UNITED STATES
SECURITIES AND EXCHANGE COMMISSION
Washington, D.C. 20549
Form N-CSR
CERTIFIED SHAREHOLDER REPORT OF REGISTERED
MANAGEMENT INVESTMENT COMPANIES
Investment Company Act File Number: 811-04015
Eaton Vance Mutual Funds Trust
(Exact Name of Registrant as Specified in Charter)
Two International Place, Boston, Massachusetts 02110
(Address of Principal Executive Offices)
Maureen A. Gemma
Two International Place, Boston, Massachusetts 02110
(Name and Address of Agent for Services)
(617) 482-8260
(Registrant’s Telephone Number)
January 31
Date of Fiscal Year End
January 31, 2013
Date of Reporting Period
Item 1. Reports to Stockholders

| | |
Eaton Vance Parametric Structured International Equity Fund Annual Report January 31, 2013 | | |

Fund shares are not insured by the FDIC and are not deposits or other obligations of, or guaranteed by, any depository institution. Shares are subject to investment risks, including possible loss of principal invested.
This report must be preceded or accompanied by a current summary prospectus or prospectus. Before investing, investors should consider carefully the investment objective, risks, and charges and expenses of a mutual fund. This and other important information is contained in the summary prospectus and prospectus, which can be obtained from a financial advisor. Prospective investors should read the prospectus carefully before investing. For further information, please call 1-800-262-1122.
Annual Report January 31, 2013
Eaton Vance
Parametric Structured International Equity Fund
Table of Contents
| | | | |
Management’s Discussion of Fund Performance | | | 2 | |
| |
Performance | | | 3 | |
| |
Fund Profile | | | 4 | |
| |
Endnotes and Additional Disclosures | | | 5 | |
| |
Fund Expenses | | | 6 | |
| |
Financial Statements | | | 7 | |
| |
Report of Independent Registered Public Accounting Firm | | | 25 | |
| |
Federal Tax Information | | | 26 | |
| |
Management and Organization | | | 27 | |
| |
Important Notices | | | 29 | |
Eaton Vance
Parametric Structured International Equity Fund
January 31, 2013
Management’s Discussion of Fund Performance1
Economic and Market Conditions
The 12-month period ended January 31, 2013 was a period of macroeconomic and political turmoil across regions from Europe (sovereign debt issues) to the United States (presidential election and so-called “fiscal cliff”) and Japan (stagnating GDP growth and parliamentary elections). Many investors continued to take psychological comfort in holding supposedly “safe” government bonds yielding next to nothing. Equity markets did, however, end the period on a strong note.
Fiscal conditions in Europe were gradually improving. It was only a year ago that there were predictions of sovereign defaults in Spain, Italy and Portugal, with some observers even going as far as to forecast that the European Union (EU) would disintegrate. However, the EU remained intact, with bond yields having moderated in its most vulnerable countries, and equity share prices have risen dramatically. The 2008 financial crisis still haunts many global investors, who view the equity markets as risky, rigged and replaceable. Despite impressive corporate fundamentals, outflows from equity-oriented strategies accelerated as investors continued their backward-looking quest for greater diversification6.
Fund Performance
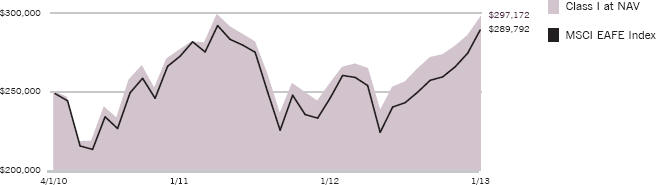
For the fiscal year ended January 31, 2013, Eaton Vance Parametric Structured International Equity Fund (the Fund) had a total return of 16.32% for Class A shares at net asset value (NAV), underperforming the 17.25% return of the Fund’s benchmark, the MSCI EAFE Index (the Index)2.
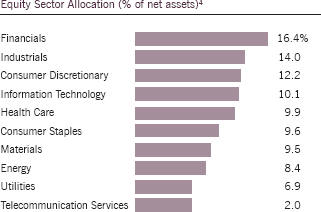
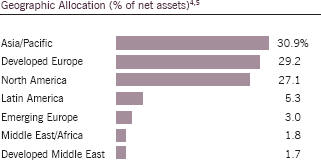
On a sector basis, contributors to the Fund’s performance relative to the Index for the 12-month period included the Fund’s overweight to the information technology sector, which outperformed the Index. In terms of country allocations, the Fund’s underweight to Japan, which underperformed the Index, contributed to Fund performance relative to the Index.
On a sector basis, detractors from Fund performance relative to the Index for the 12-month period included the Fund’s underweight to the financials sector, which outperformed the Index. In terms of country allocations, the Fund’s overweight to Israel, which underperformed the Index, detracted from Fund performance relative to the Index.
See Endnotes and Additional Disclosures in this report.
Past performance is no guarantee of future results. Returns are historical and are calculated by determining the percentage change in net asset value (NAV) or offering price (as applicable) with all distributions reinvested. Investment return and principal value will fluctuate so that shares, when redeemed, may be worth more or less than their original cost. Performance less than one year is cumulative. Performance is for the stated time period only; due to market volatility, the Fund’s current performance may be lower or higher than quoted. Returns are before taxes unless otherwise noted. For performance as of the most recent month end, please refer to www.eatonvance.com.
Eaton Vance
Parametric Structured International Equity Fund
January 31, 2013
Performance2,3
Portfolio Managers David Stein, Ph.D. and Thomas Seto, each of Parametric Portfolio Associates LLC
| | | | | | | | | | | | |
| % Average Annual Total Returns | | Inception Date | | | One Year | | | Since Inception | |
Class A at NAV | | | 04/01/2010 | | | | 16.32 | % | | | 6.00 | % |
Class A with 5.75% Maximum Sales Charge | | | — | | | | 9.64 | | | | 3.81 | |
Class C at NAV | | | 04/01/2010 | | | | 15.51 | | | | 5.26 | |
Class C with 1% Maximum Sales Charge | | | — | | | | 14.51 | | | | 5.26 | |
Class I at NAV | | | 04/01/2010 | | | | 16.59 | | | | 6.27 | |
MSCI EAFE Index | | | 04/01/2010 | | | | 17.25 | % | | | 5.34 | % |
| | | |
| | | | | | | | | | | | |
| % Total Annual Operating Expense Ratios4 | | Class A | | | Class C | | | Class I | |
Gross | | | 1.55 | % | | | 2.30 | % | | | 1.30 | % |
Net | | | 1.05 | | | | 1.80 | | | | 0.80 | |
Growth of $250,000
This graph shows the change in value of a hypothetical investment of $250,000 in Class I of the Fund for the period indicated. For comparison, the same investment is shown in the indicated index.
| | | | | | | | |
| Growth of Investment | | Amount Invested | | Period Beginning | | At NAV | | With Maximum Sales Charge |
Class A | | $10,000 | | 04/01/2010 | | $11,799 | | $11,121 |
Class C | | $10,000 | | 04/01/2010 | | $11,567 | | N.A. |
See Endnotes and Additional Disclosures in this report.
Past performance is no guarantee of future results. Returns are historical and are calculated by determining the percentage change in net asset value (NAV) or offering price (as applicable) with all distributions reinvested. Investment return and principal value will fluctuate so that shares, when redeemed, may be worth more or less than their original cost. Performance less than one year is cumulative. Performance is for the stated time period only; due to market volatility, the Fund’s current performance may be lower or higher than quoted. Returns are before taxes unless otherwise noted. For performance as of the most recent month end, please refer to www.eatonvance.com.
Eaton Vance
Parametric Structured International Equity Fund
January 31, 2013
Fund Profile
Top 10 Holdings (% of net assets)5
| | | | | | |
Nestle SA | | | 1.9 | % | | |
SAP AG | | | 1.8 | | | |
ENI SpA | | | 1.7 | | | |
Novo Nordisk A/S, Class B | | | 1.5 | | | |
Anheuser-Busch InBev NV | | | 1.3 | | | |
Royal Dutch Shell PLC, Class B | | | 1.2 | | | |
ASML Holding NV | | | 1.2 | | | |
Royal Dutch Shell PLC, Class A | | | 1.2 | | | |
DBS Group Holdings, Ltd. | | | 1.1 | | | |
L’Oreal SA | | | 1.1 | | | |
Total | | | 14.0 | % | | |
See Endnotes and Additional Disclosures in this report.
Eaton Vance
Parametric Structured International Equity Fund
January 31, 2013
Endnotes and Additional Disclosures
| 1 | The views expressed in this report are those of the portfolio manager(s) and are current only through the date stated at the top of this page. These views are subject to change at any time based upon market or other conditions, and Eaton Vance and the Fund(s) disclaim any responsibility to update such views. These views may not be relied upon as investment advice and, because investment decisions are based on many factors, may not be relied upon as an indication of trading intent on behalf of any Eaton Vance fund. This commentary may contain statements that are not historical facts, referred to as “forward looking statements”. The Fund’s actual future results may differ significantly from those stated in any forward looking statement, depending on factors such as changes in securities or financial markets or general economic conditions, the volume of sales and purchases of Fund shares, the continuation of investment advisory, administrative and service contracts, and other risks discussed from time to time in the Fund’s filings with the Securities and Exchange Commission. |
| 2 | MSCI EAFE Index is an unmanaged index of equities in the developed markets, excluding the U.S. and Canada. MSCI indices are net of foreign withholding taxes. Source: MSCI. MSCI data may not be reproduced or used for any other purpose. MSCI provides no warranties, has not prepared or approved this report, and has no liability hereunder. Unless otherwise stated, index returns do not reflect the effect of any applicable sales charges, commissions, expenses, taxes or leverage, as applicable. It is not possible to invest directly in an index. |
| 3 | Total Returns at NAV do not include applicable sales charges. If sales charges were deducted, the returns would be lower. Total Returns shown with maximum sales charge reflect the stated maximum sales charge. Unless otherwise stated, performance does not reflect the deduction of taxes on Fund distributions or redemptions of Fund shares. |
| 4 | Source: Fund prospectus. Net expense ratio reflects a contractual expense reimbursement that continues through 5/31/13. Without the reimbursement, performance would have been lower. |
| 5 | Excludes cash and cash equivalents. |
| 6 | Diversification cannot guarantee a profit or eliminate the risk of a loss. |
| | Fund profile subject to change due to active management. |
| | Important Notice to Shareholders |
| | Effective March 1, 2013, the name of the Fund was changed to Parametric International Equity Fund. Class A and Class I shares of the Fund were renamed Investor Class and Institutional Class, respectively. The front-end sales charge payable upon purchase of Investor Class shares of the Fund was eliminated. The minimum initial purchase of Institutional Class shares of the Fund was changed to $50,000 (waived in certain circumstances). Class C shares of the Fund are no longer available for purchase or exchange and all existing Class C shares converted to Investor Class shares at the close of business on March 15, 2013. Any Class C shares converted to Investor Class will continue to be subject to any applicable Class C contingent deferred sales charge. |
Eaton Vance
Parametric Structured International Equity Fund
January 31, 2013
Fund Expenses
Example: As a Fund shareholder, you incur two types of costs: (1) transaction costs, including sales charges (loads) on purchases and redemption fees (if applicable); and (2) ongoing costs, including management fees; distribution and/or service fees; and other Fund expenses. This Example is intended to help you understand your ongoing costs (in dollars) of Fund investing and to compare these costs with the ongoing costs of investing in other mutual funds. The Example is based on an investment of $1,000 invested at the beginning of the period and held for the entire period (August 1, 2012 – January 31, 2013).
Actual Expenses: The first section of the table below provides information about actual account values and actual expenses. You may use the information in this section, together with the amount you invested, to estimate the expenses that you paid over the period. Simply divide your account value by $1,000 (for example, an $8,600 account value divided by $1,000 = 8.6), then multiply the result by the number in the first section under the heading entitled “Expenses Paid During Period” to estimate the expenses you paid on your account during this period.
Hypothetical Example for Comparison Purposes: The second section of the table below provides information about hypothetical account values and hypothetical expenses based on the actual Fund expense ratio and an assumed rate of return of 5% per year (before expenses), which is not the actual Fund return. The hypothetical account values and expenses may not be used to estimate the actual ending account balance or expenses you paid for the period. You may use this information to compare the ongoing costs of investing in your Fund and other funds. To do so, compare this 5% hypothetical example with the 5% hypothetical examples that appear in the shareholder reports of the other funds.
Please note that the expenses shown in the table are meant to highlight your ongoing costs only and do not reflect any transactional costs, such as sales charges (loads) or redemption fees (if applicable). Therefore, the second section of the table is useful in comparing ongoing costs only, and will not help you determine the relative total costs of owning different funds. In addition, if these transactional costs were included, your costs would be higher.
| | | | | | | | | | | | | | | | |
| | | Beginning
Account Value
(8/1/12) | | | Ending
Account Value
(1/31/13) | | | Expenses Paid
During Period*
(8/1/12 – 1/31/13) | | | Annualized
Expense
Ratio | |
| | | | |
| | | | | | | | | | | | | | | | |
Actual | | | | | | | | | | | | | |
Class A | | $ | 1,000.00 | | | $ | 1,158.50 | | | $ | 6.29 | ** | | | 1.16 | % |
Class C | | $ | 1,000.00 | | | $ | 1,155.10 | | | $ | 10.18 | ** | | | 1.88 | % |
Class I | | $ | 1,000.00 | | | $ | 1,160.00 | | | $ | 4.89 | ** | | | 0.90 | % |
| | | | | | | | | | | | | | | | | |
| | | | |
| | | | | | | | | | | | | | | | |
Hypothetical | | | | | | | | | | | | | |
(5% return per year before expenses) | | | | | | | | | | | | | | | | |
Class A | | $ | 1,000.00 | | | $ | 1,019.30 | | | $ | 5.89 | ** | | | 1.16 | % |
Class C | | $ | 1,000.00 | | | $ | 1,015.70 | | | $ | 9.53 | ** | | | 1.88 | % |
Class I | | $ | 1,000.00 | | | $ | 1,020.60 | | | $ | 4.57 | ** | | | 0.90 | % |
| | | | |
| | | | | | | | | | | | | | | | |
| Effective December 1, 2012, the contractual expense caps of the Fund changed. If these changes had been in place during the entire reporting period, the actual and hypothetical ending account values, expenses paid and annualized expense ratios would have been as follows: | |
| | | | |
| | | | | | | | | | | | | | | | |
| | | Beginning
Account Value
(8/1/12) | | | Ending
Account Value
(1/31/13) | | | Expenses Paid
During Period*
(8/1/12 – 1/31/13) | | | Annualized
Expense
Ratio | |
| | | | |
| | | | | | | | | | | | | | | | |
Actual | | | | | | | | | | | | | | | | |
Class A | | $ | 1,000.00 | | | $ | 1,158.50 | | | $ | 5.70 | ** | | | 1.05 | % |
Class C | | $ | 1,000.00 | | | $ | 1,155.10 | | | $ | 9.75 | ** | | | 1.80 | % |
Class I | | $ | 1,000.00 | | | $ | 1,160.00 | | | $ | 4.34 | ** | | | 0.80 | % |
| | | | | | | | | | | | | | | | | |
| | | | |
| | | | | | | | | | | | | | | | |
Hypothetical | | | | | | | | | | | | | | | | |
(5% return per year before expenses) | | | | | | | | | | | | | | | | |
Class A | | $ | 1,000.00 | | | $ | 1,019.90 | | | $ | 5.33 | ** | | | 1.05 | % |
Class C | | $ | 1,000.00 | | | $ | 1,016.10 | | | $ | 9.12 | ** | | | 1.80 | % |
Class I | | $ | 1,000.00 | | | $ | 1,021.10 | | | $ | 4.06 | ** | | | 0.80 | % |
| * | Expenses are equal to the Fund’s annualized expense ratio for the indicated Class, multiplied by the average account value over the period, multiplied by 184/366 (to reflect the one-half year period). The Example assumes that the $1,000 was invested at the net asset value per share determined at the close of business on July 31, 2012. |
| ** | Absent an allocation of certain expenses to affiliates, the expenses would be higher. |
Eaton Vance
Parametric Structured International Equity Fund
January 31, 2013
Portfolio of Investments
| | | | | | | | |
| Common Stocks — 99.7% | |
| | |
| | | | | | | | |
| Security | | Shares | | | Value | |
| | | | | | | | |
|
Australia — 6.9% | |
AGL Energy, Ltd. | | | 10,720 | | | $ | 172,377 | |
Amcor, Ltd. | | | 49,351 | | | | 432,316 | |
APA Group | | | 9,374 | | | | 56,406 | |
Australia and New Zealand Banking Group, Ltd. | | | 8,787 | | | | 244,048 | |
BHP Billiton, Ltd. | | | 7,930 | | | | 311,903 | |
CFS Retail Property Trust Group | | | 15,090 | | | | 31,495 | |
Coca-Cola Amatil, Ltd. | | | 9,769 | | | | 140,990 | |
Commonwealth Bank of Australia | | | 6,524 | | | | 438,898 | |
Computershare, Ltd. | | | 8,306 | | | | 90,836 | |
CSL, Ltd. | | | 2,512 | | | | 143,795 | |
GPT Group | | | 20,151 | | | | 79,717 | |
Harvey Norman Holdings, Ltd. | | | 14,330 | | | | 29,345 | |
Metcash, Ltd. | | | 18,285 | | | | 72,655 | |
National Australia Bank, Ltd. | | | 8,102 | | | | 231,513 | |
Newcrest Mining, Ltd. | | | 1,217 | | | | 29,809 | |
Orica, Ltd. | | | 8,309 | | | | 222,189 | |
Origin Energy, Ltd. | | | 14,876 | | | | 195,429 | |
Rio Tinto, Ltd. | | | 3,276 | | | | 227,523 | |
Shopping Centres Australasia Property Group(1) | | | 1,358 | | | | 2,308 | |
Tabcorp Holdings, Ltd. | | | 11,542 | | | | 36,734 | |
Tatts Group, Ltd. | | | 15,658 | | | | 53,144 | |
Telstra Corp., Ltd. | | | 35,088 | | | | 168,422 | |
Transurban Group | | | 37,219 | | | | 236,883 | |
Wesfarmers, Ltd. | | | 1,376 | | | | 53,999 | |
Wesfarmers, Ltd., PPS | | | 980 | | | | 39,642 | |
Westfield Group | | | 2,673 | | | | 31,194 | |
Westpac Banking Corp. | | | 5,948 | | | | 174,007 | |
Woodside Petroleum, Ltd. | | | 2,457 | | | | 91,013 | |
Woolworths, Ltd. | | | 5,674 | | | | 184,846 | |
| | |
| | | | | | $ | 4,223,436 | |
| | |
|
Austria — 1.5% | |
Andritz AG | | | 459 | | | $ | 30,197 | |
Immofinanz AG(1) | | | 29,427 | | | | 128,916 | |
OMV AG | | | 6,756 | | | | 278,320 | |
Raiffeisen Bank International AG | | | 6,670 | | | | 299,560 | |
Telekom Austria AG | | | 5,922 | | | | 43,902 | |
Verbund AG | | | 4,130 | | | | 88,008 | |
Vienna Insurance Group | | | 836 | | | | 44,170 | |
Voestalpine AG | | | 438 | | | | 16,059 | |
| | |
| | | | | | $ | 929,132 | |
| | |
| | | | | | | | |
| Security | | Shares | | | Value | |
| | | | | | | | |
|
Belgium — 3.6% | |
Anheuser-Busch InBev NV | | | 9,318 | | | $ | 819,878 | |
Belgacom SA | | | 7,929 | | | | 241,893 | |
Colruyt SA | | | 3,783 | | | | 183,478 | |
Delhaize Group SA | | | 758 | | | | 35,963 | |
Groupe Bruxelles Lambert SA | | | 3,776 | | | | 315,149 | |
Mobistar SA | | | 1,285 | | | | 35,266 | |
Solvay SA | | | 1,554 | | | | 244,155 | |
UCB SA | | | 3,316 | | | | 191,405 | |
Umicore SA | | | 2,702 | | | | 140,583 | |
| | |
| | | | | | $ | 2,207,770 | |
| | |
|
Denmark — 4.1% | |
A.P. Moller - Maersk A/S, Class A | | | 18 | | | $ | 136,111 | |
A.P. Moller - Maersk A/S, Class B | | | 14 | | | | 111,681 | |
Carlsberg A/S, Class B | | | 467 | | | | 49,954 | |
Coloplast A/S | | | 8,035 | | | | 423,894 | |
DSV A/S | | | 7,100 | | | | 182,023 | |
Novo Nordisk A/S, Class B | | | 5,022 | | | | 924,511 | |
Novozymes A/S, Class B | | | 11,333 | | | | 371,399 | |
TDC A/S | | | 9,435 | | | | 72,312 | |
Tryg A/S | | | 1,973 | | | | 155,048 | |
William Demant Holding A/S(1) | | | 1,217 | | | | 106,657 | |
| | |
| | | | | | $ | 2,533,590 | |
| | |
|
Finland — 3.0% | |
Elisa Oyj | | | 8,351 | | | $ | 198,578 | |
Fortum Oyj | | | 5,990 | | | | 112,082 | |
Kesko Oyj, Class B | | | 344 | | | | 11,257 | |
Kone Oyj, Class B | | | 5,326 | | | | 439,369 | |
Nokia Oyj | | | 16,338 | | | | 64,127 | |
Nokian Renkaat Oyj | | | 4,377 | | | | 188,206 | |
Orion Oyj, Class B | | | 5,814 | | | | 162,262 | |
Pohjola Bank PLC, Class A | | | 6,634 | | | | 113,486 | |
Sampo Oyj | | | 6,079 | | | | 218,227 | |
Stora Enso Oyj | | | 9,903 | | | | 70,626 | |
UPM-Kymmene Oyj | | | 1,270 | | | | 15,528 | |
Wartsila Oyj | | | 5,201 | | | | 247,171 | |
| | |
| | | | | | $ | 1,840,919 | |
| | |
|
France — 6.6% | |
Air Liquide SA | | | 4,425 | | | $ | 564,951 | |
Alcatel-Lucent(1) | | | 129,152 | | | | 215,820 | |
Carrefour SA | | | 931 | | | | 26,543 | |
Compagnie Generale des Etablissements Michelin, Class B | | | 2,453 | | | | 228,138 | |
Dassault Systemes SA | | | 2,386 | | | | 265,305 | |
| | | | |
| | 7 | | See Notes to Financial Statements. |
Eaton Vance
Parametric Structured International Equity Fund
January 31, 2013
Portfolio of Investments — continued
| | | | | | | | |
| Security | | Shares | | | Value | |
| | | | | | | | |
|
France (continued) | |
Essilor International SA | | | 2,373 | | | $ | 241,880 | |
Eutelsat Communications SA | | | 4,071 | | | | 139,844 | |
GDF Suez | | | 5,341 | | | | 109,564 | |
Imerys SA | | | 900 | | | | 59,516 | |
L’Oreal SA | | | 4,568 | | | | 678,318 | |
LVMH Moet Hennessy Louis Vuitton SA | | | 2,860 | | | | 538,473 | |
Neopost SA | | | 619 | | | | 35,332 | |
PPR SA | | | 354 | | | | 76,133 | |
Safran SA | | | 3,384 | | | | 155,419 | |
Sanofi | | | 2,614 | | | | 254,829 | |
SES SA | | | 2,944 | | | | 90,099 | |
Societe BIC SA | | | 1,160 | | | | 156,085 | |
Sodexo | | | 626 | | | | 55,802 | |
Suez Environnement Co. SA | | | 3,119 | | | | 41,245 | |
Thales SA | | | 1,044 | | | | 37,598 | |
Total SA | | | 1,338 | | | | 72,509 | |
Unibail-Rodamco SE | | | 173 | | | | 40,858 | |
Vivendi SA | | | 623 | | | | 13,342 | |
| | |
| | | | | | $ | 4,097,603 | |
| | |
|
Germany — 6.8% | |
Adidas AG | | | 1,242 | | | $ | 115,342 | |
Bayerische Motoren Werke AG | | | 2,904 | | | | 292,486 | |
Bayerische Motoren Werke AG, PFC Shares | | | 1,990 | | | | 136,069 | |
Beiersdorf AG | | | 2,654 | | | | 232,924 | |
Continental AG | | | 582 | | | | 68,304 | |
Daimler AG | | | 3,272 | | | | 190,437 | |
Deutsche Lufthansa AG | | | 4,066 | | | | 80,765 | |
Deutsche Post AG | | | 7,780 | | | | 182,689 | |
Deutsche Telekom AG | | | 9,603 | | | | 117,975 | |
Fraport AG | | | 442 | | | | 26,790 | |
Hannover Rueckversicherung AG | | | 1,121 | | | | 90,499 | |
Henkel AG & Co. KGaA | | | 1,387 | | | | 102,887 | |
Henkel AG & Co. KGaA, PFC Shares | | | 2,588 | | | | 228,493 | |
Linde AG | | | 2,330 | | | | 424,696 | |
Porsche Automobil Holding SE, PFC Shares | | | 424 | | | | 36,917 | |
SAP AG | | | 13,290 | | | | 1,089,877 | |
Siemens AG | | | 2,840 | | | | 311,160 | |
United Internet AG | | | 5,328 | | | | 123,875 | |
Volkswagen AG | | | 274 | | | | 63,296 | |
Volkswagen AG, PFC Shares | | | 1,028 | | | | 254,508 | |
| | |
| | | | | | $ | 4,169,989 | |
| | |
| | | | | | | | |
| Security | | Shares | | | Value | |
| | | | | | | | |
|
Greece — 0.3% | |
Coca-Cola Hellenic Bottling Co. SA(1) | | | 2,321 | | | $ | 60,293 | |
OPAP SA | | | 17,716 | | | | 153,379 | |
| | |
| | | | | | $ | 213,672 | |
| | |
|
Hong Kong — 4.9% | |
Bank of East Asia, Ltd. | | | 39,600 | | | $ | 161,995 | |
BOC Hong Kong (Holdings), Ltd. | | | 77,500 | | | | 265,930 | |
Cathay Pacific Airways, Ltd. | | | 29,000 | | | | 56,066 | |
Cheung Kong Infrastructure Holdings, Ltd. | | | 33,000 | | | | 208,288 | |
CLP Holdings, Ltd. | | | 29,500 | | | | 250,102 | |
Hang Lung Group, Ltd. | | | 11,000 | | | | 66,682 | |
Hang Seng Bank, Ltd. | | | 30,900 | | | | 505,995 | |
Hong Kong & China Gas Co., Ltd. | | | 125,236 | | | | 355,712 | |
Hopewell Holdings, Ltd. | | | 23,500 | | | | 96,793 | |
Link REIT (The) | | | 76,500 | | | | 396,733 | |
MTR Corp., Ltd. | | | 47,500 | | | | 195,463 | |
Power Assets Holdings, Ltd. | | | 43,000 | | | | 371,751 | |
Wing Hang Bank, Ltd. | | | 7,500 | | | | 78,250 | |
| | |
| | | | | | $ | 3,009,760 | |
| | |
|
Ireland — 1.2% | |
CRH PLC | | | 10,157 | | | $ | 219,038 | |
Elan Corp. PLC(1) | | | 12,497 | | | | 131,858 | |
Kerry Group PLC, Class A | | | 7,637 | | | | 401,517 | |
| | |
| | | | | | $ | 752,413 | |
| | |
|
Israel — 2.3% | |
Bank Hapoalim B.M.(1) | | | 40,714 | | | $ | 171,648 | |
Bank Leumi Le-Israel B.M.(1) | | | 40,741 | | | | 136,131 | |
Bezeq Israeli Telecommunication Corp., Ltd. | | | 22,531 | | | | 26,404 | |
Delek Group, Ltd. | | | 333 | | | | 82,258 | |
Elbit Systems, Ltd. | | | 2,944 | | | | 113,182 | |
Israel Chemicals, Ltd. | | | 9,083 | | | | 120,637 | |
Israel Corp., Ltd. | | | 135 | | | | 92,386 | |
Mellanox Technologies, Ltd.(1) | | | 893 | | | | 45,355 | |
Mizrahi Tefahot Bank, Ltd.(1) | | | 8,225 | | | | 87,092 | |
NICE Systems, Ltd.(1) | | | 4,354 | | | | 160,003 | |
Teva Pharmaceutical Industries, Ltd. ADR | | | 10,318 | | | | 391,981 | |
| | |
| | | | | | $ | 1,427,077 | |
| | |
|
Italy — 4.2% | |
Atlantia SpA | | | 4,135 | | | $ | 76,355 | |
Autogrill SpA | | | 3,055 | | | | 37,463 | |
Enel SpA | | | 14,019 | | | | 61,125 | |
| | | | |
| | 8 | | See Notes to Financial Statements. |
Eaton Vance
Parametric Structured International Equity Fund
January 31, 2013
Portfolio of Investments — continued
| | | | | | | | |
| Security | | Shares | | | Value | |
| | | | | | | | |
|
Italy (continued) | |
ENI SpA | | | 41,576 | | | $ | 1,038,467 | |
Luxottica Group SpA | | | 4,518 | | | | 208,513 | |
Parmalat SpA | | | 15,710 | | | | 39,383 | |
Pirelli & C. SpA | | | 17,603 | | | | 215,909 | |
Saipem SpA | | | 3,695 | | | | 104,918 | |
Snam Rete Gas SpA | | | 76,133 | | | | 384,751 | |
Telecom Italia SpA | | | 33,467 | | | | 33,209 | |
Telecom Italia SpA, PFC Shares | | | 69,028 | | | | 58,972 | |
Tenaris SA | | | 3,596 | | | | 75,434 | |
Terna Rete Elettrica Nazionale SpA | | | 53,227 | | | | 224,106 | |
| | |
| | | | | | $ | 2,558,605 | |
| | |
|
Japan — 10.9% | |
ABC-Mart, Inc. | | | 1,100 | | | $ | 41,852 | |
All Nippon Airways Co., Ltd. | | | 14,000 | | | | 27,413 | |
Aozora Bank, Ltd. | | | 18,000 | | | | 50,605 | |
Bank of Kyoto, Ltd. (The) | | | 10,000 | | | | 82,744 | |
Bank of Yokohama, Ltd. (The) | | | 43,000 | | | | 205,383 | |
Benesse Holdings, Inc. | | | 900 | | | | 39,235 | |
Canon, Inc. | | | 1,800 | | | | 65,547 | |
Chiba Bank, Ltd. (The) | | | 16,000 | | | | 99,700 | |
Chugai Pharmaceutical Co., Ltd. | | | 7,100 | | | | 146,055 | |
Chugoku Bank, Ltd. (The) | | | 10,000 | | | | 137,736 | |
Daihatsu Motor Co., Ltd. | | | 9,000 | | | | 187,223 | |
Dainippon Sumitomo Pharma Co., Ltd. | | | 4,800 | | | | 67,667 | |
Electric Power Development Co., Ltd. | | | 1,800 | | | | 41,384 | |
Gunma Bank, Ltd. (The) | | | 20,000 | | | | 96,536 | |
Hachijuni Bank, Ltd. (The) | | | 24,000 | | | | 120,157 | |
Hamamatsu Photonics K.K. | | | 5,000 | | | | 191,171 | |
Hiroshima Bank, Ltd. (The) | | | 22,000 | | | | 93,530 | |
Honda Motor Co., Ltd. | | | 3,500 | | | | 132,297 | |
Hoya Corp. | | | 1,600 | | | | 30,894 | |
Isetan Mitsukoshi Holdings, Ltd. | | | 6,300 | | | | 62,214 | |
ITOCHU Techno-Solutions Corp. | | | 900 | | | | 39,058 | |
Iyo Bank, Ltd. (The) | | | 10,000 | | | | 81,777 | |
Japan Prime Realty Investment Corp. | | | 10 | | | | 28,431 | |
Japan Real Estate Investment Corp. | | | 6 | | | | 60,667 | |
JX Holdings, Inc. | | | 4,900 | | | | 28,909 | |
Kamigumi Co., Ltd. | | | 14,000 | | | | 114,038 | |
Kansai Paint Co., Ltd. | | | 10,000 | | | | 111,362 | |
Keikyu Corp. | | | 7,000 | | | | 59,375 | |
Keio Corp. | | | 23,000 | | | | 170,711 | |
Keyence Corp. | | | 1,300 | | | | 360,662 | |
Kintetsu Corp. | | | 16,000 | | | | 65,739 | |
Kyowa Hakko Kirin Co., Ltd. | | | 8,000 | | | | 75,641 | |
Lawson, Inc. | | | 600 | | | | 43,480 | |
| | | | | | | | |
| Security | | Shares | | | Value | |
| | | | | | | | |
|
Japan (continued) | |
McDonald’s Holdings Co. (Japan), Ltd. | | | 4,900 | | | $ | 125,772 | |
Miraca Holdings, Inc. | | | 800 | | | | 33,354 | |
Mitsubishi Logistics Corp. | | | 4,000 | | | | 59,994 | |
Mitsubishi Motors Corp.(1) | | | 59,000 | | | | 61,345 | |
Mitsubishi Tanabe Pharma Corp. | | | 4,700 | | | | 63,007 | |
Mizuho Financial Group, Inc. | | | 34,500 | | | | 68,861 | |
NGK Spark Plug Co., Ltd. | | | 8,000 | | | | 101,761 | |
Nidec Corp. | | | 300 | | | | 17,148 | |
Nippon Telegraph & Telephone Corp. | | | 700 | | | | 29,317 | |
Nishi-Nippon City Bank, Ltd. (The) | | | 19,000 | | | | 49,244 | |
NTT DoCoMo, Inc. | | | 251 | | | | 380,535 | |
Odakyu Electric Railway Co., Ltd. | | | 20,000 | | | | 200,353 | |
Ono Pharmaceutical Co., Ltd. | | | 3,600 | | | | 189,666 | |
Oracle Corp. Japan | | | 800 | | | | 33,306 | |
Oriental Land Co., Ltd. | | | 1,400 | | | | 186,141 | |
Osaka Gas Co., Ltd. | | | 8,000 | | | | 30,009 | |
Rakuten, Inc. | | | 18,300 | | | | 167,028 | |
Rinnai Corp. | | | 1,200 | | | | 84,845 | |
Santen Pharmaceutical Co., Ltd. | | | 2,100 | | | | 86,485 | |
Seven Bank, Ltd. | | | 14,800 | | | | 35,806 | |
Shikoku Electric Power Co., Inc. | | | 1,800 | | | | 22,082 | |
Shizuoka Bank, Ltd. (The) | | | 27,000 | | | | 254,578 | |
Sumitomo Metal Mining Co., Ltd. | | | 2,000 | | | | 31,106 | |
Suruga Bank, Ltd. | | | 8,000 | | | | 104,296 | |
Suzuken Co., Ltd. | | | 2,700 | | | | 82,641 | |
Sysmex Corp. | | | 1,100 | | | | 52,480 | |
Taisho Pharmaceutical Holdings Co., Ltd. | | | 700 | | | | 48,311 | |
Takashimaya Co., Ltd. | | | 8,000 | | | | 58,871 | |
Takeda Pharmaceutical Co., Ltd. | | | 200 | | | | 10,277 | |
Toho Gas Co., Ltd. | | | 24,000 | | | | 128,299 | |
Tokyo Gas Co., Ltd. | | | 18,000 | | | | 84,881 | |
TonenGeneral Sekiyu K.K. | | | 13,000 | | | | 113,361 | |
Tsumura & Co. | | | 2,000 | | | | 65,698 | |
Unicharm Corp. | | | 4,500 | | | | 238,674 | |
USS Co., Ltd. | | | 1,020 | | | | 114,580 | |
Yahoo! Japan Corp. | | | 114 | | | | 44,704 | |
Yakult Honsha Co., Ltd. | | | 900 | | | | 37,927 | |
Yamaguchi Financial Group, Inc. | | | 3,000 | | | | 28,903 | |
Yokogawa Electric Corp. | | | 3,000 | | | | 33,403 | |
| | |
| | | | | | $ | 6,718,242 | |
| | |
|
Netherlands — 5.4% | |
Akzo Nobel NV | | | 5,473 | | | $ | 374,587 | |
ASML Holding NV | | | 9,771 | | | | 732,973 | |
European Aeronautic Defence and Space Co. NV | | | 7,406 | | | | 347,202 | |
Gemalto NV | | | 334 | | | | 29,730 | |
| | | | |
| | 9 | | See Notes to Financial Statements. |
Eaton Vance
Parametric Structured International Equity Fund
January 31, 2013
Portfolio of Investments — continued
| | | | | | | | |
| Security | | Shares | | | Value | |
| | | | | | | | |
|
Netherlands (continued) | |
Heineken Holding NV | | | 1,536 | | | $ | 90,755 | |
Heineken NV | | | 4,798 | | | | 337,401 | |
Koninklijke Ahold NV | | | 26,882 | | | | 395,020 | |
Koninklijke DSM NV | | | 4,468 | | | | 273,687 | |
Koninklijke KPN NV | | | 33,920 | | | | 190,690 | |
Koninklijke Vopak NV | | | 1,287 | | | | 87,838 | |
QIAGEN NV(1) | | | 6,356 | | | | 133,430 | |
Reed Elsevier NV | | | 3,923 | | | | 60,931 | |
Unilever NV | | | 6,839 | | | | 277,091 | |
| | |
| | | | | | $ | 3,331,335 | |
| | |
|
New Zealand — 0.7% | |
Auckland International Airport, Ltd. | | | 54,928 | | | $ | 130,743 | |
Chorus, Ltd. | | | 19,155 | | | | 45,841 | |
Contact Energy, Ltd.(1) | | | 6,909 | | | | 30,269 | |
Fletcher Building, Ltd. | | | 12,742 | | | | 101,794 | |
SKYCITY Entertainment Group, Ltd. | | | 19,087 | | | | 63,601 | |
Telecom Corporation of New Zealand, Ltd. | | | 40,808 | | | | 83,102 | |
| | |
| | | | | | $ | 455,350 | |
| | |
|
Norway — 3.2% | |
Aker Solutions ASA | | | 6,611 | | | $ | 144,584 | |
Gjensidige Forsikring ASA | | | 3,679 | | | | 57,828 | |
Norsk Hydro ASA | | | 48,636 | | | | 233,489 | |
Orkla ASA | | | 29,887 | | | | 263,619 | |
Seadrill, Ltd. | | | 5,274 | | | | 208,490 | |
Statoil ASA | | | 18,251 | | | | 486,252 | |
Telenor ASA | | | 23,746 | | | | 523,137 | |
Yara International ASA | | | 500 | | | | 26,664 | |
| | |
| | | | | | $ | 1,944,063 | |
| | |
|
Portugal — 0.8% | |
EDP-Energias de Portugal SA | | | 49,749 | | | $ | 160,192 | |
Galp Energia SGPS SA, Class B | | | 4,864 | | | | 78,954 | |
Jeronimo Martins SGPS SA | | | 8,271 | | | | 175,954 | |
Portugal Telecom SGPS SA | | | 12,313 | | | | 71,883 | |
| | |
| | | | | | $ | 486,983 | |
| | |
|
Singapore — 4.5% | |
Ascendas Real Estate Investment Trust | | | 88,000 | | | $ | 179,991 | |
CapitaMall Trust | | | 17,000 | | | | 29,097 | |
ComfortDelGro Corp., Ltd. | | | 28,000 | | | | 43,658 | |
DBS Group Holdings, Ltd. | | | 58,000 | | | | 700,999 | |
Fraser and Neave, Ltd. | | | 8,000 | | | | 61,627 | |
Oversea-Chinese Banking Corp., Ltd. | | | 62,000 | | | | 489,800 | |
| | | | | | | | |
| Security | | Shares | | | Value | |
| | | | | | | | |
|
Singapore (continued) | |
Singapore Airlines, Ltd. | | | 22,000 | | | $ | 195,371 | |
Singapore Press Holdings, Ltd. | | | 48,000 | | | | 159,029 | |
Singapore Technologies Engineering, Ltd. | | | 20,000 | | | | 63,347 | |
Singapore Telecommunications, Ltd. | | | 138,000 | | | | 390,026 | |
StarHub, Ltd. | | | 11,000 | | | | 34,668 | |
United Overseas Bank, Ltd. | | | 20,000 | | | | 304,592 | |
UOL Group, Ltd. | | | 22,000 | | | | 111,117 | |
| | |
| | | | | | $ | 2,763,322 | |
| | |
|
Spain — 4.4% | |
Abertis Infraestructuras SA | | | 7,993 | | | $ | 136,851 | |
Acerinox SA | | | 6,403 | | | | 70,953 | |
ACS Actividades de Construccion y Servicios SA | | | 1,486 | | | | 35,669 | |
Amadeus IT Holding SA, Class A | | | 5,602 | | | | 140,380 | |
CaixaBank SA | | | 25,659 | | | | 101,573 | |
Distribuidora Internacional de Alimentacion SA(1) | | | 4,617 | | | | 34,083 | |
Enagas | | | 9,894 | | | | 234,095 | |
Ferrovial SA | | | 18,401 | | | | 295,488 | |
Grifols SA(1) | | | 4,142 | | | | 140,986 | |
Iberdrola SA | | | 6,009 | | | | 32,334 | |
Indra Sistemas SA | | | 1,384 | | | | 18,133 | |
Industria de Diseno Textil SA | | | 3,874 | | | | 541,460 | |
International Consolidated Airlines Group SA(1) | | | 28,622 | | | | 96,854 | |
Red Electrica Corp. SA | | | 3,386 | | | | 188,428 | |
Repsol SA | | | 8,521 | | | | 190,029 | |
Telefonica SA | | | 20,351 | | | | 294,540 | |
Zardoya Otis SA | | | 11,076 | | | | 169,781 | |
| | |
| | | | | | $ | 2,721,637 | |
| | |
|
Sweden — 4.5% | |
Atlas Copco AB, Class A | | | 2,400 | | | $ | 68,370 | |
Boliden AB | | | 17,564 | | | | 324,637 | |
Hennes & Mauritz AB, Class B | | | 8,584 | | | | 315,851 | |
Holmen AB, Class B | | | 3,338 | | | | 102,904 | |
Investor AB, Class B | | | 5,630 | | | | 159,915 | |
Millicom International Cellular SA SDR | | | 1,685 | | | | 155,244 | |
Nordea Bank AB | | | 36,011 | | | | 397,177 | |
Scania AB, Class B | | | 1,536 | | | | 31,518 | |
Skandinaviska Enskilda Banken AB, Class A | | | 20,244 | | | | 202,784 | |
Skanska AB, Class B | | | 10,263 | | | | 174,546 | |
Svenska Cellulosa AB, Class B | | | 3,869 | | | | 93,800 | |
Swedbank AB, Class A | | | 6,772 | | | | 159,905 | |
Tele2 AB, Class B | | | 9,607 | | | | 172,311 | |
Telefonaktiebolaget LM Ericsson, Class B | | | 7,673 | | | | 89,246 | |
TeliaSonera AB | | | 47,701 | | | | 344,072 | |
| | |
| | | | | | $ | 2,792,280 | |
| | |
| | | | |
| | 10 | | See Notes to Financial Statements. |
Eaton Vance
Parametric Structured International Equity Fund
January 31, 2013
Portfolio of Investments — continued
| | | | | | | | |
| Security | | Shares | | | Value | |
| | | | | | | | |
|
Switzerland — 6.8% | |
Actelion, Ltd.(1) | | | 2,942 | | | $ | 145,734 | |
Adecco SA(1) | | | 2,725 | | | | 156,260 | |
Baloise Holding AG | | | 572 | | | | 51,763 | |
Geberit AG(1) | | | 169 | | | | 39,533 | |
Givaudan SA(1) | | | 98 | | | | 108,822 | |
Nestle SA | | | 16,803 | | | | 1,179,864 | |
Novartis AG | | | 8,532 | | | | 579,975 | |
Roche Holding AG PC | | | 2,609 | | | | 576,691 | |
Schindler Holding AG | | | 1,195 | | | | 172,895 | |
Schindler Holding AG PC | | | 317 | | | | 47,022 | |
Sonova Holding AG(1) | | | 1,112 | | | | 128,603 | |
Sulzer AG | | | 246 | | | | 38,686 | |
Swatch Group, Ltd. (The), Bearer Shares | | | 363 | | | | 198,836 | |
Swiss Reinsurance Co., Ltd.(1) | | | 4,142 | | | | 307,949 | |
Swisscom AG | | | 639 | | | | 283,426 | |
Zurich Insurance Group AG(1) | | | 573 | | | | 164,776 | |
| | |
| | | | | | $ | 4,180,835 | |
| | |
|
United Kingdom — 13.1% | |
Associated British Foods PLC | | | 3,277 | | | $ | 90,873 | |
AstraZeneca PLC | | | 11,828 | | | | 571,526 | |
BAE Systems PLC | | | 64,351 | | | | 346,339 | |
BHP Billiton PLC | | | 10,926 | | | | 374,673 | |
BP PLC | | | 64,342 | | | | 476,293 | |
Bunzl PLC | | | 1,959 | | | | 35,200 | |
Burberry Group PLC | | | 10,003 | | | | 214,894 | |
Centrica PLC | | | 72,056 | | | | 400,122 | |
Compass Group PLC | | | 11,392 | | | | 137,906 | |
Diageo PLC | | | 2,701 | | | | 80,404 | |
Experian PLC | | | 5,603 | | | | 95,847 | |
GlaxoSmithKline PLC | | | 3,766 | | | | 86,143 | |
Imperial Tobacco Group PLC | | | 1,580 | | | | 58,751 | |
Kingfisher PLC | | | 14,107 | | | | 60,284 | |
Marks & Spencer Group PLC | | | 7,340 | | | | 44,158 | |
National Grid PLC | | | 3,163 | | | | 34,634 | |
Next PLC | | | 5,043 | | | | 324,411 | |
Randgold Resources, Ltd. | | | 1,738 | | | | 163,706 | |
Reckitt Benckiser Group PLC | | | 577 | | | | 38,441 | |
Reed Elsevier PLC | | | 5,162 | �� | | | 56,183 | |
Rexam PLC | | | 26,142 | | | | 194,333 | |
Rexam PLC, Class B, PFC Shares(1) | | | 29,047 | | | | 20,731 | |
Rolls-Royce Holdings PLC(1) | | | 30,231 | | | | 453,856 | |
Royal Dutch Shell PLC, Class A | | | 20,149 | | | | 714,256 | |
Royal Dutch Shell PLC, Class B | | | 20,574 | | | | 747,801 | |
Sage Group PLC (The) | | | 44,157 | | | | 226,111 | |
| | | | | | | | |
| Security | | Shares | | | Value | |
|
United Kingdom (continued) | |
Serco Group PLC | | | 16,187 | | | $ | 142,317 | |
Severn Trent PLC | | | 1,189 | | | | 30,583 | |
Shire PLC | | | 9,039 | | | | 302,375 | |
SSE PLC | | | 3,277 | | | | 73,759 | |
Subsea 7 SA | | | 5,192 | | | | 125,421 | |
Tesco PLC | | | 59,778 | | | | 337,843 | |
Tullow Oil PLC | | | 11,351 | | | | 204,665 | |
Unilever PLC | | | 988 | | | | 40,245 | |
Vodafone Group PLC | | | 124,614 | | | | 340,091 | |
Whitbread PLC | | | 3,750 | | | | 152,836 | |
WM Morrison Supermarkets PLC | | | 74,161 | | | | 294,974 | |
| | |
| | | | | | $ | 8,092,985 | |
| | |
| |
Total Common Stocks
(identified cost $51,826,401) | | | $ | 61,450,998 | |
| | |
| | |
| Short-Term Investments — 0.4% | | | | | | | | |
| | |
| | | | | | | | |
| Description | | Interest
(000’s omitted) | | | Value | |
Eaton Vance Cash Reserves Fund, LLC, 0.12%(2) | | $ | 278 | | | $ | 278,072 | |
| | |
| |
Total Short-Term Investments
(identified cost $278,072) | | | $ | 278,072 | |
| | |
| |
Total Investments — 100.1%
(identified cost $52,104,473) | | | $ | 61,729,070 | |
| | |
| | |
Other Assets, Less Liabilities — (0.1)% | | | | | | $ | (85,610 | ) |
| | |
| | |
Net Assets — 100.0% | | | | | | $ | 61,643,460 | |
| | |
The percentage shown for each investment category in the Portfolio of Investments is based on net assets.
| | | | |
| ADR | | – | | American Depositary Receipt |
| PC | | – | | Participation Certificate |
| PFC Shares | | – | | Preference Shares |
| PPS | | – | | Partially Protected Shares |
| SDR | | – | | Swedish Depositary Receipt |
| (1) | Non-income producing security. |
| (2) | Affiliated investment company available to Eaton Vance portfolios and funds which invests in high quality, U.S. dollar denominated money market instruments. The rate shown is the annualized seven-day yield as of January 31, 2013. |
| | | | |
| | 11 | | See Notes to Financial Statements. |
Eaton Vance
Parametric Structured International Equity Fund
January 31, 2013
Portfolio of Investments — continued
| | | | | | | | |
| Currency Concentration of Portfolio | |
| | |
| | | | | | | | |
| Currency | | Percentage
of Net Assets | | | Value | |
Euro | | | 37.7 | % | | $ | 23,237,778 | |
British Pound Sterling | | | 13.0 | | | | 8,039,844 | |
Japanese Yen | | | 10.9 | | | | 6,718,242 | |
Australian Dollar | | | 6.9 | | | | 4,223,436 | |
Swiss Franc | | | 6.8 | | | | 4,180,835 | |
Hong Kong Dollar | | | 4.9 | | | | 3,009,760 | |
Swedish Krona | | | 4.5 | | | | 2,792,280 | |
Singapore Dollar | | | 4.5 | | | | 2,763,322 | |
Danish Krone | | | 4.1 | | | | 2,533,590 | |
Norwegian Krone | | | 3.3 | | | | 2,069,484 | |
Israeli Shekel | | | 1.7 | | | | 1,035,096 | |
United States Dollar | | | 1.1 | | | | 670,053 | |
New Zealand Dollar | | | 0.7 | | | | 455,350 | |
| | |
Total Investments | | | 100.1 | % | | $ | 61,729,070 | |
| | |
| | | | | | | | |
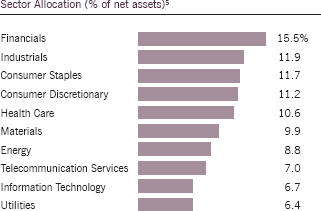
| Sector Classification of Portfolio | |
| | |
| | | | | | | | |
| Sector | | Percentage
of Net Assets | | | Value | |
Financials | | | 15.5 | % | | $ | 9,527,769 | |
Industrials | | | 11.9 | | | | 7,317,008 | |
Consumer Staples | | | 11.7 | | | | 7,208,600 | |
Consumer Discretionary | | | 11.2 | | | | 6,902,085 | |
Health Care | | | 10.6 | | | | 6,559,817 | |
Materials | | | 9.9 | | | | 6,076,762 | |
Energy | | | 8.8 | | | | 5,457,363 | |
Telecommunication Services | | | 7.0 | | | | 4,349,158 | |
Information Technology | | | 6.7 | | | | 4,125,848 | |
Utilities | | | 6.4 | | | | 3,926,588 | |
Short-Term Investments | | | 0.4 | | | | 278,072 | |
| | |
Total Investments | | | 100.1 | % | | $ | 61,729,070 | |
| | |
| | | | |
| | 12 | | See Notes to Financial Statements. |
Eaton Vance
Parametric Structured International Equity Fund
January 31, 2013
Statement of Assets and Liabilities
| | | | |
| Assets | | January 31, 2013 | |
Unaffiliated investments, at value (identified cost, $51,826,401) | | $ | 61,450,998 | |
Affiliated investment, at value (identified cost, $278,072) | | | 278,072 | |
Foreign currency, at value (identified cost, $3,997) | | | 4,009 | |
Dividends receivable | | | 30,190 | |
Interest receivable from affiliated investment | | | 58 | |
Receivable for Fund shares sold | | | 17,931 | |
Tax reclaims receivable | | | 52,061 | |
Receivable from affiliates | | | 28,080 | |
Total assets | | $ | 61,861,399 | |
| |
| Liabilities | | | | |
Payable for investments purchased | | $ | 64,709 | |
Payable for Fund shares redeemed | | | 52,239 | |
Payable to affiliates: | | | | |
Investment adviser and administration fee | | | 38,081 | |
Distribution and service fees | | | 1,800 | |
Accrued expenses | | | 61,110 | |
Total liabilities | | $ | 217,939 | |
Net Assets | | $ | 61,643,460 | |
| |
| Sources of Net Assets | | | | |
Paid-in capital | | $ | 57,758,278 | |
Accumulated net realized loss | | | (5,437,963 | ) |
Accumulated distributions in excess of net investment income | | | (302,193 | ) |
Net unrealized appreciation | | | 9,625,338 | |
Total | | $ | 61,643,460 | |
| |
| Class A Shares | | | | |
Net Assets | | $ | 7,037,979 | |
Shares Outstanding | | | 629,529 | |
Net Asset Value and Redemption Price Per Share | | | | |
(net assets ÷ shares of beneficial interest outstanding) | | $ | 11.18 | |
Maximum Offering Price Per Share | | | | |
(100 ÷ 94.25 of net asset value per share) | | $ | 11.86 | |
| |
| Class C Shares | | | | |
Net Assets | | $ | 438,604 | |
Shares Outstanding | | | 39,602 | |
Net Asset Value and Offering Price Per Share* | | | | |
(net assets ÷ shares of beneficial interest outstanding) | | $ | 11.08 | |
| |
| Class I Shares | | | | |
Net Assets | | $ | 54,166,877 | |
Shares Outstanding | | | 4,835,558 | |
Net Asset Value, Offering Price and Redemption Price Per Share | | | | |
(net assets ÷ shares of beneficial interest outstanding) | | $ | 11.20 | |
On sales of $50,000 or more, the offering price of Class A shares is reduced.
| * | Redemption price per share is equal to the net asset value less any applicable contingent deferred sales charge. |
| | | | |
| | 13 | | See Notes to Financial Statements. |
Eaton Vance
Parametric Structured International Equity Fund
January 31, 2013
Statement of Operations
| | | | |
| Investment Income | | Year Ended
January 31, 2013 | |
Dividends (net of foreign taxes, $201,969) | | $ | 1,923,876 | |
Interest allocated from affiliated investment | | | 475 | |
Expenses allocated from affiliated investment | | | (60 | ) |
Total investment income | | $ | 1,924,291 | |
| |
| Expenses | | | | |
Investment adviser and administration fee | | $ | 452,438 | |
Distribution and service fees | | | | |
Class A | | | 22,956 | |
Class C | | | 2,975 | |
Trustees’ fees and expenses | | | 2,647 | |
Custodian fee | | | 105,145 | |
Transfer and dividend disbursing agent fees | | | 25,772 | |
Legal and accounting services | | | 36,943 | |
Printing and postage | | | 15,265 | |
Registration fees | | | 69,657 | |
Miscellaneous | | | 25,455 | |
Total expenses | | $ | 759,253 | |
Deduct — | | | | |
Allocation of expenses to affiliates | | $ | 166,505 | |
Total expense reductions | | $ | 166,505 | |
| |
Net expenses | | $ | 592,748 | |
| |
Net investment income | | $ | 1,331,543 | |
| |
| Realized and Unrealized Gain (Loss) | | | | |
Net realized gain (loss) — | | | | |
Investment transactions | | $ | (2,060,500 | ) |
Investment transactions allocated from affiliated investment | | | 11 | |
Foreign currency transactions | | | (29,122 | ) |
Net realized loss | | $ | (2,089,611 | ) |
Change in unrealized appreciation (depreciation) — | | | | |
Investments | | $ | 9,401,563 | |
Foreign currency | | | 884 | |
Net change in unrealized appreciation (depreciation) | | $ | 9,402,447 | |
| |
Net realized and unrealized gain | | $ | 7,312,836 | |
| |
Net increase in net assets from operations | | $ | 8,644,379 | |
| | | | |
| | 14 | | See Notes to Financial Statements. |
Eaton Vance
Parametric Structured International Equity Fund
January 31, 2013
Statements of Changes in Net Assets
| | | | | | | | |
| | | Year Ended January 31, | |
| Increase (Decrease) in Net Assets | | 2013 | | | 2012 | |
From operations — | | | | | | | | |
Net investment income | | $ | 1,331,543 | | | $ | 1,174,630 | |
Net realized loss from investment and foreign currency transactions | | | (2,089,611 | ) | | | (3,190,959 | ) |
Net change in unrealized appreciation (depreciation) from investments and foreign currency | | | 9,402,447 | | | | (3,060,439 | ) |
Net increase (decrease) in net assets from operations | | $ | 8,644,379 | | | $ | (5,076,768 | ) |
Distributions to shareholders — | | | | | | | | |
From net investment income | | | | | | | | |
Class A | | $ | (159,997 | ) | | $ | (229,019 | ) |
Class C | | | (8,524 | ) | | | (3,397 | ) |
Class I | | | (1,417,505 | ) | | | (1,008,450 | ) |
Total distributions to shareholders | | $ | (1,586,026 | ) | | $ | (1,240,866 | ) |
Transactions in shares of beneficial interest — | | | | | | | | |
Proceeds from sale of shares | | | | | | | | |
Class A | | $ | 6,166,012 | | | $ | 15,600,066 | |
Class C | | | 242,466 | | | | 356,728 | |
Class I | | | 15,252,640 | | | | 55,864,422 | |
Net asset value of shares issued to shareholders in payment of distributions declared | | | | | | | | |
Class A | | | 159,076 | | | | 228,446 | |
Class C | | | 8,293 | | | | 3,255 | |
Class I | | | 433,419 | | | | 266,148 | |
Cost of shares redeemed | | | | | | | | |
Class A | | | (12,844,202 | ) | | | (6,318,103 | ) |
Class C | | | (104,225 | ) | | | (223,938 | ) |
Class I | | | (13,202,800 | ) | | | (46,687,406 | ) |
Net increase (decrease) in net assets from Fund share transactions | | $ | (3,889,321 | ) | | $ | 19,089,618 | |
| | |
Net increase in net assets | | $ | 3,169,032 | | | $ | 12,771,984 | |
| | |
| Net Assets | | | | | | | | |
At beginning of year | | $ | 58,474,428 | | | $ | 45,702,444 | |
At end of year | | $ | 61,643,460 | | | $ | 58,474,428 | |
| | |
Accumulated distributions in excess of net investment income
included in net assets | | | | | | | | |
At end of year | | $ | (302,193 | ) | | $ | (61,217 | ) |
| | | | |
| | 15 | | See Notes to Financial Statements. |
Eaton Vance
Parametric Structured International Equity Fund
January 31, 2013
Financial Highlights
| | | | | | | | | | | | |
| | | Class A | |
| | | Year Ended January 31, | | | Period Ended
January 31, 2011(1) | |
| | | 2013 | | | 2012 | | |
Net asset value — Beginning of period | | $ | 9.850 | | | $ | 10.960 | | | $ | 10.000 | |
| | | |
| Income (Loss) From Operations | | | | | | | | | | | | |
Net investment income (loss)(2) | | $ | 0.227 | | | $ | 0.172 | | | $ | (0.020 | ) |
Net realized and unrealized gain (loss) | | | 1.370 | | | | (1.073 | ) | | | 1.058 | |
| | | |
Total income (loss) from operations | | $ | 1.597 | | | $ | (0.901 | ) | | $ | 1.038 | |
| | | |
| Less Distributions | | | | | | | | | | | | |
From net investment income | | $ | (0.267 | ) | | $ | (0.209 | ) | | $ | (0.078 | ) |
| | | |
Total distributions | | $ | (0.267 | ) | | $ | (0.209 | ) | | $ | (0.078 | ) |
| | | |
Redemption fees(2)(3) | | $ | — | | | $ | — | | | $ | 0.000 | (4) |
| | | |
Net asset value — End of period | | $ | 11.180 | | | $ | 9.850 | | | $ | 10.960 | |
| | | |
Total Return(5) | | | 16.32 | % | | | (8.11 | )% | | | 10.39 | %(6) |
| | | |
| Ratios/Supplemental Data | | | | | | | | | | | | |
Net assets, end of period (000’s omitted) | | $ | 7,038 | | | $ | 12,263 | | | $ | 3,578 | |
Ratios (as a percentage of average daily net assets): | | | | | | | | | | | | |
Expenses(7)(8) | | | 1.29 | % | | | 1.50 | % | | | 1.50 | %(9) |
Net investment income (loss) | | | 2.22 | % | | | 1.68 | % | | | (0.22 | )%(9) |
Portfolio Turnover | | | 44 | % | | | 60 | % | | | 15 | %(6) |
| (1) | For the period from the start of business, April 1, 2010, to January 31, 2011. |
| (2) | Computed using average shares outstanding. |
| (3) | Redemption fees were discontinued as of January 1, 2011. |
| (4) | Amount is less than $0.0005. |
| (5) | Returns are historical and are calculated by determining the percentage change in net asset value with all distributions reinvested and do not reflect the effect of sales charges. |
| (7) | Excludes the effect of custody fee credits, if any, of less than 0.005%. |
| (8) | The investment adviser, sub-adviser and administrator subsidized certain operating expenses (equal to 0.29%, 0.25% and 0.72% of average daily net assets for the years ended January 31, 2013 and 2012 and the period ended January 31, 2011, respectively). |
| | | | |
| | 16 | | See Notes to Financial Statements. |
Eaton Vance
Parametric Structured International Equity Fund
January 31, 2013
Financial Highlights — continued
| | | | | | | | | | | | |
| | | Class C | |
| | | Year Ended January 31, | | | Period Ended
January 31, 2011(1) | |
| | | 2013 | | | 2012 | | |
Net asset value — Beginning of period | | $ | 9.800 | | | $ | 10.900 | | | $ | 10.000 | |
| | | |
| Income (Loss) From Operations | | | | | | | | | | | | |
Net investment income (loss)(2) | | $ | 0.132 | | | $ | 0.099 | | | $ | (0.076 | ) |
Net realized and unrealized gain (loss) | | | 1.379 | | | | (1.057 | ) | | | 1.044 | |
| | | |
Total income (loss) from operations | | $ | 1.511 | | | $ | (0.958 | ) | | $ | 0.968 | |
| | | |
| Less Distributions | | | | | | | | | | | | |
From net investment income | | $ | (0.231 | ) | | $ | (0.142 | ) | | $ | (0.068 | ) |
| | | |
Total distributions | | $ | (0.231 | ) | | $ | (0.142 | ) | | $ | (0.068 | ) |
| | | |
Redemption fees(2)(3) | | $ | — | | | $ | — | | | $ | 0.000 | (4) |
| | | |
Net asset value — End of period | | $ | 11.080 | | | $ | 9.800 | | | $ | 10.900 | |
| | | |
Total Return(5) | | | 15.51 | % | | | (8.71 | )% | | | 9.69 | %(6) |
| | | |
| Ratios/Supplemental Data | | | | | | | | | | | | |
Net assets, end of period (000’s omitted) | | $ | 439 | | | $ | 254 | | | $ | 155 | |
Ratios (as a percentage of average daily net assets): | | | | | | | | | | | | |
Expenses(7)(8) | | | 2.00 | % | | | 2.25 | % | | | 2.25 | %(9) |
Net investment income (loss) | | | 1.30 | % | | | 0.97 | % | | | (0.86 | )%(9) |
Portfolio Turnover | | | 44 | % | | | 60 | % | | | 15 | %(6) |
| (1) | For the period from the start of business, April 1, 2010, to January 31, 2011. |
| (2) | Computed using average shares outstanding. |
| (3) | Redemption fees were discontinued as of January 1, 2011. |
| (4) | Amount is less than $0.0005. |
| (5) | Returns are historical and are calculated by determining the percentage change in net asset value with all distributions reinvested and do not reflect the effect of sales charges. |
| (7) | Excludes the effect of custody fee credits, if any, of less than 0.005%. |
| (8) | The investment adviser, sub-adviser and administrator subsidized certain operating expenses (equal to 0.31%, 0.25% and 0.72% of average daily net assets for the years ended January 31, 2013 and 2012 and the period ended January 31, 2011, respectively). |
| | | | |
| | 17 | | See Notes to Financial Statements. |
Eaton Vance
Parametric Structured International Equity Fund
January 31, 2013
Financial Highlights — continued
| | | | | | | | | | | | |
| | | Class I | |
| | | Year Ended January 31, | | | Period Ended
January 31, 2011(1) | |
| | | 2013 | | | 2012 | | |
Net asset value — Beginning of period | | $ | 9.880 | | | $ | 10.970 | | | $ | 10.000 | |
| | | |
| Income (Loss) From Operations | | | | | | | | | | | | |
Net investment income(2) | | $ | 0.252 | | | $ | 0.239 | | | $ | 0.102 | |
Net realized and unrealized gain (loss) | | | 1.375 | | | | (1.104 | ) | | | 0.950 | |
| | | |
Total income (loss) from operations | | $ | 1.627 | | | $ | (0.865 | ) | | $ | 1.052 | |
| | | |
| Less Distributions | | | | | | | | | | | | |
From net investment income | | $ | (0.307 | ) | | $ | (0.225 | ) | | $ | (0.082 | ) |
| | | |
Total distributions | | $ | (0.307 | ) | | $ | (0.225 | ) | | $ | (0.082 | ) |
| | | |
Redemption fees(2)(3) | | $ | — | | | $ | — | | | $ | 0.000 | (4) |
| | | |
Net asset value — End of period | | $ | 11.200 | | | $ | 9.880 | | | $ | 10.970 | |
| | | |
Total Return(5) | | | 16.59 | % | | | (7.76 | )% | | | 10.54 | %(6) |
| | | |
| Ratios/Supplemental Data | | | | | | | | | | | | |
Net assets, end of period (000’s omitted) | | $ | 54,167 | | | $ | 45,957 | | | $ | 41,969 | |
Ratios (as a percentage of average daily net assets): | | | | | | | | | | | | |
Expenses(7)(8) | | | 1.02 | % | | | 1.25 | % | | | 1.25 | %(9) |
Net investment income | | | 2.45 | % | | | 2.28 | % | | | 1.20 | %(9) |
Portfolio Turnover | | | 44 | % | | | 60 | % | | | 15 | %(6) |
| (1) | For the period from the start of business, April 1, 2010, to January 31, 2011. |
| (2) | Computed using average shares outstanding. |
| (3) | Redemption fees were discontinued as of January 1, 2011. |
| (4) | Amount is less than $0.0005. |
| (5) | Returns are historical and are calculated by determining the percentage change in net asset value with all distributions reinvested. |
| (7) | Excludes the effect of custody fee credits, if any, of less than 0.005%. |
| (8) | The investment adviser, sub-adviser and administrator subsidized certain operating expenses (equal to 0.30%, 0.25% and 0.72% of average daily net assets for the years ended January 31, 2013 and 2012 and the period ended January 31, 2011, respectively). |
| | | | |
| | 18 | | See Notes to Financial Statements. |
Eaton Vance
Parametric Structured International Equity Fund
January 31, 2013
Notes to Financial Statements
1 Significant Accounting Policies
Eaton Vance Parametric Structured International Equity Fund (the Fund) is a diversified series of Eaton Vance Mutual Funds Trust (the Trust). The Trust is a Massachusetts business trust registered under the Investment Company Act of 1940, as amended (the 1940 Act), as an open-end management investment company. The Fund’s investment objective is to seek long-term capital appreciation. The Fund offers three classes of shares. Class A shares are generally sold subject to a sales charge imposed at time of purchase. Class C shares are sold at net asset value and are generally subject to a contingent deferred sales charge (see Note 5). Class I shares are sold at net asset value and are not subject to a sales charge. See Note 12 — Subsequent Events for changes affecting the share classes effective March 1, 2013. Each class represents a pro-rata interest in the Fund, but votes separately on class-specific matters and (as noted below) is subject to different expenses. Realized and unrealized gains and losses and net investment income and losses, other than class-specific expenses, are allocated daily to each class of shares based on the relative net assets of each class to the total net assets of the Fund. Each class of shares differs in its distribution plan and certain other class-specific expenses.
The following is a summary of significant accounting policies of the Fund. The policies are in conformity with accounting principles generally accepted in the United States of America.
A Investment Valuation — Equity securities (including common shares of closed-end investment companies) listed on a U.S. securities exchange generally are valued at the last sale or closing price on the day of valuation or, if no sales took place on such date, at the mean between the closing bid and asked prices therefore on the exchange where such securities are principally traded. Equity securities listed on the NASDAQ Global or Global Select Market generally are valued at the NASDAQ official closing price. Unlisted or listed securities for which closing sales prices or closing quotations are not available are valued at the mean between the latest available bid and asked prices or, in the case of preferred equity securities that are not listed or traded in the over-the-counter market, by a third party pricing service that will use various techniques that consider factors including, but not limited to, prices or yields of securities with similar characteristics, benchmark yields, broker/dealer quotes, quotes of underlying common stock, issuer spreads, as well as industry and economic events. Short-term obligations purchased with a remaining maturity of sixty days or less are generally valued at amortized cost, which approximates market value. Foreign securities and currencies are valued in U.S. dollars, based on foreign currency exchange rate quotations supplied by a third party pricing service. The pricing service uses a proprietary model to determine the exchange rate. Inputs to the model include reported trades and implied bid/ask spreads. The daily valuation of exchange-traded foreign securities generally is determined as of the close of trading on the principal exchange on which such securities trade. Events occurring after the close of trading on foreign exchanges may result in adjustments to the valuation of foreign securities to more accurately reflect their fair value as of the close of regular trading on the New York Stock Exchange. When valuing foreign equity securities that meet certain criteria, the Fund’s Trustees have approved the use of a fair value service that values such securities to reflect market trading that occurs after the close of the applicable foreign markets of comparable securities or other instruments that have a strong correlation to the fair-valued securities. Investments for which valuations or market quotations are not readily available or are deemed unreliable are valued at fair value using methods determined in good faith by or at the direction of the Trustees of the Fund in a manner that fairly reflects the security’s value, or the amount that the Fund might reasonably expect to receive for the security upon its current sale in the ordinary course. Each such determination is based on a consideration of relevant factors, which are likely to vary from one pricing context to another. These factors may include, but are not limited to, the type of security, the existence of any contractual restrictions on the security’s disposition, the price and extent of public trading in similar securities of the issuer or of comparable companies or entities, quotations or relevant information obtained from broker/dealers or other market participants, information obtained from the issuer, analysts, and/or the appropriate stock exchange (for exchange-traded securities), an analysis of the company’s or entity’s financial condition, and an evaluation of the forces that influence the issuer and the market(s) in which the security is purchased and sold.
The Fund may invest in Eaton Vance Cash Reserves Fund, LLC (Cash Reserves Fund), an affiliated investment company managed by Eaton Vance Management (EVM). The value of the Fund’s investment in Cash Reserves Fund reflects the Fund’s proportionate interest in its net assets. Cash Reserves Fund generally values its investment securities utilizing the amortized cost valuation technique in accordance with Rule 2a-7 under the 1940 Act. This technique involves initially valuing a portfolio security at its cost and thereafter assuming a constant amortization to maturity of any discount or premium. If amortized cost is determined not to approximate fair value, Cash Reserves Fund may value its investment securities based on available market quotations provided by a third party pricing service.
B Investment Transactions — Investment transactions for financial statement purposes are accounted for on a trade date basis. Realized gains and losses on investments sold are determined on the basis of identified cost.
C Income — Dividend income is recorded on the ex-dividend date for dividends received in cash and/or securities. However, if the ex-dividend date has passed, certain dividends from foreign securities are recorded as the Fund is informed of the ex-dividend date. Withholding taxes on foreign dividends and capital gains have been provided for in accordance with the Fund’s understanding of the applicable countries’ tax rules and rates. Interest income is recorded on the basis of interest accrued, adjusted for amortization of premium or accretion of discount.
D Federal Taxes — The Fund’s policy is to comply with the provisions of the Internal Revenue Code applicable to regulated investment companies and to distribute to shareholders each year substantially all of its net investment income, and all or substantially all of its net realized capital gains. Accordingly, no provision for federal income or excise tax is necessary.
In addition to the requirements of the Internal Revenue Code, the Fund may also be subject to local taxes on the recognition of capital gains in certain countries. In determining the daily net asset value, the Fund estimates the accrual for such taxes, if any, based on the unrealized appreciation on certain
Eaton Vance
Parametric Structured International Equity Fund
January 31, 2013
Notes to Financial Statements — continued
portfolio securities and the related tax rates. Taxes attributable to unrealized appreciation are included in the change in unrealized appreciation (depreciation) on investments. Capital gains taxes on securities sold are included in net realized gain (loss) on investments.
At January 31, 2013, the Fund, for federal income tax purposes, had a capital loss carryforward of $94,897 and current year deferred capital losses of $5,327,635 which will reduce its taxable income arising from future net realized gains on investment transactions, if any, to the extent permitted by the Internal Revenue Code, and thus will reduce the amount of distributions to shareholders, which would otherwise be necessary to relieve the Fund of any liability for federal income or excise tax. The capital loss carryforward will expire on January 31, 2019. The current year deferred capital losses are treated as arising on the first day of the Fund’s next taxable year and are treated as realized prior to the utilization of the capital loss carryforward.
As of January 31, 2013, the Fund had no uncertain tax positions that would require financial statement recognition, de-recognition, or disclosure. The Fund files a U.S. federal income tax return annually after its fiscal year-end, which is subject to examination by the Internal Revenue Service for a period of three years from the date of filing.
E Expenses — The majority of expenses of the Trust are directly identifiable to an individual fund. Expenses which are not readily identifiable to a specific fund are allocated taking into consideration, among other things, the nature and type of expense and the relative size of the funds.
F Expense Reduction — State Street Bank and Trust Company (SSBT) serves as custodian of the Fund. Pursuant to the custodian agreement, SSBT receives a fee reduced by credits, which are determined based on the average daily cash balance the Fund maintains with SSBT. All credit balances, if any, used to reduce the Fund’s custodian fees are reported as a reduction of expenses in the Statement of Operations.
G Foreign Currency Translation — Investment valuations, other assets, and liabilities initially expressed in foreign currencies are translated each business day into U.S. dollars based upon current exchange rates. Purchases and sales of foreign investment securities and income and expenses denominated in foreign currencies are translated into U.S. dollars based upon currency exchange rates in effect on the respective dates of such transactions. Recognized gains or losses on investment transactions attributable to changes in foreign currency exchange rates are recorded for financial statement purposes as net realized gains and losses on investments. That portion of unrealized gains and losses on investments that results from fluctuations in foreign currency exchange rates is not separately disclosed.
H Use of Estimates — The preparation of the financial statements in conformity with accounting principles generally accepted in the United States of America requires management to make estimates and assumptions that affect the reported amounts of assets and liabilities at the date of the financial statements and the reported amounts of income and expense during the reporting period. Actual results could differ from those estimates.
I Indemnifications — Under the Trust’s organizational documents, its officers and Trustees may be indemnified against certain liabilities and expenses arising out of the performance of their duties to the Fund. Under Massachusetts law, if certain conditions prevail, shareholders of a Massachusetts business trust (such as the Trust) could be deemed to have personal liability for the obligations of the Trust. However, the Trust’s Declaration of Trust contains an express disclaimer of liability on the part of Fund shareholders and the By-laws provide that the Trust shall assume the defense on behalf of any Fund shareholders. Moreover, the By-laws also provide for indemnification out of Fund property of any shareholder held personally liable solely by reason of being or having been a shareholder for all loss or expense arising from such liability. Additionally, in the normal course of business, the Fund enters into agreements with service providers that may contain indemnification clauses. The Fund’s maximum exposure under these arrangements is unknown as this would involve future claims that may be made against the Fund that have not yet occurred.
2 Distributions to Shareholders
It is the present policy of the Fund to make at least one distribution annually (normally in December) of all or substantially all of its net investment income and to distribute annually all or substantially all of its net realized capital gains (reduced by available capital loss carryforwards from prior years, if any). Distributions to shareholders are recorded on the ex-dividend date. Distributions are declared separately for each class of shares. Shareholders may reinvest income and capital gain distributions in additional shares of the same class of the Fund at the net asset value as of the ex-dividend date or, at the election of the shareholder, receive distributions in cash. The Fund distinguishes between distributions on a tax basis and a financial reporting basis. Accounting principles generally accepted in the United States of America require that only distributions in excess of tax basis earnings and profits be reported in the financial statements as a return of capital. Permanent differences between book and tax accounting relating to distributions are reclassified to paid-in capital. For tax purposes, distributions from short-term capital gains are considered to be from ordinary income.
The tax character of distributions declared for the years ended January 31, 2013 and January 31, 2012 was as follows:
| | | | | | | | |
| | | Year Ended January 31, | |
| | | 2013 | | | 2012 | |
| | |
Distributions declared from: | | | | | | | | |
Ordinary income | | $ | 1,586,026 | | | $ | 1,240,866 | |
Eaton Vance
Parametric Structured International Equity Fund
January 31, 2013
Notes to Financial Statements — continued
During the year ended January 31, 2013, accumulated net realized loss was increased by $13,507 and accumulated distributions in excess of net investment income was decreased by $13,507 due to differences between book and tax accounting, primarily for investments in partnerships, foreign currency gain (loss) and investments in passive foreign investment companies (PFICs). These reclassifications had no effect on the net assets or net asset value per share of the Fund.
As of January 31, 2013, the components of distributable earnings (accumulated losses) and unrealized appreciation (depreciation) on a tax basis were as follows:
| | | | |
Undistributed ordinary income | | $ | 52,727 | |
Capital loss carryforward and deferred capital losses | | $ | (5,422,532 | ) |
Net unrealized appreciation | | $ | 9,254,987 | |
The differences between components of distributable earnings (accumulated losses) on a tax basis and the amounts reflected in the Statement of Assets and Liabilities are primarily due to wash sales, foreign currency transactions, investments in partnerships and investments in PFICs.
3 Investment Adviser and Administration Fee and Other Transactions with Affiliates
The investment adviser and administration fee is earned by EVM as compensation for investment advisory and administrative services rendered to the Fund. Pursuant to the investment advisory and administrative agreement and subsequent fee reduction agreement between the Fund and EVM effective June 1, 2012, the fee is computed at an annual rate of 0.75% of the Fund’s average daily net assets up to $500 million and is payable monthly. On net assets of $500 million and over, the annual fee is reduced. The fee reduction cannot be terminated without the consent of the Trustees and shareholders. Prior to June 1, 2012, the fee was computed at an annual rate of 0.95% of the Fund’s average daily net assets up to $500 million and at reduced rates on daily net assets of $500 million and over. The Fund invests its cash in Cash Reserves Fund. EVM does not currently receive a fee for advisory services provided to Cash Reserves Fund. For the year ended January 31, 2013, the investment adviser and administration fee amounted to $452,438 or 0.82% of the Fund’s average daily net assets. Pursuant to a sub-advisory agreement, EVM has delegated the investment management of the Fund to Parametric Portfolio Associates LLC (Parametric), a majority-owned subsidiary of Eaton Vance Corp. EVM pays Parametric a portion of its advisory and administration fee for sub-advisory services provided to the Fund.
EVM and Parametric have agreed to reimburse the Fund’s expenses to the extent that total annual operating expenses (relating to ordinary operating expenses only) exceed 1.05%, 1.80% and 0.80% (1.20%, 1.95% and 0.95% for the period from June 1, 2012 to November 30, 2012 and 1.50%, 2.25% and 1.25% prior to June 1, 2012) of the Fund’s average daily net assets of Class A, Class C and Class I, respectively. This agreement may be changed or terminated after May 31, 2013. Pursuant to this agreement, EVM and Parametric were allocated $166,505 in total of the Fund’s operating expenses for the year ended January 31, 2013.
EVM serves as the sub-transfer agent of the Fund and receives from the transfer agent an aggregate fee based upon the actual expenses incurred by EVM in the performance of these services. For the year ended January 31, 2013, EVM earned $1,229 in sub-transfer agent fees. The Fund was informed that Eaton Vance Distributors, Inc. (EVD), an affiliate of EVM and the Fund’s principal underwriter, received $2,078 as its portion of the sales charge on sales of Class A shares for the year ended January 31, 2013. EVD also received distribution and services fees from Class A and Class C shares (see Note 4) and contingent deferred sales charges (see Note 5).
Trustees and officers of the Fund who are members of EVM’s organization receive remuneration for their services to the Fund out of the investment adviser and administration fee. Trustees of the Fund who are not affiliated with EVM may elect to defer receipt of all or a percentage of their annual fees in accordance with the terms of the Trustees Deferred Compensation Plan. For the year ended January 31, 2013, no significant amounts have been deferred. Certain officers and Trustees of the Fund are officers of EVM.
4 Distribution Plans
The Fund has in effect a distribution plan for Class A shares (Class A Plan) pursuant to Rule 12b-1 under the 1940 Act. Pursuant to the Class A Plan, the Fund pays EVD a distribution and service fee of 0.25% per annum of its average daily net assets attributable to Class A shares for distribution services and facilities provided to the Fund by EVD, as well as for personal services and/or the maintenance of shareholder accounts. Distribution and service fees paid or accrued to EVD for the year ended January 31, 2013 amounted to $22,956 for Class A shares.
The Fund also has in effect a distribution plan for Class C shares (Class C Plan) pursuant to Rule 12b-1 under the 1940 Act. Pursuant to the Class C Plan, the Fund pays EVD amounts equal to 0.75% per annum of its average daily net assets attributable to Class C shares for providing ongoing distribution services and facilities to the Fund. For the year ended January 31, 2013, the Fund paid or accrued to EVD $2,231 for Class C shares.
Pursuant to the Class C Plan, the Fund also makes payments of service fees to EVD, financial intermediaries and other persons in amounts equal to 0.25% per annum of its average daily net assets attributable to that class. Service fees paid or accrued are for personal services and/or the maintenance of
Eaton Vance
Parametric Structured International Equity Fund
January 31, 2013
Notes to Financial Statements — continued
shareholder accounts. They are separate and distinct from the sales commissions and distribution fees payable to EVD. Service fees paid or accrued for the year ended January 31, 2013 amounted to $744 for Class C shares.
5 Contingent Deferred Sales Charges
A contingent deferred sales charge (CDSC) of 1% generally is imposed on redemptions of Class C shares made within one year of purchase. Class A shares may be subject to a 1% CDSC if redeemed within 18 months of purchase (depending on the circumstances of purchase). Generally, the CDSC is based upon the lower of the net asset value at date of redemption or date of purchase. No charge is levied on shares acquired by reinvestment of dividends or capital gain distributions. No CDSC is levied on shares which have been sold to EVM or its affiliates or to their respective employees or clients and may be waived under certain other limited conditions. For the year ended January 31, 2013, the Fund was informed that EVD received less than $100 of CDSCs paid by Class A shareholders and no CDSCs paid by Class C shareholders.
6 Purchases and Sales of Investments
Purchases and sales of investments, other than short-term obligations, aggregated $24,385,505 and $28,460,812, respectively, for the year ended January 31, 2013.
7 Shares of Beneficial Interest
The Fund’s Declaration of Trust permits the Trustees to issue an unlimited number of full and fractional shares of beneficial interest (without par value). Such shares may be issued in a number of different series (such as the Fund) and classes. Transactions in Fund shares were as follows:
| | | | | | | | |
| | | Year Ended January 31, | |
| Class A | | 2013 | | | 2012 | |
| | |
Sales | | | 609,678 | | | | 1,509,280 | |
Issued to shareholders electing to receive payments of distributions in Fund shares | | | 14,798 | | | | 24,564 | |
Redemptions | | | (1,239,459 | ) | | | (615,930 | ) |
| | |
Net increase (decrease) | | | (614,983 | ) | | | 917,914 | |
| | |
| | | | | | | | |
| | | Year Ended January 31, | |
| Class C | | 2013 | | | 2012 | |
| | |
Sales | | | 23,268 | | | | 32,891 | |
Issued to shareholders electing to receive payments of distributions in Fund shares | | | 778 | | | | 352 | |
Redemptions | | | (10,360 | ) | | | (21,563 | ) |
| | |
Net increase | | | 13,686 | | | | 11,680 | |
| | |
| | | | | | | | |
| | | Year Ended January 31, | |
| Class I | | 2013 | | | 2012 | |
| | |
Sales | | | 1,468,321 | | | | 5,094,695 | |
Issued to shareholders electing to receive payments of distributions in Fund shares | | | 40,243 | | | | 28,557 | |
Redemptions | | | (1,325,254 | ) | | | (4,295,777 | ) |
| | |
Net increase | | | 183,310 | | | | 827,475 | |
At January 31, 2013, an EVM retirement plan owned 15.9% of the value of the outstanding shares of the Fund.
Eaton Vance
Parametric Structured International Equity Fund
January 31, 2013
Notes to Financial Statements — continued
8 Federal Income Tax Basis of Investments
The cost and unrealized appreciation (depreciation) of investments of the Fund at January 31, 2013, as determined on a federal income tax basis, were as follows:
| | | | |
| |
Aggregate cost | | $ | 52,475,016 | |
| |
Gross unrealized appreciation | | $ | 10,593,873 | |
Gross unrealized depreciation | | | (1,339,819 | ) |
| |
Net unrealized appreciation | | $ | 9,254,054 | |
9 Line of Credit
The Fund participates with other portfolios and funds managed by EVM and its affiliates in a $600 million unsecured line of credit agreement with a group of banks. Borrowings are made by the Fund solely to facilitate the handling of unusual and/or unanticipated short-term cash requirements. Interest is charged to the Fund based on its borrowings at an amount above either the Eurodollar rate or Federal Funds rate. In addition, a fee computed at an annual rate of 0.08% on the daily unused portion of the line of credit is allocated among the participating portfolios and funds at the end of each quarter. Because the line of credit is not available exclusively to the Fund, it may be unable to borrow some or all of its requested amounts at any particular time. The Fund did not have any significant borrowings or allocated fees during the year ended January 31, 2013.
10 Risks Associated with Foreign Investments
Investing in securities issued by companies whose principal business activities are outside the United States may involve significant risks not present in domestic investments. For example, there is generally less publicly available information about foreign companies, particularly those not subject to the disclosure and reporting requirements of the U.S. securities laws. Certain foreign issuers are generally not bound by uniform accounting, auditing, and financial reporting requirements and standards of practice comparable to those applicable to domestic issuers. Investments in foreign securities also involve the risk of possible adverse changes in investment or exchange control regulations, expropriation or confiscatory taxation, limitation on the removal of funds or other assets of the Fund, political or financial instability or diplomatic and other developments which could affect such investments. Foreign securities markets, while growing in volume and sophistication, are generally not as developed as those in the United States, and securities of some foreign issuers (particularly those located in developing countries) may be less liquid and more volatile than securities of comparable U.S. companies. In general, there is less overall governmental supervision and regulation of foreign securities markets, broker/dealers and issuers than in the United States.
11 Fair Value Measurements
Under generally accepted accounting principles for fair value measurements, a three-tier hierarchy to prioritize the assumptions, referred to as inputs, is used in valuation techniques to measure fair value. The three-tier hierarchy of inputs is summarized in the three broad levels listed below.
| Ÿ | | Level 1 – quoted prices in active markets for identical investments |
| Ÿ | | Level 2 – other significant observable inputs (including quoted prices for similar investments, interest rates, prepayment speeds, credit risk, etc.) |
| Ÿ | | Level 3 – significant unobservable inputs (including a fund’s own assumptions in determining the fair value of investments) |
In cases where the inputs used to measure fair value fall in different levels of the fair value hierarchy, the level disclosed is determined based on the lowest level input that is significant to the fair value measurement in its entirety. The inputs or methodology used for valuing securities are not necessarily an indication of the risk associated with investing in those securities.
Eaton Vance
Parametric Structured International Equity Fund
January 31, 2013
Notes to Financial Statements — continued
At January 31, 2013, the hierarchy of inputs used in valuing the Fund’s investments, which are carried at value, were as follows:
| | | | | | | | | | | | | | | | |
| Asset Description | | Level 1 | | | Level 2 | | | Level 3 | | | Total | |
| | | | |
Common Stocks | | | | | | | | | | | | | | | | |
Asia/Pacific | | $ | 2,308 | | | $ | 17,167,802 | | | $ | — | | | $ | 17,170,110 | |
Developed Europe | | | — | | | | 42,853,811 | | | | — | | | | 42,853,811 | |
Developed Middle East | | | 391,981 | | | | 1,035,096 | | | | — | | | | 1,427,077 | |
| | | | |
Total Common Stocks | | $ | 394,289 | | | $ | 61,056,709 | * | | $ | — | | | $ | 61,450,998 | |
Short-Term Investments | | $ | — | | | $ | 278,072 | | | $ | — | | | $ | 278,072 | |
| | | | |
Total Investments | | $ | 394,289 | | | $ | 61,334,781 | | | $ | — | | | $ | 61,729,070 | |
| * | Includes foreign equity securities whose values were adjusted to reflect market trading of comparable securities or other correlated instruments that occurred after the close of trading in their applicable foreign markets. |
The Fund held no investments or other financial instruments as of January 31, 2012 whose fair value was determined using Level 3 inputs. At January 31, 2013, the value of investments transferred between Level 1 and Level 2 during the year then ended was not significant.
12 Subsequent Events
Effective March 1, 2013, Class A and Class I shares of the Fund were renamed Investor Class and Institutional Class, respectively; the sales charge payable upon purchase of Investor Class (currently known as Class A) shares was eliminated; and Class C shares of the Fund were no longer available for purchase or exchange. All existing Class C shares were converted to Investor Class (currently known as Class A) shares at the close of business on March 15, 2013, and such Class C shares converted to Investor Class continue to be subject to any applicable Class C contingent deferred sales charge.
The name of the Fund was changed to Parametric International Equity Fund effective March 1, 2013.
Eaton Vance
Parametric Structured International Equity Fund
January 31, 2013
Report of Independent Registered Public Accounting Firm
To the Trustees of Eaton Vance Mutual Funds Trust and Shareholders of Eaton Vance Parametric Structured International Equity Fund:
We have audited the accompanying statement of assets and liabilities of Eaton Vance Parametric Structured International Equity Fund (the “Fund”) (one of the funds constituting Eaton Vance Mutual Funds Trust), including the portfolio of investments, as of January 31, 2013, and the related statement of operations for the year then ended, the statements of changes in net assets for each of the two years in the period then ended, and the financial highlights for each of the two years in the period then ended and for the period from the start of business, April 1, 2010, to January 31, 2011. These financial statements and financial highlights are the responsibility of the Fund’s management. Our responsibility is to express an opinion on these financial statements and financial highlights based on our audits.
We conducted our audits in accordance with the standards of the Public Company Accounting Oversight Board (United States). Those standards require that we plan and perform the audit to obtain reasonable assurance about whether the financial statements and financial highlights are free of material misstatement. The Fund is not required to have, nor were we engaged to perform, an audit of its internal control over financial reporting. Our audits included consideration of internal control over financial reporting as a basis for designing audit procedures that are appropriate in the circumstances, but not for the purpose of expressing an opinion on the effectiveness of the Fund’s internal control over financial reporting. Accordingly, we express no such opinion. An audit also includes examining, on a test basis, evidence supporting the amounts and disclosures in the financial statements, assessing the accounting principles used and significant estimates made by management, as well as evaluating the overall financial statement presentation. Our procedures included confirmation of securities owned as of January 31, 2013, by correspondence with the custodian and brokers; where replies were not received from brokers, we performed other auditing procedures. We believe that our audits provide a reasonable basis for our opinion.
In our opinion, such financial statements and financial highlights referred to above present fairly, in all material respects, the financial position of Eaton Vance Parametric Structured International Equity Fund as of January 31, 2013, the results of its operations for the year then ended, the changes in its net assets for each of the two years in the period then ended, and the financial highlights for each of the two years in the period then ended and for the period from the start of business, April 1, 2010, to January 31, 2011, in conformity with accounting principles generally accepted in the United States of America.
DELOITTE & TOUCHE LLP
Boston, Massachusetts
March 21, 2013
Eaton Vance
Parametric Structured International Equity Fund
January 31, 2013
Federal Tax Information (Unaudited)
The Form 1099-DIV you receive in January 2014 will show the tax status of all distributions paid to your account in calendar year 2013. Shareholders are advised to consult their own tax adviser with respect to the tax consequences of their investment in the Fund. As required by the Internal Revenue Code and/or regulations, shareholders must be notified regarding the status of qualified dividend income for individuals, the dividends received deduction for corporations and the foreign tax credit.
Qualified Dividend Income. The Fund designates approximately $1,879,797, or up to the maximum amount of such dividends allowable pursuant to the Internal Revenue Code, as qualified dividend income eligible for the reduced tax rate of 15%.
Dividends Received Deduction. Corporate shareholders are generally entitled to take the dividends received deduction on the portion of the Fund’s dividend distribution that qualifies under tax law. For the Fund’s fiscal 2013 ordinary income dividends, 0.03% qualifies for the corporate dividends received deduction.
Foreign Tax Credit. The Fund paid foreign taxes of $195,721 and recognized foreign source income of $2,125,845.
Eaton Vance
Parametric Structured International Equity Fund
January 31, 2013
Management and Organization
Fund Management. The Trustees of Eaton Vance Mutual Funds Trust (the Trust) are responsible for the overall management and supervision of the Trust’s affairs. The Trustees and officers of the Trust are listed below. Except as indicated, each individual has held the office shown or other offices in the same company for the last five years. Trustees and officers of the Trust hold indefinite terms of office. The “Noninterested Trustees” consist of those Trustees who are not “interested persons” of the Trust, as that term is defined under the 1940 Act. The business address of each Trustee and officer is Two International Place, Boston, Massachusetts 02110. As used below, “EVC” refers to Eaton Vance Corp., “EV” refers to Eaton Vance, Inc., “EVM” refers to Eaton Vance Management, “BMR” refers to Boston Management and Research and “EVD” refers to Eaton Vance Distributors, Inc. EVC and EV are the corporate parent and trustee, respectively, of EVM and BMR. EVD is the Fund’s principal underwriter and a wholly-owned subsidiary of EVC. Each officer affiliated with Eaton Vance may hold a position with other Eaton Vance affiliates that is comparable to his or her position with EVM listed below. Each Trustee oversees 183 portfolios in the Eaton Vance Complex (including all master and feeder funds in a master feeder structure). Each officer serves as an officer of certain other Eaton Vance funds. Each Trustee and officer serves until his or her successor is elected.
| | | | | | |
| Name and Year of Birth | | Position(s) with the Trust | | Length of
Service | | Principal Occupation(s) and Directorships During Past Five Years and Other Relevant Experience |
Interested Trustee |
| | | |
Thomas E. Faust Jr. 1958 | | Trustee | | Since 2007 | | Chairman, Chief Executive Officer and President of EVC, Director and President of EV, Chief Executive Officer and President of EVM and BMR, and Director of EVD. Trustee and/or officer of 183 registered investment companies. Mr. Faust is an interested person because of his positions with EVM, BMR, EVD, EVC and EV, which are affiliates of the Trust. Directorships in the Last Five Years.(1) Director of EVC and Hexavest Inc. |
| | | |
| | | | | | |
Noninterested Trustees |
| | | |
Scott E. Eston 1956 | | Trustee | | Since 2011 | | Private investor. Formerly held various positions at Grantham, Mayo, Van Otterloo and Co., L.L.C. (investment management firm) (1997-2009), including Chief Operating Officer (2002-2009), Chief Financial Officer (1997-2009) and Chairman of the Executive Committee (2002-2008); President and Principal Executive Officer, GMO Trust (open-end registered investment company) (2006-2009). Former Partner, Coopers and Lybrand L.L.P. (now PricewaterhouseCoopers) (public accounting firm) (1987-1997). Directorships in the Last Five Years. None. |
| | | |
Benjamin C. Esty 1963 | | Trustee | | Since 2005 | | Roy and Elizabeth Simmons Professor of Business Administration and Finance Unit Head, Harvard University Graduate School of Business Administration. Directorships in the Last Five Years.(1) None. |
| | | |
Allen R. Freedman 1940 | | Trustee | | Since 2007 | | Private Investor. Former Chairman (2002-2004) and a Director (1983-2004) of Systems & Computer Technology Corp. (provider of software to higher education). Formerly, a Director of Loring Ward International (fund distributor) (2005-2007). Former Chairman and a Director of Indus International, Inc. (provider of enterprise management software to the power generating industry) (2005-2007). Former Chief Executive Officer of Assurant, Inc. (insurance provider) (1979-2000). Directorships in the Last Five Years.(1) Director of Stonemor Partners, L.P. (owner and operator of cemeteries). Formerly, Director of Assurant, Inc. (insurance provider) (1979-2011). |
| | | |
William H. Park 1947 | | Trustee | | Since 2003 | | Consultant and private investor. Formerly, Chief Financial Officer, Aveon Group L.P. (investment management firm) (2010-2011). Formerly, Vice Chairman, Commercial Industrial Finance Corp. (specialty finance company) (2006-2010). Formerly, President and Chief Executive Officer, Prizm Capital Management, LLC (investment management firm) (2002-2005). Formerly, Executive Vice President and Chief Financial Officer, United Asset Management Corporation (investment management firm) (1982-2001). Formerly, Senior Manager, Price Waterhouse (now PricewaterhouseCoopers) (an independent registered public accounting firm) (1972-1981). Directorships in the Last Five Years.(1) None. |
| | | |
Ronald A. Pearlman 1940 | | Trustee | | Since 2003 | | Professor of Law, Georgetown University Law Center. Formerly, Deputy Assistant Secretary (Tax Policy) and Assistant Secretary (Tax Policy), U.S. Department of the Treasury (1983-1985). Formerly, Chief of Staff, Joint Committee on Taxation, U.S. Congress (1988-1990). Directorships in the Last Five Years.(1) None. |
Eaton Vance
Parametric Structured International Equity Fund
January 31, 2013
Management and Organization — continued
| | | | | | |
| Name and Year of Birth | | Position(s) with the Trust | | Length of
Service | | Principal Occupation(s) and Directorships During Past Five Years and Other Relevant Experience |
Noninterested Trustees (continued) |
| | | |
Helen Frame Peters 1948 | | Trustee | | Since 2008 | | Professor of Finance, Carroll School of Management, Boston College. Formerly, Dean, Carroll School of Management, Boston College (2000-2002). Formerly, Chief Investment Officer, Fixed Income, Scudder Kemper Investments (investment management firm) (1998-1999). Formerly, Chief Investment Officer, Equity and Fixed Income, Colonial Management Associates (investment management firm) (1991-1998). Directorships in the Last Five Years.(1) Formerly, Director of BJ’s Wholesale Club, Inc. (wholesale club retailer) (2004-2011). Formerly, Trustee of SPDR Index Shares Funds and SPDR Series Trust (exchange traded funds) (2000-2009). Formerly, Director of Federal Home Loan Bank of Boston (a bank for banks) (2007-2009). |
| | | |
Lynn A. Stout 1957 | | Trustee | | Since 1998 | | Distinguished Professor of Corporate and Business Law, Jack G. Clarke Business Law Institute, Cornell University Law School. Formerly, the Paul Hastings Professor of Corporate and Securities Law (2006-2012) and Professor of Law (2001-2006), University of California at Los Angeles School of Law. Directorships in the Last Five Years.(1) None. |
| | | |
Harriett Tee Taggart 1948 | | Trustee | | Since 2011 | | Managing Director, Taggart Associates (a professional practice firm). Formerly, Partner and Senior Vice President, Wellington Management Company, LLP (investment management firm) (1983-2006). Directorships in the Last Five Years. Director of Albemarle Corporation (chemicals manufacturer) (since 2007) and The Hanover Group (specialty property and casualty insurance company) (since 2009). Formerly, Director of Lubrizol Corporation (specialty chemicals) (2007-2011). |
| | | |
Ralph F. Verni 1943 | | Chairman of the Board and Trustee | | Chairman of the Board since 2007 and Trustee since 2005 | | Consultant and private investor. Formerly, Chief Investment Officer (1982-1992), Chief Financial Officer (1988-1990) and Director (1982-1992), New England Life. Formerly, Chairperson, New England Mutual Funds (1982-1992). Formerly, President and Chief Executive Officer, State Street Management & Research (1992-2000). Formerly, Chairperson, State Street Research Mutual Funds (1992-2000). Formerly, Director, W.P. Carey, LLC (1998-2004) and First Pioneer Farm Credit Corp. (2002-2006). Directorships in the Last Five Years.(1) None. |
| | | |
| | | | | | |
Principal Officers who are not Trustees |
| Name and Year of Birth | | Position(s) with the Trust | | Length of Service | | Principal Occupation(s) During Past Five Years |
| | | |
Duncan W. Richardson 1957 | | President | | Since 2011 | | Director of EVC and Executive Vice President and Chief Equity Investment Officer of EVC, EVM and BMR. |
| | | |
Payson F. Swaffield 1956 | | Vice President | | Since 2011 | | Vice President and Chief Income Investment Officer of EVM and BMR. |
| | | |
Maureen A. Gemma 1960 | | Vice President, Secretary and Chief Legal Officer | | Vice President since 2011; Secretary since 2007 and Chief Legal Officer since 2008 | | Vice President of EVM and BMR. |
| | | |
James F. Kirchner(2) 1967 | | Treasurer | | Since 2013 | | Vice President of EVM and BMR. |
| | | |
Paul M. O’Neil 1953 | | Chief Compliance Officer | | Since 2004 | | Vice President of EVM and BMR. |
| (1) | During their respective tenures, the Trustees (except Mr. Eston and Ms. Taggart) also served as trustees of one or more of the following Eaton Vance funds (which operated in the years noted): Eaton Vance Credit Opportunities Fund (launched in 2005 and terminated in 2010); Eaton Vance Insured Florida Plus Municipal Bond Fund (launched in 2002 and terminated in 2009); and Eaton Vance National Municipal Income Trust (launched in 1998 and terminated in 2009). |
| (2) | Prior to 2013, Mr. Kirchner served as Assistant Treasurer of the Trust since 2007. |
The SAI for the Fund includes additional information about the Trustees and officers of the Fund and can be obtained without charge on Eaton Vance’s website at www.eatonvance.com or by calling 1-800-262-1122.
Eaton Vance Funds
IMPORTANT NOTICES
Privacy. The Eaton Vance organization is committed to ensuring your financial privacy. Each of the financial institutions identified below has in effect the following policy (“Privacy Policy”) with respect to nonpublic personal information about its customers:
| Ÿ | | Only such information received from you, through application forms or otherwise, and information about your Eaton Vance fund transactions will be collected. This may include information such as name, address, social security number, tax status, account balances and transactions. |
| Ÿ | | None of such information about you (or former customers) will be disclosed to anyone, except as permitted by law (which includes disclosure to employees necessary to service your account). In the normal course of servicing a customer’s account, Eaton Vance may share information with unaffiliated third parties that perform various required services such as transfer agents, custodians and broker-dealers. |
| Ÿ | | Policies and procedures (including physical, electronic and procedural safeguards) are in place that are designed to protect the confidentiality of such information. |
| Ÿ | | We reserve the right to change our Privacy Policy at any time upon proper notification to you. Customers may want to review our Privacy Policy periodically for changes by accessing the link on our homepage: www.eatonvance.com. |
Our pledge of privacy applies to the following entities within the Eaton Vance organization: the Eaton Vance Family of Funds, Eaton Vance Management, Eaton Vance Investment Counsel, Eaton Vance Distributors, Inc., Eaton Vance Trust Company, Eaton Vance Management’s Real Estate Investment Group and Boston Management and Research. In addition, our Privacy Policy applies only to those Eaton Vance customers who are individuals and who have a direct relationship with us. If a customer’s account (i.e., fund shares) is held in the name of a third-party financial advisor/broker-dealer, it is likely that only such advisor’s privacy policies apply to the customer. This notice supersedes all previously issued privacy disclosures. For more information about Eaton Vance’s Privacy Policy, please call 1-800-262-1122.
Delivery of Shareholder Documents. The Securities and Exchange Commission (SEC) permits funds to deliver only one copy of shareholder documents, including prospectuses, proxy statements and shareholder reports, to fund investors with multiple accounts at the same residential or post office box address. This practice is often called “householding” and it helps eliminate duplicate mailings to shareholders. Eaton Vance, or your financial advisor, may household the mailing of your documents indefinitely unless you instruct Eaton Vance, or your financial advisor, otherwise. If you would prefer that your Eaton Vance documents not be householded, please contact Eaton Vance at 1-800-262-1122, or contact your financial advisor. Your instructions that householding not apply to delivery of your Eaton Vance documents will be effective within 30 days of receipt by Eaton Vance or your financial advisor.
Portfolio Holdings. Each Eaton Vance Fund and its underlying Portfolio(s) (if applicable) will file a schedule of portfolio holdings on Form N-Q with the SEC for the first and third quarters of each fiscal year. The Form N-Q will be available on the Eaton Vance website at www.eatonvance.com, by calling Eaton Vance at 1-800-262-1122 or in the EDGAR database on the SEC’s website at www.sec.gov. Form N-Q may also be reviewed and copied at the SEC’s public reference room in Washington, D.C. (call 1-800-732-0330 for information on the operation of the public reference room).
Proxy Voting. From time to time, funds are required to vote proxies related to the securities held by the funds. The Eaton Vance Funds or their underlying Portfolios (if applicable) vote proxies according to a set of policies and procedures approved by the Funds’ and Portfolios’ Boards. You may obtain a description of these policies and procedures and information on how the Funds or Portfolios voted proxies relating to portfolio securities during the most recent 12-month period ended June 30, without charge, upon request, by calling 1-800-262-1122 and by accessing the SEC’s website at www.sec.gov.
This Page Intentionally Left Blank
This Page Intentionally Left Blank
This Page Intentionally Left Blank
Investment Adviser and Administrator
Eaton Vance Management
Two International Place
Boston, MA 02110
Sub-Adviser
Parametric Portfolio Associates LLC
1918 Eighth Avenue, Suite 3100
Seattle, WA 98101
Principal Underwriter*
Eaton Vance Distributors, Inc.
Two International Place
Boston, MA 02110
(617) 482-8260
Custodian
State Street Bank and Trust Company
200 Clarendon Street
Boston, MA 02116
Transfer Agent
BNY Mellon Asset Servicing (US) Inc.
Attn: Eaton Vance Funds
P.O. Box 9653
Providence, RI 02940-9653
(800) 262-1122
Independent Registered Public Accounting Firm
Deloitte & Touche LLP
200 Berkeley Street
Boston, MA 02116-5022
Fund Offices
Two International Place
Boston, MA 02110
| * | FINRA BrokerCheck. Investors may check the background of their Investment Professional by contacting the Financial Industry Regulatory Authority (FINRA). FINRA BrokerCheck is a free tool to help investors check the professional background of current and former FINRA-registered securities firms and brokers. FINRA BrokerCheck is available by calling 1-800-289-9999 and at www.FINRA.org. The FINRA BrokerCheck brochure describing the program is available to investors at www.FINRA.org. |

| | |
Eaton Vance Parametric Structured Emerging Markets Fund Annual Report January 31, 2013 | | |

Fund shares are not insured by the FDIC and are not deposits or other obligations of, or guaranteed by, any depository institution. Shares are subject to investment risks, including possible loss of principal invested.
This report must be preceded or accompanied by a current summary prospectus or prospectus. Before investing, investors should consider carefully the investment objective, risks, and charges and expenses of a mutual fund. This and other important information is contained in the summary prospectus and prospectus, which can be obtained from a financial advisor. Prospective investors should read the prospectus carefully before investing. For further information, please call 1-800-262-1122.
Annual Report January 31, 2013
Eaton Vance
Parametric Structured Emerging Markets Fund
Table of Contents
| | | | |
Management’s Discussion of Fund Performance | | | 2 | |
| |
Performance | | | 3 | |
| |
Fund Profile | | | 4 | |
| |
Endnotes and Additional Disclosures | | | 5 | |
| |
Fund Expenses | | | 6 | |
| |
Financial Statements | | | 7 | |
| |
Report of Independent Registered Public Accounting Firm | | | 39 | |
| |
Federal Tax Information | | | 40 | |
| |
Management and Organization | | | 41 | |
| |
Important Notices | | | 43 | |
Eaton Vance
Parametric Structured Emerging Markets Fund
January 31, 2013
Management’s Discussion of Fund Performance1
Economic and Market Conditions
For the 12-month period, emerging markets as a whole returned 7.64%, as measured by the MSCI Emerging Markets Index (the Index)2. As 2012 began, global investors had reasonable concerns that the frequency of significant events that occurred during the better part of 2011 would continue to have a dampening effect in the new year. However, their trepidation eased slightly due to a rather encouraging first quarter of 2012 – volatility moderated, global markets weathered the myriad of economic opinions from euro-land politicians and countries that benefited from the “Arab Spring” revolutions appeared to be on their way to attracting new foreign investment.
Be that as it may, the emerging markets experienced a bumpy ride as the second and third quarters of 2012 came to a close. Key factors impacting global markets included the eurozone crisis and its corresponding rescue efforts, the so-called U.S. “fiscal cliff” and the U.S. presidential election in November 2012, and slowing global growth, with a great deal of focus on China.
The emerging markets continued to perform strongly in the fourth quarter of 2012, with the Index up 5.58%. A globally noteworthy event was the averting of the so-called U.S. “fiscal cliff” after lawmakers passed a bill on January 1, 2013 preventing a slew of spending cuts and tax hikes. This caused the Index to rally 2.12% the next day, as markets appeared to breathe a collective sigh of relief following the resolution of one uncertainty.
Looking at the frontier spectrum, these markets returned 16.34% for the period, as measured by the MSCI Frontier Markets Index. Top-performing countries included Kenya and Nigeria. Ukraine was the worst-performing frontier market due to factors such as a widening of its current deficit and tightening of its economic growth.
Fund Performance
For the fiscal year ended January 31, 2013, Eaton Vance Parametric Structured Emerging Markets Fund (the Fund) had a total return of 10.89% for Class A shares at net asset value (NAV), outperforming the 7.64% return of the Fund’s benchmark, the Index.
In terms of country allocations, contributors to Fund performance relative to the Index for the 12-month period included the Fund’s underweight to Brazil, which underperformed the Index. In addition, the Fund’s overweights
to Thailand and Mexico, both of which outperformed the Index, also contributed to Fund performance relative to the Index. Detractors from Fund performance relative to the Index included the Fund’s underweight to China, which outperformed the Index, and the Fund’s overweight to Morocco, which underperformed the Index. In addition, the Fund’s exposure to Argentina, which is not represented in the Index, also hurt relative performance for the 12-month period.
See Endnotes and Additional Disclosures in this report.
Past performance is no guarantee of future results. Returns are historical and are calculated by determining the percentage change in net asset value (NAV) or offering price (as applicable) with all distributions reinvested. Investment return and principal value will fluctuate so that shares, when redeemed, may be worth more or less than their original cost. Performance less than one year is cumulative. Performance is for the stated time period only; due to market volatility, the Fund’s current performance may be lower or higher than quoted. Returns are before taxes unless otherwise noted. For performance as of the most recent month end, please refer to www.eatonvance.com.
Eaton Vance
Parametric Structured Emerging Markets Fund
January 31, 2013
Performance2,3
Portfolio Managers David Stein, Ph.D. and Thomas Seto, each of Parametric Portfolio Associates LLC
| | | | | | | | | | | | | | | | |
| % Average Annual Total Returns | | Inception Date | | | One Year | | | Five Years | | | Since Inception | |
Class A at NAV | | | 06/30/2006 | | | | 10.89 | % | | | 1.15 | % | | | 7.64 | % |
Class A with 5.75% Maximum Sales Charge | | | — | | | | 4.51 | | | | –0.04 | | | | 6.67 | |
Class C at NAV | | | 06/30/2006 | | | | 10.07 | | | | 0.40 | | | | 6.82 | |
Class C with 1% Maximum Sales Charge | | | — | | | | 9.07 | | | | 0.40 | | | | 6.82 | |
Class I at NAV | | | 06/30/2006 | | | | 11.22 | | | | 1.41 | | | | 7.90 | |
MSCI Emerging Markets Index | | | 06/30/2006 | | | | 7.64 | % | | | 2.04 | % | | | 8.03 | % |
| | | | |
| | | | | | | | | | | | | | | | |
| % Total Annual Operating Expense Ratios4 | | | | | Class A | | | Class C | | | Class I | |
| | | | | | | 1.45 | % | | | 2.19 | % | | | 1.20 | % |
Growth of $250,000
This graph shows the change in value of a hypothetical investment of $250,000 in Class I of the Fund for the period indicated. For comparison, the same investment is shown in the indicated index.
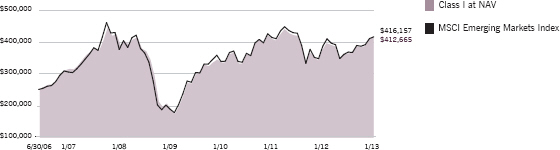
| | | | | | | | |
| Growth of Investment | | Amount Invested | | Period Beginning | | At NAV | | With Maximum Sales Charge |
Class A | | $10,000 | | 06/30/2006 | | $16,245 | | $15,311 |
Class C | | $10,000 | | 06/30/2006 | | $15,452 | | N.A. |
See Endnotes and Additional Disclosures in this report.
Past performance is no guarantee of future results. Returns are historical and are calculated by determining the percentage change in net asset value (NAV) or offering price (as applicable) with all distributions reinvested. Investment return and principal value will fluctuate so that shares, when redeemed, may be worth more or less than their original cost. Performance less than one year is cumulative. Performance is for the stated time period only; due to market volatility, the Fund’s current performance may be lower or higher than quoted. Returns are before taxes unless otherwise noted. For performance as of the most recent month end, please refer to www.eatonvance.com.
Eaton Vance
Parametric Structured Emerging Markets Fund
January 31, 2013
Fund Profile
Top 10 Holdings (% of net assets)5
| | | | | | |
MTN Group, Ltd. | | | 1.1 | % | | |
Samsung Electronics Co., Ltd. | | | 1.1 | | | |
America Movil SAB de CV, Series L | | | 1.0 | | | |
OAO Gazprom ADR | | | 0.9 | | | |
China Mobile, Ltd. | | | 0.8 | | | |
Sberbank of Russia | | | 0.8 | | | |
Taiwan Semiconductor Manufacturing Co., Ltd. | | | 0.7 | | | |
Grupo Financiero Banorte SAB de CV, Class O | | | 0.6 | | | |
LUKOIL OAO ADR | | | 0.6 | | | |
Infosys, Ltd. | | | 0.6 | | | |
| Total | | 8.2% | | | |
See Endnotes and Additional Disclosures in this report.
Eaton Vance
Parametric Structured Emerging Markets Fund
January 31, 2013
Endnotes and Additional Disclosures
| 1 | The views expressed in this report are those of the portfolio manager(s) and are current only through the date stated at the top of this page. These views are subject to change at any time based upon market or other conditions, and Eaton Vance and the Fund(s) disclaim any responsibility to update such views. These views may not be relied upon as investment advice and, because investment decisions are based on many factors, may not be relied upon as an indication of trading intent on behalf of any Eaton Vance fund. This commentary may contain statements that are not historical facts, referred to as “forward looking statements”. The Fund’s actual future results may differ significantly from those stated in any forward looking statement, depending on factors such as changes in securities or financial markets or general economic conditions, the volume of sales and purchases of Fund shares, the continuation of investment advisory, administrative and service contracts, and other risks discussed from time to time in the Fund’s filings with the Securities and Exchange Commission. |
| 2 | MSCI Emerging Markets Index is an unmanaged index of emerging markets common stocks. MSCI Frontier Markets Index is an unmanaged index that measures the performance of stock markets with less-developed economies and financial markets than emerging markets, and that typically have more restrictions on foreign stock ownership. MSCI indices are net of foreign withholding taxes. Source: MSCI. MSCI data may not be reproduced or used for any other purpose. MSCI provides no warranties, has not prepared or approved this report, and has no liability hereunder. Unless otherwise stated, index returns do not reflect the effect of any applicable sales charges, commissions, expenses, taxes or leverage, as applicable. It is not possible to invest directly in an index. |
| 3 | Total Returns at NAV do not include applicable sales charges. If sales charges were deducted, the returns would be lower. Total Returns shown with maximum sales charge reflect the stated maximum sales charge. Unless otherwise stated, performance does not reflect the deduction of taxes on Fund distributions or redemptions of Fund shares. |
| 4 | Source: Fund prospectus. |
| 5 | Excludes cash and cash equivalents. |
Important Notice to Shareholders
Effective March 1, 2013, the name of the Fund was changed to Parametric Emerging Markets Fund. Class A and Class I shares of the Fund were renamed Investor Class and Institutional Class, respectively. The front-end sales charge payable upon purchase of Investor Class shares of the Fund was eliminated. The minimum initial purchase of Institutional Class shares of the Fund was changed to $50,000 (waived in certain circumstances). Class C shares of the Fund are no longer available for purchase, except by: (1) existing shareholders (including shares acquired through the reinvestment of dividends and distributions); or (2) qualified retirement plans.
| | Fund profile subject to change due to active management. |
Eaton Vance
Parametric Structured Emerging Markets Fund
January 31, 2013
Fund Expenses
Example: As a Fund shareholder, you incur two types of costs: (1) transaction costs, including sales charges (loads) on purchases and redemption fees (if applicable); and (2) ongoing costs, including management fees; distribution and/or service fees; and other Fund expenses. This Example is intended to help you understand your ongoing costs (in dollars) of Fund investing and to compare these costs with the ongoing costs of investing in other mutual funds. The Example is based on an investment of $1,000 invested at the beginning of the period and held for the entire period (August 1, 2012 – January 31, 2013).
Actual Expenses: The first section of the table below provides information about actual account values and actual expenses. You may use the information in this section, together with the amount you invested, to estimate the expenses that you paid over the period. Simply divide your account value by $1,000 (for example, an $8,600 account value divided by $1,000 = 8.6), then multiply the result by the number in the first section under the heading entitled “Expenses Paid During Period” to estimate the expenses you paid on your account during this period.
Hypothetical Example for Comparison Purposes: The second section of the table below provides information about hypothetical account values and hypothetical expenses based on the actual Fund expense ratio and an assumed rate of return of 5% per year (before expenses), which is not the actual Fund return. The hypothetical account values and expenses may not be used to estimate the actual ending account balance or expenses you paid for the period. You may use this information to compare the ongoing costs of investing in your Fund and other funds. To do so, compare this 5% hypothetical example with the 5% hypothetical examples that appear in the shareholder reports of the other funds.
Please note that the expenses shown in the table are meant to highlight your ongoing costs only and do not reflect any transactional costs, such as sales charges (loads) or redemption fees (if applicable). Therefore, the second section of the table is useful in comparing ongoing costs only, and will not help you determine the relative total costs of owning different funds. In addition, if these transactional costs were included, your costs would be higher.
| | | | | | | | | | | | | | | | |
| | | Beginning
Account Value
(8/1/12) | | | Ending
Account Value
(1/31/13) | | | Expenses Paid
During Period*
(8/1/12 – 1/31/13) | | | Annualized
Expense
Ratio | |
| | | | |
| | | | | | | | | | | | | | | | |
Actual | | | | | | | | | | | | | |
Class A | | $ | 1,000.00 | | | $ | 1,144.10 | | | $ | 7.65 | | | | 1.42 | % |
Class C | | $ | 1,000.00 | | | $ | 1,139.40 | | | $ | 11.67 | | | | 2.17 | % |
Class I | | $ | 1,000.00 | | | $ | 1,145.80 | | | $ | 6.31 | | | | 1.17 | % |
| | | | | | | | | | | | | | | | | |
| | | | |
| | | | | | | | | | | | | | | | |
Hypothetical | | | | | | | | | | | | | |
(5% return per year before expenses) | | | | | | | | | | | | | |
Class A | | $ | 1,000.00 | | | $ | 1,018.00 | | | $ | 7.20 | | | | 1.42 | % |
Class C | | $ | 1,000.00 | | | $ | 1,014.20 | | | $ | 10.99 | | | | 2.17 | % |
Class I | | $ | 1,000.00 | | | $ | 1,019.30 | | | $ | 5.94 | | | | 1.17 | % |
| * | Expenses are equal to the Fund’s annualized expense ratio for the indicated Class, multiplied by the average account value over the period, multiplied by 184/366 (to reflect the one-half year period). The Example assumes that the $1,000 was invested at the net asset value per share determined at the close of business on July 31, 2012. |
Eaton Vance
Parametric Structured Emerging Markets Fund
January 31, 2013
Portfolio of Investments
| | | | | | | | |
| Common Stocks — 98.1% | |
| | |
| | | | | | | | |
| Security | | Shares | | | Value | |
| | | | | | | | |
|
Argentina — 0.9% | |
Adecoagro SA(1) | | | 77,700 | | | $ | 660,450 | |
Arcos Dorados Holdings, Inc., Class A | | | 341,000 | | | | 4,685,340 | |
Banco Macro SA, Class B ADR(1) | | | 129,587 | | | | 2,157,624 | |
BBVA Banco Frances SA ADR(1) | | | 231,888 | | | | 1,099,149 | |
Cresud SA ADR | | | 278,630 | | | | 2,660,916 | |
Grupo Financiero Galicia SA, Class B ADR | | | 322,600 | | | | 2,142,064 | |
IRSA Inversiones y Representaciones SA ADR | | | 61,510 | | | | 544,364 | |
MercadoLibre, Inc. | | | 69,300 | | | | 6,126,120 | |
Pampa Energia SA ADR(1) | | | 188,600 | | | | 812,866 | |
Petrobras Energia SA ADR | | | 750,308 | | | | 4,036,657 | |
Telecom Argentina SA ADR | | | 477,251 | | | | 7,573,973 | |
| | |
| | | | | | $ | 32,499,523 | |
| | |
|
Botswana — 0.3% | |
Barclays Bank of Botswana | | | 1,137,465 | | | $ | 979,486 | |
Botswana Insurance Holdings Ltd. | | | 575,111 | | | | 734,968 | |
First National Bank of Botswana | | | 4,730,800 | | | | 1,754,374 | |
Letshego Holdings, Ltd. | | | 12,485,691 | | | | 3,199,718 | |
Sechaba Breweries Ltd. | | | 905,550 | | | | 1,782,774 | |
Standard Chartered Bank Botswana | | | 531,120 | | | | 688,213 | |
| | |
| | | | | | $ | 9,139,533 | |
| | |
|
Brazil — 6.4% | |
AES Tiete SA, PFC Shares | | | 138,000 | | | $ | 1,441,233 | |
All America Latina Logistica SA (Units) | | | 478,200 | | | | 2,081,831 | |
Anhanguera Educacional Participacoes SA | | | 72,200 | | | | 1,404,009 | |
B2W Companhia Global do Varejo(1) | | | 99,370 | | | | 759,047 | |
Banco Bradesco SA ADR | | | 61,174 | | | | 1,124,378 | |
Banco Bradesco SA, PFC Shares | | | 659,056 | | | | 12,121,084 | |
Banco do Brasil SA | | | 366,698 | | | | 4,490,322 | |
Banco do Estado do Rio Grande do Sul, PFC Shares | | | 97,100 | | | | 830,287 | |
Banco Santander Brasil SA | | | 352,600 | | | | 2,588,510 | |
BM&F Bovespa SA | | | 641,451 | | | | 4,483,055 | |
BR Malls Participacoes SA | | | 167,400 | | | | 2,164,281 | |
BR Properties SA | | | 45,000 | | | | 583,481 | |
Bradespar SA, PFC Shares | | | 82,500 | | | | 1,276,275 | |
Braskem SA, PFC Shares | | | 89,760 | | | | 676,923 | |
BRF-Brasil Foods SA | | | 244,640 | | | | 5,366,859 | |
BRF-Brasil Foods SA ADR | | | 19,900 | | | | 441,780 | |
Brookfield Incorporacoes SA | | | 244,500 | | | | 413,981 | |
Centrais Eletricas Brasileiras SA, Class B, PFC Shares | | | 371,500 | | | | 2,360,701 | |
CETIP SA - Mercados Organizados | | | 92,200 | | | | 1,160,323 | |
| | | | | | | | |
| Security | | Shares | | | Value | |
| | | | | | | | |
|
Brazil (continued) | |
Cia Brasileira de Distribuicao Grupo Pao de Acucar, PFC Shares | | | 45,269 | | | $ | 2,131,536 | |
Cia de Bebidas das Americas ADR, PFC Shares | | | 28,352 | | | | 1,334,245 | |
Cia de Bebidas das Americas, PFC Shares | | | 311,190 | | | | 14,642,817 | |
Cia de Companhia de Concessoes Rodoviarias (CCR) | | | 643,300 | | | | 6,626,763 | |
Cia de Saneamento Basico do Estado de Sao Paulo | | | 88,620 | | | | 3,989,457 | |
Cia de Saneamento de Minas Gerais SA ADR | | | 57,100 | | | | 626,958 | |
Cia de Saneamento de Minas Gerais-Copasa MG | | | 45,100 | | | | 1,096,242 | |
Cia de Transmissao de Energia Eletrica Paulista, PFC Shares | | | 37,590 | | | | 660,682 | |
Cia Energetica de Minas Gerais SA, PFC Shares | | | 313,067 | | | | 3,395,811 | |
Cia Energetica de Sao Paulo, PFC Shares | | | 191,200 | | | | 1,906,294 | |
Cia Hering | | | 73,300 | | | | 1,391,046 | |
Cia Paranaense de Energia-Copel, PFC Shares | | | 82,000 | | | | 1,347,177 | |
Cia Siderurgica Nacional SA (CSN) | | | 225,500 | | | | 1,214,649 | |
Cielo SA | | | 222,683 | | | | 6,303,503 | |
Contax Participacoes SA, PFC Shares | | | 24,300 | | | | 330,344 | |
Cosan SA Industria e Comercio | | | 53,700 | | | | 1,265,875 | |
CPFL Energia SA | | | 170,400 | | | | 1,738,912 | |
Cyrela Brazil Realty SA | | | 137,100 | | | | 1,206,813 | |
Diagnosticos da America SA | | | 177,000 | | | | 1,255,471 | |
Duratex SA | | | 93,024 | | | | 645,565 | |
EcoRodovias Infraestrutura e Logistica SA | | | 133,000 | | | | 1,176,069 | |
EDP-Energias do Brasil SA | | | 197,900 | | | | 1,210,895 | |
Eletropaulo Metropolitana SA, Class B, PFC Shares | | | 124,280 | | | | 852,733 | |
Embraer SA | | | 370,600 | | | | 3,053,833 | |
Embraer SA ADR | | | 46,648 | | | | 1,537,985 | |
Estacio Participacoes SA | | | 55,900 | | | | 1,238,682 | |
Fibria Celulose SA(1) | | | 84,957 | | | | 1,039,913 | |
Gafisa SA(1) | | | 426,700 | | | | 1,064,955 | |
Gerdau SA, PFC Shares | | | 263,400 | | | | 2,308,540 | |
Gol Linhas Aereas Inteligentes SA, PFC Shares | | | 140,900 | | | | 1,023,230 | |
Hypermarcas SA(1) | | | 201,800 | | | | 1,740,388 | |
Iochpe-Maxion SA | | | 98,700 | | | | 1,292,308 | |
Itau Unibanco Holding SA ADR, PFC Shares | | | 71,570 | | | | 1,233,151 | |
Itau Unibanco Holding SA, PFC Shares | | | 637,400 | | | | 10,998,185 | |
Itausa-Investimentos Itau SA, PFC Shares | | | 1,167,174 | | | | 5,902,662 | |
JBS SA(1) | | | 356,725 | | | | 1,367,553 | |
Klabin SA, PFC Shares | | | 177,900 | | | | 1,216,699 | |
Light SA | | | 73,400 | | | | 755,208 | |
LLX Logistica SA(1) | | | 363,900 | | | | 406,870 | |
Localiza Rent a Car SA | | | 103,700 | | | | 1,902,887 | |
Lojas Americanas SA, PFC Shares | | | 277,523 | | | | 2,475,765 | |
Lojas Renner SA | | | 50,800 | | | | 2,032,428 | |
Marcopolo SA, PFC Shares | | | 360,100 | | | | 2,429,222 | |
Marfrig Frigorificos e Comercio de Alimentos
SA(1) | | | 203,555 | | | | 1,045,682 | |
| | | | |
| | 7 | | See Notes to Financial Statements. |
Eaton Vance
Parametric Structured Emerging Markets Fund
January 31, 2013
Portfolio of Investments — continued
| | | | | | | | |
| Security | | Shares | | | Value | |
| | | | | | | | |
|
Brazil (continued) | |
Metalurgica Gerdau SA, PFC Shares | | | 84,300 | | | $ | 941,949 | |
MMX Mineracao e Metalicos SA(1) | | | 179,100 | | | | 303,894 | |
MPX Energia SA(1) | | | 182,500 | | | | 905,186 | |
MRV Engenharia e Participacoes SA | | | 207,300 | | | | 1,185,351 | |
Natura Cosmeticos SA | | | 90,000 | | | | 2,419,318 | |
OGX Petroleo e Gas Participacoes SA(1) | | | 409,300 | | | | 842,673 | |
Oi SA ADR | | | 190,200 | | | | 781,722 | |
Oi SA, PFC Shares | | | 629,857 | | | | 2,553,115 | |
PDG Realty SA Empreendimentos e Participacoes | | | 823,900 | | | | 1,304,145 | |
Petroleo Brasileiro SA | | | 43,200 | | | | 393,941 | |
Petroleo Brasileiro SA ADR | | | 71,900 | | | | 1,300,671 | |
Petroleo Brasileiro SA, PFC Shares | | | 2,068,100 | | | | 18,709,556 | |
Randon Participacoes SA, PFC Shares | | | 177,600 | | | | 1,046,574 | |
Rossi Residencial SA | | | 198,500 | | | | 418,396 | |
Souza Cruz SA | | | 165,900 | | | | 2,742,486 | |
Suzano Papel e Celulose SA | | | 437,425 | | | | 1,601,508 | |
Telefonica Brasil SA, PFC Shares | | | 223,126 | | | | 5,635,945 | |
Tim Participacoes SA | | | 603,727 | | | | 2,667,401 | |
Totvs SA | | | 126,190 | | | | 2,746,874 | |
Tractebel Energia SA | | | 122,000 | | | | 2,168,488 | |
Ultrapar Participacoes SA | | | 115,784 | | | | 2,790,373 | |
Usinas Siderurgicas de Minas Gerais SA, PFC Shares | | | 199,950 | | | | 1,037,238 | |
Vale SA | | | 34,400 | | | | 693,626 | |
Vale SA ADR | | | 65,300 | | | | 1,317,101 | |
Vale SA, PFC Shares | | | 940,540 | | | | 18,226,501 | |
Weg SA | | | 150,000 | | | | 1,900,859 | |
| | |
| | | | | | $ | 224,819,254 | |
| | |
|
Bulgaria — 0.1% | |
CB First Investment Bank AD(1) | | | 235,000 | | | $ | 329,366 | |
Chimimport AD(1) | | | 329,922 | | | | 372,782 | |
Corporate Commercial Bank AD(1) | | | 10,400 | | | | 607,440 | |
MonBat AD | | | 60,235 | | | | 254,396 | |
Petrol AD(1) | | | 102,500 | | | | 334,313 | |
Sopharma AD | | | 354,600 | | | | 580,228 | |
Vivacom(1) | | | 44,690 | | | | 86,244 | |
| | |
| | | | | | $ | 2,564,769 | |
| | |
|
Chile — 3.2% | |
Administradora de Fondos de Pensiones Provida SA | | | 202,000 | | | $ | 1,486,940 | |
AES Gener SA | | | 2,001,600 | | | | 1,377,414 | |
Aguas Andinas SA, Series A | | | 2,464,200 | | | | 1,824,821 | |
Almendral SA | | | 2,512,600 | | | | 408,569 | |
Antarchile SA, Series A | | | 140,704 | | | | 2,410,739 | |
Banco de Chile | | | 49,502,828 | | | | 8,238,324 | |
| | | | | | | | |
| Security | | Shares | | | Value | |
| | | | | | | | |
|
Chile (continued) | |
Banco de Chile ADR | | | 7,141 | | | $ | 710,173 | |
Banco de Credito e Inversiones | | | 56,681 | | | | 4,421,606 | |
Banco Santander Chile SA | | | 72,005,510 | | | | 5,485,972 | |
Banmedica SA | | | 484,730 | | | | 1,253,766 | |
Besalco SA | | | 750,600 | | | | 1,392,375 | |
Cap SA | | | 86,112 | | | | 3,186,833 | |
Cencosud SA | | | 934,931 | | | | 5,814,979 | |
CFR Pharmaceuticals SA | | | 3,523,700 | | | | 927,163 | |
Cia Cervecerias Unidas SA | | | 110,890 | | | | 1,778,827 | |
Cia General de Electricidad SA | | | 274,019 | | | | 1,568,640 | |
Cia Sud Americana de Vapores SA(1) | | | 3,305,599 | | | | 361,453 | |
Colbun SA(1) | | | 6,289,410 | | | | 1,985,834 | |
Corpbanca SA | | | 112,088,770 | | | | 1,604,727 | |
E.CL SA | | | 469,400 | | | | 1,111,417 | |
Embotelladora Andina SA, Class B, PFC Shares | | | 278,341 | | | | 1,830,912 | |
Empresa Nacional de Electricidad SA | | | 2,896,263 | | | | 5,001,236 | |
Empresas CMPC SA | | | 1,236,620 | | | | 4,794,432 | |
Empresas Copec SA | | | 501,376 | | | | 7,763,892 | |
Empresas La Polar SA(1) | | | 1,713,400 | | | | 709,356 | |
Enersis SA | | | 10,494,021 | | | | 4,137,766 | |
ENTEL SA | | | 87,900 | | | | 1,909,088 | |
Grupo Security SA | | | 1,737,289 | | | | 762,945 | |
Inversiones Aguas Metropolitanas SA | | | 464,900 | | | | 961,265 | |
Latam Airlines Group SA | | | 235,695 | | | | 5,794,570 | |
Latam Airlines Group SA BDR(1) | | | 28,260 | | | | 688,282 | |
Madeco SA | | | 5,047,652 | | | | 224,627 | |
Minera Valparaiso SA | | | 12,324 | | | | 413,106 | |
Molibdenos y Metales SA | | | 16,900 | | | | 297,665 | |
Parque Arauco SA | | | 639,900 | | | | 1,744,407 | |
Quinenco SA | | | 190,344 | | | | 645,999 | |
Ripley Corp. SA | | | 1,068,500 | | | | 1,159,103 | |
S.A.C.I. Falabella SA | | | 880,900 | | | | 10,248,974 | |
Salfacorp SA | | | 816,100 | | | | 2,004,288 | |
Sigdo Koppers SA | | | 654,331 | | | | 1,685,568 | |
Sociedad de Inversiones Pampa Calichera SA, Class A | | | 244,730 | | | | 389,363 | |
Sociedad Matriz SAAM SA(1) | | | 6,242,812 | | | | 793,293 | |
Sociedad Quimica y Minera de Chile SA, Series B | | | 101,840 | | | | 5,814,887 | |
Socovesa SA | | | 1,443,206 | | | | 739,706 | |
Sonda SA | | | 944,800 | | | | 3,205,544 | |
Vina Concha y Toro SA | | | 495,122 | | | | 991,948 | |
| | |
| | | | | | $ | 112,062,794 | |
| | |
|
China — 9.4% | |
Agile Property Holdings, Ltd. | | | 400,000 | | | $ | 570,624 | |
Agricultural Bank of China, Ltd., Class H | | | 7,905,000 | | | | 4,294,514 | |
| | | | |
| | 8 | | See Notes to Financial Statements. |
Eaton Vance
Parametric Structured Emerging Markets Fund
January 31, 2013
Portfolio of Investments — continued
| | | | | | | | |
| Security | | Shares | | | Value | |
| | | | | | | | |
|
China (continued) | |
Air China, Ltd., Class H | | | 1,068,000 | | | $ | 915,924 | |
Aluminum Corp. of China, Ltd., Class H(1) | | | 1,874,000 | | | | 900,131 | |
Angang Steel Co., Ltd., Class H(1) | | | 892,000 | | | | 661,682 | |
Anhui Conch Cement Co., Ltd., Class H | | | 501,500 | | | | 1,968,984 | |
Anta Sports Products, Ltd. | | | 1,021,000 | | | | 954,390 | |
AsiaInfo-Linkage, Inc.(1) | | | 72,600 | | | | 797,148 | |
Baidu, Inc. ADR(1) | | | 114,200 | | | | 12,367,860 | |
Bank of China, Ltd., Class H | | | 18,475,000 | | | | 9,126,732 | |
Bank of Communications, Ltd., Class H | | | 1,991,900 | | | | 1,693,607 | |
Beijing Capital International Airport Co., Ltd., Class H | | | 1,064,000 | | | | 888,671 | |
Beijing Enterprises Holdings, Ltd. | | | 270,500 | | | | 1,953,796 | |
BYD Co., Ltd., Class H(1) | | | 607,200 | | | | 2,053,992 | |
Chaoda Modern Agriculture Holdings, Ltd.(1)(2) | | | 2,391,958 | | | | 0 | |
China Agri-Industries Holdings, Ltd. | | | 1,605,000 | | | | 980,649 | |
China Bluechemical, Ltd., Class H | | | 942,000 | | | | 678,015 | |
China CITIC Bank Corp., Ltd., Class H | | | 4,367,000 | | | | 2,990,479 | |
China Coal Energy Co., Class H | | | 1,583,000 | | | | 1,767,698 | |
China Communications Construction Co., Ltd., Class H | | | 2,057,000 | | | | 2,101,817 | |
China Communications Services Corp., Ltd., Class H | | | 1,386,000 | | | | 845,099 | |
China Construction Bank Corp., Class H | | | 21,536,630 | | | | 18,578,158 | |
China COSCO Holdings Co., Ltd., Class H(1) | | | 1,542,975 | | | | 797,962 | |
China Dongxiang (Group) Co., Ltd. | | | 2,459,000 | | | | 399,882 | |
China Eastern Airlines Corp., Ltd., Class H(1) | | | 1,120,000 | | | | 510,262 | |
China Everbright International, Ltd. | | | 1,134,000 | | | | 629,446 | |
China Everbright, Ltd. | | | 384,000 | | | | 725,720 | |
China High Speed Transmission Equipment Group Co., Ltd.(1) | | | 651,000 | | | | 260,361 | |
China International Marine Containers Co., Ltd., Class B(1) | | | 482,672 | | | | 1,026,909 | |
China Life Insurance Co., Ltd., Class H | | | 2,310,000 | | | | 7,709,471 | |
China Longyuan Power Group Corp., Class H | | | 1,363,000 | | | | 1,142,260 | |
China Mengniu Dairy Co., Ltd. | | | 960,000 | | | | 2,808,513 | |
China Merchants Bank Co., Ltd., Class H | | | 1,353,024 | | | | 3,253,845 | |
China Merchants Holdings (International) Co., Ltd. | | | 548,035 | | | | 1,945,996 | |
China Minsheng Banking Corp, Ltd., Class H | | | 1,873,200 | | | | 2,699,229 | |
China Mobile, Ltd. | | | 2,672,500 | | | | 29,238,794 | |
China National Building Material Co., Ltd., Class H | | | 1,216,000 | | | | 1,947,056 | |
China National Materials Co., Ltd., Class H | | | 681,000 | | | | 213,321 | |
China Oilfield Services, Ltd., Class H | | | 662,000 | | | | 1,433,317 | |
China Overseas Land & Investment, Ltd. | | | 1,298,160 | | | | 4,034,629 | |
China Pacific Insurance (Group) Co., Ltd., Class H | | | 390,600 | | | | 1,531,465 | |
China Petroleum & Chemical Corp., Class H | | | 6,895,000 | | | | 8,365,650 | |
China Pharmaceutical Group, Ltd.(1) | | | 1,402,000 | | | | 523,611 | |
China Railway Construction Corp., Class H | | | 1,032,000 | | | | 1,119,803 | |
China Railway Group, Ltd., Class H | | | 2,159,000 | | | | 1,231,246 | |
China Resources Enterprise, Ltd. | | | 634,000 | | | | 2,273,215 | |
| | | | | | | | |
| Security | | Shares | | | Value | |
| | | | | | | | |
|
China (continued) | |
China Resources Gas Group, Ltd. | | | 324,000 | | | $ | 720,100 | |
China Resources Land, Ltd. | | | 784,000 | | | | 2,382,501 | |
China Resources Power Holdings Co., Ltd. | | | 931,600 | | | | 2,589,634 | |
China Shenhua Energy Co., Ltd., Class H | | | 1,386,000 | | | | 5,977,834 | |
China Shineway Pharmaceutical Group, Ltd. | | | 381,000 | | | | 697,297 | |
China Shipping Container Lines Co., Ltd., Class H(1) | | | 2,613,000 | | | | 808,412 | |
China Shipping Development Co., Ltd., Class H | | | 830,000 | | | | 457,318 | |
China Southern Airlines Co., Ltd., Class H | | | 1,434,000 | | | | 862,195 | |
China Taiping Insurance Holdings Co., Ltd.(1) | | | 573,400 | | | | 1,211,582 | |
China Telecom Corp., Ltd., Class H | | | 8,272,000 | | | | 4,516,012 | |
China Travel International Investment Hong Kong, Ltd. | | | 4,692,000 | | | | 1,035,262 | |
China Unicom (Hong Kong), Ltd. | | | 2,706,372 | | | | 4,337,716 | |
China Vanke Co., Ltd., Class B | | | 445,120 | | | | 971,879 | |
China Yurun Food Group, Ltd.(1) | | | 1,776,000 | | | | 1,308,640 | |
China Zhongwang Holdings, Ltd.(1) | | | 464,000 | | | | 176,601 | |
Chongqing Changan Automobile Co., Ltd., Class B | | | 1,100,286 | | | | 1,081,863 | |
Citic Pacific, Ltd. | | | 848,000 | | | | 1,368,354 | |
CNOOC, Ltd. | | | 6,325,000 | | | | 13,032,368 | |
Cosco Pacific, Ltd. | | | 868,000 | | | | 1,413,080 | |
Country Garden Holdings Co.(1) | | | 2,289,631 | | | | 1,219,952 | |
Ctrip.com International, Ltd. ADR(1) | | | 252,800 | | | | 5,007,968 | |
Datang International Power Generation Co., Ltd., Class H | | | 2,154,000 | | | | 949,029 | |
Dongfeng Motor Group Co., Ltd., Class H | | | 1,696,000 | | | | 2,775,972 | |
Focus Media Holding, Ltd. ADR | | | 100,000 | | | | 2,529,000 | |
Global Bio-chem Technology Group Co., Ltd. | | | 2,418,000 | | | | 286,882 | |
Golden Eagle Retail Group, Ltd. | | | 535,000 | | | | 1,157,822 | |
Great Wall Motor Co., Ltd., Class H | | | 862,500 | | | | 3,523,208 | |
Guangdong Investment, Ltd. | | | 1,428,000 | | | | 1,185,455 | |
Guangzhou Automobile Group Co., Ltd., Class H | | | 1,588,013 | | | | 1,333,662 | |
Guangzhou R&F Properties Co., Ltd., Class H | | | 362,400 | | | | 659,634 | |
Harbin Electric Co., Ltd., Class H | | | 688,000 | | | | 623,080 | |
Hengdeli Holdings, Ltd. | | | 2,438,000 | | | | 859,122 | |
Hidili Industry International Development, Ltd. | | | 594,000 | | | | 174,647 | |
Home Inns & Hotels Management, Inc. ADR(1) | | | 50,000 | | | | 1,528,500 | |
Huaneng Power International, Inc., Class H | | | 2,148,000 | | | | 2,214,018 | |
Industrial & Commercial Bank of China, Ltd., Class H | | | 19,498,000 | | | | 14,684,128 | |
Inner Mongolia Eerduosi Cashmere Products Co., Ltd., Class B | | | 401,700 | | | | 437,767 | |
Inner Mongolia Yitai Coal Co., Ltd., Class B | | | 247,900 | | | | 1,449,228 | |
Jiangsu Expressway Co., Ltd., Class H | | | 594,000 | | | | 613,246 | |
Jiangxi Copper Co., Ltd., Class H | | | 672,000 | | | | 1,824,442 | |
Kingboard Chemical Holdings, Ltd. | | | 332,000 | | | | 1,102,044 | |
Kunlun Energy Co., Ltd. | | | 1,552,000 | | | | 3,229,569 | |
Lee & Man Paper Manufacturing, Ltd. | | | 1,220,000 | | | | 823,387 | |
Lenovo Group, Ltd. | | | 2,682,000 | | | | 2,797,051 | |
| | | | |
| | 9 | | See Notes to Financial Statements. |
Eaton Vance
Parametric Structured Emerging Markets Fund
January 31, 2013
Portfolio of Investments — continued
| | | | | | | | |
| Security | | Shares | | | Value | |
| | | | | | | | |
|
China (continued) | |
Li Ning Co., Ltd.(1) | | | 511,000 | | | $ | 342,360 | |
Maanshan Iron & Steel Co., Ltd., Class H(1) | | | 1,422,000 | | | | 440,118 | |
Metallurgical Corp. of China, Ltd., Class H(1) | | | 1,156,000 | | | | 240,068 | |
Mindray Medical International, Ltd. ADR | | | 59,100 | | | | 2,233,980 | |
NetEase.com, Inc. ADR | | | 30,800 | | | | 1,429,736 | |
New Oriental Education & Technology Group, Inc. ADR | | | 488,600 | | | | 8,340,402 | |
Nine Dragons Paper Holdings, Ltd. | | | 786,000 | | | | 691,137 | |
NWS Holdings, Ltd. | | | 472,500 | | | | 844,419 | |
Parkson Retail Group, Ltd. | | | 1,056,500 | | | | 814,901 | |
PetroChina Co., Ltd., Class H | | | 8,390,000 | | | | 11,897,606 | |
PICC Property & Casualty Co., Ltd., Class H | | | 842,000 | | | | 1,284,358 | |
Ping An Insurance (Group) Co. of China, Ltd., Class H | | | 565,000 | | | | 5,076,554 | |
Poly Property Group Co., Ltd.(1) | | | 675,000 | | | | 517,148 | |
Ports Design, Ltd. | | | 249,500 | | | | 216,130 | |
Renhe Commercial Holdings Co., Ltd.(1) | | | 3,020,000 | | | | 272,661 | |
Semiconductor Manufacturing International Corp.(1) | | | 16,033,000 | | | | 1,001,698 | |
Shandong Weigao Group Medical Polymer Co., Ltd., Class H | | | 1,396,000 | | | | 1,344,863 | |
Shanghai Electric Group Co., Ltd., Class H | | | 2,414,000 | | | | 1,002,464 | |
Shanghai Industrial Holdings, Ltd. | | | 304,000 | | | | 1,083,664 | |
Shanghai Zhenhua Heavy Industry Co., Ltd., Class B(1) | | | 784,350 | | | | 321,598 | |
Shimao Property Holdings, Ltd. | | | 665,000 | | | | 1,472,208 | |
SINA Corp.(1) | | | 32,100 | | | | 1,763,253 | |
Sino Biopharmaceutical, Ltd. | | | 2,052,000 | | | | 1,023,921 | |
Sino-Ocean Land Holdings, Ltd. | | | 1,295,000 | | | | 1,036,091 | |
Sinopec Shanghai Petrochemical Co., Ltd., Class H | | | 854,000 | | | | 316,952 | |
Sinopharm Group Co., Ltd., Class H | | | 199,600 | | | | 612,638 | |
Sinotrans Shipping, Ltd. | | | 1,000,000 | | | | 267,888 | |
Sinotruk Hong Kong, Ltd. | | | 790,500 | | | | 529,492 | |
Sohu.com, Inc.(1) | | | 38,400 | | | | 1,838,592 | |
Sound Global, Ltd. | | | 691,000 | | | | 368,465 | |
Standard Chartered PLC | | | 42,786 | | | | 1,128,163 | |
Sun Art Retail Group, Ltd. | | | 1,476,000 | | | | 2,146,704 | |
Suntech Power Holdings Co., Ltd. ADR(1) | | | 494,000 | | | | 824,980 | |
Swire Pacific, Ltd., Class H | | | 345,000 | | | | 843,632 | |
Tencent Holdings, Ltd. | | | 426,100 | | | | 14,882,325 | |
Tingyi (Cayman Islands) Holding Corp. | | | 1,082,000 | | | | 3,046,214 | |
Tsingtao Brewery Co., Ltd., Class H | | | 254,000 | | | | 1,471,395 | |
Want Want China Holdings, Ltd. | | | 3,496,000 | | | | 4,622,623 | |
Weichai Power Co., Ltd., Class H | | | 338,400 | | | | 1,396,437 | |
Wumart Stores, Inc., Class H | | | 321,000 | | | | 642,620 | |
WuXi PharmaTech (Cayman), Inc. ADR(1) | | | 61,900 | | | | 1,001,542 | |
Yangzijiang Shipbuilding Holdings, Ltd. | | | 1,550,000 | | | | 1,227,923 | |
Yantai Changyu Pioneer Wine Co., Ltd., Class B | | | 144,216 | | | | 890,310 | |
Yanzhou Coal Mining Co., Ltd., Class H | | | 774,000 | | | | 1,318,864 | |
Zhaojin Mining Industry Co., Ltd., Class H | | | 362,000 | | | | 545,724 | |
| | | | | | | | |
| Security | | Shares | | | Value | |
| | | | | | | | |
|
China (continued) | |
Zhejiang Expressway Co., Ltd., Class H | | | 862,000 | | | $ | 766,824 | |
Zhuzhou CSR Times Electric Co., Ltd., Class H | | | 344,000 | | | | 1,100,084 | |
Zijin Mining Group Co., Ltd., Class H | | | 3,876,000 | | | | 1,492,736 | |
ZTE Corp., Class H | | | 490,953 | | | | 954,321 | |
| | |
| | | | | | $ | 329,778,180 | |
| | |
|
Colombia — 1.5% | |
Almacenes Exito SA | | | 265,790 | | | $ | 4,970,248 | |
Banco Davivienda SA, PFC Shares | | | 41,500 | | | | 560,997 | |
Banco de Bogota | | | 55,930 | | | | 1,763,514 | |
Bancolombia SA ADR, PFC Shares | | | 105,200 | | | | 7,312,452 | |
Bolsa de Valores de Colombia | | | 46,242,700 | | | | 786,595 | |
Cementos Argos SA | | | 239,340 | | | | 1,474,803 | |
Cia Colombiana de Inversiones SA | | | 379,570 | | | | 1,239,999 | |
Corporacion Financiera Colombiana SA | | | 54,754 | | | | 1,079,407 | |
Ecopetrol SA | | | 2,794,590 | | | | 8,893,401 | |
Empresa de Energia de Bogota SA | | | 1,813,385 | | | | 1,368,662 | |
Empresa de Telecommunicaciones de Bogota SA(1) | | | 2,532,380 | | | | 560,561 | |
Fabricato SA(1)(2) | | | 36,122,860 | | | | 927,787 | |
Grupo Argos SA | | | 260,050 | | | | 3,424,544 | |
Grupo Argos SA, PFC Shares | | | 74,195 | | | | 948,641 | |
Grupo Aval Acciones y Valores SA | | | 3,145,485 | | | | 2,232,336 | |
Grupo de Inversiones Suramericana | | | 201,270 | | | | 4,273,874 | |
Grupo Nutresa SA | | | 307,655 | | | | 4,314,840 | |
Grupo Odinsa SA | | | 60,098 | | | | 282,311 | |
Interconexion Electrica SA | | | 657,460 | | | | 3,699,441 | |
ISAGEN SA ESP | | | 1,784,400 | | | | 2,462,406 | |
Tableros y Maderas de Caldas | | | 144,140,738 | | | | 599,974 | |
| | |
| | | | | | $ | 53,176,793 | |
| | |
|
Croatia — 0.4% | |
Adris Grupa DD, PFC Shares | | | 50,044 | | | $ | 2,564,580 | |
Atlantska Plovidba DD(1) | | | 8,567 | | | | 363,851 | |
Dalekovod DD(1) | | | 26,495 | | | | 308,126 | |
Ericsson Nikola Tesla | | | 6,040 | | | | 1,546,080 | |
Hrvatski Telekom DD | | | 150,830 | | | | 5,823,108 | |
Koncar-Elektroindustrija DD | | | 8,119 | | | | 954,390 | |
Petrokemija DD(1) | | | 25,975 | | | | 1,097,030 | |
Podravka Prehrambena Industrija DD(1) | | | 18,635 | | | | 884,526 | |
Privredna Banka Zagreb DD | | | 3,177 | | | | 305,061 | |
Zagrebacka Banka DD | | | 83,995 | | | | 554,419 | |
| | |
| | | | | | $ | 14,401,171 | |
| | |
| | | | |
| | 10 | | See Notes to Financial Statements. |
Eaton Vance
Parametric Structured Emerging Markets Fund
January 31, 2013
Portfolio of Investments — continued
| | | | | | | | |
| Security | | Shares | | | Value | |
| | | | | | | | |
|
Czech Republic — 1.5% | |
CEZ AS | | | 589,660 | | | $ | 19,122,628 | |
Fortuna Entertainment Group NV | | | 90,500 | | | | 412,872 | |
Komercni Banka AS | | | 71,464 | | | | 14,468,948 | |
New World Resources PLC, Class A | | | 901,000 | | | | 3,967,043 | |
Pegas Nonwovens SA | | | 66,614 | | | | 1,856,631 | |
Philip Morris CR AS | | | 5,613 | | | | 3,401,159 | |
Telefonica 02 Czech Republic AS | | | 373,204 | | | | 6,458,362 | |
Unipetrol AS(1) | | | 479,507 | | | | 4,320,977 | |
| | |
| | | | | | $ | 54,008,620 | |
| | |
|
Egypt — 1.5% | |
Alexandria Mineral Oils Co. | | | 171,820 | | | $ | 1,764,276 | |
Amer Group Holding | | | 4,390,500 | | | | 405,214 | |
Arab Cotton Ginning | | | 1,993,380 | | | | 1,214,142 | |
Citadel Capital Co.(1) | | | 1,887,400 | | | | 1,110,243 | |
Commercial International Bank | | | 1,607,204 | | | | 8,566,013 | |
Eastern Tobacco | | | 152,704 | | | | 2,264,112 | |
Egypt Kuwaiti Holding Co. | | | 1,348,596 | | | | 1,700,697 | |
Egyptian Financial Group-Hermes Holding SAE(1) | | | 956,838 | | | | 1,560,157 | |
Egyptian Resorts Co.(1) | | | 4,721,950 | | | | 744,960 | |
El Ezz Aldekhela Steel Alexa Co. | | | 4,000 | | | | 298,337 | |
El Sewedy Cables Holding Co. | | | 159,606 | | | | 535,131 | |
Ezz Steel | | | 1,117,345 | | | | 1,698,099 | |
Juhayna Food Industries | | | 2,646,000 | | | | 3,406,374 | |
Maridive & Oil Services SAE(1) | | | 781,799 | | | | 852,547 | |
Misr Beni-Suef Cement Co. | | | 46,100 | | | | 473,318 | |
National Societe General Bank | | | 162,828 | | | | 881,862 | |
Orascom Construction Industries (OCI)(1) | | | 247,138 | | | | 9,644,506 | |
Orascom Telecom Holding SAE(1) | | | 10,257,866 | | | | 6,782,533 | |
Orascom Telecom Media and Technology Holding SAE | | | 14,946,609 | | | | 1,266,805 | |
Oriental Weavers Co. | | | 187,375 | | | | 642,068 | |
Palm Hills Developments SAE(1) | | | 1,720,500 | | | | 624,694 | |
Pioneers Holding(1) | | | 552,900 | | | | 372,126 | |
Sidi Kerir Petrochemicals Co. | | | 929,400 | | | | 1,832,170 | |
Six of October Development & Investment
Co.(1) | | | 112,178 | | | | 345,835 | |
South Valley Cement(1) | | | 704,261 | | | | 410,694 | |
Talaat Moustafa Group(1) | | | 2,538,460 | | | | 1,618,537 | |
Telecom Egypt | | | 1,300,337 | | | | 2,826,508 | |
| | |
| | | | | | $ | 53,841,958 | |
| | |
|
Estonia — 0.2% | |
AS Merko Ehitus(1) | | | 50,618 | | | $ | 422,648 | |
AS Nordecon International(1) | | | 145,374 | | | | 247,160 | |
AS Olympic Entertainment Group | | | 503,790 | | | | 1,206,118 | |
AS Tallink Group(1) | | | 3,623,652 | | | | 4,545,318 | |
| | | | | | | | |
| Security | | Shares | | | Value | |
| | | | | | | | |
|
Estonia (continued) | |
AS Tallinna Kaubamaja | | | 137,340 | | | $ | 1,083,723 | |
AS Tallinna Vesi | | | 58,790 | | | | 807,416 | |
| | |
| | | | | | $ | 8,312,383 | |
| | |
|
Ghana — 0.1% | |
Aluworks Ghana, Ltd.(1) | | | 457,409 | | | $ | 14,418 | |
CAL Bank, Ltd. | | | 1,298,010 | | | | 320,496 | |
Ghana Commercial Bank, Ltd. | | | 1,453,841 | | | | 1,985,809 | |
HFC Bank Ghana, Ltd. | | | 1,235,326 | | | | 266,080 | |
Produce Buying Co., Ltd. | | | 582,428 | | | | 55,076 | |
Standard Chartered Bank of Ghana, Ltd. | | | 148,200 | | | | 898,604 | |
| | |
| | | | | | $ | 3,540,483 | |
| | |
|
Hungary — 1.6% | |
EGIS Pharmaceuticals PLC | | | 17,902 | | | $ | 1,539,510 | |
Magyar Telekom Rt. | | | 3,953,800 | | | | 7,466,309 | |
MOL Hungarian Oil & Gas Rt. | | | 180,700 | | | | 15,556,916 | |
OTP Bank Rt. | | | 880,930 | | | | 18,944,094 | |
PannErgy PLC(1) | | | 66,310 | | | | 131,028 | |
Richter Gedeon Rt. | | | 77,800 | | | | 13,398,355 | |
| | |
| | | | | | $ | 57,036,212 | |
| | |
|
India — 6.4% | |
ABB, Ltd. | | | 19,900 | | | $ | 243,472 | |
ACC, Ltd. | | | 34,570 | | | | 861,352 | |
Adani Enterprises, Ltd. | | | 267,400 | | | | 1,270,882 | |
Adani Ports and Special Economic Zone, Ltd. | | | 525,500 | | | | 1,510,974 | |
Aditya Birla Nuvo, Ltd. | | | 17,702 | | | | 379,434 | |
Amtek Auto, Ltd. | | | 152,500 | | | | 220,406 | |
Asian Paints, Ltd. | | | 20,230 | | | | 1,711,722 | |
Axis Bank, Ltd. | | | 135,400 | | | | 3,834,933 | |
Bajaj Auto, Ltd. | | | 53,260 | | | | 2,035,576 | |
Bank of Baroda | | | 79,760 | | | | 1,299,551 | |
Bank of India | | | 64,300 | | | | 427,173 | |
Bharat Forge, Ltd. | | | 63,650 | | | | 275,238 | |
Bharat Heavy Electricals, Ltd. | | | 473,100 | | | | 2,034,670 | |
Bharat Petroleum Corp., Ltd. | | | 147,700 | | | | 1,142,161 | |
Bharti Airtel, Ltd. | | | 1,529,960 | | | | 9,708,285 | |
Biocon, Ltd. | | | 51,500 | | | | 272,310 | |
Cairn India, Ltd. | | | 327,000 | | | | 1,993,792 | |
Canara Bank, Ltd. | | | 104,600 | | | | 944,580 | |
Cipla, Ltd. | | | 243,710 | | | | 1,863,589 | |
Coal India, Ltd. | | | 414,800 | | | | 2,753,514 | |
Colgate-Palmolive (India), Ltd. | | | 24,900 | | | | 631,088 | |
Container Corp. of India, Ltd. | | | 25,560 | | | | 444,976 | |
| | | | |
| | 11 | | See Notes to Financial Statements. |
Eaton Vance
Parametric Structured Emerging Markets Fund
January 31, 2013
Portfolio of Investments — continued
| | | | | | | | |
| Security | | Shares | | | Value | |
| | | | | | | | |
|
India (continued) | |
Crompton Greaves, Ltd. | | | 213,600 | | | $ | 428,788 | |
Cummins India, Ltd. | | | 49,900 | | | | 459,305 | |
Dabur India, Ltd. | | | 364,400 | | | | 914,145 | |
Divi’s Laboratories, Ltd. | | | 46,800 | | | | 923,615 | |
DLF, Ltd. | | | 312,600 | | | | 1,637,665 | |
Dr. Reddy’s Laboratories, Ltd. | | | 49,620 | | | | 1,794,435 | |
Educomp Solutions, Ltd. | | | 157,865 | | | | 381,898 | |
Essar Oil, Ltd.(1) | | | 198,130 | | | | 325,308 | |
Financial Technologies India, Ltd. | | | 32,600 | | | | 690,017 | |
GAIL (India), Ltd. | | | 447,750 | | | | 2,904,268 | |
GlaxoSmithKline Pharmaceuticals, Ltd. | | | 8,680 | | | | 333,205 | |
Glenmark Pharmaceuticals, Ltd. | | | 125,460 | | | | 1,183,049 | |
GMR Infrastructure, Ltd.(1) | | | 976,800 | | | | 348,643 | |
Grasim Industries, Ltd. | | | 8,158 | | | | 460,420 | |
Gujarat Ambuja Cements, Ltd. | | | 454,500 | | | | 1,729,285 | |
Gujarat State Petronet, Ltd. | | | 383,800 | | | | 523,842 | |
GVK Power & Infrastructure, Ltd.(1) | | | 2,796,900 | | | | 683,672 | |
HCL Technologies, Ltd. | | | 117,100 | | | | 1,516,301 | |
HDFC Bank, Ltd. | | | 625,920 | | | | 7,574,362 | |
Hero MotoCorp, Ltd. | | | 47,600 | | | | 1,612,652 | |
Hindalco Industries, Ltd. | | | 622,210 | | | | 1,355,678 | |
Hindustan Petroleum Corp., Ltd. | | | 82,600 | | | | 511,982 | |
Hindustan Unilever, Ltd. | | | 603,700 | | | | 5,334,060 | |
Hindustan Zinc, Ltd. | | | 148,400 | | | | 358,261 | |
Housing Development & Infrastructure, Ltd.(1) | | | 602,114 | | | | 870,091 | |
Housing Development Finance Corp., Ltd. | | | 630,000 | | | | 9,325,674 | |
ICICI Bank, Ltd. | | | 321,470 | | | | 7,168,080 | |
IDBI Bank, Ltd. | | | 199,900 | | | | 401,937 | |
Idea Cellular, Ltd.(1) | | | 1,096,700 | | | | 2,324,302 | |
IDFC, Ltd. | | | 731,000 | | | | 2,335,699 | |
IFCI, Ltd. | | | 1,227,800 | | | | 817,233 | |
Indiabulls Financial Services, Ltd. | | | 165,200 | | | | 1,014,018 | |
Indiabulls Real Estate, Ltd.(1) | | | 344,000 | | | | 497,501 | |
Indian Hotels Co., Ltd. | | | 164,280 | | | | 193,549 | |
Indian Oil Corp., Ltd. | | | 186,600 | | | | 1,143,898 | |
Infosys, Ltd. | | | 367,200 | | | | 19,288,861 | |
ITC, Ltd. | | | 1,057,760 | | | | 6,110,444 | |
IVRCL, Ltd.(1) | | | 511,500 | | | | 329,559 | |
Jaiprakash Associates, Ltd. | | | 936,400 | | | | 1,534,954 | |
Jindal Steel & Power, Ltd. | | | 268,600 | | | | 2,118,526 | |
JSW Steel, Ltd. | | | 78,700 | | | | 1,299,732 | |
Kotak Mahindra Bank, Ltd. | | | 161,200 | | | | 2,062,975 | |
Lanco Infratech, Ltd.(1) | | | 2,361,100 | | | | 553,107 | |
Larsen & Toubro, Ltd. | | | 108,960 | | | | 3,164,753 | |
LIC Housing Finance, Ltd. | | | 212,000 | | | | 1,127,331 | |
Lupin, Ltd. | | | 96,500 | | | | 1,100,791 | |
| | | | | | | | |
| Security | | Shares | | | Value | |
| | | | | | | | |
|
India (continued) | |
Mahindra & Mahindra, Ltd. | | | 177,560 | | | $ | 2,978,396 | |
Maruti Suzuki India, Ltd. | | | 47,150 | | | | 1,407,529 | |
Mphasis, Ltd. | | | 39,900 | | | | 279,170 | |
Nestle India, Ltd. | | | 9,530 | | | | 852,028 | |
Nicholas Piramal India, Ltd. | | | 76,807 | | | | 811,839 | |
NTPC, Ltd. | | | 1,727,900 | | | | 5,098,132 | |
Oil & Natural Gas Corp., Ltd. | | | 1,144,980 | | | | 7,339,264 | |
Oracle Financial Service Software, Ltd.(1) | | | 16,500 | | | | 986,592 | |
Power Grid Corporation of India, Ltd. | | | 1,608,400 | | | | 3,331,883 | |
Ranbaxy Laboratories, Ltd.(1) | | | 116,460 | | | | 985,170 | |
Reliance Capital, Ltd. | | | 153,735 | | | | 1,374,156 | |
Reliance Communications, Ltd. | | | 1,199,360 | | | | 1,869,425 | |
Reliance Industries, Ltd. | | | 869,238 | | | | 14,500,890 | |
Reliance Infrastructure, Ltd. | | | 211,400 | | | | 2,050,260 | |
Reliance Power, Ltd.(1) | | | 998,050 | | | | 1,735,376 | |
Satyam Computer Services, Ltd.(1) | | | 646,950 | | | | 1,457,095 | |
Sesa Goa, Ltd. | | | 281,200 | | | | 985,925 | |
Shree Renuka Sugars, Ltd.(1) | | | 777,100 | | | | 429,904 | |
Siemens India, Ltd. | | | 47,180 | | | | 578,644 | |
State Bank of India | | | 64,500 | | | | 2,949,688 | |
State Bank of India GDR | | | 9,600 | | | | 902,449 | |
Steel Authority of India, Ltd. | | | 646,200 | | | | 1,051,297 | |
Sterlite Industries (India), Ltd. | | | 556,020 | | | | 1,187,895 | |
Sun Pharmaceuticals Industries, Ltd. | | | 297,700 | | | | 4,004,773 | |
Sun TV Network, Ltd. | | | 147,473 | | | | 1,313,306 | |
Suzlon Energy, Ltd.(1) | | | 1,134,050 | | | | 541,163 | |
Tata Communications, Ltd. | | | 65,700 | | | | 286,021 | |
Tata Consultancy Services, Ltd. | | | 315,800 | | | | 7,977,619 | |
Tata Motors, Ltd. | | | 615,650 | | | | 3,421,223 | |
Tata Power Co., Ltd. | | | 1,003,900 | | | | 1,905,315 | |
Tata Steel, Ltd. | | | 196,896 | | | | 1,506,869 | |
Tata Tea, Ltd. | | | 279,500 | | | | 786,977 | |
Tata Teleservices Maharashtra, Ltd.(1) | | | 791,600 | | | | 175,686 | |
Titan Industries, Ltd. | | | 178,000 | | | | 940,047 | |
UltraTech Cement, Ltd. | | | 31,400 | | | | 1,123,367 | |
Unitech, Ltd.(1) | | | 1,726,100 | | | | 1,202,806 | |
United Phosphorus, Ltd. | | | 103,100 | | | | 259,231 | |
United Spirits, Ltd. | | | 54,500 | | | | 1,848,474 | |
Voltas, Ltd. | | | 296,300 | | | | 546,844 | |
Wipro, Ltd. | | | 354,533 | | | | 2,739,575 | |
Yes Bank, Ltd. | | | 148,900 | | | | 1,461,103 | |
Zee Entertainment Enterprises, Ltd. | | | 373,114 | | | | 1,623,948 | |
| | |
| | | | | | $ | 223,434,903 | |
| | |
| | | | |
| | 12 | | See Notes to Financial Statements. |
Eaton Vance
Parametric Structured Emerging Markets Fund
January 31, 2013
Portfolio of Investments — continued
| | | | | | | | |
| Security | | Shares | | | Value | |
| | | | | | | | |
|
Indonesia — 3.1% | |
Adaro Energy Tbk PT | | | 18,885,500 | | | $ | 3,200,639 | |
AKR Corporindo Tbk PT | | | 4,604,500 | | | | 1,833,138 | |
Aneka Tambang Tbk PT | | | 4,611,500 | | | | 644,358 | |
Astra Argo Lestari Tbk PT | | | 558,000 | | | | 1,080,160 | |
Astra International Tbk PT | | | 12,864,000 | | | | 9,712,569 | |
Bakrie Sumatera Plantations Tbk PT | | | 29,603,500 | | | | 277,161 | |
Bank Central Asia Tbk PT | | | 10,017,000 | | | | 9,924,599 | |
Bank Danamon Indonesia Tbk PT | | | 2,387,803 | | | | 1,495,180 | |
Bank Mandiri Tbk PT | | | 6,504,000 | | | | 6,046,562 | |
Bank Negara Indonesia Persero Tbk PT | | | 5,118,000 | | | | 2,063,065 | |
Bank Pan Indonesia Tbk PT(1) | | | 4,945,000 | | | | 335,557 | |
Bank Pembangunan Daerah Jawa Barat Dan Banten Tbk PT | | | 5,557,000 | | | | 685,219 | |
Bank Rakyat Indonesia Tbk PT | | | 7,252,000 | | | | 5,922,525 | |
Bank Tabungan Negara Tbk PT | | | 3,180,000 | | | | 529,482 | |
Berlian Laju Tanker Tbk PT(1)(2) | | | 7,544,500 | | | | 0 | |
Bhakti Investama Tbk PT | | | 14,779,000 | | | | 751,604 | |
Bumi Resources Tbk PT | | | 17,827,500 | | | | 1,245,083 | |
Bumi Serpong Damai Tbk PT | | | 7,109,000 | | | | 1,022,837 | |
Charoen Pokphand Indonesia Tbk PT | | | 6,907,500 | | | | 2,755,258 | |
Delta Dunia Makmur Tbk PT(1) | | | 9,252,500 | | | | 204,412 | |
Energi Mega Persada Tbk PT(1) | | | 64,369,200 | | | | 614,950 | |
Gudang Garam Tbk PT | | | 394,000 | | | | 2,097,824 | |
Harum Energy Tbk PT | | | 1,642,000 | | | | 1,011,633 | |
Holcim Indonesia Tbk PT | | | 1,578,500 | | | | 502,846 | |
Indo Tambangraya Megah Tbk PT | | | 431,500 | | | | 1,836,885 | |
Indocement Tunggal Prakarsa Tbk PT | | | 1,935,500 | | | | 4,322,463 | |
Indofood Sukses Makmur Tbk PT | | | 3,887,500 | | | | 2,408,017 | |
Indosat Tbk PT | | | 1,134,000 | | | | 792,425 | |
Jasa Marga (Persero) Tbk PT | | | 2,684,500 | | | | 1,515,292 | |
Kalbe Farma Tbk PT | | | 21,877,500 | | | | 2,446,413 | |
Lippo Karawaci Tbk PT | | | 14,409,000 | | | | 1,524,826 | |
Matahari Putra Prima Tbk PT | | | 2,293,000 | | | | 287,798 | |
Medco Energi Internasional Tbk PT | | | 2,095,000 | | | | 337,883 | |
Pembangunan Perumahan Persero Tbk PT | | | 9,145,000 | | | | 816,046 | |
Perusahaan Gas Negara Tbk PT | | | 12,686,500 | | | | 6,090,538 | |
Perusahaan Perkebunan London Sumatra Indonesia Tbk PT | | | 5,469,000 | | | | 1,237,662 | |
Semen Gresik (Persero) Tbk PT | | | 3,168,000 | | | | 5,126,886 | |
Surya Semesta Internusa Tbk PT | | | 7,220,500 | | | | 1,031,505 | |
Tambang Batubara Bukit Asam Tbk PT | | | 1,183,500 | | | | 1,886,454 | |
Telekomunikasi Indonesia Tbk PT | | | 11,262,000 | | | | 11,279,522 | |
Tower Bersama Infrastructure Tbk PT(1) | | | 831,500 | | | | 503,612 | |
Trada Maritime Tbk PT(1) | | | 7,567,500 | | | | 1,026,484 | |
Unilever Indonesia Tbk PT | | | 1,019,300 | | | | 2,308,423 | |
United Tractors Tbk PT | | | 3,067,083 | | | | 6,235,644 | |
| | | | | | | | |
| Security | | Shares | | | Value | |
| | | | | | | | |
|
Indonesia (continued) | |
Vale Indonesia Tbk PT | | | 4,267,000 | | | $ | 1,204,259 | |
XL Axiata Tbk PT | | | 2,954,500 | | | | 1,518,234 | |
| | |
| | | | | | $ | 109,693,932 | |
| | |
|
Jordan — 0.8% | |
Arab Bank PLC | | | 1,145,775 | | | $ | 12,382,371 | |
Arab Potash Co. PLC | | | 46,536 | | | | 3,018,168 | |
Bank of Jordan | | | 267,285 | | | | 901,234 | |
Capital Bank of Jordan(1) | | | 210,413 | | | | 374,334 | |
Jordan Ahli Bank | | | 627,155 | | | | 1,142,532 | |
Jordan Islamic Bank | | | 140,415 | | | | 630,074 | |
Jordan Petroleum Refinery | | | 246,535 | | | | 2,028,973 | |
Jordan Phosphate Mines | | | 100,638 | | | | 1,930,645 | |
Jordan Steel | | | 378,281 | | | | 741,743 | |
Jordan Telecom Corp. | | | 257,345 | | | | 1,944,405 | |
Jordanian Electric Power Co. | | | 450,446 | | | | 2,112,659 | |
Royal Jordanian Airlines(1) | | | 455,790 | | | | 495,372 | |
Taameer Jordan Holdings PSC(1) | | | 1,228,805 | | | | 294,861 | |
Union Investment Corp.(1) | | | 182,395 | | | | 383,105 | |
| | |
| | | | | | $ | 28,380,476 | |
| | |
|
Kazakhstan — 0.8% | |
Eurasian Natural Resources Corp. | | | 935,300 | | | $ | 4,889,348 | |
Halyk Savings Bank of Kazakhstan JSC GDR(1)(3) | | | 668,700 | | | | 5,422,951 | |
Kazakhmys PLC | | | 551,300 | | | | 6,381,111 | |
Kazkommertsbank JSC GDR(1)(3) | | | 117,600 | | | | 285,768 | |
KazMunaiGas Exploration Production GDR(3) | | | 425,600 | | | | 7,602,860 | |
Zhaikmunai, LP GDR(3) | | | 203,200 | | | | 2,029,435 | |
| | |
| | | | | | $ | 26,611,473 | |
| | |
|
Kenya — 0.9% | |
Athi River Mining, Ltd. | | | 390,500 | | | $ | 226,795 | |
Bamburi Cement Co., Ltd. | | | 546,000 | | | | 1,278,023 | |
Barclays Bank of Kenya, Ltd. | | | 8,931,260 | | | | 1,643,113 | |
Co-operative Bank of Kenya, Ltd. (The) | | | 9,284,400 | | | | 1,377,857 | |
East African Breweries, Ltd. | | | 2,526,280 | | | | 8,666,335 | |
Equity Bank, Ltd. | | | 12,613,200 | | | | 3,881,741 | |
KenolKobil, Ltd. | | | 4,090,000 | | | | 634,770 | |
Kenya Airways, Ltd. | | | 1,264,800 | | | | 157,376 | |
Kenya Commercial Bank, Ltd. | | | 11,014,620 | | | | 4,245,925 | |
Kenya Electricity Generating Co., Ltd. | | | 2,321,100 | | | | 309,209 | |
Kenya Power & Lighting, Ltd. | | | 9,484,354 | | | | 1,902,926 | |
Mumias Sugar Co., Ltd. | | | 3,844,600 | | | | 220,156 | |
Nation Media Group, Ltd. | | | 339,320 | | | | 988,200 | |
Safaricom, Ltd. | | | 100,160,072 | | | | 6,223,997 | |
| | | | |
| | 13 | | See Notes to Financial Statements. |
Eaton Vance
Parametric Structured Emerging Markets Fund
January 31, 2013
Portfolio of Investments — continued
| | | | | | | | |
| Security | | Shares | | | Value | |
| | | | | | | | |
|
Kenya (continued) | |
Standard Chartered Bank Kenya, Ltd. | | | 149,188 | | | $ | 450,917 | |
| | |
| | | | | | $ | 32,207,340 | |
| | |
|
Kuwait — 1.6% | |
Agility Public Warehousing Co. KSC | | | 1,475,000 | | | $ | 2,991,640 | |
Ahli United Bank | | | 275,625 | | | | 802,251 | |
Al Ahli Bank of Kuwait KSC | | | 477,500 | | | | 983,474 | |
Al Safat Energy Holding Co. KSCC(1) | | | 1,880,000 | | | | 387,591 | |
Al Safwa Group Holding Co. KSC(1)(2) | | | 8,080,000 | | | | 186,638 | |
Al-Qurain Petrochemicals Co. | | | 1,904,073 | | | | 1,258,711 | |
Boubyan Bank KSC(1) | | | 150,000 | | | | 346,523 | |
Boubyan Petrochemicals Co. | | | 1,420,000 | | | | 2,926,426 | |
Burgan Bank SAK | | | 878,792 | | | | 1,811,458 | |
Combined Group Contracting Co. | | | 73,205 | | | | 368,482 | |
Commercial Bank of Kuwait SAK(1) | | | 365,000 | | | | 933,998 | |
Commercial Real Estate Co. KSCC | | | 2,186,862 | | | | 575,835 | |
Gulf Bank(1) | | | 1,542,750 | | | | 2,248,649 | |
Gulf Cable and Electrical Industries Co. | | | 245,000 | | | | 1,114,638 | |
Kuwait Cement Co. | | | 194,000 | | | | 303,351 | |
Kuwait Finance House KSC | | | 1,628,388 | | | | 4,861,959 | |
Kuwait Foods Co. (Americana) | | | 357,500 | | | | 2,329,781 | |
Kuwait International Bank | | | 1,224,000 | | | | 1,369,997 | |
Kuwait Pipes Industries & Oil Services Co.(1) | | | 1,188,500 | | | | 481,152 | |
Kuwait Portland Cement Co. | | | 255,000 | | | | 1,087,634 | |
Kuwait Projects Co. Holdings KSC | | | 1,045,651 | | | | 1,504,530 | |
Kuwait Real Estate Co.(1) | | | 4,120,000 | | | | 776,153 | |
Mabanee Co. SAKC | | | 772,593 | | | | 3,348,158 | |
Mena Holding Group(1)(2) | | | 198,000 | | | | 0 | |
Mobile Telecommunications Co. | | | 3,165,000 | | | | 9,329,788 | |
National Bank of Kuwait SAK | | | 2,362,893 | | | | 8,227,687 | |
National Industries Group Holding(1) | | | 3,862,500 | | | | 3,104,083 | |
National Investment Co.(1) | | | 1,510,000 | | | | 858,012 | |
National Ranges Co.(1) | | | 7,920,000 | | | | 506,103 | |
Sultan Center Food Products Co.(1) | | | 1,320,000 | | | | 498,124 | |
| | |
| | | | | | $ | 55,522,826 | |
| | |
|
Latvia — 0.0%(4) | |
Grindeks(1) | | | 42,000 | | | $ | 383,863 | |
Latvian Shipping Co.(1) | | | 405,000 | | | | 211,992 | |
| | |
| | | | | | $ | 595,855 | |
| | |
|
Lebanon — 0.1% | |
Solidere GDR(3) | | | 320,943 | | | $ | 4,039,953 | |
Solidere, Class A | | | 86,340 | | | | 1,121,276 | |
Solidere, Class B | | | 1,726 | | | | 22,192 | |
| | |
| | | | | | $ | 5,183,421 | |
| | |
| | | | | | | | |
| Security | | Shares | | | Value | |
| | | | | | | | |
|
Lithuania — 0.1% | |
Apranga PVA | | | 278,536 | | | $ | 918,784 | |
Klaipedos Nafta PVA | | | 1,345,900 | | | | 675,500 | |
Lesto AB | | | 118,064 | | | | 100,140 | |
Pieno Zvaigzdes | | | 104,200 | | | | 263,761 | |
Rokiskio Suris | | | 122,500 | | | | 236,462 | |
Siauliu Bankas(1) | | | 760,297 | | | | 242,656 | |
| | |
| | | | | | $ | 2,437,303 | |
| | |
|
Malaysia — 3.1% | |
Aeon Co. (M) Bhd | | | 165,300 | | | $ | 673,177 | |
Airasia Bhd | | | 1,228,200 | | | | 1,097,735 | |
Alliance Financial Group Bhd | | | 560,300 | | | | 770,079 | |
AMMB Holdings Bhd | | | 638,000 | | | | 1,306,201 | |
Axiata Group Bhd | | | 2,048,450 | | | | 4,153,974 | |
Batu Kawan Bhd | | | 175,500 | | | | 1,040,909 | |
Berjaya Corp. Bhd | | | 2,289,600 | | | | 394,224 | |
Berjaya Sports Toto Bhd | | | 805,627 | | | | 1,128,338 | |
Boustead Holdings Bhd | | | 596,210 | | | | 928,754 | |
British American Tobacco Malaysia Bhd | | | 93,800 | | | | 1,731,800 | |
Bumi Armada Bhd | | | 660,200 | | | | 801,264 | |
Bursa Malaysia Bhd | | | 344,900 | | | | 734,953 | |
CIMB Group Holdings Bhd | | | 1,376,000 | | | | 3,192,914 | |
Dialog Group Bhd | | | 2,063,673 | | | | 1,534,691 | |
Digi.com Bhd | | | 1,672,000 | | | | 2,647,726 | |
Felda Global Ventures Holdings Bhd | | | 1,358,400 | | | | 2,002,533 | |
Gamuda Bhd | | | 2,269,300 | | | | 2,717,220 | |
Genting Bhd | | | 1,293,100 | | | | 3,952,940 | |
Genting Plantations Bhd | | | 261,700 | | | | 693,706 | |
Hong Leong Bank Bhd | | | 307,200 | | | | 1,407,673 | |
Hong Leong Financial Group Bhd | | | 208,700 | | | | 924,319 | |
IGB Corp. Bhd | | | 856,200 | | | | 644,158 | |
IHH Healthcare Bhd(1) | | | 1,695,200 | | | | 1,796,320 | |
IJM Corp. Bhd | | | 1,296,790 | | | | 2,104,444 | |
IOI Corp. Bhd | | | 1,776,018 | | | | 2,841,147 | |
KLCC Property Holdings Bhd | | | 399,100 | | | | 807,745 | |
KNM Group Bhd(1) | | | 5,003,150 | | | | 772,867 | |
Kuala Lumpur Kepong Bhd | | | 284,000 | | | | 1,983,698 | |
Kulim (Malaysia) Bhd | | | 860,000 | | | | 997,544 | |
Lafarge Malayan Cement Bhd | | | 720,350 | | | | 2,154,111 | |
Malayan Banking Bhd | | | 1,647,587 | | | | 4,708,680 | |
Malaysia Airports Holdings Bhd | | | 170,800 | | | | 303,009 | |
Malaysia Marine and Heavy Engineering Holdings Bhd | | | 557,500 | | | | 756,423 | |
Malaysian Resources Corp. Bhd | | | 1,423,500 | | | | 636,422 | |
Maxis Bhd | | | 1,504,900 | | | | 3,085,683 | |
Media Prima Bhd | | | 575,000 | | | | 412,688 | |
MISC Bhd(1) | | | 482,400 | | | | 690,780 | |
| | | | |
| | 14 | | See Notes to Financial Statements. |
Eaton Vance
Parametric Structured Emerging Markets Fund
January 31, 2013
Portfolio of Investments — continued
| | | | | | | | |
| Security | | Shares | | | Value | |
| | | | | | | | |
|
Malaysia (continued) | |
MMC Corp. Bhd | | | 868,200 | | | $ | 681,121 | |
Mudajaya Group Bhd | | | 510,600 | | | | 420,743 | |
Multi-Purpose Holdings Bhd | | | 940,340 | | | | 995,923 | |
Parkson Holdings Bhd | | | 766,578 | | | | 1,192,448 | |
Petronas Chemicals Group Bhd | | | 3,324,500 | | | | 6,367,200 | |
Petronas Dagangan Bhd | | | 473,800 | | | | 3,475,868 | |
Petronas Gas Bhd | | | 268,900 | | | | 1,607,183 | |
PPB Group Bhd | | | 404,100 | | | | 1,619,813 | |
Public Bank Bhd | | | 703,120 | | | | 3,512,012 | |
Resorts World Bhd | | | 1,885,300 | | | | 2,227,301 | |
RHB Capital Bhd | | | 582,500 | | | | 1,450,768 | |
Sapurakencana Petroleum Bhd(1) | | | 4,097,368 | | | | 3,852,055 | |
Sime Darby Bhd | | | 3,371,939 | | | | 10,096,730 | |
Supermax Corp. Bhd | | | 650,400 | | | | 401,992 | |
TA Enterprise Bhd | | | 1,323,000 | | | | 214,857 | |
Tan Chong Motor Holdings Bhd | | | 265,900 | | | | 430,269 | |
Telekom Malaysia Bhd | | | 1,026,900 | | | | 1,834,578 | |
Tenaga Nasional Bhd | | | 1,464,925 | | | | 3,303,288 | |
Top Glove Corp. Bhd | | | 525,500 | | | | 884,822 | |
UEM Land Holdings Bhd(1) | | | 1,095,050 | | | | 775,550 | |
UMW Holdings Bhd | | | 448,400 | | | | 1,752,301 | |
Unisem (M) Bhd | | | 1,289,100 | | | | 427,836 | |
Wah Seong Corp. Bhd | | | 435,726 | | | | 231,434 | |
WCT Bhd | | | 777,400 | | | | 552,840 | |
YTL Corp. Bhd | | | 2,863,465 | | | | 1,519,813 | |
YTL Power International Bhd | | | 1,793,521 | | | | 877,512 | |
| | |
| | | | | | $ | 109,237,106 | |
| | |
|
Mauritius — 0.4% | |
CIM Financial Services, Ltd.(1) | | | 1,698,300 | | | $ | 298,388 | |
LUX Island Resorts, Ltd.(1) | | | 842,920 | | | | 457,093 | |
Mauritius Commercial Bank | | | 1,228,500 | | | | 7,221,507 | |
New Mauritius Hotels, Ltd.(1) | | | 1,392,850 | | | | 3,251,113 | |
Rogers & Co., Ltd. | | | 62,900 | | | | 347,228 | |
State Bank of Mauritius, Ltd. | | | 937,000 | | | | 2,832,392 | |
Sun Resorts, Ltd. | | | 376,999 | | | | 349,138 | |
Terra Mauricia, Ltd. | | | 245,600 | | | | 313,854 | |
United Basalt Products, Ltd. | | | 99,200 | | | | 316,134 | |
United Docks, Ltd.(1) | | | 27,400 | | | | 59,377 | |
| | |
| | | | | | $ | 15,446,224 | |
| | |
|
Mexico — 6.5% | |
Alfa SAB de CV, Series A | | | 5,905,000 | | | $ | 14,239,323 | |
America Movil SAB de CV ADR, Series L | | | 494,300 | | | | 12,436,588 | |
America Movil SAB de CV, Series L | | | 27,123,050 | | | | 34,216,863 | |
| | | | | | | | |
| Security | | Shares | | | Value | |
| | | | | | | | |
|
Mexico (continued) | |
Bolsa Mexicana de Valores SAB de CV | | | 1,355,700 | | | $ | 3,428,008 | |
Cemex SAB de CV ADR(1) | | | 345,472 | | | | 3,748,371 | |
Cemex SAB de CV, Series CPO(1) | | | 9,713,291 | | | | 10,580,677 | |
Coca-Cola Femsa SA de CV, Series L | | | 149,300 | | | | 2,362,690 | |
Compartamos SAB de CV | | | 2,467,000 | | | | 3,832,071 | |
Controladora Comercial Mexicana SA de CV | | | 326,800 | | | | 1,190,808 | |
Corporacion GEO SAB de CV, Series B(1) | | | 391,700 | | | | 459,026 | |
Desarrolladora Homex SAB de CV(1) | | | 249,950 | | | | 609,020 | |
Embotelladoras Arca SAB de CV | | | 328,414 | | | | 2,504,445 | |
Empresas ICA SAB de CV(1) | | | 1,678,500 | | | | 5,031,038 | |
Fomento Economico Mexicano SA de CV ADR | | | 15,600 | | | | 1,683,084 | |
Fomento Economico Mexicano SAB de CV, Series UBD | | | 1,319,000 | | | | 14,253,740 | |
Genomma Lab Internacional SA de CV(1) | | | 539,800 | | | | 1,232,897 | |
Grupo Aeroportuario del Pacifico SAB de CV, Class B | | | 372,500 | | | | 2,323,254 | |
Grupo Aeroportuario del Sureste SAB de CV, Class B | | | 134,200 | | | | 1,603,062 | |
Grupo Bimbo SA de CV, Series A | | | 1,676,000 | | | | 4,330,187 | |
Grupo Carso SA de CV, Series A1 | | | 895,800 | | | | 4,354,084 | |
Grupo Elektra SA de CV | | | 51,200 | | | | 2,381,892 | |
Grupo Financiero Banorte SAB de CV, Class O | | | 3,055,800 | | | | 21,031,968 | |
Grupo Financiero Inbursa SAB de CV, Class O | | | 4,773,900 | | | | 13,385,363 | |
Grupo Mexico SAB de CV, Series B | | | 3,881,679 | | | | 14,440,361 | |
Grupo Modelo SA de CV, Series C | | | 545,600 | | | | 4,655,876 | |
Grupo Simec SA de CV, Series B(1) | | | 92,000 | | | | 458,025 | |
Grupo Televisa SA ADR | | | 42,900 | | | | 1,201,629 | |
Grupo Televisa SAB, Series CPO | | | 1,487,900 | | | | 8,349,588 | |
Impulsora del Desarrollo y el Empleo en America Latina SA de CV, Series B1(1) | | | 919,900 | | | | 1,935,360 | |
Industrias CH SAB de CV, Series B(1) | | | 100,700 | | | | 833,187 | |
Industrias Penoles SA de CV | | | 137,300 | | | | 6,731,529 | |
Inmuebles Carso SAB de CV(1) | | | 714,800 | | | | 618,407 | |
Kimberly-Clark de Mexico SAB de CV, Class A | | | 1,252,000 | | | | 3,528,161 | |
Mexichem SAB de CV | | | 842,916 | | | | 4,766,620 | |
Minera Frisco SAB de CV(1) | | | 714,800 | | | | 3,072,359 | |
Organizacion Soriana SAB de CV, Class B | | | 120,000 | | | | 464,914 | |
Promotora y Operadora de Infraestructura SAB de CV(1) | | | 77,700 | | | | 554,948 | |
TV Azteca SAB de CV, Series CPO | | | 625,000 | | | | 441,422 | |
Urbi Desarrollos Urbanos SAB de CV(1) | | | 904,500 | | | | 525,715 | |
Wal-Mart de Mexico SAB de CV, Series V | | | 4,085,000 | | | | 13,217,632 | |
| | |
| | | | | | $ | 227,014,192 | |
| | |
|
Morocco — 1.2% | |
Alliances Developpement Immobilier SA | | | 33,300 | | | $ | 2,103,497 | |
Attijariwafa Bank | | | 201,700 | | | | 7,612,290 | |
Banque Centrale Populaire | | | 134,460 | | | | 3,045,257 | |
Banque Marocaine du Commerce Exterieur (BMCE) | | | 186,017 | | | | 3,375,641 | |
| | | | |
| | 15 | | See Notes to Financial Statements. |
Eaton Vance
Parametric Structured Emerging Markets Fund
January 31, 2013
Portfolio of Investments — continued
| | | | | | | | |
| Security | | Shares | | | Value | |
| | | | | | | | |
|
Morocco (continued) | |
Banque Marocaine pour le Commerce et l’Industrie (BMCI) | | | 2,860 | | | $ | 279,883 | |
Ciments du Maroc | | | 7,030 | | | | 586,808 | |
Compagnie Generale Immobiliere | | | 11,200 | | | | 909,872 | |
Cosumar Compagnie Sucriere Marocaine et de Raffinage | | | 2,930 | | | | 548,212 | |
Credit Immobilier et Hotelier | | | 6,440 | | | | 150,650 | |
Delta Holding SA | | | 105,800 | | | | 393,354 | |
Douja Promotion Groupe Addoha SA | | | 453,134 | | | | 3,345,606 | |
Holcim Maroc SA | | | 6,574 | | | | 1,267,234 | |
Label Vie(1) | | | 2,100 | | | | 320,254 | |
Lafarge Ciments | | | 17,410 | | | | 2,578,193 | |
Managem | | | 15,462 | | | | 2,823,264 | |
Maroc Telecom | | | 830,524 | | | | 10,616,939 | |
Samir(1) | | | 15,717 | | | | 551,858 | |
SONASID (Societe Nationale de Siderurgie)(1) | | | 4,267 | | | | 361,179 | |
Wafa Assurance | | | 3,090 | | | | 1,174,845 | |
| | |
| | | | | | $ | 42,044,836 | |
| | |
|
Nigeria — 1.0% | |
Access Bank PLC | | | 19,423,730 | | | $ | 1,374,651 | |
Ashaka Cement PLC | | | 2,154,293 | | | | 283,265 | |
Dangote Cement PLC | | | 2,333,650 | | | | 2,010,660 | |
Dangote Flour Mills PLC | | | 2,810,000 | | | | 169,543 | |
Dangote Sugar Refinery PLC | | | 5,767,032 | | | | 261,968 | |
Diamond Bank PLC(1) | | | 16,654,000 | | | | 724,603 | |
Ecobank Transnational, Inc. | | | 9,578,418 | | | | 791,893 | |
Fidelity Bank PLC | | | 22,430,824 | | | | 453,450 | |
First Bank of Nigeria PLC | | | 32,229,046 | | | | 3,721,554 | |
First City Monument Bank PLC(1) | | | 22,646,859 | | | | 709,450 | |
Flour Mills of Nigeria PLC | | | 660,000 | | | | 322,501 | |
Guaranty Trust Bank PLC | | | 30,623,074 | | | | 4,787,839 | |
Guiness Nigeria PLC | | | 924,075 | | | | 1,718,869 | |
Lafarge Cement WAPCO Nigeria PLC | | | 2,336,900 | | | | 975,230 | |
Nestle Nigeria PLC | | | 433,960 | | | | 2,268,231 | |
Nigerian Breweries PLC | | | 4,353,805 | | | | 4,398,064 | |
Oando PLC(1) | | | 5,236,498 | | | | 437,266 | |
PZ Cussons Nigeria PLC | | | 1,481,250 | | | | 330,251 | |
Skye Bank PLC | | | 16,027,300 | | | | 584,748 | |
UAC of Nigeria PLC | | | 5,505,741 | | | | 1,599,317 | |
Unilever Nigeria PLC | | | 2,757,800 | | | | 752,701 | |
United Bank for Africa PLC(1) | | | 38,584,810 | | | | 1,672,075 | |
Zenith Bank PLC | | | 33,601,962 | | | | 4,389,229 | |
| | |
| | | | | | $ | 34,737,358 | |
| | |
| | | | | | | | |
| Security | | Shares | | | Value | |
| | | | | | | | |
|
Oman — 0.8% | |
Bank Dhofar SAOG | | | 1,393,756 | | | $ | 1,339,555 | |
Bank Muscat SAOG | | | 4,050,336 | | | | 6,439,982 | |
Bank Sohar | | | 5,208,479 | | | | 2,368,438 | |
Dhofar International Development & Investment Holding Co. | | | 275,832 | | | | 288,262 | |
Galfar Engineering & Contracting SAOG | | | 742,096 | | | | 710,134 | |
National Bank of Oman, Ltd. | | | 888,655 | | | | 676,430 | |
Oman Cables Industry SAOG | | | 93,600 | | | | 326,289 | |
Oman Cement Co. SAOG | | | 741,260 | | | | 1,233,118 | |
Oman Flour Mills Co., Ltd. SAOG | | | 561,100 | | | | 742,313 | |
Oman International Bank SAOG | | | 1,709,435 | | | | 781,483 | |
Oman National Investment Corp. Holdings | | | 272,868 | | | | 215,369 | |
Oman Telecommunications Co. | | | 1,159,271 | | | | 4,304,635 | |
Omani Qatari Telecommunications Co. SAOG | | | 1,418,700 | | | | 1,752,448 | |
Ominvest | | | 1,130,793 | | | | 1,090,546 | |
Raysut Cement Co. SAOG | | | 634,209 | | | | 2,372,242 | |
Renaissance Holdings Co.(1) | | | 1,784,923 | | | | 2,303,334 | |
Shell Oman Marketing Co. | | | 34,398 | | | | 211,850 | |
| | |
| | | | | | $ | 27,156,428 | |
| | |
|
Pakistan — 0.8% | |
Adamjee Insurance Co., Ltd. | | | 644,155 | | | $ | 456,352 | |
Azgard Nine, Ltd.(1) | | | 1,954,200 | | | | 149,349 | |
Bank Alfalah, Ltd. | | | 4,021,538 | | | | 761,629 | |
D.G. Khan Cement Co., Ltd. | | | 1,053,232 | | | | 594,266 | |
Engro Corp., Ltd. | | | 1,080,287 | | | | 1,038,501 | |
Fauji Fertilizer Bin Qasim, Ltd. | | | 1,184,000 | | | | 463,211 | |
Fauji Fertilizer Co., Ltd. | | | 1,905,410 | | | | 2,312,204 | |
Habib Bank, Ltd. | | | 462,825 | | | | 561,973 | |
Hub Power Co., Ltd. | | | 6,492,300 | | | | 3,224,550 | |
Jahangir Siddiqui & Co., Ltd.(1) | | | 2,323,700 | | | | 387,322 | |
Kot Addu Power Co., Ltd. | | | 523,900 | | | | 288,880 | |
Lucky Cement, Ltd. | | | 878,300 | | | | 1,412,791 | |
Millat Tractors, Ltd. | | | 134,000 | | | | 855,199 | |
Muslim Commercial Bank, Ltd. | | | 1,601,745 | | | | 3,493,541 | |
National Bank of Pakistan | | | 2,107,861 | | | | 1,122,157 | |
Nishat Mills, Ltd. | | | 1,798,810 | | | | 1,181,661 | |
Oil & Gas Development Co., Ltd. | | | 1,843,391 | | | | 3,640,446 | |
Pakistan Oil Fields, Ltd. | | | 376,700 | | | | 1,740,925 | |
Pakistan Petroleum, Ltd. | | | 1,130,098 | | | | 2,074,228 | |
Pakistan State Oil Co., Ltd. | | | 367,440 | | | | 863,687 | |
Pakistan Telecommunication Co., Ltd.(1) | | | 4,810,200 | | | | 913,180 | |
United Bank, Ltd. | | | 1,393,745 | | | | 1,297,682 | |
| | |
| | | | | | $ | 28,833,734 | |
| | |
| | | | |
| | 16 | | See Notes to Financial Statements. |
Eaton Vance
Parametric Structured Emerging Markets Fund
January 31, 2013
Portfolio of Investments — continued
| | | | | | | | |
| Security | | Shares | | | Value | |
| | | | | | | | |
|
Peru — 1.6% | |
Alicorp SA | | | 2,018,900 | | | $ | 6,881,992 | |
Banco Continental SA | | | 319,822 | | | | 878,598 | |
Casa Grande SAA | | | 99,420 | | | | 527,009 | |
Cia de Minas Buenaventura SA ADR | | | 255,680 | | | | 7,565,571 | |
Cia Minera Milpo SA | | | 567,882 | | | | 584,471 | |
Credicorp, Ltd. | | | 5,890 | | | | 918,133 | |
Credicorp, Ltd. ADR | | | 69,694 | | | | 10,923,141 | |
Edegel SA | | | 1,592,100 | | | | 1,663,250 | |
Edelnor SA | | | 108,248 | | | | 205,229 | |
Energia del Sur SA | | | 44,784 | | | | 393,344 | |
Ferreyros SA | | | 2,301,239 | | | | 2,199,288 | |
Grana y Montero SA | | | 1,202,512 | | | | 5,048,271 | |
Intergroup Financial Services Corp. | | | 39,300 | | | | 1,513,050 | |
Luz del Sur SAA | | | 211,550 | | | | 721,947 | |
Minsur SA | | | 1,239,459 | | | | 1,112,612 | |
Sociedad Minera Cerro Verde SAA(1) | | | 35,821 | | | | 1,361,198 | |
Southern Copper Corp. | | | 237,927 | | | | 9,371,944 | |
Volcan Cia Minera SA, Class B | | | 2,908,395 | | | | 2,993,357 | |
| | |
| | | | | | $ | 54,862,405 | |
| | |
|
Philippines — 1.6% | |
Aboitiz Equity Ventures, Inc. | | | 3,611,100 | | | $ | 4,935,179 | |
Aboitiz Power Corp. | | | 1,176,200 | | | | 1,102,030 | |
Alliance Global Group, Inc. | | | 4,540,000 | | | | 2,110,827 | |
Ayala Corp. | | | 192,195 | | | | 2,687,040 | |
Ayala Land, Inc. | | | 3,951,800 | | | | 2,816,921 | |
Ayala Land, Inc., PFC Shares(2) | | | 3,951,800 | | | | 9,713 | |
Bank of the Philippine Islands | | | 1,032,451 | | | | 2,541,827 | |
BDO Unibank, Inc.(1) | | | 1,274,481 | | | | 2,409,811 | |
DMCI Holdings, Inc. | | | 1,733,600 | | | | 2,343,365 | |
Energy Development Corp. | | | 6,100,000 | | | | 1,073,043 | |
Filinvest Land, Inc. | | | 14,494,000 | | | | 619,413 | |
First Gen Corp.(1) | | | 1,768,322 | | | | 1,149,496 | |
First Philippine Holdings Corp. | | | 228,500 | | | | 576,896 | |
Globe Telecom, Inc. | | | 18,040 | | | | 477,008 | |
Holcim Philippines, Inc. | | | 1,492,000 | | | | 494,728 | |
International Container Terminal Services, Inc. | | | 530,100 | | | | 991,580 | |
JG Summit Holding, Inc. | | | 4,019,900 | | | | 3,946,986 | |
Jollibee Foods Corp. | | | 573,300 | | | | 1,546,541 | |
Lopez Holdings Corp. | | | 4,600,000 | | | | 826,420 | |
Manila Electric Co. | | | 271,300 | | | | 1,937,364 | |
Manila Water Co. | | | 254,600 | | | | 224,642 | |
Megaworld Corp. | | | 12,596,000 | | | | 1,043,023 | |
Metropolitan Bank & Trust Co. | | | 642,455 | | | | 1,664,886 | |
Philex Mining Corp. | | | 5,579,225 | | | | 2,406,740 | |
Philex Petroleum Corp.(1) | | | 283,500 | | | | 233,430 | |
| | | | | | | | |
| Security | | Shares | | | Value | |
| | | | | | | | |
|
Philippines (continued) | |
Philippine Long Distance Telephone Co. | | | 47,220 | | | $ | 3,251,872 | |
Robinsons Land Corp. | | | 2,417,100 | | | | 1,272,678 | |
San Miguel Corp. | | | 716,000 | | | | 1,977,645 | |
Semirara Mining Corp. | | | 163,100 | | | | 986,549 | |
SM Investments Corp. | | | 187,238 | | | | 4,378,603 | |
SM Prime Holdings, Inc. | | | 5,515,999 | | | | 2,376,833 | |
Universal Robina Corp. | | | 918,300 | | | | 1,975,039 | |
Vista Land & Lifescapes, Inc. | | | 3,675,000 | | | | 468,024 | |
| | |
| | | | | | $ | 56,856,152 | |
| | |
|
Poland — 3.2% | |
Agora SA | | | 134,330 | | | $ | 388,917 | |
AmRest Holdings SE(1) | | | 7,766 | | | | 219,375 | |
Asseco Poland SA | | | 292,626 | | | | 4,259,161 | |
Bank Handlowy w Warszawie SA | | | 41,870 | | | | 1,297,009 | |
Bank Millennium SA(1) | | | 547,785 | | | | 809,660 | |
Bank Pekao SA | | | 135,238 | | | | 6,651,693 | |
Bioton SA(1) | | | 42,530,200 | | | | 963,093 | |
Boryszew SA(1) | | | 4,431,900 | | | | 801,949 | |
BRE Bank SA(1) | | | 18,304 | | | | 1,916,083 | |
Budimex SA | | | 25,400 | | | | 550,552 | |
Cinema City International NV(1) | | | 71,200 | | | | 587,885 | |
Cyfrowy Polsat SA(1) | | | 978,528 | | | | 5,303,632 | |
Enea SA | | | 169,600 | | | | 838,366 | |
Eurocash SA | | | 447,500 | | | | 7,290,814 | |
Getin Holding SA(1) | | | 378,250 | | | | 332,754 | |
Getin Noble Bank SA(1) | | | 1,520,086 | | | | 960,105 | |
Globe Trade Centre SA(1) | | | 367,890 | | | | 1,024,555 | |
Grupa Kety SA | | | 9,600 | | | | 444,222 | |
Grupa Lotos SA(1) | | | 124,953 | | | | 1,618,576 | |
ING Bank Slaski SA(1) | | | 26,850 | | | | 768,852 | |
Jastrzebska Spolka Weglowa SA | | | 15,100 | | | | 460,478 | |
Kernel Holding SA(1) | | | 97,900 | | | | 2,199,947 | |
KGHM Polska Miedz SA | | | 174,080 | | | | 10,652,187 | |
KOPEX SA(1) | | | 82,600 | | | | 427,925 | |
LPP SA | | | 1,511 | | | | 2,369,260 | |
Lubelski Wegiel Bogdanka SA | | | 45,700 | | | | 2,020,794 | |
Netia SA(1) | | | 853,654 | | | | 1,271,060 | |
NG2 SA | | | 19,400 | | | | 450,925 | |
Orbis SA | | | 30,000 | | | | 369,917 | |
Polimex-Mostostal SA(1) | | | 3,081,072 | | | | 556,410 | |
Polish Oil & Gas(1) | | | 2,349,400 | | | | 4,182,618 | |
Polska Grupa Energetyczna SA | | | 1,640,700 | | | | 9,048,734 | |
Polski Koncern Naftowy Orlen SA(1) | | | 395,500 | | | | 6,261,368 | |
Powszechna Kasa Oszczednosci Bank Polski SA | | | 898,710 | | | | 10,047,502 | |
Powszechny Zaklad Ubezpieczen SA | | | 71,400 | | | | 9,410,548 | |
| | | | |
| | 17 | | See Notes to Financial Statements. |
Eaton Vance
Parametric Structured Emerging Markets Fund
January 31, 2013
Portfolio of Investments — continued
| | | | | | | | |
| Security | | Shares | | | Value | |
| | | | | | | | |
|
Poland (continued) | |
Synthos SA | | | 192,100 | | | $ | 326,046 | |
Tauron Polska Energia SA | | | 2,592,800 | | | | 3,964,080 | |
Telekomunikacja Polska SA | | | 1,737,250 | | | | 6,745,689 | |
TVN SA | | | 832,820 | | | | 2,615,369 | |
Zaklady Azotowe w Tarnowie-Moscicach
SA(1) | | | 21,250 | | | | 388,745 | |
| | |
| | | | | | $ | 110,796,855 | |
| | |
|
Qatar — 1.5% | |
Aamal Co. QSC(1) | | | 153,573 | | | $ | 638,285 | |
Barwa Bank(1)(2) | | | 82,170 | | | | 145,119 | |
Barwa Real Estate Co. | | | 152,593 | | | | 1,164,680 | |
Commercial Bank of Qatar | | | 111,767 | | | | 2,399,666 | |
Doha Bank, Ltd. | | | 80,796 | | | | 1,252,400 | |
Gulf International Services QSC | | | 206,325 | | | | 1,817,968 | |
Industries Qatar | | | 265,745 | | | | 12,357,323 | |
Masraf Al Rayan | | | 626,150 | | | | 4,435,519 | |
Qatar Electricity & Water Co. | | | 70,280 | | | | 2,748,185 | |
Qatar Fuel | | | 16,532 | | | | 1,287,419 | |
Qatar Gas Transport Co., Ltd. (NAKILAT) | | | 609,640 | | | | 2,660,308 | |
Qatar Insurance Co. | | | 22,362 | | | | 427,499 | |
Qatar International Islamic Bank | | | 45,943 | | | | 698,801 | |
Qatar Islamic Bank | | | 97,487 | | | | 1,977,497 | |
Qatar National Bank | | | 291,574 | | | | 10,434,727 | |
Qatar National Cement Co. | | | 11,550 | | | | 328,642 | |
Qatar National Navigation | | | 80,321 | | | | 1,437,318 | |
Qatar Telecom QSC | | | 156,296 | | | | 4,811,456 | |
United Development Co.(1) | | | 112,224 | | | | 533,213 | |
Vodafone Qatar(1) | | | 1,007,110 | | | | 2,368,516 | |
| | |
| | | | | | $ | 53,924,541 | |
| | |
|
Romania — 0.6% | |
Banca Transilvania(1) | | | 9,759,951 | | | $ | 4,206,172 | |
Biofarm Bucuresti | | | 8,351,488 | | | | 542,675 | |
BRD-Group Societe Generale | | | 3,332,560 | | | | 9,078,711 | |
OMV Petrom SA | | | 45,153,300 | | | | 6,138,437 | |
Transelectrica SA | | | 134,000 | | | | 556,859 | |
TRANSGAZ SA Medias | | | 2,700 | | | | 176,627 | |
| | |
| | | | | | $ | 20,699,481 | |
| | |
|
Russia — 6.4% | |
Aeroflot-Russian Airlines | | | 229,000 | | | $ | 408,422 | |
CTC Media, Inc. | | | 338,867 | | | | 3,625,877 | |
Evraz PLC | | | 301,405 | | | | 1,380,038 | |
Federal Grid Co. Unified Energy System JSC(1) | | | 514,081,382 | | | | 3,709,097 | |
Federal Hydrogenerating Co. JSC | | | 119,016,412 | | | | 2,997,071 | |
| | | | | | | | |
| Security | | Shares | | | Value | |
| | | | | | | | |
|
Russia (continued) | |
Federal Hydrogenerating Co. JSC ADR | | | 348,000 | | | $ | 850,618 | |
Globaltrans Investment PLC GDR(3) | | | 29,700 | | | | 459,062 | |
IDGC Holding JSC(1) | | | 32,990,200 | | | | 2,409,769 | |
LSR Group GDR(3) | | | 186,400 | | | | 932,979 | |
LUKOIL OAO ADR | | | 301,377 | | | | 20,321,689 | |
Magnit OJSC | | | 14,900 | | | | 2,791,327 | |
Magnit OJSC GDR | | | 199,200 | | | | 8,842,457 | |
Magnitogorsk Iron & Steel Works GDR(3) | | | 105,708 | | | | 478,240 | |
Mail.ru Group, Ltd. GDR(3) | | | 80,300 | | | | 2,676,750 | |
Mechel ADR | | | 378,000 | | | | 2,551,500 | |
MMC Norilsk Nickel | | | 2,386 | | | | 475,401 | |
MMC Norilsk Nickel GDR | | | 388,124 | | | | 7,731,929 | |
Mobile TeleSystems OJSC | | | 1,533,328 | | | | 13,024,680 | |
Mosenergo | | | 8,811,603 | | | | 455,110 | |
NovaTek OAO GDR(3) | | | 81,616 | | | | 9,551,241 | |
Novolipetsk Steel GDR(3) | | | 57,736 | | | | 1,225,276 | |
OAO Gazprom | | | 73,400 | | | | 347,141 | |
OAO Gazprom ADR | | | 3,257,954 | | | | 30,686,810 | |
OAO Inter Rao Ues(1) | | | 2,738,091,300 | | | | 2,245,235 | |
OAO TMK GDR(3) | | | 64,757 | | | | 985,976 | |
PIK Group GDR(1)(3) | | | 166,400 | | | | 360,560 | |
Polymetal International PLC | | | 24,900 | | | | 422,379 | |
Rosneft Oil Co. GDR(3) | | | 867,350 | | | | 7,617,861 | |
Rostelecom | | | 1,040,200 | | | | 4,173,513 | |
Rostelecom ADR | | | 30,400 | | | | 743,280 | |
Sberbank of Russia | | | 7,545,888 | | | | 27,522,276 | |
Sberbank of Russia ADR | | | 724,400 | | | | 10,687,346 | |
Severstal OAO GDR(3) | | | 119,745 | | | | 1,493,655 | |
Sistema JSFC | | | 2,724,700 | | | | 2,401,619 | |
Sistema JSFC GDR(3) | | | 41,430 | | | | 909,364 | |
SOLLERS(1) | | | 24,262 | | | | 636,923 | |
Surgutneftegas OJSC ADR | | | 529,603 | | | | 5,490,253 | |
Surgutneftegas OJSC, PFC Shares | | | 4,716,400 | | | | 3,586,020 | |
Tatneft ADR | | | 130,166 | | | | 5,995,395 | |
TGC-2(1) | | | 13,779,634 | | | | 1,102 | |
Transneft, PFC Shares | | | 847 | | | | 1,991,376 | |
United Co. RUSAL PLC(1) | | | 744,000 | | | | 448,988 | |
Uralkali OJSC GDR(3) | | | 146,325 | | | | 5,567,704 | |
VimpelCom, Ltd. ADR | | | 528,684 | | | | 6,349,495 | |
VTB Bank OJSC GDR(3) | | | 1,736,170 | | | | 6,337,501 | |
X5 Retail Group NV GDR(1)(3) | | | 315,294 | | | | 5,357,720 | |
Yandex NV, Class A(1) | | | 155,500 | | | | 3,764,655 | |
| | |
| | | | | | $ | 223,022,680 | |
| | |
| | | | |
| | 18 | | See Notes to Financial Statements. |
Eaton Vance
Parametric Structured Emerging Markets Fund
January 31, 2013
Portfolio of Investments — continued
| | | | | | | | |
| Security | | Shares | | | Value | |
| | | | | | | | |
|
Slovenia — 0.4% | |
Gorenje DD | | | 37,265 | | | $ | 205,330 | |
KRKA DD | | | 95,005 | | | | 6,917,799 | |
Luka Koper(1) | | | 35,250 | | | | 397,832 | |
Mercator Poslovni Sistem | | | 8,415 | | | | 1,463,587 | |
Nova Kreditna Banka Maribor(1) | | | 123,892 | | | | 198,812 | |
Petrol | | | 4,694 | | | | 1,420,283 | |
Reinsurance Co. Sava, Ltd.(1) | | | 19,485 | | | | 206,818 | |
Sava DD(1) | | | 4,180 | | | | 21,567 | |
Telekom Slovenije DD | | | 17,842 | | | | 2,065,082 | |
Zavarovalnica Triglav DD | | | 81,339 | | | | 1,779,360 | |
| | |
| | | | | | $ | 14,676,470 | |
| | |
|
South Africa — 6.1% | |
ABSA Group, Ltd. | | | 200,350 | | | $ | 3,835,149 | |
Adcock Ingram Holdings, Ltd. | | | 93,500 | | | | 599,913 | |
AECI, Ltd. | | | 31,830 | | | | 302,994 | |
African Bank Investments, Ltd. | | | 558,614 | | | | 1,925,801 | |
African Rainbow Minerals, Ltd. | | | 54,400 | | | | 1,224,982 | |
Allied Electronics Corp., Ltd., PFC Shares | | | 186,200 | | | | 457,580 | |
Anglo Platinum, Ltd. | | | 33,280 | | | | 1,631,680 | |
AngloGold Ashanti, Ltd. | | | 211,971 | | | | 5,925,193 | |
Aquarius Platinum, Ltd.(1) | | | 173,100 | | | | 173,070 | |
Arcelormittal South Africa, Ltd.(1) | | | 50,577 | | | | 198,375 | |
Aspen Pharmacare Holdings, Ltd.(1) | | | 194,231 | | | | 3,576,541 | |
Aveng, Ltd. | | | 536,790 | | | | 1,876,379 | |
AVI, Ltd. | | | 206,400 | | | | 1,260,563 | |
Barloworld, Ltd. | | | 417,620 | | | | 3,908,162 | |
Bidvest Group, Ltd. | | | 423,296 | | | | 10,105,068 | |
Capital Property Fund | | | 839,464 | | | | 986,150 | |
Capitec Bank Holdings, Ltd. | | | 11,100 | | | | 237,807 | |
Clicks Group, Ltd. | | | 147,300 | | | | 987,248 | |
DataTec, Ltd. | | | 140,700 | | | | 734,296 | |
Discovery Holdings, Ltd. | | | 250,145 | | | | 1,850,025 | |
FirstRand, Ltd. | | | 1,624,950 | | | | 5,858,602 | |
Foschini, Ltd. | | | 129,700 | | | | 1,697,778 | |
Gold Fields, Ltd. | | | 412,077 | | | | 4,775,654 | |
Grindrod, Ltd. | | | 340,300 | | | | 630,468 | |
Group Five, Ltd. | | | 81,460 | | | | 284,821 | |
Growthpoint Properties, Ltd. | | | 605,700 | | | | 1,708,161 | |
Harmony Gold Mining Co., Ltd. | | | 211,510 | | | | 1,363,034 | |
Hyprop Investments, Ltd. | | | 67,500 | | | | 540,294 | |
Illovo Sugar, Ltd. | | | 87,400 | | | | 297,453 | |
Impala Platinum Holdings, Ltd. | | | 307,098 | | | | 5,566,175 | |
Imperial Holdings, Ltd. | | | 125,080 | | | | 2,723,300 | |
Investec, Ltd. | | | 111,500 | | | | 805,670 | |
JD Group, Ltd. | | | 58,290 | | | | 267,494 | |
| | | | | | | | |
| Security | | Shares | | | Value | |
| | | | | | | | |
|
South Africa (continued) | |
JSE, Ltd. | | | 42,700 | | | $ | 326,381 | |
Kumba Iron Ore, Ltd. | | | 42,860 | | | | 2,886,241 | |
Kumba Resources, Ltd. | | | 99,110 | | | | 1,946,351 | |
Lewis Group, Ltd. | | | 32,500 | | | | 242,934 | |
Liberty Holdings, Ltd. | | | 99,900 | | | | 1,285,903 | |
Life Healthcare Group Holdings, Ltd. | | | 563,800 | | | | 1,980,829 | |
Massmart Holdings, Ltd. | | | 55,550 | | | | 1,134,066 | |
Mediclinic International, Ltd. | | | 192,820 | | | | 1,219,934 | |
MMI Holdings, Ltd. | | | 654,096 | | | | 1,691,400 | |
Mondi, Ltd. | | | 91,130 | | | | 1,083,729 | |
Mr. Price Group, Ltd. | | | 118,100 | | | | 1,630,176 | |
MTN Group, Ltd. | | | 2,034,340 | | | | 39,803,165 | |
Murray & Roberts Holdings, Ltd.(1) | | | 515,450 | | | | 1,474,415 | |
Nampak, Ltd. | | | 271,938 | | | | 954,800 | |
Naspers, Ltd., Class N | | | 216,842 | | | | 13,995,292 | |
Nedbank Group, Ltd. | | | 129,330 | | | | 2,806,467 | |
Netcare, Ltd. | | | 582,550 | | | | 1,276,485 | |
Northam Platinum, Ltd. | | | 106,038 | | | | 434,424 | |
Pick’n Pay Stores, Ltd. | | | 180,470 | | | | 916,619 | |
PPC, Ltd. | | | 292,427 | | | | 1,070,744 | |
Redefine Properties, Ltd. | | | 1,527,800 | | | | 1,635,717 | |
Remgro, Ltd. | | | 253,900 | | | | 4,626,411 | |
Reunert, Ltd. | | | 249,860 | | | | 2,083,887 | |
RMB Holdings, Ltd. | | | 374,000 | | | | 1,793,746 | |
RMI Holdings | | | 483,800 | | | | 1,237,711 | |
Sanlam, Ltd. | | | 1,102,890 | | | | 5,596,500 | |
Sappi, Ltd.(1) | | | 283,736 | | | | 993,106 | |
Sasol, Ltd. | | | 288,150 | | | | 12,443,677 | |
Shoprite Holdings, Ltd. | | | 212,000 | | | | 3,989,373 | |
Spar Group, Ltd. | | | 79,600 | | | | 1,047,251 | |
Standard Bank Group, Ltd. | | | 703,121 | | | | 9,147,987 | |
Steinhoff International Holdings, Ltd.(1) | | | 913,240 | | | | 2,771,416 | |
Sun International, Ltd. | | | 30,482 | | | | 349,294 | |
Telkom South Africa, Ltd.(1) | | | 253,050 | | | | 470,668 | |
Tiger Brands, Ltd. | | | 90,800 | | | | 2,986,719 | |
Tongaat-Hulett | | | 36,600 | | | | 570,193 | |
Truworths International, Ltd. | | | 255,700 | | | | 2,905,782 | |
Vodacom Group (Pty), Ltd. | | | 489,400 | | | | 6,807,111 | |
Wilson Bayly Holmes-Ovcon, Ltd. | | | 68,900 | | | | 1,194,836 | |
Woolworths Holdings, Ltd. | | | 371,409 | | | | 2,639,094 | |
| | |
| | | | | | $ | 211,766,714 | |
| | |
|
South Korea — 6.2% | |
AMOREPACIFIC Corp. | | | 988 | | | $ | 993,254 | |
Asiana Airlines, Inc.(1) | | | 92,200 | | | | 510,737 | |
BS Financial Group, Inc. | | | 116,970 | | | | 1,546,421 | |
| | | | |
| | 19 | | See Notes to Financial Statements. |
Eaton Vance
Parametric Structured Emerging Markets Fund
January 31, 2013
Portfolio of Investments — continued
| | | | | | | | |
| Security | | Shares | | | Value | |
| | | | | | | | |
|
South Korea (continued) | |
Celltrion, Inc. | | | 49,630 | | | $ | 1,169,423 | |
Cheil Industries, Inc. | | | 23,400 | | | | 1,875,860 | |
Cheil Worldwide, Inc. | | | 51,100 | | | | 1,051,623 | |
CJ CheilJedang Corp. | | | 2,996 | | | | 1,020,727 | |
CJ Corp. | | | 6,100 | | | | 698,922 | |
CJ O Shopping Co., Ltd. | | | 3,130 | | | | 850,520 | |
Daelim Industrial Co., Ltd. | | | 8,650 | | | | 736,028 | |
Daewoo Engineering & Construction Co., Ltd.(1) | | | 37,741 | | | | 313,784 | |
Daewoo Industrial Development Co., Ltd.(1) | | | 3,657 | | | | 27,588 | |
Daewoo International Corp. | | | 11,575 | | | | 395,461 | |
Daewoo Securities Co., Ltd. | | | 125,693 | | | | 1,379,272 | |
Daewoo Shipbuilding & Marine Engineering Co., Ltd. | | | 31,580 | | | | 864,600 | |
Daum Communications Corp. | | | 3,100 | | | | 290,704 | |
DGB Financial Group Co., Ltd. | | | 48,450 | | | | 649,347 | |
Dong-A Pharmaceutical Co., Ltd. | | | 3,386 | | | | 366,971 | |
Dongbu Insurance Co., Ltd. | | | 31,240 | | | | 1,340,337 | |
Dongkuk Steel Mill Co., Ltd. | | | 27,430 | | | | 328,786 | |
Doosan Corp. | | | 3,160 | | | | 372,880 | |
Doosan Heavy Industries & Construction Co., Ltd. | | | 14,200 | | | | 607,296 | |
Doosan Infracore Co., Ltd.(1) | | | 34,600 | | | | 511,888 | |
E-Mart Co., Ltd. | | | 6,428 | | | | 1,427,711 | |
GS Engineering & Construction Corp. | | | 15,070 | | | | 770,737 | |
GS Holdings Corp. | | | 30,800 | | | | 2,008,916 | |
Hana Financial Group, Inc. | | | 112,730 | | | | 4,036,645 | |
Hanjin Shipping Co., Ltd.(1) | | | 60,891 | | | | 654,417 | |
Hankook Tire Co., Ltd.(1) | | | 26,323 | | | | 1,082,557 | |
Hanmi Pharmaceutical Co., Ltd.(1) | | | 6,697 | | | | 848,504 | |
Hansol Paper Co., Ltd. | | | 60,500 | | | | 572,345 | |
Hanwha Chemical Corp. | | | 53,890 | | | | 953,120 | |
Hanwha Corp. | | | 27,690 | | | | 850,092 | |
Hite-Jinro Co., Ltd. | | | 20,121 | | | | 591,028 | |
Honam Petrochemical Corp. | | | 8,970 | | | | 2,081,522 | |
Hynix Semiconductor, Inc.(1) | | | 127,090 | | | | 2,844,413 | |
Hyosung Corp. | | | 13,380 | | | | 784,221 | |
Hyundai Department Store Co., Ltd. | | | 6,215 | | | | 922,549 | |
Hyundai Development Co. | | | 16,000 | | | | 343,070 | |
Hyundai Engineering & Construction Co., Ltd. | | | 16,470 | | | | 1,037,553 | |
Hyundai Glovis Co., Ltd. | | | 10,670 | | | | 1,987,412 | |
Hyundai Heavy Industries Co., Ltd. | | | 10,970 | | | | 2,166,076 | |
Hyundai Hysco Co., Ltd. | | | 13,300 | | | | 460,326 | |
Hyundai Marine & Fire Insurance Co., Ltd. | | | 38,700 | | | | 1,190,450 | |
Hyundai Merchant Marine Co., Ltd.(1) | | | 32,500 | | | | 610,347 | |
Hyundai Mipo Dockyard Co., Ltd. | | | 3,775 | | | | 405,865 | |
Hyundai Mobis | | | 16,900 | | | | 4,425,762 | |
Hyundai Motor Co. | | | 45,100 | | | | 8,492,844 | |
Hyundai Securities Co., Ltd. | | | 43,870 | | | | 357,310 | |
| | | | | | | | |
| Security | | Shares | | | Value | |
| | | | | | | | |
|
South Korea (continued) | |
Hyundai Steel Co. | | | 26,130 | | | $ | 1,990,179 | |
Hyundai Wia Corp. | | | 8,900 | | | | 1,201,208 | |
Industrial Bank of Korea | | | 96,580 | | | | 1,091,267 | |
Kangwon Land, Inc. | | | 50,840 | | | | 1,458,421 | |
KB Financial Group, Inc. | | | 169,211 | | | | 6,023,728 | |
KCC Corp. | | | 1,445 | | | | 386,107 | |
Kia Motors Corp. | | | 72,820 | | | | 3,458,891 | |
Korea Electric Power Corp.(1) | | | 161,820 | | | | 4,802,865 | |
Korea Exchange Bank(1) | | | 101,360 | | | | 705,518 | |
Korea Express Co., Ltd.(1) | | | 4,349 | | | | 479,321 | |
Korea Gas Corp. | | | 25,180 | | | | 1,542,283 | |
Korea Investment Holdings Co., Ltd. | | | 16,690 | | | | 648,273 | |
Korea Zinc Co., Ltd. | | | 6,440 | | | | 2,270,779 | |
Korean Air Lines Co., Ltd.(1) | | | 23,502 | | | | 981,295 | |
Korean Reinsurance Co. | | | 77,034 | | | | 809,296 | |
KT Corp. | | | 53,753 | | | | 1,809,156 | |
KT Corp. ADR | | | 16,800 | | | | 284,592 | |
KT&G Corp. | | | 35,315 | | | | 2,462,584 | |
Kumho Petro Chemical Co., Ltd. | | | 10,100 | | | | 1,104,791 | |
LG Chem, Ltd. | | | 21,418 | | | | 5,992,887 | |
LG Corp. | | | 32,010 | | | | 1,885,723 | |
LG Display Co., Ltd.(1) | | | 58,300 | | | | 1,565,555 | |
LG Electronics, Inc. | | | 28,420 | | | | 1,881,734 | |
LG Hausys, Ltd. | | | 2,858 | | | | 195,040 | |
LG Household & Health Care, Ltd. | | | 2,850 | | | | 1,587,913 | |
LG International Corp. | | | 9,400 | | | | 388,375 | |
LG Life Sciences, Ltd.(1) | | | 11,000 | | | | 594,112 | |
LG Uplus Corp. | | | 154,920 | | | | 1,158,266 | |
LIG Insurance Co., Ltd. | | | 21,900 | | | | 513,311 | |
Lotte Shopping Co., Ltd. | | | 3,265 | | | | 1,117,229 | |
LS Corp. | | | 7,030 | | | | 590,742 | |
LS Industrial Systems Co., Ltd. | | | 3,800 | | | | 235,264 | |
Macquarie Korea Infrastructure Fund | | | 31,415 | | | | 191,846 | |
Mirae Asset Securities Co., Ltd. | | | 9,580 | | | | 332,218 | |
NCsoft Corp. | | | 5,150 | | | | 652,572 | |
Neo Holdings Co., Ltd.(1)(2) | | | 3,160 | | | | 0 | |
NHN Corp. | | | 11,575 | | | | 2,559,892 | |
Nong Shim Co., Ltd. | | | 2,500 | | | | 640,006 | |
OCI Co., Ltd. | | | 10,370 | | | | 1,595,348 | |
ORION Corp. | | | 1,400 | | | | 1,308,578 | |
POSCO | | | 34,127 | | | | 11,156,193 | |
S-Oil Corp. | | | 19,785 | | | | 1,779,790 | |
S1 Corp. | | | 5,750 | | | | 344,874 | |
Samsung C&T Corp. | | | 35,820 | | | | 2,086,256 | |
Samsung Card Co., Ltd. | | | 20,460 | | | | 672,885 | |
Samsung Electro-Mechanics Co., Ltd. | | | 12,790 | | | | 1,077,553 | |
| | | | |
| | 20 | | See Notes to Financial Statements. |
Eaton Vance
Parametric Structured Emerging Markets Fund
January 31, 2013
Portfolio of Investments — continued
| | | | | | | | |
| Security | | Shares | | | Value | |
| | | | | | | | |
|
South Korea (continued) | |
Samsung Electronics Co., Ltd. | | | 29,500 | | | $ | 39,247,803 | |
Samsung Electronics Co., Ltd., PFC Shares | | | 1,928 | | | | 1,502,371 | |
Samsung Engineering Co., Ltd. | | | 8,600 | | | | 1,227,563 | |
Samsung Fine Chemicals Co., Ltd. | | | 13,450 | | | | 650,954 | |
Samsung Fire & Marine Insurance Co., Ltd. | | | 19,285 | | | | 3,902,834 | |
Samsung Heavy Industries Co., Ltd. | | | 43,050 | | | | 1,512,705 | |
Samsung Life Insurance Co., Ltd. | | | 50,000 | | | | 4,821,828 | |
Samsung SDI Co., Ltd. | | | 9,150 | | | | 1,197,496 | |
Samsung Securities Co., Ltd. | | | 34,040 | | | | 1,762,681 | |
Samsung Techwin Co., Ltd. | | | 9,295 | | | | 491,713 | |
Shinhan Financial Group Co., Ltd. | | | 204,603 | | | | 7,687,093 | |
Shinsegae Co., Ltd. | | | 3,375 | | | | 681,922 | |
SK Broadband Co., Ltd.(1) | | | 83,346 | | | | 374,642 | |
SK C&C Co., Ltd. | | | 7,100 | | | | 674,465 | |
SK Chemicals Co., Ltd. | | | 11,460 | | | | 629,639 | |
SK Holdings Co., Ltd. | | | 8,115 | | | | 1,282,468 | |
SK Innovation Co., Ltd. | | | 25,079 | | | | 3,952,158 | |
SK Networks Co., Ltd. | | | 64,010 | | | | 473,116 | |
SK Telecom Co., Ltd. | | | 20,868 | | | | 3,208,947 | |
SK Telecom Co., Ltd. ADR | | | 9,450 | | | | 160,178 | |
STX Pan Ocean Co., Ltd. | | | 54,780 | | | | 285,618 | |
TONGYANG Securities, Inc. | | | 78,565 | | | | 292,090 | |
Woongjin Coway Co., Ltd.(1) | | | 22,950 | | | | 995,825 | |
Woori Finance Holdings Co., Ltd. | | | 154,060 | | | | 1,811,391 | |
Woori Investment & Securities Co., Ltd. | | | 78,408 | | | | 889,132 | |
Yuhan Corp. | | | 3,168 | | | | 533,772 | |
Zyle Motor Sales Corp.(1) | | | 5,113 | | | | 27,588 | |
| | |
| | | | | | $ | 215,700,929 | |
| | |
|
Taiwan — 6.3% | |
Acer, Inc.(1) | | | 1,396,990 | | | $ | 1,235,672 | |
Advanced Semiconductor Engineering, Inc. | | | 1,880,135 | | | | 1,517,536 | |
Ambassador Hotel | | | 298,000 | | | | 307,261 | |
AmTRAN Technology Co., Ltd. | | | 358,067 | | | | 257,051 | |
Asia Cement Corp. | | | 1,318,874 | | | | 1,678,825 | |
Asia Optical Co., Inc.(1) | | | 658,907 | | | | 678,930 | |
Asustek Computer, Inc. | | | 244,325 | | | | 2,800,097 | |
AU Optronics Corp.(1) | | | 3,617,837 | | | | 1,471,672 | |
Capital Securities Corp. | | | 711,928 | | | | 277,650 | |
Catcher Technology Co., Ltd. | | | 291,647 | | | | 1,305,069 | |
Cathay Financial Holding Co., Ltd. | | | 3,872,840 | | | | 4,317,849 | |
Chailease Holding Co., Ltd. | | | 447,000 | | | | 1,197,699 | |
Chang Hwa Commercial Bank | | | 2,089,431 | | | | 1,154,302 | |
Cheng Shin Rubber Industry Co., Ltd. | | | 1,404,063 | | | | 3,669,122 | |
Chicony Electronics Co., Ltd. | | | 330,939 | | | | 917,013 | |
Chimei Innolux Corp.(1) | | | 2,685,281 | | | | 1,398,276 | |
| | | | | | | | |
| Security | | Shares | | | Value | |
| | | | | | | | |
|
Taiwan (continued) | |
China Airlines, Ltd.(1) | | | 2,079,887 | | | $ | 913,238 | |
China Development Financial Holding Corp.(1) | | | 6,848,050 | | | | 1,893,965 | |
China Life Insurance Co., Ltd.(1) | | | 1,499,723 | | | | 1,484,014 | |
China Motor Corp. | | | 881,315 | | | | 803,763 | |
China Petrochemical Development Corp. | | | 1,851,659 | | | | 1,139,691 | |
China Steel Corp. | | | 6,060,901 | | | | 5,717,000 | |
Chinatrust Financial Holding Co., Ltd. | | | 5,109,089 | | | | 2,928,030 | |
Chipbond Technology Corp. | | | 259,000 | | | | 532,900 | |
Chong Hong Construction Co., Ltd. | | | 167,800 | | | | 557,688 | |
Chunghwa Telecom Co., Ltd. | | | 2,223,746 | | | | 7,086,420 | |
Chunghwa Telecom Co., Ltd. ADR | | | 57,616 | | | | 1,841,984 | |
Clevo Co. | | | 184,155 | | | | 256,237 | |
Compal Electronics, Inc. | | | 1,626,345 | | | | 1,182,775 | |
Coretronic Corp. | | | 649,505 | | | | 503,371 | |
Delta Electronics, Inc. | | | 604,105 | | | | 2,188,682 | |
Dynapack International Technology Corp. | | | 111,374 | | | | 424,866 | |
E Ink Holdings, Inc. | | | 584,000 | | | | 430,547 | |
E.Sun Financial Holding Co., Ltd. | | | 2,069,701 | | | | 1,185,532 | |
Elan Microelectronics Corp. | | | 345,300 | | | | 640,735 | |
Epistar Corp. | | | 360,472 | | | | 685,647 | |
EVA Airways Corp.(1) | | | 1,442,118 | | | | 924,104 | |
Evergreen International Storage & Transport Corp. | | | 868,000 | | | | 573,883 | |
Evergreen Marine Corp.(1) | | | 1,108,252 | | | | 696,999 | |
Everlight Electronics Co., Ltd. | | | 281,291 | | | | 394,767 | |
Far Eastern Department Stores, Ltd. | | | 1,736,925 | | | | 1,723,502 | |
Far Eastern New Century Corp. | | | 1,354,241 | | | | 1,570,087 | |
Far EasTone Telecommunications Co., Ltd. | | | 1,299,074 | | | | 3,305,197 | |
Faraday Technology Corp. | | | 406,880 | | | | 510,351 | |
Feng Hsin Iron & Steel Co., Ltd. | | | 183,260 | | | | 329,177 | |
First Financial Holding Co., Ltd. | | | 3,306,341 | | | | 2,016,275 | |
Formosa Chemicals & Fibre Corp. | | | 1,835,980 | | | | 4,989,769 | |
Formosa International Hotels Corp. | | | 102,330 | | | | 1,252,077 | |
Formosa Petrochemical Corp. | | | 865,320 | | | | 2,496,008 | |
Formosa Plastics Corp. | | | 2,365,670 | | | | 6,427,789 | |
Formosa Taffeta Co., Ltd. | | | 842,000 | | | | 812,811 | |
Formosan Rubber Group, Inc. | | | 433,000 | | | | 312,727 | |
Foxconn International Holdings, Ltd.(1) | | | 1,391,000 | | | | 571,158 | |
Foxconn Technology Co., Ltd. | | | 375,961 | | | | 1,100,305 | |
Fubon Financial Holding Co., Ltd. | | | 2,966,596 | | | | 3,791,620 | |
Giant Manufacturing Co., Ltd. | | | 207,208 | | | | 1,101,891 | |
Gintech Energy Corp.(1) | | | 429,649 | | | | 420,993 | |
Goldsun Development & Construction Co., Ltd. | | | 1,672,928 | | | | 649,382 | |
Great Wall Enterprise Co., Ltd. | | | 716,068 | | | | 654,864 | |
Highwealth Construction Corp. | | | 305,164 | | | | 634,307 | |
Hon Hai Precision Industry Co., Ltd. | | | 3,177,810 | | | | 9,098,115 | |
Hotai Motor Co., Ltd. | | | 244,000 | | | | 1,947,424 | |
| | | | |
| | 21 | | See Notes to Financial Statements. |
Eaton Vance
Parametric Structured Emerging Markets Fund
January 31, 2013
Portfolio of Investments — continued
| | | | | | | | |
| Security | | Shares | | | Value | |
| | | | | | | | |
|
Taiwan (continued) | |
HTC Corp. | | | 236,798 | | | $ | 2,335,347 | |
Hua Nan Financial Holdings Co., Ltd. | | | 2,732,168 | | | | 1,577,942 | |
Inventec Co., Ltd. | | | 635,966 | | | | 254,577 | |
Kinsus Interconnect Technology Corp. | | | 182,000 | | | | 571,508 | |
Largan Precision Co., Ltd. | | | 43,795 | | | | 1,146,003 | |
Lite-On Technology Corp. | | | 801,034 | | | | 1,154,564 | |
Macronix International Co., Ltd. | | | 1,202,873 | | | | 345,986 | |
MediaTek, Inc. | | | 420,462 | | | | 4,605,274 | |
Mega Financial Holding Co., Ltd. | | | 4,706,352 | | | | 3,854,500 | |
Merida Industry Co., Ltd. | | | 278,150 | | | | 1,271,143 | |
Motech Industries, Inc.(1) | | | 629,451 | | | | 707,052 | |
Nan Kang Rubber Tire Co., Ltd. | | | 851,253 | | | | 998,162 | |
Nan Ya Plastics Corp. | | | 3,056,608 | | | | 6,218,350 | |
Neo Solar Power Corp.(1) | | | 588,631 | | | | 449,386 | |
Novatek Microelectronics Corp., Ltd. | | | 215,942 | | | | 859,187 | |
Pegatron Corp.(1) | | | 718,028 | | | | 951,856 | |
Phison Electronics Corp. | | | 60,363 | | | | 408,028 | |
Pou Chen Corp. | | | 2,392,819 | | | | 2,391,083 | |
Powertech Technology, Inc. | | | 273,865 | | | | 412,433 | |
President Chain Store Corp. | | | 619,664 | | | | 3,349,087 | |
Quanta Computer, Inc. | | | 1,006,508 | | | | 2,352,495 | |
Radiant Opto-Electronics Corp. | | | 273,072 | | | | 1,060,068 | |
Radium Life Tech Co., Ltd. | | | 373,956 | | | | 356,437 | |
Realtek Semiconductor Corp. | | | 301,983 | | | | 676,703 | |
RichTek Technology Corp. | | | 101,478 | | | | 610,621 | |
Ruentex Development Co., Ltd. | | | 588,350 | | | | 1,296,601 | |
Ruentex Industries, Ltd. | | | 890,005 | | | | 2,263,658 | |
Sanyang Industrial Co., Ltd.(1) | | | 1,214,866 | | | | 869,974 | |
Shin Kong Financial Holding Co., Ltd.(1) | | | 4,423,368 | | | | 1,248,543 | |
Shin Kong Synthetic Fibers Corp. | | | 1,321,483 | | | | 426,898 | |
Siliconware Precision Industries Co., Ltd. | | | 1,135,243 | | | | 1,185,886 | |
Simplo Technology Co., Ltd. | | | 128,889 | | | | 601,232 | |
Sino-American Silicon Products, Inc. | | | 336,233 | | | | 452,368 | |
SinoPac Financial Holdings Co., Ltd. | | | 4,091,978 | | | | 1,802,599 | |
Solar Applied Materials Technology Corp. | | | 336,245 | | | | 416,391 | |
Synnex Technology International Corp. | | | 553,818 | | | | 1,124,272 | |
Tainan Spinning Co., Ltd. | | | 891,959 | | | | 428,172 | |
Taishin Financial Holdings Co., Ltd. | | | 4,306,735 | | | | 1,706,847 | |
Taiwan Business Bank(1) | | | 1,159,658 | | | | 353,330 | |
Taiwan Cement Corp. | | | 1,929,850 | | | | 2,611,058 | |
Taiwan Cooperative Financial Holding Co., Ltd. | | | 2,608,237 | | | | 1,453,827 | |
Taiwan Fertilizer Co., Ltd. | | | 570,000 | | | | 1,414,659 | |
Taiwan Glass Industry Corp. | | | 542,564 | | | | 532,002 | |
Taiwan Mobile Co., Ltd. | | | 1,252,784 | | | | 4,457,550 | |
Taiwan Semiconductor Manufacturing Co., Ltd. | | | 6,940,465 | | | | 23,783,056 | |
Taiwan Tea Corp. | | | 395,711 | | | | 217,789 | |
| | | | | | | | |
| Security | | Shares | | | Value | |
| | | | | | | | |
|
Taiwan (continued) | |
Tatung Co., Ltd.(1) | | | 2,377,785 | | | $ | 645,613 | |
Teco Electric & Machinery Co., Ltd. | | | 482,000 | | | | 400,996 | |
Tong Yang Industry Co., Ltd. | | | 597,667 | | | | 534,434 | |
TPK Holding Co., Ltd. | | | 95,148 | | | | 1,639,702 | |
Tripod Technology Corp. | | | 249,535 | | | | 503,347 | |
TSRC Corp. | | | 475,060 | | | | 964,575 | |
TTY Biopharm Co., Ltd. | | | 459,852 | | | | 1,683,980 | |
Tung Ho Steel Enterprise Corp. | | | 532,060 | | | | 537,496 | |
U-Ming Marine Transport Corp. | | | 186,000 | | | | 300,623 | |
Uni-President Enterprises Corp. | | | 3,394,880 | | | | 5,963,625 | |
Unimicron Technology Corp. | | | 637,000 | | | | 637,135 | |
United Microelectronics Corp. | | | 4,340,090 | | | | 1,695,403 | |
Walsin Lihwa Corp.(1) | | | 1,921,000 | | | | 647,992 | |
Wan Hai Lines, Ltd.(1) | | | 518,962 | | | | 283,038 | |
Waterland Financial Holdings | | | 1,030,470 | | | | 348,196 | |
Wei Chuan Food Corp. | | | 623,000 | | | | 866,671 | |
Wintek Corp.(1) | | | 1,356,877 | | | | 649,870 | |
Wistron Corp. | | | 739,526 | | | | 856,972 | |
WPG Holdings Co., Ltd. | | | 745,489 | | | | 1,004,484 | |
Yageo Corp.(1) | | | 788,000 | | | | 231,754 | |
Yang Ming Marine Transport(1) | | | 1,181,755 | | | | 571,064 | |
Yieh Phui Enterprise | | | 1,089,553 | | | | 350,676 | |
Young Fast Optoelectronics Co., Ltd. | | | 147,302 | | | | 274,651 | |
Yuanta Financial Holding Co., Ltd. | | | 4,714,938 | | | | 2,556,970 | |
Yuen Foong Yu Paper Manufacturing Co., Ltd. | | | 899,120 | | | | 434,104 | |
Yulon Motor Co., Ltd. | | | 1,206,809 | | | | 2,239,917 | |
| | |
| | | | | | $ | 219,274,483 | |
| | |
|
Thailand — 3.4% | |
Advanced Info Service PCL(5) | | | 1,386,500 | | | $ | 9,774,142 | |
Airports of Thailand PCL(5) | | | 667,400 | | | | 2,360,433 | |
Asian Property Development PCL(5) | | | 2,877,000 | | | | 912,426 | |
Bangkok Bank PCL | | | 252,500 | | | | 1,770,673 | |
Bangkok Bank PCL(5) | | | 162,700 | | | | 1,199,866 | |
Bangkok Dusit Medical Services PCL(5) | | | 559,400 | | | | 2,494,011 | |
Bank of Ayudhya PCL(5) | | | 2,289,700 | | | | 2,552,829 | |
Banpu PCL(5) | | | 113,400 | | | | 1,476,387 | |
BEC World PCL(5) | | | 1,249,200 | | | | 3,029,797 | |
Berli Jucker PCL(5) | | | 617,000 | | | | 1,551,485 | |
Big C Supercenter PCL(5) | | | 268,600 | | | | 1,936,735 | |
Bumrungrad Hospital PCL(5) | | | 899,500 | | | | 2,344,786 | |
Central Pattana PCL(5) | | | 689,100 | | | | 1,969,542 | |
CH. Karnchang PCL(5) | | | 892,200 | | | | 598,494 | |
Charoen Pokphand Foods PCL(5) | | | 2,700,800 | | | | 3,214,695 | |
CP ALL PCL(5) | | | 3,604,200 | | | | 5,650,826 | |
Delta Electronics (Thailand) PCL(5) | | | 1,087,100 | | | | 1,293,470 | |
| | | | |
| | 22 | | See Notes to Financial Statements. |
Eaton Vance
Parametric Structured Emerging Markets Fund
January 31, 2013
Portfolio of Investments — continued
| | | | | | | | |
| Security | | Shares | | | Value | |
| | | | | | | | |
|
Thailand (continued) | |
Electricity Generating PCL(5) | | | 316,200 | | | $ | 1,621,665 | |
Glow Energy PCL(5) | | | 877,300 | | | | 2,322,969 | |
Hana Microelectronics PCL(5) | | | 1,397,700 | | | | 1,097,222 | |
Indorama Ventures PCL(5) | | | 1,761,100 | | | | 1,550,235 | |
IRPC PCL(5) | | | 9,400,700 | | | | 1,387,373 | |
Italian-Thai Development PCL(1)(5) | | | 8,325,200 | | | | 1,674,399 | |
Kasikornbank PCL(5) | | | 918,400 | | | | 6,115,377 | |
Khon Kaen Sugar Industry PCL | | | 1,832,000 | | | | 889,755 | |
Krung Thai Bank PCL(5) | | | 3,293,500 | | | | 2,532,418 | |
L.P.N. Development PCL(5) | | | 1,255,000 | | | | 913,933 | |
Land & Houses PCL(5) | | | 2,593,500 | | | | 983,407 | |
Minor International PCL(5) | | | 2,557,797 | | | | 1,897,159 | |
Pruksa Real Estate PCL(5) | | | 1,150,000 | | | | 1,157,387 | |
PTT Exploration & Production PCL(5) | | | 1,134,798 | | | | 6,319,670 | |
PTT Global Chemical PCL(5) | | | 1,048,750 | | | | 2,813,503 | |
PTT PCL(5) | | | 675,060 | | | | 7,720,626 | |
Quality House PCL(5) | | | 6,086,925 | | | | 629,064 | |
Ratchaburi Electricity Generating Holding PCL(5) | | | 676,000 | | | | 1,372,170 | |
Samart Corp. PCL(5) | | | 1,341,500 | | | | 611,884 | |
Siam Cement PCL(5) | | | 235,100 | | | | 3,647,963 | |
Siam City Cement PCL(5) | | | 47,690 | | | | 658,482 | |
Siam Commercial Bank PCL(5) | | | 1,165,300 | | | | 6,997,514 | |
Siam Makro PCL(5) | | | 35,000 | | | | 524,083 | |
Sino Thai Engineering & Construction PCL(5) | | | 1,904,900 | | | | 1,788,689 | |
Thai Airways International PCL(1)(5) | | | 1,332,800 | | | | 1,032,517 | |
Thai Beverage PCL | | | 7,386,000 | | | | 3,138,314 | |
Thai Oil PCL(5) | | | 712,500 | | | | 1,762,070 | |
Thai Tap Water Supply Co., Ltd.(5) | | | 3,598,200 | | | | 1,244,074 | |
Thai Union Frozen Products PCL(5) | | | 772,002 | | | | 1,774,747 | |
Thanachart Capital PCL(5) | | | 779,400 | | | | 1,013,291 | |
Thoresen Thai Agencies PCL(5) | | | 824,160 | | | | 489,057 | |
TMB Bank PCL(5) | | | 22,274,000 | | | | 1,688,274 | |
Total Access Communication PCL(5) | | | 1,130,500 | | | | 3,218,297 | |
TPI Polene PCL(5) | | | 1,115,200 | | | | 553,330 | |
True Corp. PCL(1)(5) | | | 8,208,197 | | | | 1,817,594 | |
| | |
| | | | | | $ | 119,089,109 | |
| | |
|
Turkey — 3.2% | |
Adana Cimento Sanayii TAS | | | 93,019 | | | $ | 210,576 | |
Akbank TAS | | | 1,506,333 | | | | 7,617,315 | |
Akcansa Cimento AS | | | 56,400 | | | | 381,661 | |
Akenerji Elektrik Uretim AS(1) | | | 598,472 | | | | 575,578 | |
Aksa Akrilik Kimya Sanayii AS | | | 185,209 | | | | 537,244 | |
Albaraka Turk Katilim Bankasi AS(1) | | | 522,467 | | | | 565,219 | |
Anadolu Efes Biracilik ve Malt Sanayii AS | | | 212,239 | | | | 3,170,508 | |
Arcelik AS | | | 339,754 | | | | 2,220,508 | |
| | | | | | | | |
| Security | | Shares | | | Value | |
| | | | | | | | |
|
Turkey (continued) | |
Asya Katilim Bankasi AS(1) | | | 944,900 | | | $ | 1,198,404 | |
Aygaz AS | | | 121,813 | | | | 686,530 | |
Bagfas Bandirma Gubre Fabrikalari AS | | | 6,300 | | | | 202,346 | |
BIM Birlesik Magazalar AS | | | 105,560 | | | | 5,118,242 | |
Cimsa Cimento Sanayi ve Ticaret AS | | | 66,200 | | | | 386,085 | |
Coca-Cola Icecek AS | | | 65,700 | | | | 1,597,473 | |
Dogan Sirketler Grubu Holding AS(1) | | | 2,831,509 | | | | 1,739,531 | |
Dogan Yayin Holding AS(1) | | | 1,086,804 | | | | 544,451 | |
Eczacibasi Ilac Sanayi ve Ticaret AS | | | 356,500 | | | | 409,563 | |
Enka Insaat ve Sanayi AS | | | 1,455,436 | | | | 4,370,381 | |
Eregli Demir ve Celik Fabrikalari TAS | | | 2,511,265 | | | | 3,570,647 | |
Ford Otomotiv Sanayi AS | | | 94,600 | | | | 1,075,981 | |
Gubre Fabrikalari TAS(1) | | | 25,300 | | | | 231,480 | |
Haci Omer Sabanci Holding AS | | | 854,018 | | | | 4,921,514 | |
Hurriyet Gazetecilik ve Matbaacilik AS(1) | | | 783,538 | | | | 419,209 | |
Ihlas Holding AS(1) | | | 1,865,600 | | | | 1,262,432 | |
Is Gayrimenkul Yatirim Ortakligi AS | | | 527,286 | | | | 479,276 | |
Kardemir Karabuk Demir Celik Sanayi ve Ticaret AS, Class D | | | 1,170,360 | | | | 1,052,002 | |
KOC Holding AS | | | 1,602,860 | | | | 8,363,762 | |
Koza Altin Isletmeleri AS | | | 75,000 | | | | 1,845,976 | |
Koza Anadolu Metal Madencilik Isletmeleri
AS(1) | | | 430,600 | | | | 1,233,333 | |
Petkim Petrokimya Holding AS | | | 822,861 | | | | 1,435,893 | |
Petrol Ofisi AS(1) | | | 93,978 | | | | 300,108 | |
Sekerbank TAS(1) | | | 747,999 | | | | 804,647 | |
TAV Havalimanlari Holding AS(1) | | | 279,400 | | | | 1,739,113 | |
Tekfen Holding AS | | | 355,317 | | | | 1,454,738 | |
Tofas Turk Otomobil Fabrikasi AS | | | 194,200 | | | | 1,171,695 | |
Trakya Cam Sanayii AS(1) | | | 512,314 | | | | 754,246 | |
Tupras-Turkiye Petrol Rafinerileri AS | | | 205,670 | | | | 5,673,233 | |
Turcas Petrolculuk AS | | | 144,459 | | | | 308,623 | |
Turk Hava Yollari Anonim Ortakligi (THY) AS(1) | | | 1,059,122 | | | | 3,934,456 | |
Turk Sise ve Cam Fabrikalari AS | | | 681,607 | | | | 1,189,295 | |
Turk Telekomunikasyon AS | | | 926,800 | | | | 3,886,572 | |
Turkcell Iletisim Hizmetleri AS(1) | | | 1,337,300 | | | | 8,357,419 | |
Turkiye Garanti Bankasi AS | | | 2,046,100 | | | | 10,260,679 | |
Turkiye Halk Bankasi AS | | | 325,100 | | | | 3,210,011 | |
Turkiye Is Bankasi | | | 1,332,807 | | | | 4,925,019 | |
Turkiye Sinai Kalkinma Bankasi AS | | | 403,331 | | | | 521,003 | |
Turkiye Vakiflar Bankasi TAO | | | 587,200 | | | | 1,715,893 | |
Ulker Gida Sanayi ve Ticaret AS | | | 226,859 | | | | 1,290,798 | |
Yapi ve Kredi Bankasi AS(1) | | | 734,885 | | | | 2,156,124 | |
Yazicilar Holding AS | | | 49,200 | | | | 488,160 | |
Zorlu Enerji Elektrik Uretim AS(1) | | | 299,054 | | | | 236,331 | |
| | |
| | | | | | $ | 111,801,283 | |
| | |
| | | | |
| | 23 | | See Notes to Financial Statements. |
Eaton Vance
Parametric Structured Emerging Markets Fund
January 31, 2013
Portfolio of Investments — continued
| | | | | | | | |
| Security | | Shares | | | Value | |
| | | | | | | | |
|
Ukraine — 0.2% | |
Astarta Holding NV(1) | | | 27,007 | | | $ | 526,605 | |
Avangardco Investments Public, Ltd. GDR(1) | | | 17,182 | | | | 199,295 | |
Ferrexpo PLC | | | 892,810 | | | | 3,602,272 | |
MHP SA GDR(1)(3) | | | 74,470 | | | | 1,221,554 | |
| | |
| | | | | | $ | 5,549,726 | |
| | |
|
United Arab Emirates — 1.8% | |
Aabar Investments (PJSC)(1)(2) | | | 2,497,440 | | | $ | 0 | |
Abu Dhabi Commercial Bank (PJSC) | | | 2,818,800 | | | | 2,725,140 | |
Abu Dhabi National Hotels | | | 718,461 | | | | 354,554 | |
Agthia Group (PJSC) | | | 1,252,100 | | | | 750,630 | |
Air Arabia (PJSC) | | | 13,221,100 | | | | 3,188,157 | |
Ajman Bank (PJSC)(1) | | | 2,266,800 | | | | 895,012 | |
Aldar Properties (PJSC) | | | 5,159,444 | | | | 2,009,683 | |
Amlak Finance (PJSC)(1)(2) | | | 227,500 | | | | 0 | |
Arabtec Holding Co. | | | 9,684,018 | | | | 7,809,751 | |
Aramex (PJSC) | | | 982,500 | | | | 592,016 | |
Dana Gas(1) | | | 17,357,790 | | | | 2,314,214 | |
DP World, Ltd. | | | 661,916 | | | | 8,683,921 | |
Dubai Financial Market(1) | | | 7,800,600 | | | | 2,720,409 | |
Dubai Investments (PJSC) | | | 1,391,777 | | | | 357,670 | |
Dubai Islamic Bank (PJSC) | | | 2,229,697 | | | | 1,359,786 | |
Emaar Properties (PJSC) | | | 8,656,100 | | | | 11,493,554 | |
Emirates NBD (PJSC) | | | 606,700 | | | | 627,975 | |
First Gulf Bank (PJSC) | | | 1,496,340 | | | | 5,217,187 | |
Islamic Arabic Insurance Co.(1) | | | 946,000 | | | | 179,852 | |
National Bank of Abu Dhabi (PJSC) | | | 2,583,694 | | | | 7,700,280 | |
Ras Al Khaimah Cement Co.(1) | | | 2,052,000 | | | | 426,102 | |
Ras Al Khaimah Co. | | | 490,450 | | | | 174,922 | |
Ras Al Khaimah Properties (PJSC)(1) | | | 2,244,000 | | | | 269,454 | |
Sorouh Real Estate Co. | | | 848,925 | | | | 407,415 | |
Union National Bank | | | 2,055,084 | | | | 2,099,429 | |
Waha Capital (PJSC) | | | 2,364,751 | | | | 425,185 | |
| | |
| | | | | | $ | 62,782,298 | |
| | |
|
Vietnam — 0.9% | |
Bank for Foreign Trade of Vietnam JSC | | | 1,101,940 | | | $ | 1,799,531 | |
Baoviet Holdings | | | 676,500 | | | | 1,711,258 | |
Development Investment Construction Corp. | | | 220,935 | | | | 156,598 | |
FPT Corp. | | | 676,666 | | | | 1,300,879 | |
Gemadept Corp. | | | 312,000 | | | | 384,035 | |
Hagl JSC(1) | | | 904,532 | | | | 1,252,914 | |
HCM City Infrastructure Investment JSC | | | 547,500 | | | | 649,235 | |
Hoa Phat Group JSC | | | 1,239,332 | | | | 1,480,611 | |
Kim Long Securities Corp.(1) | | | 1,377,700 | | | | 640,901 | |
| | | | | | | | |
| Security | | Shares | | | Value | |
| | | | | | | | |
|
Vietnam (continued) | |
Kinh Bac City Development Share Holding Corp.(1) | | | 328,860 | | | $ | 156,216 | |
Kinhdo Corp. | | | 606,900 | | | | 1,325,642 | |
Masan Group Corp.(1) | | | 299,890 | | | | 1,714,631 | |
PetroVietnam Construction JSC(1) | | | 1,829,625 | | | | 588,896 | |
PetroVietnam Drilling and Well Services JSC | | | 587,083 | | | | 1,298,414 | |
PetroVietnam Fertilizer and Chemical JSC | | | 880,500 | | | | 1,935,486 | |
PetroVietnam Technical Services JSC | | | 1,713,000 | | | | 1,233,261 | |
Pha Lai Thermal Power JSC(1) | | | 483,390 | | | | 323,466 | |
Phu Nhuan Jewelry JSC | | | 181,200 | | | | 272,210 | |
Refrigeration Electrical Engineering Corp. | | | 1,182,100 | | | | 1,151,117 | |
Saigon Securities, Inc. | | | 882,600 | | | | 787,447 | |
Song Da Urban & Industrial Zone Investment and Development
JSC(1) | | | 153,250 | | | | 159,048 | |
Tan Tao Investment Industry Co.(1) | | | 1,413,490 | | | | 576,615 | |
Vietnam Construction and Import-Export JSC(1) | | | 621,655 | | | | 339,482 | |
Vietnam Dairy Products JSC | | | 519,727 | | | | 2,522,105 | |
Vietnam Joint Stock Commercial Bank for Industry and Trade(1) | | | 2,478,310 | | | | 2,735,447 | |
Vincom JSC(1) | | | 1,176,119 | | | | 3,752,118 | |
| | |
| | | | | | $ | 30,247,563 | |
| | |
| |
Total Common Stocks
(identified cost $2,981,790,246) | | | $ | 3,434,769,769 | |
| | | | | | | | | |
|
| Corporate Bonds — 0.0%(4) | |
| | |
| | | | | | | | |
| Security | | Principal
Amount
(000’s omitted) | | | Value | |
|
India — 0.0%(4) | |
Dr. Reddy’s Laboratories, Ltd., 9.25%, 3/24/14 | | INR | 1,240 | | | $ | 24,750 | |
| | |
| |
Total Corporate Bonds
(identified cost $27,437) | | | $ | 24,750 | |
| | |
| | | | | | | | | | | | |
| |
| Equity-Linked Securities(6) — 0.8% | | | | | |
| | | |
| | | | | | | | | | | | |
| Security | | Maturity
Date | | | Shares | | | Value | |
| | | |
Saudi Arabia — 0.8% | | | | | | | | | | | | |
Abdullah Al Othaim Markets(7) | | | 6/3/13 | | | | 9,100 | | | $ | 196,848 | |
Al Abdullatif Industrial Investment Co.(7) | | | 5/4/15 | | | | 64,200 | | | | 569,194 | |
Al Rajhi Bank(7) | | | 2/16/15 | | | | 115,193 | | | | 2,123,220 | |
Al Tayyar(7) | | | 7/2/15 | | | | 18,000 | | | | 394,769 | |
Alinma Bank(7) | | | 2/23/15 | | | | 156,100 | | | | 562,951 | |
Almarai Co.(7) | | | 11/24/14 | | | | 79,999 | | | | 1,405,202 | |
| | | | |
| | 24 | | See Notes to Financial Statements. |
Eaton Vance
Parametric Structured Emerging Markets Fund
January 31, 2013
Portfolio of Investments — continued
| | | | | | | | | | | | |
| Security | | Maturity
Date | | | Shares | | | Value | |
| | | |
Saudi Arabia (continued) | | | | | | | | | | | | |
Arab National Bank(7) | | | 5/11/15 | | | | 59,500 | | | $ | 429,159 | |
Bank Albilad(7) | | | 4/30/15 | | | | 38,000 | | | | 309,041 | |
Banque Saudi Fransi(7) | | | 2/23/15 | | | | 75,630 | | | | 616,082 | |
Dar Al Arkan Real Estate Development(7) | | | 8/10/15 | | | | 185,500 | | | | 435,276 | |
Etihad Etissalat Co(7) | | | 12/5/14 | | | | 133,938 | | | | 2,683,012 | |
Fawaz Abdulaziz Alhokair Co.(7) | | | 2/23/15 | | | | 20,000 | | | | 590,619 | |
Jabal Omar Development Co.(7) | | | 5/3/13 | | | | 84,579 | | | | 484,316 | |
Jarir Marketing Co.(7) | | | 5/4/15 | | | | 16,950 | | | | 701,109 | |
Mobile Telecommunications Co.(7) | | | 5/4/15 | | | | 227,977 | | | | 527,345 | |
National Industrialization Co.(7) | | | 5/4/15 | | | | 211,503 | | | | 1,604,472 | |
Rabigh Refining and Petrochemicals Co.(7) | | | 10/13/14 | | | | 92,400 | | | | 434,248 | |
Riyad Bank(7) | | | 12/15/14 | | | | 126,700 | | | | 777,875 | |
Sahara Petrochemical Co.(7) | | | 9/21/15 | | | | 69,000 | | | | 256,659 | |
Samba Financial Group(7) | | | 2/10/15 | | | | 65,008 | | | | 785,232 | |
Saudi Arabian Amiantit Co.(7) | | | 5/11/15 | | | | 53,100 | | | | 205,306 | |
Saudi Arabian Fertilizer Co.(7) | | | 5/11/15 | | | | 19,533 | | | | 811,205 | |
Saudi Arabian Mining Co.(7) | | | 5/11/15 | | | | 54,900 | | | | 493,326 | |
Saudi Basic Industries Corp(7) | | | 2/23/15 | | | | 100,096 | | | | 2,502,200 | |
Saudi British Bank(7) | | | 10/4/13 | | | | 62,300 | | | | 523,276 | |
Saudi Cable Co.(7) | | | 8/10/15 | | | | 59,400 | | | | 236,786 | |
Saudi Cement Co.(7) | | | 8/10/15 | | | | 25,900 | | | | 685,431 | |
Saudi Chemical Co.(7) | | | 5/1/15 | | | | 25,900 | | | | 292,129 | |
Saudi Electricity Co.(7) | | | 3/27/15 | | | | 268,400 | | | | 973,326 | |
Saudi Industrial Investment
Group(7) | | | 3/27/15 | | | | 95,000 | | | | 561,089 | |
Saudi International Petrochemical Co.(7) | | | 3/27/15 | | | | 90,700 | | | | 459,513 | |
Saudi Kayan Petrochemical Co.(7) | | | 3/27/15 | | | | 175,200 | | | | 551,249 | |
Saudi Telecom Co.(7) | | | 5/11/15 | | | | 78,600 | | | | 855,097 | |
Savola Group(7) | | | 2/2/15 | | | | 115,300 | | | | 1,180,580 | |
Yanbu National Petrochemical
Co.(7) | | | 3/9/15 | | | | 51,400 | | | | 705,835 | |
| | | | | | | | | | | | | |
| | | |
Total Equity-Linked Securities
(identified cost $26,885,522) | | | | | | | | | | $ | 26,922,977 | |
| | | | | | | | | | | | | |
| | | | | | | | |
|
| Investment Funds — 0.1% | |
| | |
| | | | | | | | |
| Security | | Shares | | | Value | |
Vietnam Enterprise Investments, Ltd.(1) | | | 1,239,727 | | | $ | 2,727,399 | |
| | |
| |
Total Investment Funds
(identified cost $5,027,204) | | | $ | 2,727,399 | |
| | | | | | | | | |
| | | | | | | | |
| Rights(1) — 0.0%(4) | |
| | |
| | | | | | | | |
| Security | | Shares | | | Value | |
Corpbanca SA, Exp. 2/14/13 | | | 17,958,155 | | | $ | 20,195 | |
Oando PLC, Exp. 2/6/13 | | | 10,472,996 | | | | 6,664 | |
Polimex-Mostostal SA | | | 3,081,072 | | | | 14,752 | |
| | | | | | | | | |
| | |
Total Rights
(identified cost $0) | | | | | | $ | 41,611 | |
| | | | | | | | | |
|
| Warrants(1) — 0.0%(4) | |
| | |
| | | | | | | | |
| Security | | Shares | | | Value | |
WCT Bhd, Exp. 12/11/17, Strike MYR 2.25 | | | 135,200 | | | $ | 11,967 | |
| | | | | | | | | |
| | |
Total Warrants
(identified cost $14,973) | | | | | | $ | 11,967 | |
| | | | | | | | | |
|
| Short-Term Investments — 0.9% | |
| | |
| | | | | | | | |
| Description | | Principal
Amount
(000’s omitted) | | | Value | |
State Street Bank and Trust Euro Time Deposit, 0.01%, 2/1/13 | | $ | 33,318 | | | $ | 33,318,384 | |
| | | | | | | | | |
| |
Total Short-Term Investments
(identified cost $33,318,384) | | | $ | 33,318,384 | |
| | |
| |
Total Investments — 99.9%
(identified cost $3,047,063,766) | | | $ | 3,497,816,857 | |
| | |
| |
Other Assets, Less Liabilities — 0.1% | | | $ | 3,454,210 | |
| | |
| |
Net Assets — 100.0% | | | $ | 3,501,271,067 | |
| | | | | | | | | |
The percentage shown for each investment category in the Portfolio of Investments is based on net assets.
| | | | |
| ADR | | – | | American Depositary Receipt |
| BDR | | – | | Brazilian Depositary Receipt |
| GDR | | – | | Global Depositary Receipt |
| PCL | | – | | Public Company Ltd. |
| PFC Shares | | – | | Preference Shares |
| INR | | – | | Indian Rupee |
| MYR | | – | | Malaysian Ringgit |
| (1) | Non-income producing security. |
| (2) | For fair value measurement disclosure purposes, security is categorized as Level 3 (see Note 11). |
| (3) | Security exempt from registration under Regulation S of the Securities Act of 1933, which exempts from registration securities offered and sold outside the United States. Security may not be offered or sold in the United States except pursuant to an exemption from, or in a transaction |
| | | | |
| | 25 | | See Notes to Financial Statements. |
Eaton Vance
Parametric Structured Emerging Markets Fund
January 31, 2013
Portfolio of Investments — continued
| | not subject to, the registration requirements of the Securities Act of 1933. At January 31, 2013, the aggregate value of these securities is $64,556,410 or 1.8% of the Fund’s net assets. |
| (4) | Amount is less than 0.05%. |
| (5) | Indicates a foreign registered security. Shares issued to foreign investors in markets that have foreign ownership limits. |
| (6) | Security whose performance, including redemption at maturity, is linked to the price of the underlying equity security. The investment is subject to credit risk of the issuing financial institution (HSBC Bank plc) in addition to the market risk of the underlying security. |
| (7) | Security exempt from registration pursuant to Rule 144A under the Securities Act of 1933. These securities may be sold in certain transactions (normally to qualified institutional buyers) and remain exempt from registration. At January 31, 2013, the aggregate value of these securities is $26,922,977 or 0.8% of the Fund’s net assets. |
| | | | | | | | |
| Currency Concentration of Portfolio | |
| | |
| | | | | | | | |
| Currency | | Percentage
of Net Assets | | | Value | |
United States Dollar | | | 13.3 | % | | $ | 466,144,386 | |
Hong Kong Dollar | | | 8.2 | | | | 287,330,384 | |
Indian Rupee | | | 6.4 | | | | 222,557,204 | |
New Taiwan Dollar | | | 6.2 | | | | 216,861,341 | |
Brazilian Real | | | 6.2 | | | | 215,809,545 | |
South Korean Won | | | 6.2 | | | | 215,256,159 | |
South African Rand | | | 6.0 | | | | 211,593,644 | |
Mexican Peso | | | 5.9 | | | | 207,944,520 | |
Thai Baht | | | 3.2 | | | | 112,732,498 | |
New Turkish Lira | | | 3.2 | | | | 111,801,283 | |
Polish Zloty | | | 3.2 | | | | 111,338,212 | |
Chilean Peso | | | 3.2 | | | | 110,684,534 | |
Indonesian Rupiah | | | 3.1 | | | | 109,693,932 | |
Malaysian Ringgit | | | 3.1 | | | | 109,249,073 | |
Hungarian Forint | | | 1.6 | | | | 57,036,212 | |
Philippine Peso | | | 1.6 | | | | 56,856,152 | |
Kuwaiti Dinar | | | 1.6 | | | | 55,522,826 | |
United Arab Emirates Dirham | | | 1.6 | | | | 54,098,377 | |
Czech Koruna | | | 1.5 | | | | 54,008,620 | |
Qatari Riyal | | | 1.5 | | | | 53,924,541 | |
Egyptian Pound | | | 1.5 | | | | 51,288,714 | |
Colombian Peso | | | 1.3 | | | | 45,864,341 | |
Moroccan Dirham | | | 1.2 | | | | 42,044,836 | |
Other currency, less than 1% each | | | 9.1 | | | | 318,175,523 | |
| | |
Total Investments | | | 99.9 | % | | $ | 3,497,816,857 | |
| | |
| | | | | | | | |
| Sector Classification of Portfolio | |
| | |
| | | | | | | | |
| Sector | | Percentage
of Net Assets | | | Value | |
Financials | | | 27.0 | % | | $ | 945,612,191 | |
Materials | | | 11.2 | | | | 393,642,889 | |
Telecommunication Services | | | 10.4 | | | | 362,990,512 | |
Energy | | | 10.2 | | | | 356,271,571 | |
Industrials | | | 9.9 | | | | 346,239,275 | |
Consumer Staples | | | 8.9 | | | | 311,632,441 | |
Consumer Discretionary | | | 7.2 | | | | 250,842,374 | |
Information Technology | | | 7.0 | | | | 245,361,525 | |
Utilities | | | 5.0 | | | | 174,819,727 | |
Health Care | | | 2.1 | | | | 74,333,819 | |
Other | | | 0.9 | | | | 33,343,134 | |
Investment Funds | | | 0.1 | | | | 2,727,399 | |
| | |
Total Investments | | | 99.9 | % | | $ | 3,497,816,857 | |
| | |
| | | | |
| | 26 | | See Notes to Financial Statements. |
Eaton Vance
Parametric Structured Emerging Markets Fund
January 31, 2013
Statement of Assets and Liabilities
| | | | |
| Assets | | January 31, 2013 | |
Investments, at value (identified cost, $3,047,063,766) | | $ | 3,497,816,857 | |
Cash | | | 138,926 | |
Foreign currency, at value (identified cost, $12,050,703) | | | 12,135,838 | |
Dividends and interest receivable | | | 2,761,686 | |
Receivable for investments sold | | | 133,356 | |
Receivable for Fund shares sold | | | 8,704,599 | |
Tax reclaims receivable | | | 25,001 | |
Total assets | | $ | 3,521,716,263 | |
|
| Liabilities | |
Payable for investments purchased | | $ | 13,786,069 | |
Payable for Fund shares redeemed | | | 2,410,030 | |
Payable to affiliates: | | | | |
Investment adviser fee | | | 2,288,126 | |
Administration fee | | | 438,568 | |
Distribution and service fees | | | 174,035 | |
Accrued foreign capital gains taxes | | | 447,901 | |
Accrued expenses | | | 900,467 | |
Total liabilities | | $ | 20,445,196 | |
Net Assets | | $ | 3,501,271,067 | |
|
| Sources of Net Assets | |
Paid-in capital | | $ | 3,130,085,809 | |
Accumulated net realized loss | | | (68,556,536 | ) |
Accumulated distributions in excess of net investment income | | | (10,578,102 | ) |
Net unrealized appreciation | | | 450,319,896 | |
Total | | $ | 3,501,271,067 | |
| |
| Class A Shares | | | | |
Net Assets | | $ | 738,776,107 | |
Shares Outstanding | | | 48,410,524 | |
Net Asset Value and Redemption Price Per Share | | | | |
(net assets ÷ shares of beneficial interest outstanding) | | $ | 15.26 | |
Maximum Offering Price Per Share | | | | |
(100 ÷ 94.25 of net asset value per share) | | $ | 16.19 | |
|
| Class C Shares | |
Net Assets | | $ | 23,347,728 | |
Shares Outstanding | | | 1,542,699 | |
Net Asset Value and Offering Price Per Share* | | | | |
(net assets ÷ shares of beneficial interest outstanding) | | $ | 15.13 | |
|
| Class I Shares | |
Net Assets | | $ | 2,739,147,232 | |
Shares Outstanding | | | 178,963,331 | |
Net Asset Value, Offering Price and Redemption Price Per Share | | | | |
(net assets ÷ shares of beneficial interest outstanding) | | $ | 15.31 | |
On sales of $50,000 or more, the offering price of Class A shares is reduced.
| * | Redemption price per share is equal to the net asset value less any applicable contingent deferred sales charge. |
| | | | |
| | 27 | | See Notes to Financial Statements. |
Eaton Vance
Parametric Structured Emerging Markets Fund
January 31, 2013
Statement of Operations
| | | | |
| Investment Income | | Year Ended
January 31, 2013 | |
Dividends (net of foreign taxes, $7,824,949) | | $ | 76,412,112 | |
Interest (net of foreign taxes, $515) | | | 2,889 | |
Total investment income | | $ | 76,415,001 | |
| |
| Expenses | | | | |
Investment adviser fee | | $ | 22,248,471 | |
Administration fee | | | 4,225,342 | |
Distribution and service fees | | | | |
Class A | | | 1,448,618 | |
Class C | | | 217,244 | |
Trustees’ fees and expenses | | | 68,000 | |
Custodian fee | | | 4,134,740 | |
Transfer and dividend disbursing agent fees | | | 1,478,638 | |
Legal and accounting services | | | 130,213 | |
Printing and postage | | | 144,938 | |
Registration fees | | | 39,348 | |
Stock dividend tax | | | 247,430 | |
Miscellaneous | | | 148,744 | |
Total expenses | | $ | 34,531,726 | |
Deduct — | | | | |
Reduction of custodian fee | | $ | 7 | |
Total expense reductions | | $ | 7 | |
| |
Net expenses | | $ | 34,531,719 | |
| |
Net investment income | | $ | 41,883,282 | |
| |
| Realized and Unrealized Gain (Loss) | | | | |
Net realized gain (loss) — | | | | |
Investment transactions (net of foreign capital gains taxes of $11,106) | | $ | (10,215,155 | ) |
Foreign currency transactions | | | (931,300 | ) |
Net realized loss | | $ | (11,146,455 | ) |
Change in unrealized appreciation (depreciation) — | | | | |
Investments (net of increase in accrued foreign capital gains taxes of $374,026) | | $ | 313,386,842 | |
Foreign currency | | | (154,492 | ) |
Net change in unrealized appreciation (depreciation) | | $ | 313,232,350 | |
| |
Net realized and unrealized gain | | $ | 302,085,895 | |
| |
Net increase in net assets from operations | | $ | 343,969,177 | |
| | | | |
| | 28 | | See Notes to Financial Statements. |
Eaton Vance
Parametric Structured Emerging Markets Fund
January 31, 2013
Statements of Changes in Net Assets
| | | | | | | | | | | | |
| Increase (Decrease) in Net Assets | | Year Ended
January 31, 2013 | | | Period Ended
January 31, 2012(1) | | | Year Ended
October 31, 2011 | |
From operations — | | | | | | | | | | | | |
Net investment income (loss) | | $ | 41,883,282 | | | $ | (1,373,950 | ) | | $ | 34,285,564 | |
Net realized loss from investment and foreign currency transactions | | | (11,146,455 | ) | | | (1,708,937 | ) | | | (3,256,413 | ) |
Net change in unrealized appreciation (depreciation) from investments and foreign currency | | | 313,232,350 | | | | 65,137,153 | | | | (303,696,048 | ) |
Net increase (decrease) in net assets from operations | | $ | 343,969,177 | | | $ | 62,054,266 | | | $ | (272,666,897 | ) |
Distributions to shareholders — | | | | | | | | | | | | |
From net investment income | | | | | | | | | | | | |
Class A | | $ | (8,541,444 | ) | | $ | (4,395,060 | ) | | $ | (3,647,967 | ) |
Class C | | | (112,543 | ) | | | (7,468 | ) | | | (101,937 | ) |
Class I | | | (35,860,230 | ) | | | (21,751,205 | ) | | | (20,253,048 | ) |
Tax return of capital | | | | | | | | | | | | |
Class A | | | (501,753 | ) | | | — | | | | — | |
Class C | | | (6,611 | ) | | | — | | | | — | |
Class I | | | (2,106,548 | ) | | | — | | | | — | |
Total distributions to shareholders | | $ | (47,129,129 | ) | | $ | (26,153,733 | ) | | $ | (24,002,952 | ) |
Transactions in shares of beneficial interest — | | | | | | | | | | | | |
Proceeds from sale of shares | | | | | | | | | | | | |
Class A | | $ | 308,459,699 | | | $ | 34,739,668 | | | $ | 356,399,103 | |
Class C | | | 4,847,765 | | | | 1,118,307 | | | | 10,795,829 | |
Class I | | | 874,027,705 | | | | 289,026,107 | | | | 798,457,889 | |
Net asset value of shares issued to shareholders in payment of distributions declared | | | | | | | | | | | | |
Class A | | | 8,746,689 | | | | 2,175,717 | | | | 2,710,545 | |
Class C | | | 89,763 | | | | 5,598 | | | | 74,023 | |
Class I | | | 30,549,286 | | | | 12,905,338 | | | | 12,174,959 | |
Cost of shares redeemed | | | | | | | | | | | | |
Class A | | | (139,255,686 | ) | | | (32,023,448 | ) | | | (87,629,407 | ) |
Class C | | | (6,181,813 | ) | | | (1,777,341 | ) | | | (7,563,045 | ) |
Class I | | | (381,683,788 | ) | | | (187,205,005 | ) | | | (352,427,789 | ) |
Redemption fees | | | — | | | | — | | | | 7,342 | |
Net increase in net assets from Fund share transactions | | $ | 699,599,620 | | | $ | 118,964,941 | | | $ | 732,999,449 | |
| | | |
Net increase in net assets | | $ | 996,439,668 | | | $ | 154,865,474 | | | $ | 436,329,600 | |
| | | |
| Net Assets | | | | | | | | | | | | |
At beginning of period | | $ | 2,504,831,399 | | | $ | 2,349,965,925 | | | $ | 1,913,636,325 | |
At end of period | | $ | 3,501,271,067 | | | $ | 2,504,831,399 | | | $ | 2,349,965,925 | |
| | | |
| Accumulated undistributed (distributions in excess of) net investment income included in net assets | | | | | | | | | | | | |
At end of period | | $ | (10,578,102 | ) | | $ | (6,958,649 | ) | | $ | 20,581,803 | |
| (1) | For the three months ended January 31, 2012. |
| | | | |
| | 29 | | See Notes to Financial Statements. |
Eaton Vance
Parametric Structured Emerging Markets Fund
January 31, 2013
Financial Highlights
| | | | | | | | | | | | | | | | | | | | | | | | |
| | | Class A | |
| | | Year Ended
January 31, 2013 | | | Period Ended
January 31, 2012(1) | | | Year Ended October 31, | |
| | | | | 2011 | | | 2010 | | | 2009 | | | 2008 | |
Net asset value — Beginning of period | | $ | 13.940 | | | $ | 13.750 | | | $ | 15.540 | | | $ | 12.440 | | | $ | 8.290 | | | $ | 17.500 | |
| | | | | | |
| Income (Loss) From Operations | | | | | | | | | | | | | | | | | | | | | | | | |
Net investment income (loss)(2) | | $ | 0.173 | | | $ | (0.014 | ) | | $ | 0.201 | | | $ | 0.105 | | | $ | 0.121 | | | $ | 0.190 | |
Net realized and unrealized gain (loss) | | | 1.339 | | | | 0.328 | | | | (1.826 | ) | | | 3.082 | | | | 4.120 | | | | (9.216 | ) |
| | | | | | |
Total income (loss) from operations | | $ | 1.512 | | | $ | 0.314 | | | $ | (1.625 | ) | | $ | 3.187 | | | $ | 4.241 | | | $ | (9.026 | ) |
| | | | | | |
| Less Distributions | | | | | | | | | | | | | | | | | | | | | | | | |
From net investment income | | $ | (0.181 | ) | | $ | (0.124 | ) | | $ | (0.165 | ) | | $ | (0.089 | ) | | $ | (0.092 | ) | | $ | (0.087 | ) |
From net realized gain | | | — | | | | — | | | | — | | | | — | | | | — | | | | (0.098 | ) |
Tax return of capital | | | (0.011 | ) | | | — | | | | — | | | | — | | | | — | | | | — | |
| | | | | | |
Total distributions | | $ | (0.192 | ) | | $ | (0.124 | ) | | $ | (0.165 | ) | | $ | (0.089 | ) | | $ | (0.092 | ) | | $ | (0.185 | ) |
| | | | | | |
Redemption fees(2)(3) | | $ | — | | | $ | — | | | $ | 0.000 | (4) | | $ | 0.002 | | | $ | 0.001 | | | $ | 0.001 | |
| | | | | | |
Net asset value — End of period | | $ | 15.260 | | | $ | 13.940 | | | $ | 13.750 | | | $ | 15.540 | | | $ | 12.440 | | | $ | 8.290 | |
| | | | | | |
Total Return(5) | | | 10.89 | % | | | 2.38 | %(6) | | | (10.59 | )% | | | 25.77 | % | | | 51.81 | % | | | (52.10 | )% |
| | | | | | |
| Ratios/Supplemental Data | | | | | | | | | | | | | | | | | | | | | | | | |
Net assets, end of period (000’s omitted) | | $ | 738,776 | | | $ | 493,567 | | | $ | 481,194 | | | $ | 267,040 | | | $ | 104,727 | | | $ | 74,062 | |
Ratios (as a percentage of average daily net assets): | | | | | | | | | | | | | | | | | | | | | | | | |
Expenses(7) | | | 1.42 | % | | | 1.45 | %(8) | | | 1.45 | % | | | 1.51 | % | | | 1.57 | %(9) | | | 1.50 | %(9) |
Net investment income (loss) | | | 1.22 | % | | | (0.43 | )%(8) | | | 1.33 | % | | | 0.77 | % | | | 1.26 | % | | | 1.33 | % |
Portfolio Turnover | | | 3 | % | | | 0 | %(6)(10) | | | 3 | % | | | 8 | % | | | 11 | % | | | 5 | % |
| (1) | For the three months ended January 31, 2012. The Fund changed its fiscal year-end from October 31 to January 31. |
| (2) | Computed using average shares outstanding. |
| (3) | Redemption fees were discontinued as of January 1, 2011. |
| (4) | Amount is less than $0.0005. |
| (5) | Returns are historical and are calculated by determining the percentage change in net asset value with all distributions reinvested and do not reflect the effect of sales charges. |
| (7) | Excludes the effect of custody fee credits, if any, of less than 0.005%. |
| (9) | The investment adviser and administrator waived a portion of its fees and subsidized certain operating expenses (equal to 0.02% and 0.20% of average daily net assets for the years ended October 31, 2009 and 2008, respectively). |
| (10) | Amount is less than 0.5%. |
| | | | |
| | 30 | | See Notes to Financial Statements. |
Eaton Vance
Parametric Structured Emerging Markets Fund
January 31, 2013
Financial Highlights — continued
| | | | | | | | | | | | | | | | | | | | | | | | |
| | | Class C | |
| | | Year Ended
January 31, 2013 | | | Period Ended
January 31, 2012(1) | | | Year Ended October 31, | |
| | | | | 2011 | | | 2010 | | | 2009 | | | 2008 | |
Net asset value — Beginning of period | | $ | 13.820 | | | $ | 13.530 | | | $ | 15.310 | | | $ | 12.280 | | | $ | 8.160 | | | $ | 17.320 | |
| | | | | | |
| Income (Loss) From Operations | | | | | | | | | | | | | | | | | | | | | | | | |
Net investment income (loss)(2) | | $ | 0.095 | | | $ | (0.038 | ) | | $ | 0.074 | | | $ | 0.020 | | | $ | 0.042 | | | $ | 0.092 | |
Net realized and unrealized gain (loss) | | | 1.294 | | | | 0.333 | | | | (1.792 | ) | | | 3.032 | | | | 4.087 | | | | (9.117 | ) |
| | | | | | |
Total income (loss) from operations | | $ | 1.389 | | | $ | 0.295 | | | $ | (1.718 | ) | | $ | 3.052 | | | $ | 4.129 | | | $ | (9.025 | ) |
| | | | | | |
| Less Distributions | | | | | | | | | | | | | | | | | | | | | | | | |
From net investment income | | $ | (0.075 | ) | | $ | (0.005 | ) | | $ | (0.062 | ) | | $ | (0.024 | ) | | $ | (0.010 | ) | | $ | (0.038 | ) |
From net realized gain | | | — | | | | — | | | | — | | | | — | | | | — | | | | (0.098 | ) |
Tax return of capital | | | (0.004 | ) | | | — | | | | — | | �� | | — | | | | — | | | | — | |
| | | | | | |
Total distributions | | $ | (0.079 | ) | | $ | (0.005 | ) | | $ | (0.062 | ) | | $ | (0.024 | ) | | $ | (0.010 | ) | | $ | (0.136 | ) |
| | | | | | |
Redemption fees(2)(3) | | $ | — | | | $ | — | | | $ | 0.000 | (4) | | $ | 0.002 | | | $ | 0.001 | | | $ | 0.001 | |
| | | | | | |
Net asset value — End of period | | $ | 15.130 | | | $ | 13.820 | | | $ | 13.530 | | | $ | 15.310 | | | $ | 12.280 | | | $ | 8.160 | |
| | | | | | |
Total Return(5) | | | 10.07 | % | | | 2.18 | %(6) | | | (11.27 | )% | | | 24.91 | % | | | 50.69 | % | | | (52.50 | )% |
| | | | | | |
| Ratios/Supplemental Data | | | | | | | | | | | | | | | | | | | | | | | | |
Net assets, end of period (000’s omitted) | | $ | 23,348 | | | $ | 22,646 | | | $ | 22,866 | | | $ | 22,800 | | | $ | 16,918 | | | $ | 9,828 | |
Ratios (as a percentage of average daily net assets): | | | | | | | | | | | | | | | | | | | | | | | | |
Expenses(7) | | | 2.16 | % | | | 2.19 | %(8) | | | 2.19 | % | | | 2.26 | % | | | 2.32 | %(9) | | | 2.25 | %(9) |
Net investment income (loss) | | | 0.68 | % | | | (1.18 | )%(8) | | | 0.49 | % | | | 0.15 | % | | | 0.44 | % | | | 0.65 | % |
Portfolio Turnover | | | 3 | % | | | 0 | %(6)(10) | | | 3 | % | | | 8 | % | | | 11 | % | | | 5 | % |
| (1) | For the three months ended January 31, 2012. The Fund changed its fiscal year-end from October 31 to January 31. |
| (2) | Computed using average shares outstanding. |
| (3) | Redemption fees were discontinued as of January 1, 2011. |
| (4) | Amount is less than $0.0005. |
| (5) | Returns are historical and are calculated by determining the percentage change in net asset value with all distributions reinvested and do not reflect the effect of sales charges. |
| (7) | Excludes the effect of custody fee credits, if any, of less than 0.005%. |
| (9) | The investment adviser and administrator waived a portion of its fees and subsidized certain operating expenses (equal to 0.02% and 0.20% of average daily net assets for the years ended October 31, 2009 and 2008, respectively). |
| (10) | Amount is less than 0.5%. |
| | | | |
| | 31 | | See Notes to Financial Statements. |
Eaton Vance
Parametric Structured Emerging Markets Fund
January 31, 2013
Financial Highlights — continued
| | | | | | | | | | | | | | | | | | | | | | | | |
| | | Class I | |
| | | Year Ended
January 31, 2013 | | | Period Ended January 31, 2012(1) | | | Year Ended October 31, | |
| | | | | 2011 | | | 2010 | | | 2009 | | | 2008 | |
Net asset value — Beginning of period | | $ | 13.970 | | | $ | 13.810 | | | $ | 15.580 | | | $ | 12.460 | | | $ | 8.320 | | | $ | 17.540 | |
| | | | | | |
| Income (Loss) From Operations | | | | | | | | | | | | | | | | | | | | | | | | |
Net investment income (loss)(2) | | $ | 0.222 | | | $ | (0.006 | ) | | $ | 0.233 | | | $ | 0.163 | | | $ | 0.156 | | | $ | 0.231 | |
Net realized and unrealized gain (loss) | | | 1.339 | | | | 0.322 | | | | (1.821 | ) | | | 3.071 | | | | 4.109 | | | | (9.251 | ) |
| | | | | | |
Total income (loss) from operations | | $ | 1.561 | | | $ | 0.316 | | | $ | (1.588 | ) | | $ | 3.234 | | | $ | 4.265 | | | $ | (9.020 | ) |
| | | | | | |
| Less Distributions | | | | | | | | | | | | | | | | | | | | | | | | |
From net investment income | | $ | (0.209 | ) | | $ | (0.156 | ) | | $ | (0.182 | ) | | $ | (0.116 | ) | | $ | (0.126 | ) | | $ | (0.103 | ) |
From net realized gain | | | — | | | | — | | | | — | | | | — | | | | — | | | | (0.098 | ) |
Tax return of capital | | | (0.012 | ) | | | — | | | | — | | | | — | | | | — | | | | — | |
| | | | | | |
Total distributions | | $ | (0.221 | ) | | $ | (0.156 | ) | | $ | (0.182 | ) | | $ | (0.116 | ) | | $ | (0.126 | ) | | $ | (0.201 | ) |
| | | | | | |
Redemption fees(2)(3) | | $ | — | | | $ | — | | | $ | 0.000 | (4) | | $ | 0.002 | | | $ | 0.001 | | | $ | 0.001 | |
| | | | | | |
Net asset value — End of period | | $ | 15.310 | | | $ | 13.970 | | | $ | 13.810 | | | $ | 15.580 | | | $ | 12.460 | | | $ | 8.320 | |
| | | | | | |
Total Return(5) | | | 11.22 | % | | | 2.41 | %(6) | | | (10.39 | )% | | | 26.22 | % | | | 52.15 | % | | | (51.99 | )% |
| | | | | | |
| Ratios/Supplemental Data | | | | | | | | | | | | | | | | | | | | | | | | |
Net assets, end of period (000’s omitted) | | $ | 2,739,147 | | | $ | 1,988,618 | | | $ | 1,845,906 | | | $ | 1,623,796 | | | $ | 846,944 | | | $ | 278,147 | |
Ratios (as a percentage of average daily net assets): | | | | | | | | | | | | | | | | | | | | | | | | |
Expenses(7) | | | 1.16 | % | | | 1.20 | %(8) | | | 1.20 | % | | | 1.26 | % | | | 1.33 | %(9) | | | 1.25 | %(9) |
Net investment income (loss) | | | 1.56 | % | | | (0.18 | )%(8) | | | 1.53 | % | | | 1.19 | % | | | 1.56 | % | | | 1.62 | % |
Portfolio Turnover | | | 3 | % | | | 0 | %(6)(10) | | | 3 | % | | | 8 | % | | | 11 | % | | | 5 | % |
| (1) | For the three months ended January 31, 2012. The Fund changed its fiscal year-end from October 31 to January 31. |
| (2) | Computed using average shares outstanding. |
| (3) | Redemption fees were discontinued as of January 1, 2011. |
| (4) | Amount is less than $0.0005. |
| (5) | Returns are historical and are calculated by determining the percentage change in net asset value with all distributions reinvested. |
| (7) | Excludes the effect of custody fee credits, if any, of less than 0.005%. |
| (9) | The investment adviser and administrator waived a portion of its fees and subsidized certain operating expenses (equal to 0.02% and 0.20% of average daily net assets for the years ended October 31, 2009 and 2008, respectively). |
| (10) | Amount is less than 0.5%. |
| | | | |
| | 32 | | See Notes to Financial Statements. |
Eaton Vance
Parametric Structured Emerging Markets Fund
January 31, 2013
Notes to Financial Statements
1 Significant Accounting Policies
Eaton Vance Parametric Structured Emerging Markets Fund (the Fund) is a diversified series of Eaton Vance Mutual Funds Trust (the Trust). The Trust is a Massachusetts business trust registered under the Investment Company Act of 1940, as amended (the 1940 Act), as an open-end management investment company. The Fund’s investment objective is to seek long-term capital appreciation. The Fund offers three classes of shares. Class A shares are generally sold subject to a sales charge imposed at time of purchase. Class C shares are sold at net asset value and are generally subject to a contingent deferred sales charge (see Note 5). Class I shares are sold at net asset value and are not subject to a sales charge. See Note 12-Subsequent Events for changes affecting the share classes effective March 1, 2013. Each class represents a pro-rata interest in the Fund, but votes separately on class-specific matters and (as noted below) is subject to different expenses. Realized and unrealized gains and losses and net investment income and losses, other than class-specific expenses, are allocated daily to each class of shares based on the relative net assets of each class to the total net assets of the Fund. Each class of shares differs in its distribution plan and certain other class-specific expenses.
The following is a summary of significant accounting policies of the Fund. The policies are in conformity with accounting principles generally accepted in the United States of America.
A Investment Valuation — Equity securities (including common shares of closed-end investment companies) listed on a U.S. securities exchange generally are valued at the last sale or closing price on the day of valuation or, if no sales took place on such date, at the mean between the closing bid and asked prices therefore on the exchange where such securities are principally traded. Equity securities listed on the NASDAQ Global or Global Select Market generally are valued at the NASDAQ official closing price. Unlisted or listed securities for which closing sales prices or closing quotations are not available are valued at the mean between the latest available bid and asked prices or, in the case of preferred equity securities that are not listed or traded in the over-the-counter market, by a third party pricing service that will use various techniques that consider factors including, but not limited to, prices or yields of securities with similar characteristics, benchmark yields, broker/dealer quotes, quotes of underlying common stock, issuer spreads, as well as industry and economic events. Debt obligations (including short-term obligations with a remaining maturity of more than sixty days) are generally valued on the basis of valuations provided by third party pricing services, as derived from such services’ pricing models. Inputs to the models may include, but are not limited to, reported trades, executable bid and asked prices, broker/dealer quotations, prices or yields of securities with similar characteristics, benchmark curves or information pertaining to the issuer, as well as industry and economic events. The pricing services may use a matrix approach, which considers information regarding securities with similar characteristics to determine the valuation for a security. Short-term obligations purchased with a remaining maturity of sixty days or less are generally valued at amortized cost, which approximates market value. Foreign securities and currencies are valued in U.S. dollars, based on foreign currency exchange rate quotations supplied by a third party pricing service. The pricing service uses a proprietary model to determine the exchange rate. Inputs to the model include reported trades and implied bid/ask spreads. The daily valuation of exchange-traded foreign securities generally is determined as of the close of trading on the principal exchange on which such securities trade. Events occurring after the close of trading on foreign exchanges may result in adjustments to the valuation of foreign securities to more accurately reflect their fair value as of the close of regular trading on the New York Stock Exchange. When valuing foreign equity securities that meet certain criteria, the Fund’s Trustees have approved the use of a fair value service that values such securities to reflect market trading that occurs after the close of the applicable foreign markets of comparable securities or other instruments that have a strong correlation to the fair-valued securities. Investments for which valuations or market quotations are not readily available or are deemed unreliable are valued at fair value using methods determined in good faith by or at the direction of the Trustees of the Fund in a manner that fairly reflects the security’s value, or the amount that the Fund might reasonably expect to receive for the security upon its current sale in the ordinary course. Each such determination is based on a consideration of relevant factors, which are likely to vary from one pricing context to another. These factors may include, but are not limited to, the type of security, the existence of any contractual restrictions on the security’s disposition, the price and extent of public trading in similar securities of the issuer or of comparable companies or entities, quotations or relevant information obtained from broker/dealers or other market participants, information obtained from the issuer, analysts, and/or the appropriate stock exchange (for exchange-traded securities), an analysis of the company’s or entity’s financial condition, and an evaluation of the forces that influence the issuer and the market(s) in which the security is purchased and sold.
B Investment Transactions — Investment transactions for financial statement purposes are accounted for on a trade date basis. Realized gains and losses on investments sold are determined on the basis of identified cost.
C Income — Dividend income is recorded on the ex-dividend date for dividends received in cash and/or securities. However, if the ex-dividend date has passed, certain dividends from foreign securities are recorded as the Fund is informed of the ex-dividend date. Withholding taxes on foreign dividends, interest and capital gains have been provided for in accordance with the Fund’s understanding of the applicable countries’ tax rules and rates. Interest income is recorded on the basis of interest accrued, adjusted for amortization of premium or accretion of discount.
D Federal Taxes — The Fund’s policy is to comply with the provisions of the Internal Revenue Code applicable to regulated investment companies and to distribute to shareholders each year substantially all of its net investment income, and all or substantially all of its net realized capital gains. Accordingly, no provision for federal income or excise tax is necessary.
In addition to the requirements of the Internal Revenue Code, the Fund may also be subject to local taxes on the recognition of capital gains in certain countries. In determining the daily net asset value, the Fund estimates the accrual for such taxes, if any, based on the unrealized appreciation on certain portfolio securities and the related tax rates. Taxes attributable to unrealized appreciation are included in the change in unrealized appreciation (depreciation) on investments. Capital gains taxes on securities sold are included in net realized gain (loss) on investments.
Eaton Vance
Parametric Structured Emerging Markets Fund
January 31, 2013
Notes to Financial Statements — continued
At January 31, 2013, the Fund, for federal income tax purposes, had a capital loss carryforward of $48,742,945 and current year deferred capital losses of $12,003,971 which will reduce its taxable income arising from future net realized gains on investment transactions, if any, to the extent permitted by the Internal Revenue Code, and thus will reduce the amount of distributions to shareholders, which would otherwise be necessary to relieve the Fund of any liability for federal income or excise tax. The capital loss carryforward will expire on January 31, 2016 ($2,790,563), January 31, 2017 ($44,871,373) and January 31, 2019 ($1,081,009). A capital loss carryforward of $7,660,713 included in the amounts above is available to the Fund as a result of the reorganization on September 24, 2010. Utilization of this capital loss carryforward may be limited in accordance with certain income tax regulations. The current year deferred capital losses are treated as arising on the first day of the Fund’s next taxable year and are treated as realized prior to the utilization of the capital loss carryforward.
As of January 31, 2013, the Fund had no uncertain tax positions that would require financial statement recognition, de-recognition, or disclosure. The Fund files a U.S. federal income tax return annually after its fiscal year-end, which is subject to examination by the Internal Revenue Service for a period of three years from the date of filing.
E Expenses — The majority of expenses of the Trust are directly identifiable to an individual fund. Expenses which are not readily identifiable to a specific fund are allocated taking into consideration, among other things, the nature and type of expense and the relative size of the funds.
F Expense Reduction — State Street Bank and Trust Company (SSBT) serves as custodian of the Fund. Pursuant to the custodian agreement, SSBT receives a fee reduced by credits, which are determined based on the average daily cash balance the Fund maintains with SSBT. All credit balances, if any, used to reduce the Fund’s custodian fees are reported as a reduction of expenses in the Statement of Operations.
G Foreign Currency Translation — Investment valuations, other assets, and liabilities initially expressed in foreign currencies are translated each business day into U.S. dollars based upon current exchange rates. Purchases and sales of foreign investment securities and income and expenses denominated in foreign currencies are translated into U.S. dollars based upon currency exchange rates in effect on the respective dates of such transactions. Recognized gains or losses on investment transactions attributable to changes in foreign currency exchange rates are recorded for financial statement purposes as net realized gains and losses on investments. That portion of unrealized gains and losses on investments that results from fluctuations in foreign currency exchange rates is not separately disclosed.
H Use of Estimates — The preparation of the financial statements in conformity with accounting principles generally accepted in the United States of America requires management to make estimates and assumptions that affect the reported amounts of assets and liabilities at the date of the financial statements and the reported amounts of income and expense during the reporting period. Actual results could differ from those estimates.
I Indemnifications — Under the Trust’s organizational documents, its officers and Trustees may be indemnified against certain liabilities and expenses arising out of the performance of their duties to the Fund. Under Massachusetts law, if certain conditions prevail, shareholders of a Massachusetts business trust (such as the Trust) could be deemed to have personal liability for the obligations of the Trust. However, the Trust’s Declaration of Trust contains an express disclaimer of liability on the part of Fund shareholders and the By-laws provide that the Trust shall assume the defense on behalf of any Fund shareholders. Moreover, the By-laws also provide for indemnification out of Fund property of any shareholder held personally liable solely by reason of being or having been a shareholder for all loss or expense arising from such liability. Additionally, in the normal course of business, the Fund enters into agreements with service providers that may contain indemnification clauses. The Fund’s maximum exposure under these arrangements is unknown as this would involve future claims that may be made against the Fund that have not yet occurred.
J Redemption Fees — Prior to January 1, 2011 and upon the redemption or exchange of shares by Class A and Class I shareholders within 90 days of the settlement of purchase, a fee of 1% of the current net asset value of these shares was assessed and retained by the Fund for the benefit of the remaining shareholders. The redemption fee was accounted for as an addition to paid-in capital. Effective January 1, 2011, Class A and Class I shares are no longer subject to a redemption fee.
2 Distributions to Shareholders
It is the present policy of the Fund to make at least one distribution annually (normally in December) of all or substantially all of its net investment income and to distribute annually all or substantially all of its net realized capital gains (reduced by available capital loss carryforwards from prior years, if any). Distributions to shareholders are recorded on the ex-dividend date. Distributions are declared separately for each class of shares. Shareholders may reinvest income and capital gain distributions in additional shares of the same class of the Fund at the net asset value as of the ex-dividend date or, at the election of the shareholder, receive distributions in cash. The Fund distinguishes between distributions on a tax basis and a financial reporting basis. Accounting principles generally accepted in the United States of America require that only distributions in excess of tax basis earnings and profits be reported in the financial statements as a return of capital. Permanent differences between book and tax accounting relating to distributions are reclassified to paid-in capital. For tax purposes, distributions from short-term capital gains are considered to be from ordinary income.
Eaton Vance
Parametric Structured Emerging Markets Fund
January 31, 2013
Notes to Financial Statements — continued
The tax character of distributions declared for the year ended January 31, 2013, the three months ended January 31, 2012 and the year ended October 31, 2011 was as follows:
| | | | | | | | | | | | |
| | | Year Ended January 31, 2013 | | | Period Ended
January 31, 2012(1) | | | Year Ended October 31, 2011 | |
| | | |
Distributions declared from: | | | | | | | | | | | | |
Ordinary income | | $ | 44,514,217 | | | $ | 26,153,733 | | | $ | 24,002,952 | |
Tax return of capital | | $ | 2,614,912 | | | $ | — | | | $ | — | |
| (1) | For the three months ended January 31, 2012. |
During the year ended January 31, 2013, accumulated net realized loss was decreased by $942,406, accumulated distributions in excess of net investment income was increased by $988,518 and paid-in capital was increased by $46,112 due to differences between book and tax accounting, primarily for foreign currency gain (loss), foreign capital gains taxes and investments in passive foreign investment companies (PFICs). These reclassifications had no effect on the net assets or net asset value per share of the Fund.
As of January 31, 2013, the components of distributable earnings (accumulated losses) and unrealized appreciation (depreciation) on a tax basis were as follows:
| | | | |
Capital loss carryforward and deferred capital losses | | $ | (60,746,916 | ) |
Net unrealized appreciation | | $ | 431,932,174 | |
The differences between components of distributable earnings (accumulated losses) on a tax basis and the amounts reflected in the Statement of Assets and Liabilities are primarily due to wash sales, investments in PFICs, foreign currency transactions and partnership allocations.
3 Investment Adviser Fee and Other Transactions with Affiliates
The investment adviser fee is earned by Eaton Vance Management (EVM) as compensation for management and investment advisory services rendered to the Fund. The fee is computed at an annual rate of 0.85% of the Fund’s average daily net assets up to $500 million, 0.80% on net assets of $500 million but less than $1 billion, 0.775% on net assets of $1 billion but less than $2.5 billion, 0.75% on net assets of $2.5 billion but less than $5 billion and 0.73% on average daily net assets of $5 billion and over, and is payable monthly. For the year ended January 31, 2013, the investment adviser fee amounted to $22,248,471 or 0.79% of the Fund’s average daily net assets. Pursuant to a sub-advisory agreement, EVM has delegated the investment management of the Fund to Parametric Portfolio Associates LLC (Parametric), a majority-owned subsidiary of Eaton Vance Corp. EVM pays Parametric a portion of its advisory fee for sub-advisory services provided to the Fund. The administration fee is earned by EVM for administering the business affairs of the Fund and is computed at an annual rate of 0.15% of the Fund’s average daily net assets. For the year ended January 31, 2013, the administration fee amounted to $4,225,342.
EVM serves as the sub-transfer agent of the Fund and receives from the transfer agent an aggregate fee based upon the actual expenses incurred by EVM in the performance of these services. For the year ended January 31, 2013, EVM earned $68,724 in sub-transfer agent fees. The Fund was informed that Eaton Vance Distributors, Inc. (EVD), an affiliate of EVM and the Fund’s principal underwriter, received $13,877 as its portion of the sales charge on sales of Class A shares for the year ended January 31, 2013. EVD also received distribution and service fees from Class A and Class C shares (see Note 4) and contingent deferred sales charges (see Note 5).
Trustees and officers of the Fund who are members of EVM’s organization receive remuneration for their services to the Fund out of the investment adviser fee. Trustees of the Fund who are not affiliated with EVM may elect to defer receipt of all or a percentage of their annual fees in accordance with the terms of the Trustees Deferred Compensation Plan. For the year ended January 31, 2013, no significant amounts have been deferred. Certain officers and Trustees of the Fund are officers of EVM.
4 Distribution Plans
The Fund has in effect a distribution plan for Class A shares (Class A Plan) pursuant to Rule 12b-1 under the 1940 Act. Pursuant to the Class A Plan, the Fund pays EVD a distribution and service fee of 0.25% per annum of its average daily net assets attributable to Class A shares for distribution services and facilities provided to the Fund by EVD, as well as for personal services and/or the maintenance of shareholder accounts. Distribution and service fees paid or accrued to EVD for the year ended January 31, 2013 amounted to $1,448,618 for Class A shares.
The Fund also has in effect a distribution plan for Class C shares (Class C Plan) pursuant to Rule 12b-1 under the 1940 Act. Pursuant to the Class C Plan, the Fund pays EVD amounts equal to 0.75% per annum of its average daily net assets attributable to Class C shares for providing ongoing distribution
Eaton Vance
Parametric Structured Emerging Markets Fund
January 31, 2013
Notes to Financial Statements — continued
services and facilities to the Fund. The Fund will automatically discontinue payments to EVD during any period in which there are no outstanding Uncovered Distribution Charges, which are equivalent to the sum of (i) 6.25% of the aggregate amount received by the Fund for Class C shares sold, plus (ii) interest calculated by applying the rate of 1% over the prevailing prime rate to the outstanding balance of Uncovered Distribution Charges of EVD of Class C, reduced by the aggregate amount of contingent deferred sales charges (see Note 5) and amounts theretofore paid or payable to EVD by Class C. For the year ended January��31, 2013, the Fund paid or accrued to EVD $162,933 for Class C shares representing 0.75% of the average daily net assets of Class C shares. At January 31, 2013, the amount of Uncovered Distribution Charges of EVD calculated under the Class C Plan was approximately $2,217,000.
Pursuant to the Class C Plan, the Fund also makes payments of service fees to EVD, financial intermediaries and other persons in amounts equal to 0.25% per annum of its average daily net assets attributable to Class C. Service fees paid or accrued are for personal services and/or the maintenance of shareholder accounts. They are separate and distinct from the sales commissions and distribution fees payable to EVD and, as such, are not subject to automatic discontinuance when there are no outstanding Uncovered Distribution Charges of EVD. Service fees paid or accrued for the year ended January 31, 2013 amounted to $54,311 for Class C shares.
5 Contingent Deferred Sales Charges
A contingent deferred sales charge (CDSC) of 1% generally is imposed on redemptions of Class C shares made within one year of purchase. Class A shares may be subject to a 1% CDSC if redeemed within 18 months of purchase (depending on the circumstances of purchase). Generally, the CDSC is based upon the lower of the net asset value at date of redemption or date of purchase. No charge is levied on shares acquired by reinvestment of dividends or capital gain distributions. No CDSC is levied on shares which have been sold to EVM or its affiliates or to their respective employees or clients and may be waived under certain other limited conditions. CDSCs received on Class C redemptions are paid to EVD to reduce the amount of Uncovered Distribution Charges calculated under the Fund’s Class C Plan. CDSCs received on Class C redemptions when no Uncovered Distribution Charges exist are credited to the Fund. For the year ended January 31, 2013, the Fund was informed that EVD received approximately $3,000 and $4,000 of CDSCs paid by Class A and Class C shareholders, respectively.
6 Purchases and Sales of Investments
Purchases and sales of investments, other than short-term obligations, aggregated $775,634,131 and $88,107,870, respectively, for the year ended January 31, 2013.
7 Shares of Beneficial Interest
The Fund’s Declaration of Trust permits the Trustees to issue an unlimited number of full and fractional shares of beneficial interest (without par value). Such shares may be issued in a number of different series (such as the Fund) and classes. Transactions in Fund shares were as follows:
| | | | | | | | | | | | |
| Class A | | Year Ended January 31, 2013 | | | Period Ended January 31, 2012(1) | | | Year Ended October 31, 2011 | |
| | | |
Sales | | | 22,197,036 | | | | 2,666,923 | | | | 23,535,442 | |
Issued to shareholders electing to receive payments of distributions in Fund shares | | | 590,993 | | | | 172,813 | | | | 172,536 | |
Redemptions | | | (9,787,693 | ) | | | (2,426,681 | ) | | | (5,892,424 | ) |
| | | |
Net increase | | | 13,000,336 | | | | 413,055 | | | | 17,815,554 | |
| | | |
| | | | | | | | | | | | |
| Class C | | Year Ended January 31, 2013 | | | Period Ended January 31, 2012(1) | | | Year Ended October 31, 2011 | |
| | | |
Sales | | | 343,481 | | | | 85,299 | | | | 702,397 | |
Issued to shareholders electing to receive payments of distributions in Fund shares | | | 6,110 | | | | 448 | | | | 4,757 | |
Redemptions | | | (445,335 | ) | | | (137,142 | ) | | | (506,434 | ) |
| | | |
Net increase (decrease) | | | (95,744 | ) | | | (51,395 | ) | | | 200,720 | |
Eaton Vance
Parametric Structured Emerging Markets Fund
January 31, 2013
Notes to Financial Statements — continued
| | | | | | | | | | | | |
| Class I | | Year Ended January 31, 2013 | | | Period Ended January 31, 2012(1) | | | Year Ended October 31, 2011 | |
| | | |
Sales | | | 61,302,981 | | | | 21,980,409 | | | | 52,218,449 | |
Issued to shareholders electing to receive payments of distributions in Fund shares | | | 2,058,577 | | | | 1,022,610 | | | | 773,504 | |
Redemptions | | | (26,741,612 | ) | | | (14,360,853 | ) | | | (23,488,502 | ) |
| | | |
Net increase | | | 36,619,946 | | | | 8,642,166 | | | | 29,503,451 | |
| (1) | For the three months ended January 31, 2012. |
For the year ended October 31, 2011, the Fund received $7,342 in redemption fees.
8 Federal Income Tax Basis of Investments
The cost and unrealized appreciation (depreciation) of investments of the Fund at January 31, 2013, as determined on a federal income tax basis, were as follows:
| | | | |
| |
Aggregate cost | | $ | 3,065,427,322 | |
| |
Gross unrealized appreciation | | $ | 703,502,432 | |
Gross unrealized depreciation | | | (271,112,897 | ) |
| |
Net unrealized appreciation | | $ | 432,389,535 | |
9 Line of Credit
The Fund participates with other portfolios and funds managed by EVM and its affiliates in a $600 million unsecured line of credit agreement with a group of banks. Borrowings are made by the Fund solely to facilitate the handling of unusual and/or unanticipated short-term cash requirements. Interest is charged to the Fund based on its borrowings at an amount above either the Eurodollar rate or Federal Funds rate. In addition, a fee computed at an annual rate of 0.08% on the daily unused portion of the line of credit is allocated among the participating portfolios and funds at the end of each quarter. Because the line of credit is not available exclusively to the Fund, it may be unable to borrow some or all of its requested amounts at any particular time. The Fund did not have any significant borrowings or allocated fees during the year ended January 31, 2013.
10 Risks Associated with Foreign Investments
Investing in securities issued by companies whose principal business activities are outside the United States may involve significant risks not present in domestic investments. For example, there is generally less publicly available information about foreign companies, particularly those not subject to the disclosure and reporting requirements of the U.S. securities laws. Certain foreign issuers are generally not bound by uniform accounting, auditing, and financial reporting requirements and standards of practice comparable to those applicable to domestic issuers. Investments in foreign securities also involve the risk of possible adverse changes in investment or exchange control regulations, expropriation or confiscatory taxation, limitation on the removal of funds or other assets of the Fund, political or financial instability or diplomatic and other developments which could affect such investments. Foreign securities markets, while growing in volume and sophistication, are generally not as developed as those in the United States, and securities of some foreign issuers (particularly those located in developing countries) may be less liquid and more volatile than securities of comparable U.S. companies. In general, there is less overall governmental supervision and regulation of foreign securities markets, broker/dealers and issuers than in the United States.
11 Fair Value Measurements
Under generally accepted accounting principles for fair value measurements, a three-tier hierarchy to prioritize the assumptions, referred to as inputs, is used in valuation techniques to measure fair value. The three-tier hierarchy of inputs is summarized in the three broad levels listed below.
| Ÿ | | Level 1 – quoted prices in active markets for identical investments |
| Ÿ | | Level 2 – other significant observable inputs (including quoted prices for similar investments, interest rates, prepayment speeds, credit risk, etc.) |
| Ÿ | | Level 3 – significant unobservable inputs (including a fund’s own assumptions in determining the fair value of investments) |
Eaton Vance
Parametric Structured Emerging Markets Fund
January 31, 2013
Notes to Financial Statements — continued
In cases where the inputs used to measure fair value fall in different levels of the fair value hierarchy, the level disclosed is determined based on the lowest level input that is significant to the fair value measurement in its entirety. The inputs or methodology used for valuing securities are not necessarily an indication of the risk associated with investing in those securities.
At January 31, 2013, the hierarchy of inputs used in valuing the Fund’s investments, which are carried at value, were as follows:
| | | | | | | | | | | | | | | | |
| Asset Description | | Level 1 | | | Level 2 | | | Level 3* | | | Total | |
| | | | |
Common Stocks | | | | | | | | | | | | | | | | |
Asia/Pacific | | $ | 42,976,624 | | | $ | 1,370,326,020 | | | $ | 9,713 | | | $ | 1,413,312,357 | |
Emerging Europe | | | 21,724,321 | | | | 604,178,487 | | | | — | | | | 625,902,808 | |
Latin America | | | 382,843,020 | | | | 320,664,154 | | | | 927,787 | | | | 704,434,961 | |
Middle East/Africa | | | 3,400,957 | | | | 687,386,929 | | | | 331,757 | | | | 691,119,643 | |
| | | | |
Total Common Stocks | | $ | 450,944,922 | | | $ | 2,982,555,590 | ** | | $ | 1,269,257 | | | $ | 3,434,769,769 | |
| | | | |
Corporate Bonds | | $ | — | | | $ | 24,750 | | | $ | — | | | $ | 24,750 | |
Equity-Linked Securities | | | — | | | | 26,922,977 | | | | — | | | | 26,922,977 | |
Investment Funds | | | — | | | | 2,727,399 | | | | — | | | | 2,727,399 | |
Rights | | | 20,195 | | | | 21,416 | | | | — | | | | 41,611 | |
Warrants | | | 11,967 | | | | — | | | | — | | | | 11,967 | |
Short-Term Investments | | | — | | | | 33,318,384 | | | | — | | | | 33,318,384 | |
| | | | |
Total Investments | | $ | 450,977,084 | | | $ | 3,045,570,516 | | | $ | 1,269,257 | | | $ | 3,497,816,857 | |
| * | None of the unobservable inputs for Level 3 assets, individually or collectively, had a material impact on the Fund. |
| ** | Includes foreign equity securities whose values were adjusted to reflect market trading of comparable securities or other correlated instruments that occurred after the close of trading in their applicable foreign markets. |
Level 3 investments at the beginning and/or end of the period in relation to net assets were not significant and accordingly, a reconciliation of Level 3 assets for the year ended January 31, 2013 is not presented.
At January 31, 2013, investments having a value of $243,559,780 and $834,614 at January 31, 2012 were transferred from Level 1 to Level 2 and Level 2 to Level 1, respectively, during the year then ended. The change in the level designations within the fair value hierarchy was due to an increase or decrease in the coverage of foreign equity securities provided by the Fund’s fair valuation pricing service as discussed in Note 1A.
12 Subsequent Events
Effective March 1, 2013, Class A and Class I shares of the Fund were renamed Investor Class and Institutional Class, respectively; the sales charge payable upon purchase of Investor Class (currently known as Class A) shares was eliminated; and Class C shares of the Fund are no longer available for purchase, except by existing shareholders (including shares acquired through the reinvestment of dividends and distributions) or qualified retirement plans.
The name of the Fund was changed to Parametric Emerging Markets Fund effective March 1, 2013.
Eaton Vance
Parametric Structured Emerging Markets Fund
January 31, 2013
Report of Independent Registered Public Accounting Firm
To the Trustees of Eaton Vance Mutual Funds Trust and Shareholders of Eaton Vance Parametric Structured Emerging Markets Fund:
We have audited the accompanying statement of assets and liabilities of Eaton Vance Parametric Structured Emerging Markets Fund (the “Fund”) (one of the funds constituting Eaton Vance Mutual Funds Trust), including the portfolio of investments, as of January 31, 2013, and the related statement of operations for the year then ended, the statements of changes in net assets for the year then ended, for the three month period ended January 31, 2012 and for the year ended October 31, 2011, and the financial highlights for the year then ended, for the three month period ended January 31, 2012, and for each of the four years in the period ended October 31, 2011. These financial statements and financial highlights are the responsibility of the Fund’s management. Our responsibility is to express an opinion on these financial statements and financial highlights based on our audits.
We conducted our audits in accordance with the standards of the Public Company Accounting Oversight Board (United States). Those standards require that we plan and perform the audit to obtain reasonable assurance about whether the financial statements and financial highlights are free of material misstatement. The Fund is not required to have, nor were we engaged to perform, an audit of its internal control over financial reporting. Our audits included consideration of internal control over financial reporting as a basis for designing audit procedures that are appropriate in the circumstances, but not for the purpose of expressing an opinion on the effectiveness of the Fund’s internal control over financial reporting. Accordingly, we express no such opinion. An audit also includes examining, on a test basis, evidence supporting the amounts and disclosures in the financial statements, assessing the accounting principles used and significant estimates made by management, as well as evaluating the overall financial statement presentation. Our procedures included confirmation of securities owned as of January 31, 2013, by correspondence with the custodian and brokers; where replies were not received from brokers, we performed other auditing procedures. We believe that our audits provide a reasonable basis for our opinion.
In our opinion, such financial statements and financial highlights referred to above present fairly, in all material respects, the financial position of Eaton Vance Parametric Structured Emerging Markets Fund as of January 31, 2013, the results of its operations for the year then ended, the changes in its net assets for the year then ended, for the three month period ended January 31, 2012 and for the year ended October 31, 2011, and the financial highlights for the year then ended, for the three month period ended January 31, 2012 and for each of the four years in the period ended October 31, 2011, in conformity with accounting principles generally accepted in the United States of America.
DELOITTE & TOUCHE LLP
Boston, Massachusetts
March 20, 2013
Eaton Vance
Parametric Structured Emerging Markets Fund
January 31, 2013
Federal Tax Information (Unaudited)
The Form 1099-DIV you receive in January 2014 will show the tax status of all distributions paid to your account in calendar year 2013. Shareholders are advised to consult their own tax adviser with respect to the tax consequences of their investment in the Fund. As required by the Internal Revenue Code and/or regulations, shareholders must be notified regarding the status of qualified dividend income for individuals, the dividends received deduction for corporations and the foreign tax credit.
Qualified Dividend Income. The Fund designates approximately $48,954,417, or up to the maximum amount of such dividends allowable pursuant to the Internal Revenue Code, as qualified dividend income eligible for the reduced tax rate of 15%.
Dividends Received Deduction. Corporate shareholders are generally entitled to take the dividends received deduction on the portion of the Fund’s dividend distribution that qualifies under tax law. For the Fund’s fiscal 2013 ordinary income dividends, 1.20% qualifies for the corporate dividends received deduction.
Foreign Tax Credit. The Fund paid foreign taxes of $7,663,964 and recognized foreign source income of $84,240,465.
Eaton Vance
Parametric Structured Emerging Markets Fund
January 31, 2013
Management and Organization
Fund Management. The Trustees of Eaton Vance Mutual Funds Trust (the Trust) are responsible for the overall management and supervision of the Trust’s affairs. The Trustees and officers of the Trust are listed below. Except as indicated, each individual has held the office shown or other offices in the same company for the last five years. Trustees and officers of the Trust hold indefinite terms of office. The “Noninterested Trustees” consist of those Trustees who are not “interested persons” of the Trust, as that term is defined under the 1940 Act. The business address of each Trustee and officer is Two International Place, Boston, Massachusetts 02110. As used below, “EVC” refers to Eaton Vance Corp., “EV” refers to Eaton Vance, Inc., “EVM” refers to Eaton Vance Management, “BMR” refers to Boston Management and Research and “EVD” refers to Eaton Vance Distributors, Inc. EVC and EV are the corporate parent and trustee, respectively, of EVM and BMR. EVD is the Fund’s principal underwriter and a wholly-owned subsidiary of EVC. Each officer affiliated with Eaton Vance may hold a position with other Eaton Vance affiliates that is comparable to his or her position with EVM listed below. Each Trustee oversees 183 portfolios in the Eaton Vance Complex (including all master and feeder funds in a master feeder structure). Each officer serves as an officer of certain other Eaton Vance funds. Each Trustee and officer serves until his or her successor is elected.
| | | | | | |
| Name and Year of Birth | | Position(s) with the Trust | | Length of
Service | | Principal Occupation(s) and Directorships
During Past Five Years and Other Relevant Experience |
Interested Trustee |
| | | |
Thomas E. Faust Jr. 1958 | | Trustee | | Since 2007 | | Chairman, Chief Executive Officer and President of EVC, Director and President of EV, Chief Executive Officer and President of EVM and BMR, and Director of EVD. Trustee and/or officer of 183 registered investment companies. Mr. Faust is an interested person because of his positions with EVM, BMR, EVD, EVC and EV, which are affiliates of the Trust. Directorships in the Last Five Years.(1) Director of EVC and Hexavest Inc. |
| | | |
| | | | | | |
Noninterested Trustees |
| | | |
Scott E. Eston 1956 | | Trustee | | Since 2011 | | Private investor. Formerly held various positions at Grantham, Mayo, Van Otterloo and Co., L.L.C. (investment management firm) (1997-2009), including Chief Operating Officer (2002-2009), Chief Financial Officer (1997-2009) and Chairman of the Executive Committee (2002-2008); President and Principal Executive Officer, GMO Trust (open-end registered investment company) (2006-2009). Former Partner, Coopers and Lybrand L.L.P. (now PricewaterhouseCoopers) (public accounting firm) (1987-1997). Directorships in the Last Five Years. None. |
| | | |
Benjamin C. Esty 1963 | | Trustee | | Since 2005 | | Roy and Elizabeth Simmons Professor of Business Administration and Finance Unit Head, Harvard University Graduate School of Business Administration. Directorships in the Last Five Years.(1) None. |
| | | |
Allen R. Freedman 1940 | | Trustee | | Since 2007 | | Private Investor. Former Chairman (2002-2004) and a Director (1983-2004) of Systems & Computer Technology Corp. (provider of software to higher education). Formerly, a Director of Loring Ward International (fund distributor) (2005-2007). Former Chairman and a Director of Indus International, Inc. (provider of enterprise management software to the power generating industry) (2005-2007). Former Chief Executive Officer of Assurant, Inc. (insurance provider) (1979-2000). Directorships in the Last Five Years.(1) Director of Stonemor Partners, L.P. (owner and operator of cemeteries). Formerly, Director of Assurant, Inc. (insurance provider) (1979-2011). |
| | | |
William H. Park 1947 | | Trustee | | Since 2003 | | Consultant and private investor. Formerly, Chief Financial Officer, Aveon Group L.P. (investment management firm) (2010-2011). Formerly, Vice Chairman, Commercial Industrial Finance Corp. (specialty finance company) (2006-2010). Formerly, President and Chief Executive Officer, Prizm Capital Management, LLC (investment management firm) (2002-2005). Formerly, Executive Vice President and Chief Financial Officer, United Asset Management Corporation (investment management firm) (1982-2001). Formerly, Senior Manager, Price Waterhouse (now PricewaterhouseCoopers) (an independent registered public accounting firm) (1972-1981). Directorships in the Last Five Years.(1) None. |
| | | |
Ronald A. Pearlman 1940 | | Trustee | | Since 2003 | | Professor of Law, Georgetown University Law Center. Formerly, Deputy Assistant Secretary (Tax Policy) and Assistant Secretary (Tax Policy), U.S. Department of the Treasury (1983-1985). Formerly, Chief of Staff, Joint Committee on Taxation, U.S. Congress (1988-1990). Directorships in the Last Five Years.(1) None. |
Eaton Vance
Parametric Structured Emerging Markets Fund
January 31, 2013
Management and Organization — continued
| | | | | | |
| Name and Year of Birth | | Position(s) with the Trust | | Length of
Service | | Principal Occupation(s) and Directorships
During Past Five Years and Other Relevant Experience |
Noninterested Trustees (continued) |
| | | |
Helen Frame Peters 1948 | | Trustee | | Since 2008 | | Professor of Finance, Carroll School of Management, Boston College. Formerly, Dean, Carroll School of Management, Boston College (2000-2002). Formerly, Chief Investment Officer, Fixed Income, Scudder Kemper Investments (investment management firm) (1998-1999). Formerly, Chief Investment Officer, Equity and Fixed Income, Colonial Management Associates (investment management firm) (1991-1998). Directorships in the Last Five Years.(1) Formerly, Director of BJ’s Wholesale Club, Inc. (wholesale club retailer) (2004-2011). Formerly, Trustee of SPDR Index Shares Funds and SPDR Series Trust (exchange traded funds) (2000-2009). Formerly, Director of Federal Home Loan Bank of Boston (a bank for banks) (2007-2009). |
| | | |
Lynn A. Stout 1957 | | Trustee | | Since 1998 | | Distinguished Professor of Corporate and Business Law, Jack G. Clarke Business Law Institute, Cornell University Law School. Formerly, the Paul Hastings Professor of Corporate and Securities Law (2006-2012) and Professor of Law (2001-2006), University of California at Los Angeles School of Law. Directorships in the Last Five Years.(1) None. |
| | | |
Harriett Tee Taggart 1948 | | Trustee | | Since 2011 | | Managing Director, Taggart Associates (a professional practice firm). Formerly, Partner and Senior Vice President, Wellington Management Company, LLP (investment management firm) (1983-2006). Directorships in the Last Five Years. Director of Albemarle Corporation (chemicals manufacturer) (since 2007) and The Hanover Group (specialty property and casualty insurance company) (since 2009). Formerly, Director of Lubrizol Corporation (specialty chemicals) (2007-2011). |
| | | |
Ralph F. Verni 1943 | | Chairman of the Board and Trustee | | Chairman of the Board since 2007 and Trustee since 2005 | | Consultant and private investor. Formerly, Chief Investment Officer (1982-1992), Chief Financial Officer (1988-1990) and Director (1982-1992), New England Life. Formerly, Chairperson, New England Mutual Funds (1982-1992). Formerly, President and Chief Executive Officer, State Street Management & Research (1992-2000). Formerly, Chairperson, State Street Research Mutual Funds (1992-2000). Formerly, Director, W.P. Carey, LLC (1998-2004) and First Pioneer Farm Credit Corp. (2002-2006). Directorships in the Last Five Years.(1) None. |
| | | |
| | | | | | |
Principal Officers who are not Trustees |
| Name and Year of Birth | | Position(s) with the
Trust | | Length of Service | | Principal Occupation(s) During Past Five Years |
| | | |
Duncan W. Richardson 1957 | | President | | Since 2011 | | Director of EVC and Executive Vice President and Chief Equity Investment Officer of EVC, EVM and BMR. |
| | | |
Payson F. Swaffield 1956 | | Vice President | | Since 2011 | | Vice President and Chief Income Investment Officer of EVM and BMR. |
| | | |
Maureen A. Gemma 1960 | | Vice President, Secretary and Chief Legal Officer | | Vice President since 2011; Secretary since 2007 and Chief Legal Officer since 2008 | | Vice President of EVM and BMR. |
| | | |
James F. Kirchner(2) 1967 | | Treasurer | | Since 2013 | | Vice President of EVM and BMR. |
| | | |
Paul M. O’Neil 1953 | | Chief Compliance Officer | | Since 2004 | | Vice President of EVM and BMR. |
| (1) | During their respective tenures, the Trustees (except Mr. Eston and Ms. Taggart) also served as trustees of one or more of the following Eaton Vance funds (which operated in the years noted): Eaton Vance Credit Opportunities Fund (launched in 2005 and terminated in 2010); Eaton Vance Insured Florida Plus Municipal Bond Fund (launched in 2002 and terminated in 2009); and Eaton Vance National Municipal Income Trust (launched in 1998 and terminated in 2009). |
| (2) | Prior to 2013, Mr. Kirchner served as Assistant Treasurer of the Trust since 2007. |
The SAI for the Fund includes additional information about the Trustees and officers of the Fund and can be obtained without charge on Eaton Vance’s website at www.eatonvance.com or by calling 1-800-262-1122.
Eaton Vance Funds
IMPORTANT NOTICES
Privacy. The Eaton Vance organization is committed to ensuring your financial privacy. Each of the financial institutions identified below has in effect the following policy (“Privacy Policy”) with respect to nonpublic personal information about its customers:
| Ÿ | | Only such information received from you, through application forms or otherwise, and information about your Eaton Vance fund transactions will be collected. This may include information such as name, address, social security number, tax status, account balances and transactions. |
| Ÿ | | None of such information about you (or former customers) will be disclosed to anyone, except as permitted by law (which includes disclosure to employees necessary to service your account). In the normal course of servicing a customer’s account, Eaton Vance may share information with unaffiliated third parties that perform various required services such as transfer agents, custodians and broker-dealers. |
| Ÿ | | Policies and procedures (including physical, electronic and procedural safeguards) are in place that are designed to protect the confidentiality of such information. |
| Ÿ | | We reserve the right to change our Privacy Policy at any time upon proper notification to you. Customers may want to review our Privacy Policy periodically for changes by accessing the link on our homepage: www.eatonvance.com. |
Our pledge of privacy applies to the following entities within the Eaton Vance organization: the Eaton Vance Family of Funds, Eaton Vance Management, Eaton Vance Investment Counsel, Eaton Vance Distributors, Inc., Eaton Vance Trust Company, Eaton Vance Management’s Real Estate Investment Group and Boston Management and Research. In addition, our Privacy Policy applies only to those Eaton Vance customers who are individuals and who have a direct relationship with us. If a customer’s account (i.e., fund shares) is held in the name of a third-party financial advisor/broker-dealer, it is likely that only such advisor’s privacy policies apply to the customer. This notice supersedes all previously issued privacy disclosures. For more information about Eaton Vance’s Privacy Policy, please call 1-800-262-1122.
Delivery of Shareholder Documents. The Securities and Exchange Commission (SEC) permits funds to deliver only one copy of shareholder documents, including prospectuses, proxy statements and shareholder reports, to fund investors with multiple accounts at the same residential or post office box address. This practice is often called “householding” and it helps eliminate duplicate mailings to shareholders. Eaton Vance, or your financial advisor, may household the mailing of your documents indefinitely unless you instruct Eaton Vance, or your financial advisor, otherwise. If you would prefer that your Eaton Vance documents not be householded, please contact Eaton Vance at 1-800-262-1122, or contact your financial advisor. Your instructions that householding not apply to delivery of your Eaton Vance documents will be effective within 30 days of receipt by Eaton Vance or your financial advisor.
Portfolio Holdings. Each Eaton Vance Fund and its underlying Portfolio(s) (if applicable) will file a schedule of portfolio holdings on Form N-Q with the SEC for the first and third quarters of each fiscal year. The Form N-Q will be available on the Eaton Vance website at www.eatonvance.com, by calling Eaton Vance at 1-800-262-1122 or in the EDGAR database on the SEC’s website at www.sec.gov. Form N-Q may also be reviewed and copied at the SEC’s public reference room in Washington, D.C. (call 1-800-732-0330 for information on the operation of the public reference room).
Proxy Voting. From time to time, funds are required to vote proxies related to the securities held by the funds. The Eaton Vance Funds or their underlying Portfolios (if applicable) vote proxies according to a set of policies and procedures approved by the Funds’ and Portfolios’ Boards. You may obtain a description of these policies and procedures and information on how the Funds or Portfolios voted proxies relating to portfolio securities during the most recent 12-month period ended June 30, without charge, upon request, by calling 1-800-262-1122 and by accessing the SEC’s website at www.sec.gov.
This Page Intentionally Left Blank
Investment Adviser and Administrator
Eaton Vance Management
Two International Place
Boston, MA 02110
Sub-Adviser
Parametric Portfolio Associates LLC
1918 Eighth Avenue, Suite 3100
Seattle, WA 98101
Principal Underwriter*
Eaton Vance Distributors, Inc.
Two International Place
Boston, MA 02110
(617) 482-8260
Custodian
State Street Bank and Trust Company
200 Clarendon Street
Boston, MA 02116
Transfer Agent
BNY Mellon Asset Servicing (US) Inc.
Attn: Eaton Vance Funds
P.O. Box 9653
Providence, RI 02940-9653
(800) 262-1122
Independent Registered Public Accounting Firm
Deloitte & Touche LLP
200 Berkeley Street
Boston, MA 02116-5022
Fund Offices
Two International Place
Boston, MA 02110
| * | FINRA BrokerCheck. Investors may check the background of their Investment Professional by contacting the Financial Industry Regulatory Authority (FINRA). FINRA BrokerCheck is a free tool to help investors check the professional background of current and former FINRA-registered securities firms and brokers. FINRA BrokerCheck is available by calling 1-800-289-9999 and at www.FINRA.org. The FINRA BrokerCheck brochure describing the program is available to investors at www.FINRA.org. |

| | |
Parametric Global Small-Cap Fund Annual Report January 31, 2013 | | |

Fund shares are not insured by the FDIC and are not deposits or other obligations of, or guaranteed by, any depository institution. Shares are subject to investment risks, including possible loss of principal invested.
This report must be preceded or accompanied by a current summary prospectus or prospectus. Before investing, investors should consider carefully the investment objective, risks, and charges and expenses of a mutual fund. This and other important information is contained in the summary prospectus and prospectus, which can be obtained from a financial advisor. Prospective investors should read the prospectus carefully before investing. For further information, please call 1-800-262-1122.
Annual Report January 31, 2013
Eaton Vance
Parametric Global Small-Cap Fund
Table of Contents
| | | | |
Management’s Discussion of Fund Performance | | | 2 | |
| |
Performance | | | 3 | |
| |
Fund Profile | | | 4 | |
| |
Endnotes and Additional Disclosures | | | 5 | |
| |
Fund Expenses | | | 6 | |
| |
Financial Statements | | | 7 | |
| |
Report of Independent Registered Public Accounting Firm | | | 25 | |
| |
Federal Tax Information | | | 26 | |
| |
Board of Trustees’ Contract Approval | | | 27 | |
| |
Management and Organization | | | 30 | |
| |
Important Notices | | | 32 | |
Eaton Vance
Parametric Global Small-Cap Fund
January 31, 2013
Management’s Discussion of Fund Performance1
Economic and Market Conditions
Although the fourth quarter of 2012 began on a down note due to investor concerns about China’s growth rate, the U.S. presidential election and the rancor associated with the so-called “fiscal cliff” in the United States, global small-cap stocks gained ground and finished the year on a strong note. The momentum more or less continued through the first month of the new year. Global equity markets, as measured by the Russell Global 2000 Index (the Index)2, rose in January 2013, which was generally characterized by a more upbeat mood throughout the eurozone. Risk assets, including small-cap stocks, were supported by renewed investor optimism. However, sentiment was not meaningfully boosted by mounting hopes for a broad-based global economic expansion. Instead, equity markets appeared to be lifted by investor confidence in the perceived ability of politicians to circumvent disasters, the power of the world’s major central banks and reaccelerating economic growth in China. Despite the renewed optimism, however, a number of global risks remained as of the end of the reporting period.
Fund Performance
For the period from the Fund’s inception on December 20, 2012 through January 31, 2013, Parametric Global Small-Cap Fund (the Fund) had a total return of 4.24% for Class I shares, underperforming the 4.79% return of the Fund’s benchmark, the Russell Global 2000 Index.
In terms of country allocations, contributors to the Fund’s performance relative to the Index for the period included the Fund’s overweights to Italy and Thailand, both of which outperformed the Index. By contrast, the Fund’s underweight to the United States, which outperformed the Index, detracted from Fund performance relative to the Index. On a sector basis, the Fund’s overweight to the consumer staples sector, which underperformed the Index during the period, also hurt the Fund’s performance relative to the Index.
See Endnotes and Additional Disclosures in this report.
Past performance is no guarantee of future results. Returns are historical and are calculated by determining the percentage change in net asset value (NAV) or offering price (as applicable) with all distributions reinvested. Investment return and principal value will fluctuate so that shares, when redeemed, may be worth more or less than their original cost. Performance less than one year is cumulative. Performance is for the stated time period only; due to market volatility, the Fund’s current performance may be lower or higher than quoted. Returns are before taxes unless otherwise noted. For performance as of the most recent month end, please refer to www.eatonvance.com.
Eaton Vance
Parametric Global Small-Cap Fund
January 31, 2013
Performance2
Portfolio Managers David Stein, Ph.D. and Thomas Seto, each of Parametric Portfolio Associates LLC
| | | | | | | | |
| % Cumulative Total Returns | | Inception Date | | | Since Inception | |
Class I | | | 12/20/2012 | | | | 4.24 | % |
Russell Global 2000 Index | | | 12/20/2012 | | | | 4.79 | % |
| | |
| | | | | | | | |
| % Total Annual Operating Expense Ratios3 | | | | | Class I | |
Gross | | | | | | | 1.00 | % |
Net | | | | | | | 0.85 | |
A line graph is not included since the Fund has less than six months of performance.
See Endnotes and Additional Disclosures in this report.
Past performance is no guarantee of future results. Returns are historical and are calculated by determining the percentage change in net asset value (NAV) or offering price (as applicable) with all distributions reinvested. Investment return and principal value will fluctuate so that shares, when redeemed, may be worth more or less than their original cost. Performance less than one year is cumulative. Performance is for the stated time period only; due to market volatility, the Fund’s current performance may be lower or higher than quoted. Returns are before taxes unless otherwise noted. For performance as of the most recent month end, please refer to www.eatonvance.com.
Eaton Vance
Parametric Global Small-Cap Fund
January 31, 2013
Fund Profile
Top 10 Holdings (% of net assets)5
| | | | | | |
iShares MSCI Brazil Index Fund | | | 1.5 | % | | |
iShares MSCI Chile Investable Market Index Fund | | | 1.5 | | | |
iShares MSCI ACWI Index Fund | | | 0.6 | | | |
China Gas Holdings, Ltd. | | | 0.4 | | | |
Motor Oil (Hellas) Corinth Refineries SA | | | 0.4 | | | |
Pandora A/S | | | 0.3 | | | |
Bangkok Dusit Medical Services PCL | | | 0.3 | | | |
Kaken Pharmaceutical Co., Ltd. | | | 0.3 | | | |
Giordano International, Ltd. | | | 0.3 | | | |
Auckland International Airport, Ltd. | | | 0.3 | | | |
Total | | | 5.9 | % | | |
See Endnotes and Additional Disclosures in this report.
Eaton Vance
Parametric Global Small-Cap Fund
January 31, 2013
Endnotes and Additional Disclosures
| 1 | The views expressed in this report are those of the portfolio manager(s) and are current only through the date stated at the top of this page. These views are subject to change at any time based upon market or other conditions, and Eaton Vance and the Fund(s) disclaim any responsibility to update such views. These views may not be relied upon as investment advice and, because investment decisions are based on many factors, may not be relied upon as an indication of trading intent on behalf of any Eaton Vance fund. This commentary may contain statements that are not historical facts, referred to as “forward looking statements”. The Fund’s actual future results may differ significantly from those stated in any forward looking statement, depending on factors such as changes in securities or financial markets or general economic conditions, the volume of sales and purchases of Fund shares, the continuation of investment advisory, administrative and service contracts, and other risks discussed from time to time in the Fund’s filings with the Securities and Exchange Commission. |
| 2 | Russell Global 2000 Index is an unmanaged index of 2,000 companies located in the United States, and other developed and emerging markets countries. Unless otherwise stated, index returns do not reflect the effect of any applicable sales charges, commissions, expenses, taxes or leverage, as applicable. It is not possible to invest directly in an index. |
| 3 | Source: Fund prospectus. Net expense ratio reflects a contractual expense reimbursement that continues through 5/31/14. Without the reimbursement, performance would have been lower. |
| 4 | The Fund may obtain exposure to certain market segments through investments in Exchange-Traded Funds (ETFs). For purposes of the charts, allocations with respect to the Fund’s investments in ETFs are based on the portfolio composition of each ETF as of the Fund’s report date. |
| 5 | Excludes cash and cash equivalents. |
| | Fund profile subject to change due to active management. |
| | Important Notice to Shareholders |
| | Effective March 1, 2013, Class I shares of the Fund were renamed Institutional Class. The minimum initial purchase of Institutional Class shares of the Fund was changed to $50,000 (waived in certain circumstances). |
Parametric Global Small-Cap Fund
January 31, 2013
Fund Expenses
Example: As a Fund shareholder, you incur two types of costs: (1) transaction costs, including sales charges (loads) on purchases and redemption fees (if applicable); and (2) ongoing costs, including management fees; distribution and/or service fees; and other Fund expenses. This Example is intended to help you understand your ongoing costs (in dollars) of Fund investing and to compare these costs with the ongoing costs of investing in other mutual funds. The actual expense Example is based on an investment of $1,000 invested at the beginning of the period and held for the entire period (December 20, 2012 – January 31, 2013). The hypothetical expense Example is based on an investment of $1,000 invested for the one-half year period (August 1, 2012 – January 31, 2013).
Actual Expenses: The first section of the table below provides information about actual account values and actual expenses. You may use the information in this section, together with the amount you invested, to estimate the expenses that you paid over the period. Simply divide your account value by $1,000 (for example, an $8,600 account value divided by $1,000 = 8.6), then multiply the result by the number in the first section under the heading entitled “Expenses Paid During Period” to estimate the expenses you paid on your account during this period.
Hypothetical Example for Comparison Purposes: The second section of the table below provides information about hypothetical account values and hypothetical expenses based on the actual Fund expense ratio and an assumed rate of return of 5% per year (before expenses), which is not the actual Fund return. The hypothetical account values and expenses may not be used to estimate the actual ending account balance or expenses you paid for the period. You may use this information to compare the ongoing costs of investing in your Fund and other funds. To do so, compare this 5% hypothetical example with the 5% hypothetical examples that appear in the shareholder reports of the other funds.
Please note that the expenses shown in the table are meant to highlight your ongoing costs only and do not reflect any transactional costs, such as sales charges (loads) or redemption fees (if applicable). Therefore, the second section of the table is useful in comparing ongoing costs only, and will not help you determine the relative total costs of owning different funds. In addition, if these transactional costs were included, your costs would be higher.
| | | | | | | | | | | | | | | | | | |
| | | Beginning
Account Value
(12/20/12) | | | Ending
Account Value
(1/31/13) | | | Expenses Paid
During Period
(12/20/12 – 1/31/13) | | | Annualized
Expense
Ratio | | | |
| | | | | |
| | | | | | | | | | | | | | | | | | |
Actual* | | | | | | | | | | | | | | | |
Class I | | $ | 1,000.00 | | | $ | 1,042.40 | | | $ | 1.02 | *** | | | 0.85 | % | | |
| | | | | |
| | | | | | | | | | | | | | | | | | |
* The Fund had not commenced operations on August 1, 2012. Actual expenses are equal to the Fund’s annualized expense ratio for the indicated Class, multiplied by the average account value over the period, multiplied by 43/366 (to reflect the period from commencement of operations on December 20, 2012 to January 31, 2013). The Example assumes that the $1,000 was invested at the net asset value per share determined at the opening of business on December 20, 2012. |
| | | | | |
| | | | | | | | | | | | | | | | | | |
| | | Beginning
Account Value
(8/1/12) | | | Ending
Account Value
(1/31/13) | | | Expenses Paid
During Period
(8/1/12 – 1/31/13) | | | Annualized
Expense
Ratio | | | |
| | | | | |
| | | | | | | | | | | | | | | | | | |
Hypothetical** | | | | | | | | | | | | | | | |
(5% return per year before expenses) | | | | | | | | | | | | | | | |
Class I | | $ | 1,000.00 | | | $ | 1,020.90 | | | $ | 4.32 | *** | | | 0.85 | % | | |
| ** | Hypothetical expenses are equal to the Fund’s annualized expense ratio for the indicated Class, multiplied by the average account value over the period, multiplied by 184/366 (to reflect the one-half year period). The Example assumes that the $1,000 was invested at the net asset value per share determined at the opening of business on December 20, 2012. |
| *** | Absent an allocation of certain expenses to affiliates, the expenses would be higher. |
Parametric Global Small-Cap Fund
January 31, 2013
Portfolio of Investments
| | | | | | | | |
| Common Stocks — 93.5% | |
| | |
| | | | | | | | |
| Security | | Shares | | | Value | |
| | | | | | | | |
|
Australia — 2.2% | |
Adelaide Brighton, Ltd. | | | 1,852 | | | $ | 6,548 | |
Ansell, Ltd. | | | 599 | | | | 10,720 | |
Aurora Oil & Gas, Ltd.(1) | | | 2,288 | | | | 9,053 | |
Beach Energy, Ltd. | | | 6,515 | | | | 9,706 | |
Brickworks, Ltd. | | | 742 | | | | 9,759 | |
carsales.com, Ltd. | | | 1,058 | | | | 9,794 | |
DUET Group | | | 4,931 | | | | 11,311 | |
DuluxGroup, Ltd. | | | 2,698 | | | | 11,599 | |
Investa Office Fund | | | 2,551 | | | | 8,072 | |
Iress, Ltd. | | | 721 | | | | 6,301 | |
Regis Resources, Ltd.(1) | | | 1,971 | | | | 10,716 | |
TPG Telecom, Ltd. | | | 3,821 | | | | 10,880 | |
| | | | | | | | | |
| | | | | | $ | 114,459 | |
| | | | | | | | | |
|
Austria — 1.4% | |
AMAG Austria Metall AG(1)(2) | | | 220 | | | $ | 7,203 | |
ams AG | | | 92 | | | | 11,318 | |
CA Immobilien Anlagen AG(1) | | | 551 | | | | 8,215 | |
Conwert Immobilien Invest SE(1) | | | 792 | | | | 10,734 | |
Kapsch TrafficCom AG | | | 97 | | | | 6,023 | |
RHI AG | | | 324 | | | | 11,866 | |
Schoeller-Bleckmann Oilfield Equipment AG | | | 102 | | | | 10,219 | |
Wienerberger AG | | | 758 | | | | 7,752 | |
| | | | | | | | | |
| | | | | | $ | 73,330 | |
| | | | | | | | | |
|
Belgium — 1.2% | |
Befimmo SCA Sicafi | | | 172 | | | $ | 12,025 | |
Cofinimmo | | | 115 | | | | 13,899 | |
EVS Broadcast Equipment SA | | | 129 | | | | 7,695 | |
Gimv NV | | | 160 | | | | 8,879 | |
Tessenderlo Chemie NV | | | 267 | | | | 9,296 | |
ThromboGenics NV(1) | | | 220 | | | | 11,461 | |
| | | | | | | | | |
| | | | | | $ | 63,255 | |
| | | | | | | | | |
|
Canada — 3.9% | |
Alamos Gold, Inc. | | | 341 | | | $ | 5,241 | |
AltaGas, Ltd. | | | 390 | | | | 13,807 | |
Birchcliff Energy, Ltd.(1) | | | 938 | | | | 6,865 | |
Bonterra Energy Corp. | | | 165 | | | | 7,816 | |
Canfor Corp.(1) | | | 371 | | | | 6,837 | |
Capital Power Corp. | | | 417 | | | | 9,700 | |
CCL Industries, Inc. | | | 178 | | | | 9,517 | |
Celtic Exploration, Ltd.(1) | | | 402 | | | | 10,709 | |
| | | | | | | | |
| Security | | Shares | | | Value | |
| | | | | | | | |
|
Canada (continued) | |
Cineplex, Inc. | | | 190 | | | $ | 6,096 | |
Dollarama, Inc. | | | 154 | | | | 9,369 | |
Freehold Royalties, Ltd. | | | 593 | | | | 13,734 | |
Gibson Energy, Inc. | | | 449 | | | | 11,308 | |
Imperial Metals Corp.(1) | | | 684 | | | | 9,203 | |
MacDonald Dettwiler & Associates, Ltd. | | | 183 | | | | 11,508 | |
Mullen Group, Ltd. | | | 459 | | | | 10,571 | |
North West Co., Inc. (The) | | | 352 | | | | 8,166 | |
Northland Power, Inc. | | | 529 | | | | 10,369 | |
Paramount Resources, Ltd., Class A(1) | | | 312 | | | | 10,135 | |
Pason Systems, Inc. | | | 639 | | | | 10,898 | |
ShawCor, Ltd., Class A | | | 321 | | | | 12,906 | |
Sunshine Oilsands, Ltd.(1) | | | 18,000 | | | | 7,360 | |
| | | | | | | | | |
| | | | | | $ | 202,115 | |
| | | | | | | | | |
|
Chile — 0.6% | |
Banco Santander Chile SA ADR | | | 350 | | | $ | 10,570 | |
Latam Airlines Group SA ADR | | | 430 | | | | 10,531 | |
Sociedad Quimica y Minera de Chile SA, Series B ADR | | | 175 | | | | 9,947 | |
| | | | | | | | | |
| | | | | | $ | 31,048 | |
| | | | | | | | | |
|
China — 3.0% | |
Beijing Enterprises Water Group, Ltd. | | | 44,000 | | | $ | 10,944 | |
China Foods, Ltd. | | | 8,000 | | | | 6,936 | |
China Gas Holdings, Ltd. | | | 22,000 | | | | 19,160 | |
China Medical System Holdings, Ltd. | | | 14,000 | | | | 12,025 | |
China Power International Development, Ltd. | | | 19,000 | | | | 6,860 | |
China Resources Gas Group, Ltd. | | | 6,000 | | | | 13,335 | |
Dah Chong Hong Holdings, Ltd. | | | 5,000 | | | | 5,793 | |
Daphne International Holdings, Ltd. | | | 6,000 | | | | 7,732 | |
Digital China Holdings, Ltd. | | | 4,000 | | | | 6,463 | |
Shenguan Holdings Group, Ltd. | | | 10,000 | | | | 5,288 | |
Sino Biopharmaceutical, Ltd. | | | 24,000 | | | | 11,976 | |
Sinopec Kantons Holdings, Ltd. | | | 10,000 | | | | 8,496 | |
Towngas China Co., Ltd. | | | 11,000 | | | | 9,077 | |
Uni-President China Holdings, Ltd. | | | 8,000 | | | | 9,386 | |
Vinda International Holdings, Ltd. | | | 7,000 | | | | 9,680 | |
Yingde Gases Group Co. | | | 9,500 | | | | 10,682 | |
| | | | | | | | | |
| | | | | | $ | 153,833 | |
| | | | | | | | | |
|
Denmark — 1.1% | |
D/S Norden A/S | | | 287 | | | $ | 8,812 | |
GN Store Norden A/S | | | 748 | | | | 12,171 | |
NKT Holding A/S | | | 220 | | | | 7,779 | |
| | | | |
| | 7 | | See Notes to Financial Statements. |
Parametric Global Small-Cap Fund
January 31, 2013
Portfolio of Investments — continued
| | | | | | | | |
| Security | | Shares | | | Value | |
| | | | | | | | |
|
Denmark (continued) | |
Pandora A/S | | | 705 | | | $ | 17,421 | |
Vestas Wind Systems A/S(1) | | | 1,767 | | | | 10,713 | |
| | | | | | | | | |
| | | | | | $ | 56,896 | |
| | | | | | | | | |
|
Finland — 2.0% | |
Amer Sports Oyj | | | 790 | | | $ | 12,584 | |
Huhtamaki Oyj | | | 655 | | | | 11,888 | |
Kemira Oyj | | | 790 | | | | 12,515 | |
Konecranes Oyj | | | 244 | | | | 8,207 | |
Outotec Oyj | | | 208 | | | | 13,083 | |
Ramirent Oyj | | | 1,179 | | | | 11,450 | |
Tieto Oyj | | | 591 | | | | 13,144 | |
Tikkurila Oyj | | | 516 | | | | 11,035 | |
Uponor Oyj | | | 742 | | | | 10,389 | |
| | | | | | | | | |
| | | | | | $ | 104,295 | |
| | | | | | | | | |
|
France — 2.1% | |
Air France-KLM(1) | | | 1,375 | | | $ | 14,950 | |
Alten SA | | | 168 | | | | 6,457 | |
Eurofins Scientific | | | 67 | | | | 11,969 | |
Havas SA | | | 1,085 | | | | 7,102 | |
Ingenico | | | 191 | | | | 12,040 | |
IPSOS | | | 159 | | | | 6,338 | |
Medica SA | | | 311 | | | | 5,923 | |
Orpea | | | 196 | | | | 8,360 | |
Rubis SCA | | | 174 | | | | 12,606 | |
UBISOFT Entertainment(1) | | | 575 | | | | 5,547 | |
Vilmorin & Cie | | | 60 | | | | 7,910 | |
Virbac SA | | | 49 | | | | 10,966 | |
| | | | | | | | | |
| | | | | | $ | 110,168 | |
| | | | | | | | | |
|
Germany — 2.6% | |
BayWa AG | | | 140 | | | $ | 6,979 | |
Carl Zeiss Meditec AG | | | 305 | | | | 9,959 | |
Deutsche EuroShop AG | | | 269 | | | | 11,452 | |
Deutsche Wohnen AG | | | 308 | | | | 5,930 | |
Dialog Semiconductor PLC(1) | | | 333 | | | | 5,938 | |
Duerr AG | | | 135 | | | | 13,209 | |
Freenet AG | | | 625 | | | | 13,460 | |
Gerry Weber International AG | | | 239 | | | | 11,610 | |
Gildemeister AG | | | 546 | | | | 13,450 | |
GSW Immobilien AG | | | 180 | | | | 7,681 | |
KWS Saat AG | | | 30 | | | | 11,134 | |
Pfeiffer Vacuum Technology AG | | | 51 | | | | 6,354 | |
| | | | | | | | |
| Security | | Shares | | | Value | |
| | | | | | | | |
|
Germany (continued) | |
Vossloh AG | | | 59 | | | $ | 6,141 | |
Wirecard AG | | | 458 | | | | 10,433 | |
| | | | | | | | | |
| | | | | | $ | 133,730 | |
| | | | | | | | | |
|
Greece — 0.9% | |
Hellenic Telecommunications Organization SA(1) | | | 1,047 | | | $ | 8,803 | |
JUMBO SA(1) | | | 1,355 | | | | 11,736 | |
Motor Oil (Hellas) Corinth Refineries SA | | | 1,587 | | | | 18,314 | |
Titan Cement Co. SA(1) | | | 553 | | | | 9,888 | |
| | | | | | | | | |
| | | | | | $ | 48,741 | |
| | | | | | | | | |
|
Hong Kong — 2.2% | |
Cafe De Coral Holdings, Ltd. | | | 4,000 | | | $ | 12,229 | |
Giordano International, Ltd. | | | 16,000 | | | | 16,252 | |
Great Eagle Holdings, Ltd. | | | 2,000 | | | | 7,767 | |
Hutchison Telecommunications Hong Kong Holdings, Ltd. | | | 26,000 | | | | 11,803 | |
Johnson Electric Holdings, Ltd. | | | 15,000 | | | | 10,634 | |
Kowloon Development Co., Ltd. | | | 6,000 | | | | 9,209 | |
SA SA International Holdings, Ltd. | | | 12,000 | | | | 10,832 | |
SmarTone Telecommunication Holdings, Ltd. | | | 5,000 | | | | 8,909 | |
Stella International Holdings, Ltd. | | | 3,500 | | | | 10,068 | |
Techtronic Industries Co. | | | 4,500 | | | | 9,134 | |
Texwinca Holdings, Ltd. | | | 8,000 | | | | 7,547 | |
| | | | | | | | | |
| | | | | | $ | 114,384 | |
| | | | | | | | | |
|
Indonesia — 2.1% | |
Bank Pembangunan Daerah Jawa Barat Dan Banten Tbk PT | | | 74,000 | | | $ | 9,125 | |
Bhakti Investama Tbk PT | | | 190,500 | | | | 9,688 | |
Bumi Serpong Damai Tbk PT | | | 51,000 | | | | 7,338 | |
Gajah Tunggal Tbk PT | | | 26,000 | | | | 6,017 | |
Garuda Indonesia Persero Tbk PT(1) | | | 90,500 | | | | 6,045 | |
Global Mediacom Tbk PT | | | 46,500 | | | | 10,391 | |
Holcim Indonesia Tbk PT | | | 17,500 | | | | 5,575 | |
Jasa Marga (Persero) Tbk PT | | | 18,000 | | | | 10,160 | |
Lippo Karawaci Tbk PT | | | 105,000 | | | | 11,112 | |
Mayora Indah Tbk PT | | | 5,500 | | | | 11,620 | |
Media Nusantara Citra Tbk PT | | | 29,500 | | | | 7,201 | |
Tower Bersama Infrastructure Tbk PT(1) | | | 20,500 | | | | 12,416 | |
| | | | | | | | | |
| | | $ | 106,688 | |
| | | | | | | | | |
|
Ireland — 1.7% | |
C&C Group PLC | | | 2,151 | | | $ | 14,026 | |
DCC PLC | | | 377 | | | | 12,340 | |
Glanbia PLC | | | 1,127 | | | | 12,582 | |
| | | | |
| | 8 | | See Notes to Financial Statements. |
Parametric Global Small-Cap Fund
January 31, 2013
Portfolio of Investments — continued
| | | | | | | | |
| Security | | Shares | | | Value | |
| | | | | | | | |
|
Ireland (continued) | |
Grafton Group PLC | | | 2,347 | | | $ | 13,757 | |
Icon PLC(1) | | | 433 | | | | 12,691 | |
Kingspan Group PLC | | | 970 | | | | 11,248 | |
Paddy Power PLC | | | 165 | | | | 13,675 | |
| | | | | | | | | |
| | | $ | 90,319 | |
| | | | | | | | | |
|
Israel — 1.7% | |
EZchip Semiconductor, Ltd.(1) | | | 318 | | | $ | 9,619 | |
Gazit-Globe, Ltd. | | | 830 | | | | 10,630 | |
Mellanox Technologies, Ltd.(1) | | | 144 | | | | 7,314 | |
Migdal Insurance & Financial Holdings, Ltd. | | | 3,773 | | | | 5,517 | |
Mizrahi Tefahot Bank, Ltd.(1) | | | 1,245 | | | | 13,183 | |
Oil Refineries, Ltd.(1) | | | 12,316 | | | | 6,319 | |
Osem Investment, Ltd. | | | 588 | | | | 9,726 | |
Paz Oil Co., Ltd.(1) | | | 77 | | | | 11,495 | |
RADWARE, Ltd.(1) | | | 300 | | | | 10,911 | |
Strauss Group, Ltd. | | | 470 | | | | 5,837 | |
| | | | | | | | | |
| | | $ | 90,551 | |
| | | | | | | | | |
|
Italy — 2.5% | |
Amplifon SpA | | | 1,250 | | | $ | 6,676 | |
Ansaldo STS SpA | | | 1,091 | | | | 11,231 | |
Azimut Holding SpA | | | 773 | | | | 13,597 | |
Banca Generali SpA | | | 359 | | | | 6,881 | |
Brunello Cucinelli SpA(1) | | | 340 | | | | 6,832 | |
De’Longhi SpA | | | 554 | | | | 8,947 | |
DiaSorin SpA | | | 288 | | | | 11,237 | |
ERG SpA | | | 683 | | | | 6,686 | |
Gemina SpA(1) | | | 7,633 | | | | 13,148 | |
Impregilo SpA | | | 1,891 | | | | 9,808 | |
Piaggio & C. SpA | | | 2,211 | | | | 6,051 | |
Recordati SpA | | | 1,139 | | | | 11,659 | |
Saras SpA(1) | | | 4,889 | | | | 6,584 | |
Sorin SpA(1) | | | 3,432 | | | | 8,759 | |
| | | | | | | | | |
| | | $ | 128,096 | |
| | | | | | | | | |
|
Japan — 6.4% | |
Aica Kogyo Co., Ltd. | | | 600 | | | $ | 9,969 | |
Autobacs Seven Co., Ltd. | | | 200 | | | | 8,136 | |
Awa Bank, Ltd. (The) | | | 2,000 | | | | 12,150 | |
Calbee, Inc. | | | 100 | | | | 8,231 | |
FP Corp. | | | 200 | | | | 12,898 | |
Hitachi Transport System, Ltd. | | | 500 | | | | 7,572 | |
Hokkoku Bank, Ltd. (The) | | | 2,000 | | | | 8,222 | |
Hokuetsu Kishu Paper Co., Ltd. | | | 1,500 | | | | 7,659 | |
| | | | | | | | |
| Security | | Shares | | | Value | |
| | | | | | | | |
|
Japan (continued) | |
Hoshizaki Electric Co., Ltd. | | | 400 | | | $ | 11,894 | |
Ito En, Ltd. | | | 400 | | | | 7,770 | |
Itoham Foods, Inc. | | | 2,000 | | | | 9,064 | |
Japan Exchange Group, Inc. | | | 100 | | | | 6,004 | |
Kagome Co., Ltd. | | | 400 | | | | 7,462 | |
Kakaku.com, Inc. | | | 200 | | | | 7,465 | |
Kaken Pharmaceutical Co., Ltd. | | | 1,000 | | | | 16,410 | |
Kewpie Corp. | | | 500 | | | | 6,645 | |
Kissei Pharmaceutical Co., Ltd | | | 500 | | | | 9,415 | |
Kobayashi Pharmaceutical Co., Ltd. | | | 300 | | | | 14,639 | |
Kose Corp. | | | 300 | | | | 6,320 | |
Lion Corp. | | | 2,000 | | | | 9,581 | |
M3, Inc. | | | 4 | | | | 6,529 | |
Miraca Holdings, Inc. | | | 300 | | | | 12,508 | |
Mochida Pharmaceutical Co., Ltd. | | | 1,000 | | | | 12,829 | |
Musashino Bank, Ltd. (The) | | | 300 | | | | 10,260 | |
Nihon Kohden Corp. | | | 200 | | | | 6,366 | |
Nippon Kayaku Co., Ltd. | | | 1,000 | | | | 11,296 | |
Nissan Shatai Co., Ltd. | | | 1,000 | | | | 12,454 | |
Noritz Corp. | | | 400 | | | | 7,173 | |
Obic Co., Ltd. | | | 30 | | | | 6,417 | |
Otsuka Corp. | | | 100 | | | | 8,186 | |
Point, Inc. | | | 170 | | | | 5,857 | |
Pola Orbis Holdings, Inc. | | | 200 | | | | 6,088 | |
Ryohin Keikaku Co., Ltd. | | | 100 | | | | 5,664 | |
Sawai Pharmaceutical Co., Ltd. | | | 100 | | | | 10,259 | |
Shimachu Co., Ltd. | | | 200 | | | | 4,232 | |
Sugi Holdings Co., Ltd. | | | 200 | | | | 6,858 | |
Sumitomo Osaka Cement Co., Ltd. | | | 1,000 | | | | 3,349 | |
Sundrug Co., Ltd. | | | 100 | | | | 3,762 | |
Towa Pharmaceutical Co., Ltd. | | | 100 | | | | 5,332 | |
| | | | | | | | | |
| | | $ | 332,925 | |
| | | | | | | | | |
|
Malaysia — 1.8% | |
Alliance Financial Group Bhd | | | 8,800 | | | $ | 12,095 | |
Berjaya Sports Toto Bhd | | | 7,360 | | | | 10,308 | |
Boustead Holdings Bhd | | | 5,300 | | | | 8,256 | |
Dialog Group Bhd | | | 12,700 | | | | 9,444 | |
Genting Plantations Bhd | | | 2,600 | | | | 6,892 | |
HAP Seng Consolidated Bhd | | | 11,000 | | | | 5,770 | |
KLCC Property Holdings Bhd | | | 3,300 | | | | 6,679 | |
Kulim (Malaysia) Bhd | | | 4,500 | | | | 5,220 | |
Lafarge Malayan Cement Bhd | | | 2,700 | | | | 8,074 | |
Malaysia Airports Holdings Bhd | | | 3,600 | | | | 6,387 | |
| | | | |
| | 9 | | See Notes to Financial Statements. |
Parametric Global Small-Cap Fund
January 31, 2013
Portfolio of Investments — continued
| | | | | | | | |
| Security | | Shares | | | Value | |
| | | | | | | | |
|
Malaysia (continued) | |
Media Prima Bhd | | | 8,100 | | | $ | 5,813 | |
Oriental Holdings Bhd | | | 2,200 | | | | 5,970 | |
| | | | | | | | | |
| | | $ | 90,908 | |
| | | | | | | | | |
|
Mexico — 1.7% | |
Banregio Grupo Financiero SAB de CV | | | 2,100 | | | $ | 9,905 | |
Bolsa Mexicana de Valores SAB de CV | | | 2,600 | | | | 6,574 | |
Empresas ICA SAB de CV(1) | | | 2,300 | | | | 6,894 | |
Fibra Uno Administracion SA de CV | | | 2,200 | | | | 6,880 | |
Genomma Lab Internacional SA de CV(1) | | | 3,600 | | | | 8,222 | |
Grupo Aeroportuario del Pacifico SAB de CV, Class B | | | 2,200 | | | | 13,721 | |
Grupo Aeroportuario del Sureste SAB de CV, Class B | | | 900 | | | | 10,751 | |
Grupo Simec SA de CV, Series B(1) | | | 1,300 | | | | 6,472 | |
Industrias CH SAB de CV, Series B(1) | | | 1,300 | | | | 10,756 | |
TV Azteca SAB de CV, Series CPO | | | 6,000 | | | | 4,238 | |
Urbi Desarrollos Urbanos SAB de CV(1) | | | 9,300 | | | | 5,405 | |
| | | | | | | | | |
| | | $ | 89,818 | |
| | | | | | | | | |
|
Netherlands — 1.4% | |
Aalberts Industries NV | | | 653 | | | $ | 14,675 | |
Arcadis NV | | | 537 | | | | 14,123 | |
ASM International NV | | | 168 | | | | 6,696 | |
Brunel International NV | | | 135 | | | | 7,234 | |
InterXion Holding NV(1) | | | 472 | | | | 10,851 | |
TomTom NV(1) | | | 1,687 | | | | 8,749 | |
Unit4 NV | | | 337 | | | | 11,277 | |
| | | | | | | | | |
| | | $ | 73,605 | |
| | | | | | | | | |
|
New Zealand — 1.2% | |
Auckland International Airport, Ltd. | | | 6,343 | | | $ | 15,098 | |
Fisher & Paykel Healthcare Corp., Ltd. | | | 5,269 | | | | 10,534 | |
Ryman Healthcare, Ltd. | | | 3,176 | | | | 12,289 | |
Sky Network Television, Ltd. | | | 2,378 | | | | 10,339 | |
SKYCITY Entertainment Group, Ltd. | | | 3,057 | | | | 10,186 | |
Trade Me, Ltd. | | | 1,790 | | | | 6,279 | |
| | | | | | | | | |
| | | $ | 64,725 | |
| | | | | | | | | |
|
Norway — 1.5% | |
Atea ASA | | | 708 | | | $ | 8,411 | |
BW Offshore, Ltd. | | | 6,837 | | | | 7,049 | |
Cermaq ASA(1) | | | 543 | | | | 9,336 | |
Det Norske Oljeselskap ASA(1) | | | 652 | | | | 10,227 | |
DNO International ASA(1) | | | 4,903 | | | | 8,367 | |
Nordic American Tankers, Ltd. | | | 661 | | | | 5,711 | |
SpareBank 1 SR-Bank ASA | | | 1,373 | | | | 10,551 | |
| | | | | | | | |
| Security | | Shares | | | Value | |
| | | | | | | | |
|
Norway (continued) | |
Tomra Systems ASA | | | 1,323 | | | $ | 11,258 | |
Wilh. Wilhelmsen ASA | | | 926 | | | | 8,816 | |
| | | | | | | | | |
| | | $ | 79,726 | |
| | | | | | | | | |
|
Poland — 1.2% | |
Asseco Poland SA | | | 734 | | | $ | 10,683 | |
Bank Millennium SA(1) | | | 4,206 | | | | 6,217 | |
Eurocash SA | | | 469 | | | | 7,641 | |
Grupa Lotos SA(1) | | | 618 | | | | 8,005 | |
LPP SA | | | 8 | | | | 12,544 | |
Lubelski Wegiel Bogdanka SA | | | 272 | | | | 12,028 | |
Synthos SA | | | 3,951 | | | | 6,706 | |
| | | | | | | | | |
| | | $ | 63,824 | |
| | | | | | | | | |
|
Portugal — 0.4% | |
Banco Comercial Portugues SA(1) | | | 58,938 | | | $ | 7,937 | |
Sonae | | | 7,445 | | | | 7,373 | |
Zon Multimedia Servicos de Telecomunicacoes e Multimedia SGPS SA | | | 1,670 | | | | 7,145 | |
| | | | | | | | | |
| | | $ | 22,455 | |
| | | | | | | | | |
|
Russia — 0.5% | |
Acron JSC | | | 130 | | | $ | 6,179 | |
Etalon Group, Ltd. GDR(1)(3) | | | 1,138 | | | | 5,619 | |
OAO OGK-2 | | | 525,390 | | | | 7,101 | |
PIK Group GDR(1)(3) | | | 3,180 | | | | 6,885 | |
| | | | | | | | | |
| | | $ | 25,784 | |
| | | | | | | | | |
|
Singapore — 2.4% | |
ARA Asset Management, Ltd. | | | 4,000 | | | $ | 5,526 | |
Ascott Residence Trust | | | 8,000 | | | | 8,950 | |
CDL Hospitality Trusts | | | 4,000 | | | | 6,525 | |
Hyflux, Ltd. | | | 6,000 | | | | 6,523 | |
Keppel REIT | | | 8,000 | | | | 8,855 | |
M1, Ltd. | | | 4,000 | | | | 8,985 | |
Mapletree Commercial Trust | | | 11,000 | | | | 11,865 | |
Mapletree Industrial Trust | | | 11,000 | | | | 12,179 | |
Mapletree Logistics Trust | | | 12,000 | | | | 11,341 | |
Singapore Post, Ltd. | | | 12,000 | | | | 11,734 | |
Starhill Global REIT | | | 17,000 | | | | 11,608 | |
Suntec Real Estate Investment Trust | | | 6,000 | | | | 8,220 | |
Venture Corp., Ltd. | | | 1,000 | | | | 6,860 | |
Wheelock Properties (Singapore), Ltd. | | | 5,000 | | | | 7,956 | |
| | | | | | | | | |
| | | $ | 127,127 | |
| | | | | | | | | |
| | | | |
| | 10 | | See Notes to Financial Statements. |
Parametric Global Small-Cap Fund
January 31, 2013
Portfolio of Investments — continued
| | | | | | | | |
| Security | | Shares | | | Value | |
| | | | | | | | |
|
South Africa — 1.8% | |
Adcock Ingram Holdings, Ltd. | | | 1,210 | | | $ | 7,763 | |
AECI, Ltd. | | | 1,107 | | | | 10,538 | |
AVI, Ltd. | | | 1,339 | | | | 8,178 | |
DataTec, Ltd. | | | 1,003 | | | | 5,234 | |
Illovo Sugar, Ltd. | | | 1,950 | | | | 6,636 | |
Nampak, Ltd. | | | 3,177 | | | | 11,155 | |
Pick’n Pay Holdings, Ltd. | | | 2,600 | | | | 5,680 | |
Pioneer Foods, Ltd. | | | 834 | | | | 6,081 | |
Reunert, Ltd. | | | 684 | | | | 5,705 | |
Royal Bafokeng Platinum, Ltd.(1) | | | 864 | | | | 5,634 | |
Spar Group, Ltd. (The) | | | 533 | | | | 7,012 | |
Sun International, Ltd. | | | 535 | | | | 6,131 | |
Tongaat-Hulett | | | 392 | | | | 6,107 | |
| | | | | | | | | |
| | | $ | 91,854 | |
| | | | | | | | | |
|
South Korea — 2.8% | |
AMOREPACIFIC Group, Inc. | | | 25 | | | $ | 9,457 | |
Cheil Worldwide, Inc. | | | 380 | | | | 7,820 | |
Daum Communications Corp. | | | 107 | | | | 10,034 | |
Grand Korea Leisure Co., Ltd. | | | 210 | | | | 5,929 | |
Green Cross Corp. | | | 60 | | | | 7,745 | |
GS Retail Co., Ltd. | | | 220 | | | | 5,542 | |
Hotel Shilla Co., Ltd. | | | 210 | | | | 8,850 | |
Hyundai Greenfood Co., Ltd. | | | 400 | | | | 6,042 | |
Hyundai Home Shopping Network Corp. | | | 65 | | | | 8,236 | |
Korean Reinsurance Co. | | | 600 | | | | 6,303 | |
Lock & Lock Co., Ltd. | | | 270 | | | | 6,700 | |
Lotte Chilsung Beverage Co., Ltd. | | | 5 | | | | 6,670 | |
Nong Shim Co., Ltd. | | | 25 | | | | 6,400 | |
ORION Corp. | | | 12 | | | | 11,216 | |
Paradise Co., Ltd. | | | 544 | | | | 9,594 | |
SK Broadband Co., Ltd.(1) | | | 1,803 | | | | 8,105 | |
SK Chemicals Co., Ltd. | | | 155 | | | | 8,516 | |
Tongyang Life Insurance | | | 630 | | | | 6,855 | |
Young Poong Corp. | | | 6 | | | | 5,352 | |
| | | | | | | | | |
| | | $ | 145,366 | |
| | | | | | | | | |
|
Spain — 1.5% | |
Abengoa SA, Class B(1) | | | 2,522 | | | $ | 6,756 | |
Almirall SA | | | 611 | | | | 7,555 | |
Antena 3 de Television SA | | | 1,154 | | | | 6,799 | |
Construcciones y Auxiliar de Ferrocarriles SA | | | 18 | | | | 9,014 | |
Duro Felguera SA | | | 977 | | | | 7,094 | |
Grupo Catalana Occidente SA | | | 462 | | | | 9,942 | |
Jazztel PLC(1) | | | 1,602 | | | | 11,011 | |
| | | | | | | | |
| Security | | Shares | | | Value | |
| | | | | | | | |
|
Spain (continued) | |
Melia Hotels International SA | | | 834 | | | $ | 6,809 | |
Viscofan SA | | | 231 | | | | 12,081 | |
| | | | | | | | | |
| | | $ | 77,061 | |
| | | | | | | | | |
|
Sweden — 1.9% | |
AarhusKarlshamn AB | | | 146 | | | $ | 6,214 | |
Axfood AB | | | 305 | | | | 12,618 | |
Axis Communications AB | | | 299 | | | | 7,412 | |
Clas Ohlson AB, Class B | | | 452 | | | | 6,750 | |
Hexpol AB | | | 240 | | | | 13,274 | |
Hufvudstaden AB, Class A | | | 640 | | | | 8,274 | |
Loomis AB, Class B | | | 628 | | | | 10,438 | |
Mekonomen AB | | | 234 | | | | 8,332 | |
Saab AB, Class B | | | 562 | | | | 12,159 | |
Swedish Orphan Biovitrum AB(1) | | | 1,121 | | | | 6,697 | |
Wallenstam AB, Class B | | | 616 | | | | 7,674 | |
| | | | | | | | | |
| | | $ | 99,842 | |
| | | | | | | | | |
|
Switzerland — 2.1% | |
Burckhardt Compression Holdings AG | | | 36 | | | $ | 12,687 | |
EFG International AG(1) | | | 672 | | | | 7,895 | |
Flughafen Zuerich AG | | | 31 | | | | 13,794 | |
Forbo Holding AG(1) | | | 17 | | | | 11,418 | |
Kaba Holding AG(1) | | | 30 | | | | 12,654 | |
Kuoni Reisen Holding AG(1) | | | 21 | | | | 6,383 | |
Meyer Burger Technology AG(1) | | | 775 | | | | 7,211 | |
Mobimo Holding AG(1) | | | 54 | | | | 12,635 | |
Temenos Group AG(1) | | | 699 | | | | 14,308 | |
Vontobel Holding AG | | | 378 | | | | 12,183 | |
| | | | | | | | | |
| | | $ | 111,168 | |
| | | | | | | | | |
|
Taiwan — 2.7% | |
Advantech Co., Ltd. | | | 3,000 | | | $ | 12,557 | |
Chicony Electronics Co., Ltd. | | | 3,000 | | | | 8,313 | |
China Petrochemical Development Corp. | | | 10,000 | | | | 6,155 | |
China Steel Chemical Corp. | | | 3,000 | | | | 14,843 | |
CTCI Corp. | | | 5,000 | | | | 9,582 | |
Giant Manufacturing Co., Ltd. | | | 2,000 | | | | 10,636 | |
Oriental Union Chemical Corp. | | | 7,000 | | | | 8,280 | |
Realtek Semiconductor Corp. | | | 3,000 | | | | 6,723 | |
Senao International Co., Ltd. | | | 2,000 | | | | 6,441 | |
Simplo Technology Co., Ltd. | | | 2,000 | | | | 9,329 | |
Standard Foods Corp. | | | 3,000 | | | | 8,384 | |
Teco Electric & Machinery Co., Ltd. | | | 8,000 | | | | 6,655 | |
Transcend Information, Inc. | | | 3,000 | | | | 8,202 | |
| | | | |
| | 11 | | See Notes to Financial Statements. |
Parametric Global Small-Cap Fund
January 31, 2013
Portfolio of Investments — continued
| | | | | | | | |
| Security | | Shares | | | Value | |
| | | | | | | | |
|
Taiwan (continued) | |
TSRC Corp. | | | 4,000 | | | $ | 8,122 | |
USI Corp. | | | 7,000 | | | | 5,531 | |
Vanguard International Semiconductor Corp. | | | 9,000 | | | | 6,541 | |
WPG Holdings Co., Ltd. | | | 4,000 | | | | 5,390 | |
| | | | | | | | | |
| | | $ | 141,684 | |
| | | | | | | | | |
|
Thailand — 2.1% | |
Bangkok Dusit Medical Services PCL(4) | | | 3,700 | | | $ | 16,496 | |
Berli Jucker PCL(4) | | | 4,500 | | | | 11,316 | |
Central Pattana PCL(4) | | | 3,700 | | | | 10,575 | |
Delta Electronics (Thailand) PCL(4) | | | 5,800 | | | | 6,901 | |
Electricity Generating PCL(4) | | | 2,500 | | | | 12,821 | |
Robinson Department Store PCL(4) | | | 6,100 | | | | 14,309 | |
Siam City Cement PCL(4) | | | 800 | | | | 11,046 | |
Siam Makro PCL(4) | | | 500 | | | | 7,487 | |
Thai Tap Water Supply Co., Ltd.(4) | | | 20,700 | | | | 7,157 | |
Thai Union Frozen Products PCL(4) | | | 3,100 | | | | 7,127 | |
True Corp. PCL(1)(4) | | | 24,400 | | | | 5,403 | |
| | | | | | | | | |
| | | $ | 110,638 | |
| | | | | | | | | |
|
Turkey — 1.3% | |
Aselsan Elektronik Sanayi Ve Ticaret AS | | | 1,359 | | | $ | 6,298 | |
Asya Katilim Bankasi AS(1) | | | 4,925 | | | | 6,246 | |
Aygaz AS | | | 1,376 | | | | 7,755 | |
Petkim Petrokimya Holding AS | | | 4,991 | | | | 8,709 | |
TAV Havalimanlari Holding AS | | | 1,524 | | | | 9,486 | |
Tekfen Holding AS | | | 1,505 | | | | 6,162 | |
Tofas Turk Otomobil Fabrikasi AS | | | 1,218 | | | | 7,349 | |
Turk Traktor ve Ziraat Makineleri AS | | | 222 | | | | 6,248 | |
Yazicilar Holding AS | | | 694 | | | | 6,886 | |
| | | | | | | | | |
| | | $ | 65,139 | |
| | | | | | | | | |
|
United Kingdom — 4.6% | |
Abcam PLC | | | 1,181 | | | $ | 7,293 | |
Aveva Group PLC | | | 265 | | | | 9,081 | |
AZ Electronic Materials SA | | | 1,082 | | | | 6,409 | |
Berkeley Group Holdings PLC(1) | | | 215 | | | | 6,234 | |
Booker Group PLC | | | 5,528 | | | | 9,214 | |
BTG PLC(1) | | | 1,336 | | | | 7,022 | |
Capital & Counties Properties PLC | | | 1,928 | | | | 7,395 | |
De La Rue PLC | | | 456 | | | | 6,512 | |
Domino’s Pizza Group PLC | | | 751 | | | | 6,129 | |
Elementis PLC | | | 1,668 | | | | 5,584 | |
EnQuest PLC(1) | | | 5,473 | | | | 11,212 | |
Fidessa Group PLC | | | 343 | | | | 8,361 | |
| | | | | | | | |
| Security | | Shares | | | Value | |
| | | | | | | | |
|
United Kingdom (continued) | |
Filtrona PLC | | | 1,065 | | | $ | 9,723 | |
Genus PLC | | | 390 | | | | 8,782 | |
Halfords Group PLC | | | 1,065 | | | | 5,754 | |
Hikma Pharmaceuticals PLC | | | 585 | | | | 7,480 | |
Hunting PLC | | | 682 | | | | 9,165 | |
Jardine Lloyd Thompson Group PLC | | | 485 | | | | 6,039 | |
Lancashire Holdings, Ltd. | | | 896 | | | | 11,656 | |
Micro Focus International PLC | | | 872 | | | | 8,435 | |
N Brown Group PLC | | | 997 | | | | 5,831 | |
Rightmove PLC | | | 299 | | | | 7,943 | |
Shaftesbury PLC | | | 439 | | | | 3,844 | |
Soco International PLC(1) | | | 1,980 | | | | 12,003 | |
Stolt-Nielsen, Ltd. | | | 403 | | | | 8,600 | |
Telecity Group PLC | | | 770 | | | | 10,344 | |
Telecom Plus PLC | | | 413 | | | | 6,341 | |
Ultra Electronics Holdings PLC | | | 432 | | | | 11,266 | |
Victrex PLC | | | 227 | | | | 5,512 | |
WH Smith PLC | | | 1,117 | | | | 11,798 | |
| | | | | | | | | |
| | | $ | 240,962 | |
| | | | | | | | | |
|
United States — 23.0% | |
ACI Worldwide, Inc.(1) | | | 141 | | | $ | 6,703 | |
Acorda Therapeutics, Inc.(1) | | | 237 | | | | 6,845 | |
Alaska Air Group, Inc.(1) | | | 259 | | | | 11,948 | |
Alkermes PLC(1) | | | 347 | | | | 7,998 | |
ALLETE, Inc. | | | 236 | | | | 10,889 | |
American Campus Communities, Inc. | | | 212 | | | | 9,873 | |
Anworth Mortgage Asset Corp. | | | 1,600 | | | | 10,016 | |
Arris Group, Inc.(1) | | | 460 | | | | 7,599 | |
Aspen Technology, Inc.(1) | | | 272 | | | | 8,323 | |
Avista Corp. | | | 353 | | | | 9,129 | |
Balchem Corp. | | | 168 | | | | 6,283 | |
Bill Barrett Corp.(1) | | | 297 | | | | 4,743 | |
BJ’s Restaurants, Inc.(1) | | | 171 | | | | 5,467 | |
Black Hills Corp. | | | 297 | | | | 11,984 | |
Blackbaud, Inc. | | | 267 | | | | 6,654 | |
Boston Beer Co., Inc. (The), Class A(1) | | | 55 | | | | 7,719 | |
Bristow Group, Inc. | | | 178 | | | | 10,142 | |
Cabot Microelectronics Corp. | | | 174 | | | | 6,431 | |
CACI International, Inc., Class A(1) | | | 123 | | | | 6,597 | |
Calgon Carbon Corp.(1) | | | 468 | | | | 7,507 | |
Capstead Mortgage Corp. | | | 766 | | | | 9,483 | |
Casey’s General Stores, Inc. | | | 116 | | | | 6,349 | |
Cheesecake Factory, Inc. (The) | | | 179 | | | | 5,936 | |
Children’s Place Retail Stores, Inc. (The)(1) | | | 177 | | | | 8,822 | |
| | | | |
| | 12 | | See Notes to Financial Statements. |
Parametric Global Small-Cap Fund
January 31, 2013
Portfolio of Investments — continued
| | | | | | | | |
| Security | | Shares | | | Value | |
| | | | | | | | |
|
United States (continued) | |
CLARCOR, Inc. | | | 201 | | | $ | 10,142 | |
Cleco Corp. | | | 226 | | | | 9,662 | |
Cloud Peak Energy, Inc.(1) | | | 541 | | | | 9,473 | |
CommVault Systems, Inc.(1) | | | 113 | | | | 8,671 | |
Contango Oil & Gas Co. | | | 155 | | | | 6,654 | |
Convergys Corp. | | | 361 | | | | 6,144 | |
Cracker Barrel Old Country Store, Inc. | | | 93 | | | | 6,028 | |
Cubist Pharmaceuticals, Inc.(1) | | | 219 | | | | 9,426 | |
CYS Investments, Inc. | | | 918 | | | | 11,934 | |
Delek US Holdings, Inc. | | | 269 | | | | 9,138 | |
Dril-Quip, Inc.(1) | | | 90 | | | | 7,298 | |
Eagle Materials, Inc. | | | 167 | | | | 10,817 | |
El Paso Electric Co. | | | 294 | | | | 9,905 | |
First Financial Bankshares, Inc. | | | 180 | | | | 7,391 | |
Forum Energy Technologies, Inc.(1) | | | 242 | | | | 6,173 | |
GNC Holdings, Inc., Class A | | | 223 | | | | 8,015 | |
Gold Resource Corp. | | | 384 | | | | 5,261 | |
Gulfmark Offshore, Inc., Class A | | | 164 | | | | 5,701 | |
Haemonetics Corp.(1) | | | 260 | | | | 10,904 | |
Hain Celestial Group, Inc. (The)(1) | | | 153 | | | | 8,720 | |
Hatteras Financial Corp. | | | 385 | | | | 10,426 | |
Heartland Express, Inc. | | | 469 | | | | 6,486 | |
HeartWare International, Inc.(1) | | | 112 | | | | 10,123 | |
Hibbett Sports, Inc.(1) | | | 111 | | | | 5,845 | |
Hittite Microwave Corp.(1) | | | 97 | | | | 5,954 | |
HMS Holdings Corp.(1) | | | 320 | | | | 8,723 | |
HSN, Inc. | | | 168 | | | | 10,013 | |
IDACORP, Inc. | | | 291 | | | | 13,505 | |
Isis Pharmaceuticals, Inc.(1) | | | 744 | | | | 10,810 | |
J&J Snack Foods Corp. | | | 95 | | | | 6,474 | |
j2 Global, Inc. | | | 311 | | | | 9,896 | |
Jack Henry & Associates, Inc. | | | 322 | | | | 13,357 | |
Jazz Pharmaceuticals PLC(1) | | | 114 | | | | 6,428 | |
JoS. A. Bank Clothiers, Inc.(1) | | | 137 | | | | 5,554 | |
Lancaster Colony Corp. | | | 151 | | | | 10,790 | |
Louisiana-Pacific Corp.(1) | | | 695 | | | | 13,504 | |
Lufkin Industries, Inc. | | | 106 | | | | 6,138 | |
Lumber Liquidators Holdings, Inc.(1) | | | 207 | | | | 12,250 | |
Magellan Health Services, Inc.(1) | | | 142 | | | | 7,285 | |
MAXIMUS, Inc. | | | 186 | | | | 12,754 | |
Medicines Co. (The)(1) | | | 366 | | | | 10,936 | |
Mentor Graphics Corp.(1) | | | 364 | | | | 6,235 | |
MFA Financial, Inc. | | | 1,138 | | | | 10,231 | |
MGE Energy, Inc. | | | 241 | | | | 12,626 | |
Minerals Technologies, Inc. | | | 155 | | | | 6,412 | |
Monro Muffler Brake, Inc. | | | 242 | | | | 8,765 | |
| | | | | | | | |
| Security | | Shares | | | Value | |
| | | | | | | | |
|
United States (continued) | |
Montpelier Re Holdings, Ltd. | | | 269 | | | $ | 6,558 | |
Mueller Industries, Inc. | | | 215 | | | | 11,472 | |
MWI Veterinary Supply, Inc.(1) | | | 80 | | | | 8,985 | |
National Health Investors, Inc. | | | 156 | | | | 9,929 | |
National Retail Properties, Inc. | | | 405 | | | | 12,968 | |
New Jersey Resources Corp. | | | 216 | | | | 9,079 | |
NewMarket Corp. | | | 23 | | | | 5,869 | |
Northwest Bancshares, Inc. | | | 836 | | | | 10,199 | |
Northwest Natural Gas Co. | | | 205 | | | | 9,311 | |
NorthWestern Corp. | | | 260 | | | | 9,617 | |
Nu Skin Enterprises, Inc., Class A | | | 132 | | | | 5,592 | |
Ocwen Financial Corp.(1) | | | 252 | | | | 9,820 | |
Owens & Minor, Inc. | | | 255 | | | | 7,806 | |
PDL BioPharma, Inc. | | | 1,196 | | | | 8,229 | |
Pharmacyclics, Inc.(1) | | | 153 | | | | 10,608 | |
Piedmont Natural Gas Co., Inc. | | | 304 | | | | 9,655 | |
Plantronics, Inc. | | | 191 | | | | 7,854 | |
Platinum Underwriters Holdings, Ltd. | | | 132 | | | | 6,432 | |
PNM Resources, Inc. | | | 484 | | | | 10,338 | |
Portland General Electric Co. | | | 361 | | | | 10,368 | |
Primerica, Inc. | | | 347 | | | | 11,409 | |
ProAssurance Corp. | | | 232 | | | | 10,449 | |
PSS World Medical, Inc.(1) | | | 262 | | | | 7,580 | |
Resolute Energy Corp.(1) | | | 714 | | | | 6,076 | |
RLI Corp. | | | 160 | | | | 11,042 | |
Rosetta Resources, Inc.(1) | | | 134 | | | | 7,105 | |
Salix Pharmaceuticals, Ltd.(1) | | | 141 | | | | 6,754 | |
Sanchez Energy Corp.(1) | | | 218 | | | | 4,356 | |
Sanderson Farms, Inc. | | | 190 | | | | 9,591 | |
Schweitzer-Mauduit International, Inc. | | | 269 | | | | 10,959 | |
Seaboard Corp. | | | 3 | | | | 8,110 | |
Seattle Genetics, Inc.(1) | | | 340 | | | | 10,013 | |
SemGroup Corp., Class A(1) | | | 269 | | | | 11,610 | |
Sensient Technologies Corp. | | | 197 | | | | 7,506 | |
Signature Bank(1) | | | 123 | | | | 9,093 | |
Six Flags Entertainment Corp. | | | 99 | | | | 6,231 | |
Snyders-Lance, Inc. | | | 250 | | | | 6,358 | |
Solar Capital, Ltd. | | | 330 | | | | 8,339 | |
SolarWinds, Inc.(1) | | | 155 | | | | 8,435 | |
South Jersey Industries, Inc. | | | 176 | | | | 9,553 | |
Southwest Gas Corp. | | | 274 | | | | 12,204 | |
Spirit Airlines, Inc.(1) | | | 572 | | | | 11,091 | |
Starwood Property Trust, Inc. | | | 392 | | | | 10,051 | |
STERIS Corp. | | | 177 | | | | 6,678 | |
Synaptics, Inc.(1) | | | 211 | | | | 7,402 | |
Take-Two Interactive Software, Inc.(1) | | | 473 | | | | 5,756 | |
| | | | |
| | 13 | | See Notes to Financial Statements. |
Parametric Global Small-Cap Fund
January 31, 2013
Portfolio of Investments — continued
| | | | | | | | |
| Security | | Shares | | | Value | |
| | | | | | | | |
|
United States (continued) | |
Tanger Factory Outlet Centers | | | 287 | | | $ | 10,166 | |
Targa Resources Corp. | | | 207 | | | | 12,495 | |
Teledyne Technologies, Inc.(1) | | | 189 | | | | 12,901 | |
Tennant Co. | | | 189 | | | | 8,702 | |
TiVo, Inc.(1) | | | 471 | | | | 6,283 | |
Tootsie Roll Industries, Inc. | | | 223 | | | | 6,043 | |
TreeHouse Foods, Inc.(1) | | | 151 | | | | 7,992 | |
UIL Holdings Corp. | | | 264 | | | | 9,823 | |
Ultimate Software Group, Inc.(1) | | | 86 | | | | 8,732 | |
United Natural Foods, Inc.(1) | | | 139 | | | | 7,503 | |
Universal Corp. | | | 121 | | | | 6,580 | |
UNS Energy Corp. | | | 236 | | | | 10,688 | |
ValueClick, Inc.(1) | | | 302 | | | | 6,182 | |
Vector Group, Ltd. | | | 519 | | | | 8,065 | |
Vitamin Shoppe, Inc.(1) | | | 105 | | | | 6,413 | |
Watsco, Inc. | | | 124 | | | | 9,343 | |
Weis Markets, Inc. | | | 197 | | | | 7,931 | |
West Pharmaceutical Services, Inc. | | | 143 | | | | 8,467 | |
Western Refining, Inc. | | | 423 | | | | 14,226 | |
WGL Holdings, Inc. | | | 239 | | | | 10,021 | |
World Fuel Services Corp. | | | 230 | | | | 9,915 | |
| | | | | | | | | |
| | | | | | $ | 1,195,328 | |
| | | | | | | | | |
| |
Total Common Stocks
(identified cost $4,680,226) | | | $ | 4,871,847 | |
| | |
|
| Exchange-Traded Funds — 3.5% | |
| | |
| | | | | | | | |
| Security | | Shares | | | Value | |
|
Equity Funds — 3.5% | |
iShares MSCI ACWI Index Fund | | | 600 | | | $ | 29,934 | |
iShares MSCI Brazil Index Fund | | | 1,370 | | | | 77,775 | |
iShares MSCI Chile Investable Market Index Fund | | | 1,134 | | | | 75,910 | |
| | |
| |
Total Exchange-Traded Funds
(identified cost $176,123) | | | $ | 183,619 | |
| | |
| | | | | | | | | | | | |
|
| Equity-Linked Securities(2)(5) — 2.0% | |
| | | |
| | | | | | | | | | | | |
| Security | | Maturity
Date | | | Shares | | | Value | |
| | | | | | | | | | | | |
|
India — 2.0% | |
Apollo Hospitals Enterprises Ltd. | | | 11/2/16 | | | | 500 | | | $ | 7,608 | |
Bajai Holdings and Investment, Ltd. | | | 7/20/17 | | | | 324 | | | | 5,910 | |
Britannia Industries, Ltd. | | | 10/17/17 | | | | 656 | | | | 6,084 | |
| | | | | | | | | | | | |
| Security | | Maturity
Date | | | Shares | | | Value | |
| | | | | | | | | | | | |
|
India (continued) | |
Castrol India, Ltd. | | | 10/17/17 | | | | 1,703 | | | $ | 9,724 | |
Coromandel International, Ltd. | | | 10/17/17 | | | | 1,245 | | | | 5,241 | |
GlaxoSmithKline Consumer Healthcare | | | 9/7/16 | | | | 135 | | | | 9,629 | |
Marico, Ltd. | | | 10/17/17 | | | | 2,500 | | | | 10,650 | |
Petronet LNG, Ltd. | | | 10/17/17 | | | | 3,000 | | | | 8,565 | |
Piramal Enterprises, Ltd. | | | 10/9/14 | | | | 950 | | | | 10,042 | |
Shree Cement, Ltd. | | | 7/20/17 | | | | 125 | | | | 10,527 | |
Tata Chemicals Ltd. | | | 6/30/16 | | | | 939 | | | | 6,324 | |
Tata Communications, Ltd. | | | 10/17/17 | | | | 1,442 | | | | 6,316 | |
United Phosphorus, Ltd. | | | 7/20/17 | | | | 2,617 | | | | 6,556 | |
| | | | | | | | | | | | | |
| | | |
Total Equity-Linked Securities
(identified cost $104,095) | | | | | | | | | | $ | 103,176 | |
| | | | | | | | | | | | | |
| | | | | | | | |
|
| Short-Term Investments — 0.4% | |
| Description | | Interest
(000’s omitted) | | | Value | |
| | | | | | | | |
Eaton Vance Cash Reserves Fund, LLC, 0.12%(6) | | $ | 19 | | | $ | 18,595 | |
| | |
| |
Total Short-Term Investments
(identified cost $18,595) | | | $ | 18,595 | |
| | |
| |
Total Investments — 99.4%
(identified cost $4,979,039) | | | $ | 5,177,237 | |
| | |
| |
Other Assets, Less Liabilities — 0.6% | | | $ | 31,267 | |
| | |
| |
Net Assets — 100.0% | | | $ | 5,208,504 | |
| | |
The percentage shown for each investment category in the Portfolio of Investments is based on net assets.
| | | | |
| ADR | | – | | American Depositary Receipt |
| GDR | | – | | Global Depositary Receipt |
| PCL | | – | | Public Company Ltd. |
| (1) | Non-income producing security. |
| (2) | Security exempt from registration pursuant to Rule 144A under the Securities Act of 1933. These securities may be sold in certain transactions (normally to qualified institutional buyers) and remain exempt from registration. At January 31, 2013, the aggregate value of these securities is $110,379 or 2.1% of the Fund’s net assets. |
| (3) | Security exempt from registration under Regulation S of the Securities Act of 1933, which exempts from registration securities offered and sold outside the United States. Security may not be offered or sold in the United States except pursuant to an exemption from, or in a transaction not subject to, the registration requirements of the Securities Act of 1933. At January 31, 2013, the aggregate value of these securities is $12,504 or 0.2% of the Fund’s net assets. |
| (4) | Indicates a foreign registered security. Shares issued to foreign investors in markets that have foreign ownership limits. |
| | | | |
| | 14 | | See Notes to Financial Statements. |
Parametric Global Small-Cap Fund
January 31, 2013
Portfolio of Investments — continued
| (5) | Security whose performance, including redemption at maturity, is linked to the price of the underlying equity security. The investment is subject to credit risk of the issuing financial institution (JPMorgan Chase) in addition to the market risk of the underlying security. |
| (6) | Affiliated investment company available to Eaton Vance portfolios and funds which invests in high quality, U.S. dollar denominated money market instruments. The rate shown is the annualized seven-day yield as of January 31, 2013. |
| | | | | | | | |
| Currency Concentration of Portfolio | |
| | |
| | | | | | | | |
| Currency | | Percentage
of Net Assets | | | Value | |
United States Dollar | | | 30.7 | % | | $ | 1,597,714 | |
Euro | | | 17.1 | | | | 890,195 | |
Japanese Yen | | | 6.4 | | | | 332,925 | |
Hong Kong Dollar | | | 5.3 | | | | 275,577 | |
British Pound Sterling | | | 4.5 | | | | 232,362 | |
Canadian Dollar | | | 3.7 | | | | 194,755 | |
South Korean Won | | | 2.8 | | | | 145,366 | |
New Taiwan Dollar | | | 2.7 | | | | 141,684 | |
Singapore Dollar | | | 2.4 | | | | 127,127 | |
Swiss Franc | | | 2.4 | | | | 122,486 | |
Australian Dollar | | | 2.2 | | | | 114,459 | |
Thai Baht | | | 2.1 | | | | 110,638 | |
Indonesian Rupiah | | | 2.1 | | | | 106,688 | |
Swedish Krona | | | 1.9 | | | | 99,842 | |
South African Rand | | | 1.8 | | | | 91,854 | |
Malaysian Ringgit | | | 1.7 | | | | 90,908 | |
Mexican Peso | | | 1.7 | | | | 89,818 | |
Norwegian Krone | | | 1.6 | | | | 82,615 | |
Israeli Shekel | | | 1.5 | | | | 79,640 | |
New Turkish Lira | | | 1.3 | | | | 65,139 | |
New Zealand Dollar | | | 1.2 | | | | 64,725 | |
Polish Zloty | | | 1.2 | | | | 63,824 | |
Danish Krone | | | 1.1 | | | | 56,896 | |
| | |
Total Investments | | | 99.4 | % | | $ | 5,177,237 | |
| | |
| | | | | | | | |
| Sector Classification of Portfolio | |
| | |
| | | | | | | | |
| Sector | | Percentage of Net Assets | | | Value | |
Financials | | | 15.6 | % | | $ | 810,435 | |
Industrials | | | 13.7 | | | | 713,030 | |
Consumer Discretionary | | | 12.0 | | | | 625,264 | |
Information Technology | | | 9.9 | | | | 516,919 | |
Health Care | | | 9.8 | | | | 508,676 | |
Consumer Staples | | | 9.1 | | | | 475,611 | |
Materials | | | 9.0 | | | | 467,905 | |
Energy | | | 8.0 | | | | 417,991 | |
Utilities | | | 6.5 | | | | 339,417 | |
Telecommunication Services | | | 1.9 | | | | 99,775 | |
Exchange-Traded Funds | | | 3.5 | | | | 183,619 | |
Short-Term Investments | | | 0.4 | | | | 18,595 | |
| | | | | | | | | |
Total Investments | | | 99.4 | % | | $ | 5,177,237 | |
| | | | | | | | | |
| | | | |
| | 15 | | See Notes to Financial Statements. |
Parametric Global Small-Cap Fund
January 31, 2013
Statement of Assets and Liabilities
| | | | |
| Assets | | January 31, 2013 | |
Unaffiliated investments, at value (identified cost, $4,960,444) | | $ | 5,158,642 | |
Affiliated investment, at value (identified cost, $18,595) | | | 18,595 | |
Foreign currency, at value (identified cost, $3,456) | | | 3,423 | |
Dividends receivable | | | 2,739 | |
Interest receivable from affiliated investment | | | 4 | |
Receivable for investments sold | | | 11,485 | |
Tax reclaims receivable | | | 48 | |
Receivable from affiliates | | | 48,926 | |
Total assets | | $ | 5,243,862 | |
| |
| Liabilities | | | | |
Payable to affiliate: | | | | |
Investment adviser fee | | $ | 2,901 | |
Accrued expenses | | | 32,457 | |
Total liabilities | | $ | 35,358 | |
Net Assets | | $ | 5,208,504 | |
| |
| Sources of Net Assets | | | | |
Paid-in capital | | $ | 4,974,782 | |
Accumulated net realized gain | | | 10,113 | |
Accumulated undistributed net investment income | | | 25,404 | |
Net unrealized appreciation | | | 198,205 | |
Total | | $ | 5,208,504 | |
| |
| Class I Shares | | | | |
Net Assets | | $ | 5,208,504 | |
Shares Outstanding | | | 500,000 | |
Net Asset Value, Offering Price and Redemption Price Per Share | | | | |
(net assets ÷ shares of beneficial interest outstanding) | | $ | 10.42 | |
| | | | |
| | 16 | | See Notes to Financial Statements. |
Parametric Global Small-Cap Fund
January 31, 2013
Statement of Operations
| | | | |
| Investment Income | | Period Ended
January 31, 2013(1) | |
Dividends (net of foreign taxes, $731) | | $ | 7,885 | |
Interest allocated from affiliated investment | | | 107 | |
Expenses allocated from affiliated investment | | | (12 | ) |
Total investment income | | $ | 7,980 | |
| |
| Expenses | | | | |
Investment adviser and administration fee | | $ | 4,095 | |
Trustees’ fees and expenses | | | 347 | |
Custodian fee | | | 7,000 | |
Transfer and dividend disbursing agent fees | | | 103 | |
Legal and accounting services | | | 30,201 | |
Printing and postage | | | 1,092 | |
Registration fees | | | 25,218 | |
Miscellaneous | | | 1,025 | |
Total expenses | | $ | 69,081 | |
Deduct — | | | | |
Allocation of expenses to affiliates | | $ | 64,132 | |
Total expense reductions | | $ | 64,132 | |
| |
Net expenses | | $ | 4,949 | |
| |
Net investment income | | $ | 3,031 | |
| |
| Realized and Unrealized Gain (Loss) | | | | |
Net realized gain (loss) — | | | | |
Investment transactions | | $ | 10,112 | |
Investment transactions allocated from affiliated investment | | | 1 | |
Disposal of investments in violation of restrictions and net increase from payment by affiliate | | | 0 | |
Foreign currency transactions | | | (845 | ) |
Net realized gain | | $ | 9,268 | |
Change in unrealized appreciation (depreciation) — | | | | |
Investments | | $ | 198,198 | |
Foreign currency | | | 7 | |
Net change in unrealized appreciation (depreciation) | | $ | 198,205 | |
| |
Net realized and unrealized gain | | $ | 207,473 | |
| |
Net increase in net assets from operations | | $ | 210,504 | |
| (1) | For the period from the start of business, December 20, 2012, to January 31, 2013. |
| | | | |
| | 17 | | See Notes to Financial Statements. |
Parametric Global Small-Cap Fund
January 31, 2013
Statement of Changes in Net Assets
| | | | |
| Increase (Decrease) in Net Assets | | Period Ended January 31, 2013(1) | |
From operations — | | | | |
Net investment income | | $ | 3,031 | |
Net realized gain from investment transactions, disposal of investments in violation of restrictions and net increase from payment by affiliate and foreign currency transactions | | | 9,268 | |
Net change in unrealized appreciation (depreciation) from investments and foreign currency | | | 198,205 | |
Net increase in net assets from operations | | $ | 210,504 | |
Distributions to shareholders — | | | | |
From net investment income | | | | |
Class I | | $ | (2,000 | ) |
Total distributions to shareholders | | $ | (2,000 | ) |
Transactions in shares of beneficial interest — | | | | |
Proceeds from sale of shares | | | | |
Class I | | $ | 5,000,000 | |
Net increase in net assets from Fund share transactions | | $ | 5,000,000 | |
| |
Net increase in net assets | | $ | 5,208,504 | |
| |
| Net Assets | | | | |
At beginning of period | | $ | — | |
At end of period | | $ | 5,208,504 | |
| |
Accumulated undistributed net investment income
included in net assets | | | | |
At end of period | | $ | 25,404 | |
| (1) | For the period from the start of business, December 20, 2012, to January 31, 2013. |
| | | | |
| | 18 | | See Notes to Financial Statements. |
Parametric Global Small-Cap Fund
January 31, 2013
Financial Highlights
| | | | |
| | | Class I | |
| | | Period Ended January 31, 2013(1) | |
Net asset value — Beginning of period | | $ | 10.000 | |
| |
| Income (Loss) From Operations | | | | |
Net investment income(2) | | $ | 0.006 | |
Net realized and unrealized gain | | | 0.418 | |
| |
Total income from operations | | $ | 0.424 | |
| |
| Less Distributions | | | | |
From net investment income | | $ | (0.004 | ) |
| |
Total distributions | | $ | (0.004 | ) |
| |
Net asset value — End of period | | $ | 10.420 | |
| |
Total Return(3) | | | 4.24 | %(4)(5) |
| |
| Ratios/Supplemental Data | | | | |
Net assets, end of period (000’s omitted) | | $ | 5,209 | |
Ratios (as a percentage of average daily net assets): | | | | |
Expenses | | | 0.85 | %(6)(7) |
Net investment income | | | 0.52 | %(7) |
Portfolio Turnover | | | 13 | %(4) |
| (1) | For the period from the start of business, December 20, 2012, to January 31, 2013. |
| (2) | Computed using average shares outstanding. |
| (3) | Returns are historical and are calculated by determining the percentage change in net asset value with all distributions reinvested. |
| (5) | During the period ended January 31, 2013, the sub-adviser reimbursed the Fund for a net loss realized on the disposal of an investment which did not meet the Fund’s investment guidelines. The reimbursement had no effect on total return for the period ended January 31, 2013. |
| (6) | The investment adviser, sub-adviser and administrator reimbursed certain operating expenses (equal to 10.98% of average daily net assets for the period from the start of business, December 20, 2012, to January 31, 2013). Absent this subsidy, total return would have been lower. |
| | | | |
| | 19 | | See Notes to Financial Statements. |
Parametric Global Small-Cap Fund
January 31, 2013
Notes to Financial Statements
1 Significant Accounting Policies
Parametric Global Small-Cap Fund (the Fund) is a diversified series of Eaton Vance Mutual Funds Trust (the Trust). The Trust is a Massachusetts business trust registered under the Investment Company Act of 1940, as amended (the 1940 Act), as an open-end management investment company. The Fund commenced operations on December 20, 2012. The Fund’s investment objective is to seek long-term capital appreciation. As of January 31, 2013, the Fund offered Class I shares, which are offered at net asset value and are not subject to a sales charge. Effective March 1, 2013, Class I was renamed Institutional Class.
The following is a summary of significant accounting policies of the Fund. The policies are in conformity with accounting principles generally accepted in the United States of America.
A Investment Valuation — Equity securities (including common shares of closed-end investment companies) listed on a U.S. securities exchange generally are valued at the last sale or closing price on the day of valuation or, if no sales took place on such date, at the mean between the closing bid and asked prices therefore on the exchange where such securities are principally traded. Equity securities listed on the NASDAQ Global or Global Select Market generally are valued at the NASDAQ official closing price. Unlisted or listed securities for which closing sales prices or closing quotations are not available are valued at the mean between the latest available bid and asked prices or, in the case of preferred equity securities that are not listed or traded in the over-the-counter market, by a third party pricing service that will use various techniques that consider factors including, but not limited to, prices or yields of securities with similar characteristics, benchmark yields, broker/dealer quotes, quotes of underlying common stock, issuer spreads, as well as industry and economic events. Short-term obligations purchased with a remaining maturity of sixty days or less are generally valued at amortized cost, which approximates market value. Foreign securities and currencies are valued in U.S. dollars, based on foreign currency exchange rate quotations supplied by a third party pricing service. The pricing service uses a proprietary model to determine the exchange rate. Inputs to the model include reported trades and implied bid/ask spreads. The daily valuation of exchange-traded foreign securities generally is determined as of the close of trading on the principal exchange on which such securities trade. Events occurring after the close of trading on foreign exchanges may result in adjustments to the valuation of foreign securities to more accurately reflect their fair value as of the close of regular trading on the New York Stock Exchange. When valuing foreign equity securities that meet certain criteria, the Fund’s Trustees have approved the use of a fair value service that values such securities to reflect market trading that occurs after the close of the applicable foreign markets of comparable securities or other instruments that have a strong correlation to the fair-valued securities. Investments for which valuations or market quotations are not readily available or are deemed unreliable are valued at fair value using methods determined in good faith by or at the direction of the Trustees of the Fund in a manner that fairly reflects the security’s value, or the amount that the Fund might reasonably expect to receive for the security upon its current sale in the ordinary course. Each such determination is based on a consideration of relevant factors, which are likely to vary from one pricing context to another. These factors may include, but are not limited to, the type of security, the existence of any contractual restrictions on the security’s disposition, the price and extent of public trading in similar securities of the issuer or of comparable companies or entities, quotations or relevant information obtained from broker/dealers or other market participants, information obtained from the issuer, analysts, and/or the appropriate stock exchange (for exchange-traded securities), an analysis of the company’s or entity’s financial condition, and an evaluation of the forces that influence the issuer and the market(s) in which the security is purchased and sold.
The Fund may invest in Eaton Vance Cash Reserves Fund, LLC (Cash Reserves Fund), an affiliated investment company managed by Eaton Vance Management (EVM). The value of the Fund’s investment in Cash Reserves Fund reflects the Fund’s proportionate interest in its net assets. Cash Reserves Fund generally values its investment securities utilizing the amortized cost valuation technique in accordance with Rule 2a-7 under the 1940 Act. This technique involves initially valuing a portfolio security at its cost and thereafter assuming a constant amortization to maturity of any discount or premium. If amortized cost is determined not to approximate fair value, Cash Reserves Fund may value its investment securities in the same manner as debt obligations described above.
B Investment Transactions — Investment transactions for financial statement purposes are accounted for on a trade date basis. Realized gains and losses on investments sold are determined on the basis of identified cost.
C Income — Dividend income is recorded on the ex-dividend date for dividends received in cash and/or securities. However, if the ex-dividend date has passed, certain dividends from foreign securities are recorded as the Fund is informed of the ex-dividend date. Withholding taxes on foreign dividends and capital gains have been provided for in accordance with the Fund’s understanding of the applicable countries’ tax rules and rates. Interest income is recorded on the basis of interest accrued, adjusted for amortization of premium or accretion of discount.
D Federal Taxes — The Fund’s policy is to comply with the provisions of the Internal Revenue Code applicable to regulated investment companies and to distribute to shareholders each year substantially all of its net investment income, and all or substantially all of its net realized capital gains. Accordingly, no provision for federal income or excise tax is necessary.
In addition to the requirements of the Internal Revenue Code, the Fund may also be subject to local taxes on the recognition of capital gains in certain countries. In determining the daily net asset value, the Fund estimates the accrual for such taxes, if any, based on the unrealized appreciation on certain portfolio securities and the related tax rates. Tax expense attributable to unrealized appreciation is included in the change in unrealized appreciation (depreciation) on investments. Capital gains taxes on securities sold are included in net realized gain (loss) on investments.
Parametric Global Small-Cap Fund
January 31, 2013
Notes to Financial Statements — continued
As of January 31, 2013, the Fund had no uncertain tax positions that would require financial statement recognition, de-recognition, or disclosure. The Fund files a U.S. federal income tax return annually after its fiscal year-end, which is subject to examination by the Internal Revenue Service for a period of three years from the date of filing.
E Expenses — The majority of expenses of the Trust are directly identifiable to an individual fund. Expenses which are not readily identifiable to a specific fund are allocated taking into consideration, among other things, the nature and type of expense and the relative size of the funds.
F Expense Reduction — State Street Bank and Trust Company (SSBT) serves as custodian of the Fund. Pursuant to the custodian agreement, SSBT receives a fee reduced by credits, which are determined based on the average daily cash balance the Fund maintains with SSBT. All credit balances, if any, used to reduce the Fund’s custodian fees are reported as a reduction of expenses in the Statement of Operations.
G Foreign Currency Translation — Investment valuations, other assets, and liabilities initially expressed in foreign currencies are translated each business day into U.S. dollars based upon current exchange rates. Purchases and sales of foreign investment securities and income and expenses denominated in foreign currencies are translated into U.S. dollars based upon currency exchange rates in effect on the respective dates of such transactions. Recognized gains or losses on investment transactions attributable to changes in foreign currency exchange rates are recorded for financial statement purposes as net realized gains and losses on investments. That portion of unrealized gains and losses on investments that results from fluctuations in foreign currency exchange rates is not separately disclosed.
H Use of Estimates — The preparation of the financial statements in conformity with accounting principles generally accepted in the United States of America requires management to make estimates and assumptions that affect the reported amounts of assets and liabilities at the date of the financial statements and the reported amounts of income and expense during the reporting period. Actual results could differ from those estimates.
I Indemnifications — Under the Trust’s organizational documents, its officers and Trustees may be indemnified against certain liabilities and expenses arising out of the performance of their duties to the Fund. Under Massachusetts law, if certain conditions prevail, shareholders of a Massachusetts business trust (such as the Trust) could be deemed to have personal liability for the obligations of the Trust. However, the Trust’s Declaration of Trust contains an express disclaimer of liability on the part of Fund shareholders and the By-laws provide that the Trust shall assume the defense on behalf of any Fund shareholders. Moreover, the By-laws also provide for indemnification out of Fund property of any shareholder held personally liable solely by reason of being or having been a shareholder for all loss or expense arising from such liability. Additionally, in the normal course of business, the Fund enters into agreements with service providers that may contain indemnification clauses. The Fund’s maximum exposure under these arrangements is unknown as this would involve future claims that may be made against the Fund that have not yet occurred.
2 Distributions to Shareholders
It is the present policy of the Fund to make at least one distribution annually (normally in December) of all or substantially all of its net investment income and to distribute annually all or substantially all of its net realized capital gains. Distributions to shareholders are recorded on the ex-dividend date. Shareholders may reinvest income and capital gain distributions in additional shares of the Fund at the net asset value as of the ex-dividend date or, at the election of the shareholder, receive distributions in cash. The Fund distinguishes between distributions on a tax basis and a financial reporting basis. Accounting principles generally accepted in the United States of America require that only distributions in excess of tax basis earnings and profits be reported in the financial statements as a return of capital. Permanent differences between book and tax accounting relating to distributions are reclassified to paid-in capital. For tax purposes, distributions from short-term capital gains are considered to be from ordinary income.
The tax character of distributions declared for the period ended January 31, 2013 was as follows:
| | | | |
| | | Period Ended
January 31, 2013 | |
| |
Distributions declared from: | | | | |
Ordinary income | | $ | 2,000 | |
During the period ended January 31, 2013, accumulated net realized gain was increased by $845, accumulated undistributed net investment income was increased by $24,373 and paid-in capital was decreased by $25,218 due to differences between book and tax accounting, primarily for non-deductible expenses and foreign currency gain (loss). These reclassifications had no effect on the net assets or net asset value per share of the Fund.
Parametric Global Small-Cap Fund
January 31, 2013
Notes to Financial Statements — continued
As of January 31, 2013, the components of distributable earnings (accumulated losses) and unrealized appreciation (depreciation) on a tax basis were as follows:
| | | | |
Undistributed ordinary income | | $ | 45,085 | |
Net unrealized appreciation | | $ | 188,637 | |
The difference between components of distributable earnings (accumulated losses) on a tax basis and the amounts reflected in the statement of assets and liabilities is primarily due to investments in passive foreign investment companies and the tax treatment of short-term capital gains.
3 Investment Adviser and Administration Fee and Other Transactions with Affiliates
The investment adviser and administration fee is earned by EVM as compensation for investment advisory and administrative services rendered to the Fund. The fee is computed at an annual rate of 0.70% of the Fund’s average daily net assets up to $500 million and is payable monthly. On net assets of $500 million and over, the annual fee is reduced. The Fund invests its cash in Cash Reserves Fund. EVM does not currently receive a fee for advisory services provided to Cash Reserves Fund. For the period ended January 31, 2013, the investment adviser and administration fee amounted to $4,095 or 0.70% (annualized) of the Fund’s average daily net assets. Pursuant to a sub-advisory agreement, EVM has delegated the investment management of the Fund to Parametric Portfolio Associates LLC (Parametric), a majority-owned subsidiary of Eaton Vance Corp. EVM pays Parametric a portion of its advisory and administration fee for sub-advisory services provided to the Fund. EVM and Parametric have agreed to reimburse the Fund’s expenses to the extent that total annual operating expenses (relating to ordinary operating expenses only) exceed 0.85% of the Fund’s average daily net assets. This agreement may be changed or terminated after May 31, 2014. Pursuant to this agreement, EVM and Parametric were allocated $64,132 in total of the Fund’s operating expenses for the period ended January 31, 2013.
EVM serves as the sub-transfer agent of the Fund and receives from the transfer agent an aggregate fee based upon the actual expenses incurred by EVM in the performance of these services. For the period ended January 31, 2013, EVM earned $1 in sub-transfer agent fees.
During the period ended January 31, 2013, Parametric reimbursed the Fund $1,440 for a loss on the sale of investment securities not meeting investment guidelines. The effect of the loss incurred and the reimbursement by Parametric of such amount had no impact on total return.
Trustees and officers of the Fund who are members of EVM’s organization receive remuneration for their services to the Fund out of the investment adviser and administration fee. Trustees of the Fund who are not affiliated with EVM may elect to defer receipt of all or a percentage of their annual fees in accordance with the terms of the Trustees Deferred Compensation Plan. For the period ended January 31, 2013, no significant amounts have been deferred. Certain officers and Trustees of the Fund are officers of EVM.
4 Purchases and Sales of Investments
Purchases and sales of investments, other than short-term obligations, aggregated $5,617,262 and $665,487, respectively, for the period ended January 31, 2013.
5 Shares of Beneficial Interest
The Fund’s Declaration of Trust permits the Trustees to issue an unlimited number of full and fractional shares of beneficial interest (without par value). Such shares may be issued in a number of different series (such as the Fund) and classes. Transactions in Fund shares were as follows:
| | | | |
| Class I | | Period Ended
January 31, 2013(1) | |
| |
Sales | | | 500,000 | |
| |
Net increase | | | 500,000 | |
| (1) | For the period from the start of business, December 20, 2012, to January 31, 2013. |
At January 31, 2013, an affiliate of EVM owned 100% of the outstanding shares of the Fund.
Parametric Global Small-Cap Fund
January 31, 2013
Notes to Financial Statements — continued
6 Federal Income Tax Basis of Investments
The cost and unrealized appreciation (depreciation) of investments of the Fund at January 31, 2013, as determined on a federal income tax basis, were as follows:
| | | | |
| |
Aggregate cost | | $ | 4,988,607 | |
| |
Gross unrealized appreciation | | $ | 249,403 | |
Gross unrealized depreciation | | | (60,773 | ) |
| |
Net unrealized appreciation | | $ | 188,630 | |
7 Risks Associated with Foreign Investments
Investing in securities issued by companies whose principal business activities are outside the United States may involve significant risks not present in domestic investments. For example, there is generally less publicly available information about foreign companies, particularly those not subject to the disclosure and reporting requirements of the U.S. securities laws. Certain foreign issuers are generally not bound by uniform accounting, auditing, and financial reporting requirements and standards of practice comparable to those applicable to domestic issuers. Investments in foreign securities also involve the risk of possible adverse changes in investment or exchange control regulations, expropriation or confiscatory taxation, limitation on the removal of funds or other assets of the Fund, political or financial instability or diplomatic and other developments which could affect such investments. Foreign securities markets, while growing in volume and sophistication, are generally not as developed as those in the United States, and securities of some foreign issuers (particularly those located in developing countries) may be less liquid and more volatile than securities of comparable U.S. companies. In general, there is less overall governmental supervision and regulation of foreign securities markets, broker/dealers and issuers than in the United States.
8 Fair Value Measurements
Under generally accepted accounting principles for fair value measurements, a three-tier hierarchy to prioritize the assumptions, referred to as inputs, is used in valuation techniques to measure fair value. The three-tier hierarchy of inputs is summarized in the three broad levels listed below.
| Ÿ | | Level 1 – quoted prices in active markets for identical investments |
| Ÿ | | Level 2 – other significant observable inputs (including quoted prices for similar investments, interest rates, prepayment speeds, credit risk, etc.) |
| Ÿ | | Level 3 – significant unobservable inputs (including a fund’s own assumptions in determining the fair value of investments) |
In cases where the inputs used to measure fair value fall in different levels of the fair value hierarchy, the level disclosed is determined based on the lowest level input that is significant to the fair value measurement in its entirety. The inputs or methodology used for valuing securities are not necessarily an indication of the risk associated with investing in those securities.
Parametric Global Small-Cap Fund
January 31, 2013
Notes to Financial Statements — continued
At January 31, 2013, the hierarchy of inputs used in valuing the Fund’s investments, which are carried at value, were as follows:
| | | | | | | | | | | | | | | | |
| Asset Description | | Level 1 | | | Level 2 | | | Level 3 | | | Total | |
| | | | |
Common Stocks | | | | | | | | | | | | | | | | |
Asia/Pacific | | $ | — | | | $ | 1,502,737 | | | $ | — | | | $ | 1,502,737 | |
Developed Europe | | | 29,253 | | | | 1,484,396 | | | | — | | | | 1,513,649 | |
Developed Middle East | | | 10,911 | | | | 79,640 | | | | — | | | | 90,551 | |
Emerging Europe | | | 12,504 | | | | 142,243 | | | | — | | | | 154,747 | |
Latin America | | | 120,866 | | | | — | | | | — | | | | 120,866 | |
Middle East/Africa | | | — | | | | 91,854 | | | | — | | | | 91,854 | |
North America | | | 1,390,083 | | | | 7,360 | | | | — | | | | 1,397,443 | |
| | | | |
Total Common Stocks | | $ | 1,563,617 | | | $ | 3,308,230 | * | | $ | — | | | $ | 4,871,847 | |
Exchange-Traded Funds | | $ | 183,619 | | | $ | — | | | $ | — | | | $ | 183,619 | |
Equity-Linked Securities | | | — | | | | 103,176 | | | | — | | | | 103,176 | |
Short-Term Investments | | | — | | | | 18,595 | | | | — | | | | 18,595 | |
| | | | |
Total Investments | | $ | 1,747,236 | | | $ | 3,430,001 | | | $ | — | | | $ | 5,177,237 | |
| * | Includes foreign equity securities whose values were adjusted to reflect market trading of comparable securities or other correlated instruments that occurred after the close of trading in their applicable foreign markets. |
Parametric Global Small-Cap Fund
January 31, 2013
Report of Independent Registered Public Accounting Firm
To the Trustees of Eaton Vance Mutual Funds Trust and Shareholders of Parametric Global Small-Cap Fund:
We have audited the accompanying statement of assets and liabilities of Parametric Global Small-Cap Fund (the “Fund”) (one of the funds constituting Eaton Vance Mutual Funds Trust), including the portfolio of investments, as of January 31, 2013, and the related statements of operations and changes in net assets and the financial highlights for the period from the start of business, December 20, 2012, to January 31, 2013. These financial statements and financial highlights are the responsibility of the Fund’s management. Our responsibility is to express an opinion on these financial statements and financial highlights based on our audit.
We conducted our audit in accordance with the standards of the Public Company Accounting Oversight Board (United States). Those standards require that we plan and perform the audit to obtain reasonable assurance about whether the financial statements and financial highlights are free of material misstatement. The Fund is not required to have, nor were we engaged to perform, an audit of its internal control over financial reporting. Our audit included consideration of internal control over financial reporting as a basis for designing audit procedures that are appropriate in the circumstances, but not for the purpose of expressing an opinion on the effectiveness of the Fund’s internal control over financial reporting. Accordingly, we express no such opinion. An audit also includes examining, on a test basis, evidence supporting the amounts and disclosures in the financial statements, assessing the accounting principles used and significant estimates made by management, as well as evaluating the overall financial statement presentation. Our procedures included confirmation of securities owned as of January 31, 2013, by correspondence with the custodian and brokers; where replies were not received from brokers, we performed other auditing procedures. We believe that our audit provides a reasonable basis for our opinion.
In our opinion, such financial statements and financial highlights referred to above present fairly, in all material respects, the financial position of Parametric Global Small-Cap Fund as of January 31, 2013, and the results of its operations, the changes in its net assets, and the financial highlights for the period from the start of business, December 20, 2012, to January 31, 2013, in conformity with accounting principles generally accepted in the United States of America.
DELOITTE & TOUCHE LLP
Boston, Massachusetts
March 22, 2013
Parametric Global Small-Cap Fund
January 31, 2013
Federal Tax Information (Unaudited)
The Form 1099-DIV you receive in January 2014 will show the tax status of all distributions paid to your account in calendar year 2013. Shareholders are advised to consult their own tax adviser with respect to the tax consequences of their investment in the Fund. As required by the Internal Revenue Code and/or regulations, shareholders must be notified regarding the status of qualified dividend income for individuals and the foreign tax credit.
Qualified Dividend Income. The Fund designates approximately $4,036, or up to the maximum amount of such dividends allowable pursuant to the Internal Revenue Code, as qualified dividend income eligible for the reduced tax rate of 15%.
Foreign Tax Credit. The Fund paid foreign taxes of $375 and recognized foreign source income of $6,286.
Parametric Global Small-Cap Fund
January 31, 2013
Board of Trustees’ Contract Approval
Overview of the Contract Review Process
The Investment Company Act of 1940, as amended (the “1940 Act”), provides, in substance, that for a fund to enter into an investment advisory agreement with an investment adviser, the fund’s board of trustees, including a majority of the trustees who are not “interested persons” of the fund (“Independent Trustees”), must approve the agreement and its terms at an in-person meeting called for the purpose of considering such approval.
At a meeting of the Boards of Trustees (each a “Board”) of the Eaton Vance group of mutual funds (the “Eaton Vance Funds”) held on December 17, 2012, the Board, including a majority of the Independent Trustees, voted to approve the investment advisory and administrative agreement of Parametric Global Small-Cap Fund (the “Fund”) with Eaton Vance Management (the “Adviser”) and the sub-advisory agreement with Parametric Portfolio Associates LLC (the “Sub-adviser”), an affiliate of Eaton Vance Management. The Board reviewed information furnished for the December 17, 2012 meeting as well as information previously furnished with respect to the approval of other investment advisory agreements for other Eaton Vance Funds. Such information included, among other things, the following:
Information about Fees and Expenses
| Ÿ | | The advisory and related fees to be paid by the Fund and the anticipated expense ratio of the Fund; |
| Ÿ | | Comparative information concerning fees charged by the Adviser and Sub-adviser for managing other accounts (including mutual funds, other collective investment funds and institutional accounts) using investment strategies and techniques similar to those to be used in managing the Fund, if applicable, and concerning fees charged by other advisers for managing funds similar to the Fund; |
Information about Portfolio Management
| Ÿ | | Descriptions of the investment management services to be provided to the Fund, including the investment strategies and processes to be employed; |
| Ÿ | | Information concerning the allocation of brokerage and the benefits expected to be received by the Adviser and Sub-adviser as a result of brokerage allocation for the Fund, including information concerning the acquisition of research through client commission arrangements and the Fund’s policies with respect to “soft dollar” arrangements; |
| Ÿ | | The procedures and processes to be used to determine the fair value of the Fund’s assets and actions to be taken to monitor and test the effectiveness of such procedures and processes; |
Information about the Adviser and Sub-adviser
| Ÿ | | Reports and/or other information provided by the Adviser and the Sub-adviser describing the financial results and condition of the Adviser and Sub-adviser; |
| Ÿ | | Descriptions of the qualifications, education and experience of the individual investment professionals whose responsibilities include portfolio management and investment research for the Fund, and information relating to their compensation and responsibilities with respect to managing other mutual funds and investment accounts; |
| Ÿ | | Copies of the Codes of Ethics of the Adviser and its affiliates, including the Sub-adviser, together with information relating to compliance with and the administration of such codes; |
| Ÿ | | Copies of or descriptions of the Adviser’s and the Sub-adviser’s policies and procedures relating to proxy voting and the handling of corporate actions and class actions; |
| Ÿ | | Information concerning the resources devoted to compliance efforts undertaken by the Adviser and its affiliates, including the Sub-adviser, on behalf of the Eaton Vance Funds (including descriptions of various compliance programs) and their record of compliance with investment policies and |
| | restrictions, including policies with respect to market-timing, late trading and selective portfolio disclosure, and with policies on personal securities transactions; |
| Ÿ | | Descriptions of the business continuity and disaster recovery plans of the Adviser and its affiliates; |
| Ÿ | | A description of the Adviser’s procedures for overseeing third party advisers and sub-advisers, including with respect to regulatory and compliance issues, investment management and other matters; |
Other Relevant Information
| Ÿ | | Information concerning the nature, cost and character of the administrative and other non-investment management services to be provided by Eaton Vance Management and its affiliates; |
| Ÿ | | Information concerning management of the relationship with the custodian, subcustodians and fund accountants by the Adviser (which is the administrator) and the Sub-adviser; and |
| Ÿ | | The terms of the investment advisory and administrative agreement and sub-advisory agreement of the Fund. |
Parametric Global Small-Cap Fund
January 31, 2013
Board of Trustees’ Contract Approval — continued
Results of the Process
Based on its consideration of the foregoing, and such other information as it deemed relevant, including the factors and conclusions described below, the Board concluded that the terms of the Fund’s investment advisory and administrative agreement and sub-advisory agreement with the Adviser and Sub-adviser, including their fee structures, are in the interests of shareholders and, therefore, the Board, including a majority of the Independent Trustees, voted to approve the terms of the investment advisory and administrative agreement and sub-advisory agreement for the Fund.
Nature, Extent and Quality of Services
In considering whether to approve the investment advisory and administrative agreement and sub-advisory agreement of the Fund, the Board evaluated the nature, extent and quality of services to be provided to the Fund by the Adviser and the Sub-adviser.
The Board considered the Adviser’s and the Sub-adviser’s management capabilities and investment process with respect to the types of investments to be held by the Fund, including the education, experience and number of its investment professionals and other personnel who will provide portfolio management, investment research, and similar services to the Fund and, with respect to the Adviser, whose responsibilities may include supervising the Sub-adviser and coordinating activities in implementing the Fund’s investment strategy. In particular, the Board noted the Sub-adviser’s experience employing a top-down, disciplined investment processes that emphasizes broad exposure and diversification. The Board also took into account the resources dedicated to portfolio management and other services, including the compensation methods to recruit and retain investment personnel, and the time and attention expected to be devoted to Fund matters by senior management.
The Board reviewed the compliance programs of the Adviser and relevant affiliates thereof, including the Sub-adviser. Among other matters, the Board considered compliance and reporting matters relating to personal trading by investment personnel, selective disclosure of portfolio holdings, late trading, frequent trading, portfolio valuation, business continuity and the allocation of investment opportunities. The Board also evaluated the responses of the Adviser and its affiliates to requests in recent years from regulatory authorities such as the Securities and Exchange Commission and the Financial Industry Regulatory Authority.
The Board considered shareholder and other administrative services provided or managed by the Adviser and its affiliates, including transfer agency and accounting services. The Board evaluated the benefits to shareholders of investing in a fund that is a part of a large family of funds, including the ability, in many cases, to exchange an investment among different funds without incurring additional sales charges.
After consideration of the foregoing factors, among others, the Board concluded that the nature, extent and quality of services to be provided by the Adviser and the Sub-adviser, taken as a whole, are appropriate and consistent with the terms of the investment advisory and administrative agreement and sub-advisory agreement.
Fund Performance
Because the Fund has not yet commenced operations, it has no performance record.
Management Fees and Expenses
The Board reviewed contractual fee rates to be payable by the Fund for advisory, sub-advisory and administrative services (referred to collectively as “management fees”). As part of its review, the Board considered the Fund’s management fees as compared to a group of similarly managed funds selected by an independent data provider and the Fund’s estimated expense ratio for a one-year period.
After reviewing the foregoing information, and in light of the nature, extent and quality of the services to be provided by the Adviser and Sub-adviser, the Board concluded that the management fees proposed to be charged for advisory and related services are reasonable.
Profitability
The Board reviewed the level of profits projected to be realized by the Adviser and relevant affiliates thereof in providing investment advisory and administrative services to the Fund. The Board considered the level of profits expected to be realized without regard to revenue sharing or other payments expected to be made by the Adviser and its affiliates to third parties in respect of distribution services. The Board also considered other direct or indirect benefits expected to be received by the Adviser and its affiliates, including the Sub-adviser, in connection with their relationships with the Fund, including the benefits of research services that may be available to the Adviser or Sub-adviser as a result of securities transactions effected for the Fund and other investment advisory clients.
The Board concluded that, in light of the foregoing factors and the nature, extent and quality of the services to be rendered, the profits expected to be realized by the Adviser and its affiliates, including the sub-adviser, are reasonable.
Parametric Global Small-Cap Fund
January 31, 2013
Board of Trustees’ Contract Approval — continued
Economies of Scale
In reviewing management fees and profitability, the Board also considered the extent to which the Adviser and its affiliates, on the one hand, and the Fund, on the other hand, can expect to realize benefits from economies of scale as the assets of the Fund increase. The Board acknowledged the difficulty in accurately measuring the benefits resulting from the economies of scale with respect to the management of any specific fund or group of funds. The Board also concluded that, assuming reasonably foreseeable increases in the assets of the Fund, the structure of the advisory fee, which includes breakpoints at several asset levels, can be expected to allow the Fund to benefit from economies of scale in the future.
Parametric Global Small-Cap Fund
January 31, 2013
Management and Organization
Fund Management. The Trustees of Eaton Vance Mutual Funds Trust (the Trust) are responsible for the overall management and supervision of the Trust’s affairs. The Trustees and officers of the Trust are listed below. Except as indicated, each individual has held the office shown or other offices in the same company for the last five years. Trustees and officers of the Trust hold indefinite terms of office. The “Noninterested Trustees” consist of those Trustees who are not “interested persons” of the Trust, as that term is defined under the 1940 Act. The business address of each Trustee and officer is Two International Place, Boston, Massachusetts 02110. As used below, “EVC” refers to Eaton Vance Corp., “EV” refers to Eaton Vance, Inc., “EVM” refers to Eaton Vance Management, “BMR” refers to Boston Management and Research and “EVD” refers to Eaton Vance Distributors, Inc. EVC and EV are the corporate parent and trustee, respectively, of EVM and BMR. EVD is the Fund’s principal underwriter and a wholly-owned subsidiary of EVC. Each officer affiliated with Eaton Vance may hold a position with other Eaton Vance affiliates that is comparable to his or her position with EVM listed below. Each Trustee oversees 183 portfolios in the Eaton Vance Complex (including all master and feeder funds in a master feeder structure). Each officer serves as an officer of certain other Eaton Vance funds. Each Trustee and officer serves until his or her successor is elected.
| | | | | | |
| Name and Year of Birth | | Position(s) with the
Trust | | Length of
Service | | Principal Occupation(s) and Directorships During Past Five Years and Other Relevant Experience |
Interested Trustee | | | | | | |
| | | |
Thomas E. Faust Jr. 1958 | | Trustee | | Since 2007 | | Chairman, Chief Executive Officer and President of EVC, Director and President of EV, Chief Executive Officer and President of EVM and BMR, and Director of EVD. Trustee and/or officer of 183 registered investment companies. Mr. Faust is an interested person because of his positions with EVM, BMR, EVD, EVC and EV, which are affiliates of the Trust. Directorships in the Last Five Years.(1) Director of EVC and Hexavest Inc. |
| | | |
| | | | | | |
Noninterested Trustees | | | | |
| | | |
Scott E. Eston 1956 | | Trustee | | Since 2011 | | Private investor. Formerly held various positions at Grantham, Mayo, Van Otterloo and Co., L.L.C. (investment management firm) (1997-2009), including Chief Operating Officer (2002-2009), Chief Financial Officer (1997-2009) and Chairman of the Executive Committee (2002-2008); President and Principal Executive Officer, GMO Trust (open-end registered investment company) (2006-2009). Former Partner, Coopers and Lybrand L.L.P. (now PricewaterhouseCoopers) (public accounting firm) (1987-1997). Directorships in the Last Five Years. None. |
| | | |
Benjamin C. Esty 1963 | | Trustee | | Since 2005 | | Roy and Elizabeth Simmons Professor of Business Administration and Finance Unit Head, Harvard University Graduate School of Business Administration. Directorships in the Last Five Years.(1) None. |
| | | |
Allen R. Freedman 1940 | | Trustee | | Since 2007 | | Private Investor. Former Chairman (2002-2004) and a Director (1983-2004) of Systems & Computer Technology Corp. (provider of software to higher education). Formerly, a Director of Loring Ward International (fund distributor) (2005-2007). Former Chairman and a Director of Indus International, Inc. (provider of enterprise management software to the power generating industry) (2005-2007). Former Chief Executive Officer of Assurant, Inc. (insurance provider) (1979-2000). Directorships in the Last Five Years.(1) Director of Stonemor Partners, L.P. (owner and operator of cemeteries). Formerly, Director of Assurant, Inc. (insurance provider) (1979-2011). |
| | | |
William H. Park 1947 | | Trustee | | Since 2003 | | Consultant and private investor. Formerly, Chief Financial Officer, Aveon Group L.P. (investment management firm) (2010-2011). Formerly, Vice Chairman, Commercial Industrial Finance Corp. (specialty finance company) (2006-2010). Formerly, President and Chief Executive Officer, Prizm Capital Management, LLC (investment management firm) (2002-2005). Formerly, Executive Vice President and Chief Financial Officer, United Asset Management Corporation (investment management firm) (1982-2001). Formerly, Senior Manager, Price Waterhouse (now PricewaterhouseCoopers) (an independent registered public accounting firm) (1972-1981). Directorships in the Last Five Years.(1) None. |
| | | |
Ronald A. Pearlman 1940 | | Trustee | | Since 2003 | | Professor of Law, Georgetown University Law Center. Formerly, Deputy Assistant Secretary (Tax Policy) and Assistant Secretary (Tax Policy), U.S. Department of the Treasury (1983-1985). Formerly, Chief of Staff, Joint Committee on Taxation, U.S. Congress (1988-1990). Directorships in the Last Five Years.(1) None. |
Parametric Global Small-Cap Fund
January 31, 2013
Management and Organization — continued
| | | | | | |
| Name and Year of Birth | | Position(s) with the
Trust | | Length of
Service | | Principal Occupation(s) and Directorships During Past Five Years and Other Relevant Experience |
Noninterested Trustees (continued) | | | | |
| | | |
Helen Frame Peters 1948 | | Trustee | | Since 2008 | | Professor of Finance, Carroll School of Management, Boston College. Formerly, Dean, Carroll School of Management, Boston College (2000-2002). Formerly, Chief Investment Officer, Fixed Income, Scudder Kemper Investments (investment management firm) (1998-1999). Formerly, Chief Investment Officer, Equity and Fixed Income, Colonial Management Associates (investment management firm) (1991-1998). Directorships in the Last Five Years.(1) Formerly, Director of BJ’s Wholesale Club, Inc. (wholesale club retailer) (2004-2011). Formerly, Trustee of SPDR Index Shares Funds and SPDR Series Trust (exchange traded funds) (2000-2009). Formerly, Director of Federal Home Loan Bank of Boston (a bank for banks) (2007-2009). |
| | | |
Lynn A. Stout 1957 | | Trustee | | Since 1998 | | Distinguished Professor of Corporate and Business Law, Jack G. Clarke Business Law Institute, Cornell University Law School. Formerly, the Paul Hastings Professor of Corporate and Securities Law (2006-2012) and Professor of Law (2001-2006), University of California at Los Angeles School of Law. Directorships in the Last Five Years.(1) None. |
| | | |
Harriett Tee Taggart 1948 | | Trustee | | Since 2011 | | Managing Director, Taggart Associates (a professional practice firm). Formerly, Partner and Senior Vice President, Wellington Management Company, LLP (investment management firm) (1983-2006). Directorships in the Last Five Years. Director of Albemarle Corporation (chemicals manufacturer) (since 2007) and The Hanover Group (specialty property and casualty insurance company) (since 2009). Formerly, Director of Lubrizol Corporation (specialty chemicals) (2007-2011). |
| | | |
Ralph F. Verni 1943 | | Chairman of the Board and Trustee | | Chairman of the Board since 2007 and Trustee since 2005 | | Consultant and private investor. Formerly, Chief Investment Officer (1982-1992), Chief Financial Officer (1988-1990) and Director (1982-1992), New England Life. Formerly, Chairperson, New England Mutual Funds (1982-1992). Formerly, President and Chief Executive Officer, State Street Management & Research (1992-2000). Formerly, Chairperson, State Street Research Mutual Funds (1992-2000). Formerly, Director, W.P. Carey, LLC (1998-2004) and First Pioneer Farm Credit Corp. (2002-2006). Directorships in the Last Five Years.(1) None. |
| | | |
| | | | | | |
Principal Officers who are not Trustees |
| Name and Year of Birth | | Position(s)
with the
Trust | | Length of Service | | Principal Occupation(s) During Past Five Years |
| | | |
Duncan W. Richardson 1957 | | President | | Since 2011 | | Director of EVC and Executive Vice President and Chief Equity Investment Officer of EVC, EVM and BMR. |
| | | |
Payson F. Swaffield 1956 | | Vice President | | Since 2011 | | Vice President and Chief Income Investment Officer of EVM and BMR. |
| | | |
Maureen A. Gemma 1960 | | Vice President, Secretary and Chief Legal Officer | | Vice President since 2011; Secretary since 2007 and Chief Legal Officer since 2008 | | Vice President of EVM and BMR. |
| | | |
James F. Kirchner(2) 1967 | | Treasurer | | Since 2013 | | Vice President of EVM and BMR. |
| | | |
Paul M. O’Neil 1953 | | Chief Compliance Officer | | Since 2004 | | Vice President of EVM and BMR. |
| (1) | During their respective tenures, the Trustees (except Mr. Eston and Ms. Taggart) also served as trustees of one or more of the following Eaton Vance funds (which operated in the years noted): Eaton Vance Credit Opportunities Fund (launched in 2005 and terminated in 2010); Eaton Vance Insured Florida Plus Municipal Bond Fund (launched in 2002 and terminated in 2009); and Eaton Vance National Municipal Income Trust (launched in 1998 and terminated in 2009). |
| (2) | Prior to 2013, Mr. Kirchner served as Assistant Treasurer of the Trust since 2007. |
The SAI for the Fund includes additional information about the Trustees and officers of the Fund and can be obtained without charge on Eaton Vance’s website at www.eatonvance.com or by calling 1-800-262-1122.
Eaton Vance Funds
IMPORTANT NOTICES
Privacy. The Eaton Vance organization is committed to ensuring your financial privacy. Each of the financial institutions identified below has in effect the following policy (“Privacy Policy”) with respect to nonpublic personal information about its customers:
| Ÿ | | Only such information received from you, through application forms or otherwise, and information about your Eaton Vance fund transactions will be collected. This may include information such as name, address, social security number, tax status, account balances and transactions. |
| Ÿ | | None of such information about you (or former customers) will be disclosed to anyone, except as permitted by law (which includes disclosure to employees necessary to service your account). In the normal course of servicing a customer’s account, Eaton Vance may share information with unaffiliated third parties that perform various required services such as transfer agents, custodians and broker-dealers. |
| Ÿ | | Policies and procedures (including physical, electronic and procedural safeguards) are in place that are designed to protect the confidentiality of such information. |
| Ÿ | | We reserve the right to change our Privacy Policy at any time upon proper notification to you. Customers may want to review our Privacy Policy periodically for changes by accessing the link on our homepage: www.eatonvance.com. |
Our pledge of privacy applies to the following entities within the Eaton Vance organization: the Eaton Vance Family of Funds, Eaton Vance Management, Eaton Vance Investment Counsel, Eaton Vance Distributors, Inc., Eaton Vance Trust Company, Eaton Vance Management’s Real Estate Investment Group and Boston Management and Research. In addition, our Privacy Policy applies only to those Eaton Vance customers who are individuals and who have a direct relationship with us. If a customer’s account (i.e., fund shares) is held in the name of a third-party financial advisor/broker-dealer, it is likely that only such advisor’s privacy policies apply to the customer. This notice supersedes all previously issued privacy disclosures. For more information about Eaton Vance’s Privacy Policy, please call 1-800-262-1122.
Delivery of Shareholder Documents. The Securities and Exchange Commission (SEC) permits funds to deliver only one copy of shareholder documents, including prospectuses, proxy statements and shareholder reports, to fund investors with multiple accounts at the same residential or post office box address. This practice is often called “householding” and it helps eliminate duplicate mailings to shareholders. Eaton Vance, or your financial advisor, may household the mailing of your documents indefinitely unless you instruct Eaton Vance, or your financial advisor, otherwise. If you would prefer that your Eaton Vance documents not be householded, please contact Eaton Vance at 1-800-262-1122, or contact your financial advisor. Your instructions that householding not apply to delivery of your Eaton Vance documents will be effective within 30 days of receipt by Eaton Vance or your financial advisor.
Portfolio Holdings. Each Eaton Vance Fund and its underlying Portfolio(s) (if applicable) will file a schedule of portfolio holdings on Form N-Q with the SEC for the first and third quarters of each fiscal year. The Form N-Q will be available on the Eaton Vance website at www.eatonvance.com, by calling Eaton Vance at 1-800-262-1122 or in the EDGAR database on the SEC’s website at www.sec.gov. Form N-Q may also be reviewed and copied at the SEC’s public reference room in Washington, D.C. (call 1-800-732-0330 for information on the operation of the public reference room).
Proxy Voting. From time to time, funds are required to vote proxies related to the securities held by the funds. The Eaton Vance Funds or their underlying Portfolios (if applicable) vote proxies according to a set of policies and procedures approved by the Funds’ and Portfolios’ Boards. You may obtain a description of these policies and procedures and information on how the Funds or Portfolios voted proxies relating to portfolio securities during the most recent 12-month period ended June 30, without charge, upon request, by calling 1-800-262-1122 and by accessing the SEC’s website at www.sec.gov.
Investment Adviser and Administrator
Eaton Vance Management
Two International Place
Boston, MA 02110
Sub-Adviser
Parametric Portfolio Associates LLC
1918 Eighth Avenue, Suite 3100
Seattle, WA 98101
Principal Underwriter*
Eaton Vance Distributors, Inc.
Two International Place
Boston, MA 02110
(617) 482-8260
Custodian
State Street Bank and Trust Company
200 Clarendon Street
Boston, MA 02116
Transfer Agent
BNY Mellon Asset Servicing (US) Inc.
Attn: Eaton Vance Funds
P.O. Box 9653
Providence, RI 02940-9653
(800) 262-1122
Independent Registered Public Accounting Firm
Deloitte & Touche LLP
200 Berkeley Street
Boston, MA 02116-5022
Fund Offices
Two International Place
Boston, MA 02110
| * | FINRA BrokerCheck. Investors may check the background of their Investment Professional by contacting the Financial Industry Regulatory Authority (FINRA). FINRA BrokerCheck is a free tool to help investors check the professional background of current and former FINRA-registered securities firms and brokers. FINRA BrokerCheck is available by calling 1-800-289-9999 and at www.FINRA.org. The FINRA BrokerCheck brochure describing the program is available to investors at www.FINRA.org. |
Item 2. Code of Ethics
Not required in this filing.
Item 3. Audit Committee Financial Expert
The registrant’s Board has designated William H. Park, an independent trustee, as its audit committee financial expert. Mr. Park is a certified public accountant who is a consultant and private investor. Previously, he served as the Chief Financial Officer of Aveon Group, L.P. (an investment management firm), as the Vice Chairman of Commercial Industrial Finance Corp. (specialty finance company), as President and Chief Executive Officer of Prizm Capital Management, LLC (investment management firm), as Executive Vice President and Chief Financial Officer of United Asset Management Corporation (an institutional investment management firm) and as a Senior Manager at Price Waterhouse (now PricewaterhouseCoopers) (an independent registered public accounting firm).
Item 4. Principal Accountant Fees and Services
(a)-(d)
Parametric Global Small-Cap Fund, Eaton Vance Parametric Structured International Equity Fund (currently known as Parametric International Equity Fund) and Eaton Vance Parametric Structured Emerging Markets Fund (currently known as Parametric Emerging Markets Fund) (the “Fund(s)”) are series of Eaton Vance Mutual Funds Trust (the “Trust”), a Massachusetts business trust, which, including the Funds, contains a total of 34 series (the “Series”). The Trust is registered under the Investment Company Act of 1940 as an open-end management investment company. This Form N-CSR relates to the Funds’ annual reports.
The following table presents the aggregate fees billed to each Fund for the Fund’s fiscal year ended January 31, 2012 (three months ended January 31, 2012 for Eaton Vance Parametric Structured Emerging Markets Fund) and fiscal year ended January 31, 2013 (period from December 31, 2012 through January 31, 2013 for Parametric Global Small-Cap Fund) by the Fund’s principal accountant, Deloitte & Touche LLP (“D&T”), for professional services rendered for the audit of the Fund’s annual financial statements and fees billed for other services rendered by D&T during such periods.
| | | | |
Parametric Global Small-Cap Fund* Fiscal Year Ended | | 1/31/13 | |
Audit Fees | | $ | 19,550 | |
Audit-Related Fees(1) | | $ | 0 | |
Tax Fees(2) | | $ | 10,240 | |
All Other Fees(3) | | $ | 0 | |
| | | | |
Total | | $ | 29,790 | |
| | | | |
| * | Fund commenced operations on December 20, 2012. |
| | | | | | | | |
Eaton Vance Parametric Structured International Equity Fund (currently known as Parametric International Equity Fund) Fiscal Years Ended | | 1/31/12 | | | 1/31/13 | |
Audit Fees | | $ | 21,750 | | | $ | 23,310 | |
Audit-Related Fees(1) | | $ | 0 | | | $ | 0 | |
Tax Fees(2) | | $ | 11,620 | | | $ | 13,160 | |
All Other Fees(3) | | $ | 1,200 | | | $ | 0 | |
| | | | | | | | |
Total | | $ | 34,570 | | | $ | 36,470 | |
| | | | | | | | |
| | |
Eaton Vance Parametric Structured Emerging Markets Fund (currently known as Parametric Emerging Markets Fund) Fiscal Years Ended | | 1/31/12** | | | 1/31/13 | |
Audit Fees | | $ | 66,550 | | | $ | 73,670 | |
Audit-Related Fees(1) | | $ | 0 | | | $ | 0 | |
Tax Fees(2) | | $ | 13,800 | | | $ | 32,090 | |
All Other Fees(3) | | $ | 900 | | | $ | 0 | |
| | | | | | | | |
Total | | $ | 81,250 | | | $ | 105,760 | |
| | | | | | | | |
| ** | Fund changed its fiscal year end from October 31 to January 31. Fees presented are for the fiscal period from November 1, 2011 to January 31, 2012. |
| (1) | Audit-related fees consist of the aggregate fees billed for assurance and related services that are reasonably related to the performance of the audit of financial statements and are not reported under the category of audit fees. |
| (2) | Tax fees consist of the aggregate fees billed for professional services rendered by the principal accountant relating to tax compliance, tax advice, and tax planning and specifically include fees for tax return preparation. |
| (3) | All other fees consist of the aggregate fees billed for products and services provided by the principal accountant other than audit, audit-related, and tax services. |
The various Series comprising the Trust have differing fiscal year ends* (January 31, September 30, October 31, November 30 or December 31). The following table presents the aggregate audit, audit-related, tax, and other fees billed to all of the Series in the Trust by D&T for the last two fiscal years of each Series.
| | | | | | | | | | | | | | | | | | | | | | | | | | | | | | | | | | | | |
Fiscal Years Ended* | | 9/30/11 | | | 10/31/11 | | | 12/31/11 | | | 1/31/12 | | | 9/30/12 | | | 10/31/12 | | | 11/30/12 | | | 12/31/12 | | | 1/31/13 | |
Audit Fees | | $ | 31,865 | | | $ | 522,885 | | | $ | 135,300 | | | $ | 88,300 | | | $ | 109,600 | | | $ | 524,630 | | | $ | 19,550 | | | $ | 88,479 | | | $ | 116,530 | |
Audit-Related Fees(1) | | $ | 0 | | | $ | 0 | | | $ | 0 | | | $ | 0 | | | $ | 0 | | | $ | 0 | | | $ | 0 | | | $ | 0 | | | $ | 0 | |
Tax Fees(2) | | $ | 15,580 | | | $ | 250,180 | | | $ | 51,570 | | | $ | 25,420 | | | $ | 28,740 | | | $ | 281,940 | | | $ | 8,000 | | | $ | 55,380 | | | $ | 55,490 | |
All Other Fees(3) | | $ | 600 | | | $ | 22,300 | | | $ | 1,500 | | | $ | 2,100 | | | $ | 620 | | | $ | 0 | | | $ | 310 | | | $ | 0 | | | $ | 0 | |
| | | | | | | | | | | | | | | | | | | | | | | | | | | | | | | | | | | | |
Total | | $ | 48,045 | | | $ | 795,365 | | | $ | 188,370 | | | $ | 115,820 | | | $ | 138,960 | | | $ | 806,570 | | | $ | 27,860 | | | $ | 143,859 | | | $ | 172,020 | |
| | | | | | | | | | | | | | | | | | | | | | | | | | | | | | | | | | | | |
| * | Information is not presented for fiscal year 11/30/11, as no Series in the Trust with such fiscal year end was in operation during that period. |
| (1) | Audit-related fees consist of the aggregate fees billed for assurance and related services that are reasonably related to the performance of the audit of financial statements and are not reported under the category of audit fees. |
| (2) | Tax fees consist of the aggregate fees billed for professional services rendered by the principal accountant relating to tax compliance, tax advice, and tax planning and specifically include fees for tax return preparation. |
| (3) | All other fees consist of the aggregate fees billed for products and services provided by the principal accountant other than audit, audit-related, and tax services. |
(e)(1) The registrant’s audit committee has adopted policies and procedures relating to the pre-approval of services provided by the registrant’s principal accountant (the “Pre-Approval Policies”). The Pre-Approval Policies establish a framework intended to assist the audit committee in the proper discharge of its pre-approval responsibilities. As a general matter, the Pre-Approval Policies (i) specify certain types of audit, audit-related, tax, and other services determined to be pre-approved by the audit committee; and (ii) delineate specific procedures governing the mechanics of the pre-approval process, including the approval and monitoring of audit and non-audit service fees. Unless a service is specifically pre-approved under the Pre-Approval Policies, it must be separately pre-approved by the audit committee.
The Pre-Approval Policies and the types of audit and non-audit services pre-approved therein must be reviewed and ratified by the registrant’s audit committee at least annually. The registrant’s audit committee maintains full responsibility for the appointment, compensation, and oversight of the work of the registrant’s principal accountant.
(e)(2) No services described in paragraphs (b)-(d) above were approved by the registrant’s audit committee pursuant to the “de minimis exception” set forth in Rule 2-01(c)(7)(i)(C) of Regulation S-X.
(f) Not applicable.
(g) The following table presents (i) the aggregate non-audit fees (i.e., fees for audit-related, tax, and other services) billed for services rendered to all of the Series in the Trust by D&T for the last two fiscal years of each Series; and (ii) the aggregate non-audit fees (i.e., fees for audit-related, tax, and other services) billed to the Eaton Vance organization by D&T for the last two fiscal years of each Series.
| | | | | | | | | | | | | | | | | | | | | | | | | | | | | | | | | | | | |
Fiscal Years Ended* | | 9/30/11 | | | 10/31/11 | | | 12/31/11 | | | 1/31/12 | | | 9/30/12 | | | 10/31/12 | | | 11/30/12 | | | 12/31/12 | | | 1/31/13 | |
Registrant(1) | | $ | 16,180 | | | $ | 272,480 | | | $ | 53,070 | | | $ | 27,520 | | | $ | 29,360 | | | $ | 281,940 | | | $ | 8,310 | | | $ | 55,380 | | | $ | 55,490 | |
Eaton Vance(2) | | $ | 226,431 | | | $ | 266,431 | | | $ | 334,561 | | | $ | 414,561 | | | $ | 606,619 | | | $ | 566,619 | | | $ | 662,119 | | | $ | 615,489 | | | $ | 544,549 | |
| * | Information is not presented for fiscal year 11/30/11, as no Series in the Trust with such fiscal year end was in operation during that period. |
| (1) | Includes all of the Series of the Trust. During the fiscal years reported above, certain of the Funds were “feeder” funds in a “master-feeder” fund structure or funds of funds. |
| (2) | Various subsidiaries of Eaton Vance Corp. act in either an investment advisory and/or service provider capacity with respect to the Series and/or their respective “master” funds (if applicable). |
(h) The registrant’s audit committee has considered whether the provision by the registrant’s principal accountant of non-audit services to the registrant’s investment adviser and any entity controlling,
controlled by, or under common control with the adviser that provides ongoing services to the registrant that were not pre-approved pursuant to Rule 2-01(c)(7)(ii) of Regulation S-X is compatible with maintaining the principal accountant’s independence.
Item 5. Audit Committee of Listed Registrants
Not required in this filing.
Item 6. Schedule of Investments
Please see schedule of investments contained in the Report to Stockholders included under Item 1 of this Form N-CSR.
Item 7. Disclosure of Proxy Voting Policies and Procedures for Closed-End Management Investment Companies
Not required in this filing.
Item 8. Portfolio Managers of Closed-End Management Investment Companies
Not required in this filing.
Item 9. Purchases of Equity Securities by Closed-End Management Investment Company and Affiliated Purchasers
Not required in this filing.
Item 10. Submission of Matters to a Vote of Security Holders
No Material Changes.
Item 11. Controls and Procedures
(a) It is the conclusion of the registrant’s principal executive officer and principal financial officer that the effectiveness of the registrant’s current disclosure controls and procedures (such disclosure controls and procedures having been evaluated within 90 days of the date of this filing) provide reasonable assurance that the information required to be disclosed by the registrant has been recorded, processed, summarized and reported within the time period specified in the Commission’s rules and forms and that the information required to be disclosed by the registrant has been accumulated and communicated to the registrant’s principal executive officer and principal financial officer in order to allow timely decisions regarding required disclosure.
(b) There have been no changes in the registrant’s internal controls over financial reporting during the second fiscal quarter of the period covered by this report that has materially affected, or is reasonably likely to materially affect, the registrant’s internal control over financial reporting.
Item 12. Exhibits
| | |
| |
| (a)(1) | | Registrant’s Code of Ethics – Not applicable (please see Item 2). |
| |
| (a)(2)(i) | | Treasurer’s Section 302 certification. |
| |
| (a)(2)(ii) | | President’s Section 302 certification. |
| |
| (b) | | Combined Section 906 certification. |
Signatures
Pursuant to the requirements of the Securities Exchange Act of 1934 and the Investment Company Act of 1940, the registrant has duly caused this report to be signed on its behalf by the undersigned, thereunto duly authorized.
Eaton Vance Mutual Funds Trust
| | |
| By: | | /s/ Duncan W. Richardson |
| | Duncan W. Richardson |
| | President |
Date: March 18, 2013
Pursuant to the requirements of the Securities Exchange Act of 1934 and the Investment Company Act of 1940, this report has been signed below by the following persons on behalf of the registrant and in the capacities and on the dates indicated.
| | |
| By: | | /s/ James F. Kirchner |
| | James F. Kirchner |
| | Treasurer |
Date: March 18, 2013
| | |
| By: | | /s/ Duncan W. Richardson |
| | Duncan W. Richardson |
| | President |
Date: March 18, 2013