UNITED STATES
SECURITIES AND EXCHANGE COMMISSION
Washington, D.C. 20549
Form N-CSR
CERTIFIED SHAREHOLDER REPORT OF REGISTERED
MANAGEMENT INVESTMENT COMPANIES
Investment Company Act File Number: 811-04015
Eaton Vance Mutual Funds Trust
(Exact Name of Registrant as Specified in Charter)
Two International Place, Boston, Massachusetts 02110
(Address of Principal Executive Offices)
Maureen A. Gemma
Two International Place, Boston, Massachusetts 02110
(Name and Address of Agent for Services)
(617) 482-8260
(Registrant’s Telephone Number)
September 30
Date of Fiscal Year End
September 30, 2013
Date of Reporting Period
Item 1. Reports to Stockholders

Eaton Vance
Atlanta Capital Horizon
Growth Fund
Annual Report
September 30, 2013

Commodity Futures Trading Commission Registration. Effective December 31, 2012, the Commodity Futures Trading Commission (“CFTC”) adopted certain regulatory changes that subject registered investment companies and advisers to regulation by the CFTC if a fund invests more than a prescribed level of its assets in certain CFTC-regulated instruments (including futures, certain options and swap agreements) or markets itself as providing investment exposure to such instruments. The Fund has claimed an exclusion from the definition of the term “commodity pool operator” under the Commodity Exchange Act and is not subject to the CFTC regulation. Because of its management of other strategies, the Fund’s adviser is registered with the CFTC as a commodity pool operator.
Fund shares are not insured by the FDIC and are not deposits or other obligations of, or guaranteed by, any depository institution. Shares are subject to investment risks, including possible loss of principal invested.
This report must be preceded or accompanied by a current summary prospectus or prospectus. Before investing, investors should consider carefully the investment objective, risks, and charges and expenses of a mutual fund. This and other important information is contained in the summary prospectus and prospectus, which can be obtained from a financial advisor. Prospective investors should read the prospectus carefully before investing. For further information, please call 1-800-262-1122.
Annual Report September 30, 2013
Eaton Vance
Atlanta Capital Horizon Growth Fund
Table of Contents
| | | | |
Management’s Discussion of Fund Performance | | | 2 | |
| |
Performance | | | 3 | |
| |
Fund Profile | | | 4 | |
| |
Endnotes and Additional Disclosures | | | 5 | |
| |
Fund Expenses | | | 6 | |
| |
Financial Statements | | | 7 | |
| |
Report of Independent Registered Public Accounting Firm | | | 21 | |
| |
Federal Tax Information | | | 22 | |
| |
Board of Trustees’ Contract Approval | | | 23 | |
| |
Management and Organization | | | 26 | |
| |
Important Notices | | | 28 | |
Eaton Vance
Atlanta Capital Horizon Growth Fund
September 30, 2013
Management’s Discussion of Fund Performance1
Economic and Market Conditions
At the outset of the 12-month period on October 1, 2012, the U.S. equity market was at the tail end of a summer-long rally. From early October through late December 2012, U.S. stocks gave back some of their gains, as investors worried about a Congressional budget impasse that left the United States rushing toward a self-imposed, so-called “fiscal cliff.” In the final days of 2012, however, a deal that averted the cliff sparked an equity rally that continued into May 2013. The rally was driven largely by strengthening U.S. economic data, as employment slowly improved and the housing market appeared to have finally turned the corner after its 2008 collapse.
In late May 2013, U.S. Federal Reserve (the Fed) Chairman Ben Bernanke surprised the markets by indicating that the Fed’s $85 billion in monthly asset purchases, known collectively as quantitative easing (QE), could begin to taper off sooner than most investors had expected. The negative effect on the markets was swift and dramatic. Bond investors rushed to sell assets in anticipation of rising interest rates. The prospect of reduced Fed stimulus weighed on equities as well.
By late June 2013, however, U.S. equities resumed their upward trajectory. The S&P 500 Index2, a broad measure of the U.S. stock market, closed at a new all-time high on August 2, 2013. Factors contributing to the rally included some backtracking by the Fed on its earlier statements regarding QE, ongoing improvements in housing and other U.S. economic data, and news from Europe that the eurozone had officially come out of its recession.
In the final weeks of August 2013, equities faltered again, as investors worried that a U.S. strike on Syria could lead to a spike in oil prices. As those concerns faded, equities once more trended upward. When the Fed again surprised investors by announcing in September 2013 that it was postponing any tapering of QE for the time being, the S&P 500 Index surged to yet another all-time high in intraday trading on September 18, 2013.
After that, stocks drifted downward through the end of the 12-month period, as it became increasingly apparent that another Congressional deadlock could lead to a partial government shutdown on October 1, 2013.
Fund Performance
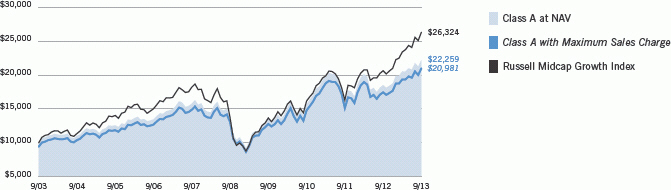
For the 12-month period ended September 30, 2013, Eaton Vance Atlanta Capital Horizon Growth Fund (the Fund) had a total return of 20.25% for Class A shares at net asset value
(NAV). By comparison, the Fund’s benchmark, the Russell Midcap Growth Index (the Index), returned 27.54% for the same period.
The Fund underperformed the Index largely due to stock selection, with sector allocation also detracting from performance versus the Index. Of the 10 economic sectors in the Index, the Fund achieved positive absolute returns in all eight sectors in which it was invested. The Index had positive returns in all 10 sectors.
The Fund’s worst-performing sector relative to the Index was consumer discretionary, due to both stock selection and an underweight in the strong-performing sector. Within consumer discretionary, the textiles, apparel & luxury goods industry was a notable detractor from Fund performance versus the Index, with a leading footwear company among the Fund’s weakest-performing individual stocks. The information technology (IT) sector was also a drag on Fund performance versus the Index as a result of both stock selection and an overweight in the underperforming sector. Within IT, the stock of a leading chip maker in the semiconductor & semiconductor equipment industry was hurt by a new product delay and increased competition. Another underperforming sector in the Fund for the 12-month period was energy, where the oil, gas & consumable fuels industry was a notable laggard. Overall, the Fund’s worst-performing individual stock was a financial data and index provider that suffered a major client loss during the period.
On the positive side, materials was the Fund’s top-performing sector relative to the Index, due primarily to stock selection. The Fund’s investment in a leading supplier of commercial cleaning products in the chemicals industry outperformed relative to the Index after announcing strong financial results. The Fund’s lack of holdings in the underperforming metals & mining industry also contributed to performance versus the Index. In the industrials sector, an overweight along with stock selection helped the Fund’s performance versus the Index for the 12-month period. For example, one of the Fund’s top-performing individual stocks was a large engineering and construction firm that benefited from rising infrastructure and energy industry spending. The Fund’s lack of exposure to two underperforming sectors, telecommunication services and utilities, also contributed to performance relative to the Index. Overall, the Fund’s best-performing individual stock was a leading genetic testing company in the health care sector that benefited from technological advances during the period.
See Endnotes and Additional Disclosures in this report.
Past performance is no guarantee of future results. Returns are historical and are calculated by determining the percentage change in net asset value (NAV) or offering price (as applicable) with all distributions reinvested. Investment return and principal value will fluctuate so that shares, when redeemed, may be worth more or less than their original cost. Performance less than one year is cumulative. Performance is for the stated time period only; due to market volatility, the Fund’s current performance may be lower or higher than quoted. Returns are before taxes unless otherwise noted. For performance as of the most recent month end, please refer to www.eatonvance.com.
Eaton Vance
Atlanta Capital Horizon Growth Fund
September 30, 2013
Performance2,3
Portfolio Managers Richard B. England, CFA, Brian P. Mansfield and Glenn H. Shaw, CFA, each of Atlanta Capital Management Company, LLC.
| | | | | | | | | | | | | | | | | | | | |
| % Average Annual Total Returns | | Class Inception Date | | | Performance
Inception Date | | | One Year | | | Five Years | | | Ten Years | |
Class A at NAV | | | 03/04/2002 | | | | 03/04/2002 | | | | 20.25 | % | | | 9.90 | % | | | 8.32 | % |
Class A with 5.75% Maximum Sales Charge | | | — | | | | — | | | | 13.32 | | | | 8.60 | | | | 7.69 | |
Class B at NAV | | | 03/04/2002 | | | | 03/04/2002 | | | | 19.35 | | | | 9.07 | | | | 7.52 | |
Class B with 5% Maximum Sales Charge | | | — | | | | — | | | | 14.35 | | | | 8.79 | | | | 7.52 | |
Class C at NAV | | | 03/04/2002 | | | | 03/04/2002 | | | | 19.36 | | | | 9.06 | | | | 7.52 | |
Class C with 1% Maximum Sales Charge | | | — | | | | — | | | | 18.36 | | | | 9.06 | | | | 7.52 | |
Class I at NAV | | | 05/02/2011 | | | | 03/04/2002 | | | | 20.50 | | | | 10.02 | | | | 8.38 | |
Russell Midcap Growth Index | | | — | | | | — | | | | 27.54 | % | | | 13.91 | % | | | 10.15 | % |
| | | | | |
| | | | | | | | | | | | | | | | | | | | |
| % Total Annual Operating Expense Ratios4 | | | | | Class A | | | Class B | | | Class C | | | Class I | |
Gross | | | | | | | 1.72 | % | | | 2.47 | % | | | 2.47 | % | | | 1.47 | % |
Net | | | | | | | 1.40 | | | | 2.15 | | | | 2.15 | | | | 1.15 | |
Growth of $10,000
This graph shows the change in value of a hypothetical investment of $10,000 in Class A of the Fund for the period indicated. For comparison, the same investment is shown in the indicated index.
| | | | | | | | |
| Growth of Investment | | Amount Invested | | Period Beginning | | At NAV | | With Maximum
Sales Charge |
Class B | | $10,000 | | 09/30/2003 | | $20,653 | | N.A. |
Class C | | $10,000 | | 09/30/2003 | | $20,664 | | N.A. |
Class I | | $250,000 | | 09/30/2003 | | $559,638 | | N.A. |
See Endnotes and Additional Disclosures in this report.
Past performance is no guarantee of future results. Returns are historical and are calculated by determining the percentage change in net asset value (NAV) or offering price (as applicable) with all distributions reinvested. Investment return and principal value will fluctuate so that shares, when redeemed, may be worth more or less than their original cost. Performance less than one year is cumulative. Performance is for the stated time period only; due to market volatility, the Fund’s current performance may be lower or higher than quoted. Returns are before taxes unless otherwise noted. For performance as of the most recent month end, please refer to www.eatonvance.com.
Eaton Vance
Atlanta Capital Horizon Growth Fund
September 30, 2013
Fund Profile
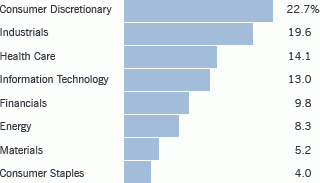
Sector Allocation (% of net assets)5
Top 10 Holdings (% of net assets)5
| | | | |
| |
| Waste Connections, Inc. | | | 3.3 | % |
| |
| Amphenol Corp., Class A | | | 2.9 | |
| |
| B/E Aerospace, Inc. | | | 2.9 | |
| |
| Chicago Bridge & Iron Co. NV - NY Shares | | | 2.8 | |
| |
| Airgas, Inc. | | | 2.8 | |
| |
| IntercontinentalExchange, Inc. | | | 2.6 | |
| |
| Affiliated Managers Group, Inc. | | | 2.5 | |
| |
| TreeHouse Foods, Inc. | | | 2.5 | |
| |
| Perrigo Co. | | | 2.5 | |
| |
| Ecolab, Inc. | | | 2.4 | |
| |
| Total | | | 27.2 | % |
See Endnotes and Additional Disclosures in this report.
Eaton Vance
Atlanta Capital Horizon Growth Fund
September 30, 2013
Endnotes and Additional Disclosures
| 1 | The views expressed in this report are those of the portfolio manager(s) and are current only through the date stated at the top of this page. These views are subject to change at any time based upon market or other conditions, and Eaton Vance and the Fund(s) disclaim any responsibility to update such views. These views may not be relied upon as investment advice and, because investment decisions are based on many factors, may not be relied upon as an indication of trading intent on behalf of any Eaton Vance fund. This commentary may contain statements that are not historical facts, referred to as “forward looking statements”. The Fund’s actual future results may differ significantly from those stated in any forward looking statement, depending on factors such as changes in securities or financial markets or general economic conditions, the volume of sales and purchases of Fund shares, the continuation of investment advisory, administrative and service contracts, and other risks discussed from time to time in the Fund’s filings with the Securities and Exchange Commission. |
| 2 | S&P 500 Index is an unmanaged index of large-cap stocks commonly used as a measure of U.S. stock market performance. Russell Midcap Growth Index is an unmanaged index of U.S. mid- cap growth stocks. Unless otherwise stated, index returns do not reflect the effect of any applicable sales charges, commissions, expenses, taxes or leverage, as applicable. It is not possible to invest directly in an index. |
| 3 | Total Returns at NAV do not include applicable sales charges. If sales charges were deducted, the returns would be lower. Total Returns shown with maximum sales charge reflect the stated maximum sales charge. Unless otherwise stated, performance does not reflect the deduction of taxes on Fund distributions or redemptions of Fund shares. |
| | Performance prior to the inception date of a class may be linked to the performance of an older class of the Fund. This linked performance is adjusted for any applicable sales charge, but is not adjusted for class expense differences. If adjusted for such differences, the performance would be different. Performance presented in the financial highlights included in the financial statements is not linked. In the performance table, the performance of Class I is linked to Class A. Performance since inception for an index, if presented, is the performance since the Fund’s or oldest share class’ inception, as applicable. |
| 4 | Source: Fund prospectus. Net expense ratio reflects a contractual expense reimbursement that continues through 1/31/14. Without the reimbursement, performance would have been lower. |
| 5 | Excludes cash and cash equivalents. |
| | Fund profile subject to change due to active management. |
Eaton Vance
Atlanta Capital Horizon Growth Fund
September 30, 2013
Fund Expenses
Example: As a Fund shareholder, you incur two types of costs: (1) transaction costs, including sales charges (loads) on purchases and redemption fees (if applicable); and (2) ongoing costs, including management fees; distribution and/or service fees; and other Fund expenses. This Example is intended to help you understand your ongoing costs (in dollars) of Fund investing and to compare these costs with the ongoing costs of investing in other mutual funds. The Example is based on an investment of $1,000 invested at the beginning of the period and held for the entire period (April 1, 2013 – September 30, 2013).
Actual Expenses: The first section of the table below provides information about actual account values and actual expenses. You may use the information in this section, together with the amount you invested, to estimate the expenses that you paid over the period. Simply divide your account value by $1,000 (for example, an $8,600 account value divided by $1,000 = 8.6), then multiply the result by the number in the first section under the heading entitled “Expenses Paid During Period” to estimate the expenses you paid on your account during this period.
Hypothetical Example for Comparison Purposes: The second section of the table below provides information about hypothetical account values and hypothetical expenses based on the actual Fund expense ratio and an assumed rate of return of 5% per year (before expenses), which is not the actual Fund return. The hypothetical account values and expenses may not be used to estimate the actual ending account balance or expenses you paid for the period. You may use this information to compare the ongoing costs of investing in your Fund and other funds. To do so, compare this 5% hypothetical example with the 5% hypothetical examples that appear in the shareholder reports of the other funds.
Please note that the expenses shown in the table are meant to highlight your ongoing costs only and do not reflect any transactional costs, such as sales charges (loads) or redemption fees (if applicable). Therefore, the second section of the table is useful in comparing ongoing costs only, and will not help you determine the relative total costs of owning different funds. In addition, if these transactional costs were included, your costs would be higher.
| | | | | | | | | | | | | | | | |
| | | Beginning
Account Value
(4/1/13) | | | Ending
Account Value
(9/30/13) | | | Expenses Paid
During Period*
(4/1/13 – 9/30/13) | | | Annualized
Expense
Ratio | |
| | | | |
| | | | | | | | | | | | | | | | |
Actual | | | | | | | | | | | | | |
Class A | | $ | 1,000.00 | | | $ | 1,084.10 | | | $ | 7.31 | ** | | | 1.40 | % |
Class B | | $ | 1,000.00 | | | $ | 1,080.30 | | | $ | 11.21 | ** | | | 2.15 | % |
Class C | | $ | 1,000.00 | | | $ | 1,080.30 | | | $ | 11.21 | ** | | | 2.15 | % |
Class I | | $ | 1,000.00 | | | $ | 1,085.10 | | | $ | 6.01 | ** | | | 1.15 | % |
| | | | | | | | | | | | | | | | | |
| | | | |
| | | | | | | | | | | | | | | | |
Hypothetical | | | | | | | | | | | | | |
(5% return per year before expenses) | | | | | | | | | | | | | |
Class A | | $ | 1,000.00 | | | $ | 1,018.00 | | | $ | 7.08 | ** | | | 1.40 | % |
Class B | | $ | 1,000.00 | | | $ | 1,014.30 | | | $ | 10.86 | ** | | | 2.15 | % |
Class C | | $ | 1,000.00 | | | $ | 1,014.30 | | | $ | 10.86 | ** | | | 2.15 | % |
Class I | | $ | 1,000.00 | | | $ | 1,019.30 | | | $ | 5.82 | ** | | | 1.15 | % |
| * | Expenses are equal to the Fund’s annualized expense ratio for the indicated Class, multiplied by the average account value over the period, multiplied by 183/365 (to reflect the one-half year period). The Example assumes that the $1,000 was invested at the net asset value per share determined at the close of business on March 31, 2013. |
| ** | Absent an allocation of certain expenses to affiliates, the expenses would be higher. |
Eaton Vance
Atlanta Capital Horizon Growth Fund
September 30, 2013
Portfolio of Investments
| | | | | | | | |
| Common Stocks — 96.7% | |
| | |
| | | | | | | | |
| Security | | Shares | | | Value | |
| | | | | | | | |
|
Aerospace & Defense — 2.9% | |
B/E Aerospace, Inc.(1) | | | 14,583 | | | $ | 1,076,517 | |
| | |
| | | | | | $ | 1,076,517 | |
| | |
|
Beverages — 1.5% | |
Dr Pepper Snapple Group, Inc. | | | 12,158 | | | $ | 544,922 | |
| | |
| | | | | | $ | 544,922 | |
| | |
|
Capital Markets — 2.5% | |
Affiliated Managers Group, Inc.(1) | | | 5,210 | | | $ | 951,555 | |
| | |
| | | | | | $ | 951,555 | |
| | |
|
Chemicals — 5.2% | |
Airgas, Inc. | | | 9,749 | | | $ | 1,033,881 | |
Ecolab, Inc. | | | 9,198 | | | | 908,395 | |
| | |
| | | | | | $ | 1,942,276 | |
| | |
|
Commercial Banks — 2.4% | |
First Republic Bank | | | 19,076 | | | $ | 889,514 | |
| | |
| | | | | | $ | 889,514 | |
| | |
|
Commercial Services & Supplies — 5.4% | |
Stericycle, Inc.(1) | | | 6,871 | | | $ | 792,913 | |
Waste Connections, Inc. | | | 26,772 | | | | 1,215,717 | |
| | |
| | | | | | $ | 2,008,630 | |
| | |
|
Communications Equipment — 3.3% | |
F5 Networks, Inc.(1) | | | 5,336 | | | $ | 457,615 | |
Juniper Networks, Inc.(1) | | | 39,803 | | | | 790,488 | |
| | |
| | | | | | $ | 1,248,103 | |
| | |
|
Construction & Engineering — 2.8% | |
Chicago Bridge & Iron Co. NV – NY Shares | | | 15,502 | | | $ | 1,050,571 | |
| | |
| | | | | | $ | 1,050,571 | |
| | |
|
Diversified Financial Services — 2.6% | |
IntercontinentalExchange, Inc.(1) | | | 5,259 | | | $ | 954,088 | |
| | |
| | | | | | $ | 954,088 | |
| | |
|
Electrical Equipment — 2.4% | |
AMETEK, Inc. | | | 11,101 | | | $ | 510,868 | |
Rockwell Automation, Inc. | | | 3,683 | | | | 393,860 | |
| | |
| | | | | | $ | 904,728 | |
| | |
| | | | | | | | |
| Security | | Shares | | | Value | |
| | | | | | | | |
|
Electronic Equipment, Instruments & Components — 2.9% | |
Amphenol Corp., Class A | | | 13,932 | | | $ | 1,078,058 | |
| | |
| | | | | | $ | 1,078,058 | |
| | |
|
Energy Equipment & Services — 6.8% | |
Cameron International Corp.(1) | | | 10,571 | | | $ | 617,029 | |
Core Laboratories NV | | | 3,908 | | | | 661,273 | |
Noble Corp. | | | 9,478 | | | | 357,984 | |
Oceaneering International, Inc. | | | 5,063 | | | | 411,318 | |
Weatherford International, Ltd.(1) | | | 32,555 | | | | 499,068 | |
| | |
| | | | | | $ | 2,546,672 | |
| | |
|
Food Products — 2.5% | |
TreeHouse Foods, Inc.(1) | | | 13,917 | | | $ | 930,073 | |
| | |
| | | | | | $ | 930,073 | |
| | |
|
Health Care Equipment & Supplies — 1.7% | |
Varian Medical Systems, Inc.(1) | | | 8,547 | | | $ | 638,717 | |
| | |
| | | | | | $ | 638,717 | |
| | |
|
Health Care Providers & Services — 3.0% | |
Catamaran Corp.(1) | | | 12,470 | | | $ | 572,997 | |
DaVita HealthCare Partners, Inc.(1) | | | 9,496 | | | | 540,322 | |
| | |
| | | | | | $ | 1,113,319 | |
| | |
|
Health Care Technology — 1.6% | |
Cerner Corp.(1) | | | 11,178 | | | $ | 587,404 | |
| | |
| | | | | | $ | 587,404 | |
| | |
|
Hotels, Restaurants & Leisure — 3.4% | |
Arcos Dorados Holdings, Inc., Class A | | | 26,471 | | | $ | 313,681 | |
Panera Bread Co., Class A(1) | | | 1,482 | | | | 234,942 | |
Wynn Resorts, Ltd. | | | 4,592 | | | | 725,582 | |
| | |
| | | | | | $ | 1,274,205 | |
| | |
|
Insurance — 2.3% | |
Markel Corp.(1) | | | 1,663 | | | $ | 861,052 | |
| | |
| | | | | | $ | 861,052 | |
| | |
|
Internet & Catalog Retail — 1.6% | |
priceline.com, Inc.(1) | | | 580 | | | $ | 586,351 | |
| | |
| | | | | | $ | 586,351 | |
| | |
| | | | |
| | 7 | | See Notes to Financial Statements. |
Eaton Vance
Atlanta Capital Horizon Growth Fund
September 30, 2013
Portfolio of Investments — continued
| | | | | | | | |
| Security | | Shares | | | Value | |
| | | | | | | | |
|
Internet Software & Services — 2.0% | |
MercadoLibre, Inc. | | | 5,655 | | | $ | 762,916 | |
| | |
| | | | | | $ | 762,916 | |
| | |
|
IT Services — 0.7% | |
Alliance Data Systems Corp.(1) | | | 1,194 | | | $ | 252,495 | |
| | |
| | | | | | $ | 252,495 | |
| | |
|
Life Sciences Tools & Services — 4.6% | |
Illumina, Inc.(1) | | | 10,648 | | | $ | 860,678 | |
Mettler-Toledo International, Inc.(1) | | | 3,539 | | | | 849,678 | |
| | |
| | | | | | $ | 1,710,356 | |
| | |
|
Machinery — 1.7% | |
IDEX Corp. | | | 9,479 | | | $ | 618,505 | |
| | |
| | | | | | $ | 618,505 | |
| | |
|
Multiline Retail — 4.1% | |
Dollar Tree, Inc.(1) | | | 13,915 | | | $ | 795,381 | |
Nordstrom, Inc. | | | 13,054 | | | | 733,635 | |
| | |
| | | | | | $ | 1,529,016 | |
| | |
|
Oil, Gas & Consumable Fuels — 1.5% | |
Denbury Resources, Inc.(1) | | | 30,480 | | | $ | 561,137 | |
| | |
| | | | | | $ | 561,137 | |
| | |
|
Pharmaceuticals — 3.3% | |
Allergan, Inc. | | | 3,423 | | | $ | 309,610 | |
Perrigo Co. | | | 7,438 | | | | 917,701 | |
| | |
| | | | | | $ | 1,227,311 | |
| | |
|
Professional Services — 1.4% | |
IHS, Inc.(1) | | | 4,756 | | | $ | 543,040 | |
| | |
| | | | | | $ | 543,040 | |
| | |
|
Road & Rail — 1.0% | |
J.B. Hunt Transport Services, Inc. | | | 4,985 | | | $ | 363,556 | |
| | |
| | | | | | $ | 363,556 | |
| | |
|
Semiconductors & Semiconductor Equipment — 1.6% | |
Broadcom Corp., Class A | | | 22,334 | | | $ | 580,907 | |
| | |
| | | | | | $ | 580,907 | |
| | |
| | | | | | | | |
| Security | | Shares | | | Value | |
| | | | | | | | |
|
Software — 2.5% | |
Informatica Corp.(1) | | | 16,060 | | | $ | 625,858 | |
Red Hat, Inc.(1) | | | 6,994 | | | | 322,703 | |
| | |
| | | | | | $ | 948,561 | |
| | |
|
Specialty Retail — 9.7% | |
Bed Bath & Beyond, Inc.(1) | | | 11,018 | | | $ | 852,352 | |
O’Reilly Automotive, Inc.(1) | | | 6,591 | | | | 840,946 | |
Ross Stores, Inc. | | | 10,359 | | | | 754,135 | |
Tiffany & Co. | | | 8,819 | | | | 675,712 | |
Ulta Salon, Cosmetics & Fragrance,
Inc.(1) | | | 4,235 | | | | 505,913 | |
| | |
| | | | | | $ | 3,629,058 | |
| | |
|
Textiles, Apparel & Luxury Goods — 3.8% | |
Fossil, Inc.(1) | | | 7,320 | | | $ | 850,877 | |
Michael Kors Holdings, Ltd.(1) | | | 2,585 | | | | 192,634 | |
Ralph Lauren Corp. | | | 2,392 | | | | 394,034 | |
| | |
| | | | | | $ | 1,437,545 | |
| | |
|
Trading Companies & Distributors — 2.0% | |
Fastenal Co. | | | 14,985 | | | $ | 752,996 | |
| | |
| | | | | | $ | 752,996 | |
| | | | | | | | | |
| |
Total Common Stocks
(identified cost $27,522,312) | | | $ | 36,104,154 | |
| | |
|
| Short-Term Investments — 3.7% | |
| | |
| | | | | | | | |
| Description | | Interest
(000’s omitted) | | | Value | |
Eaton Vance Cash Reserves Fund, LLC, 0.11%(2) | | $ | 1,375 | | | $ | 1,374,876 | |
| | |
| |
Total Short-Term Investments
(identified cost $1,374,876) | | | $ | 1,374,876 | |
| | |
| |
Total Investments — 100.4%
(identified cost $28,897,188) | | | $ | 37,479,030 | |
| | |
| | |
Other Assets, Less Liabilities — (0.4)% | | | | | | $ | (155,162 | ) |
| | | | | | | | | |
| | |
Net Assets — 100.0% | | | | | | $ | 37,323,868 | |
| | | | | | | | | |
The percentage shown for each investment category in the Portfolio of Investments is based on net assets.
| (1) | Non-income producing security. |
| (2) | Affiliated investment company, available to Eaton Vance portfolios and funds, which invests in high quality, U.S. dollar denominated money market instruments. The rate shown is the annualized seven-day yield as of September 30, 2013. |
| | | | |
| | 8 | | See Notes to Financial Statements. |
Eaton Vance
Atlanta Capital Horizon Growth Fund
September 30, 2013
Statement of Assets and Liabilities
| | | | |
| Assets | | September 30, 2013 | |
Unaffiliated investments, at value (identified cost, $27,522,312) | | $ | 36,104,154 | |
Affiliated investment, at value (identified cost, $1,374,876) | | | 1,374,876 | �� |
Cash | | | 659 | |
Dividends receivable | | | 15,864 | |
Interest receivable from affiliated investment | | | 131 | |
Receivable for Fund shares sold | | | 62,530 | |
Receivable from affiliates | | | 25,009 | |
Total assets | | $ | 37,583,223 | |
| |
| Liabilities | | | | |
Payable for Fund shares redeemed | | $ | 159,945 | |
Payable to affiliates: | | | | |
Investment adviser fee | | | 24,393 | |
Administration fee | | | 4,574 | |
Distribution and service fees | | | 14,125 | |
Accrued expenses | | | 56,318 | |
Total liabilities | | $ | 259,355 | |
Net Assets | | $ | 37,323,868 | |
| |
| Sources of Net Assets | | | | |
Paid-in capital | | $ | 28,855,247 | |
Accumulated net realized gain | | | 168,997 | |
Accumulated net investment loss | | | (282,218 | ) |
Net unrealized appreciation | | | 8,581,842 | |
Total | | $ | 37,323,868 | |
| |
| Class A Shares | | | | |
Net Assets | | $ | 24,658,158 | |
Shares Outstanding | | | 1,691,992 | |
Net Asset Value and Redemption Price Per Share | | | | |
(net assets ÷ shares of beneficial interest outstanding) | | $ | 14.57 | |
Maximum Offering Price Per Share | | | | |
(100 ÷ 94.25 of net asset value per share) | | $ | 15.46 | |
| |
| Class B Shares | | | | |
Net Assets | | $ | 2,353,642 | |
Shares Outstanding | | | 182,184 | |
Net Asset Value and Offering Price Per Share* | | | | |
(net assets ÷ shares of beneficial interest outstanding) | | $ | 12.92 | |
| |
| Class C Shares | | | | |
Net Assets | | $ | 8,759,256 | |
Shares Outstanding | | | 678,587 | |
Net Asset Value and Offering Price Per Share* | | | | |
(net assets ÷ shares of beneficial interest outstanding) | | $ | 12.91 | |
| |
| Class I Shares | | | | |
Net Assets | | $ | 1,552,812 | |
Shares Outstanding | | | 105,888 | |
Net Asset Value, Offering Price and Redemption Price Per Share | | | | |
(net assets ÷ shares of beneficial interest outstanding) | | $ | 14.66 | |
On sales of $50,000 or more, the offering price of Class A shares is reduced.
| * | Redemption price per share is equal to the net asset value less any applicable contingent deferred sales charge. |
| | | | |
| | 9 | | See Notes to Financial Statements. |
Eaton Vance
Atlanta Capital Horizon Growth Fund
September 30, 2013
Statement of Operations
| | | | |
| Investment Income | | Year Ended September 30, 2013 | |
Dividends (net of foreign taxes, $1,330) | | $ | 257,732 | |
Interest allocated from affiliated investment | | | 1,272 | |
Expenses allocated from affiliated investment | | | (161 | ) |
Total investment income | | $ | 258,843 | |
| |
| Expenses | | | | |
Investment adviser fee | | $ | 291,582 | |
Administration fee | | | 54,672 | |
Distribution and service fees | | | | |
Class A | | | 60,048 | |
Class B | | | 24,563 | |
Class C | | | 87,012 | |
Trustees’ fees and expenses | | | 1,882 | |
Custodian fee | | | 37,890 | |
Transfer and dividend disbursing agent fees | | | 44,771 | |
Legal and accounting services | | | 35,306 | |
Printing and postage | | | 16,754 | |
Registration fees | | | 74,702 | |
Miscellaneous | | | 14,546 | |
Total expenses | | $ | 743,728 | |
Deduct — | | | | |
Allocation of expenses to affiliates | | $ | 153,144 | |
Total expense reductions | | $ | 153,144 | |
| |
Net expenses | | $ | 590,584 | |
| |
Net investment loss | | $ | (331,741 | ) |
| |
| Realized and Unrealized Gain (Loss) | | | | |
Net realized gain (loss) — | | | | |
Investment transactions | | $ | 667,276 | |
Investment transactions allocated from affiliated investment | | | 37 | |
Net realized gain | | $ | 667,313 | |
Change in unrealized appreciation (depreciation) — | | | | |
Investments | | $ | 6,194,305 | |
Net change in unrealized appreciation (depreciation) | | $ | 6,194,305 | |
| |
Net realized and unrealized gain | | $ | 6,861,618 | |
| |
Net increase in net assets from operations | | $ | 6,529,877 | |
| | | | |
| | 10 | | See Notes to Financial Statements. |
Eaton Vance
Atlanta Capital Horizon Growth Fund
September 30, 2013
Statements of Changes in Net Assets
| | | | | | | | |
| | | Year Ended September 30, | |
| Increase (Decrease) in Net Assets | | 2013 | | | 2012 | |
From operations — | | | | | | | | |
Net investment loss | | $ | (331,741 | ) | | $ | (470,937 | ) |
Net realized gain from investment transactions | | | 667,313 | | | | 830,623 | |
Net change in unrealized appreciation (depreciation) from investments | | | 6,194,305 | | | | 6,005,860 | |
Net increase in net assets from operations | | $ | 6,529,877 | | | $ | 6,365,546 | |
Distributions to shareholders — | | | | | | | | |
From net realized gain | | | | | | | | |
Class A | | $ | (584,141 | ) | | $ | (7,326,162 | ) |
Class B | | | (68,849 | ) | | | (972,355 | ) |
Class C | | | (234,717 | ) | | | (2,828,659 | ) |
Class I | | | (22,746 | ) | | | (96,894 | ) |
Total distributions to shareholders | | $ | (910,453 | ) | | $ | (11,224,070 | ) |
Transactions in shares of beneficial interest — | | | | | | | | |
Proceeds from sale of shares | | | | | | | | |
Class A | | $ | 2,139,998 | | | $ | 4,966,712 | |
Class B | | | 379,620 | | | | 801,601 | |
Class C | | | 1,004,960 | | | | 2,303,167 | |
Class I | | | 803,004 | | | | 1,181,313 | |
Net asset value of shares issued to shareholders in payment of distributions declared | | | | | | | | |
Class A | | | 539,329 | | | | 6,557,260 | |
Class B | | | 60,367 | | | | 808,325 | |
Class C | | | 193,804 | | | | 2,478,644 | |
Class I | | | 22,728 | | | | 96,698 | |
Cost of shares redeemed | | | | | | | | |
Class A | | | (8,473,165 | ) | | | (12,803,560 | ) |
Class B | | | (719,742 | ) | | | (1,472,330 | ) |
Class C | | | (3,503,785 | ) | | | (4,057,403 | ) |
Class I | | | (370,360 | ) | | | (346,166 | ) |
Net asset value of shares exchanged | | | | | | | | |
Class A | | | 385,499 | | | | 825,641 | |
Class B | | | (385,499 | ) | | | (825,641 | ) |
Net increase (decrease) in net assets from Fund share transactions | | $ | (7,923,242 | ) | | $ | 514,261 | |
| | |
Net decrease in net assets | | $ | (2,303,818 | ) | | $ | (4,344,263 | ) |
| | |
| Net Assets | | | | | | | | |
At beginning of year | | $ | 39,627,686 | | | $ | 43,971,949 | |
At end of year | | $ | 37,323,868 | | | $ | 39,627,686 | |
| | |
Accumulated net investment loss
included in net assets | | | | | | | | |
At end of year | | $ | (282,218 | ) | | $ | (19,960 | ) |
| | | | |
| | 11 | | See Notes to Financial Statements. |
Eaton Vance
Atlanta Capital Horizon Growth Fund
September 30, 2013
Financial Highlights
| | | | | | | | | | | | | | | | | | | | | | | | |
| | | Class A | |
| | | Year Ended September 30, | | | Period Ended September 30, 2011(1) | | | Year Ended October 31, | |
| | | 2013 | | | 2012 | | | | 2010 | | | 2009 | | | 2008 | |
Net asset value — Beginning of period | | $ | 12.420 | | | $ | 14.100 | | | $ | 14.410 | | | $ | 11.610 | | | $ | 9.910 | | | $ | 15.400 | |
| | | | | | |
| Income (Loss) From Operations | | | | | | | | | | | | | | | | | | | | | | | | |
Net investment loss(2) | | $ | (0.091 | ) | | $ | (0.105 | ) | | $ | (0.088 | )(3) | | $ | (0.060 | ) | | $ | (0.012 | ) | | $ | (0.035 | ) |
Net realized and unrealized gain (loss) | | | 2.545 | | | | 1.904 | | | | (0.166 | ) | | | 2.860 | | | | 1.712 | | | | (4.430 | ) |
| | | | | | |
Total income (loss) from operations | | $ | 2.454 | | | $ | 1.799 | | | $ | (0.254 | ) | | $ | 2.800 | | | $ | 1.700 | | | $ | (4.465 | ) |
| | | | | | |
| Less Distributions | | | | | | | | | | | | | | | | | | | | | | | | |
From net realized gain | | $ | (0.304 | ) | | $ | (3.479 | ) | | $ | (0.056 | ) | | $ | — | | | $ | — | | | $ | (1.025 | ) |
| | | | | | |
Total distributions | | $ | (0.304 | ) | | $ | (3.479 | ) | | $ | (0.056 | ) | | $ | — | | | $ | — | | | $ | (1.025 | ) |
| | | | | | |
Net asset value — End of period | | $ | 14.570 | | | $ | 12.420 | | | $ | 14.100 | | | $ | 14.410 | | | $ | 11.610 | | | $ | 9.910 | |
| | | | | | |
Total Return(4) | | | 20.25 | % | | | 15.35 | % | | | (1.81 | )%(5) | | | 24.12 | % | | | 17.15 | % | | | (31.02 | )% |
| | | | | | |
| Ratios/Supplemental Data | | | | | | | | | | | | | | | | | | | | | | | | |
Net assets, end of period (000’s omitted) | | $ | 24,658 | | | $ | 26,305 | | | $ | 29,725 | | | $ | 35,125 | | | $ | 24,813 | | | $ | 16,196 | |
Ratios (as a percentage of average daily net assets): | | | | | | | | | | | | | | | | | | | | | | | | |
Expenses(6)(7) | | | 1.40 | % | | | 1.40 | % | | | 1.52 | %(8)(9) | | | 1.60 | %(9) | | | 1.60 | %(9) | | | 1.60 | %(9) |
Net investment loss | | | (0.69 | )% | | | (0.81 | )% | | | (0.59 | )%(3)(8) | | | (0.46 | )% | | | (0.11 | )% | | | (0.26 | )% |
Portfolio Turnover of the Portfolio(10) | | | — | | | | — | | | | 16 | %(5) | | | 33 | % | | | 42 | % | | | 40 | % |
Portfolio Turnover of the Fund | | | 23 | % | | | 50 | % | | | 52 | %(5)(11) | | | — | | | | — | | | | — | |
| (1) | For the eleven months ended September 30, 2011. The Fund changed its fiscal year-end from October 31 to September 30. |
| (2) | Computed using average shares outstanding. |
| (3) | Net investment loss per share reflects special dividends allocated from the Portfolio, which amounted to $0.015 per share, for the period while the Fund was making investments directly in the Portfolio. Excluding special dividends, the ratio of net investment loss to average daily net assets would have been (0.69)%. |
| (4) | Returns are historical and are calculated by determining the percentage change in net asset value with all distributions reinvested and do not reflect the effect of sales charges. |
| (6) | Excludes the effect of custody fee credits, if any, of less than 0.005%. |
| (7) | The investment adviser of the Portfolio waived a portion of its investment adviser fee and/or the administrator of the Fund subsidized certain operating expenses (equal to 0.42%, 0.32%, 0.21%, 0.09%, 0.31% and 0.06% of average daily net assets for the years ended September 30, 2013 and 2012, the period ended September 30, 2011 and the years ended October 31, 2010, 2009 and 2008, respectively). A portion of the waiver and subsidy was borne by the sub-adviser. Absent this waiver and/or subsidy, total return would be lower. |
| (9) | Includes the Fund’s share of the Portfolio’s allocated expenses for the period while the Fund was investing in the Portfolio. |
| (10) | Portfolio turnover represents the rate of portfolio activity for the period while the Fund was investing in the Portfolio. |
| (11) | For the period from April 22, 2011 through September 30, 2011 when the Fund was making investments directly in securities. |
References to Portfolio herein are to Tax-Managed Mid-Cap Core Portfolio, a Massachusetts business trust having the same investment objective and polices as the Fund, in which the Fund invested all of its investable assets prior to April 22, 2011.
| | | | |
| | 12 | | See Notes to Financial Statements. |
Eaton Vance
Atlanta Capital Horizon Growth Fund
September 30, 2013
Financial Highlights — continued
| | | | | | | | | | | | | | | | | | | | | | | | |
| | | Class B | |
| | | Year Ended September 30, | | | Period Ended September 30, 2011(1) | | | Year Ended October 31, | |
| | | 2013 | | | 2012 | | | | 2010 | | | 2009 | | | 2008 | |
Net asset value — Beginning of period | | $ | 11.130 | | | $ | 13.060 | | | $ | 13.450 | | | $ | 10.920 | | | $ | 9.380 | | | $ | 14.740 | |
| | | | | | |
| Income (Loss) From Operations | | | | | | | | | | | | | | | | | | | | | | | | |
Net investment loss(2) | | $ | (0.169 | ) | | $ | (0.183 | ) | | $ | (0.195 | )(3) | | $ | (0.146 | ) | | $ | (0.075 | ) | | $ | (0.127 | ) |
Net realized and unrealized gain (loss) | | | 2.263 | | | | 1.732 | | | | (0.139 | ) | | | 2.676 | | | | 1.615 | | | | (4.208 | ) |
| | | | | | |
Total income (loss) from operations | | $ | 2.094 | | | $ | 1.549 | | | $ | (0.334 | ) | | $ | 2.530 | | | $ | 1.540 | | | $ | (4.335 | ) |
| | | | | | |
| Less Distributions | | | | | | | | | | | | | | | | | | | | | | | | |
From net realized gain | | $ | (0.304 | ) | | $ | (3.479 | ) | | $ | (0.056 | ) | | $ | — | | | $ | — | | | $ | (1.025 | ) |
| | | | | | |
Total distributions | | $ | (0.304 | ) | | $ | (3.479 | ) | | $ | (0.056 | ) | | $ | — | | | $ | — | | | $ | (1.025 | ) |
| | | | | | |
Net asset value — End of period | | $ | 12.920 | | | $ | 11.130 | | | $ | 13.060 | | | $ | 13.450 | | | $ | 10.920 | | | $ | 9.380 | |
| | | | | | |
Total Return(4) | | | 19.35 | % | | | 14.49 | % | | | (2.53 | )%(5) | | | 23.17 | % | | | 16.42 | % | | | (31.56 | )% |
| | | | | | |
| Ratios/Supplemental Data | | | | | | | | | | | | | | | | | | | | | | | | |
Net assets, end of period (000’s omitted) | | $ | 2,354 | | | $ | 2,655 | | | $ | 3,790 | | | $ | 3,327 | | | $ | 3,102 | | | $ | 3,316 | |
Ratios (as a percentage of average daily net assets): | | | | | | | | | | | | | | | | | | | | | | | | |
Expenses(6)(7) | | | 2.15 | % | | | 2.15 | % | | | 2.25 | %(8)(9) | | | 2.35 | %(9) | | | 2.35 | %(9) | | | 2.35 | %(9) |
Net investment loss | | | (1.44 | )% | | | (1.56 | )% | | | (1.39 | )%(3)(8) | | | (1.21 | )% | | | (0.80 | )% | | | (1.01 | )% |
Portfolio Turnover of the Portfolio(10) | | | — | | | | — | | | | 16 | %(5) | | | 33 | % | | | 42 | % | | | 40 | % |
Portfolio Turnover of the Fund | | | 23 | % | | | 50 | % | | | 52 | %(5)(11) | | | — | | | | — | | | | — | |
| (1) | For the eleven months ended September 30, 2011. The Fund changed its fiscal year-end from October 31 to September 30. |
| (2) | Computed using average shares outstanding. |
| (3) | Net investment loss per share reflects special dividends allocated from the Portfolio, which amounted to $0.014 per share, for the period while the Fund was making investments directly in the Portfolio. Excluding special dividends, the ratio of net investment loss to average daily net assets would have been (1.49)%. |
| (4) | Returns are historical and are calculated by determining the percentage change in net asset value with all distributions reinvested and do not reflect the effect of sales charges. |
| (6) | Excludes the effect of custody fee credits, if any, of less than 0.005%. |
| (7) | The investment adviser of the Portfolio waived a portion of its investment adviser fee and/or the administrator of the Fund subsidized certain operating expenses (equal to 0.42%, 0.32%, 0.21%, 0.09%, 0.31% and 0.06% of average daily net assets for the years ended September 30, 2013 and 2012, the period ended September 30, 2011 and the years ended October 31, 2010, 2009 and 2008, respectively). A portion of the waiver and subsidy was borne by the sub-adviser. Absent this waiver and/or subsidy, total return would be lower. |
| (9) | Includes the Fund’s share of the Portfolio’s allocated expenses for the period while the Fund was investing in the Portfolio. |
| (10) | Portfolio turnover represents the rate of portfolio activity for the period while the Fund was investing in the Portfolio. |
| (11) | For the period from April 22, 2011 through September 30, 2011 when the Fund was making investments directly in securities. |
References to Portfolio herein are to Tax-Managed Mid-Cap Core Portfolio, a Massachusetts business trust having the same investment objective and polices as the Fund, in which the Fund invested all of its investable assets prior to April 22, 2011.
| | | | |
| | 13 | | See Notes to Financial Statements. |
Eaton Vance
Atlanta Capital Horizon Growth Fund
September 30, 2013
Financial Highlights — continued
| | | | | | | | | | | | | | | | | | | | | | | | |
| | | Class C | |
| | | Year Ended September 30, | | | Period Ended
September 30, 2011(1) | | | Year Ended October 31, | |
| | | 2013 | | | 2012 | | | | 2010 | | | 2009 | | | 2008 | |
Net asset value — Beginning of period | | $ | 11.120 | | | $ | 13.050 | | | $ | 13.430 | | | $ | 10.910 | | | $ | 9.370 | | | $ | 14.740 | |
| | | | | | |
| Income (Loss) From Operations | | | | | | | | | | | | | | | | | | | | | | | | |
Net investment loss(2) | | $ | (0.169 | ) | | $ | (0.182 | ) | | $ | (0.198 | )(3) | | $ | (0.145 | ) | | $ | (0.080 | ) | | $ | (0.127 | ) |
Net realized and unrealized gain (loss) | | | 2.263 | | | | 1.731 | | | | (0.126 | ) | | | 2.665 | | | | 1.620 | | | | (4.218 | ) |
| | | | | | |
Total income (loss) from operations | | $ | 2.094 | | | $ | 1.549 | | | $ | (0.324 | ) | | $ | 2.520 | | | $ | 1.540 | | | $ | (4.345 | ) |
| | | | | | |
| Less Distributions | | | | | | | | | | | | | | | | | | | | | | | | |
From net realized gain | | $ | (0.304 | ) | | $ | (3.479 | ) | | $ | (0.056 | ) | | $ | — | | | $ | — | | | $ | (1.025 | ) |
| | | | | | |
Total distributions | | $ | (0.304 | ) | | $ | (3.479 | ) | | $ | (0.056 | ) | | $ | — | | | $ | — | | | $ | (1.025 | ) |
| | | | | | |
Net asset value — End of period | | $ | 12.910 | | | $ | 11.120 | | | $ | 13.050 | | | $ | 13.430 | | | $ | 10.910 | | | $ | 9.370 | |
| | | | | | |
Total Return(4) | | | 19.36 | % | | | 14.51 | % | | | (2.46 | )%(5) | | | 23.10 | % | | | 16.44 | % | | | (31.63 | )% |
| | | | | | |
| Ratios/Supplemental Data | | | | | | | | | | | | | | | | | | | | | | | | |
Net assets, end of period (000’s omitted) | | $ | 8,759 | | | $ | 9,796 | | | $ | 10,456 | | | $ | 7,195 | | | $ | 6,528 | | | $ | 5,273 | |
Ratios (as a percentage of average daily net assets): | | | | | | | | | | | | | | | | | | | | | | | | |
Expenses(6)(7) | | | 2.15 | % | | | 2.15 | % | | | 2.25 | %(8)(9) | | | 2.35 | %(9) | | | 2.35 | %(9) | | | 2.35 | %(9) |
Net investment loss | | | (1.44 | )% | | | (1.55 | )% | | | (1.42 | )%(3)(8) | | | (1.20 | )% | | | (0.84 | )% | | | (1.02 | )% |
Portfolio Turnover of the Portfolio(10) | | | — | | | | — | | | | 16 | %(5) | | | 33 | % | | | 42 | % | | | 40 | % |
Portfolio Turnover of the Fund | | | 23 | % | | | 50 | % | | | 52 | %(5)(11) | | | — | | | | — | | | | — | |
| (1) | For the eleven months ended September 30, 2011. The Fund changed its fiscal year-end from October 31 to September 30. |
| (2) | Computed using average shares outstanding. |
| (3) | Net investment loss per share reflects special dividends allocated from the Portfolio, which amounted to $0.013 per share, for the period while the Fund was making investments directly in the Portfolio. Excluding special dividends, the ratio of net investment loss to average daily net assets would have been (1.51)%. |
| (4) | Returns are historical and are calculated by determining the percentage change in net asset value with all distributions reinvested and do not reflect the effect of sales charges. |
| (6) | Excludes the effect of custody fee credits, if any, of less than 0.005%. |
| (7) | The investment adviser of the Portfolio waived a portion of its investment adviser fee and/or the administrator of the Fund subsidized certain operating expenses (equal to 0.42%, 0.32%, 0.21%, 0.09%, 0.31% and 0.06% of average daily net assets for the years ended September 30, 2013 and 2012, the period ended September 30, 2011 and the years ended October 31, 2010, 2009 and 2008, respectively). A portion of the waiver and subsidy was borne by the sub-adviser. Absent this waiver and/or subsidy, total return would be lower. |
| (9) | Includes the Fund’s share of the Portfolio’s allocated expenses for the period while the Fund was investing in the Portfolio. |
| (10) | Portfolio turnover represents the rate of portfolio activity for the period while the Fund was investing in the Portfolio. |
| (11) | For the period from April 22, 2011 through September 30, 2011 when the Fund was making investments directly in securities. |
References to Portfolio herein are to Tax-Managed Mid-Cap Core Portfolio, a Massachusetts business trust having the same investment objective and polices as the Fund, in which the Fund invested all of its investable assets prior to April 22, 2011.
| | | | |
| | 14 | | See Notes to Financial Statements. |
Eaton Vance
Atlanta Capital Horizon Growth Fund
September 30, 2013
Financial Highlights — continued
| | | | | | | | | | | | |
| | | Class I | |
| | | Year Ended September 30, | | | Period Ended September 30, 2011(1) | |
| | | 2013 | | | 2012 | | |
Net asset value — Beginning of period | | $ | 12.470 | | | $ | 14.110 | | | $ | 17.730 | |
| | | |
| Income (Loss) From Operations | | | | | | | | | | | | |
Net investment loss(2) | | $ | (0.063 | ) | | $ | (0.072 | ) | | $ | (0.058 | ) |
Net realized and unrealized gain (loss) | | | 2.557 | | | | 1.911 | | | | (3.562 | ) |
| | | |
Total income (loss) from operations | | $ | 2.494 | | | $ | 1.839 | | | $ | (3.620 | ) |
| | | |
| Less Distributions | | | | | | | | | | | | |
From net realized gain | | $ | (0.304 | ) | | $ | (3.479 | ) | | $ | — | |
| | | |
Total distributions | | $ | (0.304 | ) | | $ | (3.479 | ) | | $ | — | |
| | | |
Net asset value — End of period | | $ | 14.660 | | | $ | 12.470 | | | $ | 14.110 | |
| | | |
Total Return(3) | | | 20.50 | % | | | 15.69 | % | | | (20.42 | )%(4) |
| | | |
| Ratios/Supplemental Data | | | | | | | | | | | | |
Net assets, end of period (000’s omitted) | | $ | 1,553 | | | $ | 872 | | | $ | 1 | |
Ratios (as a percentage of average daily net assets): | | | | | | | | | | | | |
Expenses(5)(6) | | | 1.15 | % | | | 1.15 | % | | | 1.15 | %(7) |
Net investment loss | | | (0.47 | )% | | | (0.58 | )% | | | (0.86 | )%(7) |
Portfolio Turnover | | | 23 | % | | | 50 | % | | | 52 | %(4)(8) |
| (1) | For the period from the commencement of operations, May 2, 2011, to September 30, 2011. |
| (2) | Computed using average shares outstanding. |
| (3) | Returns are historical and are calculated by determining the percentage change in net asset value with all distributions reinvested. |
| (5) | The administrator of the Fund subsidized certain operating expenses (equal to 0.42%, 0.32% and 0.38% of average daily net assets for the years ended September 30, 2013 and 2012 and the period ended September 30, 2011, respectively). A portion of the subsidy was borne by the sub-adviser. Absent this subsidy, total return would be lower. |
| (6) | Excludes the effect of custody fee credits, if any, of less than 0.005%. |
| (8) | For the period from April 22, 2011 through September 30, 2011 when the Fund was making investments directly in securities. |
| | | | |
| | 15 | | See Notes to Financial Statements. |
Eaton Vance
Atlanta Capital Horizon Growth Fund
September 30, 2013
Notes to Financial Statements
1 Significant Accounting Policies
Eaton Vance Atlanta Capital Horizon Growth Fund (the Fund) is a diversified series of Eaton Vance Mutual Funds Trust (the Trust). The Trust is a Massachusetts business trust registered under the Investment Company Act of 1940, as amended (the 1940 Act), as an open-end management investment company. The Fund’s investment objective is to seek total return. The Fund offers four classes of shares. Class A shares are generally sold subject to a sales charge imposed at time of purchase. Class B and Class C shares are sold at net asset value and are generally subject to a contingent deferred sales charge (see Note 5). Class I shares are sold at net asset value and are not subject to a sales charge. Class B shares automatically convert to Class A shares eight years after their purchase as described in the Fund’s prospectus. Beginning January 1, 2012, Class B shares are only available for purchase upon exchange from another Eaton Vance fund or through reinvestment of distributions. Each class represents a pro-rata interest in the Fund, but votes separately on class-specific matters and (as noted below) is subject to different expenses. Realized and unrealized gains and losses and net investment income and losses, other than class-specific expenses, are allocated daily to each class of shares based on the relative net assets of each class to the total net assets of the Fund. Each class of shares differs in its distribution plan and certain other class-specific expenses.
The following is a summary of significant accounting policies of the Fund. The policies are in conformity with accounting principles generally accepted in the United States of America.
A Investment Valuation — The following methodologies are used to determine the market value or fair value of investments.
Equity Securities. Equity securities (including common shares of closed-end investment companies) listed on a U.S. securities exchange generally are valued at the last sale or closing price on the day of valuation or, if no sales took place on such date, at the mean between the closing bid and asked prices therefore on the exchange where such securities are principally traded. Equity securities listed on the NASDAQ Global or Global Select Market generally are valued at the NASDAQ official closing price. Unlisted or listed securities for which closing sales prices or closing quotations are not available are valued at the mean between the latest available bid and asked prices.
Debt Obligations. Short-term obligations purchased with a remaining maturity of sixty days or less are generally valued at amortized cost, which approximates market value.
Affiliated Fund. The Fund may invest in Eaton Vance Cash Reserves Fund, LLC (Cash Reserves Fund), an affiliated investment company managed by Eaton Vance Management (EVM). The value of the Fund’s investment in Cash Reserves Fund reflects the Fund’s proportionate interest in its net assets. Cash Reserves Fund generally values its investment securities utilizing the amortized cost valuation technique in accordance with Rule 2a-7 under the 1940 Act. This technique involves initially valuing a portfolio security at its cost and thereafter assuming a constant amortization to maturity of any discount or premium. If amortized cost is determined not to approximate fair value, Cash Reserves Fund may value its investment securities based on available market quotations provided by a third party pricing service.
Fair Valuation. Investments for which valuations or market quotations are not readily available or are deemed unreliable are valued at fair value using methods determined in good faith by or at the direction of the Trustees of the Fund in a manner that fairly reflects the security’s value, or the amount that the Fund might reasonably expect to receive for the security upon its current sale in the ordinary course. Each such determination is based on a consideration of relevant factors, which are likely to vary from one pricing context to another. These factors may include, but are not limited to, the type of security, the existence of any contractual restrictions on the security’s disposition, the price and extent of public trading in similar securities of the issuer or of comparable companies or entities, quotations or relevant information obtained from broker/dealers or other market participants, information obtained from the issuer, analysts, and/or the appropriate stock exchange (for exchange-traded securities), an analysis of the company’s or entity’s financial condition, and an evaluation of the forces that influence the issuer and the market(s) in which the security is purchased and sold.
B Investment Transactions — Investment transactions for financial statement purposes are accounted for on a trade date basis. Realized gains and losses on investments sold are determined on the basis of identified cost.
C Income — Dividend income is recorded on the ex-dividend date for dividends received in cash and/or securities. However, if the ex-dividend date has passed, certain dividends from foreign securities are recorded as the Fund is informed of the ex-dividend date. Withholding taxes on foreign dividends and capital gains have been provided for in accordance with the Fund’s understanding of the applicable countries’ tax rules and rates. Interest income is recorded on the basis of interest accrued, adjusted for amortization of premium or accretion of discount.
D Federal Taxes — The Fund’s policy is to comply with the provisions of the Internal Revenue Code applicable to regulated investment companies and to distribute to shareholders each year substantially all of its net investment income, and all or substantially all of its net realized capital gains. Accordingly, no provision for federal income or excise tax is necessary.
At September 30, 2013, the Fund had a late year ordinary loss of $282,218 which it has elected to defer to the following taxable year pursuant to income tax regulations. Late year ordinary losses represent certain specified losses realized in that portion of a taxable year after October 31 that are treated as ordinary for tax purposes plus ordinary losses attributable to that portion of a taxable year after December 31.
As of September 30, 2013, the Fund had no uncertain tax positions that would require financial statement recognition, de-recognition, or disclosure. The Fund files a U.S. federal income tax return annually after its fiscal year-end, which is subject to examination by the Internal Revenue Service for a period of three years from the date of filing.
Eaton Vance
Atlanta Capital Horizon Growth Fund
September 30, 2013
Notes to Financial Statements — continued
E Expenses — The majority of expenses of the Trust are directly identifiable to an individual fund. Expenses which are not readily identifiable to a specific fund are allocated taking into consideration, among other things, the nature and type of expense and the relative size of the funds.
F Expense Reduction — State Street Bank and Trust Company (SSBT) serves as custodian of the Fund. Pursuant to the custodian agreement, SSBT receives a fee reduced by credits, which are determined based on the average daily cash balance the Fund maintains with SSBT. All credit balances, if any, used to reduce the Fund’s custodian fees are reported as a reduction of expenses in the Statement of Operations.
G Use of Estimates — The preparation of the financial statements in conformity with accounting principles generally accepted in the United States of America requires management to make estimates and assumptions that affect the reported amounts of assets and liabilities at the date of the financial statements and the reported amounts of income and expense during the reporting period. Actual results could differ from those estimates.
H Indemnifications — Under the Trust’s organizational documents, its officers and Trustees may be indemnified against certain liabilities and expenses arising out of the performance of their duties to the Fund. Under Massachusetts law, if certain conditions prevail, shareholders of a Massachusetts business trust (such as the Trust) could be deemed to have personal liability for the obligations of the Trust. However, the Trust’s Declaration of Trust contains an express disclaimer of liability on the part of Fund shareholders and the By-laws provide that the Trust shall assume the defense on behalf of any Fund shareholders. Moreover, the By-laws also provide for indemnification out of Fund property of any shareholder held personally liable solely by reason of being or having been a shareholder for all loss or expense arising from such liability. Additionally, in the normal course of business, the Fund enters into agreements with service providers that may contain indemnification clauses. The Fund’s maximum exposure under these arrangements is unknown as this would involve future claims that may be made against the Fund that have not yet occurred.
2 Distributions to Shareholders
It is the present policy of the Fund to make at least one distribution annually (normally in December) of all or substantially all of its net investment income and to distribute annually all or substantially all of its net realized capital gains. Distributions to shareholders are recorded on the ex-dividend date. Distributions are declared separately for each class of shares. Shareholders may reinvest income and capital gain distributions in additional shares of the same class of the Fund at the net asset value as of the ex-dividend date or, at the election of the shareholder, receive distributions in cash. The Fund distinguishes between distributions on a tax basis and a financial reporting basis. Accounting principles generally accepted in the United States of America require that only distributions in excess of tax basis earnings and profits be reported in the financial statements as a return of capital. Permanent differences between book and tax accounting relating to distributions are reclassified to paid-in capital. For tax purposes, distributions from short-term capital gains are considered to be from ordinary income.
The tax character of distributions declared for the years ended September 30, 2013 and September 30, 2012 was as follows:
| | | | | | | | |
| | | Year Ended September 30, | |
| | | 2013 | | | 2012 | |
| | |
Distributions declared from: | | | | | | | | |
Long-term capital gains | | $ | 910,453 | | | $ | 11,224,070 | |
During the year ended September 30, 2013, accumulated net realized gain was increased by $2,147, accumulated net investment loss was decreased by $69,483 and paid-in capital was decreased by $71,630 due to differences between book and tax accounting, primarily for net operating losses and investments in partnerships. These reclassifications had no effect on the net assets or net asset value per share of the Fund.
As of September 30, 2013, the components of distributable earnings (accumulated losses) and unrealized appreciation (depreciation) on a tax basis were as follows:
| | | | |
Undistributed long-term capital gains | | $ | 464,393 | |
Late year ordinary losses | | $ | (282,218 | ) |
Net unrealized appreciation | | $ | 8,286,446 | |
The differences between components of distributable earnings (accumulated losses) on a tax basis and the amounts reflected in the Statement of Assets and Liabilities are primarily due to wash sales, partnership allocations and investments in partnerships.
3 Investment Adviser and Administration Fees and Other Transactions with Affiliates
The investment adviser fee is earned by Boston Management and Research (BMR), a subsidiary of EVM, as compensation for investment advisory services rendered to the Fund. The fee is computed at an annual rate of 0.80% of the Fund’s average daily net assets up to $500 million and is payable monthly.
Eaton Vance
Atlanta Capital Horizon Growth Fund
September 30, 2013
Notes to Financial Statements — continued
On net assets of $500 million and over, the annual fee is reduced. For the year ended September 30, 2013, the investment adviser fee amounted to $291,582 or 0.80% of the Fund’s average daily net assets. Pursuant to a sub-advisory agreement, BMR pays Atlanta Capital Management Company, LLC (Atlanta Capital), an affiliate of EVM, a portion of its adviser fee for sub-advisory services provided to the Fund. The Fund invests its cash in Cash Reserves Fund. EVM does not currently receive a fee for advisory services provided to Cash Reserves Fund. The administration fee is earned by EVM for administering the business affairs of the Fund and is computed at an annual rate of 0.15% of the Fund’s average daily net assets. For the year ended September 30, 2013, the administration fee amounted to $54,672.
EVM and Atlanta Capital have agreed to reimburse the Fund’s expenses to the extent that total annual operating expenses (relating to ordinary operating expenses only) exceed 1.40%, 2.15%, 2.15% and 1.15% of the Fund’s average daily net assets for Class A, Class B, Class C and Class I, respectively. This agreement may be changed or terminated after January 31, 2014. Pursuant to this agreement, EVM and Atlanta Capital were allocated $153,144 in total of the Fund’s operating expenses for the year ended September 30, 2013.
EVM serves as the sub-transfer agent of the Fund and receives from the transfer agent an aggregate fee based upon the actual expenses incurred by EVM in the performance of these services. For the year ended September 30, 2013, EVM earned $3,082 in sub-transfer agent fees. The Fund was informed that Eaton Vance Distributors, Inc. (EVD), an affiliate of EVM and the Fund’s principal underwriter, received $4,214 as its portion of the sales charge on sales of Class A shares for the year ended September 30, 2013. EVD also received distribution and service fees from Class A, Class B and Class C shares (see Note 4) and contingent deferred sales charges (see Note 5).
Trustees and officers of the Fund who are members of EVM’s or BMR’s organizations receive remuneration for their services to the Fund out of the investment adviser fee. Trustees of the Fund who are not affiliated with the investment adviser and administrator may elect to defer receipt of all or a percentage of their annual fees in accordance with the terms of the Trustees Deferred Compensation Plan. For the year ended September 30, 2013, no significant amounts have been deferred. Certain officers and Trustees of the Fund are officers of the above organizations.
4 Distribution Plans
The Fund has in effect a distribution plan for Class A shares (Class A Plan) pursuant to Rule 12b-1 under the 1940 Act. Pursuant to the Class A Plan, the Fund pays EVD a distribution and service fee of 0.25% per annum of its average daily net assets attributable to Class A shares for distribution services and facilities provided to the Fund by EVD, as well as for personal services and/or the maintenance of shareholder accounts. Distribution and service fees paid or accrued to EVD for the year ended September 30, 2013 amounted to $60,048 for Class A shares.
The Fund also has in effect distribution plans for Class B shares (Class B Plan) and Class C shares (Class C Plan) pursuant to Rule 12b-1 under the 1940 Act. Pursuant to the Class B and Class C Plans, the Fund pays EVD amounts equal to 0.75% per annum of its average daily net assets attributable to Class B and Class C shares for providing ongoing distribution services and facilities to the Fund. For the year ended September 30, 2013, the Fund paid or accrued to EVD $18,422 and $65,259 for Class B and Class C shares, respectively.
Pursuant to the Class B and Class C Plans, the Fund also makes payments of service fees to EVD, financial intermediaries and other persons in amounts equal to 0.25% per annum of its average daily net assets attributable to that class. Service fees paid or accrued are for personal services and/or the maintenance of shareholder accounts. They are separate and distinct from the sales commissions and distribution fees payable to EVD. Service fees paid or accrued for the year ended September 30, 2013 amounted to $6,141 and $21,753 for Class B and Class C shares, respectively.
Distribution and service fees are subject to the limitations contained in the Financial Industry Regulatory Authority’s NASD Conduct Rule 2830(d).
5 Contingent Deferred Sales Charges
A contingent deferred sales charge (CDSC) generally is imposed on redemptions of Class B shares made within six years of purchase and on redemptions of Class C shares made within one year of purchase. Class A shares may be subject to a 1% CDSC if redeemed within 18 months of purchase (depending on the circumstances of purchase). Generally, the CDSC is based upon the lower of the net asset value at date of redemption or date of purchase. No charge is levied on shares acquired by reinvestment of dividends or capital gain distributions. The CDSC for Class B shares is imposed at declining rates that begin at 5% in the case of redemptions in the first and second year after purchase, declining one percentage point each subsequent year. Class C shares are subject to a 1% CDSC if redeemed within one year of purchase. For the year ended September 30, 2013, the Fund was informed that EVD received approximately $4,000 and $400 of CDSCs paid by Class B and Class C shareholders, respectively, and no CDSCs paid by Class A shareholders.
6 Purchases and Sales of Investments
Purchases and sales of investments, other than short-term obligations, aggregated $8,013,461 and $16,945,304, respectively, for the year ended September 30, 2013.
Eaton Vance
Atlanta Capital Horizon Growth Fund
September 30, 2013
Notes to Financial Statements — continued
7 Shares of Beneficial Interest
The Fund’s Declaration of Trust permits the Trustees to issue an unlimited number of full and fractional shares of beneficial interest (without par value). Such shares may be issued in a number of different series (such as the Fund) and classes. Transactions in Fund shares were as follows:
| | | | | | | | |
| | | Year Ended September 30, | |
| Class A | | 2013 | | | 2012 | |
| | |
Sales | | | 157,346 | | | | 373,594 | |
Issued to shareholders electing to receive payments of distributions in Fund shares | | | 44,499 | | | | 583,386 | |
Redemptions | | | (656,714 | ) | | | (1,008,925 | ) |
Exchange from Class B shares | | | 28,976 | | | | 61,677 | |
| | |
Net increase (decrease) | | | (425,893 | ) | | | 9,732 | |
| | |
| | | | | | | | |
| | | Year Ended September 30, | |
| Class B | | 2013 | | | 2012 | |
| | |
Sales | | | 32,269 | | | | 65,080 | |
Issued to shareholders electing to receive payments of distributions in Fund shares | | | 5,584 | | | | 79,795 | |
Redemptions | | | (61,738 | ) | | | (128,662 | ) |
Exchange to Class A shares | | | (32,542 | ) | | | (67,871 | ) |
| | |
Net decrease | | | (56,427 | ) | | | (51,658 | ) |
| | |
| | | | | | | | |
| | | Year Ended September 30, | |
| Class C | | 2013 | | | 2012 | |
| | |
Sales | | | 86,212 | | | | 193,949 | |
Issued to shareholders electing to receive payments of distributions in Fund shares | | | 17,945 | | | | 244,925 | |
Redemptions | | | (306,702 | ) | | | (359,087 | ) |
| | |
Net increase (decrease) | | | (202,545 | ) | | | 79,787 | |
| | |
| | | | | | | | |
| | | Year Ended September 30, | |
| Class I | | 2013 | | | 2012 | |
| | |
Sales | | | 61,536 | | | | 88,276 | |
Issued to shareholders electing to receive payments of distributions in Fund shares | | | 1,868 | | | | 8,588 | |
Redemptions | | | (27,440 | ) | | | (27,040 | ) |
| | |
Net increase | | | 35,964 | | | | 69,824 | |
Eaton Vance
Atlanta Capital Horizon Growth Fund
September 30, 2013
Notes to Financial Statements — continued
8 Federal Income Tax Basis of Investments
The cost and unrealized appreciation (depreciation) of investments of the Fund at September 30, 2013, as determined on a federal income tax basis, were as follows:
| | | | |
| |
Aggregate cost | | $ | 29,192,584 | |
| |
Gross unrealized appreciation | | $ | 8,912,254 | |
Gross unrealized depreciation | | | (625,808 | ) |
| |
Net unrealized appreciation | | $ | 8,286,446 | |
9 Line of Credit
The Fund participates with other portfolios and funds managed by EVM and its affiliates in a $750 million unsecured line of credit agreement with a group of banks. Borrowings are made by the Fund solely to facilitate the handling of unusual and/or unanticipated short-term cash requirements. Interest is charged to the Fund based on its borrowings at an amount above either the Eurodollar rate or Federal Funds rate. In addition, a fee computed at an annual rate of 0.08% on the daily unused portion of the line of credit is allocated among the participating portfolios and funds at the end of each quarter. Because the line of credit is not available exclusively to the Fund, it may be unable to borrow some or all of its requested amounts at any particular time. The Fund did not have any significant borrowings or allocated fees during the year ended September 30, 2013.
10 Fair Value Measurements
Under generally accepted accounting principles for fair value measurements, a three-tier hierarchy to prioritize the assumptions, referred to as inputs, is used in valuation techniques to measure fair value. The three-tier hierarchy of inputs is summarized in the three broad levels listed below.
| Ÿ | | Level 1 – quoted prices in active markets for identical investments |
| Ÿ | | Level 2 – other significant observable inputs (including quoted prices for similar investments, interest rates, prepayment speeds, credit risk, etc.) |
| Ÿ | | Level 3 – significant unobservable inputs (including a fund’s own assumptions in determining the fair value of investments) |
In cases where the inputs used to measure fair value fall in different levels of the fair value hierarchy, the level disclosed is determined based on the lowest level input that is significant to the fair value measurement in its entirety. The inputs or methodology used for valuing securities are not necessarily an indication of the risk associated with investing in those securities.
At September 30, 2013, the hierarchy of inputs used in valuing the Fund’s investments, which are carried at value, were as follows:
| | | | | | | | | | | | | | | | |
| Asset Description | | Level 1 | | | Level 2 | | | Level 3 | | | Total | |
| | | | |
Common Stocks | | $ | 36,104,154 | * | | $ | — | | | $ | — | | | $ | 36,104,154 | |
Short-Term Investments | | | — | | | | 1,374,876 | | | | — | | | | 1,374,876 | |
| | | | |
Total Investments | | $ | 36,104,154 | | | $ | 1,374,876 | | | $ | — | | | $ | 37,479,030 | |
| * | The level classification by major category of investments is the same as the category presentation in the Portfolio of Investments. |
The Fund held no investments or other financial instruments as of September 30, 2012 whose fair value was determined using Level 3 inputs. At September 30, 2013, there were no investments transferred between Level 1 and Level 2 during the year then ended.
Eaton Vance
Atlanta Capital Horizon Growth Fund
September 30, 2013
Report of Independent Registered Public Accounting Firm
To the Trustees of Eaton Vance Mutual Funds Trust and Shareholders of Eaton Vance Atlanta Capital Horizon Growth Fund:
We have audited the accompanying statement of assets and liabilities of Eaton Vance Atlanta Capital Horizon Growth Fund (the “Fund”) (one of the funds constituting Eaton Vance Mutual Funds Trust), including the portfolio of investments, as of September 30, 2013, and the related statement of operations for the year then ended, the statements of changes in net assets for each of the two years in the period then ended, and the financial highlights for each of the two years in the period then ended, for the eleven month period ended September 30, 2011, and for each of the three years in the period ended October 31, 2010. These financial statements and financial highlights are the responsibility of the Fund’s management. Our responsibility is to express an opinion on these financial statements and financial highlights based on our audits.
We conducted our audits in accordance with the standards of the Public Company Accounting Oversight Board (United States). Those standards require that we plan and perform the audit to obtain reasonable assurance about whether the financial statements and financial highlights are free of material misstatement. The Fund is not required to have, nor were we engaged to perform, an audit of its internal control over financial reporting. Our audits included consideration of internal control over financial reporting as a basis for designing audit procedures that are appropriate in the circumstances, but not for the purpose of expressing an opinion on the effectiveness of the Fund’s internal control over financial reporting. Accordingly, we express no such opinion. An audit also includes examining, on a test basis, evidence supporting the amounts and disclosures in the financial statements, assessing the accounting principles used and significant estimates made by management, as well as evaluating the overall financial statement presentation. Our procedures included confirmation of securities owned as of September 30, 2013, by correspondence with the custodian. We believe that our audits provide a reasonable basis for our opinion.
In our opinion, such financial statements and financial highlights referred to above present fairly, in all material respects, the financial position of Eaton Vance Atlanta Capital Horizon Growth Fund as of September 30, 2013, the results of its operations for the year then ended, the changes in its net assets for each of the two years in the period then ended, and the financial highlights for each of the two years in the period then ended, for the eleven month period ended September 30, 2011, and for each of the three years in the period ended October 31, 2010, in conformity with accounting principles generally accepted in the United States of America.
DELOITTE & TOUCHE LLP
Boston, Massachusetts
November 14, 2013
Eaton Vance
Atlanta Capital Horizon Growth Fund
September 30, 2013
Federal Tax Information (Unaudited)
The Form 1099-DIV you receive in January 2014 will show the tax status of all distributions paid to your account in calendar year 2013. Shareholders are advised to consult their own tax adviser with respect to the tax consequences of their investment in the Fund. As required by the Internal Revenue Code and/or regulations, shareholders must be notified regarding the status of capital gains dividends.
Capital Gains Dividends. The Fund hereby designates $527,708 as capital gains dividends with respect to the taxable year ended September 30, 2013, or if subsequently determined to be different, the net capital gain of such year.
Eaton Vance
Atlanta Capital Horizon Growth Fund
September 30, 2013
Board of Trustees’ Contract Approval
Overview of the Contract Review Process
The Investment Company Act of 1940, as amended (the “1940 Act”), provides, in substance, that each investment advisory agreement between a fund and its investment adviser will continue in effect from year to year only if its continuation is approved at least annually by the fund’s board of trustees, including by a vote of a majority of the trustees who are not “interested persons” of the fund (“Independent Trustees”), cast in person at a meeting called for the purpose of considering such approval.
At a meeting of the Boards of Trustees (each a “Board”) of the Eaton Vance group of mutual funds (the “Eaton Vance Funds”) held on April 23, 2013, the Board, including a majority of the Independent Trustees, voted to approve continuation of existing advisory and sub-advisory agreements for the Eaton Vance Funds for an additional one-year period. In voting its approval, the Board relied upon the affirmative recommendation of the Contract Review Committee of the Board, which is a committee comprised exclusively of Independent Trustees. Prior to making its recommendation, the Contract Review Committee reviewed information furnished by each adviser to the Eaton Vance Funds (including information specifically requested by the Board) for a series of meetings of the Contract Review Committee held between February and April 2013, as well as information considered during prior meetings of the committee. Such information included, among other things, the following:
Information about Fees, Performance and Expenses
| Ÿ | | An independent report comparing the advisory and related fees paid by each fund with fees paid by comparable funds; |
| Ÿ | | An independent report comparing each fund’s total expense ratio and its components to comparable funds; |
| Ÿ | | An independent report comparing the investment performance of each fund (including, where relevant, yield data, Sharpe ratios and information ratios) to the investment performance of comparable funds over various time periods; |
| Ÿ | | Data regarding investment performance in comparison to benchmark indices and customized peer groups, in each case as approved by the Board with respect to the funds; |
| Ÿ | | For each fund, comparative information concerning the fees charged and the services provided by each adviser in managing other accounts (including mutual funds, other collective investment funds and institutional accounts) using investment strategies and techniques similar to those used in managing such fund; |
| Ÿ | | Profitability analyses for each adviser with respect to each fund; |
Information about Portfolio Management and Trading
| Ÿ | | Descriptions of the investment management services provided to each fund, including the investment strategies and processes employed, and any changes in portfolio management processes and personnel; |
| Ÿ | | Information about the allocation of brokerage and the benefits received by each adviser as a result of brokerage allocation, including information concerning the acquisition of research through client commission arrangements and the fund’s policies with respect to “soft dollar” arrangements; |
| Ÿ | | Data relating to portfolio turnover rates of each fund; |
| Ÿ | | The procedures and processes used to determine the fair value of fund assets and actions taken to monitor and test the effectiveness of such procedures and processes; |
| Ÿ | | Information about each adviser’s processes for monitoring best execution of portfolio transactions, and other policies and practices of each adviser with respect to trading; |
Information about each Adviser
| Ÿ | | Reports detailing the financial results and condition of each adviser; |
| Ÿ | | Descriptions of the qualifications, education and experience of the individual investment professionals whose responsibilities include portfolio management and investment research for the funds, and information relating to their compensation and responsibilities with respect to managing other mutual funds and investment accounts; |
| Ÿ | | Copies of the Codes of Ethics of each adviser and its affiliates, together with information relating to compliance with and the administration of such codes; |
| Ÿ | | Copies of or descriptions of each adviser’s policies and procedures relating to proxy voting, the handling of corporate actions and class actions; |
| Ÿ | | Information concerning the resources devoted to compliance efforts undertaken by each adviser and its affiliates on behalf of the funds (including descriptions of various compliance programs) and their record of compliance with investment policies and restrictions, including policies with respect to market-timing, late trading and selective portfolio disclosure, and with policies on personal securities transactions; |
| Ÿ | | Descriptions of the business continuity and disaster recovery plans of each adviser and its affiliates; |
| Ÿ | | A description of Eaton Vance Management’s procedures for overseeing third party advisers and sub-advisers, including with respect to regulatory and compliance issues, investment management and other matters; |
Eaton Vance
Atlanta Capital Horizon Growth Fund
September 30, 2013
Board of Trustees’ Contract Approval — continued
Other Relevant Information
| Ÿ | | Information concerning the nature, cost and character of the administrative and other non-investment management services provided by Eaton Vance Management and its affiliates; |
| Ÿ | | Information concerning management of the relationship with the custodian, subcustodians and fund accountants by each adviser or the funds’ administrator; and |
| Ÿ | | The terms of each advisory agreement. |
In addition to the information identified above, the Contract Review Committee considered information provided from time to time by each adviser throughout the year at meetings of the Board and its committees. Over the course of the twelve-month period ended April 30, 2013, with respect to one or more funds, the Board met eight times and the Contract Review Committee, the Audit Committee, the Governance Committee, the Portfolio Management Committee and the Compliance Reports and Regulatory Matters Committee, each of which is a Committee comprised solely of Independent Trustees, met eight, twenty-one, five, nine and thirteen times respectively. At such meetings, the Trustees participated in investment and performance reviews with the portfolio managers and other investment professionals of each adviser relating to each fund. The Board and its Committees considered the investment and trading strategies used in pursuing each fund’s investment objective, including, where relevant, the use of derivative instruments, as well as processes for monitoring best execution of portfolio transactions and risk management techniques. The Board and its Committees also evaluated issues pertaining to industry and regulatory developments, compliance procedures, fund governance and other issues with respect to the funds, and received and participated in reports and presentations provided by Eaton Vance Management and other fund advisers with respect to such matters.
For funds that invest through one or more underlying portfolios, the Board considered similar information about the portfolio(s) when considering the approval of advisory agreements. In addition, in cases where the fund’s investment adviser has engaged a sub-adviser, the Board considered similar information about the sub-adviser when considering the approval of any sub-advisory agreement.
The Contract Review Committee was assisted throughout the contract review process by Goodwin Procter LLP, legal counsel for the Independent Trustees. The members of the Contract Review Committee relied upon the advice of such counsel and their own business judgment in determining the material factors to be considered in evaluating each advisory and sub-advisory agreement and the weight to be given to each such factor. The conclusions reached with respect to each advisory and sub-advisory agreement were based on a comprehensive evaluation of all the information provided and not any single factor. Moreover, each member of the Contract Review Committee may have placed varying emphasis on particular factors in reaching conclusions with respect to each advisory and sub-advisory agreement.
Results of the Process
Based on its consideration of the foregoing, and such other information as it deemed relevant, including the factors and conclusions described below, the Contract Review Committee concluded that the continuation of the investment advisory agreement of Eaton Vance Atlanta Capital Horizon Growth Fund (the “Fund”) with Boston Management and Research (the “Adviser”) and the sub-advisory agreement with Atlanta Capital Management Company, LLC (the “Sub-adviser”), an affiliate of Eaton Vance Management, including their fee structures, is in the interests of shareholders and, therefore, the Contract Review Committee recommended to the Board approval of each agreement. The Board accepted the recommendation of the Contract Review Committee as well as the factors considered and conclusions reached by the Contract Review Committee with respect to the agreements. Accordingly, the Board, including a majority of the Independent Trustees, voted to approve continuation of the investment advisory agreement and the sub-advisory agreement for the Fund.
Nature, Extent and Quality of Services
In considering whether to approve the investment advisory agreement and the sub-advisory agreement of the Fund, the Board evaluated the nature, extent and quality of services provided to the Fund by the Adviser and the Sub-adviser.
The Board considered the Adviser’s and the Sub-adviser’s management capabilities and investment process with respect to the types of investments held by the Fund, including the education, experience and number of its investment professionals and other personnel who provide portfolio management, investment research, and similar services to the Fund. With respect to the Adviser, the Board considered the Adviser’s responsibilities supervising the Sub-adviser. With respect to the Sub-Adviser, the Board took into account the resources available to the Sub-Adviser in fulfilling its duties under the sub-advisory agreement and the Sub-Adviser’s abilities and experience in implementing the Fund’s investment strategy. In particular, the Board evaluated, where relevant, the abilities and experience of such personnel in making investments in equity securities, including both U.S. and foreign common stocks. The Board also took into account the resources dedicated to portfolio management and other services, including the compensation methods of the Adviser to recruit and retain investment personnel, and the time and attention devoted to the Fund by senior management.
The Board reviewed the compliance programs of the Adviser and relevant affiliates thereof, including the Sub-adviser. Among other matters, the Board considered compliance and reporting matters relating to personal trading by investment personnel, selective disclosure of portfolio holdings, late trading, frequent trading, portfolio valuation, business continuity and the allocation of investment opportunities. The Board also evaluated the responses of the Adviser and its affiliates to requests in recent years from regulatory authorities such as the Securities and Exchange Commission and the Financial Industry Regulatory Authority.
Eaton Vance
Atlanta Capital Horizon Growth Fund
September 30, 2013
Board of Trustees’ Contract Approval — continued
The Board considered shareholder and other administrative services provided or managed by Eaton Vance Management and its affiliates, including transfer agency and accounting services. The Board evaluated the benefits to shareholders of investing in a fund that is a part of a large family of funds, including the ability, in many cases, to exchange an investment among different funds without incurring additional sales charges.
After consideration of the foregoing factors, among others, the Board concluded that the nature, extent and quality of services provided by the Adviser and the Sub-adviser, taken as a whole, are appropriate and consistent with the terms of the investment advisory agreement and the sub-advisory agreement.
Fund Performance
The Board compared the Fund’s investment performance to a relevant universe of similarly managed funds identified by an independent data provider and appropriate benchmark indices. The Board reviewed comparative performance data for the one-, three-, five- and ten-year periods ended September 30, 2012 for the Fund. On the basis of the foregoing and other relevant information provided by the Adviser in response to inquiries from the Contract Review Committee, the Board concluded that the performance of the Fund was satisfactory.
Management Fees and Expenses
The Board reviewed contractual investment advisory fee rates, including administrative fee rates, payable by the Fund (referred to as “management fees”). As part of its review, the Board considered the management fees and the Fund’s total expense ratio for the year ended September 30, 2012, as compared to a group of similarly managed funds selected by an independent data provider. The Board noted that the Adviser had waived fees and/or paid expenses for the Fund. The Board also considered factors that had an impact on Fund expense ratios, as identified by management in response to inquiries from the Contract Review Committee, as well as actions taken by management in recent years to reduce expenses at the Eaton Vance fund complex level, including the restructuring of the Fund and the negotiation of reduced fees for transfer agency and custody services.
After reviewing the foregoing information, and in light of the nature, extent and quality of the services provided by the Adviser and the Sub-adviser, the Board concluded that the management fees charged for advisory and related services are reasonable.
Profitability
The Board reviewed the level of profits realized by the Adviser and relevant affiliates thereof, including the Sub-adviser, in providing investment advisory and administrative services to the Fund and to all Eaton Vance Funds as a group. The Board considered the level of profits realized without regard to revenue sharing or other payments by the Adviser and its affiliates to third parties in respect of distribution services. The Board also considered other direct or indirect benefits received by the Adviser and its affiliates, including the Sub-adviser, in connection with their relationships with the Fund, including the benefits of research services that may be available to the Adviser or the Sub-adviser as a result of securities transactions effected for the Fund and other investment advisory clients.
The Board concluded that, in light of the foregoing factors and the nature, extent and quality of the services rendered, the profits realized by the Adviser and its affiliates, including the Sub-adviser, are reasonable.
Economies of Scale
In reviewing management fees and profitability, the Board also considered the extent to which the Adviser and its affiliates, on the one hand, and the Fund, on the other hand, can expect to realize benefits from economies of scale as the assets of the Fund increase. The Board acknowledged the difficulty in accurately measuring the benefits resulting from the economies of scale with respect to the management of any specific fund or group of funds. The Board reviewed data summarizing the increases and decreases in the assets of the Fund and of all Eaton Vance Funds as a group over various time periods, and evaluated the extent to which the total expense ratio of the Fund and the profitability of the Adviser and its affiliates may have been affected by such increases or decreases. Based upon the foregoing, the Board concluded that the Fund currently shares in the benefits from economies of scale. The Board also concluded that, assuming reasonably foreseeable increases in the assets of the Fund, the structure of the advisory fee, which includes breakpoints at several asset levels, will allow the Fund to continue to benefit from economies of scale in the future.
Eaton Vance
Atlanta Capital Horizon Growth Fund
September 30, 2013
Management and Organization
Fund Management. The Trustees of Eaton Vance Mutual Funds Trust (the Trust) are responsible for the overall management and supervision of the Trust’s affairs. The Trustees and officers of the Trust are listed below. Except as indicated, each individual has held the office shown or other offices in the same company for the last five years. Trustees and officers of the Trust hold indefinite terms of office. The “Noninterested Trustees” consist of those Trustees who are not “interested persons” of the Trust, as that term is defined under the 1940 Act. The business address of each Trustee and officer is Two International Place, Boston, Massachusetts 02110. As used below, “EVC” refers to Eaton Vance Corp., “EV” refers to Eaton Vance, Inc., “EVM” refers to Eaton Vance Management, “BMR” refers to Boston Management and Research and “EVD” refers to Eaton Vance Distributors, Inc. EVC and EV are the corporate parent and trustee, respectively, of EVM and BMR. EVD is the Fund’s principal underwriter and a wholly-owned subsidiary of EVC. Each officer affiliated with Eaton Vance may hold a position with other Eaton Vance affiliates that is comparable to his or her position with EVM listed below. Each Trustee oversees 190 portfolios in the Eaton Vance Complex (including all master and feeder funds in a master feeder structure). Each officer serves as an officer of certain other Eaton Vance funds. Each Trustee and officer serves until his or her successor is elected.
| | | | | | |
| Name and Year of Birth | | Position(s) with the Trust | | Length of Service | | Principal Occupation(s) and Directorships During Past Five Years and Other Relevant Experience |
Interested Trustee |
| | | |
Thomas E. Faust Jr. 1958 | | Trustee | | Since 2007 | | Chairman, Chief Executive Officer and President of EVC, Director and President of EV, Chief Executive Officer and President of EVM and BMR, and Director of EVD. Trustee and/or officer of 190 registered investment companies. Mr. Faust is an interested person because of his positions with EVM, BMR, EVD, EVC and EV, which are affiliates of the Trust. Directorships in the Last Five Years.(1) Director of EVC and Hexavest Inc. |
| | | |
| | | | | | |
Noninterested Trustees |
| | | |
Scott E. Eston 1956 | | Trustee | | Since 2011 | | Private investor. Formerly held various positions at Grantham, Mayo, Van Otterloo and Co., L.L.C. (investment management firm) (1997-2009), including Chief Operating Officer (2002-2009), Chief Financial Officer (1997-2009) and Chairman of the Executive Committee (2002-2008); President and Principal Executive Officer, GMO Trust (open-end registered investment company) (2006-2009). Former Partner, Coopers and Lybrand L.L.P. (now PricewaterhouseCoopers) (public accounting firm) (1987-1997). Directorships in the Last Five Years. None. |
| | | |
Benjamin C. Esty 1963 | | Trustee | | Since 2005 | | Roy and Elizabeth Simmons Professor of Business Administration and Finance Unit Head, Harvard University Graduate School of Business Administration. Directorships in the Last Five Years.(1) None. |
| | | |
Allen R. Freedman 1940 | | Trustee | | Since 2007 | | Private Investor. Former Chairman (2002-2004) and a Director (1983-2004) of Systems & Computer Technology Corp. (provider of software to higher education). Formerly, a Director of Loring Ward International (fund distributor) (2005-2007). Former Chairman and a Director of Indus International, Inc. (provider of enterprise management software to the power generating industry) (2005-2007). Former Chief Executive Officer of Assurant, Inc. (insurance provider) (1979-2000). Directorships in the Last Five Years.(1) Director of Stonemor Partners, L.P. (owner and operator of cemeteries). Formerly, Director of Assurant, Inc. (insurance provider) (1979-2011). |
| | | |
William H. Park 1947 | | Trustee | | Since 2003 | | Consultant and private investor. Formerly, Chief Financial Officer, Aveon Group L.P. (investment management firm) (2010-2011). Formerly, Vice Chairman, Commercial Industrial Finance Corp. (specialty finance company) (2006-2010). Formerly, President and Chief Executive Officer, Prizm Capital Management, LLC (investment management firm) (2002-2005). Formerly, Executive Vice President and Chief Financial Officer, United Asset Management Corporation (investment management firm) (1982-2001). Formerly, Senior Manager, Price Waterhouse (now PricewaterhouseCoopers) (an independent registered public accounting firm) (1972-1981). Directorships in the Last Five Years.(1) None. |
| | | |
Ronald A. Pearlman 1940 | | Trustee | | Since 2003 | | Professor of Law, Georgetown University Law Center. Formerly, Deputy Assistant Secretary (Tax Policy) and Assistant Secretary (Tax Policy), U.S. Department of the Treasury (1983-1985). Formerly, Chief of Staff, Joint Committee on Taxation, U.S. Congress (1988-1990). Directorships in the Last Five Years.(1) None. |
Eaton Vance
Atlanta Capital Horizon Growth Fund
September 30, 2013
Management and Organization — continued
| | | | | | |
| Name and Year of Birth | | Position(s) with the Trust | | Length of Service | | Principal Occupation(s) and Directorships During Past Five Years and Other Relevant Experience |
Noninterested Trustees (continued) |
| | | |
Helen Frame Peters 1948 | | Trustee | | Since 2008 | | Professor of Finance, Carroll School of Management, Boston College. Formerly, Dean, Carroll School of Management, Boston College (2000-2002). Formerly, Chief Investment Officer, Fixed Income, Scudder Kemper Investments (investment management firm) (1998-1999). Formerly, Chief Investment Officer, Equity and Fixed Income, Colonial Management Associates (investment management firm) (1991-1998). Directorships in the Last Five Years.(1) Formerly, Director of BJ’s Wholesale Club, Inc. (wholesale club retailer) (2004-2011). Formerly, Trustee of SPDR Index Shares Funds and SPDR Series Trust (exchange traded funds) (2000-2009). Formerly, Director of Federal Home Loan Bank of Boston (a bank for banks) (2007-2009). |
| | | |
Lynn A. Stout 1957 | | Trustee | | Since 1998 | | Distinguished Professor of Corporate and Business Law, Jack G. Clarke Business Law Institute, Cornell University Law School. Formerly, the Paul Hastings Professor of Corporate and Securities Law (2006-2012) and Professor of Law (2001-2006), University of California at Los Angeles School of Law. Directorships in the Last Five Years.(1) None. |
| | | |
Harriett Tee Taggart 1948 | | Trustee | | Since 2011 | | Managing Director, Taggart Associates (a professional practice firm). Formerly, Partner and Senior Vice President, Wellington Management Company, LLP (investment management firm) (1983-2006). Directorships in the Last Five Years. Director of Albemarle Corporation (chemicals manufacturer) (since 2007) and The Hanover Group (specialty property and casualty insurance company) (since 2009). Formerly, Director of Lubrizol Corporation (specialty chemicals) (2007-2011). |
| | | |
Ralph F. Verni 1943 | | Chairman of the Board and Trustee | | Chairman of the Board since 2007 and Trustee since 2005 | | Consultant and private investor. Formerly, Chief Investment Officer (1982-1992), Chief Financial Officer (1988-1990) and Director (1982-1992), New England Life. Formerly, Chairperson, New England Mutual Funds (1982-1992). Formerly, President and Chief Executive Officer, State Street Management & Research (1992-2000). Formerly, Chairperson, State Street Research Mutual Funds (1992-2000). Formerly, Director, W.P. Carey, LLC (1998-2004) and First Pioneer Farm Credit Corp. (2002-2006). Directorships in the Last Five Years.(1) None. |
| | | |
| | | | | | |
Principal Officers who are not Trustees |
| Name and Year of Birth | | Position(s) with the Trust | | Length of Service | | Principal Occupation(s) During Past Five Years |
Payson F. Swaffield(2) 1956 | | President | | Since 2013 | | Vice President and Chief Income Investment Officer of EVM and BMR. |
| | | |
Maureen A. Gemma 1960 | | Vice President, Secretary and Chief Legal Officer | | Vice President since 2011, Secretary since 2007 and Chief Legal Officer since 2008 | | Vice President of EVM and BMR. |
| | | |
James F. Kirchner(3) 1967 | | Treasurer | | Since 2013 | | Vice President of EVM and BMR. |
| | | |
Paul M. O’Neil 1953 | | Chief Compliance Officer | | Since 2004 | | Vice President of EVM and BMR. |
| (1) | During their respective tenures, the Trustees (except Mr. Eston and Ms. Taggart) also served as Board members of one or more of the following Eaton Vance funds (which operated in the years noted): Eaton Vance Credit Opportunities Fund (launched in 2005 and terminated in 2010); Eaton Vance Insured Florida Plus Municipal Bond Fund (launched in 2002 and terminated in 2009); and Eaton Vance National Municipal Income Trust (launched in 1998 and terminated in 2009). |
| (2) | Prior to October 1, 2013, Mr. Swaffield was Vice President of the Trust since 2011. |
| (3) | Prior to 2013, Mr. Kirchner served as Assistant Treasurer of the Trust since 2007. |
The SAI for the Fund includes additional information about the Trustees and officers of the Fund and can be obtained without charge on Eaton Vance’s website at www.eatonvance.com or by calling 1-800-262-1122.
Eaton Vance Funds
IMPORTANT NOTICES
Privacy. The Eaton Vance organization is committed to ensuring your financial privacy. Each of the financial institutions identified below has in effect the following policy (“Privacy Policy”) with respect to nonpublic personal information about its customers:
| Ÿ | | Only such information received from you, through application forms or otherwise, and information about your Eaton Vance fund transactions will be collected. This may include information such as name, address, social security number, tax status, account balances and transactions. |
| Ÿ | | None of such information about you (or former customers) will be disclosed to anyone, except as permitted by law (which includes disclosure to employees necessary to service your account). In the normal course of servicing a customer’s account, Eaton Vance may share information with unaffiliated third parties that perform various required services such as transfer agents, custodians and broker-dealers. |
| Ÿ | | Policies and procedures (including physical, electronic and procedural safeguards) are in place that are designed to protect the confidentiality of such information. |
| Ÿ | | We reserve the right to change our Privacy Policy at any time upon proper notification to you. Customers may want to review our Privacy Policy periodically for changes by accessing the link on our homepage: www.eatonvance.com. |
Our pledge of privacy applies to the following entities within the Eaton Vance organization: the Eaton Vance Family of Funds, Eaton Vance Management, Eaton Vance Investment Counsel, Eaton Vance Distributors, Inc., Eaton Vance Trust Company, Eaton Vance Management’s Real Estate Investment Group and Boston Management and Research. In addition, our Privacy Policy applies only to those Eaton Vance customers who are individuals and who have a direct relationship with us. If a customer’s account (i.e., fund shares) is held in the name of a third-party financial advisor/broker-dealer, it is likely that only such advisor’s privacy policies apply to the customer. This notice supersedes all previously issued privacy disclosures. For more information about Eaton Vance’s Privacy Policy, please call 1-800-262-1122.
Delivery of Shareholder Documents. The Securities and Exchange Commission (SEC) permits funds to deliver only one copy of shareholder documents, including prospectuses, proxy statements and shareholder reports, to fund investors with multiple accounts at the same residential or post office box address. This practice is often called “householding” and it helps eliminate duplicate mailings to shareholders. Eaton Vance, or your financial advisor, may household the mailing of your documents indefinitely unless you instruct Eaton Vance, or your financial advisor, otherwise. If you would prefer that your Eaton Vance documents not be householded, please contact Eaton Vance at 1-800-262-1122, or contact your financial advisor. Your instructions that householding not apply to delivery of your Eaton Vance documents will be effective within 30 days of receipt by Eaton Vance or your financial advisor.
Portfolio Holdings. Each Eaton Vance Fund and its underlying Portfolio(s) (if applicable) will file a schedule of portfolio holdings on Form N-Q with the SEC for the first and third quarters of each fiscal year. The Form N-Q will be available on the Eaton Vance website at www.eatonvance.com, by calling Eaton Vance at 1-800-262-1122 or in the EDGAR database on the SEC’s website at www.sec.gov. Form N-Q may also be reviewed and copied at the SEC’s public reference room in Washington, D.C. (call 1-800-732-0330 for information on the operation of the public reference room).
Proxy Voting. From time to time, funds are required to vote proxies related to the securities held by the funds. The Eaton Vance Funds or their underlying Portfolios (if applicable) vote proxies according to a set of policies and procedures approved by the Funds’ and Portfolios’ Boards. You may obtain a description of these policies and procedures and information on how the Funds or Portfolios voted proxies relating to portfolio securities during the most recent 12-month period ended June 30, without charge, upon request, by calling 1-800-262-1122 and by accessing the SEC’s website at www.sec.gov.
Investment Adviser
Boston Management and Research
Two International Place
Boston, MA 02110
Sub-Adviser
Atlanta Capital Management Company, LLC
1075 Peachtree Street NE
Suite 2100
Atlanta, GA 30309
Administrator
Eaton Vance Management
Two International Place
Boston, MA 02110
Principal Underwriter*
Eaton Vance Distributors, Inc.
Two International Place
Boston, MA 02110
(617) 482-8260
Custodian
State Street Bank and Trust Company
200 Clarendon Street
Boston, MA 02116
Transfer Agent
BNY Mellon Investment Servicing (US) Inc.
Attn: Eaton Vance Funds
P.O. Box 9653
Providence, RI 02940-9653
(800) 262-1122
Independent Registered Public Accounting Firm
Deloitte & Touche LLP
200 Berkeley Street
Boston, MA 02116-5022
Fund Offices
Two International Place
Boston, MA 02110
| * | FINRA BrokerCheck. Investors may check the background of their Investment Professional by contacting the Financial Industry Regulatory Authority (FINRA). FINRA BrokerCheck is a free tool to help investors check the professional background of current and former FINRA-registered securities firms and brokers. FINRA BrokerCheck is available by calling 1-800-289-9999 and at www.FINRA.org. The FINRA BrokerCheck brochure describing this program is available to investors at www.FINRA.org. |

Eaton Vance
Build America Bond Fund
Annual Report
September 30, 2013

Commodity Futures Trading Commission Registration. Effective December 31, 2012, the Commodity Futures Trading Commission (“CFTC”) adopted certain regulatory changes that subject registered investment companies and advisers to regulation by the CFTC if a fund invests more than a prescribed level of its assets in certain CFTC-regulated instruments (including futures, certain options and swap agreements) or markets itself as providing investment exposure to such instruments. The Fund has claimed an exclusion from the definition of the term “commodity pool operator” under the Commodity Exchange Act and is not subject to the CFTC regulation. Because of its management of other strategies, the Fund’s adviser is registered with the CFTC as a commodity pool operator
Fund shares are not insured by the FDIC and are not deposits or other obligations of, or guaranteed by, any depository institution. Shares are subject to investment risks, including possible loss of principal invested.
This report must be preceded or accompanied by a current summary prospectus or prospectus. Before investing, investors should consider carefully the investment objective, risks, and charges and expenses of a mutual fund. This and other important information is contained in the summary prospectus and prospectus, which can be obtained from a financial advisor. Prospective investors should read the prospectus carefully before investing. For further information, please call 1-800-262-1122.
Annual Report September 30, 2013
Eaton Vance
Build America Bond Fund
Table of Contents
| | | | |
Management’s Discussion of Fund Performance | | | 2 | |
| |
Performance | | | 3 | |
| |
Fund Profile | | | 4 | |
| |
Endnotes and Additional Disclosures | | | 5 | |
| |
Fund Expenses | | | 6 | |
| |
Financial Statements | | | 7 | |
| |
Report of Independent Registered Public Accounting Firm | | | 20 | |
| |
Federal Tax Information | | | 21 | |
| |
Board of Trustees’ Contract Approval | | | 22 | |
| |
Management and Organization | | | 25 | |
| |
Important Notices | | | 27 | |
Eaton Vance
Build America Bond Fund
September 30, 2013
Management’s Discussion of Fund Performance1
Economic and Market Conditions
During the first seven months of the fiscal year ended September 30, 2013, interest rates declined to historic lows, driven by highly accommodative monetary policies instituted by central banks around the world. In December 2012, the U.S. Federal Reserve (the Fed) replaced Operation Twist, the central bank’s swapping of its short-term holdings for long-term Treasury bonds, with outright purchases of $45 billion of Treasuries each month. This was in addition to the monthly purchase of approximately $40 billion of agency mortgage-backed securities that it had begun just a few months before. These actions combined to put extraordinary downward pressure on yields, driving investors to look for other sources of income. One beneficiary was the municipal bond market, which rallied during the first seven months of the period in response to strong investor demand.
In late May 2013, however, Fed Chairman Ben Bernanke surprised the markets by indicating that the Fed’s $85 billion in monthly asset purchases, known collectively as quantitative easing (QE), could be tapered sooner than most investors had expected. The negative effect on the bond market was swift and dramatic. Investors rushed to sell fixed income assets in anticipation of rising interest rates, causing nearly every fixed income asset class to decline dramatically in value.
Historic outflows had a particularly significant effect on the traditional tax-exempt municipal bond market because, unlike other domestic fixed income asset classes, the tax-exempt municipal market is primarily retail based and is generally impacted more by the actions of small individual investors than other fixed-income asset classes. The outflows that affected the tax-exempt market were felt in the taxable Build America Bond (BAB) municipal market as well, because most BAB issuers participate in both markets. Even after the Fed tried to temper its comments and calm the markets, moderating the outflows in other fixed income classes, heavy selling in municipals continued to impact the taxable municipal market through August 2013. The selling abated in September 2013, after the Fed surprised the markets again by postponing its tapering of QE that many investors had thought was imminent.
For the one-year period as a whole, BABs, which are highly correlated to U.S. Treasury bonds, sold off along with Treasuries and tax-exempt municipals. For BABs, the selloff was somewhat amplified by the fact that the BAB taxable municipal bond program expired on December 31, 2010, ending new issuance of BABs. The Fund’s benchmark, the
Barclays U.S. Aggregate Local Authorities Bond Index2 (the Index), an unmanaged index of taxable municipal and other bonds, returned -3.96% for the one-year period.
During the fiscal year, additional pressure on both the tax-exempt and taxable municipal bond markets came from the City of Detroit’s bankruptcy filing on July 18, 2013 and heightened attention to Puerto Rico’s fiscal woes throughout September 2013. Both issuers had outstanding debt in the taxable as well as the tax-exempt municipal bond markets. Although Detroit’s bankruptcy was not a surprise, because the city’s fiscal problems had been well documented for many years, the bankruptcy’s negative headlines injected additional fear into the municipal bond market. That fear, combined with Puerto Rico’s well publicized fiscal challenges, drove both institutional and retail investors to sell Puerto Rico bonds, exerting additional downward pressure on the market value of the bonds in late August and September 2013 as the Fund’s fiscal year was ending.
Fund Performance
For the fiscal year ended September 30, 2013, Eaton Vance Build America Bond Fund (the Fund) Class A shares at net asset value (NAV) returned -3.94%, compared to the -3.96% return of the Index.
The Fund’s overall strategy is to invest primarily in taxable municipal obligations. During the period, the Fund was underweight in A-rated credits and overweight in higher-quality AA and AAA issues relative to the Index. In addition, the Index included BBB-rated bonds while the Fund had no BBB bonds. In a period when lower quality issues underperformed, the Fund’s exposure to higher quality issues, especially its lack of BBB exposure, helped results versus the Index.
In addition, the Fund was structured to have a shorter average duration7 than the Index. In a period of rising rates, this lower duration aided relative performance versus the Index as well. A lack of Puerto Rico exposure was also positive for Fund performance versus the Index, which did include Puerto Rico bonds.
In contrast, not owning non-U.S. issues detracted from Fund performance relative to the Index. Whereas the Fund consists entirely of U.S.-issued BABs, nearly a third of the Index was comprised of Canadian and European issues, which outperformed BABs during the period.
See Endnotes and Additional Disclosures in this report.
Past performance is no guarantee of future results. Returns are historical and are calculated by determining the percentage change in net asset value (NAV) or offering price (as applicable) with all distributions reinvested. Investment return and principal value will fluctuate so that shares, when redeemed, may be worth more or less than their original cost. Performance less than one year is cumulative. Performance is for the stated time period only; due to market volatility, the Fund’s current performance may be lower or higher than quoted. Returns are before taxes unless otherwise noted. For performance as of the most recent month end, please refer to www.eatonvance.com.
Eaton Vance
Build America Bond Fund
September 30, 2013
Performance2,3
Portfolio Managers Cynthia J. Clemson and Craig R. Brandon, CFA
| | | | | | | | | | | | | | | | | | | | |
| % Average Annual Total Returns | | Class
Inception Date | | | Performance
Inception Date | | | One Year | | | Five Years | | | Since Inception | |
Class A at NAV | | | 11/17/2009 | | | | 11/17/2009 | | | | –3.94 | % | | | — | | | | 8.46 | % |
Class A with 4.75% Maximum Sales Charge | | | — | | | | — | | | | –8.52 | | | | — | | | | 7.11 | |
Class C at NAV | | | 11/17/2009 | | | | 11/17/2009 | | | | –4.65 | | | | — | | | | 7.70 | |
Class C with 1% Maximum Sales Charge | | | — | | | | — | | | | –5.57 | | | | — | | | | 7.70 | |
Class I at NAV | | | 11/17/2009 | | | | 11/17/2009 | | | | –3.70 | | | | — | | | | 8.71 | |
Barclays U.S. Aggregate Local Authorities Bond Index | | | — | | | | — | | | | –3.96 | % | | | 6.52 | % | | | 6.55 | % |
| | | | | |
| | | | | | | | | | | | | | | | | | | | |
| % Total Annual Operating Expense Ratios4 | | | | | | | | Class A | | | Class C | | | Class I | |
Gross | | | | | | | | | | | 1.14 | % | | | 1.89 | % | | | 0.89 | % |
Net | | | | | | | | | | | 0.95 | | | | 1.70 | | | | 0.70 | |
| | | | | |
| | | | | | | | | | | | | | | | | | | | |
| % Distribution Rates/Yields5 | | | | | | | | Class A | | | Class C | | | Class I | |
Distribution Rate | | | | | | | | | | | 4.88 | % | | | 4.13 | % | | | 5.13 | % |
SEC 30-day Yield | | | | | | | | | | | 3.51 | | | | 2.93 | | | | 3.93 | |
Growth of $10,000
This graph shows the change in value of a hypothetical investment of $10,000 in Class A of the Fund for the period indicated. For comparison, the same investment is shown in the indicated index.
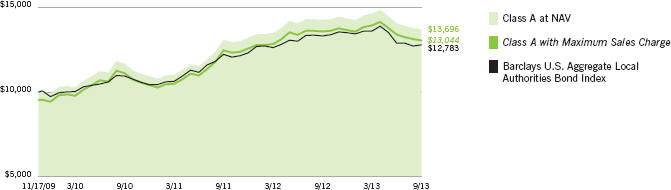
| | | | | | | | |
| Growth of Investment | | Amount Invested | | Period Beginning | | At NAV | | With Maximum
Sales Charge |
Class C | | $ 10,000 | | 11/17/2009 | | $ 13,327 | | N.A. |
Class I | | $250,000 | | 11/17/2009 | | $345,439 | | N.A. |
See Endnotes and Additional Disclosures in this report.
Past performance is no guarantee of future results. Returns are historical and are calculated by determining the percentage change in net asset value (NAV) or offering price (as applicable) with all distributions reinvested. Investment return and principal value will fluctuate so that shares, when redeemed, may be worth more or less than their original cost. Performance less than one year is cumulative. Performance is for the stated time period only; due to market volatility, the Fund’s current performance may be lower or higher than quoted. Returns are before taxes unless otherwise noted. For performance as of the most recent month end, please refer to www.eatonvance.com.
Eaton Vance
Build America Bond Fund
September 30, 2013
Fund Profile
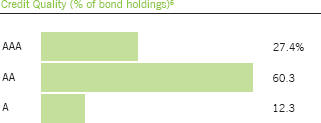
See Endnotes and Additional Disclosures in this report.
Eaton Vance
Build America Bond Fund
September 30, 2013
Endnotes and Additional Disclosures
| 1 | The views expressed in this report are those of the portfolio manager(s) and are current only through the date stated at the top of this page. These views are subject to change at any time based upon market or other conditions, and Eaton Vance and the Fund(s) disclaim any responsibility to update such views. These views may not be relied upon as investment advice and, because investment decisions are based on many factors, may not be relied upon as an indication of trading intent on behalf of any Eaton Vance fund. This commentary may contain statements that are not historical facts, referred to as “forward looking statements”. The Fund’s actual future results may differ significantly from those stated in any forward looking statement, depending on factors such as changes in securities or financial markets or general economic conditions, the volume of sales and purchases of Fund shares, the continuation of investment advisory, administrative and service contracts, and other risks discussed from time to time in the Fund’s filings with the Securities and Exchange Commission. |
| 2 | Barclays U.S. Aggregate Local Authorities Bond Index is an unmanaged index that measures the performance of U.S. investment-grade fixed-rate debt issued directly or indirectly by local government authorities. Unless otherwise stated, index returns do not reflect the effect of any applicable sales charges, commissions, expenses, taxes or leverage, as applicable. It is not possible to invest directly in an index. |
| 3 | Total Returns at NAV do not include applicable sales charges. If sales charges were deducted, the returns would be lower. Total Returns shown with maximum sales charge reflect the stated maximum sales charge. Unless otherwise stated, performance does not reflect the deduction of taxes on Fund distributions or redemptions of Fund shares. Performance since inception for an index, if presented, is the performance since the Fund’s or oldest share class’ inception, as applicable. |
| 4 | Source: Fund prospectus. Net expense ratio reflects a contractual expense reimbursement that continues through 1/31/14. Without the reimbursement, performance would have been lower. |
| 5 | The Distribution Rate is based on the Fund’s last regular distribution per share in the period (annualized) divided by the Fund’s NAV at the end of the period. The Fund’s distributions may be composed of ordinary income, tax-exempt income, net realized capital gains and return of capital. The Fund’s distributions are determined by the investment adviser based on its current assessment of the Fund’s long-term return potential. As portfolio and market conditions change, the rate of distributions paid by the Fund could change. SEC Yield is a standardized measure based on the estimated yield to maturity of a fund’s investments over a 30-day period and is based on the maximum offer price at the date specified. The SEC Yield is not based on the distributions made by the Fund, which may differ. Yield reflects the effect of fee waivers and expense reimbursements. |
| 6 | Ratings are based on Moody’s, S&P or Fitch, as applicable. Ratings, which are subject to change, apply to the creditworthiness of the issuers of the underlying securities and not to the Fund or its shares. Credit ratings measure the quality of a bond based on the issuer’s creditworthiness, with ratings ranging from AAA, being the highest, to D, being the lowest based on S&P’s measures. Ratings of BBB or higher by Standard and Poor’s or Fitch (Baa or higher by Moody’s) are considered to be investment grade quality. Credit ratings are based largely on the rating agency’s analysis at the time of rating. The rating assigned to any particular security is not necessarily a reflection of the issuer’s current financial condition and does not necessarily reflect its assessment of the volatility of a security’s market value or of the liquidity of an investment in the security. If securities are rated differently by the rating agencies, the higher rating is applied. Holdings designated as “Not Rated” are not rated by the national rating agencies stated above. |
| 7 | Duration is a measure of the expected change in price of a bond — in percentage terms — given a one percent change in interest rates, all else being constant. Securities with lower durations tend to be less sensitive to interest-rate changes. |
| | Fund profile subject to change due to active management. |
Eaton Vance
Build America Bond Fund
September 30, 2013
Fund Expenses
Example: As a Fund shareholder, you incur two types of costs: (1) transaction costs, including sales charges (loads) on purchases and redemption fees (if applicable); and (2) ongoing costs, including management fees; distribution and/or service fees; and other Fund expenses. This Example is intended to help you understand your ongoing costs (in dollars) of Fund investing and to compare these costs with the ongoing costs of investing in other mutual funds. The Example is based on an investment of $1,000 invested at the beginning of the period and held for the entire period (April 1, 2013 – September 30, 2013).
Actual Expenses: The first section of the table below provides information about actual account values and actual expenses. You may use the information in this section, together with the amount you invested, to estimate the expenses that you paid over the period. Simply divide your account value by $1,000 (for example, an $8,600 account value divided by $1,000 = 8.6), then multiply the result by the number in the first section under the heading entitled “Expenses Paid During Period” to estimate the expenses you paid on your account during this period.
Hypothetical Example for Comparison Purposes: The second section of the table below provides information about hypothetical account values and hypothetical expenses based on the actual Fund expense ratio and an assumed rate of return of 5% per year (before expenses), which is not the actual Fund return. The hypothetical account values and expenses may not be used to estimate the actual ending account balance or expenses you paid for the period. You may use this information to compare the ongoing costs of investing in your Fund and other funds. To do so, compare this 5% hypothetical example with the 5% hypothetical examples that appear in the shareholder reports of the other funds.
Please note that the expenses shown in the table are meant to highlight your ongoing costs only and do not reflect any transactional costs, such as sales charges (loads) or redemption fees (if applicable). Therefore, the second section of the table is useful in comparing ongoing costs only, and will not help you determine the relative total costs of owning different funds. In addition, if these transactional costs were included, your costs would be higher.
| | | | | | | | | | | | | | | | |
| | | Beginning
Account Value
(4/1/13) | | | Ending
Account Value
(9/30/13) | | | Expenses Paid
During Period*
(4/1/13 – 9/30/13) | | | Annualized
Expense
Ratio | |
| | | | |
| | | | | | | | | | | | | | | | |
Actual | | | | | | | | | | | | | |
Class A | | $ | 1,000.00 | | | $ | 936.50 | | | $ | 4.61 | ** | | | 0.95 | % |
Class C | | $ | 1,000.00 | | | $ | 933.80 | | | $ | 8.24 | ** | | | 1.70 | % |
Class I | | $ | 1,000.00 | | | $ | 937.70 | | | $ | 3.40 | ** | | | 0.70 | % |
| | | | | | | | | | | | | | | | | |
| | | | |
| | | | | | | | | �� | | | | | | | |
Hypothetical | | | | | | | | | | | | | |
(5% return per year before expenses) | | | | | | | | | | | | | |
Class A | | $ | 1,000.00 | | | $ | 1,020.30 | | | $ | 4.81 | ** | | | 0.95 | % |
Class C | | $ | 1,000.00 | | | $ | 1,016.50 | | | $ | 8.59 | ** | | | 1.70 | % |
Class I | | $ | 1,000.00 | | | $ | 1,021.60 | | | $ | 3.55 | ** | | | 0.70 | % |
| * | Expenses are equal to the Fund’s annualized expense ratio for the indicated Class, multiplied by the average account value over the period, multiplied by 183/365 (to reflect the one-half year period). The Example assumes that the $1,000 was invested at the net asset value per share determined at the close of business on March 31, 2013. |
| ** | Absent an allocation of certain expenses to an affiliate, the expenses would be higher. |
Eaton Vance
Build America Bond Fund
September 30, 2013
Portfolio of Investments
| | | | | | | | |
| Taxable Municipal Securities — 96.7%(1) | |
| Security | | Principal
Amount
(000’s omitted) | | | Value | |
| | | | | | | | |
|
Education — 8.5% | |
Indiana University, 5.536%, 6/1/30 | | $ | 1,300 | | | $ | 1,432,990 | |
University of Massachusetts Building Authority, 6.573%, 5/1/39 | | | 1,470 | | | | 1,586,233 | |
University of Michigan, 6.172%, 4/1/30 | | | 530 | | | | 582,926 | |
University of Texas, 6.276%, 8/15/41 | | | 1,775 | | | | 1,935,566 | |
| | | | | | | | | |
| | | | | | $ | 5,537,715 | |
| | | | | | | | | |
|
Electric Utilities — 7.6% | |
Los Angeles, CA, Department of Water and Power, 6.166%, 7/1/40 | | $ | 540 | | | $ | 569,490 | |
Los Angeles, CA, Department of Water and Power, 7.00%, 7/1/41 | | | 505 | | | | 564,898 | |
Nebraska Public Power District, 5.323%, 1/1/30 | | | 1,000 | | | | 1,026,470 | |
Northern Illinois Municipal Power Agency, 7.62%, 1/1/30 | | | 1,000 | | | | 1,141,870 | |
San Antonio, TX, Electric & Gas Revenue, 6.168%, 2/1/41 | | | 1,440 | | | | 1,606,723 | |
| | | | | | | | | |
| | | | | | $ | 4,909,451 | |
| | | | | | | | | |
|
General Obligations — 40.1% | |
Ann Arbor, MI, 5.40%, 5/1/23 | | $ | 1,000 | | | $ | 1,110,340 | |
California, 7.70%, 11/1/30 | | | 2,380 | | | | 2,787,980 | |
Commonwealth of Pennsylvania, 5.85%, 7/15/30 | | | 1,705 | | | | 1,859,626 | |
Dallas, TX, Independent School District, (PSF Guaranteed), 6.45%, 2/15/35 | | | 2,040 | | | | 2,298,774 | |
Denton County, TX, 5.968%, 7/15/35 | | | 1,020 | | | | 1,106,119 | |
Denver, CO, 5.65%, 8/1/30 | | | 1,250 | | | | 1,440,375 | |
Florida, Board of Education, 5.50%, 6/1/27 | | | 1,000 | | | | 1,087,250 | |
Florida, Board of Education, 5.65%, 6/1/30 | | | 1,000 | | | | 1,053,080 | |
Montgomery County, PA, 6.03%, 9/1/39 | | | 2,365 | | | | 2,622,359 | |
New York, NY, 5.676%, 10/1/34 | | | 1,055 | | | | 1,110,282 | |
New York, NY, 6.646%, 12/1/31 | | | 2,500 | | | | 2,877,500 | |
San Antonio, TX, Independent School District, (PSF Guaranteed), 6.247%, 8/15/35 | | | 1,245 | | | | 1,418,453 | |
San Mateo, CA, Union High School District, 6.733%, 9/1/34 | | | 900 | | | | 1,000,521 | |
Santa Monica, CA, Community College District, 6.763%, 8/1/34 | | | 2,470 | | | | 2,843,414 | |
Shelby County, TN, 5.75%, 4/1/34 | | | 385 | | | | 423,870 | |
Southwest Regional Sanitary Sewer & Water Authority, MI, 6.50%, 4/1/40 | | | 805 | | | | 900,908 | |
| | | | | | | | | |
| | | | | | $ | 25,940,851 | |
| | | | | | | | | |
|
Hospital — 1.2% | |
King County, WA, Public Hospital District No. 1, 7.90%, 6/15/30 | | $ | 250 | | | $ | 268,863 | |
King County, WA, Public Hospital District No. 1, 8.00%, 6/15/40 | | | 500 | | | | 531,815 | |
| | | | | | | | | |
| | | | | | $ | 800,678 | |
| | | | | | | | | |
| | | | | | | | |
| Security | | Principal
Amount
(000’s omitted) | | | Value | |
| | | | | | | | |
|
Lease Revenue / Certificates of Participation — 3.6% | |
North Carolina Turnpike Authority, (Triangle Expressway System), 6.70%, 1/1/39 | | $ | 1,615 | | | $ | 1,756,216 | |
Oregon Department of Administrative Services, 6.18%, 5/1/35 | | | 500 | | | | 549,340 | |
| | | | | | | | | |
| | | | | | $ | 2,305,556 | |
| | | | | | | | | |
|
Other Revenue — 5.7% | |
Battery Park City Authority, NY, 6.375%, 11/1/39 | | $ | 1,335 | | | $ | 1,461,331 | |
Florida State Board of Education, Lottery Revenue, 6.584%, 7/1/29 | | | 440 | | | | 492,008 | |
New York, NY, Transitional Finance Authority, (Building Aid), 7.128%, 7/15/30 | | | 1,500 | | | | 1,734,525 | |
| | | | | | | | | |
| | | | | | $ | 3,687,864 | |
| | | | | | | | | |
|
Special Tax Revenue — 9.3% | |
Dallas, TX, Area Rapid Transit, 6.249%, 12/1/34 | | $ | 1,265 | | | $ | 1,381,468 | |
Iowa, Special Obligation, 6.75%, 6/1/34 | | | 1,960 | | | | 2,222,895 | |
Miami-Dade County, FL, Transit Sales Surtax Revenue, 6.71%, 7/1/29 | | | 1,105 | | | | 1,240,252 | |
New York, NY, Transitional Finance Authority, Future Tax Revenue, 5.882%, 11/1/31 | | | 1,035 | | | | 1,155,816 | |
| | | | | | | | | |
| | | | | | $ | 6,000,431 | |
| | | | | | | | | |
|
Transportation — 8.9% | |
Florida Department of Transportation Authority, 6.80%, 7/1/39 | | $ | 1,185 | | | $ | 1,294,399 | |
Maryland Transportation Authority, 5.788%, 7/1/29 | | | 850 | | | | 944,809 | |
New Jersey Transportation Trust Fund Authority, 6.104%, 12/15/28 | | | 1,775 | | | | 1,915,154 | |
Port of Seattle, WA, 7.00%, 5/1/36 | | | 1,395 | | | | 1,609,746 | |
| | | | | | | | | |
| | | | | | $ | 5,764,108 | |
| | | | | | | | | |
|
Water and Sewer — 11.8% | |
Chesapeake, VA, Water and Sewer Revenue, 6.283%, 7/1/40 | | $ | 775 | | | $ | 849,671 | |
Colorado Springs Utilities System, 5.338%, 11/15/30 | | | 1,000 | | | | 1,042,190 | |
Hamilton County, OH, Sewer System Revenue, 6.50%, 12/1/34 | | | 1,000 | | | | 1,121,200 | |
Jea, FL, Water and Sewer Revenue, 6.21%, 10/1/33 | | | 100 | | | | 113,884 | |
Knoxville, TN, Wastewater System Revenue, 6.50%, 4/1/43 | | | 570 | | | | 640,652 | |
Metropolitan Water District of Southern California, 6.538%, 7/1/39 | | | 1,540 | | | | 1,694,524 | |
New York, NY, Municipal Water Finance Authority, 6.452%, 6/15/41 | | | 1,025 | | | | 1,097,098 | |
Northeast Ohio Regional Sewer District, 6.038%, 11/15/40 | | | 1,000 | | | | 1,069,850 | |
| | | | | | | | | |
| | | | | | $ | 7,629,069 | |
| | | | | | | | | |
| |
Total Taxable Municipal Securities — 96.7%
(identified cost $61,596,075) | | | $ | 62,575,723 | |
| | | | | | | | | |
| | | | |
| | 7 | | See Notes to Financial Statements. |
Eaton Vance
Build America Bond Fund
September 30, 2013
Portfolio of Investments — continued
| | | | | | | | |
| Short-Term Investments — 0.0%(2) | |
| | |
| | | | | | | | |
| Description | | Interest
(000’s omitted) | | | Value | |
| | | | | | | | |
Eaton Vance Cash Reserves Fund, LLC, 0.11%(3) | | $ | 19 | | | $ | 18,746 | |
| | | | | | | | | |
| |
Total Short-Term Investments
(identified cost $18,746) | | | $ | 18,746 | |
| | | | | | | | | |
| |
Total Investments — 96.7%
(identified cost $61,614,821) | | | $ | 62,594,469 | |
| | |
| |
Other Assets, Less Liabilities — 3.3% | | | $ | 2,116,902 | |
| | |
| |
Net Assets — 100.0% | | | $ | 64,711,371 | |
| | |
The percentage shown for each investment category in the Portfolio of Investments is based on net assets.
| | | | |
| PSF | | – | | Permanent School Fund |
At September 30, 2013, the concentration of the Fund’s investments in the various states, determined as a percentage of net assets, is as follows:
| | | | |
| Texas | | | 15.1% | |
| California | | | 14.6% | |
| New York | | | 14.6% | |
| Others, representing less than 10% individually | | | 52.4% | |
| (1) | Build America Bonds. Represent taxable municipal obligations issued pursuant to the America Recovery and Reinvestment Act of 2009 or other legislation providing for the issuance of taxable municipal debt on which the issuer receives federal support. |
| (2) | Amount is less than 0.05%. |
| (3) | Affiliated investment company, available to Eaton Vance portfolios and funds, which invests in high quality, U.S. dollar denominated money market instruments. The rate shown is the annualized seven-day yield as of September 30, 2013. |
| | | | |
| | 8 | | See Notes to Financial Statements. |
Eaton Vance
Build America Bond Fund
September 30, 2013
Statement of Assets and Liabilities
| | | | |
| Assets | | September 30, 2013 | |
Unaffiliated investments, at value (identified cost, $61,596,075) | | $ | 62,575,723 | |
Affiliated investment, at value (identified cost, $18,746) | | | 18,746 | |
Interest receivable | | | 1,019,474 | |
Interest receivable from affiliated investment | | | 10 | |
Receivable for investments sold | | | 2,210,290 | |
Receivable for Fund shares sold | | | 29,761 | |
Receivable from affiliate | | | 42,784 | |
Total assets | | $ | 65,896,788 | |
| |
| Liabilities | | | | |
Demand note payable | | $ | 400,000 | |
Payable for Fund shares redeemed | | | 608,519 | |
Distributions payable | | | 50,883 | |
Payable to affiliates: | | | | |
Investment adviser fee | | | 36,296 | |
Distribution and service fees | | | 23,191 | |
Accrued expenses | | | 66,528 | |
Total liabilities | | $ | 1,185,417 | |
Net Assets | | $ | 64,711,371 | |
|
| Sources of Net Assets | |
Paid-in capital | | $ | 65,262,993 | |
Accumulated net realized loss | | | (1,515,917 | ) |
Accumulated distributions in excess of net investment income | | | (15,353 | ) |
Net unrealized appreciation | | | 979,648 | |
Net Assets | | $ | 64,711,371 | |
|
| Class A Shares | |
Net Assets | | $ | 27,060,988 | |
Shares Outstanding | | | 2,348,277 | |
Net Asset Value and Redemption Price Per Share | | | | |
(net assets ÷ shares of beneficial interest outstanding) | | $ | 11.52 | |
Maximum Offering Price Per Share | | | | |
(100 ÷ 95.25 of net asset value per share) | | $ | 12.09 | |
|
| Class C Shares | |
Net Assets | | $ | 18,946,204 | |
Shares Outstanding | | | 1,644,785 | |
Net Asset Value and Offering Price Per Share* | | | | |
(net assets ÷ shares of beneficial interest outstanding) | | $ | 11.52 | |
|
| Class I Shares | |
Net Assets | | $ | 18,704,179 | |
Shares Outstanding | | | 1,623,336 | |
Net Asset Value, Offering Price and Redemption Price Per Share | | | | |
(net assets ÷ shares of beneficial interest outstanding) | | $ | 11.52 | |
On sales of $50,000 or more, the offering price of Class A shares is reduced.
| * | Redemption price per share is equal to the net asset value less any applicable contingent deferred sales charge. |
| | | | |
| | 9 | | See Notes to Financial Statements. |
Eaton Vance
Build America Bond Fund
September 30, 2013
Statement of Operations
| | | | |
| Investment Income | | Year Ended
September 30, 2013 | |
Interest | | $ | 4,214,863 | |
Interest allocated from affiliated investment | | | 524 | |
Expenses allocated from affiliated investment | | | (50 | ) |
Total investment income | | $ | 4,215,337 | |
| |
| Expenses | | | | |
Investment adviser fee | | $ | 586,373 | |
Distribution and service fees | | | | |
Class A | | | 89,047 | |
Class C | | | 312,092 | |
Trustees’ fees and expenses | | | 4,247 | |
Custodian fee | | | 58,148 | |
Transfer and dividend disbursing agent fees | | | 68,344 | |
Legal and accounting services | | | 35,425 | |
Printing and postage | | | 21,680 | |
Registration fees | | | 94,075 | |
Miscellaneous | | | 27,470 | |
Total expenses | | $ | 1,296,901 | |
Deduct — | | | | |
Allocation of expenses to affiliate | | $ | 212,401 | |
Total expense reductions | | $ | 212,401 | |
| |
Net expenses | | $ | 1,084,500 | |
| |
Net investment income | | $ | 3,130,837 | |
|
| Realized and Unrealized Gain (Loss) | |
Net realized gain (loss) — | | | | |
Investment transactions | | $ | (178,961 | ) |
Investment transactions allocated from affiliated investment | | | 11 | |
Net realized loss | | $ | (178,950 | ) |
Change in unrealized appreciation (depreciation) — | | | | |
Investments | | $ | (6,280,817 | ) |
Net change in unrealized appreciation (depreciation) | | $ | (6,280,817 | ) |
| |
Net realized and unrealized loss | | $ | (6,459,767 | ) |
| |
Net decrease in net assets from operations | | $ | (3,328,930 | ) |
| | | | |
| | 10 | | See Notes to Financial Statements. |
Eaton Vance
Build America Bond Fund
September 30, 2013
Statements of Changes in Net Assets
| | | | | | | | |
| | | Year Ended September 30, | |
| Increase (Decrease) in Net Assets | | 2013 | | | 2012 | |
From operations — | | | | | | | | |
Net investment income | | $ | 3,130,837 | | | $ | 2,653,106 | |
Net realized gain (loss) from investment transactions | | | (178,950 | ) | | | 1,758,654 | |
Net change in unrealized appreciation (depreciation) from investments | | | (6,280,817 | ) | | | 1,907,566 | |
Net increase (decrease) in net assets from operations | | $ | (3,328,930 | ) | | $ | 6,319,326 | |
Distributions to shareholders — | | | | | | | | |
From net investment income | | | | | | | | |
Class A | | $ | (1,531,935 | ) | | $ | (1,428,732 | ) |
Class C | | | (1,107,015 | ) | | | (749,608 | ) |
Class I | | | (1,404,065 | ) | | | (885,612 | ) |
From net realized gain | | | | | | | | |
Class A | | | (241,510 | ) | | | — | |
Class C | | | (220,629 | ) | | | — | |
Class I | | | (180,424 | ) | | | — | |
Total distributions to shareholders | | $ | (4,685,578 | ) | | $ | (3,063,952 | ) |
Transactions in shares of beneficial interest — | | | | | | | | |
Proceeds from sale of shares | | | | | | | | |
Class A | | $ | 7,737,105 | | | $ | 39,440,546 | |
Class C | | | 5,562,951 | | | | 24,492,184 | |
Class I | | | 24,588,857 | | | | 47,390,749 | |
Net asset value of shares issued to shareholders in payment of distributions declared | | | | | | | | |
Class A | | | 1,678,811 | | | | 1,320,847 | |
Class C | | | 773,674 | | | | 566,954 | |
Class I | | | 1,066,179 | | | | 403,280 | |
Cost of shares redeemed | | | | | | | | |
Class A | | | (23,516,490 | ) | | | (21,501,497 | ) |
Class C | | | (20,152,437 | ) | | | (4,444,385 | ) |
Class I | | | (45,080,837 | ) | | | (20,805,713 | ) |
Net increase (decrease) in net assets from Fund share transactions | | $ | (47,342,187 | ) | | $ | 66,862,965 | |
| | |
Net increase (decrease) in net assets | | $ | (55,356,695 | ) | | $ | 70,118,339 | |
|
| Net Assets | |
At beginning of year | | $ | 120,068,066 | | | $ | 49,949,727 | |
At end of year | | $ | 64,711,371 | | | $ | 120,068,066 | |
|
Accumulated distributions in excess of net investment income
included in net assets | |
At end of year | | $ | (15,353 | ) | | $ | (232 | ) |
| | | | |
| | 11 | | See Notes to Financial Statements. |
Eaton Vance
Build America Bond Fund
September 30, 2013
Financial Highlights
| | | | | | | | | | | | | | | | |
| | | Class A | |
| | | Year Ended September 30, | | | Period Ended September 30, 2011(1) | | | Period Ended October 31, 2010(2) | |
| | | 2013 | | | 2012 | | | |
Net asset value — Beginning of period | | $ | 12.600 | | | $ | 12.040 | | | $ | 10.840 | | | $ | 10.000 | |
| | | | |
| Income (Loss) From Operations | | | | | | | | | | | | | | | | |
Net investment income(3) | | $ | 0.415 | | | $ | 0.430 | | | $ | 0.469 | | | $ | 0.455 | |
Net realized and unrealized gain (loss) | | | (0.888 | ) | | | 0.627 | | | | 1.216 | | | | 0.796 | |
| | | | |
Total income (loss) from operations | | $ | (0.473 | ) | | $ | 1.057 | | | $ | 1.685 | | | $ | 1.251 | |
| | | | |
| Less Distributions | | | | | | | | | | | | | | | | |
From net investment income | | $ | (0.530 | ) | | $ | (0.497 | ) | | $ | (0.481 | ) | | $ | (0.411 | ) |
From net realized gain | | | (0.077 | ) | | | — | | | | (0.004 | ) | | | — | |
| | | | |
Total distributions | | $ | (0.607 | ) | | $ | (0.497 | ) | | $ | (0.485 | ) | | $ | (0.411 | ) |
| | | | |
Net asset value — End of period | | $ | 11.520 | | | $ | 12.600 | | | $ | 12.040 | | | $ | 10.840 | |
| | | | |
Total Return(4) | | | (3.94 | )% | | | 8.96 | % | | | 16.18 | %(5) | | | 12.64 | %(5) |
| | | | |
| Ratios/Supplemental Data | | | | | | | | | | | | | | | | |
Net assets, end of period (000’s omitted) | | $ | 27,061 | | | $ | 44,175 | | | $ | 23,327 | | | $ | 26,862 | |
Ratios (as a percentage of average daily net assets): | | | | | | | | | | | | | | | | |
Expenses(6) | | | 0.95 | % | | | 0.95 | % | | | 0.95 | %(7)(8) | | | 0.95 | %(7)(8) |
Net investment income | | | 3.37 | % | | | 3.50 | % | | | 4.79 | %(7) | | | 4.38 | %(7) |
Portfolio Turnover of the Portfolio(9) | | | — | | | | — | | | | 22 | %(5) | | | 1 | %(5) |
Portfolio Turnover of the Fund | | | 19 | % | | | 24 | % | | | 10 | %(5)(10) | | | — | |
| (1) | For the eleven months ended September 30, 2011. The Fund changed its fiscal year-end from October 31 to September 30. |
| (2) | For the period from the start of business, November 17, 2009, to October 31, 2010. |
| (3) | Computed using average shares outstanding. |
| (4) | Returns are historical and are calculated by determining the percentage change in net asset value with all distributions reinvested and do not reflect the effect of sales charges. |
| (6) | The investment adviser of the Portfolio or Fund and administrator subsidized certain operating expenses (equal to 0.22%, 0.19%, 0.41% and 1.16% of average daily net assets for the years ended September 30, 2013 and 2012, the period ended September 30, 2011 and the period from the start of business, November 17, 2009, to October 31, 2010, respectively). Absent this subsidy, total return would be lower. |
| (8) | Includes the Fund’s share of the Portfolio’s allocated expenses for the period while the Fund was investing in the Portfolio. |
| (9) | Portfolio turnover represents the rate of portfolio activity for the period while the Fund was investing in the Portfolio. |
| (10) | For the period from March 1, 2011 through September 30, 2011 when the Fund was making investments directly in securities. |
| | References to Portfolio herein are to Build America Bond Portfolio, a Massachusetts business trust having the same investment objective and policies as the Fund, in which the Fund invested all of its investable assets prior to March 1, 2011. |
| | | | |
| | 12 | | See Notes to Financial Statements. |
Eaton Vance
Build America Bond Fund
September 30, 2013
Financial Highlights — continued
| | | | | | | | | | | | | | | | |
| | | Class C | |
| | | Year Ended September 30, | | | Period Ended September 30, 2011(1) | | | Period Ended October 31, 2010(2) | |
| | | 2013 | | | 2012 | | | |
Net asset value — Beginning of period | | $ | 12.600 | | | $ | 12.040 | | | $ | 10.840 | | | $ | 10.000 | |
| | | | |
| Income (Loss) From Operations | | | | | | | | | | | | | | | | |
Net investment income(3) | | $ | 0.323 | | | $ | 0.337 | | | $ | 0.396 | | | $ | 0.371 | |
Net realized and unrealized gain (loss) | | | (0.888 | ) | | | 0.627 | | | | 1.215 | | | | 0.819 | |
| | | | |
Total income (loss) from operations | | $ | (0.565 | ) | | $ | 0.964 | | | $ | 1.611 | | | $ | 1.190 | |
| | | | |
| Less Distributions | | | | | | | | | | | | | | | | |
From net investment income | | $ | (0.438 | ) | | $ | (0.404 | ) | | $ | (0.407 | ) | | $ | (0.350 | ) |
From net realized gain | | | (0.077 | ) | | | — | | | | (0.004 | ) | | | — | |
| | | | |
Total distributions | | $ | (0.515 | ) | | $ | (0.404 | ) | | $ | (0.411 | ) | | $ | (0.350 | ) |
| | | | |
Net asset value — End of period | | $ | 11.520 | | | $ | 12.600 | | | $ | 12.040 | | | $ | 10.840 | |
| | | | |
Total Return(4) | | | (4.65 | )% | | | 8.14 | % | | | 15.50 | %(5) | | | 11.91 | %(5) |
| | | | |
| Ratios/Supplemental Data | | | | | | | | | | | | | | | | |
Net assets, end of period (000’s omitted) | | $ | 18,946 | | | $ | 35,407 | | | $ | 13,684 | | | $ | 13,003 | |
Ratios (as a percentage of average daily net assets): | | | | | | | | | | | | | | | | |
Expenses(6) | | | 1.70 | % | | | 1.70 | % | | | 1.70 | %(7)(8) | | | 1.70 | %(7)(8) |
Net investment income | | | 2.62 | % | | | 2.74 | % | | | 4.05 | %(7) | | | 3.56 | %(7) |
Portfolio Turnover of the Portfolio(9) | | | — | | | | — | | | | 22 | %(5) | | | 1 | %(5) |
Portfolio Turnover of the Fund | | | 19 | % | | | 24 | % | | | 10 | %(5)(10) | | | — | |
| (1) | For the eleven months ended September 30, 2011. The Fund changed its fiscal year-end from October 31 to September 30. |
| (2) | For the period from the start of business, November 17, 2009, to October 31, 2010. |
| (3) | Computed using average shares outstanding. |
| (4) | Returns are historical and are calculated by determining the percentage change in net asset value with all distributions reinvested and do not reflect the effect of sales charges. |
| (6) | The investment adviser of the Portfolio or Fund and administrator subsidized certain operating expenses (equal to 0.22%, 0.19%, 0.41% and 1.16% of average daily net assets for the years ended September 30, 2013 and 2012, the period ended September 30, 2011 and the period from the start of business, November 17, 2009, to October 31, 2010, respectively). Absent this subsidy, total return would be lower. |
| (8) | Includes the Fund’s share of the Portfolio’s allocated expenses for the period while the Fund was investing in the Portfolio. |
| (9) | Portfolio turnover represents the rate of portfolio activity for the period while the Fund was investing in the Portfolio. |
| (10) | For the period from March 1, 2011 through September 30, 2011 when the Fund was making investments directly in securities. |
| | References to Portfolio herein are to Build America Bond Portfolio, a Massachusetts business trust having the same investment objective and policies as the Fund, in which the Fund invested all of its investable assets prior to March 1, 2011. |
| | | | |
| | 13 | | See Notes to Financial Statements. |
Eaton Vance
Build America Bond Fund
September 30, 2013
Financial Highlights — continued
| | | | | | | | | | | | | | | | |
| | | Class I | |
| | | Year Ended September 30, | | | Period Ended September 30, 2011(1) | | | Period Ended October 31, 2010(2) | |
| | | 2013 | | | 2012 | | | |
Net asset value — Beginning of period | | $ | 12.600 | | | $ | 12.050 | | | $ | 10.840 | | | $ | 10.000 | |
| | | | |
| Income (Loss) From Operations | | | | | | | | | | | | | | | | |
Net investment income(3) | | $ | 0.447 | | | $ | 0.458 | | | $ | 0.495 | | | $ | 0.460 | |
Net realized and unrealized gain (loss) | | | (0.889 | ) | | | 0.620 | | | | 1.225 | | | | 0.808 | |
| | | | |
Total income (loss) from operations | | $ | (0.442 | ) | | $ | 1.078 | | | $ | 1.720 | | | $ | 1.268 | |
| | | | |
| Less Distributions | | | | | | | | | | | | | | | | |
From net investment income | | $ | (0.561 | ) | | $ | (0.528 | ) | | $ | (0.506 | ) | | $ | (0.428 | ) |
From net realized gain | | | (0.077 | ) | | | — | | | | (0.004 | ) | | | — | |
| | | | |
Total distributions | | $ | (0.638 | ) | | $ | (0.528 | ) | | $ | (0.510 | ) | | $ | (0.428 | ) |
| | | | |
Net asset value — End of period | | $ | 11.520 | | | $ | 12.600 | | | $ | 12.050 | | | $ | 10.840 | |
| | | | |
Total Return(4) | | | (3.70 | )% | | | 9.14 | % | | | 16.55 | %(5) | | | 12.81 | %(5) |
| | | | |
| Ratios/Supplemental Data | | | | | | | | | | | | | | | | |
Net assets, end of period (000’s omitted) | | $ | 18,704 | | | $ | 40,486 | | | $ | 12,939 | | | $ | 14,001 | |
Ratios (as a percentage of average daily net assets): | | | | | | | | | | | | | | | | |
Expenses(6) | | | 0.70 | % | | | 0.70 | % | | | 0.70 | %(7)(8) | | | 0.70 | %(7)(8) |
Net investment income | | | 3.62 | % | | | 3.70 | % | | | 5.07 | %(7) | | | 4.45 | %(7) |
Portfolio Turnover of the Portfolio(9) | | | — | | | | — | | | | 22 | %(5) | | | 1 | %(5) |
Portfolio Turnover of the Fund | | | 19 | % | | | 24 | % | | | 10 | %(5)(10) | | | — | |
| (1) | For the eleven months ended September 30, 2011. The Fund changed its fiscal year-end from October 31 to September 30. |
| (2) | For the period from the start of business, November 17, 2009, to October 31, 2010. |
| (3) | Computed using average shares outstanding. |
| (4) | Returns are historical and are calculated by determining the percentage change in net asset value with all distributions reinvested. |
| (6) | The investment adviser of the Portfolio or Fund and administrator subsidized certain operating expenses (equal to 0.22%, 0.19%, 0.41% and 1.16% of average daily net assets for the years ended September 30, 2013 and 2012, the period ended September 30, 2011 and the period from the start of business, November 17, 2009, to October 31, 2010, respectively). Absent this subsidy, total return would be lower. |
| (8) | Includes the Fund’s share of the Portfolio’s allocated expenses for the period while the Fund was investing in the Portfolio. |
| (9) | Portfolio turnover represents the rate of portfolio activity for the period while the Fund was investing in the Portfolio. |
| (10) | For the period from March 1, 2011 through September 30, 2011 when the Fund was making investments directly in securities. |
| | References to Portfolio herein are to Build America Bond Portfolio, a Massachusetts business trust having the same investment objective and policies as the Fund, in which the Fund invested all of its investable assets prior to March 1, 2011. |
| | | | |
| | 14 | | See Notes to Financial Statements. |
Eaton Vance
Build America Bond Fund
September 30, 2013
Notes to Financial Statements
1 Significant Accounting Policies
Eaton Vance Build America Bond Fund (the Fund) is a diversified series of Eaton Vance Mutual Funds Trust (the Trust). The Trust is a Massachusetts business trust registered under the Investment Company Act of 1940, as amended (the 1940 Act), as an open-end management investment company. The Fund’s primary investment objective is current income and its secondary investment objective is capital appreciation. The Fund offers three classes of shares. Class A shares are generally sold subject to a sales charge imposed at time of purchase. Class C shares are sold at net asset value and are generally subject to a contingent deferred sales charge (see Note 5). Class I shares are sold at net asset value and are not subject to a sales charge. Each class represents a pro-rata interest in the Fund, but votes separately on class-specific matters and (as noted below) is subject to different expenses. Realized and unrealized gains and losses are allocated daily to each class of shares based on the relative net assets of each class to the total net assets of the Fund. Net investment income, other than class-specific expenses, is allocated daily to each class of shares based upon the ratio of the value of each class’s paid shares to the total value of all paid shares. Each class of shares differs in its distribution plan and certain other class-specific expenses.
The following is a summary of significant accounting policies of the Fund. The policies are in conformity with accounting principles generally accepted in the United States of America.
A Investment Valuation — The following methodologies are used to determine the market value or fair value of investments.
Debt Obligations. Debt obligations (including short-term obligations with a remaining maturity of more than sixty days) are generally valued on the basis of valuations provided by third party pricing services, as derived from such services’ pricing models. Inputs to the models may include, but are not limited to, reported trades, executable bid and asked prices, broker/dealer quotations, prices or yields of securities with similar characteristics, benchmark curves or information pertaining to the issuer, as well as industry and economic events. The pricing services may use a matrix approach, which considers information regarding securities with similar characteristics to determine the valuation for a security. Short-term obligations purchased with a remaining maturity of sixty days or less are generally valued at amortized cost, which approximates market value.
Affiliated Fund. The Fund may invest in Eaton Vance Cash Reserves Fund, LLC (Cash Reserves Fund), an affiliated investment company managed by Eaton Vance Management (EVM). The value of the Fund’s investment in Cash Reserves Fund reflects the Fund’s proportionate interest in its net assets. Cash Reserves Fund generally values its investment securities utilizing the amortized cost valuation technique in accordance with Rule 2a-7 under the 1940 Act. This technique involves initially valuing a portfolio security at its cost and thereafter assuming a constant amortization to maturity of any discount or premium. If amortized cost is determined not to approximate fair value, Cash Reserves Fund may value its investment securities in the same manner as debt obligations described above.
Fair Valuation. Investments for which valuations or market quotations are not readily available or are deemed unreliable are valued at fair value using methods determined in good faith by or at the direction of the Trustees of the Fund in a manner that fairly reflects the security’s value, or the amount that the Fund might reasonably expect to receive for the security upon its current sale in the ordinary course. Each such determination is based on a consideration of relevant factors, which are likely to vary from one pricing context to another. These factors may include, but are not limited to, the type of security, the existence of any contractual restrictions on the security’s disposition, the price and extent of public trading in similar securities of the issuer or of comparable entities, quotations or relevant information obtained from broker/dealers or other market participants, information obtained from the issuer, analysts, and/or the appropriate stock exchange (for exchange-traded securities), an analysis of the entity’s financial condition, and an evaluation of the forces that influence the issuer and the market(s) in which the security is purchased and sold.
B Investment Transactions — Investment transactions for financial statement purposes are accounted for on a trade date basis. Realized gains and losses on investments sold are determined on the basis of identified cost.
C Income — Interest income is recorded on the basis of interest accrued, adjusted for amortization of premium or accretion of discount.
D Federal Taxes — The Fund’s policy is to comply with the provisions of the Internal Revenue Code applicable to regulated investment companies and to distribute to shareholders each year substantially all of its net investment income, and all or substantially all of its net realized capital gains. Accordingly, no provision for federal income or excise tax is necessary.
At September 30, 2013, the Fund, for federal income tax purposes, had deferred capital losses of $547,231 which will reduce its taxable income arising from future net realized gains on investment transactions, if any, to the extent permitted by the Internal Revenue Code, and thus will reduce the amount of distributions to shareholders, which would otherwise be necessary to relieve the Fund of any liability for federal income or excise tax. The deferred capital losses are treated as arising on the first day of the Fund’s next taxable year.
As of September 30, 2013, the Fund had no uncertain tax positions that would require financial statement recognition, de-recognition, or disclosure. The Fund files a U.S. federal income tax return annually after its fiscal year-end, which is subject to examination by the Internal Revenue Service for a period of three years from the date of filing.
E Expenses — The majority of expenses of the Trust are directly identifiable to an individual fund. Expenses which are not readily identifiable to a specific fund are allocated taking into consideration, among other things, the nature and type of expense and the relative size of the funds.
Eaton Vance
Build America Bond Fund
September 30, 2013
Notes to Financial Statements — continued
F Expense Reduction — State Street Bank and Trust Company (SSBT) serves as custodian of the Fund. Pursuant to the custodian agreement, SSBT receives a fee reduced by credits, which are determined based on the average daily cash balance the Fund maintains with SSBT. All credit balances, if any, used to reduce the Fund’s custodian fees are reported as a reduction of expenses in the Statement of Operations.
G Use of Estimates — The preparation of the financial statements in conformity with accounting principles generally accepted in the United States of America requires management to make estimates and assumptions that affect the reported amounts of assets and liabilities at the date of the financial statements and the reported amounts of income and expense during the reporting period. Actual results could differ from those estimates.
H Indemnifications — Under the Trust’s organizational documents, its officers and Trustees may be indemnified against certain liabilities and expenses arising out of the performance of their duties to the Fund. Under Massachusetts law, if certain conditions prevail, shareholders of a Massachusetts business trust (such as the Trust) could be deemed to have personal liability for the obligations of the Trust. However, the Trust’s Declaration of Trust contains an express disclaimer of liability on the part of Fund shareholders and the By-laws provide that the Trust shall assume the defense on behalf of any Fund shareholders. Moreover, the By-laws also provide for indemnification out of Fund property of any shareholder held personally liable solely by reason of being or having been a shareholder for all loss or expense arising from such liability. Additionally, in the normal course of business, the Fund enters into agreements with service providers that may contain indemnification clauses. The Fund’s maximum exposure under these arrangements is unknown as this would involve future claims that may be made against the Fund that have not yet occurred.
I When-Issued Securities and Delayed Delivery Transactions — The Fund may purchase or sell securities on a delayed delivery or when-issued basis. Payment and delivery may take place after the customary settlement period for that security. At the time the transaction is negotiated, the price of the security that will be delivered is fixed. The Fund maintains security positions for these commitments such that sufficient liquid assets will be available to make payments upon settlement. Securities purchased on a delayed delivery or when-issued basis are marked-to-market daily and begin earning interest on settlement date. Losses may arise due to changes in the market value of the underlying securities or if the counterparty does not perform under the contract.
2 Distributions to Shareholders
The Fund declares dividends daily to shareholders of record at the time of declaration. Distributions are generally paid monthly. Distributions of realized capital gains are made at least annually. Distributions to shareholders are recorded on the ex-dividend date. Distributions are declared separately for each class of shares. Shareholders may reinvest income and capital gain distributions in additional shares of the same class of the Fund at the net asset value as of the ex-dividend date or, at the election of the shareholder, receive distributions in cash. The Fund distinguishes between distributions on a tax basis and a financial reporting basis. Accounting principles generally accepted in the United States of America require that only distributions in excess of tax basis earnings and profits be reported in the financial statements as a return of capital. Permanent differences between book and tax accounting relating to distributions are reclassified to paid-in capital. For tax purposes, distributions from short-term capital gains are considered to be from ordinary income.
The tax character of distributions declared for the years ended September 30, 2013 and September 30, 2012 was as follows:
| | | | | | | | |
| | | Year Ended September 30, | |
| | | 2013 | | | 2012 | |
| | |
Distributions declared from: | | | | | | | | |
Ordinary income | | $ | 4,058,476 | | | $ | 3,063,952 | |
Long-term capital gains | | $ | 627,102 | | | $ | — | |
During the year ended September 30, 2013, accumulated net realized loss was increased by $897,057 and accumulated distributions in excess of net investment income was decreased by $897,057 due to differences between book and tax accounting, primarily for amortization of premium, dividend redesignations and investments in partnerships. These reclassifications had no effect on the net assets or net asset value per share of the Fund.
As of September 30, 2013, the components of distributable earnings (accumulated losses) and unrealized appreciation (depreciation) on a tax basis were as follows:
| | | | |
Undistributed ordinary income | | $ | 35,530 | |
Deferred capital losses | | $ | (547,231 | ) |
Net unrealized appreciation | | $ | 10,962 | |
Other temporary differences | | $ | (50,883 | ) |
Eaton Vance
Build America Bond Fund
September 30, 2013
Notes to Financial Statements — continued
The differences between components of distributable earnings (accumulated losses) on a tax basis and the amounts reflected in the Statement of Assets and Liabilities are primarily due to the timing of recognizing distributions to shareholders, investments in partnerships and amortization of premium.
3 Investment Adviser Fee and Other Transactions with Affiliates
The investment adviser fee is earned by Boston Management and Research (BMR), a subsidiary of EVM, as compensation for investment advisory services rendered to the Fund. The fee is computed at an annual rate of 0.60% of the Fund’s average daily net assets up to $1 billion, and at reduced rates on daily net assets of $1 billion or more, and is payable monthly. For the year ended September 30, 2013, the investment adviser fee amounted to $586,373 or 0.60% of the Fund’s average daily net assets. The Fund invests its cash in Cash Reserves Fund. EVM does not currently receive a fee for advisory services provided to Cash Reserves Fund.
EVM serves as the administrator of the Fund but receives no compensation. BMR has agreed to reimburse the Fund’s expenses to the extent that total annual operating expenses (relating to ordinary operating expenses only) exceed 0.95%, 1.70% and 0.70% of the Fund’s average daily net assets for Class A, Class C and Class I, respectively. This agreement may be changed or terminated after January 31, 2014. Pursuant to this agreement, BMR was allocated $212,401 of the Fund’s operating expenses for the year ended September 30, 2013.
EVM serves as the sub-transfer agent of the Fund and receives from the transfer agent an aggregate fee based upon the actual expenses incurred by EVM in the performance of these services. For the year ended September 30, 2013, EVM earned $1,522 in sub-transfer agent fees. The Fund was informed that Eaton Vance Distributors, Inc. (EVD), an affiliate of EVM and the Fund’s principal underwriter, received $16,165 as its portion of the sales charge on sales of Class A shares for the year ended September 30, 2013. EVD also received distribution and service fees from Class A and Class C shares (see Note 4) and contingent deferred sales charges (see Note 5).
Trustees and officers of the Fund who are members of EVM’s or BMR’s organizations receive remuneration for their services to the Fund out of the investment adviser fee. Trustees of the Fund who are not affiliated with the investment adviser may elect to defer receipt of all or a percentage of their annual fees in accordance with the terms of the Trustees Deferred Compensation Plan. For the year ended September 30, 2013, no significant amounts have been deferred. Certain officers and Trustees of the Fund are officers of the above organizations.
4 Distribution Plans
The Fund has in effect a distribution plan for Class A shares (Class A Plan) pursuant to Rule 12b-1 under the 1940 Act. Pursuant to the Class A Plan, the Fund pays EVD a distribution and service fee of 0.25% per annum of its average daily net assets attributable to Class A shares for distribution services and facilities provided to the Fund by EVD, as well as for personal services and/or the maintenance of shareholder accounts. Distribution and service fees paid or accrued to EVD for the year ended September 30, 2013 amounted to $89,047 for Class A shares.
The Fund also has in effect a distribution plan for Class C shares (Class C Plan) pursuant to Rule 12b-1 under the 1940 Act. Pursuant to the Class C Plan, the Fund pays EVD amounts equal to 0.75% per annum of its average daily net assets attributable to Class C shares for providing ongoing distribution services and facilities to the Fund. For the year ended September 30, 2013, the Fund paid or accrued to EVD $234,069 for Class C shares.
Pursuant to the Class C Plan, the Fund also makes payments of service fees to EVD, financial intermediaries and other persons in amounts equal to 0.25% per annum of its average daily net assets attributable to that class. Service fees paid or accrued are for personal services and/or the maintenance of shareholder accounts. They are separate and distinct from the sales commissions and distribution fees payable to EVD. Service fees paid or accrued for the year ended September 30, 2013 amounted to $78,023 for Class C shares.
Distribution and service fees are subject to the limitations contained in the Financial Industry Regulatory Authority’s NASD Conduct Rule 2830(d).
5 Contingent Deferred Sales Charges
A contingent deferred sales charge (CDSC) of 1% generally is imposed on redemptions of Class C shares made within one year of purchase. Class A shares may be subject to a 1% CDSC if redeemed within 18 months of purchase (depending on the circumstances of purchase). Generally, the CDSC is based upon the lower of the net asset value at date of redemption or date of purchase. No charge is levied on shares acquired by reinvestment of dividends or capital gain distributions. For the year ended September 30, 2013, the Fund was informed that EVD received approximately $8,000 of CDSCs paid by Class C shareholders and no CDSCs paid by Class A shareholders.
6 Purchases and Sales of Investments
Purchases and sales of investments, other than short-term obligations, aggregated $18,337,178 and $64,591,469, respectively, for the year ended September 30, 2013.
Eaton Vance
Build America Bond Fund
September 30, 2013
Notes to Financial Statements — continued
7 Shares of Beneficial Interest
The Fund’s Declaration of Trust permits the Trustees to issue an unlimited number of full and fractional shares of beneficial interest (without par value). Such shares may be issued in a number of different series (such as the Fund) and classes. Transactions in Fund shares were as follows:
| | | | | | | | |
| | | Year Ended September 30, | |
| Class A | | 2013 | | | 2012 | |
| | |
Sales | | | 619,993 | | | | 3,230,891 | |
Issued to shareholders electing to receive payments of distributions in Fund shares | | | 136,407 | | | | 106,996 | |
Redemptions | | | (1,913,544 | ) | | | (1,769,224 | ) |
| | |
Net increase (decrease) | | | (1,157,144 | ) | | | 1,568,663 | |
| | |
| | | | | | | | |
| | | Year Ended September 30, | |
| Class C | | 2013 | | | 2012 | |
| | |
Sales | | | 446,866 | | | | 1,991,574 | |
Issued to shareholders electing to receive payments of distributions in Fund shares | | | 62,769 | | | | 45,887 | |
Redemptions | | | (1,675,564 | ) | | | (363,341 | ) |
| | |
Net increase (decrease) | | | (1,165,929 | ) | | | 1,674,120 | |
| | |
| | | | | | | | |
| | | Year Ended September 30, | |
| Class I | | 2013 | | | 2012 | |
| | |
Sales | | | 1,995,574 | | | | 3,830,174 | |
Issued to shareholders electing to receive payments of distributions in Fund shares | | | 87,081 | | | | 32,649 | |
Redemptions | | | (3,672,363 | ) | | | (1,723,909 | ) |
| | |
Net increase (decrease) | | | (1,589,708 | ) | | | 2,138,914 | |
8 Federal Income Tax Basis of Investments
The cost and unrealized appreciation (depreciation) of investments of the Fund at September 30, 2013, as determined on a federal income tax basis, were as follows:
| | | | |
| |
Aggregate cost | | $ | 62,583,507 | |
| |
Gross unrealized appreciation | | $ | 324,287 | |
Gross unrealized depreciation | | | (313,325 | ) |
| |
Net unrealized appreciation | | $ | 10,962 | |
9 Line of Credit
The Fund participates with other portfolios and funds managed by EVM and its affiliates in a $750 million unsecured line of credit agreement with a group of banks. Borrowings are made by the Fund solely to facilitate the handling of unusual and/or unanticipated short-term cash requirements. Interest is charged to the Fund based on its borrowings at an amount above either the Eurodollar rate or Federal Funds rate. In addition, a fee computed at an annual rate of 0.08% on the daily unused portion of the line of credit is allocated among the participating portfolios and funds at the end of each quarter. Because the line of credit is not available exclusively to the Fund, it may be unable to borrow some or all of its requested amounts at any particular time. At September 30, 2013, the Fund had a balance outstanding pursuant to this line of credit of $400,000 at an interest rate of 1.08%. Based on the short-
Eaton Vance
Build America Bond Fund
September 30, 2013
Notes to Financial Statements — continued
term nature of the borrowings under the line of credit and variable interest rate, the carrying value of the borrowings approximated its fair value at September 30, 2013. If measured at fair value, borrowings under the line of credit would have been considered as Level 2 in the fair value hierarchy (see Note 11) at September 30, 2013. The Fund’s average borrowings or allocated fees during the year ended September 30, 2013 were not significant.
10 Liquidity Risk
The ability of municipalities to issue Build America Bonds expired on December 31, 2010. As a result, the number of Build America Bonds available in the market is limited and there can be no assurance that Build America Bonds will be actively traded. In addition, illiquidity may negatively affect the value of such bonds.
11 Fair Value Measurements
Under generally accepted accounting principles for fair value measurements, a three-tier hierarchy to prioritize the assumptions, referred to as inputs, is used in valuation techniques to measure fair value. The three-tier hierarchy of inputs is summarized in the three broad levels listed below.
| Ÿ | | Level 1 – quoted prices in active markets for identical investments |
| Ÿ | | Level 2 – other significant observable inputs (including quoted prices for similar investments, interest rates, prepayment speeds, credit risk, etc.) |
| Ÿ | | Level 3 – significant unobservable inputs (including a fund’s own assumptions in determining the fair value of investments) |
In cases where the inputs used to measure fair value fall in different levels of the fair value hierarchy, the level disclosed is determined based on the lowest level input that is significant to the fair value measurement in its entirety. The inputs or methodology used for valuing securities are not necessarily an indication of the risk associated with investing in those securities.
At September 30, 2013, the hierarchy of inputs used in valuing the Fund’s investments, which are carried at value, were as follows:
| | | | | | | | | | | | | | | | |
| Asset Description | | Level 1 | | | Level 2 | | | Level 3 | | | Total | |
| | | | |
Taxable Municipal Securities | | $ | — | | | $ | 62,575,723 | | | $ | — | | | $ | 62,575,723 | |
Short-Term Investments | | | — | | | | 18,746 | | | | — | | | | 18,746 | |
| | | | |
Total Investments | | $ | — | | | $ | 62,594,469 | | | $ | — | | | $ | 62,594,469 | |
The Fund held no investments or other financial instruments as of September 30, 2012 whose fair value was determined using Level 3 inputs. At September 30, 2013, there were no investments transferred between Level 1 and Level 2 during the year then ended.
Eaton Vance
Build America Bond Fund
September 30, 2013
Report of Independent Registered Public Accounting Firm
To the Trustees of Eaton Vance Mutual Funds Trust and Shareholders of Eaton Vance Build America Bond Fund:
We have audited the accompanying statement of assets and liabilities of Eaton Vance Build America Bond Fund (the “Fund”) (one of the funds constituting Eaton Vance Mutual Funds Trust), including the portfolio of investments, as of September 30, 2013, and the related statement of operations for the year then ended, the statements of changes in net assets for each of the two years in the period then ended, and the financial highlights for each of the two years in the period then ended, for the eleven month period ended September 30, 2011, and for the period from the start of business, November 17, 2009, to October 31, 2010. These financial statements and financial highlights are the responsibility of the Fund’s management. Our responsibility is to express an opinion on these financial statements and financial highlights based on our audits.
We conducted our audits in accordance with the standards of the Public Company Accounting Oversight Board (United States). Those standards require that we plan and perform the audit to obtain reasonable assurance about whether the financial statements and financial highlights are free of material misstatement. The Fund is not required to have, nor were we engaged to perform, an audit of its internal control over financial reporting. Our audits included consideration of internal control over financial reporting as a basis for designing audit procedures that are appropriate in the circumstances, but not for the purpose of expressing an opinion on the effectiveness of the Fund’s internal control over financial reporting. Accordingly, we express no such opinion. An audit also includes examining, on a test basis, evidence supporting the amounts and disclosures in the financial statements, assessing the accounting principles used and significant estimates made by management, as well as evaluating the overall financial statement presentation. Our procedures included confirmation of securities owned as of September 30, 2013, by correspondence with the custodian and brokers; where replies were not received from brokers, we performed other auditing procedures. We believe that our audits provide a reasonable basis for our opinion.
In our opinion, such financial statements and financial highlights referred to above present fairly, in all material respects, the financial position of Eaton Vance Build America Bond Fund as of September 30, 2013, the results of its operations for the year then ended, the changes in its net assets for each of the two years in the period then ended, and the financial highlights for each of the two years in the period then ended, the eleven month period ended September 30, 2011, and the period from the start of business, November 17, 2009, to October 31, 2010, in conformity with accounting principles generally accepted in the United States of America.
DELOITTE & TOUCHE LLP
Boston, Massachusetts
November 18, 2013
Eaton Vance
Build America Bond Fund
September 30, 2013
Federal Tax Information (Unaudited)
The Form 1099-DIV you receive in January 2014 will show the tax status of all distributions paid to your account in calendar year 2013. Shareholders are advised to consult their own tax adviser with respect to the tax consequences of their investment in the Fund.
Eaton Vance
Build America Bond Fund
September 30, 2013
Board of Trustees’ Contract Approval
Overview of the Contract Review Process
The Investment Company Act of 1940, as amended (the “1940 Act”), provides, in substance, that each investment advisory agreement between a fund and its investment adviser will continue in effect from year to year only if its continuation is approved at least annually by the fund’s board of trustees, including by a vote of a majority of the trustees who are not “interested persons” of the fund (“Independent Trustees”), cast in person at a meeting called for the purpose of considering such approval.
At a meeting of the Boards of Trustees (each a “Board”) of the Eaton Vance group of mutual funds (the “Eaton Vance Funds”) held on April 23, 2013, the Board, including a majority of the Independent Trustees, voted to approve continuation of existing advisory and sub-advisory agreements for the Eaton Vance Funds for an additional one-year period. In voting its approval, the Board relied upon the affirmative recommendation of the Contract Review Committee of the Board, which is a committee comprised exclusively of Independent Trustees. Prior to making its recommendation, the Contract Review Committee reviewed information furnished by each adviser to the Eaton Vance Funds (including information specifically requested by the Board) for a series of meetings of the Contract Review Committee held between February and April 2013, as well as information considered during prior meetings of the committee. Such information included, among other things, the following:
Information about Fees, Performance and Expenses
| Ÿ | | An independent report comparing the advisory and related fees paid by each fund with fees paid by comparable funds; |
| Ÿ | | An independent report comparing each fund’s total expense ratio and its components to comparable funds; |
| Ÿ | | An independent report comparing the investment performance of each fund (including, where relevant, yield data, Sharpe ratios and information ratios) to the investment performance of comparable funds over various time periods; |
| Ÿ | | Data regarding investment performance in comparison to benchmark indices and customized peer groups, in each case as approved by the Board with respect to the funds; |
| Ÿ | | For each fund, comparative information concerning the fees charged and the services provided by each adviser in managing other accounts (including mutual funds, other collective investment funds and institutional accounts) using investment strategies and techniques similar to those used in managing such fund; |
| Ÿ | | Profitability analyses for each adviser with respect to each fund; |
Information about Portfolio Management and Trading
| Ÿ | | Descriptions of the investment management services provided to each fund, including the investment strategies and processes employed, and any changes in portfolio management processes and personnel; |
| Ÿ | | Information about the allocation of brokerage and the benefits received by each adviser as a result of brokerage allocation, including information concerning the acquisition of research through client commission arrangements and the fund’s policies with respect to “soft dollar” arrangements; |
| Ÿ | | Data relating to portfolio turnover rates of each fund; |
| Ÿ | | The procedures and processes used to determine the fair value of fund assets and actions taken to monitor and test the effectiveness of such procedures and processes; |
| Ÿ | | Information about each adviser’s processes for monitoring best execution of portfolio transactions, and other policies and practices of each adviser with respect to trading; |
Information about each Adviser
| Ÿ | | Reports detailing the financial results and condition of each adviser; |
| Ÿ | | Descriptions of the qualifications, education and experience of the individual investment professionals whose responsibilities include portfolio management and investment research for the funds, and information relating to their compensation and responsibilities with respect to managing other mutual funds and investment accounts; |
| Ÿ | | Copies of the Codes of Ethics of each adviser and its affiliates, together with information relating to compliance with and the administration of such codes; |
| Ÿ | | Copies of or descriptions of each adviser’s policies and procedures relating to proxy voting, the handling of corporate actions and class actions; |
| Ÿ | | Information concerning the resources devoted to compliance efforts undertaken by each adviser and its affiliates on behalf of the funds (including descriptions of various compliance programs) and their record of compliance with investment policies and restrictions, including policies with respect to market-timing, late trading and selective portfolio disclosure, and with policies on personal securities transactions; |
| Ÿ | | Descriptions of the business continuity and disaster recovery plans of each adviser and its affiliates; |
| Ÿ | | A description of Eaton Vance Management’s procedures for overseeing third party advisers and sub-advisers, including with respect to regulatory and compliance issues, investment management and other matters; |
Eaton Vance
Build America Bond Fund
September 30, 2013
Board of Trustees’ Contract Approval — continued
Other Relevant Information
| Ÿ | | Information concerning the nature, cost and character of the administrative and other non-investment management services provided by Eaton Vance Management and its affiliates; |
| Ÿ | | Information concerning management of the relationship with the custodian, subcustodians and fund accountants by each adviser or the funds’ administrator; and |
| Ÿ | | The terms of each advisory agreement. |
In addition to the information identified above, the Contract Review Committee considered information provided from time to time by each adviser throughout the year at meetings of the Board and its committees. Over the course of the twelve-month period ended April 30, 2013, with respect to one or more funds, the Board met eight times and the Contract Review Committee, the Audit Committee, the Governance Committee, the Portfolio Management Committee and the Compliance Reports and Regulatory Matters Committee, each of which is a Committee comprised solely of Independent Trustees, met eight, twenty-one, five, nine and thirteen times respectively. At such meetings, the Trustees participated in investment and performance reviews with the portfolio managers and other investment professionals of each adviser relating to each fund. The Board and its Committees considered the investment and trading strategies used in pursuing each fund’s investment objective, including, where relevant, the use of derivative instruments, as well as processes for monitoring best execution of portfolio transactions and risk management techniques. The Board and its Committees also evaluated issues pertaining to industry and regulatory developments, compliance procedures, fund governance and other issues with respect to the funds, and received and participated in reports and presentations provided by Eaton Vance Management and other fund advisers with respect to such matters.
For funds that invest through one or more underlying portfolios, the Board considered similar information about the portfolio(s) when considering the approval of advisory agreements. In addition, in cases where the fund’s investment adviser has engaged a sub-adviser, the Board considered similar information about the sub-adviser when considering the approval of any sub-advisory agreement.
The Contract Review Committee was assisted throughout the contract review process by Goodwin Procter LLP, legal counsel for the Independent Trustees. The members of the Contract Review Committee relied upon the advice of such counsel and their own business judgment in determining the material factors to be considered in evaluating each advisory and sub-advisory agreement and the weight to be given to each such factor. The conclusions reached with respect to each advisory and sub-advisory agreement were based on a comprehensive evaluation of all the information provided and not any single factor. Moreover, each member of the Contract Review Committee may have placed varying emphasis on particular factors in reaching conclusions with respect to each advisory and sub-advisory agreement.
Results of the Process
Based on its consideration of the foregoing, and such other information as it deemed relevant, including the factors and conclusions described below, the Contract Review Committee concluded that the continuation of the investment advisory agreement of Eaton Vance Build America Bond Fund (the “Fund”) with Boston Management and Research (the “Adviser”), including its fee structure, is in the interests of shareholders and, therefore, the Contract Review Committee recommended to the Board approval of the agreement. The Board accepted the recommendation of the Contract Review Committee as well as the factors considered and conclusions reached by the Contract Review Committee with respect to the agreement. Accordingly, the Board, including a majority of the Independent Trustees, voted to approve continuation of the investment advisory agreement for the Fund.
Nature, Extent and Quality of Services
In considering whether to approve the investment advisory agreement of the Fund, the Board evaluated the nature, extent and quality of services provided to the Fund by the Adviser.
The Board considered the Adviser’s management capabilities and investment process with respect to the types of investments held by the Fund, including the education, experience and number of its investment professionals and other personnel who provide portfolio management, investment research, and similar services to the Fund. The Board considered, where relevant, the abilities and experience of such investment personnel in analyzing factors such as credit risk and special considerations relevant to investing in income securities, including municipal bonds. The Board noted the Adviser’s in-house research capabilities. The Board also took into account the resources dedicated to portfolio management and other services, including the compensation methods of the Adviser to recruit and retain investment personnel, and the time and attention devoted to the Fund by senior management.
The Board reviewed the compliance programs of the Adviser and relevant affiliates thereof. Among other matters, the Board considered compliance and reporting matters relating to personal trading by investment personnel, selective disclosure of portfolio holdings, late trading, frequent trading, portfolio valuation, business continuity and the allocation of investment opportunities. The Board also evaluated the responses of the Adviser and its affiliates to requests in recent years from regulatory authorities such as the Securities and Exchange Commission and the Financial Industry Regulatory Authority.
The Board considered shareholder and other administrative services provided or managed by Eaton Vance Management and its affiliates, including transfer agency and accounting services. The Board evaluated the benefits to shareholders of investing in a fund that is a part of a large family of funds, including the ability, in many cases, to exchange an investment among different funds without incurring additional sales charges.
Eaton Vance
Build America Bond Fund
September 30, 2013
Board of Trustees’ Contract Approval — continued
After consideration of the foregoing factors, among others, the Board concluded that the nature, extent and quality of services provided by the Adviser, taken as a whole, are appropriate and consistent with the terms of the investment advisory agreement.
Fund Performance
The Board compared the Fund’s investment performance to a relevant universe of similarly managed funds identified by an independent data provider and appropriate benchmark indices. The Board reviewed comparative performance data for the one-year period ended September 30, 2012 for the Fund. In light of the Fund’s relatively brief operating history, the Board concluded that additional time is required to evaluate Fund performance.
Management Fees and Expenses
The Board reviewed contractual investment advisory fee rates payable by the Fund (referred to as “management fees”). As part of its review, the Board considered the management fees and the Fund’s total expense ratio for the year ended September 30, 2012, as compared to a group of similarly managed funds selected by an independent data provider. The Board noted that the Adviser had waived fees and/or paid expenses for the Fund. The Board also considered factors that had an impact on Fund expense ratios, as identified by management in response to inquiries from the Contract Review Committee, as well as actions taken by management in recent years to reduce expenses at the Eaton Vance fund complex level, including the negotiation of reduced fees for transfer agency and custody services.
After reviewing the foregoing information, and in light of the nature, extent and quality of the services provided by the Adviser, the Board concluded that the management fees charged for advisory and related services are reasonable.
Profitability
The Board reviewed the level of profits realized by the Adviser and relevant affiliates thereof in providing investment advisory and administrative services to the Fund and to all Eaton Vance Funds as a group. The Board considered the level of profits realized without regard to revenue sharing or other payments by the Adviser and its affiliates to third parties in respect of distribution services. The Board also considered other direct or indirect benefits received by the Adviser and its affiliates in connection with their relationships with the Fund, including the benefits of research services that may be available to the Adviser as a result of securities transactions effected for the Fund and other investment advisory clients.
The Board concluded that, in light of the foregoing factors and the nature, extent and quality of the services rendered, the profits realized by the Adviser and its affiliates are reasonable.
Economies of Scale
In reviewing management fees and profitability, the Board also considered the extent to which the Adviser and its affiliates, on the one hand, and the Fund, on the other hand, can expect to realize benefits from economies of scale as the assets of the Fund increase. The Board acknowledged the difficulty in accurately measuring the benefits resulting from the economies of scale with respect to the management of any specific fund or group of funds. The Board reviewed data summarizing the increases and decreases in the assets of the Fund and of all Eaton Vance Funds as a group over various time periods, and evaluated the extent to which the total expense ratio of the Fund and the profitability of the Adviser and its affiliates may have been affected by such increases or decreases. Based upon the foregoing, the Board concluded that the Fund currently shares in the benefits from economies of scale. The Board also concluded that, assuming reasonably foreseeable increases in the assets of the Fund, the structure of the advisory fee, which includes breakpoints at several asset levels, will allow the Fund to continue to benefit from economies of scale in the future.
Eaton Vance
Build America Bond Fund
September 30, 2013
Management and Organization
Fund Management. The Trustees of Eaton Vance Mutual Funds Trust (the Trust) are responsible for the overall management and supervision of the Trust’s affairs. The Trustees and officers of the Trust are listed below. Except as indicated, each individual has held the office shown or other offices in the same company for the last five years. Trustees and officers of the Trust hold indefinite terms of office. The “Noninterested Trustees” consist of those Trustees who are not “interested persons” of the Trust, as that term is defined under the 1940 Act. The business address of each Trustee and officer is Two International Place, Boston, Massachusetts 02110. As used below, “EVC” refers to Eaton Vance Corp., “EV” refers to Eaton Vance, Inc., “EVM” refers to Eaton Vance Management, “BMR” refers to Boston Management and Research and “EVD” refers to Eaton Vance Distributors, Inc. EVC and EV are the corporate parent and trustee, respectively, of EVM and BMR. EVD is the Fund’s principal underwriter and a wholly-owned subsidiary of EVC. Each officer affiliated with Eaton Vance may hold a position with other Eaton Vance affiliates that is comparable to his or her position with EVM listed below. Each Trustee oversees 190 portfolios in the Eaton Vance Complex (including all master and feeder funds in a master feeder structure). Each officer serves as an officer of certain other Eaton Vance funds. Each Trustee and officer serves until his or her successor is elected.
| | | | | | |
| Name and Year of Birth | | Position(s) with the Trust | | Length of Service | | Principal Occupation(s) and Directorships During Past Five Years and Other Relevant Experience |
Interested Trustee |
| | | |
Thomas E. Faust Jr. 1958 | | Trustee | | Since 2007 | | Chairman, Chief Executive Officer and President of EVC, Director and President of EV, Chief Executive Officer and President of EVM and BMR, and Director of EVD. Trustee and/or officer of 190 registered investment companies. Mr. Faust is an interested person because of his positions with EVM, BMR, EVD, EVC and EV, which are affiliates of the Trust. Directorships in the Last Five Years.(1) Director of EVC and Hexavest Inc. |
| | | |
| | | | | | |
Noninterested Trustees |
| | | |
Scott E. Eston 1956 | | Trustee | | Since 2011 | | Private investor. Formerly held various positions at Grantham, Mayo, Van Otterloo and Co., L.L.C. (investment management firm) (1997-2009), including Chief Operating Officer (2002-2009), Chief Financial Officer (1997-2009) and Chairman of the Executive Committee (2002-2008); President and Principal Executive Officer, GMO Trust (open-end registered investment company) (2006-2009). Former Partner, Coopers and Lybrand L.L.P. (now PricewaterhouseCoopers) (public accounting firm) (1987-1997). Directorships in the Last Five Years. None. |
| | | |
Benjamin C. Esty 1963 | | Trustee | | Since 2005 | | Roy and Elizabeth Simmons Professor of Business Administration and Finance Unit Head, Harvard University Graduate School of Business Administration. Directorships in the Last Five Years.(1) None. |
| | | |
Allen R. Freedman 1940 | | Trustee | | Since 2007 | | Private Investor. Former Chairman (2002-2004) and a Director (1983-2004) of Systems & Computer Technology Corp. (provider of software to higher education). Formerly, a Director of Loring Ward International (fund distributor) (2005-2007). Former Chairman and a Director of Indus International, Inc. (provider of enterprise management software to the power generating industry) (2005-2007). Former Chief Executive Officer of Assurant, Inc. (insurance provider) (1979-2000). Directorships in the Last Five Years.(1) Director of Stonemor Partners, L.P. (owner and operator of cemeteries). Formerly, Director of Assurant, Inc. (insurance provider) (1979-2011). |
| | | |
William H. Park 1947 | | Trustee | | Since 2003 | | Consultant and private investor. Formerly, Chief Financial Officer, Aveon Group L.P. (investment management firm) (2010-2011). Formerly, Vice Chairman, Commercial Industrial Finance Corp. (specialty finance company) (2006-2010). Formerly, President and Chief Executive Officer, Prizm Capital Management, LLC (investment management firm) (2002-2005). Formerly, Executive Vice President and Chief Financial Officer, United Asset Management Corporation (investment management firm) (1982-2001). Formerly, Senior Manager, Price Waterhouse (now PricewaterhouseCoopers) (an independent registered public accounting firm) (1972-1981). Directorships in the Last Five Years.(1) None. |
| | | |
Ronald A. Pearlman 1940 | | Trustee | | Since 2003 | | Professor of Law, Georgetown University Law Center. Formerly, Deputy Assistant Secretary (Tax Policy) and Assistant Secretary (Tax Policy), U.S. Department of the Treasury (1983-1985). Formerly, Chief of Staff, Joint Committee on Taxation, U.S. Congress (1988-1990). Directorships in the Last Five Years.(1) None. |
Eaton Vance
Build America Bond Fund
September 30, 2013
Management and Organization — continued
| | | | | | |
| Name and Year of Birth | | Position(s) with the Trust | | Length of Service | | Principal Occupation(s) and Directorships During Past Five Years and Other Relevant Experience |
Noninterested Trustees (continued) |
| | | |
Helen Frame Peters 1948 | | Trustee | | Since 2008 | | Professor of Finance, Carroll School of Management, Boston College. Formerly, Dean, Carroll School of Management, Boston College (2000-2002). Formerly, Chief Investment Officer, Fixed Income, Scudder Kemper Investments (investment management firm) (1998-1999). Formerly, Chief Investment Officer, Equity and Fixed Income, Colonial Management Associates (investment management firm) (1991-1998). Directorships in the Last Five Years.(1) Formerly, Director of BJ’s Wholesale Club, Inc. (wholesale club retailer) (2004-2011). Formerly, Trustee of SPDR Index Shares Funds and SPDR Series Trust (exchange traded funds) (2000-2009). Formerly, Director of Federal Home Loan Bank of Boston (a bank for banks) (2007-2009). |
| | | |
Lynn A. Stout 1957 | | Trustee | | Since 1998 | | Distinguished Professor of Corporate and Business Law, Jack G. Clarke Business Law Institute, Cornell University Law School. Formerly, the Paul Hastings Professor of Corporate and Securities Law (2006-2012) and Professor of Law (2001-2006), University of California at Los Angeles School of Law. Directorships in the Last Five Years.(1) None. |
| | | |
Harriett Tee Taggart 1948 | | Trustee | | Since 2011 | | Managing Director, Taggart Associates (a professional practice firm). Formerly, Partner and Senior Vice President, Wellington Management Company, LLP (investment management firm) (1983-2006). Directorships in the Last Five Years. Director of Albemarle Corporation (chemicals manufacturer) (since 2007) and The Hanover Group (specialty property and casualty insurance company) (since 2009). Formerly, Director of Lubrizol Corporation (specialty chemicals) (2007-2011). |
| | | |
Ralph F. Verni 1943 | | Chairman of the Board and Trustee | | Chairman of the Board since 2007 and Trustee since 2005 | | Consultant and private investor. Formerly, Chief Investment Officer (1982-1992), Chief Financial Officer (1988-1990) and Director (1982-1992), New England Life. Formerly, Chairperson, New England Mutual Funds (1982-1992). Formerly, President and Chief Executive Officer, State Street Management & Research (1992-2000). Formerly, Chairperson, State Street Research Mutual Funds (1992-2000). Formerly, Director, W.P. Carey, LLC (1998-2004) and First Pioneer Farm Credit Corp. (2002-2006). Directorships in the Last Five Years.(1) None. |
| | | |
| | | | | | |
Principal Officers who are not Trustees |
| Name and Year of Birth | | Position(s) with the Trust | | Length of Service | | Principal Occupation(s) During Past Five Years |
Payson F. Swaffield(2) 1956 | | President | | Since 2013 | | Vice President and Chief Income Investment Officer of EVM and BMR. |
| | | |
Maureen A. Gemma 1960 | | Vice President, Secretary and Chief Legal Officer | | Vice President since 2011, Secretary since 2007 and Chief Legal Officer since 2008 | | Vice President of EVM and BMR. |
| | | |
James F. Kirchner(3) 1967 | | Treasurer | | Since 2013 | | Vice President of EVM and BMR. |
| | | |
Paul M. O’Neil 1953 | | Chief Compliance Officer | | Since 2004 | | Vice President of EVM and BMR. |
| (1) | During their respective tenures, the Trustees (except Mr. Eston and Ms. Taggart) also served as Board members of one or more of the following Eaton Vance funds (which operated in the years noted): Eaton Vance Credit Opportunities Fund (launched in 2005 and terminated in 2010); Eaton Vance Insured Florida Plus Municipal Bond Fund (launched in 2002 and terminated in 2009); and Eaton Vance National Municipal Income Trust (launched in 1998 and terminated in 2009). |
| (2) | Prior to October 1, 2013, Mr. Swaffield was Vice President of the Trust since 2011. |
| (3) | Prior to 2013, Mr. Kirchner served as Assistant Treasurer of the Trust since 2007. |
The SAI for the Fund includes additional information about the Trustees and officers of the Fund and can be obtained without charge on Eaton Vance’s website at www.eatonvance.com or by calling 1-800-262-1122.
Eaton Vance Funds
IMPORTANT NOTICES
Privacy. The Eaton Vance organization is committed to ensuring your financial privacy. Each of the financial institutions identified below has in effect the following policy (“Privacy Policy”) with respect to nonpublic personal information about its customers:
| Ÿ | | Only such information received from you, through application forms or otherwise, and information about your Eaton Vance fund transactions will be collected. This may include information such as name, address, social security number, tax status, account balances and transactions. |
| Ÿ | | None of such information about you (or former customers) will be disclosed to anyone, except as permitted by law (which includes disclosure to employees necessary to service your account). In the normal course of servicing a customer’s account, Eaton Vance may share information with unaffiliated third parties that perform various required services such as transfer agents, custodians and broker-dealers. |
| Ÿ | | Policies and procedures (including physical, electronic and procedural safeguards) are in place that are designed to protect the confidentiality of such information. |
| Ÿ | | We reserve the right to change our Privacy Policy at any time upon proper notification to you. Customers may want to review our Privacy Policy periodically for changes by accessing the link on our homepage: www.eatonvance.com. |
Our pledge of privacy applies to the following entities within the Eaton Vance organization: the Eaton Vance Family of Funds, Eaton Vance Management, Eaton Vance Investment Counsel, Eaton Vance Distributors, Inc., Eaton Vance Trust Company, Eaton Vance Management’s Real Estate Investment Group and Boston Management and Research. In addition, our Privacy Policy applies only to those Eaton Vance customers who are individuals and who have a direct relationship with us. If a customer’s account (i.e., fund shares) is held in the name of a third-party financial advisor/broker-dealer, it is likely that only such advisor’s privacy policies apply to the customer. This notice supersedes all previously issued privacy disclosures. For more information about Eaton Vance’s Privacy Policy, please call 1-800-262-1122.
Delivery of Shareholder Documents. The Securities and Exchange Commission (SEC) permits funds to deliver only one copy of shareholder documents, including prospectuses, proxy statements and shareholder reports, to fund investors with multiple accounts at the same residential or post office box address. This practice is often called “householding” and it helps eliminate duplicate mailings to shareholders. Eaton Vance, or your financial advisor, may household the mailing of your documents indefinitely unless you instruct Eaton Vance, or your financial advisor, otherwise. If you would prefer that your Eaton Vance documents not be householded, please contact Eaton Vance at 1-800-262-1122, or contact your financial advisor. Your instructions that householding not apply to delivery of your Eaton Vance documents will be effective within 30 days of receipt by Eaton Vance or your financial advisor.
Portfolio Holdings. Each Eaton Vance Fund and its underlying Portfolio(s) (if applicable) will file a schedule of portfolio holdings on Form N-Q with the SEC for the first and third quarters of each fiscal year. The Form N-Q will be available on the Eaton Vance website at www.eatonvance.com, by calling Eaton Vance at 1-800-262-1122 or in the EDGAR database on the SEC’s website at www.sec.gov. Form N-Q may also be reviewed and copied at the SEC’s public reference room in Washington, D.C. (call 1-800-732-0330 for information on the operation of the public reference room).
Proxy Voting. From time to time, funds are required to vote proxies related to the securities held by the funds. The Eaton Vance Funds or their underlying Portfolios (if applicable) vote proxies according to a set of policies and procedures approved by the Funds’ and Portfolios’ Boards. You may obtain a description of these policies and procedures and information on how the Funds or Portfolios voted proxies relating to portfolio securities during the most recent 12-month period ended June 30, without charge, upon request, by calling 1-800-262-1122 and by accessing the SEC’s website at www.sec.gov.
This Page Intentionally Left Blank
Investment Adviser
Boston Management and Research
Two International Place
Boston, MA 02110
Administrator
Eaton Vance Management
Two International Place
Boston, MA 02110
Principal Underwriter*
Eaton Vance Distributors, Inc.
Two International Place
Boston, MA 02110
(617) 482-8260
Custodian
State Street Bank and Trust Company
200 Clarendon Street
Boston, MA 02116
Transfer Agent
BNY Mellon Investment Servicing (US) Inc.
Attn: Eaton Vance Funds
P.O. Box 9653
Providence, RI 02940-9653
(800) 262-1122
Independent Registered Public Accounting Firm
Deloitte & Touche LLP
200 Berkeley Street
Boston, MA 02116-5022
Fund Offices
Two International Place
Boston, MA 02110
| * | FINRA BrokerCheck. Investors may check the background of their Investment Professional by contacting the Financial Industry Regulatory Authority (FINRA). FINRA BrokerCheck is a free tool to help investors check the professional background of current and former FINRA-registered securities firms and brokers. FINRA BrokerCheck is available by calling 1-800-289-9999 and at www.FINRA.org. The FINRA BrokerCheck brochure describing this program is available to investors at www.FINRA.org. |

Eaton Vance
Municipal Income Funds
Annual Report
September 30, 2013
AMT-Free • National

Commodity Futures Trading Commission Registration. Effective December 31, 2012, the Commodity Futures Trading Commission (“CFTC”) adopted certain regulatory changes that subject registered investment companies and advisers to regulation by the CFTC if a fund invests more than a prescribed level of its assets in certain CFTC-regulated instruments (including futures, certain options and swap agreements) or markets itself as providing investment exposure to such instruments. Each Fund has claimed an exclusion from the definition of the term “commodity pool operator” under the Commodity Exchange Act and is not subject to the CFTC regulation. Because of its management of other strategies, each Fund’s adviser is registered with the CFTC as a commodity pool operator.
Fund shares are not insured by the FDIC and are not deposits or other obligations of, or guaranteed by, any depository institution. Shares are subject to investment risks, including possible loss of principal invested.
This report must be preceded or accompanied by a current summary prospectus or prospectus. Before investing, investors should consider carefully the investment objective, risks, and charges and expenses of a mutual fund. This and other important information is contained in the summary prospectus and prospectus, which can be obtained from a financial advisor. Prospective investors should read the prospectus carefully before investing. For further information, please call 1-800-262-1122.
Annual Report September 30, 2013
Eaton Vance
Municipal Income Funds
Table of Contents
| | | | |
Management’s Discussion of Fund Performance | | | 2 | |
| |
Performance and Fund Profile | | | | |
| |
| | | | |
AMT-Free Municipal Income Fund | | | 4 | |
National Municipal Income Fund | | | 6 | |
| |
| | | | |
| |
Endnotes and Additional Disclosures | | | 8 | |
| |
Fund Expenses | | | 9 | |
| |
Financial Statements | | | 11 | |
| |
Report of Independent Registered Public Accounting Firm | | | 46 | |
| |
Federal Tax Information | | | 48 | |
| |
Board of Trustees’ Contract Approval | | | 49 | |
| |
Management and Organization | | | 52 | |
| |
Important Notices | | | 54 | |
Eaton Vance
Municipal Income Funds
September 30, 2013
Management’s Discussion of Fund Performance1
Economic and Market Conditions
During the first seven months of the fiscal year ended September 30, 2013, interest rates declined to historic lows, driven by highly accommodative monetary policies instituted by central banks around the world. In December 2012, the U.S. Federal Reserve (the Fed) replaced Operation Twist, the central bank’s swapping of its short-term holdings for long-term Treasury bonds, with outright purchases of $45 billion of Treasuries each month. This was in addition to the monthly purchase of approximately $40 billion of agency mortgage-backed securities that it had begun just a few months before. These actions combined to put extraordinary downward pressure on yields, driving investors to look for other sources of income. One beneficiary was the municipal bond market, which rallied during the first seven months of the period in response to strong investor demand.
In late May 2013, however, Fed Chairman Ben Bernanke surprised the markets by indicating that the Fed’s $85 billion in monthly asset purchases, known collectively as quantitative easing (QE), could be tapered sooner than most investors had expected. The negative effect on the bond market was swift and dramatic. Investors rushed to sell fixed-income assets in anticipation of rising interest rates, causing nearly every fixed-income asset class to decline dramatically in value.
Historic outflows had a particularly significant effect on the municipal bond market because, unlike other domestic fixed-income asset classes, the municipal market is primarily retail based and is generally impacted more by the actions of small individual investors than other fixed-income asset classes. Even after the Fed tried to temper its comments and calm the markets, moderating the outflows in other fixed-income classes, heavy selling in municipals continued through August 2013. The selling abated in September 2013, after the Fed surprised the markets again by postponing its tapering of QE that many investors had thought was imminent. The Funds’ primary benchmark, the Barclays Municipal Bond Index2 (the Index) — unmanaged index of municipal bonds traded in the United States — declined 2.21% for the one-year period, while the Barclays Long (22+) Year Municipal Bond Index lost 5.06%.
During the period, additional pressure on the municipal market came from the city of Detroit’s bankruptcy filing on July 18, 2013 and heightened attention to Puerto Rico’s fiscal woes throughout September 2013. Although Detroit’s bankruptcy was not a surprise, because the
city’s fiscal problems had been well-documented for many years, the bankruptcy’s negative headlines injected additional fear into the municipal bond market. That fear, combined with Puerto Rico’s well-publicized fiscal challenges, drove both institutional and retail investors to sell Puerto Rico bonds, exerting additional downward pressure on the market value of the bonds in late August and September 2013 as the Funds’ fiscal year was ending.
Fund Performance
For the fiscal year ended September 30, 2013, AMT-Free Municipal Income Fund and National Municipal Income Fund Class A shares at net asset value (NAV) both underperformed the -2.21% return of the Index.
The Funds’ overall strategy is to invest normally in higher-quality bonds (rated A7 or higher) with maturities of 10 years or more in order to capture their typically higher yields and a greater income stream.
Management hedges to various degrees against the greater potential risk of volatility at the long end of the yield curve by using Treasury futures and/or interest-rate swaps in seeking to mitigate risk. As a risk management tactic within the Funds’ overall strategy, interest-rate hedging is intended to moderate performance on both the upside and the downside of the market. During this period of negative performance by municipal bonds, the Funds’ hedging through Treasury futures mitigated some of the downside and, thus, added to the Funds’ performance relative to the Index.
The Funds’ overweighting in bonds with maturities of 20 years or more detracted from performance versus the Index, as longer-duration8 issues performed poorly in a rising rate environment. Similarly, an overweighting and security selection in zero coupon bonds hurt relative results versus the Index of both funds, as zero-coupon bonds are the longest-duration coupon structure.
Leveraged6 investments hurt performance versus the Index as well. In managing the Funds, management holds leveraged investments to seek to enhance the Funds’ tax-exempt income. The use of leveraged investments has the effect of achieving additional exposure to the municipal market and magnifies a fund’s exposure to its underlying investments in both up and down markets. As a result, during this period of negative performance by municipal bonds, leveraged investments detracted from performance versus the Index.
See Endnotes and Additional Disclosures in this report.
Past performance is no guarantee of future results. Returns are historical and are calculated by determining the percentage change in net asset value (NAV) or offering price (as applicable) with all distributions reinvested. Investment return and principal value will fluctuate so that shares, when redeemed, may be worth more or less than their original cost. Performance less than one year is cumulative. Performance is for the stated time period only; due to market volatility, the Fund’s current performance may be lower or higher than quoted. Returns are before taxes unless otherwise noted. For performance as of the most recent month end, please refer to www.eatonvance.com.
Eaton Vance
Municipal Income Funds
September 30, 2013
Management’s Discussion of Fund Performance1 — continued
Fund-specific Results
Eaton Vance AMT-Free Municipal Income Fund Class A shares at NAV returned -5.75%, underperforming the -2.21% return of the Index. As noted above, the chief detractors from results relative to the Index included leveraged investments, an overweighting and security selection in zero-coupon bonds and an overweighting in bonds with 20 or more years remaining to maturity. In contrast, the Fund’s hedging strategy and an underweighting in Puerto Rico bonds aided performance versus the Index. And although lower-rated bonds in general did poorly over the period, strong security section in BBB bonds, combined with an overweighting in bonds of that credit rating, allowed the Fund’s BBB holdings to outperform those of the Index and contribute to performance versus the Index.
Eaton Vance National Municipal Income Fund Class A shares at NAV returned -5.77%, underperforming the -2.21% return of the Index. An overweighting and security selection in Puerto Rico bonds held back performance relative to the Index, as did leveraged investments, an overweighting and security selection in zero-coupon bonds, and an overweighting in bonds with maturities of 20 years or more. Key contributors to results versus the Index included security selection in industrial development revenue bonds and the Fund’s hedging strategy. Performance versus the Index was also helped by a relative overweighting in noninvestment-grade bonds, because their higher coupon rates helped offset some of their price declines during the period.
See Endnotes and Additional Disclosures in this report.
Past performance is no guarantee of future results. Returns are historical and are calculated by determining the percentage change in net asset value (NAV) or offering price (as applicable) with all distributions reinvested. Investment return and principal value will fluctuate so that shares, when redeemed, may be worth more or less than their original cost. Performance less than one year is cumulative. Performance is for the stated time period only; due to market volatility, the Fund’s current performance may be lower or higher than quoted. Returns are before taxes unless otherwise noted. For performance as of the most recent month end, please refer to www.eatonvance.com.
Eaton Vance
AMT-Free Municipal Income Fund
September 30, 2013
Performance2,3
Portfolio Manager Cynthia J. Clemson
| | | | | | | | | | | | | | | | | | | | |
| % Average Annual Total Returns | | Class
Inception Date | | | Performance
Inception Date | | | One Year | | | Five Years | | | Ten Years | |
Class A at NAV | | | 01/06/1998 | | | | 03/16/1978 | | | | –5.75 | % | | | 6.06 | % | | | 3.58 | % |
Class A with 4.75% Maximum Sales Charge | | | — | | | | — | | | | –10.24 | | | | 5.03 | | | | 3.07 | |
Class B at NAV | | | 01/14/1998 | | | | 03/16/1978 | | | | –6.42 | | | | 5.28 | | | | 2.83 | |
Class B with 5% Maximum Sales Charge | | | — | | | | — | | | | –10.93 | | | | 4.95 | | | | 2.83 | |
Class C at NAV | | | 05/02/2006 | | | | 03/16/1978 | | | | –6.51 | | | | 5.26 | | | | 2.83 | |
Class C with 1% Maximum Sales Charge | | | — | | | | — | | | | –7.42 | | | | 5.26 | | | | 2.83 | |
Class I at NAV | | | 03/16/1978 | | | | 03/16/1978 | | | | –5.46 | | | | 6.32 | | | | 3.84 | |
Barclays Municipal Bond Index | | | — | | | | — | | | | –2.21 | % | | | 5.98 | % | | | 4.39 | % |
Barclays Long (22+) Year Municipal Bond Index | | | — | | | | — | | | | –5.06 | | | | 7.24 | | | | 4.82 | |
| | | | | |
| | | | | | | | | | | | | | | | | | | | |
| % Total Annual Operating Expense Ratios4 | | | | | Class A | | | Class B | | | Class C | | | Class I | |
Gross | | | | | | | 0.95 | % | | | 1.70 | % | | | 1.70 | % | | | 0.70 | % |
Net | | | | | | | 0.84 | | | | 1.59 | | | | 1.59 | | | | 0.59 | |
| | | | | |
| | | | | | | | | | | | | | | | | | | | |
| % Distribution Rates/Yields5 | | | | | Class A | | | Class B | | | Class C | | | Class I | |
Distribution Rate | | | | | | | 4.59 | % | | | 3.86 | % | | | 3.87 | % | | | 4.84 | % |
Taxable-Equivalent Distribution Rate | | | | | | | 8.11 | | | | 6.82 | | | | 6.84 | | | | 8.55 | |
SEC 30-day Yield | | | | | | | 3.66 | | | | 3.11 | | | | 3.11 | | | | 4.09 | |
Taxable-Equivalent SEC 30-day Yield | | | | | | | 6.47 | | | | 5.49 | | | | 5.49 | | | | 7.23 | |
| | | | | |
| | | | | | | | | | | | | | | | | | | | |
| % Total Leverage6 | | | | | | | | | | | | | | | |
Residual Interest Bond (RIB) | | | | | | | | | | | | | | | | | | | 12.72 | % |
Growth of $10,000
This graph shows the change in value of a hypothetical investment of $10,000 in Class A of the Fund for the period indicated. For comparison, the same investment is shown in the indicated index.
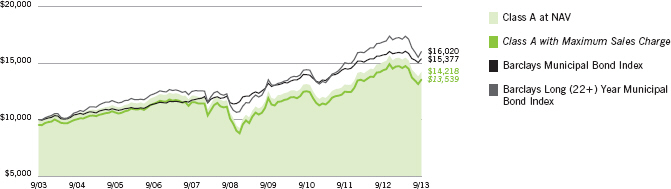
| | | | | | | | |
| Growth of Investment | | Amount Invested | | Period Beginning | | At NAV | | With Maximum
Sales Charge |
Class B | | $ 10,000 | | 09/30/2003 | | $ 13,217 | | N.A. |
Class C | | $ 10,000 | | 09/30/2003 | | $ 13,216 | | N.A. |
Class I | | $250,000 | | 09/30/2003 | | $364,491 | | N.A. |
See Endnotes and Additional Disclosures in this report.
Past performance is no guarantee of future results. Returns are historical and are calculated by determining the percentage change in net asset value (NAV) or offering price (as applicable) with all distributions reinvested. Investment return and principal value will fluctuate so that shares, when redeemed, may be worth more or less than their original cost. Performance less than one year is cumulative. Performance is for the stated time period only; due to market volatility, the Fund’s current performance may be lower or higher than quoted. Returns are before taxes unless otherwise noted. For performance as of the most recent month end, please refer to www.eatonvance.com.
Eaton Vance
AMT-Free Municipal Income Fund
September 30, 2013
Fund Profile
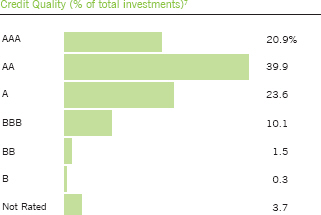
The above chart includes the ratings of securities held by special purpose vehicles established in connection with the RIB financing.6 Absent such securities, credit quality (% of total investments) is as follows:7
| | | | | | | | | | |
AAA | | | 18.5 | % | | BB | | | 1.7 | % |
AA | | | 36.5 | | | B | | | 0.3 | |
A | | | 27.1 | | | Not Rated | | | 4.3 | |
BBB | | | 11.6 | | | | | | | |
See Endnotes and Additional Disclosures in this report.
Eaton Vance
National Municipal Income Fund
September 30, 2013
Performance2,3
Portfolio Managers Thomas M. Metzold, CFA and Craig R. Brandon, CFA
| | | | | | | | | | | | | | | | | | | | |
| % Average Annual Total Returns | | Class Inception Date | | | Performance Inception Date | | | One Year | | | Five Years | | | Ten Years | |
Class A at NAV | | | 04/05/1994 | | | | 12/19/1985 | | | | –5.77 | % | | | 5.82 | % | | | 3.63 | % |
Class A with 4.75% Maximum Sales Charge | | | — | | | | — | | | | –10.25 | | | | 4.80 | | | | 3.12 | |
Class B at NAV | | | 12/19/1985 | | | | 12/19/1985 | | | | –6.47 | | | | 5.03 | | | | 2.89 | |
Class B with 5% Maximum Sales Charge | | | — | | | | — | | | | –10.96 | | | | 4.70 | | | | 2.89 | |
Class C at NAV | | | 12/03/1993 | | | | 12/19/1985 | | | | –6.47 | | | | 5.03 | | | | 2.87 | |
Class C with 1% Maximum Sales Charge | | | — | | | | — | | | | –7.37 | | | | 5.03 | | | | 2.87 | |
Class I at NAV | | | 07/01/1999 | | | | 12/19/1985 | | | | –5.43 | | | | 6.10 | | | | 3.89 | |
Barclays Municipal Bond Index | | | — | | | | — | | | | –2.21 | % | | | 5.98 | % | | | 4.39 | % |
Barclays Long (22+) Year Municipal Bond Index | | | — | | | | — | | | | –5.06 | | | | 7.24 | | | | 4.82 | |
| | | | | |
| | | | | | | | | | | | | | | | | | | | |
| % Total Annual Operating Expense Ratios4 | | | | | Class A | | | Class B | | | Class C | | | Class I | |
Gross | | | | | | | 0.78 | % | | | 1.53 | % | | | 1.53 | % | | | 0.53 | % |
Net | | | | | | | 0.67 | | | | 1.42 | | | | 1.42 | | | | 0.42 | |
| | | | | |
| | | | | | | | | | | | | | | | | | | | |
| % Distribution Rates/Yields5 | | | | | Class A | | | Class B | | | Class C | | | Class I | |
Distribution Rate | | | | | | | 5.33 | % | | | 4.61 | % | | | 4.61 | % | | | 5.57 | % |
Taxable-Equivalent Distribution Rate | | | | | | | 9.42 | | | | 8.14 | | | | 8.14 | | | | 9.84 | |
SEC 30-day Yield | | | | | | | 4.70 | | | | 4.21 | | | | 4.21 | | | | 5.18 | |
Taxable-Equivalent SEC 30-day Yield | | | | | | | 8.30 | | | | 7.44 | | | | 7.44 | | | | 9.15 | |
| | | | | |
| | | | | | | | | | | | | | | | | | | | |
| % Total Leverage6 | | | | | | | | | | | | | | | |
RIB | | | | | | | | | | | | | | | | | | | 13.79 | % |
Growth of $10,000
This graph shows the change in value of a hypothetical investment of $10,000 in Class A of the Fund for the period indicated. For comparison, the same investment is shown in the indicated index.
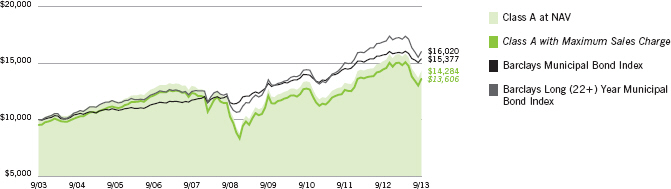
| | | | | | | | |
| Growth of Investment | | Amount Invested | | Period Beginning | | At NAV | | With Maximum
Sales Charge |
Class B | | $ 10,000 | | 09/30/2003 | | $ 13,299 | | N.A. |
Class C | | $ 10,000 | | 09/30/2003 | | $ 13,268 | | N.A. |
Class I | | $250,000 | | 09/30/2003 | | $366,229 | | N.A. |
See Endnotes and Additional Disclosures in this report.
Past performance is no guarantee of future results. Returns are historical and are calculated by determining the percentage change in net asset value (NAV) or offering price (as applicable) with all distributions reinvested. Investment return and principal value will fluctuate so that shares, when redeemed, may be worth more or less than their original cost. Performance less than one year is cumulative. Performance is for the stated time period only; due to market volatility, the Fund’s current performance may be lower or higher than quoted. Returns are before taxes unless otherwise noted. For performance as of the most recent month end, please refer to www.eatonvance.com.
Eaton Vance
National Municipal Income Fund
September 30, 2013
Fund Profile
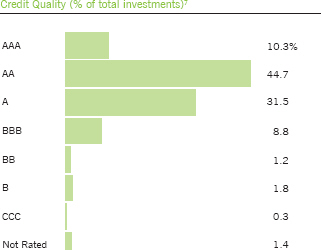
The above chart includes the ratings of securities held by special purpose vehicles established in connection with the RIB financing.6 Absent such securities, credit quality (% of total investments) is as follows:7
| | | | | | | | | | |
AAA | | | 7.9 | % | | BB | | | 1.4 | % |
AA | | | 39.7 | | | B | | | 2.1 | |
A | | | 36.6 | | | CCC | | | 0.4 | |
BBB | | | 10.3 | | | Not Rated | | | 1.6 | |
See Endnotes and Additional Disclosures in this report.
Eaton Vance
Municipal Income Funds
September 30, 2013
Endnotes and Additional Disclosures
| 1 | The views expressed in this report are those of the portfolio manager(s) and are current only through the date stated at the top of this page. These views are subject to change at any time based upon market or other conditions, and Eaton Vance and the Fund(s) disclaim any responsibility to update such views. These views may not be relied upon as investment advice and, because investment decisions are based on many factors, may not be relied upon as an indication of trading intent on behalf of any Eaton Vance fund. This commentary may contain statements that are not historical facts, referred to as “forward looking statements”. The Fund’s actual future results may differ significantly from those stated in any forward looking statement, depending on factors such as changes in securities or financial markets or general economic conditions, the volume of sales and purchases of Fund shares, the continuation of investment advisory, administrative and service contracts, and other risks discussed from time to time in the Fund’s filings with the Securities and Exchange Commission. |
| 2 | Barclays Municipal Bond Index is an unmanaged index of municipal bonds traded in the U.S. Barclays Long (22+) Year Municipal Bond Index is an unmanaged index of municipal bonds traded in the U.S. with maturities of 22 years or more. Unless otherwise stated, index returns do not reflect the effect of any applicable sales charges, commissions, expenses, taxes or leverage, as applicable. It is not possible to invest directly in an index. |
| 3 | Total Returns at NAV do not include applicable sales charges. If sales charges were deducted, the returns would be lower. Total Returns shown with maximum sales charge reflect the stated maximum sales charge. Unless otherwise stated, performance does not reflect the deduction of taxes on Fund distributions or redemptions of Fund shares. |
| | Performance prior to the inception date of a class may be linked to the performance of an older class of the Fund. This linked performance is adjusted for any applicable sales charge, but is not adjusted for class expense differences. If adjusted for such differences, the performance would be different. Performance presented in the financial highlights included in the financial statements is not linked. In the performance table, the performance of Class C is linked to Class B. Performance since inception for an index, if presented, is the performance since the Fund’s or oldest share class’ inception, as applicable. |
| 4 | Total annual operating expense ratios are as stated in the Fund’s most recent prospectus. Net expense ratio excludes interest expense relating to the Fund’s liability with respect to floating rate notes held by third parties in conjunction with residual interest bond transactions by the Fund. The Fund also records offsetting interest income in an amount equal to this expense relating to the municipal obligations underlying such transactions and, as a result, net asset value and performance have not been affected by this expense. |
| 5 | The Distribution Rate is based on the Fund’s last regular distribution per share in the period (annualized) divided by the Fund’s NAV at the end of the period. The Fund’s distributions may be composed of ordinary income, tax-exempt income, net realized capital gains and return of capital. The Fund’s distributions are determined by the investment adviser based on its current assessment of the Fund’s long-term return potential. As portfolio and market conditions change, the rate of distributions paid by the Fund could change. Taxable-equivalent performance is based on the highest combined federal and state income tax rates, where applicable. Lower tax rates would result in lower tax-equivalent performance. Actual tax rates will vary depending on your income, exemptions and deductions. Rates do not include local taxes. SEC Yield is a standardized measure based on the estimated yield to maturity of a fund’s investments over a 30-day period and is based on the maximum offer price at the date specified. The SEC Yield is not based on the distributions made by the Fund, which may differ. |
| 6 | Fund employs RIB financing. The leverage created by RIB investments provides an opportunity for increased income but, at the same time, creates special risks (including the likelihood of greater volatility of NAV). The cost of leverage rises and falls with changes in short-term interest rates. See “Floating Rate Notes Issued in Conjunction with Securities Held” in the notes to the financial statements for more information about RIB financing. RIB leverage represents the amount of Floating Rate Notes outstanding at period end as a percentage of Fund net assets plus Floating Rate Notes. |
| 7 | Ratings are based on Moody’s, S&P or Fitch, as applicable. Ratings, which are subject to change, apply to the creditworthiness of the issuers of the underlying securities and not to the Fund or its shares. Credit ratings measure the quality of a bond based on the issuer’s creditworthiness, with ratings ranging from AAA, being the highest, to D, being the lowest based on S&P’s measures. Ratings of BBB or higher by Standard and Poor’s or Fitch (Baa or higher by Moody’s) are considered to be investment grade quality. Credit ratings are based largely on the rating agency’s analysis at the time of rating. The rating assigned to any particular security is not necessarily a reflection of the issuer’s current financial condition and does not necessarily reflect its assessment of the volatility of a security’s market value or of the liquidity of an investment in the security. If securities are rated differently by the rating agencies, the higher rating is applied. Holdings designated as “Not Rated” are not rated by the national rating agencies stated above. |
| 8 | Duration is a measure of the expected change in price of a bond — in percentage terms — given a one percent change in interest rates, all else being constant. Securities with lower durations tend to be less sensitive to interest-rate changes. |
| | Fund profile subject to change due to active management. |
Important Notice to Shareholders
| | Effective August 1, 2013, Craig Brandon was added as co-portfolio manager of National Municipal Income Fund. He is a Vice President of Eaton Vance and BMR and also manages other Eaton Vance portfolios. |
Eaton Vance
Municipal Income Funds
September 30, 2013
Fund Expenses
Example: As a Fund shareholder, you incur two types of costs: (1) transaction costs, including sales charges (loads) on purchases and redemption fees (if applicable); and (2) ongoing costs, including management fees; distribution and/or service fees; and other Fund expenses. This Example is intended to help you understand your ongoing costs (in dollars) of Fund investing and to compare these costs with the ongoing costs of investing in other mutual funds. The Example is based on an investment of $1,000 invested at the beginning of the period and held for the entire period (April 1, 2013 – September 30, 2013).
Actual Expenses: The first section of each table below provides information about actual account values and actual expenses. You may use the information in this section, together with the amount you invested, to estimate the expenses that you paid over the period. Simply divide your account value by $1,000 (for example, an $8,600 account value divided by $1,000 = 8.6), then multiply the result by the number in the first section under the heading entitled “Expenses Paid During Period” to estimate the expenses you paid on your account during this period.
Hypothetical Example for Comparison Purposes: The second section of each table below provides information about hypothetical account values and hypothetical expenses based on the actual Fund expense ratio and an assumed rate of return of 5% per year (before expenses), which is not the actual Fund return. The hypothetical account values and expenses may not be used to estimate the actual ending account balance or expenses you paid for the period. You may use this information to compare the ongoing costs of investing in your Fund and other funds. To do so, compare this 5% hypothetical example with the 5% hypothetical examples that appear in the shareholder reports of the other funds.
Please note that the expenses shown in each table are meant to highlight your ongoing costs only and do not reflect any transactional costs, such as sales charges (loads) or redemption fees (if applicable). Therefore, the second section of each table is useful in comparing ongoing costs only, and will not help you determine the relative total costs of owning different funds. In addition, if these transactional costs were included, your costs would be higher.
Eaton Vance AMT-Free Municipal Income Fund
| | | | | | | | | | | | | | | | |
| | | Beginning
Account Value
(4/1/13) | | | Ending
Account Value
(9/30/13) | | | Expenses Paid
During Period*
(4/1/13 – 9/30/13) | | | Annualized
Expense
Ratio | |
| | | | |
| | | | | | | | | | | | | | | | |
Actual | | | | | | | | | | | | | |
Class A | | $ | 1,000.00 | | | $ | 929.50 | | | $ | 4.64 | | | | 0.96 | % |
Class B | | $ | 1,000.00 | | | $ | 926.50 | | | $ | 8.26 | | | | 1.71 | % |
Class C | | $ | 1,000.00 | | | $ | 925.50 | | | $ | 8.25 | | | | 1.71 | % |
Class I | | $ | 1,000.00 | | | $ | 930.70 | | | $ | 3.44 | | | | 0.71 | % |
| | | | | | | | | | | | | | | | | |
| | | | |
| | | | | | | | | | | | | | | | |
Hypothetical | | | | | | | | | | | | | |
(5% return per year before expenses) | | | | | | | | | | | | | |
Class A | | $ | 1,000.00 | | | $ | 1,020.30 | | | $ | 4.86 | | | | 0.96 | % |
Class B | | $ | 1,000.00 | | | $ | 1,016.50 | | | $ | 8.64 | | | | 1.71 | % |
Class C | | $ | 1,000.00 | | | $ | 1,016.50 | | | $ | 8.64 | | | | 1.71 | % |
Class I | | $ | 1,000.00 | | | $ | 1,021.50 | | | $ | 3.60 | | | | 0.71 | % |
| * | Expenses are equal to the Fund’s annualized expense ratio for the indicated Class, multiplied by the average account value over the period, multiplied by 183/365 (to reflect the one-half year period). The Example assumes that the $1,000 was invested at the net asset value per share determined at the close of business on March 31, 2013. |
Eaton Vance
Municipal Income Funds
September 30, 2013
Fund Expenses — continued
Eaton Vance National Municipal Income Fund
| | | | | | | | | | | | | | | | |
| | | Beginning
Account Value
(4/1/13) | | | Ending
Account Value
(9/30/13) | | | Expenses Paid
During Period*
(4/1/13 – 9/30/13) | | | Annualized
Expense
Ratio | |
| | | | |
| | | | | | | | | | | | | | | | |
Actual | | | | | | | | | | | | | |
Class A | | $ | 1,000.00 | | | $ | 918.10 | | | $ | 3.85 | | | | 0.80 | % |
Class B | | $ | 1,000.00 | | | $ | 914.70 | | | $ | 7.44 | | | | 1.55 | % |
Class C | | $ | 1,000.00 | | | $ | 914.70 | | | $ | 7.44 | | | | 1.55 | % |
Class I | | $ | 1,000.00 | | | $ | 919.40 | | | $ | 2.65 | | | | 0.55 | % |
| | | | | | | | | | | | | | | | | |
| | | | |
| | | | | | | | | | | | | | | | |
Hypothetical | | | | | | | | | | | | | |
(5% return per year before expenses) | | | | | | | | | | | | | |
Class A | | $ | 1,000.00 | | | $ | 1,021.10 | | | $ | 4.05 | | | | 0.80 | % |
Class B | | $ | 1,000.00 | | | $ | 1,017.30 | | | $ | 7.84 | | | | 1.55 | % |
Class C | | $ | 1,000.00 | | | $ | 1,017.30 | | | $ | 7.84 | | | | 1.55 | % |
Class I | | $ | 1,000.00 | | | $ | 1,022.30 | | | $ | 2.79 | | | | 0.55 | % |
| * | Expenses are equal to the Fund’s annualized expense ratio for the indicated Class, multiplied by the average account value over the period, multiplied by 183/365 (to reflect the one-half year period). The Example assumes that the $1,000 was invested at the net asset value per share determined at the close of business on March 31, 2013. |
Eaton Vance
AMT-Free Municipal Income Fund
September 30, 2013
Portfolio of Investments
| | | | | | | | |
| Tax-Exempt Investments — 112.1% | |
| Security | | Principal
Amount
(000’s omitted) | | | Value | |
| | | | | | | | |
|
Bond Bank — 3.7% | |
Idaho Bond Bank Authority, 5.25%, 9/15/25 | | $ | 1,160 | | | $ | 1,293,109 | |
Idaho Bond Bank Authority, 5.375%, 9/15/27 | | | 1,555 | | | | 1,726,423 | |
New York Environmental Facilities Corp., 5.00%, 10/15/35 | | | 30 | | | | 31,978 | |
New York Environmental Facilities Corp., 5.00%, 10/15/35(1) | | | 9,900 | | | | 10,552,707 | |
| | |
| | | | | | $ | 13,604,217 | |
| | |
|
Education — 10.5% | |
California Educational Facilities Authority, (Stanford University), 5.00%, 6/1/43 | | $ | 5,250 | | | $ | 6,061,440 | |
Georgia Private Colleges and Universities Authority, (Emory University), 5.00%, 9/1/38(1) | | | 6,990 | | | | 7,180,338 | |
Massachusetts Health and Educational Facilities Authority, (Harvard University), 5.50%, 11/15/36 | | | 11,000 | | | | 12,239,700 | |
Missouri Health and Educational Facilities Authority, (Washington University), 5.375%, 3/15/39(1) | | | 4,110 | | | | 4,523,466 | |
Oregon Facilities Authority, (Lewis & Clark College), 5.625%, 10/1/36 | | | 1,530 | | | | 1,653,134 | |
Oregon Facilities Authority, (Reed College), 5.125%, 7/1/41 | | | 1,265 | | | | 1,332,627 | |
Rutgers State University, NJ, 5.00%, 5/1/43 | | | 755 | | | | 786,491 | |
University of Virginia, 5.00%, 6/1/40 | | | 4,475 | | | | 4,754,106 | |
| | |
| | | | | | $ | 38,531,302 | |
| | |
|
Electric Utilities — 6.2% | |
Apache County, AZ, Industrial Development Authority, (Tucson Electric Power Co.), 4.50%, 3/1/30 | | $ | 1,605 | | | $ | 1,498,701 | |
Chula Vista, CA, (San Diego Gas and Electric), 5.875%, 2/15/34 | | | 3,520 | | | | 3,923,216 | |
Hawaii Department of Budget and Finance, (Hawaiian Electric Co.), 6.50%, 7/1/39 | | | 1,000 | | | | 1,086,050 | |
Pima County, AZ, Industrial Development Authority, (Tucson Electric Power Co.), 5.25%, 10/1/40 | | | 2,910 | | | | 2,889,223 | |
San Antonio, TX, (Electric and Gas Systems), 5.00%, 2/1/34(1) | | | 7,000 | | | | 7,396,340 | |
Vernon, CA, Electric System Revenue, 5.125%, 8/1/21 | | | 5,505 | | | | 5,934,335 | |
| | |
| | | | | | $ | 22,727,865 | |
| | |
|
Escrowed / Prerefunded — 3.9% | |
Foothill/Eastern Transportation Corridor Agency, CA, Escrowed to Maturity, 0.00%, 1/1/18 | | $ | 10,000 | | | $ | 9,435,900 | |
Savannah, GA, Economic Development Authority, Escrowed to Maturity, 0.00%, 12/1/21 | | | 6,000 | | | | 4,828,800 | |
| | |
| | | | | | $ | 14,264,700 | |
| | |
|
General Obligations — 12.8% | |
California, 5.00%, 2/1/31 | | $ | 1,405 | | | $ | 1,494,344 | |
| | | | | | | | |
| Security | | Principal
Amount
(000’s omitted) | | | Value | |
| | | | | | | | |
|
General Obligations (continued) | |
California, 5.25%, 10/1/29 | | $ | 560 | | | $ | 613,155 | |
California, 5.25%, 10/1/32 | | | 3,480 | | | | 3,738,425 | |
Clackamas County, OR, School District No. 46, 0.00%, 6/15/32 | | | 1,740 | | | | 716,410 | |
Clackamas County, OR, School District No. 46, 0.00%, 6/15/33 | | | 5,880 | | | | 2,286,673 | |
Clackamas County, OR, School District No. 46, 0.00%, 6/15/34 | | | 8,500 | | | | 3,125,535 | |
Clackamas County, OR, School District No. 46, 0.00%, 6/15/36 | | | 4,670 | | | | 1,545,303 | |
Deschutes and Jefferson Counties, OR, School District No. 2J, 0.00%, 6/15/25 | | | 3,700 | | | | 2,388,905 | |
Honolulu City and County, HI, 5.25%, 8/1/33 | | | 1,245 | | | | 1,376,958 | |
Honolulu City and County, HI, 5.25%, 8/1/34 | | | 1,525 | | | | 1,681,175 | |
Louisiana, 4.00%, 8/1/30 | | | 1,485 | | | | 1,489,321 | |
Louisiana, 4.00%, 8/1/31 | | | 2,515 | | | | 2,516,761 | |
Newton, MA, 5.00%, 4/1/39 | | | 1,610 | | | | 1,673,982 | |
Port of Houston Authority of Harris County, TX, 5.00%, 10/1/39 | | | 2,500 | | | | 2,756,400 | |
Salem-Keizer, OR, School District No. 24J, 0.00%, 6/15/24 | | | 1,565 | | | | 1,088,864 | |
Salem-Keizer, OR, School District No. 24J, 0.00%, 6/15/25 | | | 1,605 | | | | 1,036,268 | |
Salem-Keizer, OR, School District No. 24J, 0.00%, 6/15/26 | | | 1,615 | | | | 979,078 | |
Santa Clara County, CA, (Election of 2008), 5.00%, 8/1/39(1)(2) | | | 7,700 | | | | 8,174,628 | |
South Carolina, 3.25%, 8/1/30 | | | 2,330 | | | | 2,171,630 | |
Washington, 5.25%, 2/1/36(1) | | | 6,000 | | | | 6,444,780 | |
| | |
| | | | | | $ | 47,298,595 | |
| | |
|
Health Care-Miscellaneous — 0.2% | |
Suffolk County, NY, Industrial Development Agency, (Alliance of Long Island Agencies), Series A, Class B, 7.50%, 9/1/15 | | $ | 135 | | | $ | 136,368 | |
Tax Exempt Securities Trust, Community Health Provider, (Pooled Loan Program Various States Trust Certificates), 6.00%, 12/1/36(3) | | | 86 | | | | 85,799 | |
Tax Exempt Securities Trust, Community Health Provider, (Pooled Loan Program Various States Trust Certificates), Series 1,
5.50%, 12/1/36(3) | | | 303 | | | | 302,900 | |
Tax Exempt Securities Trust, Community Health Provider, (Pooled Loan Program Various States Trust Certificates), Series 2,
5.50%, 12/1/36(3) | | | 361 | | | | 360,595 | |
| | |
| | | | | | $ | 885,662 | |
| | |
|
Hospital — 17.2% | |
California Health Facilities Financing Authority, (Catholic Healthcare West), 5.25%, 3/1/28 | | $ | 535 | | | $ | 563,676 | |
California Health Facilities Financing Authority, (Providence Health System), 5.50%, 10/1/39 | | | 5,175 | | | | 5,645,563 | |
| | | | |
| | 11 | | See Notes to Financial Statements. |
Eaton Vance
AMT-Free Municipal Income Fund
September 30, 2013
Portfolio of Investments — continued
| | | | | | | | |
| Security | | Principal
Amount
(000’s omitted) | | | Value | |
| | | | | | | | |
|
Hospital (continued) | |
California Health Facilities Financing Authority, (St. Joseph Health System), 5.00%, 7/1/33 | | $ | 1,720 | | | $ | 1,766,646 | |
California Health Facilities Financing Authority, (St. Joseph Health System), 5.00%, 7/1/37 | | | 2,380 | | | | 2,407,299 | |
California Health Facilities Financing Authority, (Sutter Health), 5.25%, 8/15/31 | | | 1,325 | | | | 1,403,732 | |
California Statewide Communities Development Authority, (John Muir Health), 5.00%, 7/1/29 | | | 1,330 | | | | 1,363,622 | |
California Statewide Communities Development Authority, (John Muir Health), 5.125%, 7/1/39 | | | 2,375 | | | | 2,394,808 | |
California Statewide Communities Development Authority, (Kaiser Permanente), 5.00%, 3/1/41 | | | 950 | | | | 951,140 | |
California Statewide Communities Development Authority, (Kaiser Permanente), 5.00%, 4/1/42 | | | 3,060 | | | | 3,071,567 | |
Camden County, NJ, Improvement Authority, (Cooper Health System), 5.00%, 2/15/35 | | | 1,045 | | | | 969,196 | |
Henrico County, VA, Economic Development Authority, (Bon Secours Health System, Inc.), 5.00%, 11/1/30 | | | 1,185 | | | | 1,216,734 | |
Highlands County, FL, Health Facilities Authority, (Adventist Health System), 5.25%, 11/15/36 | | | 3,480 | | | | 3,529,799 | |
Idaho Health Facilities Authority, (Trinity Health Credit Group), 6.25%, 12/1/33 | | | 2,985 | | | | 3,381,109 | |
Illinois Finance Authority, (Provena Healthcare), 7.75%, 8/15/34 | | | 7,120 | | | | 8,616,695 | |
Kansas Development Finance Authority, (Adventist Health System), 5.75%, 11/15/38 | | | 5,230 | | | | 5,780,248 | |
Knox County, TN, Health, Educational and Housing Facilities Board, (Covenant Health), 0.00%, 1/1/38 | | | 2,490 | | | | 616,449 | |
Knox County, TN, Health, Educational and Housing Facilities Board, (Covenant Health), 0.00%, 1/1/42 | | | 7,010 | | | | 1,354,332 | |
Massachusetts Development Finance Agency, (Tufts Medical Center), 6.75%, 1/1/36 | | | 785 | | | | 870,903 | |
Massachusetts Health and Educational Facilities Authority, (Lowell General Hospital), 5.00%, 7/1/30 | | | 400 | | | | 398,844 | |
New York Dormitory Authority, (NYU Hospital Center), 5.625%, 7/1/37 | | | 1,865 | | | | 1,909,070 | |
New York Dormitory Authority, (Orange Regional Medical Center), 6.125%, 12/1/29 | | | 2,870 | | | | 2,891,783 | |
New York Dormitory Authority, (Orange Regional Medical Center), 6.25%, 12/1/37 | | | 3,380 | | | | 3,375,437 | |
Oneida County, NY, Industrial Development Agency, (St. Elizabeth Medical Center), 5.75%, 12/1/19 | | | 1,365 | | | | 1,366,665 | |
Orange County, FL, Health Facilities Authority, (Orlando Health, Inc.), 5.375%, 10/1/23 | | | 1,000 | | | | 1,098,590 | |
South Carolina Jobs-Economic Development Authority, (Bon Secours Health System, Inc.), 5.00%, 11/1/28 | | | 1,000 | | | | 1,047,940 | |
Tarrant County Cultural Education Facilities Finance Corp., TX, (Cook Children’s Medical Center), 5.25%, 12/1/39(1) | | | 5,000 | | | | 5,150,600 | |
| | |
| | | | | | $ | 63,142,447 | |
| | |
| | | | | | | | |
| Security | | Principal
Amount
(000’s omitted) | | | Value | |
| | | | | | | | |
|
Housing — 0.0%(4) | |
Texas Student Housing Corp., (University of North Texas), 9.375%, 7/1/06(5) | | $ | 285 | | | $ | 159,517 | |
| | |
| | | | | | $ | 159,517 | |
| | |
|
Industrial Development Revenue — 1.9% | |
Brazos River Harbor Navigation District of Brazoria County, TX, (Dow Chemical Co.), 4.95%, 5/15/33 | | $ | 4,000 | | | $ | 3,965,080 | |
Hardeman County, TN, (Correctional Facilities Corp.), 7.75%, 8/1/17 | | | 440 | | | | 433,941 | |
Selma, AL, Industrial Development Board, (International Paper Co.), 5.80%, 5/1/34 | | | 2,670 | | | | 2,735,816 | |
| | |
| | | | | | $ | 7,134,837 | |
| | |
|
Insured – Education — 0.5% | |
Virginia College Building Authority, (Washington and Lee University), (NPFG), 5.25%, 1/1/31 | | $ | 1,750 | | | $ | 1,975,890 | |
| | |
| | | | | | $ | 1,975,890 | |
| | |
|
Insured – Electric Utilities — 2.0% | |
Long Island Power Authority, NY, Electric System Revenue, (BHAC), 5.75%, 4/1/33 | | $ | 5,415 | | | $ | 6,068,265 | |
Ohio Municipal Electric Generation Agency, (NPFG), 0.00%, 2/15/29 | | | 2,865 | | | | 1,396,258 | |
| | |
| | | | | | $ | 7,464,523 | |
| | |
|
Insured – General Obligations — 0.3% | |
Yuma and La Paz Counties, AZ, Community College District, (Arizona Western College), (NPFG), 3.75%, 7/1/31 | | $ | 985 | | | $ | 935,799 | |
| | |
| | | | | | $ | 935,799 | |
| | |
|
Insured – Hospital — 0.9% | |
Harrisonburg, VA, Industrial Development Authority, (Rockingham Memorial Hospital), (AMBAC), 4.50%, 8/15/36 | | $ | 3,520 | | | $ | 3,417,005 | |
| | |
| | | | | | $ | 3,417,005 | |
| | |
|
Insured – Lease Revenue / Certificates of Participation — 0.9% | |
Anaheim, CA, Public Financing Authority, (Anaheim Public Improvements), (AGM), 0.00%, 9/1/31 | | $ | 8,680 | | | $ | 3,170,544 | |
| | |
| | | | | | $ | 3,170,544 | |
| | |
|
Insured – Other Revenue — 0.8% | |
Harris County-Houston, TX, Sports Authority, (NPFG), 0.00%, 11/15/34 | | $ | 10,600 | | | $ | 2,864,968 | |
| | |
| | | | | | $ | 2,864,968 | |
| | |
| | | | |
| | 12 | | See Notes to Financial Statements. |
Eaton Vance
AMT-Free Municipal Income Fund
September 30, 2013
Portfolio of Investments — continued
| | | | | | | | |
| Security | | Principal
Amount
(000’s omitted) | | | Value | |
| | | | | | | | |
|
Insured – Special Tax Revenue — 6.5% | |
Alabama Public School and College Authority, (AGM), 2.50%, 12/1/27 | | $ | 12,660 | | | $ | 10,721,374 | |
Massachusetts, Special Obligation, Dedicated Tax Revenue, (NPFG), 5.50%, 1/1/27 | | | 6,000 | | | | 6,945,300 | |
Massachusetts, Special Obligation, Dedicated Tax Revenue, (NPFG), 5.50%, 1/1/30 | | | 2,565 | | | | 2,922,125 | |
McKay Landing Metropolitan District No. 2, CO, (AMBAC), 4.25%, 12/1/36 | | | 1,300 | | | | 1,051,973 | |
Puerto Rico Sales Tax Financing Corp., (NPFG), 0.00%, 8/1/45 | | | 6,245 | | | | 790,117 | |
San Jose, CA, Redevelopment Agency, (Merged Area Redevelopment Project), (XLCA), 4.25%, 8/1/36 | | | 1,990 | | | | 1,636,039 | |
| | |
| | | | | | $ | 24,066,928 | |
| | |
|
Insured – Transportation — 5.5% | |
Alameda, CA, Corridor Transportation Authority, (NPFG), 0.00%, 10/1/31 | | $ | 10,000 | | | $ | 3,852,000 | |
Chicago, IL, (O’Hare International Airport), (AGM), 4.75%, 1/1/34 | | | 4,950 | | | | 4,774,820 | |
Chicago, IL, (O’Hare International Airport), (AGM), 5.00%, 1/1/28 | | | 1,000 | | | | 1,016,220 | |
Chicago, IL, (O’Hare International Airport), (AGM), 5.125%, 1/1/31 | | | 1,000 | | | | 1,007,620 | |
Chicago, IL, (O’Hare International Airport), (AGM), 5.25%, 1/1/32 | | | 785 | | | | 795,268 | |
E-470 Public Highway Authority, CO, (NPFG), 0.00%, 9/1/39 | | | 7,120 | | | | 1,529,091 | |
New Orleans, LA, Aviation Board, (AGC), 6.00%, 1/1/23 | | | 1,040 | | | | 1,185,101 | |
Texas Turnpike Authority, (Central Texas Turnpike System), (AMBAC), 0.00%, 8/15/21 | | | 6,845 | | | | 4,976,520 | |
Texas Turnpike Authority, (Central Texas Turnpike System), (AMBAC), 0.00%, 8/15/32 | | | 3,755 | | | | 1,220,337 | |
| | |
| | | | | | $ | 20,356,977 | |
| | |
|
Insured – Water and Sewer — 2.5% | |
Chicago, IL, Wastewater Transmission Revenue, (BHAC), 5.50%, 1/1/38 | | $ | 4,305 | | | $ | 4,642,211 | |
Detroit, MI, Sewage Disposal System, (AGM), 5.00%, 7/1/39 | | | 4,825 | | | | 4,359,339 | |
| | |
| | | | | | $ | 9,001,550 | |
| | |
|
Lease Revenue / Certificates of Participation — 1.2% | |
New Jersey Health Care Facilities Financing Authority, (Hospital Asset Transformation Program), 5.75%, 10/1/31 | | $ | 3,970 | | | $ | 4,429,925 | |
| | |
| | | | | | $ | 4,429,925 | |
| | |
|
Other Revenue — 5.4% | |
Brooklyn Arena Local Development Corp., NY, (Barclays Center), 6.00%, 7/15/30 | | $ | 1,175 | | | $ | 1,246,111 | |
| | | | | | | | |
| Security | | Principal
Amount
(000’s omitted) | | | Value | |
| | | | | | | | |
|
Other Revenue (continued) | |
Brooklyn Arena Local Development Corp., NY, (Barclays Center), 6.25%, 7/15/40 | | $ | 1,320 | | | $ | 1,384,786 | |
Brooklyn Arena Local Development Corp., NY, (Barclays Center), 6.375%, 7/15/43 | | | 720 | | | | 760,097 | |
Central Falls, RI, Detention Facility Corp., 7.25%, 7/15/35 | | | 1,210 | | | | 915,220 | |
Mohegan Tribe of Indians Gaming Authority, CT, (Public Improvements), 6.25%, 1/1/21(3) | | | 1,000 | | | | 1,000,430 | |
New York, NY, Transitional Finance Authority, (Building Aid), 6.00%, 7/15/38 | | | 7,250 | | | | 8,194,022 | |
Otero County, NM, Jail Project Revenue, 5.75%, 4/1/18 | | | 545 | | | | 506,659 | |
Salt Verde Financial Corp., AZ, Senior Gas Revenue, 5.00%, 12/1/37 | | | 2,735 | | | | 2,699,472 | |
Seminole Tribe, FL, 5.50%, 10/1/24(3) | | | 1,150 | | | | 1,206,500 | |
White Earth Band of Chippewa Indians, MN, 6.375%, 12/1/26(3) | | | 2,290 | | | | 1,810,382 | |
| | |
| | | | | | $ | 19,723,679 | |
| | |
|
Senior Living / Life Care — 2.4% | |
Fairfax County, VA, Economic Development Authority, (Goodwin House, Inc.), 5.125%, 10/1/37 | | $ | 1,595 | | | $ | 1,601,284 | |
Fairfax County, VA, Economic Development Authority, (Goodwin House, Inc.), 5.125%, 10/1/42 | | | 2,255 | | | | 2,261,472 | |
Kansas City, MO, Industrial Development Authority, (Kingswood United Methodist Manor), 5.875%, 11/15/29 | | | 1,480 | | | | 1,330,328 | |
Maryland Health and Higher Educational Facilities Authority, (Charlestown Community, Inc.), 6.125%, 1/1/30 | | | 1,650 | | | | 1,752,333 | |
North Miami, FL, (Imperial Club), 6.125%, 1/1/42(6) | | | 1,480 | | | | 902,830 | |
Tempe, AZ, Industrial Development Authority, (Friendship Village of Tempe), 6.00%, 12/1/32 | | | 160 | | | | 158,725 | |
Tempe, AZ, Industrial Development Authority, (Friendship Village of Tempe), 6.25%, 12/1/42 | | | 660 | | | | 658,607 | |
| | |
| | | | | | $ | 8,665,579 | |
| | |
|
Special Tax Revenue — 8.9% | |
Baltimore, MD, (Clipper Mill), 6.25%, 9/1/33 | | $ | 2,476 | | | $ | 2,525,891 | |
Baltimore, MD, (Strathdale Manor), 7.00%, 7/1/33 | | | 744 | | | | 753,412 | |
Bridgeville, DE, (Heritage Shores Special Development District), 5.45%, 7/1/35 | | | 1,233 | | | | 951,814 | |
Massachusetts Bay Transportation Authority, 5.25%, 7/1/34 | | | 4,040 | | | | 4,393,904 | |
Massachusetts Bay Transportation Authority, 5.25%, 7/1/34(1) | | | 9,000 | | | | 10,118,970 | |
Metropolitan Transportation Authority, NY, Dedicated Tax Revenue, 0.00%, 11/15/30 | | | 2,730 | | | | 1,259,212 | |
Metropolitan Transportation Authority, NY, Dedicated Tax Revenue, 0.00%, 11/15/32 | | | 2,235 | | | | 928,531 | |
New York, NY, Transitional Finance Authority, Future Tax Revenue, 5.25%, 2/1/30 | | | 4,655 | | | | 5,158,764 | |
Puerto Rico Sales Tax Financing Corp., 5.00%, 8/1/40 | | | 945 | | | | 799,716 | |
Puerto Rico Sales Tax Financing Corp., 5.25%, 8/1/57 | | | 5,065 | | | | 4,180,499 | |
| | | | |
| | 13 | | See Notes to Financial Statements. |
Eaton Vance
AMT-Free Municipal Income Fund
September 30, 2013
Portfolio of Investments — continued
| | | | | | | | |
| Security | | Principal
Amount
(000’s omitted) | | | Value | |
| | | | | | | | |
|
Special Tax Revenue (continued) | |
River Hall, FL, Community Development District, (Capital Improvements), 5.45%, 5/1/36 | | $ | 1,155 | | | $ | 951,316 | |
Tiverton, RI, (Villages on Mount Hope Bay), 6.875%, 5/1/22 | | | 735 | | | | 743,820 | |
| | |
| | | | | | $ | 32,765,849 | |
| | |
|
Transportation — 15.8% | |
Central Texas Regional Mobility Authority, 5.75%, 1/1/31 | | $ | 415 | | | $ | 419,121 | |
Dallas and Fort Worth, TX, (Dallas/Fort Worth International Airport), 5.25%, 11/1/30 | | | 1,100 | | | | 1,174,536 | |
Dallas and Fort Worth, TX, (Dallas/Fort Worth International Airport), 5.25%, 11/1/31 | | | 1,455 | | | | 1,543,842 | |
Grand Parkway Transportation Corp., TX, 5.125%, 10/1/43 | | | 1,100 | | | | 1,080,970 | |
Metropolitan Transportation Authority, NY, 5.25%, 11/15/30 | | | 105 | | | | 114,012 | |
Metropolitan Transportation Authority, NY, 6.25%, 11/15/23 | | | 2,250 | | | | 2,642,490 | |
Metropolitan Transportation Authority, NY, 6.50%, 11/15/28 | | | 5,000 | | | | 5,856,500 | |
New Jersey Transportation Trust Fund Authority, (Transportation System), 6.00%, 12/15/38 | | | 4,820 | | | | 5,421,150 | |
New Jersey Turnpike Authority, 5.00%, 1/1/30 | | | 3,060 | | | | 3,232,951 | |
New York Liberty Development Corp., (4 World Trade Center), 5.00%, 11/15/31 | | | 1,235 | | | | 1,274,878 | |
Pennsylvania Turnpike Commission, 5.25%, 6/1/39 | | | 1,070 | | | | 1,082,466 | |
Pennsylvania Turnpike Commission, 6.375%, (0.00% until 12/1/17), 12/1/38 | | | 11,500 | | | | 10,062,270 | |
Port Authority of New York and New Jersey, 5.00%, 11/15/37(1) | | | 3,000 | | | | 3,075,480 | |
Port Authority of New York and New Jersey, 5.25%, 7/15/36 | | | 2,750 | | | | 2,942,060 | |
Texas Private Activity Bond Surface Transportation Corp., (LBJ Express Managed Lanes Project), 7.00%, 6/30/34 | | | 3,500 | | | | 3,904,985 | |
Texas Private Activity Bond Surface Transportation Corp., (North Tarrant Express Managed Lanes Project), 6.875%, 12/31/39 | | | 2,980 | | | | 3,249,750 | |
Triborough Bridge and Tunnel Authority, NY, 0.00%, 11/15/30 | | | 830 | | | | 369,051 | |
Triborough Bridge and Tunnel Authority, NY, 5.25%, 11/15/34(1) | | | 10,000 | | | | 10,745,600 | |
| | |
| | | | | | $ | 58,192,112 | |
| | |
|
Water and Sewer — 2.1% | |
New York, NY, Municipal Water Finance Authority, (Water and Sewer System), 5.75%, 6/15/40(1) (2) | | $ | 6,855 | | | $ | 7,612,203 | |
| | |
| | | | | | $ | 7,612,203 | |
| | |
| |
Total Tax-Exempt Investments — 112.1%
(identified cost $392,502,551) | | | $ | 412,392,673 | |
| | |
| |
Other Assets, Less Liabilities — (12.1)% | | | $ | (44,617,146 | ) |
| | |
| |
Net Assets — 100.0% | | | $ | 367,775,527 | |
| | |
The percentage shown for each investment category in the Portfolio of Investments is based on net assets.
| | | | |
| AGC | | – | | Assured Guaranty Corp. |
| AGM | | – | | Assured Guaranty Municipal Corp. |
| AMBAC | | – | | AMBAC Financial Group, Inc. |
| BHAC | | – | | Berkshire Hathaway Assurance Corp. |
| NPFG | | – | | National Public Finance Guaranty Corp. |
| XLCA | | – | | XL Capital Assurance, Inc. |
At September 30, 2013, the concentration of the Fund’s investments in the various states, determined as a percentage of net assets, is as follows:
| | | | |
| New York | | | 21.7% | |
| California | | | 18.4% | |
| Massachusetts | | | 10.8% | |
| Texas | | | 10.8% | |
| Others, representing less than 10% individually | | | 50.4% | |
The Fund invests primarily in debt securities issued by municipalities. The ability of the issuers of the debt securities to meet their obligations may be affected by economic developments in a specific industry or municipality. In order to reduce the risk associated with such economic developments, at September 30, 2013, 17.8% of total investments are backed by bond insurance of various financial institutions and financial guaranty assurance agencies. The aggregate percentage insured by an individual financial institution or financial guaranty assurance agency ranged from 0.3% to 6.3% of total investments.
| (1) | Security represents the municipal bond held by a trust that issues residual interest bonds (see Note 1I). |
| (2) | Security (or a portion thereof) has been pledged as collateral for residual interest bond transactions. The aggregate value of such collateral is $5,441,831. |
| (3) | Security exempt from registration pursuant to Rule 144A under the Securities Act of 1933. These securities may be sold in certain transactions (normally to qualified institutional buyers) and remain exempt from registration. At September 30, 2013, the aggregate value of these securities is $4,766,606 or 1.3% of the Fund’s net assets. |
| (4) | Amount is less than 0.05%. |
| (5) | Defaulted matured security. |
| (6) | Security is in default and making only partial interest payments. |
| | | | |
| | 14 | | See Notes to Financial Statements. |
Eaton Vance
National Municipal Income Fund
September 30, 2013
Portfolio of Investments
| | | | | | | | |
| Tax-Exempt Municipal Securities — 114.5% | |
| | |
| | | | | | | | |
| Security | | Principal
Amount
(000’s omitted) | | | Value | |
| | | | | | | | |
|
Bond Bank — 1.2% | |
Oklahoma Water Resources Board, 5.25%, 4/1/36 | | $ | 14,165 | | | $ | 15,465,914 | |
Rickenbacker Port Authority, OH, (OASBO Expanded Asset Pooled Financing Program), 5.375%, 1/1/32 | | | 31,410 | | | | 30,658,044 | |
| | | | | | | | | |
| | | | | | $ | 46,123,958 | |
| | | | | | | | | |
|
Cogeneration — 0.4% | |
Northampton County, PA, Industrial Development Authority, (Northampton Generating), 5.00%, 12/31/23(1) | | $ | 16,282 | | | $ | 13,668,167 | |
| | | | | | | | | |
| | | | | | $ | 13,668,167 | |
| | | | | | | | | |
|
Education — 5.8% | |
California Educational Facilities Authority, (Stanford University), 5.00%, 6/1/43 | | $ | 575 | | | $ | 663,872 | |
California Educational Facilities Authority, (Stanford University), 5.00%, 6/1/43(2)(3) | | | 50,000 | | | | 57,728,000 | |
Massachusetts Health and Educational Facilities Authority, (Massachusetts Institute of Technology), 5.50%, 7/1/36 | | | 4,750 | | | | 5,253,310 | |
Missouri Health and Educational Facilities Authority, (Washington University), 5.375%, 3/15/39(2) | | | 45,615 | | | | 50,203,869 | |
North Carolina State University at Raleigh, 5.00%, 10/1/37 | | | 8,620 | | | | 9,236,761 | |
Oregon Facilities Authority, (Lewis & Clark College), 5.625%, 10/1/36 | | | 14,470 | | | | 15,634,546 | |
Oregon Facilities Authority, (Reed College), 5.125%, 7/1/41 | | | 8,485 | | | | 8,938,608 | |
Rutgers State University, NJ, 5.00%, 5/1/43 | | | 175 | | | | 182,299 | |
Rutgers State University, NJ, 5.00%, 5/1/43(2)(3) | | | 37,000 | | | | 38,543,270 | |
University of California, 5.00%, 5/15/38(4) | | | 20,000 | | | | 21,125,200 | |
University of Illinois, 4.00%, 4/1/31 | | | 16,525 | | | | 15,474,340 | |
| | | | | | | | | |
| | | | | | $ | 222,984,075 | |
| | | | | | | | | |
|
Electric Utilities — 4.8% | |
Apache County, AZ, Industrial Development Authority, (Tucson Electric Power Co.), 4.50%, 3/1/30 | | $ | 11,050 | | | $ | 10,318,159 | |
Hawaii Department of Budget and Finance, (Hawaiian Electric Co.), 6.50%, 7/1/39 | | | 8,600 | | | | 9,340,030 | |
Omaha Public Power District, NE, 5.00%, 2/1/37 | | | 4,310 | | | | 4,531,577 | |
Puerto Rico Electric Power Authority, 5.25%, 7/1/40 | | | 30,025 | | | | 20,891,395 | |
Puerto Rico Electric Power Authority, 6.75%, 7/1/36 | | | 38,755 | | | | 31,936,445 | |
San Antonio, TX, (Electric and Gas Systems), 5.00%, 2/1/34(2) | | | 41,100 | | | | 43,427,082 | |
Vernon, CA, Electric System Revenue, 5.125%, 8/1/21 | | | 51,375 | | | | 55,381,736 | |
Wyandotte County & Kansas City, KS, Board of Public Utilities, 5.00%, 9/1/32 | | | 10,000 | | | | 10,445,900 | |
| | | | | | | | | |
| | | | | | $ | 186,272,324 | |
| | | | | | | | | |
| | | | | | | | |
| Security | | Principal
Amount
(000’s omitted) | | | Value | |
| | | | | | | | |
|
Escrowed / Prerefunded — 0.1% | |
Bexar County, TX, Health Facilities Development Corp., (St. Luke’s Lutheran Hospital), Escrowed to Maturity, 7.00%, 5/1/21 | | $ | 2,400 | | | $ | 3,070,944 | |
| | | | | | | | | |
| | | | | | $ | 3,070,944 | |
| | | | | | | | | |
|
General Obligations — 9.0% | |
California, 5.00%, 2/1/31 | | $ | 17,595 | | | $ | 18,713,866 | |
Conroe, TX, Independent School District, (PSF Guaranteed), 5.25%, 2/15/33 | | | 10,000 | | | | 10,912,400 | |
David Douglas School District No. 40, Multnomah County, OR, 0.00%, 6/15/25 | | | 500 | | | | 312,725 | |
David Douglas School District No. 40, Multnomah County, OR, 0.00%, 6/15/26 | | | 2,590 | | | | 1,520,304 | |
David Douglas School District No. 40, Multnomah County, OR, 0.00%, 6/15/27 | | | 2,650 | | | | 1,462,641 | |
David Douglas School District No. 40, Multnomah County, OR, 0.00%, 6/15/28 | | | 2,500 | | | | 1,279,625 | |
David Douglas School District No. 40, Multnomah County, OR, 0.00%, 6/15/29 | | | 2,590 | | | | 1,225,743 | |
David Douglas School District No. 40, Multnomah County, OR, 0.00%, 6/15/30 | | | 2,000 | | | | 880,640 | |
Forest Grove School District No. 15, Washington County, OR, 0.00%, 6/15/28 | | | 3,050 | | | | 1,570,964 | |
Forest Grove School District No. 15, Washington County, OR, 0.00%, 6/15/29 | | | 3,440 | | | | 1,637,062 | |
Forest Grove School District No. 15, Washington County, OR, 0.00%, 6/15/30 | | | 4,110 | | | | 1,823,566 | |
Illinois, 5.25%, 7/1/30 | | | 16,830 | | | | 16,854,067 | |
Illinois, 5.25%, 7/1/31 | | | 5,315 | | | | 5,308,463 | |
Illinois, 5.50%, 7/1/33 | | | 10,235 | | | | 10,403,980 | |
Klein, TX, Independent School District, (PSF Guaranteed), 5.00%, 2/1/36 | | | 14,180 | | | | 15,045,264 | |
Louisiana, 4.00%, 8/1/30 | | | 14,905 | | | | 14,948,374 | |
Louisiana, 4.00%, 8/1/31 | | | 4,895 | | | | 4,898,426 | |
Newton, MA, 5.00%, 4/1/36 | | | 5,275 | | | | 5,531,365 | |
Newton, MA, 5.00%, 4/1/39 | | | 11,480 | | | | 11,936,215 | |
North East Independent School District, TX, (PSF Guaranteed), 5.25%, 2/1/31 | | | 12,275 | | | | 14,356,717 | |
Port of Houston Authority of Harris County, TX, (AMT), 5.625%, 10/1/38 | | | 10,000 | | | | 10,655,500 | |
Port of Houston Authority of Harris County, TX, (AMT), 5.625%, 10/1/38(2) | | | 41,620 | | | | 44,348,191 | |
Salem-Keizer, OR, School District No. 24J, 0.00%, 6/15/24 | | | 7,945 | | | | 5,527,813 | |
Salem-Keizer, OR, School District No. 24J, 0.00%, 6/15/25 | | | 11,945 | | | | 7,712,289 | |
Salem-Keizer, OR, School District No. 24J, 0.00%, 6/15/26 | | | 11,485 | | | | 6,962,666 | |
Santa Clara County, CA, (Election of 2008), 3.375%, 8/1/37 | | | 19,955 | | | | 15,748,885 | |
| | | | |
| | 15 | | See Notes to Financial Statements. |
Eaton Vance
National Municipal Income Fund
September 30, 2013
Portfolio of Investments — continued
| | | | | | | | |
| Security | | Principal
Amount
(000’s omitted) | | | Value | |
| | | | | | | | |
|
General Obligations (continued) | |
Santa Clara County, CA, (Election of 2008), 5.00%, 8/1/39(2)(3) | | $ | 57,400 | | | $ | 60,938,136 | |
Texas, (AMT), 5.00%, 8/1/31 | | | 8,000 | | | | 8,445,040 | |
Texas, (AMT), 5.00%, 8/1/36 | | | 9,465 | | | | 9,862,909 | |
Washington, 5.00%, 2/1/33 | | | 21,255 | | | | 22,621,484 | |
Will County, IL, Community Unit School District No. 365-U, (Valley View), 5.75%, 11/1/31 | | | 12,995 | | | | 14,382,216 | |
| | | | | | | | | |
| | | | | | $ | 347,827,536 | |
| | | | | | | | | |
|
Health Care-Miscellaneous — 0.0%(5) | |
Tax Exempt Securities Trust, Community Health Provider, (Pooled Loan Program Various States Trust Certificates), 5.50%, 12/1/36(6) | | $ | 497 | | | $ | 496,901 | |
Tax Exempt Securities Trust, Community Health Provider, (Pooled Loan Program Various States Trust Certificates), 5.875%, 12/1/36(6) | | | 533 | | | | 533,168 | |
| | | | | | | | | |
| | | | | | $ | 1,030,069 | |
| | | | | | | | | |
|
Hospital — 16.2% | |
California Health Facilities Financing Authority, (Catholic Healthcare West), 5.25%, 3/1/28 | | $ | 5,700 | | | $ | 6,005,520 | |
California Health Facilities Financing Authority, (Providence Health System), 5.50%, 10/1/39(2) (3) | | | 36,700 | | | | 40,037,131 | |
California Health Facilities Financing Authority, (St. Joseph Health System), 5.00%, 7/1/33 | | | 17,530 | | | | 18,005,414 | |
California Health Facilities Financing Authority, (St. Joseph Health System), 5.00%, 7/1/37 | | | 26,385 | | | | 26,687,636 | |
California Health Facilities Financing Authority, (Sutter Health), 5.00%, 8/15/52 | | | 60,000 | | | | 58,688,400 | |
California Health Facilities Financing Authority, (Sutter Health), 5.25%, 8/15/31 | | | 13,675 | | | | 14,487,568 | |
California Statewide Communities Development Authority, (John Muir Health), 5.00%, 7/1/29 | | | 10,670 | | | | 10,939,738 | |
California Statewide Communities Development Authority, (John Muir Health), 5.125%, 7/1/39 | | | 18,930 | | | | 19,087,876 | |
California Statewide Communities Development Authority, (Kaiser Permanente), 5.00%, 3/1/41 | | | 18,315 | | | | 18,336,978 | |
California Statewide Communities Development Authority, (Kaiser Permanente), 5.00%, 4/1/42 | | | 42,035 | | | | 42,193,892 | |
Illinois Finance Authority, (Provena Healthcare), 7.75%, 8/15/34 | | | 53,260 | | | | 64,455,784 | |
Massachusetts Development Finance Agency, (Tufts Medical Center), 6.75%, 1/1/36 | | | 7,510 | | | | 8,331,819 | |
Massachusetts Health and Educational Facilities Authority, (Lowell General Hospital), 5.00%, 7/1/30 | | | 4,060 | | | | 4,048,267 | |
Michigan Hospital Finance Authority, (Henry Ford Health System), 5.25%, 11/15/46 | | | 16,520 | | | | 15,923,628 | |
| | | | | | | | |
| Security | | Principal
Amount
(000’s omitted) | | | Value | |
| | | | | | | | |
|
Hospital (continued) | |
New York Dormitory Authority, (NYU Hospital Center), 5.625%, 7/1/37 | | $ | 12,795 | | | $ | 13,097,346 | |
Orange County, FL, Health Facilities Authority, (Orlando Health, Inc.), 5.375%, 10/1/41 | | | 39,000 | | | | 39,717,990 | |
South Carolina Jobs-Economic Development Authority, (Bon Secours Health System, Inc.), 5.00%, 11/1/28 | | | 9,000 | | | | 9,431,460 | |
South Miami, FL, Health Facilities Authority, (Baptist Health South Florida Obligated Group), 5.00%, 8/15/37(2) | | | 63,000 | | | | 63,260,190 | |
South Miami, FL, Health Facilities Authority, (Baptist Health South Florida Obligated Group), 5.00%, 8/15/42(2) | | | 64,500 | | | | 64,541,280 | |
Tarrant County Cultural Education Facilities Finance Corp., TX, (Ascension Health Senior Credit Group), 5.00%, 11/15/29 | | | 4,500 | | | | 4,726,395 | |
Tarrant County Cultural Education Facilities Finance Corp., TX, (Cook Children’s Medical Center), 5.25%, 12/1/39 | | | 8,700 | | | | 8,962,044 | |
Tarrant County Cultural Education Facilities Finance Corp., TX, (Scott & White Healthcare), 5.25%, 8/15/40 | | | 17,685 | | | | 18,077,784 | |
Washington Township Health Care District, 6.25%, 7/1/39 | | | 16,675 | | | | 17,760,042 | |
West Virginia Hospital Finance Authority, (West Virginia United Health System Obligated Group), 5.375%, 6/1/38(4) | | | 21,895 | | | | 22,407,124 | |
Wisconsin Health and Educational Facilities Authority, (Wheaton Franciscan Healthcare System), 5.125%, 8/15/30 | | | 8,475 | | | | 8,483,475 | |
Wisconsin Health and Educational Facilities Authority, (Wheaton Franciscan Healthcare System), 5.25%, 8/15/31 | | | 8,165 | | | | 8,191,455 | |
| | | | | | | | | |
| | | $ | 625,886,236 | |
| | | | | | | | | |
|
Housing — 1.3% | |
Arkansas Development Finance Authority, MFMR, (Park Apartments), (AMT), 5.95%, 12/1/28 | | $ | 5,810 | | | $ | 4,799,990 | |
Texas Student Housing Corp., (University of Northern Texas), 6.85%, 7/1/31 | | | 10,640 | | | | 7,642,818 | |
Virginia Housing Development Authority, Series A, (AMT), 5.10%, 10/1/35 | | | 18,345 | | | | 18,511,756 | |
Virginia Housing Development Authority, Series A1, (AMT), 5.10%, 10/1/35 | | | 18,750 | | | | 18,920,438 | |
| | | | | | | | | |
| | | | | | $ | 49,875,002 | |
| | | | | | | | | |
|
Industrial Development Revenue — 4.4% | |
Austin, TX, (CargoPort Development LLC), (AMT), 8.30%, 10/1/21 | | $ | 5,205 | | | $ | 4,821,756 | |
Denver City and County, CO, (United Airlines), (AMT), 5.25%, 10/1/32 | | | 12,360 | | | | 11,123,258 | |
Denver City and County, CO, (United Airlines), (AMT), 5.75%, 10/1/32 | | | 33,290 | | | | 31,809,594 | |
| | | | |
| | 16 | | See Notes to Financial Statements. |
Eaton Vance
National Municipal Income Fund
September 30, 2013
Portfolio of Investments — continued
| | | | | | | | |
| Security | | Principal
Amount
(000’s omitted) | | | Value | |
| | | | | | | | |
|
Industrial Development Revenue (continued) | |
Hardeman County, TN, (Correctional Facilities Corp.), 7.75%, 8/1/17 | | $ | 2,900 | | | $ | 2,860,067 | |
Houston, TX, (Continental Airlines), (AMT), 6.75%, 7/1/29 | | | 29,750 | | | | 29,825,565 | |
Mississippi Business Finance Corp., (Air Cargo), (AMT), 7.25%, 7/1/34 | | | 175 | | | | 84,315 | |
New Jersey Economic Development Authority, (New Jersey-American Water Co., Inc.), (AMT), 5.70%, 10/1/39 | | | 28,150 | | | | 29,743,009 | |
New York Liberty Development Corp., (Goldman Sachs Group, Inc.), 5.50%, 10/1/37(7) | | | 47,890 | | | | 52,276,245 | |
Phenix City, AL, Industrial Development Board, (MeadWestvaco Coated Board), (AMT), 4.125%, 5/15/35 | | | 11,350 | | | | 8,580,600 | |
| | | | | | | | | |
| | | | | | $ | 171,124,409 | |
| | | | | | | | | |
|
Insured – Electric Utilities — 1.2% | |
Long Island Power Authority, NY, Electric System Revenue, (BHAC), 5.50%, 5/1/33 | | $ | 36,660 | | | $ | 40,394,921 | |
Puerto Rico Electric Power Authority, (NPFG), 5.25%, 7/1/30 | | | 8,385 | | | | 6,621,467 | |
| | | | | | | | | |
| | | | | | $ | 47,016,388 | |
| | | | | | | | | |
|
Insured – General Obligations — 2.9% | |
Geary County, KS, Unified School District No. 475, (NPFG), 3.00%, 9/1/26 | | $ | 2,140 | | | $ | 1,945,239 | |
Illinois, (AGM), 4.00%, 4/1/31 | | | 14,850 | | | | 12,803,076 | |
Illinois, (AGM), 4.125%, 4/1/33 | | | 14,350 | | | | 12,378,454 | |
Illinois, (AGM), 5.00%, 4/1/26 | | | 16,250 | | | | 16,815,825 | |
Illinois, (AGM), 5.00%, 4/1/27 | | | 15,000 | | | | 15,287,100 | |
Los Angeles, CA, Unified School District, (Election of 2005), (AGM), 4.75%, 7/1/32(2) | | | 51,625 | | | | 52,080,332 | |
| | | | | | | | | |
| | | | | | $ | 111,310,026 | |
| | | | | | | | | |
|
Insured – Hospital — 1.3% | |
Maryland Health and Higher Educational Facilities Authority, (LifeBridge Health), (AGC), 4.75%, 7/1/47 | | $ | 8,255 | | | $ | 8,044,332 | |
Maryland Health and Higher Educational Facilities Authority, (LifeBridge Health), (AGC), 4.75%, 7/1/47(2) | | | 28,800 | | | | 28,065,024 | |
Medford, OR, Hospital Facilities Authority, (Asante Health System), (AGM), 5.50%, 8/15/28 | | | 12,000 | | | | 13,030,680 | |
| | | | | | | | | |
| | | | | | $ | 49,140,036 | |
| | | | | | | | | |
|
Insured – Housing — 0.3% | |
Rhode Island Housing and Mortgage Finance Corp., (Rental Housing Program), (AGM), (AMT), 5.50%, 10/1/49 | | $ | 10,310 | | | $ | 10,277,833 | |
| | | | | | | | | |
| | | $ | 10,277,833 | |
| | | | | | | | | |
| | | | | | | | |
| Security | | Principal
Amount
(000’s omitted) | | | Value | |
| | | | | | | | |
|
Insured – Other Revenue — 3.6% | |
Golden State Tobacco Securitization Corp., CA, (AGM), 0.00%, 6/1/26 | | $ | 40,700 | | | $ | 23,668,271 | |
Golden State Tobacco Securitization Corp., CA, (AMBAC), 0.00%, 6/1/24 | | | 24,985 | | | | 16,402,902 | |
Harris County-Houston, TX, Sports Authority, (NPFG), 0.00%, 11/15/34 | | | 68,155 | | | | 18,420,933 | |
Harris County-Houston, TX, Sports Authority, (NPFG), 0.00%, 11/15/41 | | | 25,000 | | | | 3,864,250 | |
New York, NY, Industrial Development Agency, (Queens Baseball Stadium), (AGC), 6.375%, 1/1/39 | | | 11,725 | | | | 12,757,973 | |
New York, NY, Industrial Development Agency, (Queens Baseball Stadium), (AGC), 6.50%, 1/1/46 | | | 6,085 | | | | 6,630,338 | |
New York, NY, Industrial Development Agency, (Yankee Stadium), (AGC), 7.00%, 3/1/49 | | | 50,000 | | | | 58,252,000 | |
| | | | | | | | | |
| | | | | | $ | 139,996,667 | |
| | | | | | | | | |
|
Insured – Special Tax Revenue — 6.5% | |
Illinois Sports Facility Authority, (AMBAC), 0.00%, 6/15/23 | | $ | 20,805 | | | $ | 13,441,486 | |
Illinois Sports Facility Authority, (AMBAC), 0.00%, 6/15/24 | | | 31,010 | | | | 18,804,154 | |
Illinois Sports Facility Authority, (AMBAC), 0.00%, 6/15/25 | | | 17,000 | | | | 9,642,910 | |
Massachusetts, Special Obligation, Dedicated Tax Revenue, (NPFG), 5.50%, 1/1/29 | | | 11,000 | | | | 12,584,440 | |
Massachusetts, Special Obligation, Dedicated Tax Revenue, (NPFG), 5.50%, 1/1/30 | | | 3,080 | | | | 3,508,828 | |
Metropolitan Pier and Exposition Authority, IL, (McCormick Place Expansion), (NPFG), 0.00%, 12/15/24 | | | 14,715 | | | | 8,783,972 | |
Miami-Dade County, FL, Professional Sports Franchise Facilities, (AGC), 0.00%, 10/1/35 | | | 84,310 | | | | 24,342,826 | |
Miami-Dade County, FL, Professional Sports Franchise Facilities, (AGC), 0.00%, 10/1/44 | | | 218,400 | | | | 34,784,568 | |
Miami-Dade County, FL, Professional Sports Franchise Facilities, (AGC), 0.00%, 10/1/45 | | | 156,345 | | | | 23,395,466 | |
Miami-Dade County, FL, Professional Sports Franchise Facilities, (AGC), 0.00%, 10/1/48 | | | 60,720 | | | | 7,518,958 | |
Miami-Dade County, FL, Professional Sports Franchise Facilities, (AGC), 0.00%, 4/1/49 | | | 50,000 | | | | 6,004,500 | |
Puerto Rico Sales Tax Financing Corp., (AMBAC), 0.00%, 8/1/54 | | | 807,785 | | | | 55,438,284 | |
Puerto Rico Sales Tax Financing Corp., (NPFG), 0.00%, 8/1/45 | | | 175,940 | | | | 22,259,929 | |
San Jose, CA, Redevelopment Agency, (Merged Area Redevelopment Project), (XLCA), 4.25%, 8/1/36 | | | 13,690 | | | | 11,254,960 | |
| | | | | | | | | |
| | | | | | $ | 251,765,281 | |
| | | | | | | | | |
|
Insured – Student Loan — 2.1% | |
Massachusetts Educational Financing Authority, (AGC), (AMT), 6.35%, 1/1/30 | | $ | 41,855 | | | $ | 44,221,063 | |
| | | | |
| | 17 | | See Notes to Financial Statements. |
Eaton Vance
National Municipal Income Fund
September 30, 2013
Portfolio of Investments — continued
| | | | | | | | |
| Security | | Principal
Amount
(000’s omitted) | | | Value | |
| | | | | | | | |
|
Insured – Student Loan (continued) | |
Massachusetts Educational Financing Authority, (AMBAC), (AMT), 4.70%, 1/1/33 | | $ | 40,980 | | | $ | 37,312,700 | |
| | | | | | | | | |
| | | | | | $ | 81,533,763 | |
| | | | | | | | | |
|
Insured – Transportation — 7.6% | |
E-470 Public Highway Authority, CO, (NPFG), 0.00%, 9/1/37 | | $ | 13,335 | | | $ | 3,272,676 | |
E-470 Public Highway Authority, CO, (NPFG), 0.00%, 9/1/38 | | | 22,385 | | | | 5,130,642 | |
Miami-Dade County, FL, (Miami International Airport), (AGM), (AMT), 5.25%, 10/1/41 | | | 46,680 | | | | 47,006,293 | |
North Texas Tollway Authority, (AGC), 0.00%, 1/1/33 | | | 104,265 | | | | 37,447,817 | |
North Texas Tollway Authority, (AGC), 6.20%, (0.00% until 1/1/15), 1/1/42 | | | 58,690 | | | | 61,484,231 | |
San Jose, CA, Airport, (AGM), (AMBAC), (BHAC), (AMT), 5.00%, 3/1/37 | | | 29,245 | | | | 29,508,790 | |
San Jose, CA, Airport, (AGM), (AMBAC), (BHAC), (AMT), 6.00%, 3/1/47 | | | 21,420 | | | | 23,150,308 | |
Texas Turnpike Authority, (Central Texas Turnpike System), (AMBAC), 0.00%, 8/15/22 | | | 46,300 | | | | 31,806,248 | |
Texas Turnpike Authority, (Central Texas Turnpike System), (AMBAC), 0.00%, 8/15/32 | | | 31,045 | | | | 10,089,315 | |
Texas Turnpike Authority, (Central Texas Turnpike System), (AMBAC), 0.00%, 8/15/34 | | | 119,480 | | | | 34,354,084 | |
Texas Turnpike Authority, (Central Texas Turnpike System), (AMBAC), 0.00%, 8/15/35 | | | 30,935 | | | | 8,361,730 | |
| | | | | | | | | |
| | | | | | $ | 291,612,134 | |
| | | | | | | | | |
|
Insured – Water and Sewer — 0.5% | |
Detroit, MI, Sewage Disposal System, (AGM), 7.50%, 7/1/33 | | $ | 3,380 | | | $ | 3,629,917 | |
Detroit, MI, Water Supply System, (NPFG), 5.00%, 7/1/27 | | | 18,290 | | | | 17,414,092 | |
| | | | | | | | | |
| | | | | | $ | 21,044,009 | |
| | | | | | | | | |
|
Lease Revenue / Certificates of Participation — 3.3% | |
Hudson Yards Infrastructure Corp., NY, 5.75%, 2/15/47 | | $ | 38,385 | | | $ | 40,684,645 | |
Mohave County, AZ, Industrial Development Authority, (Mohave Prison LLC), 8.00%, 5/1/25 | | | 38,660 | | | | 45,755,270 | |
North Carolina, Capital Improvement Limited Obligation Bonds, 5.25%, 5/1/31 | | | 36,925 | | | | 40,520,387 | |
| | | | | | | | | |
| | | | | | $ | 126,960,302 | |
| | | | | | | | | |
|
Nursing Home — 0.3% | |
Mississippi Business Finance Corp., (Magnolia Healthcare), 7.99%, 7/1/25 | | $ | 9,325 | | | $ | 8,635,043 | |
| | | | | | | | |
| Security | | Principal
Amount
(000’s omitted) | | | Value | |
| | | | | | | | |
|
Nursing Home (continued) | |
Westmoreland County, PA, Industrial Development Authority, (Highland Health Systems, Inc.), 9.25%, 6/1/22 | | $ | 1,540 | | | $ | 1,394,655 | |
| | | | | | | | | |
| | | $ | 10,029,698 | |
| | | | | | | | | |
|
Other Revenue — 5.5% | |
Brooklyn Arena Local Development Corp., NY, (Barclays Center), 6.00%, 7/15/30 | | $ | 12,735 | | | $ | 13,505,722 | |
Brooklyn Arena Local Development Corp., NY, (Barclays Center), 6.25%, 7/15/40 | | | 16,295 | | | | 17,094,759 | |
Brooklyn Arena Local Development Corp., NY, (Barclays Center), 6.375%, 7/15/43 | | | 7,785 | | | | 8,218,547 | |
Central Falls, RI, Detention Facility Corp., 7.25%, 7/15/35 | | | 250 | | | | 189,095 | |
New York, NY, Industrial Development Agency, (Bronx Parking Development Co., LLC), 5.875%, 10/1/46(8) | | | 12,330 | | | | 5,177,367 | |
New York, NY, Transitional Finance Authority, (Building Aid), 5.00%, 7/15/36 | | | 20,155 | | | | 20,890,254 | |
Non-Profit Preferred Funding Trust, Various States, 4.47%, 9/15/37(6) | | | 12,000 | | | | 9,510,360 | |
Non-Profit Preferred Funding Trust, Various States, 4.72%, 9/15/37(6) | | | 19,000 | | | | 14,644,060 | |
Salt Verde Financial Corp., AZ, Senior Gas Revenue, 5.00%, 12/1/37 | | | 12,765 | | | | 12,599,183 | |
Seminole Tribe, FL, 5.25%, 10/1/27(6) | | | 1,000 | | | | 1,034,150 | |
Seminole Tribe, FL, 5.50%, 10/1/24(6) | | | 11,915 | | | | 12,500,384 | |
Seminole Tribe, FL, 5.75%, 10/1/22(6) | | | 2,100 | | | | 2,228,709 | |
Texas Municipal Gas Acquisition and Supply Corp. I, Gas Supply Revenue, 6.25%, 12/15/26 | | | 68,720 | | | | 79,782,545 | |
Texas Municipal Gas Acquisition and Supply Corp. III, Gas Supply Revenue, 5.00%, 12/15/29 | | | 11,190 | | | | 10,947,065 | |
Texas Municipal Gas Acquisition and Supply Corp. III, Gas Supply Revenue, 5.00%, 12/15/30 | | | 4,845 | | | | 4,692,673 | |
| | | | | | | | | |
| | | | | | $ | 213,014,873 | |
| | | | | | | | | |
|
Senior Living / Life Care — 0.3% | |
Logan County, CO, (TLC Care Choices, Inc.), 6.875%, 12/1/23(9) | | $ | 410 | | | $ | 100,889 | |
North Miami, FL, (Imperial Club), 6.125%, 1/1/42(9) | | | 16,435 | | | | 10,025,678 | |
Plantation Health Facilities Authority, FL, (Covenant Village of Florida), 5.125%, 12/1/22 | | | 1,750 | | | | 1,750,560 | |
| | | | | | | | | |
| | | | | | $ | 11,877,127 | |
| | | | | | | | | |
|
Special Tax Revenue — 4.8% | |
Connecticut, Special Tax Obligation, (Transportation Infrastructure), 5.00%, 1/1/29 | | $ | 11,380 | | | $ | 12,520,276 | |
Dupree Lakes, FL, Community Development District,
5.375%, 5/1/37 | | | 890 | | | | 732,061 | |
| | | | |
| | 18 | | See Notes to Financial Statements. |
Eaton Vance
National Municipal Income Fund
September 30, 2013
Portfolio of Investments — continued
| | | | | | | | |
| Security | | Principal
Amount
(000’s omitted) | | | Value | |
| | | | | | | | |
|
Special Tax Revenue (continued) | |
Dupree Lakes, FL, Community Development District, 6.83%, 11/1/15 | | $ | 175 | | | $ | 173,371 | |
Heritage Harbor South Community Development District, FL, (Capital Improvements), 6.20%, 5/1/35 | | | 555 | | | | 567,077 | |
Massachusetts Bay Transportation Authority, 5.25%, 7/1/34 | | | 29,055 | | | | 31,600,218 | |
Metropolitan Transportation Authority, NY, Dedicated Tax Revenue, 0.00%, 11/15/30 | | | 30,040 | | | | 13,855,950 | |
Metropolitan Transportation Authority, NY, Dedicated Tax Revenue, 0.00%, 11/15/32 | | | 74,070 | | | | 30,772,381 | |
New River, FL, Community Development District, (Capital Improvements), 5.00%, 5/1/13(8) | | | 230 | | | | 0 | |
New River, FL, Community Development District, (Capital Improvements), 5.35%, 5/1/38(8) | | | 80 | | | | 0 | |
New River, FL, Community Development District, (Capital Improvements), Series 2010A-1, 5.75%, 5/1/38 | | | 165 | | | | 130,936 | |
New River, FL, Community Development District, (Capital Improvements), Series 2010A-2, 5.75%, (0.00% to 11/1/14), 5/1/38 | | | 430 | | | | 183,267 | |
New River, FL, Community Development District, (Capital Improvements), Series 2010B-1, 5.00%, 5/1/15 | | | 255 | | | | 246,164 | |
New River, FL, Community Development District, (Capital Improvements), Series 2010B-2, 5.00%, (0.00% to 11/1/13), 5/1/18 | | | 335 | | | | 158,904 | |
New York Dormitory Authority, Personal Income Tax Revenue, 5.00%, 2/15/35 | | | 10,210 | | | | 10,820,864 | |
New York, NY, Transitional Finance Authority, Future Tax Revenue, 5.00%, 2/1/35 | | | 2,310 | | | | 2,431,460 | |
New York, NY, Transitional Finance Authority, Future Tax Revenue, 5.00%, 5/1/42 | | | 1,945 | | | | 2,033,848 | |
New York, NY, Transitional Finance Authority, Future Tax Revenue, 5.25%, 2/1/30 | | | 25,200 | | | | 27,927,144 | |
Puerto Rico Sales Tax Financing Corp., 0.00%, 8/1/56 | | | 520,415 | | | | 31,240,512 | |
Puerto Rico Sales Tax Financing Corp., 5.00%, 8/1/40 | | | 19,880 | | | | 16,823,649 | |
River Hall, FL, Community Development District, (Capital Improvements), 5.45%, 5/1/36 | | | 1,075 | | | | 885,424 | |
Southern Hills Plantation I, FL, Community Development District, Series A1, 5.80%, 5/1/35 | | | 545 | | | | 465,702 | |
Southern Hills Plantation I, FL, Community Development District, Series A2, 5.80%, 5/1/35 | | | 395 | | | | 232,616 | |
Sterling Hill, FL, Community Development District, 6.20%, 5/1/35 | | | 1,665 | | | | 1,254,727 | |
Tiverton, RI, (Villages on Mount Hope Bay), 6.875%, 5/1/22 | | | 370 | | | | 374,440 | |
| | | | | | | | | |
| | | | | | $ | 185,430,991 | |
| | | | | | | | | |
| | | | | | | | |
| Security | | Principal
Amount
(000’s omitted) | | | Value | |
| | | | | | | | |
|
Student Loan — 0.8% | |
Iowa Student Loan Liquidity Corp., 5.25%, 12/1/22 | | $ | 14,800 | | | $ | 15,640,196 | |
Iowa Student Loan Liquidity Corp., 5.50%, 12/1/27 | | | 5,625 | | | | 5,717,081 | |
New Jersey Higher Education Student Assistance Authority, (AMT), 5.00%, 12/1/27 | | | 7,785 | | | | 8,092,430 | |
| | | | | | | | | |
| | | | | | $ | 29,449,707 | |
| | | | | | | | | |
|
Transportation — 26.0% | |
Central Texas Regional Mobility Authority, 5.75%, 1/1/31 | | $ | 4,260 | | | $ | 4,302,302 | |
Charleston County Airport District, SC, (AMT), 5.50%, 7/1/38 | | | 10,000 | | | | 10,311,300 | |
Dallas and Fort Worth, TX, (Dallas/Fort Worth International Airport), (AMT), 5.00%, 11/1/32 | | | 880 | | | | 884,611 | |
Dallas and Fort Worth, TX, (Dallas/Fort Worth International Airport), (AMT), 5.00%, 11/1/42 | | | 21,000 | | | | 19,980,450 | |
Dallas and Fort Worth, TX, (Dallas/Fort Worth International Airport), (AMT), 5.00%, 11/1/45 | | | 37,350 | | | | 35,408,547 | |
Dallas and Fort Worth, TX, (Dallas/Fort Worth International Airport), (AMT), 2012 Series D, 5.00%, 11/1/38 | | | 10,230 | | | | 9,861,311 | |
Dallas and Fort Worth, TX, (Dallas/Fort Worth International Airport), (AMT), 2013 Series A, 5.00%, 11/1/38 | | | 6,460 | | | | 6,227,182 | |
Dallas and Fort Worth, TX, (Dallas/Fort Worth International Airport), 5.25%, 11/1/30 | | | 6,660 | | | | 7,111,282 | |
Dallas and Fort Worth, TX, (Dallas/Fort Worth International Airport), 5.25%, 11/1/31 | | | 10,395 | | | | 11,029,719 | |
Grand Parkway Transportation Corp., TX, 5.25%, 10/1/51(2) | | | 38,780 | | | | 38,989,800 | |
Grand Parkway Transportation Corp., TX, 5.25%, 10/1/51(2) | | | 46,140 | | | | 46,389,617 | |
Illinois Toll Highway Authority, 5.25%, 1/1/29 | | | 13,160 | | | | 13,978,947 | |
Illinois Toll Highway Authority, 5.25%, 1/1/30(2)(3) | | | 18,180 | | | | 19,198,444 | |
Los Angeles, CA, Department of Airports, (Los Angeles International Airport), 5.00%, 5/15/35(2)(3) | | | 7,200 | | | | 7,500,168 | |
Metropolitan Transportation Authority, NY, 5.25%, 11/15/30 | | | 1,170 | | | | 1,270,421 | |
Metropolitan Transportation Authority, NY, 5.25%, 11/15/38 | | | 14,565 | | | | 15,110,022 | |
Metropolitan Transportation Authority, NY, 6.25%, 11/15/23 | | | 19,475 | | | | 22,872,219 | |
Miami-Dade County, FL, (Miami International Airport), 5.00%, 10/1/41 | | | 10,765 | | | | 10,828,191 | |
Miami-Dade County, FL, (Miami International Airport), 5.50%, 10/1/36 | | | 47,090 | | | | 49,517,960 | |
New Jersey Transportation Trust Fund Authority, (Transportation Program), 5.50%, 6/15/39 | | | 10,000 | | | | 10,681,500 | |
New Jersey Transportation Trust Fund Authority, (Transportation System), 2008 Series A, 0.00%, 12/15/36 | | | 91,425 | | | | 24,919,712 | |
New Jersey Transportation Trust Fund Authority, (Transportation System), 2008 Series A, 0.00%, 12/15/38 | | | 50,000 | | | | 11,831,000 | |
New Jersey Transportation Trust Fund Authority, (Transportation System), 2008 Series A, 5.875%, 12/15/38 | | | 55,250 | | | | 61,618,115 | |
| | | | |
| | 19 | | See Notes to Financial Statements. |
Eaton Vance
National Municipal Income Fund
September 30, 2013
Portfolio of Investments — continued
| | | | | | | | |
| Security | | Principal
Amount
(000’s omitted) | | | Value | |
| | | | | | | | |
|
Transportation (continued) | |
New Jersey Transportation Trust Fund Authority, (Transportation System), 2009 Series A, 0.00%, 12/15/38 | | $ | 108,655 | | | $ | 25,709,946 | |
New Jersey Turnpike Authority, 5.00%, 1/1/31 | | | 17,000 | | | | 17,884,680 | |
New York Liberty Development Corp., (One World Trade Center), 5.00%, 12/15/41 | | | 11,405 | | | | 11,728,902 | |
New York Liberty Development Corp., (4 World Trade Center), 5.00%, 11/15/31 | | | 15,845 | | | | 16,356,635 | |
North Texas Tollway Authority, 5.75%, 1/1/38 | | | 66,265 | | | | 69,747,888 | |
Orlando-Orange County, FL, Expressway Authority, Series A, 5.00%, 7/1/35 | | | 15,000 | | | | 15,274,050 | |
Pennsylvania Turnpike Commission, 5.25%, 6/1/39 | | | 9,305 | | | | 9,413,403 | |
Pennsylvania Turnpike Commission, 5.35%, (0.00% until 12/1/15), 12/1/30 | | | 13,010 | | | | 12,041,275 | |
Pennsylvania Turnpike Commission, 5.45%, (0.00% until 12/1/15), 12/1/35 | | | 12,125 | | | | 11,004,650 | |
Pennsylvania Turnpike Commission, 6.00%, (0.00% until 12/1/15), 12/1/34 | | | 25,000 | | | | 23,345,500 | |
Pennsylvania Turnpike Commission, 6.50%, 12/1/36 | | | 10,000 | | | | 11,311,300 | |
Philadelphia, PA, Airport Revenue, (AMT), 5.00%, 6/15/26 | | | 4,830 | | | | 5,016,535 | |
Philadelphia, PA, Airport Revenue, (AMT), 5.00%, 6/15/27 | | | 11,865 | | | | 12,193,305 | |
Port Authority of New York and New Jersey, 5.25%, 7/15/36 | | | 10,310 | | | | 11,030,050 | |
Port Authority of New York and New Jersey, (AMT), 4.00%, 7/15/32 | | | 10,590 | | | | 9,833,662 | |
Port Authority of New York and New Jersey, (AMT), 4.00%, 7/15/34 | | | 15,175 | | | | 13,699,535 | |
Port Authority of New York and New Jersey, (AMT), 4.00%, 7/15/36 | | | 12,650 | | | | 11,208,027 | |
Port Authority of New York and New Jersey, (AMT), 4.50%, 4/1/37 | | | 18,625 | | | | 17,944,443 | |
Port Authority of New York and New Jersey, (AMT), 4.75%, 4/15/37 | | | 11,905 | | | | 11,939,405 | |
Port Authority of New York and New Jersey, (AMT), 4.75%, 4/15/37(2) | | | 80,490 | | | | 80,722,616 | |
Port Authority of New York and New Jersey, (AMT), 5.00%, 10/15/36 | | | 22,725 | | | | 23,130,868 | |
Port Authority of New York and New Jersey, (AMT), 5.25%, 9/15/23(2) | | | 28,890 | | | | 31,945,406 | |
Texas Private Activity Bond Surface Transportation Corp., (LBJ Express Managed Lanes Project), 7.00%, 6/30/34 | | | 29,200 | | | | 32,578,732 | |
Texas Private Activity Bond Surface Transportation Corp., (North Tarrant Express Managed Lanes Project), 6.875%, 12/31/39 | | | 24,110 | | | | 26,292,437 | |
Texas Transportation Commission, (Central Texas Turnpike System), 5.00%, 8/15/41 | | | 5,850 | | | | 5,729,022 | |
Triborough Bridge and Tunnel Authority, NY, 0.00%, 11/15/30 | | | 9,135 | | | | 4,061,786 | |
| | | | | | | | |
| Security | | Principal
Amount
(000’s omitted) | | | Value | |
| | | | | | | | |
|
Transportation (continued) | |
Triborough Bridge and Tunnel Authority, NY, 5.25%, 11/15/34(2) | | $ | 38,980 | | | $ | 41,886,349 | |
| | | | | | | | | |
| | | $ | 1,002,853,227 | |
| | | | | | | | | |
|
Water and Sewer — 4.3% | |
Detroit, MI, Sewage Disposal System, 5.00%, 7/1/32 | | $ | 20,295 | | | $ | 18,387,270 | |
Detroit, MI, Sewage Disposal System, 5.25%, 7/1/39 | | | 21,500 | | | | 19,474,915 | |
Detroit, MI, Water Supply System, 5.00%, 7/1/41 | | | 1,950 | | | | 1,699,659 | |
Detroit, MI, Water Supply System, 5.25%, 7/1/41 | | | 46,605 | | | | 42,194,769 | |
Metropolitan Water District of Southern California, 5.00%, 7/1/37(2) | | | 34,800 | | | | 36,938,460 | |
New York, NY, Municipal Water Finance Authority, (Water and Sewer System),
5.75%, 6/15/40(2)(3) | | | 42,030 | | | | 46,672,634 | |
| | | | | | | | | |
| | | | | | $ | 165,367,707 | |
| | | | | | | | | |
| |
Total Tax-Exempt Municipal Securities — 114.5%
(identified cost $4,345,727,650) | | | $ | 4,416,542,489 | |
| | | | | | | | | |
|
| Taxable Municipal Securities — 0.6% | |
| | |
| | | | | | | | |
| Security | | Principal
Amount
(000’s omitted) | | | Value | |
|
Cogeneration — 0.0%(5) | |
Northampton County, PA, Industrial Development Authority, (Northampton Generating), 5.00%, 12/31/23(1) | | $ | 210 | | | $ | 0 | |
| | | | | | | | | |
| | | | | | $ | 0 | |
| | | | | | | | | |
|
Electric Utilities — 0.2% | |
Municipal Electric Authority of Georgia, 6.637%, 4/1/57(10) | | $ | 5,765 | | | $ | 5,996,061 | |
| | | | | | | | | |
| | | | | | $ | 5,996,061 | |
| | | | | | | | | |
|
Insured-Special Tax Revenue — 0.4% | |
Colony Local Development Corp., TX, Sales Tax Revenue, (BHAC), 4.881%, 10/1/47 | | $ | 17,420 | | | $ | 16,019,260 | |
| | | | | | | | | |
| | | | | | $ | 16,019,260 | |
| | | | | | | | | |
| |
Total Taxable Municipal Securities — 0.6%
(identified cost $24,727,231) | | | $ | 22,015,321 | |
| | | | | | | | | |
| |
Total Investments — 115.1%
(identified cost $4,370,454,881) | | | $ | 4,438,557,810 | |
| | | | | | | | | |
| |
Other Assets, Less Liabilities — (15.1)% | | | $ | (581,803,589 | ) |
| | | | | | | | | |
| |
Net Assets — 100.0% | | | $ | 3,856,754,221 | |
| | | | | | | | | |
| | | | |
| | 20 | | See Notes to Financial Statements. |
Eaton Vance
National Municipal Income Fund
September 30, 2013
Portfolio of Investments — continued
The percentage shown for each investment category in the Portfolio of Investments is based on net assets.
| | | | |
| AGC | | – | | Assured Guaranty Corp. |
| AGM | | – | | Assured Guaranty Municipal Corp. |
| AMBAC | | – | | AMBAC Financial Group, Inc. |
| AMT | | – | | Interest earned from these securities may be considered a tax preference item for purposes of the Federal Alternative Minimum Tax. |
| BHAC | | – | | Berkshire Hathaway Assurance Corp. |
| MFMR | | – | | Multi-Family Mortgage Revenue |
| NPFG | | – | | National Public Finance Guaranty Corp. |
| PSF | | – | | Permanent School Fund |
| XLCA | | – | | XL Capital Assurance, Inc. |
At September 30, 2013, the concentration of the Fund’s investments in the various states, determined as a percentage of net assets, is as follows:
| | | | |
| Texas | | | 22.5% | |
| New York | | | 19.4% | |
| California | | | 18.2% | |
| Florida | | | 10.9% | |
| Others, representing less than 10% individually | | | 44.1% | |
The Fund invests primarily in debt securities issued by municipalities. The ability of the issuers of the debt securities to meet their obligations may be affected by economic developments in a specific industry or municipality. In order to reduce the risk associated with such economic developments, at September 30, 2013, 23.0% of total investments are backed by bond insurance of various financial institutions and financial guaranty assurance agencies. The aggregate percentage insured by an individual financial institution or financial guaranty assurance agency ranged from 0.3 to 8.0% of total investments.
| | (1) | Represents a payment-in-kind security which may pay all or a portion of interest in additional par. |
| | (2) | Security represents the municipal bond held by a trust that issues residual interest bonds (see Note 1I). |
| | (3) | Security (or a portion thereof) has been pledged as collateral for residual interest bond transactions. The aggregate value of such collateral is $85,887,782. |
| | (4) | When-issued security. |
| | (5) | Amount is less than 0.05%. |
| | (6) | Security exempt from registration pursuant to Rule 144A under the Securities Act of 1933. These securities may be sold in certain transactions (normally to qualified institutional buyers) and remain exempt from registration. At September 30, 2013, the aggregate value of these securities is $40,947,732 or 1.1% of the Fund’s net assets. |
| | (7) | Security (or a portion thereof) has been segregated to cover payable for when-issued securities. |
| | (8) | Defaulted security. Issuer has defaulted on the payment of interest or has filed for bankruptcy. |
| | (9) | Security is in default and making only partial interest payments. |
| (10) | Build America Bond. Represents taxable municipal obligation issued pursuant to the America Recovery and Reinvestment Act of 2009 or other legislation providing for the issuance of taxable municipal debt on which the issuer receives federal support. |
| | | | |
| | 21 | | See Notes to Financial Statements. |
Eaton Vance
Municipal Income Funds
September 30, 2013
Statements of Assets and Liabilities
| | | | | | | | |
| | | September 30, 2013 | |
| Assets | | AMT-Free Fund | | | National Fund | |
Investments — | | | | | | | | |
Identified cost | | $ | 392,502,551 | | | $ | 4,370,454,881 | |
Unrealized appreciation | | | 19,890,122 | | | | 68,102,929 | |
Investments, at value | | $ | 412,392,673 | | | $ | 4,438,557,810 | |
Cash | | $ | 4,521,606 | | | $ | 34,066,802 | |
Restricted cash* | | | 1,000,000 | | | | 3,000,000 | |
Interest receivable | | | 5,059,464 | | | | 54,758,809 | |
Receivable for investments sold | | | 880,665 | | | | 10,661,023 | |
Receivable for Fund shares sold | | | 128,625 | | | | 14,297,772 | |
Total assets | | $ | 423,983,033 | | | $ | 4,555,342,216 | |
| Liabilities | | | | | | | | |
Payable for floating rate notes issued | | $ | 53,595,000 | | | $ | 617,025,000 | |
Payable for investments purchased | | | 804,481 | | | | 9,253,121 | |
Payable for when-issued securities | | | — | | | | 42,420,716 | |
Payable for variation margin on open financial futures contracts | | | 3,859 | | | | 581,783 | |
Payable for Fund shares redeemed | | | 1,101,147 | | | | 22,583,754 | |
Distributions payable | | | 249,262 | | | | 2,778,799 | |
Payable to affiliates: | | | | | | | | |
Investment adviser fee | | | 140,211 | | | | 1,136,842 | |
Distribution and service fees | | | 81,732 | | | | 1,033,677 | |
Interest expense and fees payable | | | 87,021 | | | | 1,067,736 | |
Accrued expenses | | | 144,793 | | | | 706,567 | |
Total liabilities | | $ | 56,207,506 | | | $ | 698,587,995 | |
Net Assets | | $ | 367,775,527 | | | $ | 3,856,754,221 | |
| Sources of Net Assets | | | | | | | | |
Paid-in capital | | $ | 485,940,766 | | | $ | 5,080,589,916 | |
Accumulated net realized loss | | | (138,491,623 | ) | | | (1,300,647,850 | ) |
Accumulated undistributed net investment income | | | 1,538,635 | | | | 10,956,902 | |
Net unrealized appreciation | | | 18,787,749 | | | | 65,855,253 | |
Net Assets | | $ | 367,775,527 | | | $ | 3,856,754,221 | |
| Class A Shares | | | | | | | | |
Net Assets | | $ | 224,506,027 | | | $ | 2,134,502,408 | |
Shares Outstanding | | | 25,887,694 | | | | 232,652,071 | |
Net Asset Value and Redemption Price Per Share | | | | | | | | |
(net assets ÷ shares of beneficial interest outstanding) | | $ | 8.67 | | | $ | 9.17 | |
Maximum Offering Price Per Share | | | | | | | | |
(100 ÷ 95.25 of net asset value per share) | | $ | 9.10 | | | $ | 9.63 | |
| Class B Shares | | | | | | | | |
Net Assets | | $ | 2,893,250 | | | $ | 59,244,265 | |
Shares Outstanding | | | 335,816 | | | | 6,458,026 | |
Net Asset Value and Offering Price Per Share** | | | | | | | | |
(net assets ÷ shares of beneficial interest outstanding) | | $ | 8.62 | | | $ | 9.17 | |
| Class C Shares | | | | | | | | |
Net Assets | | $ | 40,823,216 | | | $ | 681,071,660 | |
Shares Outstanding | | | 4,733,630 | | | | 74,234,987 | |
Net Asset Value and Offering Price Per Share** | | | | | | | | |
(net assets ÷ shares of beneficial interest outstanding) | | $ | 8.62 | | | $ | 9.17 | |
| Class I Shares | | | | | | | | |
Net Assets | | $ | 99,553,034 | | | $ | 981,935,888 | |
Shares Outstanding | | | 10,509,452 | | | | 107,003,602 | |
Net Asset Value, Offering Price and Redemption Price Per Share | | | | | | | | |
(net assets ÷ shares of beneficial interest outstanding) | | $ | 9.47 | | | $ | 9.18 | |
On sales of $50,000 or more, the offering price of Class A shares is reduced.
| * | Represents restricted cash on deposit at the broker for open financial futures contracts. |
| ** | Redemption price per share is equal to the net asset value less any applicable contingent deferred sales charge. |
| | | | |
| | 22 | | See Notes to Financial Statements. |
Eaton Vance
Municipal Income Funds
September 30, 2013
Statements of Operations
| | | | | | | | |
| | | Year Ended September 30, 2013 | |
| Investment Income | | AMT-Free Fund | | | National Fund | |
Interest | | $ | 23,096,883 | | | $ | 262,088,785 | |
Total investment income | | $ | 23,096,883 | | | $ | 262,088,785 | |
| | |
| Expenses | | | | | | | | |
Investment adviser fee | | $ | 2,005,847 | | | $ | 15,975,462 | |
Distribution and service fees | | | | | | | | |
Class A | | | 685,478 | | | | 6,713,598 | |
Class B | | | 40,967 | | | | 849,293 | |
Class C | | | 496,793 | | | | 8,951,076 | |
Trustees’ fees and expenses | | | 17,800 | | | | 68,000 | |
Custodian fee | | | 182,074 | | | | 695,657 | |
Transfer and dividend disbursing agent fees | | | 149,449 | | | | 2,055,595 | |
Legal and accounting services | | | 86,732 | | | | 173,921 | |
Printing and postage | | | 26,585 | | | | 261,235 | |
Registration fees | | | 88,700 | | | | 187,028 | |
Interest expense and fees | | | 467,735 | | | | 5,449,459 | |
Miscellaneous | | | 46,954 | | | | 310,119 | |
Total expenses | | $ | 4,295,114 | | | $ | 41,690,443 | |
Deduct — | | | | | | | | |
Reduction of custodian fee | | $ | 2,780 | | | $ | 20,566 | |
Total expense reductions | | $ | 2,780 | | | $ | 20,566 | |
| | |
Net expenses | | $ | 4,292,334 | | | $ | 41,669,877 | |
| | |
Net investment income | | $ | 18,804,549 | | | $ | 220,418,908 | |
| | |
| Realized and Unrealized Gain (Loss) | | | | | | | | |
Net realized gain (loss) — | | | | | | | | |
Investment transactions | | $ | (1,277,963 | ) | | $ | (82,674,512 | ) |
Financial futures contracts | | | 3,962,473 | | | | 27,068,787 | |
Net realized gain (loss) | | $ | 2,684,510 | | | $ | (55,605,725 | ) |
Change in unrealized appreciation (depreciation) — | | | | | | | | |
Investments | | $ | (45,679,301 | ) | | $ | (426,198,996 | ) |
Financial futures contracts | | | (921,984 | ) | | | (6,266,614 | ) |
Net change in unrealized appreciation (depreciation) | | $ | (46,601,285 | ) | | $ | (432,465,610 | ) |
| | |
Net realized and unrealized loss | | $ | (43,916,775 | ) | | $ | (488,071,335 | ) |
| | |
Net decrease in net assets from operations | | $ | (25,112,226 | ) | | $ | (267,652,427 | ) |
| | | | |
| | 23 | | See Notes to Financial Statements. |
Eaton Vance
Municipal Income Funds
September 30, 2013
Statements of Changes in Net Assets
| | | | | | | | | | | | |
| | | AMT-Free Fund | |
| Increase (Decrease) in Net Assets | | Year Ended September 30, 2013 | | | Nine Months Ended
September 30, 2012 | | | Year Ended December 31, 2011 | |
From operations — | | | | | | | | | | | | |
Net investment income | | $ | 18,804,549 | | | $ | 14,998,386 | | | $ | 23,753,368 | |
Net realized gain (loss) from investment transactions, financial futures contracts and swap contracts | | | 2,684,510 | | | | (3,074,263 | ) | | | (32,534,446 | ) |
Net change in unrealized appreciation (depreciation) from investments, financial futures contracts and swap contracts | | | (46,601,285 | ) | | | 41,371,974 | | | | 57,135,517 | |
Net increase (decrease) in net assets from operations | | $ | (25,112,226 | ) | | $ | 53,296,097 | | | $ | 48,354,439 | |
Distributions to shareholders — | | | | | | | | | | | | |
From net investment income | | | | | | | | | | | | |
Class A | | $ | (11,586,838 | ) | | $ | (9,761,483 | ) | | $ | (15,483,695 | ) |
Class B | | | (141,200 | ) | | | (159,199 | ) | | | (442,545 | ) |
Class C | | | (1,727,840 | ) | | | (1,230,918 | ) | | | (1,854,364 | ) |
Class I | | | (5,196,706 | ) | | | (3,784,410 | ) | | | (5,281,700 | ) |
Total distributions to shareholders | | $ | (18,652,584 | ) | | $ | (14,936,010 | ) | | $ | (23,062,304 | ) |
Transactions in shares of beneficial interest — | | | | | | | | | | | | |
Proceeds from sale of shares | | | | | | | | | | | | |
Class A | | $ | 32,542,930 | | | $ | 33,880,654 | | | $ | 55,633,479 | |
Class B | | | 110,033 | | | | 336,450 | | | | 461,154 | |
Class C | | | 7,723,182 | | | | 6,047,372 | | | | 5,655,512 | |
Class I | | | 35,873,736 | | | | 28,626,835 | | | | 22,704,897 | |
Net asset value of shares issued to shareholders in payment of distributions declared | | | | | | | | | | | | |
Class A | | | 10,065,653 | | | | 8,299,346 | | | | 11,657,848 | |
Class B | | | 105,774 | | | | 113,410 | | | | 276,699 | |
Class C | | | 1,241,793 | | | | 848,908 | | | | 1,193,795 | |
Class I | | | 3,618,600 | | | | 2,657,036 | | | | 3,252,773 | |
Cost of shares redeemed | | | | | | | | | | | | |
Class A | | | (86,368,611 | ) | | | (75,808,231 | ) | | | (135,424,615 | ) |
Class B | | | (869,626 | ) | | | (873,347 | ) | | | (2,297,151 | ) |
Class C | | | (13,190,948 | ) | | | (4,514,089 | ) | | | (15,750,550 | ) |
Class I | | | (53,834,097 | ) | | | (16,414,791 | ) | | | (59,257,421 | ) |
Net asset value of shares exchanged | | | | | | | | | | | | |
Class A | | | 1,330,566 | | | | 2,669,709 | | | | 4,269,162 | |
Class B | | | (1,330,566 | ) | | | (2,669,709 | ) | | | (4,269,162 | ) |
Net decrease in net assets from Fund share transactions | | $ | (62,981,581 | ) | | $ | (16,800,447 | ) | | $ | (111,893,580 | ) |
| | | |
Net increase (decrease) in net assets | | $ | (106,746,391 | ) | | $ | 21,559,640 | | | $ | (86,601,445 | ) |
| | | |
| Net Assets | | | | | | | | | | | | |
At beginning of period | | $ | 474,521,918 | | | $ | 452,962,278 | | | $ | 539,563,723 | |
At end of period | | $ | 367,775,527 | | | $ | 474,521,918 | | | $ | 452,962,278 | |
| | | |
Accumulated undistributed net investment income
included in net assets | | | | | | | | | | | | |
At end of period | | $ | 1,538,635 | | | $ | 1,465,933 | | | $ | 1,465,250 | |
| | | | |
| | 24 | | See Notes to Financial Statements. |
Eaton Vance
Municipal Income Funds
September 30, 2013
Statements of Changes in Net Assets — continued
| | | | | | | | |
| | | National Fund | |
| | | Year Ended September 30, | |
| Increase (Decrease) in Net Assets | | 2013 | | | 2012 | |
From operations — | | | | | | | | |
Net investment income | | $ | 220,418,908 | | | $ | 230,725,889 | |
Net realized loss from investment transactions and financial futures contracts | | | (55,605,725 | ) | | | (68,259,402 | ) |
Net change in unrealized appreciation (depreciation) from investments and financial futures contracts | | | (432,465,610 | ) | | | 483,770,584 | |
Net increase (decrease) in net assets from operations | | $ | (267,652,427 | ) | | $ | 646,237,071 | |
Distributions to shareholders — | | | | | | | | |
From net investment income | | | | | | | | |
Class A | | $ | (124,978,397 | ) | | $ | (142,373,836 | ) |
Class B | | | (3,299,435 | ) | | | (4,767,756 | ) |
Class C | | | (34,910,941 | ) | | | (39,387,478 | ) |
Class I | | | (56,609,744 | ) | | | (45,196,462 | ) |
Total distributions to shareholders | | $ | (219,798,517 | ) | | $ | (231,725,532 | ) |
Transactions in shares of beneficial interest — | | | | | | | | |
Proceeds from sale of shares | | | | | | | | |
Class A | | $ | 319,130,862 | | | $ | 317,496,688 | |
Class B | | | 1,005,784 | | | | 1,973,451 | |
Class C | | | 72,182,129 | | | | 107,685,560 | |
Class I | | | 508,215,956 | | | | 538,748,264 | |
Net asset value of shares issued to shareholders in payment of distributions declared | | | | | | | | |
Class A | | | 102,663,228 | | | | 110,453,071 | |
Class B | | | 2,639,049 | | | | 3,612,439 | |
Class C | | | 25,495,575 | | | | 26,941,458 | |
Class I | | | 48,089,138 | | | | 36,133,409 | |
Cost of shares redeemed | | | | | | | | |
Class A | | | (1,013,790,449 | ) | | | (587,169,042 | ) |
Class B | | | (24,043,341 | ) | | | (19,698,921 | ) |
Class C | | | (306,962,890 | ) | | | (167,582,529 | ) |
Class I | | | (592,809,672 | ) | | | (305,377,746 | ) |
Net asset value of shares exchanged | | | | | | | | |
Class A | | | 16,194,292 | | | | 14,370,975 | |
Class B | | | (16,194,292 | ) | | | (14,370,975 | ) |
Net increase (decrease) in net assets from Fund share transactions | | $ | (858,184,631 | ) | | $ | 63,216,102 | |
| | |
Net increase (decrease) in net assets | | $ | (1,345,635,575 | ) | | $ | 477,727,641 | |
| | |
| Net Assets | | | | | | | | |
At beginning of year | | $ | 5,202,389,796 | | | $ | 4,724,662,155 | |
At end of year | | $ | 3,856,754,221 | | | $ | 5,202,389,796 | |
| | |
Accumulated undistributed net investment income
included in net assets | | | | | | | | |
At end of year | | $ | 10,956,902 | | | $ | 9,561,591 | |
| | | | |
| | 25 | | See Notes to Financial Statements. |
Eaton Vance
Municipal Income Funds
September 30, 2013
Statements of Cash Flows
| | | | | | | | |
| | | Year Ended September 30, 2013 | |
| Cash Flows From Operating Activities | | AMT-Free Fund | | | National Fund | |
Net decrease in net assets from operations | | $ | (25,112,226 | ) | | $ | (267,652,427 | ) |
Adjustments to reconcile net decrease in net assets from operations to net cash provided by operating activities: | | | | | | | | |
Investments purchased | | | (155,394,286 | ) | | | (4,117,388,841 | ) |
Investments sold | | | 227,163,492 | | | | 5,102,115,644 | |
Net amortization/accretion of premium (discount) | | | (2,540,251 | ) | | | (32,058,222 | ) |
Decrease in restricted cash | | | — | | | | 31,150,000 | |
Decrease in interest receivable | | | 967,708 | | | | 15,957,948 | |
Decrease in receivable for variation margin on open financial futures contracts | | | 27,828 | | | | 1,375,001 | |
Increase in payable for variation margin on open financial futures contracts | | | 3,859 | | | | 581,783 | |
Decrease in payable to affiliate for investment adviser fee | | | (33,293 | ) | | | (230,369 | ) |
Decrease in payable to affiliate for distribution and service fees | | | (22,978 | ) | | | (455,860 | ) |
Decrease in interest expense and fees payable | | | (39,576 | ) | | | (563,183 | ) |
Decrease in accrued expenses | | | (7,650 | ) | | | (25,895 | ) |
Net change in unrealized (appreciation) depreciation from investments | | | 45,679,301 | | | | 426,198,996 | |
Net realized loss from investments | | | 1,277,963 | | | | 82,674,512 | |
Net cash provided by operating activities | | $ | 91,969,891 | | | $ | 1,241,679,087 | |
| | |
| Cash Flows From Financing Activities | | | | | | | | |
Proceeds from Fund shares sold | | $ | 76,494,693 | | | $ | 900,544,852 | |
Fund shares redeemed | | | (153,939,349 | ) | | | (1,930,154,520 | ) |
Distributions paid, net of reinvestments | | | (3,696,790 | ) | | | (42,166,895 | ) |
Proceeds from secured borrowings | | | 7,750,000 | | | | 236,060,000 | |
Repayment of secured borrowings | | | (20,505,000 | ) | | | (352,748,000 | ) |
Decrease in demand note payable | | | — | | | | (19,200,000 | ) |
Net cash used in financing activities | | $ | (93,896,446 | ) | | $ | (1,207,664,563 | ) |
| | |
Net increase (decrease) in cash | | $ | (1,926,555 | ) | | $ | 34,014,524 | |
| | |
Cash at beginning of period | | $ | 6,448,161 | | | $ | 52,278 | |
| | |
Cash at end of period | | $ | 4,521,606 | | | $ | 34,066,802 | |
| | |
| Supplemental disclosure of cash flow information: | | | | | | | | |
Noncash financing activities not included herein consist of: | | | | | | | | |
Reinvestment of dividends and distributions | | $ | 15,031,820 | | | $ | 178,886,990 | |
Cash paid for interest and fees | | | 507,311 | | | | 6,012,642 | |
| | | | |
| | 26 | | See Notes to Financial Statements. |
Eaton Vance
Municipal Income Funds
September 30, 2013
Financial Highlights
| | | | | | | | | | | | | | | | | | | | | | | | |
| | | AMT-Free Fund — Class A | |
| | | Year Ended
September 30, 2013 | | | Nine Months Ended September 30, 2012(1) | | | Year Ended December 31, | |
| | | | | 2011 | | | 2010 | | | 2009 | | | 2008 | |
Net asset value — Beginning of period | | $ | 9.600 | | | $ | 8.840 | | | $ | 8.320 | | | $ | 8.800 | | | $ | 7.030 | | | $ | 9.590 | |
| | | | | | |
| Income (Loss) From Operations | | | | | | | | | | | | | | | | | | | | | | | | |
Net investment income(2) | | $ | 0.400 | | | $ | 0.296 | | | $ | 0.437 | | | $ | 0.436 | | | $ | 0.429 | | | $ | 0.421 | |
Net realized and unrealized gain (loss) | | | (0.934 | ) | | | 0.758 | | | | 0.505 | | | | (0.487 | ) | | | 1.763 | | | | (2.569 | ) |
| | | | | | |
Total income (loss) from operations | | $ | (0.534 | ) | | $ | 1.054 | | | $ | 0.942 | | | $ | (0.051 | ) | | $ | 2.192 | | | $ | (2.148 | ) |
| | | | | | |
| Less Distributions | | | | | | | | | | | | | | | | | | | | | | | | |
From net investment income | | $ | (0.396 | ) | | $ | (0.294 | ) | | $ | (0.422 | ) | | $ | (0.429 | ) | | $ | (0.422 | ) | | $ | (0.412 | ) |
| | | | | | |
Total distributions | | $ | (0.396 | ) | | $ | (0.294 | ) | | $ | (0.422 | ) | | $ | (0.429 | ) | | $ | (0.422 | ) | | $ | (0.412 | ) |
| | | | | | |
Net asset value — End of period | | $ | 8.670 | | | $ | 9.600 | | | $ | 8.840 | | | $ | 8.320 | | | $ | 8.800 | | | $ | 7.030 | |
| | | | | | |
Total Return(3) | | | (5.75 | )% | | | 12.06 | %(4) | | | 11.68 | % | | | (0.79 | )% | | | 31.71 | % | | | (23.07 | )% |
| | | | | | |
| Ratios/Supplemental Data | | | | | | | | | | | | | | | | | | | | | | | | |
Net assets, end of period (000’s omitted) | | $ | 224,506 | | | $ | 293,544 | | | $ | 299,566 | | | $ | 345,914 | | | $ | 464,221 | | | $ | 454,906 | |
Ratios (as a percentage of average daily net assets): | | | | | | | | | | | | | | | | | | | | | | | | |
Expenses excluding interest and fees | | | 0.83 | % | | | 0.84 | %(5) | | | 0.85 | % | | | 0.83 | % | | | 0.84 | % | | | 0.81 | % |
Interest and fee expense(6) | | | 0.11 | % | | | 0.11 | %(5) | | | 0.12 | % | | | 0.13 | % | | | 0.11 | % | | | 0.32 | % |
Total expenses before custodian fee reduction | | | 0.94 | % | | | 0.95 | %(5) | | | 0.97 | % | | | 0.96 | % | | | 0.95 | % | | | 1.13 | % |
Expenses after custodian fee reduction excluding interest and fees | | | 0.83 | % | | | 0.84 | %(5) | | | 0.85 | % | | | 0.83 | % | | | 0.84 | % | | | 0.80 | % |
Net investment income | | | 4.26 | % | | | 4.24 | %(5) | | | 5.19 | % | | | 4.90 | % | | | 5.20 | % | | | 4.80 | % |
Portfolio Turnover | | | 31 | % | | | 26 | %(4) | | | 20 | % | | | 15 | % | | | 46 | % | | | 73 | % |
| (1) | The Fund changed its fiscal year-end from December 31 to September 30. |
| (2) | Computed using average shares outstanding. |
| (3) | Returns are historical and are calculated by determining the percentage change in net asset value with all distributions reinvested and do not reflect the effect of sales charges. |
| (6) | Interest and fee expense relates to the liability for floating rate notes issued in conjunction with residual interest bond transactions (see Note 1I). |
| | | | |
| | 27 | | See Notes to Financial Statements. |
Eaton Vance
Municipal Income Funds
September 30, 2013
Financial Highlights — continued
| | | | | | | | | | | | | | | | | | | | | | | | |
| | | AMT-Free Fund — Class B | |
| | | Year Ended
September 30, 2013 | | | Nine Months Ended September 30, 2012(1) | | | Year Ended December 31, | |
| | | | | 2011 | | | 2010 | | | 2009 | | | 2008 | |
Net asset value — Beginning of period | | $ | 9.540 | | | $ | 8.780 | | | $ | 8.270 | | | $ | 8.740 | | | $ | 6.980 | | | $ | 9.530 | |
| | | | | | |
| Income (Loss) From Operations | | | | | | | | | | | | | | | | | | | | | | | | |
Net investment income(2) | | $ | 0.326 | | | $ | 0.242 | | | $ | 0.372 | | | $ | 0.368 | | | $ | 0.365 | | | $ | 0.353 | |
Net realized and unrealized gain (loss) | | | (0.922 | ) | | | 0.758 | | | | 0.495 | | | | (0.477 | ) | | | 1.755 | | | | (2.562 | ) |
| | | | | | |
Total income (loss) from operations | | $ | (0.596 | ) | | $ | 1.000 | | | $ | 0.867 | | | $ | (0.109 | ) | | $ | 2.120 | | | $ | (2.209 | ) |
| | | | | | |
| Less Distributions | | | | | | | | | | | | | | | | | | | | | | | | |
From net investment income | | $ | (0.324 | ) | | $ | (0.240 | ) | | $ | (0.357 | ) | | $ | (0.361 | ) | | $ | (0.360 | ) | | $ | (0.341 | ) |
| | | | | | |
Total distributions | | $ | (0.324 | ) | | $ | (0.240 | ) | | $ | (0.357 | ) | | $ | (0.361 | ) | | $ | (0.360 | ) | | $ | (0.341 | ) |
| | | | | | |
Net asset value — End of period | | $ | 8.620 | | | $ | 9.540 | | | $ | 8.780 | | | $ | 8.270 | | | $ | 8.740 | | | $ | 6.980 | |
| | | | | | |
Total Return(3) | | | (6.42 | )% | | | 11.50 | %(4) | | | 10.76 | % | | | (1.43 | )% | | | 30.80 | % | | | (23.75 | )% |
| | | | | | |
| Ratios/Supplemental Data | | | | | | | | | | | | | | | | | | | | | | | | |
Net assets, end of period (000’s omitted) | | $ | 2,893 | | | $ | 5,236 | | | $ | 7,771 | | | $ | 13,078 | | | $ | 19,252 | | | $ | 21,293 | |
Ratios (as a percentage of average daily net assets): | | | | | | | | | | | | | | | | | | | | | | | | |
Expenses excluding interest and fees | | | 1.58 | % | | | 1.59 | %(5) | | | 1.61 | % | | | 1.58 | % | | | 1.59 | % | | | 1.56 | % |
Interest and fee expense(6) | | | 0.11 | % | | | 0.11 | %(5) | | | 0.12 | % | | | 0.13 | % | | | 0.11 | % | | | 0.32 | % |
Total expenses before custodian fee reduction | | | 1.69 | % | | | 1.70 | %(5) | | | 1.73 | % | | | 1.71 | % | | | 1.70 | % | | | 1.88 | % |
Expenses after custodian fee reduction excluding interest and fees | | | 1.58 | % | | | 1.59 | %(5) | | | 1.61 | % | | | 1.58 | % | | | 1.59 | % | | | 1.55 | % |
Net investment income | | | 3.49 | % | | | 3.50 | %(5) | | | 4.46 | % | | | 4.16 | % | | | 4.47 | % | | | 4.02 | % |
Portfolio Turnover | | | 31 | % | | | 26 | %(4) | | | 20 | % | | | 15 | % | | | 46 | % | | | 73 | % |
| (1) | The Fund changed its fiscal year-end from December 31 to September 30. |
| (2) | Computed using average shares outstanding. |
| (3) | Returns are historical and are calculated by determining the percentage change in net asset value with all distributions reinvested and do not reflect the effect of sales charges. |
| (6) | Interest and fee expense relates to the liability for floating rate notes issued in conjunction with residual interest bond transactions (see Note 1I). |
| | | | |
| | 28 | | See Notes to Financial Statements. |
Eaton Vance
Municipal Income Funds
September 30, 2013
Financial Highlights — continued
| | | | | | | | | | | | | | | | | | | | | | | | |
| | | AMT-Free Fund — Class C | |
| | | Year Ended
September 30, 2013 | | | Nine Months Ended September 30, 2012(1) | | | Year Ended December 31, | |
| | | | | 2011 | | | 2010 | | | 2009 | | | 2008 | |
Net asset value — Beginning of period | | $ | 9.550 | | | $ | 8.790 | | | $ | 8.280 | | | $ | 8.750 | | | $ | 6.990 | | | $ | 9.540 | |
| | | | | | |
| Income (Loss) From Operations | | | | | | | | | | | | | | | | | | | | | | | | |
Net investment income(2) | | $ | 0.327 | | | $ | 0.242 | | | $ | 0.371 | | | $ | 0.367 | | | $ | 0.365 | | | $ | 0.352 | |
Net realized and unrealized gain (loss) | | | (0.933 | ) | | | 0.758 | | | | 0.496 | | | | (0.475 | ) | | | 1.755 | | | | (2.561 | ) |
| | | | | | |
Total income (loss) from operations | | $ | (0.606 | ) | | $ | 1.000 | | | $ | 0.867 | | | $ | (0.108 | ) | | $ | 2.120 | | | $ | (2.209 | ) |
| | | | | | |
| Less Distributions | | | | | | | | | | | | | | | | | | | | | | | | |
From net investment income | | $ | (0.324 | ) | | $ | (0.240 | ) | | $ | (0.357 | ) | | $ | (0.362 | ) | | $ | (0.360 | ) | | $ | (0.341 | ) |
| | | | | | |
Total distributions | | $ | (0.324 | ) | | $ | (0.240 | ) | | $ | (0.357 | ) | | $ | (0.362 | ) | | $ | (0.360 | ) | | $ | (0.341 | ) |
| | | | | | |
Net asset value — End of period | | $ | 8.620 | | | $ | 9.550 | | | $ | 8.790 | | | $ | 8.280 | | | $ | 8.750 | | | $ | 6.990 | |
| | | | | | |
Total Return(3) | | | (6.51 | )% | | | 11.49 | %(4) | | | 10.76 | % | | | (1.42 | )% | | | 30.76 | % | | | (23.73 | )% |
| | | | | | |
| Ratios/Supplemental Data | | | | | | | | | | | | | | | | | | | | | | | | |
Net assets, end of period (000’s omitted) | | $ | 40,823 | | | $ | 50,099 | | | $ | 43,863 | | | $ | 50,369 | | | $ | 56,641 | | | $ | 47,494 | |
Ratios (as a percentage of average daily net assets): | | | | | | | | | | | | | | | | | | | | | | | | |
Expenses excluding interest and fees | | | 1.58 | % | | | 1.59 | %(5) | | | 1.61 | % | | | 1.57 | % | | | 1.59 | % | | | 1.56 | % |
Interest and fee expense(6) | | | 0.11 | % | | | 0.11 | %(5) | | | 0.12 | % | | | 0.13 | % | | | 0.11 | % | | | 0.32 | % |
Total expenses before custodian fee reduction | | | 1.69 | % | | | 1.70 | %(5) | | | 1.73 | % | | | 1.70 | % | | | 1.70 | % | | | 1.88 | % |
Expenses after custodian fee reduction excluding interest and fees | | | 1.58 | % | | | 1.59 | %(5) | | | 1.61 | % | | | 1.57 | % | | | 1.59 | % | | | 1.55 | % |
Net investment income | | | 3.52 | % | | | 3.48 | %(5) | | | 4.42 | % | | | 4.14 | % | | | 4.44 | % | | | 4.06 | % |
Portfolio Turnover | | | 31 | % | | | 26 | %(4) | | | 20 | % | | | 15 | % | | | 46 | % | | | 73 | % |
| (1) | The Fund changed its fiscal year-end from December 31 to September 30. |
| (2) | Computed using average shares outstanding. |
| (3) | Returns are historical and are calculated by determining the percentage change in net asset value with all distributions reinvested and do not reflect the effect of sales charges. |
| (6) | Interest and fee expense relates to the liability for floating rate notes issued in conjunction with residual interest bond transactions (see Note 1I). |
| | | | |
| | 29 | | See Notes to Financial Statements. |
Eaton Vance
Municipal Income Funds
September 30, 2013
Financial Highlights — continued
| | | | | | | | | | | | | | | | | | | | | | | | |
| | | AMT-Free Fund — Class I | |
| | | Year Ended
September 30, 2013 | | | Nine Months Ended September 30, 2012(1) | | | Year Ended December 31, | |
| | | | | 2011 | | | 2010 | | | 2009 | | | 2008 | |
Net asset value — Beginning of period | | $ | 10.480 | | | $ | 9.660 | | | $ | 9.090 | | | $ | 9.610 | | | $ | 7.670 | | | $ | 10.480 | |
| | | | | | |
| Income (Loss) From Operations | | | | | | | | | | | | | | | | | | | | | | | | |
Net investment income(2) | | $ | 0.463 | | | $ | 0.341 | | | $ | 0.500 | | | $ | 0.500 | | | $ | 0.491 | | | $ | 0.484 | |
Net realized and unrealized gain (loss) | | | (1.015 | ) | | | 0.819 | | | | 0.554 | | | | (0.528 | ) | | | 1.932 | | | | (2.817 | ) |
| | | | | | |
Total income (loss) from operations | | $ | (0.552 | ) | | $ | 1.160 | | | $ | 1.054 | | | $ | (0.028 | ) | | $ | 2.423 | | | $ | (2.333 | ) |
| | | | | | |
| Less Distributions | | | | | | | | | | | | | | | | | | | | | | | | |
From net investment income | | $ | (0.458 | ) | | $ | (0.340 | ) | | $ | (0.484 | ) | | $ | (0.492 | ) | | $ | (0.483 | ) | | $ | (0.477 | ) |
| | | | | | |
Total distributions | | $ | (0.458 | ) | | $ | (0.340 | ) | | $ | (0.484 | ) | | $ | (0.492 | ) | | $ | (0.483 | ) | | $ | (0.477 | ) |
| | | | | | |
Net asset value — End of period | | $ | 9.470 | | | $ | 10.480 | | | $ | 9.660 | | | $ | 9.090 | | | $ | 9.610 | | | $ | 7.670 | |
| | | | | | |
Total Return(3) | | | (5.46 | )% | | | 12.27 | %(4) | | | 11.87 | % | | | (0.50 | )% | | | 31.98 | % | | | (22.88 | )% |
| | | | | | |
| Ratios/Supplemental Data | | | | | | | | | | | | | | | | | | | | | | | | |
Net assets, end of period (000’s omitted) | | $ | 99,553 | | | $ | 125,642 | | | $ | 101,762 | | | $ | 130,202 | | | $ | 196,069 | | | $ | 123,810 | |
Ratios (as a percentage of average daily net assets): | | | | | | | | | | | | | | | | | | | | | | | | |
Expenses excluding interest and fees | | | 0.58 | % | | | 0.59 | %(5) | | | 0.60 | % | | | 0.57 | % | | | 0.59 | % | | | 0.56 | % |
Interest and fee expense(6) | | | 0.11 | % | | | 0.11 | %(5) | | | 0.12 | % | | | 0.13 | % | | | 0.11 | % | | | 0.32 | % |
Total expenses before custodian fee reduction | | | 0.69 | % | | | 0.70 | %(5) | | | 0.72 | % | | | 0.70 | % | | | 0.70 | % | | | 0.88 | % |
Expenses after custodian fee reduction excluding interest and fees | | | 0.58 | % | | | 0.59 | %(5) | | | 0.60 | % | | | 0.57 | % | | | 0.59 | % | | | 0.55 | % |
Net investment income | | | 4.52 | % | | | 4.48 | %(5) | | | 5.42 | % | | | 5.14 | % | | | 5.43 | % | | | 5.02 | % |
Portfolio Turnover | | | 31 | % | | | 26 | %(4) | | | 20 | % | | | 15 | % | | | 46 | % | | | 73 | % |
| (1) | The Fund changed its fiscal year-end from December 31 to September 30. |
| (2) | Computed using average shares outstanding. |
| (3) | Returns are historical and are calculated by determining the percentage change in net asset value with all distributions reinvested. |
| (6) | Interest and fee expense relates to the liability for floating rate notes issued in conjunction with residual interest bond transactions (see Note 1I). |
| | | | |
| | 30 | | See Notes to Financial Statements. |
Eaton Vance
Municipal Income Funds
September 30, 2013
Financial Highlights — continued
| | | | | | | | | | | | | | | | | | | | |
| | | National Fund — Class A | |
| | | Year Ended September 30, | |
| | | 2013 | | | 2012 | | | 2011 | | | 2010 | | | 2009 | |
Net asset value — Beginning of year | | $ | 10.200 | | | $ | 9.360 | | | $ | 10.020 | | | $ | 10.040 | | | $ | 9.060 | |
| | | | | |
| Income (Loss) From Operations | | | | | | | | | | | | | | | | | | | | |
Net investment income(1) | | $ | 0.468 | | | $ | 0.477 | | | $ | 0.549 | | | $ | 0.527 | | | $ | 0.527 | |
Net realized and unrealized gain (loss) | | | (1.032 | ) | | | 0.842 | | | | (0.682 | ) | | | (0.022 | ) | | | 0.984 | |
| | | | | |
Total income (loss) from operations | | $ | (0.564 | ) | | $ | 1.319 | | | $ | (0.133 | ) | | $ | 0.505 | | | $ | 1.511 | |
| | | | | |
| Less Distributions | | | | | | | | | | | | | | | | | | | | |
From net investment income | | $ | (0.466 | ) | | $ | (0.479 | ) | | $ | (0.527 | ) | | $ | (0.525 | ) | | $ | (0.531 | ) |
| | | | | |
Total distributions | | $ | (0.466 | ) | | $ | (0.479 | ) | | $ | (0.527 | ) | | $ | (0.525 | ) | | $ | (0.531 | ) |
| | | | | |
Net asset value — End of year | | $ | 9.170 | | | $ | 10.200 | | | $ | 9.360 | | | $ | 10.020 | | | $ | 10.040 | |
| | | | | |
Total Return(2) | | | (5.77 | )% | | | 14.42 | % | | | (1.00 | )% | | | 5.36 | % | | | 17.97 | % |
| | | | | |
| Ratios/Supplemental Data | | | | | | | | | | | | | | | | | | | | |
Net assets, end of year (000’s omitted) | | $ | 2,134,502 | | | $ | 2,975,655 | | | $ | 2,872,630 | | | $ | 3,971,060 | | | $ | 4,811,295 | |
Ratios (as a percentage of average daily net assets): | | | | | | | | | | | | | | | | | | | | |
Expenses excluding interest and fees | | | 0.66 | % | | | 0.67 | % | | | 0.69 | % | | | 0.67 | % | | | 0.70 | % |
Interest and fee expense(3) | | | 0.11 | % | | | 0.11 | % | | | 0.13 | % | | | 0.13 | % | | | 0.23 | % |
Total expenses(4) | | | 0.77 | % | | | 0.78 | % | | | 0.82 | % | | | 0.80 | % | | | 0.93 | % |
Net investment income | | | 4.67 | % | | | 4.88 | % | | | 6.04 | % | | | 5.45 | % | | | 6.22 | % |
Portfolio Turnover | | | 74 | % | | | 59 | % | | | 18 | % | | | 20 | % | | | 46 | % |
| (1) | Computed using average shares outstanding. |
| (2) | Returns are historical and are calculated by determining the percentage change in net asset value with all distributions reinvested and do not reflect the effect of sales charges. |
| (3) | Interest and fee expense relates to the liability for floating rate notes issued in conjunction with residual interest bond transactions (see Note 1I). |
| (4) | Excludes the effect of custody fee credits, if any, of less than 0.005% |
| | | | |
| | 31 | | See Notes to Financial Statements. |
Eaton Vance
Municipal Income Funds
September 30, 2013
Financial Highlights — continued
| | | | | | | | | | | | | | | | | | | | |
| | | National Fund — Class B | |
| | | Year Ended September 30, | |
| | | 2013 | | | 2012 | | | 2011 | | | 2010 | | | 2009 | |
Net asset value — Beginning of year | | $ | 10.200 | | | $ | 9.360 | | | $ | 10.020 | | | $ | 10.050 | | | $ | 9.060 | |
| | | | | |
| Income (Loss) From Operations | | | | | | | | | | | | | | | | | | | | |
Net investment income(1) | | $ | 0.392 | | | $ | 0.405 | | | $ | 0.480 | | | $ | 0.455 | | | $ | 0.464 | |
Net realized and unrealized gain (loss) | | | (1.031 | ) | | | 0.840 | | | | (0.681 | ) | | | (0.029 | ) | | | 0.992 | |
| | | | | |
Total income (loss) from operations | | $ | (0.639 | ) | | $ | 1.245 | | | $ | (0.201 | ) | | $ | 0.426 | | | $ | 1.456 | |
| | | | | |
| Less Distributions | | | | | | | | | | | | | | | | | | | | |
From net investment income | | $ | (0.391 | ) | | $ | (0.405 | ) | | $ | (0.459 | ) | | $ | (0.456 | ) | | $ | (0.466 | ) |
| | | | | |
Total distributions | | $ | (0.391 | ) | | $ | (0.405 | ) | | $ | (0.459 | ) | | $ | (0.456 | ) | | $ | (0.466 | ) |
| | | | | |
Net asset value — End of year | | $ | 9.170 | | | $ | 10.200 | | | $ | 9.360 | | | $ | 10.020 | | | $ | 10.050 | |
| | | | | |
Total Return(2) | | | (6.47 | )% | | | 13.57 | % | | | (1.73 | )% | | | 4.51 | % | | | 17.18 | % |
| | | | | |
| Ratios/Supplemental Data | | | | | | | | | | | | | | | | | | | | |
Net assets, end of year (000’s omitted) | | $ | 59,244 | | | $ | 103,613 | | | $ | 122,288 | | | $ | 160,946 | | | $ | 179,657 | |
Ratios (as a percentage of average daily net assets): | | | | | | | | | | | | | | | | | | | | |
Expenses excluding interest and fees | | | 1.41 | % | | | 1.42 | % | | | 1.44 | % | | | 1.42 | % | | | 1.45 | % |
Interest and fee expense(3) | | | 0.11 | % | | | 0.11 | % | | | 0.13 | % | | | 0.13 | % | | | 0.23 | % |
Total expenses(4) | | | 1.52 | % | | | 1.53 | % | | | 1.57 | % | | | 1.55 | % | | | 1.68 | % |
Net investment income | | | 3.90 | % | | | 4.15 | % | | | 5.29 | % | | | 4.70 | % | | | 5.48 | % |
Portfolio Turnover | | | 74 | % | | | 59 | % | | | 18 | % | | | 20 | % | | | 46 | % |
| (1) | Computed using average shares outstanding. |
| (2) | Returns are historical and are calculated by determining the percentage change in net asset value with all distributions reinvested and do not reflect the effect of sales charges. |
| (3) | Interest and fee expense relates to the liability for floating rate notes issued in conjunction with residual interest bond transactions (see Note 1I). |
| (4) | Excludes the effect of custody fee credits, if any, of less than 0.005%. |
| | | | |
| | 32 | | See Notes to Financial Statements. |
Eaton Vance
Municipal Income Funds
September 30, 2013
Financial Highlights — continued
| | | | | | | | | | | | | | | | | | | | |
| | | National Fund — Class C | |
| | | Year Ended September 30, | |
| | | 2013 | | | 2012 | | | 2011 | | | 2010 | | | 2009 | |
Net asset value — Beginning of year | | $ | 10.200 | | | $ | 9.360 | | | $ | 10.020 | | | $ | 10.050 | | | $ | 9.060 | |
| | | | | |
| Income (Loss) From Operations | | | | | | | | | | | | | | | | | | | | |
Net investment income(1) | | $ | 0.392 | | | $ | 0.404 | | | $ | 0.481 | | | $ | 0.455 | | | $ | 0.464 | |
Net realized and unrealized gain (loss) | | | (1.031 | ) | | | 0.841 | | | | (0.682 | ) | | | (0.029 | ) | | | 0.992 | |
| | | | | |
Total income (loss) from operations | | $ | (0.639 | ) | | $ | 1.245 | | | $ | (0.201 | ) | | $ | 0.426 | | | $ | 1.456 | |
| | | | | |
| Less Distributions | | | | | | | | | | | | | | | | | | | | |
From net investment income | | $ | (0.391 | ) | | $ | (0.405 | ) | | $ | (0.459 | ) | | $ | (0.456 | ) | | $ | (0.466 | ) |
| | | | | |
Total distributions | | $ | (0.391 | ) | | $ | (0.405 | ) | | $ | (0.459 | ) | | $ | (0.456 | ) | | $ | (0.466 | ) |
| | | | | |
Net asset value — End of year | | $ | 9.170 | | | $ | 10.200 | | | $ | 9.360 | | | $ | 10.020 | | | $ | 10.050 | |
| | | | | |
Total Return(2) | | | (6.47 | )% | | | 13.58 | % | | | (1.74 | )% | | | 4.51 | % | | | 17.18 | % |
| | | | | |
| Ratios/Supplemental Data | | | | | | | | | | | | | | | | | | | | |
Net assets, end of year (000’s omitted) | | $ | 681,072 | | | $ | 980,799 | | | $ | 932,773 | | | $ | 1,281,278 | | | $ | 1,367,785 | |
Ratios (as a percentage of average daily net assets): | | | | | | | | | | | | | | | | | | | | |
Expenses excluding interest and fees | | | 1.41 | % | | | 1.42 | % | | | 1.44 | % | | | 1.42 | % | | | 1.45 | % |
Interest and fee expense(3) | | | 0.11 | % | | | 0.11 | % | | | 0.13 | % | | | 0.13 | % | | | 0.23 | % |
Total expenses(4) | | | 1.52 | % | | | 1.53 | % | | | 1.57 | % | | | 1.55 | % | | | 1.68 | % |
Net investment income | | | 3.92 | % | | | 4.13 | % | | | 5.29 | % | | | 4.70 | % | | | 5.46 | % |
Portfolio Turnover | | | 74 | % | | | 59 | % | | | 18 | % | | | 20 | % | | | 46 | % |
| (1) | Computed using average shares outstanding. |
| (2) | Returns are historical and are calculated by determining the percentage change in net asset value with all distributions reinvested and do not reflect the effect of sales charges. |
| (3) | Interest and fee expense relates to the liability for floating rate notes issued in conjunction with residual interest bond transactions (see Note 1I). |
| (4) | Excludes the effect of custody fee credits, if any, of less than 0.005%. |
| | | | |
| | 33 | | See Notes to Financial Statements. |
Eaton Vance
Municipal Income Funds
September 30, 2013
Financial Highlights — continued
| | | | | | | | | | | | | | | | | | | | |
| | | National Fund — Class I | |
| | | Year Ended September 30, | |
| | | 2013 | | | 2012 | | | 2011 | | | 2010 | | | 2009 | |
Net asset value — Beginning of year | | $ | 10.200 | | | $ | 9.360 | | | $ | 10.020 | | | $ | 10.040 | | | $ | 9.060 | |
| | | | | |
| Income (Loss) From Operations | | | | | | | | | | | | | | | | | | | | |
Net investment income(1) | | $ | 0.492 | | | $ | 0.499 | | | $ | 0.565 | | | $ | 0.552 | | | $ | 0.550 | |
Net realized and unrealized gain (loss) | | | (1.021 | ) | | | 0.844 | | | | (0.675 | ) | | | (0.024 | ) | | | 0.983 | |
| | | | | |
Total income (loss) from operations | | $ | (0.529 | ) | | $ | 1.343 | | | $ | (0.110 | ) | | $ | 0.528 | | | $ | 1.533 | |
| | | | | |
| Less Distributions | | | | | | | | | | | | | | | | | | | | |
From net investment income | | $ | (0.491 | ) | | $ | (0.503 | ) | | $ | (0.550 | ) | | $ | (0.548 | ) | | $ | (0.553 | ) |
| | | | | |
Total distributions | | $ | (0.491 | ) | | $ | (0.503 | ) | | $ | (0.550 | ) | | $ | (0.548 | ) | | $ | (0.553 | ) |
| | | | | |
Net asset value — End of year | | $ | 9.180 | | | $ | 10.200 | | | $ | 9.360 | | | $ | 10.020 | | | $ | 10.040 | |
| | | | | |
Total Return(2) | | | (5.43 | )% | | | 14.71 | % | | | (0.75 | )% | | | 5.61 | % | | | 18.28 | % |
| | | | | |
| Ratios/Supplemental Data | | | | | | | | | | | | | | | | | | | | |
Net assets, end of year (000’s omitted) | | $ | 981,936 | | | $ | 1,142,323 | | | $ | 796,970 | | | $ | 522,370 | | | $ | 217,630 | |
Ratios (as a percentage of average daily net assets): | | | | | | | | | | | | | | | | | | | | |
Expenses excluding interest and fees | | | 0.41 | % | | | 0.42 | % | | | 0.43 | % | | | 0.42 | % | | | 0.44 | % |
Interest and fee expense(3) | | | 0.11 | % | | | 0.11 | % | | | 0.13 | % | | | 0.13 | % | | | 0.23 | % |
Total expenses(4) | | | 0.52 | % | | | 0.53 | % | | | 0.56 | % | | | 0.55 | % | | | 0.67 | % |
Net investment income | | | 4.93 | % | | | 5.09 | % | | | 6.23 | % | | | 5.70 | % | | | 6.47 | % |
Portfolio Turnover | | | 74 | % | | | 59 | % | | | 18 | % | | | 20 | % | | | 46 | % |
| (1) | Computed using average shares outstanding. |
| (2) | Returns are historical and are calculated by determining the percentage change in net asset value with all distributions reinvested. |
| (3) | Interest and fee expense relates to the liability for floating rate notes issued in conjunction with residual interest bond transactions (see Note 1I). |
| (4) | Excludes the effect of custody fee credits, if any, of less than 0.005%. |
| | | | |
| | 34 | | See Notes to Financial Statements. |
Eaton Vance
Municipal Income Funds
September 30, 2013
Notes to Financial Statements
1 Significant Accounting Policies
Eaton Vance AMT-Free Municipal Income Fund (AMT-Free Fund) and Eaton Vance National Municipal Income Fund (National Fund) (each individually referred to as the Fund, and collectively, the Funds) are a diversified series of Eaton Vance Mutual Funds Trust and Eaton Vance Municipals Trust, respectively (collectively, the Trusts). The Trusts are Massachusetts business trusts registered under the Investment Company Act of 1940, as amended (the 1940 Act), as open-end management investment companies. The Funds’ investment objective is to provide current income exempt from regular federal income tax. The Funds offer four classes of shares. Class A shares are generally sold subject to a sales charge imposed at time of purchase. Class B and Class C shares are sold at net asset value and are generally subject to a contingent deferred sales charge (see Note 5). Class I shares are sold at net asset value and are not subject to a sales charge. Class B shares of each Fund automatically convert to Class A shares eight years after their purchase as described in each Fund’s prospectus. Beginning January 1, 2012, Class B shares are only available for purchase upon exchange from another Eaton Vance fund or through reinvestment of distributions. Each class represents a pro-rata interest in the Fund, but votes separately on class-specific matters and (as noted below) is subject to different expenses. Realized and unrealized gains and losses are allocated daily to each class of shares based on the relative net assets of each class to the total net assets of the Fund. Net investment income, other than class-specific expenses, is allocated daily to each class of shares based upon the ratio of the value of each class’s paid shares to the total value of all paid shares. Each class of shares differs in its distribution plan and certain other class-specific expenses.
The following is a summary of significant accounting policies of the Funds. The policies are in conformity with accounting principles generally accepted in the United States of America.
A Investment Valuation — The following methodologies are used to determine the market value or fair value of investments.
Debt Obligations. Debt obligations (including short-term obligations with a remaining maturity of more than sixty days) are generally valued on the basis of valuations provided by third party pricing services, as derived from such services’ pricing models. Inputs to the models may include, but are not limited to, reported trades, executable bid and asked prices, broker/dealer quotations, prices or yields of securities with similar characteristics, benchmark curves or information pertaining to the issuer, as well as industry and economic events. The pricing services may use a matrix approach, which considers information regarding securities with similar characteristics to determine the valuation for a security. Short-term obligations purchased with a remaining maturity of sixty days or less are generally valued at amortized cost, which approximates market value.
Derivatives. Financial futures contracts are valued at the closing settlement price established by the board of trade or exchange on which they are traded.
Fair Valuation. Investments for which valuations or market quotations are not readily available or are deemed unreliable are valued at fair value using methods determined in good faith by or at the direction of the Trustees of a Fund in a manner that fairly reflects the security’s value, or the amount that the Fund might reasonably expect to receive for the security upon its current sale in the ordinary course. Each such determination is based on a consideration of relevant factors, which are likely to vary from one pricing context to another. These factors may include, but are not limited to, the type of security, the existence of any contractual restrictions on the security’s disposition, the price and extent of public trading in similar securities of the issuer or of comparable entities, quotations or relevant information obtained from broker/dealers or other market participants, information obtained from the issuer, analysts, and/or the appropriate stock exchange (for exchange-traded securities), an analysis of the entity’s financial condition, and an evaluation of the forces that influence the issuer and the market(s) in which the security is purchased and sold.
B Investment Transactions and Related Income — Investment transactions for financial statement purposes are accounted for on a trade date basis. Realized gains and losses on investments sold are determined on the basis of identified cost. Interest income is recorded on the basis of interest accrued, adjusted for amortization of premium or accretion of discount.
C Federal Taxes — Each Fund’s policy is to comply with the provisions of the Internal Revenue Code applicable to regulated investment companies and to distribute to shareholders each year substantially all of its taxable, if any, and tax-exempt net investment income, and all or substantially all of its net realized capital gains. Accordingly, no provision for federal income or excise tax is necessary. Each Fund intends to satisfy conditions which will enable it to designate distributions from the interest income generated by its investments in non-taxable municipal securities, which are exempt from regular federal income tax when received by each Fund, as exempt-interest dividends. For National Fund, the portion of such interest, if any, earned on private activity bonds issued after August 7, 1986, may be considered a tax preference item to shareholders.
At September 30, 2013, the Funds, for federal income tax purposes, had capital loss carryforwards and deferred capital losses which will reduce the respective Fund’s taxable income arising from future net realized gains on investment transactions, if any, to the extent permitted by the Internal Revenue Code, and thus will reduce the amount of distributions to shareholders, which would otherwise be necessary to relieve the Funds of any liability for federal income or excise tax. The deferred capital losses are treated as arising on the first day of the Funds’ next taxable year and are treated as realized prior to
Eaton Vance
Municipal Income Funds
September 30, 2013
Notes to Financial Statements — continued
the utilization of capital loss carryforward. The amounts and expiration dates of the capital loss carryforwards and the amounts of the deferred capital losses are as follows:
| | | | | | | | |
| Expiration Date | | AMT-Free
Fund | | | National
Fund | |
| | |
September 30, 2014 | | $ | — | | | $ | 390,519 | |
September 30, 2015 | | | 12,777,842 | | | | 1,392,026 | |
September 30, 2016 | | | 23,678,685 | | | | 52,850,319 | |
September 30, 2017 | | | 55,876,213 | | | | 9,883,906 | |
September 30, 2018 | | | 10,549,691 | | | | 792,861,604 | |
September 30, 2019 | | | — | | | | 56,374,590 | |
| | |
Total capital loss carryforward | | $ | 102,882,431 | | | $ | 913,752,964 | |
| | |
Deferred capital losses | | $ | 36,783,186 | | | $ | 421,618,896 | |
As of September 30, 2013, the Funds had no uncertain tax positions that would require financial statement recognition, de-recognition, or disclosure. Each Fund files a U.S. federal income tax return annually after its fiscal year-end, which is subject to examination by the Internal Revenue Service for a period of three years from the date of filing.
D Expenses — The majority of expenses of the Trusts are directly identifiable to an individual fund. Expenses which are not readily identifiable to a specific fund are allocated taking into consideration, among other things, the nature and type of expense and the relative size of the funds.
E Expense Reduction — State Street Bank and Trust Company (SSBT) serves as custodian of the Funds. Pursuant to the custodian agreement, SSBT receives a fee reduced by credits, which are determined based on the average daily cash balance each Fund maintains with SSBT. All credit balances, if any, used to reduce each Fund’s custodian fees are reported as a reduction of expenses in the Statements of Operations.
F Legal Fees — Legal fees and other related expenses incurred as part of negotiations of the terms and requirement of capital infusions, or that are expected to result in the restructuring of, or a plan of reorganization for, an investment are recorded as realized losses. Ongoing expenditures to protect or enhance an investment are treated as operating expenses.
G Use of Estimates — The preparation of the financial statements in conformity with accounting principles generally accepted in the United States of America requires management to make estimates and assumptions that affect the reported amounts of assets and liabilities at the date of the financial statements and the reported amounts of income and expense during the reporting period. Actual results could differ from those estimates.
H Indemnifications — Under each Trust’s organizational documents, its officers and Trustees may be indemnified against certain liabilities and expenses arising out of the performance of their duties to the Funds. Under Massachusetts law, if certain conditions prevail, shareholders of a Massachusetts business trust (such as a Trust) could be deemed to have personal liability for the obligations of the Trust. However, each Trust’s Declaration of Trust contains an express disclaimer of liability on the part of Fund shareholders and the By-laws provide that the Trust shall assume the defense on behalf of any Fund shareholders. Moreover, the By-laws also provide for indemnification out of Fund property of any shareholder held personally liable solely by reason of being or having been a shareholder for all loss or expense arising from such liability. Additionally, in the normal course of business, each Fund enters into agreements with service providers that may contain indemnification clauses. Each Fund’s maximum exposure under these arrangements is unknown as this would involve future claims that may be made against each Fund that have not yet occurred.
I Floating Rate Notes Issued in Conjunction with Securities Held — The Funds may invest in residual interest bonds, also referred to as inverse floating rate securities, whereby a Fund may sell a variable or fixed rate bond to a broker for cash. At the same time, the Fund buys a residual interest in the assets and cash flows of a Special-Purpose Vehicle (the SPV), (which is generally organized as a trust), set up by the broker. The broker deposits a bond into the SPV with the same CUSIP number as the bond sold to the broker by the Fund, and which may have been, but is not required to be, the bond purchased from the Fund (the Bond). The SPV also issues floating rate notes (Floating Rate Notes) which are sold to third-parties. The residual interest bond held by a Fund gives the Fund the right (1) to cause the holders of the Floating Rate Notes to generally tender their notes at par, and (2) to have the broker transfer the Bond held by the SPV to the Fund, thereby terminating the SPV. Should the Fund exercise such right, it would generally pay the broker the par amount due on the Floating Rate Notes and exchange the residual interest bond for the underlying Bond. Pursuant to generally accepted accounting principles for transfers and servicing of financial assets and extinguishment of liabilities, the Funds account for the transaction described above as a secured borrowing by including the Bond in their Portfolio of Investments and the Floating Rate Notes as a liability under the caption “Payable for floating rate notes issued” in their Statement of Assets and Liabilities. The Floating Rate Notes have interest rates that generally reset weekly and their holders have the option to tender their notes to the broker for redemption at par at each reset date. Accordingly, the fair value of the payable for floating rate notes issued approximates its carrying value. If measured at fair value, the payable for floating rate notes would have been considered as Level 2 in the fair value
Eaton Vance
Municipal Income Funds
September 30, 2013
Notes to Financial Statements — continued
hierarchy (see Note 11) at September 30, 2013. Interest expense related to the Funds’ liability with respect to Floating Rate Notes is recorded as incurred. The SPV may be terminated by the Fund, as noted above, or by the broker upon the occurrence of certain termination events as defined in the trust agreement, such as a downgrade in the credit quality of the underlying Bond, bankruptcy of or payment failure by the issuer of the underlying Bond, the inability to remarket Floating Rate Notes that have been tendered due to insufficient buyers in the market, or the failure by the SPV to obtain renewal of the liquidity agreement under which liquidity support is provided for the Floating Rate Notes up to one year. At September 30, 2013, the amounts of the Funds’ Floating Rate Notes and related interest rates and collateral were as follows:
| | | | | | | | |
| | | AMT-Free
Fund | | | National
Fund | |
| | |
Floating Rate Notes Outstanding | | $ | 53,595,000 | | | $ | 617,025,000 | |
Interest Rate or Range of Interest Rates (%) | | | 0.07 - 0.09 | | | | 0.07 - 0.32 | |
Collateral for Floating Rate Notes Outstanding | | $ | 80,975,112 | | | $ | 893,415,999 | |
For the year ended September 30, 2013, the Funds’ average Floating Rate Notes outstanding and the average interest rate including fees were as follows:
| | | | | | | | |
| | | AMT-Free Fund | | | National
Fund | |
| | |
Average Floating Rate Notes Outstanding | | $ | 66,634,877 | | | $ | 748,421,482 | |
Average Interest Rate | | | 0.70 | % | | | 0.73 | % |
The Funds may enter into shortfall and forbearance agreements with the broker by which a Fund agrees to reimburse the broker, in certain circumstances, for the difference between the liquidation value of the Bond held by the SPV and the liquidation value of the Floating Rate Notes, as well as any shortfalls in interest cash flows. The Funds had no shortfalls as of September 30, 2013.
The Funds may also purchase residual interest bonds from brokers in a secondary market transaction without first owning the underlying bond. Such transactions are not required to be treated as secured borrowings. Shortfall agreements, if any, related to residual interest bonds purchased in a secondary market transaction are disclosed in the Portfolio of Investments.
The Funds’ investment policies and restrictions expressly permit investments in residual interest bonds. Such bonds typically offer the potential for yields exceeding the yields available on fixed rate bonds with comparable credit quality and maturity. These securities tend to underperform the market for fixed rate bonds in a rising long-term interest rate environment, but tend to outperform the market for fixed rate bonds when long-term interest rates decline. The value and income of residual interest bonds are generally more volatile than that of a fixed rate bond. The Funds’ investment policies do not allow the Funds to borrow money except as permitted by the 1940 Act. Management believes that the Funds’ restrictions on borrowing money and issuing senior securities (other than as specifically permitted) do not apply to Floating Rate Notes issued by the SPV and included as a liability in the Funds’ Statement of Assets and Liabilities. As secured indebtedness issued by an SPV, Floating Rate Notes are distinct from the borrowings and senior securities to which the Funds’ restrictions apply. Residual interest bonds held by the Funds are securities exempt from registration under Rule 144A of the Securities Act of 1933.
J Financial Futures Contracts — Upon entering into a financial futures contract, a Fund is required to deposit with the broker, either in cash or securities, an amount equal to a certain percentage of the contract amount (initial margin). Subsequent payments, known as variation margin, are made or received by the Fund each business day, depending on the daily fluctuations in the value of the underlying security, and are recorded as unrealized gains or losses by the Fund. Gains (losses) are realized upon the expiration or closing of the financial futures contracts. Should market conditions change unexpectedly, the Fund may not achieve the anticipated benefits of the financial futures contracts and may realize a loss. Futures contracts have minimal counterparty risk as they are exchange traded and the clearinghouse for the exchange is substituted as the counterparty, guaranteeing counterparty performance.
K When-Issued Securities and Delayed Delivery Transactions — The Funds may purchase or sell securities on a delayed delivery or when-issued basis. Payment and delivery may take place after the customary settlement period for that security. At the time the transaction is negotiated, the price of the security that will be delivered is fixed. The Funds maintain security positions for these commitments such that sufficient liquid assets will be available to make payments upon settlement. Securities purchased on a delayed delivery or when-issued basis are marked-to-market daily and begin earning interest on settlement date. Losses may arise due to changes in the market value of the underlying securities or if the counterparty does not perform under the contract.
L Statement of Cash Flows — The cash amount shown in the Statement of Cash Flows of a Fund is the amount included in the Fund’s Statement of Assets and Liabilities and represents the unrestricted cash on hand at its custodian and does not include any short-term investments.
Eaton Vance
Municipal Income Funds
September 30, 2013
Notes to Financial Statements — continued
2 Distributions to Shareholders
The net investment income of each Fund is determined daily and substantially all of the net investment income so determined is declared as a dividend to shareholders of record at the time of declaration. Distributions are declared separately for each class of shares. Distributions are paid monthly. Distributions of realized capital gains (reduced by available capital loss carryforwards) are made at least annually. Shareholders may reinvest income and capital gain distributions in additional shares of the same class of a Fund at the net asset value as of the reinvestment date or, at the election of the shareholder, receive distributions in cash. The Funds distinguish between distributions on a tax basis and a financial reporting basis. Accounting principles generally accepted in the United States of America require that only distributions in excess of tax basis earnings and profits be reported in the financial statements as a return of capital. Permanent differences between book and tax accounting relating to distributions are reclassified to paid-in capital. For tax purposes, distributions from short-term capital gains are considered to be from ordinary income.
The tax character of distributions declared for the year ended September 30, 2013, the nine months ended September 30, 2012 and the year ended December 31, 2011 for AMT-Free Fund was as follows:
| | | | | | | | | | | | |
| | | Year Ended
September 30, 2013 | | | Nine Months Ended
September 30, 2012 | | | Year Ended
December 31, 2011 | |
| | | |
Distributions declared from: | | | | | | | | | | | | |
Tax-exempt income | | $ | 18,624,250 | | | $ | 14,879,965 | | | $ | 23,022,757 | |
Ordinary income | | $ | 28,334 | | | $ | 56,045 | | | $ | 39,547 | |
The tax character of distributions declared for the years ended September 30, 2013 and September 30, 2012 for National Fund was as follows:
| | | | | | | | |
| | | Year Ended September 30, | |
| | | 2013 | | | 2012 | |
| | |
Distributions declared from: | | | | | | | | |
Tax-exempt income | | $ | 211,242,408 | | | $ | 225,587,022 | |
Ordinary income | | $ | 8,556,109 | | | $ | 6,138,510 | |
During the year ended September 30, 2013, the following amounts were reclassified due to expired capital loss carryfowards and differences between book and tax accounting, primarily for defaulted bond interest, expenditures on defaulted bonds and accretion of market discount.
| | | | | | | | |
| | | AMT-Free
Fund | | | National
Fund | |
| | |
Change in: | | | | | | | | |
Paid-in capital | | $ | (1,429,405 | ) | | $ | (2,604,551 | ) |
Accumulated net realized loss | | $ | 1,508,668 | | | $ | 1,829,631 | |
Accumulated undistributed net investment income | | $ | (79,263 | ) | | $ | 774,920 | |
These reclassifications had no effect on the net assets or net asset value per share of the Funds.
As of September 30, 2013, the components of distributable earnings (accumulated losses) and unrealized appreciation (depreciation) on a tax basis were as follows:
| | | | | | | | |
| | | AMT-Free
Fund | | | National
Fund | |
| | |
Undistributed tax-exempt income | | $ | 1,787,897 | | | $ | 13,798,694 | |
Capital loss carryforward and deferred capital losses | | $ | (139,665,617 | ) | | $ | (1,335,371,860 | ) |
Net unrealized appreciation | | $ | 19,961,743 | | | $ | 100,516,270 | |
Other temporary differences | | $ | (249,262 | ) | | $ | (2,778,799 | ) |
Eaton Vance
Municipal Income Funds
September 30, 2013
Notes to Financial Statements — continued
The differences between components of distributable earnings (accumulated losses) on a tax basis and the amounts reflected in the Statements of Assets and Liabilities are primarily due to wash sales, futures contracts, residual interest bonds, accretion of market discount, expenditures on defaulted bonds, defaulted bond interest and the timing of recognizing distributions to shareholders.
3 Investment Adviser Fee and Other Transactions with Affiliates
The investment adviser fee is earned by Eaton Vance Management (EVM) for AMT-Free Fund and Boston Management and Research (BMR), a subsidiary of EVM, for National Fund as compensation for management and investment advisory services rendered to each Fund. The fee is based upon a percentage of average daily net assets plus a percentage of gross income (i.e., income other than gains from the sale of securities) as presented in the following table and is payable monthly.
| | | | | | | | |
| Daily Net Assets | | Annual Asset
Rate | | | Daily Income
Rate | |
| | |
Up to $500 million | | | 0.300 | % | | | 3.00 | % |
$500 million up to $1billion | | | 0.275 | | | | 2.75 | |
$1 billion up to $1.5 billion | | | 0.250 | | | | 2.50 | |
$1.5 billion up to $2 billion | | | 0.225 | | | | 2.25 | |
$2 billion up to $3 billion | | | 0.200 | | | | 2.00 | |
$3 billion and over | | | 0.175 | | | | 1.75 | |
For the year ended September 30, 2013, investment adviser fees incurred by the Funds and the effective annual rates, as a percentage of average daily net assets, were as follows:
| | | | | | | | |
| | | AMT-Free
Fund | | | National
Fund | |
| | |
Investment Adviser Fee | | $ | 2,005,847 | | | $ | 15,975,462 | |
Effective Annual Rate | | | 0.45 | % | | | 0.33 | % |
EVM serves as administrator of each Fund, but receives no compensation. EVM serves as the sub-transfer agent of each Fund and receives from the transfer agent an aggregate fee based upon the actual expenses incurred by EVM in the performance of these services. Eaton Vance Distributors, Inc. (EVD), an affiliate of EVM and the Funds’ principal underwriter, received a portion of the sales charge on sales of Class A shares of the Funds. EVD also received distribution and service fees from Class A, Class B and Class C shares (see Note 4) and contingent deferred sales charges (see Note 5). Sub-transfer agent fees earned by EVM and Class A sales charges that the Funds were informed were received by EVD for the year ended September 30, 2013 were as follows:
| | | | | | | | |
| | | AMT-Free
Fund | | | National
Fund | |
| | |
EVM’s Sub-Transfer Agent Fees | | $ | 5,637 | | | $ | 67,205 | |
EVD’s Class A Sales Charges | | $ | 31,454 | | | $ | 374,768 | |
Trustees and officers of the Funds who are members of EVM’s or BMR’s organizations receive remuneration for their services to the Funds out of the investment adviser fee. Trustees of the Funds who are not affiliated with the investment advisers may elect to defer receipt of all or a percentage of their annual fees in accordance with the terms of the Trustees Deferred Compensation Plan. For the year ended September 30, 2013, no significant amounts have been deferred. Certain officers and Trustees of the Funds are officers of the above organizations.
4 Distribution Plans
Each Fund has in effect a distribution plan for Class A shares (Class A Plan) pursuant to Rule 12b-1 under the 1940 Act. Pursuant to the Class A Plan, each Fund pays EVD a distribution and service fee of 0.25% per annum of its average daily net assets attributable to Class A shares for distribution
Eaton Vance
Municipal Income Funds
September 30, 2013
Notes to Financial Statements — continued
services and facilities provided to each Fund by EVD, as well as for personal services and/or the maintenance of shareholder accounts. Distribution and service fees paid or accrued to EVD for the year ended September 30, 2013 for Class A shares amounted to the following:
| | | | | | | | |
| | | AMT-Free
Fund | | | National
Fund | |
| | |
Class A Distribution and Service Fees | | $ | 685,478 | | | $ | 6,713,598 | |
Each Fund also has in effect distribution plans for Class B shares (Class B Plan) and Class C shares (Class C Plan) pursuant to Rule 12b-1 under the 1940 Act. Pursuant to the Class B and Class C Plans, each Fund pays EVD amounts equal to 0.75% per annum of its average daily net assets attributable to Class B and Class C shares for providing ongoing distribution services and facilities to the respective Funds. For the year ended September 30, 2013, the Funds paid or accrued to EVD the following distribution fees:
| | | | | | | | |
| | | AMT-Free
Fund | | | National
Fund | |
| | |
Class B Distribution Fees | | $ | 30,725 | | | $ | 636,970 | |
Class C Distribution Fees | | $ | 372,595 | | | $ | 6,713,307 | |
Pursuant to the Class B and Class C Plans, each Fund also makes payments of service fees to EVD, financial intermediaries and other persons in amounts equal to 0.25% per annum of the average daily net assets attributable to that class. Service fees paid or accrued are for personal services and/or the maintenance of shareholder accounts. They are separate and distinct from the sales commissions and distribution fees payable to EVD. Service fees paid or accrued for the year ended September 30, 2013 amounted to the following:
| | | | | | | | |
| | | AMT-Free
Fund | | | National
Fund | |
| | |
Class B Service Fees | | $ | 10,242 | | | $ | 212,323 | |
Class C Service Fees | | $ | 124,198 | | | $ | 2,237,769 | |
5 Contingent Deferred Sales Charges
A contingent deferred sales charge (CDSC) generally is imposed on redemptions of Class B shares made within six years of purchase and on redemptions of Class C shares made within one year of purchase. Class A shares may be subject to a 1% CDSC if redeemed within eighteen months of purchase (depending on the circumstances of purchase). Generally, the CDSC is based upon the lower of the net asset value at date of redemption or date of purchase. No charge is levied on shares acquired by reinvestment of dividends or capital gain distributions. The CDSC for Class B shares is imposed at declining rates that begin at 5% in the case of redemptions in the first and second year after purchase, declining one percentage point each subsequent year. Class C shares are subject to a 1% CDSC if redeemed within one year of purchase. For the year ended September 30, 2013, the Funds were informed that EVD received approximately the following amounts of CDSCs paid by Class A, Class B and Class C shareholders:
| | | | | | | | |
| | | AMT-Free
Fund | | | National
Fund | |
| | |
Class A | | $ | 14,000 | | | $ | 531,000 | |
Class B | | $ | 4,000 | | | $ | 124,000 | |
Class C | | $ | 4,000 | | | $ | 88,000 | |
Eaton Vance
Municipal Income Funds
September 30, 2013
Notes to Financial Statements — continued
6 Purchases and Sales of Investments
Purchases and sales of investments, other than short-term obligations, for the year ended September 30, 2013 were as follows:
| | | | | | | | |
| | | AMT-Free
Fund | | | National Fund | |
| | |
Purchases | | $ | 150,793,273 | | | $ | 4,039,738,748 | |
Sales | | $ | 222,460,677 | | | $ | 5,028,870,467 | |
7 Shares of Beneficial Interest
Each Fund’s Declaration of Trust permits the Trustees to issue an unlimited number of full and fractional shares of beneficial interest (without par value). Such shares may be issued in a number of different series (such as the Funds) and classes. Transactions in Fund shares were as follows:
| | | | | | | | | | | | |
AMT-Free Fund | | | | | | | | | |
| Class A | | Year Ended
September 30, 2013 | | | Nine Months Ended
September 30, 2012 | | | Year Ended
December 31, 2011 | |
| | | |
Sales | | | 3,405,698 | | | | 3,629,796 | | | | 6,686,640 | |
Issued to shareholders electing to receive payments of distributions in Fund shares | | | 1,082,007 | | | | 887,574 | | | | 1,380,238 | |
Redemptions | | | (9,322,342 | ) | | | (8,112,300 | ) | | | (16,233,014 | ) |
Exchange from Class B shares | | | 140,237 | | | | 288,058 | | | | 503,584 | |
| | | |
Net decrease | | | (4,694,400 | ) | | | (3,306,872 | ) | | | (7,662,552 | ) |
| | | |
| | | | | | | | | | | | |
| Class B | | Year Ended
September 30, 2013 | | | Nine Months Ended
September 30, 2012 | | | Year Ended
December 31, 2011 | |
| | | |
Sales | | | 11,525 | | | | 36,623 | | | | 54,142 | |
Issued to shareholders electing to receive payments of distributions in Fund shares | | | 11,397 | | | | 12,216 | | | | 33,023 | |
Redemptions | | | (95,114 | ) | | | (94,870 | ) | | | (276,880 | ) |
Exchange to Class A shares | | | (141,123 | ) | | | (289,671 | ) | | | (506,469 | ) |
| | | |
Net decrease | | | (213,315 | ) | | | (335,702 | ) | | | (696,184 | ) |
| | | |
| | | | | | | | | | | | |
| Class C | | Year Ended
September 30, 2013 | | | Nine Months Ended
September 30, 2012 | | | Year Ended
December 31, 2011 | |
| | | |
Sales | | | 809,123 | | | | 654,771 | | | | 667,393 | |
Issued to shareholders electing to receive payments of distributions in Fund shares | | | 134,585 | | | | 91,222 | | | | 142,188 | |
Redemptions | | | (1,458,729 | ) | | | (487,033 | ) | | | (1,903,690 | ) |
| | | |
Net increase (decrease) | | | (515,021 | ) | | | 258,960 | | | | (1,094,109 | ) |
| | | |
| | | | | | | | | | | | |
| Class I | | Year Ended
September 30, 2013 | | | Nine Months Ended
September 30, 2012 | | | Year Ended
December 31, 2011 | |
| | | |
Sales | | | 3,433,940 | | | | 2,797,000 | | | | 2,470,334 | |
Issued to shareholders electing to receive payments of distributions in Fund shares | | | 356,856 | | | | 259,889 | | | | 352,435 | |
Redemptions | | | (5,265,927 | ) | | | (1,611,882 | ) | | | (6,601,329 | ) |
| | | |
Net increase (decrease) | | | (1,475,131 | ) | | | 1,445,007 | | | | (3,778,560 | ) |
Eaton Vance
Municipal Income Funds
September 30, 2013
Notes to Financial Statements — continued
| | | | | | | | |
National Fund | | | | | | |
| | | Year Ended September 30, | |
| Class A | | 2013 | | | 2012 | |
| | |
Sales | | | 32,042,158 | | | | 32,466,746 | |
Issued to shareholders electing to receive payments of distributions in Fund shares | | | 10,357,719 | | | | 11,281,344 | |
Redemptions | | | (103,145,637 | ) | | | (60,345,084 | ) |
Exchange from Class B shares | | | 1,619,016 | | | | 1,455,731 | |
| | |
Net decrease | | | (59,126,744 | ) | | | (15,141,263 | ) |
| | |
| | | | | | | | |
| | | Year Ended September 30, | |
| Class B | | 2013 | | | 2012 | |
| | |
Sales | | | 100,073 | | | | 207,352 | |
Issued to shareholders electing to receive payments of distributions in Fund shares | | | 265,665 | | | | 369,639 | |
Redemptions | | | (2,449,635 | ) | | | (2,027,550 | ) |
Exchange to Class A shares | | | (1,618,985 | ) | | | (1,455,864 | ) |
| | |
Net decrease | | | (3,702,882 | ) | | | (2,906,423 | ) |
| | |
| | | | | | | | |
| | | Year Ended September 30, | |
| Class C | | 2013 | | | 2012 | |
| | |
Sales | | | 7,152,788 | | | | 10,979,045 | |
Issued to shareholders electing to receive payments of distributions in Fund shares | | | 2,573,627 | | | | 2,752,860 | |
Redemptions | | | (31,665,464 | ) | | | (17,219,521 | ) |
| | |
Net decrease | | | (21,939,049 | ) | | | (3,487,616 | ) |
| | |
| | | | | | | | |
| | | Year Ended September 30, | |
| Class I | | 2013 | | | 2012 | |
| | |
Sales | | | 50,855,583 | | | | 54,466,388 | |
Issued to shareholders electing to receive payments of distributions in Fund shares | | | 4,860,784 | | | | 3,682,402 | |
Redemptions | | | (60,698,403 | ) | | | (31,293,652 | ) |
| | |
Net increase (decrease) | | | (4,982,036 | ) | | | 26,855,138 | |
Eaton Vance
Municipal Income Funds
September 30, 2013
Notes to Financial Statements — continued
8 Federal Income Tax Basis of Investments
The cost and unrealized appreciation (depreciation) of investments of each Fund at September 30, 2013, as determined on a federal income tax basis, were as follows:
| | | | | | | | |
| | | AMT-Free
Fund | | | National
Fund | |
| | |
Aggregate cost | | $ | 338,835,930 | | | $ | 3,721,016,540 | |
Gross unrealized appreciation | | $ | 29,803,038 | | | $ | 303,808,800 | |
Gross unrealized depreciation | | | (9,841,295 | ) | | | (203,292,530 | ) |
| | |
Net unrealized appreciation | | $ | 19,961,743 | | | $ | 100,516,270 | |
9 Line of Credit
The Funds participate with other portfolios and funds managed by EVM and its affiliates in a $750 million unsecured line of credit agreement with a group of banks. Borrowings are made by the Funds solely to facilitate the handling of unusual and/or unanticipated short-term cash requirements. Interest is charged to each Fund based on its borrowings at an amount above either the Eurodollar rate or Federal Funds rate. In addition, a fee computed at an annual rate of 0.08% on the daily unused portion of the line of credit is allocated among the participating portfolios and funds at the end of each quarter. Because the line of credit is not available exclusively to the Funds, a Fund may be unable to borrow some or all of its requested amounts at any particular time. The Funds did not have any significant borrowings or allocated fees during the year ended September 30, 2013.
10 Financial Instruments
The Funds may trade in financial instruments with off-balance sheet risk in the normal course of their investing activities. These financial instruments may include financial futures contracts and may involve, to a varying degree, elements of risk in excess of the amounts recognized for financial statement purposes. The notional or contractual amounts of these instruments represent the investment a Fund has in particular classes of financial instruments and do not necessarily represent the amounts potentially subject to risk. The measurement of the risks associated with these instruments is meaningful only when all related and offsetting transactions are considered.
A summary of obligations under these financial instruments at September 30, 2013 is as follows:
| | | | | | | | | | | | | | | | | | | | |
| Futures Contracts | |
| Fund | | Expiration
Month/Year | | | Contracts | | Position | | Aggregate Cost | | | Value | | | Net Unrealized
Depreciation | |
| | | | | | |
| AMT-Free | | | 12/13 | | | 325 U.S. 10-Year Treasury Note | | Short | | $ | (40,266,397 | ) | | $ | (41,076,953 | ) | | $ | (810,556 | ) |
| | | | 12/13 | | | 182 U.S. Long Treasury Bond | | Short | | | (23,982,433 | ) | | | (24,274,250 | ) | | | (291,817 | ) |
| National | | | 12/13 | | | 3,000 U.S. Long Treasury Bond | | Short | | $ | (397,877,324 | ) | | $ | (400,125,000 | ) | | $ | (2,247,676 | ) |
At September 30, 2013, the Funds had sufficient cash and/or securities to cover commitments under these contracts.
Each Fund is subject to interest rate risk in the normal course of pursuing its investment objective. Because the Funds hold fixed-rate bonds, the value of these bonds may decrease if interest rates rise. The Funds purchase and sell U.S. Treasury futures contracts to hedge against changes in interest rates.
Eaton Vance
Municipal Income Funds
September 30, 2013
Notes to Financial Statements — continued
The fair value of open derivative instruments (not considered to be hedging instruments for accounting disclosure purposes) and whose primary underlying risk exposure is interest rate risk at September 30, 2013 were as follows:
| | | | | | | | |
| | | AMT-Free Fund | | | National Fund | |
| | |
Liability Derivative: | | | | | | | | |
Futures Contracts | | $ | (1,102,373 | )(1) | | $ | (2,247,676 | )(1) |
| | |
Total | | $ | (1,102,373 | ) | | $ | (2,247,676 | ) |
| (1) | Amount represents cumulative unrealized depreciation on futures contracts in the Futures Contracts table above. Only the current day’s variation margin on open futures contracts is reported within the Statement of Assets and Liabilities as Receivable or Payable for variation margin, as applicable. |
The effect of derivative instruments (not considered to be hedging instruments for accounting disclosure purposes) on the Statement of Operations and whose primary underlying risk exposure is interest rate risk for the year ended September 30, 2013 was as follows:
| | | | | | | | |
| | | AMT-Free
Fund | | | National Fund | |
| | |
Realized Gain (Loss) on Derivatives Recognized in Income | | $ | 3,962,473 | (1) | | $ | 27,068,787 | (1) |
Change in Unrealized Appreciation (Depreciation) on Derivatives Recognized in Income | | $ | (921,984 | )(2) | | $ | (6,266,614 | )(2) |
| (1) | Statement of Operations location: Net realized gain (loss) – Financial futures contracts. |
| (2) | Statement of Operations location: Change in unrealized appreciation (depreciation) – Financial futures contracts. |
The average notional amounts of futures contracts outstanding during the year ended September 30, 2013, which are indicative of the volume of this derivative type, were approximately as follows:
| | | | | | | | |
| | | AMT-Free Fund | | | National Fund | |
| | |
Average Notional Amount: | | | | | | | | |
Futures Contracts | | $ | 50,700,000 | | | $ | 530,769,000 | |
11 Fair Value Measurements
Under generally accepted accounting principles for fair value measurements, a three-tier hierarchy to prioritize the assumptions, referred to as inputs, is used in valuation techniques to measure fair value. The three-tier hierarchy of inputs is summarized in the three broad levels listed below.
| Ÿ | | Level 1 – quoted prices in active markets for identical investments |
| Ÿ | | Level 2 – other significant observable inputs (including quoted prices for similar investments, interest rates, prepayment speeds, credit risk, etc.) |
| Ÿ | | Level 3 – significant unobservable inputs (including a fund’s own assumptions in determining the fair value of investments) |
In cases where the inputs used to measure fair value fall in different levels of the fair value hierarchy, the level disclosed is determined based on the lowest level input that is significant to the fair value measurement in its entirety. The inputs or methodology used for valuing securities are not necessarily an indication of the risk associated with investing in those securities.
Eaton Vance
Municipal Income Funds
September 30, 2013
Notes to Financial Statements — continued
At September 30, 2013, the hierarchy of inputs used in valuing the Funds’ investments and open derivative instruments, which are carried at value, were as follows:
| | | | | | | | | | | | | | | | |
AMT-Free Fund | |
| Asset Description | | Level 1 | | | Level 2 | | | Level 3 | | | Total | |
| | | | |
Tax-Exempt Investments | | $ | — | | | $ | 412,392,673 | | | $ | — | | | $ | 412,392,673 | |
| | | | |
Total Investments | | $ | — | | | $ | 412,392,673 | | | $ | — | | | $ | 412,392,673 | |
| | | | |
Liability Description | | | | | | | | | | | | | | | | |
Futures Contracts | | $ | (1,102,373 | ) | | $ | — | | | $ | — | | | $ | (1,102,373 | ) |
| | | | |
Total | | $ | (1,102,373 | ) | | $ | — | | | $ | — | | | $ | (1,102,373 | ) |
| | | | |
| | | | | | | | | | | | | | | | |
National Fund | |
| Asset Description | | Level 1 | | | Level 2 | | | Level 3 | | | Total | |
| | | | |
Tax-Exempt Municipal Securities | | $ | — | | | $ | 4,416,542,489 | | | $ | — | | | $ | 4,416,542,489 | |
Taxable Municipal Securities | | | — | | | | 22,015,321 | | | | — | | | | 22,015,321 | |
| | | | |
Total Investments | | $ | — | | | $ | 4,438,557,810 | | | $ | — | | | $ | 4,438,557,810 | |
| | | | |
Liability Description | | | | | | | | | | | | | | | | |
Futures Contracts | | $ | (2,247,676 | ) | | $ | — | | | $ | — | | | $ | (2,247,676 | ) |
| | | | |
Total | | $ | (2,247,676 | ) | | $ | — | | | $ | — | | | $ | (2,247,676 | ) |
The Funds held no investments or other financial instruments as of September 30, 2012 whose fair value was determined using Level 3 inputs. At September 30, 2013, there were no investments transferred between Level 1 and Level 2 during the year then ended.
Eaton Vance
Municipal Income Funds
September 30, 2013
Report of Independent Registered Public Accounting Firm
To the Trustees of Eaton Vance Mutual Funds Trust and Shareholders of Eaton Vance AMT-Free Municipal Income Fund:
We have audited the accompanying statement of assets and liabilities of Eaton Vance AMT-Free Municipal Income Fund (the “Fund”) (one of the funds constituting Eaton Vance Mutual Funds Trust), including the portfolio of investments, as of September 30, 2013, and the related statements of operations and cash flows for the year then ended, the statements of changes in net assets for the year then ended, for the nine month period ended September 30, 2012, and for the year ended December 31, 2011, and the financial highlights for the year then ended, for the nine month period ended September 30, 2012, and for each of the four years in the period ended December 31, 2011. These financial statements and financial highlights are the responsibility of the Fund’s management. Our responsibility is to express an opinion on these financial statements and financial highlights based on our audits.
We conducted our audits in accordance with the standards of the Public Company Accounting Oversight Board (United States). Those standards require that we plan and perform the audit to obtain reasonable assurance about whether the financial statements and financial highlights are free of material misstatement. The Fund is not required to have, nor were we engaged to perform, an audit of its internal control over financial reporting. Our audits included consideration of internal control over financial reporting as a basis for designing audit procedures that are appropriate in the circumstances, but not for the purpose of expressing an opinion on the effectiveness of the Fund’s internal control over financial reporting. Accordingly, we express no such opinion. An audit also includes examining, on a test basis, evidence supporting the amounts and disclosures in the financial statements, assessing the accounting principles used and significant estimates made by management, as well as evaluating the overall financial statement presentation. Our procedures included confirmation of securities owned as of September 30, 2013, by correspondence with the custodian and brokers; where replies were not received from brokers, we performed other auditing procedures. We believe that our audits provide a reasonable basis for our opinion.
In our opinion, such financial statements and financial highlights referred to above present fairly, in all material respects, the financial position of Eaton Vance AMT-Free Municipal Income Fund as of September 30, 2013, the results of its operations and its cash flows for the year then ended, the changes in its net assets for the year then ended, for the nine month period ended September 30, 2012, and for the year ended December 31, 2011, and the financial highlights for the year then ended, for the nine month period ended September 30, 2012, and for each of the four years in the period ended December 31, 2011, in conformity with accounting principles generally accepted in the United States of America.
DELOITTE & TOUCHE LLP
Boston, Massachusetts
November 18, 2013
Eaton Vance
Municipal Income Funds
September 30, 2013
Report of Independent Registered Public Accounting Firm
To the Trustees of Eaton Vance Municipals Trust and Shareholders of Eaton Vance National Municipal Income Fund:
We have audited the accompanying statement of assets and liabilities of Eaton Vance National Municipal Income Fund (the “Fund”) (one of the funds constituting Eaton Vance Municipals Trust), including the portfolio of investments, as of September 30, 2013, and the related statements of operations and cash flows for the year then ended, the statements of changes in net assets for each of the two years in the period then ended, and the financial highlights for each of the five years in the period then ended. These financial statements and financial highlights are the responsibility of the Fund’s management. Our responsibility is to express an opinion on these financial statements and financial highlights based on our audits.
We conducted our audits in accordance with the standards of the Public Company Accounting Oversight Board (United States). Those standards require that we plan and perform the audit to obtain reasonable assurance about whether the financial statements and financial highlights are free of material misstatement. The Fund is not required to have, nor were we engaged to perform, an audit of its internal control over financial reporting. Our audits included consideration of internal control over financial reporting as a basis for designing audit procedures that are appropriate in the circumstances, but not for the purpose of expressing an opinion on the effectiveness of the Fund’s internal control over financial reporting. Accordingly, we express no such opinion. An audit also includes examining, on a test basis, evidence supporting the amounts and disclosures in the financial statements, assessing the accounting principles used and significant estimates made by management, as well as evaluating the overall financial statement presentation. Our procedures included confirmation of securities owned as of September 30, 2013, by correspondence with the custodian and brokers; where replies were not received from brokers, we performed other auditing procedures. We believe that our audits provide a reasonable basis for our opinion.
In our opinion, such financial statements and financial highlights referred to above present fairly, in all material respects, the financial position of Eaton Vance National Municipal Income Fund as of September 30, 2013, the results of its operations and its cash flows for the year then ended, the changes in its net assets for each of the two years in the period then ended, and the financial highlights for each of the five years in the period then ended, in conformity with accounting principles generally accepted in the United States of America.
DELOITTE & TOUCHE LLP
Boston, Massachusetts
November 18, 2013
Eaton Vance
Municipal Income Funds
September 30, 2013
Federal Tax Information (Unaudited)
The Form 1099-DIV you receive in January 2014 will show the tax status of all distributions paid to your account in calendar year 2013. Shareholders are advised to consult their own tax adviser with respect to the tax consequences of their investment in the Funds. As required by the Internal Revenue Code and/or regulations, shareholders must be notified regarding exempt-interest dividends.
Exempt-Interest Dividends. The Funds designate the following percentages of distributions as exempt-interest dividends:
| | | | |
AMT-Free Municipal Income Fund | | | 98.85 | % |
National Municipal Income Fund | | | 96.11 | % |
Eaton Vance
Municipal Income Funds
September 30, 2013
Board of Trustees’ Contract Approval
Overview of the Contract Review Process
The Investment Company Act of 1940, as amended (the “1940 Act”), provides, in substance, that each investment advisory agreement between a fund and its investment adviser will continue in effect from year to year only if its continuation is approved at least annually by the fund’s board of trustees, including by a vote of a majority of the trustees who are not “interested persons” of the fund (“Independent Trustees”), cast in person at a meeting called for the purpose of considering such approval.
At a meeting of the Boards of Trustees (each a “Board”) of the Eaton Vance group of mutual funds (the “Eaton Vance Funds”) held on April 23, 2013, the Board, including a majority of the Independent Trustees, voted to approve continuation of existing advisory and sub-advisory agreements for the Eaton Vance Funds for an additional one-year period. In voting its approval, the Board relied upon the affirmative recommendation of the Contract Review Committee of the Board, which is a committee comprised exclusively of Independent Trustees. Prior to making its recommendation, the Contract Review Committee reviewed information furnished by each adviser to the Eaton Vance Funds (including information specifically requested by the Board) for a series of meetings of the Contract Review Committee held between February and April 2013, as well as information considered during prior meetings of the committee. Such information included, among other things, the following:
Information about Fees, Performance and Expenses
| Ÿ | | An independent report comparing the advisory and related fees paid by each fund with fees paid by comparable funds; |
| Ÿ | | An independent report comparing each fund’s total expense ratio and its components to comparable funds; |
| Ÿ | | An independent report comparing the investment performance of each fund (including, where relevant, yield data, Sharpe ratios and information ratios) to the investment performance of comparable funds over various time periods; |
| Ÿ | | Data regarding investment performance in comparison to benchmark indices and customized peer groups, in each case as approved by the Board with respect to the funds; |
| Ÿ | | For each fund, comparative information concerning the fees charged and the services provided by each adviser in managing other accounts (including mutual funds, other collective investment funds and institutional accounts) using investment strategies and techniques similar to those used in managing such fund; |
| Ÿ | | Profitability analyses for each adviser with respect to each fund; |
Information about Portfolio Management and Trading
| Ÿ | | Descriptions of the investment management services provided to each fund, including the investment strategies and processes employed, and any changes in portfolio management processes and personnel; |
| Ÿ | | Information about the allocation of brokerage and the benefits received by each adviser as a result of brokerage allocation, including information concerning the acquisition of research through client commission arrangements and the fund’s policies with respect to “soft dollar” arrangements; |
| Ÿ | | Data relating to portfolio turnover rates of each fund; |
| Ÿ | | The procedures and processes used to determine the fair value of fund assets and actions taken to monitor and test the effectiveness of such procedures and processes; |
| Ÿ | | Information about each adviser’s processes for monitoring best execution of portfolio transactions, and other policies and practices of each adviser with respect to trading; |
Information about each Adviser
| Ÿ | | Reports detailing the financial results and condition of each adviser; |
| Ÿ | | Descriptions of the qualifications, education and experience of the individual investment professionals whose responsibilities include portfolio management and investment research for the funds, and information relating to their compensation and responsibilities with respect to managing other mutual funds and investment accounts; |
| Ÿ | | Copies of the Codes of Ethics of each adviser and its affiliates, together with information relating to compliance with and the administration of such codes; |
| Ÿ | | Copies of or descriptions of each adviser’s policies and procedures relating to proxy voting, the handling of corporate actions and class actions; |
| Ÿ | | Information concerning the resources devoted to compliance efforts undertaken by each adviser and its affiliates on behalf of the funds (including descriptions of various compliance programs) and their record of compliance with investment policies and restrictions, including policies with respect to market-timing, late trading and selective portfolio disclosure, and with policies on personal securities transactions; |
| Ÿ | | Descriptions of the business continuity and disaster recovery plans of each adviser and its affiliates; |
| Ÿ | | A description of Eaton Vance Management’s procedures for overseeing third party advisers and sub-advisers, including with respect to regulatory and compliance issues, investment management and other matters; |
Eaton Vance
Municipal Income Funds
September 30, 2013
Board of Trustees’ Contract Approval — continued
Other Relevant Information
| Ÿ | | Information concerning the nature, cost and character of the administrative and other non-investment management services provided by Eaton Vance Management and its affiliates; |
| Ÿ | | Information concerning management of the relationship with the custodian, subcustodians and fund accountants by each adviser or the funds’ administrator; and |
| Ÿ | | The terms of each advisory agreement. |
In addition to the information identified above, the Contract Review Committee considered information provided from time to time by each adviser throughout the year at meetings of the Board and its committees. Over the course of the twelve-month period ended April 30, 2013, with respect to one or more funds, the Board met eight times and the Contract Review Committee, the Audit Committee, the Governance Committee, the Portfolio Management Committee and the Compliance Reports and Regulatory Matters Committee, each of which is a Committee comprised solely of Independent Trustees, met eight, twenty-one, five, nine and thirteen times respectively. At such meetings, the Trustees participated in investment and performance reviews with the portfolio managers and other investment professionals of each adviser relating to each fund. The Board and its Committees considered the investment and trading strategies used in pursuing each fund’s investment objective, including, where relevant, the use of derivative instruments, as well as processes for monitoring best execution of portfolio transactions risk management techniques. The Board and its Committees also evaluated issues pertaining to industry and regulatory developments, compliance procedures, fund governance and other issues with respect to the funds, and received and participated in reports and presentations provided by Eaton Vance Management and other fund advisers with respect to such matters.
For funds that invest through one or more underlying portfolios, the Board considered similar information about the portfolio(s) when considering the approval of advisory agreements. In addition, in cases where the fund’s investment adviser has engaged a sub-adviser, the Board considered similar information about the sub-adviser when considering the approval of any sub-advisory agreement.
The Contract Review Committee was assisted throughout the contract review process by Goodwin Procter LLP, legal counsel for the Independent Trustees. The members of the Contract Review Committee relied upon the advice of such counsel and their own business judgment in determining the material factors to be considered in evaluating each advisory and sub-advisory agreement and the weight to be given to each such factor. The conclusions reached with respect to each advisory and sub-advisory agreement were based on a comprehensive evaluation of all the information provided and not any single factor. Moreover, each member of the Contract Review Committee may have placed varying emphasis on particular factors in reaching conclusions with respect to each advisory and sub-advisory agreement.
Results of the Process
Based on its consideration of the foregoing, and such other information as it deemed relevant, including the factors and conclusions described below, the Contract Review Committee concluded that the continuation of the investment advisory agreements of the following funds:
| Ÿ | | Eaton Vance AMT-Free Municipal Income Fund |
| Ÿ | | Eaton Vance National Municipal Income Fund |
(the “Funds”), each with Eaton Vance Management or an affiliate (the “Adviser”), including their fee structures, is in the interests of shareholders and, therefore, the Contract Review Committee recommended to the Board approval of each agreement. The Board accepted the recommendation of the Contract Review Committee as well as the factors considered and conclusions reached by the Contract Review Committee with respect to each agreement. Accordingly, the Board, including a majority of the Independent Trustees, voted to approve continuation of the investment advisory agreement for each Fund.
Nature, Extent and Quality of Services
In considering whether to approve the investment advisory agreements of the Funds, the Board evaluated the nature, extent and quality of services provided to the Funds by the Adviser.
The Board considered the Adviser’s management capabilities and investment process with respect to the types of investments held by each Fund, including the education, experience and number of its investment professionals and other personnel who provide portfolio management, investment research, and similar services to the Funds. In particular, the Board considered, where relevant, the abilities and experience of such investment personnel in analyzing factors such as credit risk, tax efficiency, and special considerations relevant to investing in municipal obligations. The Board considered the Adviser’s large municipal bond team, which includes portfolio managers and credit specialists who provide services to the Funds. The Board also took into account the resources dedicated to portfolio management and other services, including the compensation methods of the Adviser to recruit and retain investment personnel, and the time and attention devoted to each Fund by senior management.
The Board reviewed the compliance programs of the Adviser and relevant affiliates thereof. Among other matters, the Board considered compliance and reporting matters relating to personal trading by investment personnel, selective disclosure of portfolio holdings, late trading, frequent trading, portfolio valuation, business continuity and the allocation of investment opportunities. The Board also evaluated the responses of the Adviser and its affiliates to requests in recent years from regulatory authorities such as the Securities and Exchange Commission and the Financial Industry Regulatory Authority.
Eaton Vance
Municipal Income Funds
September 30, 2013
Board of Trustees’ Contract Approval — continued
The Board considered shareholder and other administrative services provided or managed by Eaton Vance Management and its affiliates, including transfer agency and accounting services. The Board evaluated the benefits to shareholders of investing in a fund that is a part of a large family of funds, including the ability, in many cases, to exchange an investment among different funds without incurring additional sales charges.
After consideration of the foregoing factors, among others, the Board concluded that the nature, extent and quality of services provided by the Adviser, taken as a whole, are appropriate and consistent with the terms of the investment advisory agreements.
Fund Performance
The Board compared each Fund’s investment performance to a relevant universe of similarly managed funds identified by an independent data provider and appropriate benchmark indices and, where relevant, a customized peer group of similarly managed funds approved by the Board, and assessed each Fund’s performance on the basis of total return and current income return. The Board’s review included comparative performance data for the one-, three-, five- and ten-year periods ended September 30, 2012 for each Fund. The Board considered the impact of extraordinary market conditions in recent years on each Fund’s performance in light of, among other things, the Adviser’s efforts to generate competitive levels of tax exempt current income over time through investments that, relative to its peer universe, focus on higher quality municipal bonds with longer maturities. The Board noted that the Adviser had taken action to restructure each Fund’s portfolio as part of a long-term strategy for managing interest rate risk, consistent with each Fund’s objective of providing current income. The Board concluded that each Fund’s performance had been satisfactory on the basis of current income return, and that it was appropriate to continue to monitor the effectiveness of the actions taken by the Adviser to improve Fund performance on the basis of total return, which the Board noted had improved for periods ended as of December 31, 2012.
Management Fees and Expenses
The Board reviewed contractual investment advisory fee rates payable by each Fund (referred to as “management fees”). As part of its review, the Board considered the management fees and each Fund’s total expense ratio for the year ended September 30, 2012, as compared to a group of similarly managed funds selected by an independent data provider. The Board also considered factors that had an impact on Fund expense ratios, as identified by management in response to inquiries from the Contract Review Committee, as well as actions taken by management in recent years to reduce expenses at the Eaton Vance fund complex level, including the negotiation of reduced fees for transfer agency and custody services.
After reviewing the foregoing information, and in light of the nature, extent and quality of the services provided by the Adviser, the Board concluded that the management fees charged for advisory and related services are reasonable.
Profitability
The Board reviewed the level of profits realized by the Adviser and relevant affiliates thereof in providing investment advisory and administrative services to each Fund and to all Eaton Vance Funds as a group. The Board considered the level of profits realized without regard to revenue sharing or other payments by the Adviser and its affiliates to third parties in respect of distribution services. The Board also considered other direct or indirect benefits received by the Adviser and its affiliates in connection with their relationships with the Funds, including the benefits of research services that may be available to the Adviser as a result of securities transactions effected for the Funds and other investment advisory clients.
The Board concluded that, in light of the foregoing factors and the nature, extent and quality of the services rendered, the profits realized by the Adviser and its affiliates are reasonable.
Economies of Scale
In reviewing management fees and profitability, the Board also considered the extent to which the Adviser and its affiliates, on the one hand, and each Fund, on the other hand, can expect to realize benefits from economies of scale as the assets of each Fund increase. The Board acknowledged the difficulty in accurately measuring the benefits resulting from the economies of scale with respect to the management of any specific fund or group of funds. The Board reviewed data summarizing the increases and decreases in the assets of each Fund and of all Eaton Vance Funds as a group over various time periods, and evaluated the extent to which the total expense ratio of each Fund and the profitability of the Adviser and its affiliates may have been affected by such increases or decreases. Based upon the foregoing, the Board concluded that each Fund currently shares in the benefits from economies of scale. The Board also concluded that, assuming reasonably foreseeable increases in the assets of each Fund, the structure of each advisory fee, which includes breakpoints at several asset levels, will allow each Fund to continue to benefit from economies of scale in the future.
Eaton Vance
Municipal Income Funds
September 30, 2013
Management and Organization
Fund Management. The Trustees of Eaton Vance Municipals Trust (MT) and Eaton Vance Mutual Funds Trust (MFT) (collectively, the Trusts) are responsible for the overall management and supervision of the Trusts’ affairs. The Trustees and officers of the Trusts are listed below. Except as indicated, each individual has held the office shown or other offices in the same company for the last five years. Trustees and officers of the Trusts hold indefinite terms of office. The “Noninterested Trustees” consist of those Trustees who are not “interested persons” of the Trusts, as that term is defined under the 1940 Act. The business address of each Trustee and officer is Two International Place, Boston, Massachusetts 02110. As used below, “EVC” refers to Eaton Vance Corp., “EV” refers to Eaton Vance, Inc., “EVM” refers to Eaton Vance Management, “BMR” refers to Boston Management and Research and “EVD” refers to Eaton Vance Distributors, Inc. EVC and EV are the corporate parent and trustee, respectively, of EVM and BMR. EVD is the Funds’ principal underwriter and a wholly-owned subsidiary of EVC. Each officer affiliated with Eaton Vance may hold a position with other Eaton Vance affiliates that is comparable to his or her position with EVM listed below. Each Trustee oversees 190 portfolios in the Eaton Vance Complex (including all master and feeder funds in a master feeder structure). Each officer serves as an officer of certain other Eaton Vance funds. Each Trustee and officer serves until his or her successor is elected.
| | | | | | |
| Name and Year of Birth | | Position(s) with the Trusts | | Length of
Service | | Principal Occupation(s) and Directorships During Past Five Years and Other Relevant Experience |
Interested Trustee | | | | | | |
| | | |
Thomas E. Faust Jr. 1958 | | Trustee | | Since 2007 | | Chairman, Chief Executive Officer and President of EVC, Director and President of EV, Chief Executive Officer and President of EVM and BMR, and Director of EVD. Trustee and/or officer of 190 registered investment companies. Mr. Faust is an interested person because of his positions with EVM, BMR, EVD, EVC and EV, which are affiliates of the Trusts. Directorships in the Last Five Years.(1) Director of EVC and Hexavest Inc. |
Noninterested Trustees | | | | | | |
| | | |
Scott E. Eston 1956 | | Trustee | | Since 2011 | | Private investor. Formerly held various positions at Grantham, Mayo, Van Otterloo and Co., L.L.C. (investment management firm) (1997-2009), including Chief Operating Officer (2002-2009), Chief Financial Officer (1997-2009) and Chairman of the Executive Committee (2002-2008); President and Principal Executive Officer, GMO Trust (open-end registered investment company) (2006-2009). Former Partner, Coopers and Lybrand L.L.P. (now PricewaterhouseCoopers) (public accounting firm) (1987-1997). Directorships in the Last Five Years. None. |
| | | |
Benjamin C. Esty 1963 | | Trustee | | Since 2005 | | Roy and Elizabeth Simmons Professor of Business Administration and Finance Unit Head, Harvard University Graduate School of Business Administration. Directorships in the Last Five Years.(1) None. |
| | | |
Allen R. Freedman 1940 | | Trustee | | Since 2007 | | Private Investor. Former Chairman (2002-2004) and a Director (1983-2004) of Systems & Computer Technology Corp. (provider of software to higher education). Formerly, a Director of Loring Ward International (fund distributor) (2005-2007). Former Chairman and a Director of Indus International, Inc. (provider of enterprise management software to the power generating industry) (2005-2007). Former Chief Executive Officer of Assurant, Inc. (insurance provider) (1979-2000). Directorships in the Last Five Years.(1) Director of Stonemor Partners, L.P. (owner and operator of cemeteries). Formerly, Director of Assurant, Inc. (insurance provider) (1979-2011). |
| | | |
William H. Park 1947 | | Trustee | | Since 2003 | | Consultant and private investor. Formerly, Chief Financial Officer, Aveon Group L.P. (investment management firm) (2010-2011). Formerly, Vice Chairman, Commercial Industrial Finance Corp. (specialty finance company) (2006-2010). Formerly, President and Chief Executive Officer, Prizm Capital Management, LLC (investment management firm) (2002-2005). Formerly, Executive Vice President and Chief Financial Officer, United Asset Management Corporation (investment management firm) (1982-2001). Formerly, Senior Manager, Price Waterhouse (now PricewaterhouseCoopers) (an independent registered public accounting firm) (1972-1981). Directorships in the Last Five Years.(1) None. |
| | | |
Ronald A. Pearlman 1940 | | Trustee | | Since 2003 | | Professor of Law, Georgetown University Law Center. Formerly, Deputy Assistant Secretary (Tax Policy) and Assistant Secretary (Tax Policy), U.S. Department of the Treasury (1983-1985). Formerly, Chief of Staff, Joint Committee on Taxation, U.S. Congress (1988-1990). Directorships in the Last Five Years.(1) None. |
Eaton Vance
Municipal Income Funds
September 30, 2013
Management and Organization — continued
| | | | | | |
| Name and Year of Birth | | Position(s) with the Trusts | | Length of
Service | | Principal Occupation(s) and Directorships During Past Five Years and Other Relevant Experience |
Noninterested Trustees (continued) | | |
| | | |
Helen Frame Peters 1948 | | Trustee | | Since 2008 | | Professor of Finance, Carroll School of Management, Boston College. Formerly, Dean, Carroll School of Management, Boston College (2000-2002). Formerly, Chief Investment Officer, Fixed Income, Scudder Kemper Investments (investment management firm) (1998-1999). Formerly, Chief Investment Officer, Equity and Fixed Income, Colonial Management Associates (investment management firm) (1991-1998). Directorships in the Last Five Years.(1) Formerly, Director of BJ’s Wholesale Club, Inc. (wholesale club retailer) (2004-2011). Formerly, Trustee of SPDR Index Shares Funds and SPDR Series Trust (exchange traded funds) (2000-2009). Formerly, Director of Federal Home Loan Bank of Boston (a bank for banks) (2007-2009). |
| | | |
Lynn A. Stout 1957 | | Trustee | | Since 1998 | | Distinguished Professor of Corporate and Business Law, Jack G. Clarke Business Law Institute, Cornell University Law School. Formerly, the Paul Hastings Professor of Corporate and Securities Law (2006-2012) and Professor of Law (2001-2006), University of California at Los Angeles School of Law. Directorships in the Last Five Years.(1) None. |
| | | |
Harriett Tee Taggart 1948 | | Trustee | | Since 2011 | | Managing Director, Taggart Associates (a professional practice firm). Formerly, Partner and Senior Vice President, Wellington Management Company, LLP (investment management firm) (1983-2006). Directorships in the Last Five Years. Director of Albemarle Corporation (chemicals manufacturer) (since 2007) and The Hanover Group (specialty property and casualty insurance company) (since 2009). Formerly, Director of Lubrizol Corporation (specialty chemicals) (2007-2011). |
| | | |
Ralph F. Verni 1943 | | Chairman of the Board and Trustee | | Chairman of the Board since 2007 and Trustee since 2005 | | Consultant and private investor. Formerly, Chief Investment Officer (1982-1992), Chief Financial Officer (1988-1990) and Director (1982-1992), New England Life. Formerly, Chairperson, New England Mutual Funds (1982-1992). Formerly, President and Chief Executive Officer, State Street Management & Research (1992-2000). Formerly, Chairperson, State Street Research Mutual Funds (1992-2000). Formerly, Director, W.P. Carey, LLC (1998-2004) and First Pioneer Farm Credit Corp. (2002-2006). Directorships in the Last Five Years.(1) None. |
| | | |
| | | | | | |
Principal Officers who are not Trustees |
| Name and Year of Birth | | Position(s) with the Trusts | | Length of Service | | Principal Occupation(s) During Past Five Years |
| | | |
Thomas M. Metzold 1958 | | President of MT | | Since 2010 | | Vice President of EVM and BMR. |
| | | |
Payson F. Swaffield(2) 1956 | | President of MFT | | Since 2013 | | Vice President and Chief Income Investment Officer of EVM and BMR. |
| | | |
Maureen A. Gemma 1960 | | Vice President, Secretary and Chief Legal Officer | | Vice President since 2011, Secretary since 2007 and Chief Legal Officer since 2008 | | Vice President of EVM and BMR. |
| | | |
James F. Kirchner(3) 1967 | | Treasurer | | Since 2005 | | Vice President of EVM and BMR. |
| | | |
Paul M. O’Neil 1953 | | Chief Compliance Officer | | Since 2004 | | Vice President of EVM and BMR. |
| (1) | During their respective tenures, the Trustees (except Mr. Eston and Ms. Taggart) also served as Board members of one or more of the following Eaton Vance funds (which operated in the years noted): Eaton Vance Credit Opportunities Fund (launched in 2005 and terminated in 2010); Eaton Vance Insured Florida Plus Municipal Bond Fund (launched in 2002 and terminated in 2009); and Eaton Vance National Municipal Income Trust (launched in 1998 and terminated in 2009). |
| (2) | Prior to October 1, 2013, Mr. Swaffield was Vice President of MFT since 2011. |
| (3) | Prior to 2013, Mr. Kirchner served as Assistant Treasurer of the Trusts since 2007. |
The SAI for the Funds includes additional information about the Trustees and officers of the Funds and can be obtained without charge on Eaton Vance’s website at www.eatonvance.com or by calling 1-800-262-1122.
Eaton Vance Funds
IMPORTANT NOTICES
Privacy. The Eaton Vance organization is committed to ensuring your financial privacy. Each of the financial institutions identified below has in effect the following policy (“Privacy Policy”) with respect to nonpublic personal information about its customers:
| Ÿ | | Only such information received from you, through application forms or otherwise, and information about your Eaton Vance fund transactions will be collected. This may include information such as name, address, social security number, tax status, account balances and transactions. |
| Ÿ | | None of such information about you (or former customers) will be disclosed to anyone, except as permitted by law (which includes disclosure to employees necessary to service your account). In the normal course of servicing a customer’s account, Eaton Vance may share information with unaffiliated third parties that perform various required services such as transfer agents, custodians and broker-dealers. |
| Ÿ | | Policies and procedures (including physical, electronic and procedural safeguards) are in place that are designed to protect the confidentiality of such information. |
| Ÿ | | We reserve the right to change our Privacy Policy at any time upon proper notification to you. Customers may want to review our Privacy Policy periodically for changes by accessing the link on our homepage: www.eatonvance.com. |
Our pledge of privacy applies to the following entities within the Eaton Vance organization: the Eaton Vance Family of Funds, Eaton Vance Management, Eaton Vance Investment Counsel, Eaton Vance Distributors, Inc., Eaton Vance Trust Company, Eaton Vance Management’s Real Estate Investment Group and Boston Management and Research. In addition, our Privacy Policy applies only to those Eaton Vance customers who are individuals and who have a direct relationship with us. If a customer’s account (i.e., fund shares) is held in the name of a third-party financial advisor/broker-dealer, it is likely that only such advisor’s privacy policies apply to the customer. This notice supersedes all previously issued privacy disclosures. For more information about Eaton Vance’s Privacy Policy, please call 1-800-262-1122.
Delivery of Shareholder Documents. The Securities and Exchange Commission (SEC) permits funds to deliver only one copy of shareholder documents, including prospectuses, proxy statements and shareholder reports, to fund investors with multiple accounts at the same residential or post office box address. This practice is often called “householding” and it helps eliminate duplicate mailings to shareholders. Eaton Vance, or your financial advisor, may household the mailing of your documents indefinitely unless you instruct Eaton Vance, or your financial advisor, otherwise. If you would prefer that your Eaton Vance documents not be householded, please contact Eaton Vance at 1-800-262-1122, or contact your financial advisor. Your instructions that householding not apply to delivery of your Eaton Vance documents will be effective within 30 days of receipt by Eaton Vance or your financial advisor.
Portfolio Holdings. Each Eaton Vance Fund and its underlying Portfolio(s) (if applicable) will file a schedule of portfolio holdings on Form N-Q with the SEC for the first and third quarters of each fiscal year. The Form N-Q will be available on the Eaton Vance website at www.eatonvance.com, by calling Eaton Vance at 1-800-262-1122 or in the EDGAR database on the SEC’s website at www.sec.gov. Form N-Q may also be reviewed and copied at the SEC’s public reference room in Washington, D.C. (call 1-800-732-0330 for information on the operation of the public reference room).
Proxy Voting. From time to time, funds are required to vote proxies related to the securities held by the funds. The Eaton Vance Funds or their underlying Portfolios (if applicable) vote proxies according to a set of policies and procedures approved by the Funds’ and Portfolios’ Boards. You may obtain a description of these policies and procedures and information on how the Funds or Portfolios voted proxies relating to portfolio securities during the most recent 12-month period ended June 30, without charge, upon request, by calling 1-800-262-1122 and by accessing the SEC’s website at www.sec.gov.
[THIS PAGE INTENTIONALLY LEFT BLANK]
[THIS PAGE INTENTIONALLY LEFT BLANK]
Investment Advisers
AMT-Free Municipal Income Fund
Eaton Vance Management
Two International Place
Boston, MA 02110
National Municipal Income Fund
Boston Management and Research
Two International Place
Boston, MA 02110
Administrator
Eaton Vance Management
Two International Place
Boston, MA 02110
Principal Underwriter*
Eaton Vance Distributors, Inc.
Two International Place
Boston, MA 02110
(617) 482-8260
Custodian
State Street Bank and Trust Company
200 Clarendon Street
Boston, MA 02116
Transfer Agent
BNY Mellon Investment Servicing (US) Inc.
Attn: Eaton Vance Funds
P.O. Box 9653
Providence, RI 02940-9653
(800) 262-1122
Independent Registered Public Accounting Firm
Deloitte & Touche LLP
200 Berkeley Street
Boston, MA 02116-5022
Fund Offices
Two International Place
Boston, MA 02110
| * | FINRA BrokerCheck. Investors may check the background of their Investment Professional by contacting the Financial Industry Regulatory Authority (FINRA). FINRA BrokerCheck is a free tool to help investors check the professional background of current and former FINRA-registered securities firms and brokers. FINRA BrokerCheck is available by calling 1-800-289-9999 and at www.FINRA.org. The FINRA BrokerCheck brochure describing this program is available to investors at www.FINRA.org. |
Item 2. Code of Ethics
The registrant has adopted a code of ethics applicable to its Principal Executive Officer, Principal Financial Officer and Principal Accounting Officer. The registrant undertakes to provide a copy of such code of ethics to any person upon request, without charge, by calling 1-800-262-1122.
Item 3. Audit Committee Financial Expert
The registrant’s Board has designated William H. Park, an independent trustee, as its audit committee financial expert. Mr. Park is a certified public accountant who is a consultant and private investor. Previously, he served as the Chief Financial Officer of Aveon Group, L.P. (an investment management firm), as the Vice Chairman of Commercial Industrial Finance Corp. (specialty finance company), as President and Chief Executive Officer of Prizm Capital Management, LLC (investment management firm), as Executive Vice President and Chief Financial Officer of United Asset Management Corporation (an institutional investment management firm) and as a Senior Manager at Price Waterhouse (now PricewaterhouseCoopers) (an independent registered public accounting firm).
Item 4. Principal Accountant Fees and Services
(a)-(d)
Eaton Vance Atlanta Capital Horizon Growth Fund, Eaton Vance Build America Bond Fund and Eaton Vance AMT-Free Municipal Income Fund (the “Fund(s)”) are series of Eaton Vance Mutual Funds Trust (the “Trust”), a Massachusetts business trust, which, including the Funds, contains a total of 37 series (the “Series”). The Trust is registered under the Investment Company Act of 1940 as an open-end management investment company. This Form N-CSR relates to the Funds’ annual reports.
The following tables present the aggregate fees billed to each Fund for the Fund’s fiscal years ended September 30, 2012 and September 30, 2013 by the Fund’s principal accountant, Deloitte & Touche LLP (“D&T”), for professional services rendered for the audit of the Funds’ annual financial statements and fees billed for other services rendered by D&T during those periods.
Eaton Vance Atlanta Capital Horizon Growth Fund
| | | | | | | | |
Fiscal Years Ended | | 9/30/12 | | | 9/30/13 | |
Audit Fees | | $ | 23,550 | | | $ | 27,350 | |
Audit-Related Fees(1) | | $ | 0 | | | $ | 0 | |
Tax Fees(2) | | $ | 7,230 | | | $ | 7,640 | |
All Other Fees(3) | | $ | 310 | | | $ | 0 | |
| | | | | | | | |
Total | | $ | 31,090 | | | $ | 34,990 | |
| | | | | | | | |
Eaton Vance Build America Bond Fund
| | | | | | | | |
Fiscal Years Ended | | 9/30/12 | | | 9/30/13 | |
Audit Fees | | $ | 21,570 | | | $ | 23,820 | |
Audit-Related Fees(1) | | $ | 0 | | | $ | 0 | |
Tax Fees(2) | | $ | 8,750 | | | $ | 9,160 | |
All Other Fees(3) | | $ | 0 | | | $ | 0 | |
| | | | | | | | |
Total | | $ | 30,320 | | | $ | 32,980 | |
| | | | | | | | |
Eaton Vance AMT-Free Municipal Income Fund
| | | | | | | | |
Fiscal Years Ended | | 9/30/12* | | | 9/30/13 | |
Audit Fees | | $ | 64,480 | | | $ | 66,230 | |
Audit-Related Fees(1) | | $ | 0 | | | $ | 0 | |
Tax Fees(2) | | $ | 12,760 | | | $ | 13,170 | |
All Other Fees(3) | | $ | 310 | | | $ | 0 | |
| | | | | | | | |
Total | | $ | 77,550 | | | $ | 79,400 | |
| | | | | | | | |
| * | Fund changed its fiscal-year end from December 31 to September 30. Accordingly, the table presents the aggregate fees billed to the Fund for the Fund’s fiscal period from January 1, 2012 to September 30, 2012. |
| (1) | Audit-related fees consist of the aggregate fees billed for assurance and related services that are reasonably related to the performance of the audit of the registrant’s financial statements and are not reported under the category of audit fees. |
| (2) | Tax fees consist of the aggregate fees billed for professional services rendered by the principal accountant relating to tax compliance, tax advice, and tax planning and specifically include fees for tax return preparation and other related tax compliance/planning matters. |
| (3) | All other fees consist of the aggregate fees billed for products and services provided by the principal accountant other than audit, audit-related, and tax services. |
The various Series comprising the Trust have differing fiscal year ends (January 31, September 30, October 31, November 30 or December 31). The following table presents the aggregate audit, audit-related, tax, and other fees billed to all of the Series in the Trust by D&T for the last two fiscal years of each Series.
| | | | | | | | | | | | | | | | | | | | | | | | | | | | | | | | | | | | |
Fiscal Years Ended* | | 10/31/11 | | | 12/31/11 | | | 1/31/12 | | | 9/30/12 | | | 10/31/12 | | | 11/30/12 | | | 12/31/12 | | | 1/31/13 | | | 9/30/13 | |
Audit Fees | | $ | 522,885 | | | $ | 135,300 | | | $ | 88,300 | | | $ | 109,600 | | | $ | 524,630 | | | $ | 19,550 | | | $ | 88,479 | | | $ | 116,530 | | | $ | 117,400 | |
Audit-Related Fees(1) | | $ | 0 | | | $ | 0 | | | $ | 0 | | | $ | 0 | | | $ | 0 | | | $ | 0 | | | $ | 0 | | | $ | 0 | | | $ | 0 | |
Tax Fees(2) | | $ | 250,180 | | | $ | 51,570 | | | $ | 25,420 | | | $ | 28,740 | | | $ | 281,940 | | | $ | 8,000 | | | $ | 55,380 | | | $ | 55,490 | | | $ | 29,970 | |
All Other Fees(3) | | $ | 22,300 | | | $ | 1,500 | | | $ | 2,100 | | | $ | 620 | | | $ | 0 | | | $ | 310 | | | $ | 0 | | | $ | 0 | | | $ | 0 | |
| | | | | | | | | | | | | | | | | | | | | | | | | | | | | | | | | | | | |
Total | | $ | 795,365 | | | $ | 188,370 | | | $ | 115,820 | | | $ | 138,960 | | | $ | 806,570 | | | $ | 27,860 | | | $ | 143,859 | | | $ | 172,020 | | | $ | 147,370 | |
| | | | | | | | | | | | | | | | | | | | | | | | | | | | | | | | | | | | |
| * | Information is not presented for the fiscal year ended 11/30/11, as no Series in the Trust with such fiscal year end was in operation during such period. |
| (1) | Audit-related fees consist of the aggregate fees billed for assurance and related services that are reasonably related to the performance of the audit of the registrant’s financial statements and are not reported under the category of audit fees. |
| (2) | Tax fees consist of the aggregate fees billed for professional services rendered by the principal accountant relating to tax compliance, tax advice, and tax planning and specifically include fees for tax return preparation and other related tax compliance/planning matters. |
| (3) | All other fees consist of the aggregate fees billed for products and services provided by the principal accountant other than audit, audit-related, and tax services. |
(e)(1) The registrant’s audit committee has adopted policies and procedures relating to the pre-approval of services provided by the registrant’s principal accountant (the “Pre-Approval Policies”). The Pre-Approval Policies establish a framework intended to assist the audit committee in the proper discharge of its pre-approval responsibilities. As a general matter, the Pre-Approval Policies (i) specify certain types of audit, audit-related, tax, and other services determined to be pre-approved by the audit committee; and (ii) delineate specific procedures governing the mechanics of the pre-approval process, including the approval and monitoring of audit and non-audit service fees. Unless a service is specifically pre-approved under the Pre-Approval Policies, it must be separately pre-approved by the audit committee.
The Pre-Approval Policies and the types of audit and non-audit services pre-approved therein must be reviewed and ratified by the registrant’s audit committee at least annually. The registrant’s audit committee maintains full responsibility for the appointment, compensation, and oversight of the work of the registrant’s principal accountant.
(e)(2) No services described in paragraphs (b)-(d) above were approved by the registrant’s audit committee pursuant to the “de minimis exception” set forth in Rule 2-01(c)(7)(i)(C) of Regulation S-X.
(g) The following table presents (i) the aggregate non-audit fees (i.e., fees for audit-related, tax, and other services) billed for services rendered to all of the Series in the Trust by D&T for the last two fiscal years of each Series; and (ii) the aggregate non-audit fees (i.e., fees for audit-related, tax, and other services) billed to the Eaton Vance organization by D&T for the last two fiscal years of each Series.
| | | | | | | | | | | | | | | | | | | | | | | | | | | | | | | | | | | | |
Fiscal Years Ended* | | 10/31/11 | | | 12/31/11 | | | 1/31/12 | | | 9/30/12 | | | 10/31/12 | | | 11/30/12 | | | 12/31/12 | | | 1/31/13 | | | 9/30/13 | |
Registrant(1) | | $ | 272,480 | | | $ | 53,070 | | | $ | 27,520 | | | $ | 29,360 | | | $ | 281,940 | | | $ | 8,310 | | | $ | 55,380 | | | $ | 55,490 | | | $ | 29,970 | |
Eaton Vance(2) | | $ | 226,431 | | | $ | 334,561 | | | $ | 414,561 | | | $ | 606,619 | | | $ | 566,619 | | | $ | 662,119 | | | $ | 615,489 | | | $ | 544,549 | | | $ | 369,820 | |
| * | Information is not presented for the fiscal year ended 11/30/11, as no Series in the Trust with such fiscal year end was in operation during such period. |
| (1) | Includes all of the Series of the Trust. During the fiscal years reported above, certain of the Funds were “feeder” funds in a “master-feeder” fund structure or funds of funds. |
| (2) | Various subsidiaries of Eaton Vance Corp. act in either an investment advisory and/or service provider capacity with respect to the Series and/or their respective “master” funds (if applicable). |
(h) The registrant’s audit committee has considered whether the provision by the registrant’s principal accountant of non-audit services to the registrant’s investment adviser and any entity controlling,
controlled by, or under common control with the adviser that provides ongoing services to the registrant that were not pre-approved pursuant to Rule 2-01(c)(7)(ii) of Regulation S-X is compatible with maintaining the principal accountant’s independence.
Item 5. Audit Committee of Listed Registrants
Not applicable.
Item 6. Schedule of Investments
Please see schedule of investments contained in the Report to Stockholders included under Item 1 of this Form N-CSR.
Item 7. Disclosure of Proxy Voting Policies and Procedures for Closed-End Management Investment Companies
Not applicable.
Item 8. Portfolio Managers of Closed-End Management Investment Companies
Not applicable.
Item 9. Purchases of Equity Securities by Closed-End Management Investment Company and Affiliated Purchasers
Not applicable.
Item 10. Submission of Matters to a Vote of Security Holders
No material changes.
Item 11. Controls and Procedures
(a) It is the conclusion of the registrant’s principal executive officer and principal financial officer that the effectiveness of the registrant’s current disclosure controls and procedures (such disclosure controls and procedures having been evaluated within 90 days of the date of this filing) provide reasonable assurance that the information required to be disclosed by the registrant has been recorded, processed, summarized and reported within the time period specified in the Commission’s rules and forms and that the information required to be disclosed by the registrant has been accumulated and communicated to the registrant’s principal executive officer and principal financial officer in order to allow timely decisions regarding required disclosure.
(b) There have been no changes in the registrant’s internal controls over financial reporting during the second fiscal quarter of the period covered by this report that has materially affected, or is reasonably likely to materially affect, the registrant’s internal control over financial reporting.
Item 12. Exhibits
| | |
| (a)(1) | | Registrant’s Code of Ethics – Not applicable (please see Item 2). |
| (a)(2)(i) | | Treasurer’s Section 302 certification. |
| (a)(2)(ii) | | President’s Section 302 certification. |
| (b) | | Combined Section 906 certification. |
Signatures
Pursuant to the requirements of the Securities Exchange Act of 1934 and the Investment Company Act of 1940, the registrant has duly caused this report to be signed on its behalf by the undersigned, thereunto duly authorized.
Eaton Vance Mutual Funds Trust
| | |
| By: | | /s/ Payson F. Swaffield |
| | Payson F. Swaffield |
| | President |
| |
| Date: | | November 12, 2013 |
Pursuant to the requirements of the Securities Exchange Act of 1934 and the Investment Company Act of 1940, this report has been signed below by the following persons on behalf of the registrant and in the capacities and on the dates indicated.
| | |
| By: | | /s/ James F. Kirchner |
| | James F. Kirchner |
| | Treasurer |
| |
| Date: | | November 12, 2013 |
| | |
| By: | | /s/ Payson F. Swaffield |
| | Payson F. Swaffield |
| | President |
| |
| Date: | | November 12, 2013 |