UNITED STATES
SECURITIES AND EXCHANGE COMMISSION
Washington, D.C. 20549
Form N-CSR
CERTIFIED SHAREHOLDER REPORT OF REGISTERED
MANAGEMENT INVESTMENT COMPANIES
Investment Company Act File Number: 811-04015
Eaton Vance Mutual Funds Trust
(Exact Name of Registrant as Specified in Charter)
Two International Place, Boston, Massachusetts 02110
(Address of Principal Executive Offices)
Maureen A. Gemma
Two International Place, Boston, Massachusetts 02110
(Name and Address of Agent for Services)
(617) 482-8260
(Registrant’s Telephone Number)
December 31
Date of Fiscal Year End
June 30, 2014
Date of Reporting Period
Item 1. Reports to Stockholders

Eaton Vance
Tax-Managed Growth Funds 1.1 and 1.2
Semiannual Report
June 30, 2014

Commodity Futures Trading Commission Registration. Effective December 31, 2012, the Commodity Futures Trading Commission (“CFTC”) adopted certain regulatory changes that subject registered investment companies and advisers to regulation by the CFTC if a fund invests more than a prescribed level of its assets in certain CFTC-regulated instruments (including futures, certain options and swap agreements) or markets itself as providing investment exposure to such instruments. Each Fund has claimed an exclusion from the definition of the term “commodity pool operator” under the Commodity Exchange Act. Accordingly, neither the Funds nor the adviser with respect to the operation the Funds is subject to the CFTC regulation. Because of its management of other strategies, each Fund’s adviser is registered with the CFTC as a commodity pool operator and a commodity trading advisor.
Fund shares are not insured by the FDIC and are not deposits or other obligations of, or guaranteed by, any depository institution. Shares are subject to investment risks, including possible loss of principal invested.
This report must be preceded or accompanied by a current summary prospectus or prospectus. Before investing, investors should consider carefully the investment objective, risks, and charges and expenses of a mutual fund. This and other important information is contained in the summary prospectus and prospectus, which can be obtained from a financial advisor. Prospective investors should read the prospectus carefully before investing. For further information, please call 1-800-262-1122.
Semiannual Report June 30, 2014
Eaton Vance
Tax-Managed Growth Funds 1.1 and 1.2
Table of Contents
| | | | |
Performance | | | | |
| |
Tax-Managed Growth Fund 1.1 | | | 2 | |
| |
Tax-Managed Growth Fund 1.2 | | | 3 | |
| |
Fund Profile | | | 4 | |
| |
Endnotes and Additional Disclosures | | | 5 | |
| |
Fund Expenses | | | 6 | |
| |
Financial Statements | | | 8 | |
| |
Special Meeting of Shareholders | | | 40 | |
| |
Board of Trustees’ Contract Approval | | | 41 | |
| |
Officers and Trustees | | | 47 | |
| |
Important Notices | | | 48 | |
Eaton Vance
Tax-Managed Growth Fund 1.1
June 30, 2014
Performance1,2
Portfolio Managers Lewis R. Piantedosi, Michael A. Allison, CFA and Yana S. Barton, CFA
| | | | | | | | | | | | | | | | | | | | | | | | |
| % Average Annual Total Returns | | Class Inception Date | | | Performance Inception Date | | | Six Months | | | One Year | | | Five Years | | | Ten Years | |
Class A at NAV | | | 03/28/1996 | | | | 03/29/1966 | | | | 5.91 | % | | | 24.04 | % | | | 17.13 | % | | | 6.88 | % |
Class A with 5.75% Maximum Sales Charge | | | — | | | | — | | | | –0.19 | | | | 16.91 | | | | 15.75 | | | | 6.25 | |
Class B at NAV | | | 03/28/1996 | | | | 03/29/1966 | | | | 5.52 | | | | 23.11 | | | | 16.27 | | | | 6.09 | |
Class B with 5% Maximum Sales Charge | | | — | | | | — | | | | 0.52 | | | | 18.11 | | | | 16.05 | | | | 6.09 | |
Class C at NAV | | | 08/02/1996 | | | | 03/29/1966 | | | | 5.53 | | | | 23.10 | | | | 16.26 | | | | 6.08 | |
Class C with 1% Maximum Sales Charge | | | — | | | | — | | | | 4.53 | | | | 22.10 | | | | 16.26 | | | | 6.08 | |
Class I at NAV | | | 07/02/1999 | | | | 03/29/1966 | | | | 6.07 | | | | 24.36 | | | | 17.40 | | | | 7.16 | |
S&P 500 Index | | | — | | | | — | | | | 7.14 | % | | | 24.61 | % | | | 18.82 | % | | | 7.78 | % |
| | | | | | |
| | | | | | | | | | | | | | | | | | | | | | | | |
| % After-Tax Returns with Maximum Sales Charge | | | Class Inception Date | | | Performance Inception Date | | | One Year | | | Five Years | | | Ten Years | |
Class A After Taxes on Distributions | | | | 03/28/1996 | | | | 03/29/1966 | | | | 16.62 | % | | | 15.53 | % | | | 6.05 | % |
Class A After Taxes on Distributions and Sale of Fund Shares | | | | — | | | | — | | | | 9.78 | | | | 12.75 | | | | 5.05 | |
Class B After Taxes on Distributions | | | | 03/28/1996 | | | | 03/29/1966 | | | | 18.04 | | | | 16.00 | | | | 6.06 | |
Class B After Taxes on Distributions and Sale of Fund Shares | | | | — | | | | — | | | | 10.29 | | | | 12.99 | | | | 4.90 | |
Class C After Taxes on Distributions | | | | 08/02/1996 | | | | 03/29/1966 | | | | 21.96 | | | | 16.15 | | | | 5.99 | |
Class C After Taxes on Distributions and Sale of Fund Shares | | | | — | | | | — | | | | 12.61 | | | | 13.18 | | | | 4.90 | |
Class I After Taxes on Distributions | | | | 07/02/1999 | | | | 03/29/1966 | | | | 23.96 | | | | 17.10 | | | | 6.88 | |
Class I After Taxes on Distributions and Sale of Fund Shares | | | | — | | | | — | | | | 14.07 | | | | 14.15 | | | | 5.81 | |
| | | | | | |
| | | | | | | | | | | | | | | | | | | | | | | | |
| % Total Annual Operating Expense Ratios3 | | | | | | Class A | | | Class B | | | Class C | | | Class I | |
| | | | | | | | | | | 0.83 | % | | | 1.59 | % | | | 1.58 | % | | | 0.59 | % |
See Endnotes and Additional Disclosures in this report.
Past performance is no guarantee of future results. Returns are historical and are calculated by determining the percentage change in net asset value (NAV) or offering price (as applicable) with all distributions reinvested. Investment return and principal value will fluctuate so that shares, when redeemed, may be worth more or less than their original cost. Performance less than one year is cumulative. Performance is for the stated time period only; due to market volatility, the Fund’s current performance may be lower or higher than quoted. Returns are before taxes unless otherwise noted. For performance as of the most recent month end, please refer to eatonvance.com.
Eaton Vance
Tax-Managed Growth Fund 1.2
June 30, 2014
Performance1,2
Portfolio Managers Lewis R. Piantedosi, Michael A. Allison, CFA and Yana S. Barton, CFA
| | | | | | | | | | | | | | | | | | | | | | | | |
| % Average Annual Total Returns | | Class Inception Date | | | Performance Inception Date | | | Six Months | | | One Year | | | Five Years | | | Ten Years | |
Class A at NAV | | | 02/28/2001 | | | | 03/29/1966 | | | | 5.84 | % | | | 23.85 | % | | | 16.94 | % | | | 6.70 | % |
Class A with 5.75% Maximum Sales Charge | | | — | | | | — | | | | –0.24 | | | | 16.72 | | | | 15.56 | | | | 6.07 | |
Class B at NAV | | | 02/28/2001 | | | | 03/29/1966 | | | | 5.46 | | | | 22.87 | | | | 16.05 | | | | 5.90 | |
Class B with 5% Maximum Sales Charge | | | — | | | | — | | | | 0.46 | | | | 17.87 | | | | 15.83 | | | | 5.90 | |
Class C at NAV | | | 02/28/2001 | | | | 03/29/1966 | | | | 5.47 | | | | 22.90 | | | | 16.08 | | | | 5.91 | |
Class C with 1% Maximum Sales Charge | | | — | | | | — | | | | 4.47 | | | | 21.90 | | | | 16.08 | | | | 5.91 | |
Class I at NAV | | | 02/28/2001 | | | | 03/29/1966 | | | | 5.96 | | | | 24.15 | | | | 17.22 | | | | 6.98 | |
S&P 500 Index | | | — | | | | — | | | | 7.14 | % | | | 24.61 | % | | | 18.82 | % | | | 7.78 | % |
| | | | | | |
| | | | | | | | | | | | | | | | | | | | | | | | |
| % After-Tax Returns with Maximum Sales Charge | | | Class Inception Date | | | Performance Inception Date | | | One Year | | | Five Years | | | Ten Years | |
Class A After Taxes on Distributions | | | | 02/28/2001 | | | | 03/29/1966 | | | | 16.47 | % | | | 15.36 | % | | | 5.90 | % |
Class A After Taxes on Distributions and Sale of Fund Shares | | | | — | | | | — | | | | 9.64 | | | | 12.59 | | | | 4.89 | |
Class B After Taxes on Distributions | | | | 02/28/2001 | | | | 03/29/1966 | | | | 17.85 | | | | 15.81 | | | | 5.88 | |
Class B After Taxes on Distributions and Sale of Fund Shares | | | | — | | | | — | | | | 10.12 | | | | 12.80 | | | | 4.75 | |
Class C After Taxes on Distributions | | | | 02/28/2001 | | | | 03/29/1966 | | | | 21.84 | | | | 16.01 | | | | 5.86 | |
Class C After Taxes on Distributions and Sale of Fund Shares | | | | — | | | | — | | | | 12.45 | | | | 13.02 | | | | 4.76 | |
Class I After Taxes on Distributions | | | | 02/28/2001 | | | | 03/29/1966 | | | | 23.83 | | | | 16.97 | | | | 6.76 | |
Class I After Taxes on Distributions and Sale of Fund Shares | | | | — | | | | — | | | | 13.91 | | | | 14.00 | | | | 5.66 | |
| | | | | | |
| | | | | | | | | | | | | | | | | | | | | | | | |
| % Total Annual Operating Expense Ratios3 | | | | | | Class A | | | Class B | | | Class C | | | Class I | |
| | | | | | | | | | | 1.00 | % | | | 1.75 | % | | | 1.75 | % | | | 0.75 | % |
See Endnotes and Additional Disclosures in this report.
Past performance is no guarantee of future results. Returns are historical and are calculated by determining the percentage change in net asset value (NAV) or offering price (as applicable) with all distributions reinvested. Investment return and principal value will fluctuate so that shares, when redeemed, may be worth more or less than their original cost. Performance less than one year is cumulative. Performance is for the stated time period only; due to market volatility, the Fund’s current performance may be lower or higher than quoted. Returns are before taxes unless otherwise noted. For performance as of the most recent month end, please refer to eatonvance.com.
Eaton Vance
Tax-Managed Growth Funds 1.1 and 1.2
June 30, 2014
Fund Profile4
Sector Allocation (% of net assets)5
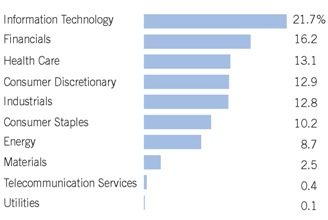
Top 10 Holdings (% of net assets)5
| | | | |
Apple, Inc. | | | 2.8 | % |
| |
Intel Corp. | | | 2.7 | |
| |
United Technologies Corp. | | | 2.4 | |
| |
Exxon Mobil Corp. | | | 2.3 | |
| |
QUALCOMM, Inc. | | | 2.2 | |
| |
Walt Disney Co. (The) | | | 2.1 | |
| |
NIKE, Inc., Class B | | | 1.8 | |
| |
Oracle Corp. | | | 1.8 | |
| |
Johnson & Johnson | | | 1.8 | |
| |
JPMorgan Chase & Co. | | | 1.8 | |
| |
| | | | 21.7 | % |
See Endnotes and Additional Disclosures in this report.
Eaton Vance
Tax-Managed Growth Funds 1.1 and 1.2
June 30, 2014
Endnotes and Additional Disclosures
| 1 | S&P 500 Index is an unmanaged index of large-cap stocks commonly used as a measure of U.S. stock market performance. Unless otherwise stated, index returns do not reflect the effect of any applicable sales charges, commissions, expenses, taxes or leverage, as applicable. It is not possible to invest directly in an index. |
| 2 | Total Returns at NAV do not include applicable sales charges. If sales charges were deducted, the returns would be lower. Total Returns shown with maximum sales charge reflect the stated maximum sales charge. Unless otherwise stated, performance does not reflect the deduction of taxes on Fund distributions or redemptions of Fund shares. Performance since inception for an index, if presented, is the performance since the Fund’s or oldest share class’ inception, as applicable. After-tax returns are calculated using certain assumptions, including using the highest historical individual federal income tax rates and do not reflect the impact of state/local taxes. Actual after-tax returns depend on a shareholder’s tax situation and the actual characterization of distributions and may differ from those shown. After-tax returns are not relevant to shareholders who hold shares in tax-deferred accounts or shares held by nontaxable entities. Return After Taxes on Distributions may be the same as Return Before Taxes for the same period because no taxable distributions were made during that period. Return After Taxes on Distributions and Sale of Fund Shares may be greater than or equal to Return After Taxes on Distributions for the same period because of losses realized on the sale of Fund shares. The Fund’s after-tax returns also may reflect foreign tax credits passed by the Fund to its shareholders. |
| 3 | Source: Fund prospectus. |
| 4 | Fund invests in an affiliated investment company (Portfolio) with the same objective(s) and policies as the Fund. References to investments are to the Portfolio’s holdings. |
| 5 | Excludes cash and cash equivalents. |
| | Fund profile subject to change due to active management. |
Eaton Vance
Tax-Managed Growth Funds 1.1 and 1.2
June 30, 2014
Fund Expenses
Example: As a Fund shareholder, you incur two types of costs: (1) transaction costs, including sales charges (loads) on purchases and redemption fees (if applicable); and (2) ongoing costs, including management fees; distribution or service fees; and other Fund expenses. This Example is intended to help you understand your ongoing costs (in dollars) of Fund investing and to compare these costs with the ongoing costs of investing in other mutual funds. The Example is based on an investment of $1,000 invested at the beginning of the period and held for the entire period (January 1, 2014 – June 30, 2014).
Actual Expenses: The first section of the table below provides information about actual account values and actual expenses. You may use the information in this section, together with the amount you invested, to estimate the expenses that you paid over the period. Simply divide your account value by $1,000 (for example, an $8,600 account value divided by $1,000 = 8.6), then multiply the result by the number in the first section under the heading entitled “Expenses Paid During Period” to estimate the expenses you paid on your account during this period.
Hypothetical Example for Comparison Purposes: The second section of the table below provides information about hypothetical account values and hypothetical expenses based on the actual Fund expense ratio and an assumed rate of return of 5% per year (before expenses), which is not the actual Fund return. The hypothetical account values and expenses may not be used to estimate the actual ending account balance or expenses you paid for the period. You may use this information to compare the ongoing costs of investing in your Fund and other funds. To do so, compare this 5% hypothetical example with the 5% hypothetical examples that appear in the shareholder reports of the other funds.
Please note that the expenses shown in the table are meant to highlight your ongoing costs only and do not reflect any transactional costs, such as sales charges (loads) or redemption fees (if applicable). Therefore, the second section of the table is useful in comparing ongoing costs only, and will not help you determine the relative total costs of owning different funds. In addition, if these transactional costs were included, your costs would be higher.
Eaton Vance Tax-Managed Growth Fund 1.1
| | | | | | | | | | | | | | | | |
| | | Beginning Account Value (1/1/14) | | | Ending Account Value (6/30/14) | | | Expenses Paid During Period* (1/1/14 – 6/30/14) | | | Annualized Expense Ratio | |
| | | | |
| | | | | | | | | | | | | | | | |
Actual | | | | | | | | | | | | | | | | |
Class A | | $ | 1,000.00 | | | $ | 1,059.10 | | | $ | 4.29 | | | | 0.84 | % |
Class B | | $ | 1,000.00 | | | $ | 1,055.20 | | | $ | 8.10 | | | | 1.59 | % |
Class C | | $ | 1,000.00 | | | $ | 1,055.30 | | | $ | 8.10 | | | | 1.59 | % |
Class I | | $ | 1,000.00 | | | $ | 1,060.70 | | | $ | 3.01 | | | | 0.59 | % |
| | | | | | | | | | | | | | | | | |
| | | | |
| | | | | | | | | | | | | | | | |
Hypothetical | | | | | | | | | | | | | | | | |
(5% return per year before expenses) | | | | | | | | | | | | | | | | |
Class A | | $ | 1,000.00 | | | $ | 1,020.60 | | | $ | 4.21 | | | | 0.84 | % |
Class B | | $ | 1,000.00 | | | $ | 1,016.90 | | | $ | 7.95 | | | | 1.59 | % |
Class C | | $ | 1,000.00 | | | $ | 1,016.90 | | | $ | 7.95 | | | | 1.59 | % |
Class I | | $ | 1,000.00 | | | $ | 1,021.90 | | | $ | 2.96 | | | | 0.59 | % |
| * | Expenses are equal to the Fund’s annualized expense ratio for the indicated Class, multiplied by the average account value over the period, multiplied by 181/365 (to reflect the one-half year period). The Example assumes that the $1,000 was invested at the net asset value per share determined at the close of business on December 31, 2013. The Example reflects the expenses of both the Fund and the Portfolio. |
Eaton Vance
Tax-Managed Growth Funds 1.1 and 1.2
June 30, 2014
Fund Expenses — continued
Eaton Vance Tax-Managed Growth Fund 1.2
| | | | | | | | | | | | | | | | |
| | | Beginning Account Value (1/1/14) | | | Ending Account Value (6/30/14) | | | Expenses Paid During Period* (1/1/14 – 6/30/14) | | | Annualized Expense Ratio | |
| | | | |
| | | | | | | | | | | | | | | | |
Actual | | | | | | | | | | | | | | | | |
Class A | | $ | 1,000.00 | | | $ | 1,058.40 | | | $ | 5.10 | | | | 1.00 | % |
Class B | | $ | 1,000.00 | | | $ | 1,054.60 | | | $ | 8.91 | | | | 1.75 | % |
Class C | | $ | 1,000.00 | | | $ | 1,054.70 | | | $ | 8.92 | | | | 1.75 | % |
Class I | | $ | 1,000.00 | | | $ | 1,059.60 | | | $ | 3.83 | | | | 0.75 | % |
| | | | | | | | | | | | | | | | | |
| | | | |
| | | | | | | | | | | | | | | | |
Hypothetical | | | | | | | | | | | | | | | | |
(5% return per year before expenses) | | | | | | | | | | | | | | | | |
Class A | | $ | 1,000.00 | | | $ | 1,019.80 | | | $ | 5.01 | | | | 1.00 | % |
Class B | | $ | 1,000.00 | | | $ | 1,016.10 | | | $ | 8.75 | | | | 1.75 | % |
Class C | | $ | 1,000.00 | | | $ | 1,016.10 | | | $ | 8.75 | | | | 1.75 | % |
Class I | | $ | 1,000.00 | | | $ | 1,021.10 | | | $ | 3.76 | | | | 0.75 | % |
| * | Expenses are equal to the Fund’s annualized expense ratio for the indicated Class, multiplied by the average account value over the period, multiplied by 181/365 (to reflect the one-half year period). The Example assumes that the $1,000 was invested at the net asset value per share determined at the close of business on December 31, 2013. The Example reflects the expenses of both the Fund and the Portfolio. |
Eaton Vance
Tax-Managed Growth Funds 1.1 and 1.2
June 30, 2014
Statements of Assets and Liabilities (Unaudited)
| | | | | | | | |
| | | June 30, 2014 | |
| Assets | | Tax-Managed Growth Fund 1.1 | | | Tax-Managed Growth Fund 1.2 | |
Investment in Tax-Managed Growth Portfolio, at value (identified cost, $579,688,584 and $262,826,917, respectively) | | $ | 1,395,032,088 | | | $ | 577,255,728 | |
Receivable for Fund shares sold | | | 1,086,409 | | | | 304,188 | |
Total assets | | $ | 1,396,118,497 | | | $ | 577,559,916 | |
| | |
| Liabilities | | | | | | | | |
Payable for Fund shares redeemed | | $ | 1,767,894 | | | $ | 789,445 | |
Payable to affiliates: | | | | | | | | |
Administration fee | | | — | | | | 70,538 | |
Distribution and service fees | | | 450,148 | | | | 212,959 | |
Trustees’ fees | | | 125 | | | | 125 | |
Accrued expenses | | | 205,520 | | | | 75,540 | |
Total liabilities | | $ | 2,423,687 | | | $ | 1,148,607 | |
Net Assets | | $ | 1,393,694,810 | | | $ | 576,411,309 | |
| | |
| Sources of Net Assets | | | | | | | | |
Paid-in capital | | $ | 686,411,957 | | | $ | 351,010,691 | |
Accumulated net realized loss from Portfolio | | | (115,163,759 | ) | | | (91,366,177 | ) |
Accumulated undistributed net investment income | | | 7,103,108 | | | | 2,337,984 | |
Net unrealized appreciation from Portfolio | | | 815,343,504 | | | | 314,428,811 | |
Total | | $ | 1,393,694,810 | | | $ | 576,411,309 | |
| | |
| Class A Shares | | | | | | | | |
Net Assets | | $ | 1,071,097,174 | | | $ | 365,308,513 | |
Shares Outstanding | | | 28,890,257 | | | | 21,916,866 | |
Net Asset Value and Redemption Price Per Share | | | | | | | | |
(net assets ÷ shares of beneficial interest outstanding) | | $ | 37.07 | | | $ | 16.67 | |
Maximum Offering Price Per Share | | | | | | | | |
(100 ÷ 94.25 of net asset value per share) | | $ | 39.33 | | | $ | 17.69 | |
| | |
| Class B Shares | | | | | | | | |
Net Assets | | $ | 8,554,636 | | | $ | 6,710,921 | |
Shares Outstanding | | | 236,614 | | | | 408,595 | |
Net Asset Value and Offering Price Per Share* | | | | | | | | |
(net assets ÷ shares of beneficial interest outstanding) | | $ | 36.15 | | | $ | 16.42 | |
| | |
| Class C Shares | | | | | | | | |
Net Assets | | $ | 274,404,083 | | | $ | 162,245,887 | |
Shares Outstanding | | | 8,220,669 | | | | 10,010,873 | |
Net Asset Value and Offering Price Per Share* | | | | | | | | |
(net assets ÷ shares of beneficial interest outstanding) | | $ | 33.38 | | | $ | 16.21 | |
| | |
| Class I Shares | | | | | | | | |
Net Assets | | $ | 39,638,917 | | | $ | 42,145,988 | |
Shares Outstanding | | | 1,139,734 | | | | 2,521,831 | |
Net Asset Value, Offering Price and Redemption Price Per Share | | | | | | | | |
(net assets ÷ shares of beneficial interest outstanding) | | $ | 34.78 | | | $ | 16.71 | |
On sales of $50,000 or more, the offering price of Class A shares is reduced.
| * | Redemption price per share is equal to the net asset value less any applicable contingent deferred sales charge. |
| | | | |
| | 8 | | See Notes to Financial Statements. |
Eaton Vance
Tax-Managed Growth Funds 1.1 and 1.2
June 30, 2014
Statements of Operations (Unaudited)
| | | | | | | | |
| | | Six Months Ended June 30, 2014 | |
| Investment Income | | Tax-Managed Growth Fund 1.1 | | | Tax-Managed Growth Fund 1.2 | |
Dividends allocated from Portfolio (net of foreign taxes, $156,067 and $64,277, respectively) | | $ | 13,604,626 | | | $ | 5,590,901 | |
Interest allocated from Portfolio | | | 12,862 | | | | 5,286 | |
Expenses allocated from Portfolio | | | (3,214,395 | ) | | | (1,321,190 | ) |
Total investment income | | $ | 10,403,093 | | | $ | 4,274,997 | |
| |
| Expenses | | | | |
Administration fee | | $ | — | | | $ | 412,325 | |
Distribution and service fees | | | | | | | | |
Class A | | | 1,286,837 | | | | 437,302 | |
Class B | | | 44,819 | | | | 36,578 | |
Class C | | | 1,319,017 | | | | 778,855 | |
Trustees’ fees and expenses | | | 250 | | | | 250 | |
Custodian fee | | | 31,752 | | | | 20,832 | |
Transfer and dividend disbursing agent fees | | | 432,861 | | | | 180,159 | |
Professional fees | | | 20,421 | | | | 14,575 | |
Printing and postage | | | 83,478 | | | | 37,166 | |
Registration fees | | | 45,453 | | | | 34,899 | |
Miscellaneous | | | 118,167 | | | | 37,926 | |
Total expenses | | $ | 3,383,055 | | | $ | 1,990,867 | |
| | |
Net investment income | | $ | 7,020,038 | | | $ | 2,284,130 | |
| |
| Realized and Unrealized Gain (Loss) from Portfolio | | | | |
Net realized gain (loss) — | | | | | | | | |
Investment transactions(1) | | $ | 42,314,215 | | | $ | 15,533,276 | |
Foreign currency transactions | | | 199 | | | | 78 | |
Net realized gain | | $ | 42,314,414 | | | $ | 15,533,354 | |
Change in unrealized appreciation (depreciation) — | | | | | | | | |
Investments | | $ | 27,956,412 | | | $ | 13,612,466 | |
Foreign currency | | | 195 | | | | 81 | |
Net change in unrealized appreciation (depreciation) | | $ | 27,956,607 | | | $ | 13,612,547 | |
| | |
Net realized and unrealized gain | | $ | 70,271,021 | | | $ | 29,145,901 | |
| | |
Net increase in net assets from operations | | $ | 77,291,059 | | | $ | 31,430,031 | |
| (1) | Includes $42,293,849 and $15,524,932, respectively, of net realized gains from redemptions in-kind. |
| | | | |
| | 9 | | See Notes to Financial Statements. |
Eaton Vance
Tax-Managed Growth Funds 1.1 and 1.2
June 30, 2014
Statements of Changes in Net Assets (Unaudited)
| | | | | | | | |
| | | Six Months Ended June 30, 2014 | |
| Increase (Decrease) in Net Assets | | Tax-Managed Growth Fund 1.1 | | | Tax-Managed Growth Fund 1.2 | |
From operations — | | | | | | | | |
Net investment income | | $ | 7,020,038 | | | $ | 2,284,130 | |
Net realized gain from investment and foreign currency transactions | | | 42,314,414 | | | | 15,533,354 | |
Net change in unrealized appreciation (depreciation) from investments and foreign currency | | | 27,956,607 | | | | 13,612,547 | |
Net increase in net assets from operations | | $ | 77,291,059 | | | $ | 31,430,031 | |
Transactions in shares of beneficial interest — | | | | | | | | |
Proceeds from sale of shares | | | | | | | | |
Class A | | $ | 3,342,424 | | | $ | 8,471,340 | |
Class B | | | 28,933 | | | | — | |
Class C | | | 704,948 | | | | 3,311,874 | |
Class I | | | 48,504,751 | | | | 17,971,609 | |
Cost of shares redeemed | | | | | | | | |
Class A | | | (41,892,274 | ) | | | (17,681,435 | ) |
Class B | | | (443,453 | ) | | | (463,796 | ) |
Class C | | | (10,400,860 | ) | | | (7,523,429 | ) |
Class I | | | (51,665,554 | ) | | | (14,898,477 | ) |
Net asset value of shares exchanged | | | | | | | | |
Class A | | | 1,367,318 | | | | 1,239,861 | |
Class B | | | (1,367,318 | ) | | | (1,239,861 | ) |
Net decrease in net assets from Fund share transactions | | $ | (51,821,085 | ) | | $ | (10,812,314 | ) |
| | |
Net increase in net assets | | $ | 25,469,974 | | | $ | 20,617,717 | |
| | |
| Net Assets | | | | | | | | |
At beginning of period | | $ | 1,368,224,836 | | | $ | 555,793,592 | |
At end of period | | $ | 1,393,694,810 | | | $ | 576,411,309 | |
| | |
Accumulated undistributed net investment income
included in net assets | | | | | | | | |
At end of period | | $ | 7,103,108 | | | $ | 2,337,984 | |
| | | | |
| | 10 | | See Notes to Financial Statements. |
Eaton Vance
Tax-Managed Growth Funds 1.1 and 1.2
June 30, 2014
Statements of Changes in Net Assets — continued
| | | | | | | | |
| | | Year Ended December 31, 2013 | |
| Increase (Decrease) in Net Assets | | Tax-Managed Growth Fund 1.1 | | | Tax-Managed Growth Fund 1.2 | |
From operations — | | | | | | | | |
Net investment income | | $ | 12,369,611 | | | $ | 3,819,360 | |
Net realized gain from investment and foreign currency transactions | | | 90,269,280 | | | | 23,837,822 | |
Net change in unrealized appreciation (depreciation) from investments and foreign currency | | | 239,341,146 | | | | 108,285,691 | |
Net increase in net assets from operations | | $ | 341,980,037 | | | $ | 135,942,873 | |
Distributions to shareholders — | | | | | | | | |
From net investment income | | | | | | | | |
Class A | | $ | (10,663,604 | ) | | $ | (3,063,582 | ) |
Class B | | | (21,740 | ) | | | (3,596 | ) |
Class C | | | (1,294,391 | ) | | | (361,443 | ) |
Class I | | | (449,675 | ) | | | (380,969 | ) |
Total distributions to shareholders | | $ | (12,429,410 | ) | | $ | (3,809,590 | ) |
Transactions in shares of beneficial interest — | | | | | | | | |
Proceeds from sale of shares | | | | | | | | |
Class A | | $ | 5,941,705 | | | $ | 16,202,355 | |
Class B | | | 252,989 | | | | 113,007 | |
Class C | | | 2,181,057 | | | | 7,163,082 | |
Class I | | | 98,259,752 | | | | 36,719,934 | |
Net asset value of shares issued to shareholders in payment of distributions declared | | | | | | | | |
Class A | | | 9,147,833 | | | | 2,767,802 | |
Class B | | | 19,959 | | | | 3,171 | |
Class C | | | 1,046,903 | | | | 298,993 | |
Class I | | | 231,613 | | | | 331,341 | |
Cost of shares redeemed | | | | | | | | |
Class A | | | (88,084,538 | ) | | | (36,009,006 | ) |
Class B | | | (1,180,695 | ) | | | (1,097,368 | ) |
Class C | | | (20,983,629 | ) | | | (16,501,898 | ) |
Class I | | | (102,568,528 | ) | | | (36,034,745 | ) |
Class S | | | (6,986 | ) | | | — | |
Net asset value of shares exchanged | | | | | | | | |
Class A | | | 3,928,743 | | | | 3,125,400 | |
Class B | | | (3,928,743 | ) | | | (3,125,400 | ) |
Net asset value of shares merged* | | | | | | | | |
Class I | | | 10,885,890 | | | | — | |
Class S | | | (10,885,890 | ) | | | — | |
Net decrease in net assets from Fund share transactions | | $ | (95,742,565 | ) | | $ | (26,043,332 | ) |
| | |
Net increase in net assets | | $ | 233,808,062 | | | $ | 106,089,951 | |
| | |
| Net Assets | | | | | | | | |
At beginning of year | | $ | 1,134,416,774 | | | $ | 449,703,641 | |
At end of year | | $ | 1,368,224,836 | | | $ | 555,793,592 | |
| | |
Accumulated undistributed net investment income
included in net assets | | | | | | | | |
At end of year | | $ | 83,070 | | | $ | 53,854 | |
| * | At the close of business on December 6, 2013, Class S shares were merged into Class I shares. |
| | | | |
| | 11 | | See Notes to Financial Statements. |
Eaton Vance
Tax-Managed Growth Funds 1.1 and 1.2
June 30, 2014
Financial Highlights
| | | | | | | | | | | | | | | | | | | | | | | | |
| | | Tax-Managed Growth Fund 1.1 — Class A | |
| | | Six Months Ended June 30, 2014 (Unaudited) | | | Year Ended December 31, | |
| | | | 2013 | | | 2012 | | | 2011 | | | 2010 | | | 2009 | |
Net asset value — Beginning of period | | $ | 35.000 | | | $ | 26.810 | | | $ | 23.630 | | | $ | 23.820 | | | $ | 21.400 | | | $ | 17.660 | |
| | | | | | |
| Income (Loss) From Operations | | | | | | | | | | | | | | | | | | | | | | | | |
Net investment income(1) | | $ | 0.209 | | | $ | 0.354 | | | $ | 0.366 | | | $ | 0.275 | | | $ | 0.226 | | | $ | 0.260 | |
Net realized and unrealized gain (loss) | | | 1.861 | | | | 8.195 | | | | 3.195 | | | | (0.176 | ) | | | 2.433 | | | | 3.768 | |
| | | | | | |
Total income from operations | | $ | 2.070 | | | $ | 8.549 | | | $ | 3.561 | | | $ | 0.099 | | | $ | 2.659 | | | $ | 4.028 | |
| | | | | | |
| Less Distributions | | | | | | | | | | | | | | | | | | | | | | | | |
From net investment income | | $ | — | | | $ | (0.359 | ) | | $ | (0.381 | ) | | $ | (0.289 | ) | | $ | (0.239 | ) | | $ | (0.285 | ) |
Tax return of capital | | | — | | | | — | | | | — | | | | — | | | | — | | | | (0.003 | ) |
| | | | | | |
Total distributions | | $ | — | | | $ | (0.359 | ) | | $ | (0.381 | ) | | $ | (0.289 | ) | | $ | (0.239 | ) | | $ | (0.288 | ) |
| | | | | | |
Net asset value — End of period | | $ | 37.070 | | | $ | 35.000 | | | $ | 26.810 | | | $ | 23.630 | | | $ | 23.820 | | | $ | 21.400 | |
| | | | | | |
Total Return(2) | | | 5.91 | %(3) | | | 31.92 | % | | | 15.05 | % | | | 0.42 | % | | | 12.43 | % | | | 22.79 | % |
| | | | | | |
| Ratios/Supplemental Data | | | | | | | | | | | | | | | | | | | | | | | | |
Net assets, end of period (000’s omitted) | | $ | 1,071,097 | | | $ | 1,048,081 | | | $ | 863,387 | | | $ | 864,789 | | | $ | 1,000,249 | | | $ | 1,036,371 | |
Ratios (as a percentage of average daily net assets): | | | | | | | | | | | | | | | | | | | | | | | | |
Expenses(4)(5) | | | 0.84 | %(6) | | | 0.83 | % | | | 0.86 | % | | | 0.86 | % | | | 0.87 | % | | | 0.91 | % |
Net investment income | | | 1.20 | %(6) | | | 1.14 | % | | | 1.40 | % | | | 1.15 | % | | | 1.04 | % | | | 1.42 | % |
Portfolio Turnover of the Portfolio | | | 3 | %(3) | | | 3 | % | | | 2 | % | | | 2 | % | | | 2 | % | | | 3 | % |
Portfolio Turnover of the Fund | | | — | | | | — | | | | — | | | | — | | | | 8 | %(7) | | | — | |
| (1) | Computed using average shares outstanding. |
| (2) | Returns are historical and are calculated by determining the percentage change in net asset value with all distributions reinvested and do not reflect the effect of sales charges. |
| (4) | Includes the Fund’s share of the Portfolio’s allocated expenses. |
| (5) | Excludes the effect of custody fee credits, if any, of less than 0.005%. |
| (7) | Percentage includes both the Fund’s contributions to and withdrawals from the Portfolio and purchases and sales of securities held directly by the Fund. |
| | | | |
| | 12 | | See Notes to Financial Statements. |
Eaton Vance
Tax-Managed Growth Funds 1.1 and 1.2
June 30, 2014
Financial Highlights — continued
| | | | | | | | | | | | | | | | | | | | | | | | |
| | | Tax-Managed Growth Fund 1.1 — Class B | |
| | | Six Months Ended June 30, 2014 (Unaudited) | | | Year Ended December 31, | |
| | | | 2013 | | | 2012 | | | 2011 | | | 2010 | | | 2009 | |
Net asset value — Beginning of period | | $ | 34.260 | | | $ | 26.220 | | | $ | 23.070 | | | $ | 23.190 | | | $ | 20.790 | | | $ | 17.100 | |
| | | | | | |
| Income (Loss) From Operations | | | | | | | | | | | | | | | | | | | | | | | | |
Net investment income(1) | | $ | 0.076 | | | $ | 0.117 | | | $ | 0.156 | | | $ | 0.087 | | | $ | 0.059 | | | $ | 0.127 | |
Net realized and unrealized gain (loss) | | | 1.814 | | | | 7.997 | | | | 3.118 | | | | (0.163 | ) | | | 2.352 | | | | 3.617 | |
| | | | | | |
Total income (loss) from operations | | $ | 1.890 | | | $ | 8.114 | | | $ | 3.274 | | | $ | (0.076 | ) | | $ | 2.411 | | | $ | 3.744 | |
| | | | | | |
| Less Distributions | | | | | | | | | | | | | | | | | | | | | | | | |
From net investment income | | $ | — | | | $ | (0.074 | ) | | $ | (0.124 | ) | | $ | (0.044 | ) | | $ | (0.011 | ) | | $ | (0.054 | ) |
Tax return of capital | | | — | | | | — | | | | — | | | | — | | | | — | | | | (0.000 | )(2) |
| | | | | | |
Total distributions | | $ | — | | | $ | (0.074 | ) | | $ | (0.124 | ) | | $ | (0.044 | ) | | $ | (0.011 | ) | | $ | (0.054 | ) |
| | | | | | |
Net asset value — End of period | | $ | 36.150 | | | $ | 34.260 | | | $ | 26.220 | | | $ | 23.070 | | | $ | 23.190 | | | $ | 20.790 | |
| | | | | | |
Total Return(3) | | | 5.52 | %(4) | | | 30.95 | % | | | 14.18 | % | | | (0.33 | )% | | | 11.60 | % | | | 21.89 | % |
| | | | | | |
| Ratios/Supplemental Data | | | | | | | | | | | | | | | | | | | | | | | | |
Net assets, end of period (000’s omitted) | | $ | 8,555 | | | $ | 9,872 | | | $ | 11,825 | | | $ | 18,835 | | | $ | 32,084 | | | $ | 52,538 | |
Ratios (as a percentage of average daily net assets): | | | | | | | | | | | | | | | | | | | | | | | | |
Expenses(5)(6) | | | 1.59 | %(7) | | | 1.59 | % | | | 1.61 | % | | | 1.61 | % | | | 1.62 | % | | | 1.67 | % |
Net investment income | | | 0.44 | %(7) | | | 0.39 | % | | | 0.62 | % | | | 0.37 | % | | | 0.28 | % | | | 0.73 | % |
Portfolio Turnover of the Portfolio | | | 3 | %(4) | | | 3 | % | | | 2 | % | | | 2 | % | | | 2 | % | | | 3 | % |
Portfolio Turnover of the Fund | | | — | | | | — | | | | — | | | | — | | | | 8 | %(8) | | | — | |
| (1) | Computed using average shares outstanding. |
| (2) | Less than $0.001 per share. |
| (3) | Returns are historical and are calculated by determining the percentage change in net asset value with all distributions reinvested and do not reflect the effect of sales charges. |
| (5) | Includes the Fund’s share of the Portfolio’s allocated expenses. |
| (6) | Excludes the effect of custody fee credits, if any, of less than 0.005%. |
| (8) | Percentage includes both the Fund’s contributions to and withdrawals from the Portfolio and purchases and sales of securities held directly by the Fund. |
| | | | |
| | 13 | | See Notes to Financial Statements. |
Eaton Vance
Tax-Managed Growth Funds 1.1 and 1.2
June 30, 2014
Financial Highlights — continued
| | | | | | | | | | | | | | | | | | | | | | | | |
| | | Tax-Managed Growth Fund 1.1 — Class C | |
| | | Six Months Ended June 30, 2014 (Unaudited) | | | Year Ended December 31, | |
| | | | 2013 | | | 2012 | | | 2011 | | | 2010 | | | 2009 | |
Net asset value — Beginning of period | | $ | 31.630 | | | $ | 24.270 | | | $ | 21.430 | | | $ | 21.630 | | | $ | 19.450 | | | $ | 16.080 | |
| | | | | | |
| Income (Loss) From Operations | | | | | | | | | | | | | | | | | | | | | | | | |
Net investment income(1) | | $ | 0.070 | | | $ | 0.110 | | | $ | 0.154 | | | $ | 0.086 | | | $ | 0.057 | | | $ | 0.112 | |
Net realized and unrealized gain (loss) | | | 1.680 | | | | 7.402 | | | | 2.889 | | | | (0.167 | ) | | | 2.205 | | | | 3.412 | |
| | | | | | |
Total income (loss) from operations | | $ | 1.750 | | | $ | 7.512 | | | $ | 3.043 | | | $ | (0.081 | ) | | $ | 2.262 | | | $ | 3.524 | |
| | | | | | |
| Less Distributions | | | | | | | | | | | | | | | | | | | | | | | | |
From net investment income | | $ | — | | | $ | (0.152 | ) | | $ | (0.203 | ) | | $ | (0.119 | ) | | $ | (0.082 | ) | | $ | (0.153 | ) |
Tax return of capital | | | — | | | | — | | | | — | | | | — | | | | — | | | | (0.001 | ) |
| | | | | | |
Total distributions | | $ | — | | | $ | (0.152 | ) | | $ | (0.203 | ) | | $ | (0.119 | ) | | $ | (0.082 | ) | | $ | (0.154 | ) |
| | | | | | |
Net asset value — End of period | | $ | 33.380 | | | $ | 31.630 | | | $ | 24.270 | | | $ | 21.430 | | | $ | 21.630 | | | $ | 19.450 | |
| | | | | | |
Total Return(2) | | | 5.53 | %(3) | | | 30.97 | % | | | 14.19 | % | | | (0.37 | )% | | | 11.63 | % | | | 21.90 | % |
| | | | | | |
| Ratios/Supplemental Data | | | | | | | | | | | | | | | | | | | | | | | | |
Net assets, end of period (000’s omitted) | | $ | 274,404 | | | $ | 269,668 | | | $ | 222,682 | | | $ | 227,541 | | | $ | 264,689 | | | $ | 281,787 | |
Ratios (as a percentage of average daily net assets): | | | | | | | | | | | | | | | | | | | | | | | | |
Expenses(4)(5) | | | 1.59 | %(6) | | | 1.58 | % | | | 1.61 | % | | | 1.61 | % | | | 1.62 | % | | | 1.66 | % |
Net investment income | | | 0.45 | %(6) | | | 0.39 | % | | | 0.65 | % | | | 0.39 | % | | | 0.29 | % | | | 0.67 | % |
Portfolio Turnover of the Portfolio | | | 3 | %(3) | | | 3 | % | | | 2 | % | | | 2 | % | | | 2 | % | | | 3 | % |
Portfolio Turnover of the Fund | | | — | | | | — | | | | — | | | | — | | | | 8 | %(7) | | | — | |
| (1) | Computed using average shares outstanding. |
| (2) | Returns are historical and are calculated by determining the percentage change in net asset value with all distributions reinvested and do not reflect the effect of sales charges. |
| (4) | Includes the Fund’s share of the Portfolio’s allocated expenses. |
| (5) | Excludes the effect of custody fee credits, if any, of less than 0.005%. |
| (7) | Percentage includes both the Fund’s contributions to and withdrawals from the Portfolio and purchases and sales of securities held directly by the Fund. |
| | | | |
| | 14 | | See Notes to Financial Statements. |
Eaton Vance
Tax-Managed Growth Funds 1.1 and 1.2
June 30, 2014
Financial Highlights — continued
| | | | | | | | | | | | | | | | | | | | | | | | |
| | | Tax-Managed Growth Fund 1.1 — Class I | |
| | | Six Months Ended June 30, 2014 (Unaudited) | | | Year Ended December 31, | |
| | | | 2013 | | | 2012 | | | 2011 | | | 2010 | | | 2009 | |
Net asset value — Beginning of period | | $ | 32.790 | | | $ | 25.130 | | | $ | 22.170 | | | $ | 22.380 | | | $ | 20.160 | | | $ | 16.640 | |
| | | | | | |
| Income (Loss) From Operations | | | | | | | | | | | | | | | | | | | | | | | | |
Net investment income(1) | | $ | 0.243 | | | $ | 0.416 | | | $ | 0.427 | | | $ | 0.323 | | | $ | 0.239 | | | $ | 0.263 | |
Net realized and unrealized gain (loss) | | | 1.747 | | | | 7.683 | | | | 2.982 | | | | (0.180 | ) | | | 2.279 | | | | 3.594 | |
| | | | | | |
Total income from operations | | $ | 1.990 | | | $ | 8.099 | | | $ | 3.409 | | | $ | 0.143 | | | $ | 2.518 | | | $ | 3.857 | |
| | | | | | |
| Less Distributions | | | | | | | | | | | | | | | | | | | | | | | | |
From net investment income | | $ | — | | | $ | (0.439 | ) | | $ | (0.449 | ) | | $ | (0.353 | ) | | $ | (0.298 | ) | | $ | (0.334 | ) |
Tax return of capital | | | — | | | | — | | | | — | | | | — | | | | — | | | | (0.003 | ) |
| | | | | | |
Total distributions | | $ | — | | | $ | (0.439 | ) | | $ | (0.449 | ) | | $ | (0.353 | ) | | $ | (0.298 | ) | | $ | (0.337 | ) |
| | | | | | |
Net asset value — End of period | | $ | 34.780 | | | $ | 32.790 | | | $ | 25.130 | | | $ | 22.170 | | | $ | 22.380 | | | $ | 20.160 | |
| | | | | | |
Total Return(2) | | | 6.07 | %(3) | | | 32.27 | % | | | 15.35 | % | | | 0.65 | % | | | 12.49 | % | | | 23.16 | % |
| | | | | | |
| Ratios/Supplemental Data | | | | | | | | | | | | | | | | | | | | | | | | |
Net assets, end of period (000’s omitted) | | $ | 39,639 | | | $ | 40,603 | | | $ | 28,049 | | | $ | 23,857 | | | $ | 12,495 | | | $ | 12,424 | |
Ratios (as a percentage of average daily net assets): | | | | | | | | | | | | | | | | | | | | | | | | |
Expenses(4)(5) | | | 0.59 | %(6) | | | 0.59 | % | | | 0.61 | % | | | 0.61 | % | | | 0.62 | % | | | 0.67 | % |
Net investment income | | | 1.48 | %(6) | | | 1.42 | % | | | 1.74 | % | | | 1.44 | % | | | 1.17 | % | | | 1.52 | % |
Portfolio Turnover of the Portfolio | | | 3 | %(3) | | | 3 | % | | | 2 | % | | | 2 | % | | | 2 | % | | | 3 | % |
Portfolio Turnover of the Fund | | | — | | | | — | | | | — | | | | — | | | | 8 | %(7) | | | — | |
| (1) | Computed using average shares outstanding. |
| (2) | Returns are historical and are calculated by determining the percentage change in net asset value with all distributions reinvested. |
| (4) | Includes the Fund’s share of the Portfolio’s allocated expenses. |
| (5) | Excludes the effect of custody fee credits, if any, of less than 0.005%. |
| (7) | Percentage includes both the Fund’s contributions to and withdrawals from the Portfolio and purchases and sales of securities held directly by the Fund. |
| | | | |
| | 15 | | See Notes to Financial Statements. |
Eaton Vance
Tax-Managed Growth Funds 1.1 and 1.2
June 30, 2014
Financial Highlights — continued
| | | | | | | | | | | | | | | | | | | | | | | | |
| | | Tax-Managed Growth Fund 1.2 — Class A | |
| | | Six Months Ended June 30, 2014 (Unaudited) | | | Year Ended December 31, | |
| | | | 2013 | | | 2012 | | | 2011 | | | 2010 | | | 2009 | |
Net asset value — Beginning of period | | $ | 15.750 | | | $ | 12.060 | | | $ | 10.630 | | | $ | 10.720 | | | $ | 9.640 | | | $ | 7.960 | |
| | | | | | |
| Income (Loss) From Operations | | | | | | | | | | | | | | | | | | | | | | | | |
Net investment income(1) | | $ | 0.082 | | | $ | 0.137 | | | $ | 0.145 | | | $ | 0.104 | | | $ | 0.084 | | | $ | 0.102 | |
Net realized and unrealized gain (loss) | | | 0.838 | | | | 3.691 | | | | 1.437 | | | | (0.083 | ) | | | 1.088 | | | | 1.697 | |
| | | | | | |
Total income from operations | | $ | 0.920 | | | $ | 3.828 | | | $ | 1.582 | | | $ | 0.021 | | | $ | 1.172 | | | $ | 1.799 | |
| | | | | | |
| Less Distributions | | | | | | | | | | | | | | | | | | | | | | | | |
From net investment income | | $ | — | | | $ | (0.138 | ) | | $ | (0.152 | ) | | $ | (0.111 | ) | | $ | (0.092 | ) | | $ | (0.117 | ) |
Tax return of capital | | | — | | | | — | | | | — | | | | — | | | | — | | | | (0.002 | ) |
| | | | | | |
Total distributions | | $ | — | | | $ | (0.138 | ) | | $ | (0.152 | ) | | $ | (0.111 | ) | | $ | (0.092 | ) | | $ | (0.119 | ) |
| | | | | | |
Net asset value — End of period | | $ | 16.670 | | | $ | 15.750 | | | $ | 12.060 | | | $ | 10.630 | | | $ | 10.720 | | | $ | 9.640 | |
| | | | | | |
Total Return(2) | | | 5.84 | %(3) | | | 31.76 | % | | | 14.87 | % | | | 0.20 | % | | | 12.15 | % | | | 22.59 | % |
| | | | | | |
| Ratios/Supplemental Data | | | | | | | | | | | | | | | | | | | | | | | | |
Net assets, end of period (000’s omitted) | | $ | 365,309 | | | $ | 352,976 | | | $ | 282,750 | | | $ | 278,401 | | | $ | 332,251 | | | $ | 337,780 | |
Ratios (as a percentage of average daily net assets): | | | | | | | | | | | | | | | | | | | | | | | | |
Expenses(4)(5) | | | 1.00 | %(6) | | | 1.00 | % | | | 1.03 | % | | | 1.04 | % | | | 1.06 | % | | | 1.09 | % |
Net investment income | | | 1.04 | %(6) | | | 0.98 | % | | | 1.24 | % | | | 0.96 | % | | | 0.86 | % | | | 1.23 | % |
Portfolio Turnover of the Portfolio | | | 3 | %(3) | | | 3 | % | | | 2 | % | | | 2 | % | | | 2 | % | | | 3 | % |
| (1) | Computed using average shares outstanding. |
| (2) | Returns are historical and are calculated by determining the percentage change in net asset value with all distributions reinvested and do not reflect the effect of sales charges. |
| (4) | Includes the Fund’s share of the Portfolio’s allocated expenses. |
| (5) | Excludes the effect of custody fee credits, if any, of less than 0.005%. |
| | | | |
| | 16 | | See Notes to Financial Statements. |
Eaton Vance
Tax-Managed Growth Funds 1.1 and 1.2
June 30, 2014
Financial Highlights — continued
| | | | | | | | | | | | | | | | | | | | | | | | |
| | | Tax-Managed Growth Fund 1.2 — Class B | |
| | | Six Months Ended June 30, 2014 (Unaudited) | | | Year Ended December 31, | |
| | | | 2013 | | | 2012 | | | 2011 | | | 2010 | | | 2009 | |
Net asset value — Beginning of period | | $ | 15.570 | | | $ | 11.920 | | | $ | 10.470 | | | $ | 10.530 | | | $ | 9.450 | | | $ | 7.780 | |
| | | | | | |
| Income (Loss) From Operations | | | | | | | | | | | | | | | | | | | | | | | | |
Net investment income(1) | | $ | 0.022 | | | $ | 0.031 | | | $ | 0.049 | | | $ | 0.019 | | | $ | 0.009 | | | $ | 0.042 | |
Net realized and unrealized gain (loss) | | | 0.828 | | | | 3.626 | | | | 1.419 | | | | (0.079 | ) | | | 1.071 | | | | 1.648 | |
| | | | | | |
Total income (loss) from operations | | $ | 0.850 | | | $ | 3.657 | | | $ | 1.468 | | | $ | (0.060 | ) | | $ | 1.080 | | | $ | 1.690 | |
| | | | | | |
| Less Distributions | | | | | | | | | | | | | | | | | | | | | | | | |
From net investment income | | $ | — | | | $ | (0.007 | ) | | $ | (0.018 | ) | | $ | — | | | $ | — | | | $ | (0.020 | ) |
Tax return of capital | | | — | | | | — | | | | — | | | | — | | | | — | | | | (0.000 | )(2) |
| | | | | | |
Total distributions | | $ | — | | | $ | (0.007 | ) | | $ | (0.018 | ) | | $ | — | | | $ | — | | | $ | (0.020 | ) |
| | | | | | |
Net asset value — End of period | | $ | 16.420 | | | $ | 15.570 | | | $ | 11.920 | | | $ | 10.470 | | | $ | 10.530 | | | $ | 9.450 | |
| | | | | | |
Total Return(3) | | | 5.46 | %(4) | | | 30.68 | % | | | 14.02 | % | | | (0.57 | )% | | | 11.43 | % | | | 21.71 | % |
| | | | | | |
| Ratios/Supplemental Data | | | | | | | | | | | | | | | | | | | | | | | | |
Net assets, end of period (000’s omitted) | | $ | 6,711 | | | $ | 8,046 | | | $ | 9,789 | | | $ | 19,064 | | | $ | 39,520 | | | $ | 84,049 | |
Ratios (as a percentage of average daily net assets): | | | | | | | | | | | | | | | | | | | | | | | | |
Expenses(5)(6) | | | 1.75 | %(7) | | | 1.75 | % | | | 1.78 | % | | | 1.80 | % | | | 1.81 | % | | | 1.85 | % |
Net investment income | | | 0.29 | %(7) | | | 0.22 | % | | | 0.43 | % | | | 0.18 | % | | | 0.10 | % | | | 0.53 | % |
Portfolio Turnover of the Portfolio | | | 3 | %(4) | | | 3 | % | | | 2 | % | | | 2 | % | | | 2 | % | | | 3 | % |
| (1) | Computed using average shares outstanding. |
| (2) | Less than $0.001 per share. |
| (3) | Returns are historical and are calculated by determining the percentage change in net asset value with all distributions reinvested and do not reflect the effect of sales charges. |
| (5) | Includes the Fund’s share of the Portfolio’s allocated expenses. |
| (6) | Excludes the effect of custody fee credits, if any, of less than 0.005%. |
| | | | |
| | 17 | | See Notes to Financial Statements. |
Eaton Vance
Tax-Managed Growth Funds 1.1 and 1.2
June 30, 2014
Financial Highlights — continued
| | | | | | | | | | | | | | | | | | | | | | | | |
| | | Tax-Managed Growth Fund 1.2 — Class C | |
| | | Six Months Ended June 30, 2014 (Unaudited) | | | Year Ended December 31, | |
| | | | 2013 | | | 2012 | | | 2011 | | | 2010 | | | 2009 | |
Net asset value — Beginning of period | | $ | 15.370 | | | $ | 11.780 | | | $ | 10.390 | | | $ | 10.470 | | | $ | 9.420 | | | $ | 7.780 | |
| | | | | | |
| Income (Loss) From Operations | | | | | | | | | | | | | | | | | | | | | | | | |
Net investment income(1) | | $ | 0.022 | | | $ | 0.031 | | | $ | 0.055 | | | $ | 0.022 | | | $ | 0.010 | | | $ | 0.039 | |
Net realized and unrealized gain (loss) | | | 0.818 | | | | 3.594 | | | | 1.398 | | | | (0.075 | ) | | | 1.053 | | | | 1.653 | |
| | | | | | |
Total income (loss) from operations | | $ | 0.840 | | | $ | 3.625 | | | $ | 1.453 | | | $ | (0.053 | ) | | $ | 1.063 | | | $ | 1.692 | |
| | | | | | |
| Less Distributions | | | | | | | | | | | | | | | | | | | | | | | | |
From net investment income | | $ | — | | | $ | (0.035 | ) | | $ | (0.063 | ) | | $ | (0.027 | ) | | $ | (0.013 | ) | | $ | (0.051 | ) |
Tax return of capital | | | — | | | | — | | | | — | | | | — | | | | — | | | | (0.001 | ) |
| | | | | | |
Total distributions | | $ | — | | | $ | (0.035 | ) | | $ | (0.063 | ) | | $ | (0.027 | ) | | $ | (0.013 | ) | | $ | (0.052 | ) |
| | | | | | |
Net asset value — End of period | | $ | 16.210 | | | $ | 15.370 | | | $ | 11.780 | | | $ | 10.390 | | | $ | 10.470 | | | $ | 9.420 | |
| | | | | | |
Total Return(2) | | | 5.47 | %(3) | | | 30.78 | % | | | 13.98 | % | | | (0.50 | )% | | | 11.28 | % | | | 21.74 | % |
| | | | | | |
| Ratios/Supplemental Data | | | | | | | | | | | | | | | | | | | | | | | | |
Net assets, end of period (000’s omitted) | | $ | 162,246 | | | $ | 158,015 | | | $ | 129,144 | | | $ | 130,802 | | | $ | 154,493 | | | $ | 168,916 | |
Ratios (as a percentage of average daily net assets): | | | | | | | | | | | | | | | | | | | | | | | | |
Expenses(4)(5) | | | 1.75 | %(6) | | | 1.75 | % | | | 1.78 | % | | | 1.80 | % | | | 1.80 | % | | | 1.84 | % |
Net investment income | | | 0.29 | %(6) | | | 0.23 | % | | | 0.48 | % | | | 0.21 | % | | | 0.11 | % | | | 0.49 | % |
Portfolio Turnover of the Portfolio | | | 3 | %(3) | | | 3 | % | | | 2 | % | | | 2 | % | | | 2 | % | | | 3 | % |
| (1) | Computed using average shares outstanding. |
| (2) | Returns are historical and are calculated by determining the percentage change in net asset value with all distributions reinvested and do not reflect the effect of sales charges. |
| (4) | Includes the Fund’s share of the Portfolio’s allocated expenses. |
| (5) | Excludes the effect of custody fee credits, if any, of less than 0.005%. |
| | | | |
| | 18 | | See Notes to Financial Statements. |
Eaton Vance
Tax-Managed Growth Funds 1.1 and 1.2
June 30, 2014
Financial Highlights — continued
| | | | | | | | | | | | | | | | | | | | | | | | |
| | | Tax-Managed Growth Fund 1.2 — Class I | |
| | | Six Months Ended June 30, 2014 (Unaudited) | | | Year Ended December 31, | |
| | | | 2013 | | | 2012 | | | 2011 | | | 2010 | | | 2009 | |
Net asset value — Beginning of period | | $ | 15.770 | | | $ | 12.080 | | | $ | 10.650 | | | $ | 10.740 | | | $ | 9.660 | | | $ | 7.970 | |
| | | | | | |
| Income (Loss) From Operations | | | | | | | | | | | | | | | | | | | | | | | | |
Net investment income(1) | | $ | 0.102 | | | $ | 0.174 | | | $ | 0.178 | | | $ | 0.135 | | | $ | 0.103 | | | $ | 0.115 | |
Net realized and unrealized gain (loss) | | | 0.838 | | | | 3.689 | | | | 1.435 | | | | (0.084 | ) | | | 1.095 | | | | 1.716 | |
| | | | | | |
Total income from operations | | $ | 0.940 | | | $ | 3.863 | | | $ | 1.613 | | | $ | 0.051 | | | $ | 1.198 | | | $ | 1.831 | |
| | | | | | |
| Less Distributions | | | | | | | | | | | | | | | | | | | | | | | | |
From net investment income | | $ | — | | | $ | (0.173 | ) | | $ | (0.183 | ) | | $ | (0.141 | ) | | $ | (0.118 | ) | | $ | (0.139 | ) |
Tax return of capital | | | — | | | | — | | | | — | | | | — | | | | — | | | | (0.002 | ) |
| | | | | | |
Total distributions | | $ | — | | | $ | (0.173 | ) | | $ | (0.183 | ) | | $ | (0.141 | ) | | $ | (0.118 | ) | | $ | (0.141 | ) |
| | | | | | |
Net asset value — End of period | | $ | 16.710 | | | $ | 15.770 | | | $ | 12.080 | | | $ | 10.650 | | | $ | 10.740 | | | $ | 9.660 | |
| | | | | | |
Total Return(2) | | | 5.96 | %(3) | | | 32.01 | % | | | 15.12 | % | | | 0.48 | % | | | 12.40 | % | | | 22.96 | % |
| | | | | | |
| Ratios/Supplemental Data | | | | | | | | | | | | | | | | | | | | | | | | |
Net assets, end of period (000’s omitted) | | $ | 42,146 | | | $ | 36,757 | | | $ | 28,021 | | | $ | 21,058 | | | $ | 11,701 | | | $ | 9,627 | |
Ratios (as a percentage of average daily net assets): | | | | | | | | | | | | | | | | | | | | | | | | |
Expenses(4)(5) | | | 0.75 | %(6) | | | 0.75 | % | | | 0.79 | % | | | 0.79 | % | | | 0.80 | % | | | 0.85 | % |
Net investment income | | | 1.29 | %(6) | | | 1.24 | % | | | 1.51 | % | | | 1.26 | % | | | 1.04 | % | | | 1.38 | % |
Portfolio Turnover of the Portfolio | | | 3 | %(3) | | | 3 | % | | | 2 | % | | | 2 | % | | | 2 | % | | | 3 | % |
| (1) | Computed using average shares outstanding. |
| (2) | Returns are historical and are calculated by determining the percentage change in net asset value with all distributions reinvested. |
| (4) | Includes the Fund’s share of the Portfolio’s allocated expenses. |
| (5) | Excludes the effect of custody fee credits, if any, of less than 0.005%. |
| | | | |
| | 19 | | See Notes to Financial Statements. |
Eaton Vance
Tax-Managed Growth Funds 1.1 and 1.2
June 30, 2014
Notes to Financial Statements (Unaudited)
1 Significant Accounting Policies
Eaton Vance Tax-Managed Growth Fund 1.1 (Tax-Managed Growth Fund 1.1) and Eaton Vance Tax-Managed Growth Fund 1.2 (Tax-Managed Growth Fund 1.2) (Each a Fund, and collectively the Funds) are diversified series of the Eaton Vance Mutual Funds Trust (the Trust). The Trust is a Massachusetts business trust registered under the Investment Company Act of 1940, as amended (the 1940 Act), as an open-end management investment company. Each Fund currently offers Class A, Class B, Class C and Class I shares. Tax-Managed Growth Fund 1.1 previously issued Class S shares in a one-time offering. At the close of business on December 6, 2013, the Class S shares were merged into Class I shares. Class A shares are generally sold subject to a sales charge imposed at time of purchase. Class B and Class C shares are sold at net asset value and are generally subject to a contingent deferred sales charge (see Note 5). Class I shares are sold at net asset value and are not subject to a sales charge. Class B shares automatically convert to Class A shares eight years after their purchase as described in the Funds’ prospectus. Currently, Class B shares are only available for purchase upon exchange from another Eaton Vance fund or through reinvestment of distributions. Tax-Managed Growth Fund 1.1 is closed to new investors. Each class represents a pro-rata interest in each Fund, but votes separately on class-specific matters and (as noted below) is subject to different expenses. Realized and unrealized gains and losses and net investment income and losses, other than class-specific expenses, are allocated daily to each class of shares based on the relative net assets of each class to the total net assets of a Fund. Each class of shares differs in its distribution plan and certain other class-specific expenses. Each Fund typically invests all of its investable assets in interests in Tax-Managed Growth Portfolio (the Portfolio), a Massachusetts business trust, having the same investment objective and policies as the Funds. The value of each Fund’s investment in the Portfolio reflects the Fund’s proportionate interest in the net assets of the Portfolio (14.3% and 5.9% for Tax-Managed Growth Fund 1.1 and Tax-Managed Growth Fund 1.2, respectively, at June 30, 2014). The performance of each Fund is directly affected by the performance of the Portfolio. The financial statements of the Portfolio, including the portfolio of investments, are included elsewhere in this report and should be read in conjunction with the Funds’ financial statements.
The following is a summary of significant accounting policies of the Funds. The policies are in conformity with accounting principles generally accepted in the United States of America.
A Investment Valuation — Valuation of securities by the Portfolio is discussed in Note 1A of the Portfolio’s Notes to Financial Statements, which are included elsewhere in this report.
B Income — Each Fund’s net investment income or loss consists of the Fund’s pro-rata share of the net investment income or loss of the Portfolio, less all actual and accrued expenses of the Fund.
C Federal Taxes — Each Fund’s policy is to comply with the provisions of the Internal Revenue Code applicable to regulated investment companies and to distribute to shareholders each year substantially all of its net investment income, and all or substantially all of its net realized capital gains. Accordingly, no provision for federal income or excise tax is necessary.
At December 31, 2013, the Funds, for federal income tax purposes, had capital loss carryforwards and/or deferred capital losses which will reduce the respective Fund’s taxable income arising from future net realized gains on investment transactions, if any, to the extent permitted by the Internal Revenue Code, and thus will reduce the amount of distributions to shareholders, which would otherwise be necessary to relieve the Funds of any liability for federal income or excise tax. The deferred capital losses are treated as arising on the first day of the Funds’ next taxable year and are treated as realized prior to the utilization of the capital loss carryforward. The amounts and expiration dates of the capital loss carryforwards and the amounts of the deferred capital losses are as follows:
| | | | | | | | |
| Expiration Date | | Tax-Managed
Growth Fund 1.1 | | | Tax-Managed
Growth Fund 1.2 | |
| | |
December 31, 2016 | | $ | — | | | $ | 5,627,596 | |
December 31, 2017 | | | — | | | | 10,124,862 | |
| | |
Total capital loss carryforward | | $ | — | | | $ | 15,752,458 | |
| | |
Deferred capital losses | | $ | 5,038,828 | | | $ | 1,664,696 | |
As of June 30, 2014, the Funds had no uncertain tax positions that would require financial statement recognition, de-recognition, or disclosure. Each Fund files a U.S. federal income tax return annually after its fiscal year-end, which is subject to examination by the Internal Revenue Service for a period of three years from the date of filing.
D Expenses — The majority of expenses of the Trust are directly identifiable to an individual fund. Expenses which are not readily identifiable to a specific fund are allocated taking into consideration, among other things, the nature and type of expense and the relative size of the funds.
E Expense Reduction — State Street Bank and Trust Company (SSBT) serves as custodian of the Funds. Pursuant to the respective custodian agreements, SSBT receives a fee reduced by credits, which are determined based on the average daily cash balance each Fund maintains with SSBT. All credit balances, if any, used to reduce each Fund’s custodian fees are reported as a reduction of expenses in the Statements of Operations.
Eaton Vance
Tax-Managed Growth Funds 1.1 and 1.2
June 30, 2014
Notes to Financial Statements (Unaudited) — continued
F Use of Estimates — The preparation of the financial statements in conformity with accounting principles generally accepted in the United States of America requires management to make estimates and assumptions that affect the reported amounts of assets and liabilities at the date of the financial statements and the reported amounts of income and expense during the reporting period. Actual results could differ from those estimates.
G Indemnifications — Under the Trust’s organizational documents, its officers and Trustees may be indemnified against certain liabilities and expenses arising out of the performance of their duties to each Fund. Under Massachusetts law, if certain conditions prevail, shareholders of a Massachusetts business trust (such as the Trust) could be deemed to have personal liability for the obligations of the Trust. However, the Trust’s Declaration of Trust contains an express disclaimer of liability on the part of Fund shareholders and the By-laws provide that the Trust shall assume the defense on behalf of any Fund shareholders. Moreover, the By-laws also provide for indemnification out of Fund property of any shareholder held personally liable solely by reason of being or having been a shareholder for all loss or expense arising from such liability. Additionally, in the normal course of business, each Fund enters into agreements with service providers that may contain indemnification clauses. Each Fund’s maximum exposure under these arrangements is unknown as this would involve future claims that may be made against each Fund that have not yet occurred.
H Other — Investment transactions are accounted for on a trade date basis. Dividends to shareholders are recorded on the ex-dividend date.
I Interim Financial Statements — The interim financial statements relating to June 30, 2014 and for the six months then ended have not been audited by an independent registered public accounting firm, but in the opinion of the Funds’ management, reflect all adjustments, consisting only of normal recurring adjustments, necessary for the fair presentation of the financial statements.
2 Distributions to Shareholders
It is the present policy of each Fund to make at least one distribution annually (normally in December) of all or substantially all of its net investment income and to distribute annually all or substantially all of its net realized capital gains (reduced by available capital loss carryforwards from prior years). Distributions are declared separately for each class of shares. Shareholders may reinvest income and capital gain distributions in additional shares of the same class of a Fund at the net asset value as of the ex-dividend date or, at the election of the shareholder, receive distributions in cash. The Funds distinguish between distributions on a tax basis and a financial reporting basis. Accounting principles generally accepted in the United States of America require that only distributions in excess of tax basis earnings and profits be reported in the financial statements as a return of capital. Permanent differences between book and tax accounting relating to distributions are reclassified to paid-in capital. For tax purposes, distributions from short-term capital gains are considered to be from ordinary income.
3 Transactions with Affiliates
Eaton Vance Management (EVM) serves as the administrator to the Funds. EVM receives no compensation from Tax-Managed Growth Fund 1.1 for such services and a fee computed at an annual rate of 0.15% of average daily net assets from Tax-Managed Growth Fund 1.2 for such services. For the six months ended June 30, 2014, the administration fee for Tax-Managed Growth Fund 1.2 amounted to $412,325. The Portfolio has engaged Boston Management and Research (BMR), a subsidiary of EVM, to render investment advisory services. See Note 2 of the Portfolio’s Notes to Financial Statements which are included elsewhere in this report.
EVM provides sub-transfer agency and related services to the Funds pursuant to a Sub-Transfer Agency Support Services Agreement. Eaton Vance Distributors, Inc. (EVD), an affiliate of EVM and the Funds’ principal underwriter, received a portion of the sales charge on sales of Class A shares of the Funds. EVD also received distribution and service fees from Class A, Class B and Class C shares (see Note 4) and contingent deferred sales charges (see Note 5). Sub-transfer agent fees earned by EVM, which are included in transfer and dividend disbursing agent fees on the Statements of Operations, and Class A sales charges that the Funds were informed were received by EVD for the six months ended June 30, 2014 were as follows:
| | | | | | | | |
| | | Tax-Managed
Growth Fund 1.1 | | | Tax-Managed
Growth Fund 1.2 | |
| | |
EVM’s Sub-Transfer Agent Fees | | $ | 44,469 | | | $ | 13,818 | |
EVD’s Class A Sales Charges | | $ | 11,638 | | | $ | 24,264 | |
Trustees and officers of the Funds who are members of EVM’s or BMR’s organizations receive remuneration for their services to the Funds out of the investment adviser fee. Certain officers and Trustees of the Funds and the Portfolio are officers of the above organizations.
4 Distribution Plans
Each Fund has in effect a distribution plan for Class A shares (Class A Plan) pursuant to Rule 12b-1 under the 1940 Act. Pursuant to the Class A Plan, each Fund pays EVD a distribution and service fee of 0.25%��per annum of its average daily net assets attributable to Class A shares for distribution
Eaton Vance
Tax-Managed Growth Funds 1.1 and 1.2
June 30, 2014
Notes to Financial Statements (Unaudited) — continued
services and facilities provided to each Fund by EVD, as well as for personal services and/or the maintenance of shareholder accounts. Distribution and service fees paid or accrued to EVD for the six months ended June 30, 2014 for Class A shares amounted to the following:
| | | | | | | | |
| | | Tax-Managed
Growth Fund 1.1 | | | Tax-Managed
Growth Fund 1.2 | |
| | |
Class A Distribution and Service Fees | | $ | 1,286,837 | | | $ | 437,302 | |
Each Fund also has in effect distribution plans for Class B shares (Class B Plan) and Class C shares (Class C Plan) pursuant to Rule 12b-1 under the 1940 Act. Pursuant to the Class B and Class C Plans, each Fund pays EVD amounts equal to 0.75% per annum of its average daily net assets attributable to Class B and Class C shares for providing ongoing distribution services and facilities to the respective Fund. For the six months ended June 30, 2014, the Funds paid or accrued to EVD the following distribution fees:
| | | | | | | | |
| | | Tax-Managed
Growth Fund 1.1 | | | Tax-Managed
Growth Fund 1.2 | |
| | |
Class B Distribution Fees | | $ | 33,614 | | | $ | 27,434 | |
Class C Distribution Fees | | $ | 989,263 | | | $ | 584,141 | |
Pursuant to the Class B and Class C Plans, each Fund also makes payments of service fees to EVD, financial intermediaries and other persons in amounts equal to 0.25% per annum of its average daily net assets attributable to that class. Service fees paid or accrued are for personal services and/or the maintenance of shareholder accounts. They are separate and distinct from the sales commissions and distribution fees payable to EVD. Service fees paid or accrued for the six months ended June 30, 2014 amounted to the following:
| | | | | | | | |
| | | Tax-Managed
Growth Fund 1.1 | | | Tax-Managed
Growth Fund 1.2 | |
| | |
Class B Service Fees | | $ | 11,205 | | | $ | 9,144 | |
Class C Service Fees | | $ | 329,754 | | | $ | 194,714 | |
Distribution and service fees are subject to the limitations contained in the Financial Industry Regulatory Authority’s NASD Conduct Rule 2830(d), and Class B shares of Tax-Managed Growth Fund 1.1 are further limited to a 5% maximum sales charge as determined in accordance with such rule.
5 Contingent Deferred Sales Charges
A contingent deferred sales charge (CDSC) generally is imposed on redemptions of Class B shares made within six years of purchase and on redemptions of Class C shares made within one year of purchase. Class A shares may be subject to a 1% CDSC if redeemed within 18 months of purchase (depending on the circumstances of purchase). Generally, the CDSC is based upon the lower of the net asset value at date of redemption or date of purchase. No charge is levied on shares acquired by reinvestment of dividends or capital gain distributions. The CDSC for Class B shares is imposed at declining rates that begin at 5% in the case of redemptions in the first and second year after purchase, declining one percentage point each subsequent year. Class C shares are subject to a 1% CDSC if redeemed within one year of purchase. For the six months ended June 30, 2014, the Funds were informed that EVD received approximately the following amounts of CDSCs paid by Class A, Class B, and Class C shareholders:
| | | | | | | | |
| | | Tax-Managed
Growth Fund 1.1 | | | Tax-Managed
Growth Fund 1.2 | |
| | |
Class A | | $ | 102 | | | $ | — | |
Class B | | $ | 2,123 | | | $ | 1,136 | |
Class C | | $ | 283 | | | $ | 1,303 | |
Eaton Vance
Tax-Managed Growth Funds 1.1 and 1.2
June 30, 2014
Notes to Financial Statements (Unaudited) — continued
6 Investment Transactions
For the six months ended June 30, 2014, increases and decreases in each Fund’s investment in the Portfolio aggregated, as follows:
| | | | | | | | |
| Fund | | Increases | | | Decreases | |
| | |
Tax-Managed Growth Fund 1.1 | | $ | 1,329 | | | $ | 55,266,798 | |
Tax-Managed Growth Fund 1.2 | | | 2,259,862 | | | | 14,985,699 | |
Decreases in each Fund’s investment in the Portfolio include distributions of common stock as the result of redemptions in-kind, as follows:
| | | | |
| Fund | | Redemptions
in-kind | |
| |
Tax-Managed Growth Fund 1.1 | | $ | 44,859,981 | |
Tax-Managed Growth Fund 1.2 | | | 10,608,023 | |
7 Shares of Beneficial Interest
Each Fund’s Declaration of Trust permits the Trustees to issue an unlimited number of full and fractional shares of beneficial interest (without par value). Such shares may be issued in a number of different series (such as the Funds) and classes. Sales and redemptions of Class I shares include shares purchased and redeemed in connection with the ReFlow liquidity program, a program designed to provide an alternative liquidity source for mutual funds experiencing net redemptions of their shares. Transactions in Fund shares were as follows:
| | | | | | | | | | | | | | | | | | | | |
Tax-Managed Growth Fund 1.1 | | | | | | | | | | | | | | | |
| | | | | | Six Months Ended June 30, 2014 (Unaudited) | |
| | | | | | Class A | | | Class B | | | Class C | | | Class I | |
| | | | | |
Sales | | | | | | | 95,124 | | | | 835 | | | | 22,253 | | | | 1,468,199 | |
Redemptions | | | | | | | (1,189,763 | ) | | | (12,849 | ) | | | (327,746 | ) | | | (1,566,717 | ) |
Exchange from Class B shares | | | | | | | 38,645 | | | | — | | | | — | | | | — | |
Exchange to Class A shares | | | | | | | — | | | | (39,553 | ) | | | — | | | | — | |
| | | | | |
Net decrease | | | | | | | (1,055,994 | ) | | | (51,567 | ) | | | (305,493 | ) | | | (98,518 | ) |
| | | | | |
| | | | | | | | | | | | | | | | | | | | |
| | | Year Ended December 31, 2013 | |
| | | Class A | | | Class B | | | Class C | | | Class I | | | Class S(1) | |
| | | | | |
Sales | | | 187,278 | | | | 9,244 | | | | 76,313 | | | | 3,388,126 | | | | — | |
Issued to shareholders electing to receive payments of distributions in Fund shares | | | 267,407 | | | | 596 | | | | 33,847 | | | | 7,227 | | | | — | |
Redemptions | | | (2,846,474 | ) | | | (39,687 | ) | | | (758,250 | ) | | | (3,609,871 | ) | | | (221 | ) |
Exchange from Class B shares | | | 129,739 | | | | — | | | | — | | | | — | | | | — | |
Exchange to Class A shares | | | — | | | | (132,969 | ) | | | — | | | | — | | | | — | |
Merger from Class S shares | | | — | | | | — | | | | — | | | | 336,631 | | | | — | |
Merger to Class I shares | | | — | | | | — | | | | — | | | | — | | | | (311,883 | ) |
| | | | | |
Net increase (decrease) | | | (2,262,050 | ) | | | (162,816 | ) | | | (648,090 | ) | | | 122,113 | | | | (312,104 | ) |
| (1) | Offering of Class S shares was discontinued during the year ended December 31, 2013 (See Note 1). |
Eaton Vance
Tax-Managed Growth Funds 1.1 and 1.2
June 30, 2014
Notes to Financial Statements (Unaudited) — continued
| | | | | | | | | | | | | | | | |
Tax-Managed Growth Fund 1.2 | | | | | | | | | | | | |
| | | Six Months Ended June 30, 2014 (Unaudited) | |
| | | Class A | | | Class B | | | Class C | | | Class I | |
| | | | |
Sales | | | 537,828 | | | | — | | | | 214,770 | | | | 1,128,810 | |
Redemptions | | | (1,113,868 | ) | | | (29,360 | ) | | | (485,504 | ) | | | (937,857 | ) |
Exchange from Class B shares | | | 77,619 | | | | — | | | | — | | | | — | |
Exchange to Class A shares | | | — | | | | (78,650 | ) | | | — | | | | — | |
| | | | |
Net increase (decrease) | | | (498,421 | ) | | | (108,010 | ) | | | (270,734 | ) | | | 190,953 | |
| | | | |
| | | | | | | | | | | | | | | | |
| | | Year Ended December 31, 2013 | |
| | | Class A | | | Class B | | | Class C | | | Class I | |
| | | | |
Sales | | | 1,164,682 | | | | 8,381 | | | | 527,210 | | | | 2,647,084 | |
Issued to shareholders electing to receive payments of distributions in Fund shares | | | 179,844 | | | | 208 | | | | 19,893 | | | | 21,502 | |
Redemptions | | | (2,599,730 | ) | | | (80,885 | ) | | | (1,225,688 | ) | | | (2,657,981 | ) |
Exchange from Class B shares | | | 229,057 | | | | — | | | | — | | | | — | |
Exchange to Class A shares | | | — | | | | (232,418 | ) | | | — | | | | — | |
| | | | |
Net increase (decrease) | | | (1,026,147 | ) | | | (304,714 | ) | | | (678,585 | ) | | | 10,605 | |
Tax-Managed Growth Portfolio
June 30, 2014
Portfolio of Investments (Unaudited)
| | | | | | | | |
| Common Stocks — 98.6% | |
| | |
| | | | | | | | |
| Security | | Shares | | | Value | |
| | | | | | | | |
|
Aerospace & Defense — 4.3% | |
Boeing Co. (The) | | | 935,171 | | | $ | 118,981,806 | |
General Dynamics Corp. | | | 101,500 | | | | 11,829,825 | |
Honeywell International, Inc. | | | 288,222 | | | | 26,790,235 | |
Huntington Ingalls Industries, Inc. | | | 2,546 | | | | 240,826 | |
Lockheed Martin Corp. | | | 16,042 | | | | 2,578,431 | |
Northrop Grumman Corp. | | | 15,277 | | | | 1,827,587 | |
Precision Castparts Corp. | | | 19,025 | | | | 4,801,910 | |
Raytheon Co. | | | 51,795 | | | | 4,778,089 | |
Rockwell Collins, Inc. | | | 166,787 | | | | 13,032,736 | |
United Technologies Corp. | | | 2,001,464 | | | | 231,069,019 | |
| | |
| | | | | | $ | 415,930,464 | |
| | |
|
Air Freight & Logistics — 1.2% | |
C.H. Robinson Worldwide, Inc. | | | 357,704 | | | $ | 22,817,938 | |
FedEx Corp. | | | 262,219 | | | | 39,694,712 | |
United Parcel Service, Inc., Class B | | | 513,015 | | | | 52,666,120 | |
| | |
| | | | | | $ | 115,178,770 | |
| | |
|
Auto Components — 0.4% | |
BorgWarner, Inc. | | | 2,000 | | | $ | 130,380 | |
Johnson Controls, Inc. | | | 850,788 | | | | 42,479,845 | |
| | |
| | | | | | $ | 42,610,225 | |
| | |
|
Automobiles — 0.0%(1) | |
Daimler AG | | | 20,000 | | | $ | 1,867,400 | |
Harley-Davidson, Inc. | | | 800 | | | | 55,880 | |
| | |
| | | | | | $ | 1,923,280 | |
| | |
|
Banks — 6.3% | |
Bank of America Corp. | | | 1,531,841 | | | $ | 23,544,396 | |
Bank of Montreal | | | 26,370 | | | | 1,940,568 | |
BB&T Corp. | | | 1,041,059 | | | | 41,048,956 | |
Citigroup, Inc. | | | 793,170 | | | | 37,358,307 | |
Comerica, Inc. | | | 126,791 | | | | 6,359,837 | |
Fifth Third Bancorp | | | 967,608 | | | | 20,658,431 | |
HSBC Holdings PLC | | | 220,592 | | | | 2,243,356 | |
HSBC Holdings PLC ADR | | | 424 | | | | 21,539 | |
JPMorgan Chase & Co. | | | 3,035,671 | | | | 174,915,363 | |
KeyCorp | | | 111,353 | | | | 1,595,688 | |
M&T Bank Corp. | | | 17,293 | | | | 2,145,197 | |
PNC Financial Services Group, Inc. (The) | | | 59,304 | | | | 5,281,021 | |
Regions Financial Corp. | | | 189,147 | | | | 2,008,741 | |
Royal Bank of Canada | | | 148,562 | | | | 10,611,784 | |
| | | | | | | | |
| Security | | Shares | | | Value | |
| | | | | | | | |
|
Banks (continued) | |
Societe Generale SA | | | 460,793 | | | $ | 24,165,213 | |
SunTrust Banks, Inc. | | | 327,060 | | | | 13,102,024 | |
Synovus Financial Corp. | | | 1,565 | | | | 38,155 | |
Toronto-Dominion Bank (The) | | | 29,644 | | | | 1,523,998 | |
U.S. Bancorp | | | 2,339,265 | | | | 101,336,960 | |
Wells Fargo & Co. | | | 2,793,971 | | | | 146,851,116 | |
Zions Bancorporation | | | 38,805 | | | | 1,143,583 | |
| | |
| | | | | | $ | 617,894,233 | |
| | |
|
Beverages — 3.0% | |
Coca-Cola Co. (The) | | | 2,794,317 | | | $ | 118,367,268 | |
Coca-Cola Enterprises, Inc. | | | 31,501 | | | | 1,505,118 | |
Molson Coors Brewing Co., Class B | | | 186,000 | | | | 13,793,760 | |
PepsiCo, Inc. | | | 1,831,657 | | | | 163,640,236 | |
| | |
| | | | | | $ | 297,306,382 | |
| | |
|
Biotechnology — 2.0% | |
Alexion Pharmaceuticals, Inc.(2)(3) | | | 15,722 | | | $ | 2,454,843 | |
Alexion Pharmaceuticals, Inc.(3) | | | 34,936 | | | | 5,458,750 | |
Amgen, Inc. | | | 973,633 | | | | 115,248,938 | |
Biogen Idec, Inc.(3) | | | 38,132 | | | | 12,023,401 | |
Celgene Corp.(3) | | | 12,310 | | | | 1,057,183 | |
Gilead Sciences, Inc.(3) | | | 758,484 | | | | 62,885,908 | |
| | |
| | | | | | $ | 199,129,023 | |
| | |
|
Building Products — 0.0%(1) | |
Fortune Brands Home & Security, Inc. | | | 1,600 | | | $ | 63,888 | |
| | |
| | | | | | $ | 63,888 | |
| | |
|
Capital Markets — 4.8% | |
Affiliated Managers Group, Inc.(3) | | | 275 | | | $ | 56,485 | |
Ameriprise Financial, Inc. | | | 189,481 | | | | 22,737,720 | |
Bank of New York Mellon Corp. (The) | | | 602,210 | | | | 22,570,831 | |
BlackRock, Inc. | | | 3,984 | | | | 1,273,286 | |
Charles Schwab Corp. (The) | | | 934,916 | | | | 25,177,288 | |
E*TRADE Financial Corp.(3) | | | 4,593 | | | | 97,647 | |
Franklin Resources, Inc. | | | 1,354,476 | | | | 78,342,892 | |
Goldman Sachs Group, Inc. (The) | | | 532,816 | | | | 89,214,711 | |
Legg Mason, Inc. | | | 96,941 | | | | 4,974,043 | |
LPL Financial Holdings, Inc. | | | 42,465 | | | | 2,112,209 | |
Morgan Stanley | | | 2,520,549 | | | | 81,489,349 | |
Northern Trust Corp. | | | 709,098 | | | | 45,531,183 | |
State Street Corp. | | | 740,415 | | | | 49,800,313 | |
T. Rowe Price Group, Inc. | | | 554,173 | | | | 46,777,743 | |
| | | | |
| | 25 | | See Notes to Financial Statements. |
Tax-Managed Growth Portfolio
June 30, 2014
Portfolio of Investments (Unaudited) — continued
| | | | | | | | |
| Security | | Shares | | | Value | |
| | | | | | | | |
|
Capital Markets (continued) | |
UBS AG(3) | | | 29,488 | | | $ | 540,220 | |
Waddell & Reed Financial, Inc., Class A | | | 8,833 | | | | 552,857 | |
| | |
| | | | | | $ | 471,248,777 | |
| | |
|
Chemicals — 2.2% | |
Air Products and Chemicals, Inc. | | | 7,660 | | | $ | 985,229 | |
Albemarle Corp. | | | 22,063 | | | | 1,577,505 | |
Ashland, Inc. | | | 25,092 | | | | 2,728,504 | |
Dow Chemical Co. (The) | | | 153,238 | | | | 7,885,627 | |
E.I. du Pont de Nemours & Co. | | | 916,651 | | | | 59,985,641 | |
Eastman Chemical Co. | | | 1,500 | | | | 131,025 | |
Ecolab, Inc. | | | 445,515 | | | | 49,603,640 | |
Monsanto Co. | | | 496,136 | | | | 61,888,005 | |
NewMarket Corp. | | | 4,549 | | | | 1,783,708 | |
PPG Industries, Inc. | | | 109,400 | | | | 22,990,410 | |
Praxair, Inc. | | | 3,478 | | | | 462,018 | |
Westlake Chemical Corp. | | | 1,000 | | | | 83,760 | |
| | |
| | | | | | $ | 210,105,072 | |
| | |
|
Commercial Services & Supplies — 0.3% | |
ADT Corp. (The) | | | 10,627 | | | $ | 371,307 | |
Cintas Corp. | | | 52,914 | | | | 3,362,156 | |
Pitney Bowes, Inc. | | | 14,270 | | | | 394,137 | |
Stericycle, Inc.(3) | | | 124,800 | | | | 14,778,816 | |
Tyco International, Ltd. | | | 96,051 | | | | 4,379,926 | |
Waste Management, Inc. | | | 108,226 | | | | 4,840,949 | |
| | |
| | | | | | $ | 28,127,291 | |
| | |
|
Communications Equipment — 2.6% | |
Brocade Communications Systems, Inc. | | | 176,629 | | | $ | 1,624,987 | |
Cisco Systems, Inc. | | | 1,396,595 | | | | 34,705,386 | |
Juniper Networks, Inc.(3) | | | 5,092 | | | | 124,957 | |
Motorola Solutions, Inc. | | | 2,509 | | | | 167,024 | |
Palo Alto Networks, Inc.(3) | | | 20,808 | | | | 1,744,751 | |
QUALCOMM, Inc. | | | 2,745,135 | | | | 217,414,692 | |
| | |
| | | | | | $ | 255,781,797 | |
| | |
|
Construction Materials — 0.0%(1) | |
Vulcan Materials Co. | | | 22,102 | | | $ | 1,409,003 | |
| | |
| | | | | | $ | 1,409,003 | |
| | |
|
Consumer Finance — 1.4% | |
American Express Co. | | | 821,489 | | | $ | 77,934,662 | |
Capital One Financial Corp. | | | 77,228 | | | | 6,379,033 | |
| | | | | | | | |
| Security | | Shares | | | Value | |
| | | | | | | | |
|
Consumer Finance (continued) | |
Discover Financial Services | | | 831,233 | | | $ | 51,519,821 | |
Navient Corp. | | | 10,200 | | | | 180,642 | |
SLM Corp. | | | 10,200 | | | | 84,762 | |
| | |
| | | | | | $ | 136,098,920 | |
| | |
|
Distributors — 0.2% | |
Genuine Parts Co. | | | 188,424 | | | $ | 16,543,627 | |
| | |
| | | | | | $ | 16,543,627 | |
| | |
|
Diversified Consumer Services — 0.0%(1) | |
H&R Block, Inc. | | | 22,181 | | | $ | 743,507 | |
| | |
| | | | | | $ | 743,507 | |
| | |
|
Diversified Financial Services — 2.6% | |
Berkshire Hathaway, Inc., Class A(3) | | | 464 | | | $ | 88,113,832 | |
Berkshire Hathaway, Inc., Class B(3) | | | 946,310 | | | | 119,764,993 | |
CBOE Holdings, Inc. | | | 140,951 | | | | 6,936,199 | |
CME Group, Inc. | | | 144,447 | | | | 10,248,515 | |
ING Groep NV ADR(3) | | | 131,385 | | | | 1,842,018 | |
IntercontinentalExchange Group, Inc. | | | 14,292 | | | | 2,699,759 | |
McGraw Hill Financial, Inc. | | | 86,290 | | | | 7,164,659 | |
Moody’s Corp. | | | 179,322 | | | | 15,719,366 | |
| | |
| | | | | | $ | 252,489,341 | |
| | |
|
Diversified Telecommunication Services — 0.3% | |
AT&T, Inc. | | | 189,064 | | | $ | 6,685,303 | |
CenturyLink, Inc. | | | 4,871 | | | | 176,330 | |
Deutsche Telekom AG ADR | | | 50,092 | | | | 877,612 | |
Frontier Communications Corp. | | | 32,628 | | | | 190,548 | |
Verizon Communications, Inc. | | | 416,626 | | | | 20,385,510 | |
Windstream Holdings, Inc. | | | 70,866 | | | | 705,825 | |
| | |
| | | | | | $ | 29,021,128 | |
| | |
|
Electric Utilities — 0.1% | |
Duke Energy Corp. | | | 47,098 | | | $ | 3,494,201 | |
Exelon Corp. | | | 6,820 | | | | 248,794 | |
NextEra Energy, Inc. | | | 63,830 | | | | 6,541,298 | |
Southern Co. (The) | | | 70,667 | | | | 3,206,868 | |
| | |
| | | | | | $ | 13,491,161 | |
| | |
|
Electrical Equipment — 1.5% | |
AMETEK, Inc. | | | 9,387 | | | $ | 490,753 | |
Eaton Corp. PLC | | | 19,484 | | | | 1,503,775 | |
Emerson Electric Co. | | | 1,998,542 | | | | 132,623,247 | |
| | | | |
| | 26 | | See Notes to Financial Statements. |
Tax-Managed Growth Portfolio
June 30, 2014
Portfolio of Investments (Unaudited) — continued
| | | | | | | | |
| Security | | Shares | | | Value | |
| | | | | | | | |
|
Electrical Equipment (continued) | |
Rockwell Automation, Inc. | | | 121,000 | | | $ | 15,144,360 | |
| | |
| | | | | | $ | 149,762,135 | |
| | |
|
Electronic Equipment, Instruments & Components — 0.4% | |
Corning, Inc. | | | 1,433,091 | | | $ | 31,456,347 | |
Knowles Corp.(3) | | | 174,670 | | | | 5,369,356 | |
TE Connectivity, Ltd. | | | 687 | | | | 42,484 | |
| | |
| | | | | | $ | 36,868,187 | |
| | |
|
Energy Equipment & Services — 2.2% | |
Baker Hughes, Inc. | | | 93,118 | | | $ | 6,932,635 | |
Frank’s International NV | | | 115,894 | | | | 2,850,992 | |
Halliburton Co. | | | 846,351 | | | | 60,099,385 | |
Schlumberger, Ltd. | | | 1,207,034 | | | | 142,369,660 | |
Transocean, Ltd. | | | 72,599 | | | | 3,269,133 | |
| | |
| | | | | | $ | 215,521,805 | |
| | |
|
Food & Staples Retailing — 3.4% | |
Costco Wholesale Corp. | | | 873,262 | | | $ | 100,564,852 | |
CVS Caremark Corp. | | | 1,279,410 | | | | 96,429,132 | |
Kroger Co. (The) | | | 35,843 | | | | 1,771,719 | |
Sysco Corp. | | | 324,289 | | | | 12,144,623 | |
Wal-Mart Stores, Inc. | | | 1,300,464 | | | | 97,625,832 | |
Walgreen Co. | | | 280,773 | | | | 20,813,703 | |
| | |
| | | | | | $ | 329,349,861 | |
| | |
|
Food Products — 1.8% | |
Archer-Daniels-Midland Co. | | | 180,036 | | | $ | 7,941,388 | |
Campbell Soup Co. | | | 7,981 | | | | 365,610 | |
ConAgra Foods, Inc. | | | 65,155 | | | | 1,933,800 | |
Flowers Foods, Inc. | | | 47,169 | | | | 994,323 | |
General Mills, Inc. | | | 36,652 | | | | 1,925,696 | |
Hain Celestial Group, Inc. (The)(3) | | | 658 | | | | 58,391 | |
Hershey Co. (The) | | | 456,522 | | | | 44,451,547 | |
Kellogg Co. | | | 50,325 | | | | 3,306,353 | |
Keurig Green Mountain, Inc. | | | 75,000 | | | | 9,345,750 | |
Kraft Foods Group, Inc. | | | 58,616 | | | | 3,514,029 | |
McCormick & Co., Inc. | | | 27,354 | | | | 1,958,273 | |
Mondelez International, Inc., Class A | | | 181,525 | | | | 6,827,155 | |
Nestle SA | | | 1,247,127 | | | | 96,636,012 | |
Unilever NV - NY Shares | | | 4,636 | | | | 202,871 | |
| | |
| | | | | | $ | 179,461,198 | |
| | |
| | | | | | | | |
| Security | | Shares | | | Value | |
| | | | | | | | |
|
Health Care Equipment & Supplies — 1.9% | |
Abbott Laboratories | | | 1,554,415 | | | $ | 63,575,574 | |
Bard (C.R.), Inc. | | | 25,000 | | | | 3,575,250 | |
Baxter International, Inc. | | | 222,708 | | | | 16,101,789 | |
Becton, Dickinson and Co. | | | 66,108 | | | | 7,820,576 | |
Boston Scientific Corp.(3) | | | 26,929 | | | | 343,883 | |
CareFusion Corp.(3) | | | 70,668 | | | | 3,134,126 | |
Covidien PLC | | | 184,996 | | | | 16,682,939 | |
Intuitive Surgical, Inc.(3) | | | 14,000 | | | | 5,765,200 | |
Medtronic, Inc. | | | 448,567 | | | | 28,600,632 | |
St. Jude Medical, Inc. | | | 135,348 | | | | 9,372,849 | |
Stryker Corp. | | | 189,350 | | | | 15,965,992 | |
Zimmer Holdings, Inc. | | | 133,186 | | | | 13,832,698 | |
| | |
| | | | | | $ | 184,771,508 | |
| | |
|
Health Care Providers & Services — 0.8% | |
AmerisourceBergen Corp. | | | 266,694 | | | $ | 19,377,986 | |
Cardinal Health, Inc. | | | 141,336 | | | | 9,689,996 | |
Cigna Corp. | | | 54,424 | | | | 5,005,375 | |
Express Scripts Holding Co.(3) | | | 367,509 | | | | 25,479,399 | |
HCA Holdings, Inc.(3) | | | 145,114 | | | | 8,181,527 | |
Henry Schein, Inc.(3) | | | 845 | | | | 100,276 | |
McKesson Corp. | | | 2,384 | | | | 443,925 | |
PharMerica Corp.(3) | | | 1,805 | | | | 51,605 | |
UnitedHealth Group, Inc. | | | 63,009 | | | | 5,150,986 | |
WellPoint, Inc. | | | 54,347 | | | | 5,848,281 | |
| | |
| | | | | | $ | 79,329,356 | |
| | |
|
Hotels, Restaurants & Leisure — 2.9% | |
Carnival Corp. | | | 144,193 | | | $ | 5,428,867 | |
International Game Technology | | | 459,500 | | | | 7,310,645 | |
Interval Leisure Group, Inc. | | | 5,349 | | | | 117,357 | |
Marriott International, Inc., Class A | | | 493,863 | | | | 31,656,618 | |
Marriott Vacations Worldwide Corp.(3) | | | 2,597 | | | | 152,262 | |
McDonald’s Corp. | | | 743,137 | | | | 74,863,621 | |
Starbucks Corp. | | | 1,929,949 | | | | 149,339,454 | |
Yum! Brands, Inc. | | | 210,518 | | | | 17,094,062 | |
| | |
| | | | | | $ | 285,962,886 | |
| | |
|
Household Durables — 0.1% | |
D.R. Horton, Inc. | | | 417,028 | | | $ | 10,250,548 | |
| | |
| | | | | | $ | 10,250,548 | |
| | |
|
Household Products — 1.6% | |
Clorox Co. (The) | | | 7,570 | | | $ | 691,898 | |
Colgate-Palmolive Co. | | | 1,173,917 | | | | 80,037,661 | |
| | | | |
| | 27 | | See Notes to Financial Statements. |
Tax-Managed Growth Portfolio
June 30, 2014
Portfolio of Investments (Unaudited) — continued
| | | | | | | | |
| Security | | Shares | | | Value | |
| | | | | | | | |
|
Household Products (continued) | |
Kimberly-Clark Corp. | | | 19,648 | | | $ | 2,185,251 | |
Procter & Gamble Co. (The) | | | 902,294 | | | | 70,911,285 | |
| | |
| | | | | | $ | 153,826,095 | |
| | |
|
Independent Power and Renewable Electricity Producers — 0.0%(1) | |
AES Corp. (The) | | | 1,730 | | | $ | 26,902 | |
| | |
| | | | | | $ | 26,902 | |
| | |
|
Industrial Conglomerates — 2.6% | |
3M Co. | | | 797,109 | | | $ | 114,177,893 | |
Danaher Corp. | | | 43,555 | | | | 3,429,085 | |
General Electric Co. | | | 5,008,022 | | | | 131,610,818 | |
| | |
| | | | | | $ | 249,217,796 | |
| | |
|
Insurance — 1.1% | |
Aegon NV ADR | | | 5,088,862 | | | $ | 44,629,320 | |
Aflac, Inc. | | | 193,292 | | | | 12,032,427 | |
Allstate Corp. (The) | | | 583 | | | | 34,234 | |
Aon PLC | | | 24,650 | | | | 2,220,719 | |
Chubb Corp. | | | 25,044 | | | | 2,308,305 | |
Cincinnati Financial Corp. | | | 135,528 | | | | 6,510,765 | |
Hartford Financial Services Group, Inc. | | | 5,762 | | | | 206,337 | |
Manulife Financial Corp. | | | 29,582 | | | | 587,794 | |
Marsh & McLennan Cos., Inc. | | | 25,000 | | | | 1,295,500 | |
Progressive Corp. | | | 1,151,311 | | | | 29,197,247 | |
Torchmark Corp. | | | 52,429 | | | | 4,294,984 | |
Travelers Companies, Inc. (The) | | | 76,125 | | | | 7,161,079 | |
| | |
| | | | | | $ | 110,478,711 | |
| | |
|
Internet & Catalog Retail — 0.8% | |
Amazon.com, Inc.(3) | | | 237,482 | | | $ | 77,129,404 | |
Expedia, Inc. | | | 2,575 | | | | 202,807 | |
Priceline Group, Inc. (The)(3) | | | 50 | | | | 60,150 | |
| | |
| | | | | | $ | 77,392,361 | |
| | |
|
Internet Software & Services — 5.0% | |
Akamai Technologies, Inc.(3) | | | 200,000 | | | $ | 12,212,000 | |
AOL, Inc.(3) | | | 5,317 | | | | 211,563 | |
eBay, Inc.(3) | | | 1,264,958 | | | | 63,323,798 | |
Facebook, Inc., Class A(3) | | | 1,932,978 | | | | 130,070,090 | |
Google, Inc., Class A(3) | | | 218,015 | | | | 127,466,830 | |
Google, Inc., Class C(3) | | | 217,579 | | | | 125,168,847 | |
IAC/InterActiveCorp | | | 14,528 | | | | 1,005,774 | |
LinkedIn Corp., Class A(3) | | | 4,537 | | | | 777,959 | |
| | | | | | | | |
| Security | | Shares | | | Value | |
| | | | | | | | |
|
Internet Software & Services (continued) | |
Twitter, Inc.(3) | | | 678,722 | | | $ | 27,807,240 | |
VeriSign, Inc.(3) | | | 14,758 | | | | 720,338 | |
Yahoo! Inc.(3) | | | 105,430 | | | | 3,703,756 | |
| | |
| | | | | | $ | 492,468,195 | |
| | |
|
IT Services — 2.0% | |
Accenture PLC, Class A | | | 1,347,075 | | | $ | 108,897,543 | |
Automatic Data Processing, Inc. | | | 102,170 | | | | 8,100,038 | |
Broadridge Financial Solutions, Inc. | | | 1,652 | | | | 68,789 | |
Cognizant Technology Solutions Corp.,
Class A(3) | | | 3,510 | | | | 171,674 | |
Fidelity National Information Services, Inc. | | | 63,590 | | | | 3,480,917 | |
Fiserv, Inc.(3) | | | 34,767 | | | | 2,097,145 | |
International Business Machines Corp. | | | 242,829 | | | | 44,017,613 | |
Paychex, Inc. | | | 693,512 | | | | 28,822,359 | |
Total System Services, Inc. | | | 32,405 | | | | 1,017,841 | |
Visa, Inc., Class A | | | 766 | | | | 161,404 | |
Western Union Co. | | | 60,362 | | | | 1,046,677 | |
| | |
| | | | | | $ | 197,882,000 | |
| | |
|
Leisure Products — 0.0%(1) | |
Mattel, Inc. | | | 26,506 | | | $ | 1,032,939 | |
Polaris Industries, Inc. | | | 1,400 | | | | 182,336 | |
| | |
| | | | | | $ | 1,215,275 | |
| | |
|
Life Sciences Tools & Services — 0.3% | |
Agilent Technologies, Inc. | | | 481,172 | | | $ | 27,638,520 | |
Thermo Fisher Scientific, Inc. | | | 18,700 | | | | 2,206,600 | |
| | |
| | | | | | $ | 29,845,120 | |
| | |
|
Machinery — 2.6% | |
Caterpillar, Inc. | | | 137,440 | | | $ | 14,935,605 | |
Deere & Co. | | | 1,200,245 | | | | 108,682,185 | |
Donaldson Co., Inc. | | | 23,332 | | | | 987,410 | |
Dover Corp. | | | 349,338 | | | | 31,772,291 | |
Illinois Tool Works, Inc. | | | 1,034,459 | | | | 90,577,230 | |
PACCAR, Inc. | | | 125,452 | | | | 7,882,149 | |
Parker Hannifin Corp. | | | 8,381 | | | | 1,053,743 | |
Pentair, Ltd. | | | 5,089 | | | | 367,019 | |
Snap-On, Inc. | | | 8,911 | | | | 1,056,132 | |
WABCO Holdings, Inc.(3) | | | 1,156 | | | | 123,484 | |
Wabtec Corp. | | | 12,082 | | | | 997,852 | |
| | |
| | | | | | $ | 258,435,100 | |
| | |
| | | | |
| | 28 | | See Notes to Financial Statements. |
Tax-Managed Growth Portfolio
June 30, 2014
Portfolio of Investments (Unaudited) — continued
| | | | | | | | |
| Security | | Shares | | | Value | |
| | | | | | | | |
|
Media — 3.7% | |
CBS Corp., Class B | | | 129,378 | | | $ | 8,039,549 | |
Comcast Corp., Class A | | | 195,330 | | | | 10,485,314 | |
Comcast Corp., Special Class A | | | 1,434,304 | | | | 76,491,432 | |
DIRECTV(3) | | | 33,786 | | | | 2,872,148 | |
Discovery Communications, Inc., Class A(3) | | | 6,930 | | | | 514,760 | |
Discovery Communications, Inc., Class C(3) | | | 6,732 | | | | 488,676 | |
Gannett Co., Inc. | | | 3,563 | | | | 111,557 | |
Liberty Global PLC, Series A(3) | | | 8,854 | | | | 391,524 | |
Liberty Global PLC, Series C(3) | | | 27,614 | | | | 1,168,348 | |
Liberty Media Corp., Class A(3) | | | 12,367 | | | | 1,690,322 | |
News Corp., Class A(3) | | | 24 | | | | 431 | |
Omnicom Group, Inc. | | | 112,077 | | | | 7,982,124 | |
Time Warner Cable, Inc. | | | 12,203 | | | | 1,797,502 | |
Time Warner, Inc. | | | 363,259 | | | | 25,518,945 | |
Time, Inc.(3) | | | 45,407 | | | | 1,099,758 | |
Twenty-First Century Fox, Inc., Class A | | | 97 | | | | 3,410 | |
Viacom, Inc., Class B | | | 133,554 | | | | 11,583,138 | |
Walt Disney Co. (The) | | | 2,428,991 | | | | 208,261,688 | |
| | |
| | | | | | $ | 358,500,626 | |
| | |
|
Metals & Mining — 0.4% | |
Alcoa, Inc. | | | 52,760 | | | $ | 785,596 | |
Cliffs Natural Resources, Inc. | | | 124,811 | | | | 1,878,406 | |
Freeport-McMoRan Copper & Gold, Inc. | | | 450,138 | | | | 16,430,037 | |
Glencore PLC | | | 598,405 | | | | 3,334,740 | |
Nucor Corp. | | | 230,000 | | | | 11,327,500 | |
| | |
| | | | | | $ | 33,756,279 | |
| | |
|
Multi-Utilities — 0.0%(1) | |
Dominion Resources, Inc. | | | 3,244 | | | $ | 232,011 | |
Sempra Energy | | | 1,443 | | | | 151,096 | |
| | |
| | | | | | $ | 383,107 | |
| | |
|
Multiline Retail — 0.1% | |
Target Corp. | | | 158,384 | | | $ | 9,178,353 | |
| | |
| | | | | | $ | 9,178,353 | |
| | |
|
Oil, Gas & Consumable Fuels — 6.5% | |
Anadarko Petroleum Corp. | | | 923,255 | | | $ | 101,068,725 | |
Antero Resources Corp.(3) | | | 109,563 | | | | 7,190,620 | |
Apache Corp. | | | 806,823 | | | | 81,182,530 | |
BP PLC ADR | | | 171,522 | | | | 9,047,786 | |
Cheniere Energy, Inc.(3) | | | 76,775 | | | | 5,504,767 | |
Cheniere Energy, Inc.(2)(3) | | | 240,000 | | | | 17,208,000 | |
Chevron Corp. | | | 590,981 | | | | 77,152,570 | |
| | | | | | | | |
| Security | | Shares | | | Value | |
| | | | | | | | |
|
Oil, Gas & Consumable Fuels (continued) | |
ConocoPhillips | | | 264,546 | | | $ | 22,679,529 | |
Devon Energy Corp. | | | 570,333 | | | | 45,284,440 | |
EOG Resources, Inc. | | | 3,600 | | | | 420,696 | |
Exxon Mobil Corp. | | | 2,242,197 | | | | 225,744,394 | |
Hess Corp. | | | 39,579 | | | | 3,913,967 | |
Marathon Oil Corp. | | | 185,039 | | | | 7,386,757 | |
Marathon Petroleum Corp. | | | 87,519 | | | | 6,832,608 | |
Murphy Oil Corp. | | | 80,200 | | | | 5,331,696 | |
Occidental Petroleum Corp. | | | 5,000 | | | | 513,150 | |
Phillips 66 | | | 141,053 | | | | 11,344,893 | |
Range Resources Corp. | | | 4,900 | | | | 426,055 | |
Royal Dutch Shell PLC ADR, Class A | | | 70,332 | | | | 5,793,247 | |
Spectra Energy Corp. | | | 8,040 | | | | 341,539 | |
Williams Cos., Inc. | | | 2,000 | | | | 116,420 | |
WPX Energy, Inc.(3) | | | 666 | | | | 15,924 | |
| | |
| | | | | | $ | 634,500,313 | |
| | |
|
Personal Products — 0.0%(1) | |
Estee Lauder Cos., Inc. (The), Class A | | | 26,070 | | | $ | 1,935,958 | |
| | |
| | | | | | $ | 1,935,958 | |
| | |
|
Pharmaceuticals — 8.0% | |
AbbVie, Inc. | | | 1,603,383 | | | $ | 90,494,936 | |
Actavis PLC(3) | | | 20,000 | | | | 4,461,000 | |
Allergan, Inc. | | | 403,794 | | | | 68,330,021 | |
Bristol-Myers Squibb Co. | | | 1,694,417 | | | | 82,196,169 | |
Eli Lilly & Co. | | | 1,081,769 | | | | 67,253,579 | |
GlaxoSmithKline PLC ADR | | | 178,318 | | | | 9,536,447 | |
Johnson & Johnson | | | 1,677,191 | | | | 175,467,722 | |
Mallinckrodt PLC(3) | | | 23,268 | | | | 1,861,905 | |
Merck & Co., Inc. | | | 1,166,617 | | | | 67,488,793 | |
Novo Nordisk A/S ADR | | | 1,249,240 | | | | 57,702,396 | |
Pfizer, Inc. | | | 2,104,147 | | | | 62,451,083 | |
Teva Pharmaceutical Industries, Ltd. ADR | | | 1,671,886 | | | | 87,640,264 | |
Zoetis, Inc. | | | 361,174 | | | | 11,655,085 | |
| | |
| | | | | | $ | 786,539,400 | |
| | |
|
Real Estate Investment Trusts (REITs) — 0.0%(1) | |
Weyerhaeuser Co. | | | 1,200 | | | $ | 39,708 | |
| | |
| | | | | | $ | 39,708 | |
| | |
|
Road & Rail — 0.4% | |
CSX Corp. | | | 17,590 | | | $ | 541,948 | |
Kansas City Southern | | | 5,386 | | | | 579,049 | |
Norfolk Southern Corp. | | | 55,971 | | | | 5,766,692 | |
| | | | |
| | 29 | | See Notes to Financial Statements. |
Tax-Managed Growth Portfolio
June 30, 2014
Portfolio of Investments (Unaudited) — continued
| | | | | | | | |
| Security | | Shares | | | Value | |
| | | | | | | | |
|
Road & Rail (continued) | |
Union Pacific Corp. | | | 275,076 | | | $ | 27,438,831 | |
| | |
| | | | | | $ | 34,326,520 | |
| | |
|
Semiconductors & Semiconductor Equipment — 4.4% | |
Analog Devices, Inc. | | | 599,209 | | | $ | 32,399,231 | |
Applied Materials, Inc. | | | 1,165,614 | | | | 26,284,596 | |
Broadcom Corp., Class A | | | 900,110 | | | | 33,412,083 | |
Cypress Semiconductor Corp.(3) | | | 1,108 | | | | 12,088 | |
Intel Corp. | | | 8,511,690 | | | | 263,011,221 | |
Linear Technology Corp. | | | 18,494 | | | | 870,512 | |
Linear Technology Corp.(2) | | | 50,000 | | | | 2,353,500 | |
Maxim Integrated Products, Inc. | | | 223,099 | | | | 7,542,977 | |
Microchip Technology, Inc. | | | 23,733 | | | | 1,158,408 | |
NVIDIA Corp. | | | 284,500 | | | | 5,274,630 | |
Texas Instruments, Inc. | | | 1,013,297 | | | | 48,425,464 | |
Xilinx, Inc. | | | 90,186 | | | | 4,266,700 | |
| | |
| | | | | | $ | 425,011,410 | |
| | |
|
Software — 3.6% | |
Activision Blizzard, Inc. | | | 254,916 | | | $ | 5,684,627 | |
Adobe Systems, Inc.(3) | | | 409,776 | | | | 29,651,391 | |
CA, Inc. | | | 7,339 | | | | 210,923 | |
Microsoft Corp. | | | 3,106,888 | | | | 129,557,230 | |
Oracle Corp. | | | 4,361,397 | | | | 176,767,420 | |
ServiceNow, Inc.(3) | | | 182,216 | | | | 11,290,103 | |
Symantec Corp. | | | 72,900 | | | | 1,669,410 | |
| | |
| | | | | | $ | 354,831,104 | |
| | |
|
Specialty Retail — 2.6% | |
Best Buy Co., Inc. | | | 133,011 | | | $ | 4,124,671 | |
Gap, Inc. (The) | | | 89,138 | | | | 3,705,467 | |
GNC Holdings, Inc., Class A | | | 900 | | | | 30,690 | |
Home Depot, Inc. (The) | | | 1,177,530 | | | | 95,332,829 | |
L Brands, Inc. | | | 41,877 | | | | 2,456,505 | |
Lowe’s Companies, Inc. | | | 247,507 | | | | 11,877,861 | |
Murphy USA, Inc.(3) | | | 19,669 | | | | 961,617 | |
Ross Stores, Inc. | | | 1,000 | | | | 66,130 | |
Ross Stores, Inc.(2) | | | 15,500 | | | | 1,025,015 | |
Staples, Inc. | | | 144,626 | | | | 1,567,746 | |
TJX Cos., Inc. (The) | | | 2,440,256 | | | | 129,699,606 | |
| | |
| | | | | | $ | 250,848,137 | |
| | |
|
Technology Hardware, Storage & Peripherals — 3.7% | |
Apple, Inc. | | | 2,909,230 | | | $ | 270,354,744 | |
EMC Corp. | | | 2,797,592 | | | | 73,688,573 | |
| | | | | | | | |
| Security | | Shares | | | Value | |
| | | | | | | | |
|
Technology Hardware, Storage & Peripherals (continued) | |
Hewlett-Packard Co. | | | 31,877 | | | $ | 1,073,617 | |
NetApp, Inc. | | | 414,967 | | | | 15,154,595 | |
Nokia Oyj ADR | | | 192 | | | | 1,452 | |
| | |
| | | | | | $ | 360,272,981 | |
| | |
|
Textiles, Apparel & Luxury Goods — 2.1% | |
Coach, Inc. | | | 10,800 | | | $ | 369,252 | |
Hanesbrands, Inc. | | | 197,676 | | | | 19,459,225 | |
NIKE, Inc., Class B | | | 2,323,098 | | | | 180,156,250 | |
VF Corp. | | | 67,200 | | | | 4,233,600 | |
| | |
| | | | | | $ | 204,218,327 | |
| | |
|
Tobacco — 0.3% | |
Altria Group, Inc. | | | 111,248 | | | $ | 4,665,741 | |
Philip Morris International, Inc. | | | 308,200 | | | | 25,984,342 | |
| | |
| | | | | | $ | 30,650,083 | |
| | |
|
Trading Companies & Distributors — 0.0%(1) | |
United Rentals, Inc.(3) | | | 2,000 | | | $ | 209,460 | |
| | |
| | | | | | $ | 209,460 | |
| | |
|
Wireless Telecommunication Services — 0.1% | |
America Movil SAB de CV ADR, Series L | | | 136,795 | | | $ | 2,838,496 | |
Sprint Nextel Corp.(3) | | | 135,160 | | | | 1,152,915 | |
Vodafone Group PLC ADR | | | 97,896 | | | | 3,268,747 | |
| | |
| | | | | | $ | 7,260,158 | |
| | |
| |
Total Common Stocks
(identified cost $4,964,372,717) | | | $ | 9,639,622,852 | |
| | |
| | |
| Preferred Stocks — 0.0%(1) | | | | | | | | |
| | |
| | | | | | | | |
| Security | | Shares | | | Value | |
|
Banks — 0.0%(1) | |
Wells Fargo & Co.(4) | | | 166 | | | $ | 0 | |
| | | | | | | | | |
| |
Total Preferred Stocks
(identified cost $4,929) | | | $ | 0 | |
| | |
| | | | |
| | 30 | | See Notes to Financial Statements. |
Tax-Managed Growth Portfolio
June 30, 2014
Portfolio of Investments (Unaudited) — continued
| | | | | | | | |
| Rights — 0.0%(1) | | | | | | | | |
| | |
| | | | | | | | |
| Security | | Shares | | | Value | |
|
Pharmaceuticals — 0.0%(1) | |
Sanofi, Exp. 12/31/20(3) | | | 6,984 | | | $ | 3,492 | |
| | | | | | | | | |
| |
Total Rights
(identified cost $16,440) | | | $ | 3,492 | |
| | |
|
| Short-Term Investments — 1.3% | |
| | |
| | | | | | | | |
| Description | | Interest
(000’s omitted) | | | Value | |
| | | | | | | | |
Eaton Vance Cash Reserves Fund, LLC, 0.12%(5) | | $ | 128,339 | | | $ | 128,338,859 | |
| | |
| |
Total Short-Term Investments
(identified cost $128,338,859) | �� | | $ | 128,338,859 | |
| | |
| |
Total Investments — 99.9%
(identified cost $5,092,732,945) | | | $ | 9,767,965,203 | |
| | |
| |
Other Assets, Less Liabilities — 0.1% | | | $ | 9,551,780 | |
| | |
| |
Net Assets — 100.0% | | | $ | 9,777,516,983 | |
| | |
The percentage shown for each investment category in the Portfolio of Investments is based on net assets.
| | | | |
| ADR | | – | | American Depositary Receipt |
| (1) | Amount is less than 0.05%. |
| (2) | Restricted security (see Note 5). |
| (3) | Non-income producing security. |
| (4) | For fair value measurement disclosure purposes, security is categorized as Level 3 (see Note 7). |
| (5) | Affiliated investment company, available to Eaton Vance portfolios and funds, which invests in high quality, U.S. dollar denominated money market instruments. The rate shown is the annualized seven-day yield as of June 30, 2014. |
| | | | |
| | 31 | | See Notes to Financial Statements. |
Tax-Managed Growth Portfolio
June 30, 2014
Statement of Assets and Liabilities (Unaudited)
| | | | |
| Assets | | June 30, 2014 | |
Unaffiliated investments, at value (identified cost, $4,964,394,086) | | $ | 9,639,626,344 | |
Affiliated investment, at value (identified cost, $128,338,859) | | | 128,338,859 | |
Dividends receivable | | | 8,802,432 | |
Interest receivable from affiliated investment | | | 12,686 | |
Receivable for investments sold | | | 2,863,317 | |
Tax reclaims receivable | | | 1,910,395 | |
Total assets | | $ | 9,781,554,033 | |
|
| Liabilities | |
Payable to affiliates: | | | | |
Investment adviser fee | | $ | 3,629,694 | |
Trustees’ fees | | | 17,000 | |
Accrued expenses | | | 390,356 | |
Total liabilities | | $ | 4,037,050 | |
Net Assets applicable to investors’ interest in Portfolio | | $ | 9,777,516,983 | |
|
| Sources of Net Assets | |
Investors’ capital | | $ | 5,102,170,711 | |
Net unrealized appreciation | | | 4,675,346,272 | |
Total | | $ | 9,777,516,983 | |
| | | | |
| | 32 | | See Notes to Financial Statements. |
Tax-Managed Growth Portfolio
June 30, 2014
Statement of Operations (Unaudited)
| | | | |
| Investment Income | | Six Months Ended June 30, 2014 | |
Dividends (net of foreign taxes, $1,543,933) | | $ | 93,546,271 | |
Interest allocated from affiliated investment | | | 88,889 | |
Expenses allocated from affiliated investment | | | (12,000 | ) |
Total investment income | | $ | 93,623,160 | |
|
| Expenses | |
Investment adviser fee | | $ | 21,195,378 | |
Trustees’ fees and expenses | | | 34,000 | |
Custodian fee | | | 703,600 | |
Professional fees | | | 129,543 | |
Miscellaneous | | | 140,473 | |
Total expenses | | $ | 22,202,994 | |
Deduct — | | | | |
Reduction of custodian fee | | $ | 11 | |
Total expense reductions | | $ | 11 | |
| |
Net expenses | | $ | 22,202,983 | |
| |
Net investment income | | $ | 71,420,177 | |
|
| Realized and Unrealized Gain (Loss) | |
Net realized gain (loss) — | | | | |
Investment transactions(1) | | $ | 250,164,741 | |
Investment transactions allocated from affiliated investment | | | 980 | |
Foreign currency transactions | | | 1,233 | |
Net realized gain | | $ | 250,166,954 | |
Change in unrealized appreciation (depreciation) — | | | | |
Investments | | $ | 235,922,462 | |
Foreign currency | | | 1,042 | |
Net change in unrealized appreciation (depreciation) | | $ | 235,923,504 | |
| |
Net realized and unrealized gain | | $ | 486,090,458 | |
| |
Net increase in net assets from operations | | $ | 557,510,635 | |
| (1) | Includes $250,025,586 of net realized gains from redemptions in-kind. |
| | | | |
| | 33 | | See Notes to Financial Statements. |
Tax-Managed Growth Portfolio
June 30, 2014
Statements of Changes in Net Assets
| | | | | | | | |
| Increase (Decrease) in Net Assets | | Six Months Ended June 30, 2014 (Unaudited) | | | Year Ended December 31, 2013 | |
From operations — | | | | | | | | |
Net investment income | | $ | 71,420,177 | | | $ | 128,257,697 | |
Net realized gain from investment and foreign currency transactions | | | 250,166,954 | | | | 431,928,006 | |
Net change in unrealized appreciation (depreciation) from investments and foreign currency | | | 235,923,504 | | | | 1,830,554,440 | |
Net increase in net assets from operations | | $ | 557,510,635 | | | $ | 2,390,740,143 | |
Capital transactions — | | | | | | | | |
Contributions | | $ | 275,345,970 | | | $ | 242,635,350 | |
Withdrawals | | | (470,293,955 | ) | | | (947,511,937 | ) |
Net decrease in net assets from capital transactions | | $ | (194,947,985 | ) | | $ | (704,876,587 | ) |
| | |
Net increase in net assets | | $ | 362,562,650 | | | $ | 1,685,863,556 | |
|
| Net Assets | |
At beginning of period | | $ | 9,414,954,333 | | | $ | 7,729,090,777 | |
At end of period | | $ | 9,777,516,983 | | | $ | 9,414,954,333 | |
| | | | |
| | 34 | | See Notes to Financial Statements. |
Tax-Managed Growth Portfolio
June 30, 2014
Supplementary Data
| | | | | | | | | | | | | | | | | | | | | | | | |
| | | Six Months Ended
June 30, 2014
(Unaudited) | | | Year Ended December 31, | |
| Ratios/Supplemental Data | | | 2013 | | | 2012 | | | 2011 | | | 2010 | | | 2009 | |
Ratios (as a percentage of average daily net assets): | | | | | | | | | | | | | | | | | | | | | | | | |
Expenses(1) | | | 0.48 | %(2) | | | 0.48 | % | | | 0.48 | % | | | 0.48 | % | | | 0.48 | % | | | 0.47 | % |
Net investment income | | | 1.54 | %(2) | | | 1.50 | % | | | 1.78 | % | | | 1.53 | % | | | 1.43 | % | | | 1.86 | % |
Portfolio Turnover | | | 3 | %(3) | | | 3 | % | | | 2 | % | | | 2 | % | | | 2 | % | | | 3 | % |
| | | | | | |
Total Return | | | 6.10 | %(3) | | | 32.39 | % | | | 15.48 | % | | | 0.80 | % | | | 12.86 | % | | | 23.32 | % |
| | | | | | |
Net assets, end of period (000’s omitted) | | $ | 9,777,517 | | | $ | 9,414,954 | | | $ | 7,729,091 | | | $ | 8,072,683 | | | $ | 9,045,217 | | | $ | 9,479,479 | |
| (1) | Excludes the effect of custody fee credits, if any, of less than 0.005%. |
| | | | |
| | 35 | | See Notes to Financial Statements. |
Tax-Managed Growth Portfolio
June 30, 2014
Notes to Financial Statements (Unaudited)
1 Significant Accounting Policies
Tax-Managed Growth Portfolio (the Portfolio) is a Massachusetts business trust registered under the Investment Company Act of 1940, as amended (the 1940 Act), as a diversified, open-end management investment company. The Portfolio’s investment objective is to achieve long-term, after-tax returns for interestholders through investing in a diversified portfolio of equity securities. The Declaration of Trust permits the Trustees to issue interests in the Portfolio. At June 30, 2014, Eaton Vance Tax-Managed Growth Fund 1.0, Eaton Vance Tax-Managed Growth Fund 1.1, Eaton Vance Tax-Managed Growth Fund 1.2 and Eaton Vance Tax-Managed Equity Asset Allocation held an interest of 8.2%, 14.3%, 5.9%, and 1.3% respectively, in the Portfolio. In addition, an unregistered fund managed by the adviser to the Portfolio held an interest of 70.3% in the Portfolio.
The following is a summary of significant accounting policies of the Portfolio. The policies are in conformity with accounting principles generally accepted in the United States of America.
A Investment Valuation — The following methodologies are used to determine the market value or fair value of investments.
Equity Securities. Equity securities (including common shares of closed-end investment companies) listed on a U.S. securities exchange generally are valued at the last sale or closing price on the day of valuation or, if no sales took place on such date, at the mean between the closing bid and asked prices therefore on the exchange where such securities are principally traded. Equity securities listed on the NASDAQ Global or Global Select Market generally are valued at the NASDAQ official closing price. Unlisted or listed securities for which closing sales prices or closing quotations are not available are valued at the mean between the latest available bid and asked prices or, in the case of preferred equity securities that are not listed or traded in the over-the-counter market, by a third party pricing service that will use various techniques that consider factors including, but not limited to, prices or yields of securities with similar characteristics, benchmark yields, broker/dealer quotes, quotes of underlying common stock, issuer spreads, as well as industry and economic events.
Foreign Securities and Currencies. Foreign securities and currencies are valued in U.S. dollars, based on foreign currency exchange rate quotations supplied by a third party pricing service. The pricing service uses a proprietary model to determine the exchange rate. Inputs to the model include reported trades and implied bid/ask spreads. The daily valuation of exchange-traded foreign securities generally is determined as of the close of trading on the principal exchange on which such securities trade. Events occurring after the close of trading on foreign exchanges may result in adjustments to the valuation of foreign securities to more accurately reflect their fair value as of the close of regular trading on the New York Stock Exchange. When valuing foreign equity securities that meet certain criteria, the Portfolio’s Trustees have approved the use of a fair value service that values such securities to reflect market trading that occurs after the close of the applicable foreign markets of comparable securities or other instruments that have a strong correlation to the fair-valued securities.
Affiliated Fund. The Portfolio may invest in Eaton Vance Cash Reserves Fund, LLC (Cash Reserves Fund), an affiliated investment company managed by Eaton Vance Management (EVM). The value of the Portfolio’s investment in Cash Reserves Fund reflects the Portfolio’s proportionate interest in its net assets. Cash Reserves Fund generally values its investment securities utilizing the amortized cost valuation technique in accordance with Rule 2a-7 under the 1940 Act. This technique involves initially valuing a portfolio security at its cost and thereafter assuming a constant amortization to maturity of any discount or premium. If amortized cost is determined not to approximate fair value, Cash Reserves Fund may value its investment securities based on available market quotations provided by a third party pricing service.
Fair Valuation. Investments for which valuations or market quotations are not readily available or are deemed unreliable are valued at fair value using methods determined in good faith by or at the direction of the Trustees of the Portfolio in a manner that fairly reflects the security’s value, or the amount that the Portfolio might reasonably expect to receive for the security upon its current sale in the ordinary course. Each such determination is based on a consideration of relevant factors, which are likely to vary from one pricing context to another. These factors may include, but are not limited to, the type of security, the existence of any contractual restrictions on the security’s disposition, the price and extent of public trading in similar securities of the issuer or of comparable companies or entities, quotations or relevant information obtained from broker/dealers or other market participants, information obtained from the issuer, analysts, and/or the appropriate stock exchange (for exchange-traded securities), an analysis of the company’s or entity’s financial condition, and an evaluation of the forces that influence the issuer and the market(s) in which the security is purchased and sold.
B Investment Transactions — Investment transactions for financial statement purposes are accounted for on a trade date basis. Realized gains and losses on investments sold are determined on the basis of identified cost.
C Income — Dividend income is recorded on the ex-dividend date for dividends received in cash and/or securities. However, if the ex-dividend date has passed, certain dividends from foreign securities are recorded as the Portfolio is informed of the ex-dividend date. Withholding taxes on foreign dividends and capital gains have been provided for in accordance with the Portfolio’s understanding of the applicable countries’ tax rules and rates. Interest income is recorded on the basis of interest accrued, adjusted for amortization of premium or accretion of discount.
D Federal Taxes — The Portfolio has elected to be treated as a partnership for federal tax purposes. No provision is made by the Portfolio for federal or state taxes on any taxable income of the Portfolio because each investor in the Portfolio is ultimately responsible for the payment of any taxes on its share of taxable income. Since at least one of the Portfolio’s investors is a regulated investment company that invests all or substantially all of its assets in the Portfolio, the Portfolio normally must satisfy the applicable source of income and diversification requirements (under the Internal Revenue Code) in order for its investors to satisfy them. The Portfolio will allocate, at least annually among its investors, each investor’s distributive share of the Portfolio’s net investment income, net realized capital gains and any other items of income, gain, loss, deduction or credit.
Tax-Managed Growth Portfolio
June 30, 2014
Notes to Financial Statements (Unaudited) — continued
As of June 30, 2014, the Portfolio had no uncertain tax positions that would require financial statement recognition, de-recognition, or disclosure. The Portfolio files a U.S. federal tax return annually after its fiscal year-end, which is subject to examination by the Internal Revenue Service for a period of three years from the date of filing.
E Expense Reduction — State Street Bank and Trust Company (SSBT) serves as custodian of the Portfolio. Pursuant to the custodian agreement, SSBT receives a fee reduced by credits, which are determined based on the average daily cash balance the Portfolio maintains with SSBT. All credit balances, if any, used to reduce the Portfolio’s custodian fees are reported as a reduction of expenses in the Statement of Operations.
F Foreign Currency Translation — Investment valuations, other assets, and liabilities initially expressed in foreign currencies are translated each business day into U.S. dollars based upon current exchange rates. Purchases and sales of foreign investment securities and income and expenses denominated in foreign currencies are translated into U.S. dollars based upon currency exchange rates in effect on the respective dates of such transactions. Recognized gains or losses on investment transactions attributable to changes in foreign currency exchange rates are recorded for financial statement purposes as net realized gains and losses on investments. That portion of unrealized gains and losses on investments that results from fluctuations in foreign currency exchange rates is not separately disclosed.
G Use of Estimates — The preparation of the financial statements in conformity with accounting principles generally accepted in the United States of America requires management to make estimates and assumptions that affect the reported amounts of assets and liabilities at the date of the financial statements and the reported amounts of income and expense during the reporting period. Actual results could differ from those estimates.
H Indemnifications — Under the Portfolio’s organizational documents, its officers and Trustees may be indemnified against certain liabilities and expenses arising out of the performance of their duties to the Portfolio. Under Massachusetts law, if certain conditions prevail, interestholders in the Portfolio could be deemed to have personal liability for the obligations of the Portfolio. However, the Portfolio’s Declaration of Trust contains an express disclaimer of liability on the part of Portfolio interestholders and the By-laws provide that the Portfolio shall assume the defense on behalf of any Portfolio interestholder. Moreover, the By-laws also provide for indemnification out of Portfolio property of any interestholder held personally liable solely by reason of being or having been an interestholder for all loss or expense arising from such liability. Additionally, in the normal course of business, the Portfolio enters into agreements with service providers that may contain indemnification clauses. The Portfolio’s maximum exposure under these arrangements is unknown as this would involve future claims that may be made against the Portfolio that have not yet occurred.
I Interim Financial Statements — The interim financial statements relating to June 30, 2014 and for the six months then ended have not been audited by an independent registered public accounting firm, but in the opinion of the Portfolio’s management, reflect all adjustments, consisting only of normal recurring adjustments, necessary for the fair presentation of the financial statements.
2 Investment Adviser Fee and Other Transactions with Affiliates
The investment adviser fee is earned by Boston Management and Research (BMR), a subsidiary of EVM, as compensation for investment advisory services rendered to the Portfolio. The fee is computed at an annual rate of 0.625% of the Portfolio’s average daily net assets up to $500 million. The advisory fee on net assets of $500 million or more is reduced as follows:
| | | | |
| Average Daily Net Assets | | Annual Fee Rate
(for each level) | |
| |
$500 million but less than $1 billion | | | 0.5625 | % |
$1 billion but less than $1.5 billion | | | 0.5000 | % |
$1.5 billion but less than $7 billion | | | 0.4375 | % |
$7 billion but less than $10 billion | | | 0.4250 | % |
$10 billion but less than $15 billion | | | 0.4125 | % |
$15 billion but less than $20 billion | | | 0.4000 | % |
$20 billion but less than $25 billion | | | 0.3900 | % |
$25 billion and over | | | 0.3800 | % |
The Portfolio invests its cash in Cash Reserves Fund. EVM does not currently receive a fee for advisory services provided to Cash Reserves Fund. For the six months ended June 30, 2014, the Portfolio’s investment adviser fee amounted to $21,195,378, or 0.46% (annualized) of the Portfolio’s average daily net assets.
Officers and Trustees of the Portfolio who are members of EVM’s or BMR’s organizations receive remuneration for their services to the Portfolio out of the investment adviser fee. Trustees of the Portfolio who are not affiliated with the investment adviser may elect to defer receipt of all or a percentage of their annual fees in accordance with the terms of the Trustees Deferred Compensation Plan. For the six months ended June 30, 2014, no significant amounts have been deferred. Certain officers and Trustees of the Portfolio are officers of the above organizations.
Tax-Managed Growth Portfolio
June 30, 2014
Notes to Financial Statements (Unaudited) — continued
3 Purchases and Sales of Investments
Purchases and sales of investments, other than short-term obligations, aggregated $43,481,948 and $133,617, respectively, for the six months ended June 30, 2014. In addition, investors contributed securities with a value of $273,071,861 and investments having an aggregate market value of $425,223,568 at dates of withdrawal were distributed in payment for capital withdrawals, during the six months ended June 30, 2014.
4 Federal Income Tax Basis of Investments
The cost and unrealized appreciation (depreciation) of investments of the Portfolio at June 30, 2014, as determined on a federal income tax basis, were as follows:
| | | | |
| |
Aggregate cost | | $ | 1,745,827,837 | |
| |
Gross unrealized appreciation | | $ | 8,022,155,243 | |
Gross unrealized depreciation | | | (17,877 | ) |
| |
Net unrealized appreciation | | $ | 8,022,137,366 | |
5 Restricted Securities
At June 30, 2014, the Portfolio owned the following securities (representing 0.24% of net assets) which were restricted as to public resale and not registered under the Securities Act of 1933. The Portfolio has various registration rights (exercisable under a variety of circumstances) with respect to these securities. The value of these securities is determined based on valuations provided by brokers when available, or if not available, they are valued at fair value using methods determined in good faith by or at the direction of the Trustees.
| | | | | | | | | | | | | | | | | | | | |
| Common Stocks | | Date of Acquisition | | | Eligible for Resale | | | Shares | | | Cost | | | Value | |
| | | | | |
Alexion Pharmaceuticals, Inc. | | | 6/26/14 | | | | 6/26/15 | | | | 15,722 | | | $ | 2,500,091 | | | $ | 2,454,843 | |
Cheniere Energy, Inc. | | | 12/19/13 | | | | 12/19/14 | | | | 240,000 | | | | 9,880,729 | | | | 17,208,000 | |
Linear Technology Corp. | | | 12/19/13 | | | | 12/19/14 | | | | 50,000 | | | | 2,225,943 | | | | 2,353,500 | |
Ross Stores, Inc. | | | 8/8/13 | | | | 8/8/14 | | | | 15,500 | | | | 1,036,122 | | | | 1,025,015 | |
| | | | | |
Total Restricted Securities | | | | | | | | | | | | | | $ | 15,642,885 | | | $ | 23,041,358 | |
6 Line of Credit
The Portfolio participates with other portfolios and funds managed by EVM and its affiliates in a $750 million unsecured line of credit agreement with a group of banks. Borrowings are made by the Portfolio solely to facilitate the handling of unusual and/or unanticipated short-term cash requirements. Interest is charged to the Portfolio based on its borrowings at an amount above either the Eurodollar rate or Federal Funds rate. In addition, a fee computed at an annual rate of 0.08% on the daily unused portion of the line of credit is allocated among the participating portfolios and funds at the end of each quarter. Because the line of credit is not available exclusively to the Portfolio, it may be unable to borrow some or all of its requested amounts at any particular time. The Portfolio did not have any significant borrowings or allocated fees during the six months ended June 30, 2014.
7 Fair Value Measurements
Under generally accepted accounting principles for fair value measurements, a three-tier hierarchy to prioritize the assumptions, referred to as inputs, is used in valuation techniques to measure fair value. The three-tier hierarchy of inputs is summarized in the three broad levels listed below.
| Ÿ | | Level 1 – quoted prices in active markets for identical investments |
| Ÿ | | Level 2 – other significant observable inputs (including quoted prices for similar investments, interest rates, prepayment speeds, credit risk, etc.) |
| Ÿ | | Level 3 – significant unobservable inputs (including a fund’s own assumptions in determining the fair value of investments) |
Tax-Managed Growth Portfolio
June 30, 2014
Notes to Financial Statements (Unaudited) — continued
In cases where the inputs used to measure fair value fall in different levels of the fair value hierarchy, the level disclosed is determined based on the lowest level input that is significant to the fair value measurement in its entirety. The inputs or methodology used for valuing securities are not necessarily an indication of the risk associated with investing in those securities.
At June 30, 2014, the hierarchy of inputs used in valuing the Portfolio’s investments, which are carried at value, were as follows:
| | | | | | | | | | | | | | | | |
| Asset Description | | Level 1 | | | Level 2 | | | Level 3* | | | Total | |
| | | | |
Common Stocks | | | | | | | | | | | | | | | | |
Consumer Discretionary | | $ | 1,259,387,152 | | | $ | — | | | $ | — | | | $ | 1,259,387,152 | |
Consumer Staples | | | 895,893,565 | | | | 96,636,012 | | | | — | | | | 992,529,577 | |
Energy | | | 850,022,118 | | | | — | | | | — | | | | 850,022,118 | |
Financials | | | 1,561,841,121 | | | | 26,408,569 | | | | — | | | | 1,588,249,690 | |
Health Care | | | 1,277,159,564 | | | | 2,454,843 | | | | — | | | | 1,279,614,407 | |
Industrials | | | 1,251,251,424 | | | | — | | | | — | | | | 1,251,251,424 | |
Information Technology | | | 2,123,115,674 | | | | — | | | | — | | | | 2,123,115,674 | |
Materials | | | 241,935,614 | | | | 3,334,740 | | | | — | | | | 245,270,354 | |
Telecommunication Services | | | 36,281,286 | | | | — | | | | — | | | | 36,281,286 | |
Utilities | | | 13,901,170 | | | | — | | | | — | | | | 13,901,170 | |
| | | | |
Total Common Stocks | | $ | 9,510,788,688 | | | $ | 128,834,164 | ** | | $ | — | | | $ | 9,639,622,852 | |
| | | | |
Preferred Stock | | $ | — | | | $ | — | | | $ | 0 | | | $ | 0 | |
Rights | | | 3,492 | | | | — | | | | — | | | | 3,492 | |
Short-Term Investments | | | — | | | | 128,338,859 | | | | — | | | | 128,338,859 | |
| | | | |
Total Investments | | $ | 9,510,792,180 | | | $ | 257,173,023 | | | $ | 0 | | | $ | 9,767,965,203 | |
| * | None of the unobservable inputs for Level 3 assets, individually or collectively, had a material impact on the Portfolio. |
| ** | Includes foreign equity securities whose values were adjusted to reflect market trading of comparable securities or other correlated instruments that occurred after the close of trading in their applicable foreign markets. |
Level 3 investments at the beginning and/or end of the period in relation to net assets were not significant and accordingly, a reconciliation of Level 3 assets for the six months ended June 30, 2014 is not presented. At June 30, 2014, the value of investments transferred between Level 1 and Level 2 during the six months then ended was not significant.
8 Legal Proceedings
In November 2010, the Portfolio was named as defendant and a putative member of the proposed defendant class of shareholders in the case entitled Official Committee of Unsecured Creditors (UCC) of the Tribune Company v. FitzSimons, et al. as a result of its ownership of shares in the Tribune Company (Tribune) in 2007 when Tribune effected a leveraged buyout transaction (LBO) and was converted to a privately held company. The UCC, which has been replaced by a Litigation Trustee pursuant to Tribune’s plan of reorganization, seeks to recover payments of the proceeds of the LBO. This action is now part of a multi-district litigation proceeding in the Southern District of New York. The motion to dismiss briefing is ongoing and is expected to continue throughout 2014. The value of the proceeds received by the Portfolio is approximately $48,237,000 (equal to 0.49% of net assets at June 30, 2014).
The Portfolio cannot predict the outcome of these proceedings or the effect, if any, on the Portfolio’s net asset value. The attorneys’ fees and costs related to these actions will be expensed by the Portfolio as incurred.
Eaton Vance Tax-Managed Growth Funds 1.1 and 1.2
Tax-Managed Growth Portfolio
June 30, 2014
Special Meeting of Shareholders (Unaudited)
The Funds held a Special Meeting of Shareholders on May 29, 2014 to elect five Trustees. The results of the vote were as follows:
Eaton Vance Tax-Managed Growth Fund 1.1
| | | | | | | | |
Nominee for Trustee | | Number of Shares(1) | |
| | For | | | Withheld | |
Scott E. Eston | | | 30,587,631 | | | | 570,392 | |
Cynthia E. Frost | | | 30,664,492 | | | | 493,531 | |
George J. Gorman | | | 30,557,976 | | | | 600,046 | |
Valerie A. Mosley | | | 30,605,521 | | | | 552,501 | |
Harriett Tee Taggart | | | 30,583,279 | | | | 574,744 | |
Eaton Vance Tax-Managed Growth Fund 1.2
| | | | | | | | |
Nominee for Trustee | | Number of Shares(1) | |
| | For | | | Withheld | |
Scott E. Eston | | | 30,512,319 | | | | 359,177 | |
Cynthia E. Frost | | | 30,509,253 | | | | 362,243 | |
George J. Gorman | | | 30,506,236 | | | | 365,260 | |
Valerie A. Mosley | | | 30,506,075 | | | | 365,421 | |
Harriett Tee Taggart | | | 30,429,055 | | | | 442,441 | |
Each nominee was also elected a Trustee of the Portfolio.
| (1) | Excludes fractional shares. |
Tax-Managed Growth Portfolio
The Portfolio held a Special Meeting of Interestholders on May 29, 2014 to elect five Trustees. The results of the vote were as follows:
| | | | | | | | |
Nominee for Trustee | | Interest in the Portfolio | |
| | For | | | Withheld | |
Scott E. Eston | | | 99 | % | | | 0 | % |
Cynthia E. Frost | | | 99 | % | | | 0 | % |
George J. Gorman | | | 99 | % | | | 0 | % |
Valerie A. Mosley | | | 99 | % | | | 0 | % |
Harriett Tee Taggart | | | 99 | % | | | 0 | % |
Results are rounded to the nearest whole number.
Eaton Vance
Tax-Managed Growth Fund 1.1
June 30, 2014
Board of Trustees’ Contract Approval
Overview of the Contract Review Process
The Investment Company Act of 1940, as amended (the “1940 Act”), provides, in substance, that each investment advisory agreement between a fund and its investment adviser will continue in effect from year to year only if its continuation is approved at least annually by the fund’s board of trustees, including by a vote of a majority of the trustees who are not “interested persons” of the fund (“Independent Trustees”), cast in person at a meeting called for the purpose of considering such approval.
At a meeting of the Boards of Trustees (each a “Board”) of the Eaton Vance group of mutual funds (the “Eaton Vance Funds”) held on April 28, 2014, the Board, including a majority of the Independent Trustees, voted to approve continuation of existing advisory and sub-advisory agreements for the Eaton Vance Funds for an additional one-year period. In voting its approval, the Board relied upon the affirmative recommendation of the Contract Review Committee of the Board, which is a committee comprised exclusively of Independent Trustees. Prior to making its recommendation, the Contract Review Committee reviewed information furnished by each adviser to the Eaton Vance Funds (including information specifically requested by the Board) for a series of meetings of the Contract Review Committee held between February and April 2014, as well as information considered throughout the year at meetings of the Board and its committees. Such information included, among other things, the following:
Information about Fees, Performance and Expenses
| Ÿ | | An independent report comparing the advisory and related fees paid by each fund with fees paid by comparable funds; |
| Ÿ | | An independent report comparing each fund’s total expense ratio and its components to comparable funds; |
| Ÿ | | An independent report comparing the investment performance of each fund (including, where relevant, yield data, Sharpe ratios and information ratios) to the investment performance of comparable funds over various time periods; |
| Ÿ | | Data regarding investment performance in comparison to benchmark indices and customized peer groups identified by the adviser in consultation with the Board; |
| Ÿ | | For each fund, comparative information concerning the fees charged and the services provided by each adviser in managing other accounts (including mutual funds, other collective investment funds and institutional accounts) using investment strategies and techniques similar to those used in managing such fund; |
| Ÿ | | Profitability analyses for each adviser with respect to each fund; |
Information about Portfolio Management and Trading
| Ÿ | | Descriptions of the investment management services provided to each fund, including the investment strategies and processes employed, and any changes in portfolio management processes and personnel; |
| Ÿ | | Information about the allocation of brokerage and the benefits received by each adviser as a result of brokerage allocation, including information concerning the acquisition of research through client commission arrangements and the fund’s policies with respect to “soft dollar” arrangements; |
| Ÿ | | Data relating to portfolio turnover rates of each fund; |
| Ÿ | | The procedures and processes used to determine the fair value of fund assets and actions taken to monitor and test the effectiveness of such procedures and processes; |
| Ÿ | | Information about each adviser’s processes for monitoring best execution of portfolio transactions, and other policies and practices of each adviser with respect to trading; |
Information about each Adviser
| Ÿ | | Reports detailing the financial results and condition of each adviser; |
| Ÿ | | Descriptions of the qualifications, education and experience of the individual investment professionals whose responsibilities include portfolio management and investment research for the funds, and information relating to their compensation and responsibilities with respect to managing other mutual funds and investment accounts; |
| Ÿ | | Copies of the Codes of Ethics of each adviser and its affiliates, together with information relating to compliance with and the administration of such codes; |
| Ÿ | | Copies of or descriptions of each adviser’s policies and procedures relating to proxy voting, the handling of corporate actions and class actions; |
| Ÿ | | Information concerning the resources devoted to compliance efforts undertaken by each adviser and its affiliates on behalf of the funds (including descriptions of various compliance programs) and their record of compliance with investment policies and restrictions, including policies with respect to market-timing, late trading and selective portfolio disclosure, and with policies on personal securities transactions; |
| Ÿ | | Descriptions of the business continuity and disaster recovery plans of each adviser and its affiliates; |
| Ÿ | | A description of Eaton Vance Management’s procedures for overseeing third party advisers and sub-advisers, including with respect to regulatory and compliance issues, investment management and other matters; |
Eaton Vance
Tax-Managed Growth Fund 1.1
June 30, 2014
Board of Trustees’ Contract Approval — continued
Other Relevant Information
| Ÿ | | Information concerning the nature, cost and character of the administrative and other non-investment management services provided by Eaton Vance Management and its affiliates; |
| Ÿ | | Information concerning management of the relationship with the custodian, subcustodians and fund accountants by each adviser or the funds’ administrator; and |
| Ÿ | | The terms of each advisory agreement. |
Over the course of the twelve-month period ended April 30, 2014, with respect to one or more funds, the Board met nine times and the Contract Review Committee, the Audit Committee, the Governance Committee, the Portfolio Management Committee and the Compliance Reports and Regulatory Matters Committee, each of which is a Committee comprised solely of Independent Trustees, met seven, seventeen, eleven, six and ten times respectively. At such meetings, the Trustees participated in investment and performance reviews with the portfolio managers and other investment professionals of each adviser relating to each fund, and considered the investment and trading strategies used in pursuing each fund’s investment objective, including, where relevant, the use of derivative instruments, as well as processes for monitoring best execution of portfolio transactions and risk management techniques. The Board and its Committees also evaluated issues pertaining to industry and regulatory developments, compliance procedures, fund governance and other issues with respect to the funds, and received and participated in reports and presentations provided by Eaton Vance Management and other fund advisers with respect to such matters.
For funds that invest through one or more underlying portfolios, the Board considered similar information about the portfolio(s) when considering the approval of advisory agreements. In addition, in cases where the fund’s investment adviser has engaged a sub-adviser, the Board considered similar information about the sub-adviser when considering the approval of any sub-advisory agreement.
The Contract Review Committee was assisted throughout the contract review process by Goodwin Procter LLP, legal counsel for the Independent Trustees. The members of the Contract Review Committee relied upon the advice of such counsel and their own business judgment in determining the material factors to be considered in evaluating each advisory and sub-advisory agreement and the weight to be given to each such factor. The conclusions reached with respect to each advisory and sub-advisory agreement were based on a comprehensive evaluation of all the information provided and not any single factor. Moreover, each member of the Contract Review Committee may have placed varying emphasis on particular factors in reaching conclusions with respect to each advisory and sub-advisory agreement. In evaluating each advisory and sub-advisory agreement, including the specific fee structures and other terms of the agreements, the Contract Review Committee was informed by multiple years of analysis and discussion among the Independent Trustees and the Funds’ advisers and sub-advisers.
Results of the Process
Based on its consideration of the foregoing, and such other information as it deemed relevant, including the factors and conclusions described below, the Contract Review Committee concluded that the continuation of the investment advisory agreement of Tax-Managed Growth Portfolio (the “Portfolio”), the portfolio in which Eaton Vance Tax-Managed Growth Fund 1.1 (the “Fund”) invests, with Boston Management and Research (the “Adviser”), an affiliate of Eaton Vance Management, including its fee structure, is in the interests of shareholders and, therefore, the Contract Review Committee recommended to the Board approval of the agreement. The Board accepted the recommendation of the Contract Review Committee as well as the factors considered and conclusions reached by the Contract Review Committee with respect to the agreement. Accordingly, the Board, including a majority of the Independent Trustees, voted to approve continuation of the investment advisory agreement for the Portfolio.
Nature, Extent and Quality of Services
In considering whether to approve the investment advisory agreement of the Portfolio, the Board evaluated the nature, extent and quality of services provided to the Portfolio by the Adviser.
The Board considered the Adviser’s management capabilities and investment process with respect to the types of investments held by the Portfolio, including the education, experience and number of its investment professionals and other personnel who provide portfolio management, investment research, and similar services to the Portfolio, including recent changes to such personnel. The Board specifically noted the Adviser’s in-house equity research capabilities and experience in managing funds that seek to maximize after-tax returns. The Board also took into account the resources dedicated to portfolio management and other services, including the compensation methods of the Adviser to recruit and retain investment personnel, and the time and attention devoted to the Portfolio by senior management.
The Board reviewed the compliance programs of the Adviser and relevant affiliates thereof. Among other matters, the Board considered compliance and reporting matters relating to personal trading by investment personnel, selective disclosure of portfolio holdings, late trading, frequent trading, portfolio valuation, business continuity and the allocation of investment opportunities. The Board also evaluated the responses of the Adviser and its affiliates to requests in recent years from regulatory authorities such as the Securities and Exchange Commission and the Financial Industry Regulatory Authority.
Eaton Vance
Tax-Managed Growth Fund 1.1
June 30, 2014
Board of Trustees’ Contract Approval — continued
The Board considered shareholder and other administrative services provided or managed by Eaton Vance Management and its affiliates, including transfer agency and accounting services. The Board evaluated the benefits to shareholders of investing in a fund that is a part of a large family of funds, including the ability, in many cases, to exchange an investment among different funds without incurring additional sales charges.
After consideration of the foregoing factors, among others, the Board concluded that the nature, extent and quality of services provided by the Adviser, taken as a whole, are appropriate and consistent with the terms of the investment advisory agreement.
Fund Performance
The Board compared the Fund’s investment performance to a relevant universe of similarly managed funds identified by an independent data provider and appropriate benchmark indices. The Board reviewed comparative performance data for the one-, three-, five- and ten-year periods ended September 30, 2013 for the Fund. On the basis of the foregoing and other relevant information provided by the Adviser in response to inquiries from the Contract Review Committee, the Board concluded that the performance of the Fund was satisfactory.
Management Fees and Expenses
The Board reviewed contractual fee rates for investment advisory and administrative services payable by the Portfolio and by the Fund (referred to as “management fees”). As part of its review, the Board considered the management fees and the Fund’s total expense ratio for the year ended September 30, 2013, as compared to a group of similarly managed funds selected by an independent data provider. The Board also considered factors that had an impact on Fund expense ratios, as identified by management in response to inquiries from the Contract Review Committee, as well as actions taken by management in recent years to reduce expenses at the fund complex level, including the negotiation of reduced fees for transfer agency and custody services.
After reviewing the foregoing information, and in light of the nature, extent and quality of the services provided by the Adviser, the Board concluded that the management fees charged for advisory and related services are reasonable.
Profitability
The Board reviewed the level of profits realized by the Adviser and relevant affiliates thereof in providing investment advisory and administrative services to the Fund, to the Portfolio and to all Eaton Vance Funds as a group. The Board considered the level of profits realized without regard to revenue sharing or other payments by the Adviser and its affiliates to third parties in respect of distribution services. The Board also considered other direct or indirect benefits received by the Adviser and its affiliates in connection with their relationships with the Fund and the Portfolio, including the benefits of research services that may be available to the Adviser as a result of securities transactions effected for the Portfolio and other investment advisory clients.
The Board concluded that, in light of the foregoing factors and the nature, extent and quality of the services rendered, the profits realized by the Adviser and its affiliates are reasonable.
Economies of Scale
In reviewing management fees and profitability, the Board also considered the extent to which the Adviser and its affiliates, on the one hand, and the Fund and the Portfolio, on the other hand, can expect to realize benefits from economies of scale as the assets of the Fund and the Portfolio increase. The Board acknowledged the difficulty in accurately measuring the benefits resulting from the economies of scale with respect to the management of any specific fund or group of funds. The Board reviewed data summarizing the increases and decreases in the assets of the Fund and of all Eaton Vance Funds as a group over various time periods, and evaluated the extent to which the total expense ratio of the Fund and the profitability of the Adviser and its affiliates may have been affected by such increases or decreases. Based upon the foregoing, the Board concluded that the Fund currently shares in the benefits from economies of scale. The Board also concluded that, assuming reasonably foreseeable increases in the assets of the Fund and the Portfolio, the structure of the advisory fee, which includes breakpoints at several asset levels, will allow the Fund and the Portfolio to continue to benefit from economies of scale in the future.
Eaton Vance
Tax-Managed Growth Fund 1.2
June 30, 2014
Board of Trustees’ Contract Approval
Overview of the Contract Review Process
The Investment Company Act of 1940, as amended (the “1940 Act”), provides, in substance, that each investment advisory agreement between a fund and its investment adviser will continue in effect from year to year only if its continuation is approved at least annually by the fund’s board of trustees, including by a vote of a majority of the trustees who are not “interested persons” of the fund (“Independent Trustees”), cast in person at a meeting called for the purpose of considering such approval.
At a meeting of the Boards of Trustees (each a “Board”) of the Eaton Vance group of mutual funds (the “Eaton Vance Funds”) held on April 28, 2014, the Board, including a majority of the Independent Trustees, voted to approve continuation of existing advisory and sub-advisory agreements for the Eaton Vance Funds for an additional one-year period. In voting its approval, the Board relied upon the affirmative recommendation of the Contract Review Committee of the Board, which is a committee comprised exclusively of Independent Trustees. Prior to making its recommendation, the Contract Review Committee reviewed information furnished by each adviser to the Eaton Vance Funds (including information specifically requested by the Board) for a series of meetings of the Contract Review Committee held between February and April 2014, as well as information considered throughout the year at meetings of the Board and its committees. Such information included, among other things, the following:
Information about Fees, Performance and Expenses
| Ÿ | | An independent report comparing the advisory and related fees paid by each fund with fees paid by comparable funds; |
| Ÿ | | An independent report comparing each fund’s total expense ratio and its components to comparable funds; |
| Ÿ | | An independent report comparing the investment performance of each fund (including, where relevant, yield data, Sharpe ratios and information ratios) to the investment performance of comparable funds over various time periods; |
| Ÿ | | Data regarding investment performance in comparison to benchmark indices and customized peer groups identified by the adviser in consultation with the Board; |
| Ÿ | | For each fund, comparative information concerning the fees charged and the services provided by each adviser in managing other accounts (including mutual funds, other collective investment funds and institutional accounts) using investment strategies and techniques similar to those used in managing such fund; |
| Ÿ | | Profitability analyses for each adviser with respect to each fund; |
Information about Portfolio Management and Trading
| Ÿ | | Descriptions of the investment management services provided to each fund, including the investment strategies and processes employed, and any changes in portfolio management processes and personnel; |
| Ÿ | | Information about the allocation of brokerage and the benefits received by each adviser as a result of brokerage allocation, including information concerning the acquisition of research through client commission arrangements and the fund’s policies with respect to “soft dollar” arrangements; |
| Ÿ | | Data relating to portfolio turnover rates of each fund; |
| Ÿ | | The procedures and processes used to determine the fair value of fund assets and actions taken to monitor and test the effectiveness of such procedures and processes; |
| Ÿ | | Information about each adviser’s processes for monitoring best execution of portfolio transactions, and other policies and practices of each adviser with respect to trading; |
Information about each Adviser
| Ÿ | | Reports detailing the financial results and condition of each adviser; |
| Ÿ | | Descriptions of the qualifications, education and experience of the individual investment professionals whose responsibilities include portfolio management and investment research for the funds, and information relating to their compensation and responsibilities with respect to managing other mutual funds and investment accounts; |
| Ÿ | | Copies of the Codes of Ethics of each adviser and its affiliates, together with information relating to compliance with and the administration of such codes; |
| Ÿ | | Copies of or descriptions of each adviser’s policies and procedures relating to proxy voting, the handling of corporate actions and class actions; |
| Ÿ | | Information concerning the resources devoted to compliance efforts undertaken by each adviser and its affiliates on behalf of the funds (including descriptions of various compliance programs) and their record of compliance with investment policies and restrictions, including policies with respect to market-timing, late trading and selective portfolio disclosure, and with policies on personal securities transactions; |
| Ÿ | | Descriptions of the business continuity and disaster recovery plans of each adviser and its affiliates; |
| Ÿ | | A description of Eaton Vance Management’s procedures for overseeing third party advisers and sub-advisers, including with respect to regulatory and compliance issues, investment management and other matters; |
Eaton Vance
Tax-Managed Growth Fund 1.2
June 30, 2014
Board of Trustees’ Contract Approval — continued
Other Relevant Information
| Ÿ | | Information concerning the nature, cost and character of the administrative and other non-investment management services provided by Eaton Vance Management and its affiliates; |
| Ÿ | | Information concerning management of the relationship with the custodian, subcustodians and fund accountants by each adviser or the funds’ administrator; and |
| Ÿ | | The terms of each advisory agreement. |
Over the course of the twelve-month period ended April 30, 2014, with respect to one or more funds, the Board met nine times and the Contract Review Committee, the Audit Committee, the Governance Committee, the Portfolio Management Committee and the Compliance Reports and Regulatory Matters Committee, each of which is a Committee comprised solely of Independent Trustees, met seven, seventeen, eleven, six and ten times respectively. At such meetings, the Trustees participated in investment and performance reviews with the portfolio managers and other investment professionals of each adviser relating to each fund, and considered the investment and trading strategies used in pursuing each fund’s investment objective, including, where relevant, the use of derivative instruments, as well as processes for monitoring best execution of portfolio transactions and risk management techniques. The Board and its Committees also evaluated issues pertaining to industry and regulatory developments, compliance procedures, fund governance and other issues with respect to the funds, and received and participated in reports and presentations provided by Eaton Vance Management and other fund advisers with respect to such matters.
For funds that invest through one or more underlying portfolios, the Board considered similar information about the portfolio(s) when considering the approval of advisory agreements. In addition, in cases where the fund’s investment adviser has engaged a sub-adviser, the Board considered similar information about the sub-adviser when considering the approval of any sub-advisory agreement.
The Contract Review Committee was assisted throughout the contract review process by Goodwin Procter LLP, legal counsel for the Independent Trustees. The members of the Contract Review Committee relied upon the advice of such counsel and their own business judgment in determining the material factors to be considered in evaluating each advisory and sub-advisory agreement and the weight to be given to each such factor. The conclusions reached with respect to each advisory and sub-advisory agreement were based on a comprehensive evaluation of all the information provided and not any single factor. Moreover, each member of the Contract Review Committee may have placed varying emphasis on particular factors in reaching conclusions with respect to each advisory and sub-advisory agreement. In evaluating each advisory and sub-advisory agreement, including the specific fee structures and other terms of the agreements, the Contract Review Committee was informed by multiple years of analysis and discussion among the Independent Trustees and the Funds’ advisers and sub-advisers.
Results of the Process
Based on its consideration of the foregoing, and such other information as it deemed relevant, including the factors and conclusions described below, the Contract Review Committee concluded that the continuation of the investment advisory agreement of Tax-Managed Growth Portfolio (the “Portfolio”), the portfolio in which Eaton Vance Tax-Managed Growth Fund 1.2 (the “Fund”) invests, with Boston Management and Research (the “Adviser”), an affiliate of Eaton Vance Management, including its fee structure, is in the interests of shareholders and, therefore, the Contract Review Committee recommended to the Board approval of the agreement. The Board accepted the recommendation of the Contract Review Committee as well as the factors considered and conclusions reached by the Contract Review Committee with respect to the agreement. Accordingly, the Board, including a majority of the Independent Trustees, voted to approve continuation of the investment advisory agreement for the Portfolio.
Nature, Extent and Quality of Services
In considering whether to approve the investment advisory agreement of the Portfolio, the Board evaluated the nature, extent and quality of services provided to the Portfolio by the Adviser.
The Board considered the Adviser’s management capabilities and investment process with respect to the types of investments held by the Portfolio, including the education, experience and number of its investment professionals and other personnel who provide portfolio management, investment research, and similar services to the Portfolio, including recent changes to such personnel. The Board specifically noted the Adviser’s in-house equity research capabilities and experience in managing funds that seek to maximize after-tax returns. The Board also took into account the resources dedicated to portfolio management and other services, including the compensation methods of the Adviser to recruit and retain investment personnel, and the time and attention devoted to the Portfolio by senior management.
The Board reviewed the compliance programs of the Adviser and relevant affiliates thereof. Among other matters, the Board considered compliance and reporting matters relating to personal trading by investment personnel, selective disclosure of portfolio holdings, late trading, frequent trading, portfolio valuation, business continuity and the allocation of investment opportunities. The Board also evaluated the responses of the Adviser and its affiliates to requests in recent years from regulatory authorities such as the Securities and Exchange Commission and the Financial Industry Regulatory Authority.
Eaton Vance
Tax-Managed Growth Fund 1.2
June 30, 2014
Board of Trustees’ Contract Approval — continued
The Board considered shareholder and other administrative services provided or managed by Eaton Vance Management and its affiliates, including transfer agency and accounting services. The Board evaluated the benefits to shareholders of investing in a fund that is a part of a large family of funds, including the ability, in many cases, to exchange an investment among different funds without incurring additional sales charges.
After consideration of the foregoing factors, among others, the Board concluded that the nature, extent and quality of services provided by the Adviser, taken as a whole, are appropriate and consistent with the terms of the investment advisory agreement.
Fund Performance
The Board compared the Fund’s investment performance to a relevant universe of similarly managed funds identified by an independent data provider and appropriate benchmark indices. The Board reviewed comparative performance data for the one-, three-, five- and ten-year periods ended September 30, 2013 for the Fund. On the basis of the foregoing and other relevant information provided by the Adviser in response to inquiries from the Contract Review Committee, the Board concluded that the performance of the Fund was satisfactory.
Management Fees and Expenses
The Board reviewed contractual fee rates for investment advisory and administrative services payable by the Portfolio and by the Fund (referred to as “management fees”). As part of its review, the Board considered the management fees and the Fund’s total expense ratio for the year ended September 30, 2013, as compared to a group of similarly managed funds selected by an independent data provider. The Board also considered factors that had an impact on Fund expense ratios, as identified by management in response to inquiries from the Contract Review Committee, as well as actions taken by management in recent years to reduce expenses at the fund complex level, including the negotiation of reduced fees for transfer agency and custody services.
After reviewing the foregoing information, and in light of the nature, extent and quality of the services provided by the Adviser, the Board concluded that the management fees charged for advisory and related services are reasonable.
Profitability
The Board reviewed the level of profits realized by the Adviser and relevant affiliates thereof in providing investment advisory and administrative services to the Fund, to the Portfolio and to all Eaton Vance Funds as a group. The Board considered the level of profits realized without regard to revenue sharing or other payments by the Adviser and its affiliates to third parties in respect of distribution services. The Board also considered other direct or indirect benefits received by the Adviser and its affiliates in connection with their relationships with the Fund and the Portfolio, including the benefits of research services that may be available to the Adviser as a result of securities transactions effected for the Portfolio and other investment advisory clients.
The Board concluded that, in light of the foregoing factors and the nature, extent and quality of the services rendered, the profits realized by the Adviser and its affiliates are reasonable.
Economies of Scale
In reviewing management fees and profitability, the Board also considered the extent to which the Adviser and its affiliates, on the one hand, and the Fund and the Portfolio, on the other hand, can expect to realize benefits from economies of scale as the assets of the Fund and the Portfolio increase. The Board acknowledged the difficulty in accurately measuring the benefits resulting from the economies of scale with respect to the management of any specific fund or group of funds. The Board reviewed data summarizing the increases and decreases in the assets of the Fund and of all Eaton Vance Funds as a group over various time periods, and evaluated the extent to which the total expense ratio of the Fund and the profitability of the Adviser and its affiliates may have been affected by such increases or decreases. Based upon the foregoing, the Board concluded that the Fund currently shares in the benefits from economies of scale. The Board also concluded that, assuming reasonably foreseeable increases in the assets of the Fund and the Portfolio, the structure of the advisory fee, which includes breakpoints at several asset levels, will allow the Fund and the Portfolio to continue to benefit from economies of scale in the future.
Eaton Vance
Tax-Managed Growth Funds 1.1 and 1.2
June 30, 2014
Officers and Trustees
Officers of Eaton Vance Tax-Managed Growth Funds 1.1 and 1.2
Payson F. Swaffield
President
Maureen A. Gemma
Vice President, Secretary and
Chief Legal Officer
James F. Kirchner
Treasurer
Paul M. O’Neil
Chief Compliance Officer
Officers of Tax-Managed Growth Portfolio
Lewis R. Piantedosi
President
Maureen A. Gemma
Vice President, Secretary and
Chief Legal Officer
James F. Kirchner
Treasurer
Paul M. O’Neil
Chief Compliance Officer
Trustees of Eaton Vance Tax-Managed Growth Funds 1.1 and 1.2 and Tax-Managed Growth Portfolio
Ralph F. Verni
Chairman
Scott E. Eston
Thomas E. Faust Jr.*
Cynthia E. Frost
George J. Gorman
Valerie A. Mosley
William H. Park
Ronald A. Pearlman
Helen Frame Peters
Harriett Tee Taggart
Eaton Vance Funds
IMPORTANT NOTICES
Privacy. The Eaton Vance organization is committed to ensuring your financial privacy. Each of the financial institutions identified below has in effect the following policy (“Privacy Policy”) with respect to nonpublic personal information about its customers:
| Ÿ | | Only such information received from you, through application forms or otherwise, and information about your Eaton Vance fund transactions will be collected. This may include information such as name, address, social security number, tax status, account balances and transactions. |
| Ÿ | | None of such information about you (or former customers) will be disclosed to anyone, except as permitted by law (which includes disclosure to employees necessary to service your account). In the normal course of servicing a customer’s account, Eaton Vance may share information with unaffiliated third parties that perform various required services such as transfer agents, custodians and broker-dealers. |
| Ÿ | | Policies and procedures (including physical, electronic and procedural safeguards) are in place that are designed to protect the confidentiality of such information. |
| Ÿ | | We reserve the right to change our Privacy Policy at any time upon proper notification to you. Customers may want to review our Privacy Policy periodically for changes by accessing the link on our homepage: www.eatonvance.com. |
Our pledge of privacy applies to the following entities within the Eaton Vance organization: the Eaton Vance Family of Funds, Eaton Vance Management, Eaton Vance Investment Counsel, Eaton Vance Distributors, Inc., Eaton Vance Trust Company, Eaton Vance Management’s Real Estate Investment Group and Boston Management and Research. In addition, our Privacy Policy applies only to those Eaton Vance customers who are individuals and who have a direct relationship with us. If a customer’s account (i.e., fund shares) is held in the name of a third-party financial advisor/broker-dealer, it is likely that only such advisor’s privacy policies apply to the customer. This notice supersedes all previously issued privacy disclosures. For more information about Eaton Vance’s Privacy Policy, please call 1-800-262-1122.
Delivery of Shareholder Documents. The Securities and Exchange Commission (SEC) permits funds to deliver only one copy of shareholder documents, including prospectuses, proxy statements and shareholder reports, to fund investors with multiple accounts at the same residential or post office box address. This practice is often called “householding” and it helps eliminate duplicate mailings to shareholders. Eaton Vance, or your financial advisor, may household the mailing of your documents indefinitely unless you instruct Eaton Vance, or your financial advisor, otherwise. If you would prefer that your Eaton Vance documents not be householded, please contact Eaton Vance at 1-800-262-1122, or contact your financial advisor. Your instructions that householding not apply to delivery of your Eaton Vance documents will be effective within 30 days of receipt by Eaton Vance or your financial advisor.
Portfolio Holdings. Each Eaton Vance Fund and its underlying Portfolio(s) (if applicable) will file a schedule of portfolio holdings on Form N-Q with the SEC for the first and third quarters of each fiscal year. The Form N-Q will be available on the Eaton Vance website at www.eatonvance.com, by calling Eaton Vance at 1-800-262-1122 or in the EDGAR database on the SEC’s website at www.sec.gov. Form N-Q may also be reviewed and copied at the SEC’s public reference room in Washington, D.C. (call 1-800-732-0330 for information on the operation of the public reference room).
Proxy Voting. From time to time, funds are required to vote proxies related to the securities held by the funds. The Eaton Vance Funds or their underlying Portfolios (if applicable) vote proxies according to a set of policies and procedures approved by the Funds’ and Portfolios’ Boards. You may obtain a description of these policies and procedures and information on how the Funds or Portfolios voted proxies relating to portfolio securities during the most recent 12-month period ended June 30, without charge, upon request, by calling 1-800-262-1122 and by accessing the SEC’s website at www.sec.gov.
Investment Adviser of Tax-Managed Growth Portfolio
Boston Management and Research
Two International Place
Boston, MA 02110
Administrator of Eaton Vance Tax-Managed Growth Funds 1.1 and 1.2
Eaton Vance Management
Two International Place
Boston, MA 02110
Principal Underwriter*
Eaton Vance Distributors, Inc.
Two International Place
Boston, MA 02110
(617) 482-8260
Custodian
State Street Bank and Trust Company
State Street Financial Center, One Lincoln Street
Boston, MA 02111
Transfer Agent
BNY Mellon Investment Servicing (US) Inc.
Attn: Eaton Vance Funds
P.O. Box 9653
Providence, RI 02940-9653
(800) 262-1122
Fund Offices
Two International Place
Boston, MA 02110
| * | FINRA BrokerCheck. Investors may check the background of their Investment Professional by contacting the Financial Industry Regulatory Authority (FINRA). FINRA BrokerCheck is a free tool to help investors check the professional background of current and former FINRA-registered securities firms and brokers. FINRA BrokerCheck is available by calling 1-800-289-9999 and at www.FINRA.org. The FINRA BrokerCheck brochure describing this program is available to investors at www.FINRA.org. |
7774 6.30.14

Eaton Vance
Large-Cap Core Research Fund
Semiannual Report
June 30, 2014

Commodity Futures Trading Commission Registration. Effective December 31, 2012, the Commodity Futures Trading Commission (“CFTC”) adopted certain regulatory changes that subject registered investment companies and advisers to regulation by the CFTC if a fund invests more than a prescribed level of its assets in certain CFTC-regulated instruments (including futures, certain options and swap agreements) or markets itself as providing investment exposure to such instruments. The Fund has claimed an exclusion from the definition of the term “commodity pool operator” under the Commodity Exchange Act. Accordingly, neither the Fund nor the adviser with respect to the operation of the Fund is subject to CFTC regulation. Because of its management of other strategies, the Fund’s adviser is registered with the CFTC as a commodity pool operator and a commodity trading advisor.
Fund shares are not insured by the FDIC and are not deposits or other obligations of, or guaranteed by, any depository institution. Shares are subject to investment risks, including possible loss of principal invested.
This report must be preceded or accompanied by a current summary prospectus or prospectus. Before investing, investors should consider carefully the investment objective, risks, and charges and expenses of a mutual fund. This and other important information is contained in the summary prospectus and prospectus, which can be obtained from a financial advisor. Prospective investors should read the prospectus carefully before investing. For further information, please call 1-800-262-1122.
Semiannual Report June 30, 2014
Eaton Vance
Large-Cap Core Research Fund
Table of Contents
| | | | |
Performance | | | 2 | |
| |
Fund Profile | | | 2 | |
| |
Endnotes and Additional Disclosures | | | 3 | |
| |
Fund Expenses | | | 4 | |
| |
Financial Statements | | | 5 | |
| |
Special Meeting of Shareholders | | | 27 | |
| |
Board of Trustees’ Contract Approval | | | 28 | |
| |
Officers and Trustees | | | 31 | |
| |
Important Notices | | | 32 | |
Eaton Vance
Large-Cap Core Research Fund
June 30, 2014
Performance1,2
Portfolio Manager Charles B. Gaffney
| | | | | | | | | | | | | | | | | | | | | | | | |
| % Average Annual Total Returns | | Class
Inception Date | | | Performance
Inception Date | | | Six Months | | | One Year | | | Five Years | | | Ten Years | |
Class A at NAV | | | 11/01/2001 | | | | 11/01/2001 | | | | 8.58 | % | | | 28.08 | % | | | 16.88 | % | | | 8.79 | % |
Class A with 5.75% Maximum Sales Charge | | | — | | | | — | | | | 2.32 | | | | 20.69 | | | | 15.49 | | | | 8.15 | |
Class C at NAV | | | 10/01/2009 | | | | 11/01/2001 | | | | 8.18 | | | | 27.10 | | | | 16.07 | | | | 8.42 | |
Class C with 1% Maximum Sales Charge | | | — | | | | — | | | | 7.18 | | | | 26.10 | | | | 16.07 | | | | 8.42 | |
Class I at NAV | | | 09/03/2008 | | | | 11/01/2001 | | | | 8.71 | | | | 28.36 | | | | 17.18 | | | | 8.96 | |
S&P 500 Index | | | — | | | | — | | | | 7.14 | % | | | 24.61 | % | | | 18.82 | % | | | 7.78 | % |
| | | | | | |
| | | | | | | | | | | | | | | | | | | | | | | | |
| % Total Annual Operating Expense Ratios3 | | | | | | | | | | | Class A | | | Class C | | | Class I | |
Gross | | | | | | | | | | | | | | | 1.44 | % | | | 2.19 | % | | | 1.19 | % |
Net | | | | | | | | | | | | | | | 1.25 | | | | 2.00 | | | | 1.00 | |
Fund Profile4
| | |
| Sector Allocation (% of net assets)5 |
| | | | |
| Top 10 Holdings (% of net assets)5 | |
| |
Apple, Inc. | | | 3.8 | % |
JPMorgan Chase & Co. | | | 2.1 | |
Schlumberger, Ltd. | | | 2.0 | |
Merck & Co., Inc. | | | 1.9 | |
Devon Energy Corp. | | | 1.8 | |
Bank of America Corp. | | | 1.7 | |
Home Depot, Inc. (The) | | | 1.7 | |
Verizon Communications, Inc. | | | 1.7 | |
Citigroup, Inc. | | | 1.7 | |
Hewlett-Packard Co. | | | 1.6 | |
Total | | | 20.0 | % |
See Endnotes and Additional Disclosures in this report.
Past performance is no guarantee of future results. Returns are historical and are calculated by determining the percentage change in net asset value (NAV) or offering price (as applicable) with all distributions reinvested. Investment return and principal value will fluctuate so that shares, when redeemed, may be worth more or less than their original cost. Performance less than one year is cumulative. Performance is for the stated time period only; due to market volatility, the Fund’s current performance may be lower or higher than quoted. Returns are before taxes unless otherwise noted. For performance as of the most recent month end, please refer to eatonvance.com.
Eaton Vance
Large-Cap Core Research Fund
June 30, 2014
Endnotes and Additional Disclosures
| 1 | S&P 500 Index is an unmanaged index of large-cap stocks commonly used as a measure of U.S. stock market performance. Unless otherwise stated, index returns do not reflect the effect of any applicable sales charges, commissions, expenses, taxes or leverage, as applicable. It is not possible to invest directly in an index. |
| 2 | Total Returns at NAV do not include applicable sales charges. If sales charges were deducted, the returns would be lower. Total Returns shown with maximum sales charge reflect the stated maximum sales charge. Unless otherwise stated, performance does not reflect the deduction of taxes on Fund distributions or redemptions of Fund shares. |
| | Performance prior to the inception date of a class may be linked to the performance of an older class of the Fund. This linked performance is adjusted for any applicable sales charge, but is not adjusted for class expense differences. If adjusted for such differences, the performance would be different. Performance presented in the financial highlights included in the financial statements is not linked. In the performance table, the performance of Class C and Class I is linked to Class A. Performance since inception for an index, if presented, is the performance since the Fund’s or oldest share class’ inception, as applicable. |
| 3 | Source: Fund prospectus. Net expense ratio reflects a contractual expense reimbursement that continues through 4/30/15. Without the reimbursement, if applicable, performance would have been lower. |
| 4 | Fund invests in an affiliated investment company (Portfolio) with the same objective(s) and policies as the Fund. References to investments are to the Portfolio’s holdings. |
| 5 | Depictions do not reflect the Portfolio’s option positions. Excludes cash and cash equivalents. |
| | Fund profile subject to change due to active management. |
Eaton Vance
Large-Cap Core Research Fund
June 30, 2014
Fund Expenses
Example: As a Fund shareholder, you incur two types of costs: (1) transaction costs, including sales charges (loads) on purchases and redemption fees (if applicable); and (2) ongoing costs, including management fees; distribution and/or service fees; and other Fund expenses. This Example is intended to help you understand your ongoing costs (in dollars) of Fund investing and to compare these costs with the ongoing costs of investing in other mutual funds. The Example is based on an investment of $1,000 invested at the beginning of the period and held for the entire period (January 1, 2014 – June 30, 2014).
Actual Expenses: The first section of the table below provides information about actual account values and actual expenses. You may use the information in this section, together with the amount you invested, to estimate the expenses that you paid over the period. Simply divide your account value by $1,000 (for example, an $8,600 account value divided by $1,000 = 8.6), then multiply the result by the number in the first section under the heading entitled “Expenses Paid During Period” to estimate the expenses you paid on your account during this period.
Hypothetical Example for Comparison Purposes: The second section of the table below provides information about hypothetical account values and hypothetical expenses based on the actual Fund expense ratio and an assumed rate of return of 5% per year (before expenses), which is not the actual Fund return. The hypothetical account values and expenses may not be used to estimate the actual ending account balance or expenses you paid for the period. You may use this information to compare the ongoing costs of investing in your Fund and other funds. To do so, compare this 5% hypothetical example with the 5% hypothetical examples that appear in the shareholder reports of the other funds.
Please note that the expenses shown in the table are meant to highlight your ongoing costs only and do not reflect any transactional costs, such as sales charges (loads) or redemption fees (if applicable). Therefore, the second section of the table is useful in comparing ongoing costs only, and will not help you determine the relative total costs of owning different funds. In addition, if these transactional costs were included, your costs would be higher.
| | | | | | | | | | | | | | | | |
| | | Beginning
Account Value
(1/1/14) | | | Ending
Account Value
(6/30/14) | | | Expenses Paid
During Period*
(1/1/14 – 6/30/14) | | | Annualized
Expense
Ratio | |
| | | | |
| | | | | | | | | | | | | | | | |
Actual | | | | | | | | | | | | | | | | |
Class A | | $ | 1,000.00 | | | $ | 1,085.80 | | | $ | 6.46 | ** | | | 1.25 | % |
Class C | | $ | 1,000.00 | | | $ | 1,081.80 | | | $ | 10.32 | ** | | | 2.00 | % |
Class I | | $ | 1,000.00 | | | $ | 1,087.10 | | | $ | 5.17 | ** | | | 1.00 | % |
| | | | | | | | | | | | | | | | | |
| | | | |
| | | | | | | | | | | | | | | | |
Hypothetical | | | | | | | | | | | | | | | | |
(5% return per year before expenses) | | | | | | | | | | | | | | | | |
Class A | | $ | 1,000.00 | | | $ | 1,018.60 | | | $ | 6.26 | ** | | | 1.25 | % |
Class C | | $ | 1,000.00 | | | $ | 1,014.90 | | | $ | 9.99 | ** | | | 2.00 | % |
Class I | | $ | 1,000.00 | | | $ | 1,019.80 | | | $ | 5.01 | ** | | | 1.00 | % |
| * | Expenses are equal to the Fund’s annualized expense ratio for the indicated Class, multiplied by the average account value over the period, multiplied by 181/365 (to reflect the one-half year period). The Example assumes that the $1,000 was invested at the net asset value per share determined at the close of business on December 31, 2013. The Example reflects the expenses of both the Fund and the Portfolio. |
| ** | Absent an allocation of certain expenses to an affiliate, expenses would be higher. |
Eaton Vance
Large-Cap Core Research Fund
June 30, 2014
Statement of Assets and Liabilities (Unaudited)
| | | | |
| Assets | | June 30, 2014 | |
Investment in Large-Cap Core Research Portfolio, at value (identified cost, $64,238,552) | | $ | 81,223,006 | |
Receivable for Fund shares sold | | | 193,584 | |
Total assets | | $ | 81,416,590 | |
| |
| Liabilities | | | | |
Payable for Fund shares redeemed | | $ | 106,611 | |
Payable to affiliates: | | | | |
Distribution and service fees | | | 17,392 | |
Trustees’ fees | | | 125 | |
Other | | | 1,948 | |
Accrued expenses | | | 25,224 | |
Total liabilities | | $ | 151,300 | |
Net Assets | | $ | 81,265,290 | |
| |
| Sources of Net Assets | | | | |
Paid-in capital | | $ | 58,712,159 | |
Accumulated net realized gain from Portfolio | | | 5,394,994 | |
Accumulated undistributed net investment income | | | 173,683 | |
Net unrealized appreciation from Portfolio | | | 16,984,454 | |
Total | | $ | 81,265,290 | |
| |
| Class A Shares | | | | |
Net Assets | | $ | 47,653,152 | |
Shares Outstanding | | | 2,769,383 | |
Net Asset Value and Redemption Price Per Share | | | | |
(net assets ÷ shares of beneficial interest outstanding) | | $ | 17.21 | |
Maximum Offering Price Per Share | | | | |
(100 ÷ 94.25 of net asset value per share) | | $ | 18.26 | |
| |
| Class C Shares | | | | |
Net Assets | | $ | 9,611,299 | |
Shares Outstanding | | | 567,955 | |
Net Asset Value and Offering Price Per Share* | | | | |
(net assets ÷ shares of beneficial interest outstanding) | | $ | 16.92 | |
| |
| Class I Shares | | | | |
Net Assets | | $ | 24,000,839 | |
Shares Outstanding | | | 1,392,983 | |
Net Asset Value, Offering Price and Redemption Price Per Share | | | | |
(net assets ÷ shares of beneficial interest outstanding) | | $ | 17.23 | |
On sales of $50,000 or more, the offering price of Class A shares is reduced.
| * | Redemption price per share is equal to the net asset value less any applicable contingent deferred sales charge. |
| | | | |
| | 5 | | See Notes to Financial Statements. |
Eaton Vance
Large-Cap Core Research Fund
June 30, 2014
Statement of Operations (Unaudited)
| | | | |
| Investment Income | | Six Months Ended June 30, 2014 | |
Dividends allocated from Portfolio (net of foreign taxes, $8,535) | | $ | 605,528 | |
Interest allocated from Portfolio | | | 513 | |
Expenses allocated from Portfolio | | | (237,534 | ) |
Total investment income from Portfolio | | $ | 368,507 | |
| |
| Expenses | | | | |
Administration fee | | $ | 50,121 | |
Distribution and service fees | | | | |
Class A | | | 55,107 | |
Class C | | | 42,816 | |
Trustees’ fees and expenses | | | 250 | |
Custodian fee | | | 8,422 | |
Transfer and dividend disbursing agent fees | | | 28,918 | |
Legal and accounting services | | | 10,618 | |
Printing and postage | | | 17,431 | |
Registration fees | | | 30,634 | |
Miscellaneous | | | 5,977 | |
Total expenses | | $ | 250,294 | |
Deduct — | | | | |
Waiver and reimbursement of expenses by an affiliate | | $ | 55,470 | |
Total expense reductions | | $ | 55,470 | |
| |
Net expenses | | $ | 194,824 | |
| |
Net investment income | | $ | 173,683 | |
| |
| Realized and Unrealized Gain (Loss) from Portfolio | | | | |
Net realized gain (loss) — | | | | |
Investment transactions | | $ | 3,912,468 | |
Written options | | | 206,918 | |
Foreign currency transactions | | | (224 | ) |
Net realized gain | | $ | 4,119,162 | |
Change in unrealized appreciation (depreciation) — | | | | |
Investments | | $ | 1,589,628 | |
Written options | | | (1,438 | ) |
Foreign currency | | | (14 | ) |
Net change in unrealized appreciation (depreciation) | | $ | 1,588,176 | |
| |
Net realized and unrealized gain | | $ | 5,707,338 | |
| |
Net increase in net assets from operations | | $ | 5,881,021 | |
| | | | |
| | 6 | | See Notes to Financial Statements. |
Eaton Vance
Large-Cap Core Research Fund
June 30, 2014
Statements of Changes in Net Assets
| | | | | | | | |
| Increase (Decrease) in Net Assets | | Six Months Ended
June 30, 2014
(Unaudited) | | | Year Ended
December 31, 2013 | |
From operations — | | | | | | | | |
Net investment income | | $ | 173,683 | | | $ | 211,363 | |
Net realized gain from investment transactions, written options and foreign currency transactions | | | 4,119,162 | | | | 8,898,231 | |
Net change in unrealized appreciation (depreciation) from investments, written options and foreign currency | | | 1,588,176 | | | | 6,988,183 | |
Net increase in net assets from operations | | $ | 5,881,021 | | | $ | 16,097,777 | |
Distributions to shareholders — | | | | | | | | |
From net investment income | | | | | | | | |
Class A | | $ | — | | | $ | (162,576 | ) |
Class C | | | — | | | | (4,712 | ) |
Class I | | | — | | | | (70,937 | ) |
From net realized gain | | | | | | | | |
Class A | | | — | | | | (4,262,022 | ) |
Class C | | | — | | | | (763,766 | ) |
Class I | | | — | | | | (1,157,458 | ) |
Total distributions to shareholders | | $ | — | | | $ | (6,421,471 | ) |
Transactions in shares of beneficial interest — | | | | | | | | |
Proceeds from sale of shares | | | | | | | | |
Class A | | $ | 4,695,209 | | | $ | 9,989,896 | |
Class C | | | 1,684,571 | | | | 1,983,569 | |
Class I | | | 14,893,511 | | | | 7,085,702 | |
Net asset value of shares issued to shareholders in payment of distributions declared | | | | | | | | |
Class A | | | — | | | | 4,319,658 | |
Class C | | | — | | | | 714,026 | |
Class I | | | — | | | | 668,431 | |
Cost of shares redeemed | | | | | | | | |
Class A | | | (4,047,664 | ) | | | (15,236,211 | ) |
Class C | | | (896,932 | ) | | | (1,019,730 | ) |
Class I | | | (3,959,397 | ) | | | (6,732,032 | ) |
Net increase in net assets from Fund share transactions | | $ | 12,369,298 | | | $ | 1,773,309 | |
| | |
Net increase in net assets | | $ | 18,250,319 | | | $ | 11,449,615 | |
| | |
| Net Assets | | | | | | | | |
At beginning of period | | $ | 63,014,971 | | | $ | 51,565,356 | |
At end of period | | $ | 81,265,290 | | | $ | 63,014,971 | |
| | |
Accumulated undistributed net investment income
included in net assets | | | | | | | | |
At end of period | | $ | 173,683 | | | $ | — | |
| | | | |
| | 7 | | See Notes to Financial Statements. |
Eaton Vance
Large-Cap Core Research Fund
June 30, 2014
Financial Highlights
| | | | | | | | | | | | | | | | | | | | | | | | | | | | |
| | | Class A | |
| | | Six Months Ended
June 30, 2014
(Unaudited) | | | Year Ended December 31, | | | Period Ended
December 31, 2009(1) | | | Year Ended
October 31, 2009 | |
| | | | 2013 | | | 2012 | | | 2011 | | | 2010 | | | |
Net asset value — Beginning of period | | $ | 15.850 | | | $ | 13.330 | | | $ | 12.980 | | | $ | 13.350 | | | $ | 12.170 | | | $ | 11.280 | | | $ | 10.290 | |
| | | | | | | |
| Income (Loss) From Operations | | | | | | | | | | | | | | | | | | | | | | | | | | | | |
Net investment income(2) | | $ | 0.045 | | | $ | 0.063 | | | $ | 0.100 | | | $ | 0.098 | | | $ | 0.071 | | | $ | 0.020 | | | $ | 0.102 | |
Net realized and unrealized gain (loss) | | | 1.315 | | | | 4.232 | | | | 1.941 | | | | (0.373 | ) | | | 1.159 | | | | 0.946 | | | | 0.948 | |
| | | | | | | |
Total income (loss) from operations | | $ | 1.360 | | | $ | 4.295 | | | $ | 2.041 | | | $ | (0.275 | ) | | $ | 1.230 | | | $ | 0.966 | | | $ | 1.050 | |
| | | | | | | |
| Less Distributions | | | | | | | | | | | | | | | | | | | | | | | | | | | | |
From net investment income | | $ | — | | | $ | (0.065 | ) | | $ | (0.102 | ) | | $ | (0.095 | ) | | $ | (0.050 | ) | | $ | (0.076 | ) | | $ | (0.060 | ) |
From net realized gain | | | — | | | | (1.710 | ) | | | (1.589 | ) | | | — | | | | — | | | | — | | | | — | |
| | | | | | | |
Total distributions | | $ | — | | | $ | (1.775 | ) | | $ | (1.691 | ) | | $ | (0.095 | ) | | $ | (0.050 | ) | | $ | (0.076 | ) | | $ | (0.060 | ) |
| | | | | | | |
Net asset value — End of period | | $ | 17.210 | | | $ | 15.850 | | | $ | 13.330 | | | $ | 12.980 | | | $ | 13.350 | | | $ | 12.170 | | | $ | 11.280 | |
| | | | | | | |
Total Return(3) | | | 8.58 | %(4) | | | 32.83 | % | | | 15.59 | % | | | (2.06 | )% | | | 10.11 | % | | | 8.56 | %(4) | | | 10.32 | % |
| | | | | | | |
| Ratios/Supplemental Data | | | | | | | | | | | | | | | | | | | | | | | | | | | | |
Net assets, end of period (000’s omitted) | | $ | 47,653 | | | $ | 43,270 | | | $ | 37,308 | | | $ | 38,113 | | | $ | 38,877 | | | $ | 22,141 | | | $ | 22,264 | |
Ratios (as a percentage of average daily net assets): | | | | | | | | | | | | | | | | | | | | | | | | | | | | |
Expenses(5) | | | 1.25 | %(6) | | | 1.25 | % | | | 1.25 | % | | | 1.25 | % | | | 1.25 | % | | | 1.25 | %(6) | | | 1.25 | % |
Net investment income | | | 0.56 | %(6) | | | 0.41 | % | | | 0.70 | % | | | 0.74 | % | | | 0.58 | % | | | 0.99 | %(6) | | | 1.00 | % |
Portfolio Turnover of the Portfolio | | | 35 | %(4) | | | 90 | % | | | 91 | % | | | 64 | % | | | 44 | % | | | 10 | %(4) | | | — | |
Portfolio Turnover of the
Fund(7) | | | — | | | | — | | | | — | | | | — | | | | — | | | | — | | | | 54 | % |
| (1) | For the two months ended December 31, 2009. The Fund changed its fiscal year end from October 31 to December 31. |
| (2) | Computed using average shares outstanding. |
| (3) | Returns are historical and are calculated by determining the percentage change in net asset value with all distributions reinvested and do not reflect the effect of sales charges. |
| (5) | The administrator waived its fees and subsidized certain operating expenses (equal to 0.17%, 0.19%, 0.21%, 0.21%, 0.24% and 0.84% of average daily net assets for the six months ended June 30, 2014, the years ended December 31, 2013, 2012, 2011 and 2010 and the two months ended December 31, 2009, respectively). The investment adviser waived its investment adviser fee, the administrator waived its administration fee and the investment adviser subsidized certain operating expenses (equal to 0.93% of average daily net assets for the year ended October 31, 2009). Absent the waivers and subsidy, total return would be lower. |
| (7) | Represents the rate of portfolio activity for the period during which the Fund was making investments directly in securities. |
| | | | |
| | 8 | | See Notes to Financial Statements. |
Eaton Vance
Large-Cap Core Research Fund
June 30, 2014
Financial Highlights — continued
| | | | | | | | | | | | | | | | | | | | | | | | | | | | |
| | | Class C | |
| | | Six Months Ended
June 30, 2014
(Unaudited) | | | Year Ended December 31, | | | Period Ended
December 31, 2009(1) | | | Period Ended
October 31, 2009(2) | |
| | | | 2013 | | | 2012 | | | 2011 | | | 2010 | | | |
Net asset value — Beginning of period | | $ | 15.640 | | | $ | 13.200 | | | $ | 12.880 | | | $ | 13.270 | | | $ | 12.130 | | | $ | 11.280 | | | $ | 11.520 | |
| | | | | | | |
| Income (Loss) From Operations | | | | | | | | | | | | | | | | | | | | | | | | | | | | |
Net investment income (loss)(3) | | $ | (0.015 | ) | | $ | (0.053 | ) | | $ | (0.007 | ) | | $ | 0.005 | | | $ | (0.017 | ) | | $ | (0.003 | ) | | $ | (0.011 | ) |
Net realized and unrealized gain (loss) | | | 1.295 | | | | 4.165 | | | | 1.926 | | | | (0.371 | ) | | | 1.158 | | | | 0.944 | | | | (0.229 | ) |
| | | | | | | |
Total income (loss) from operations | | $ | 1.280 | | | $ | 4.112 | | | $ | 1.919 | | | $ | (0.366 | ) | | $ | 1.141 | | | $ | 0.941 | | | $ | (0.240 | ) |
| | | | | | | |
| Less Distributions | | | | | | | | | | | | | | | | | | | | | | | | | | | | |
From net investment income | | $ | — | | | $ | (0.010 | ) | | $ | (0.010 | ) | | $ | (0.024 | ) | | $ | (0.001 | ) | | $ | (0.091 | ) | | $ | — | |
From net realized gain | | | — | | | | (1.662 | ) | | | (1.589 | ) | | | — | | | | — | | | | — | | | | — | |
| | | | | | | |
Total distributions | | $ | — | | | $ | (1.672 | ) | | $ | (1.599 | ) | | $ | (0.024 | ) | | $ | (0.001 | ) | | $ | (0.091 | ) | | $ | — | |
| | | | | | | |
Net asset value — End of period | | $ | 16.920 | | | $ | 15.640 | | | $ | 13.200 | | | $ | 12.880 | | | $ | 13.270 | | | $ | 12.130 | | | $ | 11.280 | |
| | | | | | | |
Total Return(4) | | | 8.18 | %(5) | | | 31.72 | % | | | 14.78 | % | | | (2.76 | )% | | | 9.40 | % | | | 8.34 | %(5) | | | (2.08 | )%(5) |
| | | | | | | |
| Ratios/Supplemental Data | | | | | | | | | | | | | | | | | | | | | | | | | | | | |
Net assets, end of period (000’s omitted) | | $ | 9,611 | | | $ | 8,123 | | | $ | 5,382 | | | $ | 5,276 | | | $ | 1,637 | | | $ | 426 | | | $ | 55 | |
Ratios (as a percentage of average daily net assets): | | | | | | | | | | | | | | | | | | | | | | | | | | | | |
Expenses(6) | | | 2.00 | %(7) | | | 2.00 | % | | | 2.00 | % | | | 2.00 | % | | | 2.00 | % | | | 2.00 | %(7) | | | 2.00 | %(7) |
Net investment income (loss) | | | (0.19 | )%(7) | | | (0.35 | )% | | | (0.05 | )% | | | 0.04 | % | | | (0.14 | )% | | | (0.14 | )%(7) | | | (1.09 | )%(7) |
Portfolio Turnover of the Portfolio | | | 35 | %(5) | | | 90 | % | | | 91 | % | | | 64 | % | | | 44 | % | | | 10 | %(5) | | | — | |
Portfolio Turnover of the Fund(8) | | | — | | | | — | | | | — | | | | — | | | | — | | | | — | | | | 54 | %(9) |
| (1) | For the two months ended December 31, 2009. The Fund changed its fiscal year end from October 31 to December 31. |
| (2) | For the period from commencement of operations on October 1, 2009 to October 31, 2009. |
| (3) | Computed using average shares outstanding. |
| (4) | Returns are historical and are calculated by determining the percentage change in net asset value with all distributions reinvested and do not reflect the effect of sales charges. |
| (6) | The administrator waived its fees and subsidized certain operating expenses (equal to 0.17%, 0.19%, 0.21%, 0.21%, 0.24% and 0.84% of average daily net assets for the six months ended June 30, 2014, the years ended December 31, 2013, 2012, 2011 and 2010 and the two months ended December 31, 2009, respectively). The investment adviser waived its investment adviser fee, the administrator waived its administration fee and the investment adviser subsidized certain operating expenses (equal to 0.93% of average daily net assets for the period ended October 31, 2009). Absent the waivers and subsidy, total return would be lower. |
| (8) | Represents the rate of portfolio activity for the period during which the Fund was making investments directly in securities. |
| (9) | For the Fund’s year ended October 31, 2009. |
| | | | |
| | 9 | | See Notes to Financial Statements. |
Eaton Vance
Large-Cap Core Research Fund
June 30, 2014
Financial Highlights — continued
| | | | | | | | | | | | | | | | | | | | | | | | | | | | |
| | | Class I | |
| | | Six Months Ended
June 30, 2014
(Unaudited) | | | Year Ended December 31, | | | Period Ended
December 31, 2009(1) | | | Year Ended
October 31, 2009 | |
| | | | 2013 | | | 2012 | | | 2011 | | | 2010 | | | |
Net asset value — Beginning of period | | $ | 15.850 | | | $ | 13.330 | | | $ | 12.980 | | | $ | 13.360 | | | $ | 12.170 | | | $ | 11.290 | | | $ | 10.300 | |
| | | | | | | |
| Income (Loss) From Operations | | | | | | | | | | | | | | | | | | | | | | | | | | | | |
Net investment income(2) | | $ | 0.066 | | | $ | 0.102 | | | $ | 0.132 | | | $ | 0.130 | | | $ | 0.103 | | | $ | 0.021 | | | $ | 0.120 | |
Net realized and unrealized gain (loss) | | | 1.314 | | | | 4.233 | | | | 1.946 | | | | (0.379 | ) | | | 1.164 | | | | 0.959 | | | | 0.949 | |
| | | | | | | |
Total income (loss) from operations | | $ | 1.380 | | | $ | 4.335 | | | $ | 2.078 | | | $ | (0.249 | ) | | $ | 1.267 | | | $ | 0.980 | | | $ | 1.069 | |
| | | | | | | |
| Less Distributions | | | | | | | | | | | | | | | | | | | | | | | | | | | | |
From net investment income | | $ | — | | | $ | (0.105 | ) | | $ | (0.139 | ) | | $ | (0.131 | ) | | $ | (0.077 | ) | | $ | (0.100 | ) | | $ | (0.079 | ) |
From net realized gain | | | — | | | | (1.710 | ) | | | (1.589 | ) | | | — | | | | — | | | | — | | | | — | |
| | | | | | | |
Total distributions | | $ | — | | | $ | (1.815 | ) | | $ | (1.728 | ) | | $ | (0.131 | ) | | $ | (0.077 | ) | | $ | (0.100 | ) | | $ | (0.079 | ) |
| | | | | | | |
Net asset value — End of period | | $ | 17.230 | | | $ | 15.850 | | | $ | 13.330 | | | $ | 12.980 | | | $ | 13.360 | | | $ | 12.170 | | | $ | 11.290 | |
| | | | | | | |
Total Return(3) | | | 8.71 | %(4) | | | 33.14 | % | | | 15.89 | % | | | (1.86 | )% | | | 10.41 | % | | | 8.67 | %(4) | | | 10.54 | % |
| | | | | | | |
| Ratios/Supplemental Data | | | | | | | | | | | | | | | | | | | | | | | | | | | | |
Net assets, end of period (000’s omitted) | | $ | 24,001 | | | $ | 11,622 | | | $ | 8,876 | | | $ | 15,454 | | | $ | 17,505 | | | $ | 7,317 | | | $ | 3,901 | |
Ratios (as a percentage of average daily net assets): | | | | | | | | | | | | | | | | | | | | | | | | | | | | |
Expenses(5) | | | 1.00 | %(6) | | | 1.00 | % | | | 1.00 | % | | | 1.00 | % | | | 1.00 | % | | | 1.00 | %(6) | | | 1.00 | % |
Net investment income | | | 0.82 | %(6) | | | 0.66 | % | | | 0.92 | % | | | 0.97 | % | | | 0.84 | % | | | 1.06 | %(6) | | | 1.16 | % |
Portfolio Turnover of the Portfolio | | | 35 | %(4) | | | 90 | % | | | 91 | % | | | 64 | % | | | 44 | % | | | 10 | %(4) | | | — | |
Portfolio Turnover of the Fund(7) | | | — | | | | — | | | | — | | | | — | | | | — | | | | — | | | | 54 | % |
| (1) | For the two months ended December 31, 2009. The Fund changed its fiscal year end from October 31 to December 31. |
| (2) | Computed using average shares outstanding. |
| (3) | Returns are historical and are calculated by determining the percentage change in net asset value with all distributions reinvested. |
| (5) | The administrator waived its fees and subsidized certain operating expenses (equal to 0.17%, 0.19%, 0.21%, 0.21%, 0.24% and 0.84% of average daily net assets for the six months ended June 30, 2014, the years ended December 31, 2013, 2012, 2011 and 2010 and the two months ended December 31, 2009, respectively). The investment adviser waived its investment adviser fee, the administrator waived its administration fee and the investment adviser subsidized certain operating expenses (equal to 0.93% of average daily net assets for the year ended October 31, 2009). Absent the waivers and subsidy, total return would be lower. |
| (7) | Represents the rate of portfolio activity for the period during which the Fund was making investments directly in securities. |
| | | | |
| | 10 | | See Notes to Financial Statements. |
Eaton Vance
Large-Cap Core Research Fund
June 30, 2014
Notes to Financial Statements (Unaudited)
1 Significant Accounting Policies
Eaton Vance Large-Cap Core Research Fund (the Fund) is a diversified series of Eaton Vance Mutual Funds Trust (the Trust). The Trust is a Massachusetts business trust registered under the Investment Company Act of 1940, as amended (the 1940 Act), as an open-end management investment company. The Fund offers three classes of shares. Class A shares are generally sold subject to a sales charge imposed at time of purchase. Class C shares are sold at net asset value and are generally subject to a contingent deferred sales charge (see Note 5). Class I shares are sold at net asset value and are not subject to a sales charge. Each class represents a pro-rata interest in the Fund, but votes separately on class-specific matters and (as noted below) is subject to different expenses. Realized and unrealized gains and losses and net investment income and losses, other than class-specific expenses, are allocated daily to each class of shares based on the relative net assets of each class to the total net assets of the Fund. Each class of shares differs in its distribution plan and certain other class-specific expenses. The Fund invests all of its investable assets in interests in Large-Cap Core Research Portfolio (the Portfolio), a Massachusetts business trust, having the same investment objective and policies as the Fund. The value of the Fund’s investment in the Portfolio reflects the Fund’s proportionate interest in the net assets of the Portfolio (30.9% at June 30, 2014). The performance of the Fund is directly affected by the performance of the Portfolio. The financial statements of the Portfolio, including the portfolio of investments, are included elsewhere in this report and should be read in conjunction with the Fund’s financial statements.
The following is a summary of significant accounting policies of the Fund. The policies are in conformity with accounting principles generally accepted in the United States of America.
A Investment Valuation — Valuation of securities by the Portfolio is discussed in Note 1A of the Portfolio’s Notes to Financial Statements, which are included elsewhere in this report.
B Income — The Fund’s net investment income or loss consists of the Fund’s pro-rata share of the net investment income or loss of the Portfolio, less all actual and accrued expenses of the Fund.
C Federal Taxes — The Fund’s policy is to comply with the provisions of the Internal Revenue Code applicable to regulated investment companies and to distribute to shareholders each year substantially all of its net investment income, and all or substantially all of its net realized capital gains. Accordingly, no provision for federal income or excise tax is necessary.
As of June 30, 2014, the Fund had no uncertain tax positions that would require financial statement recognition, de-recognition, or disclosure. The Fund files a U.S. federal income tax return annually after its fiscal year-end, which is subject to examination by the Internal Revenue Service for a period of three years from the date of filing.
D Expenses — The majority of expenses of the Trust are directly identifiable to an individual fund. Expenses which are not readily identifiable to a specific fund are allocated taking into consideration, among other things, the nature and type of expense and the relative size of the funds.
E Expense Reduction — State Street Bank and Trust Company (SSBT) serves as custodian of the Fund. Pursuant to the custodian agreement, SSBT receives a fee reduced by credits, which are determined based on the average daily cash balance the Fund maintains with SSBT. All credit balances, if any, used to reduce the Fund’s custodian fees are reported as a reduction of expenses in the Statement of Operations.
F Use of Estimates — The preparation of the financial statements in conformity with accounting principles generally accepted in the United States of America requires management to make estimates and assumptions that affect the reported amounts of assets and liabilities at the date of the financial statements and the reported amounts of income and expense during the reporting period. Actual results could differ from those estimates.
G Indemnifications — Under the Trust’s organizational documents, its officers and Trustees may be indemnified against certain liabilities and expenses arising out of the performance of their duties to the Fund. Under Massachusetts law, if certain conditions prevail, shareholders of a Massachusetts business trust (such as the Trust) could be deemed to have personal liability for the obligations of the Trust. However, the Trust’s Declaration of Trust contains an express disclaimer of liability on the part of Fund shareholders and the By-laws provide that the Trust shall assume the defense on behalf of any Fund shareholders. Moreover, the By-laws also provide for indemnification out of Fund property of any shareholder held personally liable solely by reason of being or having been a shareholder for all loss or expense arising from such liability. Additionally, in the normal course of business, the Fund enters into agreements with service providers that may contain indemnification clauses. The Fund’s maximum exposure under these arrangements is unknown as this would involve future claims that may be made against the Fund that have not yet occurred.
H Other — Investment transactions are accounted for on a trade date basis. Dividends to shareholders are recorded on the ex-dividend date.
I Interim Financial Statements — The interim financial statements relating to June 30, 2014 and for the six months then ended have not been audited by an independent registered public accounting firm, but in the opinion of the Fund’s management, reflect all adjustments, consisting only of normal recurring adjustments, necessary for the fair presentation of the financial statements.
Eaton Vance
Large-Cap Core Research Fund
June 30, 2014
Notes to Financial Statements (Unaudited) — continued
2 Distributions to Shareholders
It is the present policy of the Fund to make at least one distribution annually (normally in December) of all or substantially all of its net investment income and to distribute annually all or substantially all of its net realized capital gains. Distributions are declared separately for each class of shares. Shareholders may reinvest income and capital gain distributions in additional shares of the same class of the Fund at the net asset value as of the ex-dividend date or, at the election of the shareholder, receive distributions in cash. The Fund distinguishes between distributions on a tax basis and a financial reporting basis. Accounting principles generally accepted in the United States of America require that only distributions in excess of tax basis earnings and profits be reported in the financial statements as a return of capital. Permanent differences between book and tax accounting relating to distributions are reclassified to paid-in capital. For tax purposes, distributions from short-term capital gains are considered to be from ordinary income.
3 Transactions with Affiliates
The administration fee is earned by Eaton Vance Management (EVM) as compensation for administrative services rendered to the Fund. The fee is computed at an annual rate of 0.15% of the Fund’s average daily net assets. For the six months ended June 30, 2014, the administration fee amounted to $50,121. EVM has agreed to reimburse the Fund’s expenses to the extent that total annual operating expenses (relating to ordinary operating expenses only) exceed 1.25%, 2.00% and 1.00% of the Fund’s average daily net assets for Class A, Class C and Class I, respectively. This agreement may be changed or terminated after April 30, 2015. Pursuant to this agreement, EVM waived fees and reimbursed expenses of $55,470 for the six months ended June 30, 2014. The Portfolio has engaged Boston Management and Research (BMR), a subsidiary of EVM, to render investment advisory services. See Note 2 of the Portfolio’s Notes to Financial Statements which are included elsewhere in this report.
EVM provides sub-transfer agency and related services to the Fund pursuant to a Sub-Transfer Agency Support Services Agreement. For the six months ended June 30, 2014, EVM earned $1,057 from the Fund pursuant to such agreement, which is included in transfer and dividend disbursing agent fees on the Statement of Operations. The Fund was informed that Eaton Vance Distributors, Inc. (EVD), an affiliate of EVM and the Fund’s principal underwriter, received $5,308 as its portion of the sales charge on sales of Class A shares for the six months ended June 30, 2014. EVD also received distribution and service fees from Class A and Class C shares (see Note 4) and contingent deferred sales charges (see Note 5).
Trustees and officers of the Fund who are members of EVM’s or BMR’s organizations receive remuneration for their services to the Fund out of the investment adviser fee. Certain officers and Trustees of the Fund and the Portfolio are officers of the above organizations.
4 Distribution Plans
The Fund has in effect a distribution plan for Class A shares (Class A Plan) pursuant to Rule 12b-1 under the 1940 Act. Pursuant to the Class A Plan, the Fund pays EVD a distribution and service fee of 0.25% per annum of its average daily net assets attributable to Class A shares for distribution services and facilities provided to the Fund by EVD, as well as for personal services and/or the maintenance of shareholder accounts. Distribution and service fees paid or accrued to EVD for the six months ended June 30, 2014 amounted to $55,107 for Class A shares.
The Fund also has in effect a distribution plan for Class C shares (Class C Plan) pursuant to Rule 12b-1 under the 1940 Act. Pursuant to the Class C Plan, the Fund pays EVD amounts equal to 0.75% per annum of its average daily net assets attributable to Class C shares for providing ongoing distribution services and facilities to the Fund. For the six months ended June 30, 2014, the Fund paid or accrued to EVD $32,112 for Class C shares.
Pursuant to the Class C Plan, the Fund also makes payments of service fees to EVD, financial intermediaries and other persons in amounts equal to 0.25% per annum of its average daily net assets attributable to that class. Service fees paid or accrued are for personal services and/or the maintenance of shareholder accounts. They are separate and distinct from the sales commissions and distribution fees payable to EVD. Service fees paid or accrued for the six months ended June 30, 2014 amounted to $10,704 for Class C shares.
Distribution and service fees are subject to the limitations contained in the Financial Industry Regulatory Authority’s NASD Conduct Rule 2830(d).
5 Contingent Deferred Sales Charges
A contingent deferred sales charge (CDSC) of 1% generally is imposed on redemptions of Class C shares made within one year of purchase. Class A shares may be subject to a 1% CDSC if redeemed within 18 months of purchase (depending on the circumstances of purchase). Generally, the CDSC is based upon the lower of the net asset value at date of redemption or date of purchase. No charge is levied on shares acquired by reinvestment of dividends or capital gain distributions. For the six months ended June 30, 2014, the Fund was informed that EVD received approximately $100 of CDSCs paid by Class C shareholders and no CDSCs paid by Class A shareholders.
6 Investment Transactions
For the six months ended June 30, 2014, increases and decreases in the Fund’s investment in the Portfolio aggregated $17,012,285 and $4,907,682, respectively.
Eaton Vance
Large-Cap Core Research Fund
June 30, 2014
Notes to Financial Statements (Unaudited) — continued
7 Shares of Beneficial Interest
The Fund’s Declaration of Trust permits the Trustees to issue an unlimited number of full and fractional shares of beneficial interest (without par value). Such shares may be issued in a number of different series (such as the Fund) and classes. Transactions in Fund shares were as follows:
| | | | | | | | |
| Class A | | Six Months Ended
June 30, 2014
(Unaudited) | | | Year Ended
December 31, 2013 | |
| | |
Sales | | | 289,443 | | | | 647,688 | |
Issued to shareholders electing to receive payments of distributions in Fund shares | | | — | | | | 282,643 | |
Redemptions | | | (250,824 | ) | | | (997,414 | ) |
| | |
Net increase (decrease) | | | 38,619 | | | | (67,083 | ) |
| | |
| | | | | | | | |
| Class C | | Six Months Ended
June 30, 2014
(Unaudited) | | | Year Ended
December 31, 2013 | |
| | |
Sales | | | 104,333 | | | | 129,579 | |
Issued to shareholders electing to receive payments of distributions in Fund shares | | | — | | | | 47,313 | |
Redemptions | | | (55,694 | ) | | | (65,349 | ) |
| | |
Net increase | | | 48,639 | | | | 111,543 | |
| | |
| | | | | | | | |
| Class I | | Six Months Ended
June 30, 2014
(Unaudited) | | | Year Ended
December 31, 2013 | |
| | |
Sales | | | 893,921 | | | | 454,502 | |
Issued to shareholders electing to receive payments of distributions in Fund shares | | | — | | | | 43,654 | |
Redemptions | | | (234,314 | ) | | | (430,450 | ) |
| | |
Net increase | | | 659,607 | | | | 67,706 | |
Large-Cap Core Research Portfolio
June 30, 2014
Portfolio of Investments (Unaudited)
| | | | | | | | |
| Common Stocks — 99.6% | |
| | |
| | | | | | | | |
| Security | | Shares | | | Value | |
| | | | | | | | |
|
Aerospace & Defense — 2.4% | |
Boeing Co. (The) | | | 30,176 | | | $ | 3,839,293 | |
United Technologies Corp. | | | 20,583 | | | | 2,376,307 | |
| | | | | | | | | |
| | | $ | 6,215,600 | |
| | | | | | | | | |
|
Air Freight & Logistics — 1.2% | |
C.H. Robinson Worldwide, Inc. | | | 48,491 | | | $ | 3,093,241 | |
| | | | | | | | | |
| | | $ | 3,093,241 | |
| | | | | | | | | |
|
Airlines — 1.0% | |
Delta Air Lines, Inc. | | | 66,061 | | | $ | 2,557,882 | |
| | | | | | | | | |
| | | $ | 2,557,882 | |
| | | | | | | | | |
|
Auto Components — 0.7% | |
TRW Automotive Holdings Corp.(1) | | | 19,454 | | | $ | 1,741,522 | |
| | | | | | | | | |
| | | $ | 1,741,522 | |
| | | | | | | | | |
|
Automobiles — 0.6% | |
Volkswagen AG | | | 5,967 | | | $ | 1,538,941 | |
| | | | | | | | | |
| | | $ | 1,538,941 | |
| | | | | | | | | |
|
Banks — 7.7% | |
Bank of America Corp. | | | 299,572 | | | $ | 4,604,422 | |
Citigroup, Inc. | | | 95,117 | | | | 4,480,011 | |
JPMorgan Chase & Co. | | | 98,109 | | | | 5,653,040 | |
Regions Financial Corp. | | | 243,366 | | | | 2,584,547 | |
SunTrust Banks, Inc. | | | 70,692 | | | | 2,831,921 | |
| | | | | | | | | |
| | | $ | 20,153,941 | |
| | | | | | | | | |
|
Beverages — 1.5% | |
Constellation Brands, Inc., Class A(1) | | | 30,402 | | | $ | 2,679,328 | |
PepsiCo, Inc. | | | 15,248 | | | | 1,362,257 | |
| | | | | | | | | |
| | | $ | 4,041,585 | |
| | | | | | | | | |
|
Biotechnology — 1.5% | |
Gilead Sciences, Inc.(1) | | | 47,388 | | | $ | 3,928,939 | |
| | | | | | | | | |
| | | $ | 3,928,939 | |
| | | | | | | | | |
|
Capital Markets — 2.6% | |
Affiliated Managers Group, Inc.(1) | | | 13,300 | | | $ | 2,731,820 | |
Invesco, Ltd. | | | 111,732 | | | | 4,217,883 | |
| | | | | | | | | |
| | | $ | 6,949,703 | |
| | | | | | | | | |
| | | | | | | | |
| Security | | Shares | | | Value | |
| | | | | | | | |
|
Chemicals — 2.8% | |
E.I. du Pont de Nemours & Co. | | | 19,382 | | | $ | 1,268,358 | |
Eastman Chemical Co. | | | 12,000 | | | | 1,048,200 | |
FMC Corp. | | | 8,096 | | | | 576,354 | |
LyondellBasell Industries NV, Class A | | | 17,533 | | | | 1,712,097 | |
Monsanto Co. | | | 15,544 | | | | 1,938,959 | |
PPG Industries, Inc. | | | 3,824 | | | | 803,614 | |
| | | | | | | | | |
| | | $ | 7,347,582 | |
| | | | | | | | | |
|
Communications Equipment — 1.2% | |
QUALCOMM, Inc. | | | 9,670 | | | $ | 765,864 | |
Telefonaktiebolaget LM Ericsson ADR | | | 190,025 | | | | 2,295,502 | |
| | | | | | | | | |
| | | $ | 3,061,366 | |
| | | | | | | | | |
|
Consumer Finance — 1.7% | |
American Express Co. | | | 13,681 | | | $ | 1,297,916 | |
Discover Financial Services | | | 53,000 | | | | 3,284,940 | |
| | | | | | | | | |
| | | $ | 4,582,856 | |
| | | | | | | | | |
|
Diversified Telecommunication Services — 2.3% | |
AT&T, Inc. | | | 42,701 | | | $ | 1,509,907 | |
Verizon Communications, Inc. | | | 93,477 | | | | 4,573,830 | |
| | | | | | | | | |
| | | $ | 6,083,737 | |
| | | | | | | | | |
|
Electric Utilities — 2.0% | |
Edison International | | | 34,111 | | | $ | 1,982,190 | |
NextEra Energy, Inc. | | | 32,221 | | | | 3,302,008 | |
| | | | | | | | | |
| | | $ | 5,284,198 | |
| | | | | | | | | |
|
Electrical Equipment — 2.3% | |
Eaton Corp. PLC | | | 27,200 | | | $ | 2,099,296 | |
Emerson Electric Co. | | | 32,164 | | | | 2,134,403 | |
Rockwell Automation, Inc. | | | 14,933 | | | | 1,869,014 | |
| | | | | | | | | |
| | | $ | 6,102,713 | |
| | | | | | | | | |
|
Electronic Equipment, Instruments & Components — 1.3% | |
Corning, Inc. | | | 151,109 | | | $ | 3,316,843 | |
| | | | | | | | | |
| | | $ | 3,316,843 | |
| | | | | | | | | |
|
Energy Equipment & Services — 3.7% | |
FMC Technologies, Inc.(1) | | | 42,522 | | | $ | 2,596,819 | |
Schlumberger, Ltd. | | | 44,000 | | | | 5,189,800 | |
Weatherford International PLC(1) | | | 90,000 | | | | 2,070,000 | |
| | | | | | | | | |
| | | $ | 9,856,619 | |
| | | | | | | | | |
| | | | |
| | 14 | | See Notes to Financial Statements. |
Large-Cap Core Research Portfolio
June 30, 2014
Portfolio of Investments (Unaudited) — continued
| | | | | | | | |
| Security | | Shares | | | Value | |
| | | | | | | | |
|
Food & Staples Retailing — 1.5% | |
Costco Wholesale Corp. | | | 21,858 | | | $ | 2,517,167 | |
CVS Caremark Corp. | | | 17,500 | | | | 1,318,975 | |
| | | | | | | | | |
| | | $ | 3,836,142 | |
| | | | | | | | | |
|
Food Products — 2.3% | |
Hershey Co. (The) | | | 20,474 | | | $ | 1,993,553 | |
Mondelez International, Inc., Class A | | | 110,787 | | | | 4,166,699 | |
| | | | | | | | | |
| | | $ | 6,160,252 | |
| | | | | | | | | |
|
Health Care Equipment & Supplies — 2.7% | |
Abbott Laboratories | | | 90,261 | | | $ | 3,691,675 | |
Stryker Corp. | | | 39,964 | | | | 3,369,764 | |
| | | | | | | | | |
| | | $ | 7,061,439 | |
| | | | | | | | | |
|
Health Care Providers & Services — 1.6% | |
Aetna, Inc. | | | 5,500 | | | $ | 445,940 | |
McKesson Corp. | | | 9,765 | | | | 1,818,341 | |
UnitedHealth Group, Inc. | | | 23,012 | | | | 1,881,231 | |
| | | | | | | | | |
| | | $ | 4,145,512 | |
| | | | | | | | | |
|
Health Care Technology — 0.5% | |
Cerner Corp.(1) | | | 24,174 | | | $ | 1,246,895 | |
| | | | | | | | | |
| | | $ | 1,246,895 | |
| | | | | | | | | |
|
Hotels, Restaurants & Leisure — 0.3% | |
Las Vegas Sands Corp. | | | 12,000 | | | $ | 914,640 | |
| | | | | | | | | |
| | | $ | 914,640 | |
| | | | | | | | | |
|
Household Durables — 0.8% | |
Mohawk Industries, Inc.(1) | | | 15,571 | | | $ | 2,154,092 | |
| | | | | | | | | |
| | | $ | 2,154,092 | |
| | | | | | | | | |
|
Household Products — 0.8% | |
Colgate-Palmolive Co. | | | 32,490 | | | $ | 2,215,168 | |
| | | | | | | | | |
| | | $ | 2,215,168 | |
| | | | | | | | | |
|
Industrial Conglomerates — 0.7% | |
General Electric Co. | | | 65,241 | | | $ | 1,714,533 | |
| | | | | | | | | |
| | | $ | 1,714,533 | |
| | | | | | | | | |
|
Insurance — 1.8% | |
MetLife, Inc. | | | 62,951 | | | $ | 3,497,558 | |
XL Group PLC | | | 39,000 | | | | 1,276,470 | |
| | | | | | | | | |
| | | $ | 4,774,028 | |
| | | | | | | | | |
| | | | | | | | |
| Security | | Shares | | | Value | |
| | | | | | | | |
|
Internet & Catalog Retail — 1.6% | |
Amazon.com, Inc.(1) | | | 9,917 | | | $ | 3,220,843 | |
Priceline Group, Inc. (The)(1) | | | 800 | | | | 962,400 | |
| | | | | | | | | |
| | | $ | 4,183,243 | |
| | | | | | | | | |
|
Internet Software & Services — 4.3% | |
eBay, Inc.(1) | | | 41,814 | | | $ | 2,093,209 | |
Facebook, Inc., Class A(1) | | | 46,359 | | | | 3,119,497 | |
Google, Inc., Class A(1) | | | 5,322 | | | | 3,111,614 | |
Google, Inc., Class C(1) | | | 5,322 | | | | 3,061,640 | |
| | | | | | | | | |
| | | $ | 11,385,960 | |
| | | | | | | | | |
|
IT Services — 2.3% | |
Fiserv, Inc.(1) | | | 35,097 | | | $ | 2,117,051 | |
Visa, Inc., Class A | | | 18,161 | | | | 3,826,704 | |
| | | | | | | | | |
| | | $ | 5,943,755 | |
| | | | | | | | | |
|
Life Sciences Tools & Services — 0.8% | |
Thermo Fisher Scientific, Inc. | | | 18,668 | | | $ | 2,202,824 | |
| | | | | | | | | |
| | | $ | 2,202,824 | |
| | | | | | | | | |
|
Machinery — 2.2% | |
Caterpillar, Inc. | | | 37,251 | | | $ | 4,048,066 | |
Donaldson Co., Inc. | | | 41,331 | | | | 1,749,128 | |
| | | | | | | | | |
| | | $ | 5,797,194 | |
| | | | | | | | | |
|
Media — 3.9% | |
Cinemark Holdings, Inc. | | | 43,800 | | | $ | 1,548,768 | |
Comcast Corp., Class A | | | 63,135 | | | | 3,389,087 | |
Lions Gate Entertainment Corp.(2) | | | 113,000 | | | | 3,229,540 | |
Walt Disney Co. (The) | | | 23,085 | | | | 1,979,308 | |
| | | | | | | | | |
| | | $ | 10,146,703 | |
| | | | | | | | | |
|
Metals & Mining — 0.3% | |
Freeport-McMoRan Copper & Gold, Inc. | | | 25,275 | | | $ | 922,538 | |
| | | | | | | | | |
| | | $ | 922,538 | |
| | | | | | | | | |
|
Multi-Utilities — 1.2% | |
Sempra Energy | | | 28,948 | | | $ | 3,031,145 | |
| | | | | | | | | |
| | | $ | 3,031,145 | |
| | | | | | | | | |
|
Multiline Retail — 1.4% | |
Dollar General Corp.(1)(2) | | | 26,718 | | | $ | 1,532,545 | |
Macy’s, Inc. | | | 38,700 | | | | 2,245,374 | |
| | | | | | | | | |
| | | $ | 3,777,919 | |
| | | | | | | | | |
| | | | |
| | 15 | | See Notes to Financial Statements. |
Large-Cap Core Research Portfolio
June 30, 2014
Portfolio of Investments (Unaudited) — continued
| | | | | | | | |
| Security | | Shares | | | Value | |
| | | | | | | | |
|
Oil, Gas & Consumable Fuels — 7.2% | |
Anadarko Petroleum Corp. | | | 14,454 | | | $ | 1,582,279 | |
Chevron Corp. | | | 9,915 | | | | 1,294,403 | |
ConocoPhillips | | | 39,183 | | | | 3,359,159 | |
Devon Energy Corp. | | | 61,121 | | | | 4,853,007 | |
EOG Resources, Inc. | | | 7,154 | | | | 836,017 | |
Exxon Mobil Corp. | | | 18,621 | | | | 1,874,762 | |
Kinder Morgan, Inc. | | | 56,391 | | | | 2,044,738 | |
Occidental Petroleum Corp. | | | 24,974 | | | | 2,563,082 | |
Range Resources Corp. | | | 6,696 | | | | 582,217 | |
| | | | | | | | | |
| | | $ | 18,989,664 | |
| | | | | | | | | |
|
Paper & Forest Products — 0.3% | |
International Paper Co. | | | 14,500 | | | $ | 731,815 | |
| | | | | | | | | |
| | | $ | 731,815 | |
| | | | | | | | | |
|
Personal Products — 0.9% | |
Estee Lauder Cos., Inc. (The), Class A | | | 32,594 | | | $ | 2,420,430 | |
| | | | | | | | | |
| | | $ | 2,420,430 | |
| | | | | | | | | |
|
Pharmaceuticals — 6.4% | |
Jazz Pharmaceuticals PLC(1) | | | 12,548 | | | $ | 1,844,682 | |
Merck & Co., Inc. | | | 85,796 | | | | 4,963,299 | |
Pfizer, Inc. | | | 133,924 | | | | 3,974,864 | |
Roche Holding AG ADR | | | 72,268 | | | | 2,695,596 | |
Shire PLC ADR | | | 14,331 | | | | 3,374,807 | |
| | | | | | | | | |
| | | $ | 16,853,248 | |
| | | | | | | | | |
|
Real Estate Investment Trusts (REITs) — 1.9% | |
American Tower Corp. | | | 12,144 | | | $ | 1,092,717 | |
AvalonBay Communities, Inc. | | | 13,375 | | | | 1,901,791 | |
Simon Property Group, Inc. | | | 12,076 | | | | 2,007,998 | |
| | | | | | | | | |
| | | $ | 5,002,506 | |
| | | | | | | | | |
|
Road & Rail — 0.7% | |
CSX Corp. | | | 61,000 | | | $ | 1,879,410 | |
| | | | | | | | | |
| | | $ | 1,879,410 | |
| | | | | | | | | |
|
Semiconductors & Semiconductor Equipment — 1.2% | |
NXP Semiconductors NV(1) | | | 47,958 | | | $ | 3,173,860 | |
| | | | | | | | | |
| | | $ | 3,173,860 | |
| | | | | | | | | |
|
Software — 2.0% | |
A10 Networks, Inc.(1) | | | 96,848 | | | $ | 1,288,078 | |
Microsoft Corp. | | | 49,237 | | | | 2,053,183 | |
| | | | | | | | |
| Security | | Shares | | | Value | |
| | | | | | | | |
|
Software (continued) | |
Oracle Corp. | | | 47,431 | | | $ | 1,922,379 | |
| | | | | | | | | |
| | | $ | 5,263,640 | |
| | | | | | | | | |
|
Specialty Retail — 3.5% | |
AutoNation, Inc.(1) | | | 33,661 | | | $ | 2,008,889 | |
Home Depot, Inc. (The) | | | 56,871 | | | | 4,604,276 | |
TJX Cos., Inc. (The) | | | 49,500 | | | | 2,630,925 | |
| | | | | | | | | |
| | | $ | 9,244,090 | |
| | | | | | | | | |
|
Technology Hardware, Storage & Peripherals — 6.3% | |
Apple, Inc.(2) | | | 107,653 | | | $ | 10,004,193 | |
Hewlett-Packard Co. | | | 125,505 | | | | 4,227,008 | |
NCR Corp.(1) | | | 69,095 | | | | 2,424,544 | |
| | | | | | | | | |
| | | | | | $ | 16,655,745 | |
| | | | | | | | | |
| | |
Tobacco — 1.7% | | | | | | | | |
Altria Group, Inc. | | | 67,312 | | | $ | 2,823,065 | |
Reynolds American, Inc. | | | 27,511 | | | | 1,660,289 | |
| | | | | | | | | |
| | | | | | $ | 4,483,354 | |
| | | | | | | | | |
| | |
Total Common Stocks — 99.6%
(identified cost $200,142,854) | | | | | | $ | 262,169,012 | |
| | | | | | | | | |
| | | | | | | | | | | | | | | | |
|
| Call Options Purchased — 0.1% | |
| | | | |
| | | | | | | | | | | | | | | | |
| Security | | Number of Contracts | | | Strike Price | | | Expiration Date | | | Value | |
| | | | | | | | | | | | | | | | |
McDonald’s Corp. | | | 150 | | | $ | 105.00 | | | | 1/17/15 | | | $ | 27,375 | |
Vertex Pharmaceuticals, Inc. | | | 134 | | | | 80.00 | | | | 7/19/14 | | | | 191,620 | |
| | | | | | | | | | | | | | | | | |
| |
Total Call Options Purchased
(identified cost $165,600) | | | $ | 218,995 | |
| | | | | | | | | | | | | | | | | |
|
| Put Options Purchased — 0.0%(3) | |
| | | | |
| | | | | | | | | | | | | | | | |
| Security | | Number of Contracts | | | Strike Price | | | Expiration Date | | | Value | |
Lions Gate Entertainment Corp. | | | 1,130 | | | $ | 26.00 | | | | 7/19/14 | | | $ | 8,475 | |
NXP Semiconductors NV | | | 480 | | | | 60.00 | | | | 7/19/14 | | | | 12,000 | |
| | | | | | | | | | | | | | | | | |
| |
Total Put Options Purchased
(identified cost $273,660) | | | $ | 20,475 | |
| | | | | | | | | | | | | | | | | |
| | | | |
| | 16 | | See Notes to Financial Statements. |
Large-Cap Core Research Portfolio
June 30, 2014
Portfolio of Investments (Unaudited) — continued
| | | | | | | | |
| Short-Term Investments — 1.4% | | | | | |
| | |
| | | | | | | | |
| Description | | Interest
(000’s omitted) | | | Value | |
| | | | | | | | |
Eaton Vance Cash Reserves Fund, LLC, 0.12%(4) | | $ | 3,653 | | | $ | 3,653,333 | |
| | | | | | | | | |
| | |
Total Short-Term Investments
(identified cost $3,653,333) | | | | | | $ | 3,653,333 | |
| | | | | | | | | |
| | |
Total Investments — 101.1%
(identified cost $204,235,447) | | | | | | $ | 266,061,815 | |
| | | | | | | | | |
| | | | | | | | | | | | | | | | |
|
| Call Options Written — (0.1)% | |
| | | | |
| | | | | | | | | | | | | | | | |
| Security | | Number of Contracts | | | Strike
Price | | | Expiration
Date | | | Value | |
| | | | | | | | | | | | | | | | |
Dollar General Corp. | | | 133 | | | $ | 65.00 | | | | 7/19/14 | | | $ | (998 | ) |
Lions Gate Entertainment Corp. | | | 1,130 | | | | 28.00 | | | | 7/19/14 | | | | (113,000 | ) |
Vertex Pharmaceuticals, Inc. | | | 134 | | | | 110.00 | | | | 7/19/14 | | | | (1,675 | ) |
| | | | | | | | | | | | | | | | | |
| | |
Total Call Options Written
(premiums received $116,470) | | | | | | | $ | (115,673 | ) |
| | | | | | | | | | | | | | | | | |
|
| Put Options Written — (0.0)%(3) | |
| | | | |
| | | | | | | | | | | | | | | | |
| Security | | Number of Contracts | | | Strike
Price | | | Expiration
Date | | | Value | |
McDonald’s Corp. | | | 150 | | | $ | 82.50 | | | | 1/17/15 | | | $ | (5,700 | ) |
| | | | | | | | | | | | | | | | | |
| | |
Total Put Options Written
(premiums received $31,421) | | | | | | | $ | (5,700 | ) |
| | | | | | | | | | | | | | | | | |
| |
Other Assets, Less Liabilities — (1.0)% | | | $ | (2,678,795 | ) |
| | | | | | | | | | | | | | | | | |
| |
Net Assets — 100.0% | | | $ | 263,261,647 | |
| | | | | | | | | | | | | | | | | |
The percentage shown for each investment category in the Portfolio of Investments is based on net assets.
| | | | |
| ADR | | – | | American Depositary Receipt |
| (1) | Non-income producing security. |
| (2) | Security (or a portion thereof) has been pledged as collateral for written option contracts. |
| (3) | Amount is less than 0.05% or (0.05)%, as applicable. |
| (4) | Affiliated investment company, available to Eaton Vance portfolios and funds, which invests in high quality, U.S. dollar denominated money market instruments. The rate shown is the annualized seven-day yield as of June 30, 2014. |
| | | | |
| | 17 | | See Notes to Financial Statements. |
Large-Cap Core Research Portfolio
June 30, 2014
Statement of Assets and Liabilities (Unaudited)
| | | | |
| Assets | | June 30, 2014 | |
Unaffiliated investments, at value (identified cost, $200,582,114) | | $ | 262,408,482 | |
Affiliated investment, at value (identified cost, $3,653,333) | | | 3,653,333 | |
Cash | | | 4,992 | |
Foreign currency, at value (identified cost, $28,932) | | | 28,886 | |
Dividends receivable | | | 289,768 | |
Interest receivable from affiliated investment | | | 169 | |
Receivable for investments sold | | | 538 | |
Tax reclaims receivable | | | 45,322 | |
Total assets | | $ | 266,431,490 | |
| |
| Liabilities | | | | |
Written options outstanding, at value (premiums received, $147,891) | | $ | 121,373 | |
Payable for investments purchased | | | 2,868,216 | |
Payable to affiliates: | | | | |
Investment adviser fee | | | 138,643 | |
Trustees’ fees | | | 2,625 | |
Accrued expenses | | | 38,986 | |
Total liabilities | | $ | 3,169,843 | |
Net Assets applicable to investors’ interest in Portfolio | | $ | 263,261,647 | |
|
| Sources of Net Assets | |
Investors’ capital | | $ | 201,408,984 | |
Net unrealized appreciation | | | 61,852,663 | |
Total | | $ | 263,261,647 | |
| | | | |
| | 18 | | See Notes to Financial Statements. |
Large-Cap Core Research Portfolio
June 30, 2014
Statement of Operations (Unaudited)
| | | | |
| Investment Income | | Six Months Ended June 30, 2014 | |
Dividends (net of foreign taxes, $31,888) | | $ | 2,214,596 | |
Interest allocated from affiliated investment | | | 1,907 | |
Expenses allocated from affiliated investment | | | (201 | ) |
Total investment income | | $ | 2,216,302 | |
|
| Expenses | |
Investment adviser fee | | $ | 794,834 | |
Trustees’ fees and expenses | | | 5,770 | |
Custodian fee | | | 43,024 | |
Legal and accounting services | | | 19,638 | |
Miscellaneous | | | 4,856 | |
Total expenses | | $ | 868,122 | |
Deduct — | | | | |
Reduction of custodian fee | | $ | 1 | |
Total expense reductions | | $ | 1 | |
| |
Net expenses | | $ | 868,121 | |
| |
Net investment income | | $ | 1,348,181 | |
|
| Realized and Unrealized Gain (Loss) | |
Net realized gain (loss) — | | | | |
Investment transactions | | $ | 14,059,699 | |
Investment transactions allocated from affiliated investment | | | 13 | |
Written options | | | 750,657 | |
Foreign currency transactions | | | (852 | ) |
Net realized gain | | $ | 14,809,517 | |
Change in unrealized appreciation (depreciation) — | | | | |
Investments | | $ | 5,164,090 | |
Written options | | | 18,372 | |
Foreign currency | | | (99 | ) |
Net change in unrealized appreciation (depreciation) | | $ | 5,182,363 | |
| |
Net realized and unrealized gain | | $ | 19,991,880 | |
| |
Net increase in net assets from operations | | $ | 21,340,061 | |
| | | | |
| | 19 | | See Notes to Financial Statements. |
Large-Cap Core Research Portfolio
June 30, 2014
Statements of Changes in Net Assets
| | | | | | | | |
| Increase (Decrease) in Net Assets | | Six Months Ended
June 30, 2014
(Unaudited) | | | Year Ended
December 31, 2013 | |
From operations — | | | | | | | | |
Net investment income | | $ | 1,348,181 | | | $ | 1,930,920 | |
Net realized gain from investment transactions, written options and foreign currency transactions | | | 14,809,517 | | | | 30,992,242 | |
Net change in unrealized appreciation (depreciation) from investments, written options and foreign currency | | | 5,182,363 | | | | 26,698,613 | |
Net increase in net assets from operations | | $ | 21,340,061 | | | $ | 59,621,775 | |
Capital transactions — | | | | | | | | |
Contributions | | $ | 26,442,161 | | | $ | 22,378,744 | |
Withdrawals | | | (21,653,442 | ) | | | (33,673,667 | ) |
Net increase (decrease) in net assets from capital transactions | | $ | 4,788,719 | | | $ | (11,294,923 | ) |
| | |
Net increase in net assets | | $ | 26,128,780 | | | $ | 48,326,852 | |
|
| Net Assets | |
At beginning of period | | $ | 237,132,867 | | | $ | 188,806,015 | |
At end of period | | $ | 263,261,647 | | | $ | 237,132,867 | |
| | | | |
| | 20 | | See Notes to Financial Statements. |
Large-Cap Core Research Portfolio
June 30, 2014
Supplementary Data
| | | | | | | | | | | | | | | | | | | | | | | | |
| | | Six Months Ended
June 30, 2014
(Unaudited) | | | Year Ended December 31, | | | Period Ended
December 31, 2009(1) | |
| Ratios/Supplemental Data | | | 2013 | | | 2012 | | | 2011 | | | 2010 | | |
Ratios (as a percentage of average daily net assets): | | | | | | | | | | | | | | | | | | | | | | | | |
Expenses(2) | | | 0.71 | %(3) | | | 0.73 | % | | | 0.73 | % | | | 0.73 | % | | | 0.73 | % | | | 0.86 | %(3) |
Net investment income | | | 1.10 | %(3) | | | 0.93 | % | | | 1.21 | % | | | 1.25 | % | | | 1.09 | % | | | 1.19 | %(3) |
Portfolio Turnover | | | 35 | %(4) | | | 90 | % | | | 91 | % | | | 64 | % | | | 44 | % | | | 10 | %(4) |
Total Return | | | 8.87 | %(4) | | | 33.50 | % | | | 16.18 | % | | | (1.55 | )% | | | 10.68 | % | | | 8.63 | %(4) |
| | | | | | |
Net assets, end of period (000’s omitted) | | $ | 263,262 | | | $ | 237,133 | | | $ | 188,806 | | | $ | 204,506 | | | $ | 222,854 | | | $ | 214,153 | |
| (1) | For the period from the start of business, November 1, 2009, to December 31, 2009. |
| (2) | Excludes the effect of custody fee credits, if any, of less than 0.005%. |
| | | | |
| | 21 | | See Notes to Financial Statements. |
Large-Cap Core Research Portfolio
June 30, 2014
Notes to Financial Statements (Unaudited)
1 Significant Accounting Policies
Large-Cap Core Research Portfolio (the Portfolio) is a Massachusetts business trust registered under the Investment Company Act of 1940, as amended (the 1940 Act), as a diversified, open-end management investment company. The Portfolio’s investment objective is to achieve long-term capital appreciation by investing in a diversified portfolio of equity securities. The Declaration of Trust permits the Trustees to issue interests in the Portfolio. At June 30, 2014, Eaton Vance Large-Cap Core Research Fund and Eaton Vance Balanced Fund held an interest of 30.9% and 69.1%, respectively, in the Portfolio.
The following is a summary of significant accounting policies of the Portfolio. The policies are in conformity with accounting principles generally accepted in the United States of America.
A Investment Valuation — The following methodologies are used to determine the market value or fair value of investments.
Equity Securities. Equity securities (including common shares of closed-end investment companies) listed on a U.S. securities exchange generally are valued at the last sale or closing price on the day of valuation or, if no sales took place on such date, at the mean between the closing bid and asked prices therefore on the exchange where such securities are principally traded. Equity securities listed on the NASDAQ Global or Global Select Market generally are valued at the NASDAQ official closing price. Unlisted or listed securities for which closing sales prices or closing quotations are not available are valued at the mean between the latest available bid and asked prices.
Debt Obligations. Short-term obligations purchased with a remaining maturity of sixty days or less are generally valued at amortized cost, which approximates market value.
Derivatives. Exchange-traded options (other than FLexible EXchange traded options) are valued at the mean between the bid and asked prices at valuation time as reported by the Options Price Reporting Authority for U.S. listed options or by the relevant exchange or board of trade for non-U.S. listed options. Over-the-counter options and FLexible EXchange traded options traded at the Chicago Board Options Exchange are valued by a third party pricing service using techniques that consider factors including the value of the underlying instrument, the volatility of the underlying instrument and the period of time until option expiration.
Foreign Securities and Currencies. Foreign securities and currencies are valued in U.S. dollars, based on foreign currency exchange rate quotations supplied by a third party pricing service. The pricing service uses a proprietary model to determine the exchange rate. Inputs to the model include reported trades and implied bid/ask spreads. The daily valuation of exchange-traded foreign securities generally is determined as of the close of trading on the principal exchange on which such securities trade. Events occurring after the close of trading on foreign exchanges may result in adjustments to the valuation of foreign securities to more accurately reflect their fair value as of the close of regular trading on the New York Stock Exchange. When valuing foreign equity securities that meet certain criteria, the Portfolio’s Trustees have approved the use of a fair value service that values such securities to reflect market trading that occurs after the close of the applicable foreign markets of comparable securities or other instruments that have a strong correlation to the fair-valued securities.
Affiliated Fund. The Portfolio may invest in Eaton Vance Cash Reserves Fund, LLC (Cash Reserves Fund), an affiliated investment company managed by Eaton Vance Management (EVM). The value of the Portfolio’s investment in Cash Reserves Fund reflects the Portfolio’s proportionate interest in its net assets. Cash Reserves Fund generally values its investment securities utilizing the amortized cost valuation technique in accordance with Rule 2a-7 under the 1940 Act. This technique involves initially valuing a portfolio security at its cost and thereafter assuming a constant amortization to maturity of any discount or premium. If amortized cost is determined not to approximate fair value, Cash Reserves Fund may value its investment securities based on available market quotations provided by a third party pricing service.
Fair Valuation. Investments for which valuations or market quotations are not readily available or are deemed unreliable are valued at fair value using methods determined in good faith by or at the direction of the Trustees of the Portfolio in a manner that fairly reflects the security’s value, or the amount that the Portfolio might reasonably expect to receive for the security upon its current sale in the ordinary course. Each such determination is based on a consideration of relevant factors, which are likely to vary from one pricing context to another. These factors may include, but are not limited to, the type of security, the existence of any contractual restrictions on the security’s disposition, the price and extent of public trading in similar securities of the issuer or of comparable companies or entities, quotations or relevant information obtained from broker/dealers or other market participants, information obtained from the issuer, analysts, and/or the appropriate stock exchange (for exchange-traded securities), an analysis of the company’s or entity’s financial condition, and an evaluation of the forces that influence the issuer and the market(s) in which the security is purchased and sold.
B Investment Transactions — Investment transactions for financial statement purposes are accounted for on a trade date basis. Realized gains and losses on investments sold are determined on the basis of identified cost.
C Income — Dividend income is recorded on the ex-dividend date for dividends received in cash and/or securities. However, if the ex-dividend date has passed, certain dividends from foreign securities are recorded as the Portfolio is informed of the ex-dividend date. Withholding taxes on foreign dividends and capital gains have been provided for in accordance with the Portfolio’s understanding of the applicable countries’ tax rules and rates. Interest income is recorded on the basis of interest accrued, adjusted for amortization of premium or accretion of discount.
D Federal Taxes — The Portfolio has elected to be treated as a partnership for federal tax purposes. No provision is made by the Portfolio for federal or state taxes on any taxable income of the Portfolio because each investor in the Portfolio is ultimately responsible for the payment of any taxes on its share of taxable income. Since at least one of the Portfolio’s investors is a regulated investment company that invests all or substantially all of its assets in the
Large-Cap Core Research Portfolio
June 30, 2014
Notes to Financial Statements (Unaudited) — continued
Portfolio, the Portfolio normally must satisfy the applicable source of income and diversification requirements (under the Internal Revenue Code) in order for its investors to satisfy them. The Portfolio will allocate, at least annually among its investors, each investor’s distributive share of the Portfolio’s net investment income, net realized capital gains and any other items of income, gain, loss, deduction or credit.
As of June 30, 2014, the Portfolio had no uncertain tax positions that would require financial statement recognition, de-recognition, or disclosure. The Portfolio files a U.S. federal income tax return annually after its fiscal year-end, which is subject to examination by the Internal Revenue Service for a period of three years from the date of filing.
E Expense Reduction — State Street Bank and Trust Company (SSBT) serves as custodian of the Portfolio. Pursuant to the custodian agreement, SSBT receives a fee reduced by credits, which are determined based on the average daily cash balance the Portfolio maintains with SSBT. All credit balances, if any, used to reduce the Portfolio’s custodian fees are reported as a reduction of expenses in the Statement of Operations.
F Foreign Currency Translation — Investment valuations, other assets, and liabilities initially expressed in foreign currencies are translated each business day into U.S. dollars based upon current exchange rates. Purchases and sales of foreign investment securities and income and expenses denominated in foreign currencies are translated into U.S. dollars based upon currency exchange rates in effect on the respective dates of such transactions. Recognized gains or losses on investment transactions attributable to changes in foreign currency exchange rates are recorded for financial statement purposes as net realized gains and losses on investments. That portion of unrealized gains and losses on investments that results from fluctuations in foreign currency exchange rates is not separately disclosed.
G Use of Estimates — The preparation of the financial statements in conformity with accounting principles generally accepted in the United States of America requires management to make estimates and assumptions that affect the reported amounts of assets and liabilities at the date of the financial statements and the reported amounts of income and expense during the reporting period. Actual results could differ from those estimates.
H Indemnifications — Under the Portfolio’s organizational documents, its officers and Trustees may be indemnified against certain liabilities and expenses arising out of the performance of their duties to the Portfolio. Under Massachusetts law, if certain conditions prevail, interestholders in the Portfolio could be deemed to have personal liability for the obligations of the Portfolio. However, the Portfolio’s Declaration of Trust contains an express disclaimer of liability on the part of Portfolio interestholders and the By-laws provide that the Portfolio shall assume the defense on behalf of any Portfolio interestholder. Moreover, the By-laws also provide for indemnification out of Portfolio property of any interestholder held personally liable solely by reason of being or having been an interestholder for all loss or expense arising from such liability. Additionally, in the normal course of business, the Portfolio enters into agreements with service providers that may contain indemnification clauses. The Portfolio’s maximum exposure under these arrangements is unknown as this would involve future claims that may be made against the Portfolio that have not yet occurred.
I Written Options — Upon the writing of a call or a put option, the premium received by the Portfolio is included in the Statement of Assets and Liabilities as a liability. The amount of the liability is subsequently marked-to-market to reflect the current market value of the option written, in accordance with the Portfolio’s policies on investment valuations discussed above. Premiums received from writing options which expire are treated as realized gains. Premiums received from writing options which are exercised or are closed are added to or offset against the proceeds or amount paid on the transaction to determine the realized gain or loss. When an index option is exercised, the Portfolio is required to deliver an amount of cash determined by the excess of the strike price of the option over the value of the index (in the case of a put) or the excess of the value of the index over the strike price of the option (in the case of a call) at contract termination. If a put option on a security is exercised, the premium reduces the cost basis of the securities purchased by the Portfolio. The Portfolio, as a writer of an option, may have no control over whether the underlying securities or other assets may be sold (call) or purchased (put) and, as a result, bears the market risk of an unfavorable change in the price of the securities or other assets underlying the written option. The Portfolio may also bear the risk of not being able to enter into a closing transaction if a liquid secondary market does not exist.
J Purchased Options — Upon the purchase of a call or put option, the premium paid by the Portfolio is included in the Statement of Assets and Liabilities as an investment. The amount of the investment is subsequently marked-to-market to reflect the current market value of the option purchased, in accordance with the Portfolio’s policies on investment valuations discussed above. As the purchaser of an index option, the Portfolio has the right to receive a cash payment equal to any depreciation in the value of the index below the strike price of the option (in the case of a put) or equal to any appreciation in the value of the index over the strike price of the option (in the case of a call) as of the valuation date of the option. If an option which the Portfolio had purchased expires on the stipulated expiration date, the Portfolio will realize a loss in the amount of the cost of the option. If the Portfolio enters into a closing sale transaction, the Portfolio will realize a gain or loss, depending on whether the sales proceeds from the closing sale transaction are greater or less than the cost of the option. If the Portfolio exercises a put option on a security, it will realize a gain or loss from the sale of the underlying security, and the proceeds from such sale will be decreased by the premium originally paid. If the Portfolio exercises a call option on a security, the cost of the security which the Portfolio purchases upon exercise will be increased by the premium originally paid. The risk associated with purchasing options is limited to the premium originally paid.
K Interim Financial Statements — The interim financial statements relating to June 30, 2014 and for the six months then ended have not been audited by an independent registered public accounting firm, but in the opinion of the Portfolio’s management, reflect all adjustments, consisting only of normal recurring adjustments, necessary for the fair presentation of the financial statements.
Large-Cap Core Research Portfolio
June 30, 2014
Notes to Financial Statements (Unaudited) — continued
2 Investment Adviser Fee and Other Transactions with Affiliates
The investment adviser fee is earned by Boston Management and Research (BMR), a subsidiary of EVM, as compensation for investment advisory services rendered to the Portfolio. The fee is computed at an annual rate of 0.65% of the Portfolio’s average daily net assets up to $500 million, and is payable monthly. On net assets of $500 million and over, the annual fee is reduced. For the six months ended June 30, 2014, the Portfolio’s investment adviser fee amounted to $794,834 or 0.65% (annualized) of the Portfolio’s average daily net assets. The Portfolio invests its cash in Cash Reserves Fund. EVM does not currently receive a fee for advisory services provided to Cash Reserves Fund.
Trustees and officers of the Portfolio who are members of EVM’s or BMR’s organizations receive remuneration for their services to the Portfolio out of the investment adviser fee. Trustees of the Portfolio who are not affiliated with the investment adviser may elect to defer receipt of all or a percentage of their annual fees in accordance with the terms of the Trustees Deferred Compensation Plan. For the six months ended June 30, 2014, no significant amounts have been deferred. Certain officers and Trustees of the Portfolio are officers of the above organizations.
3 Purchases and Sales of Investments
Purchases and sales of investments, other than short-term obligations, aggregated $94,948,239 and $85,303,255, respectively, for the six months ended June 30, 2014.
4 Federal Income Tax Basis of Investments
The cost and unrealized appreciation (depreciation) of investments of the Portfolio at June 30, 2014, as determined on a federal income tax basis, were as follows:
| | | | |
| |
Aggregate cost | | $ | 205,921,618 | |
| |
Gross unrealized appreciation | | $ | 61,124,567 | |
Gross unrealized depreciation | | | (984,370 | ) |
| |
Net unrealized appreciation | | $ | 60,140,197 | |
5 Financial Instruments
The Portfolio may trade in financial instruments with off-balance sheet risk in the normal course of its investing activities. These financial instruments may include written options and may involve, to a varying degree, elements of risk in excess of the amounts recognized for financial statement purposes. The notional or contractual amounts of these instruments represent the investment the Portfolio has in particular classes of financial instruments and do not necessarily represent the amounts potentially subject to risk. The measurement of the risks associated with these instruments is meaningful only when all related and offsetting transactions are considered. A summary of written options at June 30, 2014 is included in the Portfolio of Investments.
Written options activity for the six months ended June 30, 2014 was as follows:
| | | | | | | | |
| | | Number of
Contracts | | | Premiums
Received | |
| | |
Outstanding, beginning of period | | | 213 | | | $ | 41,311 | |
Options written | | | 17,531 | | | | 1,125,942 | |
Options terminated in closing purchase transactions | | | (3,664 | ) | | | (361,855 | ) |
Options exercised | | | (546 | ) | | | (32,771 | ) |
Options expired | | | (11,987 | ) | | | (624,736 | ) |
| | |
Outstanding, end of period | | | 1,547 | | | $ | 147,891 | |
At June 30, 2014, the Portfolio had sufficient cash and/or securities to cover commitments under these contracts.
The Portfolio is subject to equity price risk in the normal course of pursuing its investment objective. During the six months ended June 30, 2014, the Portfolio entered into option transactions or a combination of option transactions on individual securities to seek return and/or to seek to reduce the Fund’s exposure to a decline in the stock price.
Large-Cap Core Research Portfolio
June 30, 2014
Notes to Financial Statements (Unaudited) — continued
The fair value of open derivative instruments (not considered to be hedging instruments for accounting disclosure purposes) and whose primary underlying risk exposure is equity price risk at June 30, 2014 was as follows:
| | | | | | | | |
| | | Fair Value | |
| Derivative | | Asset Derivative | | | Liability Derivative | |
| | |
Purchased options | | $ | 239,470 | (1) | | $ | — | |
Written options | | | — | | | | (121,373 | )(2) |
| | |
Total | | $ | 239,470 | | | $ | (121,373 | ) |
| (1) | Statement of Assets and Liabilities location: Unaffiliated investments, at value. |
| (2) | Statement of Assets and Liabilities location: Written options outstanding, at value. |
The effect of derivative instruments (not considered to be hedging instruments for accounting disclosure purposes) on the Statement of Operations and whose primary underlying risk exposure is equity price risk for the six months ended June 30, 2014 was as follows:
| | | | | | | | |
| Derivative | | Realized Gain (Loss) on Derivatives Recognized in Income(1) | | | Change in Unrealized Appreciation (Depreciation) on Derivatives Recognized in Income(2) | |
| | |
Purchased options | | $ | (120,941 | ) | | $ | (200,449 | ) |
Written options | | | 750,657 | | | | 18,372 | |
| | |
Total | | $ | 629,716 | | | $ | (182,077 | ) |
| (1) | Statement of Operations location: Net realized gain (loss) – Investment transactions and Written options, respectively. |
| (2) | Statement of Operations location: Change in unrealized appreciation (depreciation) – Investments and Written options, respectively. |
The average number of purchased options contracts outstanding during the six months ended June 30, 2014, which is indicative of the volume of this derivative type, was 2,020 contracts.
6 Line of Credit
The Portfolio participates with other portfolios and funds managed by EVM and its affiliates in a $750 million unsecured line of credit agreement with a group of banks. Borrowings are made by the Portfolio solely to facilitate the handling of unusual and/or unanticipated short-term cash requirements. Interest is charged to the Portfolio based on its borrowings at an amount above either the Eurodollar rate or Federal Funds rate. In addition, a fee computed at an annual rate of 0.08% on the daily unused portion of the line of credit is allocated among the participating portfolios and funds at the end of each quarter. Because the line of credit is not available exclusively to the Portfolio, it may be unable to borrow some or all of its requested amounts at any particular time. The Portfolio did not have any significant borrowings or allocated fees during the six months ended June 30, 2014.
7 Fair Value Measurements
Under generally accepted accounting principles for fair value measurements, a three-tier hierarchy to prioritize the assumptions, referred to as inputs, is used in valuation techniques to measure fair value. The three-tier hierarchy of inputs is summarized in the three broad levels listed below.
| Ÿ | | Level 1 – quoted prices in active markets for identical investments |
| Ÿ | | Level 2 – other significant observable inputs (including quoted prices for similar investments, interest rates, prepayment speeds, credit risk, etc.) |
| Ÿ | | Level 3 – significant unobservable inputs (including a fund’s own assumptions in determining the fair value of investments) |
In cases where the inputs used to measure fair value fall in different levels of the fair value hierarchy, the level disclosed is determined based on the lowest level input that is significant to the fair value measurement in its entirety. The inputs or methodology used for valuing securities are not necessarily an indication of the risk associated with investing in those securities.
Large-Cap Core Research Portfolio
June 30, 2014
Notes to Financial Statements (Unaudited) — continued
At June 30, 2014, the hierarchy of inputs used in valuing the Portfolio’s investments and open derivative instruments, which are carried at value, were as follows:
| | | | | | | | | | | | | | | | |
| Asset Description | | Level 1 | | | Level 2 | | | Level 3 | | | Total | |
| | | | |
Common Stocks | | | | | | | | | | | | | | | | |
Consumer Discretionary | | $ | 32,162,209 | | | $ | 1,538,941 | | | $ | — | | | $ | 33,701,150 | |
Consumer Staples | | | 23,156,931 | | | | — | | | | — | | | | 23,156,931 | |
Energy | | | 28,846,283 | | | | — | | | | — | | | | 28,846,283 | |
Financials | | | 41,463,034 | | | | — | | | | — | | | | 41,463,034 | |
Health Care | | | 35,438,857 | | | | — | | | | — | | | | 35,438,857 | |
Industrials | | | 27,360,573 | | | | — | | | | — | | | | 27,360,573 | |
Information Technology | | | 48,801,169 | | | | — | | | | — | | | | 48,801,169 | |
Materials | | | 9,001,935 | | | | — | | | | — | | | | 9,001,935 | |
Telecommunication Services | | | 6,083,737 | | | | — | | | | — | | | | 6,083,737 | |
Utilities | | | 8,315,343 | | | | — | | | | — | | | | 8,315,343 | |
| | | | |
Total Common Stocks | | $ | 260,630,071 | | | $ | 1,538,941 | * | | $ | — | | | $ | 262,169,012 | |
| | | | |
Call Options Purchased | | $ | 218,995 | | | $ | — | | | $ | — | | | $ | 218,995 | |
Put Options Purchased | | | 20,475 | | | | — | | | | — | | | | 20,475 | |
Short-Term Investments | | | — | | | | 3,653,333 | | | | — | | | | 3,653,333 | |
| | | | |
Total Investments | | $ | 260,869,541 | | | $ | 5,192,274 | | | $ | — | | | $ | 266,061,815 | |
| | | | |
Liability Description | | | | | | | | | | | | | | | | |
| | | | |
Call Options Written | | $ | (115,673 | ) | | $ | — | | | $ | — | | | $ | (115,673 | ) |
Put Options Written | | | (5,700 | ) | | | — | | | | — | | | | (5,700 | ) |
| | | | |
Total | | $ | (121,373 | ) | | $ | — | | | $ | — | | | $ | (121,373 | ) |
| * | Includes foreign equity securities whose values were adjusted to reflect market trading of comparable securities or other correlated instruments that occurred after the close of trading in their applicable foreign markets. |
The Portfolio held no investments or other financial instruments as of December 31, 2013 whose fair value was determined using Level 3 inputs. At June 30, 2014, there were no investments transferred between Level 1 and Level 2 during the six months then ended.
Eaton Vance Large-Cap Core Research Fund
Large-Cap Core Research Portfolio
June 30, 2014
Special Meeting of Shareholders (Unaudited)
Eaton Vance Large-Cap Core Research Fund
The Fund held a Special Meeting of Shareholders on May 29, 2014 to elect five Trustees. The results of the vote were as follows:
| | | | | | | | |
| Nominee for Trustee | | Number of Shares(1) | |
| | For | | | Withheld | |
Scott E. Eston | | | 3,750,214 | | | | 26,391 | |
Cynthia E. Frost | | | 3,750,214 | | | | 26,391 | |
George J. Gorman | | | 3,720,209 | | | | 56,396 | |
Valerie A. Mosley | | | 3,750,214 | | | | 26,391 | |
Harriett Tee Taggart | | | 3,750,214 | | | | 26,391 | |
Each nominee was also elected a Trustee of the Portfolio.
| (1) | Excludes fractional shares. |
Large-Cap Core Research Portfolio
The Portfolio held a Special Meeting of Interestholders on May 29, 2014 to elect five Trustees. The results of the vote were as follows:
| | | | | | | | |
| Nominee for Trustee | | Interest in the Portfolio | |
| | For | | | Withheld | |
Scott E. Eston | | | 98 | % | | | 2 | % |
Cynthia E. Frost | | | 98 | % | | | 2 | % |
George J. Gorman | | | 98 | % | | | 2 | % |
Valerie A. Mosley | | | 98 | % | | | 2 | % |
Harriett Tee Taggart | | | 98 | % | | | 2 | % |
Results are rounded to the nearest whole number.
Eaton Vance
Large-Cap Core Research Fund
June 30, 2014
Board of Trustees’ Contract Approval
Overview of the Contract Review Process
The Investment Company Act of 1940, as amended (the “1940 Act”), provides, in substance, that each investment advisory agreement between a fund and its investment adviser will continue in effect from year to year only if its continuation is approved at least annually by the fund’s board of trustees, including by a vote of a majority of the trustees who are not “interested persons” of the fund (“Independent Trustees”), cast in person at a meeting called for the purpose of considering such approval.
At a meeting of the Boards of Trustees (each a “Board”) of the Eaton Vance group of mutual funds (the “Eaton Vance Funds”) held on April 28, 2014, the Board, including a majority of the Independent Trustees, voted to approve continuation of existing advisory and sub-advisory agreements for the Eaton Vance Funds for an additional one-year period. In voting its approval, the Board relied upon the affirmative recommendation of the Contract Review Committee of the Board, which is a committee comprised exclusively of Independent Trustees. Prior to making its recommendation, the Contract Review Committee reviewed information furnished by each adviser to the Eaton Vance Funds (including information specifically requested by the Board) for a series of meetings of the Contract Review Committee held between February and April 2014, as well as information considered throughout the year at meetings of the Board and its committees. Such information included, among other things, the following:
Information about Fees, Performance and Expenses
| Ÿ | | An independent report comparing the advisory and related fees paid by each fund with fees paid by comparable funds; |
| Ÿ | | An independent report comparing each fund’s total expense ratio and its components to comparable funds; |
| Ÿ | | An independent report comparing the investment performance of each fund (including, where relevant, yield data, Sharpe ratios and information ratios) to the investment performance of comparable funds over various time periods; |
| Ÿ | | Data regarding investment performance in comparison to benchmark indices and customized peer groups identified by the adviser in consultation with the Board; |
| Ÿ | | For each fund, comparative information concerning the fees charged and the services provided by each adviser in managing other accounts (including mutual funds, other collective investment funds and institutional accounts) using investment strategies and techniques similar to those used in managing such fund; |
| Ÿ | | Profitability analyses for each adviser with respect to each fund; |
Information about Portfolio Management and Trading
| Ÿ | | Descriptions of the investment management services provided to each fund, including the investment strategies and processes employed, and any changes in portfolio management processes and personnel; |
| Ÿ | | Information about the allocation of brokerage and the benefits received by each adviser as a result of brokerage allocation, including information concerning the acquisition of research through client commission arrangements and the fund’s policies with respect to “soft dollar” arrangements; |
| Ÿ | | Data relating to portfolio turnover rates of each fund; |
| Ÿ | | The procedures and processes used to determine the fair value of fund assets and actions taken to monitor and test the effectiveness of such procedures and processes; |
| Ÿ | | Information about each adviser’s processes for monitoring best execution of portfolio transactions, and other policies and practices of each adviser with respect to trading; |
Information about each Adviser
| Ÿ | | Reports detailing the financial results and condition of each adviser; |
| Ÿ | | Descriptions of the qualifications, education and experience of the individual investment professionals whose responsibilities include portfolio management and investment research for the funds, and information relating to their compensation and responsibilities with respect to managing other mutual funds and investment accounts; |
| Ÿ | | Copies of the Codes of Ethics of each adviser and its affiliates, together with information relating to compliance with and the administration of such codes; |
| Ÿ | | Copies of or descriptions of each adviser’s policies and procedures relating to proxy voting, the handling of corporate actions and class actions; |
| Ÿ | | Information concerning the resources devoted to compliance efforts undertaken by each adviser and its affiliates on behalf of the funds (including descriptions of various compliance programs) and their record of compliance with investment policies and restrictions, including policies with respect to market-timing, late trading and selective portfolio disclosure, and with policies on personal securities transactions; |
| Ÿ | | Descriptions of the business continuity and disaster recovery plans of each adviser and its affiliates; |
| Ÿ | | A description of Eaton Vance Management’s procedures for overseeing third party advisers and sub-advisers, including with respect to regulatory and compliance issues, investment management and other matters; |
Eaton Vance
Large-Cap Core Research Fund
June 30, 2014
Board of Trustees’ Contract Approval — continued
Other Relevant Information
| Ÿ | | Information concerning the nature, cost and character of the administrative and other non-investment management services provided by Eaton Vance Management and its affiliates; |
| Ÿ | | Information concerning management of the relationship with the custodian, subcustodians and fund accountants by each adviser or the funds’ administrator; and |
| Ÿ | | The terms of each advisory agreement. |
Over the course of the twelve-month period ended April 30, 2014, with respect to one or more funds, the Board met nine times and the Contract Review Committee, the Audit Committee, the Governance Committee, the Portfolio Management Committee and the Compliance Reports and Regulatory Matters Committee, each of which is a Committee comprised solely of Independent Trustees, met seven, seventeen, eleven, six and ten times respectively. At such meetings, the Trustees participated in investment and performance reviews with the portfolio managers and other investment professionals of each adviser relating to each fund, and considered the investment and trading strategies used in pursuing each fund’s investment objective, including, where relevant, the use of derivative instruments, as well as processes for monitoring best execution of portfolio transactions and risk management techniques. The Board and its Committees also evaluated issues pertaining to industry and regulatory developments, compliance procedures, fund governance and other issues with respect to the funds, and received and participated in reports and presentations provided by Eaton Vance Management and other fund advisers with respect to such matters.
For funds that invest through one or more underlying portfolios, the Board considered similar information about the portfolio(s) when considering the approval of advisory agreements. In addition, in cases where the fund’s investment adviser has engaged a sub-adviser, the Board considered similar information about the sub-adviser when considering the approval of any sub-advisory agreement.
The Contract Review Committee was assisted throughout the contract review process by Goodwin Procter LLP, legal counsel for the Independent Trustees. The members of the Contract Review Committee relied upon the advice of such counsel and their own business judgment in determining the material factors to be considered in evaluating each advisory and sub-advisory agreement and the weight to be given to each such factor. The conclusions reached with respect to each advisory and sub-advisory agreement were based on a comprehensive evaluation of all the information provided and not any single factor. Moreover, each member of the Contract Review Committee may have placed varying emphasis on particular factors in reaching conclusions with respect to each advisory and sub-advisory agreement. In evaluating each advisory and sub-advisory agreement, including the specific fee structures and other terms of the agreements, the Contract Review Committee was informed by multiple years of analysis and discussion among the Independent Trustees and the Funds’ advisers and sub-advisers.
Results of the Process
Based on its consideration of the foregoing, and such other information as it deemed relevant, including the factors and conclusions described below, the Contract Review Committee concluded that the continuation of the investment advisory agreement of Large-Cap Core Research Portfolio (the “Portfolio”), the portfolio in which Eaton Vance Large-Cap Core Research Fund (the “Fund”) invests, with Boston Management and Research (the “Adviser”), an affiliate of Eaton Vance Management, including its fee structure, is in the interests of shareholders and, therefore, the Contract Review Committee recommended to the Board approval of the agreement. The Board accepted the recommendation of the Contract Review Committee as well as the factors considered and conclusions reached by the Contract Review Committee with respect to the agreement. Accordingly, the Board, including a majority of the Independent Trustees, voted to approve continuation of the investment advisory agreement for the Portfolio.
Nature, Extent and Quality of Services
In considering whether to approve the investment advisory agreement of the Portfolio, the Board evaluated the nature, extent and quality of services provided to the Portfolio by the Adviser.
The Board considered the Adviser’s management capabilities and investment process with respect to the types of investments held by the Portfolio, including the education, experience and number of its investment professionals and other personnel who provide portfolio management, investment research, and similar services to the Portfolio. The Board specifically noted that the Adviser has devoted extensive resources to in-house equity research and also draws upon independent research available from third-party sources. The Board also took into account the resources dedicated to portfolio management and other services, including the compensation methods of the Adviser to recruit and retain investment personnel, and the time and attention devoted to the Portfolio by senior management.
The Board reviewed the compliance programs of the Adviser and relevant affiliates thereof. Among other matters, the Board considered compliance and reporting matters relating to personal trading by investment personnel, selective disclosure of portfolio holdings, late trading, frequent trading, portfolio valuation, business continuity and the allocation of investment opportunities. The Board also evaluated the responses of the Adviser and its affiliates to requests in recent years from regulatory authorities such as the Securities and Exchange Commission and the Financial Industry Regulatory Authority.
Eaton Vance
Large-Cap Core Research Fund
June 30, 2014
Board of Trustees’ Contract Approval — continued
The Board considered shareholder and other administrative services provided or managed by Eaton Vance Management and its affiliates, including transfer agency and accounting services. The Board evaluated the benefits to shareholders of investing in a fund that is a part of a large family of funds, including the ability, in many cases, to exchange an investment among different funds without incurring additional sales charges.
After consideration of the foregoing factors, among others, the Board concluded that the nature, extent and quality of services provided by the Adviser, taken as a whole, are appropriate and consistent with the terms of the investment advisory agreement.
Fund Performance
The Board compared the Fund’s investment performance to a relevant universe of similarly managed funds identified by an independent data provider and appropriate benchmark indices. The Board reviewed comparative performance data for the one-, three-, five- and ten-year periods ended September 30, 2013 for the Fund. The Board considered various factors that contributed to the Fund’s relative underperformance during the three-year period, as well as the active and ongoing steps the Adviser had taken to improve performance, including changes in the equity group’s leadership, portfolio management staffing and analysts group. The Board concluded that it was satisfied with the steps taken by the Adviser to improve performance and that it was appropriate to allow additional time to evaluate the effectiveness of those steps.
Management Fees and Expenses
The Board reviewed contractual fee rates for investment advisory and administrative services payable by the Portfolio and by the Fund (referred to as “management fees”). As part of its review, the Board considered the management fees and the Fund’s total expense ratio for the year ended September 30, 2013, as compared to a group of similarly managed funds selected by an independent data provider. The Board noted that the Adviser had waived fees and/or paid expenses for the Fund. The Board also considered factors that had an impact on Fund expense ratios, as identified by management in response to inquiries from the Contract Review Committee, as well as actions taken by management in recent years to reduce expenses at the fund complex level, including the negotiation of reduced fees for transfer agency and custody services.
After reviewing the foregoing information, and in light of the nature, extent and quality of the services provided by the Adviser, the Board concluded that the management fees charged for advisory and related services are reasonable.
Profitability
The Board reviewed the level of profits realized by the Adviser and relevant affiliates thereof in providing investment advisory and administrative services to the Fund, to the Portfolio and to all Eaton Vance Funds as a group. The Board considered the level of profits realized without regard to revenue sharing or other payments by the Adviser and its affiliates to third parties in respect of distribution services. The Board also considered other direct or indirect benefits received by the Adviser and its affiliates in connection with their relationships with the Fund and the Portfolio, including the benefits of research services that may be available to the Adviser as a result of securities transactions effected for the Portfolio and other investment advisory clients.
The Board concluded that, in light of the foregoing factors and the nature, extent and quality of the services rendered, the profits realized by the Adviser and its affiliates are reasonable.
Economies of Scale
In reviewing management fees and profitability, the Board also considered the extent to which the Adviser and its affiliates, on the one hand, and the Fund and the Portfolio, on the other hand, can expect to realize benefits from economies of scale as the assets of the Fund and the Portfolio increase. The Board acknowledged the difficulty in accurately measuring the benefits resulting from the economies of scale with respect to the management of any specific fund or group of funds. The Board reviewed data summarizing the increases and decreases in the assets of the Fund and of all Eaton Vance Funds as a group over various time periods, and evaluated the extent to which the total expense ratio of the Fund and the profitability of the Adviser and its affiliates may have been affected by such increases or decreases. Based upon the foregoing, the Board concluded that the Fund currently shares in the benefits from economies of scale. The Board also concluded that, assuming reasonably foreseeable increases in the assets of the Fund and the Portfolio, the structure of the advisory fee, which includes breakpoints at several asset levels, will allow the Fund and the Portfolio to continue to benefit from economies of scale in the future.
Eaton Vance
Large-Cap Core Research Fund
June 30, 2014
Officers and Trustees
Officers of Eaton Vance Large-Cap Core Research Fund
Payson F. Swaffield
President
Maureen A. Gemma
Vice President, Secretary and
Chief Legal Officer
James F. Kirchner
Treasurer
Paul M. O’Neil
Chief Compliance Officer
Officers of Large-Cap Core Research Portfolio
Charles B. Gaffney
President
Maureen A. Gemma
Vice President, Secretary and
Chief Legal Officer
James F. Kirchner
Treasurer
Paul M. O’Neil
Chief Compliance Officer
Trustees of Eaton Vance Large-Cap Core Research Fund and Large-Cap Core Research Portfolio
Ralph F. Verni
Chairman
Scott E. Eston
Thomas E. Faust Jr.*
Cynthia E. Frost
George J. Gorman
Valerie A. Mosley
William H. Park
Ronald A. Pearlman
Helen Frame Peters
Harriett Tee Taggart
Eaton Vance Funds
IMPORTANT NOTICES
Privacy. The Eaton Vance organization is committed to ensuring your financial privacy. Each of the financial institutions identified below has in effect the following policy (“Privacy Policy”) with respect to nonpublic personal information about its customers:
| Ÿ | | Only such information received from you, through application forms or otherwise, and information about your Eaton Vance fund transactions will be collected. This may include information such as name, address, social security number, tax status, account balances and transactions. |
| Ÿ | | None of such information about you (or former customers) will be disclosed to anyone, except as permitted by law (which includes disclosure to employees necessary to service your account). In the normal course of servicing a customer’s account, Eaton Vance may share information with unaffiliated third parties that perform various required services such as transfer agents, custodians and broker-dealers. |
| Ÿ | | Policies and procedures (including physical, electronic and procedural safeguards) are in place that are designed to protect the confidentiality of such information. |
| Ÿ | | We reserve the right to change our Privacy Policy at any time upon proper notification to you. Customers may want to review our Privacy Policy periodically for changes by accessing the link on our homepage: www.eatonvance.com. |
Our pledge of privacy applies to the following entities within the Eaton Vance organization: the Eaton Vance Family of Funds, Eaton Vance Management, Eaton Vance Investment Counsel, Eaton Vance Distributors, Inc., Eaton Vance Trust Company, Eaton Vance Management’s Real Estate Investment Group and Boston Management and Research. In addition, our Privacy Policy applies only to those Eaton Vance customers who are individuals and who have a direct relationship with us. If a customer’s account (i.e., fund shares) is held in the name of a third-party financial advisor/broker-dealer, it is likely that only such advisor’s privacy policies apply to the customer. This notice supersedes all previously issued privacy disclosures. For more information about Eaton Vance’s Privacy Policy, please call 1-800-262-1122.
Delivery of Shareholder Documents. The Securities and Exchange Commission (SEC) permits funds to deliver only one copy of shareholder documents, including prospectuses, proxy statements and shareholder reports, to fund investors with multiple accounts at the same residential or post office box address. This practice is often called “householding” and it helps eliminate duplicate mailings to shareholders. Eaton Vance, or your financial advisor, may household the mailing of your documents indefinitely unless you instruct Eaton Vance, or your financial advisor, otherwise. If you would prefer that your Eaton Vance documents not be householded, please contact Eaton Vance at 1-800-262-1122, or contact your financial advisor. Your instructions that householding not apply to delivery of your Eaton Vance documents will be effective within 30 days of receipt by Eaton Vance or your financial advisor.
Portfolio Holdings. Each Eaton Vance Fund and its underlying Portfolio(s) (if applicable) will file a schedule of portfolio holdings on Form N-Q with the SEC for the first and third quarters of each fiscal year. The Form N-Q will be available on the Eaton Vance website at www.eatonvance.com, by calling Eaton Vance at 1-800-262-1122 or in the EDGAR database on the SEC’s website at www.sec.gov. Form N-Q may also be reviewed and copied at the SEC’s public reference room in Washington, D.C. (call 1-800-732-0330 for information on the operation of the public reference room).
Proxy Voting. From time to time, funds are required to vote proxies related to the securities held by the funds. The Eaton Vance Funds or their underlying Portfolios (if applicable) vote proxies according to a set of policies and procedures approved by the Funds’ and Portfolios’ Boards. You may obtain a description of these policies and procedures and information on how the Funds or Portfolios voted proxies relating to portfolio securities during the most recent 12-month period ended June 30, without charge, upon request, by calling 1-800-262-1122 and by accessing the SEC’s website at www.sec.gov.
Investment Adviser of Large-Cap Core Research Portfolio
Boston Management and Research
Two International Place
Boston, MA 02110
Administrator of Eaton Vance Large-Cap Core Research Fund
Eaton Vance Management
Two International Place
Boston, MA 02110
Principal Underwriter*
Eaton Vance Distributors, Inc.
Two International Place
Boston, MA 02110
(617) 482-8260
Custodian
State Street Bank and Trust Company
State Street Financial Center, One Lincoln Street
Boston, MA 02111
Transfer Agent
BNY Mellon Investment Servicing (US) Inc.
Attn: Eaton Vance Funds
P.O. Box 9653
Providence, RI 02940-9653
(800) 262-1122
Fund Offices
Two International Place
Boston, MA 02110
| * | FINRA BrokerCheck. Investors may check the background of their Investment Professional by contacting the Financial Industry Regulatory Authority (FINRA). FINRA BrokerCheck is a free tool to help investors check the professional background of current and former FINRA-registered securities firms and brokers. FINRA BrokerCheck is available by calling 1-800-289-9999 and at www.FINRA.org. The FINRA BrokerCheck brochure describing this program is available to investors at www.FINRA.org. |

Parametric Commodity Strategy Fund
Semiannual Report
June 30, 2014

Commodity Futures Trading Commission Registration. Effective December 31, 2012, the Commodity Futures Trading Commission (“CFTC”) adopted certain regulatory changes that subject registered investment companies and advisers to regulation by the CFTC if a fund invests more than a prescribed level of its assets in certain CFTC-regulated instruments (including futures, certain options and swap agreements) or markets itself as providing investment exposure to such instruments. The Fund is considered to be a commodity pool operator under CFTC regulations. The Fund’s adviser is registered with the CFTC as a commodity pool operator and a commodity trading advisor. The CFTC has neither reviewed nor approved the Fund’s investment strategies.
Fund shares are not insured by the FDIC and are not deposits or other obligations of, or guaranteed by, any depository institution. Shares are subject to investment risks, including possible loss of principal invested.
This report must be preceded or accompanied by a current summary prospectus or prospectus. Before investing, investors should consider carefully the investment objective, risks, and charges and expenses of a mutual fund. This and other important information is contained in the summary prospectus and prospectus, which can be obtained from a financial advisor. Prospective investors should read the prospectus carefully before investing. For further information, please call 1-800-260-0761.
Semiannual Report June 30, 2014
Parametric Commodity Strategy Fund
Table of Contents
| | | | |
Performance | | | 2 | |
| |
Fund Profile | | | 2 | |
| |
Endnotes and Additional Disclosures | | | 3 | |
| |
Fund Expenses | | | 4 | |
| |
Financial Statements | | | 5 | |
| |
Special Meeting of Shareholders | | | 19 | |
| |
Board of Trustees’ Contract Approval | | | 20 | |
| |
Officers and Trustees | | | 23 | |
| |
Important Notices | | | 24 | |
Parametric Commodity Strategy Fund
June 30, 2014
Performance1,2
Portfolio Managers David Stein, Ph.D., Thomas Seto and Timothy W. Atwill, CFA, each of Parametric Portfolio Associates, LLC
| | | | | | | | | | | | | | | | | | | | | | | | |
| % Average Annual Total Returns | | Class
Inception Date | | | Performance Inception Date | | | Six Months | | | One Year | | | Five Years | | | Since
Inception | |
Investor Class at NAV | | | 01/03/2012 | | | | 05/25/2011 | | | | 7.41 | % | | | 8.99 | % | | | — | | | | –5.30 | % |
Institutional Class at NAV | | | 05/25/2011 | | | | 05/25/2011 | | | | 7.51 | | | | 9.24 | | | | — | | | | –5.11 | |
Bloomberg Commodity Index Total Return | | | — | | | | — | | | | 7.08 | % | | | 8.21 | % | | | 1.98 | % | | | –6.07 | % |
| | | | | | |
| | | | | | | | | | | | | | | | | | | | | | | | |
| % Total Annual Operating Expense Ratios3 | | | | | Investor
Class | | | Institutional
Class | |
Gross | | | | | | | 1.39 | % | | | 1.14 | % |
Net | | | | | | | 0.95 | | | | 0.70 | |
Fund Profile
Commodity Exposure by Investment (% of net assets)
Commodity Exposure (% of net assets)4
| | | | | | | | | | |
Agriculture | | | 25.50 | % | | Industrial Metals | | | 25.14 | % |
Sugar | | | 3.76 | | | Copper | | | 7.71 | |
Wheat | | | 3.71 | | | Aluminum | | | 7.30 | |
Coffee | | | 3.68 | | | Nickel | | | 3.87 | |
Soybean Oil | | | 3.58 | | | Zinc | | | 3.60 | |
Corn | | | 3.54 | | | Lead | | | 1.79 | |
Soybeans | | | 3.49 | | | Tin | | | 0.87 | |
Cotton | | | 1.87 | | | | | | | |
Cocoa | | | 1.79 | | | Precious Metals | | | 17.74 | % |
Soybean Meal | | | 0.05 | | | Silver | | | 7.57 | |
Kansas Wheat | | | 0.03 | | | Gold | | | 7.51 | |
| | | | | | Platinum | | | 1.76 | |
Energy | | | 25.68 | % | | Palladium | | | 0.90 | |
GasOil | | | 7.41 | | | | | | | |
Unleaded Gasoline | | | 7.35 | | | Livestock | | | 5.92 | % |
Natural Gas | | | 7.16 | | | Live Cattle | | | 3.63 | |
Crude Oil-WTI | | | 1.85 | | | Lean Hogs | | | 1.82 | |
Crude Oil-Brent | | | 1.82 | | | Feeder Cattle | | | 0.47 | |
Heating Oil | | | 0.09 | | | | | | | |
See Endnotes and Additional Disclosures in this report.
Past performance is no guarantee of future results. Returns are historical and are calculated by determining the percentage change in net asset value (NAV) or offering price (as applicable) with all distributions reinvested. Investment return and principal value will fluctuate so that shares, when redeemed, may be worth more or less than their original cost. Performance less than one year is cumulative. Performance is for the stated time period only; due to market volatility, the Fund’s current performance may be lower or higher than quoted. Returns are before taxes unless otherwise noted. For performance as of the most recent month end, please refer to eatonvance.com.
Parametric Commodity Strategy Fund
June 30, 2014
Endnotes and Additional Disclosures
| 1 | Bloomberg Commodity Index Total Return is designed to provide diversified commodity exposure, with weightings based on each underlying commodity’s liquidity and economic significance. Prior to 7/1/14, this Index was named Dow Jones-UBS Commodity Index Total Return. Unless otherwise stated, index returns do not reflect the effect of any applicable sales charges, commissions, expenses, taxes or leverage, as applicable. It is not possible to invest directly in an index. |
| 2 | Returns are historical and are calculated by determining the percentage change in net asset value (NAV) with all distributions reinvested. Unless otherwise stated, performance does not reflect the deduction of taxes on Fund distributions or redemptions of Fund shares. |
| | Performance prior to the inception date of a class may be linked to the performance of an older class of the Fund. This linked performance is adjusted for any applicable sales charge, but is not adjusted for class expense differences. If adjusted for such differences, the performance would be different. Performance presented in the financial highlights included in the financial statements is not linked. In the performance table, the performance of Investor Class is linked to Institutional Class. Performance since inception for an index, if presented, is the performance since the Fund’s or oldest share class’ inception, as applicable. |
| 3 | Source: Fund prospectus. Net expense ratio reflects a contractual expense reimbursement that continues through 4/30/15. Without the reimbursement, if applicable, performance would have been lower. |
| 4 | Commodity Exposure reflects the Fund’s net exposure to commodities through its investment in commodity-linked derivative instruments. |
| | Fund profile subject to change due to active management. |
Parametric Commodity Strategy Fund
June 30, 2014
Fund Expenses
Example: As a Fund shareholder, you incur two types of costs: (1) transaction costs, including sales charges (loads) on purchases and redemption fees (if applicable); and (2) ongoing costs, including management fees; distribution and/or service fees; and other Fund expenses. This Example is intended to help you understand your ongoing costs (in dollars) of Fund investing and to compare these costs with the ongoing costs of investing in other mutual funds. The Example is based on an investment of $1,000 invested at the beginning of the period and held for the entire period (January 1, 2014 – June 30, 2014).
Actual Expenses: The first section of the table below provides information about actual account values and actual expenses. You may use the information in this section, together with the amount you invested, to estimate the expenses that you paid over the period. Simply divide your account value by $1,000 (for example, an $8,600 account value divided by $1,000 = 8.6), then multiply the result by the number in the first section under the heading entitled “Expenses Paid During Period” to estimate the expenses you paid on your account during this period.
Hypothetical Example for Comparison Purposes: The second section of the table below provides information about hypothetical account values and hypothetical expenses based on the actual Fund expense ratio and an assumed rate of return of 5% per year (before expenses), which is not the actual Fund return. The hypothetical account values and expenses may not be used to estimate the actual ending account balance or expenses you paid for the period. You may use this information to compare the ongoing costs of investing in your Fund and other funds. To do so, compare this 5% hypothetical example with the 5% hypothetical examples that appear in the shareholder reports of the other funds.
Please note that the expenses shown in the table are meant to highlight your ongoing costs only and do not reflect any transactional costs, such as sales charges (loads) or redemption fees (if applicable). Therefore, the second section of the table is useful in comparing ongoing costs only, and will not help you determine the relative total costs of owning different funds. In addition, if these transactional costs were included, your costs would be higher.
| | | | | | | | | | | | | | | | |
| | | Beginning
Account Value
(1/1/14) | | | Ending
Account Value
(6/30/14) | | | Expenses Paid
During Period*
(1/1/14 – 6/30/14) | | | Annualized
Expense
Ratio | |
| | | | |
| | | | | | | | | | | | | | | | |
Actual | | | | | | | | | | | | | | | | |
Investor Class | | $ | 1,000.00 | | | $ | 1,074.10 | | | $ | 5.14 | ** | | | 1.00 | % |
Institutional Class | | $ | 1,000.00 | | | $ | 1,075.10 | | | $ | 3.86 | ** | | | 0.75 | % |
| | | | | | | | | | | | | | | | | |
| | | | |
| | | | | | | | | | | | | | | | |
Hypothetical | | | | | | | | | | | | | | | | |
(5% return per year before expenses) | | | | | | | | | | | | | | | | |
Investor Class | | $ | 1,000.00 | | | $ | 1,019.80 | | | $ | 5.01 | ** | | | 1.00 | % |
Institutional Class | | $ | 1,000.00 | | | $ | 1,021.10 | | | $ | 3.76 | ** | | | 0.75 | % |
| * | Expenses are equal to the Fund’s annualized expense ratio for the indicated Class, multiplied by the average account value over the period, multiplied by 181/365 (to reflect the one-half year period). The Example assumes that the $1,000 was invested at the net asset value per share determined at the close of business on December 31, 2013. |
| ** | Absent an allocation of certain expenses to affiliates, expenses would be higher. |
Parametric Commodity Strategy Fund
June 30, 2014
Consolidated Portfolio of Investments (Unaudited)
| | | | | | | | |
| Exchange-Traded Notes (ETN) — 2.4% | |
| | |
| | | | | | | | |
| Security | | Units | | | Value | |
| | | | | | | | |
iPath Dow Jones-UBS Commodity Index Total Return ETN (Barclays Bank PLC), 0%, 6/12/36(1) | | | 63,769 | | | $ | 2,515,049 | |
| | |
| |
Total Exchange-Traded Notes
(identified cost $2,555,375) | | | $ | 2,515,049 | |
| | |
|
| Short-Term Investments — 95.7% | |
|
| U.S. Treasury Obligations — 84.7% | |
| | |
| | | | | | | | |
| Security | | Principal
Amount
(000’s omitted) | | | Value | |
U.S. Treasury Bill, 0.00%, 7/24/14 | | $ | 4,000 | | | $ | 3,999,972 | |
U.S. Treasury Bill, 0.00%, 8/21/14 | | | 2,000 | | | | 1,999,954 | |
U.S. Treasury Bill, 0.00%, 9/18/14 | | | 5,000 | | | | 4,999,820 | |
U.S. Treasury Bill, 0.00%, 10/16/14 | | | 12,230 | | | | 12,228,545 | |
U.S. Treasury Bill, 0.00%, 11/13/14(2) | | | 20,000 | | | | 19,996,540 | |
U.S. Treasury Bill, 0.00%, 12/11/14 | | | 13,000 | | | | 12,997,283 | |
U.S. Treasury Bill, 0.00%, 1/8/15(2) | | | 30,750 | | | | 30,743,665 | |
| | |
| |
Total U.S. Treasury Obligations
(identified cost $86,951,363) | | | $ | 86,965,779 | |
| | | | | | | | | |
|
| Other — 11.0% | |
| | |
| | | | | | | | |
| Description | | Interest
(000’s omitted) | | | Value | |
Eaton Vance Cash Reserves Fund, LLC, 0.12%(3) | | $ | 11,310 | | | $ | 11,309,859 | |
| | |
| |
Total Other
(identified cost $11,309,859) | | | $ | 11,309,859 | |
| | |
| |
Total Short-Term Investments
(identified cost $98,261,222) | | | $ | 98,275,638 | |
| | |
| |
Total Investments — 98.1%
(identified cost $100,816,597) | | | $ | 100,790,687 | |
| | |
| |
Other Assets, Less Liabilities — 1.9% | | | $ | 1,941,130 | |
| | |
| | |
Net Assets — 100.0% | | | | | | $ | 102,731,817 | |
| | | | | | | | | |
The percentage shown for each investment category in the Consolidated Portfolio of Investments is based on net assets.
| (1) | Security does not guarantee any return of principal at maturity, upon redemption or otherwise, and does not pay any interest during its term. Cash payment at maturity or upon early redemption is based on the performance of the indicated index less an investor fee. Security is also subject to credit risk of the indicated issuer. |
| (2) | Security (or a portion thereof) has been pledged as collateral for open swap contracts. |
| (3) | Affiliated investment company, available to Eaton Vance portfolios and funds, which invests in high quality, U.S. dollar denominated money market instruments. The rate shown is the annualized seven-day yield as of June 30, 2014. |
| | | | |
| | 5 | | See Notes to Consolidated Financial Statements. |
Parametric Commodity Strategy Fund
June 30, 2014
Consolidated Statement of Assets and Liabilities (Unaudited)
| | | | |
| Assets | | June 30, 2014 | |
Unaffiliated investments, at value (identified cost, $89,506,738) | | $ | 89,480,828 | |
Affiliated investment, at value (identified cost, $11,309,859) | | | 11,309,859 | |
Interest receivable from affiliated investment | | | 1,456 | |
Receivable for investments sold | | | 37,946 | |
Receivable for Fund shares sold | | | 143,333 | |
Receivable for open swap contracts | | | 1,162,370 | |
Receivable for closed swap contracts | | | 1,276,907 | |
Total assets | | $ | 103,412,699 | |
|
| Liabilities | |
Payable for Fund shares redeemed | | $ | 132,626 | |
Payable for open swap contracts | | | 410,870 | |
Payable to affiliates: | | | | |
Investment adviser and administration fee | | | 50,083 | |
Distribution and service fees | | | 517 | |
Trustees’ fees | | | 1,028 | |
Other | | | 22,147 | |
Accrued expenses | | | 63,611 | |
Total liabilities | | $ | 680,882 | |
Net Assets | | $ | 102,731,817 | |
|
| Sources of Net Assets | |
Paid-in capital | | $ | 96,671,053 | |
Accumulated net realized gain | | | 5,642,745 | |
Accumulated net investment loss | | | (307,571 | ) |
Net unrealized appreciation | | | 725,590 | |
Total | | $ | 102,731,817 | |
|
| Investor Class Shares | |
Net Assets | | $ | 2,563,439 | |
Shares Outstanding | | | 315,763 | |
Net Asset Value, Offering Price and Redemption Price Per Share | | | | |
(net assets ÷ shares of beneficial interest outstanding) | | $ | 8.12 | |
|
| Institutional Class Shares | |
Net Assets | | $ | 100,168,378 | |
Shares Outstanding | | | 12,276,051 | |
Net Asset Value, Offering Price and Redemption Price Per Share | | | | |
(net assets ÷ shares of beneficial interest outstanding) | | $ | 8.16 | |
| | | | |
| | 6 | | See Notes to Consolidated Financial Statements. |
Parametric Commodity Strategy Fund
June 30, 2014
Consolidated Statement of Operations (Unaudited)
| | | | |
| Investment Income | | Six Months Ended June 30, 2014 | |
Interest | | $ | 38,494 | |
Interest allocated from affiliated investment | | | 11,829 | |
Expenses allocated from affiliated investment | | | (1,572 | ) |
Total investment income | | $ | 48,751 | |
| |
| Expenses | | | | |
Investment adviser and administration fee | | $ | 283,613 | |
Distribution and service fees | | | | |
Investor Class | | | 3,080 | |
Trustees’ fees and expenses | | | 2,180 | |
Custodian fee | | | 85,940 | |
Transfer and dividend disbursing agent fees | | | 8,971 | |
Legal and accounting services | | | 49,902 | |
Printing and postage | | | 11,498 | |
Registration fees | | | 22,414 | |
Miscellaneous | | | 8,590 | |
Total expenses | | $ | 476,188 | |
Deduct — | | | | |
Allocation of expenses to affiliates | | $ | 119,829 | |
Reduction of custodian fee | | | 37 | |
Total expense reductions | | $ | 119,866 | |
| |
Net expenses | | $ | 356,322 | |
| |
Net investment loss | | $ | (307,571 | ) |
| |
| Realized and Unrealized Gain (Loss) | | | | |
Net realized gain (loss) — | | | | |
Investment transactions | | $ | 65,775 | |
Investment transactions allocated from affiliated investment | | | 138 | |
Swap contracts | | | 6,589,756 | |
Net realized gain | | $ | 6,655,669 | |
Change in unrealized appreciation (depreciation) — | | | | |
Investments | | $ | 1,819 | |
Swap contracts | | | 544,861 | |
Net change in unrealized appreciation (depreciation) | | $ | 546,680 | |
| |
Net realized and unrealized gain | | $ | 7,202,349 | |
| |
Net increase in net assets from operations | | $ | 6,894,778 | |
| | | | |
| | 7 | | See Notes to Consolidated Financial Statements. |
Parametric Commodity Strategy Fund
June 30, 2014
Consolidated Statements of Changes in Net Assets
| | | | | | | | |
| Increase (Decrease) in Net Assets | | Six Months Ended
June 30, 2014
(Unaudited) | | | Year Ended
December 31, 2013 | |
From operations — | | | | | | | | |
Net investment loss | | $ | (307,571 | ) | | $ | (551,941 | ) |
Net realized gain (loss) from investment transactions and swap contracts | | | 6,655,669 | | | | (10,330,517 | ) |
Net change in unrealized appreciation (depreciation) from investments and swap contracts | | | 546,680 | | | | 774,825 | |
Net increase (decrease) in net assets from operations | | $ | 6,894,778 | | | $ | (10,107,633 | ) |
Transactions in shares of beneficial interest — | | | | | | | | |
Proceeds from sale of shares | | | | | | | | |
Investor Class | | $ | 412,935 | | | $ | 2,474,130 | |
Institutional Class | | | 27,169,099 | | | | 102,407,690 | |
Cost of shares redeemed | | | | | | | | |
Investor Class | | | (304,961 | ) | | | (658,815 | ) |
Institutional Class | | | (17,793,423 | ) | | | (87,383,612 | ) |
Net increase in net assets from Fund share transactions | | $ | 9,483,650 | | | $ | 16,839,393 | |
| | |
Net increase in net assets | | $ | 16,378,428 | | | $ | 6,731,760 | |
|
| Net Assets | |
At beginning of period | | $ | 86,353,389 | | | $ | 79,621,629 | |
At end of period | | $ | 102,731,817 | | | $ | 86,353,389 | |
|
Accumulated net investment loss
included in net assets | |
At end of period | | $ | (307,571 | ) | | $ | — | |
| | | | |
| | 8 | | See Notes to Consolidated Financial Statements. |
Parametric Commodity Strategy Fund
June 30, 2014
Consolidated Financial Highlights
| | | | | | | | | | | | |
| | | Investor Class | |
| | | Six Months Ended
June 30, 2014
(Unaudited) | | | Year Ended
December 31, 2013 | | | Period Ended
December 31, 2012(1) | |
Net asset value — Beginning of period | | $ | 7.560 | | | $ | 8.460 | | | $ | 8.800 | |
| |
| Income (Loss) From Operations | | | | | |
Net investment loss(2) | | $ | (0.035 | ) | | $ | (0.068 | ) | | $ | (0.076 | ) |
Net realized and unrealized gain (loss) | | | 0.595 | | | | (0.832 | ) | | | 0.052 | |
| | | |
Total income (loss) from operations | | $ | 0.560 | | | $ | (0.900 | ) | | $ | (0.024 | ) |
| |
| Less Distributions | | | | | |
From net investment income | | $ | — | | | $ | — | | | $ | (0.081 | ) |
From net realized gain | | | — | | | | — | | | | (0.003 | ) |
Tax return of capital | | | — | | | | — | | | | (0.232 | ) |
| | | |
Total distributions | | $ | — | | | $ | — | | | $ | (0.316 | ) |
| | | |
Net asset value — End of period | | $ | 8.120 | | | $ | 7.560 | | | $ | 8.460 | |
| | | |
Total Return(3) | | | 7.41 | %(4) | | | (10.64 | )% | | | (0.27 | )%(4) |
| |
| Ratios/Supplemental Data | | | | | |
Net assets, end of period (000’s omitted) | | $ | 2,563 | | | $ | 2,280 | | | $ | 683 | |
Ratios (as a percentage of average daily net assets): | | | | | | | | | | | | |
Expenses(5)(6) | | | 1.00 | %(7) | | | 1.00 | % | | | 1.00 | %(7) |
Net investment loss | | | (0.89 | )%(7) | | | (0.87 | )% | | | (0.87 | )%(7) |
Portfolio Turnover | | | 460 | %(4)(8) | | | 2,797 | %(8) | | | 3,455 | %(8)(9) |
| (1) | For the period from the commencement of operations, January 3, 2012, to December 31, 2012. |
| (2) | Computed using average shares outstanding. |
| (3) | Returns are historical and are calculated by determining the percentage change in net asset value with all distributions reinvested and do not reflect the effect of sales charges, if any. |
| (5) | The investment adviser and administrator and sub-adviser reimbursed certain operating expenses (equal to 0.25%, 0.39% and 0.43% of average daily net assets for the six months ended June 30, 2014, the year ended December 31, 2013 and the period ended December 31, 2012, respectively). |
| (6) | Excludes the effect of custody fee credits, if any, of less than 0.005%. |
| (8) | Excluding the Fund’s investment in exchange-traded notes, which are used as temporary cash investments but offer commodity exposure, the portfolio turnover would be 0%. |
| (9) | For the year ended December 31, 2012. |
| | | | |
| | 9 | | See Notes to Consolidated Financial Statements. |
Parametric Commodity Strategy Fund
June 30, 2014
Consolidated Financial Highlights — continued
| | | | | | | | | | | | | | | | |
| | | Institutional Class | |
| | | Six Months Ended
June 30, 2014
(Unaudited) | | | Year Ended December 31, | | | Period Ended
December 31, 2011(1) | |
| | | | 2013 | | | 2012 | | |
Net asset value — Beginning of period | | $ | 7.590 | | | $ | 8.470 | | | $ | 8.600 | | | $ | 10.000 | |
| |
| Income (Loss) From Operations | | | | | |
Net investment loss(2) | | $ | (0.025 | ) | | $ | (0.049 | ) | | $ | (0.055 | ) | | $ | (0.038 | ) |
Net realized and unrealized gain (loss) | | | 0.595 | | | | (0.831 | ) | | | 0.252 | | | | (1.339 | ) |
| | | | |
Total income (loss) from operations | | $ | 0.570 | | | $ | (0.880 | ) | | $ | 0.197 | | | $ | (1.377 | ) |
| | |
| Less Distributions | | | | | | | | | |
From net investment income | | $ | — | | | $ | — | | | $ | (0.084 | ) | | $ | (0.023 | ) |
From net realized gain | | | — | | | | — | | | | (0.003 | ) | | | — | |
Tax return of capital | | | — | | | | — | | | | (0.240 | ) | | | — | |
| | | | |
Total distributions | | $ | — | | | $ | — | | | $ | (0.327 | ) | | $ | (0.023 | ) |
| | | | |
Net asset value — End of period | | $ | 8.160 | | | $ | 7.590 | | | $ | 8.470 | | | $ | 8.600 | |
| | | | |
Total Return(3) | | | 7.51 | %(4) | | | (10.39 | )% | | | 2.30 | % | | | (13.77 | )%(4)(5) |
| | |
| Ratios/Supplemental Data | | | | | | | | | |
Net assets, end of period (000’s omitted) | | $ | 100,168 | | | $ | 84,073 | | | $ | 78,938 | | | $ | 29,701 | |
Ratios (as a percentage of average daily net assets): | | | | | | | | | | | | | | | | |
Expenses(6)(7) | | | 0.75 | %(8) | | | 0.75 | % | | | 0.75 | % | | | 0.75 | %(8) |
Net investment loss | | | (0.64 | )%(8) | | | (0.62 | )% | | | (0.63 | )% | | | (0.67 | )%(8) |
Portfolio Turnover | | | 460 | %(4)(9) | | | 2,797 | %(9) | | | 3,455 | %(9) | | | 1,732 | %(4)(9) |
| (1) | For the period from the start of business, May 25, 2011, to December 31, 2011. |
| (2) | Computed using average shares outstanding. |
| (3) | Returns are historical and are calculated by determining the percentage change in net asset value with all distributions reinvested. |
| (5) | During the period ended December 31, 2011, the Fund received a payment made by an affiliate for a trading error which amounted to $0.024 per share. Had the Fund not received this payment, total return would have been lower by 0.20%. |
| (6) | The investment adviser and administrator and sub-adviser reimbursed certain operating expenses (equal to 0.25%, 0.39%, 0.43% and 1.90% of average daily net assets for the six months ended June 30, 2014, the years ended December 31, 2013 and 2012 and the period ended December 31, 2011, respectively). |
| (7) | Excludes the effect of custody fee credits, if any, of less than 0.005%. |
| (9) | Excluding the Fund’s investment in exchange-traded notes, which are used as temporary cash investments but offer commodity exposure, the portfolio turnover would be 0%. |
| | | | |
| | 10 | | See Notes to Consolidated Financial Statements. |
Parametric Commodity Strategy Fund
June 30, 2014
Notes to Consolidated Financial Statements (Unaudited)
1 Significant Accounting Policies
Parametric Commodity Strategy Fund (the Fund) is a diversified series of Eaton Vance Mutual Funds Trust (the Trust). The Trust is a Massachusetts business trust registered under the Investment Company Act of 1940, as amended (the 1940 Act), as an open-end management investment company. The Fund’s investment objective is to seek total return. The Fund offers two classes of shares. Investor Class and Institutional Class shares are sold at net asset value and are not subject to a sales charge. Each class represents a pro-rata interest in the Fund, but votes separately on class-specific matters and (as noted below) is subject to different expenses. Realized and unrealized gains and losses and net investment income and losses, other than class-specific expenses, are allocated daily to each class of shares based on the relative net assets of each class to the total net assets of the Fund. Each class of shares differs in its distribution plan and certain other class-specific expenses.
The Fund seeks to gain exposure to the commodity markets, in whole or in part, through investments in PSC Commodity Subsidiary, Ltd. (the Subsidiary), a wholly-owned subsidiary of the Fund organized under the laws of the Cayman Islands with the same objective and investment policies and restrictions as the Fund. The Fund may invest up to 25% of its total assets in the Subsidiary. The net assets of the Subsidiary at June 30, 2014 were $18,279,899 or 17.8% of the Fund’s consolidated net assets. The accompanying consolidated financial statements include the accounts of the Subsidiary. Intercompany balances and transactions have been eliminated in consolidation.
The following is a summary of significant accounting policies of the Fund. The policies are in conformity with accounting principles generally accepted in the United States of America.
A Investment Valuation — The following methodologies are used to determine the market value or fair value of investments.
Debt Obligations. Debt obligations (including short-term obligations with a remaining maturity of more than sixty days) are generally valued on the basis of valuations provided by third party pricing services, as derived from such services’ pricing models. Inputs to the models may include, but are not limited to, reported trades, executable bid and asked prices, broker/dealer quotations, prices or yields of securities with similar characteristics, benchmark curves or information pertaining to the issuer, as well as industry and economic events. The pricing services may use a matrix approach, which considers information regarding securities with similar characteristics to determine the valuation for a security. Exchange-traded notes are valued at the last sale price on the primary market or exchange on which they are traded on the day of valuation. Short-term obligations purchased with a remaining maturity of sixty days or less are generally valued at amortized cost, which approximates market value.
Derivatives. Total return swaps are valued using valuations provided by a third party pricing service based on the value of the underlying index or instrument and reference interest rate.
Affiliated Fund. The Fund may invest in Eaton Vance Cash Reserves Fund, LLC (Cash Reserves Fund), an affiliated investment company managed by Eaton Vance Management (EVM). The value of the Fund’s investment in Cash Reserves Fund reflects the Fund’s proportionate interest in its net assets. Cash Reserves Fund generally values its investment securities utilizing the amortized cost valuation technique in accordance with Rule 2a-7 under the 1940 Act. This technique involves initially valuing a portfolio security at its cost and thereafter assuming a constant amortization to maturity of any discount or premium. If amortized cost is determined not to approximate fair value, Cash Reserves Fund may value its investment securities in the same manner as debt obligations described above.
Fair Valuation. Investments for which valuations or market quotations are not readily available or are deemed unreliable are valued at fair value using methods determined in good faith by or at the direction of the Trustees of the Fund in a manner that fairly reflects the security’s value, or the amount that the Fund might reasonably expect to receive for the security upon its current sale in the ordinary course. Each such determination is based on a consideration of relevant factors, which are likely to vary from one pricing context to another. These factors may include, but are not limited to, the type of security, the existence of any contractual restrictions on the security’s disposition, the price and extent of public trading in similar securities of the issuer or of comparable companies or entities, quotations or relevant information obtained from broker/dealers or other market participants, information obtained from the issuer, analysts, and/or the appropriate stock exchange (for exchange-traded securities), an analysis of the company’s or entity’s financial condition, and an evaluation of the forces that influence the issuer and the market(s) in which the security is purchased and sold.
B Investment Transactions — Investment transactions for financial statement purposes are accounted for on a trade date basis. Realized gains and losses on investments sold are determined on the basis of identified cost.
C Income — Interest income is recorded on the basis of interest accrued, adjusted for amortization of premium or accretion of discount.
D Federal Taxes — The Fund’s policy is to comply with the provisions of the Internal Revenue Code applicable to regulated investment companies and to distribute to shareholders each year substantially all of its net investment income, and all or substantially all of its net realized capital gains. Accordingly, no provision for federal income or excise tax is necessary.
At December 31, 2013, the Fund, for federal income tax purposes, had deferred capital losses of $66,518 which will reduce its taxable income arising from future net realized gains on investment transactions, if any, to the extent permitted by the Internal Revenue Code, and thus will reduce the amount of distributions to shareholders, which would otherwise be necessary to relieve the Fund of any liability for federal income or excise tax. The deferred capital losses are treated as arising on the first day of the Fund’s next taxable year.
Parametric Commodity Strategy Fund
June 30, 2014
Notes to Consolidated Financial Statements (Unaudited) — continued
The Subsidiary is treated as a controlled foreign corporation under the Internal Revenue Code and is not expected to be subject to U.S. federal income tax. The Fund is treated as a U.S. shareholder of the Subsidiary. As a result, the Fund is required to include in gross income for U.S. federal income tax purposes all of the Subsidiary’s income, whether or not such income is distributed by the Subsidiary. If a net loss is realized by the Subsidiary, such loss is not generally available to offset the income earned by the Fund.
As of June 30, 2014, the Fund had no uncertain tax positions that would require financial statement recognition, de-recognition, or disclosure. The Fund files a U.S. federal income tax return annually after its fiscal year-end, which is subject to examination by the Internal Revenue Service for a period of three years from the date of filing.
E Expenses — The majority of expenses of the Trust are directly identifiable to an individual fund. Expenses which are not readily identifiable to a specific fund are allocated taking into consideration, among other things, the nature and type of expense and the relative size of the funds.
F Expense Reduction — State Street Bank and Trust Company (SSBT) serves as custodian of the Fund. Pursuant to the custodian agreement, SSBT receives a fee reduced by credits, which are determined based on the average daily cash balance the Fund maintains with SSBT. All credit balances, if any, used to reduce the Fund’s custodian fees are reported as a reduction of expenses in the Consolidated Statement of Operations.
G Use of Estimates — The preparation of the consolidated financial statements in conformity with accounting principles generally accepted in the United States of America requires management to make estimates and assumptions that affect the reported amounts of assets and liabilities at the date of the consolidated financial statements and the reported amounts of income and expense during the reporting period. Actual results could differ from those estimates.
H Indemnifications — Under the Trust’s organizational documents, its officers and Trustees may be indemnified against certain liabilities and expenses arising out of the performance of their duties to the Fund. Under Massachusetts law, if certain conditions prevail, shareholders of a Massachusetts business trust (such as the Trust) could be deemed to have personal liability for the obligations of the Trust. However, the Trust’s Declaration of Trust contains an express disclaimer of liability on the part of Fund shareholders and the By-laws provide that the Trust shall assume the defense on behalf of any Fund shareholders. Moreover, the By-laws also provide for indemnification out of Fund property of any shareholder held personally liable solely by reason of being or having been a shareholder for all loss or expense arising from such liability. Additionally, in the normal course of business, the Fund enters into agreements with service providers that may contain indemnification clauses. The Fund’s maximum exposure under these arrangements is unknown as this would involve future claims that may be made against the Fund that have not yet occurred.
I Total Return Swaps — In a total return swap, the buyer receives a periodic return equal to the total return of a specified security, securities or index for a specified period of time. In return, the buyer pays the counterparty a fixed or variable stream of payments, typically based upon short-term interest rates, possibly plus or minus an agreed upon spread. During the term of the outstanding swap agreement, changes in the underlying value of the swap are recorded as unrealized gains and losses. Periodic payments received or made are recorded as realized gains or losses. The Fund is exposed to credit loss in the event of nonperformance by the swap counterparty. Risk may also arise from the unanticipated movements in value of exchange rates, interest rates, securities, or the index.
J Interim Consolidated Financial Statements — The interim consolidated financial statements relating to June 30, 2014 and for the six months then ended have not been audited by an independent registered public accounting firm, but in the opinion of the Fund’s management, reflect all adjustments, consisting only of normal recurring adjustments, necessary for the fair presentation of the consolidated financial statements.
2 Distributions to Shareholders
It is the present policy of the Fund to make at least one distribution annually (normally in December) of all or substantially all of its net investment income and to distribute annually all or substantially all of its net realized capital gains. Distributions to shareholders are recorded on the ex-dividend date. Distributions are declared separately for each class of shares. Shareholders may reinvest income and capital gain distributions in additional shares of the same class of the Fund at the net asset value as of the ex-dividend date or, at the election of the shareholder, receive distributions in cash. The Fund distinguishes between distributions on a tax basis and a financial reporting basis. Accounting principles generally accepted in the United States of America require that only distributions in excess of tax basis earnings and profits be reported in the consolidated financial statements as a return of capital. Permanent differences between book and tax accounting relating to distributions are reclassified to paid-in capital. For tax purposes, distributions from short-term capital gains are considered to be from ordinary income.
3 Investment Adviser and Administration Fee and Other Transactions with Affiliates
The investment adviser and administration fee is earned by EVM as compensation for investment advisory and administrative services rendered to the Fund and the Subsidiary. Pursuant to the investment advisory and administrative agreement between the Trust and EVM and the investment advisory agreement between the Subsidiary and EVM, the Fund and Subsidiary pay EVM an aggregate fee at an annual rate of 0.60% of the Fund’s consolidated average daily net assets up to $500 million and at reduced rates on consolidated net assets of $500 million and over, and is payable monthly. For the six months ended June 30, 2014, the investment adviser and administration fee amounted to $283,613 or 0.60% (annualized) of the Fund’s consolidated average daily net assets. Pursuant to a sub-advisory agreement, EVM has delegated the investment management of the Fund to Parametric Portfolio Associates LLC
Parametric Commodity Strategy Fund
June 30, 2014
Notes to Consolidated Financial Statements (Unaudited) — continued
(Parametric), a majority-owned subsidiary of Eaton Vance Corp. EVM pays Parametric a portion of its advisory and administration fee for sub-advisory services provided to the Fund. EVM and Parametric have agreed to reimburse the Fund’s expenses, including expenses of the Subsidiary, to the extent that total annual operating expenses (relating to ordinary operating expenses only) exceed 1.00% and 0.75% (0.95% and 0.70% effective July 10, 2014) of the Fund’s consolidated average daily net assets of Investor Class and Institutional Class, respectively. This agreement may be changed or terminated at any time after April 30, 2015. Pursuant to this agreement, EVM and Parametric were allocated $119,829 in total of the Fund’s operating expenses for the six months ended June 30, 2014.
EVM provides sub-transfer agency and related services to the Fund pursuant to a Sub-Transfer Agency Support Services Agreement. For the six months ended June 30, 2014, EVM earned $125 from the Fund pursuant to such agreement, which is included in transfer and dividend disbursing agent fees on the Statement of Operations. Eaton Vance Distributors, Inc. (EVD), an affiliate of EVM and the Fund’s principal underwriter, received distribution and service fees from Investor Class (see Note 4).
Trustees and officers of the Fund who are members of EVM’s organization receive remuneration for their services to the Fund out of the investment adviser and administration fee. Trustees of the Fund who are not affiliated with EVM may elect to defer receipt of all or a percentage of their annual fees in accordance with the terms of the Trustees Deferred Compensation Plan. For the six months ended June 30, 2014, no significant amounts have been deferred. Certain officers and Trustees of the Fund are officers of the above organizations.
4 Distribution Plan
The Fund has in effect a distribution plan for Investor Class shares (Investor Class Plan) pursuant to Rule 12b-1 under the 1940 Act. Pursuant to the Investor Class Plan, the Fund pays EVD a distribution and service fee of 0.25% per annum of its average daily net assets attributable to Investor Class shares for distribution services and facilities provided to the Fund by EVD, as well as for personal services and/or the maintenance of shareholder accounts. Distribution and service fees paid or accrued to EVD for the six months ended June 30, 2014 amounted to $3,080 for Investor Class shares.
Distribution and service fees are subject to the limitations contained in the Financial Industry Regulatory Authority’s NASD Conduct Rule 2830(d).
5 Purchases and Sales of Investments
Purchases and sales of investments, other than short-term obligations, aggregated $8,711,938 and $8,851,553, respectively, for the six months ended June 30, 2014.
6 Shares of Beneficial Interest
The Fund’s Declaration of Trust permits the Trustees to issue an unlimited number of full and fractional shares of beneficial interest (without par value). Such shares may be issued in a number of different series (such as the Fund) and classes. Transactions in Fund shares were as follows:
| | | | | | | | |
| Investor Class | | Six Months Ended
June 30, 2014
(Unaudited) | | | Year Ended
December 31, 2013 | |
| | |
Sales | | | 52,745 | | | | 304,669 | |
Redemptions | | | (38,711 | ) | | | (83,745 | ) |
| | |
Net increase | | | 14,034 | | | | 220,924 | |
| | |
| | | | | | | | |
| Institutional Class | | Six Months Ended
June 30, 2014
(Unaudited) | | | Year Ended
December 31, 2013 | |
| | |
Sales | | | 3,445,368 | | | | 12,972,219 | |
Redemptions | | | (2,251,199 | ) | | | (11,213,671 | ) |
| | |
Net increase | | | 1,194,169 | | | | 1,758,548 | |
Parametric Commodity Strategy Fund
June 30, 2014
Notes to Consolidated Financial Statements (Unaudited) — continued
7 Federal Income Tax Basis of Investments
The cost and unrealized appreciation (depreciation) of investments of the Fund, including the Subsidiary, at June 30, 2014, as determined on a federal income tax basis, were as follows:
| | | | |
| |
Aggregate cost | | $ | 100,821,716 | |
| |
Gross unrealized appreciation | | $ | 9,296 | |
Gross unrealized depreciation | | | (40,325 | ) |
| |
Net unrealized depreciation | | $ | (31,029 | ) |
8 Financial Instruments
The Fund may trade in financial instruments with off-balance sheet risk in the normal course of its investing activities. These financial instruments may include swap contracts and may involve, to a varying degree, elements of risk in excess of the amounts recognized for financial statement purposes. The notional or contractual amounts of these instruments represent the investment the Fund has in particular classes of financial instruments and do not necessarily represent the amounts potentially subject to risk. The measurement of the risks associated with these instruments is meaningful only when all related and offsetting transactions are considered.
A summary of obligations under these financial instruments at June 30, 2014 is as follows:
| | | | | | | | | | | | | | | | | | | | | | |
| Total Return Swaps | |
| Counterparty | | Notional
Amount | | | Fund
Pays/Receives
Return on
Reference
Index | | Reference Index | | Fund
Pays/Receives
Rate | | Rate | | | Expiration
Date | | | Net Unrealized
Appreciation
(Depreciation) | |
| | | | | | | |
| Barclays Bank PLC | | $ | 454,303 | | | Receives | | Excess Return on S&P GSCI 1 Month Forward Crude Oil Index | | Pays | | | 0.13 | % | | | 7/7/14 | | | $ | 16,774 | |
| Barclays Bank PLC | | | 481,170 | | | Receives | | Excess Return on S&P GSCI 1 Month Forward Brent Crude Index | | Pays | | | 0.14 | | | | 7/7/14 | | | | 23,574 | |
| Barclays Bank PLC | | | 2,686,419 | | | Receives | | Excess Return on S&P GSCI 1 Month Forward GasOil Index | | Pays | | | 0.14 | | | | 7/7/14 | | | | 94,770 | |
| Barclays Bank PLC | | | 2,494,862 | | | Receives | | Excess Return on S&P GSCI 1 Month Forward Unleaded Gasoline Index | | Pays | | | 0.14 | | | | 7/7/14 | | | | 126,001 | |
| Barclays Bank PLC | | | 303,487 | | | Receives | | Excess Return on Dow Jones-UBS Tin Subindex Index | | Pays | | | 0.15 | | | | 7/7/14 | | | | (8,906 | ) |
| Barclays Bank PLC | | | 2,491,107 | | | Receives | | Excess Return on S&P GSCI 1 Month Forward Aluminum Index | | Pays | | | 0.15 | | | | 7/7/14 | | | | 65,552 | |
| Barclays Bank PLC | | | 325,000 | | | Receives | | Excess Return on S&P GSCI 1 Month Forward Copper Index | | Pays | | | 0.15 | | | | 7/7/14 | | | | 9,489 | |
| Barclays Bank PLC | | | 2,497,953 | | | Receives | | Excess Return on S&P GSCI 1 Month Forward Copper Index | | Pays | | | 0.15 | | | | 7/7/14 | | | | 87,982 | |
| Barclays Bank PLC | | | 2,442,354 | | | Receives | | Excess Return on S&P GSCI 1 Month Forward Gold Index | | Pays | | | 0.15 | | | | 7/7/14 | | | | 152,268 | |
| Barclays Bank PLC | | | 615,859 | | | Receives | | Excess Return on S&P GSCI 1 Month Forward Lead Index | | Pays | | | 0.15 | | | | 7/7/14 | | | | 18,368 | |
| Barclays Bank PLC | | | 350,000 | | | Receives | | Excess Return on S&P GSCI 1 Month Forward Nickel Index | | Pays | | | 0.15 | | | | 7/7/14 | | | | 12,048 | |
Parametric Commodity Strategy Fund
June 30, 2014
Notes to Consolidated Financial Statements (Unaudited) — continued
| | | | | | | | | | | | | | | | | | | | | | |
| Total Return Swaps (continued) | |
| Counterparty | | Notional
Amount | | | Fund
Pays/Receives
Return on
Reference
Index | | Reference Index | | Fund
Pays/Receives
Rate | | Rate | | | Expiration
Date | | | Net Unrealized
Appreciation
(Depreciation) | |
| | | | | | | |
| Barclays Bank PLC | | $ | 1,132,184 | | | Receives | | Excess Return on S&P GSCI 1 Month Forward Nickel Index | | Pays | | | 0.15 | % | | | 7/7/14 | | | $ | (502 | ) |
| Barclays Bank PLC | | | 2,545,588 | | | Receives | | Excess Return on S&P GSCI 1 Month Forward Silver Index | | Pays | | | 0.15 | | | | 7/7/14 | | | | 300,666 | |
| Barclays Bank PLC | | | 1,146,274 | | | Receives | | Excess Return on S&P GSCI 1 Month Forward Zinc Index | | Pays | | | 0.15 | | | | 7/7/14 | | | | 74,327 | |
| Barclays Bank PLC | | | 322,770 | | | Receives | | Excess Return on S&P GSCI Palladium Index | | Pays | | | 0.15 | | | | 7/7/14 | | | | 2,280 | |
| Barclays Bank PLC | | | 582,119 | | | Receives | | Excess Return on S&P GSCI Platinum Index | | Pays | | | 0.15 | | | | 7/7/14 | | | | 19,570 | |
| Barclays Bank PLC | | | 167,352 | | | Receives | | Excess Return on S&P GSCI 1 Month Forward Feeder Cattle Index | | Pays | | | 0.20 | | | | 7/7/14 | | | | 12,284 | |
| Barclays Bank PLC | | | 557,830 | | | Receives | | Excess Return on S&P GSCI 1 Month Forward Lean Hogs Index | | Pays | | | 0.20 | | | | 7/7/14 | | | | 33,831 | |
| Barclays Bank PLC | | | 1,147,316 | | | Receives | | Excess Return on S&P GSCI 1 Month Forward Live Cattle Index | | Pays | | | 0.20 | | | | 7/7/14 | | | | 80,800 | |
| Barclays Bank PLC | | | 2,384,963 | | | Receives | | Excess Return on S&P GSCI Enhanced Natural Gas Official Close Index | | Pays | | | 0.23 | | | | 7/7/14 | | | | (90,912 | ) |
| Barclays Bank PLC | | | 1,201,515 | | | Receives | | Excess Return on Dow Jones-UBS 3 Month Forward Soybean Oil Index | | Pays | | | 0.25 | | | | 7/7/14 | | | | (7,830 | ) |
| Barclays Bank PLC | | | 624,293 | | | Receives | | Excess Return on S&P GSCI 1 Month Forward Cocoa Index | | Pays | | | 0.25 | | | | 7/7/14 | | | | 7,982 | |
| Barclays Bank PLC | | | 1,263,437 | | | Receives | | Excess Return on S&P GSCI 1 Month Forward Coffee Index | | Pays | | | 0.25 | | | | 7/7/14 | | | | 18,081 | |
| Barclays Bank PLC | | | 1,134,798 | | | Receives | | Excess Return on S&P GSCI 1 Month Forward Corn Index | | Pays | | | 0.25 | | | | 7/7/14 | | | | (84,255 | ) |
| Barclays Bank PLC | | | 722,139 | | | Receives | | Excess Return on S&P GSCI 1 Month Forward Cotton Index | | Pays | | | 0.25 | | | | 7/7/14 | | | | (40,645 | ) |
| Barclays Bank PLC | | | 1,099,798 | | | Receives | | Excess Return on S&P GSCI 1 Month Forward Soybeans Index | | Pays | | | 0.25 | | | | 7/7/14 | | | | (54,399 | ) |
| Barclays Bank PLC | | | 1,333,903 | | | Receives | | Excess Return on S&P GSCI 1 Month Forward Sugar Index | | Pays | | | 0.25 | | | | 7/7/14 | | | | 5,723 | |
| Barclays Bank PLC | | | 1,434,136 | | | Receives | | Excess Return on S&P GSCI 1 Month Forward Wheat Index | | Pays | | | 0.25 | | | | 7/7/14 | | | | (109,242 | ) |
| Merrill Lynch International | | | 65,506,782 | | | Receives | | Excess Return on 1 Month Merrill Lynch MLBX PBR2 Custom Index(1)(2) | | Pays | | | 0.23 | | | | 9/30/14 | | | | (14,179 | ) |
| |
| | | | $ | 751,500 | |
| (1) | Represents a custom index created by Merrill Lynch intended to replicate the commodity strategy of the Fund, and is based on a basket of underlying commodity future indices as follows: |
Parametric Commodity Strategy Fund
June 30, 2014
Notes to Consolidated Financial Statements (Unaudited) — continued
| | | | | | | | |
| Commodity | | Index | | | % Weight | |
| | |
Natural Gas | | | SGECNGP | | | | 7.38 | % |
Crude Oil (WTI) | | | SG1MCLP | | | | 1.84 | % |
Brent Crude | | | SG1MBRP | | | | 1.84 | % |
Unleaded Gasoline | | | SG1MHUP | | | | 7.38 | % |
GasOil | | | SG1MGOP | | | | 7.37 | % |
Live Cattle | | | SG1MLCP | | | | 3.69 | % |
Lean Hogs | | | SG1MLHP | | | | 1.84 | % |
Feeder Cattle | | | SG1MFCP | | | | 0.46 | % |
Wheat (Chicago) | | | SG1MWHP | | | | 3.69 | % |
Corn | | | SG1MCNP | | | | 3.69 | % |
Soybeans | | | SG1MSOP | | | | 3.69 | % |
Soybean Oil | | | DJUBSBO3 | | | | 3.69 | % |
Aluminum | | | SG1MIAP | | | | 7.37 | % |
| | | | | | | | |
| Commodity | | Index | | | % Weight | |
| | |
Copper (LME) | | | SG1MICP | | | | 7.37 | % |
Zinc | | | SG1MIZP | | | | 3.69 | % |
Nickel | | | SG1MIKP | | | | 3.69 | % |
Lead | | | SG1MILP | | | | 1.84 | % |
Tin | | | DJUBSSN | | | | 0.92 | % |
Gold | | | SG1MGCP | | | | 7.37 | % |
Silver | | | SG1MSIP | | | | 7.37 | % |
Platinum | | | SPGCPLP | | | | 1.84 | % |
Palladium | | | SPGCPAP | | | | 0.92 | % |
Sugar | | | SG1MSBP | | | | 3.69 | % |
Cotton | | | SG1MCTP | | | | 1.84 | % |
Coffee | | | SG1MKCP | | | | 3.69 | % |
Cocoa | | | SG1MCCP | | | | 1.84 | % |
| (2) | Swap is subject to optional notional adjustments prior to the termination date whereby the Fund may decrease the notional amount upon notification to the counterparty or increase the notional amount upon mutual agreement with the counterparty. |
| | | | |
| LME | | – | | London Metal Exchange |
| WTI | | – | | West Texas Intermediate |
At June 30, 2014, the Fund had sufficient cash and/or securities to cover commitments under these contracts.
The Fund is subject to commodity risk in the normal course of pursuing its investment objective. Commodity risk is the risk that the value of a commodity or commodity index will fluctuate based on increases or decreases in the commodities market and factors specific to a particular industry or commodity. The Fund invests primarily in commodities-linked derivative investments, including total return swaps based on a commodity index, and commodity exchange-traded notes that provide exposure to the investment returns of the commodities markets, without investing directly in physical commodities.
The Fund enters into swap contracts that may contain provisions whereby the counterparty may terminate the contract under certain conditions, including but not limited to a decline in the Fund’s net assets below a certain level over a certain period of time, which may trigger a payment by the Fund for those derivatives in a liability position. At June 30, 2014, the fair value of derivatives with credit-related contingent features in a net liability position was $410,870. The aggregate fair value of assets pledged as collateral by the Fund for such liability was $3,167,383 at June 30, 2014.
The over-the-counter (OTC) derivatives in which the Fund invests are subject to the risk that the counterparty to the contract fails to perform its obligations under the contract. To mitigate this risk, the Fund (and Subsidiary) has entered into an International Swaps and Derivatives Association, Inc. Master Agreement (“ISDA Master Agreement”) or similar agreement with substantially all its derivative counterparties. An ISDA Master Agreement is a bilateral agreement between the Fund and a counterparty that governs certain OTC derivatives and typically contains, among other things, set-off provisions in the event of a default and/or termination event as defined under the relevant ISDA Master Agreement. Under an ISDA Master Agreement, the Fund (and Subsidiary) may, under certain circumstances, offset with the counterparty certain derivative financial instruments’ payables and/or receivables with collateral held and/or posted and create one single net payment. The provisions of the ISDA Master Agreement typically permit a single net payment in the event of default including the bankruptcy or insolvency of the counterparty. However, bankruptcy or insolvency laws of a particular jurisdiction may impose restrictions on or prohibitions against the right of offset in bankruptcy or insolvency. Certain ISDA Master Agreements allow counterparties to OTC derivatives to terminate derivative contracts prior to maturity in the event the Fund’s net assets decline by a stated percentage or the Fund fails to meet the terms of its ISDA Master Agreements, which would cause the counterparty to accelerate payment by the Fund of any net liability owed to it.
The collateral requirements for derivatives traded under an ISDA Master Agreement are governed by a Credit Support Annex to the ISDA Master Agreement. Collateral requirements are determined at the close of business each day and are typically based on changes in market values for each transaction under an ISDA Master Agreement and netted into one amount for such agreement. Generally, the amount of collateral due from or to a counterparty is subject to a minimum transfer threshold amount before a transfer is required, which may vary by counterparty. Collateral pledged for the benefit of the Fund (and Subsidiary) and/or counterparty is held in segregated accounts by the Fund’s custodian and cannot be sold, re-pledged, assigned or otherwise used while pledged. The portion of such collateral representing cash, if any, is reflected as restricted cash and, in the case of cash pledged by a counterparty for the benefit of the Fund, a corresponding liability on the Consolidated Statement of Assets and Liabilities. Securities pledged by the Fund as collateral, if any, are identified as such in the Consolidated Portfolio of Investments. Because the Subsidiary is not registered under the 1940 Act, it may not be able to negotiate terms with its counterparties that are equivalent to those a registered portfolio may negotiate. As a result, the Subsidiary may have greater exposure to those counterparties than a registered portfolio.
Parametric Commodity Strategy Fund
June 30, 2014
Notes to Consolidated Financial Statements (Unaudited) — continued
The fair value of open derivative instruments (not considered to be hedging instruments for accounting disclosure purposes) and whose primary underlying risk exposure is commodity risk at June 30, 2014 was as follows:
| | | | | | | | |
| | | Fair Value | |
| Derivative | | Asset Derivative | | | Liability Derivative | |
| | |
Swap contracts | | $ | 1,162,370 | (1) | | $ | (410,870 | )(2) |
| | |
Total Derivatives subject to master netting or similar agreements | | $ | 1,162,370 | | | $ | (410,870 | ) |
| (1) | Consolidated Statement of Assets and Liabilities location: Receivable for open swap contracts; Net unrealized appreciation. |
| (2) | Consolidated Statement of Assets and Liabilities location: Payable for open swap contracts; Net unrealized appreciation. |
The Fund’s derivative assets and liabilities at fair value by type, which are reported gross in the Consolidated Statement of Assets and Liabilities, are presented in the table above. The following tables present the Fund’s derivative assets and liabilities by counterparty, net of amounts available for offset under a master netting agreement and net of the related collateral received by the Fund (and Subsidiary) for assets and pledged by the Fund (and Subsidiary) for liabilities as of June 30, 2014.
| | | | | | | | | | | | | | | | | | | | |
| Counterparty | | Derivative
Assets Subject to
Master Netting
Agreement | | | Derivatives
Available
for Offset | | | Non-cash
Collateral
Received(a) | | | Cash
Collateral
Received(a) | | | Net Amount
of Derivative
Assets(b) | |
| | | | | |
Barclays Bank PLC | | $ | 1,162,370 | | | $ | (396,691 | ) | | $ | — | | | $ | — | | | $ | 765,679 | |
| | | | | |
| | | | | | | | | | | | | | | | | | | | |
| Counterparty | | Derivative
Liabilities Subject to
Master Netting
Agreement | | | Derivatives
Available
for Offset | | | Non-cash
Collateral
Pledged(a) | | | Cash
Collateral
Pledged(a) | | | Net Amount
of Derivative
Liabilities(c) | |
| | | | | |
Barclays Bank PLC | | $ | (396,691 | ) | | $ | 396,691 | | | $ | — | | | $ | — | | | $ | — | |
Merrill Lynch International | | | (14,179 | ) | | | — | | | | 14,179 | | | | — | | | | — | |
| | | | | |
| | | $ | (410,870 | ) | | $ | 396,691 | | | $ | 14,179 | | | $ | — | | | $ | — | |
| (a) | In some instances, the actual collateral received and/or pledged may be more than the amount shown due to overcollateralization. |
| (b) | Net amount represents the net amount due from the counterparty in the event of default. |
| (c) | Net amount represents the net amount payable to the counterparty in the event of default. |
The effect of derivative instruments (not considered to be hedging instruments for accounting disclosure purposes) on the Consolidated Statement of Operations and whose primary underlying risk exposure is commodity risk for the six months ended June 30, 2014 was as follows:
| | | | | | | | |
| Derivative | | Realized Gain (Loss)
on Derivatives Recognized
in Income | | | Change in Unrealized Appreciation (Depreciation) on
Derivatives Recognized in Income | |
| | |
Swap contracts | | $ | 6,589,756 | (1) | | $ | 544,861 | (2) |
| (1) | Consolidated Statement of Operations location: Net realized gain (loss) – Swap contracts. |
| (2) | Consolidated Statement of Operations location: Change in unrealized appreciation (depreciation) – Swap contracts. |
The average notional amount of swap contracts outstanding during the six months ended June 30, 2014, which is indicative of the volume of this derivative type, was approximately $92,726,000.
Parametric Commodity Strategy Fund
June 30, 2014
Notes to Consolidated Financial Statements (Unaudited) — continued
9 Line of Credit
The Fund participates with other portfolios and funds managed by EVM and its affiliates in a $750 million unsecured line of credit agreement with a group of banks. Borrowings are made by the Fund solely to facilitate the handling of unusual and/or unanticipated short-term cash requirements. Interest is charged to the Fund based on its borrowings at an amount above either the Eurodollar rate or Federal Funds rate. In addition, a fee computed at an annual rate of 0.08% on the daily unused portion of the line of credit is allocated among the participating portfolios and funds at the end of each quarter. Because the line of credit is not available exclusively to the Fund, it may be unable to borrow some or all of its requested amounts at any particular time. The Fund did not have any significant borrowings or allocated fees during the six months ended June 30, 2014.
10 Risks Associated with Commodities
The commodities which underlie commodity-linked derivatives in which the Fund invests may be subject to additional economic and non-economic variables, such as drought, floods, weather, livestock disease, embargoes, tariffs, and international economic, political and regulatory developments. These factors may have a larger impact on commodity prices and commodity-linked instruments than on traditional securities. Certain commodities are also subject to limited pricing flexibility because of supply and demand factors. Others are subject to broad price fluctuations as a result of the volatility of the prices for certain raw materials and the instability of supplies of other materials. These additional variables may create additional investment risks which subject the Fund’s investments to greater volatility than investments in traditional securities.
11 Fair Value Measurements
Under generally accepted accounting principles for fair value measurements, a three-tier hierarchy to prioritize the assumptions, referred to as inputs, is used in valuation techniques to measure fair value. The three-tier hierarchy of inputs is summarized in the three broad levels listed below.
| Ÿ | | Level 1 – quoted prices in active markets for identical investments |
| Ÿ | | Level 2 – other significant observable inputs (including quoted prices for similar investments, interest rates, prepayment speeds, credit risk, etc.) |
| Ÿ | | Level 3 – significant unobservable inputs (including a fund’s own assumptions in determining the fair value of investments) |
In cases where the inputs used to measure fair value fall in different levels of the fair value hierarchy, the level disclosed is determined based on the lowest level input that is significant to the fair value measurement in its entirety. The inputs or methodology used for valuing securities are not necessarily an indication of the risk associated with investing in those securities.
At June 30, 2014, the hierarchy of inputs used in valuing the Fund’s investments and open derivative instruments, which are carried at value, were as follows:
| | | | | | | | | | | | | | | | |
| Asset Description | | Level 1 | | | Level 2 | | | Level 3 | | | Total | |
| | | | |
Exchange-Traded Notes | | $ | 2,515,049 | | | $ | — | | | $ | — | | | $ | 2,515,049 | |
Short-Term Investments — | | | | | | | | | | | | | | | | |
U.S. Treasury Obligations | | | — | | | | 86,965,779 | | | | — | | | | 86,965,779 | |
Other | | | — | | | | 11,309,859 | | | | — | | | | 11,309,859 | |
| | | | |
Total Investments | | $ | 2,515,049 | | | $ | 98,275,638 | | | $ | — | | | $ | 100,790,687 | |
| | | | |
Swap Contracts | | $ | — | | | $ | 1,162,370 | | | $ | — | | | $ | 1,162,370 | |
| | | | |
Total | | $ | 2,515,049 | | | $ | 99,438,008 | | | $ | — | | | $ | 101,953,057 | |
| | | | |
Liability Description | | | | | | | | | | | | | | | | |
| | | | |
Swap Contracts | | $ | — | | | $ | (410,870 | ) | | $ | — | | | $ | (410,870 | ) |
| | | | |
Total | | $ | — | | | $ | (410,870 | ) | | $ | — | | | $ | (410,870 | ) |
The Fund held no investments or other financial instruments as of December 31, 2013 whose fair value was determined using Level 3 inputs. At June 30, 2014, there were no investments transferred between Level 1 and Level 2 during the six months then ended.
Parametric Commodity Strategy Fund
June 30, 2014
Special Meeting of Shareholders (Unaudited)
The Fund held a Special Meeting of Shareholders on May 29, 2014 to elect five Trustees. The results of the vote were as follows:
| | | | | | | | |
| | | Number of Shares(1) | |
| Nominee for Trustee | | For | | | Withheld | |
Scott E. Eston | | | 11,786,255 | | | | 1,014 | |
Cynthia E. Frost | | | 11,786,255 | | | | 1,014 | |
George J. Gorman | | | 11,786,255 | | | | 1,014 | |
Valerie A. Mosley | | | 11,786,255 | | | | 1,014 | |
Harriett Tee Taggart | | | 11,786,255 | | | | 1,014 | |
| (1) | Excludes fractional shares. |
Parametric Commodity Strategy Fund
June 30, 2014
Board of Trustees’ Contract Approval
Overview of the Contract Review Process
The Investment Company Act of 1940, as amended (the “1940 Act”), provides, in substance, that each investment advisory agreement between a fund and its investment adviser will continue in effect from year to year only if its continuation is approved at least annually by the fund’s board of trustees, including by a vote of a majority of the trustees who are not “interested persons” of the fund (“Independent Trustees”), cast in person at a meeting called for the purpose of considering such approval.
At a meeting of the Boards of Trustees (each a “Board”) of the mutual funds advised, administered and/or distributed by Eaton Vance Management or its affiliates (the “Eaton Vance Funds”) held on April 28, 2014, the Board, including a majority of the Independent Trustees, voted to approve continuation of existing advisory and sub-advisory agreements for the Eaton Vance Funds for an additional one-year period. In voting its approval, the Board relied upon the affirmative recommendation of the Contract Review Committee of the Board, which is a committee comprised exclusively of Independent Trustees. Prior to making its recommendation, the Contract Review Committee reviewed information furnished by each adviser to the Eaton Vance Funds (including information specifically requested by the Board) for a series of meetings of the Contract Review Committee held between February and April 2014, as well as information considered throughout the year at meetings of the Board and its committees. Such information included, among other things, the following:
Information about Fees, Performance and Expenses
| Ÿ | | An independent report comparing the advisory and related fees paid by each fund with fees paid by comparable funds; |
| Ÿ | | An independent report comparing each fund’s total expense ratio and its components to comparable funds; |
| Ÿ | | An independent report comparing the investment performance of each fund (including, where relevant, yield data, Sharpe ratios and information ratios) to the investment performance of comparable funds over various time periods; |
| Ÿ | | Data regarding investment performance in comparison to benchmark indices and customized peer groups identified by the adviser in consultation with the Board; |
| Ÿ | | For each fund, comparative information concerning the fees charged and the services provided by each adviser in managing other accounts (including mutual funds, other collective investment funds and institutional accounts) using investment strategies and techniques similar to those used in managing such fund; |
| Ÿ | | Profitability analyses for each adviser with respect to each fund; |
Information about Portfolio Management and Trading
| Ÿ | | Descriptions of the investment management services provided to each fund, including the investment strategies and processes employed, and any changes in portfolio management processes and personnel; |
| Ÿ | | Information about the allocation of brokerage and the benefits received by each adviser as a result of brokerage allocation, including information concerning the acquisition of research through client commission arrangements and the fund’s policies with respect to “soft dollar” arrangements; |
| Ÿ | | Data relating to portfolio turnover rates of each fund; |
| Ÿ | | The procedures and processes used to determine the fair value of fund assets and actions taken to monitor and test the effectiveness of such procedures and processes; |
| Ÿ | | Information about each adviser’s processes for monitoring best execution of portfolio transactions, and other policies and practices of each adviser with respect to trading; |
Information about each Adviser
| Ÿ | | Reports detailing the financial results and condition of each adviser; |
| Ÿ | | Descriptions of the qualifications, education and experience of the individual investment professionals whose responsibilities include portfolio management and investment research for the funds, and information relating to their compensation and responsibilities with respect to managing other mutual funds and investment accounts; |
| Ÿ | | Copies of the Codes of Ethics of each adviser and its affiliates, together with information relating to compliance with and the administration of such codes; |
| Ÿ | | Copies of or descriptions of each adviser’s policies and procedures relating to proxy voting, the handling of corporate actions and class actions; |
| Ÿ | | Information concerning the resources devoted to compliance efforts undertaken by each adviser and its affiliates on behalf of the funds (including descriptions of various compliance programs) and their record of compliance with investment policies and restrictions, including policies with respect to market-timing, late trading and selective portfolio disclosure, and with policies on personal securities transactions; |
| Ÿ | | Descriptions of the business continuity and disaster recovery plans of each adviser and its affiliates; |
| Ÿ | | A description of Eaton Vance Management’s procedures for overseeing third party advisers and sub-advisers, including with respect to regulatory and compliance issues, investment management and other matters; |
Parametric Commodity Strategy Fund
June 30, 2014
Board of Trustees’ Contract Approval — continued
Other Relevant Information
| Ÿ | | Information concerning the nature, cost and character of the administrative and other non-investment management services provided by Eaton Vance Management and its affiliates; |
| Ÿ | | Information concerning management of the relationship with the custodian, subcustodians and fund accountants by each adviser or the funds’ administrator; and |
| Ÿ | | The terms of each advisory agreement. |
Over the course of the twelve-month period ended April 30, 2014, with respect to one or more funds, the Board met nine times and the Contract Review Committee, the Audit Committee, the Governance Committee, the Portfolio Management Committee and the Compliance Reports and Regulatory Matters Committee, each of which is a Committee comprised solely of Independent Trustees, met seven, seventeen, eleven, six and ten times respectively. At such meetings, the Trustees participated in investment and performance reviews with the portfolio managers and other investment professionals of each adviser relating to each fund, and considered the investment and trading strategies used in pursuing each fund’s investment objective, including, where relevant, the use of derivative instruments, as well as processes for monitoring best execution of portfolio transactions and risk management techniques. The Board and its Committees also evaluated issues pertaining to industry and regulatory developments, compliance procedures, fund governance and other issues with respect to the funds, and received and participated in reports and presentations provided by Eaton Vance Management and other fund advisers with respect to such matters.
For funds that invest through one or more underlying portfolios, the Board considered similar information about the portfolio(s) when considering the approval of advisory agreements. In addition, in cases where the fund’s investment adviser has engaged a sub-adviser, the Board considered similar information about the sub-adviser when considering the approval of any sub-advisory agreement.
The Contract Review Committee was assisted throughout the contract review process by Goodwin Procter LLP, legal counsel for the Independent Trustees. The members of the Contract Review Committee relied upon the advice of such counsel and their own business judgment in determining the material factors to be considered in evaluating each advisory and sub-advisory agreement and the weight to be given to each such factor. The conclusions reached with respect to each advisory and sub-advisory agreement were based on a comprehensive evaluation of all the information provided and not any single factor. Moreover, each member of the Contract Review Committee may have placed varying emphasis on particular factors in reaching conclusions with respect to each advisory and sub-advisory agreement. In evaluating each advisory and sub-advisory agreement, including the specific fee structures and other terms of the agreements, the Contract Review Committee was informed by multiple years of analysis and discussion among the Independent Trustees and the Funds’ advisers and sub-advisers.
Results of the Process
Based on its consideration of the foregoing, and such other information as it deemed relevant, including the factors and conclusions described below, the Contract Review Committee concluded that the continuation of the investment advisory and administrative agreement of Parametric Commodity Strategy Fund (the “Fund”) with Eaton Vance Management (the “Adviser”) and the sub-advisory agreement with Parametric Portfolio Associates LLC (the “Sub-adviser”), an affiliate of Eaton Vance Management, including their fee structures, is in the interests of shareholders and, therefore, the Contract Review Committee recommended to the Board approval of each agreement. The Board accepted the recommendation of the Contract Review Committee as well as the factors considered and conclusions reached by the Contract Review Committee with respect to the agreements. Accordingly, the Board, including a majority of the Independent Trustees, voted to approve continuation of the investment advisory and administrative agreement and the sub-advisory agreement for the Fund.
Nature, Extent and Quality of Services
In considering whether to approve the investment advisory and administrative agreement and the sub-advisory agreement of the Fund, the Board evaluated the nature, extent and quality of services provided to the Fund by the Adviser and the Sub-adviser.
The Board considered the Adviser’s and the Sub-adviser’s management capabilities and investment process with respect to the types of investments held by the Fund, including the education, experience and number of its investment professionals and other personnel who provide portfolio management, investment research, and similar services to the Fund. With respect to the Adviser, the Board considered the Adviser’s responsibilities supervising the Sub-adviser The Board evaluated, where relevant, the abilities and experience of the Sub-adviser’s personnel in investing in commodity-linked derivative securities. The Board also took into account the resources dedicated to portfolio management and other services, including the compensation methods of the Adviser to recruit and retain investment personnel, and the time and attention devoted to the Fund by senior management.
The Board reviewed the compliance programs of the Adviser and relevant affiliates thereof, including the Sub-adviser. Among other matters, the Board considered compliance and reporting matters relating to personal trading by investment personnel, selective disclosure of portfolio holdings, late trading, frequent trading, portfolio valuation, business continuity and the allocation of investment opportunities. The Board also evaluated the responses of the Adviser and its affiliates to requests in recent years from regulatory authorities such as the Securities and Exchange Commission and the Financial Industry Regulatory Authority.
Parametric Commodity Strategy Fund
June 30, 2014
Board of Trustees’ Contract Approval — continued
The Board considered shareholder and other administrative services provided or managed by Eaton Vance Management and its affiliates, including transfer agency and accounting services. The Board evaluated the benefits to shareholders of investing in a fund that is a part of a large family of funds, including the ability, in many cases, to exchange an investment among different funds without incurring additional sales charges.
After consideration of the foregoing factors, among others, the Board concluded that the nature, extent and quality of services provided by the Adviser and the Sub-adviser, taken as a whole, are appropriate and consistent with the terms of the investment advisory and administrative agreement and the sub-advisory agreement.
Fund Performance
The Board compared the Fund’s investment performance to a relevant universe of similarly managed funds identified by an independent data provider and appropriate benchmark indices. The Board reviewed comparative performance data for the one-year period ended September 30, 2013 for the Fund. The Board concluded that the performance of the Fund was satisfactory.
Management Fees and Expenses
The Board reviewed contractual fee rates for investment advisory and administrative services payable by the Fund (referred to as “management fees”). As part of its review, the Board considered the management fees and the Fund’s total expense ratio for the year ended September 30, 2013, as compared to a group of similarly managed funds selected by an independent data provider. The Board noted that the Adviser had waived fees and/or paid expenses for the Fund. The Board noted that the Fund has established a wholly-owned subsidiary to accommodate the Fund’s commodity-related investments. The subsidiary is managed by the Adviser and the Sub-adviser pursuant to separate investment advisory and sub-advisory agreements that are subject to annual approval by the Board. The subsidiary’s fee rates are the same as those charged to the Fund, and the Fund will not pay any additional management fees with respect to its assets invested in the subsidiary. The Board also considered factors that had an impact on Fund expense ratios, as identified by management in response to inquiries from the Contract Review Committee, as well as actions taken by management in recent years to reduce expenses at the fund complex level, including the negotiation of reduced fees for transfer agency and custody services.
After reviewing the foregoing information, and in light of the nature, extent and quality of the services provided by the Adviser and the Sub-adviser, the Board concluded that the management fees charged for advisory and related services are reasonable.
Profitability
The Board reviewed the level of profits realized by the Adviser and relevant affiliates thereof, including the Sub-adviser, in providing investment advisory and administrative services to the Fund and to all Eaton Vance Funds as a group. The Board considered the level of profits realized without regard to revenue sharing or other payments by the Adviser and its affiliates to third parties in respect of distribution services. The Board also considered other direct or indirect benefits received by the Adviser and its affiliates, including the Sub-adviser, in connection with their relationships with the Fund, including the benefits of research services that may be available to the Adviser or the Sub-adviser as a result of securities transactions effected for the Fund and other investment advisory clients.
The Board concluded that, in light of the foregoing factors and the nature, extent and quality of the services rendered, the profits realized by the Adviser and its affiliates, including the Sub-adviser, are reasonable.
Economies of Scale
In reviewing management fees and profitability, the Board also considered the extent to which the Adviser and its affiliates, on the one hand, and the Fund, on the other hand, can expect to realize benefits from economies of scale as the assets of the Fund increase. The Board acknowledged the difficulty in accurately measuring the benefits resulting from the economies of scale with respect to the management of any specific fund or group of funds. The Board reviewed data summarizing the increases and decreases in the assets of the Fund and of all Eaton Vance Funds as a group over various time periods, and evaluated the extent to which the total expense ratio of the Fund and the profitability of the Adviser and its affiliates may have been affected by such increases or decreases. Based upon the foregoing, the Board concluded that the Fund currently shares in the benefits from economies of scale. The Board also concluded that, assuming reasonably foreseeable increases in the assets of the Fund, the structure of the advisory fee, which includes breakpoints at several asset levels, will allow the Fund to continue to benefit from economies of scale in the future.
Parametric Commodity Strategy Fund
June 30, 2014
Officers and Trustees
Officers of Parametric Commodity Strategy Fund
Payson F. Swaffield
President
Maureen A. Gemma
Vice President, Secretary and Chief Legal Officer
James F. Kirchner
Treasurer
Paul M. O’Neil
Chief Compliance Officer
Trustees of Parametric Commodity Strategy Fund
Ralph F. Verni
Chairman
Scott E. Eston
Thomas E. Faust Jr.*
Cynthia E. Frost
George J. Gorman
Valerie A. Mosley
William H. Park
Ronald A. Pearlman
Helen Frame Peters
Harriett Tee Taggart
Eaton Vance Funds
IMPORTANT NOTICES
Privacy. The Eaton Vance organization is committed to ensuring your financial privacy. Each of the financial institutions identified below has in effect the following policy (“Privacy Policy”) with respect to nonpublic personal information about its customers:
| Ÿ | | Only such information received from you, through application forms or otherwise, and information about your Eaton Vance fund transactions will be collected. This may include information such as name, address, social security number, tax status, account balances and transactions. |
| Ÿ | | None of such information about you (or former customers) will be disclosed to anyone, except as permitted by law (which includes disclosure to employees necessary to service your account). In the normal course of servicing a customer’s account, Eaton Vance may share information with unaffiliated third parties that perform various required services such as transfer agents, custodians and broker-dealers. |
| Ÿ | | Policies and procedures (including physical, electronic and procedural safeguards) are in place that are designed to protect the confidentiality of such information. |
| Ÿ | | We reserve the right to change our Privacy Policy at any time upon proper notification to you. Customers may want to review our Privacy Policy periodically for changes by accessing the link on our homepage: www.eatonvance.com. |
Our pledge of privacy applies to the following entities within the Eaton Vance organization: the Eaton Vance Family of Funds, Eaton Vance Management, Eaton Vance Investment Counsel, Eaton Vance Distributors, Inc., Eaton Vance Trust Company, Eaton Vance Management’s Real Estate Investment Group and Boston Management and Research. In addition, our Privacy Policy applies only to those Eaton Vance customers who are individuals and who have a direct relationship with us. If a customer’s account (i.e., fund shares) is held in the name of a third-party financial advisor/broker-dealer, it is likely that only such advisor’s privacy policies apply to the customer. This notice supersedes all previously issued privacy disclosures. For more information about Eaton Vance’s Privacy Policy, please call 1-800-262-1122.
Delivery of Shareholder Documents. The Securities and Exchange Commission (SEC) permits funds to deliver only one copy of shareholder documents, including prospectuses, proxy statements and shareholder reports, to fund investors with multiple accounts at the same residential or post office box address. This practice is often called “householding” and it helps eliminate duplicate mailings to shareholders. Eaton Vance, or your financial advisor, may household the mailing of your documents indefinitely unless you instruct Eaton Vance, or your financial advisor, otherwise. If you would prefer that your Eaton Vance documents not be householded, please contact Eaton Vance at 1-800-260-0761, or contact your financial advisor. Your instructions that householding not apply to delivery of your Eaton Vance documents will be effective within 30 days of receipt by Eaton Vance or your financial advisor.
Portfolio Holdings. Each Eaton Vance Fund and its underlying Portfolio(s) (if applicable) will file a schedule of portfolio holdings on Form N-Q with the SEC for the first and third quarters of each fiscal year. The Form N-Q will be available on the Eaton Vance website at www.eatonvance.com, by calling Eaton Vance at 1-800-260-0761 or in the EDGAR database on the SEC’s website at www.sec.gov. Form N-Q may also be reviewed and copied at the SEC’s public reference room in Washington, D.C. (call 1-800-732-0330 for information on the operation of the public reference room).
Proxy Voting. From time to time, funds are required to vote proxies related to the securities held by the funds. The Eaton Vance Funds or their underlying Portfolios (if applicable) vote proxies according to a set of policies and procedures approved by the Funds’ and Portfolios’ Boards. You may obtain a description of these policies and procedures and information on how the Funds or Portfolios voted proxies relating to portfolio securities during the most recent 12-month period ended June 30, without charge, upon request, by calling 1-800-260-0761 and by accessing the SEC’s website at www.sec.gov.
Investment Adviser and Administrator
Eaton Vance Management
Two International Place
Boston, MA 02110
Sub-Adviser
Parametric Portfolio Associates LLC
1918 Eighth Avenue, Suite 3100
Seattle, WA 98101
Principal Underwriter*
Eaton Vance Distributors, Inc.
Two International Place
Boston, MA 02110
(617) 482-8260
Custodian
State Street Bank and Trust Company
State Street Financial Center, One Lincoln Street
Boston, MA 02111
Transfer Agent
BNY Mellon Investment Servicing (US) Inc.
Attn: Eaton Vance Funds
P.O. Box 9653
Providence, RI 02940-9653
(800) 260-0761
Fund Offices
Two International Place
Boston, MA 02110
| * | FINRA BrokerCheck. Investors may check the background of their Investment Professional by contacting the Financial Industry Regulatory Authority (FINRA). FINRA BrokerCheck is a free tool to help investors check the professional background of current and former FINRA-registered securities firms and brokers. FINRA BrokerCheck is available by calling 1-800-289-9999 and at www.FINRA.org. The FINRA BrokerCheck brochure describing this program is available to investors at www.FINRA.org. |
7777 6.30.14
Item 2. Code of Ethics
Not required in this filing.
Item 3. Audit Committee Financial Expert
Not required in this filing.
Item 4. Principal Accountant Fees and Services
Not required in this filing.
Item 5. Audit Committee of Listed Registrants
Not applicable.
Item 6. Schedule of Investments
Please see schedule of investments contained in the Report to Stockholders included under Item 1 of this Form N-CSR.
Item 7. Disclosure of Proxy Voting Policies and Procedures for Closed-End Management Investment Companies
Not applicable.
Item 8. Portfolio Managers of Closed-End Management Investment Companies
Not applicable.
Item 9. Purchases of Equity Securities by Closed-End Management Investment Company and Affiliated Purchasers
Not applicable.
Item 10. Submission of Matters to a Vote of Security Holders
No material changes.
Item 11. Controls and Procedures
(a) It is the conclusion of the registrant’s principal executive officer and principal financial officer that the effectiveness of the registrant’s current disclosure controls and procedures (such disclosure controls and procedures having been evaluated within 90 days of the date of this filing) provide reasonable assurance that the information required to be disclosed by the registrant has been recorded, processed, summarized and reported within the time period specified in the Commission’s rules and forms and that the information required to be disclosed by the registrant has been accumulated and communicated to the registrant’s principal executive officer and principal financial officer in order to allow timely decisions regarding required disclosure.
(b) There have been no changes in the registrant’s internal controls over financial reporting during the second fiscal quarter of the period covered by this report that has materially affected, or is reasonably likely to materially affect, the registrant’s internal control over financial reporting.
Item 12. Exhibits
| | |
(a)(1) | | Registrant’s Code of Ethics – Not applicable (please see Item 2). |
| |
(a)(2)(i) | | Treasurer’s Section 302 certification. |
| |
(a)(2)(ii) | | President’s Section 302 certification. |
| |
(b) | | Combined Section 906 certification. |
Signatures
Pursuant to the requirements of the Securities Exchange Act of 1934 and the Investment Company Act of 1940, the registrant has duly caused this report to be signed on its behalf by the undersigned, thereunto duly authorized.
Eaton Vance Mutual Funds Trust
| | |
By: | | /s/ Payson F. Swaffield |
| | Payson F. Swaffield |
| | President |
| |
Date: | | August 14, 2014 |
Pursuant to the requirements of the Securities Exchange Act of 1934 and the Investment Company Act of 1940, this report has been signed below by the following persons on behalf of the registrant and in the capacities and on the dates indicated.
| | |
By: | | /s/ James F. Kirchner |
| | James F. Kirchner |
| | Treasurer |
|
Date: August 14, 2014 |
| |
By: | | /s/ Payson F. Swaffield |
| | Payson F. Swaffield |
| | President |
| |
Date: | | August 14, 2014 |