UNITED STATES
SECURITIES AND EXCHANGE COMMISSION
Washington, D.C. 20549
Form N-CSR
CERTIFIED SHAREHOLDER REPORT OF REGISTERED
MANAGEMENT INVESTMENT COMPANIES
Investment Company Act File Number: 811-04015
Eaton Vance Mutual Funds Trust
(Exact Name of Registrant as Specified in Charter)
Two International Place, Boston, Massachusetts 02110
(Address of Principal Executive Offices)
Maureen A. Gemma
Two International Place, Boston, Massachusetts 02110
(Name and Address of Agent for Services)
(617) 482-8260
(Registrant’s Telephone Number)
February 28
Date of Fiscal Year End
August 31, 2014
Date of Reporting Period
Item 1. Reports to Stockholders

Parametric Dividend
Income Fund
Semiannual Report
August 31, 2014

Commodity Futures Trading Commission Registration. Effective December 31, 2012, the Commodity Futures Trading Commission (“CFTC”) adopted certain regulatory changes that subject registered investment companies and advisers to regulation by the CFTC if a fund invests more than a prescribed level of its assets in certain CFTC-regulated instruments (including futures, certain options and swap agreements) or markets itself as providing investment exposure to such instruments. The Fund has claimed an exclusion from the definition of the term “commodity pool operator” under the Commodity Exchange Act. Accordingly, neither the Fund nor the adviser with respect to the operation of the Fund is subject to CFTC regulation. Because of its management of other strategies, the Fund’s adviser is registered with the CFTC as a commodity pool operator and a commodity trading advisor.
Fund shares are not insured by the FDIC and are not deposits or other obligations of, or guaranteed by, any depository institution. Shares are subject to investment risks, including possible loss of principal invested.
This report must be preceded or accompanied by a current summary prospectus or prospectus. Before investing, investors should consider carefully the investment objective, risks, and charges and expenses of a mutual fund. This and other important information is contained in the summary prospectus and prospectus, which can be obtained from a financial advisor. Prospective investors should read the prospectus carefully before investing. For further information, please call 1-800-260-0761.
|
| Semiannual Report August 31, 2014 |
Parametric Dividend Income Fund
| | | | |
| Table of Contents | | | |
| |
Performance | | | 2 | |
| |
Fund Profile | | | 2 | |
| |
Endnotes and Additional Disclosures | | | 3 | |
| |
Fund Expenses | | | 4 | |
| |
Financial Statements | | | 5 | |
| |
Board of Trustees’ Contract Approval | | | 18 | |
| |
Officers and Trustees | | | 20 | |
| |
Important Notices | | | 21 | |
Parametric Dividend Income Fund
August 31, 2014
Performance1,2
Portfolio Managers David Stein, Ph.D., Thomas Seto and Timothy W. Atwill, Ph.D., CFA, each of Parametric Portfolio Associates LLC
| | | | | | | | | | | | | | | | | | | | | | | | |
| % Cumulative Total Returns | | Class
Inception Date | | | Performance
Inception Date | | | Six Months | | | One Year | | | Five Years | | | Since Inception | |
Investor Class at NAV | | | 03/26/2014 | | | | 03/26/2014 | | | | — | | | | — | | | | — | | | | 7.97 | % |
Institutional Class at NAV | | | 03/26/2014 | | | | 03/26/2014 | | | | — | | | | — | | | | — | | | | 8.04 | |
S&P 500 Index | | | — | | | | — | | | | 8.84 | % | | | 25.25 | % | | | 16.87 | % | | | 9.11 | % |
| | | | | | |
| | | | | | | | | | | | | | | | | | | | | | | | |
| % Total Annual Operating Expense Ratios3 | | | | | | | | | Investor Class | | | Institutional Class | |
Gross | | | | | | | | | | | | | | | | | | | 1.05 | % | | | 0.80 | % |
Net | | | | | | | | | | | | | | | | | | | 0.85 | | | | 0.60 | |
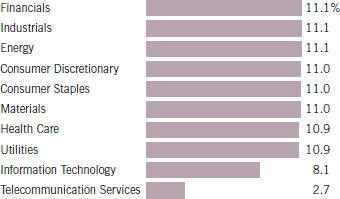
Fund Profile
Sector Allocation (% of net assets)4
Top 10 Holdings (% of net assets)4
| | | | |
Nucor Corp. | | | 0.6 | % |
Teekay Corp. | | | 0.6 | |
ConAgra Foods, Inc. | | | 0.6 | |
Altria Group, Inc. | | | 0.6 | |
Procter & Gamble Co. (The) | | | 0.6 | |
Coach, Inc. | | | 0.6 | |
C.H. Robinson Worldwide, Inc. | | | 0.6 | |
National Oilwell Varco, Inc. | | | 0.6 | |
Republic Services, Inc. | | | 0.6 | |
Waste Management, Inc. | | | 0.6 | |
Total | | | 6.0 | % |
See Endnotes and Additional Disclosures in this report.
Past performance is no guarantee of future results. Returns are historical and are calculated by determining the percentage change in net asset value (NAV) or offering price (as applicable) with all distributions reinvested. Investment return and principal value will fluctuate so that shares, when redeemed, may be worth more or less than their original cost. Performance less than one year is cumulative. Performance is for the stated time period only; due to market volatility, the Fund’s current performance may be lower or higher than quoted. Returns are before taxes unless otherwise noted. For performance as of the most recent month-end, please refer to eatonvance.com.
Parametric Dividend Income Fund
August 31, 2014
Endnotes and Additional Disclosures
| 1 | S&P 500 Index is an unmanaged index of large-cap stocks commonly used as a measure of U.S. stock market performance. Unless otherwise stated, index returns do not reflect the effect of any applicable sales charges, commissions, expenses, taxes or leverage, as applicable. It is not possible to invest directly in an index. |
| 2 | Returns are historical and are calculated by determining the percentage change in NAV with all distributions reinvested. Unless otherwise stated, performance does not reflect the deduction of taxes on Fund distributions or redemptions of Fund shares. Performance since inception for an index, if presented, is the performance since the Fund’s or oldest share class’ inception, as applicable. |
| 3 | Source: Fund prospectus. Net expense ratio reflects a contractual expense reimbursement that continues through 6/30/15. Without the reimbursement, if applicable, performance would have been lower. |
| 4 | Excludes cash and cash equivalents. |
| | Fund profile subject to change due to active management. |
Parametric Dividend Income Fund
August 31, 2014
Fund Expenses
Example: As a Fund shareholder, you incur two types of costs: (1) transaction costs, including sales charges (loads) on purchases and redemption fees (if applicable); and (2) ongoing costs, including management fees; distribution and/or service fees; and other Fund expenses. This Example is intended to help you understand your ongoing costs (in dollars) of Fund investing and to compare these costs with the ongoing costs of investing in other mutual funds. The actual expense Example is based on an investment of $1,000 invested at the beginning of the period and held for the entire period (March 26, 2014 – August 31, 2014). The hypothetical expense Example is based on an investment of $1,000 invested for the one-half year period (March 1, 2014 – August 31, 2014).
Actual Expenses: The first section of the table below provides information about actual account values and actual expenses. You may use the information in this section, together with the amount you invested, to estimate the expenses that you paid over the period. Simply divide your account value by $1,000 (for example, an $8,600 account value divided by $1,000 = 8.6), then multiply the result by the number in the first section under the heading entitled “Expenses Paid During Period” to estimate the expenses you paid on your account during this period.
Hypothetical Example for Comparison Purposes: The second section of the table below provides information about hypothetical account values and hypothetical expenses based on the actual Fund expense ratio and an assumed rate of return of 5% per year (before expenses), which is not the actual Fund return. The hypothetical account values and expenses may not be used to estimate the actual ending account balance or expenses you paid for the period. You may use this information to compare the ongoing costs of investing in your Fund and other funds. To do so, compare this 5% hypothetical example with the 5% hypothetical examples that appear in the shareholder reports of the other funds.
Please note that the expenses shown in the table are meant to highlight your ongoing costs only and do not reflect any transactional costs, such as sales charges (loads) or redemption fees (if applicable). Therefore, the second section of the table is useful in comparing ongoing costs only, and will not help you determine the relative total costs of owning different funds. In addition, if these transactional costs were included, your costs would be higher.
| | | | | | | | | | | | | | | | | | |
| | | Beginning Account Value
(3/26/14) | | | Ending Account Value
(8/31/14) | | | Expenses Paid During Period (3/26/14 – 8/31/14) | | | Annualized Expense Ratio | | | |
| | | | | |
| | | | | | | | | | | | | | | | | | |
Actual* | | | |
Investor Class | | $ | 1,000.00 | | | $ | 1,079.70 | | | $ | 4.12 | *** | | | 0.91 | % | | |
Institutional Class | | $ | 1,000.00 | | | $ | 1,080.40 | | | $ | 3.04 | *** | | | 0.67 | % | | |
| | | | | |
| | | | | | | | | | | | | | | | | | |
| | | Beginning Account Value (3/1/14) | | | Ending Account Value (8/31/14) | | | Expenses Paid During Period (3/1/14 – 8/31/14) | | | Annualized Expense Ratio | | | |
| | | | | |
| | | | | | | | | | | | | | | | | | |
Hypothetical** | | | | | | | | | | | | | | | | | | |
(5% return per year before expenses) | | | | | | | | | | | | | | | | | | |
Investor Class | | $ | 1,000.00 | | | $ | 1,020.60 | | | $ | 4.63 | *** | | | 0.91 | % | | |
Institutional Class | | $ | 1,000.00 | | | $ | 1,021.80 | | | $ | 3.41 | *** | | | 0.67 | % | | |
Effective July 10, 2014, the contractual expense caps of the Fund changed. If these changes had been in place during the entire reporting period, the actual and hypothetical ending account values, expenses paid and annualized expense ratios would have been as follows:
| | | | | | | | | | | | | | | | |
| | | Beginning
Account Value
(3/26/14) | | | Ending
Account Value
(8/31/14) | | | Expenses Paid
During Period
(3/26/14 – 8/31/14) | | | Annualized
Expense
Ratio | |
| | | | |
| | | | | | | | | | | | | | | | |
Actual* | | | | | | | | | | | | | | | | |
Investor Class | | $ | 1,000.00 | | | $ | 1,079.70 | | | $ | 3.85 | *** | | | 0.85 | % |
Institutional Class | | $ | 1,000.00 | | | $ | 1,080.40 | | | $ | 2.72 | *** | | | 0.60 | % |
| | | | |
| | | | | | | | | | | | | | | | |
| | | Beginning
Account Value
(3/1/14) | | | Ending
Account Value
(8/31/14) | | | Expenses Paid
During Period
(3/1/14 – 8/31/14) | | | Annualized
Expense
Ratio | |
| | | | |
| | | | | | | | | | | | | | | | |
Hypothetical** | | | | | | | | | | | | | | | | |
(5% return per year before expenses) | | | | | | | | | | | | | | | | |
Investor Class | | $ | 1,000.00 | | | $ | 1,020.90 | | | $ | 4.33 | *** | | | 0.85 | % |
Institutional Class | | $ | 1,000.00 | | | $ | 1,022.20 | | | $ | 3.06 | *** | | | 0.60 | % |
| * | The Fund had not commenced operations on March 1, 2014. Actual expenses are equal to the Fund’s annualized expense ratio for the indicated Class, multiplied by the average account value over the period, multiplied by 159/365 (to reflect the period from commencement of operations on March 26, 2014 to August 31, 2014). The Example assumes that the $1,000 was invested at the net asset value per share determined at the opening of business on March 26, 2014. |
| ** | Hypothetical expenses are equal to the Fund’s annualized expense ratio for the indicated Class, multiplied by the average account value over the period, multiplied by 184/365 (to reflect the one-half year period). The Example assumes that the $1,000 was invested at the net asset value per share determined at the opening of business on March 26, 2014. |
| *** | Absent an allocation of certain expenses to affiliates, expenses would be higher. |
Parametric Dividend Income Fund
August 31, 2014
Portfolio of Investments (Unaudited)
| | | | | | | | |
| Common Stocks — 98.9% | |
| | |
| | | | | | | | |
| Security | | Shares | | | Value | |
| | | | | | | | |
|
Aerospace & Defense — 2.7% | |
Honeywell International, Inc. | | | 192 | | | $ | 18,284 | |
Lockheed Martin Corp. | | | 104 | | | | 18,096 | |
Northrop Grumman Corp. | | | 135 | | | | 17,175 | |
Raytheon Co. | | | 184 | | | | 17,726 | |
United Technologies Corp. | | | 159 | | | | 17,169 | |
| | | | | | | | | |
| | | | | | $ | 88,450 | |
| | | | | | | | | |
|
Air Freight & Logistics — 1.1% | |
C.H. Robinson Worldwide, Inc. | | | 280 | | | $ | 19,113 | |
United Parcel Service, Inc., Class B | | | 184 | | | | 17,909 | |
| | | | | | | | | |
| | | | | | $ | 37,022 | |
| | | | | | | | | |
|
Automobiles — 0.6% | |
Ford Motor Co. | | | 1,035 | | | $ | 18,019 | |
| | | | | | | | | |
| | | | | | $ | 18,019 | |
| | | | | | | | | |
|
Banks — 3.8% | |
Bank of Hawaii Corp. | | | 305 | | | $ | 17,705 | |
Cullen/Frost Bankers, Inc. | | | 233 | | | | 18,314 | |
F.N.B. Corp. | | | 1,405 | | | | 17,366 | |
U.S. Bancorp | | | 420 | | | | 17,758 | |
United Bankshares, Inc. | | | 554 | | | | 18,254 | |
Valley National Bancorp | | | 1,787 | | | | 17,870 | |
Wells Fargo & Co. | | | 335 | | | | 17,232 | |
| | | | | | | | | |
| | | | | | $ | 124,499 | |
| | | | | | | | | |
|
Beverages — 1.6% | |
Coca-Cola Co. (The) | | | 427 | | | $ | 17,814 | |
Dr Pepper Snapple Group, Inc. | | | 282 | | | | 17,743 | |
PepsiCo, Inc. | | | 195 | | | | 18,036 | |
| | | | | | | | | |
| | | | | | $ | 53,593 | |
| | | | | | | | | |
|
Biotechnology — 0.6% | |
PDL BioPharma, Inc. | | | 1,803 | | | $ | 18,192 | |
| | | | | | | | | |
| | | | | | $ | 18,192 | |
| | | | | | | | | |
|
Chemicals — 5.6% | |
Air Products and Chemicals, Inc. | | | 133 | | | $ | 17,717 | |
Airgas, Inc. | | | 167 | | | | 18,434 | |
Dow Chemical Co. (The) | | | 319 | | | | 17,083 | |
E.I. du Pont de Nemours & Co. | | | 273 | | | | 18,048 | |
International Flavors & Fragrances, Inc. | | | 177 | | | | 17,981 | |
| | | | | | | | |
| Security | | Shares | | | Value | |
| | | | | | | | |
|
Chemicals (continued) | |
LyondellBasell Industries NV, Class A | | | 164 | | | $ | 18,753 | |
Olin Corp. | | | 667 | | | | 18,202 | |
Praxair, Inc. | | | 136 | | | | 17,891 | |
RPM International, Inc. | | | 397 | | | | 18,711 | |
Scotts Miracle-Gro Co. (The), Class A | | | 314 | | | | 18,127 | |
| | | | | | | | | |
| | | | | | $ | 180,947 | |
| | | | | | | | | |
|
Commercial Services & Supplies — 2.3% | |
Covanta Holding Corp. | | | 868 | | | $ | 18,219 | |
KAR Auction Services, Inc. | | | 564 | | | | 17,010 | |
Republic Services, Inc. | | | 484 | | | | 19,036 | |
Waste Management, Inc. | | | 405 | | | | 19,023 | |
| | | | | | | | | |
| | | | | | $ | 73,288 | |
| | | | | | | | | |
|
Communications Equipment — 1.6% | |
Cisco Systems, Inc. | | | 724 | | | $ | 18,093 | |
Motorola Solutions, Inc. | | | 294 | | | | 17,463 | |
QUALCOMM, Inc. | | | 226 | | | | 17,199 | |
| | | | | | | | | |
| | | | | | $ | 52,755 | |
| | | | | | | | | |
|
Containers & Packaging — 2.7% | |
AptarGroup, Inc. | | | 285 | | | $ | 18,283 | |
Avery Dennison Corp. | | | 360 | | | | 17,327 | |
Bemis Co., Inc. | | | 429 | | | | 17,477 | |
MeadWestvaco Corp. | | | 402 | | | | 17,286 | |
Sonoco Products Co. | | | 444 | | | | 18,275 | |
| | | | | | | | | |
| | | | | | $ | 88,648 | |
| | | | | | | | | |
|
Distributors — 0.6% | |
Genuine Parts Co. | | | 215 | | | $ | 18,864 | |
| | | | | | | | | |
| | | | | | $ | 18,864 | |
| | | | | | | | | |
|
Diversified Telecommunication Services — 2.7% | |
AT&T, Inc. | | | 501 | | | $ | 17,515 | |
CenturyLink, Inc. | | | 428 | | | | 17,544 | |
Frontier Communications Corp. | | | 2,618 | | | | 17,802 | |
Verizon Communications, Inc. | | | 365 | | | | 18,184 | |
Windstream Holdings, Inc. | | | 1,503 | | | | 16,984 | |
| | | | | | | | | |
| | | | | | $ | 88,029 | |
| | | | | | | | | |
|
Electric Utilities — 5.5% | |
ALLETE, Inc. | | | 351 | | | $ | 17,083 | |
Duke Energy Corp. | | | 250 | | | | 18,498 | |
Entergy Corp. | | | 242 | | | | 18,733 | |
| | | | |
| | 5 | | See Notes to Financial Statements. |
Parametric Dividend Income Fund
August 31, 2014
Portfolio of Investments (Unaudited) — continued
| | | | | | | | |
| Security | | Shares | | | Value | |
| | | | | | | | |
|
Electric Utilities (continued) | |
Hawaiian Electric Industries Inc. | | | 731 | | | $ | 18,560 | |
Northeast Utilities | | | 382 | | | | 17,530 | |
Pinnacle West Capital Corp. | | | 317 | | | | 18,053 | |
PPL Corp. | | | 506 | | | | 17,523 | |
Southern Co. (The) | | | 380 | | | | 16,872 | |
Westar Energy, Inc. | | | 470 | | | | 17,357 | |
Xcel Energy, Inc. | | | 551 | | | | 17,660 | |
| | | | | | | | | |
| | | | | | $ | 177,869 | |
| | | | | | | | | |
|
Electrical Equipment — 1.1% | |
Eaton Corp. PLC | | | 257 | | | $ | 17,941 | |
Emerson Electric Co. | | | 275 | | | | 17,606 | |
| | | | | | | | | |
| | | | | | $ | 35,547 | |
| | | | | | | | | |
|
Energy Equipment & Services — 2.7% | |
Diamond Offshore Drilling, Inc. | | | 416 | | | $ | 18,279 | |
Helmerich & Payne, Inc. | | | 178 | | | | 18,699 | |
National Oilwell Varco, Inc. | | | 221 | | | | 19,101 | |
Schlumberger, Ltd. | | | 151 | | | | 16,556 | |
Seadrill, Ltd. | | | 454 | | | | 16,911 | |
| | | | | | | | | |
| | | $ | 89,546 | |
| | | | | | | | | |
|
Food & Staples Retailing — 1.1% | |
Sysco Corp. | | | 457 | | | $ | 17,288 | |
Wal-Mart Stores, Inc. | | | 233 | | | | 17,592 | |
| | | | | | | | | |
| | | $ | 34,880 | |
| | | | | | | | | |
|
Food Products — 2.8% | |
B&G Foods, Inc. | | | 621 | | | $ | 18,754 | |
Campbell Soup Co. | | | 413 | | | | 18,510 | |
ConAgra Foods, Inc. | | | 604 | | | | 19,449 | |
General Mills, Inc. | | | 323 | | | | 17,242 | |
Kellogg Co. | | | 267 | | | | 17,347 | |
| | | | | | | | | |
| | | $ | 91,302 | |
| | | | | | | | | |
|
Gas Utilities — 1.1% | |
AGL Resources, Inc. | | | 344 | | | $ | 18,339 | |
Laclede Group, Inc. (The) | | | 370 | | | | 18,296 | |
| | | | | | | | | |
| | | $ | 36,635 | |
| | | | | | | | | |
|
Health Care Equipment & Supplies — 2.7% | |
Abbott Laboratories | | | 426 | | | $ | 17,994 | |
Baxter International, Inc. | | | 224 | | | | 16,796 | |
Becton, Dickinson and Co. | | | 157 | | | | 18,396 | |
| | | | | | | | |
| Security | | Shares | | | Value | |
| | | | | | | | |
|
Health Care Equipment & Supplies (continued) | |
Covidien PLC | | | 198 | | | $ | 17,192 | |
Medtronic, Inc. | | | 282 | | | | 18,006 | |
| | | | | | | | | |
| | | $ | 88,384 | |
| | | | | | | | | |
|
Health Care Providers & Services — 4.9% | |
AmerisourceBergen Corp. | | | 229 | | | $ | 17,722 | |
Cardinal Health, Inc. | | | 236 | | | | 17,393 | |
HealthSouth Corp. | | | 445 | | | | 17,529 | |
Omnicare, Inc. | | | 270 | | | | 17,218 | |
Owens & Minor, Inc. | | | 532 | | | | 18,301 | |
Patterson Cos., Inc. | | | 445 | | | | 17,920 | |
Quest Diagnostics, Inc. | | | 295 | | | | 18,647 | |
UnitedHealth Group, Inc. | | | 203 | | | | 17,596 | |
WellPoint, Inc. | | | 152 | | | | 17,709 | |
| | | | | | | | | |
| | | $ | 160,035 | |
| | | | | | | | | |
|
Hotels, Restaurants & Leisure — 2.2% | |
Cracker Barrel Old Country Store, Inc. | | | 184 | | | $ | 18,476 | |
Darden Restaurants, Inc. | | | 391 | | | | 18,502 | |
McDonald’s Corp. | | | 186 | | | | 17,432 | |
Six Flags Entertainment Corp. | | | 463 | | | | 16,890 | |
| | | | | | | | | |
| | | $ | 71,300 | |
| | | | | | | | | |
|
Household Durables — 1.1% | |
Leggett & Platt, Inc. | | | 515 | | | $ | 18,071 | |
Tupperware Brands Corp. | | | 248 | | | | 18,169 | |
| | | | | | | | | |
| | | $ | 36,240 | |
| | | | | | | | | |
|
Household Products — 2.7% | |
Church & Dwight Co., Inc. | | | 257 | | | $ | 17,538 | |
Clorox Co. (The) | | | 205 | | | | 18,163 | |
Colgate-Palmolive Co. | | | 259 | | | | 16,765 | |
Kimberly-Clark Corp. | | | 164 | | | | 17,712 | |
Procter & Gamble Co. (The) | | | 231 | | | | 19,198 | |
| | | | | | | | | |
| | | $ | 89,376 | |
| | | | | | | | | |
|
Industrial Conglomerates — 1.1% | |
3M Co. | | | 124 | | | $ | 17,856 | |
General Electric Co. | | | 712 | | | | 18,498 | |
| | | | | | | | | |
| | | $ | 36,354 | |
| | | | | | | | | |
|
Insurance — 6.2% | |
ACE, Ltd. | | | 173 | | | $ | 18,395 | |
American Financial Group, Inc. | | | 288 | | | | 17,271 | |
| | | | |
| | 6 | | See Notes to Financial Statements. |
Parametric Dividend Income Fund
August 31, 2014
Portfolio of Investments (Unaudited) — continued
| | | | | | | | |
| Security | | Shares | | | Value | |
| | | | | | | | |
|
Insurance (continued) | |
Arthur J. Gallagher & Co. | | | 382 | | | $ | 18,042 | |
Cincinnati Financial Corp. | | | 381 | | | | 18,322 | |
Endurance Specialty Holdings, Ltd. | | | 324 | | | | 18,815 | |
HCC Insurance Holdings, Inc. | | | 369 | | | | 18,502 | |
Old Republic International Corp. | | | 1,202 | | | | 18,451 | |
PartnerRe, Ltd. | | | 163 | | | | 18,205 | |
Progressive Corp. | | | 750 | | | | 18,765 | |
Travelers Companies, Inc. (The) | | | 191 | | | | 18,090 | |
Validus Holdings, Ltd. | | | 483 | | | | 18,890 | |
| | | | | | | | | |
| | | $ | 201,748 | |
| | | | | | | | | |
|
IT Services — 2.7% | |
Amdocs, Ltd. | | | 378 | | | $ | 17,804 | |
Automatic Data Processing, Inc. | | | 226 | | | | 18,867 | |
International Business Machines Corp. | | | 88 | | | | 16,922 | |
Jack Henry & Associates, Inc. | | | 300 | | | | 17,343 | |
Paychex, Inc. | | | 408 | | | | 16,993 | |
| | | | | | | | | |
| | | $ | 87,929 | |
| | | | | | | | | |
|
Leisure Products — 1.1% | |
Hasbro, Inc. | | | 336 | | | $ | 17,692 | |
Mattel, Inc. | | | 511 | | | | 17,624 | |
| | | | | | | | | |
| | | $ | 35,316 | |
| | | | | | | | | |
|
Machinery — 1.6% | |
Caterpillar, Inc. | | | 169 | | | $ | 18,433 | |
Deere & Co. | | | 203 | | | | 17,070 | |
Illinois Tool Works, Inc. | | | 205 | | | | 18,083 | |
| | | | | | | | | |
| | | $ | 53,586 | |
| | | | | | | | | |
|
Media — 3.3% | |
Cinemark Holdings, Inc. | | | 509 | | | $ | 17,963 | |
Lamar Advertising Co., Class A | | | 338 | | | | 17,738 | |
Meredith Corp. | | | 356 | | | | 16,582 | |
Omnicom Group, Inc. | | | 254 | | | | 18,291 | |
Regal Entertainment Group, Class A | | | 900 | | | | 18,945 | |
Thomson Reuters Corp. | | | 480 | | | | 18,192 | |
| | | | | | | | | |
| | | | | | $ | 107,711 | |
| | | | | | | | | |
|
Metals & Mining — 2.2% | |
Commercial Metals Co. | | | 1,031 | | | $ | 17,816 | |
Freeport-McMoRan, Inc. | | | 450 | | | | 16,366 | |
Kaiser Aluminum Corp. | | | 222 | | | | 17,882 | |
Nucor Corp. | | | 365 | | | | 19,827 | |
| | | | | | | | | |
| | | | | | $ | 71,891 | |
| | | | | | | | | |
| | | | | | | | |
| Security | | Shares | | | Value | |
| | | | | | | | |
|
Multi-Utilities — 4.3% | |
Alliant Energy Corp. | | | 298 | | | $ | 17,430 | |
Avista Corp. | | | 540 | | | | 17,529 | |
CMS Energy Corp. | | | 579 | | | | 17,683 | |
Consolidated Edison, Inc. | | | 311 | | | | 18,004 | |
DTE Energy Co. | | | 228 | | | | 17,841 | |
Integrys Energy Group, Inc. | | | 251 | | | | 17,040 | |
SCANA Corp. | | | 327 | | | | 16,984 | |
TECO Energy, Inc. | | | 979 | | | | 17,720 | |
| | | | | | | | | |
| | | | | | $ | 140,231 | |
| | | | | | | | | |
|
Multiline Retail — 1.1% | |
Kohl’s Corp. | | | 299 | | | $ | 17,578 | |
Target Corp. | | | 279 | | | | 16,760 | |
| | | | | | | | | |
| | | | | | $ | 34,338 | |
| | | | | | | | | |
|
Oil, Gas & Consumable Fuels — 8.3% | |
Apache Corp. | | | 179 | | | $ | 18,228 | |
Chevron Corp. | | | 129 | | | | 16,699 | |
ConocoPhillips | | | 218 | | | | 17,706 | |
CVR Energy, Inc. | | | 380 | | | | 18,859 | |
Exxon Mobil Corp. | | | 173 | | | | 17,207 | |
Hess Corp. | | | 182 | | | | 18,400 | |
HollyFrontier Corp. | | | 352 | | | | 17,611 | |
Kinder Morgan, Inc. | | | 440 | | | | 17,714 | |
Marathon Oil Corp. | | | 428 | | | | 17,843 | |
Murphy Oil Corp. | | | 293 | | | | 18,304 | |
Occidental Petroleum Corp. | | | 175 | | | | 18,153 | |
Oneok, Inc. | | | 265 | | | | 18,603 | |
Spectra Energy Corp. | | | 440 | | | | 18,330 | |
Teekay Corp. | | | 323 | | | | 19,806 | |
Williams Cos., Inc. | | | 304 | | | | 18,070 | |
| | | | | | | | | |
| | | | | | $ | 271,533 | |
| | | | | | | | | |
|
Paper & Forest Products — 0.5% | |
International Paper Co. | | | 365 | | | $ | 17,684 | |
| | | | | | | | | |
| | | | | | $ | 17,684 | |
| | | | | | | | | |
|
Pharmaceuticals — 2.7% | |
Bristol-Myers Squibb Co. | | | 356 | | | $ | 18,031 | |
Eli Lilly & Co. | | | 272 | | | | 17,288 | |
Johnson & Johnson | | | 172 | | | | 17,842 | |
Merck & Co., Inc. | | | 305 | | | | 18,334 | |
Pfizer, Inc. | | | 579 | | | | 17,017 | |
| | | | | | | | | |
| | | | | | $ | 88,512 | |
| | | | | | | | | |
| | | | |
| | 7 | | See Notes to Financial Statements. |
Parametric Dividend Income Fund
August 31, 2014
Portfolio of Investments (Unaudited) — continued
| | | | | | | | |
| Security | | Shares | | | Value | |
| | | | | | | | |
|
Road & Rail — 1.1% | |
CSX Corp. | | | 581 | | | $ | 17,959 | |
Union Pacific Corp. | | | 180 | | | | 18,948 | |
| | | | | | | | | |
| | | | | | $ | 36,907 | |
| | | | | | | | | |
|
Semiconductors & Semiconductor Equipment — 2.8% | |
Analog Devices, Inc. | | | 352 | | | $ | 17,994 | |
Intel Corp. | | | 499 | | | | 17,425 | |
Maxim Integrated Products, Inc. | | | 600 | | | | 18,534 | |
Microchip Technology, Inc. | | | 363 | | | | 17,725 | |
Texas Instruments, Inc. | | | 375 | | | | 18,068 | |
| | | | | | | | | |
| | | | | | $ | 89,746 | |
| | | | | | | | | |
|
Software — 1.0% | |
CA, Inc. | | | 615 | | | $ | 17,368 | |
Compuware Corp. | | | 1,795 | | | | 16,783 | |
| | | | | | | | | |
| | | | | | $ | 34,151 | |
| | | | | | | | | |
| | |
Specialty Retail — 0.6% | | | | | | | | |
Home Depot, Inc. (The) | | | 196 | | | $ | 18,326 | |
| | | | | | | | | |
| | | | | | $ | 18,326 | |
| | | | | | | | | |
|
Textiles, Apparel & Luxury Goods — 0.6% | |
Coach, Inc. | | | 519 | | | $ | 19,115 | |
| | | | | | | | | |
| | | | | | $ | 19,115 | |
| | | | | | | | | |
|
Thrifts & Mortgage Finance — 1.1% | |
New York Community Bancorp, Inc. | | | 1,132 | | | $ | 18,055 | |
People’s United Financial, Inc. | | | 1,205 | | | | 18,015 | |
| | | | | | | | | |
| | | | | | $ | 36,070 | |
| | | | | | | | | |
|
Tobacco — 2.8% | |
Altria Group, Inc. | | | 447 | | | $ | 19,257 | |
Philip Morris International, Inc. | | | 204 | | | | 17,458 | |
Reynolds American, Inc. | | | 307 | | | | 17,950 | |
Universal Corp. | | | 327 | | | | 17,253 | |
Vector Group, Ltd. | | | 760 | | | | 18,156 | |
| | | | | | | | | |
| | | | | | $ | 90,074 | |
| | | | | | | | | |
| |
Total Common Stocks
(identified cost $3,084,783) | | | $ | 3,224,642 | |
| | | | | | | | | |
| | | | | | | | |
| Short-Term Investments — 0.5% | |
| | |
| | | | | | | | |
| Description | | Interest (000’s omitted) | | | Value | |
| | | | | | | | |
Eaton Vance Cash Reserves Fund, LLC, 0.13%(1) | | $ | 16 | | | $ | 15,901 | |
| | | | | | | | | |
| |
Total Short-Term Investments
(identified cost $15,901) | | | $ | 15,901 | |
| | | | | | | | | |
| |
Total Investments — 99.4%
(identified cost $3,100,684) | | | $ | 3,240,543 | |
| | | | | | | | | |
| |
Other Assets, Less Liabilities — 0.6% | | | $ | 18,040 | |
| | | | | | | | | |
| |
Net Assets — 100.0% | | | $ | 3,258,583 | |
| | | | | | | | | |
The percentage shown for each investment category in the Portfolio of Investments is based on net assets.
| (1) | Affiliated investment company, available to Eaton Vance portfolios and funds, which invests in high quality, U.S. dollar denominated money market instruments. The rate shown is the annualized seven-day yield as of August 31, 2014. |
| | | | |
| | 8 | | See Notes to Financial Statements. |
Parametric Dividend Income Fund
August 31, 2014
Statement of Assets and Liabilities (Unaudited)
| | | | |
| Assets | | August 31, 2014 | |
Unaffiliated investments, at value (identified cost, $3,084,783) | | $ | 3,224,642 | |
Affiliated investment, at value (identified cost, $15,901) | | | 15,901 | |
Dividends receivable | | | 9,687 | |
Interest receivable from affiliated investment | | | 2 | |
Receivable from affiliates | | | 12,477 | |
Total assets | | $ | 3,262,709 | |
| |
| Liabilities | | | | |
Payable to affiliates: | | | | |
Investment adviser and administration fee | | $ | 1,488 | |
Distribution and service fees | | | 3 | |
Accrued expenses | | | 2,635 | |
Total liabilities | | $ | 4,126 | |
Net Assets | | $ | 3,258,583 | |
| |
| Sources of Net Assets | | | | |
Paid-in capital | | $ | 3,035,733 | |
Accumulated net realized gain | | | 70,163 | |
Accumulated undistributed net investment income | | | 12,828 | |
Net unrealized appreciation | | | 139,859 | |
Total | | $ | 3,258,583 | |
| |
| Investor Class Shares | | | | |
Net Assets | | $ | 14,557 | |
Shares Outstanding | | | 1,356 | |
Net Asset Value, Offering Price and Redemption Price Per Share | | | | |
(net assets ÷ shares of beneficial interest outstanding) | | $ | 10.74 | |
| |
| Institutional Class Shares | | | | |
Net Assets | | $ | 3,244,026 | |
Shares Outstanding | | | 302,027 | |
Net Asset Value, Offering Price and Redemption Price Per Share | | | | |
(net assets ÷ shares of beneficial interest outstanding) | | $ | 10.74 | |
| | | | |
| | 9 | | See Notes to Financial Statements. |
Parametric Dividend Income Fund
August 31, 2014
Statement of Operations (Unaudited)
| | | | |
| Investment Income | | Period Ended August 31, 2014(1) | |
Dividends (net of foreign taxes, $45) | | $ | 40,960 | |
Interest allocated from affiliated investment | | | 61 | |
Expenses allocated from affiliated investment | | | (6 | ) |
Total investment income | | $ | 41,015 | |
| |
| Expenses | | | | |
Investment adviser and administration fee | | $ | 7,474 | |
Distribution and service fees | | | | |
Investor Class | | | 12 | |
Trustees’ fees and expenses | | | 322 | |
Custodian fee | | | 14,436 | |
Transfer and dividend disbursing agent fees | | | 597 | |
Legal and accounting services | | | 20,579 | |
Printing and postage | | | 5,461 | |
Registration fees | | | 22,731 | |
Miscellaneous | | | 1,956 | |
Total expenses | | $ | 73,568 | |
Deduct — | | | | |
Allocation of expenses to affiliates | | $ | 64,455 | |
Total expense reductions | | $ | 64,455 | |
| |
Net expenses | | $ | 9,113 | |
| |
Net investment income | | $ | 31,902 | |
| |
| Realized and Unrealized Gain (Loss) | | | | |
Net realized gain (loss) — | | | | |
Investment transactions | | $ | 70,163 | |
Net realized gain | | $ | 70,163 | |
Change in unrealized appreciation (depreciation) — | | | | |
Investments | | $ | 139,859 | |
Net change in unrealized appreciation (depreciation) | | $ | 139,859 | |
| |
Net realized and unrealized gain | | $ | 210,022 | |
| |
Net increase in net assets from operations | | $ | 241,924 | |
| (1) | For the period from the start of business, March 26, 2014, to August 31, 2014. |
| | | | |
| | 10 | | See Notes to Financial Statements. |
Parametric Dividend Income Fund
August 31, 2014
Statement of Changes in Net Assets
| | | | |
| Increase (Decrease) in Net Assets | | Period Ended August 31, 2014 (Unaudited)(1) | |
From operations — | | | | |
Net investment income | | $ | 31,902 | |
Net realized gain from investment transactions | | | 70,163 | |
Net change in unrealized appreciation (depreciation) from investments | | | 139,859 | |
Net increase in net assets from operations | | $ | 241,924 | |
Distributions to shareholders — | | | | |
From net investment income | | | | |
Investor Class | | $ | (57 | ) |
Institutional Class | | | (19,017 | ) |
Total distributions to shareholders | | $ | (19,074 | ) |
Transactions in shares of beneficial interest — | | | | |
Proceeds from sale of shares | | | | |
Investor Class | | $ | 13,700 | |
Institutional Class | | | 3,008,146 | |
Net asset value of shares issued to shareholders in payment of distributions declared | | | | |
Investor Class | | | 57 | |
Institutional Class | | | 19,017 | |
Cost of shares redeemed | | | | |
Institutional Class | | | (5,187 | ) |
Net increase in net assets from Fund share transactions | | $ | 3,035,733 | |
| |
Net increase in net assets | | $ | 3,258,583 | |
| |
| Net Assets | | | | |
At beginning of period | | $ | — | |
At end of period | | $ | 3,258,583 | |
| |
Accumulated undistributed net investment income
included in net assets | | | | |
At end of period | | $ | 12,828 | |
| (1) | For the period from the start of business, March 26, 2014, to August 31, 2014. |
| | | | |
| | 11 | | See Notes to Financial Statements. |
Parametric Dividend Income Fund
August 31, 2014
Financial Highlights
| | | | |
| | | Investor Class | |
| | | Period Ended August 31, 2014 (Unaudited)(1) | |
Net asset value — Beginning of period | | $ | 10.000 | |
| |
| Income (Loss) From Operations | | | | |
Net investment income(2) | | $ | 0.098 | |
Net realized and unrealized gain | | | 0.699 | |
| |
Total income from operations | | $ | 0.797 | |
| |
| Less Distributions | | | | |
From net investment income | | $ | (0.057 | ) |
| |
Total distributions | | $ | (0.057 | ) |
| |
Net asset value — End of period | | $ | 10.740 | |
| |
Total Return(3) | | | 7.97 | %(4) |
| |
| Ratios/Supplemental Data | | | | |
Net assets, end of period (000’s omitted) | | $ | 15 | |
Ratios (as a percentage of average daily net assets): | | | | |
Expenses(5) | | | 0.91 | %(6) |
Net investment income | | | 2.15 | %(6) |
Portfolio Turnover | | | 32 | %(4) |
| (1) | For the period from the start of business, March 26, 2014, to August 31, 2014. |
| (2) | Computed using average shares outstanding. |
| (3) | Returns are historical and are calculated by determining the percentage change in net asset value with all distributions reinvested. |
| (5) | The investment adviser and administrator and/or the sub-adviser reimbursed certain operating expenses (equal to 4.71% of average daily net assets for the period ended August 31, 2014). Absent this reimbursement, total return would be lower. |
| | | | |
| | 12 | | See Notes to Financial Statements. |
Parametric Dividend Income Fund
August 31, 2014
Financial Highlights — continued
| | | | |
| | | Institutional Class | |
| | | Period Ended August 31, 2014 (Unaudited)(1) | |
Net asset value — Beginning of period | | $ | 10.000 | |
| |
| Income (Loss) From Operations | | | | |
Net investment income(2) | | $ | 0.106 | |
Net realized and unrealized gain | | | 0.698 | |
| |
Total income from operations | | $ | 0.804 | |
| |
| Less Distributions | | | | |
From net investment income | | $ | (0.064 | ) |
| |
Total distributions | | $ | (0.064 | ) |
| |
Net asset value — End of period | | $ | 10.740 | |
| |
Total Return(3) | | | 8.04 | %(4) |
| |
| Ratios/Supplemental Data | | | | |
Net assets, end of period (000’s omitted) | | $ | 3,244 | |
Ratios (as a percentage of average daily net assets): | | | | |
Expenses(5) | | | 0.67 | %(6) |
Net investment income | | | 2.33 | %(6) |
Portfolio Turnover | | | 32 | %(4) |
| (1) | For the period from the start of business, March 26, 2014, to August 31, 2014. |
| (2) | Computed using average shares outstanding. |
| (3) | Returns are historical and are calculated by determining the percentage change in net asset value with all distributions reinvested. |
| (5) | The investment adviser and administrator and/or the sub-adviser reimbursed certain operating expenses (equal to 4.71% of average daily net assets for the period ended August 31, 2014). Absent this reimbursement, total return would be lower. |
| | | | |
| | 13 | | See Notes to Financial Statements. |
Parametric Dividend Income Fund
August 31, 2014
Notes to Financial Statements (Unaudited)
1 Significant Accounting Policies
Parametric Dividend Income Fund (the Fund) is a diversified series of Eaton Vance Mutual Funds Trust (the Trust). The Trust is a Massachusetts business trust registered under the Investment Company Act of 1940, as amended (the 1940 Act), as an open-end management investment company. The Fund commenced operations on March 26, 2014. The Fund’s investment objective is total return and current income. The Fund offers two classes of shares. Investor Class and Institutional Class shares are sold at net asset value and are not subject to a sales charge. Each class represents a pro-rata interest in the Fund, but votes separately on class-specific matters and (as noted below) is subject to different expenses. Realized and unrealized gains and losses and net investment income and losses, other than class-specific expenses, are allocated daily to each class of shares based on the relative net assets of each class to the total net assets of the Fund. Each class of shares differs in its distribution plan and certain other class-specific expenses.
The following is a summary of significant accounting policies of the Fund. The policies are in conformity with accounting principles generally accepted in the United States of America.
A Investment Valuation — The following methodologies are used to determine the market value or fair value of investments.
Equity Securities. Equity securities listed on a U.S. securities exchange generally are valued at the last sale or closing price on the day of valuation or, if no sales took place on such date, at the mean between the closing bid and asked prices therefore on the exchange where such securities are principally traded. Equity securities listed on the NASDAQ Global or Global Select Market generally are valued at the NASDAQ official closing price. Unlisted or listed securities for which closing sales prices or closing quotations are not available are valued at the mean between the latest available bid and asked prices.
Debt Obligations. Short-term obligations purchased with a remaining maturity of sixty days or less are generally valued at amortized cost, which approximates market value.
Affiliated Fund. The Fund may invest in Eaton Vance Cash Reserves Fund, LLC (Cash Reserves Fund), an affiliated investment company managed by Eaton Vance Management (EVM). The value of the Fund’s investment in Cash Reserves Fund reflects the Fund’s proportionate interest in its net assets. Cash Reserves Fund generally values its investment securities utilizing the amortized cost valuation technique in accordance with Rule 2a-7 under the 1940 Act. This technique involves initially valuing a portfolio security at its cost and thereafter assuming a constant amortization to maturity of any discount or premium. If amortized cost is determined not to approximate fair value, Cash Reserves Fund may value its investment securities based on available market quotations provided by a third party pricing service.
Fair Valuation. Investments for which valuations or market quotations are not readily available or are deemed unreliable are valued at fair value using methods determined in good faith by or at the direction of the Trustees of the Fund in a manner that fairly reflects the security’s value, or the amount that the Fund might reasonably expect to receive for the security upon its current sale in the ordinary course. Each such determination is based on a consideration of relevant factors, which are likely to vary from one pricing context to another. These factors may include, but are not limited to, the type of security, the existence of any contractual restrictions on the security’s disposition, the price and extent of public trading in similar securities of the issuer or of comparable companies or entities, quotations or relevant information obtained from broker/dealers or other market participants, information obtained from the issuer, analysts, and/or the appropriate stock exchange (for exchange-traded securities), an analysis of the company’s or entity’s financial condition, and an evaluation of the forces that influence the issuer and the market(s) in which the security is purchased and sold.
B Investment Transactions — Investment transactions for financial statement purposes are accounted for on a trade date basis. Realized gains and losses on investments sold are determined on the basis of identified cost.
C Income — Dividend income is recorded on the ex-dividend date for dividends received in cash and/or securities. However, if the ex-dividend date has passed, certain dividends from foreign securities are recorded as the Fund is informed of the ex-dividend date. Withholding taxes on foreign dividends and capital gains have been provided for in accordance with the Fund’s understanding of the applicable countries’ tax rules and rates. Interest income is recorded on the basis of interest accrued, adjusted for amortization of premium or accretion of discount.
D Federal Taxes — The Fund’s policy is to comply with the provisions of the Internal Revenue Code applicable to regulated investment companies and to distribute to shareholders each year substantially all of its net investment income, and all or substantially all of its net realized capital gains. Accordingly, no provision for federal income or excise tax is necessary.
As of August 31, 2014, the Fund had no uncertain tax positions that would require financial statement recognition, de-recognition, or disclosure. The Fund files a U.S. federal income tax return annually after its fiscal year-end, which is subject to examination by the Internal Revenue Service for a period of three years from the date of filing.
E Expenses — The majority of expenses of the Trust are directly identifiable to an individual fund. Expenses which are not readily identifiable to a specific fund are allocated taking into consideration, among other things, the nature and type of expense and the relative size of the funds.
F Expense Reduction — State Street Bank and Trust Company (SSBT) serves as custodian of the Fund. Pursuant to the custodian agreement, SSBT receives a fee reduced by credits, which are determined based on the average daily cash balance the Fund maintains with SSBT. All credit balances, if any, used to reduce the Fund’s custodian fees are reported as a reduction of expenses in the Statement of Operations.
Parametric Dividend Income Fund
August 31, 2014
Notes to Financial Statements (Unaudited) — continued
G Use of Estimates — The preparation of the financial statements in conformity with accounting principles generally accepted in the United States of America requires management to make estimates and assumptions that affect the reported amounts of assets and liabilities at the date of the financial statements and the reported amounts of income and expense during the reporting period. Actual results could differ from those estimates.
H Indemnifications — Under the Trust’s organizational documents, its officers and Trustees may be indemnified against certain liabilities and expenses arising out of the performance of their duties to the Fund. Under Massachusetts law, if certain conditions prevail, shareholders of a Massachusetts business trust (such as the Trust) could be deemed to have personal liability for the obligations of the Trust. However, the Trust’s Declaration of Trust contains an express disclaimer of liability on the part of Fund shareholders and the By-laws provide that the Trust shall assume the defense on behalf of any Fund shareholders. Moreover, the By-laws also provide for indemnification out of Fund property of any shareholder held personally liable solely by reason of being or having been a shareholder for all loss or expense arising from such liability. Additionally, in the normal course of business, the Fund enters into agreements with service providers that may contain indemnification clauses. The Fund’s maximum exposure under these arrangements is unknown as this would involve future claims that may be made against the Fund that have not yet occurred.
I Interim Financial Statements — The interim financial statements relating to August 31, 2014 and for the period then ended have not been audited by an independent registered public accounting firm, but in the opinion of the Fund’s management, reflect all adjustments, consisting only of normal recurring adjustments, necessary for the fair presentation of the financial statements.
2 Distributions to Shareholders
It is the present policy of the Fund to make quarterly distributions of all or substantially all of its net investment income and to distribute annually all or substantially all of its net realized capital gains. Distributions to shareholders are recorded on the ex-dividend date. Distributions are declared separately for each class of shares. Shareholders may reinvest income and capital gain distributions in additional shares of the same class of the Fund at the net asset value as of the ex-dividend date or, at the election of the shareholder, receive distributions in cash. The Fund distinguishes between distributions on a tax basis and a financial reporting basis. Accounting principles generally accepted in the United States of America require that only distributions in excess of tax basis earnings and profits be reported in the financial statements as a return of capital. Permanent differences between book and tax accounting relating to distributions are reclassified to paid-in capital. For tax purposes, distributions from short-term capital gains are considered to be from ordinary income.
3 Investment Adviser and Administration Fee and Other Transactions with Affiliates
The investment adviser and administration fee is earned by EVM as compensation for investment advisory and administrative services rendered to the Fund. The fee is computed at an annual rate of 0.55% of the Fund’s average daily net assets up to $1 billion and is payable monthly. On net assets of $1 billion and over, the annual fee is reduced. For the period ended August 31, 2014, the investment adviser and administration fee amounted to $7,474 or 0.55% (annualized) of the Fund’s average daily net assets. Pursuant to a sub-advisory agreement, EVM has delegated the investment management of the Fund to Parametric Portfolio Associates LLC (Parametric), a majority-owned subsidiary of Eaton Vance Corp. EVM pays Parametric a portion of its advisory and administration fee for sub-advisory services provided to the Fund. The Fund invests its cash in Cash Reserves Fund. EVM does not currently receive a fee for advisory services provided to Cash Reserves Fund.
EVM and Parametric have agreed to reimburse the Fund’s expenses to the extent that total annual operating expenses (relating to ordinary operating expenses only) exceed 0.85% and 0.60% (0.95% and 0.70% prior to July 10, 2014) of the Fund’s average daily net assets for Investor Class and Institutional Class, respectively. This agreement may be changed or terminated after June 30, 2015. Pursuant to this agreement, EVM and Parametric were allocated $64,455 in total of the Fund’s operating expenses for the period ended August 31, 2014.
EVM provides sub-transfer agency and related services to the Fund pursuant to a Sub-Transfer Agency Support Services Agreement. For the period ended August 31, 2014, EVM earned $16 from the Fund pursuant to such agreement, which is included in transfer and dividend disbursing agent fees on the Statement of Operations. Eaton Vance Distributors, Inc. (EVD), an affiliate of EVM and the Fund’s principal underwriter, received distribution and service fees from Investor Class shares (see Note 4).
Trustees and officers of the Fund who are members of EVM’s organization receive remuneration for their services to the Fund out of the investment adviser and administration fee. Trustees of the Fund who are not affiliated with EVM may elect to defer receipt of all or a percentage of their annual fees in accordance with the terms of the Trustees Deferred Compensation Plan. For the period ended August 31, 2014, no significant amounts have been deferred. Certain officers and Trustees of the Fund are officers of EVM.
4 Distribution Plan
The Fund has in effect a distribution plan for Investor Class shares (Investor Class Plan) pursuant to Rule 12b-1 under the 1940 Act. Pursuant to the Investor Class Plan, the Fund pays EVD a distribution and service fee of 0.25% per annum of its average daily net assets attributable to Investor Class shares for distribution services and facilities provided to the Fund by EVD, as well as for personal services and/or the maintenance of shareholder accounts. Distribution and service fees paid or accrued to EVD for the period ended August 31, 2014 amounted to $12 for Investor Class shares.
Distribution and service fees are subject to the limitations contained in the Financial Industry Regulatory Authority’s NASD Conduct Rule 2830(d).
Parametric Dividend Income Fund
August 31, 2014
Notes to Financial Statements (Unaudited) — continued
5 Purchases and Sales of Investments
Purchases and sales of investments, other than short-term obligations, aggregated $4,026,011 and $1,011,391, respectively, for the period ended August 31, 2014.
6 Shares of Beneficial Interest
The Fund’s Declaration of Trust permits the Trustees to issue an unlimited number of full and fractional shares of beneficial interest (without par value). Such shares may be issued in a number of different series (such as the Fund) and classes. Transactions in Fund shares were as follows:
| | | | |
| Investor Class | | Period Ended August 31, 2014 (Unaudited) (1) | |
| |
Sales | | | 1,351 | |
Issued to shareholders electing to receive payments of distributions in Fund shares | | | 5 | |
| |
Net increase | | | 1,356 | |
| |
| | | | |
| Institutional Class | | Period Ended
August 31, 2014 (Unaudited) (1) | |
| |
Sales | | | 300,726 | |
Issued to shareholders electing to receive payments of distributions in Fund shares | | | 1,791 | |
Redemptions | | | (490 | ) |
| |
Net increase | | | 302,027 | |
| (1) | For the period from the start of business, March 26, 2014, to August 31, 2014. |
At August 31, 2014, EVM owned 99.5% of the value of the outstanding shares of the Fund.
7 Federal Income Tax Basis of Investments
The cost and unrealized appreciation (depreciation) of investments of the Fund at August 31, 2014, as determined on a federal income tax basis, were as follows:
| | | | |
| |
Aggregate cost | | $ | 3,100,684 | |
| |
Gross unrealized appreciation | | $ | 179,499 | |
Gross unrealized depreciation | | | (39,640 | ) |
| |
Net unrealized appreciation | | $ | 139,859 | |
8 Fair Value Measurements
Under generally accepted accounting principles for fair value measurements, a three-tier hierarchy to prioritize the assumptions, referred to as inputs, is used in valuation techniques to measure fair value. The three-tier hierarchy of inputs is summarized in the three broad levels listed below.
| Ÿ | | Level 1 – quoted prices in active markets for identical investments |
| Ÿ | | Level 2 – other significant observable inputs (including quoted prices for similar investments, interest rates, prepayment speeds, credit risk, etc.) |
| Ÿ | | Level 3 – significant unobservable inputs (including a fund’s own assumptions in determining the fair value of investments) |
Parametric Dividend Income Fund
August 31, 2014
Notes to Financial Statements (Unaudited) — continued
In cases where the inputs used to measure fair value fall in different levels of the fair value hierarchy, the level disclosed is determined based on the lowest level input that is significant to the fair value measurement in its entirety. The inputs or methodology used for valuing securities are not necessarily an indication of the risk associated with investing in those securities.
At August 31, 2014, the hierarchy of inputs used in valuing the Fund’s investments, which are carried at value, were as follows:
| | | | | | | | | | | | | | | | |
| Asset Description | | Level 1 | | | Level 2 | | | Level 3 | | | Total | |
| | | | |
Common Stocks | | $ | 3,224,642 | * | | $ | — | | | $ | — | | | $ | 3,224,642 | |
Short-Term Investments | | | — | | | | 15,901 | | | | — | | | | 15,901 | |
| | | | |
Total Investments | | $ | 3,224,642 | | | $ | 15,901 | | | $ | — | | | $ | 3,240,543 | |
| * | The level classification by major category of investments is the same as the category presentation in the Portfolio of Investments. |
Parametric Dividend Income Fund
August 31, 2014
Board of Trustees’ Contract Approval
Overview of the Contract Review Process
The Investment Company Act of 1940, as amended (the “1940 Act”), provides, in substance, that for a fund to enter into an investment advisory agreement with an investment adviser, the fund’s board of trustees, including a majority of the trustees who are not “interested persons” of the fund (“Independent Trustees”), must approve the agreement and its terms at an in-person meeting called for the purpose of considering such approval.
At a meeting of the Boards of Trustees (each a “Board”) of the Eaton Vance group of mutual funds (the “Eaton Vance Funds”) held on February 10, 2014, the Board, including a majority of the Independent Trustees, voted to approve the investment advisory and administrative agreement of Parametric Dividend Income Fund (the “Fund”) with Eaton Vance Management (the “Adviser”) and the sub-advisory agreement with Parametric Portfolio Associates LLC (the “Sub-adviser”), an affiliate of Eaton Vance Management. The Board reviewed information furnished for the February 10, 2014 meeting as well as information previously furnished throughout the year at the meetings of the Board and its committees, including, with respect to the approval of other investment advisory agreements for other Eaton Vance Funds. Such information included, among other things, the following:
Information about Fees and Expenses
| Ÿ | | The advisory and related fees to be paid by the Fund and the anticipated expense ratio of the Fund; |
| Ÿ | | Comparative information concerning the fees charged and the services provided by the Adviser and Sub-adviser in managing other accounts (including mutual funds, other collective investment funds and institutional accounts) using investment strategies and techniques similar to those to be used in managing the Fund, if applicable, and concerning fees charged by other advisers for managing funds similar to the Fund; |
Information about Portfolio Management and Trading
| Ÿ | | Descriptions of the investment management services to be provided to the Fund, including the investment strategies and processes to be employed; |
| Ÿ | | Information concerning the allocation of brokerage and the benefits expected to be received by the Adviser and Sub-adviser as a result of brokerage allocation for the Fund, including information concerning the acquisition of research through client commission arrangements and the Fund’s policies with respect to “soft dollar” arrangements; |
| Ÿ | | The procedures and processes to be used to determine the fair value of the Fund’s assets and actions to be taken to monitor and test the effectiveness of such procedures and processes; |
Information about the Adviser and Sub-adviser
| Ÿ | | Reports detailing the financial results and condition of the Adviser and Sub-adviser; |
| Ÿ | | Descriptions of the qualifications, education and experience of the individual investment professionals whose responsibilities include portfolio management and investment research for the Fund, and information relating to their compensation and responsibilities with respect to managing other mutual funds and investment accounts; |
| Ÿ | | Copies of the Codes of Ethics of the Adviser and its affiliates, including the Sub-adviser, together with information relating to compliance with and the administration of such codes; |
| Ÿ | | Copies of or descriptions of the Adviser’s and the Sub-adviser’s policies and procedures relating to proxy voting and the handling of corporate actions and class actions; |
| Ÿ | | Information concerning the resources devoted to compliance efforts undertaken by the Adviser and its affiliates, including the Sub-adviser, on behalf of the Eaton Vance Funds (including descriptions of various compliance programs) and their record of compliance with investment policies and restrictions, including policies with respect to market-timing, late trading and selective portfolio disclosure, and with policies on personal securities transactions; |
| Ÿ | | Descriptions of the business continuity and disaster recovery plans of the Adviser and its affiliates; |
| Ÿ | | A description of the Adviser’s procedures for overseeing third party advisers and sub-advisers, including with respect to regulatory and compliance issues, investment management and other matters; |
Other Relevant Information
| Ÿ | | Information concerning the nature, cost and character of the administrative and other non-investment management services to be provided by Eaton Vance Management and its affiliates; |
| Ÿ | | Information concerning management of the relationship with the custodian, subcustodians and fund accountants by the Adviser (which is the administrator) and the Sub-adviser; and |
| Ÿ | | The terms of the investment advisory and administrative agreement and sub-advisory agreement of the Fund. |
Results of the Process
Based on its consideration of the foregoing, and such other information as it deemed relevant, including the factors and conclusions described below, the Board concluded that the terms of the Fund’s investment advisory and administrative agreement and sub-advisory agreement with the Adviser and Sub-adviser, including their fee structures, is in the interests of shareholders and, therefore, the Board, including a majority of the Independent Trustees, voted to approve the terms of the investment advisory and administrative agreement and sub-advisory agreement for the Fund.
Parametric Dividend Income Fund
August 31, 2014
Board of Trustees’ Contract Approval — continued
Nature, Extent and Quality of Services
In considering whether to approve the investment advisory and administrative agreement and sub-advisory agreement of the Fund, the Board evaluated the nature, extent and quality of services to be provided to the Fund by the Adviser and the Sub-adviser.
The Board considered the Adviser’s and the Sub-adviser’s management capabilities with respect to the types of investments to be held by the Fund, including the education, experience and number of its investment professionals and other personnel who will provide portfolio management. With respect to the Adviser, the Board considered those capabilities as they relate to supervising the Sub-adviser and coordinating activities in implementing the Fund’s investment strategy. With respect to the Sub-adviser, the Board considered the Sub-advisers investment process, investment research and similar functions with respect to the types of investments to be held by the Fund. In particular, the Board noted the Sub-adviser’s experience employing a top-down, disciplined and systematic investment process that emphasizes a diversified portfolio of companies that have historically demonstrated high current income and lower levels of stock price volatility. The Board also took into account the resources dedicated to portfolio management and other services, including the compensation methods to recruit and retain investment personnel, and the time and attention expected to be devoted to Fund matters by senior management.
The Board reviewed the compliance programs of the Adviser and relevant affiliates thereof, including the Sub-adviser. Among other matters, the Board considered compliance and reporting matters relating to personal trading by investment personnel, selective disclosure of portfolio holdings, late trading, frequent trading, portfolio valuation, business continuity and the allocation of investment opportunities. The Board also evaluated the responses of the Adviser and its affiliates to requests in recent years from regulatory authorities such as the Securities and Exchange Commission and the Financial Industry Regulatory Authority.
The Board considered shareholder and other administrative services provided or managed by the Adviser and its affiliates, including transfer agency and accounting services. The Board evaluated the benefits to shareholders of investing in a fund that is a part of a large family of funds, including the ability, in many cases, to exchange an investment among different funds without incurring additional sales charges.
After consideration of the foregoing factors, among others, the Board concluded that the nature, extent and quality of services to be provided by the Adviser and the Sub-adviser, taken as a whole, are appropriate and consistent with the terms of the investment advisory and administrative agreement and sub-advisory agreement.
Fund Performance
Because the Fund had not yet commenced operations when the contract was approved, it had no performance record.
Management Fees and Expenses
The Board reviewed contractual fee rates to be payable by the Fund for advisory and administrative services and sub-advisory fees (referred to as “management fees”). As part of its review, the Board considered the Fund’s management fees as compared to a group of similarly managed funds selected by an independent data provider and the Fund’s estimated expense ratio for a one-year period.
After reviewing the foregoing information, and in light of the nature, extent and quality of the services to be provided by the Adviser and Sub-adviser, the Board concluded that the management fees proposed to be charged for advisory and related services are reasonable.
Profitability
The Board reviewed the level of profits projected to be realized by the Adviser and relevant affiliates thereof in providing investment advisory and administrative services to the Fund. The Board considered the level of profits expected to be realized without regard to revenue sharing or other payments expected to be made by the Adviser and its affiliates to third parties in respect of distribution services. The Board also considered other direct or indirect benefits expected to be received by the Adviser and its affiliates, including the Sub-adviser, in connection with their relationships with the Fund, including the benefits of research services that may be available to the Adviser or Sub-adviser as a result of securities transactions effected for the Fund and other investment advisory clients.
The Board concluded that, in light of the foregoing factors and the nature, extent and quality of the services to be rendered, the profits expected to be realized by the Adviser and its affiliates, including the sub-adviser, are reasonable.
Economies of Scale
In reviewing management fees and profitability, the Board also considered the extent to which the Adviser and its affiliates, on the one hand, and the Fund, on the other hand, can expect to realize benefits from economies of scale as the assets of the Fund increase. The Board acknowledged the difficulty in accurately measuring the benefits resulting from the economies of scale with respect to the management of any specific fund or group of funds. The Board also concluded that, assuming reasonably foreseeable increases in the assets of the Fund, the structure of the advisory fee, which includes breakpoints at several asset levels, can be expected to allow the Fund to benefit from economies of scale in the future.
Parametric Dividend Income Fund
August 31, 2014
Officers and Trustees
Officers of Parametric Dividend Income Fund
Payson F. Swaffield
President
Maureen A. Gemma
Vice President, Secretary and
Chief Legal Officer
James F. Kirchner
Treasurer
Paul M. O’Neil
Chief Compliance Officer
Trustees of Parametric Dividend Income Fund
Ralph F. Verni
Chairman
Scott E. Eston
Thomas E. Faust Jr.*
Cynthia E. Frost
George J. Gorman
Valerie A. Mosley
William H. Park
Ronald A. Pearlman
Helen Frame Peters
Harriett Tee Taggart
Eaton Vance Funds
IMPORTANT NOTICES
Privacy. The Eaton Vance organization is committed to ensuring your financial privacy. Each of the financial institutions identified below has in effect the following policy (“Privacy Policy”) with respect to nonpublic personal information about its customers:
| Ÿ | | Only such information received from you, through application forms or otherwise, and information about your Eaton Vance fund transactions will be collected. This may include information such as name, address, social security number, tax status, account balances and transactions. |
| Ÿ | | None of such information about you (or former customers) will be disclosed to anyone, except as permitted by law (which includes disclosure to employees necessary to service your account). In the normal course of servicing a customer’s account, Eaton Vance may share information with unaffiliated third parties that perform various required services such as transfer agents, custodians and broker-dealers. |
| Ÿ | | Policies and procedures (including physical, electronic and procedural safeguards) are in place that are designed to protect the confidentiality of such information. |
| Ÿ | | We reserve the right to change our Privacy Policy at any time upon proper notification to you. Customers may want to review our Privacy Policy periodically for changes by accessing the link on our homepage: www.eatonvance.com. |
Our pledge of privacy applies to the following entities within the Eaton Vance organization: the Eaton Vance Family of Funds, Eaton Vance Management, Eaton Vance Investment Counsel, Eaton Vance Distributors, Inc., Eaton Vance Trust Company, Eaton Vance Management’s Real Estate Investment Group and Boston Management and Research. In addition, our Privacy Policy applies only to those Eaton Vance customers who are individuals and who have a direct relationship with us. If a customer’s account (i.e., fund shares) is held in the name of a third-party financial advisor/broker-dealer, it is likely that only such advisor’s privacy policies apply to the customer. This notice supersedes all previously issued privacy disclosures. For more information about Eaton Vance’s Privacy Policy, please call 1-800-262-1122.
Delivery of Shareholder Documents. The Securities and Exchange Commission (SEC) permits funds to deliver only one copy of shareholder documents, including prospectuses, proxy statements and shareholder reports, to fund investors with multiple accounts at the same residential or post office box address. This practice is often called “householding” and it helps eliminate duplicate mailings to shareholders. Eaton Vance, or your financial advisor, may household the mailing of your documents indefinitely unless you instruct Eaton Vance, or your financial advisor, otherwise. If you would prefer that your Eaton Vance documents not be householded, please contact Eaton Vance at 1-800-260-0761, or contact your financial advisor. Your instructions that householding not apply to delivery of your Eaton Vance documents will be effective within 30 days of receipt by Eaton Vance or your financial advisor.
Portfolio Holdings. Each Eaton Vance Fund and its underlying Portfolio(s) (if applicable) will file a schedule of portfolio holdings on Form N-Q with the SEC for the first and third quarters of each fiscal year. The Form N-Q will be available on the Eaton Vance website at www.eatonvance.com, by calling Eaton Vance at 1-800-260-0761 or in the EDGAR database on the SEC’s website at www.sec.gov. Form N-Q may also be reviewed and copied at the SEC’s public reference room in Washington, D.C. (call 1-800-732-0330 for information on the operation of the public reference room).
Proxy Voting. From time to time, funds are required to vote proxies related to the securities held by the funds. The Eaton Vance Funds or their underlying Portfolios (if applicable) vote proxies according to a set of policies and procedures approved by the Funds’ and Portfolios’ Boards. You may obtain a description of these policies and procedures and information on how the Funds or Portfolios voted proxies relating to portfolio securities during the most recent 12-month period ended June 30, without charge, upon request, by calling 1-800-260-0761 and by accessing the SEC’s website at www.sec.gov.
This Page Intentionally Left Blank
This Page Intentionally Left Blank
This Page Intentionally Left Blank
Investment Adviser and Administrator
Eaton Vance Management
Two International Place
Boston, MA 02110
Sub-Adviser
Parametric Portfolio Associates LLC
1918 Eighth Avenue, Suite 3100
Seattle, WA 98101
Principal Underwriter*
Eaton Vance Distributors, Inc.
Two International Place
Boston, MA 02110
(617) 482-8260
Custodian
State Street Bank and Trust Company
State Street Financial Center, One Lincoln Street
Boston, MA 02111
Transfer Agent
BNY Mellon Investment Servicing (US) Inc.
Attn: Eaton Vance Funds
P.O. Box 9653
Providence, RI 02940-9653
(800) 260-0761
Fund Offices
Two International Place
Boston, MA 02110
| * | FINRA BrokerCheck. Investors may check the background of their Investment Professional by contacting the Financial Industry Regulatory Authority (FINRA). FINRA BrokerCheck is a free tool to help investors check the professional background of current and former FINRA-registered securities firms and brokers. FINRA BrokerCheck is available by calling 1-800-289-9999 and at www.FINRA.org. The FINRA BrokerCheck brochure describing this program is available to investors at www.FINRA.org. |
Item 2. Code of Ethics
Not required in this filing.
Item 3. Audit Committee Financial Expert
Not required in this filing.
Item 4. Principal Accountant Fees and Services
Not required in this filing.
Item 5. Audit Committee of Listed Registrants
Not applicable.
Item 6. Schedule of Investments
Please see schedule of investments contained in the Report to Stockholders included under Item 1 of this Form N-CSR.
Item 7. Disclosure of Proxy Voting Policies and Procedures for Closed-End Management Investment Companies
Not applicable.
Item 8. Portfolio Managers of Closed-End Management Investment Companies
Not applicable.
Item 9. Purchases of Equity Securities by Closed-End Management Investment Company and Affiliated Purchasers
Not applicable.
Item 10. Submission of Matters to a Vote of Security Holders
No material changes.
Item 11. Controls and Procedures
(a) It is the conclusion of the registrant’s principal executive officer and principal financial officer that the effectiveness of the registrant’s current disclosure controls and procedures (such disclosure controls and procedures having been evaluated within 90 days of the date of this filing) provide reasonable assurance that the information required to be disclosed by the registrant has been recorded, processed, summarized and reported within the time period specified in the Commission’s rules and forms and that the information required to be disclosed by the registrant has been accumulated and communicated to the registrant’s principal executive officer and principal financial officer in order to allow timely decisions regarding required disclosure.
(b) There have been no changes in the registrant’s internal controls over financial reporting during the second fiscal quarter of the period covered by this report that has materially affected, or is reasonably likely to materially affect, the registrant’s internal control over financial reporting.
Item 12. Exhibits
| | |
| (a)(1) | | Registrant’s Code of Ethics – Not applicable (please see Item 2). |
| |
| (a)(2)(i) | | Treasurer’s Section 302 certification. |
| |
| (a)(2)(ii) | | President’s Section 302 certification. |
| |
| (b) | | Combined Section 906 certification. |
Signatures
Pursuant to the requirements of the Securities Exchange Act of 1934 and the Investment Company Act of 1940, the registrant has duly caused this report to be signed on its behalf by the undersigned, thereunto duly authorized.
Eaton Vance Mutual Funds Trust
| | |
| By: | | /s/ Payson F. Swaffield |
| | Payson F. Swaffield |
| | President |
Date: October 9, 2014
Pursuant to the requirements of the Securities Exchange Act of 1934 and the Investment Company Act of 1940, this report has been signed below by the following persons on behalf of the registrant and in the capacities and on the dates indicated.
| | |
| By: | | /s/ James F. Kirchner |
| | James F. Kirchner |
| | Treasurer |
| |
| Date: | | October 9, 2014 |
| |
| By: | | /s/ Payson F. Swaffield |
| | Payson F. Swaffield |
| | President |
| |
| Date: | | October 9, 2014 |