UNITED STATES
SECURITIES AND EXCHANGE COMMISSION
Washington, D.C. 20549
Form N-CSR
CERTIFIED SHAREHOLDER REPORT OF REGISTERED
MANAGEMENT INVESTMENT COMPANIES
Investment Company Act File Number: 811-04015
Eaton Vance Mutual Funds Trust
(Exact Name of Registrant as Specified in Charter)
Two International Place, Boston, Massachusetts 02110
(Address of Principal Executive Offices)
Maureen A. Gemma
Two International Place, Boston, Massachusetts 02110
(Name and Address of Agent for Services)
(617) 482-8260
(Registrant’s Telephone Number)
September 30
Date of Fiscal Year End
March 31, 2015
Date of Reporting Period
Item 1. Reports to Stockholders

Eaton Vance
Municipal Income Funds
Semiannual Report
March 31, 2015
AMT-Free • National

Commodity Futures Trading Commission Registration. Effective December 31, 2012, the Commodity Futures Trading Commission (“CFTC”) adopted certain regulatory changes that subject registered investment companies and advisers to regulation by the CFTC if a fund invests more than a prescribed level of its assets in certain CFTC-regulated instruments (including futures, certain options and swap agreements) or markets itself as providing investment exposure to such instruments. Each Fund has claimed an exclusion from the definition of the term “commodity pool operator” under the Commodity Exchange Act. Accordingly, neither the Funds nor the adviser with respect to the operation of the Funds is subject to CFTC regulation. Because of its management of other strategies, each Fund’s adviser is registered with the CFTC as a commodity pool operator and a commodity trading advisor.
Fund shares are not insured by the FDIC and are not deposits or other obligations of, or guaranteed by, any depository institution. Shares are subject to investment risks, including possible loss of principal invested.
This report must be preceded or accompanied by a current summary prospectus or prospectus. Before investing, investors should consider carefully the investment objective, risks, and charges and expenses of a mutual fund. This and other important information is contained in the summary prospectus and prospectus, which can be obtained from a financial advisor. Prospective investors should read the prospectus carefully before investing. For further information, please call 1-800-262-1122.
Semiannual Report March 31, 2015
Eaton Vance
Municipal Income Funds
Table of Contents
| | | | |
Performance and Fund Profile | | | | |
| |
| | | | |
AMT-Free Municipal Income Fund | | | 2 | |
National Municipal Income Fund | | | 3 | |
| |
| | | | |
| |
Endnotes and Additional Disclosures | | | 4 | |
| |
Fund Expenses | | | 5 | |
| |
Financial Statements | | | 7 | |
| |
Officers and Trustees | | | 43 | |
| |
Important Notices | | | 44 | |
Eaton Vance
AMT-Free Municipal Income Fund
March 31, 2015
Performance1,2
Portfolio Manager Cynthia J. Clemson
| | | | | | | | | | | | | | | | | | | | | | | | |
| % Average Annual Total Returns | | Class
Inception Date | | | Performance
Inception Date | | | Six Months | | | One Year | | | Five Years | | | Ten Years | |
Class A at NAV | | | 01/06/1998 | | | | 03/16/1978 | | | | 2.02 | % | | | 8.34 | % | | | 5.68 | % | | | 4.20 | % |
Class A with 4.75% Maximum Sales Charge | | | — | | | | — | | | | –2.86 | | | | 3.17 | | | | 4.66 | | | | 3.69 | |
Class B at NAV | | | 01/14/1998 | | | | 03/16/1978 | | | | 1.64 | | | | 7.57 | | | | 4.90 | | | | 3.43 | |
Class B with 5% Maximum Sales Charge | | | — | | | | — | | | | –3.36 | | | | 2.57 | | | | 4.57 | | | | 3.43 | |
Class C at NAV | | | 05/02/2006 | | | | 03/16/1978 | | | | 1.64 | | | | 7.56 | | | | 4.90 | | | | 3.44 | |
Class C with 1% Maximum Sales Charge | | | — | | | | — | | | | 0.64 | | | | 6.56 | | | | 4.90 | | | | 3.44 | |
Class I at NAV | | | 03/16/1978 | | | | 03/16/1978 | | | | 2.15 | | | | 8.79 | | | | 5.96 | | | | 4.47 | |
Barclays Municipal Bond Index | | | — | | | | — | | | | 2.40 | % | | | 6.62 | % | | | 5.11 | % | | | 4.84 | % |
Barclays Long (22+) Year Municipal Bond Index | | | — | | | | — | | | | 3.98 | | | | 10.76 | | | | 6.89 | | | | 5.41 | |
| | | | | | |
| | | | | | | | | | | | | | | | | | | | | | | | |
| % Total Annual Operating Expense Ratios3 | | | | | | | | Class A | | | Class B | | | Class C | | | Class I | |
Gross | | | | | | | | | | | 0.92 | % | | | 1.67 | % | | | 1.67 | % | | | 0.67 | % |
Net | | | | | | | | | | | 0.83 | | | | 1.58 | | | | 1.58 | | | | 0.58 | |
| | | | | | |
| | | | | | | | | | | | | | | | | | | | | | | | |
| % Distribution Rates/Yields4 | | | | | | | | Class A | | | Class B | | | Class C | | | Class I | |
Distribution Rate | | | | | | | | | | | 4.03 | % | | | 3.26 | % | | | 3.26 | % | | | 4.28 | % |
Taxable-Equivalent Distribution Rate | | | | | | | | | | | 7.12 | | | | 5.76 | | | | 5.76 | | | | 7.56 | |
SEC 30-day Yield | | | | | | | | | | | 1.79 | | | | 1.14 | | | | 1.13 | | | | 2.12 | |
Taxable-Equivalent SEC 30-day Yield | | | | | | | | | | | 3.15 | | | | 2.01 | | | | 2.00 | | | | 3.75 | |
| | | | | | |
| | | | | | | | | | | | | | | | | | | | | | | | |
| % Total Leverage5 | | | | | | | | | | | | | | | | | | |
Residual Interest Bond (RIB) Financing | | | | | | | | | | | | | | | | | | | | | | | 10.32 | % |
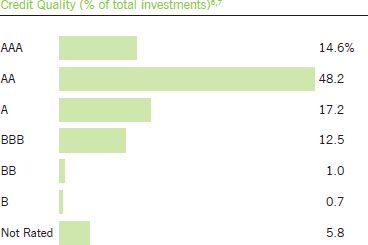
Fund Profile
See Endnotes and Additional Disclosures in this report.
Past performance is no guarantee of future results. Returns are historical and are calculated by determining the percentage change in net asset value (NAV) or offering price (as applicable) with all distributions reinvested. Investment return and principal value will fluctuate so that shares, when redeemed, may be worth more or less than their original cost. Performance less than one year is cumulative. Performance is for the stated time period only; due to market volatility, the Fund’s current performance may be lower or higher than quoted. Returns are before taxes unless otherwise noted. For performance as of the most recent month-end, please refer to eatonvance.com.
Eaton Vance
National Municipal Income Fund
March 31, 2015
Performance1,2
Portfolio Managers Thomas M. Metzold, CFA and Craig R. Brandon, CFA
| | | | | | | | | | | | | | | | | | | | | | | | |
| % Average Annual Total Returns | | Class
Inception Date | | | Performance
Inception Date | | | Six Months | | | One Year | | | Five Years | | | Ten Years | |
Class A at NAV | | | 04/05/1994 | | | | 12/19/1985 | | | | 2.48 | % | | | 9.30 | % | | | 5.69 | % | | | 4.03 | % |
Class A with 4.75% Maximum Sales Charge | | | — | | | | — | | | | –2.37 | | | | 4.13 | | | | 4.67 | | | | 3.53 | |
Class B at NAV | | | 12/19/1985 | | | | 12/19/1985 | | | | 2.10 | | | | 8.49 | | | | 4.91 | | | | 3.26 | |
Class B with 5% Maximum Sales Charge | | | — | | | | — | | | | –2.90 | | | | 3.49 | | | | 4.58 | | | | 3.26 | |
Class C at NAV | | | 12/03/1993 | | | | 12/19/1985 | | | | 2.10 | | | | 8.49 | | | | 4.91 | | | | 3.26 | |
Class C with 1% Maximum Sales Charge | | | — | | | | — | | | | 1.10 | | | | 7.49 | | | | 4.91 | | | | 3.26 | |
Class I at NAV | | | 07/01/1999 | | | | 12/19/1985 | | | | 2.50 | | | | 9.58 | | | | 5.96 | | | | 4.30 | |
Barclays Municipal Bond Index | | | — | | | | — | | | | 2.40 | % | | | 6.62 | % | | | 5.11 | % | | | 4.84 | % |
Barclays Long (22+) Year Municipal Bond Index | | | — | | | | — | | | | 3.98 | | | | 10.76 | | | | 6.89 | | | | 5.41 | |
| | | | | | |
| | | | | | | | | | | | | | | | | | | | | | | | |
| % Total Annual Operating Expense Ratios3 | | | | | | | | Class A | | | Class B | | | Class C | | | Class I | |
Gross | | | | | | | | | | | 0.80 | % | | | 1.55 | % | | | 1.55 | % | | | 0.55 | % |
Net | | | | | | | | | | | 0.71 | | | | 1.46 | | | | 1.46 | | | | 0.46 | |
| | | | | | |
| | | | | | | | | | | | | | | | | | | | | | | | |
| % Distribution Rates/Yields4 | | | | | | | | Class A | | | Class B | | | Class C | | | Class I | |
Distribution Rate | | | | | | | | | | | 3.91 | % | | | 3.16 | % | | | 3.15 | % | | | 4.16 | % |
Taxable-Equivalent Distribution Rate | | | | | | | | | | | 6.91 | | | | 5.58 | | | | 5.57 | | | | 7.35 | |
SEC 30-day Yield | | | | | | | | | | | 2.45 | | | | 1.84 | | | | 1.83 | | | | 2.82 | |
Taxable-Equivalent SEC 30-day Yield | | | | | | | | | | | 4.33 | | | | 3.26 | | | | 3.23 | | | | 4.98 | |
| | | | | | |
| | | | | | | | | | | | | | | | | | | | | | | | |
| % Total Leverage5 | | | | | | | | | | | | | | | | | | |
RIB Financing | | | | | | | | | | | | | | | | | | | | | | | 12.73 | % |
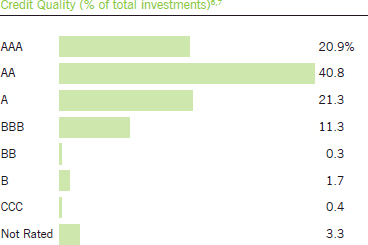
Fund Profile
See Endnotes and Additional Disclosures in this report.
Past performance is no guarantee of future results. Returns are historical and are calculated by determining the percentage change in net asset value (NAV) or offering price (as applicable) with all distributions reinvested. Investment return and principal value will fluctuate so that shares, when redeemed, may be worth more or less than their original cost. Performance less than one year is cumulative. Performance is for the stated time period only; due to market volatility, the Fund’s current performance may be lower or higher than quoted. Returns are before taxes unless otherwise noted. For performance as of the most recent month-end, please refer to eatonvance.com.
Eaton Vance
Municipal Income Funds
March 31, 2015
Endnotes and Additional Disclosures
| 1 | Barclays Municipal Bond Index is an unmanaged index of municipal bonds traded in the U.S. Barclays Long (22+) Year Municipal Bond Index is an unmanaged index of municipal bonds traded in the U.S. with maturities of 22 years or more. Unless otherwise stated, index returns do not reflect the effect of any applicable sales charges, commissions, expenses, taxes or leverage, as applicable. It is not possible to invest directly in an index. |
| 2 | Total Returns at NAV do not include applicable sales charges. If sales charges were deducted, the returns would be lower. Total Returns shown with maximum sales charge reflect the stated maximum sales charge. Unless otherwise stated, performance does not reflect the deduction of taxes on Fund distributions or redemptions of Fund shares. |
| | Performance prior to the inception date of a class may be linked to the performance of an older class of the Fund. This linked performance is adjusted for any applicable sales charge, but is not adjusted for class expense differences. If adjusted for such differences, the performance would be different. Performance presented in the financial highlights included in the financial statements is not linked. In the performance table, the performance of Class C is linked to Class B. Performance since inception for an index, if presented, is the performance since the Fund’s or oldest share class’ inception, as applicable. |
| 3 | Total annual operating expense ratios are as stated in the Fund’s most recent prospectus. Net expense ratio is not a result of a fee waiver or expense reimbursement. Net expense ratio excludes interest expense relating to the Fund’s liability with respect to floating rate notes held by third parties in conjunction with residual interest bond transactions by the Fund. The Fund also records offsetting interest income in an amount equal to this expense relating to the municipal obligations underlying such transactions and, as a result, net asset value and performance have not been affected by this expense. |
| 4 | The Distribution Rate is based on the Fund’s last regular distribution per share in the period (annualized) divided by the Fund’s NAV at the end of the period. The Fund’s distributions may be comprised of amounts characterized for federal income tax purposes as tax-exempt income, qualified and non-qualified ordinary dividends, capital gains and nondividend distributions, also known as return of capital. The Fund will determine the federal income tax character of distributions paid to a shareholder after the end of the calendar year. This is reported on the IRS form 1099- DIV and provided to the shareholder shortly after each year-end. The Fund’s distributions are determined by the investment adviser based on its current assessment of the Fund’s long-term return potential. As portfolio and market conditions change, the rate of distributions paid by the Fund could change. Taxable-equivalent performance is based on the highest combined federal and state income tax rates, where applicable. Lower tax rates would result in lower tax-equivalent performance. Actual tax rates will vary depending on your income, exemptions and deductions. Rates do not include local taxes. SEC Yield is a standardized measure based on the estimated yield to maturity of a fund’s investments over a 30-day period and is based on the maximum offer price at the date specified. The SEC Yield is not based on the distributions made by the Fund, which may differ. |
| 5 | Fund employs RIB financing. The leverage created by RIB investments provides an opportunity for increased income but, at the same time, creates special risks (including the likelihood of greater volatility of NAV). The cost of leverage rises and falls with changes in short-term interest rates. See “Floating Rate Notes Issued in Conjunction with Securities Held” in the notes to the financial statements for more information about RIB financing. RIB leverage represents the amount of Floating Rate Notes outstanding at period end as a percentage of Fund net assets plus Floating Rate Notes. |
| 6 | Ratings are based on Moody’s, S&P or Fitch, as applicable. If securities are rated differently by the ratings agencies, the higher rating is applied. Ratings, which are subject to change, apply to the creditworthiness of the issuers of the underlying securities and not to the Fund or its shares. Credit ratings measure the quality of a bond based on the issuer’s creditworthiness, with ratings ranging from AAA, being the highest, to D, being the lowest based on S&P’s measures. Ratings of BBB or higher by S&P or Fitch (Baa or higher by Moody’s) are considered to be investment- grade quality. Credit ratings are based largely on the ratings agency’s analysis at the time of rating. The rating assigned to any particular security is not necessarily a reflection of the issuer’s current financial condition and does not necessarily reflect its assessment of the volatility of a security’s market value or of the liquidity of an investment in the security. Holdings designated as “Not Rated” are not rated by the national ratings agencies stated above. |
| 7 | The chart includes the municipal bonds held by a trust that issues residual interest bonds, consistent with the Portfolio of Investments. |
| | Fund profile subject to change due to active management. |
Eaton Vance
Municipal Income Funds
March 31, 2015
Fund Expenses
Example: As a Fund shareholder, you incur two types of costs: (1) transaction costs, including sales charges (loads) on purchases and redemption fees (if applicable); and (2) ongoing costs, including management fees; distribution and/or service fees; and other Fund expenses. This Example is intended to help you understand your ongoing costs (in dollars) of Fund investing and to compare these costs with the ongoing costs of investing in other mutual funds. The Example is based on an investment of $1,000 invested at the beginning of the period and held for the entire period (October 1, 2014 – March 31, 2015).
Actual Expenses: The first section of each table below provides information about actual account values and actual expenses. You may use the information in this section, together with the amount you invested, to estimate the expenses that you paid over the period. Simply divide your account value by $1,000 (for example, an $8,600 account value divided by $1,000 = 8.6), then multiply the result by the number in the first section under the heading entitled “Expenses Paid During Period” to estimate the expenses you paid on your account during this period.
Hypothetical Example for Comparison Purposes: The second section of each table below provides information about hypothetical account values and hypothetical expenses based on the actual Fund expense ratio and an assumed rate of return of 5% per year (before expenses), which is not the actual Fund return. The hypothetical account values and expenses may not be used to estimate the actual ending account balance or expenses you paid for the period. You may use this information to compare the ongoing costs of investing in your Fund and other funds. To do so, compare this 5% hypothetical example with the 5% hypothetical examples that appear in the shareholder reports of the other funds.
Please note that the expenses shown in each table are meant to highlight your ongoing costs only and do not reflect any transactional costs, such as sales charges (loads) or redemption fees (if applicable). Therefore, the second section of each table is useful in comparing ongoing costs only, and will not help you determine the relative total costs of owning different funds. In addition, if these transactional costs were included, your costs would be higher.
Eaton Vance AMT-Free Municipal Income Fund
| | | | | | | | | | | | | | | | |
| | | Beginning
Account Value
(10/1/14) | | | Ending
Account Value
(3/31/15) | | | Expenses Paid
During Period*
(10/1/14 – 3/31/15) | | | Annualized
Expense
Ratio | |
| | | | |
| | | | | | | | | | | | | | | | |
Actual | | | | | | | | | | | | | |
Class A | | $ | 1,000.00 | | | $ | 1,020.20 | | | $ | 4.53 | | | | 0.90 | % |
Class B | | $ | 1,000.00 | | | $ | 1,016.40 | | | $ | 8.29 | | | | 1.65 | % |
Class C | | $ | 1,000.00 | | | $ | 1,016.40 | | | $ | 8.29 | | | | 1.65 | % |
Class I | | $ | 1,000.00 | | | $ | 1,021.50 | | | $ | 3.28 | | | | 0.65 | % |
| | | | | | | | | | | | | | | | | |
| | | | |
| | | | | | | | | | | | | | | | |
Hypothetical | | | | | | | | | | | | | |
(5% return per year before expenses) | | | | | | | | | | | | | |
Class A | | $ | 1,000.00 | | | $ | 1,020.40 | | | $ | 4.53 | | | | 0.90 | % |
Class B | | $ | 1,000.00 | | | $ | 1,016.70 | | | $ | 8.30 | | | | 1.65 | % |
Class C | | $ | 1,000.00 | | | $ | 1,016.70 | | | $ | 8.30 | | | | 1.65 | % |
Class I | | $ | 1,000.00 | | | $ | 1,021.70 | | | $ | 3.28 | | | | 0.65 | % |
| * | Expenses are equal to the Fund’s annualized expense ratio for the indicated Class, multiplied by the average account value over the period, multiplied by 182/365 (to reflect the one-half year period). The Example assumes that the $1,000 was invested at the net asset value per share determined at the close of business on September 30, 2014. |
Eaton Vance
Municipal Income Funds
March 31, 2015
Fund Expenses — continued
Eaton Vance National Municipal Income Fund
| | | | | | | | | | | | | | | | |
| | | Beginning
Account Value
(10/1/14) | | | Ending
Account Value
(3/31/15) | | | Expenses Paid
During Period*
(10/1/14 – 3/31/15) | | | Annualized
Expense
Ratio | |
| | | | |
| | | | | | | | | | | | | | | | |
Actual | | | | | | | | | | | | | |
Class A | | $ | 1,000.00 | | | $ | 1,024.80 | | | $ | 3.79 | | | | 0.75 | % |
Class B | | $ | 1,000.00 | | | $ | 1,021.00 | | | $ | 7.56 | | | | 1.50 | % |
Class C | | $ | 1,000.00 | | | $ | 1,021.00 | | | $ | 7.56 | | | | 1.50 | % |
Class I | | $ | 1,000.00 | | | $ | 1,025.00 | | | $ | 2.52 | | | | 0.50 | % |
| | | | | | | | | | | | | | | | | |
| | | | |
| | | | | | | | | | | | | | | | |
Hypothetical | | | | | | | | | | | | | |
(5% return per year before expenses) | | | | | | | | | | | | | |
Class A | | $ | 1,000.00 | | | $ | 1,021.20 | | | $ | 3.78 | | | | 0.75 | % |
Class B | | $ | 1,000.00 | | | $ | 1,017.50 | | | $ | 7.54 | | | | 1.50 | % |
Class C | | $ | 1,000.00 | | | $ | 1,017.50 | | | $ | 7.54 | | | | 1.50 | % |
Class I | | $ | 1,000.00 | | | $ | 1,022.40 | | | $ | 2.52 | | | | 0.50 | % |
| * | Expenses are equal to the Fund’s annualized expense ratio for the indicated Class, multiplied by the average account value over the period, multiplied by 182/365 (to reflect the one-half year period). The Example assumes that the $1,000 was invested at the net asset value per share determined at the close of business on September 30, 2014. |
Eaton Vance
AMT-Free Municipal Income Fund
March 31, 2015
Portfolio of Investments (Unaudited)
| | | | | | | | |
| Tax-Exempt Investments — 107.1% | |
| | |
| | | | | | | | |
| Security | | Principal Amount (000’s omitted) | | | Value | |
| | | | | | | | |
|
Bond Bank — 4.6% | |
Idaho Bond Bank Authority, 5.25%, 9/15/25 | | $ | 1,160 | | | $ | 1,329,894 | |
Idaho Bond Bank Authority, 5.375%, 9/15/27 | | | 1,555 | | | | 1,780,288 | |
New York Environmental Facilities Corp., 5.00%, 10/15/35(1) | | | 9,900 | | | | 11,329,857 | |
Rhode Island Clean Water Finance Agency, 5.00%, 10/1/32 | | | 1,400 | | | | 1,644,272 | |
| | | | | | | | | |
| | | | | | $ | 16,084,311 | |
| | | | | | | | | |
|
Education — 4.4% | |
Missouri Health and Educational Facilities Authority, (Washington University), 5.375%, 3/15/39(1) | | $ | 4,110 | | | $ | 4,571,717 | |
Oregon Facilities Authority, (Lewis & Clark College), 5.625%, 10/1/36 | | | 1,050 | | | | 1,263,003 | |
University of California, 5.25%, 5/15/35 | | | 3,555 | | | | 4,277,163 | |
University of Nebraska Facilities Corp., (UNMC Cancer Center), 5.00%, 2/15/23 | | | 415 | | | | 512,193 | |
University of Nebraska Facilities Corp., (UNMC Cancer Center), 5.00%, 2/15/24 | | | 1,120 | | | | 1,386,370 | |
West Virginia University, 5.00%, 10/1/31 | | | 3,000 | | | | 3,472,260 | |
| | | | | | | | | |
| | | | | | $ | 15,482,706 | |
| | | | | | | | | |
|
Electric Utilities — 8.9% | |
Apache County, AZ, Industrial Development Authority, (Tucson Electric Power Co.), 4.50%, 3/1/30 | | $ | 1,605 | | | $ | 1,727,317 | |
Beaver County, PA, Industrial Development Authority, (FirstEnergy Nuclear Generation, LLC), 3.50% to 6/1/20 (Put Date), 12/1/35 | | | 3,050 | | | | 3,173,128 | |
Chula Vista, CA, (San Diego Gas and Electric), 5.875%, 2/15/34 | | | 3,520 | | | | 4,163,315 | |
Ohio Water Development Authority, (FirstEnergy Nuclear Generation, LLC), 4.00% to 6/3/19 (Put Date), 12/1/33 | | | 3,200 | | | | 3,421,344 | |
Pima County, AZ, Industrial Development Authority, (Tucson Electric Power Co.), 5.25%, 10/1/40 | | | 1,410 | | | | 1,572,629 | |
San Antonio, TX, (Electric and Gas Systems), 5.00%, 2/1/34(1) | | | 7,000 | | | | 7,807,800 | |
Utility Debt Securitization Authority, NY, 5.00%, 12/15/33 | | | 2,895 | | | | 3,415,782 | |
Vernon, CA, Electric System Revenue, 5.125%, 8/1/21 | | | 5,505 | | | | 6,208,429 | |
| | | | | | | | | |
| | | | | | $ | 31,489,744 | |
| | | | | | | | | |
|
Escrowed / Prerefunded — 5.9% | |
Foothill/Eastern Transportation Corridor Agency, CA, Escrowed to Maturity, 0.00%, 1/1/18 | | $ | 10,000 | | | $ | 9,768,100 | |
Idaho Health Facilities Authority, (Trinity Health Credit Group), Prerefunded to 12/1/18, 6.25%, 12/1/33 | | | 2,985 | | | | 3,546,359 | |
New York Dormitory Authority, (NYU Hospitals Center), Prerefunded to 7/1/17, 5.625%, 7/1/37 | | | 1,865 | | | | 2,070,784 | |
| | | | | | | | |
| Security | | Principal Amount (000’s omitted) | | | Value | |
| | | | | | | | |
|
Escrowed / Prerefunded (continued) | |
Savannah, GA, Economic Development Authority, Escrowed to Maturity, 0.00%, 12/1/21 | | $ | 6,000 | | | $ | 5,381,280 | |
| | | | | | | | | |
| | | | | | $ | 20,766,523 | |
| | | | | | | | | |
|
General Obligations — 11.6% | |
Beaverton School District 48J, Washington and Multnomah Counties, OR, 5.00%, 6/15/32 | | $ | 2,465 | | | $ | 2,919,866 | |
California, 5.00%, 10/1/24 | | | 960 | | | | 1,192,560 | |
California, 5.00%, 10/1/26 | | | 1,300 | | | | 1,584,063 | |
California, 5.00%, 10/1/27 | | | 630 | | | | 761,563 | |
California, 5.00%, 2/1/31 | | | 1,405 | | | | 1,627,440 | |
California, 5.25%, 10/1/29 | | | 560 | | | | 660,324 | |
California, 5.25%, 10/1/32 | | | 3,480 | | | | 4,080,474 | |
Foothill-De Anza Community College District, CA, 5.00%, 8/1/34 | | | 1,150 | | | | 1,361,680 | |
Foothill-De Anza Community College District, CA, 5.00%, 8/1/36 | | | 1,150 | | | | 1,356,494 | |
Kane, Cook and DuPage Counties, IL, School District No. 46, 5.00%, 1/1/31 | | | 4,470 | | | | 5,123,693 | |
Salem-Keizer, OR, School District No. 24J, 0.00%, 6/15/24 | | | 1,220 | | | | 971,657 | |
Santa Clara County, CA, (Election of 2008), 5.00%, 8/1/39(1)(2) | | | 7,700 | | | | 8,777,538 | |
Tuscaloosa, AL, 5.00%, 1/1/35 | | | 2,000 | | | | 2,276,040 | |
University of Connecticut, 5.00%, 2/15/32 | | | 1,150 | | | | 1,339,646 | |
Washington, 5.25%, 2/1/36(1) | | | 6,000 | | | | 7,051,860 | |
| | | | | | | | | |
| | | | | | $ | 41,084,898 | |
| | | | | | | | | |
|
Health Care – Miscellaneous — 0.2% | |
Suffolk County, NY, Industrial Development Agency, (Alliance of Long Island Agencies), 7.50%, 9/1/15 | | $ | 85 | | | $ | 86,115 | |
Tax Exempt Securities Trust, Community Health Provider, (Pooled Loan Program Various States Trust Certificates), 6.00%, 12/1/36(3) | | | 83 | | | | 85,133 | |
Tax Exempt Securities Trust, Community Health Provider, (Pooled Loan Program Various States Trust Certificates), Series 1, 5.50%, 12/1/36(3) | | | 294 | | | | 294,164 | |
Tax Exempt Securities Trust, Community Health Provider, (Pooled Loan Program Various States Trust Certificates), Series 2, 5.50%, 12/1/36(3) | | | 350 | | | | 358,173 | |
| | | | | | | | | |
| | | | | | $ | 823,585 | |
| | | | | | | | | |
|
Hospital — 14.6% | |
California Health Facilities Financing Authority, (Catholic Healthcare West), 5.25%, 3/1/28 | | $ | 535 | | | $ | 607,717 | |
California Health Facilities Financing Authority, (Providence Health System), 5.50%, 10/1/39 | | | 5,175 | | | | 6,030,790 | |
| | | | |
| | 7 | | See Notes to Financial Statements. |
Eaton Vance
AMT-Free Municipal Income Fund
March 31, 2015
Portfolio of Investments (Unaudited) — continued
| | | | | | | | |
| Security | | Principal Amount (000’s omitted) | | | Value | |
| | | | | | | | |
|
Hospital (continued) | |
California Health Facilities Financing Authority, (St. Joseph Health System), 5.00%, 7/1/33 | | $ | 1,720 | | | $ | 1,980,528 | |
California Health Facilities Financing Authority, (St. Joseph Health System), 5.00%, 7/1/37 | | | 2,380 | | | | 2,712,415 | |
California Health Facilities Financing Authority, (Sutter Health), 5.25%, 8/15/31 | | | 1,325 | | | | 1,543,466 | |
California Statewide Communities Development Authority, (John Muir Health), 5.00%, 7/1/29 | | | 1,330 | | | | 1,496,955 | |
California Statewide Communities Development Authority, (Loma Linda University Medical Center), 5.25%, 12/1/34 | | | 3,000 | | | | 3,368,370 | |
Henrico County, VA, Economic Development Authority, (Bon Secours Health System, Inc.), 5.00%, 11/1/30 | | | 1,185 | | | | 1,343,363 | |
Illinois Finance Authority, (Provena Healthcare), 7.75%, 8/15/34 | | | 7,120 | | | | 8,852,581 | |
Kansas Development Finance Authority, (Adventist Health System), 5.75%, 11/15/38 | | | 5,230 | | | | 6,101,736 | |
Massachusetts Development Finance Agency, (Children’s Hospital), 5.00%, 10/1/31 | | | 2,110 | | | | 2,491,003 | |
Massachusetts Development Finance Agency, (Tufts Medical Center), 6.75%, 1/1/36 | | | 785 | | | | 933,655 | |
New York Dormitory Authority, (Orange Regional Medical Center), 6.25%, 12/1/37 | | | 3,380 | | | | 3,722,124 | |
Oklahoma Development Finance Authority, (St. John Health System), 5.00%, 2/15/34 | | | 2,035 | | | | 2,290,026 | |
Oneida County, NY, Industrial Development Agency, (St. Elizabeth Medical Center), 5.75%, 12/1/19 | | | 1,060 | | | | 1,062,661 | |
Orange County, FL, Health Facilities Authority, (Orlando Health, Inc.), 5.375%, 10/1/23 | | | 1,000 | | | | 1,152,350 | |
Tarrant County Cultural Education Facilities Finance Corp., TX, (Cook Children’s Medical Center), 5.25%, 12/1/39(1) | | | 5,000 | | | | 5,844,450 | |
| | | | | | | | | |
| | | | | | $ | 51,534,190 | |
| | | | | | | | | |
|
Housing — 0.1% | |
Texas Student Housing Corp., (University of North Texas), 9.375%, 7/1/06(4) | | $ | 285 | | | $ | 208,039 | |
| | | | | | | | | |
| | | | | | $ | 208,039 | |
| | | | | | | | | |
|
Industrial Development Revenue — 1.0% | |
Hardeman County Correctional Facilities Corp., TN, 7.75%, 8/1/17 | | $ | 345 | | | $ | 345,007 | |
Selma, AL, Industrial Development Board, (International Paper Co.), 5.80%, 5/1/34 | | | 2,670 | | | | 3,085,612 | |
| | | | | | | | | |
| | | | | | $ | 3,430,619 | |
| | | | | | | | | |
| | | | | | | | |
| Security | | Principal Amount (000’s omitted) | | | Value | |
| | | | | | | | |
|
Insured – Education — 0.6% | |
Virginia College Building Authority, (Washington and Lee University), (NPFG), 5.25%, 1/1/31 | | $ | 1,750 | | | $ | 2,226,052 | |
| | | | | | | | | |
| | | | | | $ | 2,226,052 | |
| | | | | | | | | |
|
Insured – Electric Utilities — 2.3% | |
Long Island Power Authority, NY, Electric System Revenue, (BHAC), 5.75%, 4/1/33 | | $ | 5,415 | | | $ | 6,310,424 | |
Ohio Municipal Electric Generation Agency, (NPFG), 0.00%, 2/15/29 | | | 2,865 | | | | 1,805,810 | |
| | | | | | | | | |
| | | | | | $ | 8,116,234 | |
| | | | | | | | | |
|
Insured – Escrowed / Prerefunded — 0.4% | |
Texas Transportation Commission, (Central Texas Turnpike System), (AMBAC), Escrowed to Maturity, 0.00%, 8/15/21 | | $ | 1,560 | | | $ | 1,394,110 | |
| | | | | | | | | |
| | | | | | $ | 1,394,110 | |
| | | | | | | | | |
|
Insured – General Obligations — 1.0% | |
Chicago, IL, (AGM), 5.25%, 1/1/31 | | $ | 1,900 | | | $ | 2,118,310 | |
Chicago Park District, IL, (BAM), 5.00%, 1/1/29 | | | 475 | | | | 546,825 | |
Yuma and La Paz Counties, AZ, Community College District, (Arizona Western College), (NPFG), 3.75%, 7/1/31 | | | 985 | | | | 993,845 | |
| | | | | | | | | |
| | | | | | $ | 3,658,980 | |
| | | | | | | | | |
|
Insured – Lease Revenue / Certificates of Participation — 1.2% | |
Anaheim, CA, Public Financing Authority, (Anaheim Public Improvements), (AGM), 0.00%, 9/1/31 | | $ | 8,680 | | | $ | 4,397,635 | |
| | | | | | | | | |
| | | | | | $ | 4,397,635 | |
| | | | | | | | | |
|
Insured – Other Revenue — 1.3% | |
Harris County-Houston Sports Authority, TX, (AGM), (NPFG), 0.00%, 11/15/34 | | $ | 10,600 | | | $ | 4,451,682 | |
| | | | | | | | | |
| | | | | | $ | 4,451,682 | |
| | | | | | | | | |
|
Insured – Special Tax Revenue — 5.8% | |
Alabama Public School and College Authority, (AGM), 2.50%, 12/1/27 | | $ | 6,030 | | | $ | 5,910,244 | |
Massachusetts, Special Obligation, Dedicated Tax Revenue, (NPFG), 5.50%, 1/1/27 | | | 6,000 | | | | 7,653,780 | |
Massachusetts, Special Obligation, Dedicated Tax Revenue, (NPFG), 5.50%, 1/1/30 | | | 2,565 | | | | 3,303,335 | |
McKay Landing Metropolitan District No. 2, CO, (AMBAC), 4.25%, 12/1/36 | | | 1,300 | | | | 1,251,757 | |
Puerto Rico Sales Tax Financing Corp., (NPFG), 0.00%, 8/1/45 | | | 6,245 | | | | 839,828 | |
Puerto Rico Sales Tax Financing Corp., (NPFG), 0.00%, 8/1/46 | | | 12,295 | | | | 1,547,572 | |
| | | | | | | | | |
| | | | | | $ | 20,506,516 | |
| | | | | | | | | |
| | | | |
| | 8 | | See Notes to Financial Statements. |
Eaton Vance
AMT-Free Municipal Income Fund
March 31, 2015
Portfolio of Investments (Unaudited) — continued
| | | | | | | | |
| Security | | Principal Amount (000’s omitted) | | | Value | |
| | | | | | | | |
|
Insured – Transportation — 3.2% | |
Chicago, IL, (O’Hare International Airport), (AGM), 5.00%, 1/1/28 | | $ | 1,000 | | | $ | 1,153,780 | |
Chicago, IL, (O’Hare International Airport), (AGM), 5.125%, 1/1/31 | | | 1,000 | | | | 1,146,670 | |
Chicago, IL, (O’Hare International Airport), (AGM), 5.25%, 1/1/32 | | | 785 | | | | 903,951 | |
E-470 Public Highway Authority, CO, (NPFG), 0.00%, 9/1/39 | | | 7,120 | | | | 2,237,816 | |
New Orleans, LA, Aviation Board, (AGC), 6.00%, 1/1/23 | | | 1,040 | | | | 1,206,702 | |
Texas Transportation Commission, (Central Texas Turnpike System), (AMBAC), 0.00%, 8/15/21 | | | 5,285 | | | | 4,617,663 | |
| | | | | | | | | |
| | | | | | $ | 11,266,582 | |
| | | | | | | | | |
|
Insured – Water and Sewer — 3.4% | |
Chicago, IL, Wastewater Transmission Revenue, (BHAC), 5.50%, 1/1/38 | | $ | 4,155 | | | $ | 4,574,987 | |
Detroit, MI, Sewage Disposal System, (AGM), 5.00%, 7/1/39 | | | 4,825 | | | | 5,249,214 | |
Michigan Finance Authority, (Detroit Water and Sewerage Department), (AGM), 5.00%, 7/1/32 | | | 655 | | | | 734,229 | |
Michigan Finance Authority, (Detroit Water and Sewerage Department), (AGM), 5.00%, 7/1/33 | | | 565 | | | | 630,975 | |
Michigan Finance Authority, (Detroit Water and Sewerage Department), (AGM), 5.00%, 7/1/35 | | | 280 | | | | 311,293 | |
Michigan Finance Authority, (Detroit Water and Sewerage Department), (AGM), 5.00%, 7/1/37 | | | 565 | | | | 627,201 | |
| | | | | | | | | |
| | | | | | $ | 12,127,899 | |
| | | | | | | | | |
|
Other Revenue — 6.7% | |
Brooklyn Arena Local Development Corp., NY, (Barclays Center), 6.00%, 7/15/30 | | $ | 880 | | | $ | 1,032,918 | |
Brooklyn Arena Local Development Corp., NY, (Barclays Center), 6.25%, 7/15/40 | | | 1,320 | | | | 1,560,359 | |
Central Falls Detention Facility Corp., RI, 7.25%, 7/15/35(5) | | | 1,200 | | | | 300,636 | |
Mohegan Tribe of Indians Gaming Authority, CT, (Public Improvements), 6.25%, 1/1/21(3) | | | 1,000 | | | | 1,000,150 | |
New York Liberty Development Corp., (3 World Trade Center), 5.00%, 11/15/44(3) | | | 3,500 | | | | 3,697,715 | |
New York, NY, Transitional Finance Authority, (Building Aid), 6.00%, 7/15/38 | | | 7,250 | | | | 8,363,817 | |
Otero County, NM, Jail Project Revenue, 5.75%, 4/1/18 | | | 345 | | | | 337,910 | |
Salt Verde Financial Corp., AZ, Senior Gas Revenue, 5.00%, 12/1/37 | | | 3,485 | | | | 4,081,388 | |
Seminole Tribe, FL, 5.50%, 10/1/24(3) | | | 1,150 | | | | 1,236,296 | |
White Earth Band of Chippewa Indians, MN, 6.375%, 12/1/26(3) | | | 2,070 | | | | 2,115,851 | |
| | | | | | | | | |
| | | | | | $ | 23,727,040 | |
| | | | | | | | | |
| | | | | | | | |
| Security | | Principal Amount (000’s omitted) | | | Value | |
| | | | | | | | |
|
Senior Living / Life Care — 3.7% | |
Fairfax County, VA, Economic Development Authority, (Goodwin House, Inc.), 5.125%, 10/1/37 | | $ | 1,595 | | | $ | 1,655,562 | |
Fairfax County, VA, Economic Development Authority, (Goodwin House, Inc.), 5.125%, 10/1/42 | | | 2,255 | | | | 2,334,602 | |
Kansas City, MO, Industrial Development Authority, (Kingswood United Methodist Manor), 5.875%, 11/15/29 | | | 1,480 | | | | 1,480,415 | |
Maryland Health and Higher Educational Facilities Authority, (Charlestown Community, Inc.), 6.125%, 1/1/30 | | | 1,650 | | | | 1,869,582 | |
North Miami, FL, (Imperial Club), 6.125%, 1/1/42 | | | 1,480 | | | | 1,028,570 | |
Palm Beach County Health Facilities Authority, FL, (Sinai Residences of Boca Raton), 7.25%, 6/1/39 | | | 570 | | | | 650,319 | |
Palm Beach County Health Facilities Authority, FL, (Sinai Residences of Boca Raton), 7.50%, 6/1/49 | | | 2,690 | | | | 3,089,707 | |
Tempe, AZ, Industrial Development Authority, (Friendship Village of Tempe), 6.00%, 12/1/32 | | | 160 | | | | 174,931 | |
Tempe, AZ, Industrial Development Authority, (Friendship Village of Tempe), 6.25%, 12/1/42 | | | 660 | | | | 723,848 | |
| | | | | | | | | |
| | | | | | $ | 13,007,536 | |
| | | | | | | | | |
|
Special Tax Revenue — 3.7% | |
Baltimore, MD, (Clipper Mill), 6.25%, 9/1/33 | | $ | 2,398 | | | $ | 2,421,908 | |
Baltimore, MD, (Strathdale Manor), 7.00%, 7/1/33 | | | 744 | | | | 746,790 | |
Bridgeville, DE, (Heritage Shores Special Development District), 5.45%, 7/1/35 | | | 1,117 | | | | 1,118,955 | |
Jurupa Public Financing Authority, CA, 5.00%, 9/1/31 | | | 1,200 | | | | 1,362,888 | |
Puerto Rico Sales Tax Financing Corp., 5.00%, 8/1/40 | | | 2,340 | | | | 1,646,003 | |
River Hall Community Development District, FL, (Capital Improvements), 5.45%, 5/1/36 | | | 1,100 | | | | 1,099,934 | |
Successor Agency to La Quinta Redevelopment Agency, CA, 5.00%, 9/1/30 | | | 4,125 | | | | 4,856,568 | |
| | | | | | | | | |
| | | | | | $ | 13,253,046 | |
| | | | | | | | | |
|
Transportation — 19.9% | |
Central Texas Regional Mobility Authority, 5.75%, 1/1/31 | | $ | 415 | | | $ | 482,935 | |
Dallas and Fort Worth, TX, (Dallas/Fort Worth International Airport), 5.25%, 11/1/30 | | | 1,100 | | | | 1,296,977 | |
Dallas and Fort Worth, TX, (Dallas/Fort Worth International Airport), 5.25%, 11/1/31 | | | 1,455 | | | | 1,711,924 | |
Delaware River Port Authority of Pennsylvania and New Jersey, 5.00%, 1/1/31 | | | 1,320 | | | | 1,520,693 | |
Grand Parkway Transportation Corp., TX, 5.125%, 10/1/43 | | | 1,100 | | | | 1,209,219 | |
Metropolitan Transportation Authority, NY, 6.25%, 11/15/23 | | | 2,250 | | | | 2,669,152 | |
Metropolitan Transportation Authority, NY, 6.50%, 11/15/28 | | | 5,000 | | | | 5,968,050 | |
Miami-Dade County, FL, Aviation Revenue, 5.00%, 10/1/33 | | | 6,450 | | | | 7,411,695 | |
New Jersey Transportation Trust Fund Authority, (Transportation System), 6.00%, 12/15/38 | | | 4,820 | | | | 5,528,492 | |
| | | | |
| | 9 | | See Notes to Financial Statements. |
Eaton Vance
AMT-Free Municipal Income Fund
March 31, 2015
Portfolio of Investments (Unaudited) — continued
| | | | | | | | |
| Security | | Principal Amount (000’s omitted) | | | Value | |
| | | | | | | | |
|
Transportation (continued) | |
New Jersey Turnpike Authority, 5.00%, 1/1/30 | | $ | 3,060 | | | $ | 3,498,835 | |
New York Liberty Development Corp., (4 World Trade Center), 5.00%, 11/15/31 | | | 1,235 | | | | 1,402,948 | |
Pennsylvania Turnpike Commission, 6.375%, (0.00% until 12/1/17), 12/1/38 | | | 11,500 | | | | 12,565,360 | |
San Joaquin Hills Transportation Corridor Agency, CA, 5.00%, 1/15/34 | | | 5,235 | | | | 5,853,201 | |
Texas Private Activity Bond Surface Transportation Corp., (LBJ Express Managed Lanes Project), 7.00%, 6/30/34 | | | 3,500 | | | | 4,274,095 | |
Texas Private Activity Bond Surface Transportation Corp., (North Tarrant Express Managed Lanes Project), 6.875%, 12/31/39 | | | 2,980 | | | | 3,566,255 | |
Triborough Bridge and Tunnel Authority, NY, 5.25%, 11/15/34(1) | | | 10,000 | | | | 11,380,300 | |
| | | | | | | | | |
| | | | | | $ | 70,340,131 | |
| | | | | | | | | |
|
Water and Sewer — 2.6% | |
Chicago, IL, Water Revenue, 5.00%, 11/1/33 | | $ | 1,200 | | | $ | 1,348,560 | |
New York, NY, Municipal Water Finance Authority, (Water and Sewer System), 5.75%, 6/15/40(1)(2) | | | 6,855 | | | | 7,863,439 | |
| | | | | | | | | |
| | | | | | $ | 9,211,999 | |
| | | | | | | | | |
| |
Total Tax-Exempt Investments — 107.1%
(identified cost $336,152,367) | | | $ | 378,590,057 | |
| | | | | | | | | |
| |
Other Assets, Less Liabilities — (7.1)% | | | $ | (24,951,525 | ) |
| | | | | | | | | |
| |
Net Assets — 100.0% | | | $ | 353,638,532 | |
| | | | | | | | | |
The percentage shown for each investment category in the Portfolio of Investments is based on net assets.
| | | | |
| AGC | | – | | Assured Guaranty Corp. |
| AGM | | – | | Assured Guaranty Municipal Corp. |
| AMBAC | | – | | AMBAC Financial Group, Inc. |
| BAM | | – | | Build America Mutual Assurance Co. |
| BHAC | | – | | Berkshire Hathaway Assurance Corp. |
| NPFG | | – | | National Public Finance Guaranty Corp. |
At March 31, 2015, the concentration of the Fund’s investments in the various states and territories, determined as a percentage of net assets, is as follows:
| | | | |
| California | | | 22.6% | |
| New York | | | 20.3% | |
| Texas | | | 10.4% | |
| Others, representing less than 10% individually | | | 53.8% | |
The Fund invests primarily in debt securities issued by municipalities. The ability of the issuers of the debt securities to meet their obligations may be affected by economic developments in a specific industry or municipality. In order to reduce the risk associated with such economic developments, at March 31, 2015, 18.0% of total investments are backed by bond insurance of various financial institutions and financial guaranty assurance agencies. The aggregate percentage insured by an individual financial institution or financial guaranty assurance agency ranged from 0.1% to 7.3% of total investments.
| (1) | Security represents the municipal bond held by a trust that issues residual interest bonds (see Note 1I). |
| (2) | Security (or a portion thereof) has been pledged as collateral for residual interest bond transactions. The aggregate value of such collateral is $6,295,977. |
| (3) | Security exempt from registration pursuant to Rule 144A under the Securities Act of 1933. These securities may be sold in certain transactions (normally to qualified institutional buyers) and remain exempt from registration. At March 31, 2015, the aggregate value of these securities is $8,787,482 or 2.5% of the Fund’s net assets. |
| (4) | The issuer is in default on the payment of principal but continues to pay interest. |
| (5) | Security is in default and making only partial interest payments. |
| | | | |
| | 10 | | See Notes to Financial Statements. |
Eaton Vance
National Municipal Income Fund
March 31, 2015
Portfolio of Investments (Unaudited)
| | | | | | | | |
| Tax-Exempt Municipal Securities — 108.1% | |
| | |
| | | | | | | | |
| Security | | Principal
Amount
(000’s omitted) | | | Value | |
| | | | | | | | |
| | |
Bond Bank — 1.3% | | | | | | | | |
Oklahoma Water Resources Board, 5.25%, 4/1/36 | | $ | 14,165 | | | $ | 16,357,034 | |
Rickenbacker Port Authority, OH, (OASBO Expanded Asset Pooled Financing Program), 5.375%, 1/1/32 | | | 27,915 | | | | 28,814,979 | |
| | | | | | | | | |
| | | | | | $ | 45,172,013 | |
| | | | | | | | | |
| | |
Cogeneration — 0.4% | | | | | | | | |
Northampton County, PA, Industrial Development Authority, (Northampton Generating), 5.00%, 12/31/23(1) | | $ | 14,652 | | | $ | 13,380,787 | |
| | | | | | | | | |
| | | | | | $ | 13,380,787 | |
| | | | | | | | | |
| | |
Education — 5.8% | | | | | | | | |
Missouri Health and Educational Facilities Authority, (Washington University), 5.375%, 3/15/39(2) | | $ | 45,615 | | | $ | 50,739,389 | |
New York Dormitory Authority, (Columbia University), 5.00%, 10/1/25(3) | | | 3,500 | | | | 4,493,825 | |
North Carolina State University at Raleigh, 5.00%, 10/1/37 | | | 8,620 | | | | 10,024,370 | |
Oregon Facilities Authority, (Lewis & Clark College), 5.625%, 10/1/36 | | | 9,930 | | | | 11,944,400 | |
Rutgers State University, NJ, 5.00%, 5/1/43(2)(4) | | | 37,000 | | | | 42,275,830 | |
University of California, 5.25%, 5/15/36 | | | 7,080 | | | | 8,505,558 | |
University of California, 5.25%, 5/15/37 | | | 13,000 | | | | 15,582,710 | |
University of California, 5.25%, 5/15/38 | | | 7,700 | | | | 9,216,053 | |
University of Massachusetts Building Authority, 5.00%, 11/1/31 | | | 7,815 | | | | 9,404,024 | |
University of Missouri, 5.00%, 11/1/24 | | | 3,000 | | | | 3,776,790 | |
University of Nebraska Facilities Corp., (UNMC Cancer Center), 5.00%, 2/15/23 | | | 3,860 | | | | 4,764,012 | |
University of Nebraska Facilities Corp., (UNMC Cancer Center), 5.00%, 2/15/24 | | | 10,380 | | | | 12,848,675 | |
University of Virginia, 5.00%, 8/1/21(3) | | | 10,650 | | | | 12,923,243 | |
| | | | | | | | | |
| | | | | | $ | 196,498,879 | |
| | | | | | | | | |
| | |
Electric Utilities — 7.6% | | | | | | | | |
Hawaii Department of Budget and Finance, (Hawaiian Electric Co.), 6.50%, 7/1/39 | | $ | 8,600 | | | $ | 9,987,868 | |
Ohio Water Development Authority, (FirstEnergy Nuclear Generation, LLC), (AMT), 3.95% to 5/1/20 (Put Date), 11/1/32 | | | 8,000 | | | | 8,374,960 | |
Omaha, NE, Public Power District, 5.00%, 2/1/31 | | | 15,355 | | | | 18,125,963 | |
San Antonio, TX, (Electric and Gas Systems), 5.00%, 2/1/34(2) | | | 41,100 | | | | 45,842,940 | |
South Carolina Public Service Authority, 5.00%, 12/1/26 | | | 11,140 | | | | 13,383,707 | |
Unified Government of Wyandotte County/Kansas City, KS, Board of Public Utilities, 5.00%, 9/1/32 | | | 10,000 | | | | 11,406,400 | |
| | | | | | | | |
| Security | | Principal
Amount
(000’s omitted) | | | Value | |
| | | | | | | | |
| | |
Electric Utilities (continued) | | | | | | | | |
Utility Debt Securitization Authority, NY, 5.00%, 12/15/30(2) | | $ | 22,500 | | | $ | 26,856,000 | |
Utility Debt Securitization Authority, NY, 5.00%, 12/15/31(2) | | | 27,500 | | | | 32,705,475 | |
Utility Debt Securitization Authority, NY, 5.00%, 12/15/41(2) | | | 26,600 | | | | 31,092,208 | |
Vernon, CA, Electric System Revenue, 5.125%, 8/1/21 | | | 51,375 | | | | 57,939,698 | |
| | | | | | | | | |
| | | | | | $ | 255,715,219 | |
| | | | | | | | | |
| | |
Escrowed / Prerefunded — 0.6% | | | | | | | | |
Bexar County Health Facilities Development Corp., TX, (St. Luke’s Lutheran Hospital), Escrowed to Maturity, 7.00%, 5/1/21 | | $ | 2,400 | | | $ | 2,976,840 | |
New York Dormitory Authority, (NYU Hospitals Center), Prerefunded to 7/1/17, 5.625%, 7/1/37 | | | 12,795 | | | | 14,206,800 | |
Puerto Rico Electric Power Authority, Escrowed to Maturity, 0.00%, 7/1/17 | | | 2,250 | | | | 2,065,545 | |
| | | | | | | | | |
| | | | | | $ | 19,249,185 | |
| | | | | | | | | |
| | |
General Obligations — 19.3% | | | | | | | | |
Alabama, 5.00%, 8/1/24(2)(4) | | $ | 22,260 | | | $ | 28,077,874 | |
California, 5.00%, 10/1/24 | | | 9,755 | | | | 12,118,149 | |
California, 5.00%, 3/1/25 | | | 20,000 | | | | 24,878,000 | |
California, 5.00%, 3/1/26 | | | 20,000 | | | | 24,621,200 | |
California, 5.00%, 10/1/26 | | | 13,200 | | | | 16,084,332 | |
California, 5.00%, 10/1/27 | | | 6,370 | | | | 7,700,247 | |
California, 5.00%, 2/1/31 | | | 17,595 | | | | 20,380,640 | |
California, 5.00%, 2/1/38 | | | 26,790 | | | | 30,605,164 | |
Cypress-Fairbanks Independent School District, TX, (PSF Guaranteed), 5.00%, 2/15/28 | | | 13,320 | | | | 16,234,816 | |
Henrico County, VA, 5.00%, 8/1/27 | | | 7,885 | | | | 10,067,016 | |
Honolulu City and County, HI, 5.00%, 10/1/28(3) | | | 5,550 | | | | 6,792,756 | |
Illinois, 5.00%, 5/1/26 | | | 24,650 | | | | 27,397,982 | |
Illinois, 5.25%, 7/1/30 | | | 16,830 | | | | 18,331,909 | |
Illinois, 5.25%, 7/1/31 | | | 2,370 | | | | 2,569,341 | |
Kane, Cook and DuPage Counties, IL, School District No. 46, 5.00%, 1/1/29 | | | 2,620 | | | | 3,027,069 | |
Kane, Cook and DuPage Counties, IL, School District No. 46, 5.00%, 1/1/30 | | | 4,105 | | | | 4,722,310 | |
Klein Independent School District, TX, (PSF Guaranteed), 5.00%, 2/1/36 | | | 14,180 | | | | 16,059,701 | |
Mattawan Consolidated School, Van Buren and Kalamazoo Counties, MI, 5.00%, 5/1/39 | | | 3,385 | | | | 3,865,738 | |
Mississippi, 5.00%, 10/1/27 | | | 14,190 | | | | 17,629,940 | |
Mississippi, 5.00%, 10/1/28 | | | 10,000 | | | | 12,311,800 | |
New Hampshire, 5.00%, 3/1/26 | | | 3,000 | | | | 3,762,510 | |
| | | | |
| | 11 | | See Notes to Financial Statements. |
Eaton Vance
National Municipal Income Fund
March 31, 2015
Portfolio of Investments (Unaudited) — continued
| | | | | | | | |
| Security | | Principal
Amount
(000’s omitted) | | | Value | |
| | | | | | | | |
| | |
General Obligations (continued) | | | | | | | | |
New York, NY, 5.00%, 8/1/21 | | $ | 7,445 | | | $ | 8,871,015 | |
New York, NY, 5.00%, 8/1/28 | | | 5,000 | | | | 5,991,950 | |
Newton, MA, 5.00%, 4/1/39 | | | 3,430 | | | | 3,920,627 | |
North Carolina, 5.00%, 6/1/22 | | | 10,000 | | | | 12,275,100 | |
Pennsylvania, 4.00%, 3/15/34 | | | 15,000 | | | | 15,845,400 | |
Port of Houston Authority of Harris County, TX, (AMT), 5.625%, 10/1/38(2) | | | 41,620 | | | | 47,015,617 | |
Port of Houston Authority of Harris County, TX, (AMT), 5.625%, 10/1/38 | | | 10,000 | | | | 11,296,400 | |
Santa Clara County, CA, (Election of 2008), 5.00%, 8/1/39(2)(4) | | | 57,400 | | | | 65,432,556 | |
Seward County, KS, Unified School District No. 480, 5.00%, 9/1/33 | | | 10,000 | | | | 11,299,500 | |
Texas, (Texas Transportation Commission), 5.00%, 10/1/25(2)(4) | | | 30,800 | | | | 38,154,116 | |
Washington, 5.00%, 7/1/31 | | | 20,000 | | | | 23,749,600 | |
Washington, Series 2011B, 5.00%, 2/1/33 | | | 20,000 | | | | 23,082,600 | |
Washington, Series 2014D, 5.00%, 2/1/33 | | | 21,325 | | | | 24,882,223 | |
West Linn-Wilsonville School District No. 3Jt, Clackamas and Washington Counties, OR, 5.00%, 6/15/27 | | | 15,245 | | | | 18,918,435 | |
Will County, IL, Community Unit School District No. 365-U, (Valley View), 5.75%, 11/1/31 | | | 12,995 | | | | 15,344,756 | |
Wisconsin, 5.00%, 5/1/35 | | | 16,500 | | | | 19,083,405 | |
| | | | | | | | | |
| | | | | | $ | 652,401,794 | |
| | | | | | | | | |
| | |
Health Care – Miscellaneous — 0.0%(5) | | | | | | | | |
Tax Exempt Securities Trust, Community Health Provider, (Pooled Loan Program Various States Trust Certificates), 5.50%, 12/1/36(6) | | $ | 482 | | | $ | 493,562 | |
Tax Exempt Securities Trust, Community Health Provider, (Pooled Loan Program Various States Trust Certificates), 5.875%, 12/1/36(6) | | | 517 | | | | 518,757 | |
| | | | | | | | | |
| | | | | | $ | 1,012,319 | |
| | | | | | | | | |
| | |
Hospital — 7.9% | | | | | | | | |
California Health Facilities Financing Authority, (Catholic Healthcare West), 5.25%, 3/1/28 | | $ | 5,700 | | | $ | 6,474,744 | |
California Health Facilities Financing Authority, (Providence Health System), 5.50%, 10/1/39(2)(4) | | | 36,700 | | | | 42,769,079 | |
California Health Facilities Financing Authority, (St. Joseph Health System), 5.00%, 7/1/33 | | | 17,530 | | | | 20,185,269 | |
California Health Facilities Financing Authority, (St. Joseph Health System), 5.00%, 7/1/37 | | | 26,385 | | | | 30,070,193 | |
California Health Facilities Financing Authority, (Sutter Health), 5.25%, 8/15/31 | | | 13,675 | | | | 15,929,734 | |
Hawaii Department of Budget and Finance, (The Queen’s Health Systems), 4.00%, 7/1/40 | | | 3,845 | | | | 3,867,339 | |
| | | | | | | | |
| Security | | Principal
Amount
(000’s omitted) | | | Value | |
| | | | | | | | |
| | |
Hospital (continued) | | | | | | | | |
Illinois Finance Authority, (Provena Healthcare), 7.75%, 8/15/34 | | $ | 30,000 | | | $ | 37,300,200 | |
Illinois Finance Authority, (Rush University Medical Center), 5.00%, 11/15/34 | | | 5,000 | | | | 5,654,950 | |
Kansas Development Finance Authority, (Adventist Health System/Sunbelt Obligated Group), 5.00%, 11/15/32 | | | 9,975 | | | | 11,334,493 | |
Massachusetts Development Finance Agency, (Tufts Medical Center), 6.75%, 1/1/36 | | | 7,510 | | | | 8,932,169 | |
Missouri Health and Educational Facilities Authority, (SSM Health Care), 5.00%, 6/1/30 | | | 7,505 | | | | 8,709,628 | |
Southwestern Illinois Development Authority, (Memorial Group, Inc.), 7.25%, 11/1/33 | | | 9,170 | | | | 11,491,202 | |
Tarrant County Cultural Education Facilities Finance Corp., TX, (Scott & White Healthcare), 5.25%, 8/15/40 | | | 13,500 | | | | 15,369,615 | |
Washington Township Health Care District, 6.25%, 7/1/39 | | | 16,675 | | | | 19,348,669 | |
West Virginia Hospital Finance Authority, (West Virginia United Health System Obligated Group), 5.375%, 6/1/38 | | | 25,140 | | | | 28,778,764 | |
| | | | | | | | | |
| | | | | | $ | 266,216,048 | |
| | | | | | | | | |
| | |
Housing — 0.7% | | | | | | | | |
Texas Student Housing Corp., (University of North Texas), 6.85%, 7/1/31 | | $ | 10,640 | | | $ | 9,771,882 | |
Virginia Housing Development Authority, (AMT), 5.10%, 10/1/35 | | | 12,020 | | | | 12,406,924 | |
| | | | | | | | | |
| | | | | | $ | 22,178,806 | |
| | | | | | | | | |
| | |
Industrial Development Revenue — 2.4% | | | | | | | | |
Amelia County, VA, Industrial Development Authority, (Waste Management, Inc.), (AMT), 2.125% to 4/1/20 (Put Date), 4/1/27(3) | | $ | 8,155 | | | $ | 8,155,000 | |
Cleveland, OH, (Continental Airlines), (AMT), 5.70%, 12/1/19 | | | 870 | | | | 872,741 | |
Denver City and County, CO, (United Airlines), (AMT), 5.25%, 10/1/32 | | | 12,360 | | | | 13,017,428 | |
Denver City and County, CO, (United Airlines), (AMT), 5.75%, 10/1/32 | | | 19,755 | | | | 21,127,973 | |
Hardeman County Correctional Facilities Corp., TN, 7.75%, 8/1/17 | | | 2,420 | | | | 2,420,048 | |
Metropolitan Nashville Airport Authority, TN, (Aero Nashville), 5.20%, 7/1/26 | | | 440 | | | | 479,820 | |
New Jersey Economic Development Authority, (New Jersey-American Water Co., Inc.), (AMT), 5.70%, 10/1/39 | | | 28,150 | | | | 32,496,923 | |
Wickliffe, KY, (Westvaco Corp.), (AMT), 6.375%, 4/1/26 | | | 1,070 | | | | 1,070,738 | |
| | | | | | | | | |
| | | | | | $ | 79,640,671 | |
| | | | | | | | | |
| | | | |
| | 12 | | See Notes to Financial Statements. |
Eaton Vance
National Municipal Income Fund
March 31, 2015
Portfolio of Investments (Unaudited) — continued
| | | | | | | | |
| Security | | Principal
Amount
(000’s omitted) | | | Value | |
| | | | | | | | |
| | |
Insured – Education — 0.0%(5) | | | | | | | | |
Metropolitan Government of Nashville and Davidson County, TN, Health and Educational Facilities Board, (Meharry Medical College), (AMBAC), 6.00%, 12/1/19 | | $ | 1,230 | | | $ | 1,330,442 | |
| | | | | | | | | |
| | | | | | $ | 1,330,442 | |
| | | | | | | | | |
| | |
Insured – Electric Utilities — 0.3% | | | | | | | | |
Puerto Rico Electric Power Authority, (BHAC), (FGIC), (NPFG), 5.25%, 7/1/24 | | $ | 400 | | | $ | 474,344 | |
Puerto Rico Electric Power Authority, (NPFG), 5.25%, 7/1/29 | | | 1,315 | | | | 1,334,028 | |
Puerto Rico Electric Power Authority, (NPFG), 5.25%, 7/1/30 | | | 8,385 | | | | 8,476,564 | |
Puerto Rico Electric Power Authority, (NPFG), 5.25%, 7/1/34 | | | 830 | | | | 835,445 | |
Puerto Rico Electric Power Authority, (NPFG), 5.25%, 7/1/35 | | | 165 | | | | 166,115 | |
| | | | | | | | | |
| | | | | | $ | 11,286,496 | |
| | | | | | | | | |
| | |
Insured – General Obligations — 2.0% | | | | | | | | |
Chicago, IL, (AGM), 5.25%, 1/1/31 | | $ | 7,600 | | | $ | 8,473,240 | |
Chicago Park District, IL, (BAM), 5.00%, 1/1/29 | | | 4,525 | | | | 5,209,225 | |
Los Angeles, CA, Unified School District, (Election of 2005), (AGM), 4.75%, 7/1/32(2) | | | 32,925 | | | | 35,412,484 | |
New Haven, CT, (AGM), 5.00%, 8/1/23 | | | 7,000 | | | | 8,402,170 | |
Oyster Bay, NY, (AGM), 4.00%, 8/1/30 | | | 7,160 | | | | 7,579,576 | |
Puerto Rico Public Buildings Authority, (AMBAC), 5.50%, 7/1/21 | | | 1,605 | | | | 1,647,918 | |
| | | | | | | | | |
| | | | | | $ | 66,724,613 | |
| | | | | | | | | |
| | |
Insured – Hospital — 0.7% | | | | | | | | |
Maryland Health and Higher Educational Facilities Authority, (LifeBridge Health), (AGC), 4.75%, 7/1/47(2) | | $ | 7,800 | | | $ | 7,946,328 | |
Medford, OR, Hospital Facilities Authority, (Asante Health System), (AGM), 5.50%, 8/15/28 | | | 12,000 | | | | 13,929,840 | |
| | | | | | | | | |
| | | | | | $ | 21,876,168 | |
| | | | | | | | | |
|
Insured – Lease Revenue / Certificates of Participation — 0.0%(5) | |
Puerto Rico Public Finance Corp., (AMBAC), Escrowed to Maturity, 5.50%, 8/1/27 | | $ | 770 | | | $ | 974,866 | |
Puerto Rico Public Finance Corp., (AMBAC), Escrowed to Maturity, 5.50%, 8/1/27 | | | 330 | | | | 417,800 | |
| | | | | | | | | |
| | | | | | $ | 1,392,666 | |
| | | | | | | | | |
| | | | | | | | |
| Security | | Principal
Amount
(000’s omitted) | | | Value | |
| | | | | | | | |
| | |
Insured – Other Revenue — 1.6% | | | | | | | | |
Harris County-Houston Sports Authority, TX, (AGM), (NPFG), 0.00%, 11/15/34 | | $ | 68,155 | | | $ | 28,623,055 | |
Harris County-Houston Sports Authority, TX, (NPFG), 0.00%, 11/15/41 | | | 25,000 | | | | 6,251,750 | |
New York, NY, Industrial Development Agency, (Queens Baseball Stadium), (AGC), 6.375%, 1/1/39 | | | 11,725 | | | | 13,587,399 | |
New York, NY, Industrial Development Agency, (Queens Baseball Stadium), (AGC), 6.50%, 1/1/46 | | | 6,085 | | | | 7,052,576 | |
| | | | | | | | | |
| | | | | | $ | 55,514,780 | |
| | | | | | | | | |
| | |
Insured – Special Tax Revenue — 2.4% | | | | | | | | |
Massachusetts, Special Obligation, Dedicated Tax Revenue, (NPFG), 5.50%, 1/1/29 | | $ | 11,000 | | | $ | 14,107,940 | |
Massachusetts, Special Obligation, Dedicated Tax Revenue, (NPFG), 5.50%, 1/1/30 | | | 3,080 | | | | 3,966,578 | |
Puerto Rico Infrastructure Financing Authority, (AMBAC), 0.00%, 7/1/44 | | | 4,450 | | | | 558,164 | |
Puerto Rico Infrastructure Financing Authority, (AMBAC), 5.50%, 7/1/28 | | | 1,000 | | | | 985,590 | |
Puerto Rico Sales Tax Financing Corp., (NPFG), 0.00%, 8/1/44 | | | 83,550 | | | | 12,003,628 | |
Puerto Rico Sales Tax Financing Corp., (NPFG), 0.00%, 8/1/45 | | | 253,860 | | | | 34,139,093 | |
Puerto Rico Sales Tax Financing Corp., (NPFG), 0.00%, 8/1/46 | | | 128,640 | | | | 16,191,917 | |
| | | | | | | | | |
| | | | | | $ | 81,952,910 | |
| | | | | | | | | |
| | |
Insured – Student Loan — 1.6% | | | | | | | | |
Massachusetts Educational Financing Authority, (AGC), (AMT), 6.35%, 1/1/30 | | $ | 33,650 | | | $ | 35,532,045 | |
Massachusetts Educational Financing Authority, (AMBAC), (AMT), 4.70%, 1/1/33 | | | 17,900 | | | | 18,211,997 | |
| | | | | | | | | |
| | | | | | $ | 53,744,042 | |
| | | | | | | | | |
| | |
Insured – Transportation — 4.7% | | | | | | | | |
Alameda Corridor Transportation Authority, CA, (AMBAC), 0.00%, 10/1/26 | | $ | 22,500 | | | $ | 11,980,575 | |
Alameda Corridor Transportation Authority, CA, (AMBAC), 0.00%, 10/1/27 | | | 41,630 | | | | 20,918,242 | |
E-470 Public Highway Authority, CO, (NPFG), 0.00%, 9/1/37 | | | 13,335 | | | | 4,674,851 | |
Miami-Dade County, FL, (Miami International Airport), (AGM), (AMT), 5.25%, 10/1/41 | | | 19,180 | | | | 21,135,209 | |
North Texas Tollway Authority, (AGC), 6.20%, 1/1/42 | | | 58,690 | | | | 73,523,897 | |
Puerto Rico Highway and Transportation Authority, (AMBAC), 0.00%, 7/1/16 | | | 1,000 | | | | 943,530 | |
| | | | |
| | 13 | | See Notes to Financial Statements. |
Eaton Vance
National Municipal Income Fund
March 31, 2015
Portfolio of Investments (Unaudited) — continued
| | | | | | | | |
| Security | | Principal
Amount
(000’s omitted) | | | Value | |
| | | | | | | | |
| | |
Insured – Transportation (continued) | | | | | | | | |
Puerto Rico Highway and Transportation Authority, (AMBAC), 0.00%, 7/1/18 | | $ | 1,795 | | | $ | 1,511,731 | |
Puerto Rico Highway and Transportation Authority, (NPFG), 5.25%, 7/1/32 | | | 590 | | | | 609,913 | |
San Jose, CA, Airport, (AGM), (AMBAC), (BHAC), (AMT), 6.00%, 3/1/47 | | | 21,420 | | | | 23,328,094 | |
| | | | | | | | | |
| | | | | | $ | 158,626,042 | |
| | | | | | | | | |
|
Lease Revenue / Certificates of Participation — 2.5% | |
Mohave County, AZ, Industrial Development Authority, (Mohave Prison LLC), 8.00%, 5/1/25(7) | | $ | 38,660 | | | $ | 45,538,387 | |
North Carolina, Capital Improvement Limited Obligation Bonds, 5.25%, 5/1/31 | | | 32,925 | | | | 38,629,257 | |
| | | | | | | | | |
| | | | | | $ | 84,167,644 | |
| | | | | | | | | |
| | |
Nursing Home — 0.3% | | | | | | | | |
Mississippi Business Finance Corp., (Magnolia Healthcare), 7.99%, 7/1/25 | | $ | 8,835 | | | $ | 8,356,231 | |
| | | | | | | | | |
| | | | | | $ | 8,356,231 | |
| | | | | | | | | |
| | |
Other Revenue — 6.8% | | | | | | | | |
Brooklyn Arena Local Development Corp., NY, (Barclays Center), 6.00%, 7/15/30 | | $ | 9,530 | | | $ | 11,186,028 | |
Brooklyn Arena Local Development Corp., NY, (Barclays Center), 6.25%, 7/15/40 | | | 14,295 | | | | 16,897,977 | |
Central Falls Detention Facility Corp., RI, 7.25%, 7/15/35(8) | | | 250 | | | | 62,633 | |
New Mexico Municipal Energy Acquisition Authority, (SPA: Royal Bank of Canada), 0.865%, 8/1/19 (Put Date), 11/1/39(9) | | | 8,300 | | | | 8,337,184 | |
New York Liberty Development Corp., (3 World Trade Center),
5.00%, 11/15/44(6) | | | 31,500 | | | | 33,279,435 | |
New York, NY, Industrial Development Agency, (Bronx Parking Development Co., LLC), 5.875%, 10/1/46(8) | | | 12,330 | | | | 4,407,975 | |
New York, NY, Transitional Finance Authority, (Building Aid), 5.00%, 7/15/36 | | | 23,055 | | | | 26,844,550 | |
Non-Profit Preferred Funding Trust, Various States, 4.47%, 9/15/37(6) | | | 12,000 | | | | 11,008,440 | |
Non-Profit Preferred Funding Trust, Various States, 4.72%, 9/15/37(6) | | | 19,000 | | | | 15,450,610 | |
Salt Verde Financial Corp., AZ, Senior Gas Revenue, 5.00%, 12/1/37 | | | 12,765 | | | | 14,949,474 | |
Texas Municipal Gas Acquisition and Supply Corp. I, Gas Supply Revenue, 6.25%, 12/15/26 | | | 26,135 | | | | 32,333,961 | |
Texas Municipal Gas Acquisition and Supply Corp. III, Gas Supply Revenue, 5.00%, 12/15/29 | | | 11,190 | | | | 12,466,443 | |
Texas Municipal Gas Acquisition and Supply Corp. III, Gas Supply Revenue, 5.00%, 12/15/30 | | | 4,845 | | | | 5,383,716 | |
| | | | | | | | |
| Security | | Principal
Amount
(000’s omitted) | | | Value | |
| | | | | | | | |
| | |
Other Revenue (continued) | | | | | | | | |
Texas Municipal Gas Acquisition and Supply Corp. III, Gas Supply Revenue, 5.00%, 12/15/32 | | $ | 34,755 | | | $ | 38,321,558 | |
| | | | | | | | | |
| | | | | | $ | 230,929,984 | |
| | | | | | | | | |
| | |
Senior Living / Life Care — 0.3% | | | | | | | | |
Logan County, CO, (TLC Care Choices, Inc.), 6.875%, 12/1/23(8) | | $ | 409 | | | $ | 100,213 | |
North Miami, FL, (Imperial Club), 6.125%, 1/1/42 | | | 16,435 | | | | 11,421,996 | |
| | | | | | | | | |
| | | | | | $ | 11,522,209 | |
| | | | | | | | | |
| | |
Special Tax Revenue — 8.3% | | | | | | | | |
Connecticut, Special Tax Obligation, (Transportation Infrastructure), 5.00%, 9/1/33 | | $ | 3,000 | | | $ | 3,505,050 | |
Connecticut, Special Tax Obligation, (Transportation Infrastructure), 5.00%, 9/1/34 | | | 3,000 | | | | 3,497,010 | |
Dupree Lakes Community Development District, FL, 5.375%, 5/1/37 | | | 870 | | | | 873,706 | |
Guam, Limited Obligation Bonds, 5.625%, 12/1/29 | | | 350 | | | | 388,588 | |
Guam, Limited Obligation Bonds, 5.75%, 12/1/34 | | | 375 | | | | 415,785 | |
Heritage Harbor South Community Development District, FL, (Capital Improvements), 6.20%, 5/1/35 | | | 540 | | | | 541,469 | |
Jackson County, MO, Special Obligation, (Harry S. Truman Sports Complex), 5.00%, 12/1/26 | | | 3,500 | | | | 4,206,020 | |
Louisiana, 5.00%, 6/15/31 | | | 5,950 | | | | 6,994,939 | |
Louisiana, Gasoline and Fuels Tax Revenue, 4.50%, 5/1/39 | | | 12,000 | | | | 13,237,200 | |
New River Community Development District, FL, (Capital Improvements), 5.00%, 5/1/13(10) | | | 230 | | | | 0 | |
New River Community Development District, FL, (Capital Improvements), 5.35%, 5/1/38(10) | | | 80 | | | | 0 | |
New River Community Development District, FL, (Capital Improvements), Series 2010A-1, 5.75%, 5/1/38 | | | 155 | | | | 155,527 | |
New River Community Development District, FL, (Capital Improvements), Series 2010A-2, 5.75%, 5/1/38 | | | 420 | | | | 411,050 | |
New River Community Development District, FL, (Capital Improvements), Series 2010B-1, 5.00%, 5/1/15 | | | 210 | | | | 209,815 | |
New River Community Development District, FL, (Capital Improvements), Series 2010B-2, 5.00%, 5/1/18 | | | 335 | | | | 325,942 | |
New York Dormitory Authority, Sales Tax Revenue, 5.00%, 3/15/26(2) | | | 10,800 | | | | 13,303,980 | |
New York Dormitory Authority, Sales Tax Revenue, 5.00%, 3/15/27(2) | | | 9,000 | | | | 11,014,380 | |
New York Dormitory Authority, Sales Tax Revenue, 5.00%, 3/15/28(2) | | | 14,000 | | | | 16,961,280 | |
New York Dormitory Authority, Sales Tax Revenue, 5.00%, 3/15/31 | | | 18,155 | | | | 21,607,900 | |
| | | | |
| | 14 | | See Notes to Financial Statements. |
Eaton Vance
National Municipal Income Fund
March 31, 2015
Portfolio of Investments (Unaudited) — continued
| | | | | | | | |
| Security | | Principal
Amount
(000’s omitted) | | | Value | |
| | | | | | | | |
| | |
Special Tax Revenue (continued) | | | | | | | | |
New York Dormitory Authority, Sales Tax Revenue, 5.00%, 3/15/32 | | $ | 28,500 | | | $ | 33,770,508 | |
New York Urban Development Corp., Personal Income Tax Revenue, 5.00%, 3/15/28 | | | 19,805 | | | | 23,711,338 | |
New York, NY, Transitional Finance Authority, Future Tax Revenue, 5.00%, 8/1/27 | | | 15,000 | | | | 18,199,200 | |
New York, NY, Transitional Finance Authority, Future Tax Revenue, 5.00%, 8/1/32 | | | 14,210 | | | | 16,716,786 | |
New York, NY, Transitional Finance Authority, Future Tax Revenue, 5.00%, 2/1/33 | | | 10,335 | | | | 11,935,788 | |
New York, NY, Transitional Finance Authority, Future Tax Revenue, 5.00%, 8/1/33 | | | 4,680 | | | | 5,480,514 | |
Oregon Department of Transportation, Highway User Tax Revenue, 4.00%, 11/15/32 | | | 5,000 | | | | 5,415,100 | |
Oregon Department of Transportation, Highway User Tax Revenue, 5.00%, 11/15/28 | | | 17,000 | | | | 20,640,720 | |
Puerto Rico Sales Tax Financing Corp., 5.00%, 8/1/40 | | | 5,385 | | | | 3,787,917 | |
Sales Tax Asset Receivables Corp., NY, 5.00%, 10/15/26(2) | | | 20,940 | | | | 26,092,287 | |
Southern Hills Plantation I Community Development District, FL, Series A1, 5.80%, 5/1/35 | | | 515 | | | | 510,751 | |
Southern Hills Plantation I Community Development District, FL, Series A2, 5.80%, 5/1/35 | | | 375 | | | | 337,631 | |
Sterling Hill Community Development District, FL, 6.20%, 5/1/35 | | | 1,665 | | | | 1,302,962 | |
Texas Transportation Commission, 5.00%, 4/1/33(2)(4) | | | 10,000 | | | | 11,809,300 | |
Virgin Islands Public Finance Authority, 6.75%, 10/1/37 | | | 1,410 | | | | 1,617,594 | |
| | | | | | | | | |
| | | | | | $ | 278,978,037 | |
| | | | | | | | | |
| | |
Student Loan — 0.6% | | | | | | | | |
Iowa Student Loan Liquidity Corp., 5.25%, 12/1/22 | | $ | 14,800 | | | $ | 16,560,904 | |
Iowa Student Loan Liquidity Corp., 5.50%, 12/1/27 | | | 1,290 | | | | 1,393,497 | |
New Jersey Higher Education Student Assistance Authority, (AMT), 5.00%, 12/1/27 | | | 2,160 | | | | 2,162,635 | |
| | | | | | | | | |
| | | | | | $ | 20,117,036 | |
| | | | | | | | | |
| | |
Transportation — 23.2% | | | | | | | | |
Alabama Federal Aid Highway Finance Authority, 5.00%, 9/1/28 | | $ | 11,435 | | | $ | 13,809,363 | |
Austin, TX, Airport System Revenue, (AMT), 5.00%, 11/15/32 | | | 2,500 | | | | 2,901,525 | |
Charleston County, SC, Airport District, (AMT), 5.50%, 7/1/38 | | | 10,000 | | | | 11,506,900 | |
Chicago, IL, (Midway International Airport), 5.00%, 1/1/33 | | | 6,750 | | | | 7,621,088 | |
Chicago, IL, (Midway International Airport), (AMT), 5.00%, 1/1/34 | | | 5,250 | | | | 5,809,650 | |
Chicago, IL, (O’Hare International Airport), (AMT), 5.00%, 1/1/25 | | | 16,100 | | | | 18,551,547 | |
| | | | | | | | |
| Security | | Principal
Amount
(000’s omitted) | | | Value | |
| | | | | | | | |
| | |
Transportation (continued) | | | | | | | | |
Chicago, IL, (O’Hare International Airport), (AMT), 5.00%, 1/1/26 | | $ | 13,690 | | | $ | 15,682,306 | |
Dallas and Fort Worth, TX, (Dallas/Fort Worth International Airport), 5.25%, 11/1/31 | | | 10,395 | | | | 12,230,549 | |
Dallas and Fort Worth, TX, (Dallas/Fort Worth International Airport), (AMT), 5.25%, 11/1/29 | | | 21,700 | | | | 25,622,058 | |
Dallas and Fort Worth, TX, (Dallas/Fort Worth International Airport), (AMT), 5.25%, 11/1/30 | | | 11,445 | | | | 13,446,959 | |
Delaware River Port Authority of Pennsylvania and New Jersey, 5.00%, 1/1/31 | | | 11,680 | | | | 13,455,827 | |
Houston, TX, (United Airlines, Inc.), (AMT), 5.00%, 7/1/29 | | | 7,670 | | | | 8,307,070 | |
Illinois Toll Highway Authority, 5.00%, 1/1/30 | | | 1,000 | | | | 1,152,870 | |
Illinois Toll Highway Authority, 5.00%, 1/1/31 | | | 1,000 | | | | 1,146,240 | |
Illinois Toll Highway Authority, 5.00%, 1/1/32 | | | 2,500 | | | | 2,857,350 | |
Illinois Toll Highway Authority, 5.00%, 1/1/33 | | | 4,750 | | | | 5,417,233 | |
Illinois Toll Highway Authority, 5.25%, 1/1/29 | | | 13,160 | | | | 15,101,363 | |
Illinois Toll Highway Authority,
5.25%, 1/1/30(2)(4) | | | 18,180 | | | | 20,861,914 | |
Kansas Department of Transportation, 5.00%, 9/1/30 | | | 26,290 | | | | 31,871,893 | |
Los Angeles, CA, Department of Airports, (Los Angeles International Airport), 5.00%, 5/15/35(2)(4) | | | 7,200 | | | | 8,226,000 | |
Metropolitan Transportation Authority, NY, 5.00%, 11/15/24 | | | 8,175 | | | | 10,054,514 | |
Metropolitan Transportation Authority, NY, 5.00%, 11/15/25 | | | 7,100 | | | | 8,630,760 | |
Metropolitan Transportation Authority, NY, 5.00%, 11/15/33 | | | 10,000 | | | | 11,597,100 | |
Metropolitan Transportation Authority, NY, 5.25%, 11/15/33 | | | 12,000 | | | | 14,150,880 | |
Metropolitan Transportation Authority, NY, 6.25%, 11/15/23 | | | 19,475 | | | | 23,102,998 | |
Miami-Dade County, FL, (Miami International Airport), 5.50%, 10/1/36 | | | 3,500 | | | | 4,030,775 | |
Miami-Dade County, FL, Aviation Revenue, (AMT), 5.00%, 10/1/33 | | | 25,000 | | | | 28,332,750 | |
New Jersey Transportation Trust Fund Authority, (Transportation Program), 1.22%, 12/15/21 (Put Date), 6/15/34(9) | | | 35,000 | | | | 35,015,050 | |
New Jersey Transportation Trust Fund Authority, (Transportation System), 5.00%, 6/15/32 | | | 17,475 | | | | 18,911,969 | |
New Jersey Transportation Trust Fund Authority, (Transportation System), 5.875%, 12/15/38 | | | 26,650 | | | | 30,101,441 | |
New Jersey Turnpike Authority, 5.00%, 1/1/28 | | | 20,415 | | | | 23,569,730 | |
New Jersey Turnpike Authority, 5.00%, 1/1/31 | | | 10,000 | | | | 11,595,900 | |
New York Liberty Development Corp., (4 World Trade Center), 5.00%, 11/15/31 | | | 14,845 | | | | 16,863,772 | |
Orlando-Orange County Expressway Authority, FL, 5.00%, 7/1/35 | | | 15,000 | | | | 16,991,700 | |
Pennsylvania Turnpike Commission, 5.25%, 6/1/39 | | | 9,305 | | | | 10,342,787 | |
| | | | |
| | 15 | | See Notes to Financial Statements. |
Eaton Vance
National Municipal Income Fund
March 31, 2015
Portfolio of Investments (Unaudited) — continued
| | | | | | | | |
| Security | | Principal
Amount
(000’s omitted) | | | Value | |
| | | | | | | | |
| | |
Transportation (continued) | | | | | | | | |
Pennsylvania Turnpike Commission, 5.35%, (0.00% until 12/1/15), 12/1/30 | | $ | 13,010 | | | $ | 13,942,427 | |
Pennsylvania Turnpike Commission, 5.45%, (0.00% until 12/1/15), 12/1/35 | | | 12,125 | | | | 12,904,274 | |
Pennsylvania Turnpike Commission, 6.00%, (0.00% until 12/1/15), 12/1/34 | | | 25,000 | | | | 27,258,500 | |
Pennsylvania Turnpike Commission, 6.50%, 12/1/36 | | | 10,000 | | | | 12,135,600 | |
Philadelphia, PA, Airport Revenue, (AMT), 5.00%, 6/15/27 | | | 11,865 | | | | 13,244,425 | |
Port Authority of New York & New Jersey, (AMT), 5.00%, 9/1/26 | | | 12,500 | | | | 14,860,875 | |
Port Authority of New York & New Jersey, (AMT), 5.00%, 9/1/27 | | | 7,500 | | | | 8,816,550 | |
Port Authority of New York & New Jersey, (AMT), 5.00%, 10/15/36 | | | 17,725 | | | | 19,473,039 | |
Port Authority of New York & New Jersey, (AMT), 5.25%, 9/15/23(2) | | | 28,890 | | | | 32,111,524 | |
South Jersey Transportation Authority, NJ, 5.00%, 11/1/39 | | | 4,400 | | | | 4,783,768 | |
Texas Private Activity Bond Surface Transportation Corp., (LBJ Express Managed Lanes Project), 7.00%, 6/30/34 | | | 29,200 | | | | 35,658,164 | |
Texas Private Activity Bond Surface Transportation Corp., (North Tarrant Express Managed Lanes Project), 6.875%, 12/31/39 | | | 24,110 | | | | 28,853,160 | |
Texas Transportation Commission, (Central Texas Turnpike System), 5.00%, 8/15/37 | | | 13,790 | | | | 15,278,906 | |
Triborough Bridge and Tunnel Authority, NY, 5.25%, 11/15/34(2) | | | 38,980 | | | | 44,360,409 | |
| | | | | | | | | |
| | | | | | $ | 782,553,452 | |
| | | | | | | | | |
| | |
Water and Sewer — 6.8% | | | | | | | | |
Chicago, IL, Water Revenue, 5.00%, 11/1/30 | | $ | 1,750 | | | $ | 1,989,593 | |
Chicago, IL, Water Revenue, 5.00%, 11/1/31 | | | 1,000 | | | | 1,133,400 | |
Chicago, IL, Water Revenue, 5.00%, 11/1/39 | | | 2,000 | | | | 2,238,960 | |
Detroit, MI, Sewage Disposal System, 5.25%, 7/1/39 | | | 22,500 | | | | 24,400,800 | |
Detroit, MI, Water Supply System, 5.00%, 7/1/41 | | | 2,185 | | | | 2,315,794 | |
Detroit, MI, Water Supply System, 5.25%, 7/1/41 | | | 56,420 | | | | 60,572,512 | |
King County, WA, Sewer Revenue, 5.00%, 7/1/38 | | | 15,000 | | | | 17,519,100 | |
Metropolitan Water District of Southern California, 5.00%, 7/1/37(2) | | | 34,800 | | | | 37,889,196 | |
Michigan Finance Authority, (Detroit Water and Sewerage Department), 5.00%, 7/1/33 | | | 8,095 | | | | 8,859,411 | |
Michigan Finance Authority, (Detroit Water and Sewerage Department), 5.00%, 7/1/44 | | | 8,095 | | | | 8,625,870 | |
New York, NY, Municipal Water Finance Authority, (Water and Sewer System), 5.00%, 6/15/36 | | | 15,000 | | | | 17,364,150 | |
| | | | | | | | |
| Security | | Principal
Amount
(000’s omitted) | | | Value | |
| | | | | | | | |
| | |
Water and Sewer (continued) | | | | | | | | |
New York, NY, Municipal Water Finance Authority, (Water and Sewer System), 5.75%, 6/15/40(2)(4) | | $ | 42,030 | | | $ | 48,213,033 | |
| | | | | | | | | |
| | | | | | $ | 231,121,819 | |
| | | | | | | | | |
| | |
Total Tax-Exempt Municipal
Securities — 108.1%
(identified cost $3,384,422,445) | | | | | | $ | 3,651,660,292 | |
| | | | | | | | | |
|
| Taxable Municipal Securities — 2.4% | |
| | |
| | | | | | | | |
| Security | | Principal
Amount
(000’s omitted) | | | Value | |
| | |
General Obligations — 1.3% | | | | | | | | |
Massachusetts, 4.50%, 8/1/31(11) | | $ | 18,475 | | | $ | 20,755,184 | |
Texas, (Texas Transportation Commission), 4.631%, 4/1/33(11) | | | 14,295 | | | | 16,664,682 | |
Utah, 3.539%, 7/1/25(11) | | | 7,720 | | | | 8,340,225 | |
| | | | | | | | | |
| | | | | | $ | 45,760,091 | |
| | | | | | | | | |
| | |
Hospital — 1.1% | | | | | | | | |
California Statewide Communities Development Authority, (Loma Linda University Medical Center), 6.00%, 12/1/24 | | $ | 34,250 | | | $ | 36,752,305 | |
| | | | | | | | | |
| | | | | | $ | 36,752,305 | |
| | | | | | | | | |
| | |
Total Taxable Municipal
Securities — 2.4%
(identified cost $78,253,107) | | | | | | $ | 82,512,396 | |
| | | | | | | | | |
|
| Corporate Bonds & Notes — 1.2% | |
| | |
| | | | | | | | |
| Security | | Principal
Amount
(000’s omitted) | | | Value | |
| | |
Education — 0.9% | | | | | | | | |
Massachusetts Institute of Technology, 3.308%, 7/1/26 | | $ | 27,000 | | | $ | 28,307,502 | |
| | | | | | | | | |
| | | | | | $ | 28,307,502 | |
| | | | | | | | | |
| | | | |
| | 16 | | See Notes to Financial Statements. |
Eaton Vance
National Municipal Income Fund
March 31, 2015
Portfolio of Investments (Unaudited) — continued
| | | | | | | | |
| Security | | Principal
Amount
(000’s omitted) | | | Value | |
| | | | | | | | |
| | |
Hospital — 0.3% | | | | | | | | |
Dignity Health, 3.812%, 11/1/24 | | $ | 10,050 | | | $ | 10,562,912 | |
| | | | | | | | | |
| | | | | | $ | 10,562,912 | |
| | | | | | | | | |
| |
Total Corporate Bonds & Notes — 1.2%
(identified cost $37,050,000) | | | $ | 38,870,414 | |
| | | | | | | | | |
| |
Total Investments — 111.7%
(identified cost $3,499,725,552) | | | $ | 3,773,043,102 | |
| | | | | | | | | |
| |
Other Assets, Less Liabilities — (11.7)% | | | $ | (394,330,667 | ) |
| | | | | | | | | |
| |
Net Assets — 100.0% | | | $ | 3,378,712,435 | |
| | | | | | | | | |
The percentage shown for each investment category in the Portfolio of Investments is based on net assets.
| | | | |
| AGC | | – | | Assured Guaranty Corp. |
| AGM | | – | | Assured Guaranty Municipal Corp. |
| AMBAC | | – | | AMBAC Financial Group, Inc. |
| AMT | | – | | Interest earned from these securities may be considered a tax preference item for purposes of the Federal Alternative Minimum Tax. |
| BAM | | – | | Build America Mutual Assurance Co. |
| BHAC | | – | | Berkshire Hathaway Assurance Corp. |
| FGIC | | – | | Financial Guaranty Insurance Company |
| NPFG | | – | | National Public Finance Guaranty Corp. |
| PSF | | – | | Permanent School Fund |
| SPA | | – | | Standby Bond Purchase Agreement |
At March 31, 2015, the concentration of the Fund’s investments in the various states and territories, determined as a percentage of net assets, is as follows:
| | | | |
| New York | | | 21.1% | |
| California | | | 17.6% | |
| Texas | | | 16.9% | |
| Others, representing less than 10% individually | | | 56.1% | |
The Fund invests primarily in debt securities issued by municipalities. The ability of the issuers of the debt securities to meet their obligations may be affected by economic developments in a specific industry or municipality. In order to reduce the risk associated with such economic developments, at March 31, 2015, 12.0% of total investments are backed by bond insurance of various financial institutions and financial guaranty assurance agencies. The aggregate percentage insured by an individual financial institution or financial guaranty assurance agency ranged from less than 0.1% to 3.9% of total investments.
| | (1) | Represents a payment-in-kind security which may pay interest in additional principal at the issuer’s discretion. |
| | (2) | Security represents the municipal bond held by a trust that issues residual interest bonds (see Note 1I). |
| | (3) | When-issued security. |
| | (4) | Security (or a portion thereof) has been pledged as collateral for residual interest bond transactions. The aggregate value of such collateral is $110,794,702. |
| | (5) | Amount is less than 0.05%. |
| | (6) | Security exempt from registration pursuant to Rule 144A under the Securities Act of 1933. These securities may be sold in certain transactions (normally to qualified institutional buyers) and remain exempt from registration. At March 31, 2015, the aggregate value of these securities is $60,750,804 or 1.8% of the Fund’s net assets. |
| | (7) | Security (or a portion thereof) has been segregated to cover payable for when-issued securities. |
| | (8) | Security is in default and making only partial interest payments. |
| | (9) | Variable rate security. The stated interest rate represents the rate in effect at March 31, 2015. |
| (10) | Defaulted security. Issuer has defaulted on the payment of interest and/or principal or has filed for bankruptcy. |
| (11) | Build America Bond. Represents taxable municipal obligation issued pursuant to the America Recovery and Reinvestment Act of 2009 or other legislation providing for the issuance of taxable municipal debt on which the issuer receives federal support. |
| | | | |
| | 17 | | See Notes to Financial Statements. |
Eaton Vance
Municipal Income Funds
March 31, 2015
Statements of Assets and Liabilities (Unaudited)
| | | | | | | | |
| | | March 31, 2015 | |
| Assets | | AMT-Free Fund | | | National Fund | |
Investments — | | | | | | | | |
Identified cost | | $ | 336,152,367 | | | $ | 3,499,725,552 | |
Unrealized appreciation | | | 42,437,690 | | | | 273,317,550 | |
Investments, at value | | $ | 378,590,057 | | | $ | 3,773,043,102 | |
Cash | | $ | 10,947,847 | | | $ | 60,749,641 | |
Restricted cash* | | | 885,000 | | | | 8,150,000 | |
Interest receivable | | | 4,557,814 | | | | 43,089,220 | |
Receivable for investments sold | | | 135,000 | | | | 49,541,691 | |
Receivable for Fund shares sold | | | 642,771 | | | | 2,654,005 | |
Total assets | | $ | 395,758,489 | | | $ | 3,937,227,659 | |
| | |
| Liabilities | | | | | | | | |
Payable for floating rate notes issued | | $ | 40,685,000 | | | $ | 492,765,000 | |
Payable for investments purchased | | | — | | | | 5,920,461 | |
Payable for when-issued securities | | | — | | | | 43,666,659 | |
Payable for variation margin on open financial futures contracts | | | 125,719 | | | | 812,500 | |
Payable for Fund shares redeemed | | | 777,402 | | | | 10,274,489 | |
Distributions payable | | | 192,921 | | | | 1,849,186 | |
Payable to affiliates: | | | | | | | | |
Investment adviser fee | | | 131,987 | | | | 981,197 | |
Distribution and service fees | | | 78,430 | | | | 987,697 | |
Interest expense and fees payable | | | 68,442 | | | | 815,632 | |
Accrued expenses | | | 60,056 | | | | 442,403 | |
Total liabilities | | $ | 42,119,957 | | | $ | 558,515,224 | |
Net Assets | | $ | 353,638,532 | | | $ | 3,378,712,435 | |
| | |
| Sources of Net Assets | | | | | | | | |
Paid-in capital | | $ | 445,816,772 | | | $ | 4,350,494,969 | |
Accumulated net realized loss | | | (135,247,384 | ) | | | (1,249,735,974 | ) |
Accumulated undistributed net investment income | | | 1,567,001 | | | | 11,203,798 | |
Net unrealized appreciation | | | 41,502,143 | | | | 266,749,642 | |
Net Assets | | $ | 353,638,532 | | | $ | 3,378,712,435 | |
| | | | |
| | 18 | | See Notes to Financial Statements. |
Eaton Vance
Municipal Income Funds
March 31, 2015
Statements of Assets and Liabilities (Unaudited) — continued
| | | | | | | | |
| | | March 31, 2015 | |
| Class A Shares | | AMT-Free Fund | | | National Fund | |
Net Assets | | $ | 201,020,701 | | | $ | 2,016,418,489 | |
Shares Outstanding | | | 21,488,459 | | | | 203,214,412 | |
Net Asset Value and Redemption Price Per Share | | | | | | | | |
(net assets ÷ shares of beneficial interest outstanding) | | $ | 9.35 | | | $ | 9.92 | |
Maximum Offering Price Per Share | | | | | | | | |
(100 ÷ 95.25 of net asset value per share) | | $ | 9.82 | | | $ | 10.41 | |
| | |
| Class B Shares | | | | | | | | |
Net Assets | | $ | 1,089,098 | | | $ | 33,583,356 | |
Shares Outstanding | | | 117,203 | | | | 3,384,992 | |
Net Asset Value and Offering Price Per Share** | | | | | | | | |
(net assets ÷ shares of beneficial interest outstanding) | | $ | 9.29 | | | $ | 9.92 | |
| | |
| Class C Shares | | | | | | | | |
Net Assets | | $ | 42,361,384 | | | $ | 626,138,615 | |
Shares Outstanding | | | 4,553,690 | | | | 63,103,564 | |
Net Asset Value and Offering Price Per Share** | | | | | | | | |
(net assets ÷ shares of beneficial interest outstanding) | | $ | 9.30 | | | $ | 9.92 | |
| | |
| Class I Shares | | | | | | | | |
Net Assets | | $ | 109,167,349 | | | $ | 702,571,975 | |
Shares Outstanding | | | 10,683,437 | | | | 70,802,348 | |
Net Asset Value, Offering Price and Redemption Price Per Share | | | | | | | | |
(net assets ÷ shares of beneficial interest outstanding) | | $ | 10.22 | | | $ | 9.92 | |
On sales of $50,000 or more, the offering price of Class A shares is reduced.
| * | Represents restricted cash on deposit at the broker for open financial futures contracts. |
| ** | Redemption price per share is equal to the net asset value less any applicable contingent deferred sales charge. |
| | | | |
| | 19 | | See Notes to Financial Statements. |
Eaton Vance
Municipal Income Funds
March 31, 2015
Statements of Operations (Unaudited)
| | | | | | | | |
| | | Six Months Ended March 31, 2015 | |
| Investment Income | | AMT-Free Fund | | | National Fund | |
Interest | | $ | 8,522,204 | | | $ | 80,677,905 | |
Total investment income | | $ | 8,522,204 | | | $ | 80,677,905 | |
| | |
| Expenses | | | | | | | | |
Investment adviser fee | | $ | 769,435 | | | $ | 5,858,043 | |
Distribution and service fees | | | | | | | | |
Class A | | | 250,426 | | | | 2,579,129 | |
Class B | | | 6,903 | | | | 192,027 | |
Class C | | | 196,520 | | | | 3,176,131 | |
Trustees’ fees and expenses | | | 8,621 | | | | 34,000 | |
Custodian fee | | | 44,480 | | | | 277,275 | |
Transfer and dividend disbursing agent fees | | | 59,443 | | | | 679,219 | |
Legal and accounting services | | | 39,967 | | | | 69,693 | |
Printing and postage | | | 13,319 | | | | 96,322 | |
Registration fees | | | 36,265 | | | | 72,087 | |
Interest expense and fees | | | 126,429 | | | | 1,495,690 | |
Miscellaneous | | | 18,979 | | | | 56,315 | |
Total expenses | | $ | 1,570,787 | | | $ | 14,585,931 | |
Deduct — | | | | | | | | |
Reduction of custodian fee | | $ | 785 | | | $ | 9,928 | |
Total expense reductions | | $ | 785 | | | $ | 9,928 | |
| | |
Net expenses | | $ | 1,570,002 | | | $ | 14,576,003 | |
| | |
Net investment income | | $ | 6,952,202 | | | $ | 66,101,902 | |
| | |
| Realized and Unrealized Gain (Loss) | | | | | | | | |
Net realized gain (loss) — | | | | | | | | |
Investment transactions | | $ | 3,377,276 | | | $ | 69,079,633 | |
Financial futures contracts | | | (2,065,561 | ) | | | (22,628,415 | ) |
Net realized gain | | $ | 1,311,715 | | | $ | 46,451,218 | |
Change in unrealized appreciation (depreciation) — | | | | | | | | |
Investments | | $ | 91,087 | | | $ | (20,384,977 | ) |
Financial futures contracts | | | (1,288,867 | ) | | | (9,843,668 | ) |
Net change in unrealized appreciation (depreciation) | | $ | (1,197,780 | ) | | $ | (30,228,645 | ) |
| | |
Net realized and unrealized gain | | $ | 113,935 | | | $ | 16,222,573 | |
| | |
Net increase in net assets from operations | | $ | 7,066,137 | | | $ | 82,324,475 | |
| | | | |
| | 20 | | See Notes to Financial Statements. |
Eaton Vance
Municipal Income Funds
March 31, 2015
Statements of Changes in Net Assets
| | | | | | | | |
| | | Six Months Ended March 31, 2015 (Unaudited) | |
| Increase (Decrease) in Net Assets | | AMT-Free Fund | | | National Fund | |
From operations — | | | | | | | | |
Net investment income | | $ | 6,952,202 | | | $ | 66,101,902 | |
Net realized gain from investment transactions and financial futures contracts | | | 1,311,715 | | | | 46,451,218 | |
Net change in unrealized appreciation (depreciation) from investments and financial futures contracts | | | (1,197,780 | ) | | | (30,228,645 | ) |
Net increase in net assets from operations | | $ | 7,066,137 | | | $ | 82,324,475 | |
Distributions to shareholders — | | | | | | | | |
From net investment income | | | | | | | | |
Class A | | $ | (4,024,897 | ) | | $ | (40,348,554 | ) |
Class B | | | (22,508 | ) | | | (607,833 | ) |
Class C | | | (642,713 | ) | | | (10,037,872 | ) |
Class I | | | (2,233,718 | ) | | | (14,575,639 | ) |
Total distributions to shareholders | | $ | (6,923,836 | ) | | $ | (65,569,898 | ) |
Transactions in shares of beneficial interest — | | | | | | | | |
Proceeds from sale of shares | | | | | | | | |
Class A | | $ | 12,119,742 | | | $ | 75,794,354 | |
Class B | | | 44,458 | | | | 203,651 | |
Class C | | | 7,005,126 | | | | 22,797,393 | |
Class I | | | 12,316,751 | | | | 115,851,086 | |
Net asset value of shares issued to shareholders in payment of distributions declared | | | | | | | | |
Class A | | | 3,612,876 | | | | 33,980,569 | |
Class B | | | 15,209 | | | | 503,305 | |
Class C | | | 487,884 | | | | 7,726,183 | |
Class I | | | 1,646,092 | | | | 12,086,772 | |
Cost of shares redeemed | | | | | | | | |
Class A | | | (15,628,919 | ) | | | (235,615,573 | ) |
Class B | | | (221,079 | ) | | | (4,540,042 | ) |
Class C | | | (2,324,626 | ) | | | (53,330,600 | ) |
Class I | | | (7,228,725 | ) | | | (114,933,056 | ) |
Net asset value of shares exchanged | | | | | | | | |
Class A | | | 399,107 | | | | 5,461,824 | |
Class B | | | (399,107 | ) | | | (5,461,824 | ) |
Net increase (decrease) in net assets from Fund share transactions | | $ | 11,844,789 | | | $ | (139,475,958 | ) |
| | |
Net increase (decrease) in net assets | | $ | 11,987,090 | | | $ | (122,721,381 | ) |
| | |
| Net Assets | | | | | | | | |
At beginning of period | | $ | 341,651,442 | | | $ | 3,501,433,816 | |
At end of period | | $ | 353,638,532 | | | $ | 3,378,712,435 | |
| | |
Accumulated undistributed net investment income
included in net assets | | | | | | | | |
At end of period | | $ | 1,567,001 | | | $ | 11,203,798 | |
| | | | |
| | 21 | | See Notes to Financial Statements. |
Eaton Vance
Municipal Income Funds
March 31, 2015
Statements of Changes in Net Assets — continued
| | | | | | | | |
| | | Year Ended September 30, 2014 | |
| Increase (Decrease) in Net Assets | | AMT-Free Fund | | | National Fund | |
From operations — | | | | | | | | |
Net investment income | | $ | 15,246,350 | | | $ | 160,894,414 | |
Net realized gain from investment transactions and financial futures contracts | | | 1,862,620 | | | | 24,029,933 | |
Net change in unrealized appreciation (depreciation) from investments and financial futures contracts | | | 23,912,174 | | | | 221,575,247 | |
Net increase in net assets from operations | | $ | 41,021,144 | | | $ | 406,499,594 | |
Distributions to shareholders — | | | | | | | | |
From net investment income | | | | | | | | |
Class A | | $ | (9,371,998 | ) | | $ | (99,477,459 | ) |
Class B | | | (80,021 | ) | | | (2,021,368 | ) |
Class C | | | (1,386,129 | ) | | | (25,853,832 | ) |
Class I | | | (4,338,298 | ) | | | (36,405,260 | ) |
Total distributions to shareholders | | $ | (15,176,446 | ) | | $ | (163,757,919 | ) |
Transactions in shares of beneficial interest — | | | | | | | | |
Proceeds from sale of shares | | | | | | | | |
Class A | | $ | 20,110,528 | | | $ | 203,628,591 | |
Class B | | | 92,769 | | | | 444,785 | |
Class C | | | 4,386,915 | | | | 49,933,766 | |
Class I | | | 17,931,150 | | | | 319,714,305 | |
Net asset value of shares issued to shareholders in payment of distributions declared | | | | | | | | |
Class A | | | 8,242,924 | | | | 82,959,583 | |
Class B | | | 58,072 | | | | 1,667,463 | |
Class C | | | 1,046,468 | | | | 19,675,408 | |
Class I | | | 3,172,269 | | | | 31,125,442 | |
Cost of shares redeemed | | | | | | | | |
Class A | | | (69,295,933 | ) | | | (602,870,865 | ) |
Class B | | | (627,087 | ) | | | (12,371,518 | ) |
Class C | | | (11,898,671 | ) | | | (168,173,700 | ) |
Class I | | | (25,188,187 | ) | | | (702,734,261 | ) |
Issued in connection with tax-free reorganizations (see Note 11) | | | | | | | | |
Class A | | | — | | | | 146,588,628 | |
Class B | | | — | | | | 2,461,257 | |
Class C | | | — | | | | 17,625,276 | |
Class I | | | — | | | | 12,263,760 | |
Net asset value of shares exchanged | | | | | | | | |
Class A | | | 926,940 | | | | 12,268,523 | |
Class B | | | (926,940 | ) | | | (12,268,523 | ) |
Net decrease in net assets from Fund share transactions | | $ | (51,968,783 | ) | | $ | (598,062,080 | ) |
| | |
Net decrease in net assets | | $ | (26,124,085 | ) | | $ | (355,320,405 | ) |
| | |
| Net Assets | | | | | | | | |
At beginning of year | | $ | 367,775,527 | | | $ | 3,856,754,221 | |
At end of year | | $ | 341,651,442 | | | $ | 3,501,433,816 | |
| | |
Accumulated undistributed net investment income included in net assets | | | | | | | | |
At end of year | | $ | 1,538,635 | | | $ | 10,671,794 | |
| | | | |
| | 22 | | See Notes to Financial Statements. |
Eaton Vance
Municipal Income Funds
March 31, 2015
Statements of Cash Flows (Unaudited)
| | | | | | | | |
| | | Six Months Ended March 31, 2015 | |
| Cash Flows From Operating Activities | | AMT-Free Fund | | | National Fund | |
Net increase in net assets from operations | | $ | 7,066,137 | | | $ | 82,324,475 | |
Adjustments to reconcile net increase in net assets from operations to net cash provided by operating activities: | | | | | | | | |
Investments purchased | | | (42,739,469 | ) | | | (1,399,908,978 | ) |
Investments sold | | | 47,480,387 | | | | 1,398,794,234 | |
Net amortization/accretion of premium (discount) | | | (879,259 | ) | | | 1,263,470 | |
Decrease in restricted cash | | | 90,000 | | | | 850,000 | |
Decrease in interest receivable | | | 2,406 | | | | 2,829,781 | |
Decrease in receivable for variation margin on open financial futures contracts | | | 104,563 | | | | 1,218,750 | |
Increase in payable for variation margin on open financial futures contracts | | | 125,719 | | | | 812,500 | |
Increase (decrease) in payable to affiliate for investment adviser fee | | | 5,012 | | | | (10,355 | ) |
Increase (decrease) in payable to affiliate for distribution and service fees | | | 5,180 | | | | (12,001 | ) |
Decrease in interest expense and fees payable | | | (14,436 | ) | | | (114,574 | ) |
Decrease in accrued expenses | | | (74,637 | ) | | | (176,992 | ) |
Net change in unrealized (appreciation) depreciation from investments | | | (91,087 | ) | | | 20,384,977 | |
Net realized gain from investments | | | (3,377,276 | ) | | | (69,079,633 | ) |
Net cash provided by operating activities | | $ | 7,703,240 | | | $ | 39,175,654 | |
| | |
| Cash Flows From Financing Activities | | | | | | | | |
Proceeds from Fund shares sold | | $ | 31,057,989 | | | $ | 215,682,792 | |
Fund shares redeemed | | | (26,150,344 | ) | | | (408,393,097 | ) |
Distributions paid, net of reinvestments | | | (1,170,773 | ) | | | (11,459,472 | ) |
Proceeds from secured borrowings | | | – | | | | 80,850,000 | |
Repayment of secured borrowings | | | (6,000,000 | ) | | | (48,285,000 | ) |
Net cash used in financing activities | | $ | (2,263,128 | ) | | $ | (171,604,777 | ) |
| | |
Net increase (decrease) in cash | | $ | 5,440,112 | | | $ | (132,429,123 | ) |
| | |
Cash at beginning of period | | $ | 5,507,735 | | | $ | 193,178,764 | |
| | |
Cash at end of period | | $ | 10,947,847 | | | $ | 60,749,641 | |
| | |
| Supplemental disclosure of cash flow information: | | | | | | | | |
Noncash financing activities not included herein consist of: | | | | | | | | |
Reinvestment of dividends and distributions | | $ | 5,762,061 | | | $ | 54,296,829 | |
Cash paid for interest and fees | | $ | 140,865 | | | $ | 1,610,264 | |
| | | | |
| | 23 | | See Notes to Financial Statements. |
Eaton Vance
Municipal Income Funds
March 31, 2015
Financial Highlights
| | | | | | | | | | | | | | | | | | | | | | | | | | | | |
| | | AMT-Free Fund — Class A | |
| | | Six Months Ended
March 31, 2015
(Unaudited) | | | Year Ended September 30, | | | Nine Months Ended September 30, 2012(1) | | | Year Ended December 31, | |
| | | | 2014 | | | 2013 | | | | 2011 | | | 2010 | | | 2009 | |
Net asset value — Beginning of period | | $ | 9.350 | | | $ | 8.670 | | | $ | 9.600 | | | $ | 8.840 | | | $ | 8.320 | | | $ | 8.800 | | | $ | 7.030 | |
| | | | | | |
| Income (Loss) From Operations | | | | | | | | | | | | | | | | | | | | | | | | | |
Net investment income(2) | | $ | 0.189 | | | $ | 0.395 | | | $ | 0.400 | | | $ | 0.296 | | | $ | 0.437 | | | $ | 0.436 | | | $ | 0.429 | |
Net realized and unrealized gain (loss) | | | (0.001 | ) | | | 0.677 | | | | (0.934 | ) | | | 0.758 | | | | 0.505 | | | | (0.487 | ) | | | 1.763 | |
| | | | | | | |
Total income (loss) from operations | | $ | 0.188 | | | $ | 1.072 | | | $ | (0.534 | ) | | $ | 1.054 | | | $ | 0.942 | | | $ | (0.051 | ) | | $ | 2.192 | |
| | | | | | | |
| Less Distributions | | | | | | | | | | | | | | | | | | | | | | | | | | | | |
From net investment income | | $ | (0.188 | ) | | $ | (0.392 | ) | | $ | (0.396 | ) | | $ | (0.294 | ) | | $ | (0.422 | ) | | $ | (0.429 | ) | | $ | (0.422 | ) |
| | | | | | | |
Total distributions | | $ | (0.188 | ) | | $ | (0.392 | ) | | $ | (0.396 | ) | | $ | (0.294 | ) | | $ | (0.422 | ) | | $ | (0.429 | ) | | $ | (0.422 | ) |
| | | | | | | |
Net asset value — End of period | | $ | 9.350 | | | $ | 9.350 | | | $ | 8.670 | | | $ | 9.600 | | | $ | 8.840 | | | $ | 8.320 | | | $ | 8.800 | |
| | | | | | | |
Total Return(3) | | | 2.02 | %(4) | | | 12.63 | % | | | (5.75 | )% | | | 12.06 | %(4) | | | 11.68 | % | | | (0.79 | )% | | | 31.71 | % |
| | | | | | | |
| Ratios/Supplemental Data | | | | | | | | | | | | | | | | | | | | | | | | | | | | |
Net assets, end of period (000’s omitted) | | $ | 201,021 | | | $ | 200,408 | | | $ | 224,506 | | | $ | 293,544 | | | $ | 299,566 | | | $ | 345,914 | | | $ | 464,221 | |
Ratios (as a percentage of average daily net assets): | | | | | | | | | | | | | | | | | | | | | | | | | | | | |
Expenses excluding interest and fees(6) | | | 0.83 | %(5) | | | 0.83 | % | | | 0.83 | % | | | 0.84 | %(5) | | | 0.85 | % | | | 0.83 | % | | | 0.84 | % |
Interest and fee
expense(7) | | | 0.07 | %(5) | | | 0.09 | % | | | 0.11 | % | | | 0.11 | %(5) | | | 0.12 | % | | | 0.13 | % | | | 0.11 | % |
Total expenses(6) | | | 0.90 | %(5) | | | 0.92 | % | | | 0.94 | % | | | 0.95 | %(5) | | | 0.97 | % | | | 0.96 | % | | | 0.95 | % |
Net investment income | | | 4.03 | %(5) | | | 4.40 | % | | | 4.26 | % | | | 4.24 | %(5) | | | 5.19 | % | | | 4.90 | % | | | 5.20 | % |
Portfolio Turnover | | | 9 | %(4) | | | 24 | % | | | 31 | % | | | 26 | %(4) | | | 20 | % | | | 15 | % | | | 46 | % |
| (1) | The Fund changed its fiscal year-end from December 31 to September 30. |
| (2) | Computed using average shares outstanding. |
| (3) | Returns are historical and are calculated by determining the percentage change in net asset value with all distributions reinvested and do not reflect the effect of sales charges. |
| (6) | Excludes the effect of custody fee credits, if any, of less than 0.005%. |
| (7) | Interest and fee expense relates to the liability for floating rate notes issued in conjunction with residual interest bond transactions (see Note 1I). |
| | | | |
| | 24 | | See Notes to Financial Statements. |
Eaton Vance
Municipal Income Funds
March 31, 2015
Financial Highlights — continued
| | | | | | | | | | | | | | | | | | | | | | | | | | | | |
| | | AMT-Free Fund — Class B | |
| | | Six Months Ended
March 31, 2015
(Unaudited) | | | Year Ended September 30, | | | Nine Months Ended September 30, 2012(1) | | | Year Ended December 31, | |
| | | | 2014 | | | 2013 | | | | 2011 | | | 2010 | | | 2009 | |
Net asset value — Beginning of period | | $ | 9.290 | | | $ | 8.620 | | | $ | 9.540 | | | $ | 8.780 | | | $ | 8.270 | | | $ | 8.740 | | | $ | 6.980 | |
| | | | | | | |
| Income (Loss) From Operations | | | | | | | | | | | | | | | | | | | | | | | | | | | | |
Net investment income(2) | | $ | 0.153 | | | $ | 0.326 | | | $ | 0.326 | | | $ | 0.242 | | | $ | 0.372 | | | $ | 0.368 | | | $ | 0.365 | |
Net realized and unrealized gain (loss) | | | (0.001 | ) | | | 0.667 | | | | (0.922 | ) | | | 0.758 | | | | 0.495 | | | | (0.477 | ) | | | 1.755 | |
| | | | | | | |
Total income (loss) from operations | | $ | 0.152 | | | $ | 0.993 | | | $ | (0.596 | ) | | $ | 1.000 | | | $ | 0.867 | | | $ | (0.109 | ) | | $ | 2.120 | |
| | | | | | | |
| Less Distributions | | | | | | | | | | | | | | | | | | | | | | | | | | | | |
From net investment income | | $ | (0.152 | ) | | $ | (0.323 | ) | | $ | (0.324 | ) | | $ | (0.240 | ) | | $ | (0.357 | ) | | $ | (0.361 | ) | | $ | (0.360 | ) |
| | | | | | | |
Total distributions | | $ | (0.152 | ) | | $ | (0.323 | ) | | $ | (0.324 | ) | | $ | (0.240 | ) | | $ | (0.357 | ) | | $ | (0.361 | ) | | $ | (0.360 | ) |
| | | | | | | |
Net asset value — End of period | | $ | 9.290 | | | $ | 9.290 | | | $ | 8.620 | | | $ | 9.540 | | | $ | 8.780 | | | $ | 8.270 | | | $ | 8.740 | |
| | | | | | | |
Total Return(3) | | | 1.64 | %(4) | | | 11.73 | % | | | (6.42 | )% | | | 11.50 | %(4) | | | 10.76 | % | | | (1.43 | )% | | | 30.80 | % |
| | | | | | | |
| Ratios/Supplemental Data | | | | | | | | | | | | | | | | | | | | | | | | | | | | |
Net assets, end of period (000’s omitted) | | $ | 1,089 | | | $ | 1,647 | | | $ | 2,893 | | | $ | 5,236 | | | $ | 7,771 | | | $ | 13,078 | | | $ | 19,252 | |
Ratios (as a percentage of average daily net assets): | | | | | | | | | | | | | | | | | | | | | | | | | | | | |
Expenses excluding interest and fees(6) | | | 1.58 | %(5) | | | 1.58 | % | | | 1.58 | % | | | 1.59 | %(5) | | | 1.61 | % | | | 1.58 | % | | | 1.59 | % |
Interest and fee
expense(7) | | | 0.07 | %(5) | | | 0.09 | % | | | 0.11 | % | | | 0.11 | %(5) | | | 0.12 | % | | | 0.13 | % | | | 0.11 | % |
Total expenses(6) | | | 1.65 | %(5) | | | 1.67 | % | | | 1.69 | % | | | 1.70 | %(5) | | | 1.73 | % | | | 1.71 | % | | | 1.70 | % |
Net investment income | | | 3.28 | %(5) | | | 3.67 | % | | | 3.49 | % | | | 3.50 | %(5) | | | 4.46 | % | | | 4.16 | % | | | 4.47 | % |
Portfolio Turnover | | | 9 | %(4) | | | 24 | % | | | 31 | % | | | 26 | %(4) | | | 20 | % | | | 15 | % | | | 46 | % |
| (1) | The Fund changed its fiscal year-end from December 31 to September 30. |
| (2) | Computed using average shares outstanding. |
| (3) | Returns are historical and are calculated by determining the percentage change in net asset value with all distributions reinvested and do not reflect the effect of sales charges. |
| (6) | Excludes the effect of custody fee credits, if any, of less than 0.005%. |
| (7) | Interest and fee expense relates to the liability for floating rate notes issued in conjunction with residual interest bond transactions (see Note 1I). |
| | | | |
| | 25 | | See Notes to Financial Statements. |
Eaton Vance
Municipal Income Funds
March 31, 2015
Financial Highlights — continued
| | | | | | | | | | | | | | | | | | | | | | | | | | | | |
| | | AMT-Free Fund — Class C | |
| | | Six Months Ended
March 31, 2015
(Unaudited) | | | Year Ended September 30, | | | Nine Months Ended September 30, 2012(1) | | | Year Ended December 31, | |
| | | | 2014 | | | 2013 | | | | 2011 | | | 2010 | | | 2009 | |
Net asset value — Beginning of period | | $ | 9.300 | | | $ | 8.620 | | | $ | 9.550 | | | $ | 8.790 | | | $ | 8.280 | | | $ | 8.750 | | | $ | 6.990 | |
| | | | | | | |
| Income (Loss) From Operations | | | | | | | | | | | | | | | | | | | | | | | | | | | | |
Net investment income(2) | | $ | 0.153 | | | $ | 0.326 | | | $ | 0.327 | | | $ | 0.242 | | | $ | 0.371 | | | $ | 0.367 | | | $ | 0.365 | |
Net realized and unrealized gain (loss) | | | (0.001 | ) | | | 0.677 | | | | (0.933 | ) | | | 0.758 | | | | 0.496 | | | | (0.475 | ) | | | 1.755 | |
| | | | | | | |
Total income (loss) from operations | | $ | 0.152 | | | $ | 1.003 | | | $ | (0.606 | ) | | $ | 1.000 | | | $ | 0.867 | | | $ | (0.108 | ) | | $ | 2.120 | |
| | | | | | | |
| Less Distributions | | | | | | | | | | | | | | | | | | | | | | | | | | | | |
From net investment income | | $ | (0.152 | ) | | $ | (0.323 | ) | | $ | (0.324 | ) | | $ | (0.240 | ) | | $ | (0.357 | ) | | $ | (0.362 | ) | | $ | (0.360 | ) |
| | | | | | | |
Total distributions | | $ | (0.152 | ) | | $ | (0.323 | ) | | $ | (0.324 | ) | | $ | (0.240 | ) | | $ | (0.357 | ) | | $ | (0.362 | ) | | $ | (0.360 | ) |
| | | | | | | |
Net asset value — End of period | | $ | 9.300 | | | $ | 9.300 | | | $ | 8.620 | | | $ | 9.550 | | | $ | 8.790 | | | $ | 8.280 | | | $ | 8.750 | |
| | | | | | | |
Total Return(3) | | | 1.64 | %(4) | | | 11.84 | % | | | (6.51 | )% | | | 11.49 | %(4) | | | 10.76 | % | | | (1.42 | )% | | | 30.76 | % |
| | | | | | | |
| Ratios/Supplemental Data | | | | | | | | | | | | | | | | | | | | | | | | | | | | |
Net assets, end of period (000’s omitted) | | $ | 42,361 | | | $ | 37,193 | | | $ | 40,823 | | | $ | 50,099 | | | $ | 43,863 | | | $ | 50,369 | | | $ | 56,641 | |
Ratios (as a percentage of average daily net assets): | | | | | | | | | | | | | | | | | | | | | | | | | | | | |
Expenses excluding interest and fees(6) | | | 1.58 | %(5) | | | 1.58 | % | | | 1.58 | % | | | 1.59 | %(5) | | | 1.61 | % | | | 1.57 | % | | | 1.59 | % |
Interest and fee
expense(7) | | | 0.07 | %(5) | | | 0.09 | % | | | 0.11 | % | | | 0.11 | %(5) | | | 0.12 | % | | | 0.13 | % | | | 0.11 | % |
Total expenses(6) | | | 1.65 | %(5) | | | 1.67 | % | | | 1.69 | % | | | 1.70 | %(5) | | | 1.73 | % | | | 1.70 | % | | | 1.70 | % |
Net investment income | | | 3.28 | %(5) | | | 3.65 | % | | | 3.52 | % | | | 3.48 | %(5) | | | 4.42 | % | | | 4.14 | % | | | 4.44 | % |
Portfolio Turnover | | | 9 | %(4) | | | 24 | % | | | 31 | % | | | 26 | %(4) | | | 20 | % | | | 15 | % | | | 46 | % |
| (1) | The Fund changed its fiscal year-end from December 31 to September 30. |
| (2) | Computed using average shares outstanding. |
| (3) | Returns are historical and are calculated by determining the percentage change in net asset value with all distributions reinvested and do not reflect the effect of sales charges. |
| (6) | Excludes the effect of custody fee credits, if any, of less than 0.005%. |
| (7) | Interest and fee expense relates to the liability for floating rate notes issued in conjunction with residual interest bond transactions (see Note 1I). |
| | | | |
| | 26 | | See Notes to Financial Statements. |
Eaton Vance
Municipal Income Funds
March 31, 2015
Financial Highlights — continued
| | | | | | | | | | | | | | | | | | | | | | | | | | | | |
| | | AMT-Free Fund — Class I | |
| | | Six Months Ended
March 31, 2015
(Unaudited) | | | Year Ended September 30, | | | Nine Months Ended September 30, 2012(1) | | | Year Ended December 31, | |
| | | | 2014 | | | 2013 | | | | 2011 | | | 2010 | | | 2009 | |
Net asset value — Beginning of period | | $ | 10.210 | | | $ | 9.470 | | | $ | 10.480 | | | $ | 9.660 | | | $ | 9.090 | | | $ | 9.610 | | | $ | 7.670 | |
| | | | | | |
| Income (Loss) From Operations | | | | | | | | | | | | | | | | | | | | | | | | | |
Net investment income(2) | | $ | 0.219 | | | $ | 0.455 | | | $ | 0.463 | | | $ | 0.341 | | | $ | 0.500 | | | $ | 0.500 | | | $ | 0.491 | |
Net realized and unrealized gain (loss) | | | 0.009 | | | | 0.737 | | | | (1.015 | ) | | | 0.819 | | | | 0.554 | | | | (0.528 | ) | | | 1.932 | |
| | | | | | | |
Total income (loss) from operations | | $ | 0.228 | | | $ | 1.192 | | | $ | (0.552 | ) | | $ | 1.160 | | | $ | 1.054 | | | $ | (0.028 | ) | | $ | 2.423 | |
| | | | | | | |
| Less Distributions | | | | | | | | | | | | | | | | | | | | | | | | | | | | |
From net investment income | | $ | (0.218 | ) | | $ | (0.452 | ) | | $ | (0.458 | ) | | $ | (0.340 | ) | | $ | (0.484 | ) | | $ | (0.492 | ) | | $ | (0.483 | ) |
| | | | | | | |
Total distributions | | $ | (0.218 | ) | | $ | (0.452 | ) | | $ | (0.458 | ) | | $ | (0.340 | ) | | $ | (0.484 | ) | | $ | (0.492 | ) | | $ | (0.483 | ) |
| | | | | | | |
Net asset value — End of period | | $ | 10.220 | | | $ | 10.210 | | | $ | 9.470 | | | $ | 10.480 | | | $ | 9.660 | | | $ | 9.090 | | | $ | 9.610 | |
| | | | | | | |
Total Return(3) | | | 2.15 | %(4) | | | 12.99 | % | | | (5.46 | )% | | | 12.27 | %(4) | | | 11.87 | % | | | (0.50 | )% | | | 31.98 | % |
| | | | | | | |
| Ratios/Supplemental Data | | | | | | | | | | | | | | | | | | | | | | | | | | | | |
Net assets, end of period (000’s omitted) | | $ | 109,167 | | | $ | 102,404 | | | $ | 99,553 | | | $ | 125,642 | | | $ | 101,762 | | | $ | 130,202 | | | $ | 196,069 | |
Ratios (as a percentage of average daily net assets): | | | | | | | | | | | | | | | | | | | | | | | | | | | | |
Expenses excluding interest and fees(6) | | | 0.58 | %(5) | | | 0.58 | % | | | 0.58 | % | | | 0.59 | %(5) | | | 0.60 | % | | | 0.57 | % | | | 0.59 | % |
Interest and fee expense(7) | | | 0.07 | %(5) | | | 0.09 | % | | | 0.11 | % | | | 0.11 | %(5) | | | 0.12 | % | | | 0.13 | % | | | 0.11 | % |
Total expenses(6) | | | 0.65 | %(5) | | | 0.67 | % | | | 0.69 | % | | | 0.70 | %(5) | | | 0.72 | % | | | 0.70 | % | | | 0.70 | % |
Net investment income | | | 4.28 | %(5) | | | 4.64 | % | | | 4.52 | % | | | 4.48 | %(5) | | | 5.42 | % | | | 5.14 | % | | | 5.43 | % |
Portfolio Turnover | | | 9 | %(4) | | | 24 | % | | | 31 | % | | | 26 | %(4) | | | 20 | % | | | 15 | % | | | 46 | % |
| (1) | The Fund changed its fiscal year-end from December 31 to September 30. |
| (2) | Computed using average shares outstanding. |
| (3) | Returns are historical and are calculated by determining the percentage change in net asset value with all distributions reinvested. |
| (6) | Excludes the effect of custody fee credits, if any, of less than 0.005%. |
| (7) | Interest and fee expense relates to the liability for floating rate notes issued in conjunction with residual interest bond transactions (see Note 1I). |
| | | | |
| | 27 | | See Notes to Financial Statements. |
Eaton Vance
Municipal Income Funds
March 31, 2015
Financial Highlights — continued
| | | | | | | | | | | | | | | | | | | | | | | | |
| | | National Fund — Class A | |
| | | Six Months Ended
March 31, 2015
(Unaudited) | | | Year Ended September 30, | |
| | | | 2014 | | | 2013 | | | 2012 | | | 2011 | | | 2010 | |
Net asset value — Beginning of period | | $ | 9.870 | | | $ | 9.170 | | | $ | 10.200 | | | $ | 9.360 | | | $ | 10.020 | | | $ | 10.040 | |
| | | | | | |
| Income (Loss) From Operations | | | | | | | | | | | | | | | | | | | | | | | | |
Net investment income(1) | | $ | 0.195 | | | $ | 0.446 | | | $ | 0.468 | | | $ | 0.477 | | | $ | 0.549 | | | $ | 0.527 | |
Net realized and unrealized gain (loss) | | | 0.048 | | | | 0.707 | | | | (1.032 | ) | | | 0.842 | | | | (0.682 | ) | | | (0.022 | ) |
| | | | | | |
Total income (loss) from operations | | $ | 0.243 | | | $ | 1.153 | | | $ | (0.564 | ) | | $ | 1.319 | | | $ | (0.133 | ) | | $ | 0.505 | |
| | | | | | |
| Less Distributions | | | | | | | | | | | | | | | | | | | | | | | | |
From net investment income | | $ | (0.193 | ) | | $ | (0.453 | ) | | $ | (0.466 | ) | | $ | (0.479 | ) | | $ | (0.527 | ) | | $ | (0.525 | ) |
| | | | | | |
Total distributions | | $ | (0.193 | ) | | $ | (0.453 | ) | | $ | (0.466 | ) | | $ | (0.479 | ) | | $ | (0.527 | ) | | $ | (0.525 | ) |
| | | | | | |
Net asset value — End of period | | $ | 9.920 | | | $ | 9.870 | | | $ | 9.170 | | | $ | 10.200 | | | $ | 9.360 | | | $ | 10.020 | |
| | | | | | |
Total Return(2) | | | 2.48 | %(3) | | | 12.89 | % | | | (5.77 | )% | | | 14.42 | % | | | (1.00 | )% | | | 5.36 | % |
| | | | | | |
| Ratios/Supplemental Data | | | | | | | | | | | | | | | | | | | | | | | | |
Net assets, end of period (000’s omitted) | | $ | 2,016,418 | | | $ | 2,126,465 | | | $ | 2,134,502 | | | $ | 2,975,655 | | | $ | 2,872,630 | | | $ | 3,971,060 | |
Ratios (as a percentage of average daily net assets): | | | | | | | | | | | | | | | | | | | | | | | | |
Expenses excluding interest and fees(4) | | | 0.66 | %(5) | | | 0.71 | % | | | 0.66 | % | | | 0.67 | % | | | 0.69 | % | | | 0.67 | % |
Interest and fee expense(6) | | | 0.09 | %(5) | | | 0.09 | % | | | 0.11 | % | | | 0.11 | % | | | 0.13 | % | | | 0.13 | % |
Total expenses(4) | | �� | 0.75 | %(5) | | | 0.80 | % | | | 0.77 | % | | | 0.78 | % | | | 0.82 | % | | | 0.80 | % |
Net investment income | | | 3.94 | %(5) | | | 4.71 | % | | | 4.67 | % | | | 4.88 | % | | | 6.04 | % | | | 5.45 | % |
Portfolio Turnover | | | 34 | %(3) | | | 47 | % | | | 74 | % | | | 59 | % | | | 18 | % | | | 20 | % |
| (1) | Computed using average shares outstanding. |
| (2) | Returns are historical and are calculated by determining the percentage change in net asset value with all distributions reinvested and do not reflect the effect of sales charges. |
| (4) | Excludes the effect of custody fee credits, if any, of less than 0.005%. |
| (6) | Interest and fee expense relates to the liability for floating rate notes issued in conjunction with residual interest bond transactions (see Note 1I). |
| | | | |
| | 28 | | See Notes to Financial Statements. |
Eaton Vance
Municipal Income Funds
March 31, 2015
Financial Highlights — continued
| | | | | | | | | | | | | | | | | | | | | | | | |
| | | National Fund — Class B | |
| | | Six Months Ended
March 31, 2015
(Unaudited) | | | Year Ended September 30, | |
| | | | 2014 | | | 2013 | | | 2012 | | | 2011 | | | 2010 | |
Net asset value — Beginning of period | | $ | 9.870 | | | $ | 9.170 | | | $ | 10.200 | | | $ | 9.360 | | | $ | 10.020 | | | $ | 10.050 | |
| | | | | | |
| Income (Loss) From Operations | | | | | | | | | | | | | | | | | | | | | | | | |
Net investment income(1) | | $ | 0.158 | | | $ | 0.379 | | | $ | 0.392 | | | $ | 0.405 | | | $ | 0.480 | | | $ | 0.455 | |
Net realized and unrealized gain (loss) | | | 0.048 | | | | 0.704 | | | | (1.031 | ) | | | 0.840 | | | | (0.681 | ) | | | (0.029 | ) |
| | | | | | |
Total income (loss) from operations | | $ | 0.206 | | | $ | 1.083 | | | $ | (0.639 | ) | | $ | 1.245 | | | $ | (0.201 | ) | | $ | 0.426 | |
| | | | | | |
| Less Distributions | | | | | | | | | | | | | | | | | | | | | | | | |
From net investment income | | $ | (0.156 | ) | | $ | (0.383 | ) | | $ | (0.391 | ) | | $ | (0.405 | ) | | $ | (0.459 | ) | | $ | (0.456 | ) |
| | | | | | |
Total distributions | | $ | (0.156 | ) | | $ | (0.383 | ) | | $ | (0.391 | ) | | $ | (0.405 | ) | | $ | (0.459 | ) | | $ | (0.456 | ) |
| | | | | | |
Net asset value — End of period | | $ | 9.920 | | | $ | 9.870 | | | $ | 9.170 | | | $ | 10.200 | | | $ | 9.360 | | | $ | 10.020 | |
| | | | | | |
Total Return(2) | | | 2.10 | %(3) | | | 12.06 | % | | | (6.47 | )% | | | 13.57 | % | | | (1.73 | )% | | | 4.51 | % |
| | | | | | |
| Ratios/Supplemental Data | | | | | | | | | | | | | | | | | | | | | | | | |
Net assets, end of period (000’s omitted) | | $ | 33,583 | | | $ | 42,655 | | | $ | 59,244 | | | $ | 103,613 | | | $ | 122,288 | | | $ | 160,946 | |
Ratios (as a percentage of average daily net assets): | | | | | | | | | | | | | | | | | | | | | | | | |
Expenses excluding interest and fees(4) | | | 1.41 | %(5) | | | 1.46 | % | | | 1.41 | % | | | 1.42 | % | | | 1.44 | % | | | 1.42 | % |
Interest and fee expense(6) | | | 0.09 | %(5) | | | 0.09 | % | | | 0.11 | % | | | 0.11 | % | | | 0.13 | % | | | 0.13 | % |
Total expenses(4) | | | 1.50 | %(5) | | | 1.55 | % | | | 1.52 | % | | | 1.53 | % | | | 1.57 | % | | | 1.55 | % |
Net investment income | | | 3.20 | %(5) | | | 4.01 | % | | | 3.90 | % | | | 4.15 | % | | | 5.29 | % | | | 4.70 | % |
Portfolio Turnover | | | 34 | %(3) | | | 47 | % | | | 74 | % | | | 59 | % | | | 18 | % | | | 20 | % |
| (1) | Computed using average shares outstanding. |
| (2) | Returns are historical and are calculated by determining the percentage change in net asset value with all distributions reinvested and do not reflect the effect of sales charges. |
| (4) | Excludes the effect of custody fee credits, if any, of less than 0.005%. |
| (6) | Interest and fee expense relates to the liability for floating rate notes issued in conjunction with residual interest bond transactions (see Note 1I). |
| | | | |
| | 29 | | See Notes to Financial Statements. |
Eaton Vance
Municipal Income Funds
March 31, 2015
Financial Highlights — continued
| | | | | | | | | | | | | | | | | | | | | | | | |
| | | National Fund — Class C | |
| | | Six Months Ended
March 31, 2015
(Unaudited) | | | Year Ended September 30, | |
| | | | 2014 | | | 2013 | | | 2012 | | | 2011 | | | 2010 | |
Net asset value — Beginning of period | | $ | 9.870 | | | $ | 9.170 | | | $ | 10.200 | | | $ | 9.360 | | | $ | 10.020 | | | $ | 10.050 | |
| | | | | | |
| Income (Loss) From Operations | | | | | | | | | | | | | | | | | | | | | | | | |
Net investment income(1) | | $ | 0.158 | | | $ | 0.376 | | | $ | 0.392 | | | $ | 0.404 | | | $ | 0.481 | | | $ | 0.455 | |
Net realized and unrealized gain (loss) | | | 0.048 | | | | 0.707 | | | | (1.031 | ) | | | 0.841 | | | | (0.682 | ) | | | (0.029 | ) |
| | | | | | |
Total income (loss) from operations | | $ | 0.206 | | | $ | 1.083 | | | $ | (0.639 | ) | | $ | 1.245 | | | $ | (0.201 | ) | | $ | 0.426 | |
| | | | | | |
| Less Distributions | | | | | | | | | | | | | | | | | | | | | | | | |
From net investment income | | $ | (0.156 | ) | | $ | (0.383 | ) | | $ | (0.391 | ) | | $ | (0.405 | ) | | $ | (0.459 | ) | | $ | (0.456 | ) |
| | | | | | |
Total distributions | | $ | (0.156 | ) | | $ | (0.383 | ) | | $ | (0.391 | ) | | $ | (0.405 | ) | | $ | (0.459 | ) | | $ | (0.456 | ) |
| | | | | | |
Net asset value — End of period | | $ | 9.920 | | | $ | 9.870 | | | $ | 9.170 | | | $ | 10.200 | | | $ | 9.360 | | | $ | 10.020 | |
| | | | | | |
Total Return(2) | | | 2.10 | %(3) | | | 12.06 | % | | | (6.47 | )% | | | 13.58 | % | | | (1.74 | )% | | | 4.51 | % |
| | | | | | |
| Ratios/Supplemental Data | | | | | | | | | | | | | | | | | | | | | | | | |
Net assets, end of period (000’s omitted) | | $ | 626,139 | | | $ | 645,801 | | | $ | 681,072 | | | $ | 980,799 | | | $ | 932,773 | | | $ | 1,281,278 | |
Ratios (as a percentage of average daily net assets): | | | | | | | | | | | | | | | | | | | | | | | | |
Expenses excluding interest and fees(4) | | | 1.41 | %(5) | | | 1.46 | % | | | 1.41 | % | | | 1.42 | % | | | 1.44 | % | | | 1.42 | % |
Interest and fee expense(6) | | | 0.09 | %(5) | | | 0.09 | % | | | 0.11 | % | | | 0.11 | % | | | 0.13 | % | | | 0.13 | % |
Total expenses(4) | | | 1.50 | %(5) | | | 1.55 | % | | | 1.52 | % | | | 1.53 | % | | | 1.57 | % | | | 1.55 | % |
Net investment income | | | 3.19 | %(5) | | | 3.98 | % | | | 3.92 | % | | | 4.13 | % | | | 5.29 | % | | | 4.70 | % |
Portfolio Turnover | | | 34 | %(3) | | | 47 | % | | | 74 | % | | | 59 | % | | | 18 | % | | | 20 | % |
| (1) | Computed using average shares outstanding. |
| (2) | Returns are historical and are calculated by determining the percentage change in net asset value with all distributions reinvested and do not reflect the effect of sales charges. |
| (4) | Excludes the effect of custody fee credits, if any, of less than 0.005%. |
| (6) | Interest and fee expense relates to the liability for floating rate notes issued in conjunction with residual interest bond transactions (see Note 1I). |
| | | | |
| | 30 | | See Notes to Financial Statements. |
Eaton Vance
Municipal Income Funds
March 31, 2015
Financial Highlights — continued
| | | | | | | | | | | | | | | | | | | | | | | | |
| | | National Fund — Class I | |
| | | Six Months Ended March 31, 2015 (Unaudited) | | | Year Ended September 30, | |
| | | | 2014 | | | 2013 | | | 2012 | | | 2011 | | | 2010 | |
Net asset value — Beginning of period | | $ | 9.870 | | | $ | 9.180 | | | $ | 10.200 | | | $ | 9.360 | | | $ | 10.020 | | | $ | 10.040 | |
| | | | | | |
| Income (Loss) From Operations | | | | | | | | | | | | | | | | | | | | | | | | |
Net investment income(1) | | $ | 0.208 | | | $ | 0.478 | | | $ | 0.492 | | | $ | 0.499 | | | $ | 0.565 | | | $ | 0.552 | |
Net realized and unrealized gain (loss) | | | 0.048 | | | | 0.690 | | | | (1.021 | ) | | | 0.844 | | | | (0.675 | ) | | | (0.024 | ) |
| | | | | | |
Total income (loss) from operations | | $ | 0.256 | | | $ | 1.168 | | | $ | (0.529 | ) | | $ | 1.343 | | | $ | (0.110 | ) | | $ | 0.528 | |
| | | | | | |
| Less Distributions | | | | | | | | | | | | | | | | | | | | | | | | |
From net investment income | | $ | (0.206 | ) | | $ | (0.478 | ) | | $ | (0.491 | ) | | $ | (0.503 | ) | | $ | (0.550 | ) | | $ | (0.548 | ) |
| | | | | | |
Total distributions | | $ | (0.206 | ) | | $ | (0.478 | ) | | $ | (0.491 | ) | | $ | (0.503 | ) | | $ | (0.550 | ) | | $ | (0.548 | ) |
| | | | | | |
Net asset value — End of period | | $ | 9.920 | | | $ | 9.870 | | | $ | 9.180 | | | $ | 10.200 | | | $ | 9.360 | | | $ | 10.020 | |
| | | | | | |
Total Return(2) | | | 2.50 | %(3) | | | 13.17 | % | | | (5.43 | )% | | | 14.71 | % | | | (0.75 | )% | | | 5.61 | % |
| | | | | | |
| Ratios/Supplemental Data | | | | | | | | | | | | | | | | | | | | | | | | |
Net assets, end of period (000’s omitted) | | $ | 702,572 | | | $ | 686,514 | | | $ | 981,936 | | | $ | 1,142,323 | | | $ | 796,970 | | | $ | 522,370 | |
Ratios (as a percentage of average daily net assets): | | | | | | | | | | | | | | | | | | | | | | | | |
Expenses excluding interest and fees(4) | | | 0.41 | %(5) | | | 0.46 | % | | | 0.41 | % | | | 0.42 | % | | | 0.43 | % | | | 0.42 | % |
Interest and fee expense(6) | | | 0.09 | %(5) | | | 0.09 | % | | | 0.11 | % | | | 0.11 | % | | | 0.13 | % | | | 0.13 | % |
Total expenses(4) | | | 0.50 | %(5) | | | 0.55 | % | | | 0.52 | % | | | 0.53 | % | | | 0.56 | % | | | 0.55 | % |
Net investment income | | | 4.19 | %(5) | | | 5.07 | % | | | 4.93 | % | | | 5.09 | % | | | 6.23 | % | | | 5.70 | % |
Portfolio Turnover | | | 34 | %(3) | | | 47 | % | | | 74 | % | | | 59 | % | | | 18 | % | | | 20 | % |
| (1) | Computed using average shares outstanding. |
| (2) | Returns are historical and are calculated by determining the percentage change in net asset value with all distributions reinvested. |
| (4) | Excludes the effect of custody fee credits, if any, of less than 0.005%. |
| (6) | Interest and fee expense relates to the liability for floating rate notes issued in conjunction with residual interest bond transactions (see Note 1I). |
| | | | |
| | 31 | | See Notes to Financial Statements. |
Eaton Vance
Municipal Income Funds
March 31, 2015
Notes to Financial Statements (Unaudited)
1 Significant Accounting Policies
Eaton Vance AMT-Free Municipal Income Fund (AMT-Free Fund) and Eaton Vance National Municipal Income Fund (National Fund) (each individually referred to as the Fund, and collectively, the Funds) are a diversified series of Eaton Vance Mutual Funds Trust and Eaton Vance Municipals Trust, respectively (collectively, the Trusts). The Trusts are Massachusetts business trusts registered under the Investment Company Act of 1940, as amended (the 1940 Act), as open-end management investment companies. The Funds’ investment objective is to provide current income exempt from regular federal income tax. The Funds offer four classes of shares. Class A shares are generally sold subject to a sales charge imposed at time of purchase. Class B and Class C shares are sold at net asset value and are generally subject to a contingent deferred sales charge (see Note 5). Class I shares are sold at net asset value and are not subject to a sales charge. Class B shares of each Fund automatically convert to Class A shares eight years after their purchase as described in each Fund’s prospectus. Beginning January 1, 2012, Class B shares are only available for purchase upon exchange from another Eaton Vance fund or through reinvestment of distributions. Each class represents a pro-rata interest in the Fund, but votes separately on class-specific matters and (as noted below) is subject to different expenses. Realized and unrealized gains and losses are allocated daily to each class of shares based on the relative net assets of each class to the total net assets of the Fund. Net investment income, other than class-specific expenses, is allocated daily to each class of shares based upon the ratio of the value of each class’s paid shares to the total value of all paid shares. Each class of shares differs in its distribution plan and certain other class-specific expenses.
The following is a summary of significant accounting policies of the Funds. The policies are in conformity with accounting principles generally accepted in the United States of America (U.S. GAAP). Each Fund is an investment company and follows accounting and reporting guidance in the Financial Accounting Standards Board (“FASB”) Accounting Standards Codification Topic 946.
A Investment Valuation — The following methodologies are used to determine the market value or fair value of investments.
Debt Obligations. Debt obligations (including short-term obligations with a remaining maturity of more than sixty days) are generally valued on the basis of valuations provided by third party pricing services, as derived from such services’ pricing models. Inputs to the models may include, but are not limited to, reported trades, executable bid and asked prices, broker/dealer quotations, prices or yields of securities with similar characteristics, interest rates, anticipated prepayments, benchmark curves or information pertaining to the issuer, as well as industry and economic events. The pricing services may use a matrix approach, which considers information regarding securities with similar characteristics to determine the valuation for a security. Short-term obligations purchased with a remaining maturity of sixty days or less are generally valued at amortized cost, which approximates market value.
Derivatives. Financial futures contracts are valued at the closing settlement price established by the board of trade or exchange on which they are traded.
Fair Valuation. Investments for which valuations or market quotations are not readily available or are deemed unreliable are valued at fair value using methods determined in good faith by or at the direction of the Trustees of a Fund in a manner that fairly reflects the security’s value, or the amount that a Fund might reasonably expect to receive for the security upon its current sale in the ordinary course. Each such determination is based on a consideration of relevant factors, which are likely to vary from one pricing context to another. These factors may include, but are not limited to, the type of security, the existence of any contractual restrictions on the security’s disposition, the price and extent of public trading in similar securities of the issuer or of comparable entities, quotations or relevant information obtained from broker/dealers or other market participants, information obtained from the issuer, analysts, and/or the appropriate stock exchange (for exchange-traded securities), an analysis of the entity’s financial condition, and an evaluation of the forces that influence the issuer and the market(s) in which the security is purchased and sold.
B Investment Transactions and Related Income — Investment transactions for financial statement purposes are accounted for on a trade date basis. Realized gains and losses on investments sold are determined on the basis of identified cost. Interest income is recorded on the basis of interest accrued, adjusted for amortization of premium or accretion of discount.
C Federal Taxes — Each Fund’s policy is to comply with the provisions of the Internal Revenue Code applicable to regulated investment companies and to distribute to shareholders each year substantially all of its taxable, if any, and tax-exempt net investment income, and all or substantially all of its net realized capital gains. Accordingly, no provision for federal income or excise tax is necessary. Each Fund intends to satisfy conditions which will enable it to designate distributions from the interest income generated by its investments in non-taxable municipal securities, which are exempt from regular federal income tax when received by each Fund, as exempt-interest dividends. For National Fund, the portion of such interest, if any, earned on private activity bonds issued after August 7, 1986, may be considered a tax preference item to shareholders.
As of March 31, 2015, the Funds had no uncertain tax positions that would require financial statement recognition, de-recognition, or disclosure. Each Fund files a U.S. federal income tax return annually after its fiscal year-end, which is subject to examination by the Internal Revenue Service for a period of three years from the date of filing.
D Expenses — The majority of expenses of the Trusts are directly identifiable to an individual fund. Expenses which are not readily identifiable to a specific fund are allocated taking into consideration, among other things, the nature and type of expense and the relative size of the funds.
E Expense Reduction — State Street Bank and Trust Company (SSBT) serves as custodian of the Funds. Pursuant to the custodian agreement, SSBT receives a fee reduced by credits, which are determined based on the average daily cash balance each Fund maintains with SSBT. All credit balances, if any, used to reduce each Fund’s custodian fees are reported as a reduction of expenses in the Statements of Operations.
Eaton Vance
Municipal Income Funds
March 31, 2015
Notes to Financial Statements (Unaudited) — continued
F Legal Fees — Legal fees and other related expenses incurred as part of negotiations of the terms and requirement of capital infusions, or that are expected to result in the restructuring of, or a plan of reorganization for, an investment are recorded as realized losses. Ongoing expenditures to protect or enhance an investment are treated as operating expenses.
G Use of Estimates — The preparation of the financial statements in conformity with U.S. GAAP requires management to make estimates and assumptions that affect the reported amounts of assets and liabilities at the date of the financial statements and the reported amounts of income and expense during the reporting period. Actual results could differ from those estimates.
H Indemnifications — Under each Trust’s organizational documents, its officers and Trustees may be indemnified against certain liabilities and expenses arising out of the performance of their duties to the Funds. Under Massachusetts law, if certain conditions prevail, shareholders of a Massachusetts business trust (such as a Trust) could be deemed to have personal liability for the obligations of the Trust. However, each Trust’s Declaration of Trust contains an express disclaimer of liability on the part of Fund shareholders and the By-laws provide that the Trust shall assume the defense on behalf of any Fund shareholders. Moreover, the By-laws also provide for indemnification out of Fund property of any shareholder held personally liable solely by reason of being or having been a shareholder for all loss or expense arising from such liability. Additionally, in the normal course of business, each Fund enters into agreements with service providers that may contain indemnification clauses. Each Fund’s maximum exposure under these arrangements is unknown as this would involve future claims that may be made against each Fund that have not yet occurred.
I Floating Rate Notes Issued in Conjunction with Securities Held — The Funds may invest in residual interest bonds, also referred to as inverse floating rate securities, whereby a Fund may sell a variable or fixed rate bond to a broker for cash. At the same time, the Fund buys a residual interest in the assets and cash flows of a Special-Purpose Vehicle (the SPV), (which is generally organized as a trust), set up by the broker. The broker deposits a bond into the SPV with the same CUSIP number as the bond sold to the broker by the Fund, and which may have been, but is not required to be, the bond purchased from the Fund (the Bond). The SPV also issues floating rate notes (Floating Rate Notes) which are sold to third-parties. The residual interest bond held by a Fund gives the Fund the right (1) to cause the holders of the Floating Rate Notes to generally tender their notes at par, and (2) to have the broker transfer the Bond held by the SPV to the Fund, thereby terminating the SPV. Should the Fund exercise such right, it would generally pay the broker the par amount due on the Floating Rate Notes and exchange the residual interest bond for the underlying Bond. Pursuant to generally accepted accounting principles for transfers and servicing of financial assets and extinguishment of liabilities, the Funds account for the transaction described above as a secured borrowing by including the Bond in their Portfolio of Investments and the Floating Rate Notes as a liability under the caption “Payable for floating rate notes issued” in their Statement of Assets and Liabilities. The Floating Rate Notes have interest rates that generally reset weekly and their holders have the option to tender their notes to the broker for redemption at par at each reset date. Accordingly, the fair value of the payable for floating rate notes issued approximates its carrying value. If measured at fair value, the payable for floating rate notes would have been considered as Level 2 in the fair value hierarchy (see Note 10) at March 31, 2015. Interest expense related to the Funds’ liability with respect to Floating Rate Notes is recorded as incurred. The SPV may be terminated by the Fund, as noted above, or by the broker upon the occurrence of certain termination events as defined in the trust agreement, such as a downgrade in the credit quality of the underlying Bond, bankruptcy of or payment failure by the issuer of the underlying Bond, the inability to remarket Floating Rate Notes that have been tendered due to insufficient buyers in the market, or the failure by the SPV to obtain renewal of the liquidity agreement under which liquidity support is provided for the Floating Rate Notes up to one year. At March 31, 2015, the amounts of the Funds’ Floating Rate Notes and related interest rates and collateral were as follows:
| | | | | | | | |
| | | AMT-Free
Fund | | | National
Fund | |
| | |
Floating Rate Notes Outstanding | | $ | 40,685,000 | | | $ | 492,765,000 | |
Interest Rate or Range of Interest Rates (%) | | | 0.02 - 0.03 | | | | 0.02 - 0.22 | |
Collateral for Floating Rate Notes Outstanding | | $ | 64,626,961 | | | $ | 765,163,199 | |
For the six months ended March 31, 2015, the Funds’ average Floating Rate Notes outstanding and the average interest rate (annualized) including fees were as follows:
| | | | | | | | |
| | | AMT-Free
Fund | | | National
Fund | |
| | |
Average Floating Rate Notes Outstanding | | $ | 40,948,736 | | | $ | 486,182,637 | |
Average Interest Rate | | | 0.62 | % | | | 0.62 | % |
The Funds may enter into shortfall and forbearance agreements with the broker by which a Fund agrees to reimburse the broker, in certain circumstances, for the difference between the liquidation value of the Bond held by the SPV and the liquidation value of the Floating Rate Notes, as well as any shortfalls in interest cash flows. The Funds had no shortfalls as of March 31, 2015.
Eaton Vance
Municipal Income Funds
March 31, 2015
Notes to Financial Statements (Unaudited) — continued
The Funds may also purchase residual interest bonds from brokers in a secondary market transaction without first owning the underlying bond. Such transactions are not required to be treated as secured borrowings. Shortfall agreements, if any, related to residual interest bonds purchased in a secondary market transaction are disclosed in the Portfolio of Investments.
The Funds’ investment policies and restrictions expressly permit investments in residual interest bonds. Such bonds typically offer the potential for yields exceeding the yields available on fixed rate bonds with comparable credit quality and maturity. These securities tend to underperform the market for fixed rate bonds in a rising long-term interest rate environment, but tend to outperform the market for fixed rate bonds when long-term interest rates decline. The value and income of residual interest bonds are generally more volatile than that of a fixed rate bond. The Funds’ investment policies do not allow the Funds to borrow money except as permitted by the 1940 Act. Management believes that the Funds’ restrictions on borrowing money and issuing senior securities (other than as specifically permitted) do not apply to Floating Rate Notes issued by the SPV and included as a liability in the Funds’ Statement of Assets and Liabilities. As secured indebtedness issued by an SPV, Floating Rate Notes are distinct from the borrowings and senior securities to which the Funds’ restrictions apply. Residual interest bonds held by the Funds are securities exempt from registration under Rule 144A of the Securities Act of 1933.
On December 10, 2013, five U.S. federal agencies published final rules implementing section 619 of the Dodd-Frank Wall Street Reform and Consumer Protection Act (the “Volcker Rule”). The Volcker Rule prohibits banking entities from engaging in proprietary trading of certain instruments and limits such entities’ investments in, and relationships with, covered funds (such as SPVs), as defined in the rules. The compliance date for the Volcker Rule for certain covered funds is July 21, 2015 while for other covered funds the compliance date is July 21, 2016. The Volcker Rule precludes banking entities and their affiliates from (i) sponsoring residual interest bond programs (as such programs are presently structured) and (ii) continuing relationships with or services for existing residual interest bond programs. As a result, residual interest bond trusts will need to be restructured or unwound. There can be no assurances that residual interest bond trusts can be restructured, that new sponsors of residual interest bond programs will develop, or that alternative forms of leverage will be available to the Funds. The effects of the Volcker Rule may make it more difficult for the Funds to maintain current or desired levels of leverage and may cause the Funds to incur additional expenses to maintain their leverage.
As of March 31, 2015, the Funds’ investments in residual interest bonds that must be compliant with the Volcker Rule by July 21, 2015, if any, are anticipated to be restructured by the required compliance date.
J Financial Futures Contracts — Upon entering into a financial futures contract, a Fund is required to deposit with the broker, either in cash or securities, an amount equal to a certain percentage of the contract amount (initial margin). Subsequent payments, known as variation margin, are made or received by the Fund each business day, depending on the daily fluctuations in the value of the underlying security, and are recorded as unrealized gains or losses by the Fund. Gains (losses) are realized upon the expiration or closing of the financial futures contracts. Should market conditions change unexpectedly, the Fund may not achieve the anticipated benefits of the financial futures contracts and may realize a loss. Futures contracts have minimal counterparty risk as they are exchange traded and the clearinghouse for the exchange is substituted as the counterparty, guaranteeing counterparty performance.
K When-Issued Securities and Delayed Delivery Transactions — The Funds may purchase or sell securities on a delayed delivery or when-issued basis. Payment and delivery may take place after the customary settlement period for that security. At the time the transaction is negotiated, the price of the security that will be delivered is fixed. The Funds maintain security positions for these commitments such that sufficient liquid assets will be available to make payments upon settlement. Securities purchased on a delayed delivery or when-issued basis are marked-to-market daily and begin earning interest on settlement date. Losses may arise due to changes in the market value of the underlying securities or if the counterparty does not perform under the contract.
L Statement of Cash Flows — The cash amount shown in the Statement of Cash Flows of a Fund is the amount included in the Fund’s Statement of Assets and Liabilities and represents the unrestricted cash on hand at its custodian and does not include any short-term investments.
M Interim Financial Statements — The interim financial statements relating to March 31, 2015 and for the six months then ended have not been audited by an independent registered public accounting firm, but in the opinion of the Funds’ management, reflect all adjustments, consisting only of normal recurring adjustments, necessary for the fair presentation of the financial statements.
2 Distributions to Shareholders and Income Tax Information
The net investment income of each Fund is determined daily and substantially all of the net investment income so determined is declared as a dividend to shareholders of record at the time of declaration. Distributions are declared separately for each class of shares. Distributions are paid monthly. Distributions of realized capital gains (reduced by available capital loss carryforwards) are made at least annually. Shareholders may reinvest income and capital gain distributions in additional shares of the same class of a Fund at the net asset value as of the reinvestment date or, at the election of the shareholder, receive distributions in cash. Distributions to shareholders are determined in accordance with income tax regulations, which may differ from U.S. GAAP. As required by U.S. GAAP, only distributions in excess of tax basis earnings and profits are reported in the financial statements as a return of capital. Permanent differences between book and tax accounting relating to distributions are reclassified to paid-in capital. For tax purposes, distributions from short-term capital gains are considered to be from ordinary income.
Eaton Vance
Municipal Income Funds
March 31, 2015
Notes to Financial Statements (Unaudited) — continued
At September 30, 2014, the following Funds, for federal income tax purposes, had capital loss carryforwards and deferred capital losses which will reduce the respective Fund’s taxable income arising from future net realized gains on investment transactions, if any, to the extent permitted by the Internal Revenue Code, and thus will reduce the amount of distributions to shareholders, which would otherwise be necessary to relieve the Funds of any liability for federal income or excise tax. Under tax regulations, capital losses incurred in taxable years beginning after December 2010 are considered deferred capital losses and are treated as arising on the first day of a Fund’s next taxable year, retaining the same short-term or long-term character as when originally deferred. Deferred capital losses are required to be used prior to capital loss carryforwards, which carry an expiration date. As a result of this ordering rule, capital loss carryforwards may be more likely to expire unused. The amounts and expiration dates of the capital loss carryforwards, whose character is short-term, and the amounts of the deferred capital losses are as follows:
| | | | | | | | |
| Expiration Date | | AMT-Free Fund | | | National Fund | |
| | |
September 30, 2015 | | $ | 12,777,842 | | | $ | 1,872,342 | |
September 30, 2016 | | | 23,678,685 | | | | 53,981,575 | |
September 30, 2017 | | | 55,876,213 | | | | 16,271,265 | |
September 30, 2018 | | | 10,549,691 | | | | 797,269,779 | |
September 30, 2019 | | | — | | | | 56,374,590 | |
| | |
Total capital loss carryforwards | | $ | 102,882,431 | | | $ | 925,769,551 | |
| | |
Deferred capital losses: | | | | | | | | |
Short-term | | $ | 13,989,515 | | | $ | 178,038,326 | |
Long-term | | $ | 19,186,298 | | | $ | 218,786,721 | |
Included in the amounts above for National Fund is a capital loss carryforward of $12,407,106 as a result of the reorganizations on June 27, 2014 (see Note 11) and capital loss carryforwards of $18,149,382 as a result of the reorganizations which occurred in prior years. Utilization of these capital loss carryforwards may be limited in accordance with certain income tax regulations.
The cost and unrealized appreciation (depreciation) of investments of each Fund at March 31, 2015, as determined on a federal income tax basis, were as follows:
| | | | | | | | |
| | | AMT-Free Fund | | | National Fund | |
| | |
Aggregate cost | | $ | 295,585,903 | | | $ | 2,975,505,623 | |
Gross unrealized appreciation | | $ | 44,670,905 | | | $ | 336,913,377 | |
Gross unrealized depreciation | | | (2,351,751 | ) | | | (32,140,898 | ) |
| | |
Net unrealized appreciation | | $ | 42,319,154 | | | $ | 304,772,479 | |
3 Investment Adviser Fee and Other Transactions with Affiliates
The investment adviser fee is earned by Eaton Vance Management (EVM) for AMT-Free Fund and Boston Management and Research (BMR), a subsidiary of EVM, for National Fund as compensation for management and investment advisory services rendered to each Fund. The fee is based upon a percentage
Eaton Vance
Municipal Income Funds
March 31, 2015
Notes to Financial Statements (Unaudited) — continued
of average daily net assets plus a percentage of gross income (i.e., income other than gains from the sale of securities) as presented in the following table and is payable monthly.
| | | | | | | | |
| Daily Net Assets | | Annual Asset
Rate | | | Daily Income
Rate | |
| | |
Up to $500 million | | | 0.300 | % | | | 3.00 | % |
$500 million up to $1 billion | | | 0.275 | | | | 2.75 | |
$1 billion up to $1.5 billion | | | 0.250 | | | | 2.50 | |
$1.5 billion up to $2 billion | | | 0.225 | | | | 2.25 | |
$2 billion up to $3 billion | | | 0.200 | | | | 2.00 | |
$3 billion and over | | | 0.175 | | | | 1.75 | |
For the six months ended March 31, 2015, investment adviser fees incurred by the Funds and the effective annual rates, as a percentage of average daily net assets, were as follows:
| | | | | | | | |
| | | AMT-Free
Fund | | | National Fund | |
| | |
Investment Adviser Fee | | $ | 769,435 | | | $ | 5,858,043 | |
Effective Annual Rate | | | 0.45 | % | | | 0.34 | % |
EVM serves as administrator of each Fund, but receives no compensation. EVM provides sub-transfer agency and related services to the Funds pursuant to a Sub-Transfer Agency Support Services Agreement. Eaton Vance Distributors, Inc. (EVD), an affiliate of EVM and the Funds’ principal underwriter, received a portion of the sales charge on sales of Class A shares of the Funds. EVD also received distribution and service fees from Class A, Class B and Class C shares (see Note 4) and contingent deferred sales charges (see Note 5). Sub-transfer agent fees earned by EVM, which are included in transfer and dividend disbursing agent fees on the Statements of Operations, and Class A sales charges that the Funds were informed were received by EVD for the six months ended March 31, 2015 were as follows:
| | | | | | | | |
| | | AMT-Free
Fund | | | National
Fund | |
| | |
EVM’s Sub-Transfer Agent Fees | | $ | 3,715 | | | $ | 38,974 | |
EVD’s Class A Sales Charges | | $ | 8,508 | | | $ | 102,699 | |
Trustees and officers of the Funds who are members of EVM’s or BMR’s organizations receive remuneration for their services to the Funds out of the investment adviser fee. Trustees of the Funds who are not affiliated with the investment advisers may elect to defer receipt of all or a percentage of their annual fees in accordance with the terms of the Trustees Deferred Compensation Plan. For the six months ended March 31, 2015, no significant amounts have been deferred. Certain officers and Trustees of the Funds are officers of the above organizations.
4 Distribution Plans
Each Fund has in effect a distribution plan for Class A shares (Class A Plan) pursuant to Rule 12b-1 under the 1940 Act. Pursuant to the Class A Plan, each Fund pays EVD a distribution and service fee of 0.25% per annum of its average daily net assets attributable to Class A shares for distribution services and facilities provided to each Fund by EVD, as well as for personal services and/or the maintenance of shareholder accounts. Distribution and service fees paid or accrued to EVD for the six months ended March 31, 2015 for Class A shares amounted to the following:
| | | | | | | | |
| | | AMT-Free
Fund | | | National
Fund | |
| | |
Class A Distribution and Service Fees | | $ | 250,426 | | | $ | 2,579,129 | |
Eaton Vance
Municipal Income Funds
March 31, 2015
Notes to Financial Statements (Unaudited) — continued
Each Fund also has in effect distribution plans for Class B shares (Class B Plan) and Class C shares (Class C Plan) pursuant to Rule 12b-1 under the 1940 Act. Pursuant to the Class B and Class C Plans, each Fund pays EVD amounts equal to 0.75% per annum of its average daily net assets attributable to Class B and Class C shares for providing ongoing distribution services and facilities to the respective Funds. For the six months ended March 31, 2015, the Funds paid or accrued to EVD the following distribution fees:
| | | | | | | | |
| | | AMT-Free
Fund | | | National Fund | |
| | |
Class B Distribution Fees | | $ | 5,177 | | | $ | 144,020 | |
Class C Distribution Fees | | $ | 147,390 | | | $ | 2,382,098 | |
Pursuant to the Class B and Class C Plans, each Fund also makes payments of service fees to EVD, financial intermediaries and other persons in amounts equal to 0.25% per annum of the average daily net assets attributable to that class. Service fees paid or accrued are for personal services and/or the maintenance of shareholder accounts. They are separate and distinct from the Class B and Class C sales commissions and distribution fees payable to EVD. Service fees paid or accrued for the six months ended March 31, 2015 amounted to the following:
| | | | | | | | |
| | | AMT-Free
Fund | | | National
Fund | |
| | |
Class B Service Fees | | $ | 1,726 | | | $ | 48,007 | |
Class C Service Fees | | $ | 49,130 | | | $ | 794,033 | |
5 Contingent Deferred Sales Charges
A contingent deferred sales charge (CDSC) generally is imposed on redemptions of Class B shares made within six years of purchase and on redemptions of Class C shares made within one year of purchase. Class A shares may be subject to a 1% CDSC if redeemed within eighteen months of purchase (depending on the circumstances of purchase). Generally, the CDSC is based upon the lower of the net asset value at date of redemption or date of purchase. No charge is levied on shares acquired by reinvestment of dividends or capital gain distributions. The CDSC for Class B shares is imposed at declining rates that begin at 5% in the case of redemptions in the first and second year after purchase, declining one percentage point each subsequent year. Class C shares are subject to a 1% CDSC if redeemed within one year of purchase. For the six months ended March 31, 2015, the Funds were informed that EVD received approximately the following amounts of CDSCs paid by Class A, Class B and Class C shareholders:
| | | | | | | | |
| | | AMT-Free
Fund | | | National
Fund | |
| | |
Class A | | $ | — | | | $ | 289,000 | |
Class B | | $ | 400 | | | $ | 13,000 | |
Class C | | $ | 100 | | | $ | 8,000 | |
6 Purchases and Sales of Investments
Purchases and sales of investments, other than short-term obligations, for the six months ended March 31, 2015 were as follows:
| | | | | | | | |
| | | AMT-Free Fund | | | National Fund | |
| | |
Purchases | | $ | 33,843,618 | | | $ | 1,287,645,951 | |
Sales | | $ | 33,910,936 | | | $ | 1,363,695,677 | |
Eaton Vance
Municipal Income Funds
March 31, 2015
Notes to Financial Statements (Unaudited) — continued
7 Shares of Beneficial Interest
Each Fund’s Declaration of Trust permits the Trustees to issue an unlimited number of full and fractional shares of beneficial interest (without par value). Such shares may be issued in a number of different series (such as the Funds) and classes. Transactions in Fund shares were as follows:
| | | | | | | | | | | | | | | | |
AMT-Free Fund | | | | | | | | | | | | |
| | | Six Months Ended March 31, 2015 (Unaudited) | |
| | | Class A | | | Class B | | | Class C | | | Class I | |
| | | | |
Sales | | | 1,292,277 | | | | 4,746 | | | | 750,497 | | | | 1,203,004 | |
Issued to shareholders electing to receive payments of distributions in Fund shares | | | 385,357 | | | | 1,634 | | | | 52,323 | | | | 160,693 | |
Redemptions | | | (1,665,228 | ) | | | (23,714 | ) | | | (249,228 | ) | | | (706,754 | ) |
Exchange from Class B shares | | | 42,512 | | | | — | | | | — | | | | — | |
Exchange to Class A shares | | | — | | | | (42,786 | ) | | | — | | | | — | |
| | | | |
Net increase (decrease) | | | 54,918 | | | | (60,120 | ) | | | 553,592 | | | | 656,943 | |
| | | | |
| | | | | | | | | | | | | | | | |
| | | Year Ended September 30, 2014 | |
| | | Class A | | | Class B | | | Class C | | | Class I | |
| | | | |
Sales | | | 2,260,589 | | | | 10,716 | | | | 493,488 | | | | 1,798,394 | |
Issued to shareholders electing to receive payments of distributions in Fund shares | | | 915,589 | | | | 6,516 | | | | 116,929 | | | | 322,370 | |
Redemptions | | | (7,734,138 | ) | | | (71,258 | ) | | | (1,343,949 | ) | | | (2,603,722 | ) |
Exchange from Class B shares | | | 103,807 | | | | — | | | | — | | | | — | |
Exchange to Class A shares | | | — | | | | (104,467 | ) | | | — | | | | — | |
| | | | |
Net decrease | | | (4,454,153 | ) | | | (158,493 | ) | | | (733,532 | ) | | | (482,958 | ) |
| | | | |
| | | | | | | | | | | | | | | | |
National Fund | | | | | | | | | | | | |
| | | Six Months Ended March 31, 2015 (Unaudited) | |
| | | Class A | | | Class B | | | Class C | | | Class I | |
| | | | |
Sales | | | 7,636,324 | | | | 20,476 | | | | 2,294,346 | | | | 11,641,084 | |
Issued to shareholders electing to receive payments of distributions in Fund shares | | | 3,420,255 | | | | 50,666 | | | | 777,668 | | | | 1,216,499 | |
Redemptions | | | (23,743,027 | ) | | | (457,208 | ) | | | (5,371,022 | ) | | | (11,577,088 | ) |
Exchange from Class B shares | | | 549,225 | | | | — | | | | — | | | | — | |
Exchange to Class A shares | | | — | | | | (549,167 | ) | | | — | | | | — | |
| | | | |
Net increase (decrease) | | | (12,137,223 | ) | | | (935,233 | ) | | | (2,299,008 | ) | | | 1,280,495 | |
| | | | |
| | | | | | | | | | | | | | | | |
| | | Year Ended September 30, 2014 | |
| | | Class A | | | Class B | | | Class C | | | Class I | |
| | | | |
Sales | | | 21,532,161 | | | | 47,124 | | | | 5,295,179 | | | | 33,677,725 | |
Issued to shareholders electing to receive payments of distributions in Fund shares | | | 8,748,161 | | | | 176,379 | | | | 2,076,451 | | | | 3,302,382 | |
Redemptions | | | (63,950,083 | ) | | | (1,321,416 | ) | | | (18,016,785 | ) | | | (75,723,092 | ) |
Issued in connection with tax-free reorganizations (see Note 11) | | | 15,076,171 | | | | 253,158 | | | | 1,812,740 | | | | 1,261,236 | |
Exchange from Class B shares | | | 1,293,154 | | | | — | | | | — | | | | — | |
Exchange to Class A shares | | | — | | | | (1,293,046 | ) | | | — | | | | — | |
| | | | |
Net decrease | | | (17,300,436 | ) | | | (2,137,801 | ) | | | (8,832,415 | ) | | | (37,481,749 | ) |
Eaton Vance
Municipal Income Funds
March 31, 2015
Notes to Financial Statements (Unaudited) — continued
8 Line of Credit
The Funds participate with other portfolios and funds managed by EVM and its affiliates in a $750 million unsecured line of credit agreement with a group of banks, which is in effect through September 7, 2015. Borrowings are made by the Funds solely to facilitate the handling of unusual and/or unanticipated short-term cash requirements. Interest is charged to each Fund based on its borrowings at an amount above either the Eurodollar rate or Federal Funds rate. In addition, a fee computed at an annual rate of 0.08% on the daily unused portion of the line of credit is allocated among the participating portfolios and funds at the end of each quarter. Because the line of credit is not available exclusively to the Funds, a Fund may be unable to borrow some or all of its requested amounts at any particular time. The Funds did not have any significant borrowings or allocated fees during the six months ended March 31, 2015.
9 Financial Instruments
The Funds may trade in financial instruments with off-balance sheet risk in the normal course of their investing activities. These financial instruments may include financial futures contracts and may involve, to a varying degree, elements of risk in excess of the amounts recognized for financial statement purposes. The notional or contractual amounts of these instruments represent the investment a Fund has in particular classes of financial instruments and do not necessarily represent the amounts potentially subject to risk. The measurement of the risks associated with these instruments is meaningful only when all related and offsetting transactions are considered.
A summary of obligations under these financial instruments at March 31, 2015 is as follows:
| | | | | | | | | | | | | | | | | | | | |
| Futures Contracts | |
| Fund | | Expiration
Month/Year | | | Contracts | | Position | | Aggregate Cost | | | Value | | | Net Unrealized
Depreciation | |
| | | | | | |
| AMT-Free | | | 6/15 | | | 245 U.S. 10-Year Treasury Note | | Short | | $ | (31,043,843 | ) | | $ | (31,582,031 | ) | | $ | (538,188 | ) |
| | | | 6/15 | | | 121 U.S. Long Treasury Bond | | Short | | | (19,431,516 | ) | | | (19,828,875 | ) | | | (397,359 | ) |
| National | | | 6/15 | | | 2,000 U.S. Long Treasury Bond | | Short | | $ | (321,182,092 | ) | | $ | (327,750,000 | ) | | $ | (6,567,908 | ) |
At March 31, 2015, the Funds had sufficient cash and/or securities to cover commitments under these contracts.
Each Fund is subject to interest rate risk in the normal course of pursuing its investment objective. Because the Funds hold fixed-rate bonds, the value of these bonds may decrease if interest rates rise. The Funds enter into U.S. Treasury futures contracts to hedge against changes in interest rates.
The fair values of open derivative instruments (not considered to be hedging instruments for accounting disclosure purposes) and whose primary underlying risk exposure is interest rate risk at March 31, 2015 were as follows:
| | | | | | | | |
| | | AMT-Free
Fund | | | National
Fund | |
| | |
Liability Derivative: | | | | | | | | |
| | |
Futures Contracts | | $ | (935,547 | )(1) | | $ | (6,567,908 | )(1) |
| | |
Total | | $ | (935,547 | ) | | $ | (6,567,908 | ) |
| (1) | Amount represents cumulative unrealized depreciation on futures contracts in the Futures Contracts table above. Only the current day’s variation margin on open futures contracts is reported within the Statement of Assets and Liabilities as Receivable or Payable for variation margin, as applicable. |
Eaton Vance
Municipal Income Funds
March 31, 2015
Notes to Financial Statements (Unaudited) — continued
The effect of derivative instruments (not considered to be hedging instruments for accounting disclosure purposes) on the Statement of Operations and whose primary underlying risk exposure is interest rate risk for the six months ended March 31, 2015 was as follows:
| | | | | | | | |
| | | AMT-Free
Fund | | | National Fund | |
| | |
Realized Gain (Loss) on Derivatives Recognized in Income | | $ | (2,065,561 | )(1) | | $ | (22,628,415 | )(1) |
Change in Unrealized Appreciation (Depreciation) on Derivatives Recognized in Income | | $ | (1,288,867 | )(2) | | $ | (9,843,668 | )(2) |
| (1) | Statement of Operations location: Net realized gain (loss) – Financial futures contracts. |
| (2) | Statement of Operations location: Change in unrealized appreciation (depreciation) – Financial futures contracts. |
The average notional amounts of futures contracts outstanding during the six months ended March 31, 2015, which are indicative of the volume of this derivative type, were approximately as follows:
| | | | | | | | |
| | | AMT-Free Fund | | | National Fund | |
| | |
Average Notional Amount: | | | | | | | | |
| | |
Futures Contracts — Short | | $ | 54,627,000 | | | $ | 391,710,000 | |
10 Fair Value Measurements
Under generally accepted accounting principles for fair value measurements, a three-tier hierarchy to prioritize the assumptions, referred to as inputs, is used in valuation techniques to measure fair value. The three-tier hierarchy of inputs is summarized in the three broad levels listed below.
| Ÿ | | Level 1 – quoted prices in active markets for identical investments |
| Ÿ | | Level 2 – other significant observable inputs (including quoted prices for similar investments, interest rates, prepayment speeds, credit risk, etc.) |
| Ÿ | | Level 3 – significant unobservable inputs (including a fund’s own assumptions in determining the fair value of investments) |
In cases where the inputs used to measure fair value fall in different levels of the fair value hierarchy, the level disclosed is determined based on the lowest level input that is significant to the fair value measurement in its entirety. The inputs or methodology used for valuing securities are not necessarily an indication of the risk associated with investing in those securities.
At March 31, 2015, the hierarchy of inputs used in valuing the Funds’ investments and open derivative instruments, which are carried at value, were as follows:
| | | | | | | | | | | | | | | | |
AMT-Free Fund | | | | | | | | | | | | |
| Asset Description | | Level 1 | | | Level 2 | | | Level 3 | | | Total | |
| | | | |
Tax-Exempt Investments | | $ | — | | | $ | 378,590,057 | | | $ | — | | | $ | 378,590,057 | |
| | | | |
Total Investments | | $ | — | | | $ | 378,590,057 | | | $ | — | | | $ | 378,590,057 | |
| | | | |
Liability Description | | | | | | | | | | | | | | | | |
| | | | |
Futures Contracts | | $ | (935,547 | ) | | $ | — | | | $ | — | | | $ | (935,547 | ) |
| | | | |
Total | | $ | (935,547 | ) | | $ | — | | | $ | — | | | $ | (935,547 | ) |
| | | | |
| | | | | | | | | | | | | | | | |
Eaton Vance
Municipal Income Funds
March 31, 2015
Notes to Financial Statements (Unaudited) — continued
| | | | | | | | | | | | | | | | |
National Fund | | | | | | | | | | | | |
| Asset Description | | Level 1 | | | Level 2 | | | Level 3 | | | Total | |
| | | | |
Tax-Exempt Municipal Securities | | $ | — | | | $ | 3,651,660,292 | | | $ | — | | | $ | 3,651,660,292 | |
Taxable Municipal Securities | | | — | | | | 82,512,396 | | | | — | | | | 82,512,396 | |
Corporate Bonds & Notes | | | — | | | | 38,870,414 | | | | — | | | | 38,870,414 | |
| | | | |
Total Investments | | $ | — | | | $ | 3,773,043,102 | | | $ | — | | | $ | 3,773,043,102 | |
| | | | |
Liability Description | | | | | | | | | | | | | | | | |
| | | | |
Futures Contracts | | $ | (6,567,908 | ) | | $ | — | | | $ | — | | | $ | (6,567,908 | ) |
| | | | |
Total | | $ | (6,567,908 | ) | | $ | — | | | $ | — | | | $ | (6,567,908 | ) |
The Funds held no investments or other financial instruments as of September 30, 2014 whose fair value was determined using Level 3 inputs. At March 31, 2015, there were no investments transferred between Level 1 and Level 2 during the six months then ended.
11 Reorganizations
As of the close of business on June 27, 2014, National Fund acquired the net assets of Eaton Vance Alabama Municipal Income Fund (Alabama Fund), Eaton Vance Arkansas Municipal Income Fund (Arkansas Fund), Eaton Vance Kentucky Municipal Income Fund (Kentucky Fund) and Eaton Vance Tennessee Municipal Income Fund (Tennessee Fund) pursuant to a plan of reorganization approved by the shareholders of Alabama Fund, Arkansas Fund, Kentucky Fund and Tennessee Fund, respectively. The purpose of the transaction was to combine five funds managed by BMR with substantially similar investment objectives and policies. The acquisitions were accomplished by a tax-free exchange of shares of Class A, Class B, Class C and Class I of National Fund for shares of Class A, Class B, Class C and Class I of Alabama Fund, Arkansas Fund, Kentucky Fund and Tennessee Fund, respectively, each outstanding on June 27, 2014 as follows:
| | | | | | | | | | | | |
| | | | | | Alabama Fund | |
| | | Shares of National
Fund Issued | | | Shares
Exchanged | | | Net Assets | |
| | | |
Class A | | | 3,691,256 | | | | 3,716,509 | | | $ | 35,890,818 | |
Class B | | | 36,727 | | | | 33,617 | | | | 357,069 | |
Class C | | | 225,460 | | | | 206,216 | | | | 2,192,152 | |
Class I | | | 420,267 | | | | 423,107 | | | | 4,086,506 | |
| | | |
Total | | | | | | | | | | $ | 42,526,545 | |
| | | |
| | | | | | | | | | | | |
| | | | | | Arkansas Fund | |
| | | Shares of National
Fund Issued | | | Shares
Exchanged | | | Net Assets | |
| | | |
Class A | | | 4,659,303 | | | | 5,049,539 | | | $ | 45,303,340 | |
Class B | | | 114,585 | | | | 115,588 | | | | 1,114,022 | |
Class C | | | 510,064 | | | | 514,666 | | | | 4,959,348 | |
Class I | | | 207,464 | | | | 225,005 | | | | 2,017,301 | |
| | | |
Total | | | | | | | | | | $ | 53,394,011 | |
| | | |
| | | | | | | | | | | | |
Eaton Vance
Municipal Income Funds
March 31, 2015
Notes to Financial Statements (Unaudited) — continued
| | | | | | | | | | | | |
| | | | | | Kentucky Fund | |
| | | Shares of National
Fund Issued | | | Shares
Exchanged | | | Net Assets | |
| | | |
Class A | | | 3,797,691 | | | | 4,154,124 | | | $ | 36,925,713 | |
Class B | | | 31,661 | | | | 32,076 | | | | 307,814 | |
Class C | | | 362,200 | | | | 366,730 | | | | 3,521,673 | |
Class I | | | 580,066 | | | | 634,619 | | | | 5,640,334 | |
| | | |
Total | | | | | | | | | | $ | 46,395,534 | |
| | | |
| | | | | | | | | | | | |
| | | | | | Tennessee Fund | |
| | | Shares of National
Fund Issued | | | Shares
Exchanged | | | Net Assets | |
| | | |
Class A | | | 2,927,921 | | | | 3,293,416 | | | $ | 28,468,757 | |
Class B | | | 70,185 | | | | 72,464 | | | | 682,352 | |
Class C | | | 715,016 | | | | 738,735 | | | | 6,952,103 | |
Class I | | | 53,439 | | | | 60,153 | | | | 519,619 | |
| | | |
Total | | | | | | | | | | $ | 36,622,831 | |
The investment portfolios of Alabama Fund, Arkansas Fund, Kentucky Fund and Tennessee Fund, with a fair value of $38,863,121, $50,565,357, $45,250,238 and $34,791,586, respectively, and identified cost of $36,052,796, $48,439,943, $42,026,544 and $33,403,232, respectively, were the principal assets acquired by National Fund. For financial reporting purposes, assets received and shares issued by National Fund were recorded at fair value; however, the identified cost of the investments received from Alabama Fund, Arkansas Fund, Kentucky Fund and Tennessee Fund were carried forward to align ongoing reporting of National Fund’s realized and unrealized gains and losses with amounts distributable to shareholders for tax purposes. The aggregate net assets of National Fund immediately before the acquisition were $3,326,647,761. The net assets of Alabama Fund, Arkansas Fund, Kentucky Fund and Tennessee Fund at that date of $42,526,545, $53,394,011, $46,395,534 and $36,622,831, respectively, including $2,989,917, $7,112,190, $2,273,833 and $6,719,288 of accumulated net realized losses, respectively, and $2,810,325, $2,125,414, $3,223,694 and $1,388,354 of unrealized appreciation, respectively, were combined with those of National Fund, resulting in combined net assets of $3,505,586,682.
Assuming the acquisitions had been completed on October 1, 2013, the beginning of National Fund’s annual reporting period, National Fund’s pro forma results of operations for the year ended September 30, 2014 were as follows:
| | | | |
| | |
Net investment income | | $ | 166,228,357 | |
Net realized gain | | $ | 23,408,511 | |
Net increase in net assets from operations | | $ | 418,670,891 | |
Because the combined investment portfolios have been managed as a single integrated portfolio since the acquisitions were completed, it was not practicable to separate the amounts of revenue and earnings of Alabama Fund, Arkansas Fund, Kentucky Fund and Tennessee Fund since June 27, 2014 through September 30, 2014.
Eaton Vance
Municipal Income Funds
March 31, 2015
Officers and Trustees
Officers of Eaton Vance Municipals Trust and Eaton Vance Mutual Funds Trust
Payson F. Swaffield
President
Maureen A. Gemma
Vice President, Secretary and Chief Legal Officer
James F. Kirchner
Treasurer
Paul M. O’Neil
Chief Compliance Officer
Trustees of Eaton Vance Municipals Trust and Eaton Vance Mutual Funds Trust
Ralph F. Verni
Chairman
Scott E. Eston
Thomas E. Faust Jr.*
Cynthia E. Frost
George J. Gorman
Valerie A. Mosley
William H. Park
Ronald A. Pearlman
Helen Frame Peters
Susan J. Sutherland
Harriett Tee Taggart
Eaton Vance Funds
IMPORTANT NOTICES
Privacy. The Eaton Vance organization is committed to ensuring your financial privacy. Each of the financial institutions identified below has in effect the following policy (“Privacy Policy”) with respect to nonpublic personal information about its customers:
| Ÿ | | Only such information received from you, through application forms or otherwise, and information about your Eaton Vance fund transactions will be collected. This may include information such as name, address, social security number, tax status, account balances and transactions. |
| Ÿ | | None of such information about you (or former customers) will be disclosed to anyone, except as permitted by law (which includes disclosure to employees necessary to service your account). In the normal course of servicing a customer’s account, Eaton Vance may share information with unaffiliated third parties that perform various required services such as transfer agents, custodians and broker-dealers. |
| Ÿ | | Policies and procedures (including physical, electronic and procedural safeguards) are in place that are designed to protect the confidentiality of such information. |
| Ÿ | | We reserve the right to change our Privacy Policy at any time upon proper notification to you. Customers may want to review our Privacy Policy periodically for changes by accessing the link on our homepage: www.eatonvance.com. |
Our pledge of privacy applies to the following entities within the Eaton Vance organization: the Eaton Vance Family of Funds, Eaton Vance Management, Eaton Vance Investment Counsel, Eaton Vance Distributors, Inc., Eaton Vance Trust Company, Eaton Vance Management’s Real Estate Investment Group and Boston Management and Research. In addition, our Privacy Policy applies only to those Eaton Vance customers who are individuals and who have a direct relationship with us. If a customer’s account (i.e., fund shares) is held in the name of a third-party financial advisor/broker-dealer, it is likely that only such advisor’s privacy policies apply to the customer. This notice supersedes all previously issued privacy disclosures. For more information about Eaton Vance’s Privacy Policy, please call 1-800-262-1122.
Delivery of Shareholder Documents. The Securities and Exchange Commission (SEC) permits funds to deliver only one copy of shareholder documents, including prospectuses, proxy statements and shareholder reports, to fund investors with multiple accounts at the same residential or post office box address. This practice is often called “householding” and it helps eliminate duplicate mailings to shareholders. Eaton Vance, or your financial advisor, may household the mailing of your documents indefinitely unless you instruct Eaton Vance, or your financial advisor, otherwise. If you would prefer that your Eaton Vance documents not be householded, please contact Eaton Vance at 1-800-262-1122, or contact your financial advisor. Your instructions that householding not apply to delivery of your Eaton Vance documents will be effective within 30 days of receipt by Eaton Vance or your financial advisor.
Portfolio Holdings. Each Eaton Vance Fund and its underlying Portfolio(s) (if applicable) will file a schedule of portfolio holdings on Form N-Q with the SEC for the first and third quarters of each fiscal year. The Form N-Q will be available on the Eaton Vance website at www.eatonvance.com, by calling Eaton Vance at 1-800-262-1122 or in the EDGAR database on the SEC’s website at www.sec.gov. Form N-Q may also be reviewed and copied at the SEC’s public reference room in Washington, D.C. (call 1-800-732-0330 for information on the operation of the public reference room).
Proxy Voting. From time to time, funds are required to vote proxies related to the securities held by the funds. The Eaton Vance Funds or their underlying Portfolios (if applicable) vote proxies according to a set of policies and procedures approved by the Funds’ and Portfolios’ Boards. You may obtain a description of these policies and procedures and information on how the Funds or Portfolios voted proxies relating to portfolio securities during the most recent 12-month period ended June 30, without charge, upon request, by calling 1-800-262-1122 and by accessing the SEC’s website at www.sec.gov.
Investment Advisers
AMT-Free Municipal Income Fund
Eaton Vance Management
Two International Place
Boston, MA 02110
National Municipal Income Fund
Boston Management and Research
Two International Place
Boston, MA 02110
Administrator
Eaton Vance Management
Two International Place
Boston, MA 02110
Principal Underwriter*
Eaton Vance Distributors, Inc.
Two International Place
Boston, MA 02110
(617) 482-8260
Custodian
State Street Bank and Trust Company
State Street Financial Center, One Lincoln Street
Boston, MA 02111
Transfer Agent
BNY Mellon Investment Servicing (US) Inc.
Attn: Eaton Vance Funds
P.O. Box 9653
Providence, RI 02940-9653
(800) 262-1122
Fund Offices
Two International Place
Boston, MA 02110
| * | FINRA BrokerCheck. Investors may check the background of their Investment Professional by contacting the Financial Industry Regulatory Authority (FINRA). FINRA BrokerCheck is a free tool to help investors check the professional background of current and former FINRA-registered securities firms and brokers. FINRA BrokerCheck is available by calling 1-800-289-9999 and at www.FINRA.org. The FINRA BrokerCheck brochure describing this program is available to investors at www.FINRA.org. |

Eaton Vance
Atlanta Capital Horizon
Growth Fund
Semiannual Report
March 31, 2015

Commodity Futures Trading Commission Registration. Effective December 31, 2012, the Commodity Futures Trading Commission (“CFTC”) adopted certain regulatory changes that subject registered investment companies and advisers to regulation by the CFTC if a fund invests more than a prescribed level of its assets in certain CFTC-regulated instruments (including futures, certain options and swap agreements) or markets itself as providing investment exposure to such instruments. The Fund has claimed an exclusion from the definition of the term “commodity pool operator” under the Commodity Exchange Act. Accordingly, neither the Fund nor the adviser with respect to the operation of the Fund is subject to CFTC regulation. Because of its management of other strategies, the Fund’s adviser is registered with the CFTC as a commodity pool operator and a commodity trading advisor.
Fund shares are not insured by the FDIC and are not deposits or other obligations of, or guaranteed by, any depository institution. Shares are subject to investment risks, including possible loss of principal invested.
This report must be preceded or accompanied by a current summary prospectus or prospectus. Before investing, investors should consider carefully the investment objective, risks, and charges and expenses of a mutual fund. This and other important information is contained in the summary prospectus and prospectus, which can be obtained from a financial advisor. Prospective investors should read the prospectus carefully before investing. For further information, please call 1-800-262-1122.
Semiannual Report March 31, 2015
Eaton Vance
Atlanta Capital Horizon Growth Fund
Table of Contents
| | | | |
Performance | | | 2 | |
| |
Fund Profile | | | 2 | |
| |
Endnotes and Additional Disclosures | | | 3 | |
| |
Fund Expenses | | | 4 | |
| |
Financial Statements | | | 5 | |
| |
Officers and Trustees | | | 19 | |
| |
Important Notices | | | 20 | |
Eaton Vance
Atlanta Capital Horizon Growth Fund
March 31, 2015
Performance1,2
Portfolio Manager Richard B. England, CFA, of Atlanta Capital Management Company, LLC.
| | | | | | | | | | | | | | | | | | | | | | | | |
| % Average Annual Total Returns | | Class
Inception Date | | | Performance
Inception Date | | | Six Months | | | One Year | | | Five Years | | | Ten Years | |
Class A at NAV | | | 03/04/2002 | | | | 03/04/2002 | | | | 6.60 | % | | | 5.57 | % | | | 11.00 | % | | | 7.96 | % |
Class A with 5.75% Maximum Sales Charge | | | — | | | | — | | | | 0.50 | | | | –0.48 | | | | 9.68 | | | | 7.32 | |
Class B at NAV | | | 03/04/2002 | | | | 03/04/2002 | | | | 6.16 | | | | 4.76 | | | | 10.17 | | | | 7.15 | |
Class B with 5% Maximum Sales Charge | | | — | | | | — | | | | 1.33 | | | | –0.01 | | | | 9.90 | | | | 7.15 | |
Class C at NAV | | | 03/04/2002 | | | | 03/04/2002 | | | | 6.17 | | | | 4.76 | | | | 10.18 | | | | 7.14 | |
Class C with 1% Maximum Sales Charge | | | — | | | | — | | | | 5.20 | | | | 3.81 | | | | 10.18 | | | | 7.14 | |
Class I at NAV | | | 05/02/2011 | | | | 03/04/2002 | | | | 6.74 | | | | 5.85 | | | | 11.21 | | | | 8.06 | |
Russell Midcap Growth Index | | | — | | | | — | | | | 11.53 | % | | | 15.56 | % | | | 16.42 | % | | | 10.18 | % |
| | | | | | |
| | | | | | | | | | | | | | | | | | | | | | | | |
| % Total Annual Operating Expense Ratios3 | | | | | | | | Class A | | | Class B | | | Class C | | | Class I | |
Gross | | | | | | | | | | | 1.73 | % | | | 2.48 | % | | | 2.48 | % | | | 1.48 | % |
Net | | | | | | | | | | | 1.40 | | | | 2.15 | | | | 2.15 | | | | 1.15 | |
Fund Profile
Sector Allocation (% of net assets)4
Top 10 Holdings (% of net assets)4
| | | | |
Catamaran Corp. | | | 4.6 | % |
Affiliated Managers Group, Inc. | | | 4.1 | |
Perrigo Co. PLC | | | 4.0 | |
Waste Connections, Inc. | | | 3.8 | |
Amphenol Corp., Class A | | | 3.7 | |
Markel Corp. | | | 3.5 | |
Nordstrom, Inc. | | | 3.1 | |
Airgas, Inc. | | | 3.1 | |
AMC Networks, Inc., Class A | | | 2.8 | |
Ecolab, Inc. | | | 2.8 | |
Total | | | 35.5 | % |
See Endnotes and Additional Disclosures in this report.
Past performance is no guarantee of future results. Returns are historical and are calculated by determining the percentage change in net asset value (NAV) or offering price (as applicable) with all distributions reinvested. Investment return and principal value will fluctuate so that shares, when redeemed, may be worth more or less than their original cost. Performance less than one year is cumulative. Performance is for the stated time period only; due to market volatility, the Fund’s current performance may be lower or higher than quoted. Returns are before taxes unless otherwise noted. For performance as of the most recent month-end, please refer to eatonvance.com.
Eaton Vance
Atlanta Capital Horizon Growth Fund
March 31, 2015
Endnotes and Additional Disclosures
| 1 | Russell Midcap Growth Index is an unmanaged index of U.S. midcap growth stocks. Unless otherwise stated, index returns do not reflect the effect of any applicable sales charges, commissions, expenses, taxes or leverage, as applicable. It is not possible to invest directly in an index. |
| 2 | Total Returns at NAV do not include applicable sales charges. If sales charges were deducted, the returns would be lower. Total Returns shown with maximum sales charge reflect the stated maximum sales charge. Unless otherwise stated, performance does not reflect the deduction of taxes on Fund distributions or redemptions of Fund shares. |
| | Performance prior to the inception date of a class may be linked to the performance of an older class of the Fund. This linked performance is adjusted for any applicable sales charge, but is not adjusted for class expense differences. If adjusted for such differences, the performance would be different. Performance presented in the financial highlights included in the financial statements is not linked. In the performance table, the performance of Class I is linked to Class A. Performance since inception for an index, if presented, is the performance since the Fund’s or oldest share class’ inception, as applicable. |
| 3 | Source: Fund prospectus. Net expense ratio reflects a contractual expense reimbursement that continues through 1/31/16. Without the reimbursement, if applicable, performance would have been lower. |
| 4 | Excludes cash and cash equivalents. |
| | Fund profile subject to change due to active management. |
Eaton Vance
Atlanta Capital Horizon Growth Fund
March 31, 2015
Fund Expenses
Example: As a Fund shareholder, you incur two types of costs: (1) transaction costs, including sales charges (loads) on purchases and redemption fees (if applicable); and (2) ongoing costs, including management fees; distribution and/or service fees; and other Fund expenses. This Example is intended to help you understand your ongoing costs (in dollars) of Fund investing and to compare these costs with the ongoing costs of investing in other mutual funds. The Example is based on an investment of $1,000 invested at the beginning of the period and held for the entire period (October 1, 2014 – March 31, 2015).
Actual Expenses: The first section of the table below provides information about actual account values and actual expenses. You may use the information in this section, together with the amount you invested, to estimate the expenses that you paid over the period. Simply divide your account value by $1,000 (for example, an $8,600 account value divided by $1,000 = 8.6), then multiply the result by the number in the first section under the heading entitled “Expenses Paid During Period” to estimate the expenses you paid on your account during this period.
Hypothetical Example for Comparison Purposes: The second section of the table below provides information about hypothetical account values and hypothetical expenses based on the actual Fund expense ratio and an assumed rate of return of 5% per year (before expenses), which is not the actual Fund return. The hypothetical account values and expenses may not be used to estimate the actual ending account balance or expenses you paid for the period. You may use this information to compare the ongoing costs of investing in your Fund and other funds. To do so, compare this 5% hypothetical example with the 5% hypothetical examples that appear in the shareholder reports of the other funds.
Please note that the expenses shown in the table are meant to highlight your ongoing costs only and do not reflect any transactional costs, such as sales charges (loads) or redemption fees (if applicable). Therefore, the second section of the table is useful in comparing ongoing costs only, and will not help you determine the relative total costs of owning different funds. In addition, if these transactional costs were included, your costs would be higher.
| | | | | | | | | | | | | | | | |
| | | Beginning
Account Value
(10/1/14) | | | Ending
Account Value
(3/31/15) | | | Expenses Paid
During Period*
(10/1/14 – 3/31/15) | | | Annualized
Expense
Ratio | |
| | | | |
| | | | | | | | | | | | | | | | |
Actual | | | | | | | | | | | | | |
Class A | | $ | 1,000.00 | | | $ | 1,066.00 | | | $ | 7.21 | ** | | | 1.40 | % |
Class B | | $ | 1,000.00 | | | $ | 1,061.60 | | | $ | 11.05 | ** | | | 2.15 | % |
Class C | | $ | 1,000.00 | | | $ | 1,061.70 | | | $ | 11.05 | ** | | | 2.15 | % |
Class I | | $ | 1,000.00 | | | $ | 1,067.40 | | | $ | 5.93 | ** | | | 1.15 | % |
| | | | | | | | | | | | | | | | | |
| | | | |
| | | | | | | | | | | | | | | | |
Hypothetical | | | | | | | | | | | | | |
(5% return per year before expenses) | | | | | | | | | | | | | |
Class A | | $ | 1,000.00 | | | $ | 1,018.00 | | | $ | 7.04 | ** | | | 1.40 | % |
Class B | | $ | 1,000.00 | | | $ | 1,014.20 | | | $ | 10.80 | ** | | | 2.15 | % |
Class C | | $ | 1,000.00 | | | $ | 1,014.20 | | | $ | 10.80 | ** | | | 2.15 | % |
Class I | | $ | 1,000.00 | | | $ | 1,019.20 | | | $ | 5.79 | ** | | | 1.15 | % |
| * | Expenses are equal to the Fund’s annualized expense ratio for the indicated Class, multiplied by the average account value over the period, multiplied by 182/365 (to reflect the one-half year period). The Example assumes that the $1,000 was invested at the net asset value per share determined at the close of business on September 30, 2014. |
| ** | Absent an allocation of certain expenses to affiliates, the expenses would be higher. |
Eaton Vance
Atlanta Capital Horizon Growth Fund
March 31, 2015
Portfolio of Investments (Unaudited)
| | | | | | | | |
| Common Stocks — 99.7% | |
| | |
| | | | | | | | |
| Security | | Shares | | | Value | |
| | | | | | | | |
|
Aerospace & Defense — 2.6% | |
B/E Aerospace, Inc. | | | 10,791 | | | $ | 686,524 | |
KLX, Inc.(1) | | | 5,395 | | | | 207,923 | |
| | |
| | | | | | $ | 894,447 | |
| | |
|
Banks — 2.0% | |
First Republic Bank | | | 11,977 | | | $ | 683,767 | |
| | |
| | | | | | $ | 683,767 | |
| | |
|
Beverages — 2.6% | |
Brown-Forman Corp., Class B | | | 6,184 | | | $ | 558,724 | |
Dr Pepper Snapple Group, Inc. | | | 3,937 | | | | 308,976 | |
| | |
| | | | | | $ | 867,700 | |
| | |
|
Capital Markets — 5.8% | |
Affiliated Managers Group, Inc.(1) | | | 6,398 | | | $ | 1,374,162 | |
Raymond James Financial, Inc. | | | 10,656 | | | | 605,048 | |
| | |
| | | | | | $ | 1,979,210 | |
| | |
|
Chemicals — 5.9% | |
Airgas, Inc. | | | 9,749 | | | $ | 1,034,466 | |
Ecolab, Inc. | | | 8,426 | | | | 963,766 | |
| | |
| | | | | | $ | 1,998,232 | |
| | |
|
Commercial Services & Supplies — 4.3% | |
Stericycle, Inc.(1) | | | 1,301 | | | $ | 182,699 | |
Waste Connections, Inc. | | | 26,772 | | | | 1,288,804 | |
| | |
| | | | | | $ | 1,471,503 | |
| | |
|
Communications Equipment — 3.4% | |
F5 Networks, Inc.(1) | | | 5,336 | | | $ | 613,320 | |
Juniper Networks, Inc. | | | 23,334 | | | | 526,882 | |
| | |
| | | | | | $ | 1,140,202 | |
| | |
| | |
Diversified Financial Services — 2.5% | | | | | | | | |
Intercontinental Exchange, Inc. | | | 3,702 | | | $ | 863,566 | |
| | |
| | | | | | $ | 863,566 | |
| | |
|
Electrical Equipment — 3.0% | |
AMETEK, Inc. | | | 11,101 | | | $ | 583,247 | |
Rockwell Automation, Inc. | | | 3,683 | | | | 427,191 | |
| | |
| | | | | | $ | 1,010,438 | |
| | |
| | | | | | | | |
| Security | | Shares | | | Value | |
| | | | | | | | |
|
Electronic Equipment, Instruments & Components — 3.7% | |
Amphenol Corp., Class A | | | 21,556 | | | $ | 1,270,295 | |
| | |
| | | | | | $ | 1,270,295 | |
| | |
|
Energy Equipment & Services — 3.7% | |
Cameron International Corp.(1) | | | 7,728 | | | $ | 348,687 | |
Core Laboratories NV | | | 4,601 | | | | 480,758 | |
Weatherford International PLC(1) | | | 33,122 | | | | 407,401 | |
| | |
| | | | | | $ | 1,236,846 | |
| | |
|
Food & Staples Retailing — 2.0% | |
Whole Foods Market, Inc. | | | 12,955 | | | $ | 674,696 | |
| | |
| | | | | | $ | 674,696 | |
| | |
|
Food Products — 4.4% | |
Hershey Co. (The) | | | 5,383 | | | $ | 543,199 | |
TreeHouse Foods, Inc.(1) | | | 11,020 | | | | 936,920 | |
| | |
| | | | | | $ | 1,480,119 | |
| | |
|
Health Care Providers & Services — 6.1% | |
Catamaran Corp.(1) | | | 26,202 | | | $ | 1,560,067 | |
Cigna Corp. | | | 3,878 | | | | 501,968 | |
| | |
| | | | | | $ | 2,062,035 | |
| | |
|
Health Care Technology — 2.1% | |
Cerner Corp.(1) | | | 9,637 | | | $ | 706,007 | |
| | |
| | | | | | $ | 706,007 | |
| | |
|
Hotels, Restaurants & Leisure — 3.6% | |
Dunkin’ Brands Group, Inc. | | | 7,061 | | | $ | 335,821 | |
Panera Bread Co., Class A(1) | | | 2,201 | | | | 352,149 | |
Starwood Hotels & Resorts Worldwide, Inc. | | | 6,356 | | | | 530,726 | |
| | |
| | | | | | $ | 1,218,696 | |
| | |
|
Insurance — 5.2% | |
Aon PLC | | | 6,127 | | | $ | 588,927 | |
Markel Corp.(1) | | | 1,533 | | | | 1,178,816 | |
| | | | | | | | | |
| | | | | | $ | 1,767,743 | |
| | | | | | | | | |
| | |
Life Sciences Tools & Services — 2.2% | | | | | | | | |
Mettler-Toledo International, Inc.(1) | | | 2,282 | | | $ | 749,979 | |
| | |
| | | | | | $ | 749,979 | |
| | |
| | | | |
| | 5 | | See Notes to Financial Statements. |
Eaton Vance
Atlanta Capital Horizon Growth Fund
March 31, 2015
Portfolio of Investments (Unaudited) — continued
| | | | | | | | |
| Security | | Shares | | | Value | |
| | | | | | | | |
|
Machinery — 1.4% | |
IDEX Corp. | | | 6,304 | | | $ | 478,032 | |
| | |
| | | | | | $ | 478,032 | |
| | |
|
Media — 2.8% | |
AMC Networks, Inc., Class A(1) | | | 12,578 | | | $ | 963,978 | |
| | |
| | | | | | $ | 963,978 | |
| | |
|
Multiline Retail — 5.1% | |
Dollar Tree, Inc.(1) | | | 8,181 | | | $ | 663,847 | |
Nordstrom, Inc. | | | 13,054 | | | | 1,048,498 | |
| | |
| | | | | | $ | 1,712,345 | |
| | |
|
Personal Products — 1.4% | |
Estee Lauder Cos., Inc. (The), Class A | | | 5,601 | | | $ | 465,779 | |
| | |
| | | | | | $ | 465,779 | |
| | |
|
Pharmaceuticals — 4.0% | |
Perrigo Co. PLC | | | 8,114 | | | $ | 1,343,273 | |
| | |
| | | | | | $ | 1,343,273 | |
| | |
|
Professional Services — 1.6% | |
IHS, Inc.(1) | | | 4,756 | | | $ | 541,043 | |
| | |
| | | | | | $ | 541,043 | |
| | |
|
Road & Rail — 4.2% | |
Genesee & Wyoming, Inc., Class A(1) | | | 5,240 | | | $ | 505,346 | |
J.B. Hunt Transport Services, Inc. | | | 4,985 | | | | 425,694 | |
Kansas City Southern | | | 4,944 | | | | 504,683 | |
| | |
| | | | | | $ | 1,435,723 | |
| | |
|
Semiconductors & Semiconductor Equipment — 2.0% | |
Linear Technology Corp. | | | 14,319 | | | $ | 670,129 | |
| | |
| | | | | | $ | 670,129 | |
| | |
|
Software — 3.7% | |
Check Point Software Technologies, Ltd.(1) | | | 5,834 | | | $ | 478,213 | |
Red Hat, Inc.(1) | | | 10,145 | | | | 768,484 | |
| | |
| | | | | | $ | 1,246,697 | |
| | |
|
Specialty Retail — 4.4% | |
Ross Stores, Inc. | | | 8,077 | | | $ | 850,993 | |
| | | | | | | | |
| Security | | Shares | | | Value | |
| | | | | | | | |
|
Specialty Retail (continued) | |
Tiffany & Co. | | | 7,318 | | | $ | 644,057 | |
| | |
| | | | | | $ | 1,495,050 | |
| | |
|
Textiles, Apparel & Luxury Goods — 1.4% | |
Michael Kors Holdings, Ltd.(1) | | | 7,466 | | | $ | 490,889 | |
| | |
| | | | | | $ | 490,889 | |
| | |
|
Trading Companies & Distributors — 2.6% | |
Fastenal Co. | | | 20,915 | | | $ | 866,613 | |
| | |
| | | | | | $ | 866,613 | |
| | |
| |
Total Common Stocks
(identified cost $24,820,062) | | | $ | 33,785,032 | |
| | | | | | | | | |
|
| Short-Term Investments — 0.7% | |
| | |
| | | | | | | | |
| Description | | Interest
(000’s omitted) | | | Value | |
Eaton Vance Cash Reserves Fund, LLC, 0.18%(2) | | $ | 246 | | | $ | 245,553 | |
| | | | | | | | | |
| | |
Total Short-Term Investments
(identified cost $245,553) | | | | | | $ | 245,553 | |
| | | | | | | | | |
| | |
Total Investments — 100.4%
(identified cost $25,065,615) | | | | | | $ | 34,030,585 | |
| | | | | | | | | |
| | |
Other Assets, Less Liabilities — (0.4)% | | | | | | $ | (138,385 | ) |
| | | | | | | | | |
| | |
Net Assets — 100.0% | | | | | | $ | 33,892,200 | |
| | | | | | | | | |
The percentage shown for each investment category in the Portfolio of Investments is based on net assets.
| (1) | Non-income producing security. |
| (2) | Affiliated investment company, available to Eaton Vance portfolios and funds, which invests in high quality, U.S. dollar denominated money market instruments. The rate shown is the annualized seven-day yield as of March 31, 2015. |
| | | | |
| | 6 | | See Notes to Financial Statements. |
Eaton Vance
Atlanta Capital Horizon Growth Fund
March 31, 2015
Statement of Assets and Liabilities (Unaudited)
| | | | |
| Assets | | March 31, 2015 | |
Unaffiliated investments, at value (identified cost, $24,820,062) | | $ | 33,785,032 | |
Affiliated investment, at value (identified cost, $245,553) | | | 245,553 | |
Dividends receivable | | | 17,849 | |
Interest receivable from affiliated investment | | | 40 | |
Receivable for Fund shares sold | | | 606 | |
Receivable from affiliates | | | 17,006 | |
Total assets | | $ | 34,066,086 | |
|
| Liabilities | |
Payable for Fund shares redeemed | | $ | 118,915 | |
Payable to affiliates: | | | | |
Investment adviser fee | | | 23,083 | |
Administration fee | | | 4,328 | |
Distribution and service fees | | | 12,917 | |
Accrued expenses | | | 14,643 | |
Total liabilities | | $ | 173,886 | |
Net Assets | | $ | 33,892,200 | |
|
| Sources of Net Assets | |
Paid-in capital | | $ | 24,655,711 | |
Accumulated net realized gain | | | 640,054 | |
Accumulated net investment loss | | | (368,535 | ) |
Net unrealized appreciation | | | 8,964,970 | |
Total | | $ | 33,892,200 | |
|
| Class A Shares | |
Net Assets | | $ | 22,539,351 | |
Shares Outstanding | | | 1,497,386 | |
Net Asset Value and Redemption Price Per Share | | | | |
(net assets ÷ shares of beneficial interest outstanding) | | $ | 15.05 | |
Maximum Offering Price Per Share | | | | |
(100 ÷ 94.25 of net asset value per share) | | $ | 15.97 | |
|
| Class B Shares | |
Net Assets | | $ | 1,555,389 | |
Shares Outstanding | | | 119,702 | |
Net Asset Value and Offering Price Per Share* | | | | |
(net assets ÷ shares of beneficial interest outstanding) | | $ | 12.99 | |
|
| Class C Shares | |
Net Assets | | $ | 7,930,173 | |
Shares Outstanding | | | 610,876 | |
Net Asset Value and Offering Price Per Share* | | | | |
(net assets ÷ shares of beneficial interest outstanding) | | $ | 12.98 | |
|
| Class I Shares | |
Net Assets | | $ | 1,867,287 | |
Shares Outstanding | | | 122,693 | |
Net Asset Value, Offering Price and Redemption Price Per Share | | | | |
(net assets ÷ shares of beneficial interest outstanding) | | $ | 15.22 | |
On sales of $50,000 or more, the offering price of Class A shares is reduced.
| * | Redemption price per share is equal to the net asset value less any applicable contingent deferred sales charge. |
| | | | |
| | 7 | | See Notes to Financial Statements. |
Eaton Vance
Atlanta Capital Horizon Growth Fund
March 31, 2015
Statement of Operations (Unaudited)
| | | | |
| Investment Income | | Six Months Ended March 31, 2015 | |
Dividends (net of foreign taxes, $725) | | $ | 135,413 | |
Interest allocated from affiliated investment | | | 285 | |
Expenses allocated from affiliated investment | | | (34 | ) |
Total investment income | | $ | 135,664 | |
|
| Expenses | |
Investment adviser fee | | $ | 137,097 | |
Administration fee | | | 25,706 | |
Distribution and service fees | | | | |
Class A | | | 28,084 | |
Class B | | | 8,714 | |
Class C | | | 40,356 | |
Trustees’ fees and expenses | | | 1,098 | |
Custodian fee | | | 14,786 | |
Transfer and dividend disbursing agent fees | | | 19,081 | |
Legal and accounting services | | | 19,442 | |
Printing and postage | | | 9,546 | |
Registration fees | | | 31,712 | |
Miscellaneous | | | 7,008 | |
Total expenses | | $ | 342,630 | |
Deduct — | | | | |
Allocation of expenses to affiliates | | $ | 68,485 | |
Total expense reductions | | $ | 68,485 | |
| |
Net expenses | | $ | 274,145 | |
| |
Net investment loss | | $ | (138,481 | ) |
| |
| Realized and Unrealized Gain (Loss) | | | | |
Net realized gain (loss) — | | | | |
Investment transactions | | $ | 1,111,988 | |
Investment transactions allocated from affiliated investment | | | 2 | |
Net realized gain | | $ | 1,111,990 | |
Change in unrealized appreciation (depreciation) — | | | | |
Investments | | $ | 1,174,435 | |
Net change in unrealized appreciation (depreciation) | | $ | 1,174,435 | |
| |
Net realized and unrealized gain | | $ | 2,286,425 | |
| |
Net increase in net assets from operations | | $ | 2,147,944 | |
| | | | |
| | 8 | | See Notes to Financial Statements. |
Eaton Vance
Atlanta Capital Horizon Growth Fund
March 31, 2015
Statements of Changes in Net Assets
| | | | | | | | |
| Increase (Decrease) in Net Assets | | Six Months Ended March 31, 2015
(Unaudited) | | | Year Ended September 30, 2014 | |
From operations — | | | | | | | | |
Net investment loss | | $ | (138,481 | ) | | $ | (348,034 | ) |
Net realized gain from investment transactions | | | 1,111,990 | | | | 3,898,485 | |
Net change in unrealized appreciation (depreciation) from investments | | | 1,174,435 | | | | (791,307 | ) |
Net increase in net assets from operations | | $ | 2,147,944 | | | $ | 2,759,144 | |
Distributions to shareholders — | | | | | | | | |
From net realized gain | | | | | | | | |
Class A | | $ | (1,775,783 | ) | | $ | (580,186 | ) |
Class B | | | (159,551 | ) | | | (62,391 | ) |
Class C | | | (734,188 | ) | | | (244,452 | ) |
Class I | | | (159,511 | ) | | | (35,222 | ) |
Total distributions to shareholders | | $ | (2,829,033 | ) | | $ | (922,251 | ) |
Transactions in shares of beneficial interest — | | | | | | | | |
Proceeds from sale of shares | | | | | | | | |
Class A | | $ | 389,879 | | | $ | 1,477,603 | |
Class B | | | 13,623 | | | | 204,259 | |
Class C | | | 346,611 | | | | 877,373 | |
Class I | | | 267,509 | | | | 1,155,272 | |
Net asset value of shares issued to shareholders in payment of distributions declared | | | | | | | | |
Class A | | | 1,661,744 | | | | 551,652 | |
Class B | | | 145,145 | | | | 55,654 | |
Class C | | | 608,748 | | | | 199,711 | |
Class I | | | 145,881 | | | | 30,355 | |
Cost of shares redeemed | | | | | | | | |
Class A | | | (2,268,183 | ) | | | (5,389,852 | ) |
Class B | | | (272,110 | ) | | | (484,996 | ) |
Class C | | | (1,042,009 | ) | | | (1,932,229 | ) |
Class I | | | (514,855 | ) | | | (814,257 | ) |
Net asset value of shares exchanged | | | | | | | | |
Class A | | | 182,522 | | | | 324,839 | |
Class B | | | (182,522 | ) | | | (324,839 | ) |
Net decrease in net assets from Fund share transactions | | $ | (518,017 | ) | | $ | (4,069,455 | ) |
| | |
Net decrease in net assets | | $ | (1,199,106 | ) | | $ | (2,232,562 | ) |
|
| Net Assets | |
At beginning of period | | $ | 35,091,306 | | | $ | 37,323,868 | |
At end of period | | $ | 33,892,200 | | | $ | 35,091,306 | |
|
Accumulated net investment loss
included in net assets | |
At end of period | | $ | (368,535 | ) | | $ | (230,054 | ) |
| | | | |
| | 9 | | See Notes to Financial Statements. |
Eaton Vance
Atlanta Capital Horizon Growth Fund
March 31, 2015
Financial Highlights
| | | | | | | | | | | | | | | | | | | | | | | | | | | | |
| | | Class A | |
| | | Six Months Ended
March 31, 2015
(Unaudited) | | | Year Ended September 30, | | | Period Ended September 30, 2011(1) | | | Year Ended October 31, | |
| | | | 2014 | | | 2013 | | | 2012 | | | | 2010 | | | 2009 | |
Net asset value — Beginning of period | | $ | 15.320 | | | $ | 14.570 | | | $ | 12.420 | | | $ | 14.100 | | | $ | 14.410 | | | $ | 11.610 | | | $ | 9.910 | |
| | | | | | | |
| Income (Loss) From Operations | | | | | | | | | | | | | | | | | | | | | | | | | | | | |
Net investment loss(2) | | $ | (0.045 | ) | | $ | (0.108 | ) | | $ | (0.091 | ) | | $ | (0.105 | ) | | $ | (0.088 | )(3) | | $ | (0.060 | ) | | $ | (0.012 | ) |
Net realized and unrealized gain (loss) | | | 1.000 | | | | 1.215 | | | | 2.545 | | | | 1.904 | | | | (0.166 | ) | | | 2.860 | | | | 1.712 | |
| | | | | | | |
Total income (loss) from operations | | $ | 0.955 | | | $ | 1.107 | | | $ | 2.454 | | | $ | 1.799 | | | $ | (0.254 | ) | | $ | 2.800 | | | $ | 1.700 | |
| | | | | | | |
| Less Distributions | | | | | | | | | | | | | | | | | | | | | | | | | | | | |
From net realized gain | | $ | (1.225 | ) | | $ | (0.357 | ) | | $ | (0.304 | ) | | $ | (3.479 | ) | | $ | (0.056 | ) | | $ | — | | | $ | — | |
| | | | | | | |
Total distributions | | $ | (1.225 | ) | | $ | (0.357 | ) | | $ | (0.304 | ) | | $ | (3.479 | ) | | $ | (0.056 | ) | | $ | — | | | $ | — | |
| | | | | | | |
Net asset value — End of period | | $ | 15.050 | | | $ | 15.320 | | | $ | 14.570 | | | $ | 12.420 | | | $ | 14.100 | | | $ | 14.410 | | | $ | 11.610 | |
| | | | | | | |
Total Return(4) | | | 6.60 | %(5) | | | 7.69 | % | | | 20.25 | % | | | 15.35 | % | | | (1.81 | )%(5) | | | 24.12 | % | | | 17.15 | % |
| | | | | | | |
| Ratios/Supplemental Data | | | | | | | | | | | | | | | | | | | | | | | | | | | | |
Net assets, end of period (000’s omitted) | | $ | 22,539 | | | $ | 22,918 | | | $ | 24,658 | | | $ | 26,305 | | | $ | 29,725 | | | $ | 35,125 | | | $ | 24,813 | |
Ratios (as a percentage of average daily net assets): | | | | | | | | | | | | | | | | | | | | | | | | | | | | |
Expenses(6)(7) | | | 1.40 | %(8) | | | 1.40 | % | | | 1.40 | % | | | 1.40 | % | | | 1.52 | %(8)(9) | | | 1.60 | %(9) | | | 1.60 | %(9) |
Net investment loss | | | (0.61 | )%(8) | | | (0.71 | )% | | | (0.69 | )% | | | (0.81 | )% | | | (0.59 | )%(3)(8)(9) | | | (0.46 | )%(9) | | | (0.11 | )%(9) |
Portfolio Turnover of the Portfolio(10) | | | — | | | | — | | | | — | | | | — | | | | 16 | %(5) | | | 33 | % | | | 42 | % |
Portfolio Turnover of the Fund | | | 11 | %(5) | | | 26 | % | | | 23 | % | | | 50 | % | | | 52 | %(5)(11) | | | — | | | | — | |
| (1) | For the eleven months ended September 30, 2011. The Fund changed its fiscal year-end from October 31 to September 30. |
| (2) | Computed using average shares outstanding. |
| (3) | Net investment loss per share reflects special dividends allocated from the Portfolio, which amounted to $0.015 per share, for the period while the Fund was making investments directly in the Portfolio. Excluding special dividends, the ratio of net investment loss to average daily net assets would have been (0.69)%. |
| (4) | Returns are historical and are calculated by determining the percentage change in net asset value with all distributions reinvested and do not reflect the effect of sales charges. |
| (6) | Excludes the effect of custody fee credits, if any, of less than 0.005%. |
| (7) | The investment adviser of the Portfolio waived a portion of its investment adviser fee and/or the administrator of the Fund subsidized certain operating expenses (equal to 0.40%, 0.33%, 0.42%, 0.32%, 0.21%, 0.09% and 0.31% of average daily net assets for the six months ended March 31, 2015, the years ended September 30, 2014, 2013 and 2012, the period ended September 30, 2011 and the years ended October 31, 2010 and 2009, respectively). A portion of the waiver and subsidy was borne by the sub-adviser. Absent this waiver and/or subsidy, total return would be lower. |
| (9) | Includes the Fund’s share of the Portfolio’s allocated expenses for the period while the Fund was investing in the Portfolio. |
| (10) | Portfolio turnover represents the rate of portfolio activity for the period while the Fund was investing in the Portfolio. |
| (11) | For the period from April 22, 2011 through September 30, 2011 when the Fund was making investments directly in securities. |
| | References to Portfolio herein are to Tax-Managed Mid-Cap Core Portfolio, a Massachusetts business trust having the same investment objective and policies as the Fund, in which the Fund invested all of its investable assets prior to April 22, 2011. |
| | | | |
| | 10 | | See Notes to Financial Statements. |
Eaton Vance
Atlanta Capital Horizon Growth Fund
March 31, 2015
Financial Highlights — continued
| | | | | | | | | | | | | | | | | | | | | | | | | | | | |
| | | Class B | |
| | | Six Months Ended
March 31, 2015
(Unaudited) | | | Year Ended September 30, | | | Period Ended September 30, 2011(1) | | | Year Ended October 31, | |
| | | | 2014 | | | 2013 | | | 2012 | | | | 2010 | | | 2009 | |
Net asset value — Beginning of period | | $ | 13.440 | | | $ | 12.920 | | | $ | 11.130 | | | $ | 13.060 | | | $ | 13.450 | | | $ | 10.920 | | | $ | 9.380 | |
| | | | | | | |
| Income (Loss) From Operations | | | | | | | | | | | | | | | | | | | | | | | | | | | | |
Net investment loss(2) | | $ | (0.089 | ) | | $ | (0.197 | ) | | $ | (0.169 | ) | | $ | (0.183 | ) | | $ | (0.195 | )(3) | | $ | (0.146 | ) | | $ | (0.075 | ) |
Net realized and unrealized gain (loss) | | | 0.864 | | | | 1.074 | | | | 2.263 | | | | 1.732 | | | | (0.139 | ) | | | 2.676 | | | | 1.615 | |
| | | | | | | |
Total income (loss) from operations | | $ | 0.775 | | | $ | 0.877 | | | $ | 2.094 | | | $ | 1.549 | | | $ | (0.334 | ) | | $ | 2.530 | | | $ | 1.540 | |
| | | | | | | |
| Less Distributions | | | | | | | | | | | | | | | | | | | | | | | | | | | | |
From net realized gain | | $ | (1.225 | ) | | $ | (0.357 | ) | | $ | (0.304 | ) | | $ | (3.479 | ) | | $ | (0.056 | ) | | $ | — | | | $ | — | |
| | | | | | | |
Total distributions | | $ | (1.225 | ) | | $ | (0.357 | ) | | $ | (0.304 | ) | | $ | (3.479 | ) | | $ | (0.056 | ) | | $ | — | | | $ | — | |
| | | | | | | |
Net asset value — End of period | | $ | 12.990 | | | $ | 13.440 | | | $ | 12.920 | | | $ | 11.130 | | | $ | 13.060 | | | $ | 13.450 | | | $ | 10.920 | |
| | | | | | | |
Total Return(4) | | | 6.16 | %(5) | | | 6.88 | % | | | 19.35 | % | | | 14.49 | % | | | (2.53 | )%(5) | | | 23.17 | % | | | 16.42 | % |
| | | | | | | |
| Ratios/Supplemental Data | | | | | | | | | | | | | | | | | | | | | | | | | | | | |
Net assets, end of period (000’s omitted) | | $ | 1,555 | | | $ | 1,907 | | | $ | 2,354 | | | $ | 2,655 | | | $ | 3,790 | | | $ | 3,327 | | | $ | 3,102 | |
Ratios (as a percentage of average daily net assets): | | | | | | | | | | | | | | | | | | | | | | | | | | | | |
Expenses(6)(7) | | | 2.15 | %(8) | | | 2.15 | % | | | 2.15 | % | | | 2.15 | % | | | 2.25 | %(8)(9) | | | 2.35 | %(9) | | | 2.35 | %(9) |
Net investment loss | | | (1.37 | )%(8) | | | (1.46 | )% | | | (1.44 | )% | | | (1.56 | )% | | | (1.39 | )%(3)(8)(9) | | | (1.21 | )%(9) | | | (0.80 | )%(9) |
Portfolio Turnover of the Portfolio(10) | | | — | | | | — | | | | — | | | | — | | | | 16 | %(5) | | | 33 | % | | | 42 | % |
Portfolio Turnover of the Fund | | | 11 | %(5) | | | 26 | % | | | 23 | % | | | 50 | % | | | 52 | %(5)(11) | | | — | | | | — | |
| (1) | For the eleven months ended September 30, 2011. The Fund changed its fiscal year-end from October 31 to September 30. |
| (2) | Computed using average shares outstanding. |
| (3) | Net investment loss per share reflects special dividends allocated from the Portfolio, which amounted to $0.014 per share, for the period while the Fund was making investments directly in the Portfolio. Excluding special dividends, the ratio of net investment loss to average daily net assets would have been (1.49)%. |
| (4) | Returns are historical and are calculated by determining the percentage change in net asset value with all distributions reinvested and do not reflect the effect of sales charges. |
| (6) | Excludes the effect of custody fee credits, if any, of less than 0.005%. |
| (7) | The investment adviser of the Portfolio waived a portion of its investment adviser fee and/or the administrator of the Fund subsidized certain operating expenses (equal to 0.40%, 0.33%, 0.42%, 0.32%, 0.21%, 0.09% and 0.31% of average daily net assets for the six months ended March 31, 2015, the years ended September 30, 2014, 2013 and 2012, the period ended September 30, 2011 and the years ended October 31, 2010 and 2009, respectively). A portion of the waiver and subsidy was borne by the sub-adviser. Absent this waiver and/or subsidy, total return would be lower. |
| (9) | Includes the Fund’s share of the Portfolio’s allocated expenses for the period while the Fund was investing in the Portfolio. |
| (10) | Portfolio turnover represents the rate of portfolio activity for the period while the Fund was investing in the Portfolio. |
| (11) | For the period from April 22, 2011 through September 30, 2011 when the Fund was making investments directly in securities. |
| | References to Portfolio herein are to Tax-Managed Mid-Cap Core Portfolio, a Massachusetts business trust having the same investment objective and policies as the Fund, in which the Fund invested all of its investable assets prior to April 22, 2011. |
| | | | |
| | 11 | | See Notes to Financial Statements. |
Eaton Vance
Atlanta Capital Horizon Growth Fund
March 31, 2015
Financial Highlights — continued
| | | | | | | | | | | | | | | | | | | | | | | | | | | | |
| | | Class C | |
| | | Six Months Ended
March 31, 2015
(Unaudited) | | | Year Ended September 30, | | | Period Ended
September 30, 2011(1) | | | Year Ended October 31, | |
| | | | 2014 | | | 2013 | | | 2012 | | | | 2010 | | | 2009 | |
Net asset value — Beginning of period | | $ | 13.430 | | | $ | 12.910 | | | $ | 11.120 | | | $ | 13.050 | | | $ | 13.430 | | | $ | 10.910 | | | $ | 9.370 | |
| | | | | | | |
| Income (Loss) From Operations | | | | | | | | | | | | | | | | | | | | | | | | | | | | |
Net investment loss(2) | | $ | (0.088 | ) | | $ | (0.196 | ) | | $ | (0.169 | ) | | $ | (0.182 | ) | | $ | (0.198 | )(3) | | $ | (0.145 | ) | | $ | (0.080 | ) |
Net realized and unrealized gain (loss) | | | 0.863 | | | | 1.073 | | | | 2.263 | | | | 1.731 | | | | (0.126 | ) | | | 2.665 | | | | 1.620 | |
| | | | | | | |
Total income (loss) from operations | | $ | 0.775 | | | $ | 0.877 | | | $ | 2.094 | | | $ | 1.549 | | | $ | (0.324 | ) | | $ | 2.520 | | | $ | 1.540 | |
| | | | | | | |
| Less Distributions | | | | | | | | | | | | | | | | | | | | | | | | | | | | |
From net realized gain | | $ | (1.225 | ) | | $ | (0.357 | ) | | $ | (0.304 | ) | | $ | (3.479 | ) | | $ | (0.056 | ) | | $ | — | | | $ | — | |
| | | | | | | |
Total distributions | | $ | (1.225 | ) | | $ | (0.357 | ) | | $ | (0.304 | ) | | $ | (3.479 | ) | | $ | (0.056 | ) | | $ | — | | | $ | — | |
| | | | | | | |
Net asset value — End of period | | $ | 12.980 | | | $ | 13.430 | | | $ | 12.910 | | | $ | 11.120 | | | $ | 13.050 | | | $ | 13.430 | | | $ | 10.910 | |
| | | | | | | |
Total Return(4) | | | 6.17 | %(5) | | | 6.88 | % | | | 19.36 | % | | | 14.51 | % | | | (2.46 | )%(5) | | | 23.10 | % | | | 16.44 | % |
| | | | | | | |
| Ratios/Supplemental Data | | | | | | | | | | | | | | | | | | | | | | | | | | | | |
Net assets, end of period (000’s omitted) | | $ | 7,930 | | | $ | 8,270 | | | $ | 8,759 | | | $ | 9,796 | | | $ | 10,456 | | | $ | 7,195 | | | $ | 6,528 | |
Ratios (as a percentage of average daily net assets): | | | | | | | | | | | | | | | | | | | | | | | | | | | | |
Expenses(6)(7) | | | 2.15 | %(8) | | | 2.15 | % | | | 2.15 | % | | | 2.15 | % | | | 2.25 | %(8)(9) | | | 2.35 | %(9) | | | 2.35 | %(9) |
Net investment loss | | | (1.36 | )%(8) | | | (1.46 | )% | | | (1.44 | )% | | | (1.55 | )% | | | (1.42 | )%(3)(8)(9) | | | (1.20 | )%(9) | | | (0.84 | )%(9) |
Portfolio Turnover of the Portfolio(10) | | | — | | | | — | | | | — | | | | — | | | | 16 | %(5) | | | 33 | % | | | 42 | % |
Portfolio Turnover of the Fund | | | 11 | %(5) | | | 26 | % | | | 23 | % | | | 50 | % | | | 52 | %(5)(11) | | | — | | | | — | |
| (1) | For the eleven months ended September 30, 2011. The Fund changed its fiscal year-end from October 31 to September 30. |
| (2) | Computed using average shares outstanding. |
| (3) | Net investment loss per share reflects special dividends allocated from the Portfolio, which amounted to $0.013 per share, for the period while the Fund was making investments directly in the Portfolio. Excluding special dividends, the ratio of net investment loss to average daily net assets would have been (1.51)%. |
| (4) | Returns are historical and are calculated by determining the percentage change in net asset value with all distributions reinvested and do not reflect the effect of sales charges. |
| (6) | Excludes the effect of custody fee credits, if any, of less than 0.005%. |
| (7) | The investment adviser of the Portfolio waived a portion of its investment adviser fee and/or the administrator of the Fund subsidized certain operating expenses (equal to 0.40%, 0.33%, 0.42%, 0.32%, 0.21%, 0.09% and 0.31% of average daily net assets for the six months ended March 31, 2015, the years ended September 30, 2014, 2013 and 2012, the period ended September 30, 2011 and the years ended October 31, 2010 and 2009, respectively). A portion of the waiver and subsidy was borne by the sub-adviser. Absent this waiver and/or subsidy, total return would be lower. |
| (9) | Includes the Fund’s share of the Portfolio’s allocated expenses for the period while the Fund was investing in the Portfolio. |
| (10) | Portfolio turnover represents the rate of portfolio activity for the period while the Fund was investing in the Portfolio. |
| (11) | For the period from April 22, 2011 through September 30, 2011 when the Fund was making investments directly in securities. |
| | References to Portfolio herein are to Tax-Managed Mid-Cap Core Portfolio, a Massachusetts business trust having the same investment objective and policies as the Fund, in which the Fund invested all of its investable assets prior to April 22, 2011. |
| | | | |
| | 12 | | See Notes to Financial Statements. |
Eaton Vance
Atlanta Capital Horizon Growth Fund
March 31, 2015
Financial Highlights — continued
| | | | | | | | | | | | | | | | | | | | |
| | | Class I | |
| | | Six Months Ended
March 31, 2015
(Unaudited) | | | Year Ended September 30, | | | Period Ended
September 30, 2011(1) | |
| | | | 2014 | | | 2013 | | | 2012 | | |
Net asset value — Beginning of period | | $ | 15.460 | | | $ | 14.660 | | | $ | 12.470 | | | $ | 14.110 | | | $ | 17.730 | |
| | | | | |
| Income (Loss) From Operations | | | | | | | | | | | | | | | | | | | | |
Net investment loss(2) | | $ | (0.027 | ) | | $ | (0.069 | ) | | $ | (0.063 | ) | | $ | (0.072 | ) | | $ | (0.058 | ) |
Net realized and unrealized gain (loss) | | | 1.012 | | | | 1.226 | | | | 2.557 | | | | 1.911 | | | | (3.562 | ) |
| | | | | |
Total income (loss) from operations | | $ | 0.985 | | | $ | 1.157 | | | $ | 2.494 | | | $ | 1.839 | | | $ | (3.620 | ) |
| | | | | |
| Less Distributions | | | | | | | | | | | | | | | | | | | | |
From net realized gain | | $ | (1.225 | ) | | $ | (0.357 | ) | | $ | (0.304 | ) | | $ | (3.479 | ) | | $ | — | |
| | | | | |
Total distributions | | $ | (1.225 | ) | | $ | (0.357 | ) | | $ | (0.304 | ) | | $ | (3.479 | ) | | $ | — | |
| | | | | |
Net asset value — End of period | | $ | 15.220 | | | $ | 15.460 | | | $ | 14.660 | | | $ | 12.470 | | | $ | 14.110 | |
| | | | | |
Total Return(3) | | | 6.74 | %(4) | | | 7.99 | % | | | 20.50 | % | | | 15.69 | % | | | (20.42 | )%(4) |
| | | | | |
| Ratios/Supplemental Data | | | | | | | | | | | | | | | | | | | | |
Net assets, end of period (000’s omitted) | | $ | 1,867 | | | $ | 1,996 | | | $ | 1,553 | | | $ | 872 | | | $ | 1 | |
Ratios (as a percentage of average daily net assets): | | | | | | | | | | | | | | | | | | | | |
Expenses(5)(6) | | | 1.15 | %(7) | | | 1.15 | % | | | 1.15 | % | | | 1.15 | % | | | 1.15 | %(7) |
Net investment loss | | | (0.36 | )%(7) | | | (0.45 | )% | | | (0.47 | )% | | | (0.58 | )% | | | (0.86 | )%(7) |
Portfolio Turnover | | | 11 | %(4) | | | 26 | % | | | 23 | % | | | 50 | % | | | 52 | %(4)(8) |
| (1) | For the period from the commencement of operations, May 2, 2011, to September 30, 2011. |
| (2) | Computed using average shares outstanding. |
| (3) | Returns are historical and are calculated by determining the percentage change in net asset value with all distributions reinvested. |
| (5) | The administrator of the Fund subsidized certain operating expenses (equal to 0.40%, 0.33%, 0.42%, 0.32% and 0.38% of average daily net assets for the six months ended March 31, 2015, the years ended September 30, 2014, 2013 and 2012 and the period ended September 30, 2011, respectively). A portion of the subsidy was borne by the sub-adviser. Absent this subsidy, total return would be lower. |
| (6) | Excludes the effect of custody fee credits, if any, of less than 0.005%. |
| (8) | For the period from April 22, 2011 through September 30, 2011 when the Fund was making investments directly in securities. |
| | | | |
| | 13 | | See Notes to Financial Statements. |
Eaton Vance
Atlanta Capital Horizon Growth Fund
March 31, 2015
Notes to Financial Statements (Unaudited)
1 Significant Accounting Policies
Eaton Vance Atlanta Capital Horizon Growth Fund (the Fund) is a diversified series of Eaton Vance Mutual Funds Trust (the Trust). The Trust is a Massachusetts business trust registered under the Investment Company Act of 1940, as amended (the 1940 Act), as an open-end management investment company. The Fund’s investment objective is to seek total return. The Fund offers four classes of shares. Class A shares are generally sold subject to a sales charge imposed at time of purchase. Class B and Class C shares are sold at net asset value and are generally subject to a contingent deferred sales charge (see Note 5). Class I shares are sold at net asset value and are not subject to a sales charge. Class B shares automatically convert to Class A shares eight years after their purchase as described in the Fund’s prospectus. Beginning January 1, 2012, Class B shares are only available for purchase upon exchange from another Eaton Vance fund or through reinvestment of distributions. Each class represents a pro-rata interest in the Fund, but votes separately on class-specific matters and (as noted below) is subject to different expenses. Realized and unrealized gains and losses and net investment income and losses, other than class-specific expenses, are allocated daily to each class of shares based on the relative net assets of each class to the total net assets of the Fund. Each class of shares differs in its distribution plan and certain other class-specific expenses.
The following is a summary of significant accounting policies of the Fund. The policies are in conformity with accounting principles generally accepted in the United States of America (U.S. GAAP). The Fund is an investment company and follows accounting and reporting guidance in the Financial Accounting Standards Board (“FASB”) Accounting Standards Codification Topic 946.
A Investment Valuation — The following methodologies are used to determine the market value or fair value of investments.
Equity Securities. Equity securities listed on a U.S. securities exchange generally are valued at the last sale or closing price on the day of valuation or, if no sales took place on such date, at the mean between the closing bid and asked prices therefore on the exchange where such securities are principally traded. Equity securities listed on the NASDAQ Global or Global Select Market generally are valued at the NASDAQ official closing price. Unlisted or listed securities for which closing sales prices or closing quotations are not available are valued at the mean between the latest available bid and asked prices.
Affiliated Fund. The Fund may invest in Eaton Vance Cash Reserves Fund, LLC (Cash Reserves Fund), an affiliated investment company managed by Eaton Vance Management (EVM). The value of the Fund’s investment in Cash Reserves Fund reflects the Fund’s proportionate interest in its net assets. Cash Reserves Fund generally values its investment securities utilizing the amortized cost valuation technique in accordance with Rule 2a-7 under the 1940 Act. This technique involves initially valuing a portfolio security at its cost and thereafter assuming a constant amortization to maturity of any discount or premium. If amortized cost is determined not to approximate fair value, Cash Reserves Fund may value its investment securities based on available market quotations provided by a third party pricing service.
Fair Valuation. Investments for which valuations or market quotations are not readily available or are deemed unreliable are valued at fair value using methods determined in good faith by or at the direction of the Trustees of the Fund in a manner that fairly reflects the security’s value, or the amount that the Fund might reasonably expect to receive for the security upon its current sale in the ordinary course. Each such determination is based on a consideration of relevant factors, which are likely to vary from one pricing context to another. These factors may include, but are not limited to, the type of security, the existence of any contractual restrictions on the security’s disposition, the price and extent of public trading in similar securities of the issuer or of comparable companies or entities, quotations or relevant information obtained from broker/dealers or other market participants, information obtained from the issuer, analysts, and/or the appropriate stock exchange (for exchange-traded securities), an analysis of the company’s or entity’s financial condition, and an evaluation of the forces that influence the issuer and the market(s) in which the security is purchased and sold.
B Investment Transactions — Investment transactions for financial statement purposes are accounted for on a trade date basis. Realized gains and losses on investments sold are determined on the basis of identified cost.
C Income — Dividend income is recorded on the ex-dividend date for dividends received in cash and/or securities. However, if the ex-dividend date has passed, certain dividends from foreign securities are recorded as the Fund is informed of the ex-dividend date. Withholding taxes on foreign dividends and capital gains have been provided for in accordance with the Fund’s understanding of the applicable countries’ tax rules and rates. Interest income is recorded on the basis of interest accrued, adjusted for amortization of premium or accretion of discount.
D Federal Taxes — The Fund’s policy is to comply with the provisions of the Internal Revenue Code applicable to regulated investment companies and to distribute to shareholders each year substantially all of its net investment income, and all or substantially all of its net realized capital gains. Accordingly, no provision for federal income or excise tax is necessary.
As of March 31, 2015, the Fund had no uncertain tax positions that would require financial statement recognition, de-recognition, or disclosure. The Fund files a U.S. federal income tax return annually after its fiscal year-end, which is subject to examination by the Internal Revenue Service for a period of three years from the date of filing.
E Expenses — The majority of expenses of the Trust are directly identifiable to an individual fund. Expenses which are not readily identifiable to a specific fund are allocated taking into consideration, among other things, the nature and type of expense and the relative size of the funds.
F Expense Reduction — State Street Bank and Trust Company (SSBT) serves as custodian of the Fund. Pursuant to the custodian agreement, SSBT receives a fee reduced by credits, which are determined based on the average daily cash balance the Fund maintains with SSBT. All credit balances, if any, used to reduce the Fund’s custodian fees are reported as a reduction of expenses in the Statement of Operations.
Eaton Vance
Atlanta Capital Horizon Growth Fund
March 31, 2015
Notes to Financial Statements (Unaudited) — continued
G Use of Estimates — The preparation of the financial statements in conformity with U.S. GAAP requires management to make estimates and assumptions that affect the reported amounts of assets and liabilities at the date of the financial statements and the reported amounts of income and expense during the reporting period. Actual results could differ from those estimates.
H Indemnifications — Under the Trust’s organizational documents, its officers and Trustees may be indemnified against certain liabilities and expenses arising out of the performance of their duties to the Fund. Under Massachusetts law, if certain conditions prevail, shareholders of a Massachusetts business trust (such as the Trust) could be deemed to have personal liability for the obligations of the Trust. However, the Trust’s Declaration of Trust contains an express disclaimer of liability on the part of Fund shareholders and the By-laws provide that the Trust shall assume the defense on behalf of any Fund shareholders. Moreover, the By-laws also provide for indemnification out of Fund property of any shareholder held personally liable solely by reason of being or having been a shareholder for all loss or expense arising from such liability. Additionally, in the normal course of business, the Fund enters into agreements with service providers that may contain indemnification clauses. The Fund’s maximum exposure under these arrangements is unknown as this would involve future claims that may be made against the Fund that have not yet occurred.
I Interim Financial Statements — The interim financial statements relating to March 31, 2015 and for the six months then ended have not been audited by an independent registered public accounting firm, but in the opinion of the Fund’s management, reflect all adjustments, consisting only of normal recurring adjustments, necessary for the fair presentation of the financial statements.
2 Distributions to Shareholders and Income Tax Information
It is the present policy of the Fund to make at least one distribution annually (normally in December) of all or substantially all of its net investment income and to distribute annually all or substantially all of its net realized capital gains. Distributions to shareholders are recorded on the ex-dividend date. Distributions are declared separately for each class of shares. Shareholders may reinvest income and capital gain distributions in additional shares of the same class of the Fund at the net asset value as of the ex-dividend date or, at the election of the shareholder, receive distributions in cash. Distributions to shareholders are determined in accordance with income tax regulations, which may differ from U.S. GAAP. As required by U.S. GAAP, only distributions in excess of tax basis earnings and profits are reported in the financial statements as a return of capital. Permanent differences between book and tax accounting relating to distributions are reclassified to paid-in capital. For tax purposes, distributions from short-term capital gains are considered to be from ordinary income.
At September 30, 2014, the Fund had a late year ordinary loss of $230,054 which it has elected to defer to the following taxable year pursuant to income tax regulations. Late year ordinary losses represent certain specified losses realized in that portion of a taxable year after October 31 that are treated as ordinary for tax purposes plus ordinary losses attributable to that portion of a taxable year after December 31.
The cost and unrealized appreciation (depreciation) of investments of the Fund at March 31, 2015, as determined on a federal income tax basis, were as follows:
| | | | |
| |
Aggregate cost | | $ | 25,257,623 | |
| |
Gross unrealized appreciation | | $ | 9,272,510 | |
Gross unrealized depreciation | | | (499,548 | ) |
| |
Net unrealized appreciation | | $ | 8,772,962 | |
3 Investment Adviser and Administration Fees and Other Transactions with Affiliates
The investment adviser fee is earned by Boston Management and Research (BMR), a subsidiary of EVM, as compensation for investment advisory services rendered to the Fund. The fee is computed at an annual rate of 0.80% of the Fund’s average daily net assets up to $500 million and is payable monthly. On net assets of $500 million and over, the annual fee is reduced. For the six months ended March 31, 2015, the investment adviser fee amounted to $137,097 or 0.80% (annualized) of the Fund’s average daily net assets. Pursuant to a sub-advisory agreement, BMR pays Atlanta Capital Management Company, LLC (Atlanta Capital), an affiliate of EVM, a portion of its adviser fee for sub-advisory services provided to the Fund. The Fund invests its cash in Cash Reserves Fund. EVM does not currently receive a fee for advisory services provided to Cash Reserves Fund.The administration fee is earned by EVM for administering the business affairs of the Fund and is computed at an annual rate of 0.15% of the Fund’s average daily net assets. For the six months ended March 31, 2015, the administration fee amounted to $25,706.
EVM and Atlanta Capital have agreed to reimburse the Fund’s operating expenses to the extent that total annual operating expenses (relating to ordinary operating expenses only) exceed 1.40%, 2.15%, 2.15% and 1.15% of the Fund’s average daily net assets for Class A, Class B, Class C and Class I, respectively. This agreement may be changed or terminated after January 31, 2016. Pursuant to this agreement, EVM and Atlanta Capital were allocated $68,485 in total of the Fund’s operating expenses for the six months ended March 31, 2015.
Eaton Vance
Atlanta Capital Horizon Growth Fund
March 31, 2015
Notes to Financial Statements (Unaudited) — continued
EVM provides sub-transfer agency and related services to the Fund pursuant to a Sub-Transfer Agency Support Services Agreement. For the six months ended March 31, 2015, EVM earned $2,153 from the Fund pursuant to such agreement, which is included in transfer and dividend disbursing agent fees on the Statement of Operations. The Fund was informed that Eaton Vance Distributors, Inc. (EVD), an affiliate of EVM and the Fund’s principal underwriter, received $852 as its portion of the sales charge on sales of Class A shares for the six months ended March 31, 2015. EVD also received distribution and service fees from Class A, Class B and Class C shares (see Note 4) and contingent deferred sales charges (see Note 5).
Trustees and officers of the Fund who are members of EVM’s or BMR’s organizations receive remuneration for their services to the Fund out of the investment adviser fee. Trustees of the Fund who are not affiliated with the investment adviser and administrator may elect to defer receipt of all or a percentage of their annual fees in accordance with the terms of the Trustees Deferred Compensation Plan. For the six months ended March 31, 2015, no significant amounts have been deferred. Certain officers and Trustees of the Fund are officers of the above organizations.
4 Distribution Plans
The Fund has in effect a distribution plan for Class A shares (Class A Plan) pursuant to Rule 12b-1 under the 1940 Act. Pursuant to the Class A Plan, the Fund pays EVD a distribution and service fee of 0.25% per annum of its average daily net assets attributable to Class A shares for distribution services and facilities provided to the Fund by EVD, as well as for personal services and/or the maintenance of shareholder accounts. Distribution and service fees paid or accrued to EVD for the six months ended March 31, 2015 amounted to $28,084 for Class A shares.
The Fund also has in effect distribution plans for Class B shares (Class B Plan) and Class C shares (Class C Plan) pursuant to Rule 12b-1 under the 1940 Act. Pursuant to the Class B and Class C Plans, the Fund pays EVD amounts equal to 0.75% per annum of its average daily net assets attributable to Class B and Class C shares for providing ongoing distribution services and facilities to the Fund. For the six months ended March 31, 2015, the Fund paid or accrued to EVD $6,536 and $30,267 for Class B and Class C shares, respectively.
Pursuant to the Class B and Class C Plans, the Fund also makes payments of service fees to EVD, financial intermediaries and other persons in amounts equal to 0.25% per annum of its average daily net assets attributable to that class. Service fees paid or accrued are for personal services and/or the maintenance of shareholder accounts. They are separate and distinct from the sales commissions and distribution fees payable to EVD. Service fees paid or accrued for the six months ended March 31, 2015 amounted to $2,178 and $10,089 for Class B and Class C shares, respectively.
Distribution and service fees are subject to the limitations contained in the Financial Industry Regulatory Authority’s NASD Conduct Rule 2830(d).
5 Contingent Deferred Sales Charges
A contingent deferred sales charge (CDSC) generally is imposed on redemptions of Class B shares made within six years of purchase and on redemptions of Class C shares made within one year of purchase. Class A shares may be subject to a 1% CDSC if redeemed within 18 months of purchase (depending on the circumstances of purchase). Generally, the CDSC is based upon the lower of the net asset value at date of redemption or date of purchase. No charge is levied on shares acquired by reinvestment of dividends or capital gain distributions. The CDSC for Class B shares is imposed at declining rates that begin at 5% in the case of redemptions in the first and second year after purchase, declining one percentage point each subsequent year. Class C shares are subject to a 1% CDSC if redeemed within one year of purchase. For the six months ended March 31, 2015, the Fund was informed that EVD received approximately $2,000 of CDSCs paid by Class B shareholders and no CDSCs paid by Class A and Class C shareholders.
6 Purchases and Sales of Investments
Purchases and sales of investments, other than short-term obligations, aggregated $3,903,942 and $7,118,837, respectively, for the six months ended March 31, 2015.
Eaton Vance
Atlanta Capital Horizon Growth Fund
March 31, 2015
Notes to Financial Statements (Unaudited) — continued
7 Shares of Beneficial Interest
The Fund’s Declaration of Trust permits the Trustees to issue an unlimited number of full and fractional shares of beneficial interest (without par value). Such shares may be issued in a number of different series (such as the Fund) and classes. Transactions in Fund shares were as follows:
| | | | | | | | |
| Class A | | Six Months Ended
March 31, 2015
(Unaudited) | | | Year Ended
September 30, 2014 | |
| | |
Sales | | | 26,261 | | | | 96,921 | |
Issued to shareholders electing to receive payments of distributions in Fund shares | | | 115,479 | | | | 37,400 | |
Redemptions | | | (152,279 | ) | | | (351,708 | ) |
Exchange from Class B shares | | | 12,082 | | | | 21,238 | |
| | |
Net increase (decrease) | | | 1,543 | | | | (196,149 | ) |
| | |
| | | | | | | | |
| Class B | | Six Months Ended
March 31, 2015
(Unaudited) | | | Year Ended
September 30, 2014 | |
| | |
Sales | | | 1,085 | | | | 15,347 | |
Issued to shareholders electing to receive payments of distributions in Fund shares | | | 11,658 | | | | 4,277 | |
Redemptions | | | (21,028 | ) | | | (35,785 | ) |
Exchange to Class A shares | | | (13,904 | ) | | | (24,132 | ) |
| | |
Net decrease | | | (22,189 | ) | | | (40,293 | ) |
| | |
| | | | | | | | |
| Class C | | Six Months Ended
March 31, 2015
(Unaudited) | | | Year Ended
September 30, 2014 | |
| | |
Sales | | | 27,298 | | | | 65,560 | |
Issued to shareholders electing to receive payments of distributions in Fund shares | | | 48,935 | | | | 15,363 | |
Redemptions | | | (81,380 | ) | | | (143,487 | ) |
| | |
Net decrease | | | (5,147 | ) | | | (62,564 | ) |
| | |
| | | | | | | | |
| Class I | | Six Months Ended
March 31, 2015
(Unaudited) | | | Year Ended
September 30, 2014 | |
| | |
Sales | | | 17,752 | | | | 73,999 | |
Issued to shareholders electing to receive payments of distributions in Fund shares | | | 10,033 | | | | 2,044 | |
Redemptions | | | (34,244 | ) | | | (52,779 | ) |
| | |
Net increase (decrease) | | | (6,459 | ) | | | 23,264 | |
8 Line of Credit
The Fund participates with other portfolios and funds managed by EVM and its affiliates in a $750 million unsecured line of credit agreement with a group of banks, which is in effect through September 7, 2015. Borrowings are made by the Fund solely to facilitate the handling of unusual and/or unanticipated short-term cash requirements. Interest is charged to the Fund based on its borrowings at an amount above either the Eurodollar rate or Federal Funds rate. In addition, a fee computed at an annual rate of 0.08% on the daily unused portion of the line of credit is allocated among the participating portfolios and
Eaton Vance
Atlanta Capital Horizon Growth Fund
March 31, 2015
Notes to Financial Statements (Unaudited) — continued
funds at the end of each quarter. Because the line of credit is not available exclusively to the Fund, it may be unable to borrow some or all of its requested amounts at any particular time. The Fund did not have any significant borrowings or allocated fees during the six months ended March 31, 2015.
9 Fair Value Measurements
Under generally accepted accounting principles for fair value measurements, a three-tier hierarchy to prioritize the assumptions, referred to as inputs, is used in valuation techniques to measure fair value. The three-tier hierarchy of inputs is summarized in the three broad levels listed below.
| Ÿ | | Level 1 – quoted prices in active markets for identical investments |
| Ÿ | | Level 2 – other significant observable inputs (including quoted prices for similar investments, interest rates, prepayment speeds, credit risk, etc.) |
| Ÿ | | Level 3 – significant unobservable inputs (including a fund’s own assumptions in determining the fair value of investments) |
In cases where the inputs used to measure fair value fall in different levels of the fair value hierarchy, the level disclosed is determined based on the lowest level input that is significant to the fair value measurement in its entirety. The inputs or methodology used for valuing securities are not necessarily an indication of the risk associated with investing in those securities.
At March 31, 2015, the hierarchy of inputs used in valuing the Fund’s investments, which are carried at value, were as follows:
| | | | | | | | | | | | | | | | |
| Asset Description | | Level 1 | | | Level 2 | | | Level 3 | | | Total | |
| | | | |
Common Stocks | | $ | 33,785,032 | * | | $ | — | | | $ | — | | | $ | 33,785,032 | |
Short-Term Investments | | | — | | | | 245,553 | | | | — | | | | 245,553 | |
| | | | |
Total Investments | | $ | 33,785,032 | | | $ | 245,553 | | | $ | — | | | $ | 34,030,585 | |
| * | The level classification by major category of investments is the same as the category presentation in the Portfolio of Investments. |
The Fund held no investments or other financial instruments as of September 30, 2014 whose fair value was determined using Level 3 inputs. At March 31, 2015, there were no investments transferred between Level 1 and Level 2 during the six months then ended.
Eaton Vance
Atlanta Capital Horizon Growth Fund
March 31, 2015
Officers and Trustees
Officers of Eaton Vance Atlanta Capital Horizon Growth Fund
Payson F. Swaffield
President
Maureen A. Gemma
Vice President, Secretary and Chief Legal Officer
James F. Kirchner
Treasurer
Paul M. O’Neil
Chief Compliance Officer
Trustees of Eaton Vance Atlanta Capital Horizon Growth Fund
Ralph F. Verni
Chairman
Scott E. Eston
Thomas E. Faust Jr.*
Cynthia E. Frost
George J. Gorman
Valerie A. Mosley
William H. Park
Ronald A. Pearlman
Helen Frame Peters
Susan J. Sutherland
Harriett Tee Taggart
Eaton Vance Funds
IMPORTANT NOTICES
Privacy. The Eaton Vance organization is committed to ensuring your financial privacy. Each of the financial institutions identified below has in effect the following policy (“Privacy Policy”) with respect to nonpublic personal information about its customers:
| Ÿ | | Only such information received from you, through application forms or otherwise, and information about your Eaton Vance fund transactions will be collected. This may include information such as name, address, social security number, tax status, account balances and transactions. |
| Ÿ | | None of such information about you (or former customers) will be disclosed to anyone, except as permitted by law (which includes disclosure to employees necessary to service your account). In the normal course of servicing a customer’s account, Eaton Vance may share information with unaffiliated third parties that perform various required services such as transfer agents, custodians and broker-dealers. |
| Ÿ | | Policies and procedures (including physical, electronic and procedural safeguards) are in place that are designed to protect the confidentiality of such information. |
| Ÿ | | We reserve the right to change our Privacy Policy at any time upon proper notification to you. Customers may want to review our Privacy Policy periodically for changes by accessing the link on our homepage: www.eatonvance.com. |
Our pledge of privacy applies to the following entities within the Eaton Vance organization: the Eaton Vance Family of Funds, Eaton Vance Management, Eaton Vance Investment Counsel, Eaton Vance Distributors, Inc., Eaton Vance Trust Company, Eaton Vance Management’s Real Estate Investment Group and Boston Management and Research. In addition, our Privacy Policy applies only to those Eaton Vance customers who are individuals and who have a direct relationship with us. If a customer’s account (i.e., fund shares) is held in the name of a third-party financial advisor/broker-dealer, it is likely that only such advisor’s privacy policies apply to the customer. This notice supersedes all previously issued privacy disclosures. For more information about Eaton Vance’s Privacy Policy, please call 1-800-262-1122.
Delivery of Shareholder Documents. The Securities and Exchange Commission (SEC) permits funds to deliver only one copy of shareholder documents, including prospectuses, proxy statements and shareholder reports, to fund investors with multiple accounts at the same residential or post office box address. This practice is often called “householding” and it helps eliminate duplicate mailings to shareholders. Eaton Vance, or your financial advisor, may household the mailing of your documents indefinitely unless you instruct Eaton Vance, or your financial advisor, otherwise. If you would prefer that your Eaton Vance documents not be householded, please contact Eaton Vance at 1-800-262-1122, or contact your financial advisor. Your instructions that householding not apply to delivery of your Eaton Vance documents will be effective within 30 days of receipt by Eaton Vance or your financial advisor.
Portfolio Holdings. Each Eaton Vance Fund and its underlying Portfolio(s) (if applicable) will file a schedule of portfolio holdings on Form N-Q with the SEC for the first and third quarters of each fiscal year. The Form N-Q will be available on the Eaton Vance website at www.eatonvance.com, by calling Eaton Vance at 1-800-262-1122 or in the EDGAR database on the SEC’s website at www.sec.gov. Form N-Q may also be reviewed and copied at the SEC’s public reference room in Washington, D.C. (call 1-800-732-0330 for information on the operation of the public reference room).
Proxy Voting. From time to time, funds are required to vote proxies related to the securities held by the funds. The Eaton Vance Funds or their underlying Portfolios (if applicable) vote proxies according to a set of policies and procedures approved by the Funds’ and Portfolios’ Boards. You may obtain a description of these policies and procedures and information on how the Funds or Portfolios voted proxies relating to portfolio securities during the most recent 12-month period ended June 30, without charge, upon request, by calling 1-800-262-1122 and by accessing the SEC’s website at www.sec.gov.
Investment Adviser
Boston Management and Research
Two International Place
Boston, MA 02110
Sub-Adviser
Atlanta Capital Management Company, LLC
1075 Peachtree Street NE
Suite 2100
Atlanta, GA 30309
Administrator
Eaton Vance Management
Two International Place
Boston, MA 02110
Principal Underwriter*
Eaton Vance Distributors, Inc.
Two International Place
Boston, MA 02110
(617) 482-8260
Custodian
State Street Bank and Trust Company
State Street Financial Center, One Lincoln Street
Boston, MA 02111
Transfer Agent
BNY Mellon Investment Servicing (US) Inc.
Attn: Eaton Vance Funds
P.O. Box 9653
Providence, RI 02940-9653
(800) 262-1122
Fund Offices
Two International Place
Boston, MA 02110
| * | FINRA BrokerCheck. Investors may check the background of their Investment Professional by contacting the Financial Industry Regulatory Authority (FINRA). FINRA BrokerCheck is a free tool to help investors check the professional background of current and former FINRA-registered securities firms and brokers. FINRA BrokerCheck is available by calling 1-800-289-9999 and at www.FINRA.org. The FINRA BrokerCheck brochure describing this program is available to investors at www.FINRA.org. |

Eaton Vance
Core Plus Bond Fund
Semiannual Report
March 31, 2015

Commodity Futures Trading Commission Registration. Effective December 31, 2012, the Commodity Futures Trading Commission (“CFTC”) adopted certain regulatory changes that subject registered investment companies and advisers to regulation by the CFTC if a fund invests more than a prescribed level of its assets in certain CFTC-regulated instruments (including futures, certain options and swap agreements) or markets itself as providing investment exposure to such instruments. The Fund has claimed an exclusion from the definition of the term “commodity pool operator” under the Commodity Exchange Act. Accordingly, neither the Fund nor the adviser with respect to the operation of the Fund is subject to CFTC regulation. Because of its management of other strategies, the Fund’s adviser is registered with the CFTC as a commodity pool operator and a commodity trading advisor.
Fund shares are not insured by the FDIC and are not deposits or other obligations of, or guaranteed by, any depository institution. Shares are subject to investment risks, including possible loss of principal invested.
This report must be preceded or accompanied by a current summary prospectus or prospectus. Before investing, investors should consider carefully the investment objective, risks, and charges and expenses of a mutual fund. This and other important information is contained in the summary prospectus and prospectus, which can be obtained from a financial advisor. Prospective investors should read the prospectus carefully before investing. For further information, please call 1-800-262-1122.
Semiannual Report March 31, 2015
Eaton Vance
Core Plus Bond Fund
Table of Contents
| | | | |
Performance | | | 2 | |
| |
Fund Profile | | | 2 | |
| |
Endnotes and Additional Disclosures | | | 3 | |
| |
Fund Expenses | | | 4 | |
| |
Financial Statements | | | 5 | |
| |
Officers and Trustees | | | 18 | |
| |
Important Notices | | | 19 | |
Eaton Vance
Core Plus Bond Fund
March 31, 2015
Performance1,2
Portfolio Managers Kathleen C. Gaffney, CFA, Thomas H. Luster, CFA, Bernard Scozzafava, CFA and Matthew T. Buckley, CFA
| | | | | | | | | | | | | | | | | | | | | | | | |
| % Average Annual Total Returns | | Class Inception Date | | | Performance
Inception Date | | | Six Months | | | One Year | | | Five Years | | | Since
Inception | |
Class A at NAV | | | 11/17/2009 | | | | 11/17/2009 | | | | 4.02 | % | | | 8.50 | % | | | 8.23 | % | | | 8.18 | % |
Class A with 4.75% Maximum Sales Charge | | | — | | | | — | | | | –0.94 | | | | 3.31 | | | | 7.17 | | | | 7.20 | |
Class C at NAV | | | 11/17/2009 | | | | 11/17/2009 | | | | 3.72 | | | | 7.69 | | | | 7.45 | | | | 7.41 | |
Class C with 1% Maximum Sales Charge | | | — | | | | — | | | | 2.72 | | | | 6.69 | | | | 7.45 | | | | 7.41 | |
Class I at NAV | | | 11/17/2009 | | | | 11/17/2009 | | | | 4.23 | | | | 8.76 | | | | 8.50 | | | | 8.43 | |
Barclays Taxable Municipal - Build America Bonds Index | | | — | | | | — | | | | 6.83 | % | | | 13.83 | % | | | 10.49 | % | | | 9.72 | % |
| | | | | | |
| | | | | | | | | | | | | | | | | | | | | | | | |
| % Total Annual Operating Expense Ratios3 | | | | | | | | | | | Class A | | | Class C | | | Class I | |
Gross | | | | | | | | | | | | | | | 1.03 | % | | | 1.78 | % | | | 0.78 | % |
Net | | | | | | | | | | | | | | | 0.80 | | | | 1.55 | | | | 0.55 | |
| | | | | | |
| | | | | | | | | | | | | | | | | | | | | | | | |
| % Distribution Rates/Yields4 | | | | | | | | | | | Class A | | | Class C | | | Class I | |
Distribution Rate | | | | | | | | | | | | | | | 3.53 | % | | | 2.76 | % | | | 3.73 | % |
SEC 30-day Yield | | | | | | | | | | | | | | | 1.73 | | | | 1.05 | | | | 2.01 | |
Fund Profile
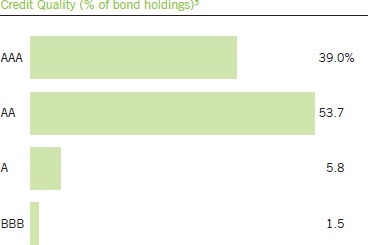
See Endnotes and Additional Disclosures in this report.
Past performance is no guarantee of future results. Returns are historical and are calculated by determining the percentage change in net asset value (NAV) or offering price (as applicable) with all distributions reinvested. Investment return and principal value will fluctuate so that shares, when redeemed, may be worth more or less than their original cost. Performance less than one year is cumulative. Performance is for the stated time period only; due to market volatility, the Fund’s current performance may be lower or higher than quoted. Returns are before taxes unless otherwise noted. For performance as of the most recent month-end, please refer to eatonvance.com.
Eaton Vance
Core Plus Bond Fund
March 31, 2015
Endnotes and Additional Disclosures
| 1 | Barclays Taxable Municipal - Build America Bonds Index is an unmanaged index that measures the Build America Bond component of the Taxable Municipal Index. The Barclays Taxable Municipal - Build America Bonds Index commenced on May 29, 2009. The Since Inception return for the index is calculated from November 30, 2009 as the index only priced monthly at such time. Unless otherwise stated, index returns do not reflect the effect of any applicable sales charges, commissions, expenses, taxes or leverage, as applicable. It is not possible to invest directly in an index. |
| 2 | Total Returns at NAV do not include applicable sales charges. If sales charges were deducted, the returns would be lower. Total Returns shown with maximum sales charge reflect the stated maximum sales charge. Unless otherwise stated, performance does not reflect the deduction of taxes on Fund distributions or redemptions of Fund shares. Performance since inception for an index, if presented, is the performance since the Fund’s or oldest share class’ inception, as applicable. |
| 3 | Source: Fund prospectus. Net expense ratio reflects a contractual expense reimbursement that continues through 1/31/16. Without the reimbursement, if applicable, performance would have been lower. |
| 4 | The Distribution Rate is based on the Fund’s last regular distribution per share in the period (annualized) divided by the Fund’s NAV at the end of the period. The Fund’s distributions may be comprised of amounts characterized for federal income tax purposes as tax-exempt income, qualified and non-qualified ordinary dividends, capital gains and nondividend distributions, also known as return of capital. The Fund will determine the federal income tax character of distributions paid to a shareholder after the end of the calendar year. This is reported on the IRS form 1099-DIV and provided to the shareholder shortly after each year-end. The Fund’s distributions are determined by the investment adviser based on its current assessment of the Fund’s long-term return potential. As portfolio and market conditions change, the rate of distributions paid by the Fund could change. SEC Yield is a standardized measure based on the estimated yield to maturity of a fund’s investments over a 30-day period and is based on the maximum offer price at the date specified. The SEC Yield is not based on the distributions made by the Fund, which may differ. Yield reflects the effect of fee waivers and expense reimbursements. |
| 5 | Ratings are based on Moody’s, S&P or Fitch, as applicable. If securities are rated differently by the ratings agencies, the higher rating is applied. Ratings, which are subject to change, apply to the creditworthiness of the issuers of the underlying securities and not to the Fund or its shares. Credit ratings measure the quality of a bond based on the issuer’s creditworthiness, with ratings ranging from AAA, being the highest, to D, being the lowest based on S&P’s measures. Ratings of BBB or higher by S&P or Fitch (Baa or higher by Moody’s) are considered to be investment-grade quality. Credit ratings are based largely on the ratings agency’s analysis at the time of rating. The rating assigned to any particular security is not necessarily a reflection of the issuer’s current financial condition and does not necessarily reflect its assessment of the volatility of a security’s market value or of the liquidity of an investment in the security. Holdings designated as “Not Rated” are not rated by the national ratings agencies stated above. |
| | Fund profile subject to change due to active management. |
Important Notice to Shareholders
| | Effective May 1, 2015, the Fund changed its name, objective and principal investment strategies and adopted a policy of investing at least 80% of net assets in bonds and other fixed and floating-rate income instruments, including preferred stocks, floating-rate loans and convertible securities. Prior to May 1, 2015, the Fund’s investment team invested at least 80% of the Fund’s net assets in taxable municipal obligations issued pursuant to the American Recovery and Reinvestment Act of 2009 or other legislation providing for the issuance of taxable municipal debt on which the issuer receives federal support (any bonds so issued considered “Build America Bonds”). The Fund expects that the changes described above will be fully implemented by June 30, 2015. |
| | In connection with the foregoing, effective May 1, 2015, (i) the Fund is managed by a team of portfolio managers comprised of Kathleen C. Gaffney, CFA, Thomas H. Luster, CFA, Bernard Scozzafava, CFA, and Matthew T. Buckley, CFA and (ii) the Fund’s primary benchmark is the Barclays U.S. Aggregate Bond Index. |
Eaton Vance
Core Plus Bond Fund
March 31, 2015
Fund Expenses
Example: As a Fund shareholder, you incur two types of costs: (1) transaction costs, including sales charges (loads) on purchases and redemption fees (if applicable); and (2) ongoing costs, including management fees; distribution and/or service fees; and other Fund expenses. This Example is intended to help you understand your ongoing costs (in dollars) of Fund investing and to compare these costs with the ongoing costs of investing in other mutual funds. The Example is based on an investment of $1,000 invested at the beginning of the period and held for the entire period (October 1, 2014 – March 31, 2015).
Actual Expenses: The first section of the table below provides information about actual account values and actual expenses. You may use the information in this section, together with the amount you invested, to estimate the expenses that you paid over the period. Simply divide your account value by $1,000 (for example, an $8,600 account value divided by $1,000 = 8.6), then multiply the result by the number in the first section under the heading entitled “Expenses Paid During Period” to estimate the expenses you paid on your account during this period.
Hypothetical Example for Comparison Purposes: The second section of the table below provides information about hypothetical account values and hypothetical expenses based on the actual Fund expense ratio and an assumed rate of return of 5% per year (before expenses), which is not the actual Fund return. The hypothetical account values and expenses may not be used to estimate the actual ending account balance or expenses you paid for the period. You may use this information to compare the ongoing costs of investing in your Fund and other funds. To do so, compare this 5% hypothetical example with the 5% hypothetical examples that appear in the shareholder reports of the other funds.
Please note that the expenses shown in the table are meant to highlight your ongoing costs only and do not reflect any transactional costs, such as sales charges (loads) or redemption fees (if applicable). Therefore, the second section of the table is useful in comparing ongoing costs only, and will not help you determine the relative total costs of owning different funds. In addition, if these transactional costs were included, your costs would be higher.
| | | | | | | | | | | | | | | | |
| | | Beginning
Account Value
(10/1/14) | | | Ending
Account Value
(3/31/15) | | | Expenses Paid
During Period*
(10/1/14 – 3/31/15) | | | Annualized
Expense
Ratio | |
| | | | |
| | | | | | | | | | | | | | | | |
Actual | | | | | | | | | | | | | |
Class A | | $ | 1,000.00 | | | $ | 1,040.20 | | | $ | 4.58 | ** | | | 0.90 | % |
Class C | | $ | 1,000.00 | | | $ | 1,037.20 | | | $ | 8.38 | ** | | | 1.65 | % |
Class I | | $ | 1,000.00 | | | $ | 1,042.30 | | | $ | 3.26 | ** | | | 0.64 | % |
| | | | | | | | | | | | | | | | | |
| | | | |
| | | | | | | | | | | | | | | | |
Hypothetical | | | | | | | | | | | | | |
(5% return per year before expenses) | | | | | | | | | | | | | |
Class A | | $ | 1,000.00 | | | $ | 1,020.40 | | | $ | 4.53 | ** | | | 0.90 | % |
Class C | | $ | 1,000.00 | | | $ | 1,016.70 | | | $ | 8.30 | ** | | | 1.65 | % |
Class I | | $ | 1,000.00 | | | $ | 1,021.70 | | | $ | 3.23 | ** | | | 0.64 | % |
Effective February 1, 2015, the contractual expense caps of the Fund changed. If these changes had been in place during the entire reporting period, the actual and hypothetical ending account values, expenses paid and annualized expense ratios would have been as follows:
| | | | | | | | | | | | | | | | |
| | | Beginning
Account Value
(10/1/14) | | | Ending
Account Value
(3/31/15) | | | Expenses Paid
During Period*
(10/1/14 – 3/31/15) | | | Annualized
Expense
Ratio | |
| | | | |
| | | | | | | | | | | | | | | | |
Actual | | | | | | | | | | | | | |
Class A | | $ | 1,000.00 | | | $ | 1,040.20 | | | $ | 4.07 | ** | | | 0.80 | % |
Class C | | $ | 1,000.00 | | | $ | 1,037.20 | | | $ | 7.87 | ** | | | 1.55 | % |
Class I | | $ | 1,000.00 | | | $ | 1,042.30 | | | $ | 2.80 | ** | | | 0.55 | % |
| | | | | | | | | | | | | | | | | |
| | | | |
| | | | | | | | | | | | | | | | |
Hypothetical | | | | | | | | | | | | | |
(5% return per year before expenses) | | | | | | | | | | | | | |
Class A | | $ | 1,000.00 | | | $ | 1,020.90 | | | $ | 4.03 | ** | | | 0.80 | % |
Class C | | $ | 1,000.00 | | | $ | 1,017.20 | | | $ | 7.80 | ** | | | 1.55 | % |
Class I | | $ | 1,000.00 | | | $ | 1,022.20 | | | $ | 2.77 | ** | | | 0.55 | % |
| * | Expenses are equal to the Fund’s annualized expense ratio for the indicated Class, multiplied by the average account value over the period, multiplied by 182/365 (to reflect the one-half year period). The Example assumes that the $1,000 was invested at the net asset value per share determined at the close of business on September 30, 2014. |
| ** | Absent an allocation of certain expenses to an affiliate, expenses would be higher. |
Eaton Vance
Core Plus Bond Fund
March 31, 2015
Portfolio of Investments (Unaudited)
| | | | | | | | |
| Taxable Municipal Securities — 81.8%(1) | |
| | |
| | | | | | | | |
| Security | | Principal
Amount
(000’s omitted) | | | Value | |
| | | | | | | | |
| | |
Education — 6.3% | | | | | | | | |
University of Michigan, 6.172%, 4/1/30 | | $ | 530 | | | $ | 599,759 | |
University of North Carolina at Chapel Hill, 3.847%, 12/1/34(2) | | | 1,500 | | | | 1,606,725 | |
University of Texas, 6.276%, 8/15/41 | | | 1,775 | | | | 2,034,647 | |
| | | | | | | | | |
| | | | | | $ | 4,241,131 | |
| | | | | | | | | |
| | |
Electric Utilities — 5.5% | | | | | | | | |
Los Angeles, CA, Department of Water and Power, 6.166%, 7/1/40 | | $ | 740 | | | $ | 853,753 | |
Northern Illinois Municipal Power Agency, 7.62%, 1/1/30 | | | 1,000 | | | | 1,224,270 | |
San Antonio, TX, Electric & Gas Revenue, 6.168%, 2/1/41 | | | 1,440 | | | | 1,645,157 | |
| | | | | | | | | |
| | | | | | $ | 3,723,180 | |
| | | | | | | | | |
| | |
General Obligations — 31.5% | | | | | | | | |
Ann Arbor, MI, 5.40%, 5/1/23 | | $ | 1,000 | | | $ | 1,123,610 | |
California, 7.70%, 11/1/30 | | | 1,000 | | | | 1,258,090 | |
Commonwealth of Pennsylvania, 5.85%, 7/15/30 | | | 1,705 | | | | 1,957,101 | |
Dallas, TX, Independent School District, (PSF Guaranteed), 6.45%, 2/15/35 | | | 2,040 | | | | 2,450,326 | |
Denton County, TX, 5.968%, 7/15/35 | | | 1,020 | | | | 1,157,465 | |
Denver, CO, 5.65%, 8/1/30 | | | 1,250 | | | | 1,458,113 | |
Florida, State Board of Education, 5.50%, 6/1/27 | | | 1,000 | | | | 1,116,710 | |
Massachusetts, 4.50%, 8/1/31 | | | 1,305 | | | | 1,466,063 | |
New York, NY, 6.646%, 12/1/31 | | | 1,270 | | | | 1,522,095 | |
San Mateo Union High School District, CA, 6.733%, 9/1/34 | | | 1,400 | | | | 1,674,918 | |
Santa Monica, CA, Community College District, 6.763%, 8/1/34 | | | 1,250 | | | | 1,493,738 | |
Shelby County, TN, 5.75%, 4/1/34 | | | 385 | | | | 429,240 | |
Southwest Regional Sanitary Sewer & Water Authority, MI, 6.50%, 4/1/40 | | | 805 | | | | 932,890 | |
Texas, (Texas Transportation Commission), 4.631%, 4/1/33 | | | 1,645 | | | | 1,917,692 | |
Utah, 3.539%, 7/1/25 | | | 1,200 | | | | 1,296,408 | |
| | | | | | | | | |
| | | | | | $ | 21,254,459 | |
| | | | | | | | | |
| | |
Hospital — 1.2% | | | | | | | | |
King County, WA, Public Hospital District No. 1, 7.90%, 6/15/30 | | $ | 250 | | | $ | 282,877 | |
King County, WA, Public Hospital District No. 1, 8.00%, 6/15/40 | | | 500 | | | | 558,370 | |
| | | | | | | | | |
| | | | | | $ | 841,247 | |
| | | | | | | | | |
| | |
Lease Revenue / Certificates of Participation — 3.6% | | | | | | | | |
North Carolina Turnpike Authority, (Triangle Expressway System), 6.70%, 1/1/39 | | $ | 1,615 | | | $ | 1,845,073 | |
Oregon Department of Administrative Services, 6.18%, 5/1/35 | | | 500 | | | | 571,505 | |
| | | | | | | | | |
| | | | | | $ | 2,416,578 | |
| | | | | | | | | |
| | | | | | | | |
| Security | | Principal
Amount
(000’s omitted) | | | Value | |
| | | | | | | | |
| | |
Other Revenue — 5.8% | | | | | | | | |
Battery Park City Authority, NY, 6.375%, 11/1/39 | | $ | 1,335 | | | $ | 1,535,811 | |
Florida State Board of Education, Lottery Revenue, 6.584%, 7/1/29 | | | 440 | | | | 506,761 | |
New York, NY, Transitional Finance Authority, (Building Aid), 7.128%, 7/15/30 | | | 1,500 | | | | 1,863,975 | |
| | | | | | | | | |
| | | | | | $ | 3,906,547 | |
| | | | | | | | | |
| | |
Special Tax Revenue — 12.2% | | | | | | | | |
Dallas, TX, Area Rapid Transit, 6.249%, 12/1/34 | | $ | 1,265 | | | $ | 1,448,261 | |
Iowa, Special Obligation, 6.75%, 6/1/34 | | | 1,250 | | | | 1,458,925 | |
Kansas Department of Transportation, 4.596%, 9/1/35 | | | 1,500 | | | | 1,705,590 | |
Miami-Dade County, FL, Transit Sales Surtax Revenue, 6.71%, 7/1/29 | | | 1,105 | | | | 1,262,009 | |
New York Dormitory Authority, Personal Income Tax Revenue, 5.50%, 3/15/30 | | | 1,000 | | | | 1,205,160 | |
New York, NY, Transitional Finance Authority, Future Tax Revenue, 5.882%, 11/1/31 | | | 1,035 | | | | 1,180,407 | |
| | | | | | | | | |
| | | | | | $ | 8,260,352 | |
| | | | | | | | | |
| | |
Transportation — 5.3% | | | | | | | | |
New Jersey Transportation Trust Fund Authority, 6.104%, 12/15/28 | | $ | 1,775 | | | $ | 1,976,143 | |
Port of Seattle, WA, 7.00%, 5/1/36(2) | | | 1,395 | | | | 1,628,941 | |
| | | | | | | | | |
| | | | | | $ | 3,605,084 | |
| | | | | | | | | |
| | |
Water and Sewer — 10.4% | | | | | | | | |
Chesapeake, VA, Water and Sewer Revenue, 6.283%, 7/1/40 | | $ | 775 | | | $ | 889,987 | |
Hamilton County, OH, Sewer System Revenue, 6.50%, 12/1/34 | | | 1,020 | | | | 1,185,434 | |
Jea, FL, Water and Sewer Revenue, 6.21%, 10/1/33 | | | 100 | | | | 123,516 | |
Knoxville, TN, Wastewater System Revenue, 6.50%, 4/1/43 | | | 570 | | | | 665,446 | |
Metropolitan Water District of Southern California, 6.538%, 7/1/39 | | | 1,540 | | | | 1,780,425 | |
New York, NY, Municipal Water Finance Authority, 6.452%, 6/15/41 | | | 1,025 | | | | 1,199,680 | |
Northeast Ohio Regional Sewer District, 6.038%, 11/15/40 | | | 1,000 | | | | 1,159,430 | |
| | | | | | | | | |
| | | | | | $ | 7,003,918 | |
| | | | | | | | | |
| | |
Total Taxable Municipal Securities — 81.8%
(identified cost $51,102,498) | | | | | | $ | 55,252,496 | |
| | | | | | | | | |
| | | | |
| | 5 | | See Notes to Financial Statements. |
Eaton Vance
Core Plus Bond Fund
March 31, 2015
Portfolio of Investments (Unaudited) — continued
| | | | | | | | |
| Short-Term Investments — 17.1% | |
| | |
| | | | | | | | |
| Description | | Interest
(000’s omitted) | | | Value | |
| | | | | | | | |
Eaton Vance Cash Reserves Fund, LLC, 0.18%(3) | | $ | 11,590 | | | $ | 11,589,920 | |
| | | | | | | | | |
| | |
Total Short-Term Investments
(identified cost $11,589,920) | | | | | | $ | 11,589,920 | |
| | | | | | | | | |
| | |
Total Investments — 98.9%
(identified cost $62,692,418) | | | | | | $ | 66,842,416 | |
| | | | | | | | | |
| | |
Other Assets, Less Liabilities — 1.1% | | | | | | $ | 715,241 | |
| | | | | | | | | |
| | |
Net Assets — 100.0% | | | | | | $ | 67,557,657 | |
| | | | | | | | | |
The percentage shown for each investment category in the Portfolio of Investments is based on net assets.
| | | | |
| PSF | | – | | Permanent School Fund |
At March 31, 2015, the concentration of the Fund’s investments in the various states, determined as a percentage of net assets, is as follows:
| | | | |
| Texas | | | 15.8% | |
| New York | | | 12.6% | |
| California | | | 10.4% | |
| Others, representing less than 10% individually | | | 43.0% | |
| (1) | Build America Bonds (unless otherwise noted). Represent taxable municipal obligations issued pursuant to the America Recovery and Reinvestment Act of 2009 or other legislation providing for the issuance of taxable municipal debt on which the issuer receives federal support. |
| (2) | Non-Build America Bond. |
| (3) | Affiliated investment company, available to Eaton Vance portfolios and funds, which invests in high quality, U.S. dollar denominated money market instruments. The rate shown is the annualized seven-day yield as of March 31, 2015. |
| | | | |
| | 6 | | See Notes to Financial Statements. |
Eaton Vance
Core Plus Bond Fund
March 31, 2015
Statement of Assets and Liabilities (Unaudited)
| | | | |
| Assets | | March 31, 2015 | |
Unaffiliated investments, at value (identified cost, $51,102,498) | | $ | 55,252,496 | |
Affiliated investment, at value (identified cost, $11,589,920) | | | 11,589,920 | |
Interest receivable | | | 801,607 | |
Interest receivable from affiliated investment | | | 1,454 | |
Receivable for Fund shares sold | | | 164,744 | |
Receivable from affiliate | | | 18,380 | |
Total assets | | $ | 67,828,601 | |
|
| Liabilities | |
Payable for Fund shares redeemed | | $ | 206,667 | |
Distributions payable | | | 13,007 | |
Payable to affiliates: | | | | |
Investment adviser fee | | | 25,172 | |
Distribution and service fees | | | 15,191 | |
Accrued expenses | | | 10,907 | |
Total liabilities | | $ | 270,944 | |
Net Assets | | $ | 67,557,657 | |
|
| Sources of Net Assets | |
Paid-in capital | | $ | 66,282,264 | |
Accumulated net realized loss | | | (2,626,830 | ) |
Accumulated distributions in excess of net investment income | | | (247,775 | ) |
Net unrealized appreciation | | | 4,149,998 | |
Net Assets | | $ | 67,557,657 | |
|
| Class A Shares | |
Net Assets | | $ | 20,883,237 | |
Shares Outstanding | | | 1,737,281 | |
Net Asset Value and Redemption Price Per Share | | | | |
(net assets ÷ shares of beneficial interest outstanding) | | $ | 12.02 | |
Maximum Offering Price Per Share | | | | |
(100 ÷ 95.25 of net asset value per share) | | $ | 12.62 | |
|
| Class C Shares | |
Net Assets | | $ | 12,686,787 | |
Shares Outstanding | | | 1,055,822 | |
Net Asset Value and Offering Price Per Share* | | | | |
(net assets ÷ shares of beneficial interest outstanding) | | $ | 12.02 | |
|
| Class I Shares | |
Net Assets | | $ | 33,987,633 | |
Shares Outstanding | | | 2,828,455 | |
Net Asset Value, Offering Price and Redemption Price Per Share | | | | |
(net assets ÷ shares of beneficial interest outstanding) | | $ | 12.02 | |
On sales of $50,000 or more, the offering price of Class A shares is reduced.
| * | Redemption price per share is equal to the net asset value less any applicable contingent deferred sales charge. |
| | | | |
| | 7 | | See Notes to Financial Statements. |
Eaton Vance
Core Plus Bond Fund
March 31, 2015
Statement of Operations (Unaudited)
| | | | |
| Investment Income | | Six Months Ended March 31, 2015 | |
Interest | | $ | 1,141,291 | |
Interest allocated from affiliated investment | | | 5,710 | |
Expenses allocated from affiliated investment | | | (633 | ) |
Total investment income | | $ | 1,146,368 | |
|
| Expenses | |
Investment adviser fee | | $ | 159,018 | |
Distribution and service fees | | | | |
Class A | | | 25,669 | |
Class C | | | 57,943 | |
Trustees’ fees and expenses | | | 1,723 | |
Custodian fee | | | 14,331 | |
Transfer and dividend disbursing agent fees | | | 18,122 | |
Legal and accounting services | | | 18,927 | |
Printing and postage | | | 13,077 | |
Registration fees | | | 25,101 | |
Miscellaneous | | | 8,296 | |
Total expenses | | $ | 342,207 | |
Deduct — | | | | |
Allocation of expenses to affiliate | | $ | 71,109 | |
Total expense reductions | | $ | 71,109 | |
| |
Net expenses | | $ | 271,098 | |
| |
Net investment income | | $ | 875,270 | |
| |
| Realized and Unrealized Gain (Loss) | | | | |
Net realized gain (loss) — | | | | |
Investment transactions allocated from affiliated investment | | $ | 19 | |
Net realized gain | | $ | 19 | |
Change in unrealized appreciation (depreciation) — | | | | |
Investments | | $ | 1,281,732 | |
Net change in unrealized appreciation (depreciation) | | $ | 1,281,732 | |
| |
Net realized and unrealized gain | | $ | 1,281,751 | |
| |
Net increase in net assets from operations | | $ | 2,157,021 | |
| | | | |
| | 8 | | See Notes to Financial Statements. |
Eaton Vance
Core Plus Bond Fund
March 31, 2015
Statements of Changes in Net Assets
| | | | | | | | |
| Increase (Decrease) in Net Assets | | Six Months Ended March 31, 2015
(Unaudited) | | | Year Ended September 30, 2014 | |
From operations — | | | | | | | | |
Net investment income | | $ | 875,270 | | | $ | 1,683,162 | |
Net realized gain (loss) from investment transactions | | | 19 | | | | (640,790 | ) |
Net change in unrealized appreciation (depreciation) from investments | | | 1,281,732 | | | | 1,888,618 | |
Net increase in net assets from operations | | $ | 2,157,021 | | | $ | 2,930,990 | |
Distributions to shareholders — | | | | | | | | |
From net investment income | | | | | | | | |
Class A | | $ | (395,617 | ) | | $ | (970,028 | ) |
Class C | | | (179,322 | ) | | | (468,894 | ) |
Class I | | | (532,236 | ) | | | (715,538 | ) |
Total distributions to shareholders | | $ | (1,107,175 | ) | | $ | (2,154,460 | ) |
Transactions in shares of beneficial interest — | | | | | | | | |
Proceeds from sale of shares | | | | | | | | |
Class A | | $ | 6,043,833 | | | $ | 3,520,032 | |
Class C | | | 2,645,869 | | | | 1,448,305 | |
Class I | | | 17,044,035 | | | | 15,090,587 | |
Net asset value of shares issued to shareholders in payment of distributions declared | | | | | | | | |
Class A | | | 374,422 | | | | 908,109 | |
Class C | | | 141,932 | | | | 344,823 | |
Class I | | | 507,313 | | | | 653,096 | |
Cost of shares redeemed | | | | | | | | |
Class A | | | (4,105,916 | ) | | | (13,663,756 | ) |
Class C | | | (915,536 | ) | | | (10,298,260 | ) |
Class I | | | (2,646,636 | ) | | | (16,072,342 | ) |
Net increase (decrease) in net assets from Fund share transactions | | $ | 19,089,316 | | | $ | (18,069,406 | ) |
| | |
Net increase (decrease) in net assets | | $ | 20,139,162 | | | $ | (17,292,876 | ) |
|
| Net Assets | |
At beginning of period | | $ | 47,418,495 | | | $ | 64,711,371 | |
At end of period | | $ | 67,557,657 | | | $ | 47,418,495 | |
|
Accumulated distributions in excess of net investment income included in net assets | |
At end of period | | $ | (247,775 | ) | | $ | (15,870 | ) |
| | | | |
| | 9 | | See Notes to Financial Statements. |
Eaton Vance
Core Plus Bond Fund
March 31, 2015
Financial Highlights
| | | | | | | | | | | | | | | | | | | | | | | | |
| | | Class A | |
| | | Six Months Ended
March 31, 2015
(Unaudited) | | | Year Ended September 30, | | | Period Ended September 30, 2011(1) | | | Period Ended October 31, 2010(2) | |
| | | | 2014 | | | 2013 | | | 2012 | | | |
Net asset value — Beginning of period | | $ | 11.780 | | | $ | 11.520 | | | $ | 12.600 | | | $ | 12.040 | | | $ | 10.840 | | | $ | 10.000 | |
| | | | | | |
| Income (Loss) From Operations | | | | | | | | | | | | | | | | | | | | | | | | |
Net investment income(3) | | $ | 0.182 | | | $ | 0.420 | | | $ | 0.415 | | | $ | 0.430 | | | $ | 0.469 | | | $ | 0.455 | |
Net realized and unrealized gain (loss) | | | 0.289 | | | | 0.372 | | | | (0.888 | ) | | | 0.627 | | | | 1.216 | | | | 0.796 | |
| | | | | | |
Total income (loss) from operations | | $ | 0.471 | | | $ | 0.792 | | | $ | (0.473 | ) | | $ | 1.057 | | | $ | 1.685 | | | $ | 1.251 | |
| | | | | | |
| Less Distributions | | | | | | | | | | | | | | | | | | | | | | | | |
From net investment income | | $ | (0.231 | ) | | $ | (0.532 | ) | | $ | (0.530 | ) | | $ | (0.497 | ) | | $ | (0.481 | ) | | $ | (0.411 | ) |
From net realized gain | | | — | | | | — | | | | (0.077 | ) | | | — | | | | (0.004 | ) | | | — | |
| | | | | | |
Total distributions | | $ | (0.231 | ) | | $ | (0.532 | ) | | $ | (0.607 | ) | | $ | (0.497 | ) | | $ | (0.485 | ) | | $ | (0.411 | ) |
| | | | | | |
Net asset value — End of period | | $ | 12.020 | | | $ | 11.780 | | | $ | 11.520 | | | $ | 12.600 | | | $ | 12.040 | | | $ | 10.840 | |
| | | | | | |
Total Return(4) | | | 4.02 | %(5) | | | 7.06 | % | | | (3.94 | )% | | | 8.96 | % | | | 16.18 | %(5) | | | 12.64 | %(5) |
| | | | | | |
| Ratios/Supplemental Data | | | | | | | | | | | | | | | | | | | | | | | | |
Net assets, end of period (000’s omitted) | | $ | 20,883 | | | $ | 18,176 | | | $ | 27,061 | | | $ | 44,175 | | | $ | 23,327 | | | $ | 26,862 | |
Ratios (as a percentage of average daily net assets): | | | | | | | | | | | | | | | | | | | | | | | | |
Expenses(6) | | | 0.90 | %(7) | | | 0.95 | % | | | 0.95 | % | | | 0.95 | % | | | 0.95 | %(7)(8) | | | 0.95 | %(7)(8) |
Net investment income | | | 3.05 | %(7) | | | 3.64 | % | | | 3.37 | % | | | 3.50 | % | | | 4.79 | %(7)(8) | | | 4.38 | %(7)(8) |
Portfolio Turnover of the Portfolio(9) | | | — | | | | — | | | | — | | | | — | | | | 22 | %(5) | | | 1 | %(5) |
Portfolio Turnover of the Fund | | | 0 | % | | | 0 | %(10) | | | 19 | % | | | 24 | % | | | 10 | %(5)(11) | | | — | |
| (1) | For the eleven months ended September 30, 2011. The Fund changed its fiscal year end from October 31 to September 30. |
| (2) | For the period from the start of business, November 17, 2009, to October 31, 2010. |
| (3) | Computed using average shares outstanding. |
| (4) | Returns are historical and are calculated by determining the percentage change in net asset value with all distributions reinvested and do not reflect the effect of sales charges. |
| (6) | The investment adviser of the Portfolio or Fund and administrator subsidized certain operating expenses (equal to 0.24%, 0.23%, 0.22%, 0.19%, 0.41% and 1.16% of average daily net assets for the six months ended March 31, 2015, the years ended September 30, 2014, 2013 and 2012, the period ended September 30, 2011 and the period from the start of business, November 17, 2009, to October 31, 2010, respectively). Absent this subsidy, total return would be lower. |
| (8) | Includes the Fund’s share of the Portfolio’s allocated expenses for the period while the Fund was investing in the Portfolio. |
| (9) | Portfolio turnover represents the rate of portfolio activity for the period while the Fund was investing in the Portfolio. |
| (10) | Amount is less than 1%. |
| (11) | For the period from March 1, 2011 through September 30, 2011 when the Fund was making investments directly in securities. |
References to Portfolio herein are to Build America Bond Portfolio, a Massachusetts business trust having the same investment objective and policies as the Fund, in which the Fund invested all of its investable assets prior to March 1, 2011.
| | | | |
| | 10 | | See Notes to Financial Statements. |
Eaton Vance
Core Plus Bond Fund
March 31, 2015
Financial Highlights — continued
| | | | | | | | | | | | | | | | | | | | | | | | |
| | | Class C | |
| | | Six Months Ended
March 31, 2015
(Unaudited) | | | Year Ended September 30, | | | Period Ended September 30, 2011(1) | | | Period Ended October 31, 2010(2) | |
| | | | 2014 | | | 2013 | | | 2012 | | | |
Net asset value — Beginning of period | | $ | 11.770 | | | $ | 11.520 | | | $ | 12.600 | | | $ | 12.040 | | | $ | 10.840 | | | $ | 10.000 | |
| | | | | | |
| Income (Loss) From Operations | | | | | | | | | | | | | | | | | | | | | | | | |
Net investment income(3) | | $ | 0.137 | | | $ | 0.334 | | | $ | 0.323 | | | $ | 0.337 | | | $ | 0.396 | | | $ | 0.371 | |
Net realized and unrealized gain (loss) | | | 0.298 | | | | 0.362 | | | | (0.888 | ) | | | 0.627 | | | | 1.215 | | | | 0.819 | |
| | | | | | |
Total income (loss) from operations | | $ | 0.435 | | | $ | 0.696 | | | $ | (0.565 | ) | | $ | 0.964 | | | $ | 1.611 | | | $ | 1.190 | |
| | | | | | |
| Less Distributions | | | | | | | | | | | | | | | | | | | | | | | | |
From net investment income | | $ | (0.185 | ) | | $ | (0.446 | ) | | $ | (0.438 | ) | | $ | (0.404 | ) | | $ | (0.407 | ) | | $ | (0.350 | ) |
From net realized gain | | | — | | | | — | | | | (0.077 | ) | | | — | | | | (0.004 | ) | | | — | |
| | | | | | |
Total distributions | | $ | (0.185 | ) | | $ | (0.446 | ) | | $ | (0.515 | ) | | $ | (0.404 | ) | | $ | (0.411 | ) | | $ | (0.350 | ) |
| | | | | | |
Net asset value — End of period | | $ | 12.020 | | | $ | 11.770 | | | $ | 11.520 | | | $ | 12.600 | | | $ | 12.040 | | | $ | 10.840 | |
| | | | | | |
Total Return(4) | | | 3.72 | %(5) | | | 6.17 | % | | | (4.65 | )% | | | 8.14 | % | | | 15.50 | %(5) | | | 11.91 | %(5) |
| | | | | | |
| Ratios/Supplemental Data | | | | | | | | | | | | | | | | | | | | | | | | |
Net assets, end of period (000’s omitted) | | $ | 12,687 | | | $ | 10,594 | | | $ | 18,946 | | | $ | 35,407 | | | $ | 13,684 | | | $ | 13,003 | |
Ratios (as a percentage of average daily net assets): | | | | | | | | | | | | | | | | | | | | | | | | |
Expenses(6) | | | 1.65 | %(7) | | | 1.70 | % | | | 1.70 | % | | | 1.70 | % | | | 1.70 | %(7)(8) | | | 1.70 | %(7)(8) |
Net investment income | | | 2.30 | %(7) | | | 2.90 | % | | | 2.62 | % | | | 2.74 | % | | | 4.05 | %(7)(8) | | | 3.56 | %(7)(8) |
Portfolio Turnover of the Portfolio(9) | | | — | | | | — | | | | — | | | | — | | | | 22 | %(5) | | | 1 | %(5) |
Portfolio Turnover of the Fund | | | 0 | % | | | 0 | %(10) | | | 19 | % | | | 24 | % | | | 10 | %(5)(11) | | | — | |
| (1) | For the eleven months ended September 30, 2011. The Fund changed its fiscal year end from October 31 to September 30. |
| (2) | For the period from the start of business, November 17, 2009, to October 31, 2010. |
| (3) | Computed using average shares outstanding. |
| (4) | Returns are historical and are calculated by determining the percentage change in net asset value with all distributions reinvested and do not reflect the effect of sales charges. |
| (6) | The investment adviser of the Portfolio or Fund and administrator subsidized certain operating expenses (equal to 0.24%, 0.23%, 0.22%, 0.19%, 0.41% and 1.16% of average daily net assets for the six months ended March 31, 2015, the years ended September 30, 2014, 2013 and 2012, the period ended September 30, 2011 and the period from the start of business, November 17, 2009, to October 31, 2010, respectively). Absent this subsidy, total return would be lower. |
| (8) | Includes the Fund’s share of the Portfolio’s allocated expenses for the period while the Fund was investing in the Portfolio. |
| (9) | Portfolio turnover represents the rate of portfolio activity for the period while the Fund was investing in the Portfolio. |
| (10) | Amount is less than 1%. |
| (11) | For the period from March 1, 2011 through September 30, 2011 when the Fund was making investments directly in securities. |
References to Portfolio herein are to Build America Bond Portfolio, a Massachusetts business trust having the same investment objective and policies as the Fund, in which the Fund invested all of its investable assets prior to March 1, 2011.
| | | | |
| | 11 | | See Notes to Financial Statements. |
Eaton Vance
Core Plus Bond Fund
March 31, 2015
Financial Highlights — continued
| | | | | | | | | | | | | | | | | | | | | | | | |
| | | Class I | |
| | | Six Months Ended
March 31, 2015
(Unaudited) | | | Year Ended September 30, | | | Period Ended September 30, 2011(1) | | | Period Ended October 31, 2010(2) | |
| | | | 2014 | | | 2013 | | | 2012 | | | |
Net asset value — Beginning of period | | $ | 11.770 | | | $ | 11.520 | | | $ | 12.600 | | | $ | 12.050 | | | $ | 10.840 | | | $ | 10.000 | |
| | | | | | |
| Income (Loss) From Operations | | | | | | | | | | | | | | | | | | | | | | | | |
Net investment income(3) | | $ | 0.194 | | | $ | 0.447 | | | $ | 0.447 | | | $ | 0.458 | | | $ | 0.495 | | | $ | 0.460 | |
Net realized and unrealized gain (loss) | | | 0.301 | | | | 0.364 | | | | (0.889 | ) | | | 0.620 | | | | 1.225 | | | | 0.808 | |
| | | | | | |
Total income (loss) from operations | | $ | 0.495 | | | $ | 0.811 | | | $ | (0.442 | ) | | $ | 1.078 | | | $ | 1.720 | | | $ | 1.268 | |
| | | | | | |
| Less Distributions | | | | | | | | | | | | | | | | | | | | | | | | |
From net investment income | | $ | (0.245 | ) | | $ | (0.561 | ) | | $ | (0.561 | ) | | $ | (0.528 | ) | | $ | (0.506 | ) | | $ | (0.428 | ) |
From net realized gain | | | — | | | | — | | | | (0.077 | ) | | | — | | | | (0.004 | ) | | | — | |
| | | | | | |
Total distributions | | $ | (0.245 | ) | | $ | (0.561 | ) | | $ | (0.638 | ) | | $ | (0.528 | ) | | $ | (0.510 | ) | | $ | (0.428 | ) |
| | | | | | |
Net asset value — End of period | | $ | 12.020 | | | $ | 11.770 | | | $ | 11.520 | | | $ | 12.600 | | | $ | 12.050 | | | $ | 10.840 | |
| | | | | | |
Total Return(4) | | | 4.23 | %(5) | | | 7.23 | % | | | (3.70 | )% | | | 9.14 | % | | | 16.55 | %(5) | | | 12.81 | %(5) |
| | | | | | |
| Ratios/Supplemental Data | | | | | | | | | | | | | | | | | | | | | | | | |
Net assets, end of period (000’s omitted) | | $ | 33,988 | | | $ | 18,648 | | | $ | 18,704 | | | $ | 40,486 | | | $ | 12,939 | | | $ | 14,001 | |
Ratios (as a percentage of average daily net assets): | | | | | | | | | | | | | | | | | | | | | | | | |
Expenses(6) | | | 0.64 | %(7) | | | 0.70 | % | | | 0.70 | % | | | 0.70 | % | | | 0.70 | %(7)(8) | | | 0.70 | %(7)(8) |
Net investment income | | | 3.26 | %(7) | | | 3.87 | % | | | 3.62 | % | | | 3.70 | % | | | 5.07 | %(7)(8) | | | 4.45 | %(7)(8) |
Portfolio Turnover of the Portfolio(9) | | | — | | | | — | | | | — | | | | — | | | | 22 | %(5) | | | 1 | %(5) |
Portfolio Turnover of the Fund | | | 0 | % | | | 0 | %(10) | | | 19 | % | | | 24 | % | | | 10 | %(5)(11) | | | — | |
| (1) | For the eleven months ended September 30, 2011. The Fund changed its fiscal year end from October 31 to September 30. |
| (2) | For the period from the start of business, November 17, 2009, to October 31, 2010. |
| (3) | Computed using average shares outstanding. |
| (4) | Returns are historical and are calculated by determining the percentage change in net asset value with all distributions reinvested. |
| (6) | The investment adviser of the Portfolio or Fund and administrator subsidized certain operating expenses (equal to 0.24%, 0.23%, 0.22%, 0.19%, 0.41% and 1.16% of average daily net assets for the six months ended March 31, 2015, the years ended September 30, 2014, 2013 and 2012, the period ended September 30, 2011 and the period from the start of business, November 17, 2009, to October 31, 2010, respectively). Absent this subsidy, total return would be lower. |
| (8) | Includes the Fund’s share of the Portfolio’s allocated expenses for the period while the Fund was investing in the Portfolio. |
| (9) | Portfolio turnover represents the rate of portfolio activity for the period while the Fund was investing in the Portfolio. |
| (10) | Amount is less than 1%. |
| (11) | For the period from March 1, 2011 through September 30, 2011 when the Fund was making investments directly in securities. |
References to Portfolio herein are to Build America Bond Portfolio, a Massachusetts business trust having the same investment objective and policies as the Fund, in which the Fund invested all of its investable assets prior to March 1, 2011.
| | | | |
| | 12 | | See Notes to Financial Statements. |
Eaton Vance
Core Plus Bond Fund
March 31, 2015
Notes to Financial Statements (Unaudited)
1 Significant Accounting Policies
Eaton Vance Core Plus Bond Fund (formerly, Eaton Vance Build America Bond Fund) (the Fund) is a diversified series of Eaton Vance Mutual Funds Trust (the Trust). The Trust is a Massachusetts business trust registered under the Investment Company Act of 1940, as amended (the 1940 Act), as an open-end management investment company. The Fund’s primary investment objective is current income and its secondary objective is capital appreciation. Effective May 1, 2015, the Fund’s investment objective changed (see Note 11). The Fund offers three classes of shares. Class A shares are generally sold subject to a sales charge imposed at time of purchase. Class C shares are sold at net asset value and are generally subject to a contingent deferred sales charge (see Note 5). Class I shares are sold at net asset value and are not subject to a sales charge. Each class represents a pro-rata interest in the Fund, but votes separately on class-specific matters and (as noted below) is subject to different expenses. Realized and unrealized gains and losses are allocated daily to each class of shares based on the relative net assets of each class to the total net assets of the Fund. Net investment income, other than class-specific expenses, is allocated daily to each class of shares based upon the ratio of the value of each class’s paid shares to the total value of all paid shares. Each class of shares differs in its distribution plan and certain other class-specific expenses.
The following is a summary of significant accounting policies of the Fund. The policies are in conformity with accounting principles generally accepted in the United States of America (U.S. GAAP). The Fund is an investment company and follows accounting and reporting guidance in the Financial Accounting Standards Board (“FASB”) Accounting Standards Codification Topic 946.
A Investment Valuation — The following methodologies are used to determine the market value or fair value of investments.
Debt Obligations. Debt obligations (including short-term obligations with a remaining maturity of more than sixty days) are generally valued on the basis of valuations provided by third party pricing services, as derived from such services’ pricing models. Inputs to the models may include, but are not limited to, reported trades, executable bid and asked prices, broker/dealer quotations, prices or yields of securities with similar characteristics, interest rates, anticipated prepayments, benchmark curves or information pertaining to the issuer, as well as industry and economic events. The pricing services may use a matrix approach, which considers information regarding securities with similar characteristics to determine the valuation for a security. Short-term obligations purchased with a remaining maturity of sixty days or less are generally valued at amortized cost, which approximates market value.
Affiliated Fund. The Fund may invest in Eaton Vance Cash Reserves Fund, LLC (Cash Reserves Fund), an affiliated investment company managed by Eaton Vance Management (EVM). The value of the Fund’s investment in Cash Reserves Fund reflects the Fund’s proportionate interest in its net assets. Cash Reserves Fund generally values its investment securities utilizing the amortized cost valuation technique in accordance with Rule 2a-7 under the 1940 Act. This technique involves initially valuing a portfolio security at its cost and thereafter assuming a constant amortization to maturity of any discount or premium. If amortized cost is determined not to approximate fair value, Cash Reserves Fund may value its investment securities in the same manner as debt obligations described above.
Fair Valuation. Investments for which valuations or market quotations are not readily available or are deemed unreliable are valued at fair value using methods determined in good faith by or at the direction of the Trustees of the Fund in a manner that fairly reflects the security’s value, or the amount that the Fund might reasonably expect to receive for the security upon its current sale in the ordinary course. Each such determination is based on a consideration of relevant factors, which are likely to vary from one pricing context to another. These factors may include, but are not limited to, the type of security, the existence of any contractual restrictions on the security’s disposition, the price and extent of public trading in similar securities of the issuer or of comparable entities, quotations or relevant information obtained from broker/dealers or other market participants, information obtained from the issuer, analysts, and/or the appropriate stock exchange (for exchange-traded securities), an analysis of the entity’s financial condition, and an evaluation of the forces that influence the issuer and the market(s) in which the security is purchased and sold.
B Investment Transactions — Investment transactions for financial statement purposes are accounted for on a trade date basis. Realized gains and losses on investments sold are determined on the basis of identified cost.
C Income — Interest income is recorded on the basis of interest accrued, adjusted for amortization of premium or accretion of discount.
D Federal Taxes — The Fund’s policy is to comply with the provisions of the Internal Revenue Code applicable to regulated investment companies and to distribute to shareholders each year substantially all of its net investment income, and all or substantially all of its net realized capital gains. Accordingly, no provision for federal income or excise tax is necessary.
As of March 31, 2015, the Fund had no uncertain tax positions that would require financial statement recognition, de-recognition, or disclosure. The Fund files a U.S. federal income tax return annually after its fiscal year-end, which is subject to examination by the Internal Revenue Service for a period of three years from the date of filing.
E Expenses — The majority of expenses of the Trust are directly identifiable to an individual fund. Expenses which are not readily identifiable to a specific fund are allocated taking into consideration, among other things, the nature and type of expense and the relative size of the funds.
F Expense Reduction — State Street Bank and Trust Company (SSBT) serves as custodian of the Fund. Pursuant to the custodian agreement, SSBT receives a fee reduced by credits, which are determined based on the average daily cash balance the Fund maintains with SSBT. All credit balances, if any, used to reduce the Fund’s custodian fees are reported as a reduction of expenses in the Statement of Operations.
Eaton Vance
Core Plus Bond Fund
March 31, 2015
Notes to Financial Statements (Unaudited) — continued
G Use of Estimates — The preparation of the financial statements in conformity with U.S. GAAP requires management to make estimates and assumptions that affect the reported amounts of assets and liabilities at the date of the financial statements and the reported amounts of income and expense during the reporting period. Actual results could differ from those estimates.
H Indemnifications — Under the Trust’s organizational documents, its officers and Trustees may be indemnified against certain liabilities and expenses arising out of the performance of their duties to the Fund. Under Massachusetts law, if certain conditions prevail, shareholders of a Massachusetts business trust (such as the Trust) could be deemed to have personal liability for the obligations of the Trust. However, the Trust’s Declaration of Trust contains an express disclaimer of liability on the part of Fund shareholders and the By-laws provide that the Trust shall assume the defense on behalf of any Fund shareholders. Moreover, the By-laws also provide for indemnification out of Fund property of any shareholder held personally liable solely by reason of being or having been a shareholder for all loss or expense arising from such liability. Additionally, in the normal course of business, the Fund enters into agreements with service providers that may contain indemnification clauses. The Fund’s maximum exposure under these arrangements is unknown as this would involve future claims that may be made against the Fund that have not yet occurred.
I Interim Financial Statements — The interim financial statements relating to March 31, 2015 and for the six months then ended have not been audited by an independent registered public accounting firm, but in the opinion of the Fund’s management, reflect all adjustments, consisting only of normal recurring adjustments, necessary for the fair presentation of the financial statements.
2 Distributions to Shareholders and Income Tax Information
The Fund declares dividends daily to shareholders of record at the time of declaration. Distributions are generally paid monthly. Distributions of realized capital gains are made at least annually. Distributions to shareholders are recorded on the ex-dividend date. Distributions are declared separately for each class of shares. Shareholders may reinvest income and capital gain distributions in additional shares of the same class of the Fund at the net asset value as of the ex-dividend date or, at the election of the shareholder, receive distributions in cash. Distributions to shareholders are determined in accordance with income tax regulations, which may differ from U.S. GAAP. As required by U.S. GAAP, only distributions in excess of tax basis earnings and profits are reported in the financial statements as a return of capital. Permanent differences between book and tax accounting relating to distributions are reclassified to paid-in capital. For tax purposes, distributions from short-term capital gains are considered to be from ordinary income.
At September 30, 2014, the Fund, for federal income tax purposes, had deferred capital losses of $1,540,109 which will reduce its taxable income arising from future net realized gains on investment transactions, if any, to the extent permitted by the Internal Revenue Code, and thus will reduce the amount of distributions to shareholders, which would otherwise be necessary to relieve the Fund of any liability for federal income or excise tax. The deferred capital losses are treated as arising on the first day of the Fund’s next taxable year and retain the same short-term or long-term character as when originally deferred. Of the deferred capital losses at September 30, 2014, $993,174 are short-term and $546,935 are long-term.
The cost and unrealized appreciation (depreciation) of investments of the Fund at March 31, 2015, as determined on a federal income tax basis, were as follows:
| | | | |
| |
Aggregate cost | | $ | 64,015,579 | |
| |
Gross unrealized appreciation | | $ | 2,935,646 | |
Gross unrealized depreciation | | | (108,809 | ) |
| |
Net unrealized appreciation | | $ | 2,826,837 | |
3 Investment Adviser Fee and Other Transactions with Affiliates
The investment adviser fee is earned by Boston Management and Research (BMR), a subsidiary of EVM, as compensation for investment advisory services rendered to the Fund. Pursuant to the investment advisory agreement and subsequent fee reduction agreement between the Fund and BMR effective February 1, 2015, the fee is computed at an annual rate of 0.45% of the Fund’s average daily net assets up to $1 billion and is payable monthly. On net assets of $1 billion and over, the annual fee is reduced. The fee reduction cannot be terminated without the consent of the Trustees and shareholders. Prior to February 1, 2015, the fee was computed an at annual rate of 0.60% of the Fund’s average daily net assets up to $1 billion and at reduced rates on net assets of $1 billion and over. For the six months ended March 31, 2015, the investment adviser fee amounted to $159,018 or 0.54% (annualized) of the Fund’s average daily net assets. The Fund invests its cash in Cash Reserves Fund. EVM does not currently receive a fee for advisory services provided to Cash Reserves Fund.
EVM serves as the administrator of the Fund but receives no compensation. BMR has agreed to reimburse the Fund’s expenses to the extent that total annual operating expenses (relating to ordinary operating expenses only) exceed 0.80%, 1.55% and 0.55% (0.95%, 1.70% and 0.70% prior to February 1, 2015) of the Fund’s average daily net assets for Class A, Class C and Class I, respectively. This agreement may be changed or terminated after January 31, 2016. Pursuant to this agreement, BMR was allocated $71,109 of the Fund’s operating expenses for the six months ended March 31, 2015.
Eaton Vance
Core Plus Bond Fund
March 31, 2015
Notes to Financial Statements (Unaudited) — continued
EVM provides sub-transfer agency and related services to the Fund pursuant to a Sub-Transfer Agency Support Services Agreement. For the six months ended March 31, 2015, EVM earned $760 from the Fund pursuant to such agreement, which is included in transfer and dividend disbursing agent fees on the Statement of Operations. The Fund was informed that Eaton Vance Distributors, Inc. (EVD), an affiliate of EVM and the Fund’s principal underwriter, received $4,198 as its portion of the sales charge on sales of Class A shares for the six months ended March 31, 2015. EVD also received distribution and service fees from Class A and Class C shares (see Note 4) and contingent deferred sales charges (see Note 5).
Trustees and officers of the Fund who are members of EVM’s or BMR’s organizations receive remuneration for their services to the Fund out of the investment adviser fee. Trustees of the Fund who are not affiliated with the investment adviser may elect to defer receipt of all or a percentage of their annual fees in accordance with the terms of the Trustees Deferred Compensation Plan. For the six months ended March 31, 2015, no significant amounts have been deferred. Certain officers and Trustees of the Fund are officers of the above organizations.
4 Distribution Plans
The Fund has in effect a distribution plan for Class A shares (Class A Plan) pursuant to Rule 12b-1 under the 1940 Act. Pursuant to the Class A Plan, the Fund pays EVD a distribution and service fee of 0.25% per annum of its average daily net assets attributable to Class A shares for distribution services and facilities provided to the Fund by EVD, as well as for personal services and/or the maintenance of shareholder accounts. Distribution and service fees paid or accrued to EVD for the six months ended March 31, 2015 amounted to $25,669 for Class A shares.
The Fund also has in effect a distribution plan for Class C shares (Class C Plan) pursuant to Rule 12b-1 under the 1940 Act. Pursuant to the Class C Plan, the Fund pays EVD amounts equal to 0.75% per annum of its average daily net assets attributable to Class C shares for providing ongoing distribution services and facilities to the Fund. For the six months ended March 31, 2015, the Fund paid or accrued to EVD $43,457 for Class C shares.
Pursuant to the Class C Plan, the Fund also makes payments of service fees to EVD, financial intermediaries and other persons in amounts equal to 0.25% per annum of its average daily net assets attributable to that class. Service fees paid or accrued are for personal services and/or the maintenance of shareholder accounts. They are separate and distinct from the sales commissions and distribution fees payable to EVD. Service fees paid or accrued for the six months ended March 31, 2015 amounted to $14,486 for Class C shares.
Distribution and service fees are subject to the limitations contained in the Financial Industry Regulatory Authority’s NASD Conduct Rule 2830(d).
5 Contingent Deferred Sales Charges
A contingent deferred sales charge (CDSC) of 1% generally is imposed on redemptions of Class C shares made within one year of purchase. Class A shares may be subject to a 1% CDSC if redeemed within 18 months of purchase (depending on the circumstances of purchase). Generally, the CDSC is based upon the lower of the net asset value at date of redemption or date of purchase. No charge is levied on shares acquired by reinvestment of dividends or capital gain distributions. For the six months ended March 31, 2015, the Fund was informed that EVD received approximately $40 of CDSCs paid by Class C shareholders and no CDSCs paid by Class A shareholders.
6 Purchases and Sales of Investments
Purchases and sales of investments, other than short-term obligations, aggregated $9,663,598 and none, respectively, for the six months ended March 31, 2015.
7 Shares of Beneficial Interest
The Fund’s Declaration of Trust permits the Trustees to issue an unlimited number of full and fractional shares of beneficial interest (without par value). Such shares may be issued in a number of different series (such as the Fund) and classes. Transactions in Fund shares were as follows:
| | | | | | | | |
| Class A | | Six Months Ended
March 31, 2015
(Unaudited) | | | Year Ended
September 30, 2014 | |
| | |
Sales | | | 505,165 | | | | 303,737 | |
Issued to shareholders electing to receive payments of distributions in Fund shares | | | 31,244 | | | | 78,568 | |
Redemptions | | | (342,562 | ) | | | (1,187,148 | ) |
| | |
Net increase (decrease) | | | 193,847 | | | | (804,843 | ) |
| | |
| | | | | | | | |
Eaton Vance
Core Plus Bond Fund
March 31, 2015
Notes to Financial Statements (Unaudited) — continued
| | | | | | | | |
| Class C | | Six Months Ended
March 31, 2015
(Unaudited) | | | Year Ended
September 30, 2014 | |
| | |
Sales | | | 220,453 | | | | 125,003 | |
Issued to shareholders electing to receive payments of distributions in Fund shares | | | 11,851 | | | | 29,829 | |
Redemptions | | | (76,420 | ) | | | (899,679 | ) |
| | |
Net increase (decrease) | | | 155,884 | | | | (744,847 | ) |
| | |
| | | | | | | | |
| Class I | | Six Months Ended
March 31, 2015
(Unaudited) | | | Year Ended
September 30, 2014 | |
| | |
Sales | | | 1,423,087 | | | | 1,305,836 | |
Issued to shareholders electing to receive payments of distributions in Fund shares | | | 42,310 | | | | 56,361 | |
Redemptions | | | (220,949 | ) | | | (1,401,526 | ) |
| | |
Net increase (decrease) | | | 1,244,448 | | | | (39,329 | ) |
8 Line of Credit
The Fund participates with other portfolios and funds managed by EVM and its affiliates in a $750 million unsecured line of credit agreement with a group of banks, which is in effect through September 7, 2015. Borrowings are made by the Fund solely to facilitate the handling of unusual and/or unanticipated short-term cash requirements. Interest is charged to the Fund based on its borrowings at an amount above either the Eurodollar rate or Federal Funds rate. In addition, a fee computed at an annual rate of 0.08% on the daily unused portion of the line of credit is allocated among the participating portfolios and funds at the end of each quarter. Because the line of credit is not available exclusively to the Fund, a Fund may be unable to borrow some or all of its requested amounts at any particular time. The Fund did not have any significant borrowings or allocated fees during the six months ended March 31, 2015.
9 Liquidity Risk
The ability of municipalities to issue Build America Bonds expired on December 31, 2010. As a result, the number of Build America Bonds available in the market is limited and there can be no assurance that Build America Bonds will be actively traded. In addition, illiquidity may negatively affect the value of such bonds.
10 Fair Value Measurements
Under generally accepted accounting principles for fair value measurements, a three-tier hierarchy to prioritize the assumptions, referred to as inputs, is used in valuation techniques to measure fair value. The three-tier hierarchy of inputs is summarized in the three broad levels listed below.
| Ÿ | | Level 1 – quoted prices in active markets for identical investments |
| Ÿ | | Level 2 – other significant observable inputs (including quoted prices for similar investments, interest rates, prepayment speeds, credit risk, etc.) |
| Ÿ | | Level 3 – significant unobservable inputs (including a fund’s own assumptions in determining the fair value of investments) |
In cases where the inputs used to measure fair value fall in different levels of the fair value hierarchy, the level disclosed is determined based on the lowest level input that is significant to the fair value measurement in its entirety. The inputs or methodology used for valuing securities are not necessarily an indication of the risk associated with investing in those securities.
Eaton Vance
Core Plus Bond Fund
March 31, 2015
Notes to Financial Statements (Unaudited) — continued
At March 31, 2015, the hierarchy of inputs used in valuing the Fund’s investments, which are carried at value, were as follows:
| | | | | | | | | | | | | | | | |
| Asset Description | | Level 1 | | | Level 2 | | | Level 3 | | | Total | |
| | | | |
Taxable Municipal Securities | | $ | — | | | $ | 55,252,496 | | | $ | — | | | $ | 55,252,496 | |
Short-Term Investments | | | — | | | | 11,589,920 | | | | — | | | | 11,589,920 | |
| | | | |
Total Investments | | $ | — | | | $ | 66,842,416 | | | $ | — | | | $ | 66,842,416 | |
The Fund held no investments or other financial instruments as of September 30, 2014 whose fair value was determined using Level 3 inputs. At March 31, 2015, there were no investments transferred between Level 1 and Level 2 during the six months then ended.
11 Name Change
Effective May 1, 2015, the name of Eaton Vance Core Plus Bond Fund was changed from Eaton Vance Build America Bond Fund and the Fund’s investment objective was changed to total return. In connection with these changes, the Fund is no longer required, under normal market circumstances, to investment at least 80% of its net assets in Build America Bonds.
Eaton Vance
Core Plus Bond Fund
March 31, 2015
Officers and Trustees
Officers of Eaton Vance Core Plus Bond Fund
Payson F. Swaffield
President
Maureen A. Gemma
Vice President, Secretary and
Chief Legal Officer
James F. Kirchner
Treasurer
Paul M. O’Neil
Chief Compliance Officer
Trustees of Eaton Vance Core Plus Bond Fund
Ralph F. Verni
Chairman
Scott E. Eston
Thomas E. Faust Jr.*
Cynthia E. Frost
George J. Gorman
Valerie A. Mosley
William H. Park
Ronald A. Pearlman
Helen Frame Peters
Susan J. Sutherland
Harriett Tee Taggart
Eaton Vance Funds
IMPORTANT NOTICES
Privacy. The Eaton Vance organization is committed to ensuring your financial privacy. Each of the financial institutions identified below has in effect the following policy (“Privacy Policy”) with respect to nonpublic personal information about its customers:
| Ÿ | | Only such information received from you, through application forms or otherwise, and information about your Eaton Vance fund transactions will be collected. This may include information such as name, address, social security number, tax status, account balances and transactions. |
| Ÿ | | None of such information about you (or former customers) will be disclosed to anyone, except as permitted by law (which includes disclosure to employees necessary to service your account). In the normal course of servicing a customer’s account, Eaton Vance may share information with unaffiliated third parties that perform various required services such as transfer agents, custodians and broker-dealers. |
| Ÿ | | Policies and procedures (including physical, electronic and procedural safeguards) are in place that are designed to protect the confidentiality of such information. |
| Ÿ | | We reserve the right to change our Privacy Policy at any time upon proper notification to you. Customers may want to review our Privacy Policy periodically for changes by accessing the link on our homepage: www.eatonvance.com. |
Our pledge of privacy applies to the following entities within the Eaton Vance organization: the Eaton Vance Family of Funds, Eaton Vance Management, Eaton Vance Investment Counsel, Eaton Vance Distributors, Inc., Eaton Vance Trust Company, Eaton Vance Management’s Real Estate Investment Group and Boston Management and Research. In addition, our Privacy Policy applies only to those Eaton Vance customers who are individuals and who have a direct relationship with us. If a customer’s account (i.e., fund shares) is held in the name of a third-party financial advisor/broker-dealer, it is likely that only such advisor’s privacy policies apply to the customer. This notice supersedes all previously issued privacy disclosures. For more information about Eaton Vance’s Privacy Policy, please call 1-800-262-1122.
Delivery of Shareholder Documents. The Securities and Exchange Commission (SEC) permits funds to deliver only one copy of shareholder documents, including prospectuses, proxy statements and shareholder reports, to fund investors with multiple accounts at the same residential or post office box address. This practice is often called “householding” and it helps eliminate duplicate mailings to shareholders. Eaton Vance, or your financial advisor, may household the mailing of your documents indefinitely unless you instruct Eaton Vance, or your financial advisor, otherwise. If you would prefer that your Eaton Vance documents not be householded, please contact Eaton Vance at 1-800-262-1122, or contact your financial advisor. Your instructions that householding not apply to delivery of your Eaton Vance documents will be effective within 30 days of receipt by Eaton Vance or your financial advisor.
Portfolio Holdings. Each Eaton Vance Fund and its underlying Portfolio(s) (if applicable) will file a schedule of portfolio holdings on Form N-Q with the SEC for the first and third quarters of each fiscal year. The Form N-Q will be available on the Eaton Vance website at www.eatonvance.com, by calling Eaton Vance at 1-800-262-1122 or in the EDGAR database on the SEC’s website at www.sec.gov. Form N-Q may also be reviewed and copied at the SEC’s public reference room in Washington, D.C. (call 1-800-732-0330 for information on the operation of the public reference room).
Proxy Voting. From time to time, funds are required to vote proxies related to the securities held by the funds. The Eaton Vance Funds or their underlying Portfolios (if applicable) vote proxies according to a set of policies and procedures approved by the Funds’ and Portfolios’ Boards. You may obtain a description of these policies and procedures and information on how the Funds or Portfolios voted proxies relating to portfolio securities during the most recent 12-month period ended June 30, without charge, upon request, by calling 1-800-262-1122 and by accessing the SEC’s website at www.sec.gov.
This Page Intentionally Left Blank
Investment Adviser
Boston Management and Research
Two International Place
Boston, MA 02110
Administrator
Eaton Vance Management
Two International Place
Boston, MA 02110
Principal Underwriter*
Eaton Vance Distributors, Inc.
Two International Place
Boston, MA 02110
(617) 482-8260
Custodian
State Street Bank and Trust Company
State Street Financial Center, One Lincoln Street
Boston, MA 02111
Transfer Agent
BNY Mellon Investment Servicing (US) Inc.
Attn: Eaton Vance Funds
P.O. Box 9653
Providence, RI 02940-9653
(800) 262-1122
Fund Offices
Two International Place
Boston, MA 02110
| * | FINRA BrokerCheck. Investors may check the background of their Investment Professional by contacting the Financial Industry Regulatory Authority (FINRA). FINRA BrokerCheck is a free tool to help investors check the professional background of current and former FINRA-registered securities firms and brokers. FINRA BrokerCheck is available by calling 1-800-289-9999 and at www.FINRA.org. The FINRA BrokerCheck brochure describing this program is available to investors at www.FINRA.org. |
Item 2. Code of Ethics
Not required in this filing.
Item 3. Audit Committee Financial Expert
Not required in this filing.
Item 4. Principal Accountant Fees and Services
Not required in this filing.
Item 5. Audit Committee of Listed Registrants
Not applicable.
Item 6. Schedule of Investments
Please see schedule of investments contained in the Report to Stockholders included under Item 1 of this Form N-CSR.
Item 7. Disclosure of Proxy Voting Policies and Procedures for Closed-End Management Investment Companies
Not applicable.
Item 8. Portfolio Managers of Closed-End Management Investment Companies
Not applicable.
Item 9. Purchases of Equity Securities by Closed-End Management Investment Company and Affiliated Purchasers
Not applicable.
Item 10. Submission of Matters to a Vote of Security Holders
No material changes.
Item 11. Controls and Procedures
(a) It is the conclusion of the registrant’s principal executive officer and principal financial officer that the effectiveness of the registrant’s current disclosure controls and procedures (such disclosure controls and procedures having been evaluated within 90 days of the date of this filing) provide reasonable assurance that the information required to be disclosed by the registrant has been recorded, processed, summarized and reported within the time period specified in the Commission’s rules and forms and that the information required to be disclosed by the registrant has been accumulated and communicated to the registrant’s principal executive officer and principal financial officer in order to allow timely decisions regarding required disclosure.
(b) There have been no changes in the registrant’s internal controls over financial reporting during the second fiscal quarter of the period covered by this report that has materially affected, or is reasonably likely to materially affect, the registrant’s internal control over financial reporting.
Item 12. Exhibits
| | | | |
| (a)(1) | | | | Registrant’s Code of Ethics – Not applicable (please see Item 2). |
| | |
| (a)(2)(i) | | | | Treasurer’s Section 302 certification. |
| | |
| (a)(2)(ii) | | | | President’s Section 302 certification. |
| | |
| (b) | | | | Combined Section 906 certification. |
Signatures
Pursuant to the requirements of the Securities Exchange Act of 1934 and the Investment Company Act of 1940, the registrant has duly caused this report to be signed on its behalf by the undersigned, thereunto duly authorized.
Eaton Vance Mutual Funds Trust
| | |
By: | | /s/ Payson F. Swaffield |
| | Payson F. Swaffield |
| | President |
Date: May 18, 2015
Pursuant to the requirements of the Securities Exchange Act of 1934 and the Investment Company Act of 1940, this report has been signed below by the following persons on behalf of the registrant and in the capacities and on the dates indicated.
| | |
By: | | /s/ James F. Kirchner |
| | James F. Kirchner |
| | Treasurer |
Date: May 18, 2015
| | |
By: | | /s/ Payson F. Swaffield |
| | Payson F. Swaffield |
| | President |
Date: May 18, 2015