UNITED STATES
SECURITIES AND EXCHANGE COMMISSION
Washington, D.C. 20549
Form N-CSR
CERTIFIED SHAREHOLDER REPORT OF REGISTERED
MANAGEMENT INVESTMENT COMPANIES
Investment Company Act File Number: 811-04015
Eaton Vance Mutual Funds Trust
(Exact Name of Registrant as Specified in Charter)
Two International Place, Boston, Massachusetts 02110
(Address of Principal Executive Offices)
Maureen A. Gemma
Two International Place, Boston, Massachusetts 02110
(Name and Address of Agent for Services)
(617) 482-8260
(Registrant’s Telephone Number)
January 31
Date of Fiscal Year End
July 31, 2015
Date of Reporting Period
Item 1. Reports to Stockholders

| | |
Parametric Emerging Markets Fund Semiannual Report July 31, 2015 | | |

Commodity Futures Trading Commission Registration. Effective December 31, 2012, the Commodity Futures Trading Commission (“CFTC”) adopted certain regulatory changes that subject registered investment companies and advisers to regulation by the CFTC if a fund invests more than a prescribed level of its assets in certain CFTC-regulated instruments (including futures, certain options and swap agreements) or markets itself as providing investment exposure to such instruments. The Fund has claimed an exclusion from the definition of the term “commodity pool operator” under the Commodity Exchange Act. Accordingly, neither the Fund nor the adviser with respect to the operation of the Fund is subject to CFTC regulation. Because of its management of other strategies, the Fund’s adviser is registered with the CFTC as a commodity pool operator and a commodity trading advisor.
Fund shares are not insured by the FDIC and are not deposits or other obligations of, or guaranteed by, any depository institution. Shares are subject to investment risks, including possible loss of principal invested.
This report must be preceded or accompanied by a current summary prospectus or prospectus. Before investing, investors should consider carefully the investment objective, risks, and charges and expenses of a mutual fund. This and other important information is contained in the summary prospectus and prospectus, which can be obtained from a financial advisor. Prospective investors should read the prospectus carefully before investing. For further information, please call 1-800-260-0761.
Semiannual Report July 31, 2015
Parametric Emerging Markets Fund
Table of Contents
| | | | |
Performance | | | 2 | |
| |
Fund Profile | | | 3 | |
| |
Endnotes and Additional Disclosures | | | 4 | |
| |
Fund Expenses | | | 5 | |
| |
Financial Statements | | | 6 | |
| |
Board of Trustees’ Contract Approval | | | 41 | |
| |
Officers and Trustees | | | 44 | |
| |
Important Notices | | | 45 | |
Parametric Emerging Markets Fund
July 31, 2015
Performance1,2
Portfolio Managers Thomas Seto and Timothy W. Atwill, Ph.D., CFA, each of Parametric Portfolio Associates LLC
| | | | | | | | | | | | | | | | | | | | | | | | |
| % Average Annual Total Returns | | Class
Inception Date | | | Performance
Inception Date | | | Six Months | | | One Year | | | Five Years | | | Since
Inception | |
Investor Class at NAV | | | 06/30/2006 | | | | 06/30/2006 | | | | –4.01 | % | | | –15.38 | % | | | 0.58 | % | | | 4.25 | % |
Class C at NAV | | | 06/30/2006 | | | | 06/30/2006 | | | | –4.33 | | | | –15.96 | | | | –0.16 | | | | 3.47 | |
Class C with 1% Maximum Sales Charge | | | — | | | | — | | | | –5.28 | | | | –16.78 | | | | –0.16 | | | | 3.47 | |
Institutional Class at NAV | | | 06/30/2006 | | | | 06/30/2006 | | | | –3.91 | | | | –15.16 | | | | 0.84 | | | | 4.50 | |
Class R6 at NAV | | | 07/01/2014 | | | | 06/30/2006 | | | | –3.90 | | | | –15.19 | | | | 0.84 | | | | 4.51 | |
MSCI Emerging Markets Index | | | — | | | | — | | | | –4.76 | % | | | –13.38 | % | | | 0.58 | % | | | 4.55 | % |
| | | | | | |
| | | | | | | | | | | | | | | | | | | | | | | | |
| % Total Annual Operating Expense Ratios3 | | | | | | | | Investor Class | | | Class C | | | Institutional
Class | | | Class R6 | |
| | | | | | | | | | | 1.36 | % | | | 2.11 | % | | | 1.11 | % | | | 1.07 | % |
See Endnotes and Additional Disclosures in this report.
Past performance is no guarantee of future results. Returns are historical and are calculated by determining the percentage change in net asset value (NAV) or offering price (as applicable) with all distributions reinvested. Investment return and principal value will fluctuate so that shares, when redeemed, may be worth more or less than their original cost. Performance less than one year is cumulative. Performance is for the stated time period only; due to market volatility, the Fund’s current performance may be lower or higher than quoted. Returns are before taxes unless otherwise noted. For performance as of the most recent month-end, please refer to eatonvance.com.
Parametric Emerging Markets Fund
July 31, 2015
Fund Profile
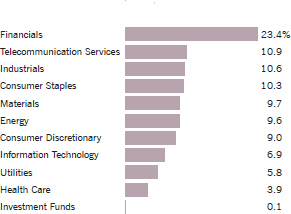
Sector Allocation (% of net assets)4
Top 10 Holdings (% of net assets)4
| | | | |
| |
China Mobile, Ltd. | | | 0.9 | % |
MTN Group, Ltd. | | | 0.8 | |
Naspers, Ltd., Class N | | | 0.8 | |
Tencent Holdings, Ltd. | | | 0.7 | |
America Movil SAB de CV, Series L | | | 0.7 | |
Cielo SA | | | 0.7 | |
CEZ AS | | | 0.6 | |
Samsung Electronics Co., Ltd. | | | 0.6 | |
OTP Bank Rt. | | | 0.5 | |
Taiwan Semiconductor Manufacturing Co., Ltd. | | | 0.5 | |
Total | | | 6.8 | % |
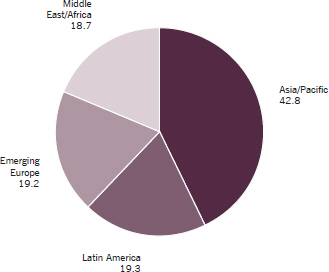
Geographic Allocation (% of common stocks)
See Endnotes and Additional Disclosures in this report.
Parametric Emerging Markets Fund
July 31, 2015
Endnotes and Additional Disclosures
| 1 | MSCI Emerging Markets Index is an unmanaged index of emerging markets common stocks. MSCI indexes are net of foreign withholding taxes. Source: MSCI. MSCI data may not be reproduced or used for any other purpose. MSCI provides no warranties, has not prepared or approved this report, and has no liability hereunder. Unless otherwise stated, index returns do not reflect the effect of any applicable sales charges, commissions, expenses, taxes or leverage, as applicable. It is not possible to invest directly in an index. |
| 2 | Total Returns at NAV do not include applicable sales charges. If sales charges were deducted, the returns would be lower. Total Returns shown with maximum sales charge reflect the stated maximum sales charge. Unless otherwise stated, performance does not reflect the deduction of taxes on Fund distributions or redemptions of Fund shares. Performance prior to the inception date of a class may be linked to the performance of an older class of the Fund. This linked performance is adjusted for any applicable sales charge, but is not adjusted for class expense differences. If adjusted for such differences, the performance would be different. Performance presented in the financial highlights included in the financial statements is not linked. In the performance table, the performance of Class R6 is linked to Institutional Class. Performance since inception for an index, if presented, is the performance since the Fund’s or oldest share class’ inception, as applicable. |
| 3 | Source: Fund prospectus. |
| 4 | Excludes cash and cash equivalents. |
| | Fund profile subject to change due to active management. |
Parametric Emerging Markets Fund
July 31, 2015
Fund Expenses
Example: As a Fund shareholder, you incur two types of costs: (1) transaction costs, including sales charges (loads) on purchases and redemption fees (if applicable); and (2) ongoing costs, including management fees; distribution and/or service fees; and other Fund expenses. This Example is intended to help you understand your ongoing costs (in dollars) of Fund investing and to compare these costs with the ongoing costs of investing in other mutual funds. The Example is based on an investment of $1,000 invested at the beginning of the period and held for the entire period (February 1, 2015 – July 31, 2015).
Actual Expenses: The first section of the table below provides information about actual account values and actual expenses. You may use the information in this section, together with the amount you invested, to estimate the expenses that you paid over the period. Simply divide your account value by $1,000 (for example, an $8,600 account value divided by $1,000 = 8.6), then multiply the result by the number in the first section under the heading entitled “Expenses Paid During Period” to estimate the expenses you paid on your account during this period.
Hypothetical Example for Comparison Purposes: The second section of the table below provides information about hypothetical account values and hypothetical expenses based on the actual Fund expense ratio and an assumed rate of return of 5% per year (before expenses), which is not the actual Fund return. The hypothetical account values and expenses may not be used to estimate the actual ending account balance or expenses you paid for the period. You may use this information to compare the ongoing costs of investing in your Fund and other funds. To do so, compare this 5% hypothetical example with the 5% hypothetical examples that appear in the shareholder reports of the other funds.
Please note that the expenses shown in the table are meant to highlight your ongoing costs only and do not reflect any transactional costs, such as sales charges (loads) or redemption fees (if applicable). Therefore, the second section of the table is useful in comparing ongoing costs only, and will not help you determine the relative total costs of owning different funds. In addition, if these transactional costs were included, your costs would be higher.
| | | | | | | | | | | | | | | | |
| | | Beginning Account Value (2/1/15) | | | Ending Account Value (7/31/15) | | | Expenses Paid During Period* (2/1/15 – 7/31/15) | | | Annualized Expense Ratio | |
| | | | |
| | | | | | | | | | | | | | | | |
Actual | | | | | | | | | | | | | | | | |
Investor Class | | $ | 1,000.00 | | | $ | 959.90 | | | $ | 6.56 | | | | 1.35 | % |
Class C | | $ | 1,000.00 | | | $ | 956.70 | | | $ | 10.19 | | | | 2.10 | % |
Institutional Class | | $ | 1,000.00 | | | $ | 960.90 | | | $ | 5.35 | | | | 1.10 | % |
Class R6 | | $ | 1,000.00 | | | $ | 961.00 | | | $ | 5.15 | | | | 1.06 | % |
| | | | | | | | | | | | | | | | | |
| | | | |
| | | | | | | | | | | | | | | | |
Hypothetical | | | | | | | | | | | | | | | | |
(5% return per year before expenses) | | | | | | | | | | | | | | | | |
Investor Class | | $ | 1,000.00 | | | $ | 1,018.10 | | | $ | 6.76 | | | | 1.35 | % |
Class C | | $ | 1,000.00 | | | $ | 1,014.40 | | | $ | 10.49 | | | | 2.10 | % |
Institutional Class | | $ | 1,000.00 | | | $ | 1,019.30 | | | $ | 5.51 | | | | 1.10 | % |
Class R6 | | $ | 1,000.00 | | | $ | 1,019.50 | | | $ | 5.31 | | | | 1.06 | % |
| * | Expenses are equal to the Fund’s annualized expense ratio for the indicated Class, multiplied by the average account value over the period, multiplied by 181/365 (to reflect the one-half year period). The Example assumes that the $1,000 was invested at the net asset value per share determined at the close of business on January 31, 2015. |
Parametric Emerging Markets Fund
July 31, 2015
Portfolio of Investments (Unaudited)
| | | | | | | | |
| Common Stocks — 99.2% | |
| | |
| | | | | | | | |
| Security | | Shares | | | Value | |
| | | | | | | | |
|
Argentina ��� 0.7% | |
Adecoagro SA(1) | | | 77,700 | | | $ | 672,105 | |
Arcos Dorados Holdings, Inc., Class A | | | 490,400 | | | | 2,084,200 | |
Banco Macro SA, Class B ADR | | | 31,787 | | | | 1,357,623 | |
BBVA Banco Frances SA ADR | | | 52,288 | | | | 781,183 | |
Cresud SA ADR(1) | | | 65,240 | | | | 735,907 | |
Grupo Financiero Galicia SA, Class B ADR | | | 91,400 | | | | 1,717,406 | |
IRSA Inversiones y Representaciones SA ADR | | | 38,810 | | | | 656,277 | |
MercadoLibre, Inc. | | | 46,300 | | | | 6,050,947 | |
Pampa Energia SA ADR(1) | | | 146,200 | | | | 2,229,550 | |
Petrobras Argentina SA ADR | | | 620,508 | | | | 4,120,173 | |
Telecom Argentina SA ADR | | | 315,602 | | | | 5,052,788 | |
YPF SA ADR | | | 95,400 | | | | 2,187,522 | |
| | | | | | | | | |
| | | | | | $ | 27,645,681 | |
| | | | | | | | | |
|
Bahrain — 0.8% | |
Ahli United Bank BSC | | | 19,538,234 | | | $ | 13,939,038 | |
Al Salam Bank-Bahrain BSC | | | 20,637,596 | | | | 7,685,350 | |
Gulf Finance House EC(1) | | | 28,949,475 | | | | 5,734,719 | |
Ithmaar Bank BSC(1) | | | 23,377,675 | | | | 3,282,527 | |
| | | | | | | | | |
| | | | | | $ | 30,641,634 | |
| | | | | | | | | |
|
Bangladesh — 0.9% | |
Aftab Automobiles, Ltd. | | | 783,888 | | | $ | 627,123 | |
Al-Arafah Islami Bank, Ltd. | | | 1,602,750 | | | | 261,287 | |
Bangladesh Export Import Co., Ltd.(1) | | | 8,249,358 | | | | 3,595,843 | |
Beximco Pharmaceuticals, Ltd. | | | 1,148,334 | | | | 1,038,343 | |
BSRM Steels, Ltd. | | | 1,709,000 | | | | 1,864,084 | |
City Bank, Ltd. (The) | | | 5,269,419 | | | | 1,240,088 | |
Grameenphone, Ltd. | | | 1,075,888 | | | | 4,577,840 | |
Heidelberger Cement Bangladesh, Ltd. | | | 146,500 | | | | 1,199,220 | |
Islami Bank Bangladesh, Ltd. | | | 3,020,610 | | | | 854,961 | |
Jamuna Oil Co., Ltd. | | | 177,760 | | | | 463,355 | |
Khulna Power Co., Ltd. | | | 1,334,705 | | | | 1,332,332 | |
Lankabangla Finance, Ltd. | | | 1,036,130 | | | | 398,258 | |
Malek Spinning Mills, Ltd. | | | 897,500 | | | | 221,871 | |
Meghna Petroleum, Ltd. | | | 293,150 | | | | 760,981 | |
National Bank, Ltd.(1) | | | 7,628,423 | | | | 1,087,722 | |
Olympic Industries, Ltd. | | | 441,450 | | | | 1,573,032 | |
Orion Pharma, Ltd. | | | 672,227 | | | | 341,951 | |
Padma Oil Co., Ltd. | | | 195,600 | | | | 635,431 | |
People’s Leasing and Financial
Services, Ltd.(1) | | | 2,472,998 | | | | 532,622 | |
Pubali Bank, Ltd. | | | 1,878,791 | | | | 466,084 | |
Renata, Ltd. | | | 53,400 | | | | 858,308 | |
Social Islami Bank, Ltd. | | | 2,944,930 | | | | 507,719 | |
| | | | | | | | |
| Security | | Shares | | | Value | |
| | | | | | | | |
|
Bangladesh (continued) | |
Southeast Bank, Ltd. | | | 2,584,951 | | | $ | 578,735 | |
Square Pharmaceuticals, Ltd. | | | 918,667 | | | | 3,209,904 | |
Summit Power, Ltd. | | | 1,561,659 | | | | 794,164 | |
Titas Gas Transmission & Distribution Co., Ltd. | | | 3,022,500 | | | | 2,818,306 | |
United Airways Bangladesh, Ltd.(1) | | | 8,053,064 | | | | 1,117,392 | |
United Commercial Bank, Ltd. | | | 5,004,083 | | | | 1,314,212 | |
| | | | | | | | | |
| | | | | | $ | 34,271,168 | |
| | | | | | | | | |
|
Botswana — 0.3% | |
Barclays Bank of Botswana, Ltd. | | | 1,137,465 | | | $ | 493,099 | |
Botswana Insurance Holdings, Ltd. | | | 575,111 | | | | 807,090 | |
First National Bank of Botswana, Ltd. | | | 6,069,100 | | | | 2,347,959 | |
Letshego Holdings, Ltd. | | | 12,485,691 | | | | 4,338,313 | |
Sechaba Breweries, Ltd. | | | 905,550 | | | | 2,559,700 | |
Standard Chartered Bank Botswana, Ltd. | | | 531,120 | | | | 665,680 | |
| | | | | | | | | |
| | | | | | $ | 11,211,841 | |
| | | | | | | | | |
|
Brazil — 5.8% | |
AES Tiete SA, PFC Shares | | | 226,300 | | | $ | 1,209,507 | |
AMBEV SA | | | 2,242,950 | | | | 12,747,793 | |
AMBEV SA ADR | | | 141,760 | | | | 805,197 | |
B2W Cia Digital(1) | | | 200,970 | | | | 1,056,517 | |
Banco Bradesco SA ADR, PFC Shares | | | 131,149 | | | | 1,041,323 | |
Banco Bradesco SA, PFC Shares | | | 643,277 | | | | 5,125,249 | |
Banco do Brasil SA | | | 277,098 | | | | 1,784,492 | |
Banco do Estado do Rio Grande do Sul, PFC Shares | | | 164,900 | | | | 476,310 | |
BB Seguridade Participacoes SA | | | 96,200 | | | | 906,103 | |
BM&FBovespa SA | | | 962,351 | | | | 2,934,314 | |
BR Malls Participacoes SA | | | 296,000 | | | | 1,110,881 | |
BR Properties SA | | | 212,800 | | | | 705,407 | |
Bradespar SA, PFC Shares | | | 121,000 | | | | 347,739 | |
Braskem SA, PFC Shares | | | 89,760 | | | | 328,740 | |
BRF SA | | | 338,540 | | | | 7,106,082 | |
BRF SA ADR | | | 19,900 | | | | 416,109 | |
CCR SA | | | 1,333,500 | | | | 5,927,619 | |
Centrais Eletricas Brasileiras SA, PFC Shares | | | 599,700 | | | | 1,495,769 | |
CETIP SA - Mercados Organizados | | | 173,900 | | | | 1,800,988 | |
Cia Brasileira de Distribuicao, PFC Shares | | | 63,069 | | | | 1,381,496 | |
Cia de Saneamento Basico do Estado de Sao Paulo | | | 573,760 | | | | 2,927,492 | |
Cia de Saneamento de Minas Gerais-COPASA | | | 72,900 | | | | 254,217 | |
Cia de Transmissao de Energia Eletrica Paulista, PFC Shares | | | 64,890 | | | | 785,362 | |
Cia Energetica de Minas Gerais SA ADR | | | 84,265 | | | | 231,729 | |
Cia Energetica de Minas Gerais SA, PFC Shares | | | 1,125,255 | | | | 3,102,384 | |
Cia Energetica de Sao Paulo, Class B, PFC Shares | | | 297,400 | | | | 1,661,608 | |
Cia Hering | | | 299,100 | | | | 1,033,413 | |
| | | | |
| | 6 | | See Notes to Financial Statements. |
Parametric Emerging Markets Fund
July 31, 2015
Portfolio of Investments (Unaudited) — continued
| | | | | | | | |
| Security | | Shares | | | Value | |
| | | | | | | | |
|
Brazil (continued) | |
Cia Paranaense de Energia-Copel, PFC Shares | | | 168,400 | | | $ | 1,735,175 | |
Cia Siderurgica Nacional SA | | | 589,500 | | | | 745,494 | |
Cielo SA | | | 2,071,677 | | | | 26,459,041 | |
Contax Participacoes SA, PFC Shares | | | 121,500 | | | | 26,969 | |
Cosan Logistica SA | | | 169,700 | | | | 89,213 | |
Cosan SA Industria e Comercio | | | 109,700 | | | | 666,412 | |
CPFL Energia SA | | | 530,110 | | | | 2,985,009 | |
Cyrela Brazil Realty SA Empreendimentos e Participacoes | | | 488,300 | | | | 1,326,301 | |
Duratex SA | | | 235,758 | | | | 479,235 | |
EcoRodovias Infraestrutura e Logistica SA | | | 357,100 | | | | 723,806 | |
EDP-Energias do Brasil SA | | | 313,400 | | | | 1,194,489 | |
Eletropaulo Metropolitana SA, Class B, PFC Shares | | | 210,580 | | | | 929,296 | |
Embraer SA | | | 482,700 | | | | 3,369,363 | |
Embraer SA ADR | | | 133,548 | �� | | | 3,719,312 | |
Equatorial Energia SA | | | 165,300 | | | | 1,689,715 | |
Estacio Participacoes SA | | | 462,100 | | | | 1,916,447 | |
Even Construtora e Incorporadora SA | | | 341,400 | | | | 291,151 | |
Ez Tec Empreendimentos e Participacoes SA | | | 91,843 | | | | 371,508 | |
Fibria Celulose SA | | | 175,057 | | | | 2,328,333 | |
Gafisa SA(1) | | | 745,400 | | | | 555,139 | |
Gerdau SA, PFC Shares | | | 771,800 | | | | 1,329,932 | |
Gol Linhas Aereas Inteligentes SA, PFC Shares | | | 204,000 | | | | 338,416 | |
Hypermarcas SA(1) | | | 267,800 | | | | 1,584,611 | |
Iochpe-Maxion SA | | | 115,700 | | | | 412,255 | |
Itau Unibanco Holding SA ADR, PFC Shares | | | 158,904 | | | | 1,379,287 | |
Itau Unibanco Holding SA, PFC Shares | | | 588,773 | | | | 5,172,474 | |
Itausa-Investimentos Itau SA, PFC Shares | | | 1,110,189 | | | | 2,723,634 | |
JBS SA | | | 583,825 | | | | 2,627,592 | |
Klabin SA, PFC Shares | | | 1,300,000 | | | | 1,571,869 | |
Kroton Educacional SA | | | 1,885,736 | | | | 5,287,187 | |
Light SA | | | 132,200 | | | | 544,020 | |
Localiza Rent a Car SA | | | 224,780 | | | | 1,844,746 | |
Lojas Americanas SA, PFC Shares | | | 777,028 | | | | 3,912,429 | |
Lojas Renner SA | | | 159,300 | | | | 5,066,130 | |
Marcopolo SA, PFC Shares | | | 1,222,300 | | | | 821,066 | |
Marfrig Global Foods SA(1) | | | 287,155 | | | | 445,332 | |
Metalurgica Gerdau SA, PFC Shares | | | 260,300 | | | | 266,082 | |
MRV Engenharia e Participacoes SA | | | 719,800 | | | | 1,618,733 | |
Multiplus SA | | | 60,200 | | | | 725,259 | |
Natura Cosmeticos SA | | | 120,900 | | | | 898,995 | |
Odontoprev SA | | | 508,100 | | | | 1,650,162 | |
Oi SA, PFC Shares | | | 1,535,585 | | | | 2,170,660 | |
PDG Realty SA Empreendimentos e Participacoes(1) | | | 4,327,100 | | | | 303,306 | |
Petroleo Brasileiro SA ADR(1) | | | 71,900 | | | | 442,185 | |
Petroleo Brasileiro SA, PFC Shares | | | 5,122,200 | | | | 15,707,910 | |
| | | | | | | | |
| Security | | Shares | | | Value | |
| | | | | | | | |
|
Brazil (continued) | |
Prumo Logistica SA(1) | | | 1,596,000 | | | $ | 326,290 | |
Qualicorp SA | | | 526,100 | | | | 3,126,837 | |
Randon Participacoes SA, PFC Shares | | | 303,500 | | | | 283,649 | |
Rossi Residencial SA(1) | | | 237,000 | | | | 69,218 | |
Rumo Logistica Operadora Multimodal SA(1) | | | 3,144,198 | | | | 835,649 | |
Smiles SA | | | 23,100 | | | | 373,154 | |
Souza Cruz SA | | | 228,000 | | | | 1,617,465 | |
Suzano Papel e Celulose SA, PFC Shares | | | 437,425 | | | | 2,144,998 | |
Telefonica Brasil SA, PFC Shares | | | 874,726 | | | | 11,529,486 | |
Tim Participacoes SA | | | 2,475,427 | | | | 6,788,726 | |
Totvs SA | | | 338,990 | | | | 3,471,134 | |
Tractebel Energia SA | | | 251,900 | | | | 2,666,912 | |
Transmissora Alianca de Energia Electrica SA | | | 151,100 | | | | 924,530 | |
Ultrapar Participacoes SA | | | 411,984 | | | | 8,455,181 | |
Usinas Siderurgicas de Minas Gerais SA, Class A, PFC Shares | | | 872,350 | | | | 1,001,281 | |
Vale SA | | | 34,400 | | | | 179,538 | |
Vale SA ADR | | | 65,300 | | | | 343,478 | |
Vale SA, PFC Shares | | | 2,875,340 | | | | 12,302,671 | |
Valid Solucoes SA | | | 68,300 | | | | 991,402 | |
Via Varejo SA | | | 41,000 | | | | 103,579 | |
Weg SA | | | 742,140 | | | | 4,074,894 | |
| | | | | | | | | |
| | | | | | $ | 230,759,592 | |
| | | | | | | | | |
|
Bulgaria — 0.0%(2) | |
CB First Investment Bank AD(1) | | | 235,000 | | | $ | 316,176 | |
Chimimport AD(1) | | | 329,922 | | | | 292,165 | |
Corporate Commercial Bank AD(1) | | | 10,400 | | | | 5,463 | |
MonBat AD | | | 60,235 | | | | 272,676 | |
Petrol AD(1) | | | 102,500 | | | | 48,183 | |
Sopharma AD | | | 354,600 | | | | 538,236 | |
| | | | | | | | | |
| | | | | | $ | 1,472,899 | |
| | | | | | | | | |
|
Chile — 3.0% | |
AES Gener SA | | | 3,720,840 | | | $ | 1,997,785 | |
Aguas Andinas SA, Series A | | | 4,337,700 | | | | 2,291,222 | |
Almendral SA | | | 2,512,600 | | | | 185,967 | |
Antarchile SA, Series A | | | 215,131 | | | | 2,249,590 | |
Banco de Chile | | | 49,742,407 | | | | 5,330,598 | |
Banco de Chile ADR | | | 7,622 | | | | 474,910 | |
Banco de Credito e Inversiones | | | 89,836 | | | | 3,941,618 | |
Banco Santander Chile SA | | | 112,643,622 | | | | 5,680,634 | |
Banmedica SA | | | 706,730 | | | | 1,331,277 | |
Besalco SA(1) | | | 1,307,600 | | | | 500,387 | |
Bupa Chile SA, PFC Shares | | | 490,000 | | | | 387,487 | |
Cap SA | | | 196,612 | | | | 527,866 | |
| | | | |
| | 7 | | See Notes to Financial Statements. |
Parametric Emerging Markets Fund
July 31, 2015
Portfolio of Investments (Unaudited) — continued
| | | | | | | | |
| Security | | Shares | | | Value | |
| | | | | | | | |
|
Chile (continued) | |
Cencosud SA | | | 2,839,007 | | | $ | 5,981,622 | |
Cia Cervecerias Unidas SA | | | 341,626 | | | | 3,598,170 | |
Cia Sud Americana de Vapores SA(1) | | | 14,510,741 | | | | 424,001 | |
Colbun SA | | | 11,398,010 | | | | 3,012,645 | |
Corpbanca SA | | | 288,938,251 | | | | 2,914,239 | |
E.CL SA | | | 693,400 | | | | 941,160 | |
Embotelladora Andina SA, Class B, PFC Shares | | | 535,258 | | | | 1,511,933 | |
Empresa Nacional de Electricidad SA | | | 4,554,263 | | | | 6,214,657 | |
Empresa Nacional de Telecomunicaciones SA | | | 489,619 | | | | 5,041,362 | |
Empresas AquaChile SA(1) | | | 336,541 | | | | 144,759 | |
Empresas CMPC SA | | | 2,641,020 | | | | 6,917,106 | |
Empresas Copec SA | | | 1,305,068 | | | | 13,056,294 | |
Empresas La Polar SA(1) | | | 1,713,400 | | | | 47,778 | |
Enersis SA | | | 20,091,568 | | | | 6,049,225 | |
Enersis SA ADR | | | 42,700 | | | | 645,197 | |
Forus SA | | | 132,100 | | | | 385,798 | |
Grupo Security SA | | | 3,397,289 | | | | 967,487 | |
Inversiones Aguas Metropolitanas SA | | | 614,900 | | | | 893,803 | |
Inversiones La Construccion SA | | | 54,000 | | | | 588,698 | |
Latam Airlines Group SA(1) | | | 581,137 | | | | 3,663,352 | |
Latam Airlines Group SA BDR(1) | | | 28,260 | | | | 132,636 | |
Molibdenos y Metales SA(1) | | | 65,700 | | | | 401,976 | |
Parque Arauco SA | | | 1,406,599 | | | | 2,592,882 | |
Quinenco SA | | | 389,755 | | | | 768,873 | |
Ripley Corp. SA | | | 1,779,400 | | | | 611,995 | |
S.A.C.I. Falabella | | | 1,962,555 | | | | 12,764,176 | |
Salfacorp SA | | | 1,726,600 | | | | 1,055,116 | |
Sigdo Koppers SA | | | 1,121,831 | | | | 1,472,757 | |
Sociedad de Inversiones Pampa Calichera SA, Class A | | | 45,817 | | | | 15,460 | |
Sociedad Matriz SAAM SA | | | 6,242,812 | | | | 462,887 | |
Sociedad Quimica y Minera de Chile SA, Series B | | | 212,340 | | | | 2,894,085 | |
Sociedad Quimica y Minera de Chile SA, Series B ADR | | | 58,400 | | | | 788,984 | |
Socovesa SA | | | 1,443,206 | | | | 254,734 | |
Sonda SA | | | 3,108,976 | | | | 5,708,858 | |
Vina Concha y Toro SA | | | 1,360,915 | | | | 2,129,584 | |
| | | | | | | | | |
| | | | | | $ | 119,953,630 | |
| | | | | | | | | |
|
China — 8.7% | |
Agile Property Holdings, Ltd. | | | 1,096,000 | | | $ | 629,998 | |
Agricultural Bank of China, Ltd., Class H | | | 2,350,000 | | | | 1,060,095 | |
Air China, Ltd., Class H(1) | | | 2,310,000 | | | | 2,311,197 | |
Aluminum Corp. of China, Ltd., Class H(1) | | | 3,374,000 | | | | 1,169,828 | |
Angang Steel Co., Ltd., Class H | | | 1,226,000 | | | | 622,551 | |
Anhui Conch Cement Co., Ltd., Class H | | | 906,500 | | | | 2,821,462 | |
ANTA Sports Products, Ltd. | | | 1,021,000 | | | | 2,625,033 | |
| | | | | | | | |
| Security | | Shares | | | Value | |
| | | | | | | | |
|
China (continued) | |
Baidu, Inc. ADR(1) | | | 44,900 | | | $ | 7,752,434 | |
Bank of China, Ltd., Class H | | | 10,330,000 | | | | 5,631,383 | |
Bank of Communications, Ltd., Class H | | | 3,583,900 | | | | 3,150,096 | |
Beijing Capital International Airport Co., Ltd., Class H | | | 1,568,000 | | | | 1,614,222 | |
Beijing Enterprises Holdings, Ltd. | | | 309,500 | | | | 2,277,432 | |
Beijing Enterprises Water Group, Ltd.(1) | | | 1,206,000 | | | | 900,214 | |
Belle International Holdings, Ltd. | | | 2,320,000 | | | | 2,418,016 | |
Brilliance China Automotive Holdings, Ltd. | | | 1,086,000 | | | | 1,441,355 | |
BYD Co., Ltd., Class H | | | 607,200 | | | | 2,669,788 | |
China Agri-Industries Holdings, Ltd.(1) | | | 2,074,000 | | | | 903,133 | |
China Bluechemical, Ltd., Class H | | | 1,270,000 | | | | 414,104 | |
China Cinda Asset Management, Co., Ltd., Class H | | | 1,495,000 | | | | 668,707 | |
China CITIC Bank Corp., Ltd., Class H(1) | | | 840,000 | | | | 599,839 | |
China Coal Energy Co., Ltd., Class H | | | 3,400,000 | | | | 1,654,435 | |
China Communications Construction Co., Ltd., Class H | | | 2,245,000 | | | | 2,881,602 | |
China Communications Services Corp., Ltd., Class H | | | 2,540,000 | | | | 1,153,292 | |
China Construction Bank Corp., Class H | | | 7,369,630 | | | | 6,002,395 | |
China COSCO Holdings Co., Ltd., Class H(1) | | | 2,694,975 | | | | 1,386,231 | |
China Dongxiang (Group) Co., Ltd. | | | 4,257,000 | | | | 1,086,032 | |
China Everbright International, Ltd. | | | 1,986,000 | | | | 3,035,831 | |
China Everbright, Ltd. | | | 536,000 | | | | 1,301,768 | |
China Gas Holdings, Ltd. | | | 606,000 | | | | 1,065,614 | |
China High Speed Transmission Equipment Group Co., Ltd.(1) | | | 2,184,000 | | | | 1,778,815 | |
China International Marine Containers Co., Ltd., Class B | | | 482,672 | | | | 1,027,647 | |
China Life Insurance Co., Ltd., Class H | | | 1,183,000 | | | | 4,349,657 | |
China Longyuan Power Group Corp., Ltd., Class H | | | 2,914,000 | | | | 3,338,520 | |
China Mengniu Dairy Co., Ltd. | | | 960,000 | | | | 4,352,668 | |
China Merchants Bank Co., Ltd., Class H | | | 497,524 | | | | 1,285,194 | |
China Merchants Holdings (International) Co., Ltd. | | | 812,035 | | | | 2,978,780 | |
China Minsheng Banking Corp., Ltd., Class H | | | 662,740 | | | | 743,355 | |
China Mobile, Ltd. | | | 2,810,500 | | | | 36,719,216 | |
China National Building Material Co., Ltd., Class H | | | 2,522,000 | | | | 1,908,302 | |
China Oilfield Services, Ltd., Class H | | | 1,420,000 | | | | 1,742,056 | |
China Overseas Land & Investment, Ltd. | | | 390,160 | | | | 1,226,162 | |
China Pacific Insurance (Group) Co., Ltd., Class H | | | 196,400 | | | | 823,308 | |
China Petroleum & Chemical Corp., Class H | | | 15,620,300 | | | | 11,752,975 | |
China Pharmaceutical Group, Ltd. | | | 1,402,000 | | | | 1,286,995 | |
China Railway Construction Corp., Ltd., Class H | | | 1,592,000 | | | | 2,072,481 | |
China Railway Group, Ltd., Class H | | | 2,179,000 | | | | 1,858,506 | |
China Resources Enterprise, Ltd. | | | 842,000 | | | | 2,731,402 | |
China Resources Gas Group, Ltd. | | | 830,000 | | | | 2,535,728 | |
China Resources Land, Ltd. | | | 250,000 | | | | 702,059 | |
China Resources Power Holdings Co., Ltd. | | | 1,591,600 | | | | 4,088,115 | |
China Shenhua Energy Co., Ltd., Class H | | | 2,164,500 | | | | 4,111,430 | |
| | | | |
| | 8 | | See Notes to Financial Statements. |
Parametric Emerging Markets Fund
July 31, 2015
Portfolio of Investments (Unaudited) — continued
| | | | | | | | |
| Security | | Shares | | | Value | |
| | | | | | | | |
|
China (continued) | |
China Shineway Pharmaceutical Group, Ltd. | | | 381,000 | | | $ | 485,994 | |
China Shipping Container Lines Co., Ltd.,
Class H(1) | | | 4,252,000 | | | | 1,337,558 | |
China Shipping Development Co., Ltd., Class H | | | 1,702,000 | | | | 1,033,165 | |
China Southern Airlines Co., Ltd., Class H | | | 2,700,000 | | | | 2,671,876 | |
China Taiping Insurance Holdings Co., Ltd.(1) | | | 573,400 | | | | 1,702,811 | |
China Telecom Corp., Ltd., Class H | | | 11,972,000 | | | | 6,695,179 | |
China Travel International Investment Hong Kong, Ltd. | | | 4,692,000 | | | | 1,804,860 | |
China Unicom (Hong Kong), Ltd. | | | 4,340,372 | | | | 6,069,409 | |
China Vanke Co., Ltd., Class H | | | 789,920 | | | | 1,878,539 | |
China Yurun Food Group, Ltd.(1) | | | 1,776,000 | | | | 525,453 | |
Chongqing Changan Automobile Co., Ltd., Class B | | | 1,100,286 | | | | 2,336,248 | |
CITIC, Ltd. | | | 1,152,000 | | | | 2,063,123 | |
CNOOC, Ltd. | | | 8,296,000 | | | | 10,159,148 | |
Cosco Pacific, Ltd. | | | 1,516,000 | | | | 1,986,357 | |
Country Garden Holdings Co., Ltd. | | | 3,785,631 | | | | 1,478,656 | |
Ctrip.com International, Ltd. ADR(1) | | | 140,100 | | | | 10,028,358 | |
Datang International Power Generation Co., Ltd., Class H | | | 3,414,000 | | | | 1,474,947 | |
Dongfeng Motor Group Co., Ltd., Class H | | | 1,966,000 | | | | 2,258,964 | |
Golden Eagle Retail Group, Ltd. | | | 739,000 | | | | 912,544 | |
Great Wall Motor Co., Ltd., Class H(1) | | | 862,500 | | | | 2,855,324 | |
Guangdong Investment, Ltd. | | | 2,022,000 | | | | 2,731,533 | |
Guangzhou Automobile Group Co., Ltd., Class H | | | 1,892,013 | | | | 1,516,656 | |
Guangzhou Baiyunshan Pharmaceutical Holdings Co., Ltd., Class H | | | 320,000 | | | | 879,311 | |
Guangzhou R&F Properties Co., Ltd.,
Class H(1) | | | 682,000 | | | | 683,718 | |
Haier Electronics Group Co., Ltd. | | | 161,000 | | | | 379,566 | |
Hengan International Group Co., Ltd. | | | 355,000 | | | | 3,956,817 | |
Hengdeli Holdings, Ltd. | | | 2,681,800 | | | | 390,466 | |
Huaneng Power International, Inc., Class H | | | 2,746,000 | | | | 3,331,115 | |
Industrial & Commercial Bank of China, Ltd., Class H | | | 7,374,000 | | | | 5,065,848 | |
Inner Mongolia Eerduosi Resources Co., Ltd., Class B | | | 72,000 | | | | 63,565 | |
Inner Mongolia Yitai Coal Co., Ltd., Class B | | | 669,000 | | | | 693,713 | |
Jiangsu Expressway Co., Ltd., Class H | | | 1,152,000 | | | | 1,443,170 | |
Jiangxi Copper Co., Ltd., Class H | | | 1,298,000 | | | | 1,750,367 | |
Kingboard Chemical Holdings, Ltd. | | | 648,600 | | | | 1,088,970 | |
Kunlun Energy Co., Ltd. | | | 2,206,000 | | | | 2,102,352 | |
Lee & Man Paper Manufacturing, Ltd. | | | 1,220,000 | | | | 746,753 | |
Lenovo Group, Ltd. | | | 3,736,000 | | | | 4,044,404 | |
Li Ning Co., Ltd.(1) | | | 774,208 | | | | 383,141 | |
Maanshan Iron & Steel Co., Ltd., Class H(1) | | | 2,294,000 | | | | 537,618 | |
Mindray Medical International, Ltd. ADR | | | 77,700 | | | | 2,120,433 | |
NetEase.com, Inc. ADR | | | 14,000 | | | | 1,940,820 | |
New Oriental Education & Technology Group, Inc. ADR(1) | | | 380,400 | | | | 8,520,960 | |
Nine Dragons Paper Holdings, Ltd. | | | 2,051,000 | | | | 1,518,318 | |
PetroChina Co., Ltd., Class H | | | 10,400,000 | | | | 10,218,768 | |
| | | | | | | | |
| Security | | Shares | | | Value | |
| | | | | | | | |
|
China (continued) | |
PICC Property & Casualty Co., Ltd., Class H | | | 750,000 | | | $ | 1,550,856 | |
Ping An Insurance (Group) Co. of China, Ltd., Class H | | | 435,000 | | | | 2,500,426 | |
Poly Property Group Co., Ltd. | | | 1,918,000 | | | | 726,781 | |
Semiconductor Manufacturing International Corp.(1) | | | 23,397,000 | | | | 2,102,374 | |
Shandong Weigao Group Medical Polymer Co., Ltd., Class H | | | 1,396,000 | | | | 937,257 | |
Shanghai Electric Group Co., Ltd., Class H | | | 2,414,000 | | | | 1,493,410 | |
Shanghai Industrial Holdings, Ltd. | | | 304,000 | | | | 895,852 | |
Shimao Property Holdings, Ltd. | | | 665,000 | | | | 1,192,504 | |
Sihuan Pharmaceutical Holdings Group, Ltd.(1)(3) | | | 3,161,000 | | | | 899,089 | |
SINA Corp.(1) | | | 22,900 | | | | 929,969 | |
Sino Biopharmaceutical, Ltd. | | | 2,760,000 | | | | 3,199,366 | |
Sino-Ocean Land Holdings, Ltd. | | | 1,720,500 | | | | 1,185,919 | |
Sinopec Shanghai Petrochemical Co., Ltd., Class H(1) | | | 2,931,000 | | | | 1,195,061 | |
Sinopharm Group Co., Ltd., Class H | | | 1,075,600 | | | | 4,136,501 | |
Sohu.com, Inc.(1) | | | 10,300 | | | | 495,739 | |
Sun Art Retail Group, Ltd. | | | 1,476,000 | | | | 1,123,575 | |
Tencent Holdings, Ltd. | | | 1,493,800 | | | | 27,772,744 | |
Tingyi (Cayman Islands) Holding Corp. | | | 1,266,000 | | | | 2,436,190 | |
Tsingtao Brewery Co., Ltd., Class H | | | 254,000 | | | | 1,355,331 | |
Want Want China Holdings, Ltd. | | | 3,750,000 | | | | 3,894,780 | |
Weichai Power Co., Ltd., Class H | | | 912,800 | | | | 1,371,659 | |
Wumart Stores, Inc., Class H(1) | | | 321,000 | | | | 198,396 | |
WuXi PharmaTech (Cayman), Inc. ADR(1) | | | 61,900 | | | | 2,568,850 | |
Yangzijiang Shipbuilding Holdings, Ltd. | | | 1,809,000 | | | | 1,697,977 | |
Yanzhou Coal Mining Co., Ltd., Class H | | | 2,200,000 | | | | 1,254,543 | |
Zhaojin Mining Industry Co., Ltd., Class H | | | 1,140,000 | | | | 530,820 | |
Zhejiang Expressway Co., Ltd., Class H | | | 1,404,000 | | | | 1,630,258 | |
Zhuzhou CSR Times Electric Co., Ltd., Class H | | | 513,000 | | | | 3,477,876 | |
Zijin Mining Group Co., Ltd., Class H | | | 6,290,000 | | | | 1,672,592 | |
ZTE Corp., Class H | | | 876,903 | | | | 1,947,495 | |
| | | | | | | | | |
| | | | | | $ | 346,902,543 | |
| | | | | | | | | |
|
Colombia — 1.4% | |
Almacenes Exito SA | | | 465,190 | | | $ | 3,440,468 | |
Avianca Holdings SA, PFC Shares | | | 551,298 | | | | 597,240 | |
Banco Davivienda SA, PFC Shares | | | 186,400 | | | | 1,713,844 | |
Banco de Bogota SA | | | 98,407 | | | | 2,050,829 | |
Bancolombia SA | | | 114,355 | | | | 1,033,166 | |
Bancolombia SA ADR, PFC Shares | | | 149,600 | | | | 5,774,560 | |
Bolsa de Valores de Colombia | | | 72,389,909 | | | | 404,680 | |
Celsia SA ESP | | | 809,070 | | | | 1,177,084 | |
Cementos Argos SA | | | 697,019 | | | | 2,388,742 | |
Cementos Argos SA, PFC Shares | | | 307,566 | | | | 1,003,861 | |
Cemex Latam Holdings SA(1) | | | 372,500 | | | | 1,634,861 | |
Corporacion Financiera Colombiana SA | | | 112,407 | | | | 1,475,342 | |
| | | | |
| | 9 | | See Notes to Financial Statements. |
Parametric Emerging Markets Fund
July 31, 2015
Portfolio of Investments (Unaudited) — continued
| | | | | | | | |
| Security | | Shares | | | Value | |
| | | | | | | | |
|
Colombia (continued) | |
Ecopetrol SA | | | 12,707,769 | | | $ | 7,103,996 | |
Empresa de Energia de Bogota SA | | | 5,363,581 | | | | 3,110,132 | |
Empresa de Telecommunicaciones de Bogota SA | | | 2,532,380 | | | | 494,166 | |
Grupo Argos SA | | | 453,128 | | | | 2,737,648 | |
Grupo Argos SA, PFC Shares | | | 108,995 | | | | 625,964 | |
Grupo Aval Acciones y Valores SA | | | 3,145,485 | | | | 1,337,923 | |
Grupo Aval Acciones y Valores SA, PFC Shares | | | 6,098,800 | | | | 2,625,872 | |
Grupo de Inversiones Suramericana SA | | | 325,070 | | | | 4,176,247 | |
Grupo de Inversiones Suramericana SA, PFC Shares | | | 48,367 | | | | 614,664 | |
Grupo Nutresa SA | | | 582,655 | | | | 4,475,114 | |
Grupo Odinsa SA(1) | | | 74,829 | | | | 188,242 | |
Interconexion Electrica SA | | | 901,290 | | | | 2,215,671 | |
ISAGEN SA ESP | | | 2,296,200 | | | | 2,336,065 | |
| | | | | | | | | |
| | | | | | $ | 54,736,381 | |
| | | | | | | | | |
|
Croatia — 0.8% | |
AD Plastik DD | | | 35,190 | | | $ | 547,622 | |
Adris Grupa DD, PFC Shares | | | 75,044 | | | | 4,378,024 | |
Atlantic Grupa DD | | | 13,898 | | | | 1,798,315 | |
Atlantska Plovidba DD(1) | | | 22,867 | | | | 717,594 | |
Dalekovod DD(1) | | | 136,610 | | | | 337,502 | |
Ericsson Nikola Tesla DD | | | 6,740 | | | | 1,120,461 | |
Hrvatski Telekom DD | | | 453,186 | | | | 10,273,662 | |
INA Industrija Nafte DD | | | 900 | | | | 455,209 | |
Koncar-Elektroindustrija DD | | | 17,382 | | | | 1,668,703 | |
Kras DD(1) | | | 7,262 | | | | 479,860 | |
Ledo DD | | | 1,669 | | | | 2,120,167 | |
Petrokemija DD(1) | | | 25,975 | | | | 63,631 | |
Podravka Prehrambena Industrija DD(1) | | | 50,669 | | | | 2,339,252 | |
Privredna Banka Zagreb DD | | | 3,177 | | | | 283,112 | |
Valamar Riviera DD | | | 1,445,688 | | | | 4,714,034 | |
Zagrebacka Banka DD | | | 194,885 | | | | 1,189,654 | |
| | | | | | | | | |
| | | | | | $ | 32,486,802 | |
| | | | | | | | | |
|
Czech Republic — 1.3% | |
CEZ AS | | | 908,060 | | | $ | 21,997,335 | |
Fortuna Entertainment Group NV(1) | | | 246,600 | | | | 780,110 | |
Komercni Banka AS | | | 90,019 | | | | 20,143,617 | |
Pegas Nonwovens SA | | | 96,614 | | | | 3,199,810 | |
Philip Morris CR AS | | | 8,877 | | | | 3,855,015 | |
Unipetrol AS(1) | | | 289,352 | | | | 2,194,008 | |
| | | | | | | | | |
| | | | | | $ | 52,169,895 | |
| | | | | | | | | |
|
Egypt — 1.6% | |
Alexandria Mineral Oils Co. | | | 193,820 | | | $ | 947,330 | |
| | | | | | | | |
| Security | | Shares | | | Value | |
| | | | | | | | |
|
Egypt (continued) | |
Arab Cotton Ginning | | | 1,993,380 | | | $ | 804,727 | |
Citadel Capital SAE(1) | | | 2,280,400 | | | | 575,029 | |
Commercial International Bank Egypt SAE | | | 2,449,586 | | | | 17,536,586 | |
Eastern Tobacco | | | 281,822 | | | | 7,755,235 | |
Egypt Kuwait Holding Co. SAE | | | 1,862,146 | | | | 1,155,046 | |
Egyptian Financial Group-Hermes
Holding Co.(1) | | | 1,981,023 | | | | 2,734,157 | |
Egyptian Resorts Co.(1) | | | 4,721,950 | | | | 671,756 | |
El Ezz Aldekhela Steel Alexandria | | | 4,000 | | | | 198,761 | |
ElSewedy Electric Co.(1) | | | 529,606 | | | | 3,143,203 | |
Ezz Steel(1) | | | 1,548,345 | | | | 1,655,605 | |
Global Telecom Holding SAE(1) | | | 12,928,866 | | | | 4,250,286 | |
Juhayna Food Industries | | | 4,494,565 | | | | 4,721,751 | |
Maridive & Oil Services SAE(1) | | | 2,013,484 | | | | 766,668 | |
Misr Beni-Suef Cement Co.(1) | | | 69,150 | | | | 346,557 | |
Orascom Telecom Media and Technology Holding SAE(1) | | | 21,964,609 | | | | 2,425,652 | |
Oriental Weavers Co. | | | 936,875 | | | | 1,283,694 | |
Palm Hills Developments SAE(1) | | | 3,395,160 | | | | 1,085,619 | |
Pioneers Holding(1) | | | 761,635 | | | | 847,399 | |
QNB Alahli Bank SAE(1) | | | 234,568 | | | | 1,047,614 | |
Sidi Kerir Petrochemicals Co. | | | 1,686,400 | | | | 2,864,408 | |
Six of October Development &
Investment Co.(1) | | | 382,178 | | | | 523,582 | |
South Valley Cement | | | 704,261 | | | | 438,251 | |
Talaat Moustafa Group | | | 4,487,196 | | | | 4,711,850 | |
Telecom Egypt | | | 1,949,337 | | | | 1,975,261 | |
| | | | | | | | | |
| | | | | | $ | 64,466,027 | |
| | | | | | | | | |
|
Estonia — 0.2% | |
AS Merko Ehitus | | | 50,618 | | | $ | 463,264 | |
AS Tallink Grupp | | | 3,623,652 | | | | 2,990,640 | |
AS Tallinna Kaubamaja Grupp | | | 137,340 | | | | 908,290 | |
AS Tallinna Vesi | | | 58,790 | | | | 859,039 | |
Nordecon AS | | | 145,374 | | | | 170,744 | |
Olympic Entertainment Group AS | | | 503,790 | | | | 1,063,015 | |
| | | | | | | | | |
| | | | | | $ | 6,454,992 | |
| | | | | | | | | |
|
Ghana — 0.1% | |
Aluworks Ghana, Ltd.(1) | | | 457,409 | | | $ | 7,184 | |
CAL Bank, Ltd. | | | 1,298,010 | | | | 352,446 | |
Ghana Commercial Bank, Ltd. | | | 1,554,441 | | | | 1,798,961 | |
Produce Buying Co., Ltd.(1) | | | 582,428 | | | | 17,578 | |
Standard Chartered Bank of Ghana, Ltd. | | | 148,200 | | | | 736,842 | |
| | | | | | | | | |
| | | | | | $ | 2,913,011 | |
| | | | | | | | | |
| | | | |
| | 10 | | See Notes to Financial Statements. |
Parametric Emerging Markets Fund
July 31, 2015
Portfolio of Investments (Unaudited) — continued
| | | | | | | | |
| Security | | Shares | | | Value | |
| | | | | | | | |
|
Greece (4) — 1.5% | |
Aegean Airlines SA | | | 46,112 | | | $ | 259,569 | |
Aegean Marine Petroleum Network, Inc. | | | 91,225 | | | | 997,089 | |
Alpha Bank AE(1) | | | 6,440,984 | | | | 1,889,119 | |
Athens Water Supply & Sewage Co. SA (The) | | | 208,817 | | | | 1,110,783 | |
Costamare, Inc. | | | 93,419 | | | | 1,590,926 | |
Diana Shipping, Inc.(1) | | | 260,777 | | | | 1,968,866 | |
DryShips, Inc.(1) | | | 1,762,212 | | | | 928,333 | |
Ellaktor SA(1) | | | 593,062 | | | | 1,010,165 | |
Eurobank Ergasias SA(1) | | | 14,183,453 | | | | 1,860,359 | |
FF Group(1) | | | 82,904 | | | | 1,827,434 | |
Frigoglass SAIC(1) | | | 104,857 | | | | 200,571 | |
GasLog, Ltd. | | | 102,055 | | | | 1,583,894 | |
GEK Terna Holding Real Estate Construction SA(1) | | | 381,049 | | | | 621,276 | |
Grivalia Properties REIC AE | | | 14,830 | | | | 99,419 | |
Hellenic Exchanges - Athens Stock Exchange SA(1) | | | 180,829 | | | | 764,252 | |
Hellenic Petroleum SA | | | 248,848 | | | | 1,060,793 | |
Hellenic Telecommunications Organization SA | | | 1,105,808 | | | | 8,259,320 | |
Intralot SA(1) | | | 418,837 | | | | 648,552 | |
JUMBO SA | | | 287,375 | | | | 1,942,243 | |
Marfin Investment Group Holdings SA(1) | | | 1,854,199 | | | | 229,693 | |
Metka SA | | | 108,300 | | | | 768,452 | |
Motor Oil (Hellas) Corinth Refineries SA | | | 219,453 | | | | 1,699,070 | |
Mytilineos Holdings SA(1) | | | 497,581 | | | | 2,624,177 | |
National Bank of Greece SA(1) | | | 2,148,775 | | | | 2,348,675 | |
Navios Maritime Acquisition Corp. | | | 202,800 | | | | 803,088 | |
Navios Maritime Holdings, Inc. | | | 286,986 | | | | 1,061,848 | |
OPAP SA | | | 528,742 | | | | 3,761,366 | |
Piraeus Bank SA(1) | | | 3,473,666 | | | | 1,265,608 | |
Public Power Corp. SA(1) | | | 1,208,704 | | | | 5,185,511 | |
Safe Bulkers, Inc. | | | 176,900 | | | | 608,536 | |
StealthGas, Inc.(1) | | | 122,975 | | | | 692,349 | |
Terna Energy SA(1) | | | 112,955 | | | | 315,860 | |
Titan Cement Co. SA | | | 266,462 | | | | 5,193,974 | |
Tsakos Energy Navigation, Ltd. | | | 188,400 | | | | 1,718,208 | |
Viohalco SA(1) | | | 223,488 | | | | 565,913 | |
| | | | | | | | | |
| | | | | | $ | 57,465,291 | |
| | | | | | | | | |
|
Hungary — 1.6% | |
Magyar Telekom Telecommunications PLC(1) | | | 5,561,100 | | | $ | 8,053,957 | |
MOL Hungarian Oil & Gas Rt. | | | 280,600 | | | | 14,781,322 | |
OTP Bank Rt. | | | 1,063,830 | | | | 21,801,510 | |
Richter Gedeon Nyrt. | | | 1,061,000 | | | | 17,046,414 | |
| | | | | | | | | |
| | | | | | $ | 61,683,203 | |
| | | | | | | | | |
| | | | | | | | |
| Security | | Shares | | | Value | |
| | | | | | | | |
|
India — 6.1% | |
ABB India, Ltd. | | | 19,900 | | | $ | 429,984 | |
ACC, Ltd. | | | 45,970 | | | | 994,056 | |
Adani Enterprises, Ltd. | | | 180,900 | | | | 245,148 | |
Adani Ports and Special Economic Zone, Ltd. | | | 1,425,552 | | | | 7,229,347 | |
Adani Power, Ltd.(1) | | | 556,250 | | | | 237,527 | |
Adani Transmissions, Ltd.(1) | | | 299,124 | | | | 128,759 | |
Aditya Birla Nuvo, Ltd. | | | 17,702 | | | | 603,696 | |
Ambuja Cements, Ltd. | | | 522,500 | | | | 1,898,478 | |
Amtek Auto, Ltd. | | | 152,500 | | | | 400,316 | |
Asian Paints, Ltd. | | | 249,700 | | | | 3,437,254 | |
Axis Bank, Ltd. | | | 240,800 | | | | 2,157,109 | |
Bajaj Auto, Ltd. | | | 59,560 | | | | 2,342,777 | |
Bank of Baroda | | | 262,300 | | | | 729,423 | |
Bank of India | | | 247,400 | | | | 631,797 | |
Bharat Forge, Ltd. | | | 63,650 | | | | 1,138,102 | |
Bharat Heavy Electricals, Ltd. | | | 659,700 | | | | 2,860,372 | |
Bharat Petroleum Corp., Ltd. | | | 190,100 | | | | 2,766,622 | |
Bharti Airtel, Ltd. | | | 2,225,936 | | | | 14,551,662 | |
Biocon, Ltd. | | | 101,600 | | | | 723,896 | |
Cairn India, Ltd. | | | 423,700 | | | | 1,141,330 | |
Canara Bank, Ltd. | | | 127,831 | | | | 549,170 | |
Cipla, Ltd. | | | 287,310 | | | | 3,175,318 | |
Coal India, Ltd. | | | 402,200 | | | | 2,758,076 | |
Colgate-Palmolive (India), Ltd. | | | 44,900 | | | | 1,379,049 | |
Container Corp. of India, Ltd. | | | 54,240 | | | | 1,391,768 | |
Crompton Greaves, Ltd. | | | 213,600 | | | | 614,147 | |
Cummins India, Ltd. | | | 49,900 | | | | 778,521 | |
Dabur India, Ltd. | | | 504,400 | | | | 2,312,046 | |
Divi’s Laboratories, Ltd. | | | 46,800 | | | | 1,433,068 | |
DLF, Ltd. | | | 445,700 | | | | 799,134 | |
Dr. Reddy’s Laboratories, Ltd. | | | 73,620 | | | | 4,701,857 | |
Essar Oil, Ltd.(1) | | | 274,130 | | | | 824,978 | |
GAIL (India), Ltd. | | | 585,050 | | | | 3,237,254 | |
GlaxoSmithKline Pharmaceuticals, Ltd. | | | 8,680 | | | | 479,190 | |
Glenmark Pharmaceuticals, Ltd. | | | 125,460 | | | | 1,971,154 | |
GMR Infrastructure, Ltd. | | | 1,721,400 | | | | 378,040 | |
Grasim Industries, Ltd. | | | 8,158 | | | | 523,488 | |
Gujarat State Petronet, Ltd. | | | 383,800 | | | | 773,602 | |
HCL Technologies, Ltd. | | | 235,090 | | | | 3,668,255 | |
HDFC Bank, Ltd. | | | 291,973 | | | | 5,912,168 | |
Hero MotoCorp, Ltd. | | | 60,900 | | | | 2,551,262 | |
Hindalco Industries, Ltd. | | | 515,910 | | | | 845,079 | |
Hindustan Petroleum Corp., Ltd. | | | 131,400 | | | | 1,894,334 | |
Hindustan Unilever, Ltd. | | | 691,300 | | | | 9,942,425 | |
Hindustan Zinc, Ltd. | | | 148,400 | | | | 362,944 | |
Housing Development Finance Corp., Ltd. | | | 343,661 | | | | 7,161,923 | |
| | | | |
| | 11 | | See Notes to Financial Statements. |
Parametric Emerging Markets Fund
July 31, 2015
Portfolio of Investments (Unaudited) — continued
| | | | | | | | |
| Security | | Shares | | | Value | |
| | | | | | | | |
|
India (continued) | |
ICICI Bank, Ltd. | | | 516,934 | | | $ | 2,433,378 | |
IDBI Bank, Ltd. | | | 367,000 | | | | 375,304 | |
Idea Cellular, Ltd. | | | 1,816,900 | | | | 4,906,434 | |
IDFC, Ltd. | | | 260,034 | | | | 606,944 | |
IFCI, Ltd. | | | 1,152,200 | | | | 446,110 | |
Indiabulls Housing Finance, Ltd. | | | 40,115 | | | | 462,384 | |
Indiabulls Real Estate, Ltd.(1) | | | 646,300 | | | | 633,102 | |
Indian Hotels Co., Ltd.(1) | | | 164,280 | | | | 241,232 | |
Indian Oil Corp., Ltd. | | | 158,900 | | | | 1,076,861 | |
Infosys, Ltd. | | | 672,068 | | | | 11,319,711 | |
ITC, Ltd. | | | 1,313,460 | | | | 6,667,857 | |
Jaiprakash Associates, Ltd.(1) | | | 658,200 | | | | 98,960 | |
Jindal Steel & Power, Ltd. | | | 268,800 | | | | 329,317 | |
JSW Steel, Ltd. | | | 135,800 | | | | 1,758,218 | |
Kotak Mahindra Bank, Ltd. | | | 167,800 | | | | 1,820,554 | |
Larsen & Toubro, Ltd. | | | 253,560 | | | | 7,074,358 | |
LIC Housing Finance, Ltd. | | | 49,663 | | | | 386,129 | |
Lupin, Ltd. | | | 148,500 | | | | 3,933,239 | |
Mahindra & Mahindra, Ltd. | | | 226,260 | | | | 4,788,776 | |
Maruti Suzuki India, Ltd. | | | 67,750 | | | | 4,731,409 | |
Nestle India, Ltd. | | | 11,930 | | | | 1,180,991 | |
NMDC, Ltd. | | | 86,003 | | | | 136,858 | |
NTPC, Ltd. | | | 2,533,900 | | | | 5,353,593 | |
Oil & Natural Gas Corp., Ltd. | | | 1,309,993 | | | | 5,566,974 | |
Oracle Financial Services Software, Ltd. | | | 16,500 | | | | 1,038,861 | |
Piramal Enterprises, Ltd. | | | 76,807 | | | | 1,097,127 | |
Power Grid Corporation of India, Ltd. | | | 2,181,400 | | | | 4,820,197 | |
Reliance Capital, Ltd. | | | 36,735 | | | | 222,828 | |
Reliance Communications, Ltd.(1) | | | 1,412,060 | | | | 1,548,703 | |
Reliance Industries, Ltd. | | | 867,245 | | | | 13,536,283 | |
Reliance Infrastructure, Ltd. | | | 227,600 | | | | 1,464,773 | |
Reliance Power, Ltd.(1) | | | 1,400,250 | | | | 927,772 | |
Siemens, Ltd. | | | 47,180 | | | | 1,071,038 | |
State Bank of India | | | 315,179 | | | | 1,322,305 | |
Steel Authority of India, Ltd. | | | 513,200 | | | | 450,414 | |
Sun Pharmaceutical Industries, Ltd. | | | 660,568 | | | | 8,457,622 | |
Sun TV Network, Ltd. | | | 147,473 | | | | 773,212 | |
Suzlon Energy, Ltd.(1) | | | 2,099,450 | | | | 706,148 | |
Tata Communications, Ltd. | | | 127,400 | | | | 892,924 | |
Tata Consultancy Services, Ltd. | | | 176,727 | | | | 6,916,624 | |
Tata Global Beverages, Ltd. | | | 279,500 | | | | 609,652 | |
Tata Motors, Ltd.(1) | | | 742,250 | | | | 4,441,307 | |
Tata Power Co., Ltd. | | | 1,776,918 | | | | 1,895,158 | |
Tata Steel, Ltd. | | | 149,296 | | | | 572,673 | |
Tech Mahindra, Ltd. | | | 160,844 | | | | 1,326,463 | |
Titan Co., Ltd. | | | 234,100 | | | | 1,192,007 | |
| | | | | | | | |
| Security | | Shares | | | Value | |
| | | | | | | | |
|
India (continued) | |
UltraTech Cement, Ltd. | | | 58,600 | | | $ | 2,874,867 | |
Unitech, Ltd.(1) | | | 2,836,900 | | | | 333,467 | |
United Spirits, Ltd.(1) | | | 29,285 | | | | 1,694,772 | |
UPL, Ltd. | | | 180,700 | | | | 1,506,239 | |
Vedanta, Ltd. | | | 790,212 | | | | 1,598,349 | |
Voltas, Ltd. | | | 296,300 | | | | 1,468,868 | |
Wipro, Ltd. | | | 372,279 | | | | 3,316,249 | |
Yes Bank, Ltd. | | | 55,200 | | | | 713,184 | |
Zee Entertainment Enterprises, Ltd. | | | 373,114 | | | | 2,325,613 | |
| | | | | | | | | |
| | | $ | 242,510,297 | |
| | | | | | | | | |
|
Indonesia — 2.8% | |
Adaro Energy Tbk PT | | | 51,915,400 | | | $ | 2,263,200 | |
AKR Corporindo Tbk PT | | | 5,472,400 | | | | 2,324,570 | |
Aneka Tambang Persero Tbk PT(1) | | | 10,251,500 | | | | 359,295 | |
Astra Argo Lestari Tbk PT | | | 775,000 | | | | 1,149,453 | |
Astra International Tbk PT | | | 16,851,600 | | | | 8,275,011 | |
Bank Central Asia Tbk PT | | | 8,293,200 | | | | 8,027,494 | |
Bank Danamon Indonesia Tbk PT | | | 4,504,303 | | | | 1,398,374 | |
Bank Mandiri Tbk PT | | | 5,275,700 | | | | 3,703,930 | |
Bank Negara Indonesia Persero Tbk PT | | | 5,815,300 | | | | 2,043,902 | |
Bank Pan Indonesia Tbk PT(1) | | | 4,945,000 | | | | 388,835 | |
Bank Pembangunan Daerah Jawa Barat Dan Banten Tbk PT | | | 12,193,000 | | | | 725,868 | |
Bank Rakyat Indonesia Tbk PT | | | 5,805,000 | | | | 4,288,572 | |
Bank Tabungan Negara Tbk PT | | | 10,171,500 | | | | 879,203 | |
Berlian Laju Tanker Tbk PT(1)(3) | | | 7,544,500 | | | | 0 | |
Bumi Resources Tbk PT(1) | | | 37,563,000 | | | | 138,768 | |
Bumi Serpong Damai Tbk PT | | | 13,777,500 | | | | 1,820,390 | |
Charoen Pokphand Indonesia Tbk PT | | | 8,948,300 | | | | 1,674,872 | |
Energi Mega Persada Tbk PT(1) | | | 64,369,200 | | | | 266,107 | |
Gudang Garam Tbk PT | | | 660,000 | | | | 2,413,556 | |
Harum Energy Tbk PT | | | 2,626,500 | | | | 193,236 | |
Holcim Indonesia Tbk PT | | | 3,029,000 | | | | 317,908 | |
Indo Tambangraya Megah Tbk PT | | | 1,056,300 | | | | 757,360 | |
Indocement Tunggal Prakarsa Tbk PT | | | 2,435,200 | | | | 3,599,560 | |
Indofood Sukses Makmur Tbk PT | | | 4,564,300 | | | | 2,056,719 | |
Indosat Tbk PT(1) | | | 2,794,500 | | | | 888,181 | |
Jasa Marga (Persero) Tbk PT | | | 3,198,000 | | | | 1,353,421 | |
Kalbe Farma Tbk PT | | | 57,805,000 | | | | 7,449,804 | |
Lippo Karawaci Tbk PT | | | 28,867,500 | | | | 2,463,204 | |
Matahari Putra Prima Tbk PT | | | 7,240,000 | | | | 1,551,309 | |
Medco Energi Internasional Tbk PT | | | 4,497,500 | | | | 854,165 | |
Media Nusantara Citra Tbk PT | | | 3,201,000 | | | | 483,531 | |
MNC Investama Tbk PT | | | 49,042,500 | | | | 1,036,415 | |
Pembangunan Perumahan Persero Tbk PT | | | 9,145,000 | | | | 2,635,265 | |
| | | | |
| | 12 | | See Notes to Financial Statements. |
Parametric Emerging Markets Fund
July 31, 2015
Portfolio of Investments (Unaudited) — continued
| | | | | | | | |
| Security | | Shares | | | Value | |
| | | | | | | | |
|
Indonesia (continued) | |
Perusahaan Gas Negara Tbk PT | | | 23,109,700 | | | $ | 6,826,770 | |
Perusahaan Perkebunan London Sumatra Indonesia Tbk PT | | | 7,185,000 | | | | 718,644 | |
Semen Indonesia Persero Tbk PT | | | 5,479,200 | | | | 4,088,155 | |
Sigmagold Inti Perkasa Tbk PT(1) | | | 17,097,000 | | | | 554,738 | |
Siloam International Hospitals Tbk PT | | | 976,400 | | | | 1,194,233 | |
Sugih Energy Tbk PT(1) | | | 28,308,700 | | | | 832,910 | |
Surya Semesta Internusa Tbk PT | | | 14,275,000 | | | | 833,072 | |
Tambang Batubara Bukit Asam Tbk PT | | | 2,672,800 | | | | 1,184,716 | |
Telekomunikasi Indonesia Tbk PT | | | 60,071,500 | | | | 13,036,791 | |
Tower Bersama Infrastructure Tbk PT(1) | | | 2,871,000 | | | | 1,777,919 | |
Trada Maritime Tbk PT(1) | | | 10,350,500 | | | | 38,253 | |
Unilever Indonesia Tbk PT | | | 1,486,800 | | | | 4,396,545 | |
United Tractors Tbk PT | | | 3,690,783 | | | | 5,505,431 | |
Vale Indonesia Tbk PT | | | 5,222,500 | | | | 754,874 | |
Wijaya Karya Persero Tbk PT | | | 6,522,800 | | | | 1,278,378 | |
XL Axiata Tbk PT(1) | | | 4,954,500 | | | | 1,084,576 | |
| | | | | | | | | |
| | | | | | $ | 111,887,483 | |
| | | | | | | | | |
|
Jordan — 0.8% | |
Al Eqbal Co. for Investment PLC | | | 92,532 | | | $ | 1,831,359 | |
Alia The Royal Jordanian Airlines PLC(1)(3) | | | 454,236 | | | | 185,965 | |
Arab Bank PLC | | | 1,560,600 | | | | 13,520,498 | |
Arab Potash Co. PLC | | | 68,846 | | | | 2,279,163 | |
Bank of Jordan | | | 214,422 | | | | 756,433 | |
Cairo Amman Bank | | | 278,672 | | | | 899,804 | |
Capital Bank of Jordan | | | 406,376 | | | | 682,487 | |
Jordan Ahli Bank | | | 921,899 | | | | 1,509,839 | |
Jordan Dubai Islamic Bank(1) | | | 301,685 | | | | 389,688 | |
Jordan Islamic Bank | | | 369,023 | | | | 1,828,265 | |
Jordan Petroleum Refinery | | | 567,373 | | | | 3,832,339 | |
Jordan Phosphate Mines(1) | | | 183,247 | | | | 1,528,759 | |
Jordan Steel(1) | | | 453,091 | | | | 363,829 | |
Jordan Telecommunications Co. | | | 316,230 | | | | 1,312,185 | |
Jordanian Electric Power Co. | | | 484,781 | | | | 1,725,679 | |
Union Investment Corp. PLC(1) | | | 409,693 | | | | 798,021 | |
| | | | | | | | | |
| | | | | | $ | 33,444,313 | |
| | | | | | | | | |
|
Kazakhstan — 0.7% | |
Halyk Savings Bank of Kazakhstan
JSC GDR(5) | | | 774,972 | | | $ | 6,302,077 | |
KAZ Minerals PLC(1) | | | 2,680,585 | | | | 6,766,871 | |
Kazkommertsbank JSC GDR(1)(5) | | | 360,501 | | | | 1,080,234 | |
KazMunaiGas Exploration Production GDR(5) | | | 629,000 | | | | 5,517,601 | |
Kcell JSC GDR(5) | | | 670,428 | | | | 4,611,608 | |
Nostrum Oil & Gas PLC | | | 340,501 | | | | 2,764,130 | |
| | | | | | | | | |
| | | | | | $ | 27,042,521 | |
| | | | | | | | | |
| | | | | | | | |
| Security | | Shares | | | Value | |
| | | | | | | | |
|
Kenya — 0.7% | |
ARM Cement, Ltd. | | | 1,241,600 | | | $ | 764,651 | |
Bamburi Cement Co., Ltd. | | | 606,300 | | | | 917,791 | |
Barclays Bank of Kenya, Ltd. | | | 8,196,160 | | | | 1,120,564 | |
Co-operative Bank of Kenya, Ltd. (The) | | | 8,936,200 | | | | 1,701,597 | |
East African Breweries, Ltd. | | | 2,127,780 | | | | 6,129,571 | |
Equity Group Holdings, Ltd. | | | 8,739,600 | | | | 3,328,465 | |
KenolKobil, Ltd. | | | 4,090,000 | | | | 329,874 | |
Kenya Airways, Ltd.(1) | | | 1,264,800 | | | | 70,395 | |
Kenya Commercial Bank, Ltd. | | | 6,729,920 | | | | 3,286,150 | |
Kenya Electricity Generating Co., Ltd. | | | 5,488,800 | | | | 444,601 | |
Kenya Power & Lighting, Ltd. | | | 9,484,354 | | | | 1,472,456 | |
Nation Media Group, Ltd. | | | 407,184 | | | | 747,809 | |
Safaricom, Ltd. | | | 50,844,772 | | | | 7,148,366 | |
Standard Chartered Bank Kenya, Ltd. | | | 149,188 | | | | 385,998 | |
| | | | | | | | | |
| | | | | | $ | 27,848,288 | |
| | | | | | | | | |
|
Kuwait — 1.6% | |
Agility Public Warehousing Co. KSC | | | 2,823,507 | | | $ | 6,058,402 | |
Ahli United Bank | | | 366,855 | | | | 666,462 | |
Al Ahli Bank of Kuwait KSCP | | | 510,925 | | | | 607,536 | |
Al Safat Energy Holding Co. KSC(1) | | | 1,880,000 | | | | 120,481 | |
ALAFCO Aviation Lease and Finance Co. KSCP | | | 1,327,500 | | | | 982,236 | |
Boubyan Bank KSCP | | | 561,188 | | | | 786,998 | |
Boubyan Petrochemicals Co. | | | 2,155,914 | | | | 4,060,325 | |
Burgan Bank SAK | | | 1,027,040 | | | | 1,407,365 | |
Combined Group Contracting Co. KSC | | | 84,551 | | | | 226,883 | |
Commercial Bank of Kuwait KSCP | | | 405,150 | | | | 803,731 | |
Commercial Real Estate Co. KSCC | | | 2,296,205 | | | | 659,737 | |
Gulf Bank(1) | | | 2,050,525 | | | | 1,899,027 | |
Gulf Cable and Electrical Industries Co. KSC | | | 424,072 | | | | 699,676 | |
Jazeera Airways Co. KSC | | | 339,700 | | | | 526,220 | |
Kuwait Cement Co. | | | 533,870 | | | | 634,282 | |
Kuwait Finance House KSCP | | | 2,532,187 | | | | 5,272,946 | |
Kuwait Food Co. (Americana) SAK | | | 484,700 | | | | 4,511,746 | |
Kuwait International Bank | | | 974,124 | | | | 778,237 | |
Kuwait Pipes Industries & Oil Services Co.(1)(3) | | | 1,188,500 | | | | 0 | |
Kuwait Portland Cement Co. KSC | | | 267,750 | | | | 1,049,696 | |
Kuwait Projects Co. Holdings KSC | | | 927,112 | | | | 2,082,522 | |
Kuwait Real Estate Co. KSC | | | 3,694,155 | | | | 852,908 | |
Mabanee Co. SAK | | | 964,643 | | | | 3,151,889 | |
Mobile Telecommunications Co. | | | 7,452,608 | | | | 10,183,204 | |
National Bank of Kuwait SAK | | | 2,715,898 | | | | 7,629,695 | |
National Industries Group Holding SAK | | | 4,323,111 | | | | 2,512,602 | |
National Investment Co. | | | 1,510,000 | | | | 638,454 | |
National Ranges Co. KPSC(1) | | | 2,219,111 | | | | 212,624 | |
Qurain Petrochemical Industries Co. KSC | | | 3,195,160 | | | | 2,068,374 | |
| | | | |
| | 13 | | See Notes to Financial Statements. |
Parametric Emerging Markets Fund
July 31, 2015
Portfolio of Investments (Unaudited) — continued
| | | | | | | | |
| Security | | Shares | | | Value | |
| | | | | | | | |
|
Kuwait (continued) | |
Sultan Center Food Products Co.(1) | | | 4,020,000 | | | $ | 1,076,032 | |
VIVA Kuwait Telecom Co.(1) | | | 910,400 | | | | 2,807,755 | |
| | | | | | | | | |
| | | | | | $ | 64,968,045 | |
| | | | | | | | | |
|
Latvia — 0.0%(2) | |
Grindeks | | | 42,000 | | | $ | 261,998 | |
Latvian Shipping Co.(1) | | | 405,000 | | | | 171,085 | |
| | | | | | | | | |
| | | | | | $ | 433,083 | |
| | | | | | | | | |
|
Lebanon — 0.1% | |
Solidere GDR(5) | | | 327,361 | | | $ | 3,664,357 | |
Solidere, Class A | | | 88,066 | | | | 979,357 | |
Solidere, Class B | | | 1,760 | | | | 19,201 | |
| | | | | | | | | |
| | | | | | $ | 4,662,915 | |
| | | | | | | | | |
|
Lithuania — 0.1% | |
Apranga PVA | | | 278,536 | | | $ | 834,323 | |
Klaipedos Nafta AB | | | 1,345,900 | | | | 584,468 | |
Lesto AB | | | 118,064 | | | | 119,715 | |
Pieno Zvaigzdes | | | 104,200 | | | | 174,408 | |
Rokiskio Suris(1) | | | 122,500 | | | | 195,198 | |
Siauliu Bankas | | | 949,231 | | | | 308,648 | |
| | | | | | | | | |
| | | | | | $ | 2,216,760 | |
| | | | | | | | | |
|
Malaysia — 3.0% | |
Aeon Co. (M) Bhd | | | 661,200 | | | $ | 482,364 | |
Airasia Bhd | | | 1,228,200 | | | | 436,758 | |
Alliance Financial Group Bhd | | | 560,300 | | | | 621,099 | |
AMMB Holdings Bhd | | | 887,900 | | | | 1,297,011 | |
Astro Malaysia Holdings Bhd | | | 979,300 | | | | 786,268 | |
Axiata Group Bhd | | | 2,706,750 | | | | 4,504,978 | |
Batu Kawan Bhd | | | 210,000 | | | | 1,001,161 | |
Berjaya Corp. Bhd | | | 4,369,700 | | | | 445,332 | |
Berjaya Sports Toto Bhd | | | 824,362 | | | | 717,734 | |
Boustead Holdings Bhd | | | 596,210 | | | | 629,281 | |
British American Tobacco Malaysia Bhd | | | 109,700 | | | | 1,940,858 | |
Bumi Armada Bhd(1) | | | 3,133,350 | | | | 906,374 | |
Bursa Malaysia Bhd | | | 344,900 | | | | 728,550 | |
CIMB Group Holdings Bhd | | | 1,771,500 | | | | 2,490,930 | |
Dialog Group Bhd | | | 5,451,814 | | | | 2,291,341 | |
Digi.com Bhd | | | 1,873,500 | | | | 2,645,750 | |
Felda Global Ventures Holdings Bhd | | | 1,358,400 | | | | 598,388 | |
Gamuda Bhd | | | 2,919,700 | | | | 3,681,966 | |
Genting Bhd | | | 1,448,500 | | | | 3,080,305 | |
Genting Malaysia Bhd | | | 2,155,600 | | | | 2,407,014 | |
| | | | | | | | |
| Security | | Shares | | | Value | |
| | | | | | | | |
|
Malaysia (continued) | |
Genting Plantations Bhd | | | 261,700 | | | $ | 710,595 | |
Hartalega Holdings Bhd | | | 59,300 | | | | 134,053 | |
Hong Leong Bank Bhd | | | 382,900 | | | | 1,358,725 | |
Hong Leong Financial Group Bhd | | | 276,000 | | | | 1,143,501 | |
IHH Healthcare Bhd | | | 4,325,800 | | | | 6,800,954 | |
IJM Corp. Bhd | | | 1,828,190 | | | | 3,255,471 | |
IOI Corp. Bhd | | | 2,439,818 | | | | 2,704,559 | |
IOI Properties Group Bhd | | | 1,044,058 | | | | 521,481 | |
KLCCP Stapled Group | | | 399,100 | | | | 739,479 | |
KNM Group Bhd(1) | | | 5,003,150 | | | | 756,038 | |
Kuala Lumpur Kepong Bhd | | | 358,700 | | | | 2,063,146 | |
Kulim (Malaysia) Bhd | | | 860,000 | | | | 561,907 | |
Lafarge Malaysia Bhd | | | 942,950 | | | | 2,330,766 | |
Magnum Bhd | | | 940,340 | | | | 663,375 | |
Malayan Banking Bhd | | | 1,980,587 | | | | 4,761,372 | |
Malaysia Airports Holdings Bhd | | | 342,800 | | | | 531,430 | |
Malaysia Marine and Heavy Engineering Holdings Bhd(1) | | | 739,000 | | | | 220,017 | |
Malaysian Resources Corp. Bhd | | | 1,423,500 | | | | 402,487 | |
Maxis Bhd | | | 1,737,900 | | | | 3,029,860 | |
Media Prima Bhd | | | 575,000 | | | | 200,246 | |
MISC Bhd | | | 482,400 | | | | 983,540 | |
MMC Corp. Bhd | | | 1,217,800 | | | | 697,845 | |
Mudajaya Group Bhd | | | 510,600 | | | | 156,194 | |
Nestle Malaysia Bhd | | | 12,300 | | | | 231,510 | |
Parkson Holdings Bhd(1) | | | 958,655 | | | | 336,557 | |
Petronas Chemicals Group Bhd | | | 4,123,000 | | | | 6,908,749 | |
Petronas Dagangan Bhd | | | 507,500 | | | | 2,797,196 | |
Petronas Gas Bhd | | | 378,800 | | | | 2,182,096 | |
PPB Group Bhd | | | 404,100 | | | | 1,632,425 | |
Press Metal Bhd | | | 1,469,400 | | | | 944,388 | |
Public Bank Bhd | | | 837,820 | | | | 4,161,877 | |
RHB Capital Bhd | | | 733,900 | | | | 1,426,841 | |
Sapurakencana Petroleum Bhd | | | 5,340,168 | | | | 3,413,345 | |
Silverlake Axis, Ltd. | | | 703,200 | | | | 498,484 | |
Sime Darby Bhd | | | 3,863,639 | | | | 8,812,515 | |
Sunway Bhd | | | 304,600 | | | | 276,271 | |
Sunway Construction Group Bhd(1) | | | 30,460 | | | | 9,398 | |
Supermax Corp. Bhd | | | 1,732,700 | | | | 1,114,895 | |
TA Enterprise Bhd | | | 1,323,000 | | | | 236,750 | |
Tan Chong Motor Holdings Bhd | | | 265,900 | | | | 191,821 | |
Telekom Malaysia Bhd | | | 1,249,900 | | | | 2,141,017 | |
Tenaga Nasional Bhd | | | 2,361,125 | | | | 7,526,922 | |
Top Glove Corp. Bhd | | | 713,900 | | | | 1,423,067 | |
UEM Sunrise Bhd | | | 1,683,050 | | | | 428,482 | |
UMW Holdings Bhd | | | 448,400 | | | | 1,172,759 | |
| | | | |
| | 14 | | See Notes to Financial Statements. |
Parametric Emerging Markets Fund
July 31, 2015
Portfolio of Investments (Unaudited) — continued
| | | | | | | | |
| Security | | Shares | | | Value | |
| | | | | | | | |
|
Malaysia (continued) | |
UMW Oil & Gas Corp. Bhd | | | 549,700 | | | $ | 198,134 | |
Unisem (M) Bhd | | | 2,784,300 | | | | 1,646,979 | |
Wah Seong Corp. Bhd | | | 445,076 | | | | 153,390 | |
WCT Holdings Bhd | | | 1,283,081 | | | | 469,571 | |
YTL Corp. Bhd | | | 2,863,465 | | | | 1,182,964 | |
YTL Power International Bhd | | | 1,883,197 | | | | 773,131 | |
| | | | | | | | | |
| | | | | | $ | 118,712,037 | |
| | | | | | | | | |
|
Mauritius — 0.8% | |
Alteo, Ltd. | | | 637,758 | | | $ | 557,975 | |
CIEL, Ltd. | | | 1,576,086 | | | | 306,295 | |
CIM Financial Services, Ltd. | | | 5,820,100 | | | | 1,449,120 | |
LUX Island Resorts, Ltd. | | | 1,037,348 | | | | 1,800,667 | |
MCB Group, Ltd. | | | 2,411,789 | | | | 15,319,639 | |
New Mauritius Hotels, Ltd.(1) | | | 6,219,198 | | | | 3,337,868 | |
Phoenix Beverages, Ltd. | | | 7,498 | | | | 84,692 | |
Rogers & Co., Ltd. | | | 2,431,349 | | | | 2,051,374 | |
SBM Holdings, Ltd. | | | 212,155,230 | | | | 5,329,487 | |
Sun Resorts, Ltd., Class A(1) | | | 449,032 | | | | 508,164 | |
Terra Mauricia, Ltd. | | | 1,085,900 | | | | 929,207 | |
United Basalt Products, Ltd. | | | 371,540 | | | | 849,459 | |
United Docks, Ltd.(1) | | | 27,400 | | | | 52,444 | |
| | | | | | | | | |
| | | | | | $ | 32,576,391 | |
| | | | | | | | | |
|
Mexico — 6.4% | |
Alfa SAB de CV, Series A | | | 7,983,200 | | | $ | 15,859,875 | |
Alsea SAB de CV | | | 694,800 | | | | 2,250,527 | |
America Movil SAB de CV ADR, Series L | | | 905,400 | | | | 17,546,652 | |
America Movil SAB de CV, Series L | | | 27,725,350 | | | | 26,963,924 | |
Arca Continental SAB de CV | | | 800,314 | | | | 4,806,603 | |
Bolsa Mexicana de Valores SAB de CV | | | 1,503,700 | | | | 2,695,228 | |
Cemex SAB de CV ADR(1) | | | 1,322,136 | | | | 11,238,156 | |
Cemex SAB de CV, Series CPO(1) | | | 10,926,130 | | | | 9,317,302 | |
Coca-Cola Femsa SAB de CV, Series L | | | 359,300 | | | | 2,716,074 | |
Controladora Comercial Mexicana SA de CV | | | 518,500 | | | | 1,522,757 | |
Corporacion GEO SAB de CV, Series B(1)(3) | | | 1,144,000 | | | | 0 | |
Desarrolladora Homex SAB de CV(1)(3) | | | 776,450 | | | | 0 | |
El Puerto de Liverpool SAB de CV | | | 107,300 | | | | 1,258,232 | |
Empresas ICA SAB de CV(1) | | | 2,747,100 | | | | 1,735,639 | |
Fibra Uno Administracion SA de CV | | | 2,173,500 | | | | 5,221,796 | |
Fomento Economico Mexicano SAB de CV ADR | | | 37,200 | | | | 3,371,808 | |
Fomento Economico Mexicano SAB de CV, Series UBD | | | 1,447,100 | | | | 13,130,552 | |
Genomma Lab Internacional SAB de CV(1) | | | 2,778,500 | | | | 2,586,656 | |
Gentera SAB de CV | | | 2,788,400 | | | | 4,800,634 | |
Grupo Aeroportuario del Centro Norte SAB de CV(1) | | | 92,100 | | | | 511,359 | |
| | | | | | | | |
| Security | | Shares | | | Value | |
| | | | | | | | |
|
Mexico (continued) | |
Grupo Aeroportuario del Pacifico SAB de CV, Class B(1) | | | 643,387 | | | $ | 5,077,217 | |
Grupo Aeroportuario del Sureste SAB de CV, Class B | | | 293,800 | | | | 4,392,276 | |
Grupo Bimbo SAB de CV, Series A(1) | | | 2,277,300 | | | | 6,102,952 | |
Grupo Carso SAB de CV, Series A1 | | | 1,061,100 | | | | 4,814,710 | |
Grupo Elektra SAB de CV | | | 101,895 | | | | 2,203,904 | |
Grupo Financiero Banorte SAB de CV, Class O | | | 3,428,600 | | | | 18,112,796 | |
Grupo Financiero Inbursa SAB de CV, Class O | | | 4,951,200 | | | | 11,216,062 | |
Grupo Mexico SAB de CV, Series B | | | 4,508,679 | | | | 12,315,095 | |
Grupo Sanborns SAB de CV | | | 226,889 | | | | 364,290 | |
Grupo Simec SA de CV, Series B(1) | | | 133,800 | | | | 382,902 | |
Grupo Televisa SAB ADR | | | 431,500 | | | | 15,042,090 | |
Grupo Televisa SAB, Series CPO | | | 1,550,600 | | | | 10,801,511 | |
Impulsora del Desarrollo y el Empleo en America Latina SA de CV, Series B1(1) | | | 1,038,200 | | | | 2,016,798 | |
Industrias CH SAB de CV, Series B(1) | | | 225,500 | | | | 797,735 | |
Industrias Penoles SAB de CV | | | 188,600 | | | | 2,874,094 | |
Infraestructura Energetica Nova SAB de CV | | | 180,000 | | | | 875,842 | |
Kimberly-Clark de Mexico SAB de CV, Class A | | | 1,727,100 | | | | 4,009,980 | |
Mexichem SAB de CV | | | 1,483,316 | | | | 4,345,230 | |
Minera Frisco SAB de CV(1) | | | 714,800 | | | | 424,111 | |
OHL Mexico SAB de CV(1) | | | 438,300 | | | | 717,601 | |
Organizacion Soriana SAB de CV, Class B | | | 120,000 | | | | 239,069 | |
Promotora y Operadora de Infraestructura SAB de CV(1) | | | 487,400 | | | | 5,590,769 | |
Ternium SA ADR | | | 46,000 | | | | 715,300 | |
TV Azteca SAB de CV, Series CPO | | | 1,240,300 | | | | 239,400 | |
Urbi Desarrollos Urbanos SAB de CV(1)(3) | | | 2,260,600 | | | | 0 | |
Wal-Mart de Mexico SAB de CV, Series V | | | 5,879,400 | | | | 14,252,870 | |
| | | | | | | | | |
| | | | | | $ | 255,458,378 | |
| | | | | | | | | |
|
Morocco — 0.8% | |
Alliances Developpement Immobilier SA | | | 7,000 | | | $ | 39,076 | |
Attijariwafa Bank | | | 140,404 | | | | 5,082,568 | |
Banque Centrale Populaire | | | 133,714 | | | | 3,080,592 | |
BMCE Bank | | | 97,829 | | | | 2,157,520 | |
Ciments du Maroc | | | 2,591 | | | | 340,416 | |
Delta Holding SA | | | 52,900 | | | | 150,345 | |
Douja Promotion Groupe Addoha SA | | | 278,635 | | | | 816,811 | |
Holcim Maroc SA | | | 12,874 | | | | 2,977,993 | |
Label Vie(1) | | | 2,100 | | | | 272,810 | |
Managem | | | 9,862 | | | | 866,597 | |
Maroc Telecom | | | 655,849 | | | | 7,804,996 | |
Samir | | | 15,717 | | | | 223,683 | |
Societe Lafarge Ciments SA | | | 18,510 | | | | 3,608,379 | |
Sonasid | | | 3,036 | | | | 247,539 | |
| | | | |
| | 15 | | See Notes to Financial Statements. |
Parametric Emerging Markets Fund
July 31, 2015
Portfolio of Investments (Unaudited) — continued
| | | | | | | | |
| Security | | Shares | | | Value | |
| | | | | | | | |
|
Morocco (continued) | |
Taqa Morocco | | | 28,081 | | | $ | 1,593,557 | |
Wafa Assurance | | | 1,600 | | | | 616,447 | |
| | | | | | | | | |
| | | | | | $ | 29,879,329 | |
| | | | | | | | | |
|
Nigeria — 0.7% | |
Access Bank PLC | | | 20,986,349 | | | $ | 502,391 | |
Afriland Properties PLC(1)(3) | | | 1,169,236 | | | | 0 | |
Cadbury Nigeria PLC | | | 397,700 | | | | 66,474 | |
Dangote Cement PLC | | | 2,932,919 | | | | 2,517,447 | |
Dangote Sugar Refinery PLC | | | 5,586,250 | | | | 170,872 | |
Diamond Bank PLC | | | 16,654,000 | | | | 317,682 | |
Ecobank Transnational, Inc.(1) | | | 14,145,874 | | | | 1,351,108 | |
FBN Holdings PLC | | | 35,028,318 | | | | 1,212,126 | |
FCMB Group PLC | | | 23,552,733 | | | | 322,972 | |
Fidelity Bank PLC(1) | | | 22,430,824 | | | | 168,926 | |
Flour Mills of Nigeria PLC | | | 2,057,956 | | | | 303,805 | |
Forte Oil PLC | | | 1,622,126 | | | | 1,533,436 | |
Guaranty Trust Bank PLC | | | 26,287,879 | | | | 3,035,132 | |
Guiness Nigeria PLC | | | 1,109,846 | | | | 696,246 | |
Lafarge Africa PLC | | | 3,755,270 | | | | 1,917,988 | |
Lekoil, Ltd.(1) | | | 1,624,911 | | | | 571,871 | |
Nestle Nigeria PLC | | | 468,973 | | | | 2,096,025 | |
Nigerian Breweries PLC | | | 5,387,207 | | | | 3,276,826 | |
Oando PLC | | | 16,928,421 | | | | 1,081,040 | |
PZ Cussons Nigeria PLC | | | 2,100,282 | | | | 289,931 | |
SEPLAT Petroleum Development Co. PLC(6) | | | 996,758 | | | | 1,534,189 | |
Skye Bank PLC(1) | | | 16,828,665 | | | | 168,047 | |
Stanbic IBTC Holdings PLC | | | 1,977,675 | | | | 214,588 | |
Transnational Corp. of Nigeria PLC | | | 30,056,660 | | | | 310,550 | |
UAC of Nigeria PLC | | | 6,386,813 | | | | 1,218,163 | |
Unilever Nigeria PLC | | | 2,740,833 | | | | 523,304 | |
United Bank for Africa PLC | | | 29,618,308 | | | | 625,096 | |
Zenith Bank PLC | | | 25,817,139 | | | | 2,079,265 | |
| | | | | | | | | |
| | | | | | $ | 28,105,500 | |
| | | | | | | | | |
|
Oman — 0.8% | |
Al Anwar Ceramic Tiles Co. | | | 622,746 | | | $ | 653,621 | |
Bank Dhofar SAOG | | | 1,957,041 | | | | 1,351,466 | |
Bank Muscat SAOG | | | 4,252,852 | | | | 6,123,312 | |
Bank Sohar SAOG | | | 5,741,827 | | | | 3,073,152 | |
Dhofar International Development & Investment Holding SAOG | | | 339,824 | | | | 407,683 | |
Galfar Engineering & Contracting SAOG(1) | | | 2,070,926 | | | | 651,398 | |
HSBC Bank Oman SAOG | | | 1,709,435 | | | | 589,704 | |
National Bank of Oman SAOG | | | 1,655,709 | | | | 1,487,356 | |
| | | | | | | | |
| Security | | Shares | | | Value | |
| | | | | | | | |
|
Oman (continued) | |
Oman Cables Industry SAOG | | | 93,600 | | | $ | 557,590 | |
Oman Cement Co. SAOG | | | 741,260 | | | | 1,001,995 | |
Oman Flour Mills Co. SAOG | | | 561,100 | | | | 740,071 | |
Oman National Investment Corp. Holdings | | | 272,868 | | | | 340,111 | |
Oman Telecommunications Co. SAOG | | | 1,399,971 | | | | 6,380,200 | |
Omani Qatari Telecommunications Co. SAOG | | | 1,800,500 | | | | 3,753,652 | |
Ominvest | | | 1,505,084 | | | | 1,907,248 | |
Raysut Cement Co. SAOG | | | 634,209 | | | | 2,462,694 | |
Renaissance Services SAOG | | | 2,280,925 | | | | 1,632,173 | |
Sembcorp Salalah Power & Water Co. | | | 50,000 | | | | 323,339 | |
Shell Oman Marketing Co. SAOG | | | 34,398 | | | | 179,051 | |
| | | | | | | | | |
| | | | | | $ | 33,615,816 | |
| | | | | | | | | |
|
Pakistan — 0.8% | |
Adamjee Insurance Co., Ltd. | | | 415,744 | | | $ | 229,685 | |
Azgard Nine, Ltd.(1) | | | 1,954,200 | | | | 123,071 | |
Bank Alfalah, Ltd. | | | 1,414,538 | | | | 392,665 | |
D.G. Khan Cement Co., Ltd. | | | 503,732 | | | | 756,006 | |
Engro Corp., Ltd. | | | 465,287 | | | | 1,482,109 | |
Engro Fertilizers, Ltd. | | | 736,028 | | | | 671,218 | |
Engro Foods, Ltd.(1) | | | 1,210,400 | | | | 1,957,317 | |
Fauji Fertilizer Bin Qasim, Ltd. | | | 1,184,000 | | | | 680,547 | |
Fauji Fertilizer Co., Ltd. | | | 1,165,210 | | | | 1,681,459 | |
Habib Bank, Ltd. | | | 291,617 | | | | 668,962 | |
Hub Power Co., Ltd. | | | 4,680,800 | | | | 4,597,928 | |
Kot Addu Power Co., Ltd. | | | 875,900 | | | | 763,690 | |
Lucky Cement, Ltd. | | | 328,200 | | | | 1,791,152 | |
MCB Bank, Ltd. | | | 1,740,030 | | | | 4,787,520 | |
Millat Tractors, Ltd. | | | 139,790 | | | | 913,415 | |
National Bank of Pakistan | | | 803,040 | | | | 449,827 | |
Nishat Mills, Ltd. | | | 1,142,810 | | | | 1,285,914 | |
Oil & Gas Development Co., Ltd. | | | 1,240,991 | | | | 1,985,229 | |
Pakistan Oil Fields, Ltd. | | | 211,100 | | | | 764,835 | |
Pakistan Petroleum, Ltd. | | | 910,577 | | | | 1,385,631 | |
Pakistan State Oil Co., Ltd. | | | 357,320 | | | | 1,302,984 | |
Pakistan Telecommunication Co., Ltd. | | | 3,306,700 | | | | 716,266 | |
SUI Southern Gas Co., Ltd.(1) | | | 1,459,500 | | | | 792,286 | |
United Bank, Ltd. | | | 564,045 | | | | 1,014,236 | |
| | | | | | | | | |
| | | | | | $ | 31,193,952 | |
| | | | | | | | | |
|
Panama — 0.3% | |
Copa Holdings SA, Class A | | | 133,300 | | | $ | 10,068,149 | |
| | | | | | | | | |
| | | | | | $ | 10,068,149 | |
| | | | | | | | | |
| | | | |
| | 16 | | See Notes to Financial Statements. |
Parametric Emerging Markets Fund
July 31, 2015
Portfolio of Investments (Unaudited) — continued
| | | | | | | | |
| Security | | Shares | | | Value | |
| | | | | | | | |
|
Peru — 1.5% | |
Alicorp SAA(1) | | | 3,848,309 | | | $ | 6,401,568 | |
Banco Continental SA | | | 537,580 | | | | 701,903 | |
Casa Grande SAA(1) | | | 99,420 | | | | 182,545 | |
Cementos Pacasmayo SAA | | | 241,600 | | | | 375,355 | |
Cia de Minas Buenaventura SA ADR | | | 470,280 | | | | 3,348,394 | |
Cia Minera Milpo SA | | | 676,862 | | | | 515,172 | |
Credicorp, Ltd. | | | 156,994 | | | | 20,707,509 | |
Edegel SA | | | 1,894,571 | | | | 2,194,208 | |
Edelnor SA | | | 108,248 | | | | 195,357 | |
Energia del Sur SA | | | 120,072 | | | | 333,523 | |
Ferreycorp SAA | | | 6,227,411 | | | | 2,677,742 | |
Grana y Montero SAA | | | 2,096,520 | | | | 2,467,578 | |
Intercorp Financial Services, Inc. | | | 66,690 | | | | 1,906,667 | |
Luz del Sur SAA | | | 548,126 | | | | 1,965,519 | |
Minsur SA | | | 1,961,259 | | | | 732,525 | |
Sociedad Minera Cerro Verde SAA(1) | | | 44,121 | | | | 882,420 | |
Southern Copper Corp. | | | 483,627 | | | | 13,473,848 | |
Union Andina de Cementos SAA | | | 1,014,000 | | | | 768,592 | |
Volcan Cia Minera SAA, Class B | | | 5,911,333 | | | | 964,782 | |
| | | | | | | | | |
| | | | | | $ | 60,795,207 | |
| | | | | | | | | |
|
Philippines — 3.0% | |
Aboitiz Equity Ventures, Inc. | | | 3,611,100 | | | $ | 4,619,472 | |
Aboitiz Power Corp. | | | 4,371,000 | | | | 4,175,266 | |
ABS-CBN Holdings Corp. PDR | | | 138,370 | | | | 182,999 | |
Alliance Global Group, Inc. | | | 4,540,000 | | | | 2,242,445 | |
Ayala Corp. | | | 245,795 | | | | 4,192,586 | |
Ayala Land, Inc. | | | 5,465,000 | | | | 4,465,699 | |
Ayala Land, Inc., PFC Shares(3) | | | 3,951,800 | | | | 0 | |
Bank of the Philippine Islands | | | 1,270,595 | | | | 2,636,892 | |
BDO Unibank, Inc. | | | 1,274,481 | | | | 2,799,487 | |
Bloomberry Resorts Corp. | | | 15,369,700 | | | | 3,260,850 | |
Cosco Capital, Inc. | | | 3,726,300 | | | | 602,744 | |
D&L Industries, Inc. | | | 2,407,000 | | | | 1,133,639 | |
DMCI Holdings, Inc. | | | 8,668,000 | | | | 2,254,708 | |
Emperador, Inc. | | | 4,313,300 | | | | 830,507 | |
Energy Development Corp. | | | 20,767,300 | | | | 3,253,349 | |
Filinvest Land, Inc. | | | 14,494,000 | | | | 599,036 | |
First Gen Corp. | | | 3,778,322 | | | | 2,136,138 | |
First Philippine Holdings Corp. | | | 587,500 | | | | 1,063,659 | |
Globe Telecom, Inc. | | | 45,740 | | | | 2,580,401 | |
GT Capital Holdings, Inc. | | | 67,795 | | | | 2,076,128 | |
Holcim Philippines, Inc. | | | 1,492,000 | | | | 429,042 | |
International Container Terminal Services, Inc. | | | 746,400 | | | | 1,792,577 | |
JG Summit Holding, Inc. | | | 4,019,900 | | | | 6,365,936 | |
Jollibee Foods Corp. | | | 1,179,850 | | | | 4,899,256 | |
| | | | | | | | |
| Security | | Shares | | | Value | |
| | | | | | | | |
|
Philippines (continued) | |
Lopez Holdings Corp. | | | 4,600,000 | | | $ | 725,031 | |
LT Group, Inc. | | | 5,822,400 | | | | 1,890,756 | |
Manila Electric Co. | | | 577,330 | | | | 3,771,554 | |
Manila Water Co. | | | 2,187,700 | | | | 1,194,187 | |
Megaworld Corp. | | | 12,596,000 | | | | 1,304,853 | |
Melco Crown Philippines Resorts Corp.(1) | | | 3,711,400 | | | | 649,195 | |
Metro Pacific Investments Corp. | | | 7,682,400 | | | | 814,759 | |
Metropolitan Bank & Trust Co. | | | 1,171,246 | | | | 2,261,122 | |
Nickel Asia Corp. | | | 5,281,800 | | | | 1,215,804 | |
Pepsi-Cola Products Philippines, Inc. | | | 1,388,000 | | | | 144,839 | |
Petron Corp. | | | 4,267,400 | | | | 932,596 | |
Philex Mining Corp. | | | 6,094,825 | | | | 717,391 | |
Philex Petroleum Corp.(1) | | | 283,500 | | | | 10,162 | |
Philippine Long Distance Telephone Co. | | | 231,120 | | | | 14,645,934 | |
Puregold Price Club, Inc. | | | 2,674,400 | | | | 2,164,041 | |
Robinsons Land Corp. | | | 2,417,100 | | | | 1,487,391 | |
Robinsons Retail Holdings, Inc. | | | 1,269,250 | | | | 2,094,044 | |
San Miguel Corp. | | | 716,000 | | | | 881,102 | |
Security Bank Corp. | | | 243,300 | | | | 791,664 | |
Semirara Mining & Power Co. | | | 1,426,620 | | | | 3,726,529 | |
SM Investments Corp. | | | 359,172 | | | | 7,014,573 | |
SM Prime Holdings, Inc. | | | 9,538,699 | | | | 4,469,920 | |
SSI Group, Inc.(1) | | | 2,061,000 | | | | 391,532 | |
Travellers International Hotel Group, Inc. | | | 3,521,900 | | | | 410,452 | |
Universal Robina Corp. | | | 1,858,330 | | | | 7,776,809 | |
Vista Land & Lifescapes, Inc. | | | 3,675,000 | | | | 568,815 | |
| | | | | | | | | |
| | | | | | $ | 120,647,871 | |
| | | | | | | | | |
|
Poland — 3.2% | |
Agora SA(1) | | | 125,463 | | | $ | 384,782 | |
AmRest Holdings SE(1) | | | 7,766 | | | | 355,370 | |
Asseco Poland SA | | | 512,726 | | | | 7,828,968 | |
Bank Handlowy w Warszawie SA | | | 50,570 | | | | 1,243,328 | |
Bank Millennium SA(1) | | | 687,285 | | | | 1,121,361 | |
Bank Pekao SA | | | 179,638 | | | | 7,578,503 | |
Bank Zachodni WBK SA(1) | | | 16,600 | | | | 1,323,666 | |
Bioton SA(1) | | | 425,302 | | | | 801,515 | |
Boryszew SA | | | 122,670 | | | | 194,291 | |
Budimex SA | | | 27,910 | | | | 1,371,410 | |
CCC SA | | | 43,900 | | | | 2,244,687 | |
Cyfrowy Polsat SA(1) | | | 1,022,728 | | | | 6,260,313 | |
Enea SA | | | 202,800 | | | | 792,575 | |
Eurocash SA | | | 355,800 | | | | 4,089,471 | |
Getin Holding SA(1) | | | 365,918 | | | | 154,347 | |
Getin Noble Bank SA(1) | | | 2,322,186 | | | | 743,967 | |
Grupa Azoty SA(1) | | | 76,370 | | | | 1,718,844 | |
| | | | |
| | 17 | | See Notes to Financial Statements. |
Parametric Emerging Markets Fund
July 31, 2015
Portfolio of Investments (Unaudited) — continued
| | | | | | | | |
| Security | | Shares | | | Value | |
| | | | | | | | |
|
Poland (continued) | |
Grupa Lotos SA(1) | | | 101,253 | | | $ | 846,449 | |
ING Bank Slaski SA | | | 47,450 | | | | 1,576,749 | |
Jastrzebska Spolka Weglowa SA(1) | | | 138,610 | | | | 435,134 | |
KGHM Polska Miedz SA | | | 344,982 | | | | 8,669,530 | |
KOPEX SA | | | 125,900 | | | | 240,149 | |
LPP SA | | | 1,811 | | | | 3,697,998 | |
Lubelski Wegiel Bogdanka SA | | | 49,706 | | | | 690,071 | |
mBank SA(1) | | | 23,504 | | | | 2,355,702 | |
Netia SA | | | 1,111,077 | | | | 1,664,987 | |
Orange Polska SA | | | 2,781,316 | | | | 5,993,552 | |
Orbis SA | | | 30,000 | | | | 470,171 | |
PGE SA | | | 1,874,600 | | | | 8,806,969 | |
PKP Cargo SA | | | 27,389 | | | | 581,997 | |
Polimex-Mostostal SA(1) | | | 9,735,442 | | | | 234,545 | |
Polski Koncern Naftowy Orlen SA | | | 796,258 | | | | 16,058,294 | |
Polskie Gornictwo Naftowe i Gazownictwo SA | | | 3,952,621 | | | | 6,587,065 | |
Powszechna Kasa Oszczednosci Bank Polski SA | | | 1,151,310 | | | | 8,914,417 | |
Powszechny Zaklad Ubezpieczen SA | | | 86,300 | | | | 9,861,775 | |
Synthos SA | | | 844,500 | | | | 1,055,170 | |
Tauron Polska Energia SA | | | 3,279,494 | | | | 3,295,342 | |
TVN SA | | | 918,442 | | | | 4,833,030 | |
| | | | | | | | | |
| | | | | | $ | 125,076,494 | |
| | | | | | | | | |
|
Qatar — 1.6% | |
Aamal Co. QSC | | | 177,687 | | | $ | 715,486 | |
Barwa Real Estate Co. | | | 146,293 | | | | 2,002,481 | |
Doha Bank QSC | | | 100,995 | | | | 1,468,207 | |
Gulf International Services QSC | | | 205,956 | | | | 3,856,144 | |
Industries Qatar | | | 238,919 | | | | 8,871,897 | |
Masraf Al Rayan QSC | | | 692,465 | | | | 8,535,445 | |
Ooredoo QSC | | | 132,696 | | | | 2,942,432 | |
Qatar Electricity & Water Co. QSC | | | 84,058 | | | | 5,100,486 | |
Qatar Gas Transport Co., Ltd. | | | 605,140 | | | | 3,667,819 | |
Qatar Insurance Co. | | | 67,706 | | | | 1,824,902 | |
Qatar International Islamic Bank | | | 45,943 | | | | 979,715 | |
Qatar Islamic Bank | | �� | 98,955 | | | | 2,970,145 | |
Qatar National Bank SAQ | | | 206,274 | | | | 10,322,780 | |
Qatar National Cement Co. QSC | | | 31,625 | | | | 1,035,613 | |
Qatar Navigation QSC | | | 52,421 | | | | 1,433,301 | |
Qatari Investors Group | | | 37,029 | | | | 509,406 | |
United Development Co. QSC | | | 117,835 | | | | 817,978 | |
Vodafone Qatar QSC | | | 1,185,810 | | | | 5,140,409 | |
| | | | | | | | | |
| | | | | | $ | 62,194,646 | |
| | | | | | | | | |
| | | | | | | | |
| Security | | Shares | | | Value | |
| | | | | | | | |
|
Romania — 0.8% | |
Banca Transilvania(1) | | | 16,257,360 | | | $ | 9,703,383 | |
BRD-Groupe Societe Generale SA(1) | | | 2,833,794 | | | | 8,050,160 | |
OMV Petrom SA | | | 45,352,995 | | | | 4,419,792 | |
Societatea Nationala de Gaze Naturale ROMGAZ SA | | | 555,151 | | | | 4,751,494 | |
Societatea Nationala Nuclearelectrica SA | | | 794,100 | | | | 1,481,252 | |
Transelectrica SA | | | 426,930 | | | | 2,911,990 | |
Transgaz SA Medias | | | 27,412 | | | | 1,872,194 | |
| | | | | | | | | |
| | | | | | $ | 33,190,265 | |
| | | | | | | | | |
|
Russia — 5.5% | |
Aeroflot - Russian Airlines (PJSC)(1) | | | 1,876,656 | | | $ | 1,192,907 | |
AK Transneft OAO, PFC Shares | | | 1,847 | | | | 4,170,613 | |
CTC Media, Inc. | | | 628,567 | | | | 1,181,706 | |
E.ON Russia JSC | | | 8,737,000 | | | | 369,248 | |
Eurasia Drilling Co., Ltd. GDR(5) | | | 23,517 | | | | 366,979 | |
Evraz PLC(1) | | | 916,942 | | | | 1,441,912 | |
Federal Grid Co. Unified Energy System (PJSC) | | | 1,585,875,440 | | | | 1,739,085 | |
Gazprom PAO | | | 1,755,200 | | | | 4,041,378 | |
Gazprom PAO ADR | | | 4,478,501 | | | | 20,588,686 | |
Globaltrans Investment PLC GDR(1)(5) | | | 207,458 | | | | 745,811 | |
Inter RAO UES (PJSC) | | | 71,597,070 | | | | 1,319,155 | |
Lenta, Ltd. GDR(1)(5) | | | 133,659 | | | | 1,027,105 | |
LSR Group PJSC GDR(5) | | | 186,400 | | | | 409,060 | |
Lukoil (PJSC) ADR | | | 472,457 | | | | 19,455,095 | |
Luxoft Holding, Inc.(1) | | | 13,100 | | | | 822,156 | |
Magnit PJSC | | | 85,215 | | | | 16,834,597 | |
Magnit PJSC GDR(5) | | | 167,418 | | | | 9,065,987 | |
Magnitogorsk Iron & Steel Works OJSC GDR(5) | | | 105,708 | | | | 428,661 | |
Mail.ru Group, Ltd. GDR(1)(5) | | | 265,535 | | | | 4,970,752 | |
Mechel ADR(1) | | | 378,000 | | | | 368,134 | |
MegaFon PJSC GDR(5) | | | 249,745 | | | | 3,090,409 | |
MMC Norilsk Nickel (PJSC) | | | 2,386 | | | | 363,618 | |
MMC Norilsk Nickel (PJSC) ADR | | | 775,037 | | | | 11,956,969 | |
Mobile TeleSystems (PJSC) | | | 3,400,577 | | | | 12,371,993 | |
Moscow Exchange MICEX-RTS (PJSC) | | | 1,214,410 | | | | 1,388,751 | |
Mosenergo PAO | | | 8,811,603 | | | | 125,525 | |
NovaTek OAO GDR(5) | | | 74,808 | | | | 7,433,600 | |
Novolipetsk Steel GDR(5) | | | 156,893 | | | | 2,059,943 | |
OAO TMK GDR(5) | | | 64,757 | | | | 251,051 | |
O’Key Group SA GDR(5) | | | 15,504 | | | | 41,628 | |
PhosAgro OAO GDR(5) | | | 28,064 | | | | 380,978 | |
PIK Group | | | 12,354 | | | | 34,343 | |
PIK Group GDR(5) | | | 166,400 | | | | 435,811 | |
Polymetal International PLC | | | 295,128 | | | | 2,084,863 | |
Polyus Gold International, Ltd. | | | 137,262 | | | | 378,239 | |
QIWI PLC ADR | | | 51,408 | | | | 1,574,113 | |
| | | | |
| | 18 | | See Notes to Financial Statements. |
Parametric Emerging Markets Fund
July 31, 2015
Portfolio of Investments (Unaudited) — continued
| | | | | | | | |
| Security | | Shares | | | Value | |
| | | | | | | | |
|
Russia (continued) | |
Rosneft OAO GDR(5) | | | 1,056,332 | | | $ | 4,053,037 | |
Rossetti JSC(1) | | | 135,144,187 | | | | 1,038,130 | |
Rostelecom (PJSC) | | | 1,492,177 | | | | 2,041,625 | |
Rostelecom (PJSC) ADR | | | 15,064 | | | | 121,868 | |
RusHydro JSC | | | 395,274,080 | | | | 3,392,924 | |
RusHydro JSC ADR | | | 348,000 | | | | 310,004 | |
Sberbank of Russia | | | 9,493,768 | | | | 11,044,628 | |
Sberbank of Russia ADR | | | 1,431,200 | | | | 7,041,400 | |
Severstal PAO GDR(5) | | | 428,946 | | | | 4,831,683 | |
Sistema JSFC | | | 10,069,378 | | | | 3,388,031 | |
Sistema JSFC GDR(5) | | | 41,430 | | | | 351,465 | |
Sollers OJSC(1) | | | 24,262 | | | | 143,795 | |
Surgutneftegas OAO ADR | | | 927,852 | | | | 5,212,576 | |
Surgutneftegas OAO, PFC Shares | | | 7,577,600 | | | | 4,609,688 | |
Tatneft ADR | | | 237,559 | | | | 6,955,754 | |
VimpelCom, Ltd. ADR | | | 751,784 | | | | 4,345,312 | |
VTB Bank JSC | | | 2,064,590,000 | | | | 2,400,258 | |
VTB Bank JSC GDR(5) | | | 2,903,354 | | | | 6,820,437 | |
X5 Retail Group NV GDR(1)(5) | | | 385,980 | | | | 6,885,703 | |
Yandex NV, Class A(1) | | | 639,200 | | | | 8,891,272 | |
| | | | | | | | | |
| | | | | | $ | 218,390,451 | |
| | | | | | | | | |
|
Slovenia — 0.8% | |
Cinkarna Celje DD | | | 6,272 | | | $ | 964,877 | |
Gorenje DD | | | 349,170 | | | | 2,377,559 | |
KRKA DD | | | 159,605 | | | | 11,524,958 | |
Luka Koper | | | 118,550 | | | | 3,385,063 | |
Petrol | | | 12,467 | | | | 3,504,202 | |
Pivovarna Lasko(1) | | | 32,721 | | | | 869,645 | |
Sava DD(1) | | | 18,004 | | | | 2,393 | |
Sava Reinsurance Co. | | | 179,037 | | | | 2,770,033 | |
Telekom Slovenije DD | | | 27,437 | | | | 2,831,188 | |
Zavarovalnica Triglav DD | | | 139,239 | | | | 3,839,576 | |
| | | | | | | | | |
| | | | | | $ | 32,069,494 | |
| | | | | | | | | |
|
South Africa — 6.2% | |
AECI, Ltd. | | | 73,130 | | | $ | 625,655 | |
African Bank Investments, Ltd.(1)(3) | | | 1,537,194 | | | | 0 | |
African Rainbow Minerals, Ltd. | | | 94,900 | | | | 521,333 | |
Allied Electronics Corp., Ltd. | | | 186,200 | | | | 137,484 | |
Anglo American Platinum, Ltd.(1) | | | 58,680 | | | | 1,221,071 | |
AngloGold Ashanti, Ltd.(1) | | | 403,071 | | | | 2,452,672 | |
Aquarius Platinum, Ltd.(1) | | | 173,100 | | | | 16,735 | |
Arcelormittal South Africa, Ltd.(1) | | | 50,577 | | | | 58,413 | |
Aspen Pharmacare Holdings, Ltd. | | | 392,807 | | | | 11,502,459 | |
| | | | | | | | |
| Security | | Shares | | | Value | |
| | | | | | | | |
|
South Africa (continued) | |
Astral Foods, Ltd. | | | 18,500 | | | $ | 244,642 | |
Aveng, Ltd.(1) | | | 939,990 | | | | 478,187 | |
AVI, Ltd. | | | 319,500 | | | | 2,013,866 | |
Barclays Africa Group, Ltd. | | | 193,289 | | | | 2,841,620 | |
Barloworld, Ltd. | | | 662,120 | | | | 4,697,551 | |
Bidvest Group, Ltd. (The) | | | 605,796 | | | | 14,710,262 | |
Capital Property Fund(1) | | | 1,259,064 | | | | 1,461,661 | |
Capitec Bank Holdings, Ltd. | | | 42,400 | | | | 1,561,317 | |
Clicks Group, Ltd. | | | 167,700 | | | | 1,276,269 | |
DataTec, Ltd. | | | 160,600 | | | | 864,993 | |
Discovery, Ltd. | | | 252,631 | | | | 2,706,904 | |
Exxaro Resources, Ltd. | | | 118,010 | | | | 697,113 | |
FirstRand, Ltd. | | | 1,677,145 | | | | 7,245,346 | |
Foschini Group, Ltd. (The) | | | 63,545 | | | | 722,026 | |
Gold Fields, Ltd. | | | 681,677 | | | | 1,862,231 | |
Grindrod, Ltd. | | | 340,300 | | | | 359,180 | |
Group Five, Ltd. | | | 81,460 | | | | 151,368 | |
Growthpoint Properties, Ltd. | | | 1,042,876 | | | | 2,282,135 | |
Harmony Gold Mining Co., Ltd.(1) | | | 374,410 | | | | 355,843 | |
Hosken Consolidated Investments, Ltd. | | | 5,046 | | | | 55,286 | |
Hyprop Investments, Ltd. | | | 92,800 | | | | 951,987 | |
Illovo Sugar, Ltd. | | | 174,700 | | | | 184,276 | |
Impala Platinum Holdings, Ltd.(1) | | | 533,748 | | | | 1,915,704 | |
Imperial Holdings, Ltd. | | | 78,001 | | | | 1,046,892 | |
Investec, Ltd. | | | 182,794 | | | | 1,655,316 | |
JSE, Ltd. | | | 105,800 | | | | 1,231,771 | |
Kumba Iron Ore, Ltd. | | | 66,960 | | | | 572,842 | |
Lewis Group, Ltd. | | | 62,700 | | | | 284,324 | |
Liberty Holdings, Ltd. | | | 107,168 | | | | 1,203,620 | |
Life Healthcare Group Holdings, Ltd. | | | 1,510,419 | | | | 4,456,709 | |
Massmart Holdings, Ltd. | | | 149,614 | | | | 1,584,926 | |
Mediclinic International, Ltd. | | | 574,283 | | | | 5,109,579 | |
MMI Holdings, Ltd. | | | 692,950 | | | | 1,612,364 | |
Mondi, Ltd. | | | 91,130 | | | | 2,180,651 | |
Montauk Holdings, Ltd.(1) | | | 6,057 | | | | 6,225 | |
Mr. Price Group, Ltd. | | | 91,080 | | | | 1,813,839 | |
MTN Group, Ltd. | | | 1,885,095 | | | | 31,384,485 | |
Murray & Roberts Holdings, Ltd. | | | 915,850 | | | | 939,568 | |
Nampak, Ltd. | | | 465,438 | | | | 1,171,656 | |
Naspers, Ltd., Class N | | | 219,423 | | | | 30,579,506 | |
Nedbank Group, Ltd. | | | 121,638 | | | | 2,421,139 | |
Netcare, Ltd. | | | 1,305,994 | | | | 4,161,496 | |
Northam Platinum, Ltd.(1) | | | 207,738 | | | | 562,797 | |
Pick’n Pay Stores, Ltd. | | | 371,278 | | | | 1,736,110 | |
PPC, Ltd. | | | 468,427 | | | | 833,288 | |
Redefine Properties, Ltd. | | | 2,311,150 | | | | 2,099,130 | |
| | | | |
| | 19 | | See Notes to Financial Statements. |
Parametric Emerging Markets Fund
July 31, 2015
Portfolio of Investments (Unaudited) — continued
| | | | | | | | |
| Security | | Shares | | | Value | |
| | | | | | | | |
|
South Africa (continued) | |
Remgro, Ltd. | | | 270,121 | | | $ | 5,584,929 | |
Reunert, Ltd. | | | 407,260 | | | | 2,033,382 | |
RMB Holdings, Ltd. | | | 441,055 | | | | 2,380,040 | |
RMI Holdings | | | 479,034 | | | | 1,677,612 | |
Sanlam, Ltd. | | | 991,073 | | | | 5,235,887 | |
Sappi, Ltd.(1) | | | 415,236 | | | | 1,364,455 | |
Sasol, Ltd. | | | 469,150 | | | | 16,195,469 | |
Shoprite Holdings, Ltd. | | | 837,380 | | | | 11,112,099 | |
Sibanye Gold, Ltd. | | | 800,277 | | | | 1,042,938 | |
Spar Group, Ltd. | | | 206,544 | | | | 3,229,830 | |
Standard Bank Group, Ltd. | | | 614,446 | | | | 7,378,969 | |
Steinhoff International Holdings, Ltd. | | | 787,883 | | | | 4,763,578 | |
Sun International, Ltd. | | | 30,482 | | | | 276,187 | |
Telkom SA SOC, Ltd. | | | 309,050 | | | | 1,501,493 | |
Tiger Brands, Ltd. | | | 202,394 | | | | 4,549,509 | |
Tongaat-Hulett | | | 99,910 | | | | 961,755 | |
Truworths International, Ltd. | | | 300,800 | | | | 2,032,814 | |
Vodacom Group (Pty), Ltd. | | | 613,500 | | | | 7,092,917 | |
Wilson Bayly Holmes-Ovcon, Ltd. | | | 106,200 | | | | 800,578 | |
Woolworths Holdings, Ltd. | | | 287,328 | | | | 2,250,607 | |
| | | | | | | | | |
| | | | | | $ | 246,288,870 | |
| | | | | | | | | |
|
South Korea — 6.0% | |
AMOREPACIFIC Corp. | | | 22,880 | | | $ | 8,066,078 | |
AMOREPACIFIC Group, Inc. | | | 6,000 | | | | 1,001,043 | |
Asiana Airlines, Inc.(1) | | | 92,200 | | | | 469,117 | |
BNK Financial Group, Inc. | | | 130,435 | | | | 1,533,299 | |
Celltrion, Inc.(1) | | | 70,611 | | | | 4,679,190 | |
Cheil Worldwide, Inc.(1) | | | 51,100 | | | | 836,772 | |
CJ CheilJedang Corp. | | | 7,496 | | | | 2,637,849 | |
CJ Corp. | | | 6,100 | | | | 1,597,448 | |
CJ Korea Express Co., Ltd.(1) | | | 4,349 | | | | 639,347 | |
CJ O Shopping Co., Ltd. | | | 3,130 | | | | 543,459 | |
Coway Co., Ltd. | | | 22,950 | | | | 1,915,904 | |
Daelim Industrial Co., Ltd. | | | 8,650 | | | | 551,101 | |
Daesang Corp. | | | 8,000 | | | | 243,245 | |
Daewoo Engineering & Construction Co., Ltd.(1) | | | 65,741 | | | | 388,193 | |
Daewoo Industrial Development Co., Ltd.(1) | | | 3,657 | | | | 4,688 | |
Daewoo International Corp. | | | 21,675 | | | | 383,485 | |
Daewoo Securities Co., Ltd. | | | 125,693 | | | | 1,561,188 | |
Daewoo Shipbuilding & Marine Engineering Co., Ltd. | | | 45,532 | | | | 270,647 | |
Daewoong Pharmaceutical Co., Ltd. | | | 5,630 | | | | 431,399 | |
Daum Kakao Corp. | | | 5,600 | | | | 577,738 | |
DGB Financial Group Co., Ltd. | | | 65,650 | | | | 629,915 | |
Dong-A Pharmaceutical Co., Ltd. | | | 2,407 | | | | 359,505 | |
Dong-A ST Co., Ltd. | | | 4,078 | | | | 485,761 | |
| | | | | | | | |
| Security | | Shares | | | Value | |
| | | | | | | | |
|
South Korea (continued) | |
Dongbu Insurance Co., Ltd. | | | 36,640 | | | $ | 1,741,789 | |
Dongkuk Steel Mill Co., Ltd.(1) | | | 67,733 | | | | 350,897 | |
Doosan Corp. | | | 6,101 | | | | 534,575 | |
Doosan Heavy Industries & Construction Co., Ltd. | | | 23,400 | | | | 401,567 | |
Doosan Infracore Co., Ltd.(1) | | | 34,600 | | | | 225,242 | |
E-Mart Co., Ltd. | | | 10,328 | | | | 2,110,991 | |
GS Engineering & Construction Corp.(1) | | | 19,935 | | | | 446,004 | |
GS Holdings Corp. | | | 55,400 | | | | 2,157,984 | |
Hana Financial Group, Inc. | | | 151,951 | | | | 3,791,393 | |
Hanjin Kal Corp. | | | 19,283 | | | | 467,538 | |
Hanjin Shipping Co., Ltd.(1) | | | 98,091 | | | | 423,632 | |
Hankook Tire Co., Ltd. | | | 21,623 | | | | 750,745 | |
Hanmi Pharmaceutical Co., Ltd.(1) | | | 8,096 | | | | 2,784,814 | |
Hansol Holdings Co., Ltd.(1) | | | 37,566 | | | | 287,055 | |
Hansol Paper Co., Ltd.(1) | | | 22,933 | | | | 383,761 | |
Hanwha Chemical Corp. | | | 81,490 | | | | 1,441,039 | |
Hanwha Corp. | | | 34,490 | | | | 1,401,881 | |
Hanwha Techwin Co., Ltd.(1) | | | 18,895 | | | | 615,269 | |
Hite-Jinro Co., Ltd. | | | 20,121 | | | | 385,356 | |
Hyosung Corp. | | | 21,380 | | | | 2,608,567 | |
Hyundai Department Store Co., Ltd. | | | 7,615 | | | | 961,727 | |
Hyundai Development Co. | | | 29,900 | | | | 1,797,776 | |
Hyundai Engineering & Construction Co., Ltd. | | | 29,816 | | | | 877,018 | |
Hyundai Glovis Co., Ltd. | | | 13,870 | | | | 2,315,739 | |
Hyundai Heavy Industries Co., Ltd.(1) | | | 18,270 | | | | 1,515,434 | |
Hyundai Marine & Fire Insurance Co., Ltd. | | | 38,700 | | | | 1,050,572 | |
Hyundai Merchant Marine Co., Ltd.(1) | | | 68,800 | | | | 367,913 | |
Hyundai Mipo Dockyard Co., Ltd.(1) | | | 5,275 | | | | 244,268 | |
Hyundai Mobis Co., Ltd. | | | 19,100 | | | | 3,484,536 | |
Hyundai Motor Co. | | | 56,700 | | | | 7,223,020 | |
Hyundai Securities Co., Ltd. | | | 43,870 | | | | 322,150 | |
Hyundai Steel Co. | | | 59,452 | | | | 2,967,871 | |
Hyundai Wia Corp. | | | 5,400 | | | | 495,056 | |
Industrial Bank of Korea | | | 96,580 | | | | 1,142,965 | |
Kangwon Land, Inc. | | | 50,840 | | | | 1,856,983 | |
KB Financial Group, Inc. | | | 180,917 | | | | 5,684,036 | |
KB Insurance Co., Ltd. | | | 28,900 | | | | 696,472 | |
KCC Corp. | | | 2,345 | | | | 980,295 | |
Kia Motors Corp. | | | 86,120 | | | | 3,230,464 | |
Korea Electric Power Corp. | | | 221,620 | | | | 9,582,610 | |
Korea Gas Corp. | | | 39,170 | | | | 1,414,986 | |
Korea Investment Holdings Co., Ltd. | | | 21,590 | | | | 1,151,784 | |
Korea Zinc Co., Ltd. | | | 8,940 | | | | 3,777,272 | |
Korean Air Lines Co., Ltd.(1) | | | 28,110 | | | | 843,335 | |
Korean Reinsurance Co. | | | 78,574 | | | | 992,326 | |
KT Corp.(1) | | | 69,653 | | | | 1,819,970 | |
| | | | |
| | 20 | | See Notes to Financial Statements. |
Parametric Emerging Markets Fund
July 31, 2015
Portfolio of Investments (Unaudited) — continued
| | | | | | | | |
| Security | | Shares | | | Value | |
| | | | | | | | |
|
South Korea (continued) | |
KT Corp. ADR(1) | | | 16,800 | | | $ | 219,576 | |
KT&G Corp. | | | 51,115 | | | | 4,815,591 | |
Kumho Petrochemical Co., Ltd. | | | 12,900 | | | | 668,486 | |
Kwangju Bank(1) | | | 13,793 | | | | 89,577 | |
LG Chem, Ltd. | | | 27,318 | | | | 5,840,692 | |
LG Corp. | | | 50,210 | | | | 2,492,566 | |
LG Display Co., Ltd. | | | 71,100 | | | | 1,343,918 | |
LG Electronics, Inc. | | | 39,320 | | | | 1,363,340 | |
LG Hausys, Ltd. | | | 2,858 | | | | 433,707 | |
LG Household & Health Care, Ltd. | | | 7,450 | | | | 5,455,486 | |
LG International Corp. | | | 20,600 | | | | 508,375 | |
LG Life Sciences, Ltd.(1) | | | 11,000 | | | | 663,008 | |
LG Uplus Corp. | | | 207,920 | | | | 2,053,842 | |
Lotte Chemical Corp. | | | 11,770 | | | | 2,621,093 | |
Lotte Shopping Co., Ltd. | | | 5,065 | | | | 1,091,532 | |
LS Corp. | | | 7,030 | | | | 236,062 | |
LS Industrial Systems Co., Ltd. | | | 9,200 | | | | 411,455 | |
Medy-Tox, Inc. | | | 3,894 | | | | 1,767,653 | |
Mirae Asset Securities Co., Ltd. | | | 16,464 | | | | 620,393 | |
Naver Corp. | | | 8,556 | | | | 3,826,941 | |
NCsoft Corp. | | | 5,150 | | | | 965,783 | |
NH Investment & Securities Co., Ltd. | | | 78,408 | | | | 729,080 | |
NHN Entertainment Corp.(1) | | | 4,718 | | | | 228,757 | |
Nong Shim Co., Ltd. | | | 3,700 | | | | 983,322 | |
OCI Co., Ltd. | | | 15,570 | | | | 1,290,758 | |
ORION Corp. | | | 2,200 | | | | 2,174,720 | |
POSCO | | | 47,127 | | | | 7,854,693 | |
S-Oil Corp. | | | 36,885 | | | | 1,982,901 | |
S1 Corp. | | | 9,450 | | | | 681,656 | |
Samsung C&T Corp. | | | 48,920 | | | | 2,357,989 | |
Samsung Card Co., Ltd. | | | 20,460 | | | | 676,475 | |
Samsung Electro-Mechanics Co., Ltd. | | | 17,390 | | | | 806,489 | |
Samsung Electronics Co., Ltd. | | | 21,658 | | | | 21,973,255 | |
Samsung Engineering Co., Ltd.(1) | | | 12,600 | | | | 315,142 | |
Samsung Fine Chemicals Co., Ltd. | | | 18,150 | | | | 533,835 | |
Samsung Fire & Marine Insurance Co., Ltd. | | | 17,974 | | | | 4,299,702 | |
Samsung Heavy Industries Co., Ltd. | | | 67,350 | | | | 795,372 | |
Samsung Life Insurance Co., Ltd. | | | 50,510 | | | | 4,617,419 | |
Samsung SDI Co., Ltd. | | | 28,662 | | | | 2,104,633 | |
Samsung Securities Co., Ltd. | | | 34,040 | | | | 1,533,641 | |
Shinhan Financial Group Co., Ltd. | | | 195,345 | | | | 6,990,837 | |
Shinsegae Co., Ltd. | | | 5,075 | | | | 902,262 | |
SK C&C Co., Ltd. | | | 7,100 | | | | 1,863,319 | |
SK Chemicals Co., Ltd. | | | 15,660 | | | | 947,327 | |
SK Holdings Co., Ltd.(3) | | | 9,615 | | | | 1,852,588 | |
SK Hynix, Inc. | | | 162,890 | | | | 5,144,129 | |
| | | | | | | | |
| Security | | Shares | | | Value | |
| | | | | | | | |
|
South Korea (continued) | |
SK Innovation Co., Ltd.(1) | | | 61,379 | | | $ | 5,241,392 | |
SK Networks Co., Ltd. | | | 64,010 | | | | 396,761 | |
SK Telecom Co., Ltd. | | | 35,900 | | | | 7,704,632 | |
ViroMed Co., Ltd.(1) | | | 9,440 | | | | 1,419,633 | |
Woori Bank | | | 181,786 | | | | 1,483,999 | |
Yuanta Securities Korea Co., Ltd.(1) | | | 78,565 | | | | 366,601 | |
Yuhan Corp. | | | 6,229 | | | | 1,437,888 | |
Zyle Daewoo Motor Sales Corp.(1) | | | 5,113 | | | | 5,112 | |
| | | | | | | | | |
| | | | | | $ | 239,098,443 | |
| | | | | | | | | |
|
Sri Lanka — 0.8% | |
Access Engineering PLC | | | 4,510,376 | | | $ | 923,317 | |
Aitken Spence PLC | | | 550,325 | | | | 411,755 | |
Ceylon Tobacco Co. PLC | | | 82,568 | | | | 589,877 | |
Chevron Lubricants Lanka PLC | | | 1,018,398 | | | | 3,121,271 | |
Commercial Bank of Ceylon PLC | | | 4,472,617 | | | | 5,717,128 | |
DFCC Bank PLC | | | 293,137 | | | | 435,963 | |
Dialog Axiata PLC | | | 21,214,477 | | | | 1,745,760 | |
Distilleries Co. of Sri Lanka PLC | | | 1,818,497 | | | | 3,924,832 | |
Hatton National Bank PLC (Non-Voting) | | | 1,911,012 | | | | 3,142,109 | |
John Keells Holdings PLC | | | 6,360,225 | | | | 9,376,912 | |
National Development Bank PLC | | | 769,896 | | | | 1,582,382 | |
Nations Trust Bank PLC | | | 623,287 | | | | 491,855 | |
Sampath Bank PLC | | | 815,537 | | | | 1,604,879 | |
| | | | | | | | | |
| | | | | | $ | 33,068,040 | |
| | | | | | | | | |
|
Taiwan — 5.9% | |
AcBel Polytech, Inc. | | | 429,000 | | | $ | 251,920 | |
Acer, Inc.(1) | | | 2,014,519 | | | | 835,938 | |
Advanced Semiconductor Engineering, Inc. | | | 1,999,135 | | | | 2,320,847 | |
AirTAC International Group | | | 66,150 | | | | 304,763 | |
Ambassador Hotel | | | 298,000 | | | | 250,496 | |
AmTRAN Technology Co., Ltd. | | | 650,067 | | | | 358,420 | |
Asia Cement Corp. | | | 1,892,356 | | | | 2,075,515 | |
Asia Optical Co., Inc.(1) | | | 658,907 | | | | 538,253 | |
Asustek Computer, Inc. | | | 210,325 | | | | 1,900,788 | |
AU Optronics Corp. | | | 3,273,837 | | | | 1,051,937 | |
Capital Securities Corp. | | | 711,928 | | | | 218,526 | |
Catcher Technology Co., Ltd. | | | 226,647 | | | | 2,498,614 | |
Cathay Financial Holding Co., Ltd. | | | 2,444,533 | | | | 3,951,075 | |
Center Laboratories, Inc.(1) | | | 395,000 | | | | 864,812 | |
Chailease Holding Co., Ltd. | | | 425,224 | | | | 888,618 | |
Chang Hwa Commercial Bank, Ltd. | | | 2,124,502 | | | | 1,187,451 | |
Cheng Shin Rubber Industry Co., Ltd. | | | 2,060,672 | | | | 3,980,236 | |
Chicony Electronics Co., Ltd. | | | 335,919 | | | | 871,960 | |
| | | | |
| | 21 | | See Notes to Financial Statements. |
Parametric Emerging Markets Fund
July 31, 2015
Portfolio of Investments (Unaudited) — continued
| | | | | | | | |
| Security | | Shares | | | Value | |
| | | | | | | | |
|
Taiwan (continued) | |
China Airlines, Ltd.(1) | | | 2,591,887 | | | $ | 1,151,914 | |
China Development Financial Holding Corp. | | | 5,396,050 | | | | 1,776,887 | |
China Life Insurance Co., Ltd. | | | 1,165,652 | | | | 1,175,576 | |
China Motor Corp. | | | 881,315 | | | | 640,954 | |
China Petrochemical Development Corp.(1) | | | 3,333,659 | | | | 913,012 | |
China Steel Corp. | | | 7,563,734 | | | | 5,412,056 | |
Chipbond Technology Corp. | | | 359,000 | | | | 539,664 | |
Chong Hong Construction Co., Ltd. | | | 176,190 | | | | 322,844 | |
Chunghwa Telecom Co., Ltd. | | | 2,915,746 | | | | 9,065,627 | |
Clevo Co. | | | 394,155 | | | | 390,604 | |
Compal Electronics, Inc. | | | 1,854,345 | | | | 1,249,990 | |
Coretronic Corp. | | | 487,128 | | | | 386,924 | |
CTBC Financial Holding Co., Ltd. | | | 5,099,356 | | | | 3,698,248 | |
Delta Electronics, Inc. | | | 534,105 | | | | 2,627,246 | |
Dynapack International Technology Corp. | | | 183,374 | | | | 296,256 | |
E Ink Holdings, Inc.(1) | | | 1,234,000 | | | | 483,056 | |
E.Sun Financial Holding Co., Ltd. | | | 3,217,726 | | | | 1,955,767 | |
Eclat Textile Co., Ltd. | | | 136,240 | | | | 1,993,102 | |
Elan Microelectronics Corp. | | | 345,300 | | | | 359,805 | |
Epistar Corp. | | | 526,472 | | | | 457,968 | |
EVA Airways Corp.(1) | | | 1,654,523 | | | | 1,194,588 | |
Evergreen International Storage & Transport Corp. | | | 868,000 | | | | 397,463 | |
Evergreen Marine Corp. | | | 2,373,754 | | | | 1,139,717 | |
Everlight Electronics Co., Ltd. | | | 406,291 | | | | 536,931 | |
Far Eastern Department Stores, Ltd. | | | 2,056,995 | | | | 1,163,076 | |
Far Eastern New Century Corp. | | | 2,564,695 | | | | 2,416,423 | |
Far EasTone Telecommunications Co., Ltd. | | | 1,673,074 | | | | 3,914,104 | |
Faraday Technology Corp. | | | 406,880 | | | | 412,836 | |
Feng Hsin Iron & Steel Co., Ltd. | | | 183,260 | | | | 210,691 | |
FIH Mobile, Ltd. | | | 1,391,000 | | | | 726,637 | |
First Financial Holding Co., Ltd. | | | 3,127,244 | | | | 1,685,948 | |
Formosa Chemicals & Fibre Corp. | | | 2,365,399 | | | | 5,604,802 | |
Formosa International Hotels Corp. | | | 145,599 | | | | 1,027,132 | |
Formosa Petrochemical Corp. | | | 1,005,320 | | | | 2,371,356 | |
Formosa Plastics Corp. | | | 2,953,896 | | | | 6,552,144 | |
Formosa Taffeta Co., Ltd. | | | 842,000 | | | | 795,468 | |
Formosan Rubber Group, Inc. | | | 433,000 | | | | 299,361 | |
Foxconn Technology Co., Ltd. | | | 282,411 | | | | 857,766 | |
Fubon Financial Holding Co., Ltd. | | | 2,322,596 | | | | 4,237,393 | |
Giant Manufacturing Co., Ltd. | | | 352,208 | | | | 2,973,480 | |
Gintech Energy Corp.(1) | | | 788,201 | | | | 466,272 | |
Great Wall Enterprise Co., Ltd. | | | 930,888 | | | | 623,026 | |
Highwealth Construction Corp. | | | 339,746 | | | | 699,060 | |
Hiwin Technologies Corp. | | | 224,000 | | | | 1,388,436 | |
Hon Hai Precision Industry Co., Ltd. | | | 3,381,069 | | | | 9,723,386 | |
Hota Industrial Manufacturing Co., Ltd. | | | 298,658 | | | | 884,731 | |
| | | | | | | | |
| Security | | Shares | | | Value | |
| | | | | | | | |
|
Taiwan (continued) | |
Hotai Motor Co., Ltd. | | | 300,000 | | | $ | 3,847,592 | |
HTC Corp.(1) | | | 392,798 | | | | 861,922 | |
Hu Lane Associate, Inc. | | | 181,000 | | | | 687,939 | |
Hua Nan Financial Holdings Co., Ltd. | | | 3,067,293 | | | | 1,742,377 | |
Innolux Corp. | | | 2,846,762 | | | | 989,694 | |
Inventec Corp. | | | 960,966 | | | | 546,944 | |
Kenda Rubber Industrial Co., Ltd. | | | 222,562 | | | | 344,175 | |
Kinpo Electronics, Inc.(1) | | | 2,159,000 | | | | 679,507 | |
Kinsus Interconnect Technology Corp. | | | 182,000 | | | | 357,709 | |
Largan Precision Co., Ltd. | | | 27,795 | | | | 2,823,906 | |
Lite-On Technology Corp. | | | 1,024,182 | | | | 1,125,795 | |
Macronix International Corp., Ltd.(1) | | | 1,202,873 | | | | 177,362 | |
MediaTek, Inc. | | | 434,462 | | | | 4,567,136 | |
Medigen Biotechnology Corp.(1) | | | 69,000 | | | | 214,052 | |
Mega Financial Holding Co., Ltd. | | | 3,248,035 | | | | 2,775,814 | |
Merida Industry Co., Ltd. | | | 388,657 | | | | 2,414,337 | |
Motech Industries, Inc.(1) | | | 629,451 | | | | 875,549 | |
Nan Kang Rubber Tire Co., Ltd.(1) | | | 1,153,253 | | | | 1,026,143 | |
Nan Ya Plastics Corp. | | | 3,322,214 | | | | 6,781,440 | |
Neo Solar Power Corp. | | | 685,542 | | | | 526,702 | |
Novatek Microelectronics Corp., Ltd. | | | 275,942 | | | | 1,000,968 | |
Pegatron Corp. | | | 564,028 | | | | 1,585,323 | |
Phison Electronics Corp. | | | 112,363 | | | | 808,453 | |
Pou Chen Corp. | | | 2,809,819 | | | | 3,991,124 | |
Powertech Technology, Inc. | | | 547,865 | | | | 1,027,373 | |
President Chain Store Corp. | | | 619,664 | | | | 4,506,736 | |
Quanta Computer, Inc. | | | 967,508 | | | | 1,873,165 | |
Radiant Opto-Electronics Corp. | | | 281,264 | | | | 837,967 | |
Radium Life Tech Co., Ltd.(1) | | | 621,002 | | | | 274,555 | |
Realtek Semiconductor Corp. | | | 429,002 | | | | 843,830 | |
RichTek Technology Corp. | | | 101,478 | | | | 525,476 | |
Ruentex Development Co., Ltd. | | | 437,306 | | | | 553,501 | |
Ruentex Industries, Ltd. | | | 1,233,060 | | | | 2,582,720 | |
Sanyang Motor Co., Ltd.(1) | | | 1,819,866 | | | | 1,290,930 | |
ScinoPharm Taiwan, Ltd. | | | 227,000 | | | | 240,932 | |
Shin Kong Financial Holding Co., Ltd. | | | 3,746,630 | | | | 1,096,990 | |
Shin Kong Synthetic Fibers Corp. | | | 1,321,483 | | | | 414,015 | |
Siliconware Precision Industries Co., Ltd. | | | 1,104,243 | | | | 1,253,892 | |
Simplo Technology Co., Ltd. | | | 205,889 | | | | 847,371 | |
Sino-American Silicon Products, Inc.(1) | | | 576,233 | | | | 625,798 | |
SinoPac Financial Holdings Co., Ltd. | | | 3,265,908 | | | | 1,392,611 | |
Solar Applied Materials Technology Corp. | | | 336,245 | | | | 212,636 | |
St. Shine Optical Co., Ltd. | | | 22,000 | | | | 286,257 | |
Synnex Technology International Corp. | | | 730,818 | | | | 880,408 | |
TaiMed Biologics, Inc.(1) | | | 148,103 | | | | 505,179 | |
Tainan Spinning Co., Ltd. | | | 941,822 | | | | 435,636 | |
| | | | |
| | 22 | | See Notes to Financial Statements. |
Parametric Emerging Markets Fund
July 31, 2015
Portfolio of Investments (Unaudited) — continued
| | | | | | | | |
| Security | | Shares | | | Value | |
| | | | | | | | |
|
Taiwan (continued) | |
Taishin Financial Holding Co., Ltd. | | | 3,387,203 | | | $ | 1,341,583 | |
Taiwan Building Materials Co., Ltd. | | | 1,672,928 | | | | 477,590 | |
Taiwan Business Bank(1) | | | 2,014,650 | | | | 587,412 | |
Taiwan Cement Corp. | | | 2,185,850 | | | | 2,366,427 | |
Taiwan Cooperative Financial Holding Co., Ltd. | | | 3,174,348 | | | | 1,593,204 | |
Taiwan Fertilizer Co., Ltd. | | | 816,000 | | | | 1,196,031 | |
Taiwan Glass Industry Corp.(1) | | | 542,564 | | | | 245,206 | |
Taiwan Mobile Co., Ltd. | | | 1,805,784 | | | | 5,971,969 | |
Taiwan Semiconductor Manufacturing Co., Ltd. | | | 4,915,465 | | | | 21,480,625 | |
Taiwan Tea Corp. | | | 395,711 | | | | 172,935 | |
Tatung Co., Ltd.(1) | | | 2,377,785 | | | | 438,374 | |
Teco Electric & Machinery Co., Ltd. | | | 2,247,000 | | | | 1,764,803 | |
Tong Yang Industry Co., Ltd. | | | 758,608 | | | | 808,383 | |
TPK Holding Co., Ltd. | | | 155,148 | | | | 530,659 | |
Tripod Technology Corp. | | | 396,535 | | | | 623,975 | |
TSRC Corp. | | | 693,063 | | | | 481,922 | |
TTY Biopharm Co., Ltd. | | | 534,330 | | | | 1,537,767 | |
Tung Ho Steel Enterprise Corp. | | | 991,060 | | | | 615,596 | |
U-Ming Marine Transport Corp. | | | 186,000 | | | | 238,546 | |
Uni-President Enterprises Corp. | | | 4,043,107 | | | | 7,113,685 | |
Unimicron Technology Corp. | | | 948,000 | | | | 447,659 | |
United Microelectronics Corp. | | | 3,427,090 | | | | 1,224,973 | |
Walsin Lihwa Corp.(1) | | | 2,539,000 | | | | 562,111 | |
Wan Hai Lines, Ltd. | | | 518,962 | | | | 435,317 | |
Waterland Financial Holdings | | | 1,085,795 | | | | 285,842 | |
Wei Chuan Food Corp.(1) | | | 623,000 | | | | 425,014 | |
Wintek Corp.(3) | | | 1,892,877 | | | | 0 | |
Wistron Corp. | | | 1,490,362 | | | | 975,314 | |
WPG Holdings Co., Ltd. | | | 919,489 | | | | 1,044,823 | |
Xxentria Technology Materials Corp. | | | 234,700 | | | | 639,993 | |
Yageo Corp. | | | 166,897 | | | | 238,204 | |
Yang Ming Marine Transport(1) | | | 2,468,755 | | | | 849,326 | |
YFY, Inc. | | | 899,120 | | | | 292,057 | |
Yieh Phui Enterprise | | | 1,721,304 | | | | 441,874 | |
Yuanta Financial Holding Co., Ltd. | | | 3,712,261 | | | | 1,764,244 | |
Yulon Motor Co., Ltd. | | | 1,342,809 | | | | 1,310,466 | |
| | | | | | | | | |
| | | | | | $ | 235,333,746 | |
| | | | | | | | | |
|
Thailand — 2.9% | |
Advanced Info Service PCL(7) | | | 1,322,600 | | | $ | 9,379,296 | |
Airports of Thailand PCL(7) | | | 667,400 | | | | 5,560,375 | |
AP Thailand PCL(7) | | | 5,199,700 | | | | 870,599 | |
Bangkok Bank PCL(7) | | | 276,400 | | | | 1,300,438 | |
Bangkok Dusit Medical Services PCL(7) | | | 5,594,000 | | | | 3,188,245 | |
Bangkok Land PCL(7) | | | 13,071,100 | | | | 541,459 | |
Banpu PCL(7) | | | 1,468,000 | | | | 1,041,195 | |
| | | | | | | | |
| Security | | Shares | | | Value | |
| | | | | | | | |
|
Thailand (continued) | |
BEC World PCL(7) | | | 1,752,100 | | | $ | 1,789,160 | |
Berli Jucker PCL(7) | | | 1,563,300 | | | | 1,472,028 | |
Big C Supercenter PCL(7) | | | 268,600 | | | | 1,398,949 | |
BTS Group Holdings PCL | | | 6,774,200 | | | | 1,893,576 | |
Bumrungrad Hospital PCL(7) | | | 899,500 | | | | 5,206,288 | |
Central Pattana PCL(7) | | | 1,102,100 | | | | 1,477,874 | |
CH. Karnchang PCL(7) | | | 1,970,620 | | | | 1,453,600 | |
Charoen Pokphand Foods PCL(7) | | | 4,351,000 | | | | 2,581,452 | |
CP ALL PCL(7) | | | 2,790,200 | | | | 3,798,433 | |
Delta Electronics (Thailand) PCL(7) | | | 1,345,400 | | | | 3,074,956 | |
Electricity Generating PCL(7) | | | 413,800 | | | | 1,802,446 | |
Glow Energy PCL(7) | | | 877,300 | | | | 2,219,747 | |
Hana Microelectronics PCL(7) | | | 1,730,900 | | | | 1,595,618 | |
Home Product Center PCL(7) | | | 3,521,555 | | | | 624,063 | |
Indorama Ventures PCL(7) | | | 2,106,900 | | | | 1,584,142 | |
IRPC PCL(7) | | | 12,191,400 | | | | 1,452,078 | |
Italian-Thai Development PCL(1)(7) | | | 9,648,906 | | | | 2,012,163 | |
Jasmine International PCL(7) | | | 1,976,800 | | | | 280,437 | |
Kasikornbank PCL(7) | | | 408,800 | | | | 2,068,468 | |
Khon Kaen Sugar Industry PCL(7) | | | 4,396,800 | | | | 496,511 | |
Kiatnakin Bank PCL(7) | | | 1,074,300 | | | | 929,699 | |
Krung Thai Bank PCL(7) | | | 1,231,400 | | | | 611,538 | |
L.P.N. Development PCL(7) | | | 1,255,000 | | | | 630,325 | |
Land & Houses PCL(7) | | | 2,593,500 | | | | 584,927 | |
Minor International PCL(7) | | | 2,813,577 | | | | 2,334,420 | |
Pruksa Real Estate PCL(7) | | | 1,602,000 | | | | 1,095,187 | |
PTT Exploration & Production PCL(7) | | | 1,579,798 | | | | 4,185,352 | |
PTT Global Chemical PCL(7) | | | 1,844,950 | | | | 3,231,678 | |
PTT PCL(7) | | | 713,560 | | | | 6,594,861 | |
Quality House PCL(7) | | | 13,198,646 | | | | 869,059 | |
Ratchaburi Electricity Generating Holding PCL(7) | | | 676,000 | | | | 1,031,057 | |
Samart Corp. PCL(7) | | | 2,188,100 | | | | 1,278,022 | |
Siam Cement PCL(7) | | | 357,600 | | | | 5,378,815 | |
Siam City Cement PCL(7) | | | 97,390 | | | | 1,011,108 | |
Siam Commercial Bank PCL(7) | | | 535,300 | | | | 2,307,699 | |
Sino Thai Engineering & Construction PCL(7) | | | 2,449,157 | | | | 1,605,445 | |
Thai Airways International PCL(1)(7) | | | 2,173,900 | | | | 770,709 | |
Thai Beverage PCL | | | 9,995,000 | | | | 5,498,827 | |
Thai Oil PCL(7) | | | 1,094,800 | | | | 1,497,271 | |
Thai Union Frozen Products PCL(7) | | | 4,345,208 | | | | 2,332,341 | |
Thanachart Capital PCL(7) | | | 1,128,900 | | | | 1,001,344 | |
Thoresen Thai Agencies PCL(7) | | | 2,584,565 | | | | 924,055 | |
TMB Bank PCL(7) | | | 16,643,600 | | | | 1,105,153 | |
Total Access Communication PCL(7) | | | 1,130,500 | | | | 2,253,973 | |
TPI Polene PCL(7) | | | 18,986,000 | | | | 1,249,752 | |
True Corp. PCL(1)(7) | | | 14,572,601 | | | | 4,465,028 | |
| | | | |
| | 23 | | See Notes to Financial Statements. |
Parametric Emerging Markets Fund
July 31, 2015
Portfolio of Investments (Unaudited) — continued
| | | | | | | | |
| Security | | Shares | | | Value | |
| | | | | | | | |
|
Thailand (continued) | |
TTCL PCL | | | 224,200 | | | $ | 189,377 | |
TTW PCL(7) | | | 3,598,200 | | | | 1,173,764 | |
| | | | | | | | | |
| | | | | | $ | 116,304,382 | |
| | | | | | | | | |
|
Turkey — 3.1% | |
Akbank TAS | | | 1,842,533 | | | $ | 4,918,996 | |
Akcansa Cimento AS | | | 126,800 | | | | 717,727 | |
Akenerji Elektrik Uretim AS(1) | | | 598,472 | | | | 209,069 | |
Aksa Akrilik Kimya Sanayii AS | | | 322,613 | | | | 1,287,761 | |
Aksa Enerji Uretim AS(1) | | | 600,923 | | | | 640,885 | |
Albaraka Turk Katilim Bankasi AS | | | 522,467 | | | | 263,646 | |
Anadolu Efes Biracilik ve Malt Sanayii AS | | | 395,839 | | | | 3,104,645 | |
Arcelik AS | | | 998,054 | | | | 5,253,475 | |
Aygaz AS | | | 279,132 | | | | 1,053,427 | |
Besiktas Futbol Yatirimlari Sanayi ve
Ticaret AS(1) | | | 592,900 | | | | 438,475 | |
BIM Birlesik Magazalar AS | | | 424,306 | | | | 7,190,959 | |
Brisa Bridgestone Sabanci Sanayi ve Ticaret AS | | | 69,682 | | | | 207,450 | |
Cimsa Cimento Sanayi ve Ticaret AS | | | 141,400 | | | | 806,566 | |
Coca-Cola Icecek AS | | | 159,495 | | | | 2,289,558 | |
Dogan Sirketler Grubu Holding AS(1) | | | 1,732,915 | | | | 342,937 | |
Dogus Otomotiv Servis ve Ticaret AS | | | 111,778 | | | | 646,771 | |
Eczacibasi Ilac Sanayi ve Ticaret AS | | | 255,200 | | | | 247,008 | |
Emlak Konut Gayrimenkul Yatirim Ortakligi AS | | | 1,976,700 | | | | 1,850,408 | |
Enka Insaat ve Sanayi AS | | | 1,307,393 | | | | 2,365,726 | |
Eregli Demir ve Celik Fabrikalari TAS | | | 4,877,751 | | | | 7,304,757 | |
Ford Otomotiv Sanayi AS | | | 296,400 | | | | 3,518,638 | |
Goodyear Lastikleri TAS | | | 18,000 | | | | 383,371 | |
Gubre Fabrikalari TAS | | | 490,400 | | | | 1,350,319 | |
Haci Omer Sabanci Holding AS | | | 1,437,018 | | | | 4,908,915 | |
Ihlas Holding AS(1) | | | 4,223,700 | | | | 366,173 | |
Is Gayrimenkul Yatirim Ortakligi AS | | | 655,591 | | | | 363,701 | |
Kardemir Karabuk Demir Celik Sanayi ve Ticaret AS, Class D | | | 2,655,090 | | | | 1,415,316 | |
KOC Holding AS | | | 921,460 | | | | 4,086,847 | |
Koza Altin Isletmeleri AS | | | 152,600 | | | | 1,284,002 | |
Koza Anadolu Metal Madencilik
Isletmeleri AS(1) | | | 780,100 | | | | 729,528 | |
Migros Ticaret AS(1) | | | 75,000 | | | | 557,464 | |
Net Holding AS(1) | | | 325,363 | | | | 384,869 | |
Pegasus Hava Tasimaciligi AS(1) | | | 86,600 | | | | 761,034 | |
Petkim Petrokimya Holding AS(1) | | | 1,455,661 | | | | 2,181,578 | |
Sekerbank TAS(1) | | | 765,199 | | | | 432,821 | |
TAV Havalimanlari Holding AS | | | 201,088 | | | | 1,527,683 | |
Tekfen Holding AS | | | 497,173 | | | | 755,591 | |
Teknosa Ic Ve Dis Ticaret AS | | | 164,600 | | | | 428,013 | |
Tofas Turk Otomobil Fabrikasi AS | | | 507,400 | | | | 3,323,308 | |
Trakya Cam Sanayii AS | | | 1,044,657 | | | | 771,110 | |
| | | | | | | | |
| Security | | Shares | | | Value | |
| | | | | | | | |
|
Turkey (continued) | |
Tupras-Turkiye Petrol Rafinerileri AS(1) | | | 442,250 | | | $ | 11,477,863 | |
Turcas Petrol AS | | | 474,910 | | | | 277,518 | |
Turk Hava Yollari Anonim Ortakligi AS(1) | | | 774,945 | | | | 2,520,451 | |
Turk Sise ve Cam Fabrikalari AS | | | 929,159 | | | | 1,048,728 | |
Turk Telekomunikasyon AS | | | 1,688,424 | | | | 4,191,551 | |
Turkcell Iletisim Hizmetleri AS | | | 2,633,952 | | | | 12,054,934 | |
Turkiye Garanti Bankasi AS | | | 2,409,882 | | | | 7,108,302 | |
Turkiye Halk Bankasi AS | | | 624,600 | | | | 2,717,782 | |
Turkiye Is Bankasi | | | 1,572,912 | | | | 3,058,660 | |
Turkiye Sinai Kalkinma Bankasi AS | | | 641,660 | | | | 403,801 | |
Turkiye Vakiflar Bankasi TAO | | | 1,413,300 | | | | 2,127,075 | |
Ulker Biskuvi Sanayi AS | | | 353,959 | | | | 1,967,553 | |
Vestel Elektronik Sanayi ve Ticaret AS(1) | | | 368,100 | | | | 607,016 | |
Yapi ve Kredi Bankasi AS | | | 953,085 | | | | 1,306,992 | |
Yazicilar Holding AS | | | 193,900 | | | | 1,389,453 | |
Zorlu Enerji Elektrik Uretim AS(1) | | | 692,954 | | | | 422,620 | |
| | | | | | | | | |
| | | | | | $ | 123,350,826 | |
| | | | | | | | | |
|
Ukraine — 0.3% | |
Astarta Holding NV(1) | | | 194,791 | | | $ | 1,844,693 | |
Avangardco Investments Public, Ltd. GDR(5) | | | 138,412 | | | | 145,248 | |
Ferrexpo PLC | | | 2,332,085 | | | | 2,103,049 | |
Kernel Holding SA | | | 408,822 | | | | 4,735,996 | |
MHP SA GDR(5) | | | 300,561 | | | | 2,997,110 | |
| | | | | | | | | |
| | | | | | $ | 11,826,096 | |
| | | | | | | | | |
|
United Arab Emirates — 1.7% | |
Abu Dhabi Commercial Bank (PJSC) | | | 2,281,264 | | | $ | 5,129,316 | |
Abu Dhabi National Hotels | | | 718,461 | | | | 567,296 | |
Agthia Group (PJSC) | | | 1,252,100 | | | | 2,643,919 | |
Air Arabia (PJSC) | | | 7,103,683 | | | | 3,096,968 | |
Ajman Bank (PJSC)(1) | | | 744,975 | | | | 392,762 | |
Al Waha Capital PJSC | | | 2,092,394 | | | | 1,412,732 | |
Aldar Properties PJSC | | | 4,132,498 | | | | 3,010,478 | |
Arabtec Holding (PJSC)(1) | | | 6,821,504 | | | | 4,414,545 | |
Dana Gas (PJSC)(1) | | | 5,241,906 | | | | 782,796 | |
DP World, Ltd. | | | 507,613 | | | | 11,542,075 | |
Drake & Scull International (PJSC)(1) | | | 3,823,093 | | | | 833,457 | |
Dubai Financial Market (PJSC) | | | 1,928,561 | | | | 1,011,647 | |
Dubai Investments (PJSC) | | | 1,767,836 | | | | 1,399,168 | |
Dubai Islamic Bank (PJSC) | | | 1,313,689 | | | | 2,676,503 | |
Emaar Properties (PJSC) | | | 4,449,009 | | | | 9,538,288 | |
First Gulf Bank (PJSC) | | | 1,580,964 | | | | 6,663,276 | |
Gulf Pharmaceutical Industries | | | 128,551 | | | | 89,650 | |
National Bank of Abu Dhabi (PJSC) | | | 2,090,616 | | | | 6,086,149 | |
| | | | |
| | 24 | | See Notes to Financial Statements. |
Parametric Emerging Markets Fund
July 31, 2015
Portfolio of Investments (Unaudited) — continued
| | | | | | | | |
| Security | | Shares | | | Value | |
| | | | | | | | |
|
United Arab Emirates (continued) | |
National Bank of Ras Al-Khaimah PSC (The) | | | 62,608 | | | $ | 130,104 | |
National Central Cooling Co. (Tabreed) | | | 828,054 | | | | 333,539 | |
Ras Al Khaimah Ceramics | | | 334,915 | | | | 321,375 | |
Ras Al Khaimah Properties (PJSC) | | | 2,150,800 | | | | 384,036 | |
Union National Bank PJSC | | | 1,992,209 | | | | 3,821,487 | |
| | | | | | | | | |
| | | | | | $ | 66,281,566 | |
| | | | | | | | | |
|
Vietnam — 0.7% | |
Bank for Foreign Trade of Vietnam JSC | | | 1,556,456 | | | $ | 3,559,233 | |
Bao Viet Holdings | | | 307,150 | | | | 739,701 | |
Development Investment
Construction Corp.(1) | | | 276,167 | | | | 151,803 | |
FPT Corp. | | | 503,196 | | | | 1,091,000 | |
Gemadept Corp. | | | 312,000 | | | | 490,619 | |
HAGL JSC(1) | | | 1,155,511 | | | | 916,438 | |
HCM City Infrastructure Investment JSC | | | 291,080 | | | | 347,071 | |
Hoa Phat Group JSC | | | 2,137,846 | | | | 3,181,176 | |
Kim Long Securities Corp. | | | 824,100 | | | | 328,101 | |
Kinh Bac City Development Share Holding Corp.(1) | | | 328,860 | | | | 239,624 | |
Kinh Do Corp. | | | 633,520 | | | | 1,406,135 | |
Masan Group Corp.(1) | | | 272,520 | | | | 1,123,489 | |
PetroVietnam Construction JSC(1) | | | 919,725 | | | | 152,038 | |
PetroVietnam Drilling and Well Services JSC | | | 739,369 | | | | 1,483,352 | |
PetroVietnam Fertilizer & Chemical JSC | | | 880,500 | | | | 1,271,626 | |
PetroVietnam Gas JSC | | | 166,550 | | | | 449,652 | |
PetroVietnam Technical Services JSC | | | 1,236,400 | | | | 1,460,441 | |
Pha Lai Thermal Power JSC | | | 483,390 | | | | 485,428 | |
Phu Nhuan Jewelry JSC | | | 235,560 | | | | 395,760 | |
Refrigeration Electrical Engineering Corp. | | | 896,580 | | | | 1,199,693 | |
Saigon Securities, Inc. | | | 180,000 | | | | 224,369 | |
Tan Tao Investment & Industry JSC(1) | | | 1,554,838 | | | | 448,848 | |
Vietnam Construction and Import-Export JSC | | | 621,655 | | | | 353,525 | |
Vietnam Dairy Products JSC | | | 563,742 | | | | 3,101,258 | |
Vietnam Joint Stock Commercial Bank for Industry and Trade | | | 1,810,143 | | | | 1,868,064 | |
Vingroup JSC | | | 1,565,455 | | | | 3,097,372 | |
| | | | | | | | | |
| | | | | | $ | 29,565,816 | |
| | | | | | | | | |
| |
Total Common Stocks
(identified cost $4,285,377,269) | | | $ | 3,943,340,060 | |
| | | | | | | | | |
| | | | | | | | | | | | |
| Equity-Linked Securities(6)(8) — 0.9% | |
| | | |
| | | | | | | | | | | | |
| Security | | Maturity Date | | | Shares | | | Value | |
| | | | | | | | | | | | |
|
Saudi Arabia — 0.9% | |
Abdullah Al Othaim Markets | | | 7/31/17 | | | | 36,000 | | | $ | 1,046,372 | |
Al Abdullatif Industrial Investment Co. | | | 4/30/18 | | | | 64,200 | | | | 689,919 | |
Al Rajhi Bank | | | 1/22/18 | | | | 149,493 | | | | 2,591,147 | |
Al Tayyar | | | 3/5/18 | | | | 70,167 | | | | 1,899,133 | |
Alinma Bank | | | 1/22/18 | | | | 250,600 | | | | 1,503,550 | |
Almarai Co. | | | 7/31/17 | | | | 59,399 | | | | 1,488,895 | |
Arab National Bank | | | 5/12/17 | | | | 70,000 | | | | 621,586 | |
Bank Albilad | | | 3/5/18 | | | | 103,957 | | | | 948,067 | |
Banque Saudi Fransi | | | 1/22/18 | | | | 100,840 | | | | 892,747 | |
Dar Al Arkan Real Estate Development | | | 7/20/18 | | | | 185,500 | | | | 430,341 | |
Etihad Etisalat Co.(3) | | | 11/20/17 | | | | 134,038 | | | | 966,414 | |
Fawaz Abdulaziz Alhokair Co. | | | 3/20/17 | | | | 60,000 | | | | 1,515,960 | |
Jarir Marketing Co. | | | 1/22/18 | | | | 25,425 | | | | 1,452,576 | |
Mobile Telecommunications Co. | | | 4/30/18 | | | | 123,207 | | | | 415,602 | |
National Industrialization Co. | | | 10/31/16 | | | | 156,903 | | | | 765,671 | |
Rabigh Refining and Petrochemicals Co. | | | 7/24/17 | | | | 92,400 | | | | 591,342 | |
Riyad Bank | | | 11/20/17 | | | | 161,200 | | | | 689,920 | |
Sahara Petrochemical Co. | | | 9/21/15 | | | | 122,800 | | | | 443,701 | |
Samba Financial Group | | | 6/29/17 | | | | 182,240 | | | | 1,287,799 | |
Saudi Airlines Catering Co. | | | 5/28/18 | | | | 5,500 | | | | 233,927 | |
Saudi Arabian Amiantit Co. | | | 4/30/18 | | | | 106,500 | | | | 377,713 | |
Saudi Arabian Fertilizer Co. | | | 7/31/17 | | | | 35,791 | | | | 1,111,876 | |
Saudi Arabian Mining Co. | | | 4/30/18 | | | | 54,900 | | | | 594,369 | |
Saudi Basic Industries Corp. | | | 1/22/18 | | | | 107,696 | | | | 2,764,126 | |
Saudi British Bank | | | 1/22/18 | | | | 93,450 | | | | 829,817 | |
Saudi Cable Co. | | | 7/20/18 | | | | 97,900 | | | | 231,034 | |
Saudi Cement Co. | | | 7/20/18 | | | | 25,900 | | | | 607,769 | |
Saudi Chemical Co. | | | 4/23/18 | | | | 25,900 | | | | 480,000 | |
Saudi Electricity Co. | | | 1/22/18 | | | | 268,400 | | | | 1,299,029 | |
Saudi Industrial Investment Group | | | 10/9/17 | | | | 95,000 | | | | 673,845 | |
Saudi International Petrochemicals Co. | | | 1/22/18 | | | | 40,200 | | | | 307,655 | |
Saudi Kayan Petrochemical Co. | | | 1/22/18 | | | | 247,500 | | | | 719,383 | |
Saudi Telecom Co. | | | 4/23/18 | | | | 98,200 | | | | 1,780,641 | |
Savola Group | | | 2/6/17 | | | | 115,300 | | | | 2,090,712 | |
Yanbu National Petrochemical Co. | | | 7/31/17 | | | | 51,400 | | | | 705,876 | |
| | | | | | | | | | | | | |
| |
Total Equity-Linked Securities
(identified cost $35,473,516) | | | $ | 35,048,514 | |
| | | | | | | | | | | | | |
| | | | |
| | 25 | | See Notes to Financial Statements. |
Parametric Emerging Markets Fund
July 31, 2015
Portfolio of Investments (Unaudited) — continued
| | | | | | | | |
| Investment Funds — 0.1% | |
| | |
| | | | | | | | |
| Security | | Shares | | | Value | |
| | | | | | | | |
Vietnam Enterprise Investments, Ltd.(1) | | | 739,727 | | | $ | 2,219,181 | |
| | | | | | | | | |
| |
Total Investment Funds
(identified cost $2,471,779) | | | $ | 2,219,181 | |
| | | | | | | | | |
|
| Warrants(1) — 0.0%(2) | |
| | |
| | | | | | | | |
| Security | | Shares | | | Value | |
Italian-Thai Development PCL, Exp. 5/13/19, Strike THB 14.00 | | | 1,929,781 | | | $ | 90,343 | |
Jasmine International PCL, Exp. 7/5/20, Strike THB 4.30 | | | 969,020 | | | | 39,041 | |
Samart Corp. PCL, Exp. 2/19/18, Strike THB 45.00 | | | 437,620 | | | | 24,461 | |
Thoresen Thai Agencies PCL, Exp. 2/28/19, Strike THB 18.50 | | | 246,149 | | | | 16,482 | |
| | | | | | | | | |
| |
Total Warrants
(identified cost $0) | | | $ | 170,327 | |
| | | | | | | | | |
|
| Short-Term Investments — 0.0%(2) | |
| | |
| | | | | | | | |
| Description | | Principal Amount (000’s omitted) | | | Value | |
State Street Bank and Trust Euro Time Deposit, 0.01%, 8/3/15 | | $ | 68 | | | $ | 67,602 | |
| | | | | | | | | |
| |
Total Short-Term Investments
(identified cost $67,602) | | | $ | 67,602 | |
| | | | | | | | | |
| |
Total Investments — 100.2%
(identified cost $4,323,390,166) | | | $ | 3,980,845,684 | |
| | | | | | | | | |
| |
Other Assets, Less Liabilities — (0.2)% | | | $ | (6,220,549 | ) |
| | | | | | | | | |
| |
Net Assets — 100.0% | | | $ | 3,974,625,135 | |
| | | | | | | | | |
The percentage shown for each investment category in the Portfolio of Investments is based on net assets.
| | | | |
| ADR | | – | | American Depositary Receipt |
| BDR | | – | | Brazilian Depositary Receipt |
| GDR | | – | | Global Depositary Receipt |
| PCL | | – | | Public Company Ltd. |
| PDR | | – | | Philippine Deposit Receipt |
| PFC Shares | | – | | Preference Shares |
| THB | | – | | Thai Baht |
| (1) | Non-income producing security. |
| (2) | Amount is less than 0.05%. |
| (3) | For fair value measurement disclosure purposes, security is categorized as Level 3 (see Note 10). |
| (4) | Trading of securities on the Athens Stock Exchange was suspended on June 29, 2015. As of July 31, 2015, the Fund’s holdings in Greek equity securities were fair valued by management based on other available observable inputs. |
| (5) | Security exempt from registration under Regulation S of the Securities Act of 1933, which exempts from registration securities offered and sold outside the United States. Security may not be offered or sold in the United States except pursuant to an exemption from, or in a transaction not subject to, the registration requirements of the Securities Act of 1933. At July 31, 2015, the aggregate value of these securities is $77,968,335 or 2.0% of the Fund’s net assets. |
| (6) | Security exempt from registration pursuant to Rule 144A under the Securities Act of 1933. These securities may be sold in certain transactions (normally to qualified institutional buyers) and remain exempt from registration. At July 31, 2015, the aggregate value of these securities is $36,582,703 or 0.9% of the Fund’s net assets. |
| (7) | Indicates a foreign registered security. Shares issued to foreign investors in markets that have foreign ownership limits. |
| (8) | Security whose performance, including redemption at maturity, is linked to the price of the underlying equity security. The investment is subject to credit risk of the issuing financial institution (HSBC Bank plc) in addition to the market risk of the underlying security. |
| | | | | | | | |
| Currency Concentration of Portfolio | |
| | |
| | | | | | | | |
| Currency | | Percentage of Net Assets | | | Value | |
United States Dollar | | | 10.3 | % | | $ | 407,887,523 | |
Hong Kong Dollar | | | 7.8 | | | | 310,816,362 | |
South African Rand | | | 6.2 | | | | 246,272,135 | |
Indian Rupee | | | 6.1 | | | | 242,510,297 | |
South Korean Won | | | 6.0 | | | | 238,878,867 | |
New Taiwan Dollar | | | 5.9 | | | | 234,607,109 | |
Brazilian Real | | | 5.6 | | | | 222,513,608 | |
Mexican Peso | | | 5.2 | | | | 207,544,372 | |
Polish Zloty | | | 3.3 | | | | 131,657,183 | |
New Turkish Lira | | | 3.1 | | | | 123,350,826 | |
Philippine Peso | | | 3.0 | | | | 120,647,871 | |
Malaysian Ringgit | | | 3.0 | | | | 118,213,553 | |
Chilean Peso | | | 3.0 | | | | 117,911,903 | |
Indonesian Rupiah | | | 2.8 | | | | 111,887,483 | |
Thai Baht | | | 2.8 | | | | 110,975,882 | |
Euro | | | 2.2 | | | | 86,686,483 | |
Kuwaiti Dinar | | | 2.1 | | | | 82,189,610 | |
Russian Ruble | | | 1.8 | | | | 72,010,292 | |
United Arab Emirates Dirham | | | 1.7 | | | | 68,159,560 | |
Egyptian Pound | | | 1.6 | | | | 62,544,313 | |
Qatari Riyal | | | 1.6 | | | | 62,194,646 | |
Hungarian Forint | | | 1.6 | | | | 61,683,203 | |
Czech Koruna | | | 1.3 | | | | 52,169,895 | |
Colombian Peso | | | 1.2 | | | | 48,961,821 | |
Other currency, less than 1% each | | | 11.0 | | | | 438,570,887 | |
| | | | | | | | | |
Total Investments | | | 100.2 | % | | $ | 3,980,845,684 | |
| | | | | | | | | |
| | | | |
| | 26 | | See Notes to Financial Statements. |
Parametric Emerging Markets Fund
July 31, 2015
Portfolio of Investments (Unaudited) — continued
| | | | | | | | |
| Sector Classification of Portfolio | |
| | |
| | | | | | | | |
| Sector | | Percentage of Net Assets | | | Value | |
Financials | | | 23.4 | % | | $ | 929,596,903 | |
Telecommunication Services | | | 10.9 | | | | 431,764,730 | |
Industrials | | | 10.6 | | | | 420,200,564 | |
Consumer Staples | | | 10.3 | | | | 408,530,706 | |
Materials | | | 9.7 | | | | 387,675,168 | |
Energy | | | 9.6 | | | | 382,807,050 | |
Consumer Discretionary | | | 9.0 | | | | 356,165,253 | |
Information Technology | | | 6.9 | | | | 273,085,680 | |
Utilities | | | 5.8 | | | | 232,033,252 | |
Health Care | | | 3.9 | | | | 156,699,595 | |
Investment Funds | | | 0.1 | | | | 2,219,181 | |
Short-Term Investments | | | 0.0 | (1) | | | 67,602 | |
| | | | | | | | | |
Total Investments | | | 100.2 | % | | $ | 3,980,845,684 | |
| | | | | | | | | |
| (1) | Amount is less than 0.05%. |
| | | | |
| | 27 | | See Notes to Financial Statements. |
Parametric Emerging Markets Fund
July 31, 2015
Statement of Assets and Liabilities (Unaudited)
| | | | |
| Assets | | July 31, 2015 | |
Investments, at value (identified cost, $4,323,390,166) | | $ | 3,980,845,684 | |
Cash | | | 78,758 | |
Foreign currency, at value (identified cost, $19,720,697) | | | 19,675,626 | |
Dividends and interest receivable | | | 13,012,049 | |
Receivable for investments sold | | | 4,545,907 | |
Receivable for Fund shares sold | | | 5,986,270 | |
Tax reclaims receivable | | | 1,323,042 | |
Total assets | | $ | 4,025,467,336 | |
| |
| Liabilities | | | | |
Demand note payable | | $ | 35,500,000 | |
Payable for Fund shares redeemed | | | 9,284,421 | |
Payable to affiliates: | | | | |
Investment adviser fee | | | 2,747,346 | |
Administration fee | | | 530,360 | |
Distribution and service fees | | | 152,531 | |
Accrued foreign capital gains taxes | | | 1,738,225 | |
Accrued expenses | | | 889,318 | |
Total liabilities | | $ | 50,842,201 | |
Net Assets | | $ | 3,974,625,135 | |
| |
| Sources of Net Assets | | | | |
Paid-in capital | | $ | 4,287,371,750 | |
Accumulated distributions in excess of net realized gain | | | (6,719,252 | ) |
Accumulated undistributed net investment income | | | 38,801,110 | |
Net unrealized depreciation | | | (344,828,473 | ) |
Total | | $ | 3,974,625,135 | |
| |
| Investor Class Shares | | | | |
Net Assets | | $ | 636,776,680 | |
Shares Outstanding | | | 48,523,442 | |
Net Asset Value, Offering Price and Redemption Price Per Share | | | | |
(net assets ÷ shares of beneficial interest outstanding) | | $ | 13.12 | |
| |
| Class C Shares | | | | |
Net Assets | | $ | 13,748,439 | |
Shares Outstanding | | | 1,057,913 | |
Net Asset Value and Offering Price Per Share* | | | | |
(net assets ÷ shares of beneficial interest outstanding) | | $ | 13.00 | |
| |
| Institutional Class Shares | | | | |
Net Assets | | $ | 2,701,067,499 | |
Shares Outstanding | | | 205,109,727 | |
Net Asset Value, Offering Price and Redemption Price Per Share | | | | |
(net assets ÷ shares of beneficial interest outstanding) | | $ | 13.17 | |
| |
| Class R6 Shares | | | | |
Net Assets | | $ | 623,032,517 | |
Shares Outstanding | | | 47,293,277 | |
Net Asset Value, Offering Price and Redemption Price Per Share | | | | |
(net assets ÷ shares of beneficial interest outstanding) | | $ | 13.17 | |
| * | Redemption price per share is equal to the net asset value less any applicable contingent deferred sales charge. |
| | | | |
| | 28 | | See Notes to Financial Statements. |
Parametric Emerging Markets Fund
July 31, 2015
Statement of Operations (Unaudited)
| | | | |
| Investment Income | | Six Months Ended July 31, 2015 | |
Dividends (net of foreign taxes, $9,666,075) | | $ | 82,509,626 | |
Interest | | | 903 | |
Total investment income | | $ | 82,510,529 | |
| |
| Expenses | | | | |
Investment adviser fee | | $ | 17,342,130 | |
Administration fee | | | 3,356,851 | |
Distribution and service fees | | | | |
Investor Class | | | 837,608 | |
Class C | | | 76,176 | |
Trustees’ fees and expenses | | | 34,000 | |
Custodian fee | | | 2,300,051 | |
Transfer and dividend disbursing agent fees | | | 982,008 | |
Legal and accounting services | | | 78,345 | |
Printing and postage | | | 110,400 | |
Registration fees | | | 173,982 | |
Miscellaneous | | | 135,657 | |
Total expenses | | $ | 25,427,208 | |
Deduct — | | | | |
Reduction of custodian fee | | $ | 44 | |
Total expense reductions | | $ | 44 | |
| |
Net expenses | | $ | 25,427,164 | |
| |
Net investment income | | $ | 57,083,365 | |
| |
| Realized and Unrealized Gain (Loss) | | | | |
Net realized gain (loss) — | | | | |
Investment transactions (net of foreign capital gains taxes of $1,009,797) | | $ | 802,833 | |
Foreign currency transactions | | | (1,846,778 | ) |
Net realized loss | | $ | (1,043,945 | ) |
Change in unrealized appreciation (depreciation) — | | | | |
Investments (including net increase of $295,921 in accrued foreign capital gains taxes) | | $ | (210,027,492 | ) |
Foreign currency | | | (153,875 | ) |
Net change in unrealized appreciation (depreciation) | | $ | (210,181,367 | ) |
| |
Net realized and unrealized loss | | $ | (211,225,312 | ) |
| |
Net decrease in net assets from operations | | $ | (154,141,947 | ) |
| | | | |
| | 29 | | See Notes to Financial Statements. |
Parametric Emerging Markets Fund
July 31, 2015
Statements of Changes in Net Assets
| | | | | | | | |
| Increase (Decrease) in Net Assets | | Six Months Ended July 31, 2015
(Unaudited) | | | Year Ended January 31, 2015 | |
From operations — | | | | | | | | |
Net investment income | | $ | 57,083,365 | | | $ | 70,454,043 | |
Net realized gain (loss) from investment and foreign currency transactions | | | (1,043,945 | ) | | | 124,615,509 | |
Net change in unrealized appreciation (depreciation) from investments and foreign currency | | | (210,181,367 | ) | | | (223,186,051 | ) |
Net decrease in net assets from operations | | $ | (154,141,947 | ) | | $ | (28,116,499 | ) |
Distributions to shareholders — | | | | | | | | |
From net investment income | | | | | | | | |
Investor Class | | $ | (774,640 | ) | | $ | (7,624,891 | ) |
Class C | | | (3,739 | ) | | | (62,696 | ) |
Institutional Class | | | (4,129,899 | ) | | | (53,005,889 | ) |
Class R6 | | | (895,569 | ) | | | (8,251,614 | ) |
From net realized gain | | | | | | | | |
Investor Class | | | (8,843,802 | ) | | | (3,278,070 | ) |
Class C | | | (190,277 | ) | | | (91,108 | ) |
Institutional Class | | | (39,758,650 | ) | | | (18,387,380 | ) |
Class R6 | | | (8,307,331 | ) | | | (2,812,144 | ) |
Total distributions to shareholders | | $ | (62,903,907 | ) | | $ | (93,513,792 | ) |
Transactions in shares of beneficial interest — | | | | | | | | |
Proceeds from sale of shares | | | | | | | | |
Investor Class | | $ | 203,981,050 | | | $ | 197,861,864 | |
Class C | | | 209,070 | | | | 897,819 | |
Institutional Class | | | 368,379,227 | | | | 1,330,896,984 | |
Class R6 | | | 76,186,375 | | | | 666,535,564 | |
Net asset value of shares issued to shareholders in payment of distributions declared | | | | | | | | |
Investor Class | | | 9,380,760 | | | | 9,748,494 | |
Class C | | | 162,399 | | | | 129,392 | |
Institutional Class | | | 35,113,761 | | | | 55,872,880 | |
Class R6 | | | 8,856,322 | | | | 10,865,403 | |
Cost of shares redeemed | | | | | | | | |
Investor Class | | | (142,202,307 | ) | | | (362,395,741 | ) |
Class C | | | (1,837,288 | ) | | | (4,832,577 | ) |
Institutional Class | | | (782,767,381 | ) | | | (1,504,658,092 | ) |
Class R6 | | | (20,116,206 | ) | | | (11,403,828 | ) |
Net increase (decrease) in net assets from Fund share transactions | | $ | (244,654,218 | ) | | $ | 389,518,162 | |
| | |
Net increase (decrease) in net assets | | $ | (461,700,072 | ) | | $ | 267,887,871 | |
| | |
| Net Assets | | | | | | | | |
At beginning of period | | $ | 4,436,325,207 | | | $ | 4,168,437,336 | |
At end of period | | $ | 3,974,625,135 | | | $ | 4,436,325,207 | |
| | |
Accumulated undistributed (distributions in excess of) net investment income
included in net assets | | | | | | | | |
At end of period | | $ | 38,801,110 | | | $ | (12,478,408 | ) |
| | | | |
| | 30 | | See Notes to Financial Statements. |
Parametric Emerging Markets Fund
July 31, 2015
Financial Highlights
| | | | | | | | | | | | | | | | | | | | | | | | | | | | |
| | | Investor Class | |
| | | Six Months Ended
July 31, 2015
(Unaudited) | | | Year Ended January 31, | | | Period Ended January 31, 2012(1) | | | Year Ended October 31, | |
| | | | 2015 | | | 2014 | | | 2013 | | | | 2011 | | | 2010 | |
Net asset value — Beginning of period | | $ | 13.850 | | | $ | 14.070 | | | $ | 15.260 | | | $ | 13.940 | | | $ | 13.750 | | | $ | 15.540 | | | $ | 12.440 | |
| | | | | | | |
| Income (Loss) From Operations | | | | | | | | | | | | | | | | | | | | | | | | | | | | |
Net investment income (loss)(2) | | $ | 0.166 | | | $ | 0.204 | | | $ | 0.201 | | | $ | 0.173 | | | $ | (0.014 | ) | | $ | 0.201 | | | $ | 0.105 | |
Net realized and unrealized gain (loss) | | | (0.702 | ) | | | (0.166 | ) | | | (1.204 | ) | | | 1.339 | | | | 0.328 | | | | (1.826 | ) | | | 3.082 | |
| | | | | | | |
Total income (loss) from operations | | $ | (0.536 | ) | | $ | 0.038 | | | $ | (1.003 | ) | | $ | 1.512 | | | $ | 0.314 | | | $ | (1.625 | ) | | $ | 3.187 | |
| | | | | | | |
| Less Distributions | | | | | | | | | | | | | | | | | | | | | | | | | | | | |
From net investment income | | $ | (0.016 | ) | | $ | (0.180 | ) | | $ | (0.187 | ) | | $ | (0.181 | ) | | $ | (0.124 | ) | | $ | (0.165 | ) | | $ | (0.089 | ) |
From net realized gain | | | (0.178 | ) | | | (0.078 | ) | | | — | | | | — | | | | — | | | | — | | | | — | |
Tax return of capital | | | — | | | | — | | | | — | | | | (0.011 | ) | | | — | | | | — | | | | — | |
| | | | | | | |
Total distributions | | $ | (0.194 | ) | | $ | (0.258 | ) | | $ | (0.187 | ) | | $ | (0.192 | ) | | $ | (0.124 | ) | | $ | (0.165 | ) | | $ | (0.089 | ) |
| | | | | | | |
Redemption fees(2)(3) | | $ | — | | | $ | — | | | $ | — | | | $ | — | | | $ | — | | | $ | 0.000 | (4) | | $ | 0.002 | |
| | | | | | | |
Net asset value — End of period | | $ | 13.120 | | | $ | 13.850 | | | $ | 14.070 | | | $ | 15.260 | | | $ | 13.940 | | | $ | 13.750 | | | $ | 15.540 | |
| | | | | | | |
Total Return(5) | | | (4.01 | )%(6) | | | 0.25 | % | | | (6.62 | )% | | | 10.89 | % | | | 2.38 | %(6) | | | (10.59 | )% | | | 25.77 | % |
| | | | | | | |
| Ratios/Supplemental Data | | | | | | | | | | | | | | | | | | | | | | | | | | | | |
Net assets, end of period (000’s omitted) | | $ | 636,777 | | | $ | 599,094 | | | $ | 755,768 | | | $ | 738,776 | | | $ | 493,567 | | | $ | 481,194 | | | $ | 267,040 | |
Ratios (as a percentage of average daily net assets): | | | | | | | | | | | | | | | | | | | | | | | | | | | | |
Expenses(7) | | | 1.35 | %(8) | | | 1.36 | % | | | 1.38 | % | | | 1.42 | % | | | 1.45 | %(8) | | | 1.45 | % | | | 1.51 | % |
Net investment income (loss) | | | 2.38 | %(8) | | | 1.34 | % | | | 1.36 | % | | | 1.22 | % | | | (0.43 | )%(8) | | | 1.33 | % | | | 0.77 | % |
Portfolio Turnover | | | 5 | %(6) | | | 9 | % | | | 7 | % | | | 3 | % | | | 0 | %(6)(9) | | | 3 | % | | | 8 | % |
| (1) | For the three months ended January 31, 2012. The Fund changed its fiscal year-end from October 31 to January 31. |
| (2) | Computed using average shares outstanding. |
| (3) | Redemption fees were discontinued as of January 1, 2011. |
| (4) | Amount is less than $0.0005. |
| (5) | Returns are historical and are calculated by determining the percentage change in net asset value with all distributions reinvested and do not reflect the effect of sales charges, if applicable, which were eliminated effective March 1, 2013. |
| (7) | Excludes the effect of custody fee credits, if any, of less than 0.005%. |
| (9) | Amount is less than 0.5%. |
| | | | |
| | 31 | | See Notes to Financial Statements. |
Parametric Emerging Markets Fund
July 31, 2015
Financial Highlights — continued
| | | | | | | | | | | | | | | | | | | | | | | | | | | | |
| | | Class C | |
| | | Six Months Ended July 31, 2015
(Unaudited) | | | Year Ended January 31, | | | Period Ended January 31, 2012(1) | | | Year Ended October 31, | |
| | | | 2015 | | | 2014 | | | 2013 | | | | 2011 | | | 2010 | |
Net asset value — Beginning of period | | $ | 13.760 | | | $ | 13.960 | | | $ | 15.130 | | | $ | 13.820 | | | $ | 13.530 | | | $ | 15.310 | | | $ | 12.280 | |
| | | | | | | |
| Income (Loss) From Operations | | | | | | | | | | | | | | | | | | | | | | | | | | | | |
Net investment income (loss)(2) | | $ | 0.109 | | | $ | 0.094 | | | $ | 0.091 | | | $ | 0.095 | | | $ | (0.038 | ) | | $ | 0.074 | | | $ | 0.020 | |
Net realized and unrealized gain (loss) | | | (0.687 | ) | | | (0.163 | ) | | | (1.188 | ) | | | 1.294 | | | | 0.333 | | | | (1.792 | ) | | | 3.032 | |
| | | | | | | |
Total income (loss) from operations | | $ | (0.578 | ) | | $ | (0.069 | ) | | $ | (1.097 | ) | | $ | 1.389 | | | $ | 0.295 | | | $ | (1.718 | ) | | $ | 3.052 | |
| | | | | | | |
| Less Distributions | | | | | | | | | | | | | | | | | | | | | | | | | | | | |
From net investment income | | $ | (0.004 | ) | | $ | (0.053 | ) | | $ | (0.073 | ) | | $ | (0.075 | ) | | $ | (0.005 | ) | | $ | (0.062 | ) | | $ | (0.024 | ) |
From net realized gain | | | (0.178 | ) | | | (0.078 | ) | | | — | | | | — | | | | — | | | | — | | | | — | |
Tax return of capital | | | — | | | | — | | | | — | | | | (0.004 | ) | | | — | | | | — | | | | — | |
| | | | | | | |
Total distributions | | $ | (0.182 | ) | | $ | (0.131 | ) | | $ | (0.073 | ) | | $ | (0.079 | ) | | $ | (0.005 | ) | | $ | (0.062 | ) | | $ | (0.024 | ) |
| | | | | | | |
Redemption fees(2)(3) | | $ | — | | | $ | — | | | $ | — | | | $ | — | | | $ | — | | | $ | 0.000 | (4) | | $ | 0.002 | |
| | | | | | | |
Net asset value — End of period | | $ | 13.000 | | | $ | 13.760 | | | $ | 13.960 | | | $ | 15.130 | | | $ | 13.820 | | | $ | 13.530 | | | $ | 15.310 | |
| | | | | | | |
Total Return(5) | | | (4.33 | )%(6) | | | (0.51 | )% | | | (7.27 | )% | | | 10.07 | % | | | 2.18 | %(6) | | | (11.27 | )% | | | 24.91 | % |
| | | | | | | |
| Ratios/Supplemental Data | | | | | | | | | | | | | | | | | | | | | | | | | | | | |
Net assets, end of period (000’s omitted) | | $ | 13,748 | | | $ | 15,996 | | | $ | 19,779 | | | $ | 23,348 | | | $ | 22,646 | | | $ | 22,866 | | | $ | 22,800 | |
Ratios (as a percentage of average daily net assets): | | | | | | | | | | | | | | | | | | | | | | | | | | | | |
Expenses(7) | | | 2.10 | %(8) | | | 2.11 | % | | | 2.13 | % | | | 2.16 | % | | | 2.19 | %(8) | | | 2.19 | % | | | 2.26 | % |
Net investment income (loss) | | | 1.56 | %(8) | | | 0.63 | % | | | 0.63 | % | | | 0.68 | % | | | (1.18 | )%(8) | | | 0.49 | % | | | 0.15 | % |
Portfolio Turnover | | | 5 | %(6) | | | 9 | % | | | 7 | % | | | 3 | % | | | 0 | %(6)(9) | | | 3 | % | | | 8 | % |
| (1) | For the three months ended January 31, 2012. The Fund changed its fiscal year-end from October 31 to January 31. |
| (2) | Computed using average shares outstanding. |
| (3) | Redemption fees were discontinued as of January 1, 2011. |
| (4) | Amount is less than $0.0005. |
| (5) | Returns are historical and are calculated by determining the percentage change in net asset value with all distributions reinvested and do not reflect the effect of sales charges. |
| (7) | Excludes the effect of custody fee credits, if any, of less than 0.005%. |
| (9) | Amount is less than 0.5%. |
| | | | |
| | 32 | | See Notes to Financial Statements. |
Parametric Emerging Markets Fund
July 31, 2015
Financial Highlights — continued
| | | | | | | | | | | | | | | | | | | | | | | | | | | | |
| | | Institutional Class | |
| | | Six Months Ended
July 31, 2015
(Unaudited) | | | Year Ended January 31, | | | Period Ended January 31, 2012(1) | | | Year Ended October 31, | |
| | | | 2015 | | | 2014 | | | 2013 | | | | 2011 | | | 2010 | |
Net asset value — Beginning of period | | $ | 13.890 | | | $ | 14.110 | | | $ | 15.310 | | | $ | 13.970 | | | $ | 13.810 | | | $ | 15.580 | | | $ | 12.460 | |
| | | | | | | |
| Income (Loss) From Operations | | | | | | | | | | | | | | | | | | | | | | | | | | | | |
Net investment income (loss)(2) | | $ | 0.181 | | | $ | 0.243 | | | $ | 0.224 | | | $ | 0.222 | | | $ | (0.006 | ) | | $ | 0.233 | | | $ | 0.163 | |
Net realized and unrealized gain (loss) | | | (0.704 | ) | | | (0.162 | ) | | | (1.197 | ) | | | 1.339 | | | | 0.322 | | | | (1.821 | ) | | | 3.071 | |
| | | | | | | |
Total income (loss) from operations | | $ | (0.523 | ) | | $ | 0.081 | | | $ | (0.973 | ) | | $ | 1.561 | | | $ | 0.316 | | | $ | (1.588 | ) | | $ | 3.234 | |
| | | | | | | |
| Less Distributions | | | | | | | | | | | | | | | | | | | | | | | | | | | | |
From net investment income | | $ | (0.019 | ) | | $ | (0.223 | ) | | $ | (0.227 | ) | | $ | (0.209 | ) | | $ | (0.156 | ) | | $ | (0.182 | ) | | $ | (0.116 | ) |
From net realized gain | | | (0.178 | ) | | | (0.078 | ) | | | — | | | | — | | | | — | | | | — | | | | — | |
Tax return of capital | | | — | | | | — | | | | — | | | | (0.012 | ) | | | — | | | | — | | | | — | |
| | | | | | | |
Total distributions | | $ | (0.197 | ) | | $ | (0.301 | ) | | $ | (0.227 | ) | | $ | (0.221 | ) | | $ | (0.156 | ) | | $ | (0.182 | ) | | $ | (0.116 | ) |
| | | | | | | |
Redemption fees(2)(3) | | $ | — | | | $ | — | | | $ | — | | | $ | — | | | $ | — | | | $ | 0.000 | (4) | | $ | 0.002 | |
| | | | | | | |
Net asset value — End of period | | $ | 13.170 | | | $ | 13.890 | | | $ | 14.110 | | | $ | 15.310 | | | $ | 13.970 | | | $ | 13.810 | | | $ | 15.580 | |
| | | | | | | |
Total Return(5) | | | (3.91 | )%(6) | | | 0.55 | % | | | (6.42 | )% | | | 11.22 | % | | | 2.41 | %(6) | | | (10.39 | )% | | | 26.22 | % |
| | | | | | | |
| Ratios/Supplemental Data | | | | | | | | | | | | | | | | | | | | | | | | | | | | |
Net assets, end of period (000’s omitted) | | $ | 2,701,067 | | | $ | 3,227,614 | | | $ | 3,392,890 | | | $ | 2,739,147 | | | $ | 1,988,618 | | | $ | 1,845,906 | | | $ | 1,623,796 | |
Ratios (as a percentage of average daily net assets): | | | | | | | | | | | | | | | | | | | | | | | | | | | | |
Expenses(7) | | | 1.10 | %(8) | | | 1.11 | % | | | 1.13 | % | | | 1.16 | % | | | 1.20 | %(8) | | | 1.20 | % | | | 1.26 | % |
Net investment income (loss) | | | 2.57 | %(8) | | | 1.59 | % | | | 1.52 | % | | | 1.56 | % | | | (0.18 | )%(8) | | | 1.53 | % | | | 1.19 | % |
Portfolio Turnover | | | 5 | %(6) | | | 9 | % | | | 7 | % | | | 3 | % | | | 0 | %(6)(9) | | | 3 | % | | | 8 | % |
| (1) | For the three months ended January 31, 2012. The Fund changed its fiscal year-end from October 31 to January 31. |
| (2) | Computed using average shares outstanding. |
| (3) | Redemption fees were discontinued as of January 1, 2011. |
| (4) | Amount is less than $0.0005. |
| (5) | Returns are historical and are calculated by determining the percentage change in net asset value with all distributions reinvested. |
| (7) | Excludes the effect of custody fee credits, if any, of less than 0.005%. |
| (9) | Amount is less than 0.5%. |
| | | | |
| | 33 | | See Notes to Financial Statements. |
Parametric Emerging Markets Fund
July 31, 2015
Financial Highlights — continued
| | | | | | | | |
| | | Class R6 | |
| | | Six Months Ended
July 31, 2015
(Unaudited) | | | Period Ended January 31, 2015(1) | |
Net asset value — Beginning of period | | $ | 13.890 | | | $ | 16.010 | |
| | |
| Income (Loss) From Operations | | | | | | | | |
Net investment income(2) | | $ | 0.187 | | | $ | 0.027 | |
Net realized and unrealized loss | | | (0.710 | ) | | | (1.842 | ) |
| | |
Total loss from operations | | $ | (0.523 | ) | | $ | (1.815 | ) |
| | |
| Less Distributions | | | | | | | | |
From net investment income | | $ | (0.019 | ) | | $ | (0.227 | ) |
From net realized gain | | | (0.178 | ) | | | (0.078 | ) |
| | |
Total distributions | | $ | (0.197 | ) | | $ | (0.305 | ) |
| | |
Net asset value — End of period | | $ | 13.170 | | | $ | 13.890 | |
| | |
Total Return(3) | | | (3.90 | )%(4) | | | (11.36 | )%(4) |
| | |
| Ratios/Supplemental Data | | | | | | | | |
Net assets, end of period (000’s omitted) | | $ | 623,033 | | | $ | 593,622 | |
Ratios (as a percentage of average daily net assets): | | | | | | | | |
Expenses(5) | | | 1.06 | %(6) | | | 1.07 | %(6) |
Net investment income | | | 2.66 | %(6) | | | 0.31 | %(6) |
Portfolio Turnover | | | 5 | %(4) | | | 9 | %(7) |
| (1) | For the period from the commencement of operations, July 1, 2014, to January 31, 2015. |
| (2) | Computed using average shares outstanding. |
| (3) | Returns are historical and are calculated by determining the percentage change in net asset value with all distributions reinvested. |
| (5) | Excludes the effect of custody fee credits, if any, of less than 0.005%. |
| (7) | For the Fund’s year ended January 31, 2015. |
| | | | |
| | 34 | | See Notes to Financial Statements. |
Parametric Emerging Markets Fund
July 31, 2015
Notes to Financial Statements (Unaudited)
1 Significant Accounting Policies
Parametric Emerging Markets Fund (the Fund) is a diversified series of Eaton Vance Mutual Funds Trust (the Trust). The Trust is a Massachusetts business trust registered under the Investment Company Act of 1940, as amended (the 1940 Act), as an open-end management investment company. The Fund’s investment objective is to seek long-term capital appreciation. The Fund offers four classes of shares. Investor Class, Institutional Class and Class R6 shares are sold at net asset value and are not subject to a sales charge. Class C shares are sold at net asset value and are generally subject to a contingent deferred sales charge (see Note 5). Effective March 1, 2013, Class C shares of the Fund are no longer available for purchase, except by existing shareholders (including shares acquired through the reinvestment of dividends and distributions) or qualified retirement plans. Each class represents a pro-rata interest in the Fund, but votes separately on class-specific matters and (as noted below) is subject to different expenses. Realized and unrealized gains and losses and net investment income and losses, other than class-specific expenses, are allocated daily to each class of shares based on the relative net assets of each class to the total net assets of the Fund. Sub-accounting, recordkeeping and similar administrative fees payable to financial intermediaries, which are a component of transfer and dividend disbursing agent fees on the Statement of Operations, are not allocated to Class R6 shares. Each class of shares differs in its distribution plan and certain other class-specific expenses.
The following is a summary of significant accounting policies of the Fund. The policies are in conformity with accounting principles generally accepted in the United States of America (U.S. GAAP). The Fund is an investment company and follows accounting and reporting guidance in the Financial Accounting Standards Board (“FASB”) Accounting Standards Codification Topic 946.
A Investment Valuation — The following methodologies are used to determine the market value or fair value of investments.
Equity Securities. Equity securities listed on a U.S. securities exchange generally are valued at the last sale or closing price on the day of valuation or, if no sales took place on such date, at the mean between the closing bid and asked prices therefore on the exchange where such securities are principally traded. Equity securities listed on the NASDAQ Global or Global Select Market generally are valued at the NASDAQ official closing price. Unlisted or listed securities for which closing sales prices or closing quotations are not available are valued at the mean between the latest available bid and asked prices. Equity-linked securities are generally valued based on the value of the underlying equity security or instrument.
Debt Obligations. Debt obligations (including short-term obligations with a remaining maturity of more than sixty days) are generally valued on the basis of valuations provided by third party pricing services, as derived from such services’ pricing models. Inputs to the models may include, but are not limited to, reported trades, executable bid and asked prices, broker/dealer quotations, prices or yields of securities with similar characteristics, interest rates, anticipated prepayments, benchmark curves or information pertaining to the issuer, as well as industry and economic events. The pricing services may use a matrix approach, which considers information regarding securities with similar characteristics to determine the valuation for a security. Short-term obligations purchased with a remaining maturity of sixty days or less are generally valued at amortized cost, which approximates market value.
Foreign Securities and Currencies. Foreign securities and currencies are valued in U.S. dollars, based on foreign currency exchange rate quotations supplied by a third party pricing service. The pricing service uses a proprietary model to determine the exchange rate. Inputs to the model include reported trades and implied bid/ask spreads. The daily valuation of exchange-traded foreign securities generally is determined as of the close of trading on the principal exchange on which such securities trade. Events occurring after the close of trading on foreign exchanges may result in adjustments to the valuation of foreign securities to more accurately reflect their fair value as of the close of regular trading on the New York Stock Exchange. When valuing foreign equity securities that meet certain criteria, the Fund’s Trustees have approved the use of a fair value service that values such securities to reflect market trading that occurs after the close of the applicable foreign markets of comparable securities or other instruments that have a strong correlation to the fair-valued securities.
Fair Valuation. Investments for which valuations or market quotations are not readily available or are deemed unreliable are valued at fair value using methods determined in good faith by or at the direction of the Trustees of the Fund in a manner that fairly reflects the security’s value, or the amount that the Fund might reasonably expect to receive for the security upon its current sale in the ordinary course. Each such determination is based on a consideration of relevant factors, which are likely to vary from one pricing context to another. These factors may include, but are not limited to, the type of security, the existence of any contractual restrictions on the security’s disposition, the price and extent of public trading in similar securities of the issuer or of comparable companies or entities, quotations or relevant information obtained from broker/dealers or other market participants, information obtained from the issuer, analysts, and/or the appropriate stock exchange (for exchange-traded securities), an analysis of the company’s or entity’s financial condition, and an evaluation of the forces that influence the issuer and the market(s) in which the security is purchased and sold.
B Investment Transactions — Investment transactions for financial statement purposes are accounted for on a trade date basis. Realized gains and losses on investments sold are determined on the basis of identified cost.
C Income — Dividend income is recorded on the ex-dividend date for dividends received in cash and/or securities. However, if the ex-dividend date has passed, certain dividends from foreign securities are recorded as the Fund is informed of the ex-dividend date. Withholding taxes on foreign dividends, interest and capital gains have been provided for in accordance with the Fund’s understanding of the applicable countries’ tax rules and rates. Interest income is recorded on the basis of interest accrued, adjusted for amortization of premium or accretion of discount.
D Federal and Other Taxes — The Fund’s policy is to comply with the provisions of the Internal Revenue Code applicable to regulated investment companies and to distribute to shareholders each year substantially all of its net investment income, and all or substantially all of its net realized capital gains. Accordingly, no provision for federal income or excise tax is necessary.
Parametric Emerging Markets Fund
July 31, 2015
Notes to Financial Statements (Unaudited) — continued
In addition to the requirements of the Internal Revenue Code, the Fund may also be subject to local taxes on the recognition of capital gains in certain countries. In determining the daily net asset value, the Fund estimates the accrual for such taxes, if any, based on the unrealized appreciation on certain portfolio securities and the related tax rates. Taxes attributable to unrealized appreciation are included in the change in unrealized appreciation (depreciation) on investments. Capital gains taxes on securities sold are included in net realized gain (loss) on investments.
As of July 31, 2015, the Fund had no uncertain tax positions that would require financial statement recognition, de-recognition, or disclosure. The Fund files a U.S. federal income tax return annually after its fiscal year-end, which is subject to examination by the Internal Revenue Service for a period of three years from the date of filing.
E Expenses — The majority of expenses of the Trust are directly identifiable to an individual fund. Expenses which are not readily identifiable to a specific fund are allocated taking into consideration, among other things, the nature and type of expense and the relative size of the funds.
F Expense Reduction — State Street Bank and Trust Company (SSBT) serves as custodian of the Fund. Pursuant to the custodian agreement, SSBT receives a fee reduced by credits, which are determined based on the average daily cash balance the Fund maintains with SSBT. All credit balances, if any, used to reduce the Fund’s custodian fees are reported as a reduction of expenses in the Statement of Operations.
G Foreign Currency Translation — Investment valuations, other assets, and liabilities initially expressed in foreign currencies are translated each business day into U.S. dollars based upon current exchange rates. Purchases and sales of foreign investment securities and income and expenses denominated in foreign currencies are translated into U.S. dollars based upon currency exchange rates in effect on the respective dates of such transactions. Recognized gains or losses on investment transactions attributable to changes in foreign currency exchange rates are recorded for financial statement purposes as net realized gains and losses on investments. That portion of unrealized gains and losses on investments that results from fluctuations in foreign currency exchange rates is not separately disclosed.
H Equity-Linked Securities — Equity-linked securities are primarily used as an alternative means to more efficiently and effectively access the securities markets of emerging market countries and may also be known as participation notes, equity swaps, and zero strike calls and warrants. Equity-linked securities are privately issued securities whose investment results are designed to correspond generally to the performance of a specified stock index or “basket” of stocks, or a single stock. The Fund deposits an amount of cash with its custodian (or broker, if legally permitted) in an amount near or equal to the selling price of the underlying security in exchange for an equity-linked security. Upon sale, the Fund receives cash from the broker or custodian equal to the current value of the underlying security, less transactional costs. Aside from market risk of the underlying security, there is the risk that the issuer of an equity-linked security may default on its obligation under the security. In addition, the Fund may be unable to close out such a transaction with the other party or obtain an offsetting position with any other party, at any time prior to the end of the term of the underlying agreement. Income received on equity-linked securities is recorded as dividend income.
I Use of Estimates — The preparation of the financial statements in conformity with U.S. GAAP requires management to make estimates and assumptions that affect the reported amounts of assets and liabilities at the date of the financial statements and the reported amounts of income and expense during the reporting period. Actual results could differ from those estimates.
J Indemnifications — Under the Trust’s organizational documents, its officers and Trustees may be indemnified against certain liabilities and expenses arising out of the performance of their duties to the Fund. Under Massachusetts law, if certain conditions prevail, shareholders of a Massachusetts business trust (such as the Trust) could be deemed to have personal liability for the obligations of the Trust. However, the Trust’s Declaration of Trust contains an express disclaimer of liability on the part of Fund shareholders and the By-laws provide that the Trust shall assume the defense on behalf of any Fund shareholders. Moreover, the By-laws also provide for indemnification out of Fund property of any shareholder held personally liable solely by reason of being or having been a shareholder for all loss or expense arising from such liability. Additionally, in the normal course of business, the Fund enters into agreements with service providers that may contain indemnification clauses. The Fund’s maximum exposure under these arrangements is unknown as this would involve future claims that may be made against the Fund that have not yet occurred.
K Interim Financial Statements — The interim financial statements relating to July 31, 2015 and for the six months then ended have not been audited by an independent registered public accounting firm, but in the opinion of the Fund’s management, reflect all adjustments, consisting only of normal recurring adjustments, necessary for the fair presentation of the financial statements.
2 Distributions to Shareholders and Income Tax Information
It is the present policy of the Fund to make at least one distribution annually (normally in December) of all or substantially all of its net investment income and to distribute annually all or substantially all of its net realized capital gains (reduced by available capital loss carryforwards from prior years). Distributions to shareholders are recorded on the ex-dividend date. Distributions are declared separately for each class of shares. Shareholders may reinvest income and capital gain distributions in additional shares of the same class of the Fund at the net asset value as of the ex-dividend date or, at the election of the shareholder, receive distributions in cash. Distributions to shareholders are determined in accordance with income tax regulations, which may differ from U.S. GAAP. As required by U.S. GAAP, only distributions in excess of tax basis earnings and profits are reported in the financial statements as a return of capital. Permanent differences between book and tax accounting relating to distributions are reclassified to paid-in capital. For tax purposes, distributions from short-term capital gains are considered to be from ordinary income.
Parametric Emerging Markets Fund
July 31, 2015
Notes to Financial Statements (Unaudited) — continued
The cost and unrealized appreciation (depreciation) of investments of the Fund at July 31, 2015, as determined on a federal income tax basis, were as follows:
| | | | |
| |
Aggregate cost | | $ | 4,347,329,953 | |
| |
Gross unrealized appreciation | | $ | 659,613,234 | |
Gross unrealized depreciation | | | (1,026,097,503 | ) |
| |
Net unrealized depreciation | | $ | (366,484,269 | ) |
3 Investment Adviser Fee and Other Transactions with Affiliates
The investment adviser fee is earned by Eaton Vance Management (EVM) as compensation for management and investment advisory services rendered to the Fund. Pursuant to the investment advisory agreement and subsequent fee reduction agreement between the Fund and EVM effective May 1, 2015, the fee is computed at an annual rate of 0.85% of the Fund’s average daily net assets up to $500 million, 0.80% on net assets of $500 million but less than $1 billion, 0.775% on net assets of $1 billion but less than $2.5 billion, 0.75% on net assets of $2.5 billion but less than $5 billion, 0.73% on net assets of $5 billion but less than $7.5 billion and 0.71% on net assets of $7.5 billion and over, and is payable monthly. Prior to May 1, 2015, the annual rate on the Fund’s average daily net assets of $5 billion and over was 0.73%. The fee reduction cannot be terminated or reduced without the approval of a majority vote of the Trustees of the Fund who are not interested persons of EVM or the Fund and by the vote of a majority of shareholders. For the six months ended July 31, 2015, the investment adviser fee amounted to $17,342,130 or 0.77% (annualized) of the Fund’s average daily net assets. Pursuant to a sub-advisory agreement, EVM has delegated the investment management of the Fund to Parametric Portfolio Associates LLC (Parametric), a majority-owned subsidiary of Eaton Vance Corp. EVM pays Parametric a portion of its advisory fee for sub-advisory services provided to the Fund. The administration fee is earned by EVM for administering the business affairs of the Fund and is computed at an annual rate of 0.15% of the Fund’s average daily net assets. For the six months ended July 31, 2015, the administration fee amounted to $3,356,851.
EVM provides sub-transfer agency and related services to the Fund pursuant to a Sub-Transfer Agency Support Services Agreement. For the six months ended July 31, 2015, EVM earned $20,519 from the Fund pursuant to such agreement, which is included in transfer and dividend disbursing agent fees on the Statement of Operations. Eaton Vance Distributors, Inc. (EVD), an affiliate of EVM and the Fund’s principal underwriter, received distribution and service fees from Investor Class and Class C shares (see Note 4) and contingent deferred sales charges (see Note 5).
Trustees and officers of the Fund who are members of EVM’s organization receive remuneration for their services to the Fund out of the investment adviser fee. Trustees of the Fund who are not affiliated with EVM may elect to defer receipt of all or a percentage of their annual fees in accordance with the terms of the Trustees Deferred Compensation Plan. For the six months ended July 31, 2015, no significant amounts have been deferred. Certain officers and Trustees of the Fund are officers of EVM.
4 Distribution Plans
The Fund has in effect a distribution plan for Investor Class shares (Investor Class Plan) pursuant to Rule 12b-1 under the 1940 Act. Pursuant to the Investor Class Plan, the Fund pays EVD a distribution and service fee of 0.25% per annum of its average daily net assets attributable to Investor Class shares for distribution services and facilities provided to the Fund by EVD, as well as for personal services and/or the maintenance of shareholder accounts. Distribution and service fees paid or accrued to EVD for the six months ended July 31, 2015 amounted to $837,608 for Investor Class shares.
The Fund also has in effect a distribution plan for Class C shares (Class C Plan) pursuant to Rule 12b-1 under the 1940 Act. Pursuant to the Class C Plan, the Fund pays EVD amounts equal to 0.75% per annum of its average daily net assets attributable to Class C shares for providing ongoing distribution services and facilities to the Fund. For the six months ended July 31, 2015, the Fund paid or accrued to EVD $57,132 for Class C shares.
Pursuant to the Class C Plan, the Fund also makes payments of service fees to EVD, financial intermediaries and other persons in amounts equal to 0.25% per annum of its average daily net assets attributable to that class. Service fees paid or accrued are for personal services and/or the maintenance of shareholder accounts. They are separate and distinct from the sales commissions and distribution fees payable to EVD. Service fees paid or accrued for the six months ended July 31, 2015 amounted to $19,044 for Class C shares.
Distribution and service fees are subject to the limitations contained in the Financial Industry Regulatory Authority’s NASD Conduct Rule 2830(d).
5 Contingent Deferred Sales Charges
A contingent deferred sales charge (CDSC) of 1% generally is imposed on redemptions of Class C shares made within one year of purchase. Generally, the CDSC is based upon the lower of the net asset value at date of redemption or date of purchase. No charge is levied on shares acquired by reinvestment of dividends or capital gain distributions. For the six months ended July 31, 2015, the Fund was informed that EVD received approximately $200 of CDSCs paid by Class C shareholders.
Parametric Emerging Markets Fund
July 31, 2015
Notes to Financial Statements (Unaudited) — continued
6 Purchases and Sales of Investments
Purchases and sales of investments, other than short-term obligations, aggregated $226,430,723 and $438,707,892, respectively, for the six months ended July 31, 2015.
7 Shares of Beneficial Interest
The Fund’s Declaration of Trust permits the Trustees to issue an unlimited number of full and fractional shares of beneficial interest (without par value). Such shares may be issued in a number of different series (such as the Fund) and classes. Transactions in Fund shares were as follows:
| | | | | | | | |
| Investor Class | | Six Months Ended
July 31, 2015
(Unaudited) | | | Year Ended
January 31, 2015 | |
| | |
Sales | | | 14,615,755 | | | | 13,143,124 | |
Issued to shareholders electing to receive payments of distributions in Fund shares | | | 644,726 | | | | 694,832 | |
Redemptions | | | (9,980,982 | ) | | | (24,293,071 | ) |
| | |
Net increase (decrease) | | | 5,279,499 | | | | (10,455,115 | ) |
| | |
| | | | | | | | |
| Class C | | Six Months Ended
July 31, 2015
(Unaudited) | | | Year Ended
January 31, 2015 | |
| | |
Sales | | | 14,781 | | | | 59,440 | |
Issued to shareholders electing to receive payments of distributions in Fund shares | | | 11,255 | | | | 9,275 | |
Redemptions | | | (130,532 | ) | | | (323,121 | ) |
| | |
Net decrease | | | (104,496 | ) | | | (254,406 | ) |
| | |
| | | | | | | | |
| Institutional Class | | Six Months Ended
July 31, 2015
(Unaudited) | | | Year Ended
January 31, 2015 | |
| | |
Sales | | | 25,964,289 | | | | 87,215,213 | |
Issued to shareholders electing to receive payments of distributions in Fund shares | | | 2,406,700 | | | | 3,973,840 | |
Redemptions | | | (55,686,665 | ) | | | (99,157,476 | ) |
| | |
Net decrease | | | (27,315,676 | ) | | | (7,968,423 | ) |
| | |
| | | | | | | | |
| Class R6 | | Six Months Ended
July 31, 2015
(Unaudited) | | | Period Ended
January 31, 2015(1) | |
| | |
Sales | | | 5,380,315 | | | | 42,716,351 | |
Issued to shareholders electing to receive payments of distributions in Fund shares | | | 606,597 | | | | 772,239 | |
Redemptions | | | (1,423,868 | ) | | | (758,357 | ) |
| | |
Net increase | | | 4,563,044 | | | | 42,730,233 | |
| (1) | Class R6 commenced operations on July 1, 2014. |
Parametric Emerging Markets Fund
July 31, 2015
Notes to Financial Statements (Unaudited) — continued
8 Line of Credit
The Fund participates with other portfolios and funds managed by EVM and its affiliates in a $750 million unsecured line of credit agreement with a group of banks, which is in effect through September 7, 2015. Borrowings are made by the Fund solely to facilitate the handling of unusual and/or unanticipated short-term cash requirements. Interest is charged to the Fund based on its borrowings at an amount above either the Eurodollar rate or Federal Funds rate. In addition, a fee computed at an annual rate of 0.08% on the daily unused portion of the line of credit is allocated among the participating portfolios and funds at the end of each quarter. Because the line of credit is not available exclusively to the Fund, it may be unable to borrow some or all of its requested amounts at any particular time. At July 31, 2015, the Fund had a balance outstanding pursuant to this line of credit of $35,500,000 at an interest rate of 1.14%. Based on the short-term nature of the borrowings under the line of credit and variable interest rate, the carrying value of the borrowings approximated its fair value at July 31, 2015. If measured at fair value, borrowings under the line of credit would have been considered as Level 2 in the fair value hierarchy (see Note 10) at July 31, 2015. The Fund’s average borrowings or allocated fees during the six months ended July 31, 2015 were not significant.
On September 4, 2015, the Fund renewed its line of credit agreement, which expires September 2, 2016. Under the terms of the renewed credit agreement, the commitment amount was reduced to $625 million and the commitment fee on the unused portion of the line of credit was changed to an annual rate of 0.10%.
9 Risks Associated with Foreign Investments
Investing in securities issued by companies whose principal business activities are outside the United States may involve significant risks not present in domestic investments. For example, there is generally less publicly available information about foreign companies, particularly those not subject to the disclosure and reporting requirements of the U.S. securities laws. Certain foreign issuers are generally not bound by uniform accounting, auditing, and financial reporting requirements and standards of practice comparable to those applicable to domestic issuers. Investments in foreign securities also involve the risk of possible adverse changes in investment or exchange control regulations, expropriation or confiscatory taxation, limitation on the removal of funds or other assets of the Fund, political or financial instability or diplomatic and other developments which could affect such investments. Foreign securities markets, while growing in volume and sophistication, are generally not as developed as those in the United States, and securities of some foreign issuers (particularly those located in developing countries) may be less liquid and more volatile than securities of comparable U.S. companies. In general, there is less overall governmental supervision and regulation of foreign securities markets, broker/dealers and issuers than in the United States. The foregoing risks of foreign investing can be more significant in less developed countries characterized as emerging market countries.
On June 29, 2015, trading of securities on the Athens Stock Exchange was suspended due to the imposition of capital controls by the Greek government. The suspension on trading was lifted in early August after a five-week period.
10 Fair Value Measurements
Under generally accepted accounting principles for fair value measurements, a three-tier hierarchy to prioritize the assumptions, referred to as inputs, is used in valuation techniques to measure fair value. The three-tier hierarchy of inputs is summarized in the three broad levels listed below.
| • | | Level 1 – quoted prices in active markets for identical investments |
| • | | Level 2 – other significant observable inputs (including quoted prices for similar investments, interest rates, prepayment speeds, credit risk, etc.) |
| • | | Level 3 – significant unobservable inputs (including a fund’s own assumptions in determining the fair value of investments) |
In cases where the inputs used to measure fair value fall in different levels of the fair value hierarchy, the level disclosed is determined based on the lowest level input that is significant to the fair value measurement in its entirety. The inputs or methodology used for valuing securities are not necessarily an indication of the risk associated with investing in those securities.
Parametric Emerging Markets Fund
July 31, 2015
Notes to Financial Statements (Unaudited) — continued
At July 31, 2015, the hierarchy of inputs used in valuing the Fund’s investments, which are carried at value, were as follows:
| | | | | | | | | | | | | | | | |
| Asset Description | | Level 1 | | | Level 2 | | | Level 3* | | | Total | |
| | | |
Common Stocks | | | | | | | | | | | | |
Asia/Pacific | | $ | 35,005,533 | | | $ | 1,648,781,089 | | | $ | 2,751,677 | | | $ | 1,686,538,299 | |
Emerging Europe | | | 30,050,600 | | | | 728,235,951 | | | | — | | | | 758,286,551 | |
Latin America | | | 759,417,018 | | | | — | | | | 0 | | | | 759,417,018 | |
Middle East/Africa | | | 6,528,963 | | | | 732,383,264 | | | | 185,965 | | | | 739,098,192 | |
| | | | |
Total Common Stocks | | $ | 831,002,114 | | | $ | 3,109,400,304 | ** | | $ | 2,937,642 | | | $ | 3,943,340,060 | |
| | | | |
Equity-Linked Securities – Saudi Arabia | | $ | — | | | $ | 34,082,100 | | | $ | 966,414 | | | $ | 35,048,514 | |
Investment Funds | | | — | | | | 2,219,181 | | | | — | | | | 2,219,181 | |
Warrants | | | 170,327 | | | | — | | | | — | | | | 170,327 | |
Short-Term Investments | | | — | | | | 67,602 | | | | — | | | | 67,602 | |
| | | | |
Total Investments | | $ | 831,172,441 | | | $ | 3,145,769,187 | | | $ | 3,904,056 | | | $ | 3,980,845,684 | |
| * | None of the unobservable inputs for Level 3 assets, individually or collectively, had a material impact on the Fund. |
| ** | Includes foreign equity securities whose values were adjusted to reflect market trading of comparable securities or other correlated instruments that occurred after the close of trading in their applicable foreign markets. |
Level 3 investments at the beginning and/or end of the period in relation to net assets were not significant and accordingly, a reconciliation of Level 3 assets for the six months ended July 31, 2015 is not presented. At July 31, 2015, the value of investments transferred between Level 1 and Level 2 during the six months then ended was not significant.
Parametric Emerging Markets Fund
July 31, 2015
Board of Trustees’ Contract Approval
Overview of the Contract Review Process
The Investment Company Act of 1940, as amended (the “1940 Act”), provides, in substance, that each investment advisory agreement between a fund and its investment adviser will continue in effect from year to year only if its continuation is approved at least annually by the fund’s board of trustees, including by a vote of a majority of the trustees who are not “interested persons” of the fund (“Independent Trustees”), cast in person at a meeting called for the purpose of considering such approval.
At a meeting of the Boards of Trustees (each a “Board”) of the registered investment companies advised, administered and/or distributed by Eaton Vance Management or its affiliates (the “Eaton Vance Funds”) held on April 27, 2015, the Board, including a majority of the Independent Trustees, voted to approve continuation of existing investment advisory and sub-advisory agreements for the Eaton Vance Funds for an additional one-year period. In voting its approval, the Board relied upon the affirmative recommendation of its Contract Review Committee, which is a committee comprised exclusively of Independent Trustees. Prior to making its recommendation, the Contract Review Committee reviewed information furnished by each adviser to the Eaton Vance Funds (including information specifically requested by the Board) for a series of meetings of the Contract Review Committee held between February and April 2015. The Contract Review Committee also considered information received at prior meetings of the Board and its committees, as relevant to its annual evaluation of the investment advisory and sub-advisory agreements.
The information that the Board considered included, among other things, the following:
Information about Fees, Performance and Expenses
| • | | A report from an independent data provider comparing the advisory and related fees paid by each fund with fees paid by comparable funds as identified by the data provider (“comparable funds”); |
| • | | A report from an independent data provider comparing each fund’s total expense ratio and its components to comparable funds; |
| • | | A report from an independent data provider comparing the investment performance of each fund (including, where relevant, yield data, Sharpe ratios and information ratios) to the investment performance of comparable funds over various time periods; |
| • | | Data regarding investment performance in comparison to benchmark indices and customized peer groups identified by the adviser in consultation with the Board; |
| • | | For each fund, comparative information concerning the fees charged and the services provided by each adviser in managing other accounts (including mutual funds, other collective investment funds and institutional accounts) using investment strategies and techniques similar to those used in managing such fund; |
| • | | Profitability analyses for each adviser with respect to each fund; |
Information about Portfolio Management and Trading
| • | | Descriptions of the investment management services provided to each fund, including the investment strategies and processes it employs; |
| • | | The procedures and processes used to determine the fair value of fund assets and actions taken to monitor and test the effectiveness of such procedures and processes; |
| • | | Information about each adviser’s policies and practices with respect to trading, including each adviser’s processes for monitoring best execution of portfolio transactions; |
| • | | Information about the allocation of brokerage transactions and the benefits received by each adviser as a result of brokerage allocation, including information concerning the acquisition of research through client commission arrangements and policies with respect to “soft dollars”; |
| • | | Data relating to portfolio turnover rates of each fund; |
Information about each Adviser
| • | | Reports detailing the financial results and condition of each adviser; |
| • | | Descriptions of the qualifications, education and experience of the individual investment professionals whose responsibilities include portfolio management and investment research for the funds, and information relating to their compensation and responsibilities with respect to managing other mutual funds and investment accounts; |
| • | | The Code of Ethics of each adviser and its affiliates, together with information relating to compliance with and the administration of such codes; |
| • | | Policies and procedures relating to proxy voting and the handling of corporate actions and class actions; |
| • | | Information concerning the resources devoted to compliance efforts undertaken by each adviser and its affiliates (including descriptions of various compliance programs) and their record of compliance; |
| • | | Descriptions of the business continuity and disaster recovery plans of each adviser and its affiliates; |
| • | | A description of Eaton Vance Management’s procedures for overseeing third party advisers and sub-advisers, including with respect to regulatory and compliance issues, investment management and other matters; |
Parametric Emerging Markets Fund
July 31, 2015
Board of Trustees’ Contract Approval — continued
Other Relevant Information
| • | | Information concerning the nature, cost and character of the administrative and other non-investment management services provided by Eaton Vance Management and its affiliates; |
| • | | Information concerning management of the relationship with the custodian, subcustodians and fund accountants by each adviser or the funds’ administrator; and |
| • | | The terms of each investment advisory agreement. |
Over the course of the twelve-month period ended April 30, 2015, with respect to one or more funds, the Board met nine times and the Contract Review Committee, the Audit Committee, the Governance Committee, the Portfolio Management Committee and the Compliance Reports and Regulatory Matters Committee, each of which is a Committee comprised solely of Independent Trustees, met eight, seventeen, seven, eleven and thirteen times, respectively. At such meetings, the Trustees participated in investment and performance reviews with the portfolio managers and other investment professionals of each adviser relating to each fund, and considered the investment and trading strategies used in pursuing each fund’s investment objective, including, where relevant, the use of derivative instruments, as well as processes for monitoring best execution of portfolio transactions and risk management techniques. The Board and its Committees also evaluated issues pertaining to industry and regulatory developments, compliance procedures, fund governance and other issues with respect to the funds, and received and participated in reports and presentations provided by Eaton Vance Management and other fund advisers with respect to such matters. In addition to the formal meetings of the Board and its Committees, the Independent Trustees hold regular teleconferences in between meetings to discuss, among other topics, matters relating to the continuation of investment advisory and sub-advisory agreements.
For funds that invest through one or more underlying portfolios, the Board considered similar information about the portfolio(s) when considering the approval of investment advisory agreements. In addition, in cases where the fund’s investment adviser has engaged a sub-adviser, the Board considered similar information about the sub-adviser when considering the approval of any sub-advisory agreement.
The Contract Review Committee was assisted throughout the contract review process by Goodwin Procter LLP, legal counsel for the Independent Trustees. The members of the Contract Review Committee relied upon the advice of such counsel and their own business judgment in determining the material factors to be considered in evaluating each investment advisory and sub-advisory agreement and the weight to be given to each such factor. The conclusions reached with respect to each investment advisory and sub-advisory agreement were based on a comprehensive evaluation of all the information provided and not any single factor. Moreover, each member of the Contract Review Committee may have placed varying emphasis on particular factors in reaching conclusions with respect to each investment advisory and sub-advisory agreement. In evaluating each investment advisory and sub-advisory agreement, including the specific fee structures and other terms of the agreements, the Contract Review Committee was informed by multiple years of analysis and discussion among the Independent Trustees and the Eaton Vance Funds’ advisers and sub-advisers.
Results of the Process
Based on its consideration of the foregoing, and such other information as it deemed relevant, including the factors and conclusions described below, the Contract Review Committee concluded that the continuation of the investment advisory agreement of Parametric Emerging Markets Fund (the “Fund”) with Eaton Vance Management (the “Adviser”) and the sub-advisory agreement with Parametric Portfolio Associates LLC (the “Sub-adviser”), an affiliate of the Adviser, including their fee structures, is in the interests of shareholders and, therefore, the Contract Review Committee recommended to the Board approval of each agreement. The Board accepted the recommendation of the Contract Review Committee as well as the factors considered and conclusions reached by the Contract Review Committee with respect to the agreements. Accordingly, the Board, including a majority of the Independent Trustees, voted to approve continuation of the investment advisory agreement and the sub-advisory agreement for the Fund.
Nature, Extent and Quality of Services
In considering whether to approve the investment advisory agreement and the sub-advisory agreement of the Fund, the Board evaluated the nature, extent and quality of services provided to the Fund by the Adviser and the Sub-adviser.
The Board considered the Adviser’s and the Sub-adviser’s management capabilities and investment process with respect to the types of investments held by the Fund, including the education, experience and number of its investment professionals and other personnel who provide portfolio management, investment research, and similar services to the Fund, including recent changes to such personnel. With respect to the Adviser, the Board considered the Adviser’s responsibilities supervising the Sub-adviser. With respect to the Sub-adviser, the Board considered the abilities and experience of investment personnel in analyzing factors such as special considerations relevant to investing in emerging markets. The Board noted the Adviser’s in-house equity research capabilities. With respect to the Sub-adviser, the Board noted the Sub-adviser’s experience in deploying quantitative-based investment strategies. The Board also took into account the resources dedicated to portfolio management and other services, as well as the compensation methods of the Adviser and other factors, such as the reputation and resources of the Adviser to recruit and retain investment personnel. In addition, the Board considered the time and attention devoted to the Fund by senior management, as well as the infrastructure, operational capabilities and support staff in place to assist in the management of the Fund, including the provision of administrative services.
The Board considered the compliance programs of the Adviser and relevant affiliates thereof, including the Sub-adviser. Among other matters, the Board considered compliance and reporting matters relating to personal trading by investment personnel, selective disclosure of portfolio holdings, late trading,
Parametric Emerging Markets Fund
July 31, 2015
Board of Trustees’ Contract Approval — continued
frequent trading, portfolio valuation, business continuity and the allocation of investment opportunities. The Board also considered the responses of the Adviser and its affiliates to requests in recent years from regulatory authorities such as the Securities and Exchange Commission and the Financial Industry Regulatory Authority.
The Board considered shareholder and other administrative services provided or managed by the Adviser and its affiliates, including transfer agency and accounting services. The Board evaluated the benefits to shareholders of investing in a fund that is a part of a large family of funds, including the ability, in many cases, to exchange an investment among different funds without incurring additional sales charges.
After consideration of the foregoing factors, among others, the Board concluded that the nature, extent and quality of services provided by the Adviser and the Sub-adviser, taken as a whole, are appropriate and consistent with the terms of the investment advisory agreement and the sub-advisory agreement.
Fund Performance
The Board compared the Fund’s investment performance to that of comparable funds and appropriate benchmark indices. The Board’s review included comparative performance data for the one-, three- and five-year periods ended September 30, 2014 for the Fund. The Board concluded that the performance of the Fund was satisfactory.
Management Fees and Expenses
The Board considered contractual fee rates payable by the Fund for advisory and administrative services (referred to collectively as “management fees”). As part of its review, the Board considered the Fund’s management fees and total expense ratio for the year ended September 30, 2014, as compared to those of comparable funds, before and after giving effect to any undertaking to waive fees or reimburse expenses. The Board also considered factors that had an impact on Fund expense ratios, as identified by management in response to inquiries from the Contract Review Committee, as well as actions taken by management in recent years to reduce expenses at the fund complex level.
After considering the foregoing information, and in light of the nature, extent and quality of the services provided by the Adviser and the Sub-adviser, the Board concluded that the management fees charged for advisory and related services are reasonable.
Profitability
The Board considered the level of profits realized by the Adviser and relevant affiliates thereof, including the Sub-adviser, in providing investment advisory and administrative services to the Fund and to all Eaton Vance Funds as a group. The Board considered the level of profits realized without regard to revenue sharing or other payments by the Adviser and its affiliates to third parties in respect of distribution services. The Board also considered other direct or indirect benefits received by the Adviser and its affiliates, including the Sub-adviser, in connection with their relationships with the Fund, including the benefits of research services that may be available to the Adviser or the Sub-adviser as a result of securities transactions effected for the Fund and other investment advisory clients.
The Board concluded that, in light of the foregoing factors and the nature, extent and quality of the services rendered, the profits realized by the Adviser and its affiliates, including the Sub-adviser, are reasonable.
Economies of Scale
In reviewing management fees and profitability, the Board also considered the extent to which the Adviser and its affiliates, on the one hand, and the Fund, on the other hand, can expect to realize benefits from economies of scale as the assets of the Fund increase. The Board acknowledged the difficulty in accurately measuring the benefits resulting from the economies of scale with respect to the management of any specific fund or group of funds. The Board reviewed data summarizing the increases and decreases in the assets of the Fund and of all Eaton Vance Funds as a group over various time periods, and evaluated the extent to which the total expense ratio of the Fund and the profitability of the Adviser and its affiliates may have been affected by such increases or decreases. Based upon the foregoing, the Board concluded that the Fund currently shares in the benefits from economies of scale. The Board also concluded that, assuming reasonably foreseeable increases in the assets of the Fund, the structure of the advisory fee, which includes breakpoints at several asset levels, including new breakpoints effective May 1, 2015, will allow the Fund to continue to benefit from economies of scale in the future.
Parametric Emerging Markets Fund
July 31, 2015
Officers and Trustees
Officers of Parametric Emerging Markets Fund
Payson F. Swaffield
President
Maureen A. Gemma
Vice President, Secretary and
Chief Legal Officer
James F. Kirchner
Treasurer
Paul M. O’Neil
Chief Compliance Officer
Trustees of Parametric Emerging Markets Fund
Ralph F. Verni
Chairman
Scott E. Eston
Thomas E. Faust Jr.*
Cynthia E. Frost
George J. Gorman
Valerie A. Mosley
William H. Park
Helen Frame Peters
Susan J. Sutherland**
Harriett Tee Taggart
| ** | Ms. Sutherland began serving as a Trustee effective May 1, 2015. |
Eaton Vance Funds
IMPORTANT NOTICES
Privacy. The Eaton Vance organization is committed to ensuring your financial privacy. Each of the financial institutions identified below has in effect the following policy (“Privacy Policy”) with respect to nonpublic personal information about its customers:
| • | | Only such information received from you, through application forms or otherwise, and information about your Eaton Vance fund transactions will be collected. This may include information such as name, address, social security number, tax status, account balances and transactions. |
| • | | None of such information about you (or former customers) will be disclosed to anyone, except as permitted by law (which includes disclosure to employees necessary to service your account). In the normal course of servicing a customer’s account, Eaton Vance may share information with unaffiliated third parties that perform various required services such as transfer agents, custodians and broker-dealers. |
| • | | Policies and procedures (including physical, electronic and procedural safeguards) are in place that are designed to protect the confidentiality of such information. |
| • | | We reserve the right to change our Privacy Policy at any time upon proper notification to you. Customers may want to review our Privacy Policy periodically for changes by accessing the link on our homepage: www.eatonvance.com. |
Our pledge of privacy applies to the following entities within the Eaton Vance organization: the Eaton Vance Family of Funds, Eaton Vance Management, Eaton Vance Investment Counsel, Eaton Vance Distributors, Inc., Eaton Vance Trust Company, Eaton Vance Management’s Real Estate Investment Group and Boston Management and Research. In addition, our Privacy Policy applies only to those Eaton Vance customers who are individuals and who have a direct relationship with us. If a customer’s account (i.e., fund shares) is held in the name of a third-party financial advisor/broker-dealer, it is likely that only such advisor’s privacy policies apply to the customer. This notice supersedes all previously issued privacy disclosures. For more information about Eaton Vance’s Privacy Policy, please call 1-800-262-1122.
Delivery of Shareholder Documents. The Securities and Exchange Commission (SEC) permits funds to deliver only one copy of shareholder documents, including prospectuses, proxy statements and shareholder reports, to fund investors with multiple accounts at the same residential or post office box address. This practice is often called “householding” and it helps eliminate duplicate mailings to shareholders. Eaton Vance, or your financial advisor, may household the mailing of your documents indefinitely unless you instruct Eaton Vance, or your financial advisor, otherwise. If you would prefer that your Eaton Vance documents not be householded, please contact Eaton Vance at 1-800-260-0761, or contact your financial advisor. Your instructions that householding not apply to delivery of your Eaton Vance documents will be effective within 30 days of receipt by Eaton Vance or your financial advisor.
Portfolio Holdings. Each Eaton Vance Fund and its underlying Portfolio(s) (if applicable) will file a schedule of portfolio holdings on Form N-Q with the SEC for the first and third quarters of each fiscal year. The Form N-Q will be available on the Eaton Vance website at www.eatonvance.com, by calling Eaton Vance at 1-800-260-0761 or in the EDGAR database on the SEC’s website at www.sec.gov. Form N-Q may also be reviewed and copied at the SEC’s public reference room in Washington, D.C. (call 1-800-732-0330 for information on the operation of the public reference room).
Proxy Voting. From time to time, funds are required to vote proxies related to the securities held by the funds. The Eaton Vance Funds or their underlying Portfolios (if applicable) vote proxies according to a set of policies and procedures approved by the Funds’ and Portfolios’ Boards. You may obtain a description of these policies and procedures and information on how the Funds or Portfolios voted proxies relating to portfolio securities during the most recent 12-month period ended June 30, without charge, upon request, by calling 1-800-260-0761 and by accessing the SEC’s website at www.sec.gov.
This Page Intentionally Left Blank
This Page Intentionally Left Blank
This Page Intentionally Left Blank
Investment Adviser and Administrator
Eaton Vance Management
Two International Place
Boston, MA 02110
Sub-Adviser
Parametric Portfolio Associates LLC
1918 Eighth Avenue, Suite 3100
Seattle, WA 98101
Principal Underwriter*
Eaton Vance Distributors, Inc.
Two International Place
Boston, MA 02110
(617) 482-8260
Custodian
State Street Bank and Trust Company
State Street Financial Center, One Lincoln Street
Boston, MA 02111
Transfer Agent
BNY Mellon Investment Servicing (US) Inc.
Attn: Eaton Vance Funds
P.O. Box 9653
Providence, RI 02940-9653
(800) 260-0761
Fund Offices
Two International Place
Boston, MA 02110
| * | FINRA BrokerCheck. Investors may check the background of their Investment Professional by contacting the Financial Industry Regulatory Authority (FINRA). FINRA BrokerCheck is a free tool to help investors check the professional background of current and former FINRA-registered securities firms and brokers. FINRA BrokerCheck is available by calling 1-800-289-9999 and at www.FINRA.org. The FINRA BrokerCheck brochure describing the program is available to investors at www.FINRA.org. |

| | |
Parametric Global Small-Cap Fund Semiannual Report July 31, 2015 | | |

Commodity Futures Trading Commission Registration. Effective December 31, 2012, the Commodity Futures Trading Commission (“CFTC”) adopted certain regulatory changes that subject registered investment companies and advisers to regulation by the CFTC if a fund invests more than a prescribed level of its assets in certain CFTC-regulated instruments (including futures, certain options and swap agreements) or markets itself as providing investment exposure to such instruments. The Fund has claimed an exclusion from the definition of the term “commodity pool operator” under the Commodity Exchange Act. Accordingly, neither the Fund nor the adviser with respect to the operation of the Fund is subject to CFTC regulation. Because of its management of other strategies, the Fund’s adviser is registered with the CFTC as a commodity pool operator and a commodity trading advisor.
Fund shares are not insured by the FDIC and are not deposits or other obligations of, or guaranteed by, any depository institution. Shares are subject to investment risks, including possible loss of principal invested.
This report must be preceded or accompanied by a current summary prospectus or prospectus. Before investing, investors should consider carefully the investment objective, risks, and charges and expenses of a mutual fund. This and other important information is contained in the summary prospectus and prospectus, which can be obtained from a financial advisor. Prospective investors should read the prospectus carefully before investing. For further information, please call 1-800-260-0761.
Semiannual Report July 31, 2015
Parametric Global Small-Cap Fund
Table of Contents
| | | | |
Performance | | | 2 | |
| |
Fund Profile | | | 3 | |
| |
Endnotes and Additional Disclosures | | | 4 | |
| |
Fund Expenses | | | 5 | |
| |
Financial Statements | | | 6 | |
| |
Board of Trustees’ Contract Approval | | | 29 | |
| |
Officers and Trustees | | | 32 | |
| |
Important Notices | | | 33 | |
Parametric Global Small-Cap Fund
July 31, 2015
Performance1,2
Portfolio Managers Thomas Seto and Paul Bouchey, CFA, each of Parametric Portfolio Associates LLC
| | | | | | | | | | | | | | | | | | | | | | | | |
| % Average Annual Total Returns | | Class Inception Date | | | Performance Inception Date | | | Six Months | | | One Year | | | Five Years | | | Since Inception | |
Institutional Class at NAV | | | 12/20/2012 | | | | 12/20/2012 | | | | 6.76 | % | | | 3.24 | % | | | — | | | | 9.72 | % |
S&P Global SmallCap Index | | | — | | | | — | | | | 6.86 | % | | | 4.23 | % | | | 11.66 | % | | | 12.77 | % |
| | | | | | |
| | | | | | | | | | | | | | | | | | | | | | | | |
| % Total Annual Operating Expense Ratios3 | | | | | | | | | | | | | | | | | Institutional Class | |
Gross | | | | | | | | | | | | | | | | | | | | | | | 3.33 | % |
Net | | | | | | | | | | | | | | | | | | | | | | | 0.85 | |
See Endnotes and Additional Disclosures in this report.
Past performance is no guarantee of future results. Returns are historical and are calculated by determining the percentage change in net asset value (NAV) or offering price (as applicable) with all distributions reinvested. Investment return and principal value will fluctuate so that shares, when redeemed, may be worth more or less than their original cost. Performance less than one year is cumulative. Performance is for the stated time period only; due to market volatility, the Fund’s current performance may be lower or higher than quoted. Returns are before taxes unless otherwise noted. For performance as of the most recent month-end, please refer to eatonvance.com.
Parametric Global Small-Cap Fund
July 31, 2015
Fund Profile
Sector Allocation (% of net assets)4
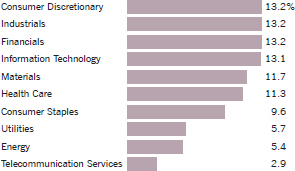
Top 10 Holdings (% of net assets)4
| | | | |
| |
Ulta Salon, Cosmetics & Fragrance, Inc. | | | 0.5 | % |
Alaska Air Group, Inc. | | | 0.5 | |
Allegiant Travel Co. | | | 0.5 | |
Foot Locker, Inc. | | | 0.4 | |
Endo International PLC | | | 0.4 | |
Inmarsat PLC | | | 0.4 | |
Costar Group, Inc. | | | 0.4 | |
Ingenico Group | | | 0.4 | |
Freenet AG | | | 0.4 | |
Jarden Corp. | | | 0.4 | |
Total | | | 4.3 | % |
Geographic Allocation (% of common stocks)
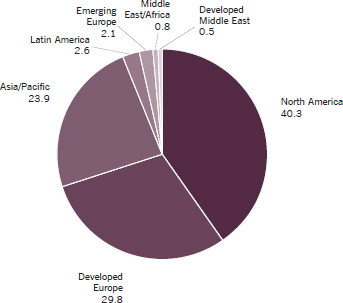
See Endnotes and Additional Disclosures in this report.
Parametric Global Small-Cap Fund
July 31, 2015
Endnotes and Additional Disclosures
| 1 | S&P Global SmallCap Index is an unmanaged index of global small-cap stocks. Unless otherwise stated, index returns do not reflect the effect of any applicable sales charges, commissions, expenses, taxes or leverage, as applicable. It is not possible to invest directly in an index. |
| 2 | Returns are historical and are calculated by determining the percentage change in NAV with all distributions reinvested. Unless otherwise stated, performance does not reflect the deduction of taxes on Fund distributions or redemptions of Fund shares. Performance since inception for an index, if presented, is the performance since the Fund’s or oldest share class’ inception, as applicable. |
| 3 | Source: Fund prospectus. Net expense ratio reflects a contractual expense reimbursement that continues through 5/31/16. Without the reimbursement, if applicable, performance would have been lower. |
| 4 | Excludes cash and cash equivalents. |
| | Fund profile subject to change due to active management. |
| | Important Notice to Shareholders |
| | Effective May 29, 2015, the Fund changed its primary benchmark to the S&P Global SmallCap Index because the Russell Global 2000 Index terminated. |
Parametric Global Small-Cap Fund
July 31, 2015
Fund Expenses
Example: As a Fund shareholder, you incur two types of costs: (1) transaction costs, including sales charges (loads) on purchases and redemption fees (if applicable); and (2) ongoing costs, including management fees; distribution and/or service fees; and other Fund expenses. This Example is intended to help you understand your ongoing costs (in dollars) of Fund investing and to compare these costs with the ongoing costs of investing in other mutual funds. The Example is based on an investment of $1,000 invested at the beginning of the period and held for the entire period (February 1, 2015 – July 31, 2015).
Actual Expenses: The first section of the table below provides information about actual account values and actual expenses. You may use the information in this section, together with the amount you invested, to estimate the expenses that you paid over the period. Simply divide your account value by $1,000 (for example, an $8,600 account value divided by $1,000 = 8.6), then multiply the result by the number in the first section under the heading entitled “Expenses Paid During Period” to estimate the expenses you paid on your account during this period.
Hypothetical Example for Comparison Purposes: The second section of the table below provides information about hypothetical account values and hypothetical expenses based on the actual Fund expense ratio and an assumed rate of return of 5% per year (before expenses), which is not the actual Fund return. The hypothetical account values and expenses may not be used to estimate the actual ending account balance or expenses you paid for the period. You may use this information to compare the ongoing costs of investing in your Fund and other funds. To do so, compare this 5% hypothetical example with the 5% hypothetical examples that appear in the shareholder reports of the other funds.
Please note that the expenses shown in the table are meant to highlight your ongoing costs only and do not reflect any transactional costs, such as sales charges (loads) or redemption fees (if applicable). Therefore, the second section of the table is useful in comparing ongoing costs only, and will not help you determine the relative total costs of owning different funds. In addition, if these transactional costs were included, your costs would be higher.
| | | | | | | | | | | | | | | | |
| | | Beginning
Account Value
(2/1/15) | | | Ending
Account Value
(7/31/15) | | | Expenses Paid
During Period*
(2/1/15 – 7/31/15) | | | Annualized
Expense
Ratio | |
| | | | |
| | | | | | | | | | | | | | | | |
Actual | | | | | | | | | | | | | |
Institutional Class | | $ | 1,000.00 | | | $ | 1,067.60 | | | $ | 4.36 | ** | | | 0.85 | % |
| | | | | | | | | | | | | | | | | |
| | | | |
| | | | | | | | | | | | | | | | |
Hypothetical | | | | | | | | | | | | | |
(5% return per year before expenses) | | | | | | | | | | | | | |
Institutional Class | | $ | 1,000.00 | | | $ | 1,020.60 | | | $ | 4.26 | ** | | | 0.85 | % |
| * | Expenses are equal to the Fund’s annualized expense ratio for the indicated Class, multiplied by the average account value over the period, multiplied by 181/365 (to reflect the one-half year period). The Example assumes that the $1,000 was invested at the net asset value per share determined at the close of business on January 31, 2015. |
| ** | Absent an allocation of certain expenses to affiliates, the expenses would be higher. |
Parametric Global Small-Cap Fund
July 31, 2015
Portfolio of Investments (Unaudited)
| | | | | | | | |
| Common Stocks — 98.5% | |
| | |
| | | | | | | | |
| Security | | Shares | | | Value | |
| | | | | | | | |
|
Australia — 3.4% | |
Adelaide Brighton, Ltd. | | | 970 | | | $ | 3,347 | |
Alumina, Ltd. | | | 3,204 | | | | 3,465 | |
Ansell, Ltd. | | | 486 | | | | 8,884 | |
Aristocrat Leisure, Ltd. | | | 984 | | | | 6,155 | |
AWE, Ltd.(1) | | | 3,708 | | | | 3,408 | |
Beach Energy, Ltd. | | | 4,500 | | | | 3,193 | |
Bega Cheese, Ltd. | | | 902 | | | | 3,132 | |
CSG, Ltd. | | | 4,974 | | | | 6,108 | |
CSR, Ltd. | | | 1,082 | | | | 2,953 | |
Downer EDI, Ltd. | | | 935 | | | | 3,103 | |
Drillsearch Energy, Ltd.(1) | | | 6,991 | | | | 4,509 | |
DUET Group | | | 5,309 | | | | 8,531 | |
DuluxGroup, Ltd. | | | 752 | | | | 3,337 | |
Echo Entertainment Group, Ltd. | | | 1,151 | | | | 4,214 | |
Energy Resources of Australia, Ltd.(1) | | | 3,794 | | | | 1,053 | |
Federation Centres | | | 2,213 | | | | 4,843 | |
GrainCorp, Ltd., Class A | | | 840 | | | | 5,470 | |
Greencross, Ltd. | | | 371 | | | | 1,637 | |
Investa Office Fund | | | 2,551 | | | | 7,372 | |
IOOF Holdings, Ltd. | | | 535 | | | | 3,605 | |
iProperty Group, Ltd.(1) | | | 2,043 | | | | 4,404 | |
IRESS, Ltd. | | | 881 | | | | 6,685 | |
JB Hi-Fi, Ltd. | | | 315 | | | | 4,439 | |
M2 Group, Ltd. | | | 1,436 | | | | 11,564 | |
Macquarie Atlas Roads Group | | | 1,021 | | | | 2,548 | |
Mesoblast, Ltd.(1) | | | 791 | | | | 2,273 | |
Monadelphous Group, Ltd. | | | 656 | | | | 4,087 | |
Myer Holdings, Ltd. | | | 1,814 | | | | 1,664 | |
New Hope Corp., Ltd. | | | 3,189 | | | | 4,453 | |
NEXTDC, Ltd.(1) | | | 2,526 | | | | 4,745 | |
Orora, Ltd. | | | 1,851 | | | | 3,149 | |
Platinum Asset Management, Ltd. | | | 575 | | | | 3,179 | |
Primary Health Care, Ltd. | | | 1,699 | | | | 5,704 | |
Qube Holdings, Ltd. | | | 1,740 | | | | 3,097 | |
REA Group, Ltd. | | | 67 | | | | 2,118 | |
Recall Holdings, Ltd. | | | 740 | | | | 3,880 | |
Reece Australia, Ltd. | | | 125 | | | | 3,016 | |
Regis Resources, Ltd.(1) | | | 5,382 | | | | 5,090 | |
Select Harvests, Ltd. | | | 642 | | | | 6,185 | |
Sims Metal Management, Ltd. | | | 311 | | | | 2,140 | |
Spark Infrastructure Group | | | 6,295 | | | | 8,889 | |
Tabcorp Holdings, Ltd. | | | 1,469 | | | | 5,190 | |
Tassal Group, Ltd. | | | 1,158 | | | | 3,181 | |
Technology One, Ltd. | | | 1,619 | | | | 4,711 | |
| | | | | | | | |
| Security | | Shares | | | Value | |
| | | | | | | | |
|
Australia (continued) | |
TPG Telecom, Ltd. | | | 819 | | | $ | 5,689 | |
Transpacific Industries Group, Ltd. | | | 4,376 | | | | 2,264 | |
Treasury Wine Estates, Ltd. | | | 1,877 | | | | 7,887 | |
Vocus Communications, Ltd. | | | 1,192 | | | | 5,365 | |
Whitehaven Coal, Ltd.(1) | | | 2,505 | | | | 2,187 | |
| | | | | | | | | |
| | | | | | $ | 218,102 | |
| | | | | | | | | |
|
Austria — 0.5% | |
AMAG Austria Metall AG(2) | | | 72 | | | $ | 2,663 | |
ams AG | | | 88 | | | | 3,816 | |
CA Immobilien Anlagen AG | | | 146 | | | | 2,626 | |
Conwert Immobilien Invest SE(1) | | | 261 | | | | 3,169 | |
DO & Co. AG | | | 59 | | | | 6,120 | |
Flughafen Wien AG | | | 30 | | | | 2,589 | |
Kapsch TrafficCom AG(1) | | | 97 | | | | 2,543 | |
RHI AG | | | 125 | | | | 3,101 | |
Wienerberger AG | | | 186 | | | | 3,072 | |
| | | | | | | | | |
| | | | | | $ | 29,699 | |
| | | | | | | | | |
|
Belgium — 0.9% | |
Agfa-Gevaert NV(1) | | | 823 | | | $ | 2,479 | |
Barco NV | | | 38 | | | | 2,515 | |
Befimmo SCA Sicafi | | | 28 | | | | 1,774 | |
Bekaert SA | | | 76 | | | | 2,222 | |
Cofinimmo | | | 20 | | | | 2,148 | |
Compagnie d’Entreprises CFE | | | 56 | | | | 7,473 | |
D’Ieteren SA NV | | | 85 | | | | 3,110 | |
Elia System Operator SA NV | | | 124 | | | | 5,200 | |
Euronav SA | | | 475 | | | | 7,256 | |
EVS Broadcast Equipment SA | | | 60 | | | | 1,693 | |
Fagron | | | 45 | | | | 2,113 | |
Gimv NV | | | 47 | | | | 2,322 | |
Kinepolis | | | 71 | | | | 2,867 | |
Mobistar SA(1) | | | 268 | | | | 5,809 | |
Tessenderlo Chemie NV(1) | | | 113 | | | | 4,430 | |
ThromboGenics NV(1) | | | 220 | | | | 1,217 | |
| | | | | | | | | |
| | | | | | $ | 54,628 | |
| | | | | | | | | |
|
Brazil — 1.5% | |
Aliansce Shopping Centers SA | | | 500 | | | $ | 2,025 | |
BR Properties SA | | | 1,400 | | | | 4,641 | |
Bradespar SA, PFC Shares | | | 650 | | | | 1,868 | |
Brasil Pharma SA(1) | | | 8,000 | | | | 1,589 | |
CETIP SA - Mercados Organizados | | | 250 | | | | 2,589 | |
Duratex SA | | | 1,550 | | | | 3,151 | |
| | | | |
| | 6 | | See Notes to Financial Statements. |
Parametric Global Small-Cap Fund
July 31, 2015
Portfolio of Investments (Unaudited) — continued
| | | | | | | | |
| Security | | Shares | | | Value | |
| | | | | | | | |
|
Brazil (continued) | |
EDP-Energias do Brasil SA | | | 600 | | | $ | 2,287 | |
Equatorial Energia SA | | | 900 | | | | 9,200 | |
Estacio Participacoes SA | | | 500 | | | | 2,074 | |
Linx SA | | | 125 | | | | 1,843 | |
Localiza Rent a Car SA | | | 200 | | | | 1,641 | |
LPS Brasil Consultoria de Imoveis SA | | | 500 | | | | 701 | |
Mahle-Metal Leve | | | 500 | | | | 3,016 | |
Marcopolo SA, PFC Shares | | | 1,800 | | | | 1,209 | |
Metalurgica Gerdau SA, PFC Shares | | | 2,300 | | | | 2,351 | |
Minerva SA(1) | | | 600 | | | | 1,980 | |
Odontoprev SA | | | 1,100 | | | | 3,572 | |
PDG Realty SA Empreendimentos e Participacoes(1) | | | 26,900 | | | | 1,886 | |
Profarma Distribuidora de Produtos Farmaceuticos SA(1) | | | 625 | | | | 1,816 | |
QGEP Participacoes SA | | | 700 | | | | 1,300 | |
Qualicorp SA | | | 1,275 | | | | 7,578 | |
Raia Drogasil SA | | | 1,000 | | | | 12,708 | |
Rumo Logistica Operadora Multimodal SA(1) | | | 5,701 | | | | 1,515 | |
Santos Brasil Participacoes SA | | | 855 | | | | 3,181 | |
Sao Martinho SA | | | 200 | | | | 1,974 | |
Somos Educacao SA | | | 600 | | | | 2,234 | |
Sonae Sierra Brasil SA | | | 400 | | | | 2,021 | |
Totvs SA | | | 775 | | | | 7,936 | |
Valid Solucoes SA | | | 200 | | | | 2,903 | |
| | | | | | | | | |
| | | | | | $ | 92,789 | |
| | | | | | | | | |
|
Canada — 3.3% | |
Aimia, Inc. | | | 172 | | | $ | 1,860 | |
Air Canada(1) | | | 380 | | | | 3,420 | |
Alamos Gold, Inc.(1) | | | 341 | | | | 1,108 | |
Allied Properties REIT | | | 181 | | | | 5,040 | |
Amaya, Inc.(1) | | | 105 | | | | 2,574 | |
AuRico Metals, Inc.(1) | | | 149 | | | | 59 | |
Birchcliff Energy, Ltd.(1) | | | 378 | | | | 1,711 | |
Bonterra Energy Corp. | | | 78 | | | | 1,437 | |
Canadian Apartment Properties REIT | | | 200 | | | | 4,287 | |
Canadian REIT | | | 100 | | | | 3,251 | |
Canadian Western Bank | | | 92 | | | | 1,731 | |
Canfor Corp.(1) | | | 371 | | | | 6,749 | |
Capital Power Corp. | | | 566 | | | | 9,473 | |
CCL Industries, Inc. | | | 76 | | | | 10,633 | |
Celestica, Inc.(1) | | | 500 | | | | 6,698 | |
Chartwell Retirement Residences | | | 500 | | | | 4,572 | |
China Gold International Resources Corp., Ltd.(1) | | | 1,591 | | | | 2,178 | |
Cineplex, Inc. | | | 59 | | | | 2,149 | |
Computer Modelling Group, Ltd. | | | 220 | | | | 2,202 | |
| | | | | | | | |
| Security | | Shares | | | Value | |
| | | | | | | | |
|
Canada (continued) | |
Concordia Healthcare Corp. | | | 98 | | | $ | 7,801 | |
Constellation Software, Inc. | | | 24 | | | | 10,671 | |
Cott Corp. | | | 500 | | | | 5,631 | |
Descartes Systems Group, Inc. (The)(1) | | | 247 | | | | 4,166 | |
DH Corp. | | | 198 | | | | 6,525 | |
Dollarama, Inc. | | | 214 | | | | 12,738 | |
E-L Financial Corp, Ltd. | | | 4 | | | | 2,202 | |
Enbridge Income Fund Holdings, Inc. | | | 111 | | | | 2,926 | |
Enerflex, Ltd. | | | 317 | | | | 2,955 | |
First Majestic Silver Corp.(1) | | | 665 | | | | 2,039 | |
Freehold Royalties, Ltd. | | | 114 | | | | 1,130 | |
Gibson Energy, Inc. | | | 96 | | | | 1,415 | |
Gran Tierra Energy, Inc.(1) | | | 526 | | | | 1,162 | |
High Liner Foods, Inc. | | | 109 | | | | 1,988 | |
Home Capital Group, Inc. | | | 190 | | | | 4,624 | |
Imperial Metals Corp.(1) | | | 302 | | | | 1,847 | |
Just Energy Group, Inc. | | | 622 | | | | 3,348 | |
MacDonald Dettwiler & Associates, Ltd. | | | 57 | | | | 3,379 | |
Manitoba Telecom Services, Inc. | | | 89 | | | | 1,974 | |
Maple Leaf Foods, Inc. | | | 533 | | | | 9,247 | |
Medical Facilities Corp. | | | 499 | | | | 5,429 | |
Mullen Group, Ltd. | | | 179 | | | | 2,613 | |
North West Co., Inc. (The) | | | 352 | | | | 7,404 | |
Northland Power, Inc. | | | 529 | | | | 6,468 | |
Parkland Fuel Corp. | | | 150 | | | | 2,732 | |
Pason Systems, Inc. | | | 201 | | | | 3,045 | |
Quebecor, Inc., Class B | | | 123 | | | | 2,909 | |
Ritchie Bros Auctioneers, Inc. | | | 132 | | | | 3,571 | |
RONA, Inc. | | | 382 | | | | 4,478 | |
Russel Metals, Inc. | | | 78 | | | | 1,157 | |
Sienna Senior Living, Inc. | | | 400 | | | | 4,738 | |
Toromont Industries, Ltd. | | | 104 | | | | 2,908 | |
WestJet Airlines, Ltd. | | | 153 | | | | 2,699 | |
Westshore Terminals Investment Corp. | | | 91 | | | | 2,010 | |
| | | | | | | | | |
| | | | | | $ | 211,061 | |
| | | | | | | | | |
|
Chile — 0.4% | |
A.F.P. Habitat SA | | | 3,057 | | | $ | 3,986 | |
Almendral SA | | | 45,176 | | | | 3,344 | |
Banmedica SA | | | 2,310 | | | | 4,351 | |
Besalco SA(1) | | | 3,333 | | | | 1,275 | |
Inversiones Aguas Metropolitanas SA | | | 2,520 | | | | 3,663 | |
Ripley Corp. SA | | | 8,187 | | | | 2,816 | |
Vina Concha y Toro SA | | | 2,004 | | | | 3,136 | |
| | | | | | | | | |
| | | | | | $ | 22,571 | |
| | | | | | | | | |
| | | | |
| | 7 | | See Notes to Financial Statements. |
Parametric Global Small-Cap Fund
July 31, 2015
Portfolio of Investments (Unaudited) — continued
| | | | | | | | |
| Security | | Shares | | | Value | |
| | | | | | | | |
|
China — 3.0% | |
ANTA Sports Products, Ltd. | | | 2,000 | | | $ | 5,142 | |
Anton Oilfield Services (Group), Ltd.(1) | | | 8,000 | | | | 1,370 | |
Beijing Enterprises Water Group, Ltd. | | | 8,000 | | | | 5,972 | |
Beijing Jingneng Clean Energy Co., Ltd., Class H | | | 8,000 | | | | 2,690 | |
C.P. Pokphand Co., Ltd. | | | 30,000 | | | | 4,130 | |
Carnival Group International Holdings, Ltd.(1) | | | 30,000 | | | | 4,489 | |
China Datang Corp. Renewable Power Co., Ltd., Class H(1) | | | 18,000 | | | | 2,344 | |
China Foods, Ltd.(1) | | | 8,000 | | | | 3,690 | |
China High Speed Transmission Equipment Group Co., Ltd.(1) | | | 4,000 | | | | 3,258 | |
China Medical System Holdings, Ltd. | | | 5,000 | | | | 6,639 | |
China Modern Dairy Holdings, Ltd. | | | 9,000 | | | | 2,905 | |
China Oil & Gas Group, Ltd. | | | 22,000 | | | | 2,015 | |
China Pharmaceutical Group, Ltd. | | | 4,000 | | | | 3,672 | |
China Power International Development, Ltd. | | | 11,000 | | | | 7,787 | |
China Shineway Pharmaceutical Group, Ltd. | | | 2,000 | | | | 2,551 | |
China Singyes Solar Technologies Holdings, Ltd. | | | 2,000 | | | | 2,004 | |
China South City Holdings, Ltd. | | | 8,000 | | | | 2,360 | |
China Suntien Green Energy Corp., Ltd., Class H | | | 9,000 | | | | 1,589 | |
China Tian Lun Gas Holdings, Ltd.(1) | | | 3,000 | | | | 2,719 | |
China Travel International Investment Hong Kong, Ltd. | | | 20,000 | | | | 7,693 | |
China Zhongwang Holdings, Ltd. | | | 7,600 | | | | 3,245 | |
CIMC Enric Holdings, Ltd. | | | 4,000 | | | | 2,797 | |
CITIC Telecom International Holdings, Ltd. | | | 12,000 | | | | 5,477 | |
Dah Chong Hong Holdings, Ltd. | | | 5,000 | | | | 2,214 | |
E-House China Holdings, Ltd. ADR | | | 300 | | | | 1,890 | |
Franshion Properties China, Ltd. | | | 10,000 | | | | 3,222 | |
Guangzhou Automobile Group Co., Ltd., Class H | | | 2,000 | | | | 1,603 | |
Haitian International Holdings, Ltd. | | | 2,000 | | | | 4,150 | |
Hanergy Thin Film Power Group, Ltd.(1)(3) | | | 26,000 | | | | 0 | |
Huabao International Holdings, Ltd. | | | 5,000 | | | | 2,422 | |
Kingsoft Corp, Ltd. | | | 3,000 | | | | 8,013 | |
Leju Holdings, Ltd. ADR | | | 15 | | | | 102 | |
MMG, Ltd.(1) | | | 8,000 | | | | 2,174 | |
Newocean Energy Holdings, Ltd. | | | 14,000 | | | | 6,236 | |
Shenguan Holdings Group, Ltd. | | | 10,000 | | | | 2,008 | |
Shenzhen International Holdings, Ltd. | | | 2,500 | | | | 4,132 | |
Shenzhen Investment, Ltd. | | | 8,000 | | | | 3,093 | |
Shougang Fushan Resources Group, Ltd. | | | 14,000 | | | | 2,108 | |
Sino Biopharmaceutical, Ltd. | | | 4,000 | | | | 4,637 | |
Sinopec Engineering Group Co., Ltd., Class H | | | 2,500 | | | | 2,043 | |
Sinopec Kantons Holdings, Ltd. | | | 10,000 | | | | 6,365 | |
SouFun Holdings, Ltd. ADR | | | 520 | | | | 3,468 | |
Sunac China Holdings, Ltd. | | | 5,000 | | | | 4,464 | |
TAL Education Group ADR(1) | | | 100 | | | | 3,381 | |
Uni-President China Holdings, Ltd. | | | 5,000 | | | | 4,600 | |
Vinda International Holdings, Ltd. | | | 3,000 | | | | 7,423 | |
| | | | | | | | |
| Security | | Shares | | | Value | |
| | | | | | | | |
|
China (continued) | |
Vipshop Holdings, Ltd. ADR(1) | | | 370 | | | $ | 7,211 | |
WuXi PharmaTech (Cayman), Inc. ADR(1) | | | 227 | | | | 9,420 | |
Yingde Gases Group Co. | | | 6,500 | | | | 3,876 | |
Youku Tudou, Inc. ADR(1) | | | 114 | | | | 2,212 | |
Yuexiu Property Co., Ltd. | | | 14,000 | | | | 2,761 | |
YY, Inc. ADR(1) | | | 28 | | | | 1,655 | |
| | | | | | | | | |
| | | | | | $ | 193,421 | |
| | | | | | | | | |
|
Denmark — 0.8% | |
ALK-Abello A/S | | | 19 | | | $ | 2,320 | |
Auriga Industries A/S, Class B | | | 93 | | | | 31 | |
Bang & Olufsen A/S(1) | | | 487 | | | | 4,529 | |
D/S Norden A/S(1) | | | 91 | | | | 2,383 | |
GN Store Nord A/S | | | 153 | | | | 3,112 | |
NKT Holding A/S | | | 39 | | | | 2,187 | |
Royal Unibrew A/S | | | 180 | | | | 5,891 | |
SimCorp A/S | | | 218 | | | | 9,307 | |
Spar Nord Bank A/S | | | 285 | | | | 3,350 | |
Sydbank A/S | | | 108 | | | | 4,089 | |
Topdanmark A/S(1) | | | 96 | | | | 2,653 | |
United International Enterprises, Ltd. | | | 19 | | | | 3,197 | |
Vestas Wind Systems A/S | | | 86 | | | | 4,698 | |
Zealand Pharma A/S(1) | | | 205 | | | | 4,448 | |
| | | | | | | | | |
| | | | | | $ | 52,195 | |
| | | | | | | | | |
|
Finland — 0.8% | |
Amer Sports Oyj | | | 200 | | | $ | 5,833 | |
Citycon Oyj | | | 974 | | | | 2,585 | |
F-Secure Oyj | | | 1,008 | | | | 3,109 | |
Huhtamaki Oyj | | | 222 | | | | 7,879 | |
Oriola-KD Oyj, Series B(1) | | | 1,275 | | | | 6,207 | |
Raisio Oyj | | | 1,138 | | | | 5,177 | |
Ramirent Oyj | | | 365 | | | | 2,876 | |
Stockmann Oyj Abp, Class B(1) | | | 370 | | | | 2,718 | |
Technopolis Oyj | | | 672 | | | | 2,759 | |
Tieto Oyj | | | 211 | | | | 5,403 | |
Tikkurila Oyj | | | 160 | | | | 3,086 | |
Uponor Oyj | | | 193 | | | | 3,060 | |
Valmet Oyj | | | 305 | | | | 3,610 | |
| | | | | | | | | |
| | | | | | $ | 54,302 | |
| | | | | | | | | |
|
France — 3.6% | |
Alten SA | | | 168 | | | $ | 8,466 | |
Arkema SA | | | 160 | | | | 12,468 | |
bioMerieux | | | 62 | | | | 7,204 | |
| | | | |
| | 8 | | See Notes to Financial Statements. |
Parametric Global Small-Cap Fund
July 31, 2015
Portfolio of Investments (Unaudited) — continued
| | | | | | | | |
| Security | | Shares | | | Value | |
| | | | | | | | |
|
France (continued) | |
Bollore SA | | | 2,953 | | | $ | 16,357 | |
CGG SA(1) | | | 879 | | | | 4,391 | |
Edenred | | | 176 | | | | 4,387 | |
Etablissements Maurel et Prom(1) | | | 504 | | | | 3,227 | |
Eutelsat Communications SA | | | 98 | | | | 2,987 | |
Fonciere des Regions | | | 52 | | | | 4,490 | |
Gecina SA | | | 35 | | | | 4,481 | |
Groupe Eurotunnel SE | | | 407 | | | | 5,847 | |
ICADE | | | 48 | | | | 3,559 | |
Imerys SA | | | 91 | | | | 6,856 | |
Ingenico Group | | | 191 | | | | 25,018 | |
Ipsen SA | | | 130 | | | | 8,377 | |
IPSOS | | | 159 | | | | 3,989 | |
Lagardere SCA | | | 116 | | | | 3,469 | |
MPI | | | 747 | | | | 2,152 | |
Orpea | | | 44 | | | | 3,321 | |
Remy Cointreau SA | | | 165 | | | | 11,727 | |
Rubis SCA | | | 174 | | | | 12,506 | |
Sartorius Stedim Biotech | | | 28 | | | | 8,735 | |
SCOR SE | | | 198 | | | | 7,587 | |
Societe d’Edition de Canal | | | 781 | | | | 6,846 | |
UBISOFT Entertainment(1) | | | 575 | | | | 11,171 | |
Veolia Environnement SA | | | 733 | | | | 16,372 | |
Vicat | | | 71 | | | | 5,280 | |
Vilmorin & Cie SA | | | 51 | | | | 4,242 | |
Virbac SA | | | 49 | | | | 11,620 | |
Zodiac Aerospace | | | 164 | | | | 4,888 | |
| | | | | | | | | |
| | | | | | $ | 232,020 | |
| | | | | | | | | |
|
Germany — 3.6% | |
Aixtron SE(1) | | | 195 | | | $ | 1,157 | |
Aurubis AG | | | 78 | | | | 4,666 | |
Axel Springer SE | | | 52 | | | | 2,914 | |
BayWa AG | | | 46 | | | | 1,712 | |
Bechtle AG | | | 33 | | | | 2,801 | |
Bilfinger SE | | | 33 | | | | 1,363 | |
Biotest AG, PFC Shares | | | 81 | | | | 2,280 | |
Brenntag AG | | | 78 | | | | 4,337 | |
Carl Zeiss Meditec AG | | | 175 | | | | 4,930 | |
Celesio AG | | | 125 | | | | 3,644 | |
CTS Eventim AG & Co. KGaA | | | 129 | | | | 4,862 | |
Deutsche Annington Immobilien SE | | | 83 | | | | 2,590 | |
Deutsche EuroShop AG | | | 219 | | | | 9,788 | |
Deutsche Lufthansa AG(1) | | | 142 | | | | 1,929 | |
Dialog Semiconductor PLC(1) | | | 167 | | | | 8,329 | |
| | | | | | | | |
| Security | | Shares | | | Value | |
| | | | | | | | |
|
Germany (continued) | |
Draegerwerk AG & Co. KGaA, PFC Shares | | | 33 | | | $ | 3,306 | |
Fielmann AG | | | 46 | | | | 3,040 | |
Fraport AG | | | 37 | | | | 2,429 | |
Freenet AG | | | 724 | | | | 24,846 | |
Fuchs Petrolub SE | | | 87 | | | | 3,482 | |
Fuchs Petrolub SE, PFC Shares | | | 125 | | | | 5,432 | |
Gerresheimer AG | | | 82 | | | | 6,034 | |
Gerry Weber International AG | | | 112 | | | | 2,758 | |
Hannover Rueck SE | | | 76 | | | | 8,069 | |
Hawesko Holding AG | | | 53 | | | | 2,409 | |
Hugo Boss AG | | | 29 | | | | 3,497 | |
K&S AG | | | 253 | | | | 10,381 | |
Kabel Deutschland Holding AG(1) | | | 26 | | | | 3,528 | |
Krones AG | | | 32 | | | | 3,689 | |
KUKA AG | | | 48 | | | | 4,107 | |
LEG Immobilien AG | | | 74 | | | | 5,385 | |
MTU Aero Engines AG | | | 32 | | | | 2,947 | |
Pfeiffer Vacuum Technology AG | | | 51 | | | | 4,674 | |
ProSiebenSat. 1 Media SE | | | 136 | | | | 6,953 | |
QSC AG | | | 875 | | | | 1,752 | |
Rheinmetall AG | | | 39 | | | | 2,123 | |
Rhoen-Klinikum AG | | | 256 | | | | 7,115 | |
Sky Deutschland AG(1) | | | 476 | | | | 3,553 | |
Software AG | | | 105 | | | | 3,142 | |
Suedzucker AG | | | 333 | | | | 5,492 | |
Symrise AG | | | 169 | | | | 11,236 | |
TAG Immobilien AG | | | 228 | | | | 2,577 | |
Telefonica Deutschland Holdings AG(2) | | | 1,268 | | | | 7,864 | |
United Internet AG | | | 110 | | | | 5,437 | |
Vossloh AG(1) | | | 59 | | | | 3,751 | |
Wincor Nixdorf AG | | | 53 | | | | 2,252 | |
Wirecard AG | | | 238 | | | | 9,430 | |
| | | | | | | | | |
| | | | | | $ | 229,992 | |
| | | | | | | | | |
|
Greece — 0.4% | |
Ellaktor SA(1) | | | 1,575 | | | $ | 2,683 | |
GEK Terna Holding Real Estate Construction SA(1) | | | 686 | | | | 1,118 | |
Hellenic Exchanges - Athens Stock Exchange SA | | | 1,001 | | | | 4,231 | |
Intralot SA(1) | | | 1,505 | | | | 2,330 | |
JUMBO SA | | | 210 | | | | 1,419 | |
LAMDA Development SA(1) | | | 461 | | | | 1,701 | |
Metka SA | | | 283 | | | | 2,008 | |
Navios Maritime Acquisition Corp. | | | 800 | | | | 3,168 | |
StealthGas, Inc.(1) | | | 500 | | | | 2,815 | |
Terna Energy SA(1) | | | 1,369 | | | | 3,828 | |
| | | | | | | | | |
| | | | | | $ | 25,301 | |
| | | | | | | | | |
| | | | |
| | 9 | | See Notes to Financial Statements. |
Parametric Global Small-Cap Fund
July 31, 2015
Portfolio of Investments (Unaudited) — continued
| | | | | | | | |
| Security | | Shares | | | Value | |
| | | | | | | | |
|
Hong Kong — 1.6% | |
APT Satellite Holdings, Ltd. | | | 3,750 | | | $ | 3,495 | |
Brightoil Petroleum Holdings, Ltd.(1) | | | 12,000 | | | | 4,405 | |
Century Sunshine Group Holdings, Ltd. | | | 31,500 | | | | 2,277 | |
Champion REIT | | | 6,000 | | | | 3,327 | |
Chia Tai Enterprises International, Ltd.(1) | | | 300 | | | | 194 | |
China Huarong Energy Co., Ltd.(1) | | | 13,000 | | | | 802 | |
China Traditional Chinese Medicine Co., Ltd.(1) | | | 10,000 | | | | 7,563 | |
China Water Industry Group, Ltd.(1) | | | 16,000 | | | | 4,004 | |
Chow Sang Sang Holdings International, Ltd. | | | 2,000 | | | | 3,872 | |
CK Life Sciences International Holdings, Inc. | | | 48,000 | | | | 4,765 | |
Fortune REIT | | | 3,000 | | | | 3,273 | |
G-Resources Group, Ltd. | | | 114,000 | | | | 3,370 | |
Giordano International, Ltd. | | | 6,000 | | | | 3,055 | |
Great Eagle Holdings, Ltd. | | | 1,000 | | | | 3,481 | |
HC International, Inc.(1) | | | 2,000 | | | | 1,306 | |
Honbridge Holdings, Ltd.(1) | | | 14,000 | | | | 2,419 | |
Hopewell Highway Infrastructure, Ltd. | | | 50 | | | | 24 | |
Hopewell Holdings, Ltd. | | | 1,000 | | | | 3,450 | |
IGG, Inc. | | | 4,000 | | | | 1,982 | |
Johnson Electric Holdings, Ltd. | | | 1,500 | | | | 5,082 | |
Pacific Andes International Holdings, Ltd.(1) | | | 100,000 | | | | 3,350 | |
PCCW, Ltd. | | | 14,000 | | | | 8,378 | |
SA SA International Holdings, Ltd. | | | 4,000 | | | | 1,794 | |
Sino Oil and Gas Holdings, Ltd.(1) | | | 95,000 | | | | 2,058 | |
Techtronic Industries Co., Ltd. | | | 1,000 | | | | 3,534 | |
Tongda Group Holdings, Ltd. | | | 20,000 | | | | 3,374 | |
Towngas China Co., Ltd. | | | 4,000 | | | | 3,657 | |
Transport International Holdings, Ltd. | | | 1,600 | | | | 4,366 | |
Truly International Holdings | | | 8,000 | | | | 2,693 | |
Up Energy Development Group, Ltd.(1) | | | 28,000 | | | | 992 | |
Vitasoy International Holdings, Ltd. | | | 2,000 | | | | 3,003 | |
Yanchang Petroleum International, Ltd.(1) | | | 50,000 | | | | 1,495 | |
Yuexiu REIT | | | 6,000 | | | | 3,381 | |
| | | | | | | | | |
| | | | | | $ | 104,221 | |
| | | | | | | | | |
|
India — 0.1% | |
WNS Holdings, Ltd. ADR(1) | | | 130 | | | $ | 3,875 | |
| | | | | | | | | |
| | | | | | $ | 3,875 | |
| | | | | | | | | |
|
Indonesia — 0.4% | |
Ciputra Development Tbk PT | | | 33,000 | | | $ | 2,559 | |
Gajah Tunggal Tbk PT | | | 26,000 | | | | 1,441 | |
Garuda Indonesia Persero Tbk PT(1) | | | 103,402 | | | | 3,338 | |
Holcim Indonesia Tbk PT | | | 17,500 | | | | 1,837 | |
Perusahaan Perkebunan London Sumatra Indonesia Tbk PT | | | 31,500 | | | | 3,151 | |
| | | | | | | | |
| Security | | Shares | | | Value | |
| | | | | | | | |
|
Indonesia (continued) | |
Sigmagold Inti Perkasa Tbk PT(1) | | | 85,000 | | | $ | 2,758 | |
Siloam International Hospitals Tbk PT | | | 5,800 | | | | 7,094 | |
Sugih Energy Tbk PT(1) | | | 91,000 | | | | 2,677 | |
| | | | | | | | | |
| | | | | | $ | 24,855 | |
| | | | | | | | | |
|
Ireland — 0.4% | |
C&C Group PLC | | | 1,034 | | | $ | 4,021 | |
Dalata Hotel Group PLC(1) | | | 534 | | | | 2,453 | |
FBD Holdings PLC | | | 164 | | | | 1,378 | |
FleetMatics Group PLC(1) | | | 127 | | | | 6,079 | |
Grafton Group PLC | | | 635 | | | | 7,133 | |
Kenmare Resources PLC(1) | | | 15,591 | | | | 853 | |
UDG Healthcare PLC | | | 631 | | | | 4,943 | |
| | | | | | | | | |
| | | | | | $ | 26,860 | |
| | | | | | | | | |
|
Israel — 0.5% | |
Cellcom Israel, Ltd.(1) | | | 304 | | | $ | 1,888 | |
Evogene, Ltd.(1) | | | 233 | | | | 2,107 | |
EZchip Semiconductor, Ltd.(1) | | | 130 | | | | 2,111 | |
Frutarom Industries, Ltd. | | | 151 | | | | 6,368 | |
Harel Insurance Investments & Financial Services, Ltd. | | | 1,099 | | | | 5,428 | |
Oil Refineries, Ltd.(1) | | | 12,316 | | | | 5,085 | |
Rami Levi Chain Stores Hashikma Marketing 2006, Ltd. | | | 70 | | | | 3,340 | |
Shikun & Binui, Ltd. | | | 1,434 | | | | 3,359 | |
SodaStream International, Ltd.(1) | | | 75 | | | | 1,346 | |
| | | | | | | | | |
| | | | | | $ | 31,032 | |
| | | | | | | | | |
|
Italy — 2.0% | |
A2A SpA | | | 2,987 | | | $ | 3,813 | |
ACEA SpA | | | 349 | | | | 4,600 | |
Amplifon SpA | | | 823 | | | | 6,900 | |
Ansaldo STS SpA | | | 280 | | | | 2,898 | |
Atlantia SpA | | | 165 | | | | 4,406 | |
Autogrill SpA(1) | | | 314 | | | | 2,835 | |
Banca Generali SpA | | | 173 | | | | 5,688 | |
Banca Popolare di Milano Scarl | | | 6,380 | | | | 6,901 | |
Banco Popolare SC(1) | | | 202 | | | | 3,498 | |
Brembo SpA | | | 74 | | | | 3,336 | |
Brunello Cucinelli SpA | | | 131 | | | | 2,469 | |
Buzzi Unicem SpA | | | 679 | | | | 11,592 | |
Buzzi Unicem SpA, PFC Shares | | | 291 | | | | 3,037 | |
Danieli & C. Officine Meccaniche SpA | | | 139 | | | | 2,924 | |
De’Longhi SpA | | | 222 | | | | 5,411 | |
Ei Towers SpA | | | 56 | | | | 3,597 | |
Engineering SpA | | | 56 | | | | 3,583 | |
| | | | |
| | 10 | | See Notes to Financial Statements. |
Parametric Global Small-Cap Fund
July 31, 2015
Portfolio of Investments (Unaudited) — continued
| | | | | | | | |
| Security | | Shares | | | Value | |
| | | | | | | | |
|
Italy (continued) | |
ERG SpA | | | 683 | | | $ | 8,837 | |
Interpump Group SpA | | | 214 | | | | 3,636 | |
Iren SPA | | | 3,843 | | | | 5,595 | |
Italmobiliare SpA, PFC Shares | | | 119 | | | | 3,155 | |
MARR SpA | | | 177 | | | | 3,273 | |
Recordati SpA | | | 495 | | | | 12,328 | |
Reply SpA | | | 42 | | | | 4,740 | |
Sorin SpA(1) | | | 2,019 | | | | 5,838 | |
| | | | | | | | | |
| | | | | | $ | 124,890 | |
| | | | | | | | | |
|
Japan — 7.9% | |
Adastria Co., Ltd. | | | 90 | | | $ | 4,349 | |
ADEKA Corp. | | | 300 | | | | 3,875 | |
Aica Kogyo Co., Ltd. | | | 300 | | | | 6,681 | |
Aiful Corp.(1) | | | 700 | | | | 2,410 | |
Anritsu Corp. | | | 1,000 | | | | 7,160 | |
Asahi Intecc Co., Ltd. | | | 200 | | | | 6,683 | |
Autobacs Seven Co., Ltd. | | | 400 | | | | 7,253 | |
Azbil Corp. | | | 200 | | | | 4,750 | |
Capcom Co., Ltd. | | | 300 | | | | 6,560 | |
COMSYS Holdings Corp. | | | 200 | | | | 3,032 | |
Daifuku Co., Ltd. | | | 500 | | | | 7,224 | |
Daiwa House Residential Investment Corp. | | | 2 | | | | 4,217 | |
Denki Kagaku Kogyo K.K. | | | 1,000 | | | | 4,158 | |
Disco Corp. | | | 100 | | | | 7,727 | |
Enplas Corp. | | | 200 | | | | 8,058 | |
Fancl Corp. | | | 700 | | | | 10,818 | |
FP Corp. | | | 200 | | | | 6,450 | |
Frontier Real Estate Investment Corp. | | | 1 | | | | 4,355 | |
GLP J-Reit | | | 4 | | | | 3,850 | |
Haseko Corp. | | | 500 | | | | 6,331 | |
Hokuetsu Kishu Paper Co., Ltd. | | | 1,000 | | | | 5,972 | |
Hoshizaki Electric Co., Ltd. | | | 300 | | | | 17,882 | |
House Foods Group, Inc. | | | 300 | | | | 6,062 | |
Iida Group Holdings Co., Ltd. | | | 300 | | | | 5,266 | |
IT Holdings Corp. | | | 200 | | | | 4,580 | |
Ito En, Ltd. | | | 400 | | | | 9,298 | |
Itochu Enex Co., Ltd. | | | 500 | | | | 4,902 | |
Itoham Foods, Inc. | | | 1,000 | | | | 5,541 | |
Japan Airport Terminal Co., Ltd. | | | 100 | | | | 5,320 | |
Japan Excellent, Inc. | | | 3 | | | | 3,286 | |
Japan Logistics Fund, Inc. | | | 2 | | | | 3,769 | |
Kagoshima Bank, Ltd. (The) | | | 1,000 | | | | 6,836 | |
Kakaku.com, Inc. | | | 400 | | | | 6,358 | |
Kawasaki Kisen Kaisha, Ltd. | | | 2,000 | | | | 4,465 | |
| | | | | | | | |
| Security | | Shares | | | Value | |
| | | | | | | | |
|
Japan (continued) | |
Kenedix Office Investment Corp. | | | 1 | | | $ | 4,633 | |
Komeri Co., Ltd. | | | 200 | | | | 4,823 | |
Kose Corp. | | | 100 | | | | 9,716 | |
Kureha Corp. | | | 1,000 | | | | 3,775 | |
KYORIN Holdings, Inc. | | | 300 | | | | 5,844 | |
LEOPALACE21 Corp.(1) | | | 900 | | | | 4,921 | |
Lion Corp. | | | 1,000 | | | | 8,598 | |
Matsumotokiyoshi Holdings Co., Ltd. | | | 100 | | | | 4,826 | |
Mixi, Inc. | | | 100 | | | | 4,333 | |
MonotaRO Co., Ltd. | | | 200 | | | | 10,527 | |
Mori Hills REIT Investment Corp. | | | 3 | | | | 3,518 | |
Musashino Bank, Ltd. (The) | | | 100 | | | | 3,956 | |
Nakanishi, Inc. | | | 100 | | | | 3,985 | |
Nichirei Corp. | | | 1,000 | | | | 6,524 | |
Nihon Kohden Corp. | | | 400 | | | | 8,873 | |
Nihon Parkerizing Co., Ltd. | | | 400 | | | | 3,708 | |
Nippon Gas Co., Ltd. | | | 200 | | | | 6,628 | |
Nippon Light Metal Holdings Co., Ltd. | | | 2,400 | | | | 3,984 | |
Nipro Corp. | | | 500 | | | | 5,282 | |
NOF Corp. | | | 1,000 | | | | 8,281 | |
Noritz Corp. | | | 400 | | | | 6,574 | |
NS Solutions Corp. | | | 200 | | | | 7,887 | |
Oki Electric Industry Co., Ltd. | | | 3,000 | | | | 6,166 | |
Okinawa Electric Power Co., Inc. (The) | | | 100 | | | | 2,499 | |
Orix JREIT, Inc. | | | 3 | | | | 4,084 | |
Plenus Co., Ltd. | | | 200 | | | | 3,366 | |
Pola Orbis Holdings, Inc. | | | 200 | | | | 12,219 | |
Resorttrust, Inc. | | | 200 | | | | 4,942 | |
Rohto Pharmaceutical Co., Ltd. | | | 500 | | | | 8,878 | |
Ryohin Keikaku Co., Ltd. | | | 100 | | | | 21,311 | |
Sawai Pharmaceutical Co., Ltd. | | | 200 | | | | 12,242 | |
Shimachu Co., Ltd. | | | 200 | | | | 5,544 | |
Shinko Plantech Co., Ltd. | | | 500 | | | | 4,126 | |
Ship Healthcare Holdings, Inc. | | | 200 | | | | 4,239 | |
Shizuoka Gas Co., Ltd. | | | 500 | | | | 3,583 | |
Sohgo Security Services Co., Ltd. | | | 200 | | | | 8,868 | |
Sotetsu Holdings, Inc. | | | 1,000 | | | | 5,890 | |
Sumitomo Forestry Co., Ltd. | | | 400 | | | | 4,744 | |
Sumitomo Osaka Cement Co., Ltd. | | | 2,000 | | | | 7,498 | |
T-Gaia Corp. | | | 400 | | | | 6,961 | |
Tokai Tokyo Financial Holdings, Inc. | | | 500 | | | | 3,819 | |
Tokyo Ohka Kogyo Co., Ltd. | | | 200 | | | | 5,474 | |
Toyobo Co., Ltd. | | | 3,000 | | | | 4,474 | |
Tsuruha Holdings, Inc. | | | 100 | | | | 8,779 | |
TV Asahi Corp. | | | 200 | | | | 3,133 | |
UACJ Corp. | | | 1,000 | | | | 2,361 | |
| | | | |
| | 11 | | See Notes to Financial Statements. |
Parametric Global Small-Cap Fund
July 31, 2015
Portfolio of Investments (Unaudited) — continued
| | | | | | | | |
| Security | | Shares | | | Value | |
| | | | | | | | |
|
Japan (continued) | |
Xebio Co., Ltd. | | | 200 | | | $ | 3,778 | |
Yodogawa Steel Works, Ltd. | | | 1,000 | | | | 4,186 | |
ZERIA Pharmaceutical Co., Ltd. | | | 200 | | | | 2,924 | |
| | | | | | | | | |
| | | | | | $ | 502,762 | |
| | | | | | | | | |
|
Malaysia — 0.8% | |
Affin Holdings Bhd | | | 3,400 | | | $ | 2,252 | |
Berjaya Sports Toto Bhd | | | 4,231 | | | | 3,684 | |
Cahya Mata Sarawak Bhd | | | 4,100 | | | | 6,244 | |
Eastern & Oriental Bhd | | | 7,100 | | | | 3,287 | |
Gas Malaysia Bhd | | | 3,800 | | | | 2,480 | |
Icon Offshore Bhd(1) | | | 15,700 | | | | 1,577 | |
KNM Group Bhd(1) | | | 14,700 | | | | 2,221 | |
Kossan Rubber Industries | | | 3,100 | | | | 5,916 | |
KPJ Healthcare Bhd | | | 3,500 | | | | 3,935 | |
Press Metal Bhd | | | 10,200 | | | | 6,555 | |
Silverlake Axis, Ltd. | | | 7,200 | | | | 5,104 | |
TIME dotCom Bhd | | | 2,800 | | | | 4,957 | |
TSH Resources Bhd | | | 6,150 | | | | 3,605 | |
| | | | | | | | | |
| | | | | | $ | 51,817 | |
| | | | | | | | | |
|
Mexico — 0.8% | |
Alsea SAB de CV | | | 1,200 | | | $ | 3,887 | |
Fibra Uno Administracion SA de CV | | | 2,200 | | | | 5,286 | |
Genomma Lab Internacional SAB de CV(1) | | | 6,100 | | | | 5,679 | |
Gruma SAB, Class B | | | 400 | | | | 5,233 | |
Grupo Aeroportuario del Pacifico SAB de CV, Class B | | | 600 | | | | 4,735 | |
Grupo Aeroportuario del Sureste SAB de CV, Class B | | | 400 | | | | 5,980 | |
Grupo Comercial Chedraui SA de CV | | | 1,200 | | | | 3,328 | |
Grupo Simec SA de CV, Series B(1) | | | 1,300 | | | | 3,720 | |
Infraestructura Energetica Nova SAB de CV | | | 900 | | | | 4,379 | |
Megacable Holdings SAB de CV | | | 900 | | | | 3,649 | |
Ternium SA ADR | | | 300 | | | | 4,665 | |
| | | | | | | | | |
| | | | | | $ | 50,541 | |
| | | | | | | | | |
|
Netherlands — 1.7% | |
Aercap Holdings NV(1) | | | 100 | | | $ | 4,684 | |
Arcadis NV | | | 387 | | | | 10,148 | |
ASM International NV | | | 168 | | | | 7,554 | |
Beter Bed Holding NV | | | 320 | | | | 7,839 | |
Brunel International NV | | | 270 | | | | 5,285 | |
Constellium NV, Class A(1) | | | 400 | | | | 4,440 | |
Delta Lloyd NV | | | 350 | | | | 6,207 | |
Eurocommercial Properties NV | | | 156 | | | | 6,731 | |
Fugro NV(1) | | | 223 | | | | 4,664 | |
| | | | | | | | |
| Security | | Shares | | | Value | |
| | | | | | | | |
|
Netherlands (continued) | |
InterXion Holding NV(1) | | | 272 | | | $ | 7,513 | |
Lucas Bols Holding BV(1)(2) | | | 304 | | | | 5,669 | |
Royal Boskalis Westminster NV | | | 120 | | | | 5,863 | |
SBM Offshore NV(1) | | | 800 | | | | 9,733 | |
Sligro Food Group NV | | | 249 | | | | 9,574 | |
TNT Express NV | | | 976 | | | | 8,168 | |
Wereldhave NV | | | 80 | | | | 4,730 | |
| | | | | | | | | |
| | | | | | $ | 108,802 | |
| | | | | | | | | |
|
New Zealand — 0.4% | |
A2 Milk Co., Ltd.(1) | | | 6,203 | | | $ | 3,360 | |
Diligent Corp.(1) | | | 998 | | | | 3,778 | |
Kathmandu Holdings, Ltd. | | | 1,189 | | | | 1,333 | |
New Zealand Oil & Gas, Ltd. | | | 4,006 | | | | 1,321 | |
Nuplex Industries, Ltd. | | | 1,410 | | | | 4,233 | |
Property for Industry, Ltd. | | | 3,009 | | | | 3,078 | |
Skellerup Holdings, Ltd. | | | 2,372 | | | | 1,926 | |
Summerset Group Holdings, Ltd. | | | 2,032 | | | | 5,603 | |
| | | | | | | | | |
| | | | | | $ | 24,632 | |
| | | | | | | | | |
|
Norway — 0.8% | |
ABG Sundal Collier Holding ASA | | | 3,080 | | | $ | 2,825 | |
Atea ASA | | | 272 | | | | 2,349 | |
Borregaard ASA | | | 1,022 | | | | 6,476 | |
Ekornes ASA | | | 639 | | | | 7,864 | |
Hoegh LNG Holdings, Ltd. | | | 194 | | | | 3,107 | |
Leroey Seafood Group ASA | | | 75 | | | | 2,579 | |
Nordic Semiconductor ASA(1) | | | 453 | | | | 2,894 | |
Norway Royal Salmon ASA | | | 322 | | | | 2,813 | |
Olav Thon Eiendomsselskap ASA | | | 123 | | | | 2,232 | |
Opera Software ASA | | | 232 | | | | 1,852 | |
Protector Forsikring ASA | | | 297 | | | | 2,274 | |
Salmar ASA | | | 178 | | | | 2,815 | |
Scatec Solar ASA(2) | | | 549 | | | | 3,220 | |
Tomra Systems ASA | | | 291 | | | | 2,577 | |
Veidekke ASA | | | 275 | | | | 3,060 | |
Wilh. Wilhelmsen ASA | | | 298 | | | | 1,738 | |
| | | | | | | | | |
| | | | | | $ | 50,675 | |
| | | | | | | | | |
|
Poland — 0.5% | |
Asseco Poland SA | | | 321 | | | $ | 4,901 | |
Ciech SA(1) | | | 256 | | | | 4,784 | |
Emperia Holding SA | | | 136 | | | | 2,630 | |
Integer.pl SA(1) | | | 41 | | | | 1,460 | |
Lubelski Wegiel Bogdanka SA | | | 106 | | | | 1,472 | |
| | | | |
| | 12 | | See Notes to Financial Statements. |
Parametric Global Small-Cap Fund
July 31, 2015
Portfolio of Investments (Unaudited) — continued
| | | | | | | | |
| Security | | Shares | | | Value | |
| | | | | | | | |
|
Poland (continued) | |
Netia SA | | | 2,062 | | | $ | 3,090 | |
PKP Cargo SA | | | 136 | | | | 2,890 | |
TVN SA | | | 842 | | | | 4,431 | |
Warsaw Stock Exchange | | | 270 | | | | 3,497 | |
| | | | | | | | | |
| | | | | | $ | 29,155 | |
| | | | | | | | | |
|
Portugal — 0.4% | |
Banco BPI SA(1) | | | 3,044 | | | $ | 3,451 | |
Mota-Engil SGPS SA | | | 570 | | | | 1,514 | |
NOS SGPS SA | | | 1,192 | | | | 10,087 | |
Portucel SA | | | 850 | | | | 3,236 | |
REN - Redes Energeticas Nacionais SGPS SA | | | 1,000 | | | | 2,997 | |
Sonae | | | 2,400 | | | | 3,327 | |
Sonaecom - SGPS SA | | | 1,352 | | | | 3,388 | |
| | | | | | | | | |
| | | | | | $ | 28,000 | |
| | | | | | | | | |
|
Russia — 0.8% | |
Aeroflot - Russian Airlines PJSC(1) | | | 7,346 | | | $ | 4,670 | |
AK Transneft OAO, PFC Shares | | | 2 | | | | 4,516 | |
CTC Media, Inc. | | | 1,000 | | | | 1,880 | |
E.ON Russia JSC | | | 62,421 | | | | 2,638 | |
Mail.ru Group, Ltd. GDR(1) | | | 319 | | | | 5,972 | |
O’Key Group SA GDR | | | 357 | | | | 959 | |
OAO TMK GDR | | | 374 | | | | 1,450 | |
PhosAgro OAO GDR | | | 278 | | | | 3,774 | |
PIK Group | | | 1,530 | | | | 4,253 | |
Polyus Gold International, Ltd. | | | 1,559 | | | | 4,296 | |
QIWI PLC ADR | | | 146 | | | | 4,470 | |
RusHydro JSC ADR | | | 6,090 | | | | 5,425 | |
X5 Retail Group NV GDR(1) | | | 465 | | | | 8,295 | |
| | | | | | | | | |
| | | | | | $ | 52,598 | |
| | | | | | | | | |
|
Singapore — 0.8% | |
ARA Asset Management, Ltd. | | | 2,000 | | | $ | 2,487 | |
Boustead Projects, Ltd.(1) | | | 480 | | | | 302 | |
Boustead Singapore, Ltd. | | | 1,600 | | | | 1,401 | |
CDL Hospitality Trusts | | | 4,000 | | | | 4,550 | |
CSE Global, Ltd. | | | 5,000 | | | | 1,949 | |
Ezion Holdings, Ltd. | | | 2,400 | | | | 1,509 | |
Ezra Holdings, Ltd.(1) | | | 9,320 | | | | 914 | |
Hyflux, Ltd. | | | 4,100 | | | | 2,506 | |
Indofood Agri Resources, Ltd. | | | 4,000 | | | | 1,706 | |
Keppel Infrastructure Trust | | | 11,000 | | | | 4,167 | |
LionGold Corp., Ltd.(1) | | | 54,000 | | | | 631 | |
Metro Holdings, Ltd. | | | 4,000 | | | | 2,654 | |
| | | | | | | | |
| Security | | Shares | | | Value | |
| | | | | | | | |
|
Singapore (continued) | |
OSIM International, Ltd. | | | 2,000 | | | $ | 2,325 | |
Raffles Medical Group, Ltd. | | | 1,000 | | | | 3,494 | |
Religare Health Trust | | | 5,000 | | | | 3,846 | |
Sheng Siong Group, Ltd. | | | 8,000 | | | | 5,213 | |
Singapore Post, Ltd. | | | 2,000 | | | | 2,848 | |
UMS Holdings, Ltd. | | | 6,000 | | | | 2,230 | |
United Engineers, Ltd. | | | 2,000 | | | | 3,627 | |
| | | | | | | | | |
| | | | | | $ | 48,359 | |
| | | | | | | | | |
|
South Africa — 0.8% | |
Adbee Rf, Ltd.(1) | | | 144 | | | $ | 391 | |
Adcock Ingram Holdings, Ltd.(1) | | | 819 | | | | 3,246 | |
AECI, Ltd. | | | 397 | | | | 3,396 | |
African Bank Investments, Ltd.(1)(3) | | | 4,545 | | | | 0 | |
Aveng, Ltd.(1) | | | 1,540 | | | | 783 | |
AVI, Ltd. | | | 610 | | | | 3,845 | |
Capital Property Fund(1) | | | 2,582 | | | | 2,997 | |
DataTec, Ltd. | | | 1,003 | | | | 5,402 | |
EOH Holdings, Ltd. | | | 342 | | | | 4,655 | |
Illovo Sugar, Ltd. | | | 1,950 | | | | 2,057 | |
Lewis Group, Ltd. | | | 494 | | | | 2,240 | |
Resilient Property Income Fund, Ltd. | | | 458 | | | | 3,633 | |
Reunert, Ltd. | | | 684 | | | | 3,415 | |
Royal Bafokeng Platinum, Ltd.(1) | | | 494 | | | | 1,417 | |
Sappi, Ltd.(1) | | | 1,408 | | | | 4,627 | |
Sun International, Ltd. | | | 298 | | | | 2,700 | |
Telkom SA SOC, Ltd. | | | 977 | | | | 4,747 | |
Trencor, Ltd. | | | 315 | | | | 1,489 | |
| | | | | | | | | |
| | | | | | $ | 51,040 | |
| | | | | | | | | |
|
South Korea — 3.3% | |
Cheil Worldwide, Inc.(1) | | | 380 | | | $ | 6,223 | |
CJ Korea Express Co., Ltd.(1) | | | 27 | | | | 3,969 | |
Daum Kakao Corp. | | | 47 | | | | 4,849 | |
DGB Financial Group Co., Ltd. | | | 274 | | | | 2,629 | |
EO Technics Co., Ltd. | | | 45 | | | | 4,397 | |
Grand Korea Leisure Co., Ltd. | | | 90 | | | | 2,312 | |
Green Cross Corp. | | | 19 | | | | 3,573 | |
Green Cross Holdings Corp. | | | 224 | | | | 7,869 | |
GS Engineering & Construction Corp.(1) | | | 158 | | | | 3,535 | |
GS Retail Co., Ltd. | | | 220 | | | | 9,827 | |
Hanil Cement Co., Ltd. | | | 24 | | | | 2,594 | |
Hanmi Pharmaceutical Co., Ltd.(1) | | | 13 | | | | 4,472 | |
Hanssem Co., Ltd. | | | 39 | | | | 9,916 | |
Huchems Fine Chemical Corp. | | | 132 | | | | 2,572 | |
| | | | |
| | 13 | | See Notes to Financial Statements. |
Parametric Global Small-Cap Fund
July 31, 2015
Portfolio of Investments (Unaudited) — continued
| | | | | | | | |
| Security | | Shares | | | Value | |
| | | | | | | | |
|
South Korea (continued) | |
Hyundai Green Food Co., Ltd. | | | 400 | | | $ | 8,259 | |
Hyundai Home Shopping Network Corp. | | | 26 | | | | 2,721 | |
iMarketKorea, Inc. | | | 99 | | | | 2,596 | |
JB Financial Group Co., Ltd. | | | 489 | | | | 2,682 | |
KB Insurance Co., Ltd. | | | 155 | | | | 3,735 | |
KEPCO Plant Service & Engineering Co., Ltd. | | | 49 | | | | 4,923 | |
Kolon Industries, Inc. | | | 76 | | | | 3,546 | |
Korean Reinsurance Co. | | | 612 | | | | 7,729 | |
LG Hausys, Ltd. | | | 18 | | | | 2,732 | |
Lock & Lock Co., Ltd. | | | 270 | | | | 3,270 | |
Lotte Chilsung Beverage Co., Ltd. | | | 3 | | | | 5,799 | |
LS Industrial Systems Co., Ltd. | | | 72 | | | | 3,220 | |
Macquarie Korea Infrastructure Fund | | | 780 | | | | 5,266 | |
Medy-Tox, Inc. | | | 10 | | | | 4,539 | |
Nong Shim Co., Ltd. | | | 25 | | | | 6,644 | |
Ottogi Corp. | | | 13 | | | | 9,158 | |
Paradise Co., Ltd. | | | 132 | | | | 2,670 | |
Partron Co., Ltd. | | | 296 | | | | 2,049 | |
Posco ICT Co., Ltd. | | | 584 | | | | 2,532 | |
S1 Corp. | | | 77 | | | | 5,554 | |
Samchully Co., Ltd. | | | 25 | | | | 2,678 | |
Samsung Fine Chemicals Co., Ltd. | | | 102 | | | | 3,000 | |
Seoul Semiconductor Co., Ltd.(1) | | | 155 | | | | 2,099 | |
SK Chemicals Co., Ltd. | | | 71 | | | | 4,295 | |
SK Gas, Ltd. | | | 34 | | | | 2,460 | |
SK Telecom Co., Ltd. | | | 30 | | | | 6,438 | |
Tongyang Life Insurance | | | 630 | | | | 8,195 | |
ViroMed Co., Ltd.(1) | | | 45 | | | | 6,767 | |
Wonik IPS Co., Ltd.(1) | | | 405 | | | | 4,246 | |
Young Poong Corp. | | | 3 | | | | 3,497 | |
Yuhan Corp. | | | 34 | | | | 7,848 | |
| | | | | | | | | |
| | | | | | $ | 209,884 | |
| | | | | | | | | |
|
Spain — 1.5% | |
Acerinox SA | | | 294 | | | $ | 3,586 | |
Almirall SA | | | 611 | | | | 12,016 | |
Atresmedia Corporacion de Medios de Comunicacion SA | | | 401 | | | | 6,038 | |
Banco de Sabadell SA | | | 1,734 | | | | 3,951 | |
Bankinter SA | | | 342 | | | | 2,640 | |
Distribuidora Internacional de Alimentacion SA | | | 645 | | | | 4,037 | |
Duro Felguera SA | | | 747 | | | | 2,976 | |
Ebro Foods SA | | | 165 | | | | 3,291 | |
Enagas SA | | | 159 | | | | 4,463 | |
Ence Energia y Celulosa SA | | | 3,003 | | | | 10,840 | |
Faes Farma SA | | | 882 | | | | 2,449 | |
| | | | | | | | |
| Security | | Shares | | | Value | |
| | | | | | | | |
|
Spain (continued) | |
Gamesa Corporacion Tecnologica SA | | | 472 | | | $ | 7,475 | |
Grupo Catalana Occidente SA | | | 111 | | | | 3,445 | |
Indra Sistemas SA | | | 428 | | | | 4,808 | |
Melia Hotels International SA | | | 398 | | | | 5,726 | |
NH Hotel Group SA(1) | | | 562 | | | | 3,407 | |
Red Electrica Corp. SA | | | 80 | | | | 6,388 | |
Tecnicas Reunidas SA | | | 156 | | | | 7,943 | |
Viscofan SA | | | 41 | | | | 2,450 | |
| | | | | | | | | |
| | | | | | $ | 97,929 | |
| | | | | | | | | |
|
Sweden — 1.6% | |
AAK AB | | | 146 | | | $ | 9,889 | |
Atrium Ljungberg AB | | | 326 | | | | 4,497 | |
Axfood AB | | | 660 | | | | 11,254 | |
BillerudKorsnas AB | | | 419 | | | | 6,437 | |
Clas Ohlson AB, Class B | | | 452 | | | | 8,366 | |
Hexpol AB | | | 1,220 | | | | 13,087 | |
Hufvudstaden AB, Class A | | | 350 | | | | 4,524 | |
Husqvarna AB, Class B | | | 690 | | | | 5,028 | |
Industrial & Financial Systems, Class B | | | 150 | | | | 5,031 | |
Loomis AB, Class B | | | 101 | | | | 2,830 | |
NIBE Industrier AB, Class B | | | 174 | | | | 4,904 | |
Saab AB, Class B | | | 366 | | | | 8,826 | |
Swedish Orphan Biovitrum AB(1) | | | 1,121 | | | | 14,756 | |
Wallenstam AB, Class B | | | 752 | | | | 5,448 | |
| | | | | | | | | |
| | | | | | $ | 104,877 | |
| | | | | | | | | |
|
Switzerland — 3.7% | |
Actelion, Ltd. | | | 113 | | | $ | 16,711 | |
Barry Callebaut AG | | | 7 | | | | 7,825 | |
Burckhardt Compression Holdings AG | | | 18 | | | | 6,799 | |
Comet Holding AG | | | 6 | | | | 5,082 | |
Emmi AG | | | 18 | | | | 5,966 | |
Ems-Chemie Holding AG | | | 19 | | | | 9,254 | |
Flughafen Zuerich AG | | | 16 | | | | 13,133 | |
Forbo Holding AG | | | 17 | | | | 20,704 | |
Galenica AG | | | 5 | | | | 5,692 | |
Georg Fischer AG | | | 7 | | | | 4,668 | |
Givaudan SA | | | 12 | | | | 22,322 | |
Inficon Holding AG | | | 14 | | | | 4,157 | |
Julius Baer Group, Ltd. | | | 124 | | | | 6,860 | |
Kaba Holding AG | | | 19 | | | | 12,156 | |
Kuoni Reisen Holding AG | | | 21 | | | | 5,836 | |
Lindt & Spruengli AG PC | | | 3 | | | | 16,858 | |
Logitech International SA | | | 768 | | | | 11,049 | |
| | | | |
| | 14 | | See Notes to Financial Statements. |
Parametric Global Small-Cap Fund
July 31, 2015
Portfolio of Investments (Unaudited) — continued
| | | | | | | | |
| Security | | Shares | | | Value | |
| | | | | | | | |
|
Switzerland (continued) | |
Mobimo Holding AG | | | 54 | | | $ | 11,485 | |
Schmolz & Bickenbach AG(1) | | | 2,417 | | | | 2,023 | |
Sonova Holding AG | | | 61 | | | | 8,684 | |
Temenos Group AG | | | 174 | | | | 6,378 | |
U-Blox AG | | | 32 | | | | 6,736 | |
Valora Holding AG | | | 24 | | | | 4,665 | |
Vontobel Holding AG | | | 378 | | | | 20,108 | |
| | | | | | | | | |
| | | | | | $ | 235,151 | |
| | | | | | | | | |
|
Taiwan — 1.4% | |
Ability Enterprise Co., Ltd. | | | 4,000 | | | $ | 1,781 | |
AcBel Polytech, Inc. | | | 3,000 | | | | 1,762 | |
Center Laboratories, Inc.(1) | | | 1,150 | | | | 2,518 | |
Chicony Electronics Co., Ltd. | | | 3,045 | | | | 7,904 | |
China Bills Finance Corp. | | | 8,000 | | | | 2,863 | |
China Synthetic Rubber Corp. | | | 3,000 | | | | 2,872 | |
Feng Hsin Iron & Steel Co., Ltd. | | | 2,000 | | | | 2,299 | |
Formosan Rubber Group, Inc. | | | 3,000 | | | | 2,074 | |
Gloria Material Technology Corp. | | | 4,000 | | | | 2,046 | |
Hota Industrial Manufacturing Co., Ltd. | | | 2,059 | | | | 6,100 | |
Hu Lane Associate, Inc. | | | 1,000 | | | | 3,801 | |
Kindom Construction Corp. | | | 4,000 | | | | 2,355 | |
Kinpo Electronics, Inc.(1) | | | 7,000 | | | | 2,203 | |
Merry Electronics Co., Ltd. | | | 1,000 | | | | 1,453 | |
Micro-Star International Co., Ltd. | | | 2,000 | | | | 1,838 | |
MIN AIK Technology Co., Ltd. | | | 1,000 | | | | 2,100 | |
Oriental Union Chemical Corp. | | | 2,000 | | | | 1,316 | |
Ruentex Development Co., Ltd. | | | 2,000 | | | | 2,531 | |
ScinoPharm Taiwan, Ltd. | | | 2,163 | | | | 2,296 | |
Shin Kong No. 1 REIT | | | 8,000 | | | | 3,570 | |
Silicon Motion Technology Corp. ADR | | | 235 | | | | 6,185 | |
Standard Foods Corp. | | | 3,760 | | | | 11,372 | |
TA Chen Stainless Pipe Co., Ltd. | | | 5,000 | | | | 2,553 | |
Taiwan Paiho, Ltd. | | | 3,000 | | | | 6,268 | |
Taiwan Sogo Shin Kong SEC | | | 3,030 | | | | 3,596 | |
Xxentria Technology Materials Corp. | | | 1,700 | | | | 4,636 | |
| | | | | | | | | |
| | | | | | $ | 90,292 | |
| | | | | | | | | |
|
Thailand — 0.4% | |
Bangkok Chain Hospital PCL(4) | | | 10,700 | | | $ | 2,080 | |
Central Plaza Hotel PCL(4) | | | 2,900 | | | | 3,066 | |
Energy Absolute PCL(4) | | | 4,800 | | | | 2,915 | |
Hana Microelectronics PCL(4) | | | 2,700 | | | | 2,489 | |
Sino Thai Engineering & Construction PCL(4) | | | 5,900 | | | | 3,867 | |
STP & I PCL(4) | | | 5,280 | | | | 2,234 | |
| | | | | | | | |
| Security | | Shares | | | Value | |
| | | | | | | | |
|
Thailand (continued) | |
Thai Vegetable Oil PCL(4) | | | 4,200 | | | $ | 2,919 | |
TTW PCL(4) | | | 10,400 | | | | 3,393 | |
| | | | | | | | | |
| | | | | | $ | 22,963 | |
| | | | | | | | | |
|
Turkey — 0.4% | |
Akcansa Cimento AS | | | 449 | | | $ | 2,541 | |
Aksa Akrilik Kimya Sanayii AS | | | 746 | | | | 2,978 | |
Aksa Enerji Uretim AS(1) | | | 2,157 | | | | 2,300 | |
Asya Katilim Bankasi AS(1) | | | 4,925 | | | | 1,474 | |
Bizim Toptan Satis Magazalari AS | | | 234 | | | | 1,039 | |
Cimsa Cimento Sanayi ve Ticaret AS | | | 416 | | | | 2,373 | |
Eczacibasi Ilac Sanayi ve Ticaret AS | | | 2,706 | | | | 2,619 | |
Net Holding AS(1) | | | 2,214 | | | | 2,619 | |
Tekfen Holding AS | | | 1,505 | | | | 2,287 | |
Turkiye Sinai Kalkinma Bankasi AS | | | 5,898 | | | | 3,712 | |
| | | | | | | | | |
| | | | | | $ | 23,942 | |
| | | | | | | | | |
|
United Kingdom — 6.9% | |
3i Group PLC | | | 514 | | | $ | 4,434 | |
A.G. BARR PLC | | | 416 | | | | 3,669 | |
Abcam PLC | | | 1,181 | | | | 10,777 | |
Aveva Group PLC | | | 248 | | | | 8,529 | |
Babcock International Group PLC | | | 290 | | | | 4,487 | |
Beazley PLC | | | 1,650 | | | | 8,688 | |
Berkeley Group Holdings PLC | | | 215 | | | | 11,291 | |
Betfair Group PLC | | | 236 | | | | 10,254 | |
Booker Group PLC | | | 5,528 | | | | 15,434 | |
Britvic PLC | | | 734 | | | | 7,854 | |
BTG PLC(1) | | | 1,108 | | | | 11,297 | |
Cable & Wireless Communication PLC | | | 5,515 | | | | 5,510 | |
Capital & Counties Properties PLC | | | 1,928 | | | | 13,876 | |
Cobham PLC | | | 810 | | | | 3,300 | |
Cranswick PLC | | | 187 | | | | 4,818 | |
Croda International PLC | | | 186 | | | | 8,820 | |
CSR PLC | | | 499 | | | | 6,996 | |
Dairy Crest Group PLC | | | 556 | | | | 5,009 | |
De La Rue PLC | | | 149 | | | | 1,174 | |
Direct Line Insurance Group PLC | | | 669 | | | | 3,818 | |
Domino’s Pizza Group PLC | | | 751 | | | | 10,524 | |
Drax Group PLC | | | 1,056 | | | | 4,915 | |
Dunelm Group PLC | | | 551 | | | | 7,707 | |
Elementis PLC | | | 1,668 | | | | 6,675 | |
EnQuest PLC(1) | | | 6,020 | | | | 3,320 | |
Essentra PLC | | | 1,065 | | | | 15,161 | |
Fidessa Group PLC | | | 343 | | | | 12,846 | |
| | | | |
| | 15 | | See Notes to Financial Statements. |
Parametric Global Small-Cap Fund
July 31, 2015
Portfolio of Investments (Unaudited) — continued
| | | | | | | | |
| Security | | Shares | | | Value | |
| | | | | | | | |
|
United Kingdom (continued) | |
Genus PLC | | | 390 | | | $ | 8,764 | |
Greene King PLC | | | 330 | | | | 4,449 | |
Hikma Pharmaceuticals PLC | | | 585 | | | | 21,854 | |
Hunting PLC | | | 682 | | | | 5,454 | |
Inmarsat PLC | | | 1,893 | | | | 26,214 | |
International Game Technology(1) | | | 112 | | | | 2,218 | |
International Personal Finance PLC | | | 415 | | | | 2,581 | |
Jardine Lloyd Thompson Group PLC | | | 485 | | | | 7,865 | |
Kcom Group PLC | | | 4,622 | | | | 6,819 | |
Lancashire Holdings, Ltd. | | | 182 | | | | 1,831 | |
Meggitt PLC | | | 532 | | | | 3,855 | |
Micro Focus International PLC | | | 746 | | | | 16,271 | |
Moneysupermarket.com Group PLC | | | 1,776 | | | | 8,122 | |
N Brown Group PLC | | | 997 | | | | 4,942 | |
Pace PLC | | | 957 | | | | 5,423 | |
Pennon Group PLC | | | 1,181 | | | | 15,033 | |
Premier Oil PLC(1) | | | 1,512 | | | | 3,152 | |
Rentokil Initial PLC | | | 1,494 | | | | 3,430 | |
Rexam PLC | | | 971 | | | | 8,428 | |
Rightmove PLC | | | 67 | | | | 3,807 | |
Rotork PLC | | | 1,170 | | | | 3,906 | |
RPC Group PLC | | | 335 | | | | 3,557 | |
Shaftesbury PLC | | | 439 | | | | 6,403 | |
Soco International PLC | | | 1,980 | | | | 4,879 | |
Tate & Lyle PLC | | | 1,234 | | | | 10,489 | |
Telecom Plus PLC | | | 424 | | | | 8,031 | |
Travis Perkins PLC | | | 157 | | | | 5,505 | |
Ultra Electronics Holdings PLC | | | 486 | | | | 13,226 | |
Victrex PLC | | | 227 | | | | 6,855 | |
WH Smith PLC | | | 163 | | | | 4,019 | |
| | | | | | | | | |
| | | | | | $ | 438,565 | |
| | | | | | | | | |
|
United States — 36.4% | |
ACI Worldwide, Inc.(1) | | | 423 | | | $ | 10,012 | |
Acorda Therapeutics, Inc.(1) | | | 311 | | | | 10,686 | |
Aegerion Pharmaceuticals, Inc.(1) | | | 159 | | | | 3,042 | |
Akorn, Inc.(1) | | | 217 | | | | 10,006 | |
Alaska Air Group, Inc. | | | 398 | | | | 30,148 | |
Albemarle Corp. | | | 228 | | | | 12,358 | |
Alexandria Real Estate Equities, Inc. | | | 64 | | | | 5,933 | |
Alkermes PLC(1) | | | 347 | | | | 24,297 | |
Alleghany Corp.(1) | | | 17 | | | | 8,264 | |
Allegiant Travel Co. | | | 139 | | | | 29,569 | |
ALLETE, Inc. | | | 236 | | | | 11,396 | |
Alliance Data Systems Corp.(1) | | | 37 | | | | 10,176 | |
| | | | | | | | |
| Security | | Shares | | | Value | |
| | | | | | | | |
|
United States (continued) | |
American Airlines Group, Inc. | | | 500 | | | $ | 20,050 | |
Anworth Mortgage Asset Corp. | | | 1,864 | | | | 9,320 | |
AptarGroup, Inc. | | | 163 | | | | 11,050 | |
ARRIS Group, Inc.(1) | | | 460 | | | | 14,223 | |
Arthur J. Gallagher & Co. | | | 156 | | | | 7,399 | |
Aspen Technology, Inc.(1) | | | 272 | | | | 12,071 | |
Athenahealth, Inc.(1) | | | 135 | | | | 18,895 | |
Avance Gas Holding, Ltd.(2) | | | 216 | | | | 3,610 | |
Avery Dennison Corp. | | | 212 | | | | 12,900 | |
Avista Corp. | | | 353 | | | | 11,656 | |
Balchem Corp. | | | 168 | | | | 9,521 | |
Bemis Co., Inc. | | | 251 | | | | 11,187 | |
Blackbaud, Inc. | | | 170 | | | | 10,397 | |
Bonanza Creek Energy, Inc.(1) | | | 221 | | | | 1,726 | |
Boston Beer Co., Inc. (The), Class A(1) | | | 55 | | | | 12,129 | |
Bristow Group, Inc. | | | 178 | | | | 8,019 | |
Buckle, Inc. (The) | | | 403 | | | | 17,825 | |
Buffalo Wild Wings, Inc.(1) | | | 53 | | | | 10,366 | |
C&J Energy Services, Ltd.(1) | | | 199 | | | | 1,920 | |
Cabot Corp. | | | 143 | | | | 5,031 | |
Cabot Microelectronics Corp.(1) | | | 174 | | | | 7,889 | |
CACI International, Inc., Class A(1) | | | 123 | | | | 10,102 | |
Calgon Carbon Corp. | | | 468 | | | | 8,279 | |
Camden Property Trust | | | 92 | | | | 7,326 | |
Capstead Mortgage Corp. | | | 766 | | | | 8,480 | |
Casey’s General Stores, Inc. | | | 116 | | | | 11,857 | |
Celldex Therapeutics, Inc.(1) | | | 550 | | | | 12,953 | |
Cheesecake Factory, Inc. (The) | | | 179 | | | | 10,335 | |
CLARCOR, Inc. | | | 230 | | | | 13,839 | |
Cleco Corp. | | | 226 | | | | 12,301 | |
Cloud Peak Energy, Inc.(1) | | | 541 | | | | 1,720 | |
Cogent Communications Group, Inc. | | | 170 | | | | 5,404 | |
CommVault Systems, Inc.(1) | | | 113 | | | | 4,234 | |
Conn’s, Inc.(1) | | | 216 | | | | 7,456 | |
Contango Oil & Gas Co.(1) | | | 155 | | | | 1,423 | |
Convergys Corp. | | | 361 | | | | 9,065 | |
Cornerstone OnDemand, Inc.(1) | | | 308 | | | | 11,106 | |
Costar Group, Inc.(1) | | | 126 | | | | 25,363 | |
Cracker Barrel Old Country Store, Inc. | | | 93 | | | | 14,126 | |
CYS Investments, Inc. | | | 918 | | | | 7,124 | |
Cytec Industries, Inc. | | | 158 | | | | 11,728 | |
Delek US Holdings, Inc. | | | 269 | | | | 9,595 | |
Diamondback Energy, Inc.(1) | | | 238 | | | | 16,017 | |
Dril-Quip, Inc.(1) | | | 90 | | | | 5,257 | |
El Paso Electric Co. | | | 294 | | | | 10,710 | |
Endo International PLC(1) | | | 300 | | | | 26,262 | |
| | | | |
| | 16 | | See Notes to Financial Statements. |
Parametric Global Small-Cap Fund
July 31, 2015
Portfolio of Investments (Unaudited) — continued
| | | | | | | | |
| Security | | Shares | | | Value | |
| | | | | | | | |
|
United States (continued) | |
Energy XXI, Ltd. | | | 270 | | | $ | 478 | |
Essex Property Trust, Inc. | | | 47 | | | | 10,571 | |
Extra Space Storage, Inc. | | | 125 | | | | 9,190 | |
Finish Line, Inc. (The), Class A | | | 255 | | | | 7,010 | |
First Financial Bankshares, Inc. | | | 218 | | | | 7,408 | |
First Republic Bank | | | 139 | | | | 8,867 | |
FNF Group | | | 259 | | | | 10,124 | |
Foot Locker, Inc. | | | 400 | | | | 28,220 | |
Forum Energy Technologies, Inc.(1) | | | 425 | | | | 6,494 | |
GNC Holdings, Inc., Class A | | | 223 | | | | 10,974 | |
Government Properties Income Trust | | | 229 | | | | 3,955 | |
Graphic Packaging Holding Co. | | | 838 | | | | 12,654 | |
GulfMark Offshore, Inc., Class A | | | 164 | | | | 1,545 | |
H.B. Fuller Co. | | | 128 | | | | 5,128 | |
Haemonetics Corp.(1) | | | 258 | | | | 10,323 | |
Hain Celestial Group, Inc. (The)(1) | | | 306 | | | | 20,802 | |
Hanesbrands, Inc. | | | 560 | | | | 17,377 | |
Hatteras Financial Corp. | | | 385 | | | | 6,260 | |
Heartland Express, Inc. | | | 465 | | | | 9,918 | |
Heartland Payment Systems, Inc. | | | 306 | | | | 19,064 | |
Hecla Mining Co. | | | 3,530 | | | | 7,413 | |
Helen of Troy, Ltd.(1) | | | 259 | | | | 22,735 | |
Hibbett Sports, Inc.(1) | | | 111 | | | | 5,056 | |
Hillenbrand, Inc. | | | 397 | | | | 11,259 | |
Home BancShares, Inc. | | | 139 | | | | 5,535 | |
HSN, Inc. | | | 168 | | | | 12,350 | |
Hubbell, Inc., Class B | | | 100 | | | | 10,441 | |
Hyster-Yale Materials Handling, Inc. | | | 90 | | | | 6,090 | |
International Flavors & Fragrances, Inc. | | | 102 | | | | 11,790 | |
Investors Bancorp, Inc. | | | 1,167 | | | | 14,214 | |
J&J Snack Foods Corp. | | | 95 | | | | 11,244 | |
j2 Global, Inc. | | | 239 | | | | 16,826 | |
Jarden Corp.(1) | | | 450 | | | | 24,750 | |
Jazz Pharmaceuticals PLC(1) | | | 114 | | | | 21,915 | |
Kirby Corp.(1) | | | 100 | | | | 7,241 | |
Lancaster Colony Corp. | | | 72 | | | | 6,711 | |
Lear Corp. | | | 200 | | | | 20,814 | |
Level 3 Communications, Inc.(1) | | | 280 | | | | 14,140 | |
Lexicon Pharmaceuticals, Inc.(1) | | | 556 | | | | 4,693 | |
Liberty TripAdvisor Holdings, Inc.(1) | | | 200 | | | | 5,858 | |
Liberty Ventures(1) | | | 200 | | | | 8,296 | |
Louisiana-Pacific Corp.(1) | | | 446 | | | | 6,574 | |
Manhattan Associates, Inc.(1) | | | 360 | | | | 23,335 | |
ManTech International Corp., Class A | | | 190 | | | | 5,664 | |
MarketAxess Holdings, Inc. | | | 69 | | | | 6,748 | |
Martin Marietta Materials, Inc. | | | 79 | | | | 12,389 | |
| | | | | | | | |
| Security | | Shares | | | Value | |
| | | | | | | | |
|
United States (continued) | |
MAXIMUS, Inc. | | | 265 | | | $ | 18,076 | |
Medicines Co. (The)(1) | | | 366 | | | | 11,489 | |
Medidata Solutions, Inc.(1) | | | 232 | | | | 12,482 | |
Mentor Graphics Corp. | | | 364 | | | | 9,497 | |
MFA Financial, Inc. | | | 1,138 | | | | 8,569 | |
Mid-America Apartment Communities, Inc. | | | 71 | | | | 5,704 | |
Middleby Corp.(1) | | | 160 | | | | 19,632 | |
Minerals Technologies, Inc. | | | 155 | | | | 10,036 | |
Monro Muffler Brake, Inc. | | | 242 | | | | 15,306 | |
Montpelier Re Holdings, Ltd. | | | 86 | | | | 3,668 | |
MSCI, Inc. | | | 113 | | | | 7,702 | |
Mueller Industries, Inc. | | | 430 | | | | 13,919 | |
National Health Investors, Inc. | | | 156 | | | | 10,179 | |
National Retail Properties, Inc. | | | 72 | | | | 2,676 | |
Nektar Therapeutics(1) | | | 1,272 | | | | 16,040 | |
New Jersey Resources Corp. | | | 432 | | | | 12,485 | |
NewMarket Corp. | | | 23 | | | | 9,147 | |
Nordic American Offshore, Ltd.(1) | | | 5 | | | | 36 | |
Nordic American Tankers, Ltd. | | | 661 | | | | 9,928 | |
Northwest Bancshares, Inc. | | | 864 | | | | 10,964 | |
Northwest Natural Gas Co. | | | 205 | | | | 8,874 | |
NorthWestern Corp. | | | 292 | | | | 15,721 | |
Owens & Minor, Inc. | | | 255 | | | | 8,966 | |
Packaging Corp. of America | | | 175 | | | | 12,388 | |
PDC Energy, Inc.(1) | | | 180 | | | | 8,451 | |
Piedmont Natural Gas Co., Inc. | | | 304 | | | | 11,555 | |
Plantronics, Inc. | | | 191 | | | | 11,093 | |
PNM Resources, Inc. | | | 484 | | | | 12,768 | |
PolyOne Corp. | | | 196 | | | | 6,717 | |
Portland General Electric Co. | | | 361 | | | | 13,000 | |
Post Properties, Inc. | | | 251 | | | | 14,292 | |
Primerica, Inc. | | | 347 | | | | 15,695 | |
ProAssurance Corp. | | | 250 | | | | 12,073 | |
Puma Biotechnology, Inc.(1) | | | 106 | | | | 9,604 | |
RBC Bearings, Inc.(1) | | | 197 | | | | 13,347 | |
Reinsurance Group of America, Inc. | | | 62 | | | | 5,984 | |
Reliance Steel & Aluminum Co. | | | 150 | | | | 9,090 | |
RenaissanceRe Holdings, Ltd. | | | 53 | | | | 5,687 | |
Rite Aid Corp.(1) | | | 2,585 | | | | 23,032 | |
RLI Corp. | | | 236 | | | | 13,034 | |
Rollins, Inc. | | | 540 | | | | 15,660 | |
Royal Gold, Inc. | | | 129 | | | | 6,504 | |
RPM International, Inc. | | | 247 | | | | 11,577 | |
Sanchez Energy Corp.(1) | | | 218 | | | | 1,598 | |
Sanderson Farms, Inc. | | | 48 | | | | 3,456 | |
Saul Centers, Inc. | | | 131 | | | | 6,796 | |
| | | | |
| | 17 | | See Notes to Financial Statements. |
Parametric Global Small-Cap Fund
July 31, 2015
Portfolio of Investments (Unaudited) — continued
| | | | | | | | |
| Security | | Shares | | | Value | |
| | | | | | | | |
|
United States (continued) | |
Schweitzer-Mauduit International, Inc. | | | 204 | | | $ | 8,099 | |
Scorpio Tankers, Inc. | | | 1,048 | | | | 11,256 | |
Seaboard Corp.(1) | | | 3 | | | | 10,425 | |
Sealed Air Corp. | | | 348 | | | | 18,503 | |
Seattle Genetics, Inc.(1) | | | 340 | | | | 16,276 | |
SEI Investments Co. | | | 139 | | | | 7,410 | |
SemGroup Corp., Class A | | | 204 | | | | 14,502 | |
Sensient Technologies Corp. | | | 197 | | | | 13,473 | |
Ship Finance International, Ltd. | | | 148 | | | | 2,476 | |
Shutterstock, Inc.(1) | | | 115 | | | | 6,144 | |
Signature Bank(1) | | | 123 | | | | 17,908 | |
Signet Jewelers, Ltd. | | | 200 | | | | 24,244 | |
Six Flags Entertainment Corp. | | | 198 | | | | 9,235 | |
Snap-on, Inc. | | | 100 | | | | 16,480 | |
Snyders-Lance, Inc. | | | 250 | | | | 8,130 | |
SolarWinds, Inc.(1) | | | 155 | | | | 6,183 | |
Sonoco Products Co. | | | 253 | | | | 10,444 | |
Sovran Self Storage, Inc. | | �� | 123 | | | | 11,711 | |
Spirit Airlines, Inc.(1) | | | 277 | | | | 16,570 | |
SS&C Technologies Holdings, Inc. | | | 338 | | | | 22,994 | |
Starwood Property Trust, Inc. | | | 392 | | | | 8,530 | |
Starwood Waypoint Residential Trust | | | 378 | | | | 9,253 | |
Stepan Co. | | | 130 | | | | 6,371 | |
STERIS Corp. | | | 177 | | | | 12,236 | |
Stone Energy Corp.(1) | | | 320 | | | | 1,853 | |
SVB Financial Group(1) | | | 48 | | | | 6,869 | |
SYNNEX Corp. | | | 273 | | | | 20,647 | |
Take-Two Interactive Software, Inc.(1) | | | 473 | | | | 14,937 | |
Tanger Factory Outlet Centers, Inc. | | | 267 | | | | 8,672 | |
Targa Resources Corp. | | | 207 | | | | 18,309 | |
Teledyne Technologies, Inc.(1) | | | 189 | | | | 19,594 | |
Telephone & Data Systems, Inc. | | | 500 | | | | 14,705 | |
Tennant Co. | | | 189 | | | | 11,304 | |
TiVo, Inc.(1) | | | 471 | | | | 4,691 | |
Towers Watson & Co., Class A | | | 100 | | | | 12,678 | |
TreeHouse Foods, Inc.(1) | | | 151 | | | | 12,376 | |
Tyler Technologies, Inc.(1) | | | 74 | | | | 10,326 | |
UIL Holdings Corp. | | | 264 | | | | 12,656 | |
Ulta Salon, Cosmetics & Fragrance, Inc.(1) | | | 200 | | | | 33,206 | |
Ultimate Software Group, Inc.(1) | | | 86 | | | | 15,842 | |
Universal Corp. | | | 121 | | | | 6,903 | |
Vector Group, Ltd. | | | 151 | | | | 3,823 | |
VEREIT, Inc. | | | 676 | | | | 5,922 | |
ViaSat, Inc.(1) | | | 101 | | | | 6,262 | |
W.R. Grace & Co.(1) | | | 106 | | | | 10,699 | |
Wabtec Corp. | | | 200 | | | | 20,238 | |
| | | | | | | | |
| Security | | Shares | | | Value | |
| | | | | | | | |
|
United States (continued) | |
Watsco, Inc. | | | 124 | | | $ | 15,902 | |
Weis Markets, Inc. | | | 197 | | | | 8,307 | |
West Pharmaceutical Services, Inc. | | | 286 | | | | 17,123 | |
Westamerica Bancorporation | | | 58 | | | | 2,841 | |
Western Refining, Inc. | | | 423 | | | | 18,680 | |
WGL Holdings, Inc. | | | 239 | | | | 13,360 | |
Whiting Petroleum Corp.(1) | | | 92 | | | | 1,885 | |
Williams-Sonoma, Inc. | | | 280 | | | | 23,705 | |
World Fuel Services Corp. | | | 230 | | | | 9,350 | |
| | | | | | | | | |
| | | $ | 2,312,591 | |
| | | | | | | | | |
| |
Total Common Stocks
(identified cost $5,857,185) | | | $ | 6,266,389 | |
| | | | | | | | | |
| | | | | | | | | | | | |
|
| Equity-Linked Securities(2)(5) — 0.8% | |
| | | |
| | | | | | | | | | | | |
| Security | | Maturity Date | | | Shares | | | Value | |
| | | | | | | | | | | | |
|
India — 0.8% | |
Aurobindo Pharma, Ltd. | | | 12/4/18 | | | | 257 | | | $ | 3,040 | |
Bharat Forge, Ltd. | | | 11/2/16 | | | | 242 | | | | 4,329 | |
Britannia Industries, Ltd. | | | 10/17/17 | | | | 88 | | | | 4,328 | |
Havells India, Ltd. | | | 8/8/19 | | | | 785 | | | | 3,417 | |
Hindustan Petroleum Corp., Ltd. | | | 8/8/19 | | | | 441 | | | | 6,347 | |
Jaiprakash Power Ventures, Ltd. | | | 10/26/18 | | | | 13,980 | | | | 1,376 | |
JSW Energy, Ltd. | | | 10/26/18 | | | | 2,310 | | | | 3,028 | |
Mahindra & Mahindra Financial Services | | | 11/3/15 | | | | 1,007 | | | | 4,043 | |
Marico, Ltd. | | | 10/17/17 | | | | 764 | | | | 5,240 | |
Mindtree, Ltd. | | | 12/5/18 | | | | 183 | | | | 3,666 | |
Pidilite Industries, Ltd. | | | 8/8/19 | | | | 599 | | | | 5,212 | |
Piramal Enterprises, Ltd. | | | 12/3/18 | | | | 260 | | | | 3,731 | |
Reliance Capital, Ltd. | | | 10/26/18 | | | | 293 | | | | 1,782 | |
Shree Cement, Ltd. | | | 7/20/17 | | | | 25 | | | | 4,469 | |
| | | | | | | | | | | | | |
| | | |
Total Equity-Linked Securities
(identified cost $38,409) | | | | | | | | | | $ | 54,008 | |
| | | | | | | | | | | | | |
| | | | |
| | 18 | | See Notes to Financial Statements. |
Parametric Global Small-Cap Fund
July 31, 2015
Portfolio of Investments (Unaudited) — continued
| | | | | | | | |
| Rights(1) — 0.0%(6) | |
| | |
| | | | | | | | |
| Security | | Shares | | | Value | |
| | | | | | | | |
| | |
Canada — 0.0%(6) | | | | | | | | |
Constellation Software, Inc., Exp. 9/15/15 | | | 24 | | | $ | 4 | |
Imperial Metals Corp., Exp. 8/20/15 | | | 302 | | | | 5 | |
| | | | | | | | | |
| |
Total Rights
(identified cost $6) | | | $ | 9 | |
| | | | | | | | | |
| | |
| Warrants (1) — 0.0%(6) | | | | | | | | |
| | |
| | | | | | | | |
| Security | | Shares | | | Value | |
| | |
South Africa — 0.0%(6) | | | | | | | | |
Adcock Ingram Holdings, Ltd., Exp. 7/26/19 | | | 45 | | | $ | 27 | |
| | | | | | | | | |
| |
Total Warrants
(identified cost $0) | | | $ | 27 | |
| | | | | | | | | |
| | |
| Short-Term Investments — 0.5% | | | | | | | | |
| | |
| | | | | | | | |
| Description | | Interest
(000’s omitted) | | | Value | |
Eaton Vance Cash Reserves Fund, LLC, 0.20%(7) | | $ | 29 | | | $ | 28,960 | |
| | | | | | | | | |
| |
Total Short-Term Investments
(identified cost $28,960) | | | $ | 28,960 | |
| | | | | | | | | |
| |
Total Investments — 99.8%
(identified cost $5,924,560) | | | $ | 6,349,393 | |
| | | | | | | | | |
| |
Other Assets, Less Liabilities — 0.2% | | | $ | 10,668 | |
| | | | | | | | | |
| |
Net Assets — 100.0% | | | $ | 6,360,061 | |
| | | | | | | | | |
The percentage shown for each investment category in the Portfolio of Investments is based on net assets.
| | | | |
| ADR | | – | | American Depositary Receipt |
| GDR | | – | | Global Depositary Receipt |
| PCL | | – | | Public Company Ltd. |
| PFC Shares | | – | | Preference Shares |
| REIT | | – | | Real Estate Investment Trust |
| (1) | Non-income producing security. |
| (2) | Security exempt from registration pursuant to Rule 144A under the Securities Act of 1933. These securities may be sold in certain transactions (normally to qualified institutional buyers) and remain exempt from registration. At July 31, 2015, the aggregate value of these securities is $77,034 or 1.2% of the Fund’s net assets. |
| (3) | For fair value measurement disclosure purposes, security is categorized as Level 3 (see Note 8). |
| (4) | Indicates a foreign registered security. Shares issued to foreign investors in markets that have foreign ownership limits. |
| (5) | Security whose performance, including redemption at maturity, is linked to the price of the underlying equity security. The investment is subject to credit risk of the issuing financial institution (JPMorgan Chase) in addition to the market risk of the underlying security. |
| (6) | Amount is less than 0.05%. |
| (7) | Affiliated investment company, available to Eaton Vance portfolios and funds, which invests in high quality, U.S. dollar denominated money market instruments. The rate shown is the annualized seven-day yield as of July 31, 2015. |
| | | | | | | | |
| Currency Concentration of Portfolio | |
| | |
| | | | | | | | |
| Currency | | Percentage
of Net Assets | | | Value | |
United States Dollar | | | 39.3 | % | | $ | 2,500,501 | |
Euro | | | 15.1 | | | | 960,859 | |
Japanese Yen | | | 7.9 | | | | 502,762 | |
British Pound Sterling | | | 7.1 | | | | 453,572 | |
Hong Kong Dollar | | | 4.2 | | | | 268,303 | |
Swiss Franc | | | 3.8 | | | | 238,967 | |
Australian Dollar | | | 3.4 | | | | 218,102 | |
Canadian Dollar | | | 3.3 | | | | 211,070 | |
South Korean Won | | | 3.3 | | | | 209,884 | |
Swedish Krona | | | 1.6 | | | | 104,877 | |
Brazilian Real | | | 1.5 | | | | 92,789 | |
New Taiwan Dollar | | | 1.3 | | | | 84,107 | |
Other currency, less than 1% each | | | 8.0 | | | | 503,600 | |
| | | | | | | | | |
Total Investments | | | 99.8 | % | | $ | 6,349,393 | |
| | | | | | | | | |
| | |
| | | | | | | | |
| Sector Classification of Portfolio | |
| | |
| | | | | | | | |
| Sector | | Percentage
of Net Assets | | | Value | |
Consumer Discretionary | | | 13.2 | % | | $ | 842,216 | |
Industrials | | | 13.2 | | | | 839,688 | |
Financials | | | 13.2 | | | | 839,041 | |
Information Technology | | | 13.1 | | | | 831,491 | |
Materials | | | 11.7 | | | | 743,008 | |
Health Care | | | 11.3 | | | | 723,302 | |
Consumer Staples | | | 9.6 | | | | 609,798 | |
Utilities | | | 5.7 | | | | 362,538 | |
Energy | | | 5.4 | | | | 346,494 | |
Telecommunication Services | | | 2.9 | | | | 182,857 | |
Short-Term Investments | | | 0.5 | | | | 28,960 | |
| | | | | | | | | |
Total Investments | | | 99.8 | % | | $ | 6,349,393 | |
| | | | | | | | | |
| | | | |
| | 19 | | See Notes to Financial Statements. |
Parametric Global Small-Cap Fund
July 31, 2015
Statement of Assets and Liabilities (Unaudited)
| | | | |
| Assets | | July 31, 2015 | |
Unaffiliated investments, at value (identified cost, $5,895,600) | | $ | 6,320,433 | |
Affiliated investment, at value (identified cost, $28,960) | | | 28,960 | |
Cash | | | 4,032 | |
Foreign currency, at value (identified cost, $21,724) | | | 21,069 | |
Dividends receivable | | | 5,598 | |
Interest receivable from affiliated investment | | | 4 | |
Tax reclaims receivable | | | 1,783 | |
Receivable from affiliates | | | 19,675 | |
Total assets | | $ | 6,401,554 | |
| |
| Liabilities | | | | |
Payable to affiliate: | | | | |
Investment adviser and administration fee | | $ | 3,777 | |
Accrued expenses | | | 37,716 | |
Total liabilities | | $ | 41,493 | |
Net Assets | | $ | 6,360,061 | |
| |
| Sources of Net Assets | | | | |
Paid-in capital | | $ | 5,825,522 | |
Accumulated net realized gain | | | 62,670 | |
Accumulated undistributed net investment income | | | 47,826 | |
Net unrealized appreciation | | | 424,043 | |
Net Assets | | $ | 6,360,061 | |
| |
| Institutional Class | | | | |
Net Assets | | $ | 6,360,061 | |
Shares Outstanding | | | 579,287 | |
Net Asset Value, Offering Price and Redemption Price Per Share | | | | |
(net assets ÷ shares of beneficial interest outstanding) | | $ | 10.98 | |
| | | | |
| | 20 | | See Notes to Financial Statements. |
Parametric Global Small-Cap Fund
July 31, 2015
Statement of Operations (Unaudited)
| | | | |
| Investment Income | | Six Months Ended July 31, 2015 | |
Dividends (net of foreign taxes, $6,765) | | $ | 87,063 | |
Interest allocated from affiliated investment | | | 17 | |
Expenses allocated from affiliated investment | | | (1 | ) |
Total investment income | | $ | 87,079 | |
| |
| Expenses | | | | |
Investment adviser and administration fee | | $ | 22,074 | |
Trustees’ fees and expenses | | | 426 | |
Custodian fee | | | 23,074 | |
Transfer and dividend disbursing agent fees | | | 210 | |
Legal and accounting services | | | 43,688 | |
Printing and postage | | | 5,662 | |
Registration fees | | | 10,010 | |
Miscellaneous | | | 6,218 | |
Total expenses | | $ | 111,362 | |
Deduct — | | | | |
Allocation of expenses to affiliates | | $ | 84,559 | |
Total expense reductions | | $ | 84,559 | |
| |
Net expenses | | $ | 26,803 | |
| |
Net investment income | | $ | 60,276 | |
| |
| Realized and Unrealized Gain (Loss) | | | | |
Net realized gain (loss) — | | | | |
Investment transactions | | $ | 63,805 | |
Foreign currency transactions | | | (634 | ) |
Net realized gain | | $ | 63,171 | |
Change in unrealized appreciation (depreciation) — | | | | |
Investments | | $ | 279,680 | |
Foreign currency | | | (87 | ) |
Net change in unrealized appreciation (depreciation) | | $ | 279,593 | |
| |
Net realized and unrealized gain | | $ | 342,764 | |
| |
Net increase in net assets from operations | | $ | 403,040 | |
| | | | |
| | 21 | | See Notes to Financial Statements. |
Parametric Global Small-Cap Fund
July 31, 2015
Statements of Changes in Net Assets
| | | | | | | | |
| Increase (Decrease) in Net Assets | | Six Months Ended July 31, 2015
(Unaudited) | | | Year Ended January 31, 2015 | |
From operations — | | | | | | | | |
Net investment income | | $ | 60,276 | | | $ | 73,814 | |
Net realized gain from investment and foreign currency transactions | | | 63,171 | | | | 468,137 | |
Net change in unrealized appreciation (depreciation) from investments and foreign currency | | | 279,593 | | | | (387,606 | ) |
Net increase in net assets from operations | | $ | 403,040 | | | $ | 154,345 | |
Distributions to shareholders — | | | | | | | | |
From net investment income | | $ | — | | | $ | (86,097 | ) |
From net realized gain | | | (22,227 | ) | | | (441,916 | ) |
Total distributions to shareholders | | $ | (22,227 | ) | | $ | (528,013 | ) |
Transactions in shares of beneficial interest — | | | | | | | | |
Net asset value of shares issued to shareholders in payment of distributions declared | | $ | 22,227 | | | $ | 528,013 | |
Cost of shares redeemed | | | (25,000 | ) | | | (8,353 | ) |
Net increase (decrease) in net assets from Fund share transactions | | $ | (2,773 | ) | | $ | 519,660 | |
| | |
Net increase in net assets | | $ | 378,040 | | | $ | 145,992 | |
| | |
| Net Assets | | | | | | | | |
At beginning of period | | $ | 5,982,021 | | | $ | 5,836,029 | |
At end of period | | $ | 6,360,061 | | | $ | 5,982,021 | |
| | |
Accumulated undistributed (distributions in excess of) net investment income included in net assets | | | | | | | | |
At end of period | | $ | 47,826 | | | $ | (12,450 | ) |
| | | | |
| | 22 | | See Notes to Financial Statements. |
Parametric Global Small-Cap Fund
July 31, 2015
Financial Highlights
| | | | | | | | | | | | | | | | |
| | | Institutional Class | |
| | | Six Months Ended
July 31, 2015
(Unaudited) | | | Year Ended January 31, | | | Period Ended January 31, 2013(1) | |
| | | | 2015 | | | 2014 | | |
Net asset value — Beginning of period | | $ | 10.320 | | | $ | 11.010 | | | $ | 10.420 | | | $ | 10.000 | |
| | | | |
| Income (Loss) From Operations | | | | | | | | | | | | | | | | |
Net investment income(2) | | $ | 0.104 | | | $ | 0.138 | | | $ | 0.181 | | | $ | 0.006 | |
Net realized and unrealized gain | | | 0.595 | | | | 0.170 | | | | 1.023 | | | | 0.418 | |
| | | | |
Total income from operations | | $ | 0.699 | | | $ | 0.308 | | | $ | 1.204 | | | $ | 0.424 | |
| | | | |
| Less Distributions | | | | | | | | | | | | | | | | |
From net investment income | | $ | — | | | $ | (0.163 | ) | | $ | (0.257 | ) | | $ | (0.004 | ) |
From net realized gain | | | (0.039 | ) | | | (0.835 | ) | | | (0.357 | ) | | | — | |
| | | | |
Total distributions | | $ | (0.039 | ) | | $ | (0.998 | ) | | $ | (0.614 | ) | | $ | (0.004 | ) |
| | | | |
Net asset value — End of period | | $ | 10.980 | | | $ | 10.320 | | | $ | 11.010 | | | $ | 10.420 | |
| | | | |
Total Return(3) | | | 6.76 | %(4) | | | 2.68 | % | | | 11.50 | % | | | 4.24 | %(4)(5) |
| | | | |
| Ratios/Supplemental Data | | | | | | �� | | | | | | | | | | |
Net assets, end of period (000’s omitted) | | $ | 6,360 | | | $ | 5,982 | | | $ | 5,836 | | | $ | 5,209 | |
Ratios (as a percentage of average daily net assets): | | | | | | | | | | | | | | | | |
Expenses(6) | | | 0.85 | %(7) | | | 0.85 | % | | | 0.85 | % | | | 0.85 | %(7) |
Net investment income | | | 1.91 | %(7) | | | 1.21 | % | | | 1.63 | % | | | 0.52 | %(7) |
Portfolio Turnover | | | 3 | %(4) | | | 49 | % | | | 38 | % | | | 13 | %(4) |
| (1) | For the period from the start of business, December 20, 2012, to January 31, 2013. |
| (2) | Computed using average shares outstanding. |
| (3) | Returns are historical and are calculated by determining the percentage change in net asset value with all distributions reinvested. |
| (5) | During the period ended January 31, 2013, the sub-adviser reimbursed the Fund for a net loss realized on the disposal of an investment which did not meet the Fund’s investment guidelines. The reimbursement had no effect on total return for the period ended January 31, 2013. |
| (6) | The investment adviser, sub-adviser and administrator reimbursed certain operating expenses (equal to 2.68%, 2.48%, 2.86% and 10.98% of average daily net assets for the six months ended July 31, 2015, the years ended January 31, 2015 and 2014 and the period ended January 31, 2013, respectively). Absent this subsidy, total return would have been lower. |
| | | | |
| | 23 | | See Notes to Financial Statements. |
Parametric Global Small-Cap Fund
July 31, 2015
Notes to Financial Statements (Unaudited)
1 Significant Accounting Policies
Parametric Global Small-Cap Fund (the Fund) is a diversified series of Eaton Vance Mutual Funds Trust (the Trust). The Trust is a Massachusetts business trust registered under the Investment Company Act of 1940, as amended (the 1940 Act), as an open-end management investment company. The Fund’s investment objective is to seek long-term capital appreciation. The Fund’s shares are offered to institutional investors and are sold at net asset value and are not subject to a sales charge.
The following is a summary of significant accounting policies of the Fund. The policies are in conformity with accounting principles generally accepted in the United States of America (U.S. GAAP). The Fund is an investment company and follows accounting and reporting guidance in the Financial Accounting Standards Board (“FASB”) Accounting Standards Codification Topic 946.
A Investment Valuation — The following methodologies are used to determine the market value or fair value of investments.
Equity Securities. Equity securities listed on a U.S. securities exchange generally are valued at the last sale or closing price on the day of valuation or, if no sales took place on such date, at the mean between the closing bid and asked prices therefore on the exchange where such securities are principally traded. Equity securities listed on the NASDAQ Global or Global Select Market generally are valued at the NASDAQ official closing price. Unlisted or listed securities for which closing sales prices or closing quotations are not available are valued at the mean between the latest available bid and asked prices. Equity-linked securities are generally valued based on the value of the underlying equity security or instrument.
Foreign Securities and Currencies. Foreign securities and currencies are valued in U.S. dollars, based on foreign currency exchange rate quotations supplied by a third party pricing service. The pricing service uses a proprietary model to determine the exchange rate. Inputs to the model include reported trades and implied bid/ask spreads. The daily valuation of exchange-traded foreign securities generally is determined as of the close of trading on the principal exchange on which such securities trade. Events occurring after the close of trading on foreign exchanges may result in adjustments to the valuation of foreign securities to more accurately reflect their fair value as of the close of regular trading on the New York Stock Exchange. When valuing foreign equity securities that meet certain criteria, the Fund’s Trustees have approved the use of a fair value service that values such securities to reflect market trading that occurs after the close of the applicable foreign markets of comparable securities or other instruments that have a strong correlation to the fair-valued securities.
Affiliated Fund. The Fund may invest in Eaton Vance Cash Reserves Fund, LLC (Cash Reserves Fund), an affiliated investment company managed by Eaton Vance Management (EVM). The value of the Fund’s investment in Cash Reserves Fund reflects the Fund’s proportionate interest in its net assets. Cash Reserves Fund generally values its investment securities utilizing the amortized cost valuation technique in accordance with Rule 2a-7 under the 1940 Act. This technique involves initially valuing a portfolio security at its cost and thereafter assuming a constant amortization to maturity of any discount or premium. If amortized cost is determined not to approximate fair value, Cash Reserves Fund may value its investment securities based on available market quotations provided by a third party pricing service.
Fair Valuation. Investments for which valuations or market quotations are not readily available or are deemed unreliable are valued at fair value using methods determined in good faith by or at the direction of the Trustees of the Fund in a manner that fairly reflects the security’s value, or the amount that the Fund might reasonably expect to receive for the security upon its current sale in the ordinary course. Each such determination is based on a consideration of relevant factors, which are likely to vary from one pricing context to another. These factors may include, but are not limited to, the type of security, the existence of any contractual restrictions on the security’s disposition, the price and extent of public trading in similar securities of the issuer or of comparable companies or entities, quotations or relevant information obtained from broker/dealers or other market participants, information obtained from the issuer, analysts, and/or the appropriate stock exchange (for exchange-traded securities), an analysis of the company’s or entity’s financial condition, and an evaluation of the forces that influence the issuer and the market(s) in which the security is purchased and sold.
B Investment Transactions — Investment transactions for financial statement purposes are accounted for on a trade date basis. Realized gains and losses on investments sold are determined on the basis of identified cost.
C Income — Dividend income is recorded on the ex-dividend date for dividends received in cash and/or securities. However, if the ex-dividend date has passed, certain dividends from foreign securities are recorded as the Fund is informed of the ex-dividend date. Withholding taxes on foreign dividends and capital gains have been provided for in accordance with the Fund’s understanding of the applicable countries’ tax rules and rates. Interest income is recorded on the basis of interest accrued, adjusted for amortization of premium or accretion of discount.
D Federal Taxes — The Fund’s policy is to comply with the provisions of the Internal Revenue Code applicable to regulated investment companies and to distribute to shareholders each year substantially all of its net investment income, and all or substantially all of its net realized capital gains. Accordingly, no provision for federal income or excise tax is necessary.
In addition to the requirements of the Internal Revenue Code, the Fund may also be subject to local taxes on the recognition of capital gains in certain countries. In determining the daily net asset value, the Fund estimates the accrual for such taxes, if any, based on the unrealized appreciation on certain portfolio securities and the related tax rates. Taxes attributable to unrealized appreciation are included in the change in unrealized appreciation (depreciation) on investments. Capital gains taxes on securities sold are included in net realized gain (loss) on investments.
As of July 31, 2015, the Fund had no uncertain tax positions that would require financial statement recognition, de-recognition, or disclosure. The Fund files a U.S. federal income tax return annually after its fiscal year-end, which is subject to examination by the Internal Revenue Service for a period of three years from the date of filing.
Parametric Global Small-Cap Fund
July 31, 2015
Notes to Financial Statements (Unaudited) — continued
E Expenses — The majority of expenses of the Trust are directly identifiable to an individual fund. Expenses which are not readily identifiable to a specific fund are allocated taking into consideration, among other things, the nature and type of expense and the relative size of the funds.
F Expense Reduction — State Street Bank and Trust Company (SSBT) serves as custodian of the Fund. Pursuant to the custodian agreement, SSBT receives a fee reduced by credits, which are determined based on the average daily cash balance the Fund maintains with SSBT. All credit balances, if any, used to reduce the Fund’s custodian fees are reported as a reduction of expenses in the Statement of Operations.
G Foreign Currency Translation — Investment valuations, other assets, and liabilities initially expressed in foreign currencies are translated each business day into U.S. dollars based upon current exchange rates. Purchases and sales of foreign investment securities and income and expenses denominated in foreign currencies are translated into U.S. dollars based upon currency exchange rates in effect on the respective dates of such transactions. Recognized gains or losses on investment transactions attributable to changes in foreign currency exchange rates are recorded for financial statement purposes as net realized gains and losses on investments. That portion of unrealized gains and losses on investments that results from fluctuations in foreign currency exchange rates is not separately disclosed.
H Equity-Linked Securities — Equity-linked securities are primarily used as an alternative means to more efficiently and effectively access the securities markets of emerging market countries and may also be known as participation notes, equity swaps, and zero strike calls and warrants. Equity-linked securities are privately issued securities whose investment results are designed to correspond generally to the performance of a specified stock index or “basket” of stocks, or a single stock. The Fund deposits an amount of cash with its custodian (or broker, if legally permitted) in an amount near or equal to the selling price of the underlying security in exchange for an equity-linked security. Upon sale, the Fund receives cash from the broker or custodian equal to the current value of the underlying security, less transactional costs. Aside from market risk of the underlying security, there is the risk that the issuer of an equity-linked security may default on its obligation under the security. In addition, the Fund may be unable to close out such a transaction with the other party or obtain an offsetting position with any other party, at any time prior to the end of the term of the underlying agreement. Income received on equity-linked securities is recorded as dividend income.
I Use of Estimates — The preparation of the financial statements in conformity with U.S. GAAP requires management to make estimates and assumptions that affect the reported amounts of assets and liabilities at the date of the financial statements and the reported amounts of income and expense during the reporting period. Actual results could differ from those estimates.
J Indemnifications — Under the Trust’s organizational documents, its officers and Trustees may be indemnified against certain liabilities and expenses arising out of the performance of their duties to the Fund. Under Massachusetts law, if certain conditions prevail, shareholders of a Massachusetts business trust (such as the Trust) could be deemed to have personal liability for the obligations of the Trust. However, the Trust’s Declaration of Trust contains an express disclaimer of liability on the part of Fund shareholders and the By-laws provide that the Trust shall assume the defense on behalf of any Fund shareholders. Moreover, the By-laws also provide for indemnification out of Fund property of any shareholder held personally liable solely by reason of being or having been a shareholder for all loss or expense arising from such liability. Additionally, in the normal course of business, the Fund enters into agreements with service providers that may contain indemnification clauses. The Fund’s maximum exposure under these arrangements is unknown as this would involve future claims that may be made against the Fund that have not yet occurred.
K Interim Financial Statements — The interim financial statements relating to July 31, 2015 and for the six months then ended have not been audited by an independent registered public accounting firm, but in the opinion of the Fund’s management, reflect all adjustments, consisting only of normal recurring adjustments, necessary for the fair presentation of the financial statements.
2 Distributions to Shareholders and Income Tax Information
It is the present policy of the Fund to make at least one distribution annually (normally in December) of all or substantially all of its net investment income and to distribute annually all or substantially all of its net realized capital gains. Distributions to shareholders are recorded on the ex-dividend date. Shareholders may reinvest income and capital gain distributions in additional shares of the Fund at the net asset value as of the ex-dividend date or, at the election of the shareholder, receive distributions in cash. Distributions to shareholders are determined in accordance with income tax regulations, which may differ from U.S. GAAP. As required by U.S. GAAP, only distributions in excess of tax basis earnings and profits are reported in the financial statements as a return of capital. As required by U.S. GAAP, only distributions in excess of tax basis earnings and profits are reported in the financial statements as a return of capital. Permanent differences between book and tax accounting relating to distributions are reclassified to paid-in capital. For tax purposes, distributions from short-term capital gains are considered to be from ordinary income.
Parametric Global Small-Cap Fund
July 31, 2015
Notes to Financial Statements (Unaudited) — continued
The cost and unrealized appreciation (depreciation) of investments of the Fund at July 31, 2015, as determined on a federal income tax basis, were as follows:
| | | | |
| |
Aggregate cost | | $ | 5,937,450 | |
| |
Gross unrealized appreciation | | $ | 1,279,886 | |
Gross unrealized depreciation | | | (867,943 | ) |
| |
Net unrealized appreciation | | $ | 411,943 | |
3 Investment Adviser and Administration Fee and Other Transactions with Affiliates
The investment adviser and administration fee is earned by EVM as compensation for investment advisory and administrative services rendered to the Fund. The fee is computed at an annual rate of 0.70% of the Fund’s average daily net assets up to $500 million and is payable monthly. On net assets of $500 million and over, the annual fee is reduced. For the six months ended July 31, 2015, the investment adviser and administration fee amounted to $22,074 or 0.70% (annualized) of the Fund’s average daily net assets. Pursuant to a sub-advisory agreement, EVM has delegated the investment management of the Fund to Parametric Portfolio Associates LLC (Parametric), a majority-owned subsidiary of Eaton Vance Corp. EVM pays Parametric a portion of its advisory and administration fee for sub-advisory services provided to the Fund. The Fund invests its cash in Cash Reserves Fund. EVM does not currently receive a fee for advisory services provided to Cash Reserves Fund.
EVM and Parametric have agreed to reimburse the Fund’s expenses to the extent that total annual operating expenses (relating to ordinary operating expenses only) exceed 0.85% of the Fund’s average daily net assets. This agreement may be changed or terminated after May 31, 2016. Pursuant to this agreement, EVM and Parametric were allocated $84,559 in total of the Fund’s operating expenses for the six months ended July 31, 2015.
EVM provides sub-transfer agency and related services to the Fund pursuant to a Sub-Transfer Agency Support Services Agreement. For the six months ended July 31, 2015, EVM earned $12 from the Fund pursuant to such agreement, which is included in transfer and dividend disbursing agent fees on the Statement of Operations.
Trustees and officers of the Fund who are members of EVM’s organization receive remuneration for their services to the Fund out of the investment adviser and administration fee. Trustees of the Fund who are not affiliated with EVM may elect to defer receipt of all or a percentage of their annual fees in accordance with the terms of the Trustees Deferred Compensation Plan. For the six months ended July 31, 2015, no significant amounts have been deferred. Certain officers and Trustees of the Fund are officers of EVM.
4 Purchases and Sales of Investments
Purchases and sales of investments, other than short-term obligations, aggregated $162,932 and $174,421, respectively, for the six months ended July 31, 2015.
5 Shares of Beneficial Interest
The Fund’s Declaration of Trust permits the Trustees to issue an unlimited number of full and fractional shares of beneficial interest (without par value). Such shares may be issued in a number of different series (such as the Fund) and classes. Transactions in Fund shares were as follows:
| | | | | | | | |
| Institutional Class | | Six Months Ended
July 31, 2015
(Unaudited) | | | Year Ended
January 31, 2015 | |
| | |
Sales | | | — | | | | — | |
Issued to shareholders electing to receive payments of distributions in Fund shares | | | 1,952 | | | | 50,528 | |
Redemptions | | | (2,370 | ) | | | (735 | ) |
| | |
Net increase (decrease) | | | (418 | ) | | | 49,793 | |
At July 31, 2015, an affiliate of EVM owned 99.3% of the outstanding shares of the Fund.
Parametric Global Small-Cap Fund
July 31, 2015
Notes to Financial Statements (Unaudited) — continued
6 Risks Associated with Foreign Investments
Investing in securities issued by companies whose principal business activities are outside the United States may involve significant risks not present in domestic investments. For example, there is generally less publicly available information about foreign companies, particularly those not subject to the disclosure and reporting requirements of the U.S. securities laws. Certain foreign issuers are generally not bound by uniform accounting, auditing, and financial reporting requirements and standards of practice comparable to those applicable to domestic issuers. Investments in foreign securities also involve the risk of possible adverse changes in investment or exchange control regulations, expropriation or confiscatory taxation, limitation on the removal of funds or other assets of the Fund, political or financial instability or diplomatic and other developments which could affect such investments. Foreign securities markets, while growing in volume and sophistication, are generally not as developed as those in the United States, and securities of some foreign issuers (particularly those located in developing countries) may be less liquid and more volatile than securities of comparable U.S. companies. In general, there is less overall governmental supervision and regulation of foreign securities markets, broker/dealers and issuers than in the United States.
7 Line of Credit
The Fund participates with other portfolios and funds managed by EVM and its affiliates in a $750 million unsecured line of credit agreement with a group of banks, which is in effect through September 7, 2015. Borrowings are made by the Fund solely to facilitate the handling of unusual and/or unanticipated short-term cash requirements. Interest is charged to the Fund based on its borrowings at an amount above either the Eurodollar rate or Federal Funds rate. In addition, a fee computed at an annual rate of 0.08% on the daily unused portion of the line of credit is allocated among the participating portfolios and funds at the end of each quarter. Because the line of credit is not available exclusively to the Fund, it may be unable to borrow some or all of its requested amounts at any particular time. The Fund did not have any significant borrowings or allocated fees during the six months ended July 31, 2015.
On September 4, 2015, the Fund renewed its line of credit agreement, which expires September 2, 2016. Under the terms of the renewed credit agreement, the commitment amount was reduced to $625 million and the commitment fee on the unused portion of the line of credit was changed to an annual rate of 0.10%.
8 Fair Value Measurements
Under generally accepted accounting principles for fair value measurements, a three-tier hierarchy to prioritize the assumptions, referred to as inputs, is used in valuation techniques to measure fair value. The three-tier hierarchy of inputs is summarized in the three broad levels listed below.
| • | | Level 1 – quoted prices in active markets for identical investments |
| • | | Level 2 – other significant observable inputs (including quoted prices for similar investments, interest rates, prepayment speeds, credit risk, etc.) |
| • | | Level 3 – significant unobservable inputs (including a fund’s own assumptions in determining the fair value of investments) |
In cases where the inputs used to measure fair value fall in different levels of the fair value hierarchy, the level disclosed is determined based on the lowest level input that is significant to the fair value measurement in its entirety. The inputs or methodology used for valuing securities are not necessarily an indication of the risk associated with investing in those securities.
Parametric Global Small-Cap Fund
July 31, 2015
Notes to Financial Statements (Unaudited) — continued
At July 31, 2015, the hierarchy of inputs used in valuing the Fund’s investments, which are carried at value, were as follows:
| | | | | | | | | | | | | | | | |
| Asset Description | | Level 1 | | | Level 2 | | | Level 3* | | | Total | |
| | | | |
Common Stocks | | | | | | | | | | | | | | | | |
Asia/Pacific | | $ | 42,838 | | | $ | 1,452,345 | | | $ | 0 | | | $ | 1,495,183 | |
Developed Europe | | | 24,934 | | | | 1,847,261 | | | | — | | | | 1,872,195 | |
Developed Middle East | | | 1,346 | | | | 29,686 | | | | — | | | | 31,032 | |
Emerging Europe | | | 13,292 | | | | 117,704 | | | | — | | | | 130,996 | |
Latin America | | | 165,901 | | | | — | | | | — | | | | 165,901 | |
Middle East/Africa | | | 391 | | | | 50,649 | | | | 0 | | | | 51,040 | |
North America | | | 2,520,042 | | | | — | | | | — | | | | 2,520,042 | |
| | | | |
Total Common Stocks | | $ | 2,768,744 | | | $ | 3,497,645 | ** | | $ | 0 | | | $ | 6,266,389 | |
| | | | |
Equity-Linked Securities - India | | $ | — | | | $ | 54,008 | | | $ | — | | | $ | 54,008 | |
Rights | | | 9 | | | | — | | | | — | | | | 9 | |
Warrants | | | 27 | | | | — | | | | — | | | | 27 | |
Short-Term Investments | | | — | | | | 28,960 | | | | — | | | | 28,960 | |
| | | | |
Total Investments | | $ | 2,768,780 | | | $ | 3,580,613 | | | $ | 0 | | | $ | 6,349,393 | |
| * | None of the unobservable inputs for Level 3 assets, individually or collectively, had a material impact on the Fund. |
| ** | Includes foreign equity securities whose values were adjusted to reflect market trading of comparable securities or other correlated instruments that occurred after the close of trading in their applicable foreign markets. |
Level 3 investments at the beginning and/or end of the period in relation to net assets were not significant and accordingly, a reconciliation of Level 3 assets for the six months ended July 31, 2015 is not presented. At July 31, 2015, the value of investments transferred between Level 1 and Level 2 during the six months then ended was not significant.
Parametric Global Small-Cap Fund
July 31, 2015
Board of Trustees’ Contract Approval
Overview of the Contract Review Process
The Investment Company Act of 1940, as amended (the “1940 Act”), provides, in substance, that each investment advisory agreement between a fund and its investment adviser will continue in effect from year to year only if its continuation is approved at least annually by the fund’s board of trustees, including by a vote of a majority of the trustees who are not “interested persons” of the fund (“Independent Trustees”), cast in person at a meeting called for the purpose of considering such approval.
At a meeting of the Boards of Trustees (each a “Board”) of the registered investment companies advised, administered and/or distributed by Eaton Vance Management or its affiliates (the “Eaton Vance Funds”) held on April 27, 2015, the Board, including a majority of the Independent Trustees, voted to approve continuation of existing investment advisory and sub-advisory agreements for the Eaton Vance Funds for an additional one-year period. In voting its approval, the Board relied upon the affirmative recommendation of its Contract Review Committee, which is a committee comprised exclusively of Independent Trustees. Prior to making its recommendation, the Contract Review Committee reviewed information furnished by each adviser to the Eaton Vance Funds (including information specifically requested by the Board) for a series of meetings of the Contract Review Committee held between February and April 2015. The Contract Review Committee also considered information received at prior meetings of the Board and its committees, as relevant to its annual evaluation of the investment advisory and sub-advisory agreements.
The information that the Board considered included, among other things, the following:
Information about Fees, Performance and Expenses
| • | | A report from an independent data provider comparing the advisory and related fees paid by each fund with fees paid by comparable funds as identified by the data provider (“comparable funds”); |
| • | | A report from an independent data provider comparing each fund’s total expense ratio and its components to comparable funds; |
| • | | A report from an independent data provider comparing the investment performance of each fund (including, where relevant, yield data, Sharpe ratios and information ratios) to the investment performance of comparable funds over various time periods; |
| • | | Data regarding investment performance in comparison to benchmark indices and customized peer groups identified by the adviser in consultation with the Board; |
| • | | For each fund, comparative information concerning the fees charged and the services provided by each adviser in managing other accounts (including mutual funds, other collective investment funds and institutional accounts) using investment strategies and techniques similar to those used in managing such fund; |
| • | | Profitability analyses for each adviser with respect to each fund; |
Information about Portfolio Management and Trading
| • | | Descriptions of the investment management services provided to each fund, including the investment strategies and processes it employs; |
| • | | The procedures and processes used to determine the fair value of fund assets and actions taken to monitor and test the effectiveness of such procedures and processes; |
| • | | Information about each adviser’s policies and practices with respect to trading, including each adviser’s processes for monitoring best execution of portfolio transactions; |
| • | | Information about the allocation of brokerage transactions and the benefits received by each adviser as a result of brokerage allocation, including information concerning the acquisition of research through client commission arrangements and policies with respect to “soft dollars”; |
| • | | Data relating to portfolio turnover rates of each fund; |
Information about each Adviser
| • | | Reports detailing the financial results and condition of each adviser; |
| • | | Descriptions of the qualifications, education and experience of the individual investment professionals whose responsibilities include portfolio management and investment research for the funds, and information relating to their compensation and responsibilities with respect to managing other mutual funds and investment accounts; |
| • | | The Code of Ethics of each adviser and its affiliates, together with information relating to compliance with and the administration of such codes; |
| • | | Policies and procedures relating to proxy voting and the handling of corporate actions and class actions; |
| • | | Information concerning the resources devoted to compliance efforts undertaken by each adviser and its affiliates (including descriptions of various compliance programs) and their record of compliance; |
| • | | Descriptions of the business continuity and disaster recovery plans of each adviser and its affiliates; |
| • | | A description of Eaton Vance Management’s procedures for overseeing third party advisers and sub-advisers, including with respect to regulatory and compliance issues, investment management and other matters; |
Parametric Global Small-Cap Fund
July 31, 2015
Board of Trustees’ Contract Approval — continued
Other Relevant Information
| • | | Information concerning the nature, cost and character of the administrative and other non-investment management services provided by Eaton Vance Management and its affiliates; |
| • | | Information concerning management of the relationship with the custodian, subcustodians and fund accountants by each adviser or the funds’ administrator; and |
| • | | The terms of each investment advisory agreement. |
Over the course of the twelve-month period ended April 30, 2015, with respect to one or more funds, the Board met nine times and the Contract Review Committee, the Audit Committee, the Governance Committee, the Portfolio Management Committee and the Compliance Reports and Regulatory Matters Committee, each of which is a Committee comprised solely of Independent Trustees, met eight, seventeen, seven, eleven and thirteen times, respectively. At such meetings, the Trustees participated in investment and performance reviews with the portfolio managers and other investment professionals of each adviser relating to each fund, and considered the investment and trading strategies used in pursuing each fund’s investment objective, including, where relevant, the use of derivative instruments, as well as processes for monitoring best execution of portfolio transactions and risk management techniques. The Board and its Committees also evaluated issues pertaining to industry and regulatory developments, compliance procedures, fund governance and other issues with respect to the funds, and received and participated in reports and presentations provided by Eaton Vance Management and other fund advisers with respect to such matters. In addition to the formal meetings of the Board and its Committees, the Independent Trustees hold regular teleconferences in between meetings to discuss, among other topics, matters relating to the continuation of investment advisory and sub-advisory agreements.
For funds that invest through one or more underlying portfolios, the Board considered similar information about the portfolio(s) when considering the approval of investment advisory agreements. In addition, in cases where the fund’s investment adviser has engaged a sub-adviser, the Board considered similar information about the sub-adviser when considering the approval of any sub-advisory agreement.
The Contract Review Committee was assisted throughout the contract review process by Goodwin Procter LLP, legal counsel for the Independent Trustees. The members of the Contract Review Committee relied upon the advice of such counsel and their own business judgment in determining the material factors to be considered in evaluating each investment advisory and sub-advisory agreement and the weight to be given to each such factor. The conclusions reached with respect to each investment advisory and sub-advisory agreement were based on a comprehensive evaluation of all the information provided and not any single factor. Moreover, each member of the Contract Review Committee may have placed varying emphasis on particular factors in reaching conclusions with respect to each investment advisory and sub-advisory agreement. In evaluating each investment advisory and sub-advisory agreement, including the specific fee structures and other terms of the agreements, the Contract Review Committee was informed by multiple years of analysis and discussion among the Independent Trustees and the Eaton Vance Funds’ advisers and sub-advisers.
Results of the Process
Based on its consideration of the foregoing, and such other information as it deemed relevant, including the factors and conclusions described below, the Contract Review Committee concluded that the continuation of the investment advisory and administrative agreement of Parametric Global Small-Cap Fund (the “Fund”) with Eaton Vance Management (the “Adviser”) and the sub-advisory agreement with Parametric Portfolio Associates LLC (the “Sub-adviser”), an affiliate of the Adviser, including their fee structures, is in the interests of shareholders and, therefore, the Contract Review Committee recommended to the Board approval of each agreement. The Board accepted the recommendation of the Contract Review Committee as well as the factors considered and conclusions reached by the Contract Review Committee with respect to the agreements. Accordingly, the Board, including a majority of the Independent Trustees, voted to approve continuation of the investment advisory and administrative agreement and the sub-advisory agreement for the Fund.
Nature, Extent and Quality of Services
In considering whether to approve the investment advisory and administrative agreement and the sub-advisory agreement of the Fund, the Board evaluated the nature, extent and quality of services provided to the Fund by the Adviser and the Sub-adviser.
The Board considered the Adviser’s and the Sub-adviser’s management capabilities and investment process with respect to the types of investments held by the Fund, including the education, experience and number of its investment professionals and other personnel who provide portfolio management, investment research, and similar services to the Fund, including recent changes to such personnel. With respect to the Adviser, the Board considered the Adviser’s responsibilities supervising the Sub-adviser. The Board evaluated, where relevant, the abilities and experience of the Sub-adviser’s experience employing a top-down, disciplined investment processes that emphasizes broad exposure and diversification. The Board also took into account the resources dedicated to portfolio management and other services, as well as the compensation methods of the Adviser and other factors, such as the reputation and resources of the Adviser to recruit and retain investment personnel. In addition, the Board considered the time and attention devoted to the Fund by senior management, as well as the infrastructure, operational capabilities and support staff in place to assist in the management of the Fund, including the provision of administrative services.
The Board considered the compliance programs of the Adviser and relevant affiliates thereof, including the Sub-adviser. Among other matters, the Board considered compliance and reporting matters relating to personal trading by investment personnel, selective disclosure of portfolio holdings, late trading,
Parametric Global Small-Cap Fund
July 31, 2015
Board of Trustees’ Contract Approval — continued
frequent trading, portfolio valuation, business continuity and the allocation of investment opportunities. The Board also considered the responses of the Adviser and its affiliates to requests in recent years from regulatory authorities such as the Securities and Exchange Commission and the Financial Industry Regulatory Authority.
The Board considered shareholder and other administrative services provided or managed by the Adviser and its affiliates, including transfer agency and accounting services. The Board evaluated the benefits to shareholders of investing in a fund that is a part of a large family of funds, including the ability, in many cases, to exchange an investment among different funds without incurring additional sales charges.
After consideration of the foregoing factors, among others, the Board concluded that the nature, extent and quality of services provided by the Adviser and the Sub-adviser, taken as a whole, are appropriate and consistent with the terms of the investment advisory and administrative agreement and the sub-advisory agreement.
Fund Performance
The Board compared the Fund’s investment performance to that of comparable funds and appropriate benchmark indices. The Board’s review included comparative performance data for the one-year period ended September 30, 2014 for the Fund. The Board concluded that the performance of the Fund was satisfactory.
Management Fees and Expenses
The Board considered contractual fee rates payable by the Fund for advisory and administrative services (referred to collectively as “management fees”). As part of its review, the Board considered the Fund’s management fees and total expense ratio for the year ended September 30, 2014, as compared to those of comparable funds, before and after giving effect to any undertaking to waive fees or reimburse expenses. The Board also considered factors that had an impact on Fund expense ratios, as identified by management in response to inquiries from the Contract Review Committee, as well as actions taken by management in recent years to reduce expenses at the fund complex level.
After considering the foregoing information, and in light of the nature, extent and quality of the services provided by the Adviser and the Sub-adviser, the Board concluded that the management fees charged for advisory and related services are reasonable.
Profitability
The Board considered the level of profits realized by the Adviser and relevant affiliates thereof, including the Sub-adviser, in providing investment advisory and administrative services to the Fund and to all Eaton Vance Funds as a group. The Board considered the level of profits realized without regard to revenue sharing or other payments by the Adviser and its affiliates to third parties in respect of distribution services. The Board also considered other direct or indirect benefits received by the Adviser and its affiliates, including the Sub-adviser, in connection with their relationships with the Fund, including the benefits of research services that may be available to the Adviser or the Sub-adviser as a result of securities transactions effected for the Fund and other investment advisory clients.
The Board concluded that, in light of the foregoing factors and the nature, extent and quality of the services rendered, the profits realized by the Adviser and its affiliates, including the Sub-adviser, are reasonable.
Economies of Scale
In reviewing management fees and profitability, the Board also considered the extent to which the Adviser and its affiliates, on the one hand, and the Fund, on the other hand, can expect to realize benefits from economies of scale as the assets of the Fund increase. The Board acknowledged the difficulty in accurately measuring the benefits resulting from the economies of scale with respect to the management of any specific fund or group of funds. The Board reviewed data summarizing the increases and decreases in the assets of the Fund and of all Eaton Vance Funds as a group over various time periods, and evaluated the extent to which the total expense ratio of the Fund and the profitability of the Adviser and its affiliates may have been affected by such increases or decreases. Based upon the foregoing, the Board concluded that the Fund currently shares in the benefits from economies of scale. The Board also concluded that, assuming reasonably foreseeable increases in the assets of the Fund, the structure of the advisory fee, which includes breakpoints at several asset levels, will allow the Fund to continue to benefit from economies of scale in the future.
Parametric Global Small-Cap Fund
July 31, 2015
Officers and Trustees
Officers of Parametric Global Small-Cap Fund
Payson F. Swaffield
President
Maureen A. Gemma
Vice President, Secretary and
Chief Legal Officer
James F. Kirchner
Treasurer
Paul M. O’Neil
Chief Compliance Officer
Trustees of Parametric Global Small-Cap Fund
Ralph F. Verni
Chairman
Scott E. Eston
Thomas E. Faust Jr.*
Cynthia E. Frost
George J. Gorman
Valerie A. Mosley
William H. Park
Helen Frame Peters
Susan J. Sutherland**
Harriett Tee Taggart
| ** | Ms. Sutherland began serving as a Trustee effective May 1, 2015. |
Eaton Vance Funds
IMPORTANT NOTICES
Privacy. The Eaton Vance organization is committed to ensuring your financial privacy. Each of the financial institutions identified below has in effect the following policy (“Privacy Policy”) with respect to nonpublic personal information about its customers:
| • | | Only such information received from you, through application forms or otherwise, and information about your Eaton Vance fund transactions will be collected. This may include information such as name, address, social security number, tax status, account balances and transactions. |
| • | | None of such information about you (or former customers) will be disclosed to anyone, except as permitted by law (which includes disclosure to employees necessary to service your account). In the normal course of servicing a customer’s account, Eaton Vance may share information with unaffiliated third parties that perform various required services such as transfer agents, custodians and broker-dealers. |
| • | | Policies and procedures (including physical, electronic and procedural safeguards) are in place that are designed to protect the confidentiality of such information. |
| • | | We reserve the right to change our Privacy Policy at any time upon proper notification to you. Customers may want to review our Privacy Policy periodically for changes by accessing the link on our homepage: www.eatonvance.com. |
Our pledge of privacy applies to the following entities within the Eaton Vance organization: the Eaton Vance Family of Funds, Eaton Vance Management, Eaton Vance Investment Counsel, Eaton Vance Distributors, Inc., Eaton Vance Trust Company, Eaton Vance Management’s Real Estate Investment Group and Boston Management and Research. In addition, our Privacy Policy applies only to those Eaton Vance customers who are individuals and who have a direct relationship with us. If a customer’s account (i.e., fund shares) is held in the name of a third-party financial advisor/broker-dealer, it is likely that only such advisor’s privacy policies apply to the customer. This notice supersedes all previously issued privacy disclosures. For more information about Eaton Vance’s Privacy Policy, please call 1-800-262-1122.
Delivery of Shareholder Documents. The Securities and Exchange Commission (SEC) permits funds to deliver only one copy of shareholder documents, including prospectuses, proxy statements and shareholder reports, to fund investors with multiple accounts at the same residential or post office box address. This practice is often called “householding” and it helps eliminate duplicate mailings to shareholders. Eaton Vance, or your financial advisor, may household the mailing of your documents indefinitely unless you instruct Eaton Vance, or your financial advisor, otherwise. If you would prefer that your Eaton Vance documents not be householded, please contact Eaton Vance at 1-800-260-0761, or contact your financial advisor. Your instructions that householding not apply to delivery of your Eaton Vance documents will be effective within 30 days of receipt by Eaton Vance or your financial advisor.
Portfolio Holdings. Each Eaton Vance Fund and its underlying Portfolio(s) (if applicable) will file a schedule of portfolio holdings on Form N-Q with the SEC for the first and third quarters of each fiscal year. The Form N-Q will be available on the Eaton Vance website at www.eatonvance.com, by calling Eaton Vance at 1-800-260-0761 or in the EDGAR database on the SEC’s website at www.sec.gov. Form N-Q may also be reviewed and copied at the SEC’s public reference room in Washington, D.C. (call 1-800-732-0330 for information on the operation of the public reference room).
Proxy Voting. From time to time, funds are required to vote proxies related to the securities held by the funds. The Eaton Vance Funds or their underlying Portfolios (if applicable) vote proxies according to a set of policies and procedures approved by the Funds’ and Portfolios’ Boards. You may obtain a description of these policies and procedures and information on how the Funds or Portfolios voted proxies relating to portfolio securities during the most recent 12-month period ended June 30, without charge, upon request, by calling 1-800-260-0761 and by accessing the SEC’s website at www.sec.gov.
This Page Intentionally Left Blank
This Page Intentionally Left Blank
This Page Intentionally Left Blank
Investment Adviser and Administrator
Eaton Vance Management
Two International Place
Boston, MA 02110
Sub-Adviser
Parametric Portfolio Associates LLC
1918 Eighth Avenue, Suite 3100
Seattle, WA 98101
Principal Underwriter*
Eaton Vance Distributors, Inc.
Two International Place
Boston, MA 02110
(617) 482-8260
Custodian
State Street Bank and Trust Company
State Street Financial Center, One Lincoln Street
Boston, MA 02111
Transfer Agent
BNY Mellon Investment Servicing (US) Inc.
Attn: Eaton Vance Funds
P.O. Box 9653
Providence, RI 02940-9653
(800) 260-0761
Fund Offices
Two International Place
Boston, MA 02110
| * | FINRA BrokerCheck. Investors may check the background of their Investment Professional by contacting the Financial Industry Regulatory Authority (FINRA). FINRA BrokerCheck is a free tool to help investors check the professional background of current and former FINRA-registered securities firms and brokers. FINRA BrokerCheck is available by calling 1-800-289-9999 and at www.FINRA.org. The FINRA BrokerCheck brochure describing the program is available to investors at www.FINRA.org. |

| | |
Parametric International Equity Fund Semiannual Report July 31, 2015 | | |

Commodity Futures Trading Commission Registration. Effective December 31, 2012, the Commodity Futures Trading Commission (“CFTC”) adopted certain regulatory changes that subject registered investment companies and advisers to regulation by the CFTC if a fund invests more than a prescribed level of its assets in certain CFTC-regulated instruments (including futures, certain options and swap agreements) or markets itself as providing investment exposure to such instruments. The Fund has claimed an exclusion from the definition of the term “commodity pool operator” under the Commodity Exchange Act. Accordingly, neither the Fund nor the adviser with respect to the operation of the Fund is subject to CFTC regulation. Because of its management of other strategies, the Fund’s adviser is registered with the CFTC as a commodity pool operator and a commodity trading advisor.
Fund shares are not insured by the FDIC and are not deposits or other obligations of, or guaranteed by, any depository institution. Shares are subject to investment risks, including possible loss of principal invested.
This report must be preceded or accompanied by a current summary prospectus or prospectus. Before investing, investors should consider carefully the investment objective, risks, and charges and expenses of a mutual fund. This and other important information is contained in the summary prospectus and prospectus, which can be obtained from a financial advisor. Prospective investors should read the prospectus carefully before investing. For further information, please call 1-800-260-0761.
Semiannual Report July 31, 2015
Parametric International Equity Fund
Table of Contents
| | | | |
| |
Performance | | | 2 | |
| |
Fund Profile | | | 3 | |
| |
Endnotes and Additional Disclosures | | | 4 | |
| |
Fund Expenses | | | 5 | |
| |
Financial Statements | | | 6 | |
| |
Board of Trustees’ Contract Approval | | | 30 | |
| |
Officers and Trustees | | | 33 | |
| |
Important Notices | | | 34 | |
Parametric International Equity Fund
July 31, 2015
Performance1,2
Portfolio Managers Thomas Seto and Paul Bouchey, CFA, each of Parametric Portfolio Associates LLC
| | | | | | | | | | | | | | | | | | | | | | | | |
| % Average Annual Total Returns | | Class Inception Date | | | Performance
Inception Date | | | Six Months | | | One Year | | | Five Years | | | Since
Inception | |
Investor Class at NAV | | | 04/01/2010 | | | | 04/01/2010 | | | | 7.09 | % | | | 0.76 | % | | | 7.73 | % | | | 6.39 | % |
Institutional Class at NAV | | | 04/01/2010 | | | | 04/01/2010 | | | | 7.26 | | | | 0.99 | | | | 8.00 | | | | 6.66 | |
MSCI EAFE Index | | | — | | | | — | | | | 7.19 | % | | | –0.28 | % | | | 8.01 | % | | | 6.29 | % |
| | | | | | |
| | | | | | | | | | | | | | | | | | | | | | | | |
| % Total Annual Operating Expense Ratios3 | | | | | | | | | | | | | | Investor
Class | | | Institutional
Class | |
Gross | | | | | | | | | | | | | | | | | | | 1.19 | % | | | 0.94 | % |
Net | | | | | | | | | | | | | | | | | | | 0.90 | | | | 0.65 | |
See Endnotes and Additional Disclosures in this report.
Past performance is no guarantee of future results. Returns are historical and are calculated by determining the percentage change in net asset value (NAV) or offering price (as applicable) with all distributions reinvested. Investment return and principal value will fluctuate so that shares, when redeemed, may be worth more or less than their original cost. Performance less than one year is cumulative. Performance is for the stated time period only; due to market volatility, the Fund’s current performance may be lower or higher than quoted. Returns are before taxes unless otherwise noted. For performance as of the most recent month-end, please refer to eatonvance.com.
Parametric International Equity Fund
July 31, 2015
Fund Profile
Sector Allocation (% of net assets)4
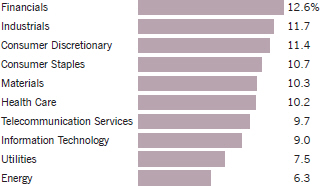
Geographic Allocation (% of common stocks)
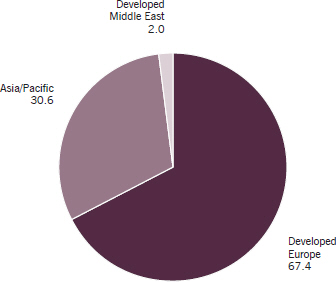
Top 10 Holdings (% of net assets)4
| | | | |
Vodafone Group PLC | | | 1.1 | % |
Nestle SA | | | 1.1 | |
Novartis AG | | | 1.0 | |
Royal Dutch Shell PLC, Class A | | | 0.8 | |
National Grid PLC | | | 0.8 | |
Iliad SA | | | 0.8 | |
Telstra Corp., Ltd. | | | 0.8 | |
Compagnie Financiere Richemont SA, Class A | | | 0.8 | |
Deutsche Telekom AG | | | 0.8 | |
Total SA | | | 0.7 | |
Total | | | 8.7 | % |
See Endnotes and Additional Disclosures in this report.
Parametric International Equity Fund
July 31, 2015
Endnotes and Additional Disclosures
| 1 | MSCI EAFE Index is an unmanaged index of equities in the developed markets, excluding the U.S. and Canada. MSCI indexes are net of foreign withholding taxes. Source: MSCI. MSCI data may not be reproduced or used for any other purpose. MSCI provides no warranties, has not prepared or approved this report, and has no liability hereunder. Unless otherwise stated, index returns do not reflect the effect of any applicable sales charges, commissions, expenses, taxes or leverage, as applicable. It is not possible to invest directly in an index. |
| 2 | Returns are historical and are calculated by determining the percentage change in NAV with all distributions reinvested. Unless otherwise stated, performance does not reflect the deduction of taxes on Fund distributions or redemptions of Fund shares. Performance since inception for an index, if presented, is the performance since the Fund’s or oldest share class’ inception, as applicable. |
| 3 | Source: Fund prospectus. Net expense ratio reflects a contractual expense reimbursement that continues through 8/10/16. Without the reimbursement, if applicable, performance would have been lower. |
| 4 | Excludes cash and cash equivalents. |
| | Fund profile subject to change due to active management. |
Parametric International Equity Fund
July 31, 2015
Fund Expenses
Example: As a Fund shareholder, you incur two types of costs: (1) transaction costs, including sales charges (loads) on purchases and redemption fees (if applicable); and (2) ongoing costs, including management fees; distribution and/or service fees; and other Fund expenses. This Example is intended to help you understand your ongoing costs (in dollars) of Fund investing and to compare these costs with the ongoing costs of investing in other mutual funds. The Example is based on an investment of $1,000 invested at the beginning of the period and held for the entire period (February 1, 2015 – July 31, 2015).
Actual Expenses: The first section of the table below provides information about actual account values and actual expenses. You may use the information in this section, together with the amount you invested, to estimate the expenses that you paid over the period. Simply divide your account value by $1,000 (for example, an $8,600 account value divided by $1,000 = 8.6), then multiply the result by the number in the first section under the heading entitled “Expenses Paid During Period” to estimate the expenses you paid on your account during this period.
Hypothetical Example for Comparison Purposes: The second section of the table below provides information about hypothetical account values and hypothetical expenses based on the actual Fund expense ratio and an assumed rate of return of 5% per year (before expenses), which is not the actual Fund return. The hypothetical account values and expenses may not be used to estimate the actual ending account balance or expenses you paid for the period. You may use this information to compare the ongoing costs of investing in your Fund and other funds. To do so, compare this 5% hypothetical example with the 5% hypothetical examples that appear in the shareholder reports of the other funds.
Please note that the expenses shown in the table are meant to highlight your ongoing costs only and do not reflect any transactional costs, such as sales charges (loads) or redemption fees (if applicable). Therefore, the second section of the table is useful in comparing ongoing costs only, and will not help you determine the relative total costs of owning different funds. In addition, if these transactional costs were included, your costs would be higher.
| | | | | | | | | | | | | | | | |
| | | Beginning
Account Value
(2/1/15) | | | Ending
Account Value
(7/31/15) | | | Expenses Paid
During Period*
(2/1/15 – 7/31/15) | | | Annualized
Expense
Ratio | |
| | | | |
| | | | | | | | | | | | | | | | |
Actual | | | | | | | | | | | | | |
Investor Class | | $ | 1,000.00 | | | $ | 1,070.90 | | | $ | 4.62 | ** | | | 0.90 | % |
Institutional Class | | $ | 1,000.00 | | | $ | 1,072.60 | | | $ | 3.34 | ** | | | 0.65 | % |
| | | | | | | | | | | | | | | | | |
| | | | |
| | | | | | | | | | | | | | | | |
Hypothetical | | | | | | | | | | | | | |
(5% return per year before expenses) | | | | | | | | | | | | | |
Investor Class | | $ | 1,000.00 | | | $ | 1,020.30 | | | $ | 4.51 | ** | | | 0.90 | % |
Institutional Class | | $ | 1,000.00 | | | $ | 1,021.60 | | | $ | 3.26 | ** | | | 0.65 | % |
| * | Expenses are equal to the Fund’s annualized expense ratio for the indicated Class, multiplied by the average account value over the period, multiplied by 181/365 (to reflect the one-half year period). The Example assumes that the $1,000 was invested at the net asset value per share determined at the close of business on January 31, 2015. |
| ** | Absent an allocation of certain expenses to affiliates, the expenses would be higher. |
Parametric International Equity Fund
July 31, 2015
Portfolio of Investments (Unaudited)
| | | | | | | | |
| Common Stocks — 99.4% | |
| | |
| | | | | | | | |
| Security | | Shares | | | Value | |
| | | | | | | | |
|
Australia — 7.9% | |
AGL Energy, Ltd. | | | 27,033 | | | $ | 328,945 | |
Amalgamated Holdings, Ltd. | | | 3,962 | | | | 36,478 | |
Amcor, Ltd. | | | 10,892 | | | | 114,449 | |
Ansell, Ltd. | | | 2,656 | | | | 48,551 | |
APA Group | | | 44,180 | | | | 292,320 | |
APN News & Media, Ltd.(1) | | | 27,358 | | | | 14,261 | |
ARB Corp., Ltd. | | | 2,740 | | | | 28,416 | |
Ardent Leisure Group | | | 12,741 | | | | 22,493 | |
Aristocrat Leisure, Ltd. | | | 13,434 | | | | 84,033 | |
Asciano, Ltd. | | | 19,164 | | | | 113,761 | |
Aurizon Holdings, Ltd. | | | 9,545 | | | | 36,895 | |
AusNet Services | | | 38,579 | | | | 39,191 | |
Australia and New Zealand Banking Group, Ltd. | | | 8,138 | | | | 194,079 | |
Automotive Holdings Group, Ltd. | | | 8,319 | | | | 26,707 | |
Beach Energy, Ltd. | | | 39,630 | | | | 28,120 | |
Bega Cheese, Ltd. | | | 6,296 | | | | 21,861 | |
BHP Billiton, Ltd. | | | 23,969 | | | | 462,779 | |
Boral, Ltd. | | | 6,180 | | | | 29,936 | |
Brambles, Ltd. | | | 25,682 | | | | 203,719 | |
Breville Group, Ltd. | | | 3,592 | | | | 17,916 | |
Caltex Australia, Ltd. | | | 5,221 | | | | 131,523 | |
Cardno, Ltd. | | | 9,576 | | | | 20,027 | |
carsales.com, Ltd. | | | 10,059 | | | | 79,626 | |
Coca-Cola Amatil, Ltd. | | | 12,701 | | | | 85,984 | |
Commonwealth Bank of Australia | | | 4,269 | | | | 272,594 | |
Computershare, Ltd. | | | 18,612 | | | | 167,883 | |
CSL, Ltd. | | | 8,437 | | | | 609,507 | |
CSR, Ltd. | | | 13,956 | | | | 38,083 | |
Dexus Property Group | | | 10,799 | | | | 61,282 | |
Domino’s Pizza Enterprises, Ltd. | | | 1,673 | | | | 49,342 | |
Drillsearch Energy, Ltd.(1) | | | 92,745 | | | | 59,815 | |
DUET Group | | | 43,561 | | | | 69,995 | |
Echo Entertainment Group, Ltd. | | | 16,693 | | | | 61,120 | |
ERM Power, Ltd. | | | 12,209 | | | | 19,187 | |
Federation Centres | | | 34,152 | | | | 74,744 | |
Goodman Group | | | 4,772 | | | | 22,758 | |
GPT Group (The) | | | 15,885 | | | | 53,395 | |
GrainCorp, Ltd., Class A | | | 8,239 | | | | 53,653 | |
GUD Holdings, Ltd. | | | 3,393 | | | | 23,167 | |
GWA Group, Ltd. | | | 11,240 | | | | 19,912 | |
Harvey Norman Holdings, Ltd. | | | 24,339 | | | | 79,167 | |
Healthscope, Ltd. | | | 21,535 | | | | 43,015 | |
Incitec Pivot, Ltd. | | | 11,121 | | | | 29,383 | |
Invocare, Ltd. | | | 3,082 | | | | 30,399 | |
| | | | | | | | |
| Security | | Shares | | | Value | |
| | | | | | | | |
|
Australia (continued) | |
IRESS, Ltd. | | | 9,077 | | | $ | 68,873 | |
iSentia Group, Ltd. | | | 12,985 | | | | 33,073 | |
James Hardie Industries PLC CDI | | | 4,080 | | | | 56,426 | |
JB Hi-Fi, Ltd. | | | 2,369 | | | | 33,381 | |
Macquarie Atlas Roads Group | | | 13,855 | | | | 34,571 | |
McMillan Shakespeare, Ltd. | | | 2,231 | | | | 23,200 | |
Mirvac Group | | | 42,165 | | | | 58,090 | |
Myer Holdings, Ltd. | | | 43,985 | | | | 40,337 | |
MYOB Group, Ltd.(1) | | | 20,236 | | | | 52,373 | |
National Australia Bank, Ltd. | | | 2,718 | | | | 68,980 | |
Navitas, Ltd. | | | 7,563 | | | | 22,774 | |
New Hope Corp., Ltd. | | | 11,960 | | | | 16,700 | |
Newcrest Mining, Ltd.(1) | | | 6,314 | | | | 52,227 | |
Nine Entertainment Co. Holdings, Ltd. | | | 20,195 | | | | 22,539 | |
Oil Search, Ltd. | | | 25,401 | | | | 138,187 | |
Origin Energy, Ltd. | | | 21,736 | | | | 179,857 | |
Orora, Ltd. | | | 13,920 | | | | 23,681 | |
Premier Investments, Ltd. | | | 3,446 | | | | 33,548 | |
Primary Health Care, Ltd. | | | 7,957 | | | | 26,716 | |
Prime Media Group, Ltd. | | | 32,363 | | | | 15,350 | |
Ramsay Health Care, Ltd. | | | 3,014 | | | | 147,014 | |
Recall Holdings, Ltd. | | | 7,050 | | | | 36,968 | |
Retail Food Group, Ltd. | | | 8,090 | | | | 31,500 | |
Rio Tinto, Ltd. | | | 3,174 | | | | 121,936 | |
SAI Global, Ltd. | | | 7,632 | | | | 24,993 | |
Scentre Group | | | 14,175 | | | | 40,936 | |
Sonic Healthcare, Ltd. | | | 9,334 | | | | 140,833 | |
South32, Ltd.(1) | | | 62,350 | | | | 81,351 | |
Southern Cross Media Group, Ltd. | | | 25,786 | | | | 18,162 | |
Spark Infrastructure Group | | | 43,233 | | | | 61,051 | |
Spotless Group Holdings, Ltd. | | | 21,982 | | | | 31,375 | |
Stockland | | | 7,062 | | | | 21,889 | |
STW Communications Group, Ltd. | | | 74,259 | | | | 40,954 | |
Suncorp Group, Ltd. | | | 8,470 | | | | 88,172 | |
Super Retail Group, Ltd. | | | 3,746 | | | | 25,212 | |
Sydney Airport | | | 30,374 | | | | 124,372 | |
Tabcorp Holdings, Ltd. | | | 22,318 | | | | 78,854 | |
Tatts Group, Ltd. | | | 45,995 | | | | 133,575 | |
Technology One, Ltd. | | | 15,700 | | | | 45,689 | |
Telstra Corp., Ltd. | | | 193,394 | | | | 915,737 | |
Tox Free Solutions, Ltd. | | | 9,194 | | | | 19,452 | |
Transpacific Industries Group, Ltd. | | | 55,685 | | | | 28,804 | |
Transurban Group | | | 33,410 | | | | 243,171 | |
Treasury Wine Estates, Ltd. | | | 8,985 | | | | 37,756 | |
Veda Group, Ltd. | | | 21,772 | | | | 38,913 | |
Village Roadshow, Ltd. | | | 4,552 | | | | 21,334 | |
| | | | |
| | 6 | | See Notes to Financial Statements. |
Parametric International Equity Fund
July 31, 2015
Portfolio of Investments (Unaudited) — continued
| | | | | | | | |
| Security | | Shares | | | Value | |
| | | | | | | | |
|
Australia (continued) | |
Vocus Communications, Ltd. | | | 11,297 | | | $ | 50,848 | |
Washington H. Soul Pattinson & Co., Ltd. | | | 5,073 | | | | 50,789 | |
Wesfarmers, Ltd. | | | 13,792 | | | | 426,884 | |
Westfield Corp. | | | 5,863 | | | | 42,881 | |
Westpac Banking Corp. | | | 9,340 | | | | 237,481 | |
Whitehaven Coal, Ltd.(1) | | | 54,939 | | | | 47,963 | |
Woodside Petroleum, Ltd. | | | 14,034 | | | | 364,907 | |
Woolworths, Ltd. | | | 18,499 | | | | 385,939 | |
| | | | | | | | | |
| | | | | | $ | 9,509,049 | |
| | | | | | | | | |
|
Austria — 1.0% | |
ams AG | | | 4,147 | | | $ | 179,828 | |
Andritz AG | | | 1,285 | | | | 71,669 | |
CA Immobilien Anlagen AG | | | 1,562 | | | | 28,091 | |
Conwert Immobilien Invest SE(1) | | | 2,111 | | | | 25,630 | |
DO & Co. AG | | | 559 | | | | 58,351 | |
EVN AG | | | 2,151 | | | | 24,262 | |
Flughafen Wien AG | | | 562 | | | | 48,499 | |
Immofinanz AG(1) | | | 26,800 | | | | 65,824 | |
Oesterreichische Post AG | | | 1,018 | | | | 45,480 | |
OMV AG | | | 5,459 | | | | 145,075 | |
Porr AG | | | 788 | | | | 23,097 | |
Raiffeisen Bank International AG(1) | | | 2,576 | | | | 37,755 | |
RHI AG | | | 858 | | | | 21,288 | |
Schoeller-Bleckmann Oilfield Equipment AG | | | 688 | | | | 38,911 | |
Telekom Austria AG | | | 7,553 | | | | 51,099 | |
UNIQA Insurance Group AG | | | 2,146 | | | | 20,279 | |
Verbund AG | | | 6,179 | | | | 95,692 | |
Vienna Insurance Group | | | 607 | | | | 20,935 | |
Voestalpine AG | | | 3,799 | | | | 162,888 | |
| | | | | | | | | |
| | | | | | $ | 1,164,653 | |
| | | | | | | | | |
|
Belgium — 1.9% | |
Ackermans & van Haaren NV | | | 418 | | | $ | 63,919 | |
Ageas | | | 1,632 | | | | 67,194 | |
Agfa-Gevaert NV(1) | | | 9,696 | | | | 29,211 | |
Anheuser-Busch InBev NV | | | 3,174 | | | | 379,235 | |
Barco NV | | | 628 | | | | 41,557 | |
Befimmo SCA Sicafi | | | 400 | | | | 25,345 | |
Bekaert SA | | | 730 | | | | 21,343 | |
bpost SA | | | 4,751 | | | | 134,451 | |
Cofinimmo | | | 337 | | | | 36,203 | |
Colruyt SA | | | 793 | | | | 38,500 | |
Compagnie d’Entreprises CFE | | | 570 | | | | 76,061 | |
D’Ieteren SA NV | | | 858 | | | | 31,389 | |
| | | | | | | | |
| Security | | Shares | | | Value | |
| | | | | | | | |
|
Belgium (continued) | |
Econocom Group SA/NV | | | 2,876 | | | $ | 26,592 | |
Elia System Operator SA NV | | | 1,508 | | | | 63,235 | |
Euronav SA | | | 2,461 | | | | 37,594 | |
EVS Broadcast Equipment SA | | | 507 | | | | 14,306 | |
Fagron | | | 1,218 | | | | 57,206 | |
Galapagos NV(1) | | | 1,186 | | | | 71,157 | |
Groupe Bruxelles Lambert SA | | | 1,247 | | | | 102,907 | |
Melexis NV | | | 557 | | | | 29,800 | |
Nyrstar NV(1) | | | 6,856 | | | | 20,155 | |
Ontex Group NV | | | 1,200 | | | | 36,450 | |
Proximus | | | 6,399 | | | | 241,218 | |
Sofina SA | | | 347 | | | | 40,003 | |
Solvay SA | | | 1,196 | | | | 160,004 | |
Telenet Group Holding NV(1) | | | 3,343 | | | | 188,683 | |
Tessenderlo Chemie NV(1) | | | 739 | | | | 28,971 | |
UCB SA | | | 2,350 | | | | 181,836 | |
Umicore SA | | | 1,929 | | | | 84,506 | |
| | | | | | | | | |
| | | | | | $ | 2,329,031 | |
| | | | | | | | | |
|
Denmark — 1.9% | |
A.P. Moller-Maersk A/S, Class A | | | 39 | | | $ | 64,461 | |
A.P. Moller-Maersk A/S, Class B | | | 54 | | | | 91,994 | |
Bakkafrost P/F | | | 1,915 | | | | 58,133 | |
Carlsberg A/S, Class B | | | 2,872 | | | | 250,224 | |
Chr Hansen Holding A/S | | | 2,107 | | | | 116,429 | |
Coloplast A/S, Class B | | | 475 | | | | 34,275 | |
Danske Bank A/S | | | 7,600 | | | | 237,610 | |
DSV A/S | | | 2,805 | | | | 96,014 | |
GN Store Nord A/S | | | 898 | | | | 18,266 | |
ISS A/S | | | 890 | | | | 30,711 | |
Matas AS | | | 1,465 | | | | 30,215 | |
Novo Nordisk A/S, Class B | | | 5,242 | | | | 309,364 | |
Novozymes A/S, Class B | | | 5,006 | | | | 261,671 | |
Pandora A/S | | | 2,848 | | | | 320,695 | |
Royal Unibrew A/S | | | 945 | | | | 30,925 | |
SimCorp A/S | | | 1,201 | | | | 51,275 | |
TDC A/S | | | 26,972 | | | | 203,470 | |
Topdanmark A/S(1) | | | 1,346 | | | | 37,194 | |
Tryg A/S | | | 3,425 | | | | 68,935 | |
William Demant Holding A/S(1) | | | 198 | | | | 15,098 | |
| | | | | | | | | |
| | | | | | $ | 2,326,959 | |
| | | | | | | | | |
|
Finland — 2.0% | |
Amer Sports Oyj | | | 3,707 | | | $ | 108,122 | |
Elisa Oyj | | | 8,462 | | | | 284,895 | |
| | | | |
| | 7 | | See Notes to Financial Statements. |
Parametric International Equity Fund
July 31, 2015
Portfolio of Investments (Unaudited) — continued
| | | | | | | | |
| Security | | Shares | | | Value | |
| | | | | | | | |
|
Finland (continued) | |
Fiskars Oyj Abp | | | 2,200 | | | $ | 46,933 | |
Fortum Oyj | | | 12,481 | | | | 219,150 | |
Huhtamaki Oyj | | | 1,924 | | | | 68,280 | |
Kesko Oyj, Class B | | | 5,825 | | | | 226,729 | |
Kone Oyj, Class B | | | 2,308 | | | | 96,859 | |
Metsa Board Oyj | | | 3,454 | | | | 24,609 | |
Neste Oyj | | | 7,267 | | | | 202,467 | |
Nokia Oyj | | | 29,895 | | | | 211,696 | |
Nokian Renkaat Oyj | | | 2,076 | | | | 62,388 | |
Oriola-KD Oyj, Series B(1) | | | 6,575 | | | | 32,011 | |
Orion Oyj, Class B | | | 5,220 | | | | 217,923 | |
Sampo Oyj, Class A | | | 4,572 | | | | 226,226 | |
Sanoma Oyj | | | 6,906 | | | | 25,264 | |
Sponda Oyj | | | 5,906 | | | | 23,529 | |
Tieto Oyj | | | 900 | | | | 23,045 | |
UPM-Kymmene Oyj | | | 7,890 | | | | 145,742 | |
Uponor Oyj | | | 1,690 | | | | 26,794 | |
Valmet Oyj | | | 2,592 | | | | 30,676 | |
Wartsila Oyj | | | 1,458 | | | | 67,016 | |
| | | | | | | | | |
| | | | | | $ | 2,370,354 | |
| | | | | | | | | |
|
France — 7.9% | |
Accor SA | | | 1,838 | | | $ | 90,105 | |
ADP | | | 489 | | | | 58,623 | |
Air Liquide SA | | | 5,622 | | | | 732,070 | |
Airbus Group SE | | | 2,312 | | | | 164,118 | |
Alstom SA(1) | | | 1,526 | | | | 44,818 | |
Alten SA | | | 1,223 | | | | 61,633 | |
Altran Technologies SA | | | 4,114 | | | | 48,576 | |
Atos | | | 1,902 | | | | 144,526 | |
BNP Paribas SA | | | 4,318 | | | | 280,874 | |
Bouygues SA | | | 1,412 | | | | 51,870 | |
Cap Gemini SA | | | 2,239 | | | | 213,895 | |
Christian Dior SE | | | 490 | | | | 101,355 | |
CNP Assurances | | | 2,298 | | | | 38,622 | |
Danone SA | | | 4,390 | | | | 297,828 | |
Dassault Systemes SA | | | 2,724 | | | | 205,412 | |
Edenred | | | 900 | | | | 22,433 | |
Engie | | | 33,939 | | | | 650,865 | |
Eramet(1) | | | 796 | | | | 52,424 | |
Essilor International SA | | | 1,353 | | | | 173,292 | |
Euler Hermes SA | | | 307 | | | | 31,984 | |
Eurazeo SA | | | 700 | | | | 45,490 | |
Eutelsat Communications SA | | | 525 | | | | 16,000 | |
Fonciere des Regions | | | 629 | | | | 54,313 | |
GameLoft SE(1) | | | 5,348 | | | | 25,292 | |
| | | | | | | | |
| Security | | Shares | | | Value | |
| | | | | | | | |
|
France (continued) | |
Gecina SA | | | 349 | | | $ | 44,685 | |
Groupe Eurotunnel SE | | | 4,517 | | | | 64,895 | |
Hermes International | | | 100 | | | | 38,888 | |
ICADE | | | 448 | | | | 33,213 | |
Iliad SA | | | 3,993 | | | | 948,258 | |
Imerys SA | | | 1,811 | | | | 136,442 | |
Ingenico Group | | | 1,085 | | | | 142,117 | |
Kering SA | | | 354 | | | | 68,172 | |
Klepierre | | | 1,536 | | | | 69,886 | |
Korian SA | | | 564 | | | | 20,102 | |
L’Oreal SA | | | 1,885 | | | | 352,331 | |
Lagardere SCA | | | 1,608 | | | | 48,090 | |
Legrand SA | | | 1,439 | | | | 88,523 | |
LVMH Moet Hennessy Louis Vuitton SE | | | 1,313 | | | | 245,608 | |
Natixis SA | | | 8,039 | | | | 59,000 | |
Neopost SA | | | 1,240 | | | | 49,810 | |
Orpea | | | 324 | | | | 24,452 | |
Pernod-Ricard SA | | | 1,754 | | | | 209,809 | |
Publicis Groupe SA | | | 996 | | | | 75,325 | |
Remy Cointreau SA | | | 963 | | | | 68,444 | |
Rexel SA | | | 1,252 | | | | 19,717 | |
Rubis SCA | | | 2,785 | | | | 200,171 | |
Safran SA | | | 1,656 | | | | 125,377 | |
Sanofi | | | 6,770 | | | | 729,746 | |
SCOR SE | | | 1,975 | | | | 75,683 | |
Societe BIC SA | | | 432 | | | | 73,972 | |
Sodexo SA | | | 863 | | | | 80,380 | |
Sopra Steria Group | | | 432 | | | | 41,273 | |
Suez Environnement Co. SA | | | 4,251 | | | | 81,475 | |
Technip SA | | | 2,280 | | | | 129,556 | |
Thales SA | | | 1,044 | | | | 70,551 | |
Total SA | | | 17,486 | | | | 862,811 | |
Unibail-Rodamco SE | | | 496 | | | | 131,839 | |
Vicat | | | 726 | | | | 53,993 | |
Vinci SA | | | 2,031 | | | | 130,163 | |
Vivendi SA | | | 6,567 | | | | 172,560 | |
Wendel SA | | | 480 | | | | 63,911 | |
Zodiac Aerospace | | | 1,509 | | | | 44,980 | |
| | | | | | | | | |
| | | | | | $ | 9,482,626 | |
| | | | | | | | | |
|
Germany — 7.8% | |
Adidas AG | | | 1,352 | | | $ | 110,637 | |
Allianz SE | | | 2,469 | | | | 404,453 | |
alstria office REIT AG | | | 2,172 | | | | 30,000 | |
BASF SE | | | 5,928 | | | | 512,266 | |
| | | | |
| | 8 | | See Notes to Financial Statements. |
Parametric International Equity Fund
July 31, 2015
Portfolio of Investments (Unaudited) — continued
| | | | | | | | |
| Security | | Shares | | | Value | |
| | | | | | | | |
|
Germany (continued) | |
Bayer AG | | | 4,855 | | | $ | 716,969 | |
Bayerische Motoren Werke AG | | | 1,708 | | | | 171,271 | |
Bayerische Motoren Werke AG, PFC Shares | | | 687 | | | | 53,772 | |
Beiersdorf AG | | | 2,901 | | | | 247,860 | |
Bilfinger SE | | | 1,287 | | | | 53,157 | |
Brenntag AG | | | 2,480 | | | | 137,913 | |
Celesio AG | | | 843 | | | | 24,573 | |
Continental AG | | | 614 | | | | 137,268 | |
Deutsche Annington Immobilien SE | | | 1,673 | | | | 52,197 | |
Deutsche Boerse AG | | | 923 | | | | 83,846 | |
Deutsche EuroShop AG | | | 619 | | | | 27,666 | |
Deutsche Telekom AG | | | 49,948 | | | | 903,182 | |
Deutsche Wohnen AG | | | 3,834 | | | | 94,593 | |
E.ON SE | | | 54,364 | | | | 717,946 | |
Fraport AG | | | 1,039 | | | | 68,218 | |
Fresenius Medical Care AG & Co. KGaA | | | 1,217 | | | | 99,578 | |
Fresenius SE & Co. KGaA | | | 1,869 | | | | 129,327 | |
Fuchs Petrolub SE, PFC Shares | | | 490 | | | | 21,295 | |
Gerresheimer AG | | | 360 | | | | 26,491 | |
Grand City Properties SA | | | 1,598 | | | | 27,627 | |
Hannover Rueck SE | | | 760 | | | | 80,686 | |
Henkel AG & Co. KGaA | | | 1,664 | | | | 167,825 | |
Henkel AG & Co. KGaA, PFC Shares | | | 4,002 | | | | 474,421 | |
Hugo Boss AG | | | 623 | | | | 75,119 | |
Jenoptik AG | | | 3,183 | | | | 41,619 | |
K&S AG | | | 1,896 | | | | 77,793 | |
Kabel Deutschland Holding AG(1) | | | 314 | | | | 42,614 | |
KION Group AG | | | 588 | | | | 26,945 | |
Krones AG | | | 267 | | | | 30,781 | |
KWS Saat SE | | | 176 | | | | 57,227 | |
LANXESS AG | | | 989 | | | | 57,112 | |
LEG Immobilien AG | | | 453 | | | | 32,966 | |
Linde AG | | | 1,381 | | | | 260,641 | |
MAN AG | | | 882 | | | | 91,967 | |
Merck KGaA | | | 594 | | | | 60,448 | |
MTU Aero Engines AG | | | 1,070 | | | | 98,546 | |
Muenchener Rueckversicherungs-Gesellschaft AG | | | 977 | | | | 179,552 | |
Nemetschek AG | | | 1,372 | | | | 50,760 | |
Porsche Automobil Holding SE, PFC Shares | | | 1,013 | | | | 76,351 | |
ProSiebenSat.1 Media SE | | | 2,109 | | | | 107,819 | |
Rational AG | | | 70 | | | | 27,313 | |
RWE AG | | | 14,435 | | | | 300,632 | |
SAP SE | | | 9,783 | | | | 702,841 | |
Siemens AG | | | 4,885 | | | | 523,408 | |
Software AG | | | 3,450 | | | | 103,223 | |
Stada Arzneimittel AG | | | 691 | | | | 26,598 | |
| | | | | | | | |
| Security | | Shares | | | Value | |
| | | | | | | | |
|
Germany (continued) | |
Suedzucker AG | | | 4,770 | | | $ | 78,673 | |
Symrise AG | | | 1,375 | | | | 91,420 | |
TAG Immobilien AG | | | 2,395 | | | | 27,071 | |
Talanx AG(1) | | | 794 | | | | 25,336 | |
Telefonica Deutschland Holdings AG | | | 18,638 | | | | 115,595 | |
TUI AG | | | 1,983 | | | | 34,063 | |
Volkswagen AG | | | 452 | | | | 91,424 | |
Volkswagen AG, PFC Shares | | | 642 | | | | 128,768 | |
Wacker Chemie AG | | | 535 | | | | 53,719 | |
Wirecard AG | | | 2,865 | | | | 113,519 | |
| | | | | | | | | |
| | | | | | $ | 9,386,900 | |
| | | | | | | | | |
|
Hong Kong — 4.0% | |
AIA Group, Ltd. | | | 27,200 | | | $ | 177,274 | |
Alibaba Health Information Technology, Ltd.(1) | | | 86,000 | | | | 79,765 | |
ASM Pacific Technology, Ltd. | | | 8,700 | | | | 78,819 | |
Bank of East Asia, Ltd. (The) | | | 17,600 | | | | 71,278 | |
Bloomage BioTechnology Corp, Ltd. | | | 10,000 | | | | 18,073 | |
BOC Hong Kong (Holdings), Ltd. | | | 18,000 | | | | 72,385 | |
Brightoil Petroleum Holdings, Ltd.(1) | | | 103,000 | | | | 37,807 | |
Cafe de Coral Holdings, Ltd. | | | 6,000 | | | | 21,045 | |
Cathay Pacific Airways, Ltd. | | | 11,000 | | | | 25,999 | |
Cheung Kong Infrastructure Holdings, Ltd. | | | 14,000 | | | | 121,468 | |
Cheung Kong Property Holdings, Ltd.(1) | | | 18,996 | | | | 158,294 | |
China Innovationpay Group, Ltd.(1) | | | 484,000 | | | | 42,429 | |
China Regenerative Medicine International, Ltd.(1) | | | 765,000 | | | | 47,338 | |
China Traditional Chinese Medicine Co., Ltd.(1) | | | 68,000 | | | | 51,431 | |
Chow Sang Sang Holdings International, Ltd. | | | 12,000 | | | | 23,231 | |
CK Hutchison Holdings, Ltd. | | | 23,996 | | | | 356,184 | |
CLP Holdings, Ltd. | | | 29,500 | | | | 250,149 | |
Dairy Farm International Holdings, Ltd. | | | 12,600 | | | | 104,134 | |
Esprit Holdings, Ltd. | | | 72,700 | | | | 69,765 | |
Fosun International, Ltd. | | | 59,000 | | | | 124,296 | |
G-Resources Group, Ltd. | | | 852,000 | | | | 25,190 | |
Galaxy Entertainment Group, Ltd. | | | 30,000 | | | | 137,953 | |
GCL New Energy Holdings, Ltd.(1) | | | 224,000 | | | | 15,854 | |
Global Brands Group Holdings, Ltd.(1) | | | 126,000 | | | | 27,922 | |
Hang Lung Group, Ltd. | | | 5,000 | | | | 22,601 | |
Hang Lung Properties, Ltd. | | | 10,000 | | | | 28,687 | |
Hang Seng Bank, Ltd. | | | 4,800 | | | | 98,461 | |
Hao Tian Development Group, Ltd.(1) | | | 534,000 | | | | 51,763 | |
Henderson Land Development Co., Ltd. | | | 6,050 | | | | 39,998 | |
HK Electric Investments & HK Electric Investments, Ltd.(2) | | | 144,000 | | | | 99,929 | |
HKT Trust and HKT, Ltd. | | | 140,000 | | | | 170,418 | |
Honbridge Holdings, Ltd.(1) | | | 122,000 | | | | 21,084 | |
Hong Kong Exchanges and Clearing, Ltd. | | | 3,700 | | | | 100,492 | |
| | | | |
| | 9 | | See Notes to Financial Statements. |
Parametric International Equity Fund
July 31, 2015
Portfolio of Investments (Unaudited) — continued
| | | | | | | | |
| Security | | Shares | | | Value | |
| | | | | | | | |
|
Hong Kong (continued) | |
Hongkong Land Holdings, Ltd. | | | 4,000 | | | $ | 30,776 | |
Hopewell Holdings, Ltd. | | | 19,500 | | | | 67,269 | |
IGG, Inc. | | | 53,000 | | | | 26,258 | |
Jardine Matheson Holdings, Ltd. | | | 2,800 | | | | 152,071 | |
Jardine Strategic Holdings, Ltd. | | | 2,000 | | | | 60,079 | |
Kingston Financial Group, Ltd. | | | 158,000 | | | | 57,371 | |
Kong Sun Holdings, Ltd.(1) | | | 500,000 | | | | 67,006 | |
KuangChi Science, Ltd.(1) | | | 135,000 | | | | 34,392 | |
Lee’s Pharmaceutical Holdings, Ltd. | | | 9,500 | | | | 15,981 | |
Li & Fung, Ltd. | | | 104,000 | | | | 80,584 | |
Lifestyle International Holdings, Ltd. | | | 11,000 | | | | 17,936 | |
Link REIT (The) | | | 19,000 | | | | 111,702 | |
Macau Legend Development, Ltd.(1) | | | 79,000 | | | | 21,474 | |
Man Wah Holdings, Ltd. | | | 15,600 | | | | 14,016 | |
MGM China Holdings, Ltd. | | | 8,400 | | | | 17,799 | |
MTR Corp., Ltd. | | | 19,000 | | | | 84,588 | |
NWS Holdings, Ltd. | | | 17,000 | | | | 25,421 | |
Pacific Textiles Holdings, Ltd. | | | 15,000 | | | | 23,816 | |
PAX Global Technology, Ltd.(1) | | | 55,000 | | | | 88,097 | |
PCCW, Ltd. | | | 187,000 | | | | 111,907 | |
Power Assets Holdings, Ltd. | | | 25,500 | | | | 240,032 | |
Sands China, Ltd. | | | 25,200 | | | | 111,214 | |
Shangri-La Asia, Ltd. | | | 18,000 | | | | 23,181 | |
Sino Land Co., Ltd. | | | 22,000 | | | | 34,193 | |
Sino Oil and Gas Holdings, Ltd.(1) | | | 1,125,000 | | | | 24,371 | |
SJM Holdings, Ltd. | | | 20,000 | | | | 23,265 | |
Stella International Holdings, Ltd. | | | 9,500 | | | | 25,594 | |
Sun Hung Kai Properties, Ltd. | | | 5,000 | | | | 76,724 | |
Superb Summit International Group, Ltd.(1)(3) | | | 230,000 | | | | 0 | |
Swire Pacific, Ltd., Class A | | | 3,000 | | | | 38,459 | |
Television Broadcasts, Ltd. | | | 4,600 | | | | 24,241 | |
Texwinca Holdings, Ltd. | | | 18,000 | | | | 21,765 | |
Town Health International Medical Group, Ltd. | | | 120,000 | | | | 27,389 | |
VTech Holdings, Ltd. | | | 10,200 | | | | 126,895 | |
Wynn Macau, Ltd. | | | 18,400 | | | | 37,946 | |
Yue Yuen Industrial Holdings, Ltd. | | | 10,000 | | | | 32,550 | |
| | | | | | | | | |
| | | | | | $ | 4,747,878 | |
| | | | | | | | | |
|
Ireland — 2.0% | |
Bank of Ireland(1) | | | 626,258 | | | $ | 263,018 | |
CRH PLC | | | 12,123 | | | | 358,559 | |
Dalata Hotel Group PLC(1) | | | 11,357 | | | | 52,161 | |
DCC PLC | | | 2,167 | | | | 171,245 | |
Dragon Oil PLC | | | 11,128 | | | | 127,332 | |
FBD Holdings PLC | | | 1,257 | | | | 10,564 | |
FleetMatics Group PLC(1) | | | 5,094 | | | | 243,850 | |
| | | | | | | | |
| Security | | Shares | | | Value | |
| | | | | | | | |
|
Ireland (continued) | |
Fly Leasing, Ltd. ADR | | | 2,161 | | | $ | 32,501 | |
Glanbia PLC | | | 5,942 | | | | 123,905 | |
Grafton Group PLC | | | 7,383 | | | | 82,934 | |
Green REIT PLC | | | 16,052 | | | | 26,999 | |
Hibernia REIT PLC | | | 16,439 | | | | 23,720 | |
ICON PLC(1) | | | 5,014 | | | | 405,131 | |
Irish Continental Group PLC | | | 7,510 | | | | 36,063 | |
Kenmare Resources PLC(1) | | | 109,911 | | | | 6,013 | |
Kerry Group PLC, Class A | | | 2,866 | | | | 217,788 | |
Paddy Power PLC | | | 2,886 | | | | 257,684 | |
| | | | | | | | | |
| | | | | | $ | 2,439,467 | |
| | | | | | | | | |
|
Israel — 1.9% | |
Azrieli Group | | | 575 | | | $ | 23,872 | |
Bank Hapoalim B.M. | | | 20,465 | | | | 113,787 | |
Bezeq Israeli Telecommunication Corp., Ltd. | | | 159,013 | | | | 293,259 | |
Caesarstone Sdot-Yam, Ltd. | | | 936 | | | | 67,149 | |
Check Point Software Technologies, Ltd.(1) | | | 2,200 | | | | 177,694 | |
Delek Automotive Systems, Ltd. | | | 2,964 | | | | 33,001 | |
Delek Group, Ltd. | | | 197 | | | | 58,178 | |
Elbit Systems, Ltd. | | | 1,766 | | | | 145,804 | |
Gazit-Globe, Ltd. | | | 2,355 | | | | 27,789 | |
Israel Chemicals, Ltd. | | | 36,509 | | | | 252,652 | |
Israel Corp., Ltd. | | | 199 | | | | 70,202 | |
Israel Discount Bank, Ltd., Series A(1) | | | 37,711 | | | | 76,156 | |
Kenon Holdings, Ltd.(1) | | | 1,393 | | | | 21,876 | |
Mizrahi Tefahot Bank, Ltd. | | | 6,299 | | | | 80,815 | |
Mobileye NV(1) | | | 1,314 | | | | 78,971 | |
NICE Systems, Ltd. | | | 790 | | | | 50,721 | |
Oil Refineries, Ltd.(1) | | | 99,305 | | | | 41,000 | |
Osem Investment, Ltd. | | | 3,280 | | | | 69,753 | |
Paz Oil Co., Ltd. | | | 774 | | | | 124,803 | |
Sarine Technologies, Ltd. | | | 24,100 | | | | 34,733 | |
Shikun & Binui, Ltd. | | | 24,887 | | | | 58,293 | |
SodaStream International, Ltd.(1) | | | 1,340 | | | | 24,053 | |
Strauss Group, Ltd.(1) | | | 2,832 | | | | 44,634 | |
Teva Pharmaceutical Industries, Ltd. ADR | | | 5,102 | | | | 352,140 | |
Tower Semiconductor, Ltd.(1) | | | 467 | | | | 6,291 | |
| | | | | | | | | |
| | | | | | $ | 2,327,626 | |
| | | | | | | | | |
|
Italy — 3.9% | |
Ansaldo STS SpA | | | 6,279 | | | $ | 64,978 | |
Assicurazioni Generali SpA | | | 7,144 | | | | 140,789 | |
Atlantia SpA | | | 8,406 | | | | 224,475 | |
Autogrill SpA(1) | | | 4,891 | | | | 44,162 | |
| | | | |
| | 10 | | See Notes to Financial Statements. |
Parametric International Equity Fund
July 31, 2015
Portfolio of Investments (Unaudited) — continued
| | | | | | | | |
| Security | | Shares | | | Value | |
| | | | | | | | |
|
Italy (continued) | |
Banca Monte dei Paschi di Siena SpA(1) | | | 2,690 | | | $ | 5,346 | |
Banca Popolare di Milano Scarl | | | 32,000 | | | | 34,613 | |
Banca Popolare di Sondrio Scarl | | | 7,176 | | | | 36,513 | |
Brembo SpA | | | 901 | | | | 40,619 | |
Brunello Cucinelli SpA | | | 1,077 | | | | 20,299 | |
Buzzi Unicem SpA | | | 8,143 | | | | 139,013 | |
CNH Industrial NV | | | 16,821 | | | | 150,961 | |
Danieli & C Officine Meccaniche SpA, PFC Shares | | | 1,258 | | | | 19,865 | |
Davide Campari-Milano SpA | | | 13,191 | | | | 105,550 | |
De’Longhi SpA | | | 1,326 | | | | 32,317 | |
DiaSorin SpA | | | 1,861 | | | | 85,481 | |
Ei Towers SpA | | | 915 | | | | 58,774 | |
Enel Green Power SpA | | | 26,815 | | | | 55,702 | |
Enel SpA | | | 77,818 | | | | 365,663 | |
ENI SpA | | | 29,563 | | | | 517,371 | |
Esprinet SpA | | | 1,400 | | | | 12,365 | |
EXOR SpA | | | 1,603 | | | | 80,656 | |
Hera SpA | | | 8,691 | | | | 21,922 | |
Industria Macchine Automatiche SpA | | | 435 | | | | 22,523 | |
Interpump Group SpA | | | 3,123 | | | | 53,056 | |
Intesa Sanpaolo SpA | | | 61,330 | | | | 236,129 | |
Intesa Sanpaolo SpA, PFC Shares | | | 8,400 | | | | 28,037 | |
Italcementi SpA | | | 5,848 | | | | 64,643 | |
Italmobiliare SpA, PFC Shares | | | 956 | | | | 25,346 | |
Luxottica Group SpA | | | 1,955 | | | | 141,770 | |
Mediobanca SpA | | | 7,502 | | | | 81,757 | |
Moncler SpA | | | 2,119 | | | | 43,057 | |
Parmalat SpA | | | 15,867 | | | | 41,745 | |
Pirelli & C. SpA | | | 4,439 | | | | 73,395 | |
Prada SpA | | | 7,400 | | | | 34,059 | |
Recordati SpA | | | 6,078 | | | | 151,378 | |
Reply SpA | | | 289 | | | | 32,613 | |
Saipem SpA(1) | | | 2,600 | | | | 22,690 | |
Salini Impregilo SpA | | | 11,163 | | | | 53,265 | |
Salvatore Ferragamo SpA | | | 1,601 | | | | 50,633 | |
Snam SpA | | | 22,478 | | | | 110,611 | |
Societa Iniziative Autostradali e Servizi SpA | | | 2,008 | | | | 23,626 | |
Sorin SpA(1) | | | 26,970 | | | | 77,981 | |
STMicroelectronics NV | | | 28,651 | | | | 224,262 | |
Telecom Italia SpA(1) | | | 456,478 | | | | 604,882 | |
Tenaris SA | | | 5,074 | | | | 64,137 | |
Terna Rete Elettrica Nazionale SpA | | | 16,318 | | | | 76,105 | |
Tiscali SpA(1) | | | 95,908 | | | | 6,381 | |
Tod’s SpA | | | 613 | | | | 61,924 | |
UnipolSai SpA | | | 12,219 | | | | 31,751 | |
Yoox SpA(1) | | | 851 | | | | 28,758 | |
| | | | | | | | | |
| | | | | | $ | 4,723,948 | |
| | | | | | | | | |
| | | | | | | | |
| Security | | Shares | | | Value | |
| | | | | | | | |
|
Japan — 15.7% | |
Aeon Co., Ltd. | | | 7,100 | | | $ | 108,493 | |
Air Water, Inc. | | | 3,000 | | | | 52,041 | |
Ajinomoto Co., Inc. | | | 7,000 | | | | 160,982 | |
Alfresa Holdings Corp. | | | 2,400 | | | | 40,193 | |
Asahi Glass Co., Ltd. | | | 6,000 | | | | 35,153 | |
Asahi Group Holdings, Ltd. | | | 4,400 | | | | 147,462 | |
Asahi Kasei Corp. | | | 11,000 | | | | 83,559 | |
Asics Corp. | | | 1,300 | | | | 37,360 | |
Astellas Pharma, Inc. | | | 9,500 | | | | 142,993 | |
Bank of Kyoto, Ltd. (The) | | | 3,000 | | | | 35,374 | |
Bank of Yokohama, Ltd. (The) | | | 7,000 | | | | 44,478 | |
Bridgestone Corp. | | | 2,400 | | | | 90,468 | |
Calbee, Inc. | | | 1,500 | | | | 66,837 | |
Canon, Inc. | | | 6,600 | | | | 211,168 | |
Central Japan Railway Co. | | | 800 | | | | 139,953 | |
Chiba Bank, Ltd. (The) | | | 7,000 | | | | 55,776 | |
Chubu Electric Power Co., Inc. | | | 20,900 | | | | 354,537 | |
Chugai Pharmaceutical Co., Ltd. | | | 3,000 | | | | 109,125 | |
Chugoku Bank, Ltd. (The) | | | 2,000 | | | | 31,240 | |
Citizen Holdings Co., Ltd. | | | 5,500 | | | | 36,693 | |
Coca-Cola West Co., Ltd. | | | 3,200 | | | | 64,456 | |
Cosmo Oil Co., Ltd.(1) | | | 52,000 | | | | 84,212 | |
Dai Nippon Printing Co., Ltd. | | | 6,000 | | | | 66,577 | |
Daicel Corp. | | | 4,000 | | | | 54,216 | |
Daido Steel Co., Ltd. | | | 12,000 | | | | 45,511 | |
Daihatsu Motor Co., Ltd. | | | 3,900 | | | | 55,387 | |
Daikin Industries, Ltd. | | | 1,300 | | | | 84,016 | |
Daito Trust Construction Co., Ltd. | | | 300 | | | | 31,681 | |
Daiwa House Industry Co., Ltd. | | | 4,500 | | | | 111,925 | |
DeNA Co., Ltd. | | | 2,800 | | | | 55,626 | |
Denki Kagaku Kogyo K.K. | | | 9,000 | | | | 37,427 | |
Denso Corp. | | | 2,600 | | | | 128,871 | |
Dentsu, Inc. | | | 2,600 | | | | 147,138 | |
DIC Corp. | | | 12,000 | | | | 28,238 | |
Disco Corp. | | | 300 | | | | 23,181 | |
Dowa Holdings Co., Ltd. | | | 5,000 | | | | 47,508 | |
East Japan Railway Co. | | | 1,500 | | | | 147,971 | |
Eisai Co., Ltd. | | | 2,000 | | | | 130,530 | |
Electric Power Development Co., Ltd. | | | 4,300 | | | | 148,616 | |
FamilyMart Co., Ltd. | | | 600 | | | | 28,997 | |
FANUC Corp. | | | 600 | | | | 100,072 | |
Fast Retailing Co., Ltd. | | | 200 | | | | 98,939 | |
Fuji Electric Co., Ltd. | | | 9,000 | | | | 37,208 | |
FUJIFILM Holdings Corp. | | | 3,600 | | | | 142,771 | |
Fujitsu, Ltd. | | | 11,000 | | | | 57,705 | |
Fukuoka Financial Group, Inc. | | | 7,000 | | | | 35,975 | |
| | | | |
| | 11 | | See Notes to Financial Statements. |
Parametric International Equity Fund
July 31, 2015
Portfolio of Investments (Unaudited) — continued
| | | | | | | | |
| Security | | Shares | | | Value | |
| | | | | | | | |
|
Japan (continued) | |
Hachijuni Bank, Ltd. (The) | | | 5,000 | | | $ | 38,803 | |
Hamamatsu Photonics K.K. | | | 2,200 | | | | 57,214 | |
Hankyu Hanshin Holdings, Inc. | | | 8,000 | | | | 50,536 | |
Hirose Electric Co., Ltd. | | | 400 | | | | 47,715 | |
Hiroshima Bank, Ltd. (The) | | | 7,000 | | | | 41,022 | |
Hisamitsu Pharmaceutical Co., Inc. | | | 800 | | | | 29,082 | |
Hitachi Chemical Co., Ltd. | | | 1,500 | | | | 26,524 | |
Hitachi Metals, Ltd. | | | 3,000 | | | | 44,601 | |
Hokkaido Electric Power Co., Inc.(1) | | | 5,300 | | | | 63,914 | |
Hokuhoku Financial Group, Inc. | | | 19,000 | | | | 44,858 | |
Hokuriku Electric Power Co. | | | 4,600 | | | | 70,713 | |
Honda Motor Co., Ltd. | | | 5,700 | | | | 191,506 | |
Hoya Corp. | | | 2,800 | | | | 118,407 | |
Hulic Co., Ltd. | | | 2,300 | | | | 22,748 | |
Ibiden Co., Ltd. | | | 2,400 | | | | 39,679 | |
Idemitsu Kosan Co., Ltd. | | | 3,200 | | | | 58,819 | |
INPEX Corp. | | | 7,200 | | | | 78,233 | |
Isetan Mitsukoshi Holdings, Ltd. | | | 3,600 | | | | 65,489 | |
ITOCHU Corp. | | | 4,900 | | | | 59,985 | |
Iyo Bank, Ltd. (The) | | | 6,000 | | | | 76,284 | |
Japan Airlines Co., Ltd. | | | 1,000 | | | | 37,729 | |
Japan Exchange Group, Inc. | | | 1,300 | | | | 45,250 | |
Japan Real Estate Investment Corp. | | | 5 | | | | 22,423 | |
Japan Retail Fund Investment Corp. | | | 17 | | | | 33,324 | |
Japan Tobacco, Inc. | | | 6,900 | | | | 267,835 | |
JGC Corp. | | | 2,000 | | | | 34,156 | |
Joyo Bank, Ltd. (The) | | | 9,000 | | | | 53,230 | |
JSR Corp. | | | 2,400 | | | | 39,937 | |
JX Holdings, Inc. | | | 59,300 | | | | 252,783 | |
Kakaku.com, Inc. | | | 2,000 | | | | 31,790 | |
Kaken Pharmaceutical Co., Ltd. | | | 2,000 | | | | 74,517 | |
Kaneka Corp. | | | 6,000 | | | | 43,290 | |
Kansai Electric Power Co., Inc. (The)(1) | | | 12,600 | | | | 170,847 | |
Kansai Paint Co., Ltd. | | | 4,000 | | | | 65,109 | |
KDDI Corp. | | | 29,300 | | | | 743,812 | |
Keikyu Corp. | | | 5,000 | | | | 41,128 | |
Keio Corp. | | | 5,000 | | | | 41,600 | |
Kewpie Corp. | | | 1,400 | | | | 31,655 | |
Keyence Corp. | | | 300 | | | | 151,121 | |
Kikkoman Corp. | | | 2,000 | | | | 69,902 | |
Kintetsu Group Holdings Co., Ltd. | | | 12,000 | | | | 42,747 | |
Kirin Holdings Co., Ltd. | | | 7,500 | | | | 115,319 | |
Kobayashi Pharmaceutical Co., Ltd. | | | 700 | | | | 54,909 | |
Koito Manufacturing Co., Ltd. | | | 1,800 | | | | 70,715 | |
Konami Corp. | | | 2,400 | | | | 50,052 | |
Konica Minolta, Inc. | | | 6,700 | | | | 83,503 | |
| | | | | | | | |
| Security | | Shares | | | Value | |
| | | | | | | | |
|
Japan (continued) | |
Kubota Corp. | | | 6,000 | | | $ | 102,616 | |
Kuraray Co., Ltd. | | | 3,500 | | | | 41,261 | |
Kyocera Corp. | | | 2,000 | | | | 102,979 | |
Kyowa Hakko Kirin Co., Ltd. | | | 5,000 | | | | 81,359 | |
Kyushu Electric Power Co., Inc.(1) | | | 12,800 | | | | 181,382 | |
Lawson, Inc. | | | 1,000 | | | | 74,381 | |
Lion Corp. | | | 8,000 | | | | 68,785 | |
LIXIL Group Corp. | | | 1,100 | | | | 22,053 | |
M3, Inc. | | | 2,200 | | | | 51,842 | |
Makita Corp. | | | 1,000 | | | | 55,207 | |
Marubeni Corp. | | | 16,300 | | | | 90,587 | |
Maruichi Steel Tube, Ltd. | | | 1,200 | | | | 30,918 | |
Matsumotokiyoshi Holdings Co., Ltd. | | | 1,000 | | | | 48,262 | |
MEIJI Holdings Co., Ltd. | | | 700 | | | | 99,423 | |
Miraca Holdings, Inc. | | | 800 | | | | 36,822 | |
Mitsubishi Chemical Holdings Corp. | | | 14,500 | | | | 94,636 | |
Mitsubishi Corp. | | | 5,000 | | | | 107,884 | |
Mitsubishi Estate Co., Ltd. | | | 4,000 | | | | 88,830 | |
Mitsubishi Gas Chemical Co., Inc. | | | 10,000 | | | | 55,473 | |
Mitsubishi Materials Corp. | | | 18,000 | | | | 65,161 | |
Mitsubishi Motors Corp. | | | 7,000 | | | | 59,508 | |
Mitsubishi Tanabe Pharma Corp. | | | 3,600 | | | | 59,939 | |
Mitsubishi UFJ Financial Group, Inc. | | | 44,100 | | | | 320,919 | |
Mitsui & Co., Ltd. | | | 5,400 | | | | 70,066 | |
Mitsui Chemicals, Inc. | | | 14,000 | | | | 52,437 | |
Mitsui Fudosan Co., Ltd. | | | 3,000 | | | | 85,336 | |
Mitsui O.S.K. Lines, Ltd. | | | 8,000 | | | | 23,993 | |
Mizuho Financial Group, Inc. | | | 69,700 | | | | 151,982 | |
Murata Manufacturing Co., Ltd. | | | 1,100 | | | | 162,968 | |
NEC Corp. | | | 15,000 | | | | 47,907 | |
NGK Spark Plug Co., Ltd. | | | 1,900 | | | | 50,297 | |
NH Foods, Ltd. | | | 2,000 | | | | 48,611 | |
Nidec Corp. | | | 800 | | | | 71,525 | |
Nihon Kohden Corp. | | | 1,200 | | | | 26,619 | |
Nikon Corp. | | | 2,300 | | | | 27,358 | |
Nintendo Co., Ltd. | | | 700 | | | | 122,948 | |
Nippon Building Fund, Inc. | | | 14 | | | | 62,566 | |
Nippon Electric Glass Co., Ltd. | | | 8,000 | | | | 38,818 | |
Nippon Express Co., Ltd. | | | 6,000 | | | | 31,718 | |
Nippon Kayaku Co., Ltd. | | | 4,000 | | | | 40,520 | |
Nippon Paint Holdings Co., Ltd. | | | 2,000 | | | | 57,324 | |
Nippon Paper Industries Co., Ltd. | | | 1,900 | | | | 31,175 | |
Nippon Shinyaku Co., Ltd. | | | 2,000 | | | | 66,703 | |
Nippon Shokubai Co., Ltd. | | | 3,000 | | | | 44,306 | |
Nippon Telegraph & Telephone Corp. | | | 18,200 | | | | 700,932 | |
Nippon Yusen K.K. | | | 16,000 | | | | 43,737 | |
| | | | |
| | 12 | | See Notes to Financial Statements. |
Parametric International Equity Fund
July 31, 2015
Portfolio of Investments (Unaudited) — continued
| | | | | | | | |
| Security | | Shares | | | Value | |
| | | | | | | | |
|
Japan (continued) | |
Nishi-Nippon City Bank, Ltd. (The) | | | 8,000 | | | $ | 24,295 | |
Nissan Chemical Industries, Ltd. | | | 2,000 | | | | 43,860 | |
Nissan Motor Co., Ltd. | | | 9,100 | | | | 86,582 | |
Nisshin Seifun Group, Inc. | | | 3,800 | | | | 54,464 | |
Nissin Foods Holdings Co., Ltd. | | | 1,500 | | | | 67,596 | |
Nitori Holdings Co., Ltd. | | | 400 | | | | 35,860 | |
Nitto Denko Corp. | | | 2,100 | | | | 158,934 | |
Nomura Research Institute, Ltd. | | | 900 | | | | 36,915 | |
NTT Data Corp. | | | 2,200 | | | | 105,114 | |
NTT DoCoMo, Inc. | | | 32,600 | | | | 688,360 | |
Obic Co., Ltd. | | | 1,000 | | | | 47,445 | |
Odakyu Electric Railway Co., Ltd. | | | 4,000 | | | | 40,008 | |
Okinawa Electric Power Co., Inc. (The) | | | 1,300 | | | | 32,483 | |
Ono Pharmaceutical Co., Ltd. | | | 1,100 | | | | 132,526 | |
Oracle Corp. Japan | | | 1,400 | | | | 58,919 | |
Oriental Land Co., Ltd. | | | 800 | | | | 50,741 | |
Osaka Gas Co., Ltd. | | | 48,000 | | | | 191,931 | |
Otsuka Holdings Co., Ltd. | | | 4,700 | | | | 168,753 | |
Pigeon Corp. | | | 1,800 | | | | 54,732 | |
Rakuten, Inc. | | | 2,500 | | | | 40,175 | |
Resona Holdings, Inc. | | | 9,200 | | | | 50,579 | |
Ricoh Co., Ltd. | | | 4,500 | | | | 44,396 | |
Rinnai Corp. | | | 500 | | | | 35,345 | |
San-Ai Oil Co., Ltd. | | | 4,000 | | | | 27,924 | |
Santen Pharmaceutical Co., Ltd. | | | 5,500 | | | | 80,916 | |
Sawai Pharmaceutical Co., Ltd. | | | 1,000 | | | | 61,210 | |
SECOM Co., Ltd. | | | 1,500 | | | | 100,914 | |
Sekisui Chemical Co., Ltd. | | | 2,000 | | | | 22,190 | |
Sekisui House, Ltd. | | | 3,000 | | | | 44,566 | |
Seven Bank, Ltd. | | | 9,500 | | | | 45,246 | |
Sharp Corp.(1) | | | 20,000 | | | | 26,464 | |
Shimadzu Corp. | | | 4,000 | | | | 59,545 | |
Shimamura Co., Ltd. | | | 400 | | | | 41,272 | |
Shimano, Inc. | | | 300 | | | | 41,590 | |
Shin-Etsu Chemical Co., Ltd. | | | 3,200 | | | | 191,360 | |
Shionogi & Co., Ltd. | | | 3,500 | | | | 139,439 | |
Shiseido Co., Ltd. | | | 4,100 | | | | 99,172 | |
Shizuoka Bank, Ltd. (The) | | | 7,000 | | | | 79,069 | |
Showa Denko K.K. | | | 23,000 | | | | 28,352 | |
Showa Shell Sekiyu K.K. | | | 6,200 | | | | 58,222 | |
SMC Corp. | | | 200 | | | | 50,664 | |
Sumitomo Corp. | | | 6,300 | | | | 71,520 | |
Sumitomo Metal Mining Co., Ltd. | | | 8,000 | | | | 107,562 | |
Sumitomo Mitsui Financial Group, Inc. | | | 4,300 | | | | 193,904 | |
Sumitomo Osaka Cement Co., Ltd. | | | 12,000 | | | | 44,991 | |
Suntory Beverage & Food, Ltd. | | | 1,200 | | | | 50,691 | |
| | | | | | | | |
| Security | | Shares | | | Value | |
| | | | | | | | |
|
Japan (continued) | |
Suruga Bank, Ltd. | | | 3,800 | | | $ | 81,597 | |
Sysmex Corp. | | | 2,200 | | | | 142,363 | |
Taiheiyo Cement Corp. | | | 12,000 | | | | 39,564 | |
Taisho Pharmaceutical Holdings Co., Ltd. | | | 1,400 | | | | 93,939 | |
Takashimaya Co., Ltd. | | | 6,000 | | | | 57,397 | |
Takeda Pharmaceutical Co., Ltd. | | | 4,800 | | | | 241,494 | |
TDK Corp. | | | 700 | | | | 48,947 | |
TEIJIN, Ltd. | | | 12,000 | | | | 43,796 | |
Toho Gas Co., Ltd. | | | 21,000 | | | | 125,453 | |
Tokio Marine Holdings, Inc. | | | 2,500 | | | | 104,108 | |
Tokyo Gas Co., Ltd. | | | 56,000 | | | | 302,352 | |
Tokyu Corp. | | | 7,000 | | | | 51,443 | |
Tokyu Fudosan Holdings Corp. | | | 4,000 | | | | 30,179 | |
TonenGeneral Sekiyu K.K. | | | 10,000 | | | | 99,983 | |
Toray Industries, Inc. | | | 19,000 | | | | 151,190 | |
Toshiba Corp. | | | 14,000 | | | | 42,791 | |
Tosoh Corp. | | | 7,000 | | | | 36,492 | |
TOTO, Ltd. | | | 3,000 | | | | 48,832 | |
Toyo Suisan Kaisha, Ltd. | | | 1,400 | | | | 52,901 | |
Toyota Motor Corp. | | | 7,400 | | | | 492,764 | |
Toyota Tsusho Corp. | | | 1,100 | | | | 27,883 | |
Trend Micro, Inc. | | | 1,500 | | | | 54,903 | |
Tsumura & Co. | | | 1,300 | | | | 27,255 | |
Tsuruha Holdings, Inc. | | | 600 | | | | 52,675 | |
Ube Industries, Ltd. | | | 32,000 | | | | 55,968 | |
Unicharm Corp. | | | 4,500 | | | | 108,034 | |
UNY Group Holdings Co., Ltd. | | | 8,100 | | | | 55,975 | |
USS Co., Ltd. | | | 2,100 | | | | 36,875 | |
West Japan Railway Co. | | | 1,000 | | | | 71,766 | |
Yahoo! Japan Corp. | | | 13,100 | | | | 57,314 | |
Yamaguchi Financial Group, Inc. | | | 3,000 | | | | 40,054 | |
Yamato Holdings Co., Ltd. | | | 1,600 | | | | 35,461 | |
Yamazaki Baking Co., Ltd. | | | 2,000 | | | | 31,862 | |
Yokohama Rubber Co., Ltd. (The) | | | 2,500 | | | | 49,443 | |
Zeon Corp. | | | 6,000 | | | | 58,131 | |
| | | | | | | | | |
| | | | | | $ | 18,841,507 | |
| | | | | | | | | |
|
Netherlands — 3.9% | |
Aegon NV | | | 12,684 | | | $ | 97,562 | |
Aercap Holdings NV(1) | | | 1,800 | | | | 84,312 | |
Akzo Nobel NV | | | 4,225 | | | | 302,320 | |
Altice SA(1) | | | 1,339 | | | | 169,031 | |
AMG Advanced Metallurgical Group NV(1) | | | 3,023 | | | | 25,435 | |
Arcadis NV | | | 1,684 | | | | 44,158 | |
ASM International NV | | | 1,283 | | | | 57,689 | |
ASML Holding NV | | | 4,396 | | | | 436,986 | |
| | | | |
| | 13 | | See Notes to Financial Statements. |
Parametric International Equity Fund
July 31, 2015
Portfolio of Investments (Unaudited) — continued
| | | | | | | | |
| Security | | Shares | | | Value | |
| | | | | | | | |
|
Netherlands (continued) | |
AVG Technologies NV(1) | | | 1,500 | | | $ | 43,110 | |
BE Semiconductor Industries NV | | | 1,189 | | | | 28,276 | |
Constellium NV, Class A(1) | | | 1,900 | | | | 21,090 | |
Euronext NV(2) | | | 672 | | | | 30,666 | |
Fugro NV(1) | | | 3,598 | | | | 75,259 | |
Gemalto NV | | | 1,094 | | | | 93,873 | |
Heineken NV | | | 1,487 | | | | 116,937 | |
IMCD Group NV | | | 1,268 | | | | 46,583 | |
ING Groep NV | | | 34,317 | | | | 583,635 | |
InterXion Holding NV(1) | | | 1,200 | | | | 33,144 | |
Koninklijke Ahold NV | | | 6,370 | | | | 126,774 | |
Koninklijke DSM NV | | | 3,099 | | | | 176,858 | |
Koninklijke KPN NV | | | 66,651 | | | | 263,343 | |
Koninklijke Philips NV | | | 9,890 | | | | 275,597 | |
Koninklijke Vopak NV | | | 1,811 | | | | 94,609 | |
NN Group NV | | | 1,200 | | | | 36,975 | |
OCI NV(1) | | | 716 | | | | 23,981 | |
QIAGEN NV(1) | | | 5,257 | | | | 147,504 | |
Refresco Gerber NV(1)(2) | | | 3,342 | | | | 57,205 | |
RELX NV | | | 23,456 | | | | 390,379 | |
Royal Boskalis Westminster NV | | | 1,167 | | | | 57,017 | |
Royal Imtech NV(1) | | | 5,613 | | | | 17,749 | |
Sligro Food Group NV | | | 1,664 | | | | 63,982 | |
TKH Group NV | | | 660 | | | | 28,321 | |
Unilever NV | | | 13,945 | | | | 624,712 | |
Wereldhave NV | | | 361 | | | | 21,343 | |
| | | | | | | | | |
| | | | | | $ | 4,696,415 | |
| | | | | | | | | |
|
New Zealand — 1.0% | |
Argosy Property, Ltd. | | | 60,306 | | | $ | 44,385 | |
Auckland International Airport, Ltd. | | | 36,722 | | | | 131,076 | |
Contact Energy, Ltd. | | | 19,502 | | | | 63,707 | |
Fisher & Paykel Healthcare Corp., Ltd. | | | 16,073 | | | | 79,521 | |
Fletcher Building, Ltd. | | | 17,578 | | | | 91,853 | |
Infratil, Ltd. | | | 20,557 | | | | 43,825 | |
Kiwi Property Group, Ltd. | | | 67,261 | | | | 61,219 | |
Mighty River Power, Ltd. | | | 16,147 | | | | 29,421 | |
Nuplex Industries, Ltd. | | | 8,690 | | | | 26,086 | |
Precinct Properties New Zealand, Ltd. | | | 57,750 | | | | 43,640 | |
Ryman Healthcare, Ltd. | | | 8,800 | | | | 48,778 | |
Sky Network Television, Ltd. | | | 14,463 | | | | 58,414 | |
SKYCITY Entertainment Group, Ltd. | | | 20,643 | | | | 60,200 | |
Spark New Zealand, Ltd. | | | 69,611 | | | | 135,951 | |
Xero, Ltd.(1) | | | 10,720 | | | | 125,257 | |
Z Energy, Ltd. | | | 32,373 | | | | 123,840 | |
| | | | | | | | | |
| | | | | | $ | 1,167,173 | |
| | | | | | | | | |
| | | | | | | | |
| Security | | Shares | | | Value | |
| | | | | | | | |
|
Norway — 2.0% | |
Atea ASA | | | 6,981 | | | $ | 60,284 | |
Austevoll Seafood ASA | | | 5,049 | | | | 26,256 | |
Borregaard ASA | | | 4,154 | | | | 26,321 | |
Det Norske Oljeselskap ASA(1) | | | 3,543 | | | | 21,720 | |
DNB ASA | | | 9,636 | | | | 157,090 | |
Gjensidige Forsikring ASA | | | 3,579 | | | | 57,512 | |
Golar LNG, Ltd. | | | 2,320 | | | | 99,922 | |
IDEX ASA(1) | | | 37,361 | | | | 45,682 | |
Kongsberg Gruppen ASA | | | 4,193 | | | | 70,236 | |
Leroy Seafood Group ASA | | | 1,349 | | | | 46,392 | |
Nordic Semiconductor ASA(1) | | | 2,982 | | | | 19,051 | |
Opera Software ASA | | | 17,007 | | | | 135,798 | |
Orkla ASA | | | 20,408 | | | | 162,647 | |
Prosafe SE | | | 5,622 | | | | 16,407 | |
Salmar ASA | | | 3,093 | | | | 48,910 | |
Schibsted ASA, Class A | | | 4,165 | | | | 145,526 | |
Schibsted ASA, Class B(1) | | | 4,165 | | | | 136,140 | |
SpareBank 1 SMN | | | 4,478 | | | | 34,668 | |
SpareBank 1 SR-Bank ASA | | | 4,300 | | | | 25,526 | |
Statoil ASA | | | 7,015 | | | | 118,263 | |
Stolt-Nielsen, Ltd. | | | 2,767 | | | | 44,703 | |
Subsea 7 SA(1) | | | 3,900 | | | | 34,169 | |
Telenor ASA | | | 14,444 | | | | 317,277 | |
Thin Film Electronics ASA(1) | | | 44,255 | | | | 22,743 | |
Tomra Systems ASA | | | 7,121 | | | | 63,060 | |
Veidekke ASA | | | 8,955 | | | | 99,639 | |
XXL ASA(2) | | | 4,976 | | | | 55,161 | |
Yara International ASA | | | 5,175 | | | | 257,478 | |
| | | | | | | | | |
| | | | | | $ | 2,348,581 | |
| | | | | | | | | |
|
Portugal — 1.0% | |
Banco BPI SA(1) | | | 20,010 | | | $ | 22,688 | |
Banco Comercial Portugues SA(1) | | | 1,508,983 | | | | 115,622 | |
CTT-Correios de Portugal SA | | | 12,934 | | | | 133,348 | |
EDP-Energias de Portugal SA | | | 33,754 | | | | 124,848 | |
Galp Energia SGPS SA, Class B | | | 13,624 | | | | 157,567 | |
Jeronimo Martins SGPS SA | | | 13,128 | | | | 195,110 | |
Mota-Engil SGPS SA | | | 5,885 | | | | 15,631 | |
NOS SGPS SA | | | 18,782 | | | | 158,934 | |
Pharol SGPS SA(1) | | | 189,661 | | | | 70,663 | |
Portucel SA | | | 38,007 | | | | 144,678 | |
REN - Redes Energeticas Nacionais SGPS SA | | | 6,664 | | | | 19,969 | |
| | | | | | | | | |
| | | | | | $ | 1,159,058 | |
| | | | | | | | | |
| | | | |
| | 14 | | See Notes to Financial Statements. |
Parametric International Equity Fund
July 31, 2015
Portfolio of Investments (Unaudited) — continued
| | | | | | | | |
| Security | | Shares | | | Value | |
| | | | | | | | |
|
Singapore — 1.9% | |
Ascendas Real Estate Investment Trust | | | 33,000 | | | $ | 58,182 | |
Biosensors International Group, Ltd.(1) | | | 39,000 | | | | 19,766 | |
Boustead Projects, Ltd.(1) | | | 1,500 | | | | 945 | |
Boustead Singapore, Ltd. | | | 5,000 | | | | 4,377 | |
CapitaLand Mall Trust | | | 23,000 | | | | 33,530 | |
City Developments, Ltd. | | | 4,500 | | | | 30,626 | |
ComfortDelGro Corp., Ltd. | | | 28,000 | | | | 61,446 | |
Ezion Holdings, Ltd. | | | 80,300 | | | | 50,488 | |
Ezra Holdings, Ltd.(1) | | | 291,000 | | | | 28,544 | |
First Resources, Ltd. | | | 15,000 | | | | 20,752 | |
Flextronics International, Ltd.(1) | | | 20,712 | | | | 228,039 | |
Genting Singapore PLC | | | 119,400 | | | | 76,511 | |
Global Logistic Properties, Ltd. | | | 13,000 | | | | 21,804 | |
Golden Agri-Resources, Ltd. | | | 236,400 | | | | 54,250 | |
Haw Par Corp, Ltd. | | | 3,200 | | | | 20,565 | |
Keppel Corp., Ltd. | | | 12,100 | | | | 66,102 | |
Keppel Infrastructure Trust | | | 169,500 | | | | 64,210 | |
Midas Holdings, Ltd. | | | 80,000 | | | | 18,338 | |
OSIM International, Ltd. | | | 58,000 | | | | 67,427 | |
Oversea-Chinese Banking Corp., Ltd. | | | 13,000 | | | | 97,488 | |
Pacific Radiance, Ltd. | | | 38,400 | | | | 11,306 | |
Petra Foods, Ltd. | | | 11,000 | | | | 22,995 | |
Raffles Medical Group, Ltd. | | | 14,000 | | | | 48,910 | |
Religare Health Trust | | | 54,000 | | | | 41,532 | |
Rex International Holding, Ltd.(1) | | | 180,000 | | | | 15,850 | |
Sembcorp Industries, Ltd. | | | 16,000 | | | | 41,616 | |
Sheng Siong Group, Ltd. | | | 45,400 | | | | 29,585 | |
Singapore Airport Terminal Services, Ltd. | | | 8,800 | | | | 24,151 | |
Singapore Exchange, Ltd. | | | 8,300 | | | | 48,254 | |
Singapore Post, Ltd. | | | 37,200 | | | | 52,972 | |
Singapore Press Holdings, Ltd. | | | 53,100 | | | | 161,779 | |
Singapore Technologies Engineering, Ltd. | | | 20,000 | | | | 47,817 | |
Singapore Telecommunications, Ltd. | | | 90,400 | | | | 269,991 | |
StarHub, Ltd. | | | 12,000 | | | | 33,504 | |
Suntec REIT | | | 17,000 | | | | 21,098 | |
United Overseas Bank, Ltd. | | | 6,000 | | | | 97,131 | |
UOL Group, Ltd. | | | 4,700 | | | | 22,962 | |
Venture Corp., Ltd. | | | 9,000 | | | | 51,498 | |
Wilmar International, Ltd. | | | 75,700 | | | | 176,523 | |
| | | | | | | | | |
| | | | | | $ | 2,242,864 | |
| | | | | | | | | |
|
Spain — 3.9% | |
Abertis Infraestructuras SA | | | 8,323 | | | $ | 136,289 | |
Acerinox SA | | | 5,463 | | | | 66,623 | |
Aena SA(1)(2) | | | 619 | | | | 68,150 | |
Almirall SA | | | 2,500 | | | | 49,165 | |
| | | | | | | | |
| Security | | Shares | | | Value | |
| | | | | | | | |
|
Spain (continued) | |
Amadeus IT Holding SA, Class A | | | 12,022 | | | $ | 524,839 | |
Banco de Sabadell SA | | | 19,629 | | | | 44,720 | |
Banco Santander SA | | | 46,504 | | | | 321,562 | |
Bankia SA | | | 37,040 | | | | 48,952 | |
Bankinter SA | | | 4,724 | | | | 36,462 | |
Bolsas y Mercados Espanoles SHMSF SA | | | 760 | | | | 31,386 | |
CaixaBank SA | | | 20,372 | | | | 90,914 | |
Cia de Distribucion Integral Logista Holdings SA | | | 1,397 | | | | 27,534 | |
Construcciones y Auxiliar de Ferrocarriles SA | | | 75 | | | | 21,318 | |
Distribuidora Internacional de Alimentacion SA | | | 16,912 | | | | 105,845 | |
Ebro Foods SA | | | 5,138 | | | | 102,481 | |
Enagas SA | | | 2,646 | | | | 74,278 | |
Ence Energia y Celulosa SA | | | 8,194 | | | | 29,579 | |
Faes Farma SA | | | 11,377 | | | | 31,590 | |
Ferrovial SA | | | 7,151 | | | | 173,908 | |
Gas Natural SDG SA | | | 2,563 | | | | 55,628 | |
Grifols SA, Class A | | | 5,596 | | | | 247,284 | |
Grifols SA, Class B, PFC Shares | | | 4,595 | | | | 149,731 | |
Iberdrola SA | | | 42,072 | | | | 296,744 | |
Industria de Diseno Textil SA | | | 14,416 | | | | 494,297 | |
Laboratorios Farmaceuticos Rovi SA | | | 1,344 | | | | 20,286 | |
Melia Hotels International SA | | | 3,749 | | | | 53,940 | |
Prosegur Cia de Seguridad SA | | | 6,773 | | | | 35,869 | |
Red Electrica Corp. SA | | | 938 | | | | 74,899 | |
Repsol SA | | | 24,256 | | | | 407,656 | |
Tecnicas Reunidas SA | | | 1,676 | | | | 85,340 | |
Telefonica SA | | | 34,418 | | | | 527,928 | |
Tubos Reunidos SA | | | 9,481 | | | | 13,232 | |
Vidrala SA | | | 694 | | | | 34,061 | |
Viscofan SA | | | 1,814 | | | | 108,408 | |
Zardoya Otis SA | | | 4,388 | | | | 48,172 | |
| | | | | | | | | |
| | | | | | $ | 4,639,070 | |
| | | | | | | | | |
|
Sweden — 3.9% | |
AAK AB | | | 447 | | | $ | 30,277 | |
Alfa Laval AB | | | 1,173 | | | | 21,574 | |
Assa Abloy AB, Class B | | | 7,558 | | | | 153,464 | |
Atlas Copco AB, Class A | | | 3,417 | | | | 93,452 | |
Axfood AB | | | 1,472 | | | | 25,101 | |
Betsson AB | | | 4,560 | | | | 76,454 | |
Bilia AB, Class A | | | 2,460 | | | | 49,447 | |
BillerudKorsnas AB | | | 7,160 | | | | 109,990 | |
BioGaia AB, Class B | | | 1,123 | | | | 36,439 | |
Castellum AB | | | 1,758 | | | | 25,066 | |
Clas Ohlson AB, Class B | | | 3,000 | | | | 55,524 | |
Com Hem Holding AB | | | 3,424 | | | | 30,250 | |
| | | | |
| | 15 | | See Notes to Financial Statements. |
Parametric International Equity Fund
July 31, 2015
Portfolio of Investments (Unaudited) — continued
| | | | | | | | |
| Security | | Shares | | | Value | |
| | | | | | | | |
|
Sweden (continued) | |
Elekta AB, Class B | | | 25,757 | | | $ | 170,873 | |
Fingerprint Cards AB(1) | | | 3,503 | | | | 82,303 | |
Granges AB | | | 7,960 | | | | 52,701 | |
Hennes & Mauritz AB, Class B | | | 9,753 | | | | 388,045 | |
Hexpol AB | | | 14,655 | | | | 157,203 | |
Holmen AB, Class B | | | 3,945 | | | | 112,547 | |
ICA Gruppen AB | | | 1,318 | | | | 48,100 | |
Industrial & Financial Systems, Class B | | | 1,025 | | | | 34,378 | |
Industrivarden AB, Class A | | | 1,313 | | | | 25,921 | |
Investment AB Kinnevik, Class B | | | 858 | | | | 27,434 | |
Investor AB, Class B | | | 1,665 | | | | 64,192 | |
Lundin Petroleum AB(1) | | | 7,983 | | | | 115,738 | |
Meda AB, Class A | | | 13,150 | | | | 214,288 | |
Medivir AB, Class B(1) | | | 11,060 | | | | 117,358 | |
NIBE Industrier AB, Class B | | | 1,022 | | | | 28,803 | |
Nordea Bank AB | | | 13,259 | | | | 165,085 | |
Sandvik AB | | | 8,816 | | | | 89,330 | |
Securitas AB, Class B | | | 2,566 | | | | 36,834 | |
Skanska AB, Class B | | | 3,676 | | | | 77,414 | |
SKF AB, Class B | | | 3,418 | | | | 66,854 | |
SSAB AB, Class A(1) | | | 14,126 | | | | 67,256 | |
SSAB AB, Class B(1) | | | 7,841 | | | | 32,559 | |
Svenska Cellulosa AB SCA, Class A | | | 902 | | | | 25,596 | |
Svenska Cellulosa AB SCA, Class B | | | 11,444 | | | | 325,633 | |
Svenska Handelsbanken AB, Class A | | | 5,505 | | | | 84,250 | |
Swedbank AB, Class A | | | 5,949 | | | | 139,350 | |
Swedish Match AB | | | 4,007 | | | | 122,734 | |
Tele2 AB, Class B | | | 8,730 | | | | 90,857 | |
Telefonaktiebolaget LM Ericsson, Class B | | | 42,609 | | | | 455,577 | |
TeliaSonera AB | | | 73,811 | | | | 448,566 | |
Tethys Oil AB | | | 2,578 | | | | 15,278 | |
Unibet Group PLC SDR | | | 577 | | | | 37,056 | |
Vitrolife AB | | | 1,255 | | | | 25,337 | |
Wihlborgs Fastigheter AB | | | 1,547 | | | | 26,670 | |
| | | | | | | | | |
| | | | | | $ | 4,679,158 | |
| | | | | | | | | |
|
Switzerland — 7.9% | |
ABB, Ltd. | | | 24,150 | | | $ | 491,211 | |
Allreal Holding AG | | | 213 | | | | 30,443 | |
Ascom Holding AG | | | 3,183 | | | | 57,704 | |
Autoneum Holding AG | | | 118 | | | | 24,345 | |
Baloise Holding AG | | | 668 | | | | 85,109 | |
Banque Cantonale Vaudoise | | | 88 | | | | 57,052 | |
Barry Callebaut AG | | | 43 | | | | 48,071 | |
Belimo Holding AG | | | 10 | | | | 22,805 | |
Berner Kantonalbank AG | | | 118 | | | | 22,580 | |
| | | | | | | | |
| Security | | Shares | | | Value | |
| | | | | | | | |
|
Switzerland (continued) | |
Bucher Industries AG | | | 171 | | | $ | 41,688 | |
Burckhardt Compression Holdings AG | | | 110 | | | | 41,549 | |
Cembra Money Bank AG | | | 435 | | | | 26,490 | |
Comet Holding AG | | | 50 | | | | 42,347 | |
Compagnie Financiere Richemont SA, Class A | | | 10,464 | | | | 903,184 | |
Daetwyler Holding AG | | | 155 | | | | 19,181 | |
DKSH Holding AG | | | 263 | | | | 19,731 | |
Dufry AG(1) | | | 557 | | | | 77,241 | |
EFG International AG | | | 2,974 | | | | 34,634 | |
Ems-Chemie Holding AG | | | 429 | | | | 208,955 | |
Flughafen Zuerich AG | | | 44 | | | | 36,117 | |
Forbo Holding AG | | | 29 | | | | 35,319 | |
Gategroup Holding AG | | | 975 | | | | 36,025 | |
Geberit AG | | | 465 | | | | 160,845 | |
Givaudan SA | | | 231 | | | | 429,694 | |
Helvetia Holding AG | | | 91 | | | | 49,935 | |
Implenia AG | | | 405 | | | | 24,296 | |
Inficon Holding AG | | | 86 | | | | 25,537 | |
Julius Baer Group, Ltd. | | | 1,792 | | | | 99,133 | |
Kaba Holding AG | | | 62 | | | | 39,667 | |
Komax Holding AG | | | 194 | | | | 33,772 | |
Kuehne & Nagel International AG | | | 663 | | | | 91,525 | |
Kuoni Reisen Holding AG | | | 68 | | | | 18,899 | |
LEM Holding SA | | | 25 | | | | 18,897 | |
Leonteq AG | | | 316 | | | | 72,899 | |
Lindt & Spruengli AG | | | 1 | | | | 66,753 | |
Lindt & Spruengli AG PC | | | 9 | | | | 50,574 | |
Logitech International SA | | | 5,517 | | | | 79,370 | |
Luzerner Kantonalbank AG | | | 71 | | | | 26,116 | |
Mobimo Holding AG | | | 140 | | | | 29,775 | |
Nestle SA | | | 17,148 | | | | 1,297,247 | |
Novartis AG | | | 11,742 | | | | 1,218,398 | |
Panalpina Welttransport Holding AG | | | 153 | | | | 19,046 | |
Pargesa Holding SA | | | 707 | | | | 47,492 | |
Partners Group Holding AG | | | 209 | | | | 69,884 | |
PSP Swiss Property AG | | | 555 | | | | 49,856 | |
Roche Holding AG | | | 600 | | | | 171,700 | |
Schindler Holding AG | | | 363 | | | | 58,986 | |
Schindler Holding AG PC | | | 772 | | | | 124,341 | |
Schmolz & Bickenbach AG(1) | | | 42,451 | | | | 35,531 | |
SFS Group AG | | | 281 | | | | 19,877 | |
SGS SA | | | 62 | | | | 118,269 | |
Sika AG | | | 47 | | | | 170,393 | |
Sonova Holding AG | | | 815 | | | | 116,023 | |
Sulzer AG | | | 269 | | | | 27,622 | |
Sunrise Communications Group AG(1)(2) | | | 1,254 | | | | 98,178 | |
| | | | |
| | 16 | | See Notes to Financial Statements. |
Parametric International Equity Fund
July 31, 2015
Portfolio of Investments (Unaudited) — continued
| | | | | | | | |
| Security | | Shares | | | Value | |
| | | | | | | | |
|
Switzerland (continued) | |
Swatch Group, Ltd. (The) | | | 1,267 | | | $ | 103,845 | |
Swatch Group, Ltd. (The), Bearer Shares | | | 601 | | | | 258,831 | |
Swiss Life Holding AG | | | 339 | | | | 79,986 | |
Swiss Prime Site AG | | | 635 | | | | 50,586 | |
Swiss Re AG | | | 2,627 | | | | 236,317 | |
Swisscom AG | | | 611 | | | | 355,362 | |
Syngenta AG | | | 1,503 | | | | 619,192 | |
U-Blox AG | | | 256 | | | | 53,886 | |
Valiant Holding AG | | | 314 | | | | 31,170 | |
Valora Holding AG | | | 105 | | | | 20,411 | |
Vontobel Holding AG | | | 783 | | | | 41,653 | |
Zurich Insurance Group AG | | | 1,002 | | | | 305,119 | |
| | | | | | | | | |
| | | | | | $ | 9,478,669 | |
| | | | | | | | | |
|
United Kingdom — 16.0% | |
3i Group PLC | | | 4,683 | | | $ | 40,396 | |
AA PLC(1) | | | 6,677 | | | | 38,034 | |
Abengoa Yield PLC | | | 2,600 | | | | 65,988 | |
Admiral Group PLC | | | 1,744 | | | | 40,299 | |
Aggreko PLC | | | 3,797 | | | | 71,121 | |
Alent PLC | | | 11,989 | | | | 88,704 | |
Anglo American PLC | | | 14,725 | | | | 185,667 | |
Anite PLC | | | 36,371 | | | | 71,429 | |
AstraZeneca PLC | | | 10,904 | | | | 736,114 | |
Auto Trader Group PLC (1)(2) | | | 16,829 | | | | 88,804 | |
Aveva Group PLC | | | 1,989 | | | | 68,407 | |
Aviva PLC | | | 16,931 | | | | 137,669 | |
Babcock International Group PLC | | | 5,474 | | | | 84,688 | |
BAE Systems PLC | | | 27,684 | | | | 207,275 | |
Berendsen PLC | | | 1,722 | | | | 27,505 | |
Berkeley Group Holdings PLC | | | 1,885 | | | | 98,992 | |
BHP Billiton PLC | | | 21,927 | | | | 402,748 | |
BP PLC | | | 33,808 | | | | 208,248 | |
British American Tobacco PLC | | | 9,238 | | | | 548,516 | |
British Land Co. PLC (The) | | | 6,863 | | | | 90,005 | |
Bunzl PLC | | | 4,454 | | | | 127,492 | |
Burberry Group PLC | | | 2,842 | | | | 71,324 | |
Capita PLC | | | 6,789 | | | | 138,204 | |
Carillion PLC | | | 13,709 | | | | 73,996 | |
Carnival PLC | | | 2,140 | | | | 118,616 | |
Close Brothers Group PLC | | | 2,061 | | | | 46,704 | |
Cobham PLC | | | 15,469 | | | | 63,026 | |
Compass Group PLC | | | 9,959 | | | | 159,301 | |
Computacenter PLC | | | 3,234 | | | | 38,375 | |
Croda International PLC | | | 2,328 | | | | 110,391 | |
CSR PLC | | | 6,722 | | | | 94,242 | |
| | | | | | | | |
| Security | | Shares | | | Value | |
| | | | | | | | |
|
United Kingdom (continued) | |
Daily Mail & General Trust PLC, Class A | | | 3,261 | | | $ | 40,837 | |
Derwent London PLC | | | 788 | | | | 44,672 | |
Diageo PLC | | | 12,937 | | | | 362,660 | |
Dignity PLC | | | 1,144 | | | | 43,633 | |
Direct Line Insurance Group PLC | | | 6,547 | | | | 37,363 | |
Dixons Carphone PLC | | | 6,693 | | | | 47,627 | |
Drax Group PLC | | | 36,743 | | | | 171,030 | |
easyJet PLC | | | 1,477 | | | | 37,895 | |
Electrocomponents PLC | | | 14,300 | | | | 44,443 | |
Essentra PLC | | | 8,366 | | | | 119,097 | |
Experian PLC | | | 9,946 | | | | 186,474 | |
Fidessa Group PLC | | | 1,354 | | | | 50,711 | |
FirstGroup PLC(1) | | | 21,263 | | | | 38,253 | |
Fresnillo PLC | | | 6,349 | | | | 64,039 | |
G4s PLC | | | 10,246 | | | | 43,928 | |
Galliford Try PLC | | | 1,479 | | | | 40,950 | |
GlaxoSmithKline PLC | | | 38,102 | | | | 828,145 | |
Glencore PLC | | | 114,086 | | | | 369,652 | |
Grainger PLC | | | 13,002 | | | | 48,430 | |
Great Portland Estates PLC | | | 2,834 | | | | 36,816 | |
Greene King PLC | | | 3,179 | | | | 42,863 | |
Halma PLC | | | 12,223 | | | | 144,332 | |
Hammerson PLC | | | 5,110 | | | | 52,457 | |
Hargreaves Lansdown PLC | | | 4,354 | | | | 81,283 | |
Howden Joinery Group PLC | | | 5,262 | | | | 40,663 | |
HSBC Holdings PLC | | | 53,240 | | | | 480,888 | |
Imperial Tobacco Group PLC | | | 5,807 | | | | 304,731 | |
Indivior PLC(1) | | | 47,286 | | | | 194,911 | |
Inmarsat PLC | | | 23,719 | | | | 328,457 | |
Innovation Group PLC | | | 103,708 | | | | 52,148 | |
InterContinental Hotels Group PLC | | | 1,851 | | | | 77,746 | |
International Game Technology PLC(1) | | | 2,666 | | | | 52,787 | |
Intertek Group PLC | | | 1,097 | | | | 41,922 | |
J Sainsbury PLC | | | 32,881 | | | | 135,824 | |
Johnson Matthey PLC | | | 2,211 | | | | 100,494 | |
Kingfisher PLC | | | 14,107 | | | | 79,464 | |
Laird PLC | | | 9,172 | | | | 56,395 | |
Land Securities Group PLC | | | 5,329 | | | | 107,926 | |
Legal & General Group PLC | | | 27,751 | | | | 112,870 | |
Lloyds Banking Group PLC | | | 146,864 | | | | 191,248 | |
LondonMetric Property PLC | | | 21,023 | | | | 53,111 | |
Lonmin PLC(1) | | | 41,705 | | | | 33,900 | |
Marks & Spencer Group PLC | | | 13,275 | | | | 112,676 | |
Marston’s PLC | | | 18,673 | | | | 45,475 | |
Mears Group PLC | | | 5,306 | | | | 32,333 | |
Meggitt PLC | | | 9,721 | | | | 70,441 | |
| | | | |
| | 17 | | See Notes to Financial Statements. |
Parametric International Equity Fund
July 31, 2015
Portfolio of Investments (Unaudited) — continued
| | | | | | | | |
| Security | | Shares | | | Value | |
| | | | | | | | |
|
United Kingdom (continued) | |
Merlin Entertainments PLC(2) | | | 4,727 | | | $ | 30,615 | |
Micro Focus International PLC | | | 4,308 | | | | 93,962 | |
Mitie Group PLC | | | 5,570 | | | | 27,982 | |
Mondi PLC | | | 2,542 | | | | 61,021 | |
Moneysupermarket.com Group PLC | | | 20,202 | | | | 92,382 | |
National Grid PLC | | | 71,537 | | | | 952,067 | |
NCC Group PLC | | | 9,827 | | | | 36,079 | |
Next PLC | | | 916 | | | | 114,271 | |
Oxford Instruments PLC | | | 4,584 | | | | 65,400 | |
Pace PLC | | | 12,497 | | | | 70,819 | |
Pearson PLC | | | 4,832 | | | | 90,679 | |
Pennon Group PLC | | | 12,929 | | | | 164,578 | |
Playtech PLC | | | 6,421 | | | | 90,778 | |
Premier Farnell PLC | | | 25,654 | | | | 54,334 | |
Provident Financial PLC | | | 887 | | | | 41,082 | |
Randgold Resources, Ltd. | | | 1,221 | | | | 73,658 | |
Reckitt Benckiser Group PLC | | | 3,663 | | | | 351,275 | |
RELX PLC | | | 7,191 | | | | 125,403 | |
Renishaw PLC | | | 1,171 | | | | 38,182 | |
Rentokil Initial PLC | | | 14,663 | | | | 33,666 | |
Restaurant Group PLC (The) | | | 4,207 | | | | 44,274 | |
Rexam PLC | | | 11,995 | | | | 104,113 | |
Rightmove PLC | | | 1,755 | | | | 99,719 | |
Rolls-Royce Holdings PLC | | | 12,754 | | | | 157,840 | |
Rotork PLC | | | 16,830 | | | | 56,184 | |
Royal Dutch Shell PLC, Class A | | | 34,589 | | | | 991,437 | |
Royal Dutch Shell PLC, Class B | | | 26,445 | | | | 765,717 | |
Royal Mail PLC | | | 6,802 | | | | 53,586 | |
RPC Group PLC | | | 6,241 | | | | 66,258 | |
RSA Insurance Group PLC | | | 10,493 | | | | 84,157 | |
Sage Group PLC (The) | | | 35,041 | | | | 284,782 | |
SDL PLC | | | 5,875 | | | | 36,762 | |
Segro PLC | | | 8,230 | | | | 57,623 | |
Serco Group PLC | | | 19,990 | | | | 40,182 | |
Sky PLC | | | 6,095 | | | | 108,353 | |
Smiths Group PLC | | | 4,467 | | | | 78,608 | |
South32, Ltd.(1) | | | 19,353 | | | | 24,707 | |
Spirax-Sarco Engineering PLC | | | 1,300 | | | | 67,297 | |
Spirent Communications PLC | | | 34,304 | | | | 50,034 | |
Sports Direct International PLC(1) | | | 3,723 | | | | 45,979 | |
SSE PLC | | | 19,233 | | | | 454,903 | |
Standard Chartered PLC | | | 7,172 | | | | 109,664 | |
Synergy Health PLC | | | 6,312 | | | | 171,590 | |
TalkTalk Telecom Group PLC | | | 38,654 | | | | 181,715 | |
Tate & Lyle PLC | | | 14,341 | | | | 121,897 | |
Telecity Group PLC | | | 5,845 | | | | 99,748 | |
| | | | | | | | |
| Security | | Shares | | | Value | |
| | | | | | | | |
|
United Kingdom (continued) | |
Travis Perkins PLC | | | 2,151 | | | $ | 75,422 | |
TT Electronics PLC | | | 18,160 | | | | 42,079 | |
UBM PLC | | | 7,445 | | | | 61,715 | |
UNITE Group PLC (The) | | | 4,128 | | | | 40,645 | |
United Utilities Group PLC | | | 7,906 | | | | 109,977 | |
Victrex PLC | | | 1,878 | | | | 56,710 | |
Vodafone Group PLC | | | 362,450 | | | | 1,372,959 | |
Whitbread PLC | | | 1,494 | | | | 120,960 | |
William Hill PLC | | | 16,136 | | | | 101,948 | |
WM Morrison Supermarkets PLC | | | 37,125 | | | | 105,647 | |
WS Atkins PLC | | | 1,396 | | | | 34,220 | |
Xaar PLC | | | 6,654 | | | | 53,883 | |
Xchanging PLC | | | 20,955 | | | | 31,825 | |
| | | | | | | | | |
| | | | | | $ | 19,199,632 | |
| | | | | | | | | |
| |
Total Common Stocks
(identified cost $111,271,709) | | | $ | 119,260,618 | |
| | | | | | | | | |
|
| Short-Term Investments — 0.3% | |
| | |
| | | | | | | | |
| Description | | Interest
(000’s omitted) | | | Value | |
Eaton Vance Cash Reserves Fund, LLC, 0.20%(4) | | $ | 396 | | | $ | 395,875 | |
| | | | | | | | | |
| | |
Total Short-Term Investments
(identified cost $395,875) | | | | | | $ | 395,875 | |
| | | | | | | | | |
| | |
Total Investments — 99.7%
(identified cost $111,667,584) | | | | | | $ | 119,656,493 | |
| | | | | | | | | |
| | |
Other Assets, Less Liabilities — 0.3% | | | | | | $ | 352,429 | |
| | | | | | | | | |
| | |
Net Assets — 100.0% | | | | | | $ | 120,008,922 | |
| | | | | | | | | |
The percentage shown for each investment category in the Portfolio of Investments is based on net assets.
| | | | |
| ADR | | – | | American Depositary Receipt |
| CDI | | – | | CHESS Depositary Interest |
| PC | | – | | Participation Certificate |
| PFC Shares | | – | | Preference Shares |
| SDR | | – | | Swedish Depositary Receipt |
| (1) | Non-income producing security. |
| (2) | Security exempt from registration pursuant to Rule 144A under the Securities Act of 1933. These securities may be sold in certain transactions (normally to qualified institutional buyers) and remain exempt from registration. At July 31, 2015, the aggregate value of these securities is $528,708 or 0.4% of the Fund’s net assets. |
| (3) | For fair value measurement disclosure purposes, security is categorized as Level 3 (see Note 9). |
| | | | |
| | 18 | | See Notes to Financial Statements. |
Parametric International Equity Fund
July 31, 2015
Portfolio of Investments (Unaudited) — continued
| (4) | Affiliated investment company, available to Eaton Vance portfolios and funds, which invests in high quality, U.S. dollar denominated money market instruments. The rate shown is the annualized seven-day yield as of July 31, 2015. |
| | | | | | | | |
| Currency Concentration of Portfolio | |
| | |
| | | | | | | | |
| Currency | | Percentage
of Net Assets | | | Value | |
Euro | | | 34.1 | % | | $ | 40,892,910 | |
British Pound Sterling | | | 16.3 | | | | 19,502,444 | |
Japanese Yen | | | 15.7 | | | | 18,841,507 | |
Swiss Franc | | | 8.0 | | | | 9,658,497 | |
Australian Dollar | | | 7.9 | | | | 9,509,049 | |
Swedish Krona | | | 3.9 | | | | 4,679,158 | |
Hong Kong Dollar | | | 3.7 | | | | 4,434,877 | |
United States Dollar | | | 2.3 | | | | 2,752,816 | |
Norwegian Krone | | | 1.9 | | | | 2,306,792 | |
Danish Krone | | | 1.9 | | | | 2,268,826 | |
Singapore Dollar | | | 1.7 | | | | 2,049,558 | |
Israeli Shekel | | | 1.3 | | | | 1,592,886 | |
New Zealand Dollar | | | 1.0 | | | | 1,167,173 | |
| | | | | | | | | |
Total Investments | | | 99.7 | % | | $ | 119,656,493 | |
| | | | | | | | | |
| | | | | | | | |
| Sector Classification of Portfolio | |
| | |
| | | | | | | | |
| Sector | | Percentage
of Net Assets | | | Value | |
Financials | | | 12.6 | % | | $ | 15,104,150 | |
Industrials | | | 11.7 | | | | 13,999,601 | |
Consumer Discretionary | | | 11.4 | | | | 13,715,768 | |
Consumer Staples | | | 10.7 | | | | 12,839,011 | |
Materials | | | 10.3 | | | | 12,398,727 | |
Health Care | | | 10.2 | | | | 12,189,643 | |
Telecommunication Services | | | 9.7 | | | | 11,639,019 | |
Information Technology | | | 9.0 | | | | 10,817,944 | |
Utilities | | | 7.5 | | | | 9,002,880 | |
Energy | | | 6.3 | | | | 7,553,875 | |
Short-Term Investments | | | 0.3 | | | | 395,875 | |
| | | | | | | | | |
Total Investments | | | 99.7 | % | | $ | 119,656,493 | |
| | | | | | | | | |
| | | | |
| | 19 | | See Notes to Financial Statements. |
Parametric International Equity Fund
July 31, 2015
Statement of Assets and Liabilities (Unaudited)
| | | | |
| Assets | | July 31, 2015 | |
Unaffiliated investments, at value (identified cost, $111,271,709) | | $ | 119,260,618 | |
Affiliated investment, at value (identified cost, $395,875) | | | 395,875 | |
Cash | | | 23,838 | |
Foreign currency, at value (identified cost, $54,554) | | | 54,667 | |
Dividends receivable | | | 163,854 | |
Interest receivable from affiliated investment | | | 164 | |
Receivable for Fund shares sold | | | 76,163 | |
Tax reclaims receivable | | | 171,764 | |
Receivable from affiliates | | | 32,624 | |
Total assets | | $ | 120,179,567 | |
| |
| Liabilities | | | | |
Payable for Fund shares redeemed | | $ | 52,067 | |
Payable to affiliates: | | | | |
Investment adviser and administration fee | | | 77,093 | |
Distribution and service fees | | | 2,000 | |
Accrued expenses | | | 39,485 | |
Total liabilities | | $ | 170,645 | |
Net Assets | | $ | 120,008,922 | |
| |
| Sources of Net Assets | | | | |
Paid-in capital | | $ | 110,082,889 | |
Accumulated net realized gain | | | 292,436 | |
Accumulated undistributed net investment income | | | 1,654,310 | |
Net unrealized appreciation | | | 7,979,287 | |
Total | | $ | 120,008,922 | |
| |
| Investor Class Shares | | | | |
Net Assets | | $ | 11,648,819 | |
Shares Outstanding | | | 952,570 | |
Net Asset Value, Offering Price and Redemption Price Per Share | | | | |
(net assets ÷ shares of beneficial interest outstanding) | | $ | 12.23 | |
| |
| Institutional Class Shares | | | | |
Net Assets | | $ | 108,360,103 | |
Shares Outstanding | | | 8,835,561 | |
Net Asset Value, Offering Price and Redemption Price Per Share | | | | |
(net assets ÷ shares of beneficial interest outstanding) | | $ | 12.26 | |
| | | | |
| | 20 | | See Notes to Financial Statements. |
Parametric International Equity Fund
July 31, 2015
Statement of Operations (Unaudited)
| | | | |
| Investment Income | | Six Months Ended July 31, 2015 | |
Dividends (net of foreign taxes, $228,172) | | $ | 2,240,170 | |
Interest allocated from affiliated investment | | | 860 | |
Expenses allocated from affiliated investment | | | (64 | ) |
Total investment income | | $ | 2,240,966 | |
| |
| Expenses | | | | |
Investment adviser and administration fee | | $ | 426,032 | |
Distribution and service fees | | | | |
Investor Class | | | 11,005 | |
Trustees’ fees and expenses | | | 3,528 | |
Custodian fee | | | 49,770 | |
Transfer and dividend disbursing agent fees | | | 13,295 | |
Legal and accounting services | | | 23,235 | |
Printing and postage | | | 7,136 | |
Registration fees | | | 18,255 | |
Miscellaneous | | | 21,884 | |
Total expenses | | $ | 574,140 | |
Deduct — | | | | |
Allocation of expenses to affiliates | | $ | 193,976 | |
Total expense reductions | | $ | 193,976 | |
| |
Net expenses | | $ | 380,164 | |
| |
Net investment income | | $ | 1,860,802 | |
| |
| Realized and Unrealized Gain (Loss) | | | | |
Net realized gain (loss) — | | | | |
Investment transactions | | $ | 387,190 | |
Foreign currency transactions | | | 25,683 | |
Net realized gain | | $ | 412,873 | |
Change in unrealized appreciation (depreciation) — | | | | |
Investments | | $ | 5,385,730 | |
Foreign currency | | | (3,909 | ) |
Net change in unrealized appreciation (depreciation) | | $ | 5,381,821 | |
| |
Net realized and unrealized gain | | $ | 5,794,694 | |
| |
Net increase in net assets from operations | | $ | 7,655,496 | |
| | | | |
| | 21 | | See Notes to Financial Statements. |
Parametric International Equity Fund
July 31, 2015
Statements of Changes in Net Assets
| | | | | | | | |
| Increase (Decrease) in Net Assets | | Six Months Ended July 31, 2015
(Unaudited) | | | Year Ended January 31, 2015 | |
From operations — | | | | | | | | |
Net investment income | | $ | 1,860,802 | | | $ | 2,467,163 | |
Net realized gain from investment and foreign currency transactions | | | 412,873 | | | | 8,074,145 | |
Net change in unrealized appreciation (depreciation) from investments and foreign currency | | | 5,381,821 | | | | (10,199,743 | ) |
Net increase in net assets from operations | | $ | 7,655,496 | | | $ | 341,565 | |
Distributions to shareholders — | | | | | | | | |
From net investment income | | | | | | | | |
Investor Class | | $ | — | | | $ | (181,582 | ) |
Institutional Class | | | — | | | | (2,111,617 | ) |
From net realized gain | | | | | | | | |
Investor Class | | | — | | | | (298,365 | ) |
Institutional Class | | | — | | | | (2,931,932 | ) |
Total distributions to shareholders | | $ | — | | | $ | (5,523,496 | ) |
Transactions in shares of beneficial interest — | | | | | | | | |
Proceeds from sale of shares | | | | | | | | |
Investor Class | | $ | 4,698,183 | | | $ | 5,338,950 | |
Institutional Class | | | 30,949,755 | | | | 34,388,019 | |
Net asset value of shares issued to shareholders in payment of distributions declared | | | | | | | | |
Investor Class | | | — | | | | 405,557 | |
Institutional Class | | | — | | | | 2,101,145 | |
Cost of shares redeemed | | | | | | | | |
Investor Class | | | (2,161,204 | ) | | | (10,964,044 | ) |
Institutional Class | | | (13,831,029 | ) | | | (16,308,189 | ) |
Net increase in net assets from Fund share transactions | | $ | 19,655,705 | | | $ | 14,961,438 | |
| | |
Net increase in net assets | | $ | 27,311,201 | | | $ | 9,779,507 | |
| | |
| Net Assets | | | | | | | | |
At beginning of period | | $ | 92,697,721 | | | $ | 82,918,214 | |
At end of period | | $ | 120,008,922 | | | $ | 92,697,721 | |
| | |
Accumulated undistributed (distributions in excess of) net investment income
included in net assets | | | | | | | | |
At end of period | | $ | 1,654,310 | | | $ | (206,492 | ) |
| | | | |
| | 22 | | See Notes to Financial Statements. |
Parametric International Equity Fund
July 31, 2015
Financial Highlights
| | | | | | | | | | | | | | | | | | | | | | | | |
| | | Investor Class | |
| | | Six Months Ended
July 31, 2015
(Unaudited) | | | Year Ended January 31, | | | Period Ended
January 31, 2011(1) | |
| | | | 2015 | | | 2014 | | | 2013 | | | 2012 | | |
Net asset value — Beginning of period | | $ | 11.410 | | | $ | 11.960 | | | $ | 11.180 | | | $ | 9.850 | | | $ | 10.960 | | | $ | 10.000 | |
| | | | | | |
| Income (Loss) From Operations | | | | | | | | | | | | | | | | | | | | | | | | |
Net investment income (loss)(2) | | $ | 0.178 | | | $ | 0.355 | (3) | | $ | 0.195 | | | $ | 0.227 | | | $ | 0.172 | | | $ | (0.020 | ) |
Net realized and unrealized gain (loss) | | | 0.642 | | | | (0.242 | ) | | | 0.822 | | | | 1.370 | | | | (1.073 | ) | | | 1.058 | |
| | | | | | |
Total income (loss) from operations | | $ | 0.820 | | | $ | 0.113 | | | $ | 1.017 | | | $ | 1.597 | | | $ | (0.901 | ) | | $ | 1.038 | |
| | | | | | |
| Less Distributions | | | | | | | | | | | | | | | | | | | | | | | | |
From net investment income | | $ | — | | | $ | (0.251 | ) | | $ | (0.237 | ) | | $ | (0.267 | ) | | $ | (0.209 | ) | | $ | (0.078 | ) |
From net realized gain | | | — | | | | (0.412 | ) | | | — | | | | — | | | | — | | | | — | |
| | | | | | |
Total distributions | | $ | — | | | $ | (0.663 | ) | | $ | (0.237 | ) | | $ | (0.267 | ) | | $ | (0.209 | ) | | $ | (0.078 | ) |
| | | | | | |
Redemption fees(2)(4) | | $ | — | | | $ | — | | | $ | — | | | $ | — | | | $ | — | | | $ | 0.000 | (5) |
| | | | | | |
Net asset value — End of period | | $ | 12.230 | | | $ | 11.410 | | | $ | 11.960 | | | $ | 11.180 | | | $ | 9.850 | | | $ | 10.960 | |
| | | | | | |
Total Return(6) | | | 7.09 | %(7) | | | 1.01 | % | | | 9.04 | % | | | 16.32 | % | | | (8.11 | )% | | | 10.39 | %(7) |
| | | | | | |
| Ratios/Supplemental Data | | | | | | | | | | | | | | | | | | | | | | | | |
Net assets, end of period (000’s omitted) | | $ | 11,649 | | | $ | 8,503 | | | $ | 14,007 | | | $ | 7,038 | | | $ | 12,263 | | | $ | 3,578 | |
Ratios (as a percentage of average daily net assets): | | | | | | | | | | | | | | | | | | | | | | | | |
Expenses(8)(9) | | | 0.90 | %(10) | | | 0.97 | % | | | 1.05 | % | | | 1.29 | % | | | 1.50 | % | | | 1.50 | %(10) |
Net investment income (loss) | | | 2.96 | %(10) | | | 2.83 | %(3) | | | 1.65 | % | | | 2.22 | % | | | 1.68 | % | | | (0.22 | )%(10) |
Portfolio Turnover | | | 6 | %(7) | | | 63 | % | | | 35 | % | | | 44 | % | | | 60 | % | | | 15 | %(7) |
| (1) | For the period from the start of business, April 1, 2010, to January 31, 2011. |
| (2) | Computed using average shares outstanding. |
| (3) | Net investment income per share reflects special dividends which amounted to $0.059 per share. Excluding special dividends, the ratio of net investment income to average daily net assets would have been 2.35%. |
| (4) | Redemption fees were discontinued as of January 1, 2011. |
| (5) | Amount is less than $0.0005. |
| (6) | Returns are historical and are calculated by determining the percentage change in net asset value with all distributions reinvested and do not reflect the effect of sales charges, if applicable, which were eliminated effective March 1, 2013. |
| (8) | Excludes the effect of custody fee credits, if any, of less than 0.005%. |
| (9) | The investment adviser, sub-adviser and administrator subsidized certain operating expenses (equal to 0.34%, 0.32%, 0.29%, 0.29%, 0.25% and 0.72% of average daily net assets for the six months ended July 31, 2015, the years ended January 31, 2015, 2014, 2013 and 2012 and the period ended January 31, 2011, respectively). Absent this subsidy, total return would be lower. |
| | | | |
| | 23 | | See Notes to Financial Statements. |
Parametric International Equity Fund
July 31, 2015
Financial Highlights — continued
| | | | | | | | | | | | | | | | | | | | | | | | |
| | | Institutional Class | |
| | | Six Months Ended
July 31, 2015
(Unaudited) | | | Year Ended January 31, | | | Period Ended
January 31, 2011(1) | |
| | | | 2015 | | | 2014 | | | 2013 | | | 2012 | | |
Net asset value — Beginning of period | | $ | 11.430 | | | $ | 11.990 | | | $ | 11.200 | | | $ | 9.880 | | | $ | 10.970 | | | $ | 10.000 | |
| | | | | | |
| Income (Loss) From Operations | | | | | | | | | | | | | | | | | | | | | | | | |
Net investment income(2) | | $ | 0.199 | | | $ | 0.333 | (3) | | $ | 0.259 | | | $ | 0.252 | | | $ | 0.239 | | | $ | 0.102 | |
Net realized and unrealized gain (loss) | | | 0.631 | | | | (0.184 | ) | | | 0.790 | | | | 1.375 | | | | (1.104 | ) | | | 0.950 | |
| | | | | | |
Total income (loss) from operations | | $ | 0.830 | | | $ | 0.149 | | | $ | 1.049 | | | $ | 1.627 | | | $ | (0.865 | ) | | $ | 1.052 | |
| | | | | | |
| Less Distributions | | | | | | | | | | | | | | | | | | | | | | | | |
From net investment income | | $ | — | | | $ | (0.297 | ) | | $ | (0.259 | ) | | $ | (0.307 | ) | | $ | (0.225 | ) | | $ | (0.082 | ) |
From net realized gain | | | — | | | | (0.412 | ) | | | — | | | | — | | | | — | | | | — | |
| | | | | | |
Total distributions | | $ | — | | | $ | (0.709 | ) | | $ | (0.259 | ) | | $ | (0.307 | ) | | $ | (0.225 | ) | | $ | (0.082 | ) |
| | | | | | |
Redemption fees(2)(4) | | $ | — | | | $ | — | | | $ | — | | | $ | — | | | $ | — | | | $ | 0.000 | (5) |
| | | | | | |
Net asset value — End of period | | $ | 12.260 | | | $ | 11.430 | | | $ | 11.990 | | | $ | 11.200 | | | $ | 9.880 | | | $ | 10.970 | |
| | | | | | |
Total Return(6) | | | 7.26 | %(7) | | | 1.22 | % | | | 9.31 | % | | | 16.59 | % | | | (7.76 | )% | | | 10.54 | %(7) |
| | | | | | |
| Ratios/Supplemental Data | | | | | | | | | | | | | | | | | | | | | | | | |
Net assets, end of period (000’s omitted) | | $ | 108,360 | | | $ | 84,195 | | | $ | 68,911 | | | $ | 54,167 | | | $ | 45,957 | | | $ | 41,969 | |
Ratios (as a percentage of average daily net assets): | | | | | | | | | | | | | | | | | | | | | | | | |
Expenses(8)(9) | | | 0.65 | %(10) | | | 0.72 | % | | | 0.80 | % | | | 1.02 | % | | | 1.25 | % | | | 1.25 | %(10) |
Net investment income | | | 3.30 | %(10) | | | 2.66 | %(3) | | | 2.20 | % | | | 2.45 | % | | | 2.28 | % | | | 1.20 | %(10) |
Portfolio Turnover | | | 6 | %(7) | | | 63 | % | | | 35 | % | | | 44 | % | | | 60 | % | | | 15 | %(7) |
| (1) | For the period from the start of business, April 1, 2010, to January 31, 2011. |
| (2) | Computed using average shares outstanding. |
| (3) | Net investment income per share reflects special dividends which amounted to $0.048 per share. Excluding special dividends, the ratio of net investment income to average daily net assets would have been 2.28%. |
| (4) | Redemption fees were discontinued as of January 1, 2011. |
| (5) | Amount is less than $0.0005. |
| (6) | Returns are historical and are calculated by determining the percentage change in net asset value with all distributions reinvested. |
| (8) | Excludes the effect of custody fee credits, if any, of less than 0.005%. |
| (9) | The investment adviser, sub-adviser and administrator subsidized certain operating expenses (equal to 0.34%, 0.32%, 0.29%, 0.30%, 0.25% and 0.72% of average daily net assets for the six months ended July 31, 2015, the years ended January 31, 2015, 2014, 2013 and 2012 and the period ended January 31, 2011, respectively). Absent this subsidy, total return would be lower. |
| | | | |
| | 24 | | See Notes to Financial Statements. |
Parametric International Equity Fund
July 31, 2015
Notes to Financial Statements (Unaudited)
1 Significant Accounting Policies
Parametric International Equity Fund (the Fund) is a diversified series of Eaton Vance Mutual Funds Trust (the Trust). The Trust is a Massachusetts business trust registered under the Investment Company Act of 1940, as amended (the 1940 Act), as an open-end management investment company. The Fund’s investment objective is to seek long-term capital appreciation. As of July 31, 2015, the Fund offered Investor Class and Institutional Class shares, and effective August 10, 2015, began offering Class R and Class R6 shares, all of which are sold at net asset value and are not subject to a sales charge. Each class represents a pro-rata interest in the Fund, but votes separately on class-specific matters and (as noted below) is subject to different expenses. Realized and unrealized gains and losses and net investment income and losses, other than class-specific expenses, are allocated daily to each class of shares based on the relative net assets of each class to the total net assets of the Fund. Each class of shares differs in its distribution plan and certain other class-specific expenses.
The following is a summary of significant accounting policies of the Fund. The policies are in conformity with accounting principles generally accepted in the United States of America (U.S. GAAP). The Fund is an investment company and follows accounting and reporting guidance in the Financial Accounting Standards Board (“FASB”) Accounting Standards Codification Topic 946.
A Investment Valuation — The following methodologies are used to determine the market value or fair value of investments.
Equity Securities. Equity securities listed on a U.S. securities exchange generally are valued at the last sale or closing price on the day of valuation or, if no sales took place on such date, at the mean between the closing bid and asked prices therefore on the exchange where such securities are principally traded. Equity securities listed on the NASDAQ Global or Global Select Market generally are valued at the NASDAQ official closing price. Unlisted or listed securities for which closing sales prices or closing quotations are not available are valued at the mean between the latest available bid and asked prices.
Foreign Securities and Currencies. Foreign securities and currencies are valued in U.S. dollars, based on foreign currency exchange rate quotations supplied by a third party pricing service. The pricing service uses a proprietary model to determine the exchange rate. Inputs to the model include reported trades and implied bid/ask spreads. The daily valuation of exchange-traded foreign securities generally is determined as of the close of trading on the principal exchange on which such securities trade. Events occurring after the close of trading on foreign exchanges may result in adjustments to the valuation of foreign securities to more accurately reflect their fair value as of the close of regular trading on the New York Stock Exchange. When valuing foreign equity securities that meet certain criteria, the Fund’s Trustees have approved the use of a fair value service that values such securities to reflect market trading that occurs after the close of the applicable foreign markets of comparable securities or other instruments that have a strong correlation to the fair-valued securities.
Affiliated Fund. The Fund may invest in Eaton Vance Cash Reserves Fund, LLC (Cash Reserves Fund), an affiliated investment company managed by Eaton Vance Management (EVM). The value of the Fund’s investment in Cash Reserves Fund reflects the Fund’s proportionate interest in its net assets. Cash Reserves Fund generally values its investment securities utilizing the amortized cost valuation technique in accordance with Rule 2a-7 under the 1940 Act. This technique involves initially valuing a portfolio security at its cost and thereafter assuming a constant amortization to maturity of any discount or premium. If amortized cost is determined not to approximate fair value, Cash Reserves Fund may value its investment securities based on available market quotations provided by a third party pricing service.
Fair Valuation. Investments for which valuations or market quotations are not readily available or are deemed unreliable are valued at fair value using methods determined in good faith by or at the direction of the Trustees of the Fund in a manner that fairly reflects the security’s value, or the amount that the Fund might reasonably expect to receive for the security upon its current sale in the ordinary course. Each such determination is based on a consideration of relevant factors, which are likely to vary from one pricing context to another. These factors may include, but are not limited to, the type of security, the existence of any contractual restrictions on the security’s disposition, the price and extent of public trading in similar securities of the issuer or of comparable companies or entities, quotations or relevant information obtained from broker/dealers or other market participants, information obtained from the issuer, analysts, and/or the appropriate stock exchange (for exchange-traded securities), an analysis of the company’s or entity’s financial condition, and an evaluation of the forces that influence the issuer and the market(s) in which the security is purchased and sold.
B Investment Transactions — Investment transactions for financial statement purposes are accounted for on a trade date basis. Realized gains and losses on investments sold are determined on the basis of identified cost.
C Income — Dividend income is recorded on the ex-dividend date for dividends received in cash and/or securities. However, if the ex-dividend date has passed, certain dividends from foreign securities are recorded as the Fund is informed of the ex-dividend date. Withholding taxes on foreign dividends and capital gains have been provided for in accordance with the Fund’s understanding of the applicable countries’ tax rules and rates. Interest income is recorded on the basis of interest accrued, adjusted for amortization of premium or accretion of discount.
D Federal Taxes — The Fund’s policy is to comply with the provisions of the Internal Revenue Code applicable to regulated investment companies and to distribute to shareholders each year substantially all of its net investment income, and all or substantially all of its net realized capital gains. Accordingly, no provision for federal income or excise tax is necessary.
As of July 31, 2015, the Fund had no uncertain tax positions that would require financial statement recognition, de-recognition, or disclosure. The Fund files a U.S. federal income tax return annually after its fiscal year-end, which is subject to examination by the Internal Revenue Service for a period of three years from the date of filing.
Parametric International Equity Fund
July 31, 2015
Notes to Financial Statements (Unaudited) — continued
E Expenses — The majority of expenses of the Trust are directly identifiable to an individual fund. Expenses which are not readily identifiable to a specific fund are allocated taking into consideration, among other things, the nature and type of expense and the relative size of the funds.
F Expense Reduction — State Street Bank and Trust Company (SSBT) serves as custodian of the Fund. Pursuant to the custodian agreement, SSBT receives a fee reduced by credits, which are determined based on the average daily cash balance the Fund maintains with SSBT. All credit balances, if any, used to reduce the Fund’s custodian fees are reported as a reduction of expenses in the Statement of Operations.
G Foreign Currency Translation — Investment valuations, other assets, and liabilities initially expressed in foreign currencies are translated each business day into U.S. dollars based upon current exchange rates. Purchases and sales of foreign investment securities and income and expenses denominated in foreign currencies are translated into U.S. dollars based upon currency exchange rates in effect on the respective dates of such transactions. Recognized gains or losses on investment transactions attributable to changes in foreign currency exchange rates are recorded for financial statement purposes as net realized gains and losses on investments. That portion of unrealized gains and losses on investments that results from fluctuations in foreign currency exchange rates is not separately disclosed.
H Use of Estimates — The preparation of the financial statements in conformity with U.S. GAAP requires management to make estimates and assumptions that affect the reported amounts of assets and liabilities at the date of the financial statements and the reported amounts of income and expense during the reporting period. Actual results could differ from those estimates.
I Indemnifications — Under the Trust’s organizational documents, its officers and Trustees may be indemnified against certain liabilities and expenses arising out of the performance of their duties to the Fund. Under Massachusetts law, if certain conditions prevail, shareholders of a Massachusetts business trust (such as the Trust) could be deemed to have personal liability for the obligations of the Trust. However, the Trust’s Declaration of Trust contains an express disclaimer of liability on the part of Fund shareholders and the By-laws provide that the Trust shall assume the defense on behalf of any Fund shareholders. Moreover, the By-laws also provide for indemnification out of Fund property of any shareholder held personally liable solely by reason of being or having been a shareholder for all loss or expense arising from such liability. Additionally, in the normal course of business, the Fund enters into agreements with service providers that may contain indemnification clauses. The Fund’s maximum exposure under these arrangements is unknown as this would involve future claims that may be made against the Fund that have not yet occurred.
J Interim Financial Statements — The interim financial statements relating to July 31, 2015 and for the six months then ended have not been audited by an independent registered public accounting firm, but in the opinion of the Fund’s management, reflect all adjustments, consisting only of normal recurring adjustments, necessary for the fair presentation of the financial statements.
2 Distributions to Shareholders and Income Tax Information
It is the present policy of the Fund to make at least one distribution annually (normally in December) of all or substantially all of its net investment income and to distribute annually all or substantially all of its net realized capital gains. Distributions to shareholders are recorded on the ex-dividend date. Distributions are declared separately for each class of shares. Shareholders may reinvest income and capital gain distributions in additional shares of the same class of the Fund at the net asset value as of the ex-dividend date or, at the election of the shareholder, receive distributions in cash. Distributions to shareholders are determined in accordance with income tax regulations, which may differ from U.S. GAAP. As required by U.S. GAAP, only distributions in excess of tax basis earnings and profits are reported in the financial statements as a return of capital. Permanent differences between book and tax accounting relating to distributions are reclassified to paid-in capital. For tax purposes, distributions from short-term capital gains are considered to be from ordinary income.
The cost and unrealized appreciation (depreciation) of investments of the Fund at July 31, 2015, as determined on a federal income tax basis, were as follows:
| | | | |
| |
Aggregate cost | | $ | 112,030,903 | |
| |
Gross unrealized appreciation | | $ | 16,033,104 | |
Gross unrealized depreciation | | | (8,407,514 | ) |
| |
Net unrealized appreciation | | $ | 7,625,590 | |
3 Investment Adviser and Administration Fee and Other Transactions with Affiliates
The investment adviser and administration fee is earned by EVM as compensation for investment advisory and administrative services rendered to the Fund. Pursuant to the investment advisory and administrative agreement and subsequent fee reduction agreement between the Fund and EVM, the fee is computed at an annual rate of 0.75% of the Fund’s average daily net assets up to $500 million and is payable monthly. On net assets of $500 million and
Parametric International Equity Fund
July 31, 2015
Notes to Financial Statements (Unaudited) — continued
over, the annual fee is reduced. Pursuant to an additional fee reduction agreement effective August 10, 2015, the fee will be computed at an annual rate of 0.65% of the Fund’s average daily net assets up to $500 million and a reduced rate on net assets of $500 million and over. The fee reductions cannot be terminated or reduced without the approval of a majority vote of the Trustees of the Fund who are not interested persons of EVM or the Fund and by the vote of a majority of shareholders. For the six months ended July 31, 2015, the investment adviser and administration fee amounted to $426,032 or 0.75% (annualized) of the Fund’s average daily net assets. Pursuant to a sub-advisory agreement, EVM has delegated the investment management of the Fund to Parametric Portfolio Associates LLC (Parametric), a majority-owned subsidiary of Eaton Vance Corp. EVM pays Parametric a portion of its advisory and administration fee for sub-advisory services provided to the Fund. The Fund invests its cash in Cash Reserves Fund. EVM does not currently receive a fee for advisory services provided to Cash Reserves Fund.
EVM and Parametric have agreed to reimburse the Fund’s expenses to the extent that total annual operating expenses (relating to ordinary operating expenses only) exceed 0.90% and 0.65% of the Fund’s average daily net assets for Investor Class and Institutional Class, respectively. This agreement may be changed or terminated after August 10, 2016. Pursuant to this agreement, EVM and Parametric were allocated $193,976 in total of the Fund’s operating expenses for the six months ended July 31, 2015.
EVM provides sub-transfer agency and related services to the Fund pursuant to a Sub-Transfer Agency Support Services Agreement. For the six months ended July 31, 2015, EVM earned $810 from the Fund pursuant to such agreement, which is included in transfer and dividend disbursing agent fees on the Statement of Operations. Eaton Vance Distributors, Inc. (EVD), an affiliate of EVM and the Fund’s principal underwriter, received distribution and services fees from Investor Class (see Note 4).
Trustees and officers of the Fund who are members of EVM’s organization receive remuneration for their services to the Fund out of the investment adviser and administration fee. Trustees of the Fund who are not affiliated with EVM may elect to defer receipt of all or a percentage of their annual fees in accordance with the terms of the Trustees Deferred Compensation Plan. For the six months ended July 31, 2015, no significant amounts have been deferred. Certain officers and Trustees of the Fund are officers of EVM.
4 Distribution Plan
The Fund has in effect a distribution plan for Investor Class shares (Investor Class Plan) pursuant to Rule 12b-1 under the 1940 Act. Pursuant to the Investor Class Plan, the Fund pays EVD a distribution and service fee of 0.25% per annum of its average daily net assets attributable to Investor Class shares for distribution services and facilities provided to the Fund by EVD, as well as for personal services and/or the maintenance of shareholder accounts. Distribution and service fees paid or accrued to EVD for the six months ended July 31, 2015 amounted to $11,005 for Investor Class shares.
Distribution and service fees are subject to the limitations contained in the Financial Industry Regulatory Authority’s NASD Conduct Rule 2830(d).
5 Purchases and Sales of Investments
Purchases and sales of investments, other than short-term obligations, aggregated $26,841,867 and $6,587,451, respectively, for the six months ended July 31, 2015.
6 Shares of Beneficial Interest
The Fund’s Declaration of Trust permits the Trustees to issue an unlimited number of full and fractional shares of beneficial interest (without par value). Such shares may be issued in a number of different series (such as the Fund) and classes. Transactions in Fund shares were as follows:
| | | | | | | | |
| Investor Class | | Six Months Ended
July 31, 2015
(Unaudited) | | | Year Ended
January 31, 2015 | |
| | |
Sales | | | 386,153 | | | | 418,943 | |
Issued to shareholders electing to receive payments of distributions in Fund shares | | | — | | | | 35,420 | |
Redemptions | | | (178,521 | ) | | | (880,596 | ) |
| | |
Net increase (decrease) | | | 207,632 | | | | (426,233 | ) |
Parametric International Equity Fund
July 31, 2015
Notes to Financial Statements (Unaudited) — continued
| | | | | | | | |
| Institutional Class | | Six Months Ended
July 31, 2015
(Unaudited) | | | Year Ended
January 31, 2015 | |
| | |
Sales | | | 2,611,089 | | | | 2,733,329 | |
Issued to shareholders electing to receive payments of distributions in Fund shares | | | — | | | | 183,186 | |
Redemptions | | | (1,140,035 | ) | | | (1,297,574 | ) |
| | |
Net increase | | | 1,471,054 | | | | 1,618,941 | |
At July 31, 2015, an Eaton Vance collective investment trust and donor advised and pooled income funds (established and maintained by a public charity) managed by EVM owned in the aggregate 44.1% of the value of the outstanding shares of the Fund.
7 Line of Credit
The Fund participates with other portfolios and funds managed by EVM and its affiliates in a $750 million unsecured line of credit agreement with a group of banks, which is in effect through September 7, 2015. Borrowings are made by the Fund solely to facilitate the handling of unusual and/or unanticipated short-term cash requirements. Interest is charged to the Fund based on its borrowings at an amount above either the Eurodollar rate or Federal Funds rate. In addition, a fee computed at an annual rate of 0.08% on the daily unused portion of the line of credit is allocated among the participating portfolios and funds at the end of each quarter. Because the line of credit is not available exclusively to the Fund, it may be unable to borrow some or all of its requested amounts at any particular time. The Fund did not have any significant borrowings or allocated fees during the six months ended July 31, 2015.
On September 4, 2015, the Fund renewed its line of credit agreement, which expires September 2, 2016. Under the terms of the renewed credit agreement, the commitment amount was reduced to $625 million and the commitment fee on the unused portion of the line of credit was changed to an annual rate of 0.10%.
8 Risks Associated with Foreign Investments
Investing in securities issued by companies whose principal business activities are outside the United States may involve significant risks not present in domestic investments. For example, there is generally less publicly available information about foreign companies, particularly those not subject to the disclosure and reporting requirements of the U.S. securities laws. Certain foreign issuers are generally not bound by uniform accounting, auditing, and financial reporting requirements and standards of practice comparable to those applicable to domestic issuers. Investments in foreign securities also involve the risk of possible adverse changes in investment or exchange control regulations, expropriation or confiscatory taxation, limitation on the removal of funds or other assets of the Fund, political or financial instability or diplomatic and other developments which could affect such investments. Foreign securities markets, while growing in volume and sophistication, are generally not as developed as those in the United States, and securities of some foreign issuers (particularly those located in developing countries) may be less liquid and more volatile than securities of comparable U.S. companies. In general, there is less overall governmental supervision and regulation of foreign securities markets, broker/dealers and issuers than in the United States.
9 Fair Value Measurements
Under generally accepted accounting principles for fair value measurements, a three-tier hierarchy to prioritize the assumptions, referred to as inputs, is used in valuation techniques to measure fair value. The three-tier hierarchy of inputs is summarized in the three broad levels listed below.
| • | | Level 1 – quoted prices in active markets for identical investments |
| • | | Level 2 – other significant observable inputs (including quoted prices for similar investments, interest rates, prepayment speeds, credit risk, etc.) |
| • | | Level 3 – significant unobservable inputs (including a fund’s own assumptions in determining the fair value of investments) |
In cases where the inputs used to measure fair value fall in different levels of the fair value hierarchy, the level disclosed is determined based on the lowest level input that is significant to the fair value measurement in its entirety. The inputs or methodology used for valuing securities are not necessarily an indication of the risk associated with investing in those securities.
Parametric International Equity Fund
July 31, 2015
Notes to Financial Statements (Unaudited) — continued
At July 31, 2015, the hierarchy of inputs used in valuing the Fund’s investments, which are carried at value, were as follows:
| | | | | | | | | | | | | | | | |
| Asset Description | | Level 1 | | | Level 2 | | | Level 3* | | | Total | |
| | | | |
Common Stocks | | | | | | | | | | | | | | | | |
Asia/Pacific | | $ | 467,684 | | | $ | 36,040,787 | | | $ | 0 | | | $ | 36,508,471 | |
Developed Europe | | | 1,345,664 | | | | 79,078,857 | | | | — | | | | 80,424,521 | |
Developed Middle East | | | 700,007 | | | | 1,627,619 | | | | — | | | | 2,327,626 | |
| | | | |
Total Common Stocks | | $ | 2,513,355 | | | $ | 116,747,263 | ** | | $ | 0 | | | $ | 119,260,618 | |
| | | | |
Short-Term Investments | | $ | — | | | $ | 395,875 | | | $ | — | | | $ | 395,875 | |
| | | | |
Total Investments | | $ | 2,513,355 | | | $ | 117,143,138 | | | $ | 0 | | | $ | 119,656,493 | |
| * | None of the unobservable inputs for Level 3 assets, individually or collectively, had a material impact on the Fund. |
| ** | Includes foreign equity securities whose values were adjusted to reflect market trading of comparable securities or other correlated instruments that occurred after the close of trading in their applicable foreign markets. |
Level 3 investments at the beginning and/or end of the period in relation to net assets were not significant and accordingly, a reconciliation of Level 3 assets for the six months ended July 31, 2015 is not presented. At July 31, 2015, the value of investments transferred between Level 1 and Level 2 during the six months then ended was not significant.
Parametric International Equity Fund
July 31, 2015
Board of Trustees’ Contract Approval
Overview of the Contract Review Process
The Investment Company Act of 1940, as amended (the “1940 Act”), provides, in substance, that each investment advisory agreement between a fund and its investment adviser will continue in effect from year to year only if its continuation is approved at least annually by the fund’s board of trustees, including by a vote of a majority of the trustees who are not “interested persons” of the fund (“Independent Trustees”), cast in person at a meeting called for the purpose of considering such approval.
At a meeting of the Boards of Trustees (each a “Board”) of the registered investment companies advised, administered and/or distributed by Eaton Vance Management or its affiliates (the “Eaton Vance Funds”) held on April 27, 2015, the Board, including a majority of the Independent Trustees, voted to approve continuation of existing investment advisory and sub-advisory agreements for the Eaton Vance Funds for an additional one-year period. In voting its approval, the Board relied upon the affirmative recommendation of its Contract Review Committee, which is a committee comprised exclusively of Independent Trustees. Prior to making its recommendation, the Contract Review Committee reviewed information furnished by each adviser to the Eaton Vance Funds (including information specifically requested by the Board) for a series of meetings of the Contract Review Committee held between February and April 2015. The Contract Review Committee also considered information received at prior meetings of the Board and its committees, as relevant to its annual evaluation of the investment advisory and sub-advisory agreements.
The information that the Board considered included, among other things, the following:
Information about Fees, Performance and Expenses
| • | | A report from an independent data provider comparing the advisory and related fees paid by each fund with fees paid by comparable funds as identified by the data provider (“comparable funds”); |
| • | | A report from an independent data provider comparing each fund’s total expense ratio and its components to comparable funds; |
| • | | A report from an independent data provider comparing the investment performance of each fund (including, where relevant, yield data, Sharpe ratios and information ratios) to the investment performance of comparable funds over various time periods; |
| • | | Data regarding investment performance in comparison to benchmark indices and customized peer groups identified by the adviser in consultation with the Board; |
| • | | For each fund, comparative information concerning the fees charged and the services provided by each adviser in managing other accounts (including mutual funds, other collective investment funds and institutional accounts) using investment strategies and techniques similar to those used in managing such fund; |
| • | | Profitability analyses for each adviser with respect to each fund; |
Information about Portfolio Management and Trading
| • | | Descriptions of the investment management services provided to each fund, including the investment strategies and processes it employs; |
| • | | The procedures and processes used to determine the fair value of fund assets and actions taken to monitor and test the effectiveness of such procedures and processes; |
| • | | Information about each adviser’s policies and practices with respect to trading, including each adviser’s processes for monitoring best execution of portfolio transactions; |
| • | | Information about the allocation of brokerage transactions and the benefits received by each adviser as a result of brokerage allocation, including information concerning the acquisition of research through client commission arrangements and policies with respect to “soft dollars”; |
| • | | Data relating to portfolio turnover rates of each fund; |
Information about each Adviser
| • | | Reports detailing the financial results and condition of each adviser; |
| • | | Descriptions of the qualifications, education and experience of the individual investment professionals whose responsibilities include portfolio management and investment research for the funds, and information relating to their compensation and responsibilities with respect to managing other mutual funds and investment accounts; |
| • | | The Code of Ethics of each adviser and its affiliates, together with information relating to compliance with and the administration of such codes; |
| • | | Policies and procedures relating to proxy voting and the handling of corporate actions and class actions; |
| • | | Information concerning the resources devoted to compliance efforts undertaken by each adviser and its affiliates (including descriptions of various compliance programs) and their record of compliance; |
| • | | Descriptions of the business continuity and disaster recovery plans of each adviser and its affiliates; |
| • | | A description of Eaton Vance Management’s procedures for overseeing third party advisers and sub-advisers, including with respect to regulatory and compliance issues, investment management and other matters; |
Parametric International Equity Fund
July 31, 2015
Board of Trustees’ Contract Approval — continued
Other Relevant Information
| • | | Information concerning the nature, cost and character of the administrative and other non-investment management services provided by Eaton Vance Management and its affiliates; |
| • | | Information concerning management of the relationship with the custodian, subcustodians and fund accountants by each adviser or the funds’ administrator; and |
| • | | The terms of each investment advisory agreement. |
Over the course of the twelve-month period ended April 30, 2015, with respect to one or more funds, the Board met nine times and the Contract Review Committee, the Audit Committee, the Governance Committee, the Portfolio Management Committee and the Compliance Reports and Regulatory Matters Committee, each of which is a Committee comprised solely of Independent Trustees, met eight, seventeen, seven, eleven and thirteen times, respectively. At such meetings, the Trustees participated in investment and performance reviews with the portfolio managers and other investment professionals of each adviser relating to each fund, and considered the investment and trading strategies used in pursuing each fund’s investment objective, including, where relevant, the use of derivative instruments, as well as processes for monitoring best execution of portfolio transactions and risk management techniques. The Board and its Committees also evaluated issues pertaining to industry and regulatory developments, compliance procedures, fund governance and other issues with respect to the funds, and received and participated in reports and presentations provided by Eaton Vance Management and other fund advisers with respect to such matters. In addition to the formal meetings of the Board and its Committees, the Independent Trustees hold regular teleconferences in between meetings to discuss, among other topics, matters relating to the continuation of investment advisory and sub-advisory agreements.
For funds that invest through one or more underlying portfolios, the Board considered similar information about the portfolio(s) when considering the approval of investment advisory agreements. In addition, in cases where the fund’s investment adviser has engaged a sub-adviser, the Board considered similar information about the sub-adviser when considering the approval of any sub-advisory agreement.
The Contract Review Committee was assisted throughout the contract review process by Goodwin Procter LLP, legal counsel for the Independent Trustees. The members of the Contract Review Committee relied upon the advice of such counsel and their own business judgment in determining the material factors to be considered in evaluating each investment advisory and sub-advisory agreement and the weight to be given to each such factor. The conclusions reached with respect to each investment advisory and sub-advisory agreement were based on a comprehensive evaluation of all the information provided and not any single factor. Moreover, each member of the Contract Review Committee may have placed varying emphasis on particular factors in reaching conclusions with respect to each investment advisory and sub-advisory agreement. In evaluating each investment advisory and sub-advisory agreement, including the specific fee structures and other terms of the agreements, the Contract Review Committee was informed by multiple years of analysis and discussion among the Independent Trustees and the Eaton Vance Funds’ advisers and sub-advisers.
Results of the Process
Based on its consideration of the foregoing, and such other information as it deemed relevant, including the factors and conclusions described below, the Contract Review Committee concluded that the continuation of the investment advisory and administrative agreement of Parametric International Equity Fund (the “Fund”) with Eaton Vance Management (the “Adviser”) and the sub-advisory agreement with Parametric Portfolio Associates LLC (the “Sub-adviser”), an affiliate of the Adviser, including their fee structures, is in the interests of shareholders and, therefore, the Contract Review Committee recommended to the Board approval of each agreement. The Board accepted the recommendation of the Contract Review Committee as well as the factors considered and conclusions reached by the Contract Review Committee with respect to the agreements. Accordingly, the Board, including a majority of the Independent Trustees, voted to approve continuation of the investment advisory and administrative agreement and the sub-advisory agreement for the Fund.
Nature, Extent and Quality of Services
In considering whether to approve the investment advisory and administrative agreement and the sub-advisory agreement of the Fund, the Board evaluated the nature, extent and quality of services provided to the Fund by the Adviser and the Sub-adviser.
The Board considered the Adviser’s and the Sub-adviser’s management capabilities and investment process with respect to the types of investments held by the Fund, including the education, experience and number of its investment professionals and other personnel who provide portfolio management, investment research, and similar services to the Fund, including recent changes to such personnel. With respect to the Adviser, the Board considered the Adviser’s responsibilities supervising the Sub-adviser. With respect to the Sub-adviser, the Board considered the abilities and experience of investment personnel in analyzing factors such as special considerations relevant to investing in global markets. The Board noted the Adviser’s in-house equity research capabilities. With respect to the Sub-adviser, the Board noted the Sub-adviser’s experience in deploying quantitative-based investment strategies. The Board also took into account the resources dedicated to portfolio management and other services, as well as the compensation methods of the Adviser and other factors, such as the reputation and resources of the Adviser to recruit and retain investment personnel. In addition, the Board considered the time and attention devoted to the Fund by senior management, as well as the infrastructure, operational capabilities and support staff in place to assist in the management of the Fund, including the provision of administrative services.
Parametric International Equity Fund
July 31, 2015
Board of Trustees’ Contract Approval — continued
The Board considered the compliance programs of the Adviser and relevant affiliates thereof, including the Sub-adviser. Among other matters, the Board considered compliance and reporting matters relating to personal trading by investment personnel, selective disclosure of portfolio holdings, late trading, frequent trading, portfolio valuation, business continuity and the allocation of investment opportunities. The Board also considered the responses of the Adviser and its affiliates to requests in recent years from regulatory authorities such as the Securities and Exchange Commission and the Financial Industry Regulatory Authority.
The Board considered shareholder and other administrative services provided or managed by the Adviser and its affiliates, including transfer agency and accounting services. The Board evaluated the benefits to shareholders of investing in a fund that is a part of a large family of funds, including the ability, in many cases, to exchange an investment among different funds without incurring additional sales charges.
After consideration of the foregoing factors, among others, the Board concluded that the nature, extent and quality of services provided by the Adviser and the Sub-adviser, taken as a whole, are appropriate and consistent with the terms of the investment advisory and administrative agreement and the sub-advisory agreement.
Fund Performance
The Board compared the Fund’s investment performance to that of comparable funds and appropriate benchmark indices. The Board’s review included comparative performance data for the one and three-year periods ended September 30, 2014 for the Fund. The Board considered various factors that contributed to the Fund’s relative underperformance during the three-year period, including the rules-based strategy employed by the Sub-adviser in managing the Fund, which tends to result in relative underperformance during periods of strong equity markets. The Board concluded that the performance of the Fund was satisfactory.
Management Fees and Expenses
The Board considered contractual fee rates payable by the Fund for advisory and administrative services (referred to collectively as “management fees”). As part of its review, the Board considered the Fund’s management fees and total expense ratio for the year ended September 30, 2014, as compared to those of comparable funds, before and after giving effect to any undertaking to waive fees or reimburse expenses. The Board also considered factors that had an impact on Fund expense ratios, as identified by management in response to inquiries from the Contract Review Committee, as well as actions taken by management in recent years to reduce expenses at the fund complex level.
After considering the foregoing information, and in light of the nature, extent and quality of the services provided by the Adviser and the Sub-adviser, the Board concluded that the management fees charged for advisory and related services are reasonable.
Profitability
The Board considered the level of profits realized by the Adviser and relevant affiliates thereof, including the Sub-adviser, in providing investment advisory and administrative services to the Fund and to all Eaton Vance Funds as a group. The Board considered the level of profits realized without regard to revenue sharing or other payments by the Adviser and its affiliates to third parties in respect of distribution services. The Board also considered other direct or indirect benefits received by the Adviser and its affiliates, including the Sub-adviser, in connection with their relationships with the Fund, including the benefits of research services that may be available to the Adviser or the Sub-adviser as a result of securities transactions effected for the Fund and other investment advisory clients.
The Board concluded that, in light of the foregoing factors and the nature, extent and quality of the services rendered, the profits realized by the Adviser and its affiliates, including the Sub-adviser, are reasonable.
Economies of Scale
In reviewing management fees and profitability, the Board also considered the extent to which the Adviser and its affiliates, on the one hand, and the Fund, on the other hand, can expect to realize benefits from economies of scale as the assets of the Fund increase. The Board acknowledged the difficulty in accurately measuring the benefits resulting from the economies of scale with respect to the management of any specific fund or group of funds. The Board reviewed data summarizing the increases and decreases in the assets of the Fund and of all Eaton Vance Funds as a group over various time periods, and evaluated the extent to which the total expense ratio of the Fund and the profitability of the Adviser and its affiliates may have been affected by such increases or decreases. Based upon the foregoing, the Board concluded that the Fund currently shares in the benefits from economies of scale. The Board also concluded that, assuming reasonably foreseeable increases in the assets of the Fund, the structure of the advisory fee, which includes breakpoints at several asset levels, will allow the Fund to continue to benefit from economies of scale in the future.
Parametric International Equity Fund
July 31, 2015
Officers and Trustees
Officers of Parametric International Equity Fund
Payson F. Swaffield
President
Maureen A. Gemma
Vice President, Secretary and
Chief Legal Officer
James F. Kirchner
Treasurer
Paul M. O’Neil
Chief Compliance Officer
Trustees of Parametric International Equity Fund
Ralph F. Verni
Chairman
Scott E. Eston
Thomas E. Faust Jr.*
Cynthia E. Frost
George J. Gorman
Valerie A. Mosley
William H. Park
Helen Frame Peters
Susan J. Sutherland**
Harriett Tee Taggart
| ** | Ms. Sutherland began serving as a Trustee effective May 1, 2015. |
Eaton Vance Funds
IMPORTANT NOTICES
Privacy. The Eaton Vance organization is committed to ensuring your financial privacy. Each of the financial institutions identified below has in effect the following policy (“Privacy Policy”) with respect to nonpublic personal information about its customers:
| • | | Only such information received from you, through application forms or otherwise, and information about your Eaton Vance fund transactions will be collected. This may include information such as name, address, social security number, tax status, account balances and transactions. |
| • | | None of such information about you (or former customers) will be disclosed to anyone, except as permitted by law (which includes disclosure to employees necessary to service your account). In the normal course of servicing a customer’s account, Eaton Vance may share information with unaffiliated third parties that perform various required services such as transfer agents, custodians and broker-dealers. |
| • | | Policies and procedures (including physical, electronic and procedural safeguards) are in place that are designed to protect the confidentiality of such information. |
| • | | We reserve the right to change our Privacy Policy at any time upon proper notification to you. Customers may want to review our Privacy Policy periodically for changes by accessing the link on our homepage: www.eatonvance.com. |
Our pledge of privacy applies to the following entities within the Eaton Vance organization: the Eaton Vance Family of Funds, Eaton Vance Management, Eaton Vance Investment Counsel, Eaton Vance Distributors, Inc., Eaton Vance Trust Company, Eaton Vance Management’s Real Estate Investment Group and Boston Management and Research. In addition, our Privacy Policy applies only to those Eaton Vance customers who are individuals and who have a direct relationship with us. If a customer’s account (i.e., fund shares) is held in the name of a third-party financial advisor/broker-dealer, it is likely that only such advisor’s privacy policies apply to the customer. This notice supersedes all previously issued privacy disclosures. For more information about Eaton Vance’s Privacy Policy, please call 1-800-262-1122.
Delivery of Shareholder Documents. The Securities and Exchange Commission (SEC) permits funds to deliver only one copy of shareholder documents, including prospectuses, proxy statements and shareholder reports, to fund investors with multiple accounts at the same residential or post office box address. This practice is often called “householding” and it helps eliminate duplicate mailings to shareholders. Eaton Vance, or your financial advisor, may household the mailing of your documents indefinitely unless you instruct Eaton Vance, or your financial advisor, otherwise. If you would prefer that your Eaton Vance documents not be householded, please contact Eaton Vance at 1-800-260-0761, or contact your financial advisor. Your instructions that householding not apply to delivery of your Eaton Vance documents will be effective within 30 days of receipt by Eaton Vance or your financial advisor.
Portfolio Holdings. Each Eaton Vance Fund and its underlying Portfolio(s) (if applicable) will file a schedule of portfolio holdings on Form N-Q with the SEC for the first and third quarters of each fiscal year. The Form N-Q will be available on the Eaton Vance website at www.eatonvance.com, by calling Eaton Vance at 1-800-260-0761 or in the EDGAR database on the SEC’s website at www.sec.gov. Form N-Q may also be reviewed and copied at the SEC’s public reference room in Washington, D.C. (call 1-800-732-0330 for information on the operation of the public reference room).
Proxy Voting. From time to time, funds are required to vote proxies related to the securities held by the funds. The Eaton Vance Funds or their underlying Portfolios (if applicable) vote proxies according to a set of policies and procedures approved by the Funds’ and Portfolios’ Boards. You may obtain a description of these policies and procedures and information on how the Funds or Portfolios voted proxies relating to portfolio securities during the most recent 12-month period ended June 30, without charge, upon request, by calling 1-800-260-0761 and by accessing the SEC’s website at www.sec.gov.
This Page Intentionally Left Blank
This Page Intentionally Left Blank
Investment Adviser and Administrator
Eaton Vance Management
Two International Place
Boston, MA 02110
Sub-Adviser
Parametric Portfolio Associates LLC
1918 Eighth Avenue, Suite 3100
Seattle, WA 98101
Principal Underwriter*
Eaton Vance Distributors, Inc.
Two International Place
Boston, MA 02110
(617) 482-8260
Custodian
State Street Bank and Trust Company
State Street Financial Center, One Lincoln Street
Boston, MA 02111
Transfer Agent
BNY Mellon Investment Servicing (US) Inc.
Attn: Eaton Vance Funds
P.O. Box 9653
Providence, RI 02940-9653
(800) 260-0761
Fund Offices
Two International Place
Boston, MA 02110
| * | FINRA BrokerCheck. Investors may check the background of their Investment Professional by contacting the Financial Industry Regulatory Authority (FINRA). FINRA BrokerCheck is a free tool to help investors check the professional background of current and former FINRA-registered securities firms and brokers. FINRA BrokerCheck is available by calling 1-800-289-9999 and at www.FINRA.org. The FINRA BrokerCheck brochure describing the program is available to investors at www.FINRA.org. |
Item 2. Code of Ethics
Not required in this filing.
Item 3. Audit Committee Financial Expert
Not required in this filing.
Item 4. Principal Accountant Fees and Services
Not required in this filing.
Item 5. Audit Committee of Listed Registrants
Not applicable.
Item 6. Schedule of Investments
Please see schedule of investments contained in the Report to Stockholders included under Item 1 of this Form N-CSR.
Item 7. Disclosure of Proxy Voting Policies and Procedures for Closed-End Management Investment Companies
Not applicable.
Item 8. Portfolio Managers of Closed-End Management Investment Companies
Not applicable.
Item 9. Purchases of Equity Securities by Closed-End Management Investment Company and Affiliated Purchasers
Not applicable.
Item 10. Submission of Matters to a Vote of Security Holders
No material changes.
Item 11. Controls and Procedures
(a) It is the conclusion of the registrant’s principal executive officer and principal financial officer that the effectiveness of the registrant’s current disclosure controls and procedures (such disclosure controls and procedures having been evaluated within 90 days of the date of this filing) provide reasonable assurance that the information required to be disclosed by the registrant has been recorded, processed, summarized and reported within the time period specified in the Commission’s rules and forms and that the information required to be disclosed by the registrant has been accumulated and communicated to the registrant’s principal executive officer and principal financial officer in order to allow timely decisions regarding required disclosure.
(b) There have been no changes in the registrant’s internal controls over financial reporting during the second fiscal quarter of the period covered by this report that has materially affected, or is reasonably likely to materially affect, the registrant’s internal control over financial reporting.
Item 12. Exhibits
| | |
| (a)(1) | | Registrant’s Code of Ethics – Not applicable (please see Item 2). |
| |
| (a)(2)(i) | | Treasurer’s Section 302 certification. |
| |
| (a)(2)(ii) | | President’s Section 302 certification. |
| |
| (b) | | Combined Section 906 certification. |
Signatures
Pursuant to the requirements of the Securities Exchange Act of 1934 and the Investment Company Act of 1940, the registrant has duly caused this report to be signed on its behalf by the undersigned, thereunto duly authorized.
Eaton Vance Mutual Funds Trust
| | |
| By: | | /s/ Payson F. Swaffield |
| | Payson F. Swaffield |
| | President |
| |
| Date: | | September 15, 2015 |
Pursuant to the requirements of the Securities Exchange Act of 1934 and the Investment Company Act of 1940, this report has been signed below by the following persons on behalf of the registrant and in the capacities and on the dates indicated.
| | |
| By: | | /s/ James F. Kirchner |
| | James F. Kirchner |
| | Treasurer |
| |
| Date: | | September 15, 2015 |
| |
| By: | | /s/ Payson F. Swaffield |
| | Payson F. Swaffield |
| | President |
| |
| Date: | | September 15, 2015 |