UNITED STATES
SECURITIES AND EXCHANGE COMMISSION
Washington, D.C. 20549
Form N-CSR
CERTIFIED SHAREHOLDER REPORT OF REGISTERED
MANAGEMENT INVESTMENT COMPANIES
Investment Company Act File Number: 811-04015
Eaton Vance Mutual Funds Trust
(Exact Name of Registrant as Specified in Charter)
Two International Place, Boston, Massachusetts 02110
(Address of Principal Executive Offices)
Maureen A. Gemma
Two International Place, Boston, Massachusetts 02110
(Name and Address of Agent for Services)
(617) 482-8260
(Registrant’s Telephone Number)
September 30
Date of Fiscal Year End
September 30, 2015
Date of Reporting Period
Item 1. Reports to Stockholders

Eaton Vance
Atlanta Capital Horizon
Growth Fund
Annual Report
September 30, 2015

Commodity Futures Trading Commission Registration. Effective December 31, 2012, the Commodity Futures Trading Commission (“CFTC”) adopted certain regulatory changes that subject registered investment companies and advisers to regulation by the CFTC if a fund invests more than a prescribed level of its assets in certain CFTC-regulated instruments (including futures, certain options and swap agreements) or markets itself as providing investment exposure to such instruments. The Fund has claimed an exclusion from the definition of the term “commodity pool operator” under the Commodity Exchange Act. Accordingly, neither the Fund nor the adviser with respect to the operation of the Fund is subject to CFTC regulation. Because of its management of other strategies, the Fund’s adviser is registered with the CFTC as a commodity pool operator and a commodity trading advisor.
Fund shares are not insured by the FDIC and are not deposits or other obligations of, or guaranteed by, any depository institution. Shares are subject to investment risks, including possible loss of principal invested.
This report must be preceded or accompanied by a current summary prospectus or prospectus. Before investing, investors should consider carefully the investment objective, risks, and charges and expenses of a mutual fund. This and other important information is contained in the summary prospectus and prospectus, which can be obtained from a financial advisor. Prospective investors should read the prospectus carefully before investing. For further information, please call 1-800-262-1122.
Annual Report September 30, 2015
Eaton Vance
Atlanta Capital Horizon Growth Fund
Table of Contents
| | | | |
Management’s Discussion of Fund Performance | | | 2 | |
| |
Performance | | | 3 | |
| |
Fund Profile | | | 4 | |
| |
Endnotes and Additional Disclosures | | | 5 | |
| |
Fund Expenses | | | 6 | |
| |
Financial Statements | | | 7 | |
| |
Report of Independent Registered Public Accounting Firm | | | 21 | |
| |
Federal Tax Information | | | 22 | |
| |
Board of Trustees’ Contract Approval | | | 23 | |
| |
Management and Organization | | | 26 | |
| |
Important Notices | | | 29 | |
Eaton Vance
Atlanta Capital Horizon Growth Fund
September 30, 2015
Management’s Discussion of Fund Performance1
Economic and Market Conditions
A sharp downturn late in the period left the major U.S. stock indices with either losses or modest gains for the 12 months ended September 30, 2015.
U.S. equity markets opened the period on the downside amid renewed worries about the global economy, international conflicts and elevated stock valuations. However, U.S. stocks rebounded in late 2014, buoyed by positive economic data and the U.S. Federal Reserve (the Fed) ending its bond-buying stimulus program.
In the first quarter of 2015, harsh winter weather, along with West Coast port strikes and the strong U.S. dollar, adversely impacted U.S. economic growth. Although an improving job market and rising retail sales helped the U.S. economy regain some momentum, weakness persisted in certain areas, such as factory output. The uneven pattern of economic growth led the Fed to reassure investors in mid-June 2015 that eventual interest-rate hikes would be gradual and would proceed slowly. U.S. stocks rose following the Fed’s reassurance, with the technology-laden NASDAQ Composite Index2 reaching a new record high. Subsequently, however, the mounting Greek debt crisis and signs of economic weakness in China sent stocks lower. U.S. equity markets dropped in August 2015 on growing concerns about China and the timing of the Fed’s first rate hike. U.S. stocks then recouped some of those losses in a brief rally, only to retreat again late in the period after the Fed left interest rates unchanged.
The blue-chip Dow Jones Industrial Average fell 2.11% for the 12-month period, while the broader U.S. equity market, as represented by the S&P 500 Index, lost 0.61%. The NASDAQ Composite Index was able to hold on to some of its earlier gains, finishing the period up 4.00%. Small-cap U.S. stocks (as measured by the Russell 2000 Index) generally fared better than their large-cap counterparts (as measured by the Russell 1000 Index). Growth stocks as a group outpaced value stocks in both the large- and small-cap categories.
Fund Performance
For the 12-month period ended September 30, 2015, Eaton Vance Atlanta Capital Horizon Growth Fund (the Fund) had a total return of –1.97% for Class A shares at net asset value (NAV), underperforming the Fund’s benchmark, the Russell Midcap Growth Index (the Index), which returned 1.45% for the same period.
The Fund underperformed the Index largely due to stock selection, with sector and industry allocation also detracting from Fund performance versus the Index. Of the 10 economic sectors in the Index, the Fund delivered positive returns in four of the eight sectors in which it was invested. The Index recorded positive returns in five of the 10 sectors.
The industrials sector was the Fund’s worst-performing sector versus the Index for the 12-month period. This was due to both stock selection and the Fund’s overweight position in the sector. In the lagging aerospace & defense industry, the Fund’s overweight in B/E Aerospace, Inc. was one of the biggest detractors from Fund performance versus the Index amid fears of a declining order backlog in the aircraft industry. The stock was sold during the period. The road & rail industry was also a drag on the Fund’s performance relative to the Index. The consumer discretionary sector detracted from the Fund’s performance versus the Index largely due to stock selection. In the lagging textile, apparel & luxury goods industry, the Fund’s overweight in fashion leader Ralph Lauren Corp. was among the largest detractors from Fund performance versus the Index. The stock was sold during the period. In the consumer staples sector, stock selection hampered the Fund’s performance relative to the Index, but was partially offset by the Fund’s overweight in the outperforming sector. Overall, the biggest detractor from Fund performance versus the Index was the Fund’s out-of- Index holding in oilfield equipment company Weatherford International PLC within the energy sector, which was hurt by falling oil prices.
On the positive side, financials was the Fund’s best-performing sector relative to the Index. This was due to both stock selection and an overweight in the outperforming sector. The Fund’s overweight in specialty commercial insurer Markel Corp. was among the top contributors to Fund performance versus the Index after it reported solid earnings during the period. Another strong contributor to Fund performance versus the Index was the Fund’s overweight in stock and futures exchange operator Intercontinental Exchange, Inc., part of the diversified financial services industry, as it benefited from increased trading volume amid the stock market turmoil late in the period. The health care sector also boosted the Fund’s performance relative to the Index, with stock selection in the health care providers & services industry making a notable contribution to relative Fund performance. The Fund’s overweight in pharmacy benefits manager Catamaran Corp. was the leading contributor to Fund performance versus the Index after it was acquired by a larger company. In the outperforming information technology sector, the Fund’s holdings in the software industry aided performance relative to the Index. The Fund’s overweight in systems software company Red Hat, Inc. was among the largest contributors to Fund performance versus the Index after its earnings repeatedly exceeded expectations during the 12-month period.
See Endnotes and Additional Disclosures in this report.
Past performance is no guarantee of future results. Returns are historical and are calculated by determining the percentage change in net asset value (NAV) or offering price (as applicable) with all distributions reinvested. Investment return and principal value will fluctuate so that shares, when redeemed, may be worth more or less than their original cost. Performance less than one year is cumulative. Performance is for the stated time period only; due to market volatility, the Fund’s current performance may be lower or higher than quoted. Returns are before taxes unless otherwise noted. For performance as of the most recent month-end, please refer to eatonvance.com.
Eaton Vance
Atlanta Capital Horizon Growth Fund
September 30, 2015
Performance2,3
Portfolio Manager Richard B. England, CFA, of Atlanta Capital Management Company, LLC.
| | | | | | | | | | | | | | | | | | | | |
| % Average Annual Total Returns | | Class
Inception Date | | | Performance
Inception Date | | | One Year | | | Five Years | | | Ten Years | |
Class A at NAV | | | 03/04/2002 | | | | 03/04/2002 | | | | –1.97 | % | | | 8.42 | % | | | 6.45 | % |
Class A with 5.75% Maximum Sales Charge | | | — | | | | — | | | | –7.58 | | | | 7.15 | | | | 5.82 | |
Class B at NAV | | | 03/04/2002 | | | | 03/04/2002 | | | | –2.75 | | | | 7.59 | | | | 5.65 | |
Class B with 5% Maximum Sales Charge | | | — | | | | — | | | | –7.17 | | | | 7.32 | | | | 5.65 | |
Class C at NAV | | | 03/04/2002 | | | | 03/04/2002 | | | | –2.75 | | | | 7.60 | | | | 5.65 | |
Class C with 1% Maximum Sales Charge | | | — | | | | — | | | | –3.63 | | | | 7.60 | | | | 5.65 | |
Class I at NAV | | | 05/02/2011 | | | | 03/04/2002 | | | | –1.75 | | | | 8.65 | | | | 6.56 | |
Russell Midcap Growth Index | | | — | | | | — | | | | 1.45 | % | | | 13.58 | % | | | 8.09 | % |
| | | | | |
| | | | | | | | | | | | | | | | | | | | |
| % Total Annual Operating Expense Ratios4 | | | | | Class A | | | Class B | | | Class C | | | Class I | |
Gross | | | | | | | 1.73 | % | | | 2.48 | % | | | 2.48 | % | | | 1.48 | % |
Net | | | | | | | 1.40 | | | | 2.15 | | | | 2.15 | | | | 1.15 | |
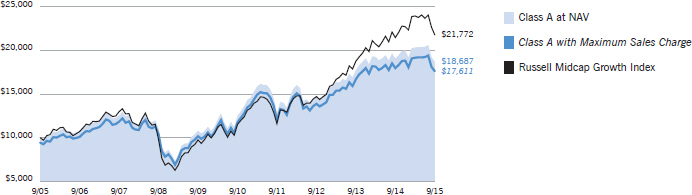
Growth of $10,000
This graph shows the change in value of a hypothetical investment of $10,000 in Class A of the Fund for the period indicated. For comparison, the same investment is shown in the indicated index.
| | | | | | | | | | | | | | | | |
| Growth of Investment | | Amount Invested | | | Period Beginning | | | At NAV | | | With Maximum Sales Charge | |
Class B | | $ | 10,000 | | | | 09/30/2005 | | | $ | 17,338 | | | | N.A. | |
Class C | | $ | 10,000 | | | | 09/30/2005 | | | $ | 17,330 | | | | N.A. | |
Class I | | $ | 250,000 | | | | 09/30/2005 | | | $ | 472,228 | | | | N.A. | |
See Endnotes and Additional Disclosures in this report.
Past performance is no guarantee of future results. Returns are historical and are calculated by determining the percentage change in net asset value (NAV) or offering price (as applicable) with all distributions reinvested. Investment return and principal value will fluctuate so that shares, when redeemed, may be worth more or less than their original cost. Performance less than one year is cumulative. Performance is for the stated time period only; due to market volatility, the Fund’s current performance may be lower or higher than quoted. Returns are before taxes unless otherwise noted. For performance as of the most recent month-end, please refer to eatonvance.com.
Eaton Vance
Atlanta Capital Horizon Growth Fund
September 30, 2015
Fund Profile
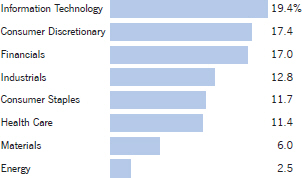
Sector Allocation (% of net assets)5
Top 10 Holdings (% of net assets)5
| | | | |
| |
Waste Connections, Inc. | | | 4.3 | % |
| |
Markel Corp. | | | 4.1 | |
| |
Amphenol Corp., Class A | | | 3.7 | |
| |
Affiliated Managers Group, Inc. | | | 3.7 | |
| |
ANSYS, Inc. | | | 3.2 | |
| |
DENTSPLY International, Inc. | �� | | 3.2 | |
| |
Nordstrom, Inc. | | | 3.1 | |
| |
Ecolab, Inc. | | | 3.1 | |
| |
AMC Networks, Inc., Class A | | | 3.1 | |
| |
Airgas, Inc. | | | 2.9 | |
| | |
Total | | | 34.4 | % |
See Endnotes and Additional Disclosures in this report.
Eaton Vance
Atlanta Capital Horizon Growth Fund
September 30, 2015
Endnotes and Additional Disclosures
| 1 | The views expressed in this report are those of the portfolio manager(s) and are current only through the date stated at the top of this page. These views are subject to change at any time based upon market or other conditions, and Eaton Vance and the Fund(s) disclaim any responsibility to update such views. These views may not be relied upon as investment advice and, because investment decisions are based on many factors, may not be relied upon as an indication of trading intent on behalf of any Eaton Vance fund. This commentary may contain statements that are not historical facts, referred to as “forward looking statements”. The Fund’s actual future results may differ significantly from those stated in any forward looking statement, depending on factors such as changes in securities or financial markets or general economic conditions, the volume of sales and purchases of Fund shares, the continuation of investment advisory, administrative and service contracts, and other risks discussed from time to time in the Fund’s filings with the Securities and Exchange Commission. |
| 2 | NASDAQ Composite Index is a market capitalization-weighted index of all domestic and international securities listed on NASDAQ. Dow Jones Industrial Average is a price-weighted average of 30 blue-chip stocks that are generally the leaders in their industry. S&P 500 Index is an unmanaged index of large-cap stocks commonly used as a measure of U.S. stock market performance. Russell 2000 Index is an unmanaged index of 2,000 U.S. small-cap stocks. Russell 1000 Index is an unmanaged index of 1,000 U.S. large-cap stocks. Russell Midcap Growth Index is an unmanaged index of U.S. midcap growth stocks. Unless otherwise stated, index returns do not reflect the effect of any applicable sales charges, commissions, expenses, taxes or leverage, as applicable. It is not possible to invest directly in an index. |
| 3 | Total Returns at NAV do not include applicable sales charges. If sales charges were deducted, the returns would be lower. Total Returns shown with maximum sales charge reflect the stated maximum sales charge. Unless otherwise stated, performance does not reflect the deduction of taxes on Fund distributions or redemptions of Fund shares. |
| | Performance prior to the inception date of a class may be linked to the performance of an older class of the Fund. This linked performance is adjusted for any applicable sales charge, but is not adjusted for class expense differences. If adjusted for such differences, the performance would be different. Performance presented in the financial highlights included in the financial statements is not linked. In the performance table, the performance of Class I is linked to Class A. Performance since inception for an index, if presented, is the performance since the Fund’s or oldest share class’ inception, as applicable. |
| 4 | Source: Fund prospectus. Net expense ratio reflects a contractual expense reimbursement that continues through 1/31/16. Without the reimbursement, if applicable, performance would have been lower. |
| 5 | Excludes cash and cash equivalents. |
| | Fund profile subject to change due to active management. |
Important Notice to Shareholders
| | In June 2015, the Trustees of the Fund approved an Agreement and Plan of Reorganization (the Agreement) whereby Eaton Vance Atlanta Capital SMID-Cap Fund would acquire substantially all the assets and assume substantially all the liabilities of the Fund in exchange for shares of Eaton Vance Atlanta Capital SMID-Cap Fund. The proposed reorganization was approved by the shareholders of the Fund on October 23, 2015. Subject to the satisfaction of the conditions of the Agreement, the reorganization is expected to occur on or about December 4, 2015. |
Eaton Vance
Atlanta Capital Horizon Growth Fund
September 30, 2015
Fund Expenses
Example: As a Fund shareholder, you incur two types of costs: (1) transaction costs, including sales charges (loads) on purchases and redemption fees (if applicable); and (2) ongoing costs, including management fees; distribution and/or service fees; and other Fund expenses. This Example is intended to help you understand your ongoing costs (in dollars) of Fund investing and to compare these costs with the ongoing costs of investing in other mutual funds. The Example is based on an investment of $1,000 invested at the beginning of the period and held for the entire period (April 1, 2015 – September 30, 2015).
Actual Expenses: The first section of the table below provides information about actual account values and actual expenses. You may use the information in this section, together with the amount you invested, to estimate the expenses that you paid over the period. Simply divide your account value by $1,000 (for example, an $8,600 account value divided by $1,000 = 8.6), then multiply the result by the number in the first section under the heading entitled “Expenses Paid During Period” to estimate the expenses you paid on your account during this period.
Hypothetical Example for Comparison Purposes: The second section of the table below provides information about hypothetical account values and hypothetical expenses based on the actual Fund expense ratio and an assumed rate of return of 5% per year (before expenses), which is not the actual Fund return. The hypothetical account values and expenses may not be used to estimate the actual ending account balance or expenses you paid for the period. You may use this information to compare the ongoing costs of investing in your Fund and other funds. To do so, compare this 5% hypothetical example with the 5% hypothetical examples that appear in the shareholder reports of the other funds.
Please note that the expenses shown in the table are meant to highlight your ongoing costs only and do not reflect any transactional costs, such as sales charges (loads) or redemption fees (if applicable). Therefore, the second section of the table is useful in comparing ongoing costs only, and will not help you determine the relative total costs of owning different funds. In addition, if these transactional costs were included, your costs would be higher.
| | | | | | | | | | | | | | | | |
| | | Beginning
Account Value
(4/1/15) | | | Ending
Account Value
(9/30/15) | | | Expenses Paid
During Period*
(4/1/15 – 9/30/15) | | | Annualized
Expense
Ratio | |
| | | | |
| | | | | | | | | | | | | | | | |
Actual | | | | | | | | | | | | | | | | |
Class A | | $ | 1,000.00 | | | $ | 919.60 | | | $ | 6.74 | ** | | | 1.40 | % |
Class B | | $ | 1,000.00 | | | $ | 916.10 | | | $ | 10.33 | ** | | | 2.15 | % |
Class C | | $ | 1,000.00 | | | $ | 916.00 | | | $ | 10.33 | ** | | | 2.15 | % |
Class I | | $ | 1,000.00 | | | $ | 920.50 | | | $ | 5.54 | ** | | | 1.15 | % |
| | | | | | | | | | | | | | | | | |
| | | | |
| | | | | | | | | | | | | | | | |
Hypothetical | | | | | | | | | | | | | | | | |
(5% return per year before expenses) | | | | | | | | | | | | | | | | |
Class A | | $ | 1,000.00 | | | $ | 1,018.00 | | | $ | 7.08 | ** | | | 1.40 | % |
Class B | | $ | 1,000.00 | | | $ | 1,014.30 | | | $ | 10.86 | ** | | | 2.15 | % |
Class C | | $ | 1,000.00 | | | $ | 1,014.30 | | | $ | 10.86 | ** | | | 2.15 | % |
Class I | | $ | 1,000.00 | | | $ | 1,019.30 | | | $ | 5.82 | ** | | | 1.15 | % |
| * | Expenses are equal to the Fund’s annualized expense ratio for the indicated Class, multiplied by the average account value over the period, multiplied by 183/365 (to reflect the one-half year period). The Example assumes that the $1,000 was invested at the net asset value per share determined at the close of business on March 31, 2015. |
| ** | Absent an allocation of certain expenses to affiliates, the expenses would be higher. |
Eaton Vance
Atlanta Capital Horizon Growth Fund
September 30, 2015
Portfolio of Investments
| | | | | | | | |
| Common Stocks — 98.2% | |
| | |
| | | | | | | | |
| Security | | Shares | | | Value | |
| | | | | | | | |
|
Banks — 2.5% | |
First Republic Bank | | | 11,977 | | | $ | 751,796 | |
| | |
| | | | | | $ | 751,796 | |
| | |
|
Beverages — 3.0% | |
Brown-Forman Corp., Class B | | | 6,184 | | | $ | 599,229 | |
Dr Pepper Snapple Group, Inc. | | | 3,937 | | | | 311,220 | |
| | |
| | | | | | $ | 910,449 | |
| | |
|
Capital Markets — 5.7% | |
Affiliated Managers Group, Inc.(1) | | | 6,398 | | | $ | 1,093,994 | |
Raymond James Financial, Inc. | | | 12,067 | | | | 598,885 | |
| | |
| | | | | | $ | 1,692,879 | |
| | |
|
Chemicals — 6.0% | |
Airgas, Inc. | | | 9,749 | | | $ | 870,878 | |
Ecolab, Inc. | | | 8,426 | | | | 924,501 | |
| | |
| | | | | | $ | 1,795,379 | |
| | |
|
Commercial Services & Supplies — 4.3% | |
Waste Connections, Inc. | | | 26,772 | | | $ | 1,300,584 | |
| | |
| | | | | | $ | 1,300,584 | |
| | |
|
Communications Equipment — 4.1% | |
F5 Networks, Inc.(1) | | | 5,336 | | | $ | 617,909 | |
Juniper Networks, Inc. | | | 23,334 | | | | 599,917 | |
| | |
| | | | | | $ | 1,217,826 | |
| | |
|
Diversified Financial Services — 2.9% | |
Intercontinental Exchange, Inc. | | | 3,702 | | | $ | 869,933 | |
| | |
| | | | | | $ | 869,933 | |
| | |
|
Electrical Equipment — 2.9% | |
AMETEK, Inc. | | | 11,101 | | | $ | 580,804 | |
Rockwell Automation, Inc. | | | 2,713 | | | | 275,288 | |
| | |
| | | | | | $ | 856,092 | |
| | |
|
Electronic Equipment, Instruments & Components — 3.7% | |
Amphenol Corp., Class A | | | 21,556 | | | $ | 1,098,494 | |
| | |
| | | | | | $ | 1,098,494 | |
| | |
| | | | | | | | |
| Security | | Shares | | | Value | |
| | | | | | | | |
|
Energy Equipment & Services — 2.5% | |
Cameron International Corp.(1) | | | 7,728 | | | $ | 473,881 | |
Weatherford International PLC(1) | | | 33,122 | | | | 280,874 | |
| | |
| | | | | | $ | 754,755 | |
| | |
|
Food & Staples Retailing — 1.4% | |
Whole Foods Market, Inc. | | | 12,955 | | | $ | 410,026 | |
| | |
| | | | | | $ | 410,026 | |
| | |
|
Food Products — 4.9% | |
Hershey Co. (The) | | | 6,475 | | | $ | 594,923 | |
TreeHouse Foods, Inc.(1) | | | 11,020 | | | | 857,246 | |
| | |
| | | | | | $ | 1,452,169 | |
| | |
|
Health Care Equipment & Supplies — 3.2% | |
DENTSPLY International, Inc. | | | 18,675 | | | $ | 944,395 | |
| | |
| | | | | | $ | 944,395 | |
| | |
|
Health Care Providers & Services — 2.0% | |
Cigna Corp. | | | 4,456 | | | $ | 601,649 | |
| | |
| | | | | | $ | 601,649 | |
| | |
|
Health Care Technology — 2.2% | |
Cerner Corp.(1) | | | 10,961 | | | $ | 657,222 | |
| | |
| | | | | | $ | 657,222 | |
| | |
|
Hotels, Restaurants & Leisure — 2.6% | |
Dunkin’ Brands Group, Inc. | | | 7,061 | | | $ | 345,989 | |
Starwood Hotels & Resorts Worldwide, Inc. | | | 6,356 | | | | 422,547 | |
| | |
| | | | | | $ | 768,536 | |
| | |
|
Insurance — 5.9% | |
Aon PLC | | | 6,127 | | | $ | 542,914 | |
Markel Corp.(1) | | | 1,533 | | | | 1,229,251 | |
| | |
| | | | | | $ | 1,772,165 | |
| | |
|
Life Sciences Tools & Services — 2.2% | |
Mettler-Toledo International, Inc.(1) | | | 2,282 | | | $ | 649,777 | |
| | |
| | | | | | $ | 649,777 | |
| | |
|
Machinery — 1.5% | |
IDEX Corp. | | | 6,304 | | | $ | 449,475 | |
| | |
| | | | | | $ | 449,475 | |
| | |
| | | | |
| | 7 | | See Notes to Financial Statements. |
Eaton Vance
Atlanta Capital Horizon Growth Fund
September 30, 2015
Portfolio of Investments — continued
| | | | | | | | |
| Security | | Shares | | | Value | |
| | | | | | | | |
|
Media — 3.1% | |
AMC Networks, Inc., Class A(1) | | | 12,578 | | | $ | 920,332 | |
| | |
| | | | | | $ | 920,332 | |
| | |
|
Multiline Retail — 5.0% | |
Dollar Tree, Inc.(1) | | | 8,181 | | | $ | 545,346 | |
Nordstrom, Inc. | | | 13,054 | | | | 936,102 | |
| | |
| | | | | | $ | 1,481,448 | |
| | |
|
Personal Products — 2.4% | |
Estee Lauder Cos., Inc. (The), Class A | | | 8,841 | | | $ | 713,292 | |
| | |
| | | | | | $ | 713,292 | |
| | |
|
Pharmaceuticals — 1.8% | |
Perrigo Co. PLC | | | 3,498 | | | $ | 550,130 | |
| | |
| | | | | | $ | 550,130 | |
| | |
|
Professional Services — 1.8% | |
IHS, Inc.(1) | | | 4,756 | | | $ | 551,696 | |
| | |
| | | | | | $ | 551,696 | |
| | |
|
Road & Rail — 2.2% | |
J.B. Hunt Transport Services, Inc. | | | 5,961 | | | $ | 425,615 | |
Kansas City Southern | | | 2,721 | | | | 247,285 | |
| | |
| | | | | | $ | 672,900 | |
| | |
|
Semiconductors & Semiconductor Equipment — 1.9% | |
Linear Technology Corp. | | | 14,319 | | | $ | 577,772 | |
| | |
| | | | | | $ | 577,772 | |
| | |
|
Software — 9.7% | |
ANSYS, Inc.(1) | | | 10,835 | | | $ | 954,997 | |
Check Point Software Technologies, Ltd.(1) | | | 5,834 | | | | 462,811 | |
Fair Isaac Corp. | | | 9,085 | | | | 767,682 | |
Red Hat, Inc.(1) | | | 10,145 | | | | 729,223 | |
| | |
| | | | | | $ | 2,914,713 | |
| | |
|
Specialty Retail — 6.8% | |
Ross Stores, Inc. | | | 16,154 | | | $ | 782,984 | |
Sally Beauty Holdings, Inc.(1) | | | 28,302 | | | | 672,173 | |
| | | | | | | | |
| Security | | Shares | | | Value | |
| | | | | | | | |
|
Specialty Retail (continued) | |
Tiffany & Co. | | | 7,318 | | | $ | 565,096 | |
| | |
| | | | | | $ | 2,020,253 | |
| | |
| |
Total Common Stocks
(identified cost $23,216,882) | | | $ | 29,356,137 | |
| | |
|
| Short-Term Investments — 2.0% | |
| | |
| | | | | | | | |
| Description | | Interest
(000’s omitted) | | | Value | |
Eaton Vance Cash Reserves Fund, LLC, 0.23%(2) | | $ | 584 | | | $ | 583,763 | |
| | | | | | | | | |
| |
Total Short-Term Investments
(identified cost $583,763) | | | $ | 583,763 | |
| | | | | | | | | |
| |
Total Investments — 100.2%
(identified cost $23,800,645) | | | $ | 29,939,900 | |
| | | | | | | | | |
| |
Other Assets, Less Liabilities — (0.2)% | | | $ | (51,577 | ) |
| | | | | | | | | |
| |
Net Assets — 100.0% | | | $ | 29,888,323 | |
| | | | | | | | | |
The percentage shown for each investment category in the Portfolio of Investments is based on net assets.
| (1) | Non-income producing security. |
| (2) | Affiliated investment company, available to Eaton Vance portfolios and funds, which invests in high quality, U.S. dollar denominated money market instruments. The rate shown is the annualized seven-day yield as of September 30, 2015. |
| | | | |
| | 8 | | See Notes to Financial Statements. |
Eaton Vance
Atlanta Capital Horizon Growth Fund
September 30, 2015
Statement of Assets and Liabilities
| | | | |
| Assets | | September 30, 2015 | |
Unaffiliated investments, at value (identified cost, $23,216,882) | | $ | 29,356,137 | |
Affiliated investment, at value (identified cost, $583,763) | | | 583,763 | |
Dividends receivable | | | 18,671 | |
Interest receivable from affiliated investment | | | 120 | |
Receivable for Fund shares sold | | | 2,514 | |
Receivable from affiliates | | | 41,553 | |
Total assets | | $ | 30,002,758 | |
|
| Liabilities | |
Payable for Fund shares redeemed | | $ | 26,277 | |
Payable to affiliates: | | | | |
Investment adviser fee | | | 20,058 | |
Administration fee | | | 3,761 | |
Distribution and service fees | | | 10,989 | |
Accrued expenses | | | 53,350 | |
Total liabilities | | $ | 114,435 | |
Net Assets | | $ | 29,888,323 | |
|
| Sources of Net Assets | |
Paid-in capital | | $ | 23,132,917 | |
Accumulated net realized gain | | | 824,803 | |
Accumulated net investment loss | | | (208,652 | ) |
Net unrealized appreciation | | | 6,139,255 | |
Total | | $ | 29,888,323 | |
|
| Class A Shares | |
Net Assets | | $ | 20,124,831 | |
Shares Outstanding | | | 1,454,350 | |
Net Asset Value and Redemption Price Per Share | | | | |
(net assets ÷ shares of beneficial interest outstanding) | | $ | 13.84 | |
Maximum Offering Price Per Share | | | | |
(100 ÷ 94.25 of net asset value per share) | | $ | 14.68 | |
|
| Class B Shares | |
Net Assets | | $ | 1,207,841 | |
Shares Outstanding | | | 101,498 | |
Net Asset Value and Offering Price Per Share* | | | | |
(net assets ÷ shares of beneficial interest outstanding) | | $ | 11.90 | |
|
| Class C Shares | |
Net Assets | | $ | 6,817,857 | |
Shares Outstanding | | | 573,462 | |
Net Asset Value and Offering Price Per Share* | | | | |
(net assets ÷ shares of beneficial interest outstanding) | | $ | 11.89 | |
|
| Class I Shares | |
Net Assets | | $ | 1,737,794 | |
Shares Outstanding | | | 124,052 | |
Net Asset Value, Offering Price and Redemption Price Per Share | | | | |
(net assets ÷ shares of beneficial interest outstanding) | | $ | 14.01 | |
On sales of $50,000 or more, the offering price of Class A shares is reduced.
| * | Redemption price per share is equal to the net asset value less any applicable contingent deferred sales charge. |
| | | | |
| | 9 | | See Notes to Financial Statements. |
Eaton Vance
Atlanta Capital Horizon Growth Fund
September 30, 2015
Statement of Operations
| | | | |
| Investment Income | | Year Ended September 30, 2015 | |
Dividends (net of foreign taxes, $1,484) | | $ | 252,464 | |
Interest allocated from affiliated investment | | | 1,391 | |
Expenses allocated from affiliated investment | | | (102 | ) |
Total investment income | | $ | 253,753 | |
| |
| Expenses | | | | |
Investment adviser fee | | $ | 269,163 | |
Administration fee | | | 50,468 | |
Distribution and service fees | | | | |
Class A | | | 55,618 | |
Class B | | | 15,877 | |
Class C | | | 78,791 | |
Trustees’ fees and expenses | | | 2,263 | |
Custodian fee | | | 29,443 | |
Transfer and dividend disbursing agent fees | | | 36,796 | |
Legal and accounting services | | | 53,734 | |
Printing and postage | | | 23,925 | |
Registration fees | | | 63,885 | |
Miscellaneous | | | 13,490 | |
Total expenses | | $ | 693,453 | |
Deduct — | | | | |
Allocation of expenses to affiliates | | $ | 156,407 | |
Total expense reductions | | $ | 156,407 | |
| |
Net expenses | | $ | 537,046 | |
| |
Net investment loss | | $ | (283,293 | ) |
| |
| Realized and Unrealized Gain (Loss) | | | | |
Net realized gain (loss) — | | | | |
Investment transactions | | $ | 1,420,121 | |
Investment transactions allocated from affiliated investment | | | 2 | |
Net realized gain | | $ | 1,420,123 | |
Change in unrealized appreciation (depreciation) — | | | | |
Investments | | $ | (1,651,280 | ) |
Net change in unrealized appreciation (depreciation) | | $ | (1,651,280 | ) |
| |
Net realized and unrealized loss | | $ | (231,157 | ) |
| |
Net decrease in net assets from operations | | $ | (514,450 | ) |
| | | | |
| | 10 | | See Notes to Financial Statements. |
Eaton Vance
Atlanta Capital Horizon Growth Fund
September 30, 2015
Statements of Changes in Net Assets
| | | | | | | | |
| | | Year Ended September 30, | |
| Increase (Decrease) in Net Assets | | 2015 | | | 2014 | |
From operations — | | | | | | | | |
Net investment loss | | $ | (283,293 | ) | | $ | (348,034 | ) |
Net realized gain from investment transactions | | | 1,420,123 | | | | 3,898,485 | |
Net change in unrealized appreciation (depreciation) from investments | | | (1,651,280 | ) | | | (791,307 | ) |
Net increase (decrease) in net assets from operations | | $ | (514,450 | ) | | $ | 2,759,144 | |
Distributions to shareholders — | | | | | | | | |
From net realized gain | | | | | | | | |
Class A | | $ | (1,775,783 | ) | | $ | (580,186 | ) |
Class B | | | (159,551 | ) | | | (62,391 | ) |
Class C | | | (734,188 | ) | | | (244,452 | ) |
Class I | | | (159,511 | ) | | | (35,222 | ) |
Total distributions to shareholders | | $ | (2,829,033 | ) | | $ | (922,251 | ) |
Transactions in shares of beneficial interest — | | | | | | | | |
Proceeds from sale of shares | | | | | | | | |
Class A | | $ | 761,249 | | | $ | 1,477,603 | |
Class B | | | 18,373 | | | | 204,259 | |
Class C | | | 407,696 | | | | 877,373 | |
Class I | | | 416,555 | | | | 1,155,272 | |
Net asset value of shares issued to shareholders in payment of distributions declared | | | | | | | | |
Class A | | | 1,661,744 | | | | 551,652 | |
Class B | | | 145,145 | | | | 55,654 | |
Class C | | | 608,748 | | | | 199,711 | |
Class I | | | 145,881 | | | | 30,355 | |
Cost of shares redeemed | | | | | | | | |
Class A | | | (3,337,791 | ) | | | (5,389,852 | ) |
Class B | | | (461,620 | ) | | | (484,996 | ) |
Class C | | | (1,580,120 | ) | | | (1,932,229 | ) |
Class I | | | (645,360 | ) | | | (814,257 | ) |
Net asset value of shares exchanged | | | | | | | | |
Class A | | | 232,861 | | | | 324,839 | |
Class B | | | (232,861 | ) | | | (324,839 | ) |
Net decrease in net assets from Fund share transactions | | $ | (1,859,500 | ) | | $ | (4,069,455 | ) |
| | |
Net decrease in net assets | | $ | (5,202,983 | ) | | $ | (2,232,562 | ) |
|
| Net Assets | |
At beginning of year | | $ | 35,091,306 | | | $ | 37,323,868 | |
At end of year | | $ | 29,888,323 | | | $ | 35,091,306 | |
|
Accumulated net investment loss included in net assets | |
At end of year | | $ | (208,652 | ) | | $ | (230,054 | ) |
| | | | |
| | 11 | | See Notes to Financial Statements. |
Eaton Vance
Atlanta Capital Horizon Growth Fund
September 30, 2015
Financial Highlights
| | | | | | | | | | | | | | | | | | | | | | | | |
| | | Class A | |
| | | Year Ended September 30, | | | Period Ended
September 30, 2011(1) | | | Year Ended
October 31, 2010 | |
| | | 2015 | | | 2014 | | | 2013 | | | 2012 | | | |
Net asset value — Beginning of period | | $ | 15.320 | | | $ | 14.570 | | | $ | 12.420 | | | $ | 14.100 | | | $ | 14.410 | | | $ | 11.610 | |
| | | | | | |
| Income (Loss) From Operations | | | | | | | | | | | | | | | | | | | | | | | | |
Net investment loss(2) | | $ | (0.097 | ) | | $ | (0.108 | ) | | $ | (0.091 | ) | | $ | (0.105 | ) | | $ | (0.088 | )(3) | | $ | (0.060 | ) |
Net realized and unrealized gain (loss) | | | (0.158 | ) | | | 1.215 | | | | 2.545 | | | | 1.904 | | | | (0.166 | ) | | | 2.860 | |
| | | | | | |
Total income (loss) from operations | | $ | (0.255 | ) | | $ | 1.107 | | | $ | 2.454 | | | $ | 1.799 | | | $ | (0.254 | ) | | $ | 2.800 | |
| | | | | | |
| Less Distributions | | | | | | | | | | | | | | | | | | | | | | | | |
From net realized gain | | $ | (1.225 | ) | | $ | (0.357 | ) | | $ | (0.304 | ) | | $ | (3.479 | ) | | $ | (0.056 | ) | | $ | — | |
| | | | | | |
Total distributions | | $ | (1.225 | ) | | $ | (0.357 | ) | | $ | (0.304 | ) | | $ | (3.479 | ) | | $ | (0.056 | ) | | $ | — | |
| | | | | | |
Net asset value — End of period | | $ | 13.840 | | | $ | 15.320 | | | $ | 14.570 | | | $ | 12.420 | | | $ | 14.100 | | | $ | 14.410 | |
| | | | | | |
Total Return(4) | | | (1.97 | )% | | | 7.69 | % | | | 20.25 | % | | | 15.35 | % | | | (1.81 | )%(5) | | | 24.12 | % |
| | | | | | |
| Ratios/Supplemental Data | | | | | | | | | | | | | | | | | | | | | | | | |
Net assets, end of period (000’s omitted) | | $ | 20,125 | | | $ | 22,918 | | | $ | 24,658 | | | $ | 26,305 | | | $ | 29,725 | | | $ | 35,125 | |
Ratios (as a percentage of average daily net assets): | | | | | | | | | | | | | | | | | | | | | | | | |
Expenses(6)(7) | | | 1.40 | % | | | 1.40 | % | | | 1.40 | % | | | 1.40 | % | | | 1.52 | %(8)(9) | | | 1.60 | %(9) |
Net investment loss | | | (0.65 | )% | | | (0.71 | )% | | | (0.69 | )% | | | (0.81 | )% | | | (0.59 | )%(3)(8)(9) | | | (0.46 | )%(9) |
Portfolio Turnover of the Portfolio(10) | | | — | | | | — | | | | — | | | | — | | | | 16 | %(5) | | | 33 | % |
Portfolio Turnover of the Fund | | | 25 | % | | | 26 | % | | | 23 | % | | | 50 | % | | | 52 | %(5)(11) | | | — | |
| (1) | For the eleven months ended September 30, 2011. The Fund changed its fiscal year-end from October 31 to September 30. |
| (2) | Computed using average shares outstanding. |
| (3) | Net investment loss per share reflects special dividends allocated from the Portfolio, which amounted to $0.015 per share, for the period while the Fund was making investments directly in the Portfolio. Excluding special dividends, the ratio of net investment loss to average daily net assets would have been (0.69)%. |
| (4) | Returns are historical and are calculated by determining the percentage change in net asset value with all distributions reinvested and do not reflect the effect of sales charges. |
| (6) | Excludes the effect of custody fee credits, if any, of less than 0.005%. |
| (7) | The investment adviser of the Portfolio waived a portion of its investment adviser fee and/or the administrator of the Fund reimbursed certain operating expenses (equal to 0.47%, 0.33%, 0.42%, 0.32%, 0.21% and 0.09% of average daily net assets for the years ended September 30, 2015, 2014, 2013 and 2012, the period ended September 30, 2011 and the year ended October 31, 2010, respectively). A portion of the waiver and reimbursement was borne by the sub-adviser. Absent this waiver and/or reimbursement, total return would be lower. |
| (9) | Includes the Fund’s share of the Portfolio’s allocated expenses for the period while the Fund was investing in the Portfolio. |
| (10) | Portfolio turnover represents the rate of portfolio activity for the period while the Fund was investing in the Portfolio. |
| (11) | For the period from April 22, 2011 through September 30, 2011 when the Fund was making investments directly in securities. |
References to Portfolio herein are to Tax-Managed Mid-Cap Core Portfolio, a Massachusetts business trust having the same investment objective and policies as the Fund, in which the Fund invested all of its investable assets prior to April 22, 2011.
| | | | |
| | 12 | | See Notes to Financial Statements. |
Eaton Vance
Atlanta Capital Horizon Growth Fund
September 30, 2015
Financial Highlights — continued
| | | | | | | | | | | | | | | | | | | | | | | | |
| | | Class B | |
| | | Year Ended September 30, | | | Period Ended September 30, 2011(1) | | | Year Ended
October 31, 2010 | |
| | | 2015 | | | 2014 | | | 2013 | | | 2012 | | | |
Net asset value — Beginning of period | | $ | 13.440 | | | $ | 12.920 | | | $ | 11.130 | | | $ | 13.060 | | | $ | 13.450 | | | $ | 10.920 | |
| | | | | | |
| Income (Loss) From Operations | | | | | | | | | | | | | | | | | | | | | | | | |
Net investment loss(2) | | $ | (0.182 | ) | | $ | (0.197 | ) | | $ | (0.169 | ) | | $ | (0.183 | ) | | $ | (0.195 | )(3) | | $ | (0.146 | ) |
Net realized and unrealized gain (loss) | | | (0.133 | ) | | | 1.074 | | | | 2.263 | | | | 1.732 | | | | (0.139 | ) | | | 2.676 | |
| | | | | | |
Total income (loss) from operations | | $ | (0.315 | ) | | $ | 0.877 | | | $ | 2.094 | | | $ | 1.549 | | | $ | (0.334 | ) | | $ | 2.530 | |
| | | | | | |
| Less Distributions | | | | | | | | | | | | | | | | | | | | | | | | |
From net realized gain | | $ | (1.225 | ) | | $ | (0.357 | ) | | $ | (0.304 | ) | | $ | (3.479 | ) | | $ | (0.056 | ) | | $ | — | |
| | | | | | |
Total distributions | | $ | (1.225 | ) | | $ | (0.357 | ) | | $ | (0.304 | ) | | $ | (3.479 | ) | | $ | (0.056 | ) | | $ | — | |
| | | | | | |
Net asset value — End of period | | $ | 11.900 | | | $ | 13.440 | | | $ | 12.920 | | | $ | 11.130 | | | $ | 13.060 | | | $ | 13.450 | |
| | | | | | |
Total Return(4) | | | (2.75 | )% | | | 6.88 | % | | | 19.35 | % | | | 14.49 | % | | | (2.53 | )%(5) | | | 23.17 | % |
| | | | | | |
| Ratios/Supplemental Data | | | | | | | | | | | | | | | | | | | | | | | | |
Net assets, end of period (000’s omitted) | | $ | 1,208 | | | $ | 1,907 | | | $ | 2,354 | | | $ | 2,655 | | | $ | 3,790 | | | $ | 3,327 | |
Ratios (as a percentage of average daily net assets): | | | | | | | | | | | | | | | | | | | | | | | | |
Expenses(6)(7) | | | 2.15 | % | | | 2.15 | % | | | 2.15 | % | | | 2.15 | % | | | 2.25 | %(8)(9) | | | 2.35 | %(9) |
Net investment loss | | | (1.40 | )% | | | (1.46 | )% | | | (1.44 | )% | | | (1.56 | )% | | | (1.39 | )%(3)(8)(9) | | | (1.21 | )%(9) |
Portfolio Turnover of the Portfolio(10) | | | — | | | | — | | | | — | | | | — | | | | 16 | %(5) | | | 33 | % |
Portfolio Turnover of the Fund | | | 25 | % | | | 26 | % | | | 23 | % | | | 50 | % | | | 52 | %(5)(11) | | | — | |
| (1) | For the eleven months ended September 30, 2011. The Fund changed its fiscal year-end from October 31 to September 30. |
| (2) | Computed using average shares outstanding. |
| (3) | Net investment loss per share reflects special dividends allocated from the Portfolio, which amounted to $0.014 per share, for the period while the Fund was making investments directly in the Portfolio. Excluding special dividends, the ratio of net investment loss to average daily net assets would have been (1.49)%. |
| (4) | Returns are historical and are calculated by determining the percentage change in net asset value with all distributions reinvested and do not reflect the effect of sales charges. |
| (6) | Excludes the effect of custody fee credits, if any, of less than 0.005%. |
| (7) | The investment adviser of the Portfolio waived a portion of its investment adviser fee and/or the administrator of the Fund reimbursed certain operating expenses (equal to 0.47%, 0.33%, 0.42%, 0.32%, 0.21% and 0.09% of average daily net assets for the years ended September 30, 2015, 2014, 2013 and 2012, the period ended September 30, 2011 and the year ended October 31, 2010, respectively). A portion of the waiver and reimbursement was borne by the sub-adviser. Absent this waiver and/or reimbursement, total return would be lower. |
| (9) | Includes the Fund’s share of the Portfolio’s allocated expenses for the period while the Fund was investing in the Portfolio. |
| (10) | Portfolio turnover represents the rate of portfolio activity for the period while the Fund was investing in the Portfolio. |
| (11) | For the period from April 22, 2011 through September 30, 2011 when the Fund was making investments directly in securities. |
References to Portfolio herein are to Tax-Managed Mid-Cap Core Portfolio, a Massachusetts business trust having the same investment objective and policies as the Fund, in which the Fund invested all of its investable assets prior to April 22, 2011.
| | | | |
| | 13 | | See Notes to Financial Statements. |
Eaton Vance
Atlanta Capital Horizon Growth Fund
September 30, 2015
Financial Highlights — continued
| | | | | | | | | | | | | | | | | | | | | | | | |
| | | Class C | |
| | | Year Ended September 30, | | | Period Ended September 30, 2011(1) | | | Year Ended
October 31, 2010 | |
| | | 2015 | | | 2014 | | | 2013 | | | 2012 | | | |
Net asset value — Beginning of period | | $ | 13.430 | | | $ | 12.910 | | | $ | 11.120 | | | $ | 13.050 | | | $ | 13.430 | | | $ | 10.910 | |
| | | | | | |
| Income (Loss) From Operations | | | | | | | | | | | | | | | | | | | | | | | | |
Net investment loss(2) | | $ | (0.181 | ) | | $ | (0.196 | ) | | $ | (0.169 | ) | | $ | (0.182 | ) | | $ | (0.198 | )(3) | | $ | (0.145 | ) |
Net realized and unrealized gain (loss) | | | (0.134 | ) | | | 1.073 | | | | 2.263 | | | | 1.731 | | | | (0.126 | ) | | | 2.665 | |
| | | | | | |
Total income (loss) from operations | | $ | (0.315 | ) | | $ | 0.877 | | | $ | 2.094 | | | $ | 1.549 | | | $ | (0.324 | ) | | $ | 2.520 | |
| | | | | | |
| Less Distributions | | | | | | | | | | | | | | | | | | | | | | | | |
From net realized gain | | $ | (1.225 | ) | | $ | (0.357 | ) | | $ | (0.304 | ) | | $ | (3.479 | ) | | $ | (0.056 | ) | | $ | — | |
| | | | | | |
Total distributions | | $ | (1.225 | ) | | $ | (0.357 | ) | | $ | (0.304 | ) | | $ | (3.479 | ) | | $ | (0.056 | ) | | $ | — | |
| | | | | | |
Net asset value — End of period | | $ | 11.890 | | | $ | 13.430 | | | $ | 12.910 | | | $ | 11.120 | | | $ | 13.050 | | | $ | 13.430 | |
| | | | | | |
Total Return(4) | | | (2.75 | )% | | | 6.88 | % | | | 19.36 | % | | | 14.51 | % | | | (2.46 | )%(5) | | | 23.10 | % |
| | | | | | |
| Ratios/Supplemental Data | | | | | | | | | | | | | | | | | | | | | | | | |
Net assets, end of period (000’s omitted) | | $ | 6,818 | | | $ | 8,270 | | | $ | 8,759 | | | $ | 9,796 | | | $ | 10,456 | | | $ | 7,195 | |
Ratios (as a percentage of average daily net assets): | | | | | | | | | | | | | | | | | | | | | | | | |
Expenses(6)(7) | | | 2.15 | % | | | 2.15 | % | | | 2.15 | % | | | 2.15 | % | | | 2.25 | %(8)(9) | | | 2.35 | %(9) |
Net investment loss | | | (1.40 | )% | | | (1.46 | )% | | | (1.44 | )% | | | (1.55 | )% | | | (1.42 | )%(3)(8)(9) | | | (1.20 | )%(9) |
Portfolio Turnover of the Portfolio(10) | | | — | | | | — | | | | — | | | | — | | | | 16 | %(5) | | | 33 | % |
Portfolio Turnover of the Fund | | | 25 | % | | | 26 | % | | | 23 | % | | | 50 | % | | | 52 | %(5)(11) | | | — | |
| (1) | For the eleven months ended September 30, 2011. The Fund changed its fiscal year-end from October 31 to September 30. |
| (2) | Computed using average shares outstanding. |
| (3) | Net investment loss per share reflects special dividends allocated from the Portfolio, which amounted to $0.013 per share, for the period while the Fund was making investments directly in the Portfolio. Excluding special dividends, the ratio of net investment loss to average daily net assets would have been (1.51)%. |
| (4) | Returns are historical and are calculated by determining the percentage change in net asset value with all distributions reinvested and do not reflect the effect of sales charges. |
| (6) | Excludes the effect of custody fee credits, if any, of less than 0.005%. |
| (7) | The investment adviser of the Portfolio waived a portion of its investment adviser fee and/or the administrator of the Fund reimbursed certain operating expenses (equal to 0.47%, 0.33%, 0.42%, 0.32%, 0.21% and 0.09% of average daily net assets for the years ended September 30, 2015, 2014, 2013 and 2012, the period ended September 30, 2011 and the year ended October 31, 2010, respectively). A portion of the waiver and reimbursement was borne by the sub-adviser. Absent this waiver and/or reimbursement, total return would be lower. |
| (9) | Includes the Fund’s share of the Portfolio’s allocated expenses for the period while the Fund was investing in the Portfolio. |
| (10) | Portfolio turnover represents the rate of portfolio activity for the period while the Fund was investing in the Portfolio. |
| (11) | For the period from April 22, 2011 through September 30, 2011 when the Fund was making investments directly in securities. |
References to Portfolio herein are to Tax-Managed Mid-Cap Core Portfolio, a Massachusetts business trust having the same investment objective and policies as the Fund, in which the Fund invested all of its investable assets prior to April 22, 2011.
| | | | |
| | 14 | | See Notes to Financial Statements. |
Eaton Vance
Atlanta Capital Horizon Growth Fund
September 30, 2015
Financial Highlights — continued
| | | | | | | | | | | | | | | | | | | | |
| | | Class I | |
| | | Year Ended September 30, | | | Period Ended September 30, 2011(1) | |
| | | 2015 | | | 2014 | | | 2013 | | | 2012 | | |
Net asset value — Beginning of period | | $ | 15.460 | | | $ | 14.660 | | | $ | 12.470 | | | $ | 14.110 | | | $ | 17.730 | |
| | | | | |
| Income (Loss) From Operations | | | | | | | | | | | | | | | | | | | | |
Net investment loss(2) | | $ | (0.059 | ) | | $ | (0.069 | ) | | $ | (0.063 | ) | | $ | (0.072 | ) | | $ | (0.058 | ) |
Net realized and unrealized gain (loss) | | | (0.166 | ) | | | 1.226 | | | | 2.557 | | | | 1.911 | | | | (3.562 | ) |
| | | | | |
Total income (loss) from operations | | $ | (0.225 | ) | | $ | 1.157 | | | $ | 2.494 | | | $ | 1.839 | | | $ | (3.620 | ) |
| | | | | |
| Less Distributions | | | | | | | | | | | | | | | | | | | | |
From net realized gain | | $ | (1.225 | ) | | $ | (0.357 | ) | | $ | (0.304 | ) | | $ | (3.479 | ) | | $ | — | |
| | | | | |
Total distributions | | $ | (1.225 | ) | | $ | (0.357 | ) | | $ | (0.304 | ) | | $ | (3.479 | ) | | $ | — | |
| | | | | |
Net asset value — End of period | | $ | 14.010 | | | $ | 15.460 | | | $ | 14.660 | | | $ | 12.470 | | | $ | 14.110 | |
| | | | | |
Total Return(3) | | | (1.75 | )% | | | 7.99 | % | | | 20.50 | % | | | 15.69 | % | | | (20.42 | )%(4) |
| | | | | |
| Ratios/Supplemental Data | | | | | | | | | | | | | | | | | | | | |
Net assets, end of period (000’s omitted) | | $ | 1,738 | | | $ | 1,996 | | | $ | 1,553 | | | $ | 872 | | | $ | 1 | |
Ratios (as a percentage of average daily net assets): | | | | | | | | | | | | | | | | | | | | |
Expenses(5)(6) | | | 1.15 | % | | | 1.15 | % | | | 1.15 | % | | | 1.15 | % | | | 1.15 | %(7) |
Net investment loss | | | (0.39 | )% | | | (0.45 | )% | | | (0.47 | )% | | | (0.58 | )% | | | (0.86 | )%(7) |
Portfolio Turnover | | | 25 | % | | | 26 | % | | | 23 | % | | | 50 | % | | | 52 | %(4)(8) |
| (1) | For the period from the commencement of operations, May 2, 2011, to September 30, 2011. |
| (2) | Computed using average shares outstanding. |
| (3) | Returns are historical and are calculated by determining the percentage change in net asset value with all distributions reinvested. |
| (5) | The administrator of the Fund reimbursed certain operating expenses (equal to 0.47%, 0.33%, 0.42%, 0.32% and 0.38% of average daily net assets for the years ended September 30, 2015, 2014, 2013 and 2012 and the period ended September 30, 2011, respectively). A portion of the reimbursement was borne by the sub-adviser. Absent this reimbursement, total return would be lower. |
| (6) | Excludes the effect of custody fee credits, if any, of less than 0.005%. |
| (8) | For the period from April 22, 2011 through September 30, 2011 when the Fund was making investments directly in securities. |
| | | | |
| | 15 | | See Notes to Financial Statements. |
Eaton Vance
Atlanta Capital Horizon Growth Fund
September 30, 2015
Notes to Financial Statements
1 Significant Accounting Policies
Eaton Vance Atlanta Capital Horizon Growth Fund (the Fund) is a diversified series of Eaton Vance Mutual Funds Trust (the Trust). The Trust is a Massachusetts business trust registered under the Investment Company Act of 1940, as amended (the 1940 Act), as an open-end management investment company. The Fund’s investment objective is to seek total return. The Fund offers four classes of shares. Class A shares are generally sold subject to a sales charge imposed at time of purchase. Class B and Class C shares are sold at net asset value and are generally subject to a contingent deferred sales charge (see Note 5). Class I shares are sold at net asset value and are not subject to a sales charge. After the close of business on July 13, 2015 and in connection with the proposed reorganization (see Note 10), the Fund was closed to new investors, with limited exceptions. Class B shares automatically convert to Class A shares eight years after their purchase as described in the Fund’s prospectus. Beginning January 1, 2012, Class B shares are only available for purchase upon exchange from another Eaton Vance fund or through reinvestment of distributions. Each class represents a pro-rata interest in the Fund, but votes separately on class-specific matters and (as noted below) is subject to different expenses. Realized and unrealized gains and losses and net investment income and losses, other than class-specific expenses, are allocated daily to each class of shares based on the relative net assets of each class to the total net assets of the Fund. Each class of shares differs in its distribution plan and certain other class-specific expenses.
The following is a summary of significant accounting policies of the Fund. The policies are in conformity with accounting principles generally accepted in the United States of America (U.S. GAAP). The Fund is an investment company and follows accounting and reporting guidance in the Financial Accounting Standards Board (“FASB”) Accounting Standards Codification Topic 946.
A Investment Valuation — The following methodologies are used to determine the market value or fair value of investments.
Equity Securities. Equity securities listed on a U.S. securities exchange generally are valued at the last sale or closing price on the day of valuation or, if no sales took place on such date, at the mean between the closing bid and asked prices therefore on the exchange where such securities are principally traded. Equity securities listed on the NASDAQ Global or Global Select Market generally are valued at the NASDAQ official closing price. Unlisted or listed securities for which closing sales prices or closing quotations are not available are valued at the mean between the latest available bid and asked prices.
Affiliated Fund. The Fund may invest in Eaton Vance Cash Reserves Fund, LLC (Cash Reserves Fund), an affiliated investment company managed by Eaton Vance Management (EVM). The value of the Fund’s investment in Cash Reserves Fund reflects the Fund’s proportionate interest in its net assets. Cash Reserves Fund generally values its investment securities utilizing the amortized cost valuation technique in accordance with Rule 2a-7 under the 1940 Act. This technique involves initially valuing a portfolio security at its cost and thereafter assuming a constant amortization to maturity of any discount or premium. If amortized cost is determined not to approximate fair value, Cash Reserves Fund may value its investment securities based on available market quotations provided by a third party pricing service.
Fair Valuation. Investments for which valuations or market quotations are not readily available or are deemed unreliable are valued at fair value using methods determined in good faith by or at the direction of the Trustees of the Fund in a manner that fairly reflects the security’s value, or the amount that the Fund might reasonably expect to receive for the security upon its current sale in the ordinary course. Each such determination is based on a consideration of relevant factors, which are likely to vary from one pricing context to another. These factors may include, but are not limited to, the type of security, the existence of any contractual restrictions on the security’s disposition, the price and extent of public trading in similar securities of the issuer or of comparable companies or entities, quotations or relevant information obtained from broker/dealers or other market participants, information obtained from the issuer, analysts, and/or the appropriate stock exchange (for exchange-traded securities), an analysis of the company’s or entity’s financial condition, and an evaluation of the forces that influence the issuer and the market(s) in which the security is purchased and sold.
B Investment Transactions — Investment transactions for financial statement purposes are accounted for on a trade date basis. Realized gains and losses on investments sold are determined on the basis of identified cost.
C Income — Dividend income is recorded on the ex-dividend date for dividends received in cash and/or securities. However, if the ex-dividend date has passed, certain dividends from foreign securities are recorded as the Fund is informed of the ex-dividend date. Withholding taxes on foreign dividends and capital gains have been provided for in accordance with the Fund’s understanding of the applicable countries’ tax rules and rates. Interest income is recorded on the basis of interest accrued, adjusted for amortization of premium or accretion of discount.
D Federal Taxes — The Fund’s policy is to comply with the provisions of the Internal Revenue Code applicable to regulated investment companies and to distribute to shareholders each year substantially all of its net investment income, and all or substantially all of its net realized capital gains. Accordingly, no provision for federal income or excise tax is necessary.
As of September 30, 2015, the Fund had no uncertain tax positions that would require financial statement recognition, de-recognition, or disclosure. The Fund files a U.S. federal income tax return annually after its fiscal year-end, which is subject to examination by the Internal Revenue Service for a period of three years from the date of filing.
E Expenses — The majority of expenses of the Trust are directly identifiable to an individual fund. Expenses which are not readily identifiable to a specific fund are allocated taking into consideration, among other things, the nature and type of expense and the relative size of the funds.
F Expense Reduction — State Street Bank and Trust Company (SSBT) serves as custodian of the Fund. Pursuant to the custodian agreement, SSBT receives a fee reduced by credits, which are determined based on the average daily cash balance the Fund maintains with SSBT. All credit balances, if any, used to reduce the Fund’s custodian fees are reported as a reduction of expenses in the Statement of Operations.
Eaton Vance
Atlanta Capital Horizon Growth Fund
September 30, 2015
Notes to Financial Statements — continued
G Use of Estimates — The preparation of the financial statements in conformity with U.S. GAAP requires management to make estimates and assumptions that affect the reported amounts of assets and liabilities at the date of the financial statements and the reported amounts of income and expense during the reporting period. Actual results could differ from those estimates.
H Indemnifications — Under the Trust’s organizational documents, its officers and Trustees may be indemnified against certain liabilities and expenses arising out of the performance of their duties to the Fund. Under Massachusetts law, if certain conditions prevail, shareholders of a Massachusetts business trust (such as the Trust) could be deemed to have personal liability for the obligations of the Trust. However, the Trust’s Declaration of Trust contains an express disclaimer of liability on the part of Fund shareholders and the By-laws provide that the Trust shall assume the defense on behalf of any Fund shareholders. Moreover, the By-laws also provide for indemnification out of Fund property of any shareholder held personally liable solely by reason of being or having been a shareholder for all loss or expense arising from such liability. Additionally, in the normal course of business, the Fund enters into agreements with service providers that may contain indemnification clauses. The Fund’s maximum exposure under these arrangements is unknown as this would involve future claims that may be made against the Fund that have not yet occurred.
2 Distributions to Shareholders and Income Tax Information
It is the present policy of the Fund to make at least one distribution annually (normally in December) of all or substantially all of its net investment income and to distribute annually all or substantially all of its net realized capital gains. Distributions to shareholders are recorded on the ex-dividend date. Distributions are declared separately for each class of shares. Shareholders may reinvest income and capital gain distributions in additional shares of the same class of the Fund at the net asset value as of the ex-dividend date or, at the election of the shareholder, receive distributions in cash. Distributions to shareholders are determined in accordance with income tax regulations, which may differ from U.S. GAAP. As required by U.S. GAAP, only distributions in excess of tax basis earnings and profits are reported in the financial statements as a return of capital. Permanent differences between book and tax accounting relating to distributions are reclassified to paid-in capital. For tax purposes, distributions from short-term capital gains are considered to be from ordinary income.
The tax character of distributions declared for the years ended September 30, 2015 and September 30, 2014 was as follows:
| | | | | | | | |
| | | Year Ended September 30, | |
| | | 2015 | | | 2014 | |
| | |
Distributions declared from: | | | | | | | | |
Long-term capital gains | | $ | 2,829,033 | | | $ | 922,251 | |
During the year ended September 30, 2015, accumulated net realized gain was decreased by $123,384, accumulated net investment loss was decreased by $304,695 and paid-in capital was decreased by $181,311 due to the Fund’s use of equalization accounting and differences between book and tax accounting, primarily for net operating losses and investments in partnerships. Tax equalization accounting allows the Fund to treat as a distribution that portion of redemption proceeds representing a redeeming shareholder’s portion of undistributed taxable income and net capital gains. These reclassifications had no effect on the net assets or net asset value per share of the Fund.
As of September 30, 2015, the components of distributable earnings (accumulated losses) and unrealized appreciation (depreciation) on a tax basis were as follows:
| | | | |
Undistributed long-term capital gains | | $ | 1,016,678 | |
Late year ordinary losses | | $ | (208,652 | ) |
Net unrealized appreciation | | $ | 5,947,380 | |
The differences between components of distributable earnings (accumulated losses) on a tax basis and the amounts reflected in the Statement of Assets and Liabilities are primarily due to wash sales and investments in partnerships.
At September 30, 2015, the Fund had a late year ordinary loss of $208,652 which it has elected to defer to the following taxable year pursuant to income tax regulations. Late year ordinary losses represent certain specified losses realized in that portion of a taxable year after October 31 that are treated as ordinary for tax purposes plus ordinary losses attributable to that portion of a taxable year after December 31.
Eaton Vance
Atlanta Capital Horizon Growth Fund
September 30, 2015
Notes to Financial Statements — continued
The cost and unrealized appreciation (depreciation) of investments of the Fund at September 30, 2015, as determined on a federal income tax basis, were as follows:
| | | | |
| |
Aggregate cost | | $ | 23,992,520 | |
| |
Gross unrealized appreciation | | $ | 6,960,532 | |
Gross unrealized depreciation | | | (1,013,152 | ) |
| |
Net unrealized appreciation | | $ | 5,947,380 | |
3 Investment Adviser and Administration Fees and Other Transactions with Affiliates
The investment adviser fee is earned by Boston Management and Research (BMR), a subsidiary of EVM, as compensation for investment advisory services rendered to the Fund. The fee is computed at an annual rate of 0.80% of the Fund’s average daily net assets up to $500 million and is payable monthly. On net assets of $500 million and over, the annual fee is reduced. For the year ended September 30, 2015, the investment adviser fee amounted to $269,163 or 0.80% of the Fund’s average daily net assets. Pursuant to a sub-advisory agreement, BMR pays Atlanta Capital Management Company, LLC (Atlanta Capital), an affiliate of EVM, a portion of its adviser fee for sub-advisory services provided to the Fund. The Fund invests its cash in Cash Reserves Fund. EVM does not currently receive a fee for advisory services provided to Cash Reserves Fund.The administration fee is earned by EVM for administering the business affairs of the Fund and is computed at an annual rate of 0.15% of the Fund’s average daily net assets. For the year ended September 30, 2015, the administration fee amounted to $50,468.
EVM and Atlanta Capital have agreed to reimburse the Fund’s operating expenses to the extent that total annual operating expenses (relating to ordinary operating expenses only) exceed 1.40%, 2.15%, 2.15% and 1.15% of the Fund’s average daily net assets for Class A, Class B, Class C and Class I, respectively. This agreement may be changed or terminated after January 31, 2016. Pursuant to this agreement, EVM and Atlanta Capital were allocated $156,407 in total of the Fund’s operating expenses for the year ended September 30, 2015.
EVM provides sub-transfer agency and related services to the Fund pursuant to a Sub-Transfer Agency Support Services Agreement. For the year ended September 30, 2015, EVM earned $4,067 from the Fund pursuant to such agreement, which is included in transfer and dividend disbursing agent fees on the Statement of Operations. The Fund was informed that Eaton Vance Distributors, Inc. (EVD), an affiliate of EVM and the Fund’s principal underwriter, received $1,827 as its portion of the sales charge on sales of Class A shares for the year ended September 30, 2015. EVD also received distribution and service fees from Class A, Class B and Class C shares (see Note 4) and contingent deferred sales charges (see Note 5).
Trustees and officers of the Fund who are members of EVM’s or BMR’s organizations receive remuneration for their services to the Fund out of the investment adviser fee. Trustees of the Fund who are not affiliated with the investment adviser and administrator may elect to defer receipt of all or a percentage of their annual fees in accordance with the terms of the Trustees Deferred Compensation Plan. For the year ended September 30, 2015, no significant amounts have been deferred. Certain officers and Trustees of the Fund are officers of the above organizations.
4 Distribution Plans
The Fund has in effect a distribution plan for Class A shares (Class A Plan) pursuant to Rule 12b-1 under the 1940 Act. Pursuant to the Class A Plan, the Fund pays EVD a distribution and service fee of 0.25% per annum of its average daily net assets attributable to Class A shares for distribution services and facilities provided to the Fund by EVD, as well as for personal services and/or the maintenance of shareholder accounts. Distribution and service fees paid or accrued to EVD for the year ended September 30, 2015 amounted to $55,618 for Class A shares.
The Fund also has in effect distribution plans for Class B shares (Class B Plan) and Class C shares (Class C Plan) pursuant to Rule 12b-1 under the 1940 Act. Pursuant to the Class B and Class C Plans, the Fund pays EVD amounts equal to 0.75% per annum of its average daily net assets attributable to Class B and Class C shares for providing ongoing distribution services and facilities to the Fund. For the year ended September 30, 2015, the Fund paid or accrued to EVD $11,908 and $59,093 for Class B and Class C shares, respectively.
Pursuant to the Class B and Class C Plans, the Fund also makes payments of service fees to EVD, financial intermediaries and other persons in amounts equal to 0.25% per annum of its average daily net assets attributable to that class. Service fees paid or accrued are for personal services and/or the maintenance of shareholder accounts. They are separate and distinct from the sales commissions and distribution fees payable to EVD. Service fees paid or accrued for the year ended September 30, 2015 amounted to $3,969 and $19,698 for Class B and Class C shares, respectively.
Distribution and service fees are subject to the limitations contained in the Financial Industry Regulatory Authority’s NASD Conduct Rule 2830(d).
Eaton Vance
Atlanta Capital Horizon Growth Fund
September 30, 2015
Notes to Financial Statements — continued
5 Contingent Deferred Sales Charges
A contingent deferred sales charge (CDSC) generally is imposed on redemptions of Class B shares made within six years of purchase and on redemptions of Class C shares made within one year of purchase. Class A shares may be subject to a 1% CDSC if redeemed within 18 months of purchase (depending on the circumstances of purchase). Generally, the CDSC is based upon the lower of the net asset value at date of redemption or date of purchase. No charge is levied on shares acquired by reinvestment of dividends or capital gain distributions. The CDSC for Class B shares is imposed at declining rates that begin at 5% in the case of redemptions in the first and second year after purchase, declining one percentage point each subsequent year. Class C shares are subject to a 1% CDSC if redeemed within one year of purchase. For the year ended September 30, 2015, the Fund was informed that EVD received approximately $3,000 and less than $100 of CDSCs paid by Class B and Class C shareholders, respectively, and no CDSCs paid by Class A shareholders.
6 Purchases and Sales of Investments
Purchases and sales of investments, other than short-term obligations, aggregated $8,313,398 and $13,410,089, respectively, for the year ended September 30, 2015.
7 Shares of Beneficial Interest
The Fund’s Declaration of Trust permits the Trustees to issue an unlimited number of full and fractional shares of beneficial interest (without par value). Such shares may be issued in a number of different series (such as the Fund) and classes. Transactions in Fund shares were as follows:
| | | | | | | | |
| | | Year Ended September 30, | |
| Class A | | 2015 | | | 2014 | |
| | |
Sales | | | 51,042 | | | | 96,921 | |
Issued to shareholders electing to receive payments of distributions in Fund shares | | | 115,479 | | | | 37,400 | |
Redemptions | | | (223,441 | ) | | | (351,708 | ) |
Exchange from Class B shares | | | 15,427 | | | | 21,238 | |
| | |
Net decrease | | | (41,493 | ) | | | (196,149 | ) |
| | |
| | | | | | | | |
| | | Year Ended September 30, | |
| Class B | | 2015 | | | 2014 | |
| | |
Sales | | | 1,450 | | | | 15,347 | |
Issued to shareholders electing to receive payments of distributions in Fund shares | | | 11,658 | | | | 4,277 | |
Redemptions | | | (35,715 | ) | | | (35,785 | ) |
Exchange to Class A shares | | | (17,786 | ) | | | (24,132 | ) |
| | |
Net decrease | | | (40,393 | ) | | | (40,293 | ) |
| | |
| | | | | | | | |
| | | Year Ended September 30, | |
| Class C | | 2015 | | | 2014 | |
| | |
Sales | | | 32,012 | | | | 65,560 | |
Issued to shareholders electing to receive payments of distributions in Fund shares | | | 48,935 | | | | 15,363 | |
Redemptions | | | (123,508 | ) | | | (143,487 | ) |
| | |
Net decrease | | | (42,561 | ) | | | (62,564 | ) |
Eaton Vance
Atlanta Capital Horizon Growth Fund
September 30, 2015
Notes to Financial Statements — continued
| | | | | | | | |
| | | Year Ended September 30, | |
| Class I | | 2015 | | | 2014 | |
| | |
Sales | | | 27,792 | | | | 73,999 | |
Issued to shareholders electing to receive payments of distributions in Fund shares | | | 10,033 | | | | 2,044 | |
Redemptions | | | (42,925 | ) | | | (52,779 | ) |
| | |
Net increase (decrease) | | | (5,100 | ) | | | 23,264 | |
8 Line of Credit
The Fund participates with other portfolios and funds managed by EVM and its affiliates in a $625 million unsecured line of credit agreement with a group of banks, which is in effect through September 2, 2016. Borrowings are made by the Fund solely to facilitate the handling of unusual and/or unanticipated short-term cash requirements. Interest is charged to the Fund based on its borrowings at an amount above either the Eurodollar rate or Federal Funds rate. In addition, a fee computed at an annual rate of 0.10% on the daily unused portion of the line of credit is allocated among the participating portfolios and funds at the end of each quarter. Because the line of credit is not available exclusively to the Fund, it may be unable to borrow some or all of its requested amounts at any particular time. The Fund did not have any significant borrowings or allocated fees during the year ended September 30, 2015.
9 Fair Value Measurements
Under generally accepted accounting principles for fair value measurements, a three-tier hierarchy to prioritize the assumptions, referred to as inputs, is used in valuation techniques to measure fair value. The three-tier hierarchy of inputs is summarized in the three broad levels listed below.
| • | | Level 1 – quoted prices in active markets for identical investments |
| • | | Level 2 – other significant observable inputs (including quoted prices for similar investments, interest rates, prepayment speeds, credit risk, etc.) |
| • | | Level 3 – significant unobservable inputs (including a fund’s own assumptions in determining the fair value of investments) |
In cases where the inputs used to measure fair value fall in different levels of the fair value hierarchy, the level disclosed is determined based on the lowest level input that is significant to the fair value measurement in its entirety. The inputs or methodology used for valuing securities are not necessarily an indication of the risk associated with investing in those securities.
At September 30, 2015, the hierarchy of inputs used in valuing the Fund’s investments, which are carried at value, were as follows:
| | | | | | | | | | | | | | | | |
| Asset Description | | Level 1 | | | Level 2 | | | Level 3 | | | Total | |
| | | | |
Common Stocks | | $ | 29,356,137 | * | | $ | — | | | $ | — | | | $ | 29,356,137 | |
Short-Term Investments | | | — | | | | 583,763 | | | | — | | | | 583,763 | |
| | | | |
Total Investments | | $ | 29,356,137 | | | $ | 583,763 | | | $ | — | | | $ | 29,939,900 | |
| * | The level classification by major category of investments is the same as the category presentation in the Portfolio of Investments. |
The Fund held no investments or other financial instruments as of September 30, 2014 whose fair value was determined using Level 3 inputs. At September 30, 2015, there were no investments transferred between Level 1 and Level 2 during the year then ended.
10 Plan of Reorganization
In June 2015, the Trustees of the Fund approved an Agreement and Plan of Reorganization (the Agreement) whereby Eaton Vance Atlanta Capital SMID-Cap Fund would acquire substantially all the assets and assume substantially all the liabilities of the Fund in exchange for shares of Eaton Vance Atlanta Capital SMID-Cap Fund. The proposed reorganization was approved by the shareholders of the Fund on October 23, 2015. Subject to the satisfaction of the conditions of the Agreement, the transaction is expected to occur on or about December 4, 2015.
Eaton Vance
Atlanta Capital Horizon Growth Fund
September 30, 2015
Report of Independent Registered Public Accounting Firm
To the Trustees of Eaton Vance Mutual Funds Trust and Shareholders of Eaton Vance Atlanta Capital Horizon Growth Fund:
We have audited the accompanying statement of assets and liabilities of Eaton Vance Atlanta Capital Horizon Growth Fund (the “Fund”) (one of the funds constituting Eaton Vance Mutual Funds Trust), including the portfolio of investments, as of September 30, 2015, and the related statement of operations for the year then ended, the statements of changes in net assets for each of the two years in the period then ended, and the financial highlights for each of the periods presented. These financial statements and financial highlights are the responsibility of the Fund’s management. Our responsibility is to express an opinion on these financial statements and financial highlights based on our audits.
We conducted our audits in accordance with the standards of the Public Company Accounting Oversight Board (United States). Those standards require that we plan and perform the audit to obtain reasonable assurance about whether the financial statements and financial highlights are free of material misstatement. The Fund is not required to have, nor were we engaged to perform, an audit of its internal control over financial reporting. Our audits included consideration of internal control over financial reporting as a basis for designing audit procedures that are appropriate in the circumstances, but not for the purpose of expressing an opinion on the effectiveness of the Fund’s internal control over financial reporting. Accordingly, we express no such opinion. An audit also includes examining, on a test basis, evidence supporting the amounts and disclosures in the financial statements, assessing the accounting principles used and significant estimates made by management, as well as evaluating the overall financial statement presentation. Our procedures included confirmation of securities owned as of September 30, 2015, by correspondence with the custodian and brokers; where replies were not received from brokers, we performed other auditing procedures. We believe that our audits provide a reasonable basis for our opinion.
In our opinion, such financial statements and financial highlights referred to above present fairly, in all material respects, the financial position of Eaton Vance Atlanta Capital Horizon Growth Fund as of September 30, 2015, the results of its operations for the year then ended, the changes in its net assets for each of the two years in the period then ended, and the financial highlights for each of the periods presented, in conformity with accounting principles generally accepted in the United States of America.
As discussed in Note 10 to the financial statements, the Trustees and Shareholders of the Fund approved an Agreement and Plan of Reorganization whereby Eaton Vance Atlanta Capital SMID-Cap Fund would acquire substantially all the assets and assume substantially all the liabilities of the Fund in exchange for shares of Eaton Vance Atlanta Capital SMID-Cap Fund. The transaction is expected to occur on or about December 4, 2015.
DELOITTE & TOUCHE LLP
Boston, Massachusetts
November 16, 2015
Eaton Vance
Atlanta Capital Horizon Growth Fund
September 30, 2015
Federal Tax Information (Unaudited)
The Form 1099-DIV you receive in February 2016 will show the tax status of all distributions paid to your account in calendar year 2015. Shareholders are advised to consult their own tax adviser with respect to the tax consequences of their investment in the Fund. As required by the Internal Revenue Code and/or regulations, shareholders must be notified regarding the status of capital gains dividends.
Capital Gains Dividends. The Fund hereby designates as a capital gain dividend with respect to the taxable year ended September 30, 2015, $1,416,255 or, if subsequently determined to be different, the net capital gain of such year.
Eaton Vance
Atlanta Capital Horizon Growth Fund
September 30, 2015
Board of Trustees’ Contract Approval
Overview of the Contract Review Process
The Investment Company Act of 1940, as amended (the “1940 Act”), provides, in substance, that each investment advisory agreement between a fund and its investment adviser will continue in effect from year to year only if its continuation is approved at least annually by the fund’s board of trustees, including by a vote of a majority of the trustees who are not “interested persons” of the fund (“Independent Trustees”), cast in person at a meeting called for the purpose of considering such approval.
At a meeting of the Boards of Trustees (each a “Board”) of the registered investment companies advised, administered and/or distributed by Eaton Vance Management or its affiliates (the “Eaton Vance Funds”) held on April 27, 2015, the Board, including a majority of the Independent Trustees, voted to approve continuation of existing investment advisory and sub-advisory agreements for the Eaton Vance Funds for an additional one-year period. In voting its approval, the Board relied upon the affirmative recommendation of its Contract Review Committee, which is a committee comprised exclusively of Independent Trustees. Prior to making its recommendation, the Contract Review Committee reviewed information furnished by each adviser to the Eaton Vance Funds (including information specifically requested by the Board) for a series of meetings of the Contract Review Committee held between February and April 2015. The Contract Review Committee also considered information received at prior meetings of the Board and its committees, as relevant to its annual evaluation of the investment advisory and sub-advisory agreements.
The information that the Board considered included, among other things, the following:
Information about Fees, Performance and Expenses
| • | | A report from an independent data provider comparing the advisory and related fees paid by each fund with fees paid by comparable funds as identified by the data provider (“comparable funds”); |
| • | | A report from an independent data provider comparing each fund’s total expense ratio and its components to comparable funds; |
| • | | A report from an independent data provider comparing the investment performance of each fund (including, where relevant, yield data, Sharpe ratios and information ratios) to the investment performance of comparable funds over various time periods; |
| • | | Data regarding investment performance in comparison to benchmark indices and customized peer groups identified by the adviser in consultation with the Board; |
| • | | For each fund, comparative information concerning the fees charged and the services provided by each adviser in managing other accounts (including mutual funds, other collective investment funds and institutional accounts) using investment strategies and techniques similar to those used in managing such fund; |
| • | | Profitability analyses for each adviser with respect to each fund; |
Information about Portfolio Management and Trading
| • | | Descriptions of the investment management services provided to each fund, including the investment strategies and processes it employs; |
| • | | The procedures and processes used to determine the fair value of fund assets and actions taken to monitor and test the effectiveness of such procedures and processes; |
| • | | Information about each adviser’s policies and practices with respect to trading, including each adviser’s processes for monitoring best execution of portfolio transactions; |
| • | | Information about the allocation of brokerage transactions and the benefits received by each adviser as a result of brokerage allocation, including information concerning the acquisition of research through client commission arrangements and policies with respect to “soft dollars”; |
| • | | Data relating to portfolio turnover rates of each fund; |
Information about each Adviser
| • | | Reports detailing the financial results and condition of each adviser; |
| • | | Descriptions of the qualifications, education and experience of the individual investment professionals whose responsibilities include portfolio management and investment research for the funds, and information relating to their compensation and responsibilities with respect to managing other mutual funds and investment accounts; |
| • | | The Code of Ethics of each adviser and its affiliates, together with information relating to compliance with and the administration of such codes; |
| • | | Policies and procedures relating to proxy voting and the handling of corporate actions and class actions; |
| • | | Information concerning the resources devoted to compliance efforts undertaken by each adviser and its affiliates (including descriptions of various compliance programs) and their record of compliance; |
| • | | Descriptions of the business continuity and disaster recovery plans of each adviser and its affiliates; |
| • | | A description of Eaton Vance Management’s procedures for overseeing third party advisers and sub-advisers, including with respect to regulatory and compliance issues, investment management and other matters; |
Eaton Vance
Atlanta Capital Horizon Growth Fund
September 30, 2015
Board of Trustees’ Contract Approval — continued
Other Relevant Information
| • | | Information concerning the nature, cost and character of the administrative and other non-investment management services provided by Eaton Vance Management and its affiliates; |
| • | | Information concerning management of the relationship with the custodian, subcustodians and fund accountants by each adviser or the funds’ administrator; and |
| • | | The terms of each investment advisory agreement. |
Over the course of the twelve-month period ended April 30, 2015, with respect to one or more funds, the Board met nine times and the Contract Review Committee, the Audit Committee, the Governance Committee, the Portfolio Management Committee and the Compliance Reports and Regulatory Matters Committee, each of which is a Committee comprised solely of Independent Trustees, met eight, seventeen, seven, eleven and thirteen times, respectively. At such meetings, the Trustees participated in investment and performance reviews with the portfolio managers and other investment professionals of each adviser relating to each fund, and considered the investment and trading strategies used in pursuing each fund’s investment objective, including, where relevant, the use of derivative instruments, as well as processes for monitoring best execution of portfolio transactions and risk management techniques. The Board and its Committees also evaluated issues pertaining to industry and regulatory developments, compliance procedures, fund governance and other issues with respect to the funds, and received and participated in reports and presentations provided by Eaton Vance Management and other fund advisers with respect to such matters. In addition to the formal meetings of the Board and its Committees, the Independent Trustees hold regular teleconferences in between meetings to discuss, among other topics, matters relating to the continuation of investment advisory and sub-advisory agreements.
For funds that invest through one or more underlying portfolios, the Board considered similar information about the portfolio(s) when considering the approval of investment advisory agreements. In addition, in cases where the fund’s investment adviser has engaged a sub-adviser, the Board considered similar information about the sub-adviser when considering the approval of any sub-advisory agreement.
The Contract Review Committee was assisted throughout the contract review process by Goodwin Procter LLP, legal counsel for the Independent Trustees. The members of the Contract Review Committee relied upon the advice of such counsel and their own business judgment in determining the material factors to be considered in evaluating each investment advisory and sub-advisory agreement and the weight to be given to each such factor. The conclusions reached with respect to each investment advisory and sub-advisory agreement were based on a comprehensive evaluation of all the information provided and not any single factor. Moreover, each member of the Contract Review Committee may have placed varying emphasis on particular factors in reaching conclusions with respect to each investment advisory and sub-advisory agreement. In evaluating each investment advisory and sub-advisory agreement, including the specific fee structures and other terms of the agreements, the Contract Review Committee was informed by multiple years of analysis and discussion among the Independent Trustees and the Eaton Vance Funds’ advisers and sub-advisers.
Results of the Process
Based on its consideration of the foregoing, and such other information as it deemed relevant, including the factors and conclusions described below, the Contract Review Committee concluded that the continuation of the investment advisory agreement of Eaton Vance Atlanta Capital Horizon Growth Fund (the “Fund”) with Boston Management and Research (the “Adviser”) and the sub-advisory agreement with Atlanta Capital Management Company, LLC (the “Sub-adviser”), each an affiliate of Eaton Vance Management, including their fee structures, is in the interests of shareholders and, therefore, the Contract Review Committee recommended to the Board approval of each agreement. The Board accepted the recommendation of the Contract Review Committee as well as the factors considered and conclusions reached by the Contract Review Committee with respect to the agreements. Accordingly, the Board, including a majority of the Independent Trustees, voted to approve continuation of the investment advisory agreement and the sub-advisory agreement for the Fund.
Nature, Extent and Quality of Services
In considering whether to approve the investment advisory agreement and the sub-advisory agreement of the Fund, the Board evaluated the nature, extent and quality of services provided to the Fund by the Adviser and the Sub-adviser.
The Board considered the Adviser’s and the Sub-adviser’s management capabilities and investment process with respect to the types of investments held by the Fund, including the education, experience and number of its investment professionals and other personnel who provide portfolio management, investment research, and similar services to the Fund. With respect to the Adviser, the Board considered the Adviser’s responsibilities supervising the Sub-adviser. With respect to the Sub-adviser, the Board took into account the resources available to the Sub-adviser in fulfilling its duties under the sub-advisory agreement and the Sub-adviser’s abilities and experience in implementing the Fund’s investment strategy. In particular, the Board considered the abilities and experience of such personnel in investing in equity securities, including both U.S. and foreign common stocks. The Board also took into account the resources dedicated to portfolio management and other services, as well as the compensation methods of the Adviser and other factors, such as the reputation and resources of the Adviser to recruit and retain investment personnel. In addition, the Board considered the time and attention devoted to the Fund by senior management, as well as the infrastructure, operational capabilities and support staff in place to assist in the management of the Fund, including the provision of administrative services.
Eaton Vance
Atlanta Capital Horizon Growth Fund
September 30, 2015
Board of Trustees’ Contract Approval — continued
The Board considered the compliance programs of the Adviser and relevant affiliates thereof, including the Sub-adviser. Among other matters, the Board considered compliance and reporting matters relating to personal trading by investment personnel, selective disclosure of portfolio holdings, late trading, frequent trading, portfolio valuation, business continuity and the allocation of investment opportunities. The Board also considered the responses of the Adviser and its affiliates to requests in recent years from regulatory authorities such as the Securities and Exchange Commission and the Financial Industry Regulatory Authority.
The Board considered shareholder and other administrative services provided or managed by Eaton Vance Management and its affiliates, including transfer agency and accounting services. The Board evaluated the benefits to shareholders of investing in a fund that is a part of a large family of funds, including the ability, in many cases, to exchange an investment among different funds without incurring additional sales charges.
After consideration of the foregoing factors, among others, the Board concluded that the nature, extent and quality of services provided by the Adviser and the Sub-adviser, taken as a whole, are appropriate and consistent with the terms of the investment advisory agreement and the sub-advisory agreement.
Fund Performance
The Board compared the Fund’s investment performance to that of comparable funds and appropriate benchmark indices. The Board’s review included comparative performance data for the one-, three-, five- and ten-year periods ended September 30, 2014 for the Fund. The Board noted that actions are being taken by the Adviser to address Fund performance and concluded that additional time is required to evaluate the effectiveness of such actions.
Management Fees and Expenses
The Board considered contractual fee rates payable by the Fund for advisory and administrative services (referred to collectively as “management fees”). As part of its review, the Board considered the Fund’s management fees and total expense ratio for the year ended September 30, 2014, as compared to those of comparable funds, before and after giving effect to any undertaking to waive fees or reimburse expenses. The Board also considered factors that had an impact on Fund expense ratios, as identified by management in response to inquiries from the Contract Review Committee, as well as actions taken by management in recent years to reduce expenses at the fund complex level.
After considering the foregoing information, and in light of the nature, extent and quality of the services provided by the Adviser and the Sub-adviser, the Board concluded that the management fees charged for advisory and related services are reasonable.
Profitability
The Board considered the level of profits realized by the Adviser and relevant affiliates thereof, including the Sub-adviser, in providing investment advisory and administrative services to the Fund and to all Eaton Vance Funds as a group. The Board considered the level of profits realized without regard to revenue sharing or other payments by the Adviser and its affiliates to third parties in respect of distribution services. The Board also considered other direct or indirect benefits received by the Adviser and its affiliates, including the Sub-adviser, in connection with their relationships with the Fund, including the benefits of research services that may be available to the Adviser or the Sub-adviser as a result of securities transactions effected for the Fund and other investment advisory clients.
The Board concluded that, in light of the foregoing factors and the nature, extent and quality of the services rendered, the profits realized by the Adviser and its affiliates, including the Sub-adviser, are reasonable.
Economies of Scale
In reviewing management fees and profitability, the Board also considered the extent to which the Adviser and its affiliates, on the one hand, and the Fund, on the other hand, can expect to realize benefits from economies of scale as the assets of the Fund increase. The Board acknowledged the difficulty in accurately measuring the benefits resulting from the economies of scale with respect to the management of any specific fund or group of funds. The Board reviewed data summarizing the increases and decreases in the assets of the Fund and of all Eaton Vance Funds as a group over various time periods, and evaluated the extent to which the total expense ratio of the Fund and the profitability of the Adviser and its affiliates may have been affected by such increases or decreases. Based upon the foregoing, the Board concluded that the Fund currently shares in the benefits from economies of scale. The Board also concluded that, assuming reasonably foreseeable increases in the assets of the Fund, the structure of the advisory fee, which includes breakpoints at several asset levels, will allow the Fund to continue to benefit from economies of scale in the future.
Eaton Vance
Atlanta Capital Horizon Growth Fund
September 30, 2015
Management and Organization
Fund Management. The Trustees of Eaton Vance Mutual Funds Trust (the Trust) are responsible for the overall management and supervision of the Trust’s affairs. The Trustees and officers of the Trust are listed below. Except as indicated, each individual has held the office shown or other offices in the same company for the last five years. Trustees and officers of the Trust hold indefinite terms of office. The “Noninterested Trustees” consist of those Trustees who are not “interested persons” of the Trust, as that term is defined under the 1940 Act. The business address of each Trustee and officer is Two International Place, Boston, Massachusetts 02110. As used below, “EVC” refers to Eaton Vance Corp., “EV” refers to Eaton Vance, Inc., “EVM” refers to Eaton Vance Management, “BMR” refers to Boston Management and Research and “EVD” refers to Eaton Vance Distributors, Inc. EVC and EV are the corporate parent and trustee, respectively, of EVM and BMR. EVD is the Fund’s principal underwriter and a wholly-owned subsidiary of EVC. Each officer affiliated with Eaton Vance may hold a position with other Eaton Vance affiliates that is comparable to his or her position with EVM listed below. Each Trustee oversees 174 portfolios in the Eaton Vance Complex (including all master and feeder funds in a master feeder structure). Each officer serves as an officer of certain other Eaton Vance funds. Each Trustee and officer serves until his or her successor is elected.
| | | | | | |
| Name and Year of Birth | | Position(s) with the Trust | | Trustee Since(1) | | Principal Occupation(s) and Directorships During Past Five Years and Other Relevant Experience |
Interested Trustee | | | | |
| | | |
Thomas E. Faust Jr. 1958 | | Trustee | | 2007 | | Chairman, Chief Executive Officer and President of EVC, Director and President of EV, Chief Executive Officer and President of EVM and BMR, and Director of EVD. Trustee and/or officer of 174 registered investment companies. Mr. Faust is an interested person because of his positions with EVM, BMR, EVD, EVC and EV, which are affiliates of the Trust. Directorships in the Last Five Years.(2) Director of EVC and Hexavest Inc. |
| | | |
| | | | | | |
Noninterested Trustees | | | | |
| | | |
Scott E. Eston 1956 | | Trustee | | 2011 | | Private investor. Formerly held various positions at Grantham, Mayo, Van Otterloo and Co., L.L.C. (investment management firm) (1997-2009), including Chief Operating Officer (2002-2009), Chief Financial Officer (1997-2009) and Chairman of the Executive Committee (2002-2008); President and Principal Executive Officer, GMO Trust (open-end registered investment company) (2006-2009). Former Partner, Coopers and Lybrand L.L.P. (now PricewaterhouseCoopers) (public accounting firm) (1987-1997). Directorships in the Last Five Years.(2) None. |
| | | |
Cynthia E. Frost 1961 | | Trustee | | 2014 | | Private investor. Formerly, Chief Investment Officer of Brown University (university endowment) (2000-2012); Portfolio Strategist for Duke Management Company (university endowment manager) (1995-2000); Managing Director, Cambridge Associates (1989-1995); Consultant, Bain and Company (1987-1989); Senior Equity Analyst, BA Investment Management Company (1983-1985). Directorships in the Last Five Years. None. |
| | | |
George J. Gorman 1952 | | Trustee | | 2014 | | Principal at George J. Gorman LLC (consulting firm). Formerly, Senior Partner at Ernst & Young LLP (public accounting firm) (1974-2009). Directorships in the Last Five Years. Formerly, Trustee of the Bank of America Money Market Funds Series Trust (2011-2014) and of the Ashmore Funds (2010-2014). |
| | | |
Valerie A. Mosley 1960 | | Trustee | | 2014 | | Chairwoman and Chief Executive Officer of Valmo Ventures (a consulting and investment firm). Former Partner and Senior Vice President, Portfolio Manager and Investment Strategist at Wellington Management Company, LLP (investment management firm) (1992-2012). Former Chief Investment Officer, PG Corbin Asset Management (1990-1992). Formerly worked in institutional corporate bond sales at Kidder Peabody (1986-1990). Directorships in the Last Five Years.(2) Director of Dynex Capital, Inc. (mortgage REIT) (since 2013). |
Eaton Vance
Atlanta Capital Horizon Growth Fund
September 30, 2015
Management and Organization — continued
| | | | | | |
| Name and Year of Birth | | Position(s) with the Trust | | Trustee Since(1) | | Principal Occupation(s) and Directorships During Past Five Years and Other Relevant Experience |
Noninterested Trustees (contined) |
| | | |
William H. Park 1947 | | Trustee | | 2003 | | Private investor. Formerly, Consultant (2012-2014). Formerly, Chief Financial Officer, Aveon Group L.P. (investment management firm) (2010-2011). Formerly, Vice Chairman, Commercial Industrial Finance Corp. (specialty finance company) (2006-2010). Formerly, President and Chief Executive Officer, Prizm Capital Management, LLC (investment management firm) (2002-2005). Formerly, Executive Vice President and Chief Financial Officer, United Asset Management Corporation (investment management firm) (1982-2001). Formerly, Senior Manager, Price Waterhouse (now PricewaterhouseCoopers) (an independent registered public accounting firm) (1972-1981). Directorships in the Last Five Years.(2) None. |
| | | |
Helen Frame Peters 1948 | | Trustee | | 2008 | | Professor of Finance, Carroll School of Management, Boston College. Formerly, Dean, Carroll School of Management, Boston College (2000-2002). Formerly, Chief Investment Officer, Fixed Income, Scudder Kemper Investments (investment management firm) (1998-1999). Formerly, Chief Investment Officer, Equity and Fixed Income, Colonial Management Associates (investment management firm) (1991-1998). Directorships in the Last Five Years.(2) Formerly, Director of BJ’s Wholesale Club, Inc. (wholesale club retailer) (2004-2011). Formerly, Trustee of SPDR Index Shares Funds and SPDR Series Trust (exchange traded funds) (2000-2009). Formerly, Director of Federal Home Loan Bank of Boston (a bank for banks) (2007-2009). |
| | | |
Susan J. Sutherland(3) 1957 | | Trustee | | 2015 | | Private investor. Formerly, Associate, Counsel and Partner at Skadden, Arps, Slate, Meagher & Flom LLP (law firm) (1982-2013). Directorships in the Last Five Years. Formerly, Director of Montpelier Re Holdings Ltd. (global provider of customized insurance and reinsurance products) (2013-2015). |
| | | |
Harriett Tee Taggart 1948 | | Trustee | | 2011 | | Managing Director, Taggart Associates (a professional practice firm). Formerly, Partner and Senior Vice President, Wellington Management Company, LLP (investment management firm) (1983-2006). Directorships in the Last Five Years.(2) Director of Albemarle Corporation (chemicals manufacturer) (since 2007) and The Hanover Group (specialty property and casualty insurance company) (since 2009). Formerly, Director of Lubrizol Corporation (specialty chemicals) (2007-2011). |
| | | |
Ralph F. Verni 1943 | | Chairman of the Board and Trustee | | 2007 (Chairman); 2005 (Trustee) | | Consultant and private investor. Formerly, Chief Investment Officer (1982-1992), Chief Financial Officer (1988-1990) and Director (1982-1992), New England Life. Formerly, Chairperson, New England Mutual Funds (1982-1992). Formerly, President and Chief Executive Officer, State Street Management & Research (1992-2000). Formerly, Chairperson, State Street Research Mutual Funds (1992-2000). Formerly, Director, W.P. Carey, LLC (1998-2004) and First Pioneer Farm Credit Corp. (2002-2006). Directorships in the Last Five Years.(2) None. |
| | | |
| | | | | | |
Principal Officers who are not Trustees |
| Name and Year of Birth | | Position(s)
with the Trust | | Officer Since(4) | | Principal Occupation(s) During Past Five Years |
| | | |
Payson F. Swaffield 1956 | | President | | 2003 | | Vice President and Chief Income Investment Officer of EVM and BMR. |
| | | |
Maureen A. Gemma 1960 | | Vice President, Secretary and Chief Legal Officer | | 2005 | | Vice President of EVM and BMR. |
| | | |
James F. Kirchner 1967 | | Treasurer | | 2007 | | Vice President of EVM and BMR. |
Eaton Vance
Atlanta Capital Horizon Growth Fund
September 30, 2015
Management and Organization — continued
| | | | | | |
| Name and Year of Birth | | Position(s)
with the Trust | | Officer Since(4) | | Principal Occupation(s) During Past Five Years |
Principal Officers who are not Trustees (continued) |
| | | |
Paul M. O’Neil 1953 | | Chief Compliance Officer | | 2004 | | Vice President of EVM and BMR. |
| (1) | Year first appointed to serve as Trustee for a fund in the Eaton Vance family of funds. Each Trustee has served continuously since appointment unless indicated otherwise. |
| (2) | During their respective tenures, the Trustees (except for Mmes. Frost and Sutherland and Mr. Gorman) also served as Board members of one or more of the following funds (which operated in the years noted): eUnitsTM 2 Year U.S. Market Participation Trust: Upside to Cap / Buffered Downside (launched in 2012 and terminated in 2014); eUnitsTM 2 Year U.S. Market Participation Trust II: Upside to Cap / Buffered Downside (launched in 2012 and terminated in 2014); Eaton Vance Credit Opportunities Fund (launched in 2005 and terminated in 2010); and Eaton Vance National Municipal Income Trust (launched in 1998 and terminated in 2009). However, Ms. Mosley did not serve as a Board member of eUnitsTM 2 Year U.S. Market Participation Trust: Upside to Cap / Buffered Downside (launched in 2012 and terminated in 2014). |
| (3) | Ms. Sutherland began serving as a Trustee effective May 1, 2015. |
| (4) | Year first elected to serve as officer of a fund in the Eaton Vance family of funds when the officer has served continuously. Otherwise, year of most recent election as an officer of a fund in the Eaton Vance family of funds. Titles may have changed since initial election. |
The SAI for the Fund includes additional information about the Trustees and officers of the Fund and can be obtained without charge on Eaton Vance’s website at www.eatonvance.com or by calling 1-800-262-1122.
Eaton Vance Funds
IMPORTANT NOTICES
Privacy. The Eaton Vance organization is committed to ensuring your financial privacy. Each of the financial institutions identified below has in effect the following policy (“Privacy Policy”) with respect to nonpublic personal information about its customers:
| • | | Only such information received from you, through application forms or otherwise, and information about your Eaton Vance fund transactions will be collected. This may include information such as name, address, social security number, tax status, account balances and transactions. |
| • | | None of such information about you (or former customers) will be disclosed to anyone, except as permitted by law (which includes disclosure to employees necessary to service your account). In the normal course of servicing a customer’s account, Eaton Vance may share information with unaffiliated third parties that perform various required services such as transfer agents, custodians and broker-dealers. |
| • | | Policies and procedures (including physical, electronic and procedural safeguards) are in place that are designed to protect the confidentiality of such information. |
| • | | We reserve the right to change our Privacy Policy at any time upon proper notification to you. Customers may want to review our Privacy Policy periodically for changes by accessing the link on our homepage: www.eatonvance.com. |
Our pledge of privacy applies to the following entities within the Eaton Vance organization: the Eaton Vance Family of Funds, Eaton Vance Management, Eaton Vance Investment Counsel, Eaton Vance Distributors, Inc., Eaton Vance Trust Company, Eaton Vance Management’s Real Estate Investment Group and Boston Management and Research. In addition, our Privacy Policy applies only to those Eaton Vance customers who are individuals and who have a direct relationship with us. If a customer’s account (i.e., fund shares) is held in the name of a third-party financial advisor/broker-dealer, it is likely that only such advisor’s privacy policies apply to the customer. This notice supersedes all previously issued privacy disclosures. For more information about Eaton Vance’s Privacy Policy, please call 1-800-262-1122.
Delivery of Shareholder Documents. The Securities and Exchange Commission (SEC) permits funds to deliver only one copy of shareholder documents, including prospectuses, proxy statements and shareholder reports, to fund investors with multiple accounts at the same residential or post office box address. This practice is often called “householding” and it helps eliminate duplicate mailings to shareholders. Eaton Vance, or your financial advisor, may household the mailing of your documents indefinitely unless you instruct Eaton Vance, or your financial advisor, otherwise. If you would prefer that your Eaton Vance documents not be householded, please contact Eaton Vance at 1-800-262-1122, or contact your financial advisor. Your instructions that householding not apply to delivery of your Eaton Vance documents will be effective within 30 days of receipt by Eaton Vance or your financial advisor.
Portfolio Holdings. Each Eaton Vance Fund and its underlying Portfolio(s) (if applicable) will file a schedule of portfolio holdings on Form N-Q with the SEC for the first and third quarters of each fiscal year. The Form N-Q will be available on the Eaton Vance website at www.eatonvance.com, by calling Eaton Vance at 1-800-262-1122 or in the EDGAR database on the SEC’s website at www.sec.gov. Form N-Q may also be reviewed and copied at the SEC’s public reference room in Washington, D.C. (call 1-800-732-0330 for information on the operation of the public reference room).
Proxy Voting. From time to time, funds are required to vote proxies related to the securities held by the funds. The Eaton Vance Funds or their underlying Portfolios (if applicable) vote proxies according to a set of policies and procedures approved by the Funds’ and Portfolios’ Boards. You may obtain a description of these policies and procedures and information on how the Funds or Portfolios voted proxies relating to portfolio securities during the most recent 12-month period ended June 30, without charge, upon request, by calling 1-800-262-1122 and by accessing the SEC’s website at www.sec.gov.
This Page Intentionally Left Blank
This Page Intentionally Left Blank
This Page Intentionally Left Blank
Investment Adviser
Boston Management and Research
Two International Place
Boston, MA 02110
Sub-Adviser
Atlanta Capital Management Company, LLC
1075 Peachtree Street NE
Suite 2100
Atlanta, GA 30309
Administrator
Eaton Vance Management
Two International Place
Boston, MA 02110
Principal Underwriter*
Eaton Vance Distributors, Inc.
Two International Place
Boston, MA 02110
(617) 482-8260
Custodian
State Street Bank and Trust Company
State Street Financial Center, One Lincoln Street
Boston, MA 02111
Transfer Agent
BNY Mellon Investment Servicing (US) Inc.
Attn: Eaton Vance Funds
P.O. Box 9653
Providence, RI 02940-9653
(800) 262-1122
Independent Registered Public Accounting Firm
Deloitte & Touche LLP
200 Berkeley Street
Boston, MA 02116-5022
Fund Offices
Two International Place
Boston, MA 02110
| * | FINRA BrokerCheck. Investors may check the background of their Investment Professional by contacting the Financial Industry Regulatory Authority (FINRA). FINRA BrokerCheck is a free tool to help investors check the professional background of current and former FINRA-registered securities firms and brokers. FINRA BrokerCheck is available by calling 1-800-289-9999 and at www.FINRA.org. The FINRA BrokerCheck brochure describing this program is available to investors at www.FINRA.org. |

Eaton Vance
Core Plus Bond Fund
Annual Report
September 30, 2015

Commodity Futures Trading Commission Registration. Effective December 31, 2012, the Commodity Futures Trading Commission (“CFTC”) adopted certain regulatory changes that subject registered investment companies and advisers to regulation by the CFTC if a fund invests more than a prescribed level of its assets in certain CFTC-regulated instruments (including futures, certain options and swap agreements) or markets itself as providing investment exposure to such instruments. The Fund has claimed an exclusion from the definition of the term “commodity pool operator” under the Commodity Exchange Act. Accordingly, neither the Fund nor the adviser with respect to the operation of the Fund is subject to CFTC regulation. Because of its management of other strategies, the Fund’s adviser is registered with the CFTC as a commodity pool operator and a commodity trading advisor.
Fund shares are not insured by the FDIC and are not deposits or other obligations of, or guaranteed by, any depository institution. Shares are subject to investment risks, including possible loss of principal invested.
This report must be preceded or accompanied by a current summary prospectus or prospectus. Before investing, investors should consider carefully the investment objective, risks, and charges and expenses of a mutual fund. This and other important information is contained in the summary prospectus and prospectus, which can be obtained from a financial advisor. Prospective investors should read the prospectus carefully before investing. For further information, please call 1-800-262-1122.
Annual Report September 30, 2015
Eaton Vance
Core Plus Bond Fund
Table of Contents
| | | | |
Management’s Discussion of Fund Performance | | | 2 | |
| |
Performance | | | 3 | |
| |
Fund Profile | | | 4 | |
| |
Endnotes and Additional Disclosures | | | 5 | |
| |
Fund Expenses | | | 6 | |
| |
Financial Statements | | | 7 | |
| |
Report of Independent Registered Public Accounting Firm | | | 23 | |
| |
Federal Tax Information | | | 24 | |
| |
Board of Trustees’ Contract Approval | | | 25 | |
| |
Management and Organization | | | 28 | |
| |
Important Notices | | | 31 | |
Eaton Vance
Core Plus Bond Fund
September 30, 2015
Management’s Discussion of Fund Performance1
Economic and Market Conditions
For the 12-month period ended September 30, 2015, the U.S. economy continued to experience moderate growth and low inflation. Fixed-income investors became increasingly concerned about declining growth in the eurozone, Japan and China. The result was strong worldwide demand for U.S. Treasurys that pushed Treasury rates down in the early months of the period.
Beginning in February 2015, however, rates in the short end of the yield curve began to creep upward, as investors believed the Federal Reserve Board (the Fed) was getting closer to a rate hike. In the following months, as European interest rates rose from historic lows, yields on longer maturity Treasurys climbed as well.
One of the strongest headwinds during the 12-month period was slowing growth in China, the world’s second-largest economy. The Chinese government took steps to stimulate growth, such as cutting interest rates and bank reserve requirements. Nonetheless, industrial production, retail sales and other key segments of the economy remained sluggish. In August 2015, China surprised the markets by devaluing its currency. After a number of U.S. economic numbers came in weaker than expected, the Fed ultimately held short-term rates near zero at its September 2015 meeting.
The slowdown in China contributed to a broad selloff in commodities, which hurt financial markets in emerging countries that export raw materials. Oil was particularly weak, falling more than 50% amid waning global demand, rising U.S. production and the decision of the Organization of the Petroleum Exporting Countries (OPEC) not to lower output.
Against this backdrop, many asset classes experienced dramatic volatility in the final two months of the fiscal period. Rising bond yields in the United States made yields on emerging-market government debt appear less attractive and also diminished the appeal of commodities. For the period, the S&P 500 Index returned -0.61%, the Bloomberg Commodity Index Total Return returned -25.99%, the Barclays U.S. Aggregate Bond Index returned 2.94%, and the JPMorgan Government Bond Index: Emerging Market (JPM GBI-EM) Global Diversified returned -19.77%.
Fund Performance
For the fiscal year ended September 30, 2015, Eaton Vance Core Plus Bond Fund (the Fund) Class A shares at net asset value (NAV) returned -2.80%, underperforming the 2.94% return of the benchmark, the Barclays U.S. Aggregate Bond Index (the Index).2
Effective May 1, 2015, the name of the Fund was changed from Eaton Vance Build America Bond Fund to Eaton Vance Core Plus Bond Fund, the Fund’s investment objective and principal strategies were changed and the Fund adopted a policy of investing at least 80% of its net assets in bonds and other fixed and floating-rate instruments, including preferred securities, floating-rate loans and convertible securities.
In the period from the transition on May 1, 2015, to September 30, 2015, the Fund underperformed the Index, as security selection, asset allocation and currency allocation outweighed the relative performance contribution of the Fund’s yield curve management.
Security selection was the largest detractor from Fund performance relative to the Index, as the Fund’s exposure to commodity-related companies underperformed. The Fund’s sector allocation also hurt performance relative to the Index, as investments in out-of-Index areas such as convertibles, preferreds and Treasury inflation-protected securities (TIPS) underperformed securities in the Index. In addition, the relative strength of the U.S. dollar versus the Brazilian real, New Zealand dollar, Mexican peso and Canadian dollar also detracted from Fund performance relative to the Index. On the other hand, less exposure to the intermediate portion of the yield curve was a contributor to the Fund’s performance relative to the Index.
For the period from October 1, 2014 through May 1, 2015, the Fund invested at least 80% of its net assets in taxable municipal obligations issued pursuant to the American Recovery and Reinvestment Act of 2009 (“Build America Bonds”). During that period, the Fund underperformed its previous benchmark, the Barclays Taxable Municipal – Build America Bonds Index, largely due to an overweight to short call cushion bonds. These cushion bonds are callable bonds that trade at a premium and often offer higher yields to compensate for the potential that they are called back by the issuer.
See Endnotes and Additional Disclosures in this report.
Past performance is no guarantee of future results. Returns are historical and are calculated by determining the percentage change in net asset value (NAV) or offering price (as applicable) with all distributions reinvested. Investment return and principal value will fluctuate so that shares, when redeemed, may be worth more or less than their original cost. Performance less than one year is cumulative. Performance is for the stated time period only; due to market volatility, the Fund’s current performance may be lower or higher than quoted. Returns are before taxes unless otherwise noted. For performance as of the most recent month-end, please refer to eatonvance.com.
Eaton Vance
Core Plus Bond Fund
September 30, 2015
Performance2,3
Portfolio Managers Kathleen C. Gaffney, CFA, Thomas H. Luster, CFA, Bernard Scozzafava, CFA and Matthew T. Buckley, CFA
| | | | | | | | | | | | | | | | | | | | |
| % Average Annual Total Returns | | Class
Inception Date | | | Performance
Inception Date | | | One Year | | | Five Years | | | Since
Inception | |
Class A at NAV | | | 11/17/2009 | | | | 11/17/2009 | | | | –2.80 | % | | | 4.08 | % | | | 6.22 | % |
Class A with 4.75% Maximum Sales Charge | | | — | | | | — | | | | –7.43 | | | | 3.08 | | | | 5.34 | |
Class C at NAV | | | 11/17/2009 | | | | 11/17/2009 | | | | –3.44 | | | | 3.33 | | | | 5.46 | |
Class C with 1% Maximum Sales Charge | | | — | | | | — | | | | –4.38 | | | | 3.33 | | | | 5.46 | |
Class I at NAV | | | 11/17/2009 | | | | 11/17/2009 | | | | –2.47 | | | | 4.34 | | | | 6.47 | |
Barclays U.S. Aggregate Bond Index | | | — | | | | — | | | | 2.94 | % | | | 3.09 | % | | | 3.80 | % |
Barclays Taxable Municipal - Build America Bonds Index | | | — | | | | — | | | | 4.27 | | | | 7.71 | | | | 8.40 | |
| | | | | | | | | | | | | | | | | | | | |
| % Total Annual Operating Expense Ratios4 | | | | | | | | Class A | | | Class C | | | Class I | |
Gross | | | | | | | | | | | 1.03 | % | | | 1.78 | % | | | 0.78 | % |
Net | | | | | | | | | | | 0.80 | | | | 1.55 | | | | 0.55 | |
Growth of $10,000
This graph shows the change in value of a hypothetical investment of $10,000 in Class A of the Fund for the period indicated. For comparison, the same investment is shown in the indicated index.
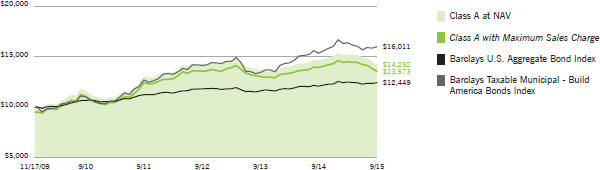
| | | | | | | | | | | | | | | | |
| Growth of Investment | | Amount Invested | | | Period Beginning | | | At NAV | | | With Maximum Sales Charge | |
Class C | | $ | 10,000 | | | | 11/17/2009 | | | $ | 13,663 | | | | N.A. | |
Class I | | $ | 250,000 | | | | 11/17/2009 | | | $ | 361,262 | | | | N.A. | |
See Endnotes and Additional Disclosures in this report.
Past performance is no guarantee of future results. Returns are historical and are calculated by determining the percentage change in net asset value (NAV) or offering price (as applicable) with all distributions reinvested. Investment return and principal value will fluctuate so that shares, when redeemed, may be worth more or less than their original cost. Performance less than one year is cumulative. Performance is for the stated time period only; due to market volatility, the Fund’s current performance may be lower or higher than quoted. Returns are before taxes unless otherwise noted. For performance as of the most recent month-end, please refer to eatonvance.com.
Eaton Vance
Core Plus Bond Fund
September 30, 2015
Fund Profile
Credit Quality (% of bond holdings)5
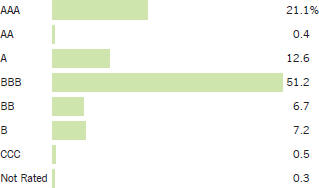
Asset allocation (% of total investments)
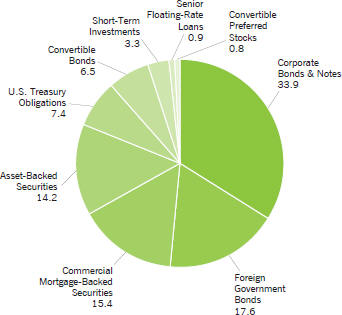
See Endnotes and Additional Disclosures in this report.
Eaton Vance
Core Plus Bond Fund
September 30, 2015
Endnotes and Additional Disclosures
| 1 | The views expressed in this report are those of the portfolio manager(s) and are current only through the date stated at the top of this page. These views are subject to change at any time based upon market or other conditions, and Eaton Vance and the Fund(s) disclaim any responsibility to update such views. These views may not be relied upon as investment advice and, because investment decisions are based on many factors, may not be relied upon as an indication of trading intent on behalf of any Eaton Vance fund. This commentary may contain statements that are not historical facts, referred to as “forward looking statements”. The Fund’s actual future results may differ significantly from those stated in any forward looking statement, depending on factors such as changes in securities or financial markets or general economic conditions, the volume of sales and purchases of Fund shares, the continuation of investment advisory, administrative and service contracts, and other risks discussed from time to time in the Fund’s filings with the Securities and Exchange Commission. |
| 2 | S&P 500 Index is an unmanaged index of large-cap stocks commonly used as a measure of U.S. stock market performance. Bloomberg Commodity Index Total Return is designed to provide diversified commodity exposure, with weightings based on each underlying commodity’s liquidity and economic significance. Barclays U.S. Aggregate Bond Index is an unmanaged index of domestic investment-grade bonds, including corporate, government and mortgage-backed securities. JPMorgan Government Bond Index: Emerging Market (JPM GBI-EM) Global Diversified is an unmanaged index of local-currency bonds with maturities of more than one year issued by emerging markets governments. Barclays Taxable Municipal - Build America Bonds Index is an unmanaged index that measures the Build America Bond component of the Taxable Municipal Index. The Barclays Taxable Municipal - Build America Bonds Index commenced on May 29, 2009. The Since Inception return for the index is calculated from November 30, 2009 as the index only priced monthly at such time. Unless otherwise stated, index returns do not reflect the effect of any applicable sales charges, commissions, expenses, taxes or leverage, as applicable. It is not possible to invest directly in an index. |
| 3 | Total Returns at NAV do not include applicable sales charges. If sales charges were deducted, the returns would be lower. Total Returns shown with maximum sales charge reflect the stated maximum sales charge. Unless otherwise stated, performance does not reflect the deduction of taxes on Fund distributions or redemptions of Fund shares. Performance since inception for an index, if presented, is the performance since the Fund’s or oldest share class’ inception, as applicable. Effective 5/1/15, the Fund changed its investment objective and policies. Prior to 5/1/15, the Fund invested primarily in Build America Bonds. Performance prior to 5/1/15 reflects the Fund’s performance under its former investment objectives and policies. |
| | Effective May 1, 2015, the Fund changed its primary benchmark to the Barclays U.S. Aggregate Bond Index because the investment adviser believes it is more closely aligned with the Fund’s revised investment objective and strategies. |
| 4 | Source: Fund prospectus. Net expense ratio reflects a contractual expense reimbursement that continues through 1/31/16. Without the reimbursement, if applicable, performance would have been lower. |
| 5 | Ratings are based on Moody’s, S&P or Fitch, as applicable. If securities are rated differently by the ratings agencies, the higher rating is applied. Ratings, which are subject to change, apply to the creditworthiness of the issuers of the underlying securities and not to the Fund or its shares. Credit ratings measure the quality of a bond based on the issuer’s creditworthiness, with ratings ranging from AAA, being the highest, to D, being the lowest based on S&P’s measures. Ratings of BBB or higher by S&P or Fitch (Baa or higher by Moody’s) are considered to be investment- grade quality. Credit ratings are based largely on the ratings agency’s analysis at the time of rating. The rating assigned to any particular security is not necessarily a reflection of the issuer’s current financial condition and does not necessarily reflect its assessment of the volatility of a security’s market value or of the liquidity of an investment in the security. Holdings designated as “Not Rated” are not rated by the national ratings agencies stated above. |
| | Fund profile subject to change due to active management. |
Eaton Vance
Core Plus Bond Fund
September 30, 2015
Fund Expenses
Example: As a Fund shareholder, you incur two types of costs: (1) transaction costs, including sales charges (loads) on purchases and redemption fees (if applicable); and (2) ongoing costs, including management fees; distribution and/or service fees; and other Fund expenses. This Example is intended to help you understand your ongoing costs (in dollars) of Fund investing and to compare these costs with the ongoing costs of investing in other mutual funds. The Example is based on an investment of $1,000 invested at the beginning of the period and held for the entire period (April 1, 2015 – September 30, 2015).
Actual Expenses: The first section of the table below provides information about actual account values and actual expenses. You may use the information in this section, together with the amount you invested, to estimate the expenses that you paid over the period. Simply divide your account value by $1,000 (for example, an $8,600 account value divided by $1,000 = 8.6), then multiply the result by the number in the first section under the heading entitled “Expenses Paid During Period” to estimate the expenses you paid on your account during this period.
Hypothetical Example for Comparison Purposes: The second section of the table below provides information about hypothetical account values and hypothetical expenses based on the actual Fund expense ratio and an assumed rate of return of 5% per year (before expenses), which is not the actual Fund return. The hypothetical account values and expenses may not be used to estimate the actual ending account balance or expenses you paid for the period. You may use this information to compare the ongoing costs of investing in your Fund and other funds. To do so, compare this 5% hypothetical example with the 5% hypothetical examples that appear in the shareholder reports of the other funds.
Please note that the expenses shown in the table are meant to highlight your ongoing costs only and do not reflect any transactional costs, such as sales charges (loads) or redemption fees (if applicable). Therefore, the second section of the table is useful in comparing ongoing costs only, and will not help you determine the relative total costs of owning different funds. In addition, if these transactional costs were included, your costs would be higher.
| | | | | | | | | | | | | | | | |
| | | Beginning
Account Value
(4/1/15) | | | Ending
Account Value
(9/30/15) | | | Expenses Paid
During Period*
(4/1/15 – 9/30/15) | | | Annualized
Expense
Ratio | |
| | | | |
| | | | | | | | | | | | | | | | |
Actual | | | | | | | | | | | | | | | | |
Class A | | $ | 1,000.00 | | | $ | 934.50 | | | $ | 3.88 | ** | | | 0.80 | % |
Class C | | $ | 1,000.00 | | | $ | 931.00 | | | $ | 7.50 | ** | | | 1.55 | % |
Class I | | $ | 1,000.00 | | | $ | 935.70 | | | $ | 2.67 | ** | | | 0.55 | % |
| | | | | | | | | | | | | | | | | |
| | | | |
| | | | | | | | | | | | | | | | |
Hypothetical | | | | | | | | | | | | | | | | |
(5% return per year before expenses) | | | | | | | | | | | | | | | | |
Class A | | $ | 1,000.00 | | | $ | 1,021.10 | | | $ | 4.05 | ** | | | 0.80 | % |
Class C | | $ | 1,000.00 | | | $ | 1,017.30 | | | $ | 7.84 | ** | | | 1.55 | % |
Class I | | $ | 1,000.00 | | | $ | 1,022.30 | | | $ | 2.79 | ** | | | 0.55 | % |
| * | Expenses are equal to the Fund’s annualized expense ratio for the indicated Class, multiplied by the average account value over the period, multiplied by 183/365 (to reflect the one-half year period). The Example assumes that the $1,000 was invested at the net asset value per share determined at the close of business on March 31, 2015. |
| ** | Absent an allocation of certain expenses to an affiliate, expenses would be higher. |
Eaton Vance
Core Plus Bond Fund
September 30, 2015
Portfolio of Investments
| | | | | | | | | | |
| Corporate Bonds & Notes — 33.6% | |
| | | |
| | | | | | | | | | |
| Security | | | | Principal
Amount*
(000’s omitted) | | | Value | |
| | | | | | | | | | |
|
Banks — 0.4% | |
JPMorgan Chase & Co., 4.25%, 11/2/18 | | NZD | | | 215 | | | $ | 139,968 | |
| | | | | | | | | | | |
| | | | | | | | $ | 139,968 | |
| | | | | | | | | | | |
|
Chemicals — 0.8% | |
Dow Chemical Co. (The), 4.375%, 11/15/42 | | | | | 285 | | | $ | 249,754 | |
| | | | | | | | | | | |
| | | | | | | | $ | 249,754 | |
| | | | | | | | | | | |
|
Commercial Services — 0.5% | |
Block Financial, LLC, 5.25%, 10/1/25 | | | | | 170 | | | $ | 170,637 | |
| | | | | | | | | | | |
| | | | | | | | $ | 170,637 | |
| | | | | | | | | | | |
|
Diversified Financial Services — 2.0% | |
Jefferies Group, LLC, 6.50%, 1/20/43 | | | | | 485 | | | $ | 462,085 | |
Navient Corp., 5.625%, 8/1/33 | | | | | 300 | | | | 195,750 | |
| | | | | | | | | | | |
| | | | | | | | $ | 657,835 | |
| | | | | | | | | | | |
|
Foods — 2.8% | |
ESAL GmbH, 6.25%, 2/5/23(1) | | | | | 985 | | | $ | 908,663 | |
| | | | | | | | | | | |
| | | | | | | | $ | 908,663 | |
| | | | | | | | | | | |
|
Home Construction — 1.4% | |
MDC Holdings, Inc., 6.00%, 1/15/43 | | | | | 560 | | | $ | 456,400 | |
| | | | | | | | | | | |
| | | | | | | | $ | 456,400 | |
| | | | | | | | | | | |
|
Machinery — 1.3% | |
Valmont Industries, Inc., 5.00%, 10/1/44 | | | | | 505 | | | $ | 446,281 | |
| | | | | | | | | | | |
| | | | | | | | $ | 446,281 | |
| | | | | | | | | | | |
|
Media — 1.5% | |
Viacom, Inc., Class B, 3.875%, 4/1/24 | | | | | 535 | | | $ | 502,634 | |
| | | | | | | | | | | |
| | | | | | | | $ | 502,634 | |
| | | | | | | | | | | |
|
Mining — 5.0% | |
Barrick Gold Corp., 5.25%, 4/1/42 | | | | | 745 | | | $ | 585,417 | |
JMC Steel Group, Inc., 8.25%, 3/15/18(1) | | | | | 20 | | | | 13,700 | |
Newcrest Finance Pty, Ltd., 4.20%, 10/1/22(1) | | | | | 575 | | | | 505,223 | |
Southern Copper Corp., 5.25%, 11/8/42 | | | | | 260 | | | | 197,987 | |
Teck Resources, Ltd., 5.20%, 3/1/42 | | | | | 615 | | | | 340,659 | |
| | | | | | | | | | |
| Security | | | | Principal
Amount*
(000’s omitted) | | | Value | |
| | | | | | | | | | |
|
Mining (continued) | |
Teck Resources, Ltd., 5.40%, 2/1/43 | | | | | 35 | | | $ | 19,298 | |
| | | | | | | | | | | |
| | | | | | | | $ | 1,662,284 | |
| | | | | | | | | | | |
|
Miscellaneous Manufacturing — 2.4% | |
Bombardier, Inc., 7.50%, 3/15/25(1) | | | | | 325 | | | $ | 245,375 | |
Trinity Industries, Inc., 4.55%, 10/1/24 | | | | | 575 | | | | 544,352 | |
| | | | | | | | | | | |
| | | | | | | | $ | 789,727 | |
| | | | | | | | | | | |
|
Oil and Gas – Equipment and Services — 10.2% | |
Apache Corp., 4.25%, 1/15/44 | | | | | 535 | | | $ | 456,891 | |
Continental Resources, Inc., 3.80%, 6/1/24 | | | | | 520 | | | | 422,671 | |
Ecopetrol SA, 5.875%, 5/28/45 | | | | | 655 | | | | 497,800 | |
Ensco PLC, 5.75%, 10/1/44 | | | | | 705 | | | | 489,297 | |
Noble Energy, Inc., 5.05%, 11/15/44 | | | | | 250 | | | | 217,378 | |
Pacific Drilling SA, 5.375%, 6/1/20(1) | | | | | 450 | | | | 267,750 | |
Pacific Rubiales Energy Corp., 5.625%, 1/19/25(1) | | | | | 520 | | | | 185,250 | |
Petrobras Global Finance BV, 5.625%, 5/20/43 | | | | | 605 | | | | 373,587 | |
Rowan Cos., Inc., 5.40%, 12/1/42 | | | | | 745 | | | | 443,029 | |
| | | | | | | | | | | |
| | | | | | | | $ | 3,353,653 | |
| | | | | | | | | | | |
|
Real Estate Investment Trusts (REITs) — 1.5% | |
VEREIT Operating Partnership, L.P., 4.60%, 2/6/24 | | | | | 500 | | | $ | 481,250 | |
| | | | | | | | | | | |
| | | | | | | | $ | 481,250 | |
| | | | | | | | | | | |
|
Retail – Specialty and Apparel — 0.3% | |
JC Penney Corp., Inc., 6.375%, 10/15/36 | | | | | 165 | | | $ | 115,500 | |
| | | | | | | | | | | |
| | | | | | | | $ | 115,500 | |
| | | | | | | | | | | |
|
Software — 0.5% | |
HP Enterprise Co., 4.40%, 10/15/22(1)(2) | | | | | 170 | | | $ | 169,663 | |
| | | | | | | | | | | |
| | | | | | | | $ | 169,663 | |
| | | | | | | | | | | |
|
Technology — 1.1% | |
Seagate HDD Cayman, 4.875%, 6/1/27(1) | | | | | 390 | | | $ | 363,716 | |
| | | | | | | | | | | |
| | | | | | | | $ | 363,716 | |
| | | | | | | | | | | |
|
Telecommunications — 1.9% | |
Avaya, Inc., 10.50%, 3/1/21(1) | | | | | 75 | | | $ | 34,875 | |
Axtel SAB de CV, 9.00%, 1/31/20(1) | | | | | 500 | | | | 455,000 | |
| | | | |
| | 7 | | See Notes to Financial Statements. |
Eaton Vance
Core Plus Bond Fund
September 30, 2015
Portfolio of Investments — continued
| | | | | | | | | | |
| Security | | | | Principal
Amount*
(000’s omitted) | | | Value | |
| | | | | | | | | | |
|
Telecommunications (continued) | |
OTE PLC, 3.50%, 7/9/20(3) | | EUR | | | 120 | | | $ | 122,188 | |
| | | | | | | | | | | |
| | | | | | | | $ | 612,063 | |
| | | | | | | | | | | |
| |
Total Corporate Bonds & Notes
(identified cost $12,860,171) | | | $ | 11,080,028 | |
| | | | | | | | | | | |
|
| Commercial Mortgage-Backed Securities — 15.2% | |
| | | |
| | | | | | | | | | |
| Security | | | | Principal
Amount
(000’s omitted) | | | Value | |
BACM, Series 2006-5, Class AM, 5.448%, 9/10/47 | | | | $ | 165 | | | $ | 169,587 | |
COMM, Series 2014-CR17, Class D, 4.959%, 5/10/47(1)(4) | | | | | 460 | | | | 428,258 | |
COMM, Series 2014-LC17, Class D, 3.687%, 10/10/47(1) | | | | | 200 | | | | 165,493 | |
COMM, Series 2015-CR22, Class D, 4.266%, 3/10/48(1)(4) | | | | | 500 | | | | 417,275 | |
ESA, Series 2013-ESH7, Class C7, 3.902%, 12/5/31(1) | | | | | 740 | | | | 746,807 | |
HILT, Series 2013-HLT, Class DFX, 4.407%, 11/5/30(1) | | | | | 500 | | | | 504,116 | |
JPMBB, Series 2014-C19, Class D, 4.832%, 4/15/47(1)(4) | | | | | 615 | | | | 555,483 | |
JPMBB, Series 2014-C23, Class D, 4.109%, 9/15/47(1)(4) | | | | | 140 | | | | 121,024 | |
UBSCM, Series 2012-C1, Class D, 5.727%, 5/10/45(1)(4) | | | | | 500 | | | | 522,765 | |
WFCM, Series 2015-C26, Class D, 3.586%, 2/15/48(1) | | | | | 500 | | | | 399,578 | |
WFCM, Series 2015-C29, Class D, 4.365%, 6/15/48(4) | | | | | 500 | | | | 420,527 | |
WFCM, Series 2015-NXS1, Class D, 4.242%, 5/15/48(4) | | | | | 90 | | | | 75,564 | |
WFCM, Series 2015-SG1, Class C, 4.62%, 12/15/47(4) | | | | | 350 | | | | 342,380 | |
WF-RBS, Series 2014-LC14, Class D, 4.586%, 3/15/47(1)(4) | | | | | 165 | | | | 145,921 | |
| | | | | | | | | | | |
| |
Total Commercial Mortgage-Backed Securities
(identified cost $5,139,492) | | | $ | 5,014,778 | |
| | | | | | | | | | | |
|
| Asset-Backed Securities — 14.1% | |
| | | |
| | | | | | | | | | |
| Security | | | | Principal
Amount
(000’s omitted) | | | Value | |
|
Automotive — 2.7% | |
AESOP, Series 2013-1A, Class B, 2.62%, 9/20/19(1) | | | | $ | 705 | | | $ | 714,155 | |
SDART, Series 2014-3, Class D, 2.65%, 8/17/20 | | | | | 170 | | | | 171,202 | |
| | | | | | | | | | | |
| | | | | | | | $ | 885,357 | |
| | | | | | | | | | | |
|
Computers — 0.4% | |
DEFT, Series 2014-1, Class C, 1.80%, 6/22/20(1) | | | | $ | 130 | | | $ | 129,721 | |
| | | | | | | | | | | |
| | | | | | | | $ | 129,721 | |
| | | | | | | | | | | |
| | | | | | | | | | |
| Security | | | | Principal
Amount
(000’s omitted) | | | Value | |
| | | | | | | | | | |
|
Other — 4.8% | |
DNKN, Series 2015-1A, Class A2I, 3.262%, 2/20/45(1) | | | | $ | 863 | | | $ | 869,816 | |
SCFT, Series 2014-AA, Class B, 4.61%, 10/25/27(1) | | | | | 100 | | | | 102,175 | |
WEN, Series 2015-1A, Class A2I, 3.371%, 6/15/45(1) | | | | | 600 | | | | 604,462 | |
| | | | | | | | | | | |
| | | | | | | | $ | 1,576,453 | |
| | | | | | | | | | | |
|
Single Family Home Rental — 6.2% | |
AH4R, Series 2014-SFR1, Class D, 2.35%, 6/17/31(1)(5) | | | | $ | 270 | | | $ | 265,109 | |
ARP, Series 2014-SFR1, Class D, 3.207%, 9/17/31(1)(5) | | | | | 750 | | | | 749,774 | |
FKL, Series 2015-SFR1, Class A, 2.553%, 3/9/47(1) | | | | | 114 | | | | 114,160 | |
Invitation Homes Trust, Series 2015-SFR3, Class D,
2.957%, 8/17/32(1)(5) | | | | | 450 | | | | 445,815 | |
TAH, Series 2015-SFR1, Class D, 2.407%, 5/17/32(1)(5) | | | | | 500 | | | | 481,005 | |
| | | | | | | | | | | |
| | | | | | | | $ | 2,055,863 | |
| | | | | | | | | | | |
| |
Total Asset-Backed Securities
(identified cost $4,643,001) | | | $ | 4,647,394 | |
| | | | | | | | | | | |
|
| Foreign Government Bonds — 17.3% | |
| | | |
| | | | | | | | | | |
| Security | | | | Principal
Amount
(000’s omitted) | | | Value | |
|
Brazil — 2.9% | |
Brazil Nota do Tesouro Nacional, 10.00%, 1/1/21 | | BRL | | | 4,580 | | | $ | 941,424 | |
| | | | | | | | | | | |
| | | | | | | | $ | 941,424 | |
| | | | | | | | | | | |
|
Canada — 2.8% | |
Canadian Government Bond, 0.25%, 5/1/17 | | CAD | | | 1,250 | | | $ | 932,615 | |
| | | | | | | | | | | |
| | | | | | | | $ | 932,615 | |
| | | | | | | | | | | |
|
Mexico — 2.0% | |
Mexican Bonos, 7.75%, 5/29/31 | | MXN | | | 10,170 | | | $ | 669,642 | |
| | | | | | | | | | | |
| | | | | | | | $ | 669,642 | |
| | | | | | | | | | | |
|
New Zealand — 3.8% | |
New Zealand Government Bond, 6.00%, 12/15/17(3) | | NZD | | | 1,850 | | | $ | 1,270,756 | |
| | | | | | | | | | | |
| | | | | | | | $ | 1,270,756 | |
| | | | | | | | | | | |
| | | | |
| | 8 | | See Notes to Financial Statements. |
Eaton Vance
Core Plus Bond Fund
September 30, 2015
Portfolio of Investments — continued
| | | | | | | | | | |
| Security | | | | Principal
Amount
(000’s omitted) | | | Value | |
| | | | | | | | | | |
|
Supranational — 5.8% | |
European Investment Bank, 7.20%, 7/9/19(1) | | IDR | | | 6,590,000 | | | $ | 398,050 | |
International Finance Corp., 7.80%, 6/3/19 | | INR | | | 95,800 | | | | 1,514,685 | |
| | | | | | | | | | | |
| | | | | | | | $ | 1,912,735 | |
| | | | | | | | | | | |
| |
Total Foreign Government Bonds
(identified cost $6,610,923) | | | $ | 5,727,172 | |
| | | | | | | | | | | |
|
| Senior Floating-Rate Interests — 0.8%(6) | |
| | | |
| | | | | | | | | | |
| Borrower/Tranche Description | | | | Principal
Amount
(000’s omitted) | | | Value | |
| | | |
Food Service — 0.8% | | | | | | | | | | |
Weight Watchers International, Inc., Term Loan, 4.00%, 4/2/20 | | | | $ | 507 | | | $ | 275,898 | |
| | | | | | | | | | | |
| |
Total Senior Floating-Rate Interests
(identified cost $270,989) | | | $ | 275,898 | |
| | | | | | | | | | | |
|
| Convertible Bonds — 6.5% | |
| | | |
| | | | | | | | | | |
| Security | | | | Principal
Amount
(000’s omitted) | | | Value | |
| | | |
Health Care — 1.0% | | | | | | | | | | |
Hologic, Inc., 0.00%, 12/15/43 | | | | $ | 250 | | | $ | 316,406 | |
| | | | | | | | | | | |
| | | | | | | | $ | 316,406 | |
| | | | | | | | | | | |
| | | |
Home Construction — 1.7% | | | | | | | | | | |
KB Home, 1.375%, 2/1/19 | | | | $ | 240 | | | $ | 224,100 | |
Lennar Corp., 3.25%, 11/15/21(1) | | | | | 105 | | | | 216,234 | |
Standard Pacific Corp., 1.25%, 8/1/32 | | | | | 105 | | | | 121,997 | |
| | | | | | | | | | | |
| | | | | | | | $ | 562,331 | |
| | | | | | | | | | | |
| | | |
Semiconductors — 3.6% | | | | | | | | | | |
Intel Corp., 2.95%, 12/15/35 | | | | $ | 975 | | | $ | 1,186,453 | |
| | | | | | | | | | | |
| | | | | | | | $ | 1,186,453 | |
| | | | | | | | | | | |
| | | |
Telecommunications — 0.2% | | | | | | | | | | |
Ciena Corp., 3.75%, 10/15/18(1) | | | | $ | 55 | | | $ | 69,060 | |
| | | | | | | | | | | |
| | | | | | | | $ | 69,060 | |
| | | | | | | | | | | |
| |
Total Convertible Bonds
(identified cost $2,167,647) | | | $ | 2,134,250 | |
| | | | | | | | | | | |
| | | | | | | | | | |
| Convertible Preferred Stocks — 0.8% | |
| | | |
| | | | | | | | | | |
| Security | | | | Shares | | | Value | |
| | | | | | | | | | |
|
Oil and Gas – Equipment and Services — 0.5% | |
Chesapeake Energy Corp., 5.75% | | | | | 400 | | | $ | 160,500 | |
| | | | | | | | | | | |
| | | | | | | | $ | 160,500 | |
| | | | | | | | | | | |
|
Real Estate Investment Trusts (REITs) — 0.3% | |
iStar, Inc., Series J, 4.50% | | | | | 2,100 | | | $ | 112,161 | |
| | | | | | | | | | | |
| | | | | | | | $ | 112,161 | |
| | | | | | | | | | | |
| |
Total Convertible Preferred Stocks
(identified cost $442,475) | | | $ | 272,661 | |
| | | | | | | | | | | |
|
| U.S. Treasury Obligations — 7.3% | |
| | | |
| | | | | | | | | | |
| Security | | | | Principal
Amount
(000’s omitted) | | | Value | |
U.S. Treasury Inflation-Protected Note, 0.25%, 1/15/25(7) | | | | $ | 2,519 | | | $ | 2,418,371 | |
| | | | | | | | | | | |
| | | |
Total U.S. Treasury Obligations
(identified cost $2,490,388) | | | | | | | | $ | 2,418,371 | |
| | | | | | | | | | | |
|
| Short-Term Investments — 3.3% | |
| | | |
| | | | | | | | | | |
| Description | | | | Interest
(000’s omitted) | | | Value | |
Eaton Vance Cash Reserves Fund, LLC, 0.23%(8) | | | | $ | 1,078 | | | $ | 1,078,453 | |
| | | | | | | | | | | |
| |
Total Short-Term Investments
(identified cost $1,078,453) | | | $ | 1,078,453 | |
| | | | | | | | | | | |
| |
Total Investments — 98.9%
(identified cost $35,703,539) | | | $ | 32,649,005 | |
| | | | | | | | | | | |
| |
Other Assets, Less Liabilities — 1.1% | | | $ | 364,988 | |
| | | | | | | | | | | |
| |
Net Assets — 100.0% | | | $ | 33,013,993 | |
| | | | | | | | | | | |
The percentage shown for each investment category in the Portfolio of Investments is based on net assets.
| | | | |
| | 9 | | See Notes to Financial Statements. |
Eaton Vance
Core Plus Bond Fund
September 30, 2015
Portfolio of Investments — continued
| | | | |
| AESOP | | – | | Avis Budget Rental Car Funding LLC |
| AH4R | | – | | American Homes 4 Rent |
| ARP | | – | | American Residential Properties Trust |
| BACM | | – | | Banc of America Commercial Mortgage Trust |
| COMM | | – | | Commercial Mortgage Trust |
| DEFT | | – | | Dell Equipment Finance Trust |
| DNKN | | – | | DB Master Finance LLC |
| ESA | | – | | Extended Stay America Trust |
| FKL | | – | | FirstKey Lending Trust |
| HILT | | – | | Hilton USA Trust |
| JPMBB | | – | | JPMBB Commercial Mortgage Securities Trust |
| SCFT | | – | | SpringCastle Funding Trust |
| SDART | | – | | Santander Drive Auto Receivables Trust |
| TAH | | – | | Tricon American Homes |
| UBSCM | | – | | UBS Commercial Mortgage Trust |
| WEN | | – | | Wendys Funding LLC |
| WFCM | | – | | Wells Fargo Commercial Mortgage Trust |
| WF-RBS | | – | | WF-RBS Commercial Mortgage Trust |
| | | | |
| BRL | | – | | Brazilian Real |
| CAD | | – | | Canadian Dollar |
| EUR | | – | | Euro |
| IDR | | – | | Indonesian Rupiah |
| INR | | – | | Indian Rupee |
| MXN | | – | | Mexican Peso |
| NZD | | – | | New Zealand Dollar |
| * | In U.S dollars unless otherwise indicated. |
| (1) | Security exempt from registration pursuant to Rule 144A under the Securities Act of 1933. These securities may be sold in certain transactions (normally to qualified institutional buyers) and remain exempt from registration. At September 30, 2015, the aggregate value of these securities is $12,315,471 or 37.3% of the Fund’s net assets. |
| (3) | Security exempt from registration under Regulation S of the Securities Act of 1933, which exempts from registration securities offered and sold outside the United States. Security may not be offered or sold in the United States except pursuant to an exemption from, or in a transaction not subject to, the registration requirements of the Securities Act of 1933. At September 30, 2015, the aggregate value of these securities is $1,392,944 or 4.2% of the Fund’s net assets. |
| (4) | Weighted average fixed-rate coupon that changes/updates monthly. Rate shown is the rate at September 30, 2015. |
| (5) | Variable rate security. The stated interest rate represents the rate in effect at September 30, 2015. |
| (6) | Senior floating-rate interests (Senior Loans) often require prepayments from excess cash flows or permit the borrowers to repay at their election. The degree to which borrowers repay, whether as a contractual requirement or at their election, cannot be predicted with accuracy. As a result, the actual remaining maturity may be substantially less than the stated maturities shown. However, Senior Loans will typically have an expected average life of approximately two to four years. The stated interest rate represents the weighted average interest rate of all contracts within the senior loan facility and includes commitment fees on unfunded loan commitments, if any. Senior Loans typically have rates of interest |
| | which are redetermined either daily, monthly, quarterly or semi-annually by reference to a base lending rate, plus a premium. These base lending rates are primarily the London Interbank Offered Rate (“LIBOR”) and secondarily, the prime rate offered by one or more major United States banks (the “Prime Rate”) and the certificate of deposit (“CD”) rate or other base lending rates used by commercial lenders. |
| (7) | Inflation-linked security whose principal is adjusted for inflation based on changes in the U.S. Consumer Price Index. Interest is calculated based on the inflation-adjusted principal. |
| (8) | Affiliated investment company, available to Eaton Vance portfolios and funds, which invests in high quality, U.S. dollar denominated money market instruments. The rate shown is the annualized seven-day yield as of September 30, 2015. |
| | | | | | | | |
| Country Concentration of Portfolio | |
| | |
| | | | | | | | |
| Country | | Percentage of Total Investments | | | Value | |
United States | | | 68.9 | % | | $ | 22,485,386 | |
Brazil | | | 6.8 | | | | 2,223,674 | |
Canada | | | 6.5 | | | | 2,123,364 | |
Supranational | | | 5.9 | | | | 1,912,735 | |
New Zealand | | | 3.9 | | | | 1,270,756 | |
Mexico | | | 3.4 | | | | 1,124,642 | |
Colombia | | | 2.1 | | | | 683,050 | |
Australia | | | 1.5 | | | | 505,223 | |
Peru | | | 0.6 | | | | 197,987 | |
Greece | | | 0.4 | | | | 122,188 | |
| | | | | | | | | |
Total Investments | | | 100.0 | % | | $ | 32,649,005 | |
| | | | | | | | | |
| | | | |
| | 10 | | See Notes to Financial Statements. |
Eaton Vance
Core Plus Bond Fund
September 30, 2015
Statement of Assets and Liabilities
| | | | |
| Assets | | September 30, 2015 | |
Unaffiliated investments, at value (identified cost, $34,625,086) | | $ | 31,570,552 | |
Affiliated investment, at value (identified cost, $1,078,453) | | | 1,078,453 | |
Cash | | | 1,313 | |
Interest receivable | | | 378,501 | |
Interest receivable from affiliated investment | | | 358 | |
Receivable for investments sold | | | 354,596 | |
Receivable for Fund shares sold | | | 6,700 | |
Receivable from affiliate | | | 36,977 | |
Total assets | | $ | 33,427,450 | |
| |
| Liabilities | | | | |
Payable for when-issued securities | | $ | 169,663 | |
Payable for Fund shares redeemed | | | 150,297 | |
Distributions payable | | | 13,485 | |
Payable to affiliates: | | | | |
Investment adviser fee | | | 13,556 | |
Distribution and service fees | | | 12,134 | |
Accrued expenses | | | 54,322 | |
Total liabilities | | $ | 413,457 | |
Net Assets | | $ | 33,013,993 | |
| |
| Sources of Net Assets | | | | |
Paid-in capital | | $ | 36,043,167 | |
Accumulated net realized gain | | | 38,977 | |
Accumulated distributions in excess of net investment income | | | (8,572 | ) |
Net unrealized depreciation | | | (3,059,579 | ) |
Net Assets | | $ | 33,013,993 | |
| |
| Class A Shares | | | | |
Net Assets | | $ | 15,588,115 | |
Shares Outstanding | | | 1,411,563 | |
Net Asset Value and Redemption Price Per Share | | | | |
(net assets ÷ shares of beneficial interest outstanding) | | $ | 11.04 | |
Maximum Offering Price Per Share | | | | |
(100 ÷ 95.25 of net asset value per share) | | $ | 11.59 | |
| |
| Class C Shares | | | | |
Net Assets | | $ | 10,457,252 | |
Shares Outstanding | | | 947,329 | |
Net Asset Value and Offering Price Per Share* | | | | |
(net assets ÷ shares of beneficial interest outstanding) | | $ | 11.04 | |
| |
| Class I Shares | | | | |
Net Assets | | $ | 6,968,626 | |
Shares Outstanding | | | 631,455 | |
Net Asset Value, Offering Price and Redemption Price Per Share | | | | |
(net assets ÷ shares of beneficial interest outstanding) | | $ | 11.04 | |
On sales of $50,000 or more, the offering price of Class A shares is reduced.
| * | Redemption price per share is equal to the net asset value less any applicable contingent deferred sales charge. |
| | | | |
| | 11 | | See Notes to Financial Statements. |
Eaton Vance
Core Plus Bond Fund
September 30, 2015
Statement of Operations
| | | | |
| Investment Income | | Year Ended September 30, 2015 | |
Interest | | $ | 2,090,600 | |
Dividends | | | 6,531 | |
Interest allocated from affiliated investment | | | 18,807 | |
Expenses allocated from affiliated investment | | | (1,433 | ) |
Total investment income | | $ | 2,114,505 | |
| |
| Expenses | | | | |
Investment adviser fee | | $ | 275,906 | |
Distribution and service fees | | | | |
Class A | | | 48,301 | |
Class C | | | 116,720 | |
Trustees’ fees and expenses | | | 3,368 | |
Custodian fee | | | 30,940 | |
Transfer and dividend disbursing agent fees | | | 39,407 | |
Legal and accounting services | | | 38,377 | |
Printing and postage | | | 34,550 | |
Registration fees | | | 80,215 | |
Miscellaneous | | | 14,021 | |
Total expenses | | $ | 681,805 | |
Deduct — | | | | |
Reduction of custodian fee | | $ | 6 | |
Allocation of expenses to affiliate | | | 187,160 | |
Total expense reductions | | $ | 187,166 | |
| |
Net expenses | | $ | 494,639 | |
| |
Net investment income | | $ | 1,619,866 | |
| |
| Realized and Unrealized Gain (Loss) | | | | |
Net realized gain (loss) — | | | | |
Investment transactions | | $ | 3,304,619 | |
Investment transactions allocated from affiliated investment | | | 20 | |
Foreign currency transactions | | | 22,648 | |
Net realized gain | | $ | 3,327,287 | |
Change in unrealized appreciation (depreciation) — | | | | |
Investments | | $ | (5,922,800 | ) |
Foreign currency | | | (5,045 | ) |
Net change in unrealized appreciation (depreciation) | | $ | (5,927,845 | ) |
| |
Net realized and unrealized loss | | $ | (2,600,558 | ) |
| |
Net decrease in net assets from operations | | $ | (980,692 | ) |
| | | | |
| | 12 | | See Notes to Financial Statements. |
Eaton Vance
Core Plus Bond Fund
September 30, 2015
Statements of Changes in Net Assets
| | | | | | | | |
| | | Year Ended September 30, | |
| Increase (Decrease) in Net Assets | | 2015 | | | 2014 | |
From operations — | | | | | | | | |
Net investment income | | $ | 1,619,866 | | | $ | 1,683,162 | |
Net realized gain (loss) from investment and foreign currency transactions | | | 3,327,287 | | | | (640,790 | ) |
Net change in unrealized appreciation (depreciation) from investments and foreign currency | | | (5,927,845 | ) | | | 1,888,618 | |
Net increase (decrease) in net assets from operations | | $ | (980,692 | ) | | $ | 2,930,990 | |
Distributions to shareholders — | | | | | | | | |
From net investment income | | | | | | | | |
Class A | | $ | (701,685 | ) | | $ | (970,028 | ) |
Class C | | | (334,888 | ) | | | (468,894 | ) |
Class I | | | (916,619 | ) | | | (715,538 | ) |
Total distributions to shareholders | | $ | (1,953,192 | ) | | $ | (2,154,460 | ) |
Transactions in shares of beneficial interest — | | | | | | | | |
Proceeds from sale of shares | | | | | | | | |
Class A | | $ | 8,617,825 | | | $ | 3,520,032 | |
Class C | | | 4,174,061 | | | | 1,448,305 | |
Class I | | | 22,902,381 | | | | 15,090,587 | |
Net asset value of shares issued to shareholders in payment of distributions declared | | | | | �� | | | |
Class A | | | 662,306 | | | | 908,109 | |
Class C | | | 267,958 | | | | 344,823 | |
Class I | | | 872,012 | | | | 653,096 | |
Cost of shares redeemed | | | | | | | | |
Class A | | | (10,790,858 | ) | | | (13,663,756 | ) |
Class C | | | (3,834,693 | ) | | | (10,298,260 | ) |
Class I | | | (34,341,610 | ) | | | (16,072,342 | ) |
Net decrease in net assets from Fund share transactions | | $ | (11,470,618 | ) | | $ | (18,069,406 | ) |
| | |
Net decrease in net assets | | $ | (14,404,502 | ) | | $ | (17,292,876 | ) |
| | |
| Net Assets | | | | | | | | |
At beginning of year | | $ | 47,418,495 | | | $ | 64,711,371 | |
At end of year | | $ | 33,013,993 | | | $ | 47,418,495 | |
| | |
Accumulated distributions in excess of net investment income
included in net assets | | | | | | | | |
At end of year | | $ | (8,572 | ) | | $ | (15,870 | ) |
| | | | |
| | 13 | | See Notes to Financial Statements. |
Eaton Vance
Core Plus Bond Fund
September 30, 2015
Financial Highlights
| | | | | | | | | | | | | | | | | | | | | | | | |
| | | Class A | |
| | | Year Ended September 30, | | | Period Ended September 30, 2011(1) | | | Period Ended October 31, 2010(2) | |
| | | 2015 | | | 2014 | | | 2013 | | | 2012 | | | |
Net asset value — Beginning of period | | $ | 11.780 | | | $ | 11.520 | | | $ | 12.600 | | | $ | 12.040 | | | $ | 10.840 | | | $ | 10.000 | |
| | | | | | |
| Income (Loss) From Operations | | | | | | | | | | | | | | | | | | | | | | | | |
Net investment income(3) | | $ | 0.358 | | | $ | 0.420 | | | $ | 0.415 | | | $ | 0.430 | | | $ | 0.469 | | | $ | 0.455 | |
Net realized and unrealized gain (loss) | | | (0.668 | ) | | | 0.372 | | | | (0.888 | ) | | | 0.627 | | | | 1.216 | | | | 0.796 | |
| | | | | | |
Total income (loss) from operations | | $ | (0.310 | ) | | $ | 0.792 | | | $ | (0.473 | ) | | $ | 1.057 | | | $ | 1.685 | | | $ | 1.251 | |
| | | | | | |
| Less Distributions | | | | | | | | | | | | | | | | | | | | | | | | |
From net investment income | | $ | (0.430 | ) | | $ | (0.532 | ) | | $ | (0.530 | ) | | $ | (0.497 | ) | | $ | (0.481 | ) | | $ | (0.411 | ) |
From net realized gain | | | — | | | | — | | | | (0.077 | ) | | | — | | | | (0.004 | ) | | | — | |
| | | | | | |
Total distributions | | $ | (0.430 | ) | | $ | (0.532 | ) | | $ | (0.607 | ) | | $ | (0.497 | ) | | $ | (0.485 | ) | | $ | (0.411 | ) |
| | | | | | |
Net asset value — End of period | | $ | 11.040 | | | $ | 11.780 | | | $ | 11.520 | | | $ | 12.600 | | | $ | 12.040 | | | $ | 10.840 | |
| | | | | | |
Total Return(4) | | | (2.80 | )% | | | 7.06 | % | | | (3.94 | )% | | | 8.96 | % | | | 16.18 | %(5) | | | 12.64 | %(5) |
| | | | | | |
| Ratios/Supplemental Data | | | | | | | | | | | | | | | | | | | | | | | | |
Net assets, end of period (000’s omitted) | | $ | 15,588 | | | $ | 18,176 | | | $ | 27,061 | | | $ | 44,175 | | | $ | 23,327 | | | $ | 26,862 | |
Ratios (as a percentage of average daily net assets): | | | | | | | | | | | | | | | | | | | | | | | | |
Expenses(6)(7) | | | 0.85 | % | | | 0.95 | % | | | 0.95 | % | | | 0.95 | % | | | 0.95 | %(8)(9) | | | 0.95 | %(8)(9) |
Net investment income | | | 3.03 | % | | �� | 3.64 | % | | | 3.37 | % | | | 3.50 | % | | | 4.79 | %(8)(9) | | | 4.38 | %(8)(9) |
Portfolio Turnover of the Portfolio(10) | | | — | | | | — | | | | — | | | | — | | | | 22 | %(5) | | | 1 | %(5) |
Portfolio Turnover of the Fund | | | 119 | % | | | 0 | %(11) | | | 19 | % | | | 24 | % | | | 10 | %(5)(12) | | | — | |
| (1) | For the eleven months ended September 30, 2011. The Fund changed its fiscal year end from October 31 to September 30. |
| (2) | For the period from the start of business, November 17, 2009, to October 31, 2010. |
| (3) | Computed using average shares outstanding. |
| (4) | Returns are historical and are calculated by determining the percentage change in net asset value with all distributions reinvested and do not reflect the effect of sales charges. |
| (6) | The investment adviser of the Portfolio or Fund and administrator reimbursed certain operating expenses (equal to 0.34%, 0.23%, 0.22%, 0.19%, 0.41% and 1.16% of average daily net assets for the years ended September 30, 2015, 2014, 2013 and 2012, the period ended September 30, 2011 and the period from the start of business, November 17, 2009, to October 31, 2010, respectively). Absent this reimbursement, total return would be lower. |
| (7) | Excludes the effect of custody fee credits, if any, of less than 0.005%. |
| (9) | Includes the Fund’s share of the Portfolio’s allocated expenses for the period while the Fund was investing in the Portfolio. |
| (10) | Portfolio turnover represents the rate of portfolio activity for the period while the Fund was investing in the Portfolio. |
| (11) | Amount is less than 1%. |
| (12) | For the period from March 1, 2011 through September 30, 2011 when the Fund was making investments directly in securities. |
References to Portfolio herein are to Build America Bond Portfolio, a Massachusetts business trust in which the Fund invested all of its investable assets prior to March 1, 2011 and which had the same investment objective and policies as the Fund during such period.
| | | | |
| | 14 | | See Notes to Financial Statements. |
Eaton Vance
Core Plus Bond Fund
September 30, 2015
Financial Highlights — continued
| | | | | | | | | | | | | | | | | | | | | | | | |
| | | Class C | |
| | | Year Ended September 30, | | | Period Ended September 30, 2011(1) | | | Period Ended October 31, 2010(2) | |
| | | 2015 | | | 2014 | | | 2013 | | | 2012 | | | |
Net asset value — Beginning of period | | $ | 11.770 | | | $ | 11.520 | | | $ | 12.600 | | | $ | 12.040 | | | $ | 10.840 | | | $ | 10.000 | |
| | | | | | |
| Income (Loss) From Operations | | | | | | | | | | | | | | | | | | | | | | | | |
Net investment income(3) | | $ | 0.266 | | | $ | 0.334 | | | $ | 0.323 | | | $ | 0.337 | | | $ | 0.396 | | | $ | 0.371 | |
Net realized and unrealized gain (loss) | | | (0.655 | ) | | | 0.362 | | | | (0.888 | ) | | | 0.627 | | | | 1.215 | | | | 0.819 | |
| | | | | | |
Total income (loss) from operations | | $ | (0.389 | ) | | $ | 0.696 | | | $ | (0.565 | ) | | $ | 0.964 | | | $ | 1.611 | | | $ | 1.190 | |
| | | | | | |
| Less Distributions | | | | | | | | | | | | | | | | | | | | | | | | |
From net investment income | | $ | (0.341 | ) | | $ | (0.446 | ) | | $ | (0.438 | ) | | $ | (0.404 | ) | | $ | (0.407 | ) | | $ | (0.350 | ) |
From net realized gain | | | — | | | | — | | | | (0.077 | ) | | | — | | | | (0.004 | ) | | | — | |
| | | | | | |
Total distributions | | $ | (0.341 | ) | | $ | (0.446 | ) | | $ | (0.515 | ) | | $ | (0.404 | ) | | $ | (0.411 | ) | | $ | (0.350 | ) |
| | | | | | |
Net asset value — End of period | | $ | 11.040 | | | $ | 11.770 | | | $ | 11.520 | | | $ | 12.600 | | | $ | 12.040 | | | $ | 10.840 | |
| | | | | | |
Total Return(4) | | | (3.44 | )% | | | 6.17 | % | | | (4.65 | )% | | | 8.14 | % | | | 15.50 | %(5) | | | 11.91 | %(5) |
| | | | | | |
| Ratios/Supplemental Data | | | | | | | | | | | | | | | | | | | | | | | | |
Net assets, end of period (000’s omitted) | | $ | 10,457 | | | $ | 10,594 | | | $ | 18,946 | | | $ | 35,407 | | | $ | 13,684 | | | $ | 13,003 | |
Ratios (as a percentage of average daily net assets): | | | | | | | | | | | | | | | | | | | | | | | | |
Expenses(6)(7) | | | 1.60 | % | | | 1.70 | % | | | 1.70 | % | | | 1.70 | % | | | 1.70 | %(8)(9) | | | 1.70 | %(8)(9) |
Net investment income | | | 2.25 | % | | | 2.90 | % | | | 2.62 | % | | | 2.74 | % | | | 4.05 | %(8)(9) | | | 3.56 | %(8)(9) |
Portfolio Turnover of the Portfolio(10) | | | — | | | | — | | | | — | | | | — | | | | 22 | %(5) | | | 1 | %(5) |
Portfolio Turnover of the Fund | | | 119 | % | | | 0 | %(11) | | | 19 | % | | | 24 | % | | | 10 | %(5)(12) | | | — | |
| (1) | For the eleven months ended September 30, 2011. The Fund changed its fiscal year end from October 31 to September 30. |
| (2) | For the period from the start of business, November 17, 2009, to October 31, 2010. |
| (3) | Computed using average shares outstanding. |
| (4) | Returns are historical and are calculated by determining the percentage change in net asset value with all distributions reinvested and do not reflect the effect of sales charges. |
| (6) | The investment adviser of the Portfolio or Fund and administrator reimbursed certain operating expenses (equal to 0.34%, 0.23%, 0.22%, 0.19%, 0.41% and 1.16% of average daily net assets for the years ended September 30, 2015, 2014, 2013 and 2012, the period ended September 30, 2011 and the period from the start of business, November 17, 2009, to October 31, 2010, respectively). Absent this reimbursement, total return would be lower. |
| (7) | Excludes the effect of custody fee credits, if any, of less than 0.005%. |
| (9) | Includes the Fund’s share of the Portfolio’s allocated expenses for the period while the Fund was investing in the Portfolio. |
| (10) | Portfolio turnover represents the rate of portfolio activity for the period while the Fund was investing in the Portfolio. |
| (11) | Amount is less than 1%. |
| (12) | For the period from March 1, 2011 through September 30, 2011 when the Fund was making investments directly in securities. |
References to Portfolio herein are to Build America Bond Portfolio, a Massachusetts business trust in which the Fund invested all of its investable assets prior to March 1, 2011 and which had the same investment objective and policies as the Fund during such period.
| | | | |
| | 15 | | See Notes to Financial Statements. |
Eaton Vance
Core Plus Bond Fund
September 30, 2015
Financial Highlights — continued
| | | | | | | | | | | | | | | | | | | | | | | | |
| | | Class I | |
| | | Year Ended September 30, | | | Period Ended September 30, 2011(1) | | | Period Ended October 31, 2010(2) | |
| | | 2015 | | | 2014 | | | 2013 | | | 2012 | | | |
Net asset value — Beginning of period | | $ | 11.770 | | | $ | 11.520 | | | $ | 12.600 | | | $ | 12.050 | | | $ | 10.840 | | | $ | 10.000 | |
| | | | | | |
| Income (Loss) From Operations | | | | | | | | | | | | | | | | | | | | | | | | |
Net investment income(3) | | $ | 0.380 | | | $ | 0.447 | | | $ | 0.447 | | | $ | 0.458 | | | $ | 0.495 | | | $ | 0.460 | |
Net realized and unrealized gain (loss) | | | (0.651 | ) | | | 0.364 | | | | (0.889 | ) | | | 0.620 | | | | 1.225 | | | | 0.808 | |
| | | | | | |
Total income (loss) from operations | | $ | (0.271 | ) | | $ | 0.811 | | | $ | (0.442 | ) | | $ | 1.078 | | | $ | 1.720 | | | $ | 1.268 | |
| | | | | | |
| Less Distributions | | | | | | | | | | | | | | | | | | | | | | | | |
From net investment income | | $ | (0.459 | ) | | $ | (0.561 | ) | | $ | (0.561 | ) | | $ | (0.528 | ) | | $ | (0.506 | ) | | $ | (0.428 | ) |
From net realized gain | | | — | | | | — | | | | (0.077 | ) | | | — | | | | (0.004 | ) | | | — | |
| | | | | | |
Total distributions | | $ | (0.459 | ) | | $ | (0.561 | ) | | $ | (0.638 | ) | | $ | (0.528 | ) | | $ | (0.510 | ) | | $ | (0.428 | ) |
| | | | | | |
Net asset value — End of period | | $ | 11.040 | | | $ | 11.770 | | | $ | 11.520 | | | $ | 12.600 | | | $ | 12.050 | | | $ | 10.840 | |
| | | | | | |
Total Return(4) | | | (2.47 | )% | | | 7.23 | % | | | (3.70 | )% | | | 9.14 | % | | | 16.55 | %(5) | | | 12.81 | %(5) |
| | | | | | |
| Ratios/Supplemental Data | | | | | | | | | | | | | | | | | | | | | | | | |
Net assets, end of period (000’s omitted) | | $ | 6,969 | | | $ | 18,648 | | | $ | 18,704 | | | $ | 40,486 | | | $ | 12,939 | | | $ | 14,001 | |
Ratios (as a percentage of average daily net assets): | | | | | | | | | | | | | | | | | | | | | | | | |
Expenses(6)(7) | | | 0.60 | % | | | 0.70 | % | | | 0.70 | % | | | 0.70 | % | | | 0.70 | %(8)(9) | | | 0.70 | %(8)(9) |
Net investment income | | | 3.21 | % | | | 3.87 | % | | | 3.62 | % | | | 3.70 | % | | | 5.07 | %(8)(9) | | | 4.45 | %(8)(9) |
Portfolio Turnover of the Portfolio(10) | | | — | | | | — | | | | — | | | | — | | | | 22 | %(5) | | | 1 | %(5) |
Portfolio Turnover of the Fund | | | 119 | % | | | 0 | %(11) | | | 19 | % | | | 24 | % | | | 10 | %(5)(12) | | | — | |
| (1) | For the eleven months ended September 30, 2011. The Fund changed its fiscal year end from October 31 to September 30. |
| (2) | For the period from the start of business, November 17, 2009, to October 31, 2010. |
| (3) | Computed using average shares outstanding. |
| (4) | Returns are historical and are calculated by determining the percentage change in net asset value with all distributions reinvested. |
| (6) | The investment adviser of the Portfolio or Fund and administrator reimbursed certain operating expenses (equal to 0.34%, 0.23%, 0.22%, 0.19%, 0.41% and 1.16% of average daily net assets for the years ended September 30, 2015, 2014, 2013 and 2012, the period ended September 30, 2011 and the period from the start of business, November 17, 2009, to October 31, 2010, respectively). Absent this reimbursement, total return would be lower. |
| (7) | Excludes the effect of custody fee credits, if any, of less than 0.005%. |
| (9) | Includes the Fund’s share of the Portfolio’s allocated expenses for the period while the Fund was investing in the Portfolio. |
| (10) | Portfolio turnover represents the rate of portfolio activity for the period while the Fund was investing in the Portfolio. |
| (11) | Amount is less than 1%. |
| (12) | For the period from March 1, 2011 through September 30, 2011 when the Fund was making investments directly in securities. |
References to Portfolio herein are to Build America Bond Portfolio, a Massachusetts business trust in which the Fund invested all of its investable assets prior to March 1, 2011 and which had the same investment objective and policies as the Fund during such period.
| | | | |
| | 16 | | See Notes to Financial Statements. |
Eaton Vance
Core Plus Bond Fund
September 30, 2015
Notes to Financial Statements
1 Significant Accounting Policies
Eaton Vance Core Plus Bond Fund (formerly, Eaton Vance Build America Bond Fund) (the Fund) is a diversified series of Eaton Vance Mutual Funds Trust (the Trust). The Trust is a Massachusetts business trust registered under the Investment Company Act of 1940, as amended (the 1940 Act), as an open-end management investment company. The Fund’s investment objective is total return. Prior to May 1, 2015, the Fund’s investment objective was current income and its secondary objective was capital appreciation. As of May 1, 2015, the Fund also changed its principal investment strategies and adopted a policy of investing at least 80% of its net assets in bonds and other fixed and floating-rate income instruments, including preferred securities, floating-rate loans and convertible securities. In connection with these changes, the Fund is no longer required, under normal market circumstances, to invest at least 80% of its net assets in Build America Bonds. The Fund offers three classes of shares. Class A shares are generally sold subject to a sales charge imposed at time of purchase. Class C shares are sold at net asset value and are generally subject to a contingent deferred sales charge (see Note 5). Class I shares are sold at net asset value and are not subject to a sales charge. Each class represents a pro-rata interest in the Fund, but votes separately on class-specific matters and (as noted below) is subject to different expenses. Realized and unrealized gains and losses are allocated daily to each class of shares based on the relative net assets of each class to the total net assets of the Fund. Net investment income, other than class-specific expenses, is allocated daily to each class of shares based upon the ratio of the value of each class’s paid shares to the total value of all paid shares. Each class of shares differs in its distribution plan and certain other class-specific expenses.
The following is a summary of significant accounting policies of the Fund. The policies are in conformity with accounting principles generally accepted in the United States of America (U.S. GAAP). The Fund is an investment company and follows accounting and reporting guidance in the Financial Accounting Standards Board (“FASB”) Accounting Standards Codification Topic 946.
A Investment Valuation — The following methodologies are used to determine the market value or fair value of investments.
Debt Obligations. Debt obligations (including short-term obligations with a remaining maturity of more than sixty days) are generally valued on the basis of valuations provided by third party pricing services, as derived from such services’ pricing models. Inputs to the models may include, but are not limited to, reported trades, executable bid and asked prices, broker/dealer quotations, prices or yields of securities with similar characteristics, interest rates, anticipated prepayments, benchmark curves or information pertaining to the issuer, as well as industry and economic events. The pricing services may use a matrix approach, which considers information regarding securities with similar characteristics to determine the valuation for a security. Short-term obligations purchased with a remaining maturity of sixty days or less are generally valued at amortized cost, which approximates market value.
Equity Securities. Equity securities listed on a U.S. securities exchange generally are valued at the last sale or closing price on the day of valuation or, if no sales took place on such date, at the mean between the closing bid and asked prices therefore on the exchange where such securities are principally traded. Equity securities listed on the NASDAQ Global or Global Select Market generally are valued at the NASDAQ official closing price. Unlisted or listed securities for which closing sales prices or closing quotations are not available are valued at the mean between the latest available bid and asked prices or, in the case of preferred equity securities that are not listed or traded in the over-the-counter market, by a third party pricing service that uses various techniques that consider factors including, but not limited to, prices or yields of securities with similar characteristics, benchmark yields, broker/dealer quotes, quotes of underlying common stock, issuer spreads, as well as industry and economic events.
Senior Floating-Rate Loans. Interests in senior floating-rate loans (Senior Loans) for which reliable market quotations are readily available are valued generally at the average mean of bid and ask quotations obtained from a third party pricing service.
Foreign Securities and Currencies. Foreign securities and currencies are valued in U.S. dollars, based on foreign currency exchange rate quotations supplied by a third party pricing service. The pricing service uses a proprietary model to determine the exchange rate. Inputs to the model include reported trades and implied bid/ask spreads.
Affiliated Fund. The Fund may invest in Eaton Vance Cash Reserves Fund, LLC (Cash Reserves Fund), an affiliated investment company managed by Eaton Vance Management (EVM). The value of the Fund’s investment in Cash Reserves Fund reflects the Fund’s proportionate interest in its net assets. Cash Reserves Fund generally values its investment securities utilizing the amortized cost valuation technique in accordance with Rule 2a-7 under the 1940 Act. This technique involves initially valuing a portfolio security at its cost and thereafter assuming a constant amortization to maturity of any discount or premium. If amortized cost is determined not to approximate fair value, Cash Reserves Fund may value its investment securities in the same manner as debt obligations described above.
Fair Valuation. Investments for which valuations or market quotations are not readily available or are deemed unreliable are valued at fair value using methods determined in good faith by or at the direction of the Trustees of the Fund in a manner that fairly reflects the security’s value, or the amount that the Fund might reasonably expect to receive for the security upon its current sale in the ordinary course. Each such determination is based on a consideration of relevant factors, which are likely to vary from one pricing context to another. These factors may include, but are not limited to, the type of security, the existence of any contractual restrictions on the security’s disposition, the price and extent of public trading in similar securities of the issuer or of comparable companies or entities, quotations or relevant information obtained from broker/dealers or other market participants, information obtained from the issuer, analysts, and/or the appropriate stock exchange (for exchange-traded securities), an analysis of the company’s or entity’s financial condition, and an evaluation of the forces that influence the issuer and the market(s) in which the security is purchased and sold.
B Investment Transactions — Investment transactions for financial statement purposes are accounted for on a trade date basis. Realized gains and losses on investments sold are determined on the basis of identified cost.
Eaton Vance
Core Plus Bond Fund
September 30, 2015
Notes to Financial Statements — continued
C Income — Interest income is recorded on the basis of interest accrued, adjusted for amortization of premium or accretion of discount. Fees associated with loan amendments are recognized immediately. Dividend income is recorded on the ex-dividend date for dividends received in cash and/or securities. Inflation adjustments to the principal amount of inflation-adjusted bonds and notes are reflected as interest income. Deflation adjustments to the principal amount of an inflation-adjusted bond or note are reflected as reductions to interest income to the extent of interest income previously recorded on such bond or note.
D Federal Taxes — The Fund’s policy is to comply with the provisions of the Internal Revenue Code applicable to regulated investment companies and to distribute to shareholders each year substantially all of its net investment income, and all or substantially all of its net realized capital gains. Accordingly, no provision for federal income or excise tax is necessary.
As of September 30, 2015, the Fund had no uncertain tax positions that would require financial statement recognition, de-recognition, or disclosure. The Fund files a U.S. federal income tax return annually after its fiscal year-end, which is subject to examination by the Internal Revenue Service for a period of three years from the date of filing.
E Expenses — The majority of expenses of the Trust are directly identifiable to an individual fund. Expenses which are not readily identifiable to a specific fund are allocated taking into consideration, among other things, the nature and type of expense and the relative size of the funds.
F Expense Reduction — State Street Bank and Trust Company (SSBT) serves as custodian of the Fund. Pursuant to the custodian agreement, SSBT receives a fee reduced by credits, which are determined based on the average daily cash balance the Fund maintains with SSBT. All credit balances, if any, used to reduce the Fund’s custodian fees are reported as a reduction of expenses in the Statement of Operations.
G Foreign Currency Translation — Investment valuations, other assets, and liabilities initially expressed in foreign currencies are translated each business day into U.S. dollars based upon current exchange rates. Purchases and sales of foreign investment securities and income and expenses denominated in foreign currencies are translated into U.S. dollars based upon currency exchange rates in effect on the respective dates of such transactions. Recognized gains or losses on investment transactions attributable to changes in foreign currency exchange rates are recorded for financial statement purposes as net realized gains and losses on investments. That portion of unrealized gains and losses on investments that results from fluctuations in foreign currency exchange rates is not separately disclosed.
H Use of Estimates — The preparation of the financial statements in conformity with U.S. GAAP requires management to make estimates and assumptions that affect the reported amounts of assets and liabilities at the date of the financial statements and the reported amounts of income and expense during the reporting period. Actual results could differ from those estimates.
I Indemnifications — Under the Trust’s organizational documents, its officers and Trustees may be indemnified against certain liabilities and expenses arising out of the performance of their duties to the Fund. Under Massachusetts law, if certain conditions prevail, shareholders of a Massachusetts business trust (such as the Trust) could be deemed to have personal liability for the obligations of the Trust. However, the Trust’s Declaration of Trust contains an express disclaimer of liability on the part of Fund shareholders and the By-laws provide that the Trust shall assume the defense on behalf of any Fund shareholders. Moreover, the By-laws also provide for indemnification out of Fund property of any shareholder held personally liable solely by reason of being or having been a shareholder for all loss or expense arising from such liability. Additionally, in the normal course of business, the Fund enters into agreements with service providers that may contain indemnification clauses. The Fund’s maximum exposure under these arrangements is unknown as this would involve future claims that may be made against the Fund that have not yet occurred.
J When-Issued Securities and Delayed Delivery Transactions — The Fund may purchase or sell securities on a delayed delivery or when-issued basis. Payment and delivery may take place after the customary settlement period for that security. At the time the transaction is negotiated, the price of the security that will be delivered is fixed. The Fund maintains security positions for these commitments such that sufficient liquid assets will be available to make payments upon settlement. Securities purchased on a delayed delivery or when-issued basis are marked-to-market daily and begin earning interest on settlement date. Losses may arise due to changes in the market value of the underlying securities or if the counterparty does not perform under the contract.
2 Distributions to Shareholders and Income Tax Information
The Fund declares dividends daily to shareholders of record at the time of declaration. Distributions are generally paid monthly. Distributions of realized capital gains are made at least annually. Distributions to shareholders are recorded on the ex-dividend date. Distributions are declared separately for each class of shares. Shareholders may reinvest income and capital gain distributions in additional shares of the same class of the Fund at the net asset value as of the ex-dividend date or, at the election of the shareholder, receive distributions in cash. Distributions to shareholders are determined in accordance with income tax regulations, which may differ from U.S. GAAP. As required by U.S. GAAP, only distributions in excess of tax basis earnings and profits are reported in the financial statements as a return of capital. Permanent differences between book and tax accounting relating to distributions are reclassified to paid-in capital. For tax purposes, distributions from short-term capital gains are considered to be from ordinary income.
Eaton Vance
Core Plus Bond Fund
September 30, 2015
Notes to Financial Statements — continued
The tax character of distributions declared for the years ended September 30, 2015 and September 30, 2014 was as follows:
| | | | | | | | |
| | | Year Ended September 30, | |
| | | 2015 | | | 2014 | |
| | |
Distributions declared from: | | | | | | | | |
Ordinary income | | $ | 1,953,192 | | | $ | 2,154,460 | |
During the year ended September 30, 2015, accumulated net realized gain was decreased by $661,461, accumulated distributions in excess of net investment income was decreased by $340,624 and paid-in capital was increased by $320,837 due to the Fund’s use of equalization accounting and differences between book and tax accounting, primarily for foreign currency gain (loss), premium amortization, accretion of market discount and investments in partnerships. Tax equalization accounting allows the Fund to treat as a distribution that portion of redemption proceeds representing a redeeming shareholder’s portion of undistributed taxable income and net capital gains. These reclassifications had no effect on the net assets or net asset value per share of the Fund.
As of September 30, 2015, the components of distributable earnings (accumulated losses) and unrealized appreciation (depreciation) on a tax basis were as follows:
| | | | |
Undistributed ordinary income | | $ | 4,914 | |
Undistributed long-term capital gains | | $ | 430,260 | |
Post October capital losses | | $ | (364,488 | ) |
Net unrealized depreciation | | $ | (3,086,375 | ) |
Other temporary differences | | $ | (13,485 | ) |
The differences between components of distributable earnings (accumulated losses) on a tax basis and the amounts reflected in the Statement of Assets and Liabilities are primarily due to investments in partnerships, the timing of recognizing distributions to shareholders, premium amortization and accretion of market discount.
At September 30, 2015, the Fund had a net capital loss of $364,488 attributable to security transactions incurred after October 31, 2014 that it has elected to defer. This net capital loss is treated as arising on the first day of the Fund’s taxable year ending September 30, 2016.
The cost and unrealized appreciation (depreciation) of investments of the Fund at September 30, 2015, as determined on a federal income tax basis, were as follows:
| | | | |
| |
Aggregate cost | | $ | 35,730,335 | |
| |
Gross unrealized appreciation | | $ | 62,368 | |
Gross unrealized depreciation | | | (3,143,698 | ) |
| |
Net unrealized depreciation | | $ | (3,081,330 | ) |
3 Investment Adviser Fee and Other Transactions with Affiliates
The investment adviser fee is earned by Boston Management and Research (BMR), a subsidiary of EVM, as compensation for investment advisory services rendered to the Fund. Pursuant to the investment advisory agreement and subsequent fee reduction agreement between the Fund and BMR effective February 1, 2015, the fee is computed at an annual rate of 0.45% of the Fund’s average daily net assets up to $1 billion and is payable monthly. On net assets of $1 billion and over, the annual fee is reduced. The fee reduction cannot be terminated without the consent of the Trustees and shareholders. Prior to February 1, 2015, the fee was computed at an annual rate of 0.60% of the Fund’s average daily net assets up to $1 billion and at reduced rates on net assets of $1 billion and over. For the year ended September 30, 2015, the Fund’s investment adviser fee amounted to $275,906 or 0.50% of the Fund’s average daily net assets. The Fund invests its cash in Cash Reserves Fund. EVM does not currently receive a fee for advisory services provided to Cash Reserves Fund.
BMR has agreed to reimburse the Fund’s expenses to the extent that total annual operating expenses (relating to ordinary operating expenses only) exceed 0.80%, 1.55% and 0.55% (0.95%, 1.70% and 0.70% prior to February 1, 2015) of the Fund’s average daily net assets for Class A, Class C and Class I,
Eaton Vance
Core Plus Bond Fund
September 30, 2015
Notes to Financial Statements — continued
respectively. This agreement may be changed or terminated after January 31, 2016. Pursuant to this agreement, BMR was allocated $187,160 of the Fund’s operating expenses for the year ended September 30, 2015.
EVM serves as the administrator of the Fund, but receives no compensation. EVM provides sub-transfer agency and related services to the Fund pursuant to a Sub-Transfer Agency Support Services Agreement. For the year ended September 30, 2015, EVM earned $1,488 from the Fund pursuant to such agreement, which is included in transfer and dividend disbursing agent fees on the Statement of Operations. The Fund was informed that Eaton Vance Distributors, Inc. (EVD), an affiliate of EVM and the Fund’s principal underwriter, received $6,368 as its portion of the sales charge on sales of Class A shares for the year ended September 30, 2015. EVD also received distribution and service fees from Class A and Class C shares (see Note 4) and contingent deferred sales charges (see Note 5).
Trustees and officers of the Fund who are members of EVM’s or BMR’s organizations receive remuneration for their services to the Fund out of the investment adviser fee. Trustees of the Fund who are not affiliated with the investment adviser may elect to defer receipt of all or a percentage of their annual fees in accordance with the terms of the Trustees Deferred Compensation Plan. For the year ended September 30, 2015, no significant amounts have been deferred. Certain officers and Trustees of the Fund are officers of the above organizations.
4 Distribution Plans
The Fund has in effect a distribution plan for Class A shares (Class A Plan) pursuant to Rule 12b-1 under the 1940 Act. Pursuant to the Class A Plan, the Fund pays EVD a distribution and service fee of 0.25% per annum of its average daily net assets attributable to Class A shares for distribution services and facilities provided to the Fund by EVD, as well as for personal services and/or the maintenance of shareholder accounts. Distribution and service fees paid or accrued to EVD for the year ended September 30, 2015 amounted to $48,301 for Class A shares.
The Fund also has in effect a distribution plan for Class C shares (Class C Plan) pursuant to Rule 12b-1 under the 1940 Act. Pursuant to the Class C Plan, the Fund pays EVD amounts equal to 0.75% per annum of its average daily net assets attributable to Class C shares for providing ongoing distribution services and facilities to the Fund. For the year ended September 30, 2015, the Fund paid or accrued to EVD $87,540 for Class C shares.
Pursuant to the Class C Plan, the Fund also makes payments of service fees to EVD, financial intermediaries and other persons in amounts equal to 0.25% per annum of its average daily net assets attributable to that class. Service fees paid or accrued are for personal services and/or the maintenance of shareholder accounts. They are separate and distinct from the sales commissions and distribution fees payable to EVD. Service fees paid or accrued for the year ended September 30, 2015 amounted to $29,180 for Class C shares.
Distribution and service fees are subject to the limitations contained in the Financial Industry Regulatory Authority’s NASD Conduct Rule 2830(d).
5 Contingent Deferred Sales Charges
A contingent deferred sales charge (CDSC) of 1% generally is imposed on redemptions of Class C shares made within one year of purchase. Class A shares may be subject to a 1% CDSC if redeemed within 18 months of purchase (depending on the circumstances of purchase). Generally, the CDSC is based upon the lower of the net asset value at date of redemption or date of purchase. No charge is levied on shares acquired by reinvestment of dividends or capital gain distributions. For the year ended September 30, 2015, the Fund was informed that EVD received approximately $5,000 of CDSCs paid by Class C shareholders and no CDSCs paid by Class A shareholders.
6 Purchases and Sales of Investments
Purchases and sales of investments, other than short-term obligations and including maturities, paydowns and principal repayments on Senior Loans, aggregated $54,298,168 and $64,424,658, respectively, for the year ended September 30, 2015.
Eaton Vance
Core Plus Bond Fund
September 30, 2015
Notes to Financial Statements — continued
7 Shares of Beneficial Interest
The Fund’s Declaration of Trust permits the Trustees to issue an unlimited number of full and fractional shares of beneficial interest (without par value). Such shares may be issued in a number of different series (such as the Fund) and classes. Transactions in Fund shares were as follows:
| | | | | | | | |
| | | Year Ended September 30, | |
| Class A | | 2015 | | | 2014 | |
| | |
Sales | | | 724,868 | | | | 303,737 | |
Issued to shareholders electing to receive payments of distributions in Fund shares | | | 56,204 | | | | 78,568 | |
Redemptions | | | (912,943 | ) | | | (1,187,148 | ) |
| | |
Net decrease | | | (131,871 | ) | | | (804,843 | ) |
| | |
| | | | | | | | |
| | | Year Ended September 30, | |
| Class C | | 2015 | | | 2014 | |
| | |
Sales | | | 351,961 | | | | 125,003 | |
Issued to shareholders electing to receive payments of distributions in Fund shares | | | 22,807 | | | | 29,829 | |
Redemptions | | | (327,377 | ) | | | (899,679 | ) |
| | |
Net increase (decrease) | | | 47,391 | | | | (744,847 | ) |
| | |
| | | | | | | | |
| | | Year Ended September 30, | |
| Class I | | 2015 | | | 2014 | |
| | |
Sales | | | 1,920,947 | | | | 1,305,836 | |
Issued to shareholders electing to receive payments of distributions in Fund shares | | | 73,662 | | | | 56,361 | |
Redemptions | | | (2,947,161 | ) | | | (1,401,526 | ) |
| | |
Net decrease | | | (952,552 | ) | | | (39,329 | ) |
8 Line of Credit
The Fund participates with other portfolios and funds managed by EVM and its affiliates in a $625 million unsecured line of credit agreement with a group of banks, which is in effect through September 2, 2016. Borrowings are made by the Fund solely to facilitate the handling of unusual and/or unanticipated short-term cash requirements. Interest is charged to the Fund based on its borrowings at an amount above either the Eurodollar rate or Federal Funds rate. In addition, a fee computed at an annual rate of 0.10% on the daily unused portion of the line of credit is allocated among the participating portfolios and funds at the end of each quarter. Because the line of credit is not available exclusively to the Fund, it may be unable to borrow some or all of its requested amounts at any particular time. The Fund did not have any significant borrowings or allocated fees during the year ended September 30, 2015.
9 Risks Associated with Foreign Investments
Investing in securities issued by companies whose principal business activities are outside the United States may involve significant risks not present in domestic investments. For example, there is generally less publicly available information about foreign companies, particularly those not subject to the disclosure and reporting requirements of the U.S. securities laws. Certain foreign issuers are generally not bound by uniform accounting, auditing, and financial reporting requirements and standards of practice comparable to those applicable to domestic issuers. Investments in foreign securities also involve the risk of possible adverse changes in investment or exchange control regulations, expropriation or confiscatory taxation, limitation on the removal of funds or other assets of the Fund, political or financial instability or diplomatic and other developments which could affect such investments. Foreign securities markets, while growing in volume and sophistication, are generally not as developed as those in the United States, and securities of some foreign issuers (particularly those located in developing countries) may be less liquid and more volatile than securities of comparable U.S. companies. In general, there is less overall governmental supervision and regulation of foreign securities markets, broker/dealers and issuers than in the United States.
Eaton Vance
Core Plus Bond Fund
September 30, 2015
Notes to Financial Statements — continued
10 Fair Value Measurements
Under generally accepted accounting principles for fair value measurements, a three-tier hierarchy to prioritize the assumptions, referred to as inputs, is used in valuation techniques to measure fair value. The three-tier hierarchy of inputs is summarized in the three broad levels listed below.
| • | | Level 1 – quoted prices in active markets for identical investments |
| • | | Level 2 – other significant observable inputs (including quoted prices for similar investments, interest rates, prepayment speeds, credit risk, etc.) |
| • | | Level 3 – significant unobservable inputs (including a fund’s own assumptions in determining the fair value of investments) |
In cases where the inputs used to measure fair value fall in different levels of the fair value hierarchy, the level disclosed is determined based on the lowest level input that is significant to the fair value measurement in its entirety. The inputs or methodology used for valuing securities are not necessarily an indication of the risk associated with investing in those securities.
At September 30, 2015, the hierarchy of inputs used in valuing the Fund’s investments, which are carried at value, were as follows:
| | | | | | | | | | | | | | | | |
| Asset Description | | Level 1 | | | Level 2 | | | Level 3 | | | Total | |
| | | | |
Corporate Bonds & Notes | | $ | — | | | $ | 11,080,028 | | | $ | — | | | $ | 11,080,028 | |
Commercial Mortgage-Backed Securities | | | — | | | | 5,014,778 | | | | — | | | | 5,014,778 | |
Asset-Backed Securities | | | — | | | | 4,647,394 | | | | — | | | | 4,647,394 | |
Foreign Government Bonds | | | — | | | | 5,727,172 | | | | — | | | | 5,727,172 | |
Senior Floating-Rate Interests | | | — | | | | 275,898 | | | | — | | | | 275,898 | |
Convertible Bonds | | | — | | | | 2,134,250 | | | | — | | | | 2,134,250 | |
Convertible Preferred Stocks | | | — | | | | 272,661 | | | | — | | | | 272,661 | |
U.S. Treasury Obligations | | | — | | | | 2,418,371 | | | | — | | | | 2,418,371 | |
Short-Term Investments | | | — | | | | 1,078,453 | | | | — | | | | 1,078,453 | |
| | | | |
Total Investments | | $ | — | | | $ | 32,649,005 | | | $ | — | | | $ | 32,649,005 | |
The Fund held no investments or other financial instruments as of September 30, 2014 whose fair value was determined using Level 3 inputs. At September 30, 2015, there were no investments transferred between Level 1 and Level 2 during the year then ended.
11 Name Change
Effective May 1, 2015, the name of Eaton Vance Core Plus Bond Fund was changed from Eaton Vance Build America Bond Fund and the Fund’s investment objective and principal investment strategies were changed as described in Note 1.
Eaton Vance
Core Plus Bond Fund
September 30, 2015
Report of Independent Registered Public Accounting Firm
To the Trustees of Eaton Vance Mutual Funds Trust and Shareholders of Eaton Vance Core Plus Bond Fund:
We have audited the accompanying statement of assets and liabilities of Eaton Vance Core Plus Bond Fund (formerly, Eaton Vance Build America Bond Fund), (the “Fund”) (one of the funds constituting Eaton Vance Mutual Funds Trust), including the portfolio of investments, as of September 30, 2015, and the related statement of operations for the year then ended, the statements of changes in net assets for each of the two years in the period then ended, and the financial highlights for each of the periods presented. These financial statements and financial highlights are the responsibility of the Fund’s management. Our responsibility is to express an opinion on these financial statements and financial highlights based on our audits.
We conducted our audits in accordance with the standards of the Public Company Accounting Oversight Board (United States). Those standards require that we plan and perform the audit to obtain reasonable assurance about whether the financial statements and financial highlights are free of material misstatement. The Fund is not required to have, nor were we engaged to perform, an audit of its internal control over financial reporting. Our audits included consideration of internal control over financial reporting as a basis for designing audit procedures that are appropriate in the circumstances, but not for the purpose of expressing an opinion on the effectiveness of the Fund’s internal control over financial reporting. Accordingly, we express no such opinion. An audit also includes examining, on a test basis, evidence supporting the amounts and disclosures in the financial statements, assessing the accounting principles used and significant estimates made by management, as well as evaluating the overall financial statement presentation. Our procedures included confirmation of securities owned as of September 30, 2015, by correspondence with the custodian, brokers and selling or agent banks; where replies were not received from brokers and selling or agent banks, we performed other auditing procedures. We believe that our audits provide a reasonable basis for our opinion.
In our opinion, such financial statements and financial highlights referred to above present fairly, in all material respects, the financial position of Eaton Vance Core Plus Bond Fund as of September 30, 2015, the results of its operations for the year then ended, the changes in its net assets for each of the two years in the period then ended, and the financial highlights for each of the periods presented, in conformity with accounting principles generally accepted in the United States of America.
DELOITTE & TOUCHE LLP
Boston, Massachusetts
November 18, 2015
Eaton Vance
Core Plus Bond Fund
September 30, 2015
Federal Tax Information (Unaudited)
The Form 1099-DIV you receive in February 2016 will show the tax status of all distributions paid to your account in calendar year 2015. Shareholders are advised to consult their own tax adviser with respect to the tax consequences of their investment in the Fund. As required by the Internal Revenue Code and/or regulations, shareholders must be notified regarding the status of capital gains dividends.
Capital Gains Dividends. The Fund hereby designates as a capital gain dividend with respect to the taxable year ended September 30, 2015, $751,097 or, if subsequently determined to be different, the net capital gain of such year.
Eaton Vance
Core Plus Bond Fund
September 30, 2015
Board of Trustees’ Contract Approval
Overview of the Contract Review Process
The Investment Company Act of 1940, as amended (the “1940 Act”), provides, in substance, that each investment advisory agreement between a fund and its investment adviser will continue in effect from year to year only if its continuation is approved at least annually by the fund’s board of trustees, including by a vote of a majority of the trustees who are not “interested persons” of the fund (“Independent Trustees”), cast in person at a meeting called for the purpose of considering such approval.
At a meeting of the Boards of Trustees (each a “Board”) of the registered investment companies advised, administered and/or distributed by Eaton Vance Management or its affiliates (the “Eaton Vance Funds”) held on April 27, 2015, the Board, including a majority of the Independent Trustees, voted to approve continuation of existing investment advisory and sub-advisory agreements for the Eaton Vance Funds for an additional one-year period. In voting its approval, the Board relied upon the affirmative recommendation of its Contract Review Committee, which is a committee comprised exclusively of Independent Trustees. Prior to making its recommendation, the Contract Review Committee reviewed information furnished by each adviser to the Eaton Vance Funds (including information specifically requested by the Board) for a series of meetings of the Contract Review Committee held between February and April 2015. The Contract Review Committee also considered information received at prior meetings of the Board and its committees, as relevant to its annual evaluation of the investment advisory and sub-advisory agreements.
The information that the Board considered included, among other things, the following:
Information about Fees, Performance and Expenses
| • | | A report from an independent data provider comparing the advisory and related fees paid by each fund with fees paid by comparable funds as identified by the data provider (“comparable funds”); |
| • | | A report from an independent data provider comparing each fund’s total expense ratio and its components to comparable funds; |
| • | | A report from an independent data provider comparing the investment performance of each fund (including, where relevant, yield data, Sharpe ratios and information ratios) to the investment performance of comparable funds over various time periods; |
| • | | Data regarding investment performance in comparison to benchmark indices and customized peer groups identified by the adviser in consultation with the Board; |
| • | | For each fund, comparative information concerning the fees charged and the services provided by each adviser in managing other accounts (including mutual funds, other collective investment funds and institutional accounts) using investment strategies and techniques similar to those used in managing such fund; |
| • | | Profitability analyses for each adviser with respect to each fund; |
Information about Portfolio Management and Trading
| • | | Descriptions of the investment management services provided to each fund, including the investment strategies and processes it employs; |
| • | | The procedures and processes used to determine the fair value of fund assets and actions taken to monitor and test the effectiveness of such procedures and processes; |
| • | | Information about each adviser’s policies and practices with respect to trading, including each adviser’s processes for monitoring best execution of portfolio transactions; |
| • | | Information about the allocation of brokerage transactions and the benefits received by each adviser as a result of brokerage allocation, including information concerning the acquisition of research through client commission arrangements and policies with respect to “soft dollars”; |
| • | | Data relating to portfolio turnover rates of each fund; |
Information about each Adviser
| • | | Reports detailing the financial results and condition of each adviser; |
| • | | Descriptions of the qualifications, education and experience of the individual investment professionals whose responsibilities include portfolio management and investment research for the funds, and information relating to their compensation and responsibilities with respect to managing other mutual funds and investment accounts; |
| • | | The Code of Ethics of each adviser and its affiliates, together with information relating to compliance with and the administration of such codes; |
| • | | Policies and procedures relating to proxy voting and the handling of corporate actions and class actions; |
| • | | Information concerning the resources devoted to compliance efforts undertaken by each adviser and its affiliates (including descriptions of various compliance programs) and their record of compliance; |
| • | | Descriptions of the business continuity and disaster recovery plans of each adviser and its affiliates; |
| • | | A description of Eaton Vance Management’s procedures for overseeing third party advisers and sub-advisers, including with respect to regulatory and compliance issues, investment management and other matters; |
Eaton Vance
Core Plus Bond Fund
September 30, 2015
Board of Trustees’ Contract Approval — continued
Other Relevant Information
| • | | Information concerning the nature, cost and character of the administrative and other non-investment management services provided by Eaton Vance Management and its affiliates; |
| • | | Information concerning management of the relationship with the custodian, subcustodians and fund accountants by each adviser or the funds’ administrator; and |
| • | | The terms of each investment advisory agreement. |
Over the course of the twelve-month period ended April 30, 2015, with respect to one or more funds, the Board met nine times and the Contract Review Committee, the Audit Committee, the Governance Committee, the Portfolio Management Committee and the Compliance Reports and Regulatory Matters Committee, each of which is a Committee comprised solely of Independent Trustees, met eight, seventeen, seven, eleven and thirteen times, respectively. At such meetings, the Trustees participated in investment and performance reviews with the portfolio managers and other investment professionals of each adviser relating to each fund, and considered the investment and trading strategies used in pursuing each fund’s investment objective, including, where relevant, the use of derivative instruments, as well as processes for monitoring best execution of portfolio transactions and risk management techniques. The Board and its Committees also evaluated issues pertaining to industry and regulatory developments, compliance procedures, fund governance and other issues with respect to the funds, and received and participated in reports and presentations provided by Eaton Vance Management and other fund advisers with respect to such matters. In addition to the formal meetings of the Board and its Committees, the Independent Trustees hold regular teleconferences in between meetings to discuss, among other topics, matters relating to the continuation of investment advisory and sub-advisory agreements.
For funds that invest through one or more underlying portfolios, the Board considered similar information about the portfolio(s) when considering the approval of investment advisory agreements. In addition, in cases where the fund’s investment adviser has engaged a sub-adviser, the Board considered similar information about the sub-adviser when considering the approval of any sub-advisory agreement.
The Contract Review Committee was assisted throughout the contract review process by Goodwin Procter LLP, legal counsel for the Independent Trustees. The members of the Contract Review Committee relied upon the advice of such counsel and their own business judgment in determining the material factors to be considered in evaluating each investment advisory and sub-advisory agreement and the weight to be given to each such factor. The conclusions reached with respect to each investment advisory and sub-advisory agreement were based on a comprehensive evaluation of all the information provided and not any single factor. Moreover, each member of the Contract Review Committee may have placed varying emphasis on particular factors in reaching conclusions with respect to each investment advisory and sub-advisory agreement. In evaluating each investment advisory and sub-advisory agreement, including the specific fee structures and other terms of the agreements, the Contract Review Committee was informed by multiple years of analysis and discussion among the Independent Trustees and the Eaton Vance Funds’ advisers and sub-advisers.
Results of the Process
Based on its consideration of the foregoing, and such other information as it deemed relevant, including the factors and conclusions described below, the Contract Review Committee concluded that the continuation of the investment advisory agreement of Eaton Vance Core Plus Bond Fund (formerly Eaton Vance Build America Bond Fund) (the “Fund”) with Boston Management and Research (the “Adviser”), an affiliate of Eaton Vance Management, including its fee structure, is in the interests of shareholders and, therefore, the Contract Review Committee recommended to the Board approval of the agreement. The Board accepted the recommendation of the Contract Review Committee as well as the factors considered and conclusions reached by the Contract Review Committee with respect to the agreement. Accordingly, the Board, including a majority of the Independent Trustees, voted to approve continuation of the investment advisory agreement for the Fund.
Nature, Extent and Quality of Services
In considering whether to approve the investment advisory agreement of the Fund, the Board evaluated the nature, extent and quality of services provided to the Fund by the Adviser.
The Board considered the Adviser’s management capabilities and investment process with respect to the types of investments held by the Fund, including the education, experience and number of its investment professionals and other personnel who provide portfolio management, investment research, and similar services to the Fund. The Board considered, where relevant, the abilities and experience of such investment personnel in analyzing factors such as credit risk and special considerations relevant to investing in income securities. The Board considered the Adviser’s in-house research capabilities. The Board also took into account the resources dedicated to portfolio management and other services, as well as the compensation methods of the Adviser and other factors, such as the reputation and resources of the Adviser to recruit and retain investment personnel. In addition, the Board considered the time and attention devoted to the Fund by senior management, as well as the infrastructure, operational capabilities and support staff in place to assist in the management of the Fund, including the provision of administrative services.
The Board considered the compliance programs of the Adviser and relevant affiliates thereof. Among other matters, the Board considered compliance and reporting matters relating to personal trading by investment personnel, selective disclosure of portfolio holdings, late trading, frequent trading, portfolio
Eaton Vance
Core Plus Bond Fund
September 30, 2015
Board of Trustees’ Contract Approval — continued
valuation, business continuity and the allocation of investment opportunities. The Board also considered the responses of the Adviser and its affiliates to requests in recent years from regulatory authorities such as the Securities and Exchange Commission and the Financial Industry Regulatory Authority.
The Board considered shareholder and other administrative services provided or managed by Eaton Vance Management and its affiliates, including transfer agency and accounting services. The Board evaluated the benefits to shareholders of investing in a fund that is a part of a large family of funds, including the ability, in many cases, to exchange an investment among different funds without incurring additional sales charges.
After consideration of the foregoing factors, among others, the Board concluded that the nature, extent and quality of services provided by the Adviser, taken as a whole, are appropriate and consistent with the terms of the investment advisory agreement.
Fund Performance
The Board compared the Fund’s investment performance to that of comparable funds and appropriate benchmark indices and assessed the Fund’s performance on the basis of total return and current income return. The Board’s review included comparative performance data for the one- and three-year periods ended September 30, 2014 for the Fund. The Board noted that it had recently approved changes to the Fund’s name and investment strategy to allow the Fund to invest in a broad range of income investments. On the basis of the foregoing and other relevant information provided by the Adviser in response to inquiries from the Contract Review Committee, the Board concluded that the performance of the Fund was satisfactory.
Management Fees and Expenses
The Board considered contractual fee rates payable by the Fund for advisory and administrative services (referred to collectively as “management fees”). As part of its review, the Board considered the Fund’s management fees and total expense ratio for the year ended September 30, 2014, as compared to those of comparable funds, before and after giving effect to any undertaking to waive fees or reimburse expenses. The Board also considered factors that had an impact on Fund expense ratios, as identified by management in response to inquiries from the Contract Review Committee, as well as actions taken by management in recent years to reduce expenses at the fund complex level.
After considering the foregoing information, and in light of the nature, extent and quality of the services provided by the Adviser, the Board concluded that the management fees charged for advisory and related services are reasonable.
Profitability
The Board considered the level of profits realized by the Adviser and relevant affiliates thereof in providing investment advisory and administrative services to the Fund and to all Eaton Vance Funds as a group. The Board considered the level of profits realized without regard to revenue sharing or other payments by the Adviser and its affiliates to third parties in respect of distribution services. The Board also considered other direct or indirect benefits received by the Adviser and its affiliates in connection with their relationships with the Fund, including the benefits of research services that may be available to the Adviser as a result of securities transactions effected for the Fund and other investment advisory clients.
The Board concluded that, in light of the foregoing factors and the nature, extent and quality of the services rendered, the profits realized by the Adviser and its affiliates are reasonable.
Economies of Scale
In reviewing management fees and profitability, the Board also considered the extent to which the Adviser and its affiliates, on the one hand, and the Fund, on the other hand, can expect to realize benefits from economies of scale as the assets of the Fund increase. The Board acknowledged the difficulty in accurately measuring the benefits resulting from the economies of scale with respect to the management of any specific fund or group of funds. The Board reviewed data summarizing the increases and decreases in the assets of the Fund and of all Eaton Vance Funds as a group over various time periods, and evaluated the extent to which the total expense ratio of the Fund and the profitability of the Adviser and its affiliates may have been affected by such increases or decreases. Based upon the foregoing, the Board concluded that the Fund currently shares in the benefits from economies of scale. The Board also concluded that, assuming reasonably foreseeable increases in the assets of the Fund, the structure of the advisory fee, which includes breakpoints at several asset levels, will allow the Fund to continue to benefit from economies of scale in the future.
Eaton Vance
Core Plus Bond Fund
September 30, 2015
Management and Organization
Fund Management. The Trustees of Eaton Vance Mutual Funds Trust (the Trust) are responsible for the overall management and supervision of the Trust’s affairs. The Trustees and officers of the Trust are listed below. Except as indicated, each individual has held the office shown or other offices in the same company for the last five years. Trustees and officers of the Trust hold indefinite terms of office. The “Noninterested Trustees” consist of those Trustees who are not “interested persons” of the Trust, as that term is defined under the 1940 Act. The business address of each Trustee and officer is Two International Place, Boston, Massachusetts 02110. As used below, “EVC” refers to Eaton Vance Corp., “EV” refers to Eaton Vance, Inc., “EVM” refers to Eaton Vance Management, “BMR” refers to Boston Management and Research and “EVD” refers to Eaton Vance Distributors, Inc. EVC and EV are the corporate parent and trustee, respectively, of EVM and BMR. EVD is the Fund’s principal underwriter and a wholly-owned subsidiary of EVC. Each officer affiliated with Eaton Vance may hold a position with other Eaton Vance affiliates that is comparable to his or her position with EVM listed below. Each Trustee oversees 174 portfolios in the Eaton Vance Complex (including all master and feeder funds in a master feeder structure). Each officer serves as an officer of certain other Eaton Vance funds. Each Trustee and officer serves until his or her successor is elected.
| | | | | | |
| Name and Year of Birth | | Position(s) with the Trust | | Trustee Since(1) | | Principal Occupation(s) and Directorships During Past Five Years and Other Relevant Experience |
Interested Trustee | | | | | | |
| | | |
Thomas E. Faust Jr. 1958 | | Trustee | | 2007 | | Chairman, Chief Executive Officer and President of EVC, Director and President of EV, Chief Executive Officer and President of EVM and BMR, and Director of EVD. Trustee and/or officer of 174 registered investment companies. Mr. Faust is an interested person because of his positions with EVM, BMR, EVD, EVC and EV, which are affiliates of the Trust. Directorships in the Last Five Years.(2) Director of EVC and Hexavest Inc. |
Noninterested Trustees | | | | | | |
| | | |
Scott E. Eston 1956 | | Trustee | | 2011 | | Private investor. Formerly held various positions at Grantham, Mayo, Van Otterloo and Co., L.L.C. (investment management firm) (1997-2009), including Chief Operating Officer (2002-2009), Chief Financial Officer (1997-2009) and Chairman of the Executive Committee (2002-2008); President and Principal Executive Officer, GMO Trust (open-end registered investment company) (2006-2009). Former Partner, Coopers and Lybrand L.L.P. (now PricewaterhouseCoopers) (public accounting firm) (1987-1997). Directorships in the Last Five Years.(2) None. |
| | | |
Cynthia E. Frost 1961 | | Trustee | | 2014 | | Private investor. Formerly, Chief Investment Officer of Brown University (university endowment) (2000-2012); Portfolio Strategist for Duke Management Company (university endowment manager) (1995-2000); Managing Director, Cambridge Associates (1989-1995); Consultant, Bain and Company (1987-1989); Senior Equity Analyst, BA Investment Management Company (1983-1985). Directorships in the Last Five Years. None. |
| | | |
George J. Gorman 1952 | | Trustee | | 2014 | | Principal at George J. Gorman LLC (consulting firm). Formerly, Senior Partner at Ernst & Young LLP (public accounting firm) (1974-2009). Directorships in the Last Five Years. Formerly, Trustee of the Bank of America Money Market Funds Series Trust (2011-2014) and of the Ashmore Funds (2010-2014). |
| | | |
Valerie A. Mosley 1960 | | Trustee | | 2014 | | Chairwoman and Chief Executive Officer of Valmo Ventures (a consulting and investment firm). Former Partner and Senior Vice President, Portfolio Manager and Investment Strategist at Wellington Management Company, LLP (investment management firm) (1992-2012). Former Chief Investment Officer, PG Corbin Asset Management (1990-1992). Formerly worked in institutional corporate bond sales at Kidder Peabody (1986-1990). Directorships in the Last Five Years.(2) Director of Dynex Capital, Inc. (mortgage REIT) (since 2013). |
| | | |
William H. Park 1947 | | Trustee | | 2003 | | Private investor. Formerly, Consultant (2012-2014). Formerly, Chief Financial Officer, Aveon Group L.P. (investment management firm) (2010-2011). Formerly, Vice Chairman, Commercial Industrial Finance Corp. (specialty finance company) (2006-2010). Formerly, President and Chief Executive Officer, Prizm Capital Management, LLC (investment management firm) (2002-2005). Formerly, Executive Vice President and Chief Financial Officer, United Asset Management Corporation (investment management firm) (1982-2001). Formerly, Senior Manager, Price Waterhouse (now PricewaterhouseCoopers) (an independent registered public accounting firm) (1972-1981). Directorships in the Last Five Years.(2) None. |
Eaton Vance
Core Plus Bond Fund
September 30, 2015
Management and Organization — continued
| | | | | | |
| Name and Year of Birth | | Position(s) with the Trust | | Trustee Since(1) | | Principal Occupation(s) and Directorships During Past Five Years and Other Relevant Experience |
Noninterested Trustees (continued) | | |
| | | |
Helen Frame Peters 1948 | | Trustee | | 2008 | | Professor of Finance, Carroll School of Management, Boston College. Formerly, Dean, Carroll School of Management, Boston College (2000-2002). Formerly, Chief Investment Officer, Fixed Income, Scudder Kemper Investments (investment management firm) (1998-1999). Formerly, Chief Investment Officer, Equity and Fixed Income, Colonial Management Associates (investment management firm) (1991-1998). Directorships in the Last Five Years.(2) Formerly, Director of BJ’s Wholesale Club, Inc. (wholesale club retailer) (2004-2011). Formerly, Trustee of SPDR Index Shares Funds and SPDR Series Trust (exchange traded funds) (2000-2009). Formerly, Director of Federal Home Loan Bank of Boston (a bank for banks) (2007-2009). |
| | | |
Susan J. Sutherland(3) 1957 | | Trustee | | 2015 | | Private investor. Formerly, Associate, Counsel and Partner at Skadden, Arps, Slate, Meagher & Flom LLP (law firm) (1982-2013). Directorships in the Last Five Years. Formerly, Director of Montpelier Re Holdings Ltd. (global provider of customized insurance and reinsurance products) (2013-2015). |
| | | |
Harriett Tee Taggart 1948 | | Trustee | | 2011 | | Managing Director, Taggart Associates (a professional practice firm). Formerly, Partner and Senior Vice President, Wellington Management Company, LLP (investment management firm) (1983-2006). Directorships in the Last Five Years.(2) Director of Albemarle Corporation (chemicals manufacturer) (since 2007) and The Hanover Group (specialty property and casualty insurance company) (since 2009). Formerly, Director of Lubrizol Corporation (specialty chemicals) (2007-2011). |
| | | |
Ralph F. Verni 1943 | | Chairman of the Board and Trustee | | 2007 (Chairman) 2005 (Trustee) | | Consultant and private investor. Formerly, Chief Investment Officer (1982-1992), Chief Financial Officer (1988-1990) and Director (1982-1992), New England Life. Formerly, Chairperson, New England Mutual Funds (1982-1992). Formerly, President and Chief Executive Officer, State Street Management & Research (1992-2000). Formerly, Chairperson, State Street Research Mutual Funds (1992-2000). Formerly, Director, W.P. Carey, LLC (1998-2004) and First Pioneer Farm Credit Corp. (2002-2006). Directorships in the Last Five Years.(2) None. |
| | | |
| | | | | | |
Principal Officers who are not Trustees |
| Name and Year of Birth | | Position(s) with the Trust | | Officer Since(4) | | Principal Occupation(s) During Past Five Years |
| | | |
Payson F. Swaffield 1956 | | President | | 2003 | | Vice President and Chief Income Investment Officer of EVM and BMR. |
| | | |
Maureen A. Gemma 1960 | | Vice President, Secretary and Chief Legal Officer | | 2005 | | Vice President of EVM and BMR. |
| | | |
James F. Kirchner 1967 | | Treasurer | | 2007 | | Vice President of EVM and BMR. |
| | | |
Paul M. O’Neil 1953 | | Chief Compliance Officer | | 2004 | | Vice President of EVM and BMR. |
| (1) | Year first appointed to serve as Trustee for a fund in the Eaton Vance family of funds. Each Trustee has served continuously since appointment unless indicated otherwise. |
| (2) | During their respective tenures, the Trustees (except for Mmes. Frost and Sutherland and Mr. Gorman) also served as Board members of one or more of the following funds (which operated in the years noted): eUnitsTM 2 Year U.S. Market Participation Trust: Upside to Cap / Buffered Downside (launched in 2012 and terminated in 2014); eUnitsTM 2 Year U.S. Market Participation Trust II: Upside to Cap / Buffered Downside (launched in 2012 and terminated in 2014); Eaton Vance Credit Opportunities Fund (launched in 2005 and terminated in 2010); and Eaton Vance National Municipal Income Trust (launched in 1998 and terminated in 2009). However, Ms. Mosley did not serve as a Board member of eUnitsTM 2 Year U.S. Market Participation Trust: Upside to Cap / Buffered Downside (launched in 2012 and terminated in 2014). |
Eaton Vance
Core Plus Bond Fund
September 30, 2015
Management and Organization — continued
| (3) | Ms. Sutherland began serving as a Trustee effective May 1, 2015. |
| (4) | Year first elected to serve as officer of a fund in the Eaton Vance family of funds when the officer has served continuously. Otherwise, year of most recent election as an officer of a fund in the Eaton Vance family of funds. Titles may have changed since initial election. |
The SAI for the Fund includes additional information about the Trustees and officers of the Fund and can be obtained without charge on Eaton Vance’s website at www.eatonvance.com or by calling 1-800-262-1122.
Eaton Vance Funds
IMPORTANT NOTICES
Privacy. The Eaton Vance organization is committed to ensuring your financial privacy. Each of the financial institutions identified below has in effect the following policy (“Privacy Policy”) with respect to nonpublic personal information about its customers:
| • | | Only such information received from you, through application forms or otherwise, and information about your Eaton Vance fund transactions will be collected. This may include information such as name, address, social security number, tax status, account balances and transactions. |
| • | | None of such information about you (or former customers) will be disclosed to anyone, except as permitted by law (which includes disclosure to employees necessary to service your account). In the normal course of servicing a customer’s account, Eaton Vance may share information with unaffiliated third parties that perform various required services such as transfer agents, custodians and broker-dealers. |
| • | | Policies and procedures (including physical, electronic and procedural safeguards) are in place that are designed to protect the confidentiality of such information. |
| • | | We reserve the right to change our Privacy Policy at any time upon proper notification to you. Customers may want to review our Privacy Policy periodically for changes by accessing the link on our homepage: www.eatonvance.com. |
Our pledge of privacy applies to the following entities within the Eaton Vance organization: the Eaton Vance Family of Funds, Eaton Vance Management, Eaton Vance Investment Counsel, Eaton Vance Distributors, Inc., Eaton Vance Trust Company, Eaton Vance Management’s Real Estate Investment Group and Boston Management and Research. In addition, our Privacy Policy applies only to those Eaton Vance customers who are individuals and who have a direct relationship with us. If a customer’s account (i.e., fund shares) is held in the name of a third-party financial advisor/broker-dealer, it is likely that only such advisor’s privacy policies apply to the customer. This notice supersedes all previously issued privacy disclosures. For more information about Eaton Vance’s Privacy Policy, please call 1-800-262-1122.
Delivery of Shareholder Documents. The Securities and Exchange Commission (SEC) permits funds to deliver only one copy of shareholder documents, including prospectuses, proxy statements and shareholder reports, to fund investors with multiple accounts at the same residential or post office box address. This practice is often called “householding” and it helps eliminate duplicate mailings to shareholders. Eaton Vance, or your financial advisor, may household the mailing of your documents indefinitely unless you instruct Eaton Vance, or your financial advisor, otherwise. If you would prefer that your Eaton Vance documents not be householded, please contact Eaton Vance at 1-800-262-1122, or contact your financial advisor. Your instructions that householding not apply to delivery of your Eaton Vance documents will be effective within 30 days of receipt by Eaton Vance or your financial advisor.
Portfolio Holdings. Each Eaton Vance Fund and its underlying Portfolio(s) (if applicable) will file a schedule of portfolio holdings on Form N-Q with the SEC for the first and third quarters of each fiscal year. The Form N-Q will be available on the Eaton Vance website at www.eatonvance.com, by calling Eaton Vance at 1-800-262-1122 or in the EDGAR database on the SEC’s website at www.sec.gov. Form N-Q may also be reviewed and copied at the SEC’s public reference room in Washington, D.C. (call 1-800-732-0330 for information on the operation of the public reference room).
Proxy Voting. From time to time, funds are required to vote proxies related to the securities held by the funds. The Eaton Vance Funds or their underlying Portfolios (if applicable) vote proxies according to a set of policies and procedures approved by the Funds’ and Portfolios’ Boards. You may obtain a description of these policies and procedures and information on how the Funds or Portfolios voted proxies relating to portfolio securities during the most recent 12-month period ended June 30, without charge, upon request, by calling 1-800-262-1122 and by accessing the SEC’s website at www.sec.gov.
This Page Intentionally Left Blank
Investment Adviser
Boston Management and Research
Two International Place
Boston, MA 02110
Administrator
Eaton Vance Management
Two International Place
Boston, MA 02110
Principal Underwriter*
Eaton Vance Distributors, Inc.
Two International Place
Boston, MA 02110
(617) 482-8260
Custodian
State Street Bank and Trust Company
State Street Financial Center, One Lincoln Street
Boston, MA 02111
Transfer Agent
BNY Mellon Investment Servicing (US) Inc.
Attn: Eaton Vance Funds
P.O. Box 9653
Providence, RI 02940-9653
(800) 262-1122
Independent Registered Public Accounting Firm
Deloitte & Touche LLP
200 Berkeley Street
Boston, MA 02116-5022
Fund Offices
Two International Place
Boston, MA 02110
| * | FINRA BrokerCheck. Investors may check the background of their Investment Professional by contacting the Financial Industry Regulatory Authority (FINRA). FINRA BrokerCheck is a free tool to help investors check the professional background of current and former FINRA-registered securities firms and brokers. FINRA BrokerCheck is available by calling 1-800-289-9999 and at www.FINRA.org. The FINRA BrokerCheck brochure describing this program is available to investors at www.FINRA.org. |

Eaton Vance
Municipal Income Funds
Annual Report
September 30, 2015
AMT-Free • National

Commodity Futures Trading Commission Registration. Effective December 31, 2012, the Commodity Futures Trading Commission (“CFTC”) adopted certain regulatory changes that subject registered investment companies and advisers to regulation by the CFTC if a fund invests more than a prescribed level of its assets in certain CFTC-regulated instruments (including futures, certain options and swap agreements) or markets itself as providing investment exposure to such instruments. Each Fund has claimed an exclusion from the definition of the term “commodity pool operator” under the Commodity Exchange Act. Accordingly, neither the Funds nor the adviser with respect to the operation of the Funds is subject to CFTC regulation. Because of its management of other strategies, each Fund’s adviser is registered with the CFTC as a commodity pool operator and a commodity trading advisor.
Fund shares are not insured by the FDIC and are not deposits or other obligations of, or guaranteed by, any depository institution. Shares are subject to investment risks, including possible loss of principal invested.
This report must be preceded or accompanied by a current summary prospectus or prospectus. Before investing, investors should consider carefully the investment objective, risks, and charges and expenses of a mutual fund. This and other important information is contained in the summary prospectus and prospectus, which can be obtained from a financial advisor. Prospective investors should read the prospectus carefully before investing. For further information, please call 1-800-262-1122.
Annual Report September 30, 2015
Eaton Vance
Municipal Income Funds
Table of Contents
| | | | |
Management’s Discussion of Fund Performance | | | 2 | |
| |
Performance and Fund Profile | | | | |
| |
| | | | |
AMT-Free Municipal Income Fund | | | 3 | |
National Municipal Income Fund | | | 5 | |
| |
| | | | |
| |
Endnotes and Additional Disclosures | | | 7 | |
| |
Fund Expenses | | | 8 | |
| |
Financial Statements | | | 10 | |
| |
Report of Independent Registered Public Accounting Firm | | | 47 | |
| |
Federal Tax Information | | | 49 | |
| |
Board of Trustees’ Contract Approval | | | 50 | |
| |
Management and Organization | | | 53 | |
| |
Important Notices | | | 56 | |
Eaton Vance
Municipal Income Funds
September 30, 2015
Management’s Discussion of Fund Performance1
Economic and Market Conditions
As the fiscal year began on October 1, 2014, municipal bonds were well into a rally that continued for the first four months of the period ended September 30, 2015. U.S. 10-year Treasury and municipal rates hit their low for the period around the end of January 2015. After that, municipal returns turned negative as a flood of new issuance, along with modest outflows from municipal mutual funds, put downward pressure on bond prices. For the period as a whole, however, municipal bonds delivered positive performance as gains during the rally in the opening months of the period outweighed losses during the selloff in the period’s final eight months.
Going into the period, investors anticipated rising interest rates, driven by what was expected to be the Federal Reserve Board’s (the Fed’s) first rate hike since 2006. But while the U.S. economy continued to experience moderate growth and low inflation, fixed-income investors became increasingly concerned about declining growth in the eurozone, Japan and China. The result was strong worldwide demand for U.S. Treasurys that pushed Treasury rates down in the early months of the period, with municipal rates following.
Beginning in February 2015, however, rates in the short end of the yield curve began to creep upward, as investors believed the Fed was getting closer to a rate hike. In the following months, as European interest rates rose from historic lows, yields on longer maturity Treasurys climbed as well.
In August 2015, China surprised the markets by devaluing its currency. Oil prices continued their fall, causing investors to question whether the Fed would raise rates in September as many had expected. After a number of U.S. economic numbers came in weaker than expected, the Fed decided not to take action at its September meeting. Against this backdrop, many asset classes experienced dramatic volatility in August and September, although the municipal market remained relatively calm.
For the one-year period as a whole, the municipal yield curve flattened. For AAA-rated7 issues, interest rates rose modestly in the one- to six-year part of the curve, while rates declined slightly in the seven- to 30-year part of the curve.
Fund Performance
For the fiscal year ended September 30, 2015, AMT-Free Municipal Income Fund Class A shares at net asset value (NAV) underperformed the 3.16% return of the Funds’ primary benchmark, the Barclays Municipal Bond Index (the Index),2 while National Municipal Income Fund Class A shares at NAV outperformed the Index.
The Funds’ overall strategy is to invest normally in bonds with maturities of 10 years or more, in order to capture their typically higher yields and a greater income stream compared with shorter-maturity issues.
The Funds seek to enhance tax-exempt income by entering into residual interest bond transactions (RIB transactions)6 and investing the proceeds of such transactions in additional municipal securities, which creates leverage in the Funds. Leverage has the effect of magnifying the Funds’ exposure to their underlying investments in both up and down markets. During this period of positive performance by municipal bonds, leverage helped performance of both Funds relative to the Index.
By using Treasury futures and/or interest-rate swaps, management hedges to various degrees against the greater potential risk of volatility caused by the use of leverage and investing in bonds at the long end of the yield curve. As a risk management tactic within the Funds’ overall strategies, interest rate hedging is intended to moderate performance on both the upside and the downside of the market. During this period of positive performance by municipal bonds, the Funds’ Treasury futures hedge mitigated some of the upside and thus detracted modestly from the Funds’ performance relative to the unhedged Index.
Fund-specific Results
Eaton Vance AMT-Free Municipal Income Fund Class A shares at NAV returned 2.52%, underperforming the 3.16% return of the Index. Detractors from results relative to the Index included the Fund’s hedging strategy, as noted above, as well as security selection in BBB-rated bonds and an underweight in bonds with 25 or more years remaining to maturity. In contrast, contributors to performance versus the Index included RIB transactions, an overweight and security selection in zero coupon bonds, an overweight in industrial development revenue (IDR) bonds, and an overweight in the hospital sector, which was the best-performing sector in the Index during the period.
Eaton Vance National Municipal Income Fund Class A shares at NAV returned 3.35%, outperforming the 3.16% return of the Index. RIB transactions, an overweight and security selection in zero coupon bonds, an overweight and security selection in IDR bonds, and an overweight and security selection in the hospital sector all contributed to performance relative to the Index. Detractors from results versus the Index included the Fund’s hedging strategy and security selection in water and sewer bonds.
See Endnotes and Additional Disclosures in this report.
Past performance is no guarantee of future results. Returns are historical and are calculated by determining the percentage change in net asset value (NAV) or offering price (as applicable) with all distributions reinvested. Investment return and principal value will fluctuate so that shares, when redeemed, may be worth more or less than their original cost. Performance less than one year is cumulative. Performance is for the stated time period only; due to market volatility, the Fund’s current performance may be lower or higher than quoted. Returns are before taxes unless otherwise noted. For performance as of the most recent month-end, please refer to eatonvance.com.
Eaton Vance
AMT-Free Municipal Income Fund
September 30, 2015
Performance2,3
Portfolio Manager Cynthia J. Clemson
| | | | | | | | | | | | | | | | | | | | |
| % Average Annual Total Returns | | Class Inception Date | | | Performance
Inception Date | | | One Year | | | Five Years | | | Ten Years | |
Class A at NAV | | | 01/06/1998 | | | | 03/16/1978 | | | | 2.52 | % | | | 4.56 | % | | | 3.93 | % |
Class A with 4.75% Maximum Sales Charge | | | — | | | | — | | | | –2.39 | | | | 3.54 | | | | 3.43 | |
Class B at NAV | | | 01/14/1998 | | | | 03/16/1978 | | | | 1.74 | | | | 3.78 | | | | 3.15 | |
Class B with 5% Maximum Sales Charge | | | — | | | | — | | | | –3.18 | | | | 3.43 | | | | 3.15 | |
Class C at NAV | | | 05/02/2006 | | | | 03/16/1978 | | | | 1.75 | | | | 3.78 | | | | 3.16 | |
Class C with 1% Maximum Sales Charge | | | — | | | | — | | | | 0.76 | | | | 3.78 | | | | 3.16 | |
Class I at NAV | | | 03/16/1978 | | | | 03/16/1978 | | | | 2.70 | | | | 4.81 | | | | 4.19 | |
Barclays Municipal Bond Index | | | — | | | | — | | | | 3.16 | % | | | 4.14 | % | | | 4.63 | % |
Barclays Long (22+) Year Municipal Bond Index | | | — | | | | — | | | | 4.44 | | | | 5.55 | | | | 5.02 | |
| | | | | |
| | | | | | | | | | | | | | | | | | | | |
| % Total Annual Operating Expense Ratios4 | | | | | Class A | | | Class B | | | Class C | | | Class I | |
Gross | | | | | | | 0.92 | % | | | 1.67 | % | | | 1.67 | % | | | 0.67 | % |
Net | | | | | | | 0.83 | | | | 1.58 | | | | 1.58 | | | | 0.58 | |
| | | | | |
| | | | | | | | | | | | | | | | | | | | |
| % Distribution Rates/Yields5 | | | | | Class A | | | Class B | | | Class C | | | Class I | |
Distribution Rate | | | | | | | 4.00 | % | | | 3.26 | % | | | 3.26 | % | | | 4.25 | % |
Taxable-Equivalent Distribution Rate | | | | | | | 7.07 | | | | 5.76 | | | | 5.76 | | | | 7.51 | |
SEC 30-day Yield | | | | | | | 1.90 | | | | 1.26 | | | | 1.26 | | | | 2.25 | |
Taxable-Equivalent SEC 30-day Yield | | | | | | | 3.36 | | | | 2.22 | | | | 2.22 | | | | 3.97 | �� |
| | | | | |
| | | | | | | | | | | | | | | | | | | | |
| % Total Leverage6 | | | | | | | | | | | | | | | |
Residual Interest Bond (RIB) Financing | | | | | | | | | | | | | | | | | | | 10.50 | % |
Growth of $10,000
This graph shows the change in value of a hypothetical investment of $10,000 in Class A of the Fund for the period indicated. For comparison, the same investment is shown in the indicated index.
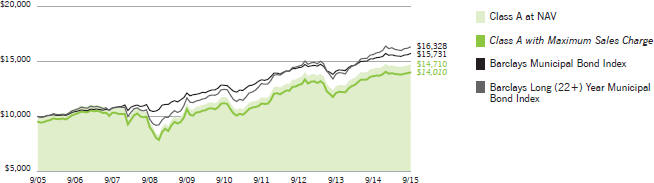
| | | | | | | | | | | | | | | | |
| Growth of Investment | | Amount Invested | | | Period Beginning | | | At NAV | | | With Maximum Sales Charge | |
Class B | | $ | 10,000 | | | | 09/30/2005 | | | $ | 13,640 | | | | N.A. | |
Class C | | $ | 10,000 | | | | 09/30/2005 | | | $ | 13,654 | | | | N.A. | |
Class I | | $ | 250,000 | | | | 09/30/2005 | | | $ | 376,921 | | | | N.A. | |
See Endnotes and Additional Disclosures in this report.
Past performance is no guarantee of future results. Returns are historical and are calculated by determining the percentage change in net asset value (NAV) or offering price (as applicable) with all distributions reinvested. Investment return and principal value will fluctuate so that shares, when redeemed, may be worth more or less than their original cost. Performance less than one year is cumulative. Performance is for the stated time period only; due to market volatility, the Fund’s current performance may be lower or higher than quoted. Returns are before taxes unless otherwise noted. For performance as of the most recent month-end, please refer to eatonvance.com.
Eaton Vance
AMT-Free Municipal Income Fund
September 30, 2015
Fund Profile
Credit Quality (% of total investments)7,8
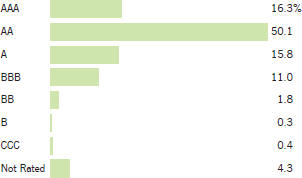
See Endnotes and Additional Disclosures in this report.
Eaton Vance
National Municipal Income Fund
September 30, 2015
Performance2,3
Portfolio Manager Craig R. Brandon, CFA
| | | | | | | | | | | | | | | | | | | | |
| % Average Annual Total Returns | | Class
Inception Date | | | Performance
Inception Date | | | One Year | | | Five Years | | | Ten Years | |
Class A at NAV | | | 04/05/1994 | | | | 12/19/1985 | | | | 3.35 | % | | | 4.49 | % | | | 3.67 | % |
Class A with 4.75% Maximum Sales Charge | | | — | | | | — | | | | –1.54 | | | | 3.47 | | | | 3.17 | |
Class B at NAV | | | 12/19/1985 | | | | 12/19/1985 | | | | 2.58 | | | | 3.71 | | | | 2.90 | |
Class B with 5% Maximum Sales Charge | | | — | | | | — | | | | –2.39 | | | | 3.37 | | | | 2.90 | |
Class C at NAV | | | 12/03/1993 | | | | 12/19/1985 | | | | 2.58 | | | | 3.71 | | | | 2.89 | |
Class C with 1% Maximum Sales Charge | | | — | | | | — | | | | 1.58 | | | | 3.71 | | | | 2.89 | |
Class I at NAV | | | 07/01/1999 | | | | 12/19/1985 | | | | 3.50 | | | | 4.75 | | | | 3.93 | |
Barclays Municipal Bond Index | | | — | | | | — | | | | 3.16 | % | | | 4.14 | % | | | 4.63 | % |
Barclays Long (22+) Year Municipal Bond Index | | | — | | | | — | | | | 4.44 | | | | 5.55 | | | | 5.02 | |
| | | | | |
| | | | | | | | | | | | | | | | | | | | |
| % Total Annual Operating Expense Ratios4 | | | | | Class A | | | Class B | | | Class C | | | Class I | |
Gross | | | | | | | 0.80 | % | | | 1.55 | % | | | 1.55 | % | | | 0.55 | % |
Net | | | | | | | 0.71 | | | | 1.46 | | | | 1.46 | | | | 0.46 | |
| | | | | |
| | | | | | | | | | | | | | | | | | | | |
| % Distribution Rates/Yields5 | | | | | Class A | | | Class B | | | Class C | | | Class I | |
Distribution Rate | | | | | | | 3.94 | % | | | 3.20 | % | | | 3.20 | % | | | 4.18 | % |
Taxable-Equivalent Distribution Rate | | | | | | | 6.96 | | | | 5.65 | | | | 5.65 | | | | 7.39 | |
SEC 30-day Yield | | | | | | | 2.60 | | | | 1.99 | | | | 1.98 | | | | 2.98 | |
Taxable-Equivalent SEC 30-day Yield | | | | | | | 4.59 | | | | 3.51 | | | | 3.51 | | | | 5.26 | |
| | | | | |
| | | | | | | | | | | | | | | | | | | | |
| % Total Leverage6 | | | | | | | | | | | | | | | |
RIB Financing | | | | | | | | | | | | | | | | | | | 12.16 | % |
Growth of $10,000
This graph shows the change in value of a hypothetical investment of $10,000 in Class A of the Fund for the period indicated. For comparison, the same investment is shown in the indicated index.
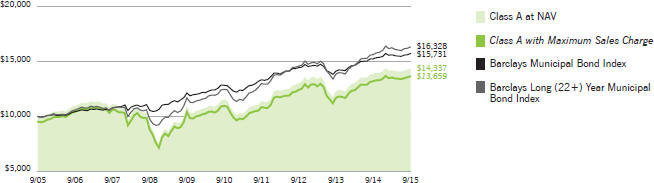
| | | | | | | | | | | | | | | | |
| Growth of Investment | | Amount Invested | | | Period Beginning | | | At NAV | | | With Maximum Sales Charge | |
Class B | | $ | 10,000 | | | | 09/30/2005 | | | $ | 13,305 | | | | N.A. | |
Class C | | $ | 10,000 | | | | 09/30/2005 | | | $ | 13,304 | | | | N.A. | |
Class I | | $ | 250,000 | | | | 09/30/2005 | | | $ | 367,490 | | | | N.A. | |
See Endnotes and Additional Disclosures in this report.
Past performance is no guarantee of future results. Returns are historical and are calculated by determining the percentage change in net asset value (NAV) or offering price (as applicable) with all distributions reinvested. Investment return and principal value will fluctuate so that shares, when redeemed, may be worth more or less than their original cost. Performance less than one year is cumulative. Performance is for the stated time period only; due to market volatility, the Fund’s current performance may be lower or higher than quoted. Returns are before taxes unless otherwise noted. For performance as of the most recent month-end, please refer to eatonvance.com.
Eaton Vance
National Municipal Income Fund
September 30, 2015
Fund Profile
Credit Quality (% of total investments)7,8
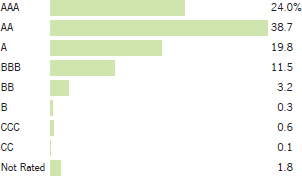
See Endnotes and Additional Disclosures in this report.
Eaton Vance
Municipal Income Funds
September 30, 2015
Endnotes and Additional Disclosures
| 1 | The views expressed in this report are those of the portfolio manager(s) and are current only through the date stated at the top of this page. These views are subject to change at any time based upon market or other conditions, and Eaton Vance and the Fund(s) disclaim any responsibility to update such views. These views may not be relied upon as investment advice and, because investment decisions are based on many factors, may not be relied upon as an indication of trading intent on behalf of any Eaton Vance fund. This commentary may contain statements that are not historical facts, referred to as “forward looking statements”. The Fund’s actual future results may differ significantly from those stated in any forward looking statement, depending on factors such as changes in securities or financial markets or general economic conditions, the volume of sales and purchases of Fund shares, the continuation of investment advisory, administrative and service contracts, and other risks discussed from time to time in the Fund’s filings with the Securities and Exchange Commission. |
| 2 | Barclays Municipal Bond Index is an unmanaged index of municipal bonds traded in the U.S. Barclays Long (22+) Year Municipal Bond Index is an unmanaged index of municipal bonds traded in the U.S. with maturities of 22 years or more. Unless otherwise stated, index returns do not reflect the effect of any applicable sales charges, commissions, expenses, taxes or leverage, as applicable. It is not possible to invest directly in an index. |
| 3 | Total Returns at NAV do not include applicable sales charges. If sales charges were deducted, the returns would be lower. Total Returns shown with maximum sales charge reflect the stated maximum sales charge. Unless otherwise stated, performance does not reflect the deduction of taxes on Fund distributions or redemptions of Fund shares. |
| | Performance prior to the inception date of a class may be linked to the performance of an older class of the Fund. This linked performance is adjusted for any applicable sales charge, but is not adjusted for class expense differences. If adjusted for such differences, the performance would be different. Performance presented in the financial highlights included in the financial statements is not linked. In the performance table, the performance of Class C is linked to Class B. Performance since inception for an index, if presented, is the performance since the Fund’s or oldest share class’ inception, as applicable. |
| 4 | Total annual operating expense ratios are as stated in the Fund’s most recent prospectus. Net expense ratio is not a result of a fee waiver or expense reimbursement. Net expense ratio excludes interest expense relating to the Fund’s liability with respect to floating rate notes held by third parties in conjunction with residual interest bond transactions by the Fund. The Fund also records offsetting interest income in an amount equal to this expense relating to the municipal obligations underlying such transactions and, as a result, net asset value and performance have not been affected by this expense. |
| 5 | The Distribution Rate is based on the Fund’s last regular distribution per share in the period (annualized) divided by the Fund’s NAV at the end of the period. The Fund’s distributions may be comprised of amounts characterized for federal income tax purposes as tax-exempt income, qualified and non-qualified ordinary dividends, capital gains and nondividend distributions, also known as return of capital. The Fund will determine the federal income tax character of distributions paid to a shareholder after the end of the calendar year. This is reported on the IRS form 1099- DIV and provided to the shareholder shortly after each year-end. The Fund’s distributions are determined by the investment adviser based on its current assessment of the Fund’s long-term return potential. As portfolio and market conditions change, the rate of distributions paid by the Fund could change. Taxable-equivalent performance is based on the highest combined federal and state income tax rates, where applicable. Lower tax rates would result in lower tax-equivalent performance. Actual tax rates will vary depending on your income, exemptions and deductions. Rates do not include local taxes. SEC Yield is a standardized measure based on the estimated yield to maturity of a fund’s investments over a 30-day period and is based on the maximum offer price at the date specified. The SEC Yield is not based on the distributions made by the Fund, which may differ. |
| 6 | Fund employs RIB financing. The leverage created by RIB investments provides an opportunity for increased income but, at the same time, creates special risks (including the likelihood of greater volatility of NAV). The cost of leverage rises and falls with changes in short-term interest rates. See “Floating Rate Notes Issued in Conjunction with Securities Held” in the notes to the financial statements for more information about RIB financing. RIB leverage represents the amount of Floating Rate Notes outstanding at period end as a percentage of Fund net assets plus Floating Rate Notes. |
| 7 | Ratings are based on Moody’s, S&P or Fitch, as applicable. If securities are rated differently by the ratings agencies, the higher rating is applied. Ratings, which are subject to change, apply to the creditworthiness of the issuers of the underlying securities and not to the Fund or its shares. Credit ratings measure the quality of a bond based on the issuer’s creditworthiness, with ratings ranging from AAA, being the highest, to D, being the lowest based on S&P’s measures. Ratings of BBB or higher by S&P or Fitch (Baa or higher by Moody’s) are considered to be investment- grade quality. Credit ratings are based largely on the ratings agency’s analysis at the time of rating. The rating assigned to any particular security is not necessarily a reflection of the issuer’s current financial condition and does not necessarily reflect its assessment of the volatility of a security’s market value or of the liquidity of an investment in the security. Holdings designated as “Not Rated” are not rated by the national ratings agencies stated above. |
| 8 | The chart includes the municipal bonds held by a trust that issues residual interest bonds, consistent with the Portfolio of Investments. |
| | Fund profile subject to change due to active management. |
Eaton Vance
Municipal Income Funds
September 30, 2015
Fund Expenses
Example: As a Fund shareholder, you incur two types of costs: (1) transaction costs, including sales charges (loads) on purchases and redemption fees (if applicable); and (2) ongoing costs, including management fees; distribution and/or service fees; and other Fund expenses. This Example is intended to help you understand your ongoing costs (in dollars) of Fund investing and to compare these costs with the ongoing costs of investing in other mutual funds. The Example is based on an investment of $1,000 invested at the beginning of the period and held for the entire period (April 1, 2015 – September 30, 2015).
Actual Expenses: The first section of each table below provides information about actual account values and actual expenses. You may use the information in this section, together with the amount you invested, to estimate the expenses that you paid over the period. Simply divide your account value by $1,000 (for example, an $8,600 account value divided by $1,000 = 8.6), then multiply the result by the number in the first section under the heading entitled “Expenses Paid During Period” to estimate the expenses you paid on your account during this period.
Hypothetical Example for Comparison Purposes: The second section of each table below provides information about hypothetical account values and hypothetical expenses based on the actual Fund expense ratio and an assumed rate of return of 5% per year (before expenses), which is not the actual Fund return. The hypothetical account values and expenses may not be used to estimate the actual ending account balance or expenses you paid for the period. You may use this information to compare the ongoing costs of investing in your Fund and other funds. To do so, compare this 5% hypothetical example with the 5% hypothetical examples that appear in the shareholder reports of the other funds.
Please note that the expenses shown in each table are meant to highlight your ongoing costs only and do not reflect any transactional costs, such as sales charges (loads) or redemption fees (if applicable). Therefore, the second section of each table is useful in comparing ongoing costs only, and will not help you determine the relative total costs of owning different funds. In addition, if these transactional costs were included, your costs would be higher.
Eaton Vance AMT-Free Municipal Income Fund
| | | | | | | | | | | | | | | | |
| | | Beginning Account Value (4/1/15) | | | Ending Account Value (9/30/15) | | | Expenses Paid During Period* (4/1/15 – 9/30/15) | | | Annualized Expense Ratio | |
| | | | |
| | | | | | | | | | | | | | | | |
Actual | | | | | | | | | | | | | | | | |
Class A | | $ | 1,000.00 | | | $ | 1,004.90 | | | $ | 4.52 | | | | 0.90 | % |
Class B | | $ | 1,000.00 | | | $ | 1,001.00 | | | $ | 8.28 | | | | 1.65 | % |
Class C | | $ | 1,000.00 | | | $ | 1,001.00 | | | $ | 8.28 | | | | 1.65 | % |
Class I | | $ | 1,000.00 | | | $ | 1,005.40 | | | $ | 3.27 | | | | 0.65 | % |
| | | | | | | | | | | | | | | | | |
| | | | |
| | | | | | | | | | | | | | | | |
Hypothetical | | | | | | | | | | | | | | | | |
(5% return per year before expenses) | | | | | | | | | | | | | | | | |
Class A | | $ | 1,000.00 | | | $ | 1,020.60 | | | $ | 4.56 | | | | 0.90 | % |
Class B | | $ | 1,000.00 | | | $ | 1,016.80 | | | $ | 8.34 | | | | 1.65 | % |
Class C | | $ | 1,000.00 | | | $ | 1,016.80 | | | $ | 8.34 | | | | 1.65 | % |
Class I | | $ | 1,000.00 | | | $ | 1,021.80 | | | $ | 3.29 | | | | 0.65 | % |
| * | Expenses are equal to the Fund’s annualized expense ratio for the indicated Class, multiplied by the average account value over the period, multiplied by 183/365 (to reflect the one-half year period). The Example assumes that the $1,000 was invested at the net asset value per share determined at the close of business on March 31, 2015. |
Eaton Vance
Municipal Income Funds
September 30, 2015
Fund Expenses — continued
Eaton Vance National Municipal Income Fund
| | | | | | | | | | | | | | | | |
| | | Beginning Account Value (4/1/15) | | | Ending Account Value (9/30/15) | | | Expenses Paid During Period*
(4/1/15 – 9/30/15) | | | Annualized Expense Ratio | |
| | | | |
| | | | | | | | | | | | | | | | |
Actual | | | | | | | | | | | | | | | | |
Class A | | $ | 1,000.00 | | | $ | 1,008.40 | | | $ | 3.88 | | | | 0.77 | % |
Class B | | $ | 1,000.00 | | | $ | 1,004.70 | | | $ | 7.64 | | | | 1.52 | % |
Class C | | $ | 1,000.00 | | | $ | 1,004.70 | | | $ | 7.64 | | | | 1.52 | % |
Class I | | $ | 1,000.00 | | | $ | 1,009.70 | | | $ | 2.62 | | | | 0.52 | % |
| | | | | | | | | | | | | | | | | |
| | | | |
| | | | | | | | | | | | | | | | |
Hypothetical | | | | | | | | | | | | | | | | |
(5% return per year before expenses) | | | | | | | | | | | | | | | | |
Class A | | $ | 1,000.00 | | | $ | 1,021.20 | | | $ | 3.90 | | | | 0.77 | % |
Class B | | $ | 1,000.00 | | | $ | 1,017.40 | | | $ | 7.69 | | | | 1.52 | % |
Class C | | $ | 1,000.00 | | | $ | 1,017.40 | | | $ | 7.69 | | | | 1.52 | % |
Class I | | $ | 1,000.00 | | | $ | 1,022.50 | | | $ | 2.64 | | | | 0.52 | % |
| * | Expenses are equal to the Fund’s annualized expense ratio for the indicated Class, multiplied by the average account value over the period, multiplied by 183/365 (to reflect the one-half year period). The Example assumes that the $1,000 was invested at the net asset value per share determined at the close of business on March 31, 2015. |
Eaton Vance
AMT-Free Municipal Income Fund
September 30, 2015
Portfolio of Investments
| | | | | | | | |
| Tax-Exempt Investments — 109.1% | |
| | |
| | | | | | | | |
| Security | | Principal Amount (000’s omitted) | | | Value | |
| | | | | | | | |
|
Bond Bank — 3.9% | |
Idaho Bond Bank Authority, 5.25%, 9/15/25 | | $ | 830 | | | $ | 934,896 | |
Idaho Bond Bank Authority, 5.375%, 9/15/27 | | | 1,110 | | | | 1,248,006 | |
New York Environmental Facilities Corp., 5.00%, 10/15/35(1) | | | 9,900 | | | | 11,208,681 | |
| | | | | | | | | |
| | | | | | $ | 13,391,583 | |
| | | | | | | | | |
|
Education — 5.2% | |
Missouri Health and Educational Facilities Authority, (Washington University), 5.375%, 3/15/39(1) | | $ | 4,110 | | | $ | 4,483,969 | |
Oregon Facilities Authority, (Lewis & Clark College), 5.625%, 10/1/36 | | | 1,050 | | | | 1,243,253 | |
University of California, 5.25%, 5/15/35 | | | 3,555 | | | | 4,209,191 | |
University of Nebraska, 5.00%, 5/15/35 | | | 1,000 | | | | 1,159,740 | |
University of Nebraska, 5.00%, 7/1/35 | | | 3,000 | | | | 3,484,650 | |
West Virginia University, 5.00%, 10/1/31 | | | 3,000 | | | | 3,427,290 | |
| | | | | | | | | |
| | | | | | $ | 18,008,093 | |
| | | | | | | | | |
|
Electric Utilities — 8.4% | |
Apache County, AZ, Industrial Development Authority, (Tucson Electric Power Co.), 4.50%, 3/1/30 | | $ | 1,605 | | | $ | 1,714,124 | |
Beaver County, PA, Industrial Development Authority, (FirstEnergy Nuclear Generation, LLC), 3.50% to 6/1/20 (Put Date), 12/1/35 | | | 3,050 | | | | 3,075,711 | |
Chula Vista, CA, (San Diego Gas and Electric), 5.875%, 2/15/34 | | | 3,520 | | | | 4,033,568 | |
Ohio Water Development Authority, (FirstEnergy Nuclear Generation, LLC), 4.00% to 6/3/19 (Put Date), 12/1/33 | | | 3,200 | | | | 3,293,024 | |
Pima County, AZ, Industrial Development Authority, (Tucson Electric Power Co.), 5.25%, 10/1/40 | | | 1,410 | | | | 1,549,830 | |
San Antonio, TX, (Electric and Gas Systems), 5.00%, 2/1/34(1) | | | 7,000 | | | | 7,707,980 | |
Utility Debt Securitization Authority, NY, 5.00%, 12/15/33 | | | 2,895 | | | | 3,377,539 | |
Vernon, CA, Electric System Revenue, 5.125%, 8/1/21 | | | 3,820 | | | | 4,227,823 | |
| | | | | | | | | |
| | | | | | $ | 28,979,599 | |
| | | | | | | | | |
|
Escrowed / Prerefunded — 6.2% | |
Foothill/Eastern Transportation Corridor Agency, CA, Escrowed to Maturity, 0.00%, 1/1/18 | | $ | 10,000 | | | $ | 9,858,200 | |
Idaho Bond Bank Authority, Prerefunded to 3/15/19, 5.25%, 9/15/25 | | | 330 | | | | 377,952 | |
Idaho Bond Bank Authority, Prerefunded to 3/15/19, 5.375%, 9/15/27 | | | 445 | | | | 511,550 | |
Idaho Health Facilities Authority, (Trinity Health Credit Group), Prerefunded to 12/1/18, 6.25%, 12/1/33 | | | 2,985 | | | | 3,485,047 | |
Savannah, GA, Economic Development Authority, Escrowed to Maturity, 0.00%, 12/1/21 | | | 6,000 | | | | 5,412,660 | |
| | | | | | | | |
| Security | | Principal Amount (000’s omitted) | | | Value | |
| | | | | | | | |
|
Escrowed / Prerefunded (continued) | |
Vernon, CA, Electric System Revenue, Prerefunded to 8/1/19, 5.125%, 8/1/21 | | $ | 1,685 | | | $ | 1,868,716 | |
| | | | | | | | | |
| | | | | | $ | 21,514,125 | |
| | | | | | | | | |
|
General Obligations — 14.8% | |
Beaverton School District 48J, Washington and Multnomah Counties, OR, 5.00%, 6/15/32 | | $ | 2,465 | | | $ | 2,879,342 | |
California, 5.00%, 10/1/24 | | | 960 | | | | 1,185,955 | |
California, 5.00%, 10/1/26 | | | 1,300 | | | | 1,576,601 | |
California, 5.00%, 10/1/27 | | | 630 | | | | 756,265 | |
California, 5.00%, 2/1/31 | | | 1,405 | | | | 1,619,726 | |
California, 5.25%, 10/1/29 | | | 560 | | | | 657,586 | |
California, 5.25%, 10/1/32 | | | 3,480 | | | | 4,048,284 | |
Foothill-De Anza Community College District, CA, 5.00%, 8/1/34 | | | 1,150 | | | | 1,344,821 | |
Foothill-De Anza Community College District, CA, 5.00%, 8/1/36 | | | 1,150 | | | | 1,336,035 | |
Honolulu City and County, HI, 5.00%, 10/1/31 | | | 4,425 | | | | 5,269,157 | |
Kane, Cook and DuPage Counties, IL, School District No. 46, 5.00%, 1/1/31 | | | 4,470 | | | | 5,018,290 | |
Maryland, 5.00%, 8/1/23 | | | 1,790 | | | | 2,204,170 | |
Oklahoma City, OK, 5.00%, 3/1/25 | | | 4,255 | | | | 5,327,388 | |
Salem-Keizer School District No. 24J, OR, 0.00%, 6/15/24 | | | 1,220 | | | | 981,685 | |
Santa Clara County, CA, (Election of 2008), 5.00%, 8/1/39(1)(2) | | | 7,700 | | | | 8,667,659 | |
Tuscaloosa, AL, 5.00%, 1/1/35 | | | 725 | | | | 827,428 | |
University of Connecticut, 5.00%, 2/15/32 | | | 650 | | | | 746,662 | |
Washington, 5.25%, 2/1/36(1) | | | 6,000 | | | | 6,935,220 | |
| | | | | | | | | |
| | | | | | $ | 51,382,274 | |
| | | | | | | | | |
|
Health Care – Miscellaneous — 0.1% | |
Tax Exempt Securities Trust, Community Health Provider, (Pooled Loan Program Various States Trust Certificates), 6.00%, 12/1/36(3) | | $ | 15 | | | $ | 15,341 | |
Tax Exempt Securities Trust, Community Health Provider, (Pooled Loan Program Various States Trust Certificates), Series 1, 5.50%, 12/1/36(3) | | | 53 | | | | 53,532 | |
Tax Exempt Securities Trust, Community Health Provider, (Pooled Loan Program Various States Trust Certificates), Series 2, 5.50%, 12/1/36(3) | | | 64 | | | | 64,515 | |
| | | | | | | | | |
| | | | | | $ | 133,388 | |
| | | | | | | | | |
|
Hospital — 14.5% | |
California Health Facilities Financing Authority, (Catholic Healthcare West), 5.25%, 3/1/28 | | $ | 535 | | | $ | 600,570 | |
California Health Facilities Financing Authority, (Providence Health System), 5.50%, 10/1/39 | | | 5,175 | | | | 5,902,657 | |
| | | | |
| | 10 | | See Notes to Financial Statements. |
Eaton Vance
AMT-Free Municipal Income Fund
September 30, 2015
Portfolio of Investments — continued
| | | | | | | | |
| Security | | Principal Amount (000’s omitted) | | | Value | |
| | | | | | | | |
|
Hospital (continued) | |
California Health Facilities Financing Authority, (St. Joseph Health System), 5.00%, 7/1/33 | | $ | 1,720 | | | $ | 1,951,202 | |
California Health Facilities Financing Authority, (St. Joseph Health System), 5.00%, 7/1/37 | | | 2,300 | | | | 2,583,820 | |
California Health Facilities Financing Authority, (Sutter Health), 5.25%, 8/15/31 | | | 1,325 | | | | 1,543,373 | |
California Statewide Communities Development Authority, (John Muir Health), 5.00%, 7/1/29 | | | 1,330 | | | | 1,473,015 | |
California Statewide Communities Development Authority, (Loma Linda University Medical Center), 5.25%, 12/1/34 | | | 3,000 | | | | 3,180,060 | |
Henrico County, VA, Economic Development Authority, (Bon Secours Health System, Inc.), 5.00%, 11/1/30 | | | 1,185 | | | | 1,324,427 | |
Illinois Finance Authority, (Provena Healthcare), 7.75%, 8/15/34 | | | 7,120 | | | | 8,633,000 | |
Kansas Development Finance Authority, (Adventist Health System), 5.75%, 11/15/38 | | | 5,230 | | | | 5,969,260 | |
Massachusetts Development Finance Agency, (Children’s Hospital), 5.00%, 10/1/31 | | | 2,110 | | | | 2,440,785 | |
Massachusetts Development Finance Agency, (Tufts Medical Center), 6.75%, 1/1/36 | | | 785 | | | | 923,898 | |
New York Dormitory Authority, (Orange Regional Medical Center), 6.25%, 12/1/37 | | | 3,380 | | | | 3,698,869 | |
Oklahoma Development Finance Authority, (St. John Health System), 5.00%, 2/15/34 | | | 2,035 | | | | 2,249,591 | |
Oneida County, NY, Industrial Development Agency, (St. Elizabeth Medical Center), 5.75%, 12/1/19 | | | 1,060 | | | | 1,062,586 | |
Orange County, FL, Health Facilities Authority, (Orlando Health, Inc.), 5.375%, 10/1/23 | | | 1,000 | | | | 1,133,850 | |
Tarrant County Cultural Education Facilities Finance Corp., TX, (Cook Children’s Medical Center), 5.25%, 12/1/39(1) | | | 5,000 | | | | 5,712,200 | |
| | | | | | | | | |
| | | | | | $ | 50,383,163 | |
| | | | | | | | | |
|
Housing — 0.1% | |
Texas Student Housing Corp., (University of North Texas), 9.375%, 7/1/06(4) | | $ | 285 | | | $ | 227,989 | |
| | | | | | | | | |
| | | | | | $ | 227,989 | |
| | | | | | | | | |
|
Industrial Development Revenue — 0.9% | |
Hardeman County Correctional Facilities Corp., TN, 7.75%, 8/1/17 | | $ | 240 | | | $ | 239,969 | |
Selma, AL, Industrial Development Board, (International Paper Co.), 5.80%, 5/1/34 | | | 2,670 | | | | 2,978,438 | |
| | | | | | | | | |
| | | | | | $ | 3,218,407 | |
| | | | | | | | | |
| | | | | | | | |
| Security | | Principal Amount (000’s omitted) | | | Value | |
| | | | | | | | |
|
Insured – Education — 0.6% | |
Virginia College Building Authority, (Washington and Lee University), (NPFG), 5.25%, 1/1/31 | | $ | 1,750 | | | $ | 2,116,415 | |
| | | | | | | | | |
| | | | | | $ | 2,116,415 | |
| | | | | | | | | |
|
Insured – Electric Utilities — 2.3% | |
Long Island Power Authority, NY, Electric System Revenue, (BHAC), 5.75%, 4/1/33 | | $ | 5,415 | | | $ | 6,192,540 | |
Ohio Municipal Electric Generation Agency, (NPFG), 0.00%, 2/15/29 | | | 2,865 | | | | 1,809,591 | |
| | | | | | | | | |
| | | | | | $ | 8,002,131 | |
| | | | | | | | | |
|
Insured – Escrowed / Prerefunded — 0.4% | |
Texas Transportation Commission, (Central Texas Turnpike System), (AMBAC), Escrowed to Maturity, 0.00%, 8/15/21 | | $ | 1,560 | | | $ | 1,416,308 | |
| | | | | | | | | |
| | | | | | $ | 1,416,308 | |
| | | | | | | | | |
|
Insured – General Obligations — 1.0% | |
Chicago, IL, (AGM), 5.25%, 1/1/31 | | $ | 1,900 | | | $ | 1,975,943 | |
Chicago Park District, IL, (BAM), 5.00%, 1/1/29 | | | 475 | | | | 513,978 | |
Yuma and La Paz Counties, AZ, Community College District, (Arizona Western College), (NPFG), 3.75%, 7/1/31 | | | 985 | | | | 989,620 | |
| | | | | | | | | |
| | | | | | $ | 3,479,541 | |
| | | | | | | | | |
|
Insured – Lease Revenue / Certificates of Participation — 1.3% | |
Anaheim, CA, Public Financing Authority, (Anaheim Public Improvements), (AGM), 0.00%, 9/1/31 | | $ | 8,680 | | | $ | 4,566,895 | |
| | | | | | | | | |
| | | | | | $ | 4,566,895 | |
| | | | | | | | | |
|
Insured – Other Revenue — 1.3% | |
Harris County-Houston Sports Authority, TX, (AGM), (NPFG), 0.00%, 11/15/34 | | $ | 10,600 | | | $ | 4,467,370 | |
| | | | | | | | | |
| | | | | | $ | 4,467,370 | |
| | | | | | | | | |
|
Insured – Special Tax Revenue — 5.6% | |
Alabama Public School and College Authority, (AGM), 2.50%, 12/1/27 | | $ | 5,930 | | | $ | 5,767,399 | |
Massachusetts, Special Obligation, Dedicated Tax Revenue, (NPFG), 5.50%, 1/1/27 | | | 6,000 | | | | 7,574,040 | |
Massachusetts, Special Obligation, Dedicated Tax Revenue, (NPFG), 5.50%, 1/1/30 | | | 2,565 | | | | 3,259,525 | |
Puerto Rico Sales Tax Financing Corp., (NPFG), 0.00%, 8/1/45 | | | 6,245 | | | | 965,789 | |
Puerto Rico Sales Tax Financing Corp., (NPFG), 0.00%, 8/1/46 | | | 12,295 | | | | 1,786,095 | |
| | | | | | | | | |
| | | | | | $ | 19,352,848 | |
| | | | | | | | | |
| | | | |
| | 11 | | See Notes to Financial Statements. |
Eaton Vance
AMT-Free Municipal Income Fund
September 30, 2015
Portfolio of Investments — continued
| | | | | | | | |
| Security | | Principal Amount (000’s omitted) | | | Value | |
| | | | | | | | |
|
Insured – Transportation — 3.3% | |
Chicago, IL, (O’Hare International Airport), (AGM), 5.00%, 1/1/28 | | $ | 1,000 | | | $ | 1,135,030 | |
Chicago, IL, (O’Hare International Airport), (AGM), 5.125%, 1/1/31 | | | 1,000 | | | | 1,126,080 | |
Chicago, IL, (O’Hare International Airport), (AGM), 5.25%, 1/1/32 | | | 785 | | | | 887,301 | |
E-470 Public Highway Authority, CO, (NPFG), 0.00%, 9/1/39 | | | 7,120 | | | | 2,339,490 | |
New Orleans, LA, Aviation Board, (AGC), 6.00%, 1/1/23 | | | 1,040 | | | | 1,183,031 | |
Texas Transportation Commission, (Central Texas Turnpike System), (AMBAC), 0.00%, 8/15/21 | | | 5,285 | | | | 4,671,042 | |
| | | | | | | | | |
| | | | | | $ | 11,341,974 | |
| | | | | | | | | |
|
Insured – Water and Sewer — 3.4% | |
Chicago, IL, Wastewater Transmission Revenue, (BHAC), 5.50%, 1/1/38 | | $ | 4,155 | | | $ | 4,454,617 | |
Detroit, MI, Sewage Disposal System, (AGM), 5.00%, 7/1/39 | | | 4,825 | | | | 5,160,772 | |
Michigan Finance Authority, (Detroit Water and Sewerage Department), (AGM), 5.00%, 7/1/32 | | | 655 | | | | 729,533 | |
Michigan Finance Authority, (Detroit Water and Sewerage Department), (AGM), 5.00%, 7/1/33 | | | 565 | | | | 629,291 | |
Michigan Finance Authority, (Detroit Water and Sewerage Department), (AGM), 5.00%, 7/1/35 | | | 280 | | | | 306,989 | |
Michigan Finance Authority, (Detroit Water and Sewerage Department), (AGM), 5.00%, 7/1/37 | | | 565 | | | | 616,370 | |
| | | | | | | | | |
| | | | | | $ | 11,897,572 | |
| | | | | | | | | |
|
Other Revenue — 5.6% | |
Brooklyn Arena Local Development Corp., NY, (Barclays Center), 6.00%, 7/15/30 | | $ | 880 | | | $ | 999,574 | |
Brooklyn Arena Local Development Corp., NY, (Barclays Center), 6.25%, 7/15/40 | | | 1,320 | | | | 1,504,602 | |
Central Falls Detention Facility Corp., RI, 7.25%, 7/15/35(5) | | | 1,200 | | | | 298,896 | |
Mohegan Tribe of Indians Gaming Authority, CT, (Public Improvements), 6.25%, 1/1/21(3) | | | 1,000 | | | | 1,000,000 | |
New York, NY, Transitional Finance Authority, (Building Aid), 6.00%, 7/15/38 | | | 7,250 | | | | 8,161,977 | |
Otero County, NM, Jail Project Revenue, 5.75%, 4/1/18 | | | 345 | | | | 341,295 | |
Salt Verde Financial Corp., AZ, Senior Gas Revenue, 5.00%, 12/1/37 | | | 3,485 | | | | 3,889,818 | |
Seminole Tribe, FL, 5.50%, 10/1/24(3) | | | 1,150 | | | | 1,216,482 | |
White Earth Band of Chippewa Indians, MN, 6.375%, 12/1/26(3) | | | 2,070 | | | | 2,127,339 | |
| | | | | | | | | |
| | | | | | $ | 19,539,983 | |
| | | | | | | | | |
| | | | | | | | |
| Security | | Principal Amount (000’s omitted) | | | Value | |
| | | | | | | | |
|
Senior Living / Life Care — 3.8% | |
Fairfax County, VA, Economic Development Authority, (Goodwin House, Inc.), 5.125%, 10/1/37 | | $ | 1,595 | | | $ | 1,661,352 | |
Fairfax County, VA, Economic Development Authority, (Goodwin House, Inc.), 5.125%, 10/1/42 | | | 2,255 | | | | 2,343,464 | |
Kansas City, MO, Industrial Development Authority, (Kingswood United Methodist Manor), 5.875%, 11/15/29 | | | 1,480 | | | | 1,462,418 | |
Maryland Health and Higher Educational Facilities Authority, (Charlestown Community, Inc.), 6.125%, 1/1/30 | | | 1,650 | | | | 1,838,892 | |
North Miami, FL, (Imperial Club), 6.125%, 1/1/42(5) | | | 1,480 | | | | 1,058,096 | |
Palm Beach County Health Facilities Authority, FL, (Sinai Residences of Boca Raton), 7.25%, 6/1/39 | | | 570 | | | | 652,222 | |
Palm Beach County Health Facilities Authority, FL, (Sinai Residences of Boca Raton), 7.50%, 6/1/49 | | | 2,690 | | | | 3,112,518 | |
Tempe, AZ, Industrial Development Authority, (Friendship Village of Tempe), 6.00%, 12/1/32 | | | 160 | | | | 173,330 | |
Tempe, AZ, Industrial Development Authority, (Friendship Village of Tempe), 6.25%, 12/1/42 | | | 660 | | | | 716,390 | |
| | | | | | | | | |
| | | | | | $ | 13,018,682 | |
| | | | | | | | | |
|
Special Tax Revenue — 3.0% | |
Bridgeville, DE, (Heritage Shores Special Development District), 5.45%, 7/1/35 | | $ | 1,084 | | | $ | 1,084,195 | |
Jurupa Public Financing Authority, CA, 5.00%, 9/1/31 | | | 1,200 | | | | 1,351,548 | |
New York, NY, Transitional Finance Authority, Future Tax Revenue, 3.50%, 8/1/38 | | | 740 | | | | 729,181 | |
Puerto Rico Sales Tax Financing Corp., 5.00%, 8/1/40 | | | 2,340 | | | | 1,460,651 | |
River Hall Community Development District, FL, (Capital Improvements), 5.45%, 5/1/36 | | | 1,095 | | | | 1,094,902 | |
Successor Agency to La Quinta Redevelopment Agency, CA, 5.00%, 9/1/30 | | | 4,125 | | | | 4,790,858 | |
| | | | | | | | | |
| | | | | | $ | 10,511,335 | |
| | | | | | | | | |
|
Transportation — 21.2% | |
Central Texas Regional Mobility Authority, 5.75%, 1/1/31 | | $ | 415 | | | $ | 473,743 | |
Dallas and Fort Worth, TX, (Dallas/Fort Worth International Airport), 5.25%, 11/1/30 | | | 1,100 | | | | 1,283,381 | |
Dallas and Fort Worth, TX, (Dallas/Fort Worth International Airport), 5.25%, 11/1/31 | | | 1,455 | | | | 1,693,009 | |
Delaware River Port Authority of Pennsylvania and New Jersey, 5.00%, 1/1/31 | | | 1,150 | | | | 1,318,797 | |
Grand Parkway Transportation Corp., TX, 5.125%, 10/1/43 | | | 1,100 | | | | 1,191,630 | |
Metropolitan Transportation Authority, NY, 5.00%, 11/15/28 | | | 5,015 | | | | 5,931,341 | |
Metropolitan Transportation Authority, NY, 6.25%, 11/15/23 | | | 2,250 | | | | 2,617,785 | |
Metropolitan Transportation Authority, NY, 6.50%, 11/15/28 | | | 5,000 | | | | 5,852,400 | |
Miami-Dade County, FL, Aviation Revenue, 5.00%, 10/1/33 | | | 6,450 | | | | 7,303,400 | |
New Jersey Transportation Trust Fund Authority, (Transportation System), 6.00%, 12/15/38 | | | 4,075 | | | | 4,436,942 | |
| | | | |
| | 12 | | See Notes to Financial Statements. |
Eaton Vance
AMT-Free Municipal Income Fund
September 30, 2015
Portfolio of Investments — continued
| | | | | | | | |
| Security | | Principal Amount (000’s omitted) | | | Value | |
| | | | | | | | |
|
Transportation (continued) | |
New Jersey Turnpike Authority, 5.00%, 1/1/30 | | $ | 3,060 | | | $ | 3,477,506 | |
New York Liberty Development Corp., (4 World Trade Center), 5.00%, 11/15/31 | | | 745 | | | | 845,612 | |
Pennsylvania Turnpike Commission, 6.375%, (0.00% until 12/1/17), 12/1/38 | | | 11,500 | | | | 12,706,005 | |
San Joaquin Hills Transportation Corridor Agency, CA, 5.00%, 1/15/34 | | | 5,235 | | | | 5,673,588 | |
Texas Private Activity Bond Surface Transportation Corp., (LBJ Express Managed Lanes Project), 7.00%, 6/30/34 | | | 3,500 | | | | 4,175,115 | |
Texas Private Activity Bond Surface Transportation Corp., (North Tarrant Express Managed Lanes Project), 6.875%, 12/31/39 | | | 2,980 | | | | 3,487,345 | |
Triborough Bridge and Tunnel Authority, NY, 5.25%, 11/15/34(1) | | | 10,000 | | | | 11,175,100 | |
| | | | | | | | | |
| | | | | | $ | 73,642,699 | |
| | | | | | | | | |
|
Water and Sewer — 2.2% | |
New York, NY, Municipal Water Finance Authority, (Water and Sewer System), 5.75%, 6/15/40(1)(2) | | $ | 6,855 | | | $ | 7,664,301 | |
| | | | | | | | | |
| | | | | | $ | 7,664,301 | |
| | | | | | | | | |
| |
Total Tax-Exempt Investments — 109.1%
(identified cost $341,880,986) | | | $ | 378,256,675 | |
| | | | | | | | | |
| |
Other Assets, Less Liabilities — (9.1)% | | | $ | (31,407,609 | ) |
| | | | | | | | | |
| |
Net Assets — 100.0% | | | $ | 346,849,066 | |
| | | | | | | | | |
The percentage shown for each investment category in the Portfolio of Investments is based on net assets.
| | | | |
| AGC | | – | | Assured Guaranty Corp. |
| AGM | | – | | Assured Guaranty Municipal Corp. |
| AMBAC | | – | | AMBAC Financial Group, Inc. |
| BAM | | – | | Build America Mutual Assurance Co. |
| BHAC | | – | | Berkshire Hathaway Assurance Corp. |
| NPFG | | – | | National Public Finance Guaranty Corp. |
At September 30, 2015, the concentration of the Fund’s investments in the various states and territories, determined as a percentage of net assets, is as follows:
| | | | |
| California | | | 22.8% | |
| New York | | | 20.5% | |
| Texas | | | 10.5% | |
| Others, representing less than 10% individually | | | 55.3% | |
The Fund invests primarily in debt securities issued by municipalities. The ability of the issuers of the debt securities to meet their obligations may be affected by economic developments in a specific industry or municipality. In order to reduce the risk associated with such economic developments, at September 30, 2015, 17.6% of total investments are backed by bond insurance of various financial institutions and financial guaranty assurance agencies. The aggregate percentage insured by an individual financial institution or financial guaranty assurance agency ranged from 0.1% to 7.2% of total investments.
| (1) | Security represents the municipal bond held by a trust that issues residual interest bonds (see Note 1I). |
| (2) | Security (or a portion thereof) has been pledged as collateral for residual interest bond transactions. The aggregate value of such collateral is $5,986,960. |
| (3) | Security exempt from registration pursuant to Rule 144A under the Securities Act of 1933. These securities may be sold in certain transactions (normally to qualified institutional buyers) and remain exempt from registration. At September 30, 2015, the aggregate value of these securities is $4,477,209 or 1.3% of the Fund’s net assets. |
| (4) | The issuer is in default on the payment of principal but continues to pay interest. |
| (5) | Security is in default and making only partial interest payments. |
| | | | |
| | 13 | | See Notes to Financial Statements. |
Eaton Vance
National Municipal Income Fund
September 30, 2015
Portfolio of Investments
| | | | | | | | |
| Tax-Exempt Municipal Securities — 106.2% | |
| | |
| | | | | | | | |
| Security | | Principal Amount (000’s omitted) | | | Value | |
| | | | | | | | |
|
Bond Bank — 1.9% | |
Connecticut, (State Revolving Fund), 5.00%, 3/1/28 | | $ | 12,960 | | | $ | 15,652,051 | |
Oklahoma Water Resources Board, 5.25%, 4/1/36 | | | 14,165 | | | | 16,163,823 | |
Rickenbacker Port Authority, OH, (OASBO Expanded Asset Pooled Financing Program), 5.375%, 1/1/32 | | | 27,115 | | | | 28,858,495 | |
| | | | | | | | | |
| | | | | | $ | 60,674,369 | |
| | | | | | | | | |
|
Cogeneration — 0.4% | |
Northampton County, PA, Industrial Development Authority, (Northampton Generating), 5.00%, 12/31/23(1) | | $ | 14,652 | | | $ | 13,308,844 | |
| | | | | | | | | |
| | | | | | $ | 13,308,844 | |
| | | | | | | | | |
|
Education — 5.9% | |
Missouri Health and Educational Facilities Authority, (Washington University), 5.375%, 3/15/39(2) | | $ | 45,615 | | | $ | 49,765,509 | |
New Jersey Educational Facilities Authority, (Princeton University), 5.00%, 7/1/22 | | | 13,720 | | | | 16,670,212 | |
New York Dormitory Authority, (Columbia University), 5.00%, 10/1/25 | | | 3,500 | | | | 4,448,535 | |
New York Dormitory Authority, (State University), 5.00%, 7/1/27 | | | 5,000 | | | | 6,018,200 | |
New York Dormitory Authority, (State University), 5.00%, 7/1/28 | | | 2,500 | | | | 2,981,775 | |
North Carolina State University at Raleigh, 5.00%, 10/1/37 | | | 8,620 | | | | 9,838,523 | |
Oregon Facilities Authority, (Lewis & Clark College), 5.625%, 10/1/36 | | | 9,930 | | | | 11,757,617 | |
Rutgers State University, NJ, 5.00%, 5/1/43(2)(3) | | | 37,000 | | | | 41,137,340 | |
University of California, 5.25%, 5/15/36 | | | 7,080 | | | | 8,376,914 | |
University of California, 5.25%, 5/15/37 | | | 13,000 | | | | 15,326,870 | |
University of California, 5.25%, 5/15/38 | | | 7,700 | | | | 9,007,768 | |
University of Virginia, 5.00%, 8/1/21 | | | 10,650 | | | | 12,786,922 | |
| | | | | | | | | |
| | | | | | $ | 188,116,185 | |
| | | | | | | | | |
|
Electric Utilities — 8.1% | |
Hawaii Department of Budget and Finance, (Hawaiian Electric Co.), 6.50%, 7/1/39 | | $ | 8,600 | | | $ | 9,788,090 | |
Ohio Water Development Authority, (FirstEnergy Nuclear Generation, LLC), (AMT), 3.95% to 5/1/20 (Put Date), 11/1/32 | | | 8,000 | | | | 8,090,160 | |
Omaha, NE, Public Power District, 5.00%, 2/1/31 | | | 14,255 | | | | 16,694,316 | |
Omaha, NE, Public Power District, 5.00%, 2/1/39 | | | 12,155 | | | | 13,908,237 | |
Public Power Generation Agency, NE, (Whelan Energy Center Unit 2), 5.00%, 1/1/28 | | | 6,815 | | | | 7,867,168 | |
Public Power Generation Agency, NE, (Whelan Energy Center Unit 2), 5.00%, 1/1/31 | | | 7,040 | | | | 7,963,296 | |
| | | | | | | | |
| Security | | Principal Amount (000’s omitted) | | | Value | |
| | | | | | | | |
|
Electric Utilities (continued) | |
San Antonio, TX, (Electric and Gas Systems), 5.00%, 2/1/34(2) | | $ | 41,100 | | | $ | 45,256,854 | |
Unified Government of Wyandotte County/Kansas City, KS, Board of Public Utilities, 5.00%, 9/1/32 | | | 10,000 | | | | 11,261,000 | |
Utility Debt Securitization Authority, NY, 5.00%, 12/15/30 | | | 5,960 | | | | 7,049,607 | |
Utility Debt Securitization Authority, NY, 5.00%, 12/15/30(2) | | | 22,500 | | | | 26,613,450 | |
Utility Debt Securitization Authority, NY, 5.00%, 12/15/31(2) | | | 27,500 | | | | 32,349,075 | |
Utility Debt Securitization Authority, NY, 5.00%, 12/15/41(2) | | | 26,600 | | | | 30,360,974 | |
Vernon, CA, Electric System Revenue, 5.125%, 8/1/21 | | | 35,640 | | | | 39,444,926 | |
| | | | | | | | | |
| | | | | | $ | 256,647,153 | |
| | | | | | | | | |
|
Escrowed / Prerefunded — 0.7% | |
Bexar County Health Facilities Development Corp., TX, (St. Luke’s Lutheran Hospital), Escrowed to Maturity, 7.00%, 5/1/21 | | $ | 2,400 | | | $ | 2,922,672 | |
Puerto Rico Electric Power Authority, Escrowed to Maturity, 0.00%, 7/1/17 | | | 1,450 | | | | 1,377,834 | |
Tarrant County Cultural Education Facilities Finance Corp., TX, (Scott & White Healthcare), Prerefunded to 8/15/20, 5.25%, 8/15/40 | | | 1,000 | | | | 1,178,620 | |
Vernon, CA, Electric System Revenue, Prerefunded to 8/1/19, 5.125%, 8/1/21 | | | 15,735 | | | | 17,450,587 | |
| | | | | | | | | |
| | | | | | $ | 22,929,713 | |
| | | | | | | | | |
|
General Obligations — 19.0% | |
Alabama, 5.00%, 8/1/24(2)(3) | | $ | 22,260 | | | $ | 27,670,738 | |
California, 5.00%, 8/1/22 | | | 12,400 | | | | 14,953,904 | |
California, 5.00%, 10/1/24 | | | 9,755 | | | | 12,051,034 | |
California, 5.00%, 3/1/25 | | | 20,000 | | | | 24,750,800 | |
California, 5.00%, 3/1/26 | | | 20,000 | | | | 24,509,000 | |
California, 5.00%, 2/1/31 | | | 17,595 | | | | 20,284,044 | |
Honolulu City and County, HI, 5.00%, 10/1/31 | | | 8,265 | | | | 9,841,714 | |
Illinois, 5.00%, 5/1/26 | | | 24,650 | | | | 26,358,245 | |
Illinois, 5.25%, 7/1/30 | | | 9,840 | | | | 10,344,103 | |
Kane, Cook and DuPage Counties, IL, School District No. 46, 5.00%, 1/1/29 | | | 2,620 | | | | 2,971,735 | |
Kane, Cook and DuPage Counties, IL, School District No. 46, 5.00%, 1/1/30 | | | 4,105 | | | | 4,627,484 | |
Klein Independent School District, TX, (PSF Guaranteed), 5.00%, 2/1/36 | | | 14,180 | | | | 16,176,686 | |
Maryland, 5.00%, 8/1/23 | | | 17,150 | | | | 21,118,167 | |
Massachusetts, 5.00%, 7/1/35 | | | 10,000 | | | | 11,707,500 | |
Massachusetts, 5.00%, 7/1/36 | | | 18,080 | | | | 21,100,445 | |
| | | | |
| | 14 | | See Notes to Financial Statements. |
Eaton Vance
National Municipal Income Fund
September 30, 2015
Portfolio of Investments — continued
| | | | | | | | |
| Security | | Principal Amount (000’s omitted) | | | Value | |
| | | | | | | | |
|
General Obligations (continued) | |
Mississippi, Series 2015A, 5.00%, 10/1/27 | | $ | 11,475 | | | $ | 13,999,959 | |
Mississippi, Series 2015C, 5.00%, 10/1/27 | | | 14,190 | | | | 17,312,368 | |
New Hampshire, 5.00%, 3/1/26 | | | 3,000 | | | | 3,719,310 | |
Newton, MA, 5.00%, 4/1/39 | | | 3,210 | | | | 3,586,758 | |
North Carolina, 5.00%, 6/1/22 | | | 10,000 | | | | 12,133,900 | |
Port of Houston Authority of Harris County, TX, (AMT), 5.625%, 10/1/38 | | | 10,000 | | | | 11,083,000 | |
Port of Houston Authority of Harris County, TX, (AMT), 5.625%, 10/1/38(2) | | | 41,620 | | | | 46,127,446 | |
Santa Clara County, CA, (Election of 2008), 5.00%, 8/1/39(2)(3) | | | 57,400 | | | | 64,613,458 | |
Seward County, KS, Unified School District No. 480, 5.00%, 9/1/33 | | | 10,000 | | | | 11,168,300 | |
Texas, (Texas Transportation Commission), 5.00%, 10/1/25(2)(3) | | | 30,800 | | | | 37,581,236 | |
Virginia, 5.00%, 6/1/21 | | | 14,680 | | | | 17,547,885 | |
Virginia, 5.00%, 6/1/22 | | | 14,980 | | | | 18,176,582 | |
Washington, Series 2011B, 5.00%, 2/1/33 | | | 20,000 | | | | 22,883,400 | |
Washington, Series 2014D, 5.00%, 2/1/33 | | | 21,325 | | | | 24,551,046 | |
West Linn-Wilsonville School District No. 3Jt, Clackamas and Washington Counties, OR, 5.00%, 6/15/27 | | | 14,820 | | | | 18,084,105 | |
Will County, IL, Community Unit School District No. 365-U, (Valley View), 5.75%, 11/1/31 | | | 12,995 | | | | 15,118,253 | |
Wisconsin, 5.00%, 5/1/35 | | | 16,500 | | | | 18,868,080 | |
| | | | | | | | | |
| | | | | | $ | 605,020,685 | |
| | | | | | | | | |
|
Health Care – Miscellaneous — 0.0%(4) | |
Tax Exempt Securities Trust, Community Health Provider, (Pooled Loan Program Various States Trust Certificates), 5.50%, 12/1/36(5) | | $ | 88 | | | $ | 88,902 | |
Tax Exempt Securities Trust, Community Health Provider, (Pooled Loan Program Various States Trust Certificates), 5.875%, 12/1/36(5) | | | 94 | | | | 94,382 | |
| | | | | | | | | |
| | | | | | $ | 183,284 | |
| | | | | | | | | |
|
Hospital — 8.0% | |
California Health Facilities Financing Authority, (Catholic Healthcare West), 5.25%, 3/1/28 | | $ | 5,700 | | | $ | 6,398,592 | |
California Health Facilities Financing Authority, (Providence Health System), 5.50%, 10/1/39(2)(3) | | | 36,700 | | | | 41,860,387 | |
California Health Facilities Financing Authority, (St. Joseph Health System), 5.00%, 7/1/33 | | | 17,530 | | | | 19,886,383 | |
California Health Facilities Financing Authority, (St. Joseph Health System), 5.00%, 7/1/37 | | | 25,465 | | | | 28,607,381 | |
California Health Facilities Financing Authority, (Sutter Health), 5.25%, 8/15/31 | | | 13,675 | | | | 15,928,777 | |
| | | | | | | | |
| Security | | Principal Amount (000’s omitted) | | | Value | |
| | | | | | | | |
|
Hospital (continued) | |
Illinois Finance Authority, (Provena Healthcare), 7.75%, 8/15/34 | | $ | 30,000 | | | $ | 36,375,000 | |
Illinois Finance Authority, (Rush University Medical Center), 5.00%, 11/15/34 | | | 5,000 | | | | 5,511,500 | |
Kansas Development Finance Authority, (Adventist Health System/Sunbelt Obligated Group), 5.00%, 11/15/32 | | | 9,975 | | | | 11,152,549 | |
Massachusetts Development Finance Agency, (Tufts Medical Center), 6.75%, 1/1/36 | | | 7,510 | | | | 8,838,819 | |
Missouri Health and Educational Facilities Authority, (SSM Health Care), 5.00%, 6/1/30 | | | 7,505 | | | | 8,584,519 | |
Southwestern Illinois Development Authority, (Memorial Group, Inc.), 7.25%, 11/1/33 | | | 9,170 | | | | 11,669,650 | |
Tarrant County Cultural Education Facilities Finance Corp., TX, (Scott & White Healthcare), 5.25%, 8/15/40 | | | 12,500 | | | | 13,976,750 | |
Washington Township Health Care District, 6.25%, 7/1/39 | | | 16,675 | | | | 18,939,298 | |
West Virginia Hospital Finance Authority, (West Virginia United Health System Obligated Group), 5.375%, 6/1/38 | | | 25,140 | | | | 28,150,767 | |
| | | | | | | | | |
| | | | | | $ | 255,880,372 | |
| | | | | | | | | |
|
Housing — 1.2% | |
Connecticut Housing Finance Authority, (SPA: JPMorgan Chase Bank, N.A.), 0.01%, 5/15/39(6) | | $ | 15,650 | | | $ | 15,650,000 | |
Texas Student Housing Corp., (University of Northern Texas), 6.85%, 7/1/31 | | | 10,640 | | | | 10,413,261 | |
Virginia Housing Development Authority, (AMT), 5.10%, 10/1/35 | | | 11,070 | | | | 11,329,149 | |
| | | | | | | | | |
| | | | | | $ | 37,392,410 | |
| | | | | | | | | |
|
Industrial Development Revenue — 3.1% | |
Amelia County, VA, Industrial Development Authority, (Waste Management, Inc.), (AMT), 2.125% to 4/1/20 (Put Date), 4/1/27 | | $ | 8,155 | | | $ | 8,153,287 | |
Cleveland, OH, (Continental Airlines), (AMT), 5.70%, 12/1/19 | | | 870 | | | | 877,447 | |
Denver City and County, CO, (United Airlines), (AMT), 5.25%, 10/1/32 | | | 12,360 | | | | 12,763,925 | |
Denver City and County, CO, (United Airlines), (AMT), 5.75%, 10/1/32 | | | 19,755 | | | | 20,585,698 | |
Hardeman County Correctional Facilities Corp., TN, 7.75%, 8/1/17 | | | 1,670 | | | | 1,669,783 | |
Metropolitan Nashville Airport Authority, TN, (Aero Nashville), 5.20%, 7/1/26 | | | 420 | | | | 452,000 | |
New Jersey Economic Development Authority, (New Jersey-American Water Co., Inc.), (AMT), 5.70%, 10/1/39 | | | 28,150 | | | | 31,963,762 | |
Pennsylvania Economic Development Financing Authority, (PPL Energy Supply, LLC), 5.00% to 9/1/20 (Put Date), 12/1/37 | | | 20,620 | | | | 20,856,511 | |
| | | | |
| | 15 | | See Notes to Financial Statements. |
Eaton Vance
National Municipal Income Fund
September 30, 2015
Portfolio of Investments — continued
| | | | | | | | |
| Security | | Principal Amount (000’s omitted) | | | Value | |
| | | | | | | | |
|
Industrial Development Revenue (continued) | |
Wickliffe, KY, (Westvaco Corp.), (AMT), 6.375%, 4/1/26 | | $ | 1,070 | | | $ | 1,070,589 | |
| | | | | | | | | |
| | | | | | $ | 98,393,002 | |
| | | | | | | | | |
|
Insured – Education — 0.1% | |
Metropolitan Government of Nashville and Davidson County, TN, Health and Educational Facilities Board, (Meharry Medical College), (AMBAC), 6.00%, 12/1/19 | | $ | 1,230 | | | $ | 1,316,703 | |
New Jersey Educational Facilities Authority, (Kean University), (AGM), 5.00%, 7/1/27 | | | 2,780 | | | | 3,234,252 | |
| | | | | | | | | |
| | | | | | $ | 4,550,955 | |
| | | | | | | | | |
|
Insured – Electric Utilities — 0.3% | |
Puerto Rico Electric Power Authority, (BHAC), (FGIC), (NPFG), 5.25%, 7/1/24 | | $ | 400 | | | $ | 477,136 | |
Puerto Rico Electric Power Authority, (NPFG), 5.25%, 7/1/29 | | | 1,315 | | | | 1,253,563 | |
Puerto Rico Electric Power Authority, (NPFG), 5.25%, 7/1/30 | | | 8,385 | | | | 7,935,145 | |
Puerto Rico Electric Power Authority, (NPFG), 5.25%, 7/1/34 | | | 830 | | | | 760,056 | |
Puerto Rico Electric Power Authority, (NPFG), 5.25%, 7/1/35 | | | 165 | | | | 150,313 | |
| | | | | | | | | |
| | | | | | $ | 10,576,213 | |
| | | | | | | | | |
|
Insured – General Obligations — 0.5% | |
Chicago, IL, (AGM), 5.25%,��1/1/31 | | $ | 7,600 | | | $ | 7,903,772 | |
Chicago Park District, IL, (BAM), 5.00%, 1/1/29 | | | 4,525 | | | | 4,896,321 | |
Puerto Rico Public Buildings Authority, (AMBAC), 5.50%, 7/1/21 | | | 1,605 | | | | 1,545,535 | |
| | | | | | | | | |
| | | | | | $ | 14,345,628 | |
| | | | | | | | | |
|
Insured – Hospital — 0.7% | |
Maryland Health and Higher Educational Facilities Authority, (LifeBridge Health), (AGC), 4.75%, 7/1/47(2) | | $ | 7,800 | | | $ | 7,999,290 | |
Medford, OR, Hospital Facilities Authority, (Asante Health System), (AGM), 5.50%, 8/15/28 | | | 12,000 | | | | 13,713,360 | |
| | | | | | | | | |
| | | | | | $ | 21,712,650 | |
| | | | | | | | | |
|
Insured – Lease Revenue / Certificates of Participation — 0.0%(4) | |
Puerto Rico Public Finance Corp., (AMBAC), Escrowed to Maturity, 5.50%, 8/1/27 | | $ | 770 | | | $ | 1,019,326 | |
Puerto Rico Public Finance Corp., (AMBAC), Escrowed to Maturity, 5.50%, 8/1/27 | | | 330 | | | | 436,854 | |
| | | | | | | | | |
| | | | | | $ | 1,456,180 | |
| | | | | | | | | |
| | | | | | | | |
| Security | | Principal Amount (000’s omitted) | | | Value | |
| | | | | | | | |
|
Insured – Other Revenue — 1.7% | |
Harris County-Houston Sports Authority, TX, (AGM), (NPFG), 0.00%, 11/15/34 | | $ | 68,155 | | | $ | 28,723,925 | |
Harris County-Houston Sports Authority, TX, (NPFG), 0.00%, 11/15/41 | | | 25,000 | | | | 6,242,500 | |
New York, NY, Industrial Development Agency, (Queens Baseball Stadium), (AGC), 6.375%, 1/1/39 | | | 11,725 | | | | 13,352,078 | |
New York, NY, Industrial Development Agency, (Queens Baseball Stadium), (AGC), 6.50%, 1/1/46 | | | 6,085 | | | | 6,955,337 | |
| | | | | | | | | |
| | | | | | $ | 55,273,840 | |
| | | | | | | | | |
|
Insured – Special Tax Revenue — 2.9% | |
Massachusetts, Special Obligation, Dedicated Tax Revenue, (NPFG), 5.50%, 1/1/29 | | $ | 11,000 | | | $ | 13,960,760 | |
Massachusetts, Special Obligation, Dedicated Tax Revenue, (NPFG), 5.50%, 1/1/30 | | | 3,080 | | | | 3,913,971 | |
Puerto Rico Infrastructure Financing Authority, (AMBAC), 0.00%, 7/1/44 | | | 4,450 | | | | 496,442 | |
Puerto Rico Infrastructure Financing Authority, (AMBAC), 5.50%, 7/1/28 | | | 1,000 | | | | 880,470 | |
Puerto Rico Sales Tax Financing Corp., (NPFG), 0.00%, 8/1/44 | | | 83,550 | | | | 13,755,672 | |
Puerto Rico Sales Tax Financing Corp., (NPFG), 0.00%, 8/1/45 | | | 253,860 | | | | 39,259,449 | |
Puerto Rico Sales Tax Financing Corp., (NPFG), 0.00%, 8/1/46 | | | 128,640 | | | | 18,687,533 | |
| | | | | | | | | |
| | | | | | $ | 90,954,297 | |
| | | | | | | | | |
|
Insured – Student Loan — 1.5% | |
Massachusetts Educational Financing Authority, (AGC), (AMT), 6.35%, 1/1/30 | | $ | 30,175 | | | $ | 31,799,622 | |
Massachusetts Educational Financing Authority, (AMBAC), (AMT), 4.70%, 1/1/33 | | | 15,975 | | | | 16,141,300 | |
| | | | | | | | | |
| | | | | | $ | 47,940,922 | |
| | | | | | | | | |
|
Insured – Transportation — 5.0% | |
Alameda Corridor Transportation Authority, CA, (AMBAC), 0.00%, 10/1/26 | | $ | 22,500 | | | $ | 11,886,975 | |
Alameda Corridor Transportation Authority, CA, (AMBAC), 0.00%, 10/1/27 | | | 41,630 | | | | 20,514,015 | |
E-470 Public Highway Authority, CO, (NPFG), 0.00%, 9/1/37 | | | 13,335 | | | | 4,880,343 | |
Miami-Dade County, FL, (Miami International Airport), (AGM), (AMT), 5.25%, 10/1/41 | | | 19,180 | | | | 20,831,590 | |
North Texas Tollway Authority, (AGC), 6.20%, 1/1/42 | | | 58,345 | | | | 72,496,580 | |
Ohio, (Portsmouth Gateway Group, LLC), (AGM), (AMT), 5.00%, 12/31/39 | | | 3,410 | | | | 3,723,174 | |
| | | | |
| | 16 | | See Notes to Financial Statements. |
Eaton Vance
National Municipal Income Fund
September 30, 2015
Portfolio of Investments — continued
| | | | | | | | |
| Security | | Principal Amount (000’s omitted) | | | Value | |
| | | | | | | | |
|
Insured – Transportation (continued) | |
Puerto Rico Highway and Transportation Authority, (AMBAC), 0.00%, 7/1/16 | | $ | 1,000 | | | $ | 962,200 | |
Puerto Rico Highway and Transportation Authority, (AMBAC), 0.00%, 7/1/18 | | | 1,795 | | | | 1,539,141 | |
Puerto Rico Highway and Transportation Authority, (NPFG), 5.25%, 7/1/32 | | | 590 | | | | 545,054 | |
San Jose, CA, Airport, (AGM), (AMBAC), (BHAC), (AMT), 6.00%, 3/1/47 | | | 21,420 | | | | 22,807,587 | |
| | | | | | | | | |
| | | | | | $ | 160,186,659 | |
| | | | | | | | | |
|
Lease Revenue / Certificates of Participation — 2.5% | |
Mohave County, AZ, Industrial Development Authority, (Mohave Prison LLC), 8.00%, 5/1/25 | | $ | 38,660 | | | $ | 42,910,280 | |
North Carolina, Capital Improvement Limited Obligation Bonds, 5.25%, 5/1/31 | | | 32,925 | | | | 38,044,838 | |
| | | | | | | | | |
| | | | | | $ | 80,955,118 | |
| | | | | | | | | |
|
Nursing Home — 0.3% | |
Mississippi Business Finance Corp., (Magnolia Healthcare), 7.99%, 7/1/25 | | $ | 8,305 | | | $ | 8,088,239 | |
| | | | | | | | | |
| | | | | | $ | 8,088,239 | |
| | | | | | | | | |
|
Other Revenue — 6.0% | |
Brooklyn Arena Local Development Corp., NY, (Barclays Center), 6.00%, 7/15/30 | | $ | 9,530 | | | $ | 10,824,936 | |
Brooklyn Arena Local Development Corp., NY, (Barclays Center), 6.25%, 7/15/40 | | | 14,295 | | | | 16,294,156 | |
Central Falls Detention Facility Corp., RI, 7.25%, 7/15/35(7) | | | 250 | | | | 62,270 | |
New Mexico Municipal Energy Acquisition Authority, (SPA: Royal Bank of Canada), 0.882%, 8/1/19 (Put Date), 11/1/39(8) | | | 8,300 | | | | 8,297,759 | |
New York, NY, Industrial Development Agency, (Bronx Parking Development Co., LLC), 5.875%, 10/1/46(7) | | | 12,330 | | | | 4,399,221 | |
New York, NY, Transitional Finance Authority, (Building Aid), 5.00%, 7/15/33 | | | 10,000 | | | | 11,527,600 | |
New York, NY, Transitional Finance Authority, (Building Aid), 5.00%, 7/15/36 | | | 10,000 | | | | 11,423,500 | |
Non-Profit Preferred Funding Trust, Various States, 4.47%, 9/15/37(5) | | | 12,000 | | | | 10,917,960 | |
Non-Profit Preferred Funding Trust, Various States, 4.72%, 9/15/37(5) | | | 19,000 | | | | 15,246,550 | |
Salt Verde Financial Corp., AZ, Senior Gas Revenue, 5.00%, 12/1/37 | | | 12,765 | | | | 14,247,782 | |
Texas Municipal Gas Acquisition and Supply Corp. I, Gas Supply Revenue, 6.25%, 12/15/26 | | | 26,135 | | | | 31,587,284 | |
Texas Municipal Gas Acquisition and Supply Corp. III, Gas Supply Revenue, 5.00%, 12/15/29 | | | 11,190 | | | | 12,243,203 | |
| | | | | | | | |
| Security | | Principal Amount (000’s omitted) | | | Value | |
| | | | | | | | |
|
Other Revenue (continued) | |
Texas Municipal Gas Acquisition and Supply Corp. III, Gas Supply Revenue, 5.00%, 12/15/30 | | $ | 4,845 | | | $ | 5,288,075 | |
Texas Municipal Gas Acquisition and Supply Corp. III, Gas Supply Revenue, 5.00%, 12/15/32 | | | 34,755 | | | | 37,588,923 | |
| | | | | | | | | |
| | | | | | $ | 189,949,219 | |
| | | | | | | | | |
|
Senior Living / Life Care — 0.4% | |
Logan County, CO, (TLC Care Choices, Inc.), 6.875%, 12/1/23(7) | | $ | 409 | | | $ | 100,000 | |
North Miami, FL, (Imperial Club), 6.125%, 1/1/42(7) | | | 16,435 | | | | 11,749,875 | |
| | | | | | | | | |
| | | | | | $ | 11,849,875 | |
| | | | | | | | | |
|
Special Tax Revenue — 8.7% | |
Connecticut, Special Tax Obligation, (Transportation Infrastructure), 5.00%, 9/1/33 | | $ | 3,000 | | | $ | 3,426,060 | |
Connecticut, Special Tax Obligation, (Transportation Infrastructure), 5.00%, 9/1/34 | | | 3,000 | | | | 3,413,580 | |
Guam, Limited Obligation Bonds, 5.625%, 12/1/29 | | | 350 | | | | 388,059 | |
Guam, Limited Obligation Bonds, 5.75%, 12/1/34 | | | 375 | | | | 416,359 | |
Jackson County, MO, Special Obligation, (Harry S. Truman Sports Complex), 5.00%, 12/1/26 | | | 3,120 | | | | 3,715,109 | |
Louisiana, 5.00%, 6/15/31 | | | 5,950 | | | | 6,905,272 | |
Louisiana, Gasoline and Fuels Tax Revenue, 4.50%, 5/1/39 | | | 10,650 | | | | 11,519,682 | |
Metropolitan Pier and Exposition Authority, IL, (Liq: Morgan Stanley Bank), 0.55%, 6/15/50(5)(9) | | | 30,000 | | | | 30,000,000 | |
New River Community Development District, FL, (Capital Improvements), 5.00%, 5/1/13(10) | | | 230 | | | | 0 | |
New River Community Development District, FL, (Capital Improvements), 5.35%, 5/1/38(10) | | | 80 | | | | 0 | |
New River Community Development District, FL, (Capital Improvements), Series 2010A-2, 5.75%, 5/1/38 | | | 420 | | | | 413,196 | |
New River Community Development District, FL, (Capital Improvements), Series 2010B-2, 5.00%, 5/1/18 | | | 335 | | | | 330,015 | |
New York Convention Center Development Corp., 5.00%, 11/15/45 | | | 5,445 | | | | 6,081,902 | |
New York Dormitory Authority, Personal Income Tax Revenue, 5.00%, 3/15/25 | | | 6,770 | | | | 8,378,687 | |
New York Dormitory Authority, Personal Income Tax Revenue, 5.00%, 2/15/34(2) | | | 21,835 | | | | 25,235,106 | |
New York Dormitory Authority, Personal Income Tax Revenue, 5.00%, 2/15/35(2) | | | 12,895 | | | | 14,789,784 | |
New York Dormitory Authority, Personal Income Tax Revenue, 5.00%, 2/15/36 | | | 10,000 | | | | 11,417,200 | |
New York Dormitory Authority, Sales Tax Revenue, 5.00%, 3/15/26 | | | 10,800 | | | | 13,208,940 | |
| | | | |
| | 17 | | See Notes to Financial Statements. |
Eaton Vance
National Municipal Income Fund
September 30, 2015
Portfolio of Investments — continued
| | | | | | | | |
| Security | | Principal Amount (000’s omitted) | | | Value | |
| | | | | | | | |
|
Special Tax Revenue (continued) | |
New York Dormitory Authority, Sales Tax Revenue, 5.00%, 3/15/27 | | $ | 9,000 | | | $ | 10,895,760 | |
New York Dormitory Authority, Sales Tax Revenue, 5.00%, 3/15/28 | | | 14,000 | | | | 16,746,380 | |
New York Dormitory Authority, Sales Tax Revenue, 5.00%, 3/15/32 | | | 14,250 | | | | 16,648,987 | |
New York Dormitory Authority, Sales Tax Revenue, 5.00%, 3/15/34 | | | 11,095 | | | | 12,854,001 | |
New York, NY, Transitional Finance Authority, Future Tax Revenue, 3.50%, 8/1/38 | | | 2,975 | | | | 2,931,506 | |
New York, NY, Transitional Finance Authority, Future Tax Revenue, 5.00%, 8/1/32 | | | 14,210 | | | | 16,514,862 | |
New York, NY, Transitional Finance Authority, Future Tax Revenue, 5.00%, 2/1/33 | | | 12,995 | | | | 15,056,917 | |
Puerto Rico Sales Tax Financing Corp., 5.00%, 8/1/40 | | | 5,385 | | | | 3,361,371 | |
Sales Tax Asset Receivables Corp., NY, 5.00%, 10/15/26(2) | | | 20,940 | | | | 25,771,277 | |
Southern Hills Plantation I Community Development District, FL, Series A1, 5.80%, 5/1/35 | | | 515 | | | | 502,037 | |
Southern Hills Plantation I Community Development District, FL, Series A2, 5.80%, 5/1/35 | | | 375 | | | | 332,490 | |
Sterling Hill Community Development District, FL, 6.20%, 5/1/35 | | | 1,665 | | | | 1,165,367 | |
Texas Transportation Commission, 5.00%, 4/1/33(2)(3) | | | 10,000 | | | | 11,637,900 | |
Virgin Islands Public Finance Authority, 6.75%, 10/1/37 | | | 1,410 | | | | 1,589,987 | |
| | | | | | | | | |
| | | | | | $ | 275,647,793 | |
| | | | | | | | | |
|
Student Loan — 0.7% | |
Iowa Student Loan Liquidity Corp., 5.25%, 12/1/22 | | $ | 14,800 | | | $ | 16,321,292 | |
New Jersey Higher Education Student Assistance Authority, (AMT), 4.00%, 12/1/28 | | | 5,340 | | | | 5,397,939 | |
| | | | | | | | | |
| | | | | | $ | 21,719,231 | |
| | | | | | | | | |
|
Transportation — 21.5% | |
Charleston County, SC, Airport District, (AMT), 5.50%, 7/1/38 | | $ | 10,000 | | | $ | 11,260,400 | |
Chicago, IL, (Midway International Airport), 5.00%, 1/1/33 | | | 6,750 | | | | 7,495,470 | |
Chicago, IL, (Midway International Airport), (AMT), 5.00%, 1/1/34 | | | 5,250 | | | | 5,592,825 | |
Chicago, IL, (O’Hare International Airport), (AMT), 5.00%, 1/1/25 | | | 16,100 | | | | 17,906,742 | |
Dallas and Fort Worth, TX, (Dallas/Fort Worth International Airport), 5.25%, 11/1/31 | | | 10,395 | | | | 12,095,414 | |
Dallas and Fort Worth, TX, (Dallas/Fort Worth International Airport), (AMT), 5.25%, 11/1/29 | | | 21,700 | | | | 25,148,347 | |
Dallas and Fort Worth, TX, (Dallas/Fort Worth International Airport), (AMT), 5.25%, 11/1/30 | | | 11,445 | | | | 13,166,214 | |
| | | | | | | | |
| Security | | Principal Amount (000’s omitted) | | | Value | |
| | | | | | | | |
|
Transportation (continued) | |
Delaware River Port Authority of Pennsylvania and New Jersey, 5.00%, 1/1/31 | | $ | 10,170 | | | $ | 11,662,753 | |
Houston, TX, (United Airlines, Inc.), (AMT), 5.00%, 7/1/29 | | | 7,670 | | | | 8,136,413 | |
Illinois Toll Highway Authority, 5.00%, 1/1/31 | | | 1,000 | | | | 1,135,030 | |
Illinois Toll Highway Authority, 5.00%, 1/1/32 | | | 2,500 | | | | 2,812,425 | |
Illinois Toll Highway Authority, 5.00%, 1/1/33 | | | 4,750 | | | | 5,310,785 | |
Illinois Toll Highway Authority, 5.25%, 1/1/29 | | | 13,110 | | | | 14,684,773 | |
Illinois Toll Highway Authority, 5.25%, 1/1/30(2)(3) | | | 18,180 | | | | 20,262,155 | |
Kansas Department of Transportation, 5.00%, 9/1/30 | | | 26,290 | | | | 31,398,936 | |
Los Angeles, CA, Department of Airports, (Los Angeles International Airport), 5.00%, 5/15/35(2)(3) | | | 7,200 | | | | 8,173,296 | |
Metropolitan Transportation Authority, NY, 5.00%, 11/15/29 | | | 5,830 | | | | 6,852,582 | |
Metropolitan Transportation Authority, NY, 5.00%, 11/15/31 | | | 18,000 | | | | 20,867,040 | |
Metropolitan Transportation Authority, NY, 5.00%, 11/15/33 | | | 10,000 | | | | 11,422,800 | |
Metropolitan Transportation Authority, NY, 5.25%, 11/15/29 | | | 11,000 | | | | 13,285,800 | |
Metropolitan Transportation Authority, NY, 5.25%, 11/15/33 | | | 11,900 | | | | 13,881,707 | |
Metropolitan Transportation Authority, NY, 6.25%, 11/15/23 | | | 19,475 | | | | 22,658,383 | |
Miami-Dade County, FL, (Miami International Airport), 5.50%, 10/1/36 | | | 3,500 | | | | 3,958,185 | |
Miami-Dade County, FL, Aviation Revenue, (AMT), 5.00%, 10/1/33 | | | 25,000 | | | | 27,610,250 | |
New Jersey Transportation Trust Fund Authority, (Transportation Program), 1.22%, 12/15/21 (Put Date), 6/15/34(8) | | | 35,000 | | | | 34,072,500 | |
New Jersey Transportation Trust Fund Authority, (Transportation System), 5.875%, 12/15/38 | | | 26,050 | | | | 27,935,238 | |
New Jersey Turnpike Authority, 5.00%, 1/1/28 | | | 10,000 | | | | 11,469,900 | |
New Jersey Turnpike Authority, 5.00%, 1/1/31 | | | 10,000 | | | | 11,438,000 | |
New York Liberty Development Corp., (4 World Trade Center), 5.00%, 11/15/31 | | | 8,935 | | | | 10,141,672 | |
Orlando-Orange County Expressway Authority, FL, 5.00%, 7/1/35 | | | 15,000 | | | | 16,824,000 | |
Pennsylvania Turnpike Commission, 5.25%, 6/1/39 | | | 9,305 | | | | 10,216,611 | |
Pennsylvania Turnpike Commission, 5.35%, (0.00% until 12/1/15), 12/1/30 | | | 13,010 | | | | 14,041,563 | |
Pennsylvania Turnpike Commission, 5.45%, (0.00% until 12/1/15), 12/1/35 | | | 12,125 | | | | 12,986,724 | |
Pennsylvania Turnpike Commission, 6.00%, (0.00% until 12/1/15), 12/1/34 | | | 25,000 | | | | 27,443,750 | |
Pennsylvania Turnpike Commission, 6.50%, 12/1/36 | | | 10,000 | | | | 11,952,000 | |
Philadelphia, PA, Airport Revenue, (AMT), 5.00%, 6/15/27 | | | 11,865 | | | | 13,288,444 | |
| | | | |
| | 18 | | See Notes to Financial Statements. |
Eaton Vance
National Municipal Income Fund
September 30, 2015
Portfolio of Investments — continued
| | | | | | | | |
| Security | | Principal Amount (000’s omitted) | | | Value | |
| | | | | | | | |
|
Transportation (continued) | |
Port Authority of New York & New Jersey, (AMT), 5.00%, 10/15/36 | | $ | 17,425 | | | $ | 19,276,581 | |
Port Authority of New York & New Jersey, (AMT), 5.25%, 9/15/23(2) | | | 28,890 | | | | 31,624,438 | |
Texas Private Activity Bond Surface Transportation Corp., (LBJ Express Managed Lanes Project), 7.00%, 6/30/34 | | | 29,200 | | | | 34,832,388 | |
Texas Private Activity Bond Surface Transportation Corp., (North Tarrant Express Managed Lanes Project), 6.875%, 12/31/39 | | | 24,110 | | | | 28,214,727 | |
Texas Transportation Commission, (Central Texas Turnpike System), 5.00%, 8/15/37 | | | 8,000 | | | | 8,729,760 | |
Triborough Bridge and Tunnel Authority, NY, 5.25%, 11/15/34(2) | | | 38,980 | | | | 43,560,540 | |
| | | | | | | | | |
| | | | | | $ | 684,827,561 | |
| | | | | | | | | |
|
Water and Sewer — 5.1% | |
Charlotte, NC, Water and Sewer Revenue, 5.00%, 7/1/26 | | $ | 9,410 | | | $ | 11,743,963 | |
Detroit, MI, Sewage Disposal System, 5.25%, 7/1/39 | | | 22,500 | | | | 24,286,725 | |
Detroit, MI, Water Supply System, 5.00%, 7/1/41 | | | 2,185 | | | | 2,296,173 | |
Detroit, MI, Water Supply System, 5.25%, 7/1/41 | | | 56,420 | | | | 60,008,876 | |
Michigan Finance Authority, (Detroit Water and Sewerage Department), 5.00%, 7/1/33 | | | 8,095 | | | | 8,730,781 | |
Michigan Finance Authority, (Detroit Water and Sewerage Department), 5.00%, 7/1/44 | | | 8,095 | | | | 8,515,535 | |
New York, NY, Municipal Water Finance Authority, (Water and Sewer System), 5.75%, 6/15/40(2)(3) | | | 42,030 | | | | 46,992,062 | |
| | | | | | | | | |
| | | | | | $ | 162,574,115 | |
| | | | | | | | | |
| |
Total Tax-Exempt Municipal Securities — 106.2%
(identified cost $3,166,185,365) | | | $ | 3,381,154,512 | |
| | | | | | | | | |
|
| Taxable Municipal Securities — 3.9% | |
| | |
| | | | | | | | |
| Security | | Principal Amount (000’s omitted) | | | Value | |
|
Cogeneration — 0.0%(4) | |
Northampton County, PA, Industrial Development Authority, (Northampton Generating), 5.00%, 12/31/23(1) | | $ | 281 | | | $ | 281,403 | |
| | | | | | | | | |
| | | | | | $ | 281,403 | |
| | | | | | | | | |
|
General Obligations — 2.7% | |
California, 7.50%, 4/1/34(11) | | $ | 15,420 | | | $ | 21,672,656 | |
Chicago, IL, 7.517%, 1/1/40(11) | | | 25,000 | | | | 25,153,750 | |
Chicago, IL, 7.75%, 1/1/42 | | | 7,900 | | | | 7,945,346 | |
| | | | | | | | |
| Security | | Principal Amount (000’s omitted) | | | Value | |
| | | | | | | | |
|
General Obligations (continued) | |
Massachusetts, 4.50%, 8/1/31(11) | | $ | 18,525 | | | $ | 20,089,436 | |
Utah, 3.539%, 7/1/25(11) | | | 11,200 | | | | 11,979,632 | |
| | | | | | | | | |
| | | | | | $ | 86,840,820 | |
| | | | | | | | | |
|
Hospital — 1.2% | |
California Statewide Communities Development Authority, (Loma Linda University Medical Center), 6.00%, 12/1/24 | | $ | 34,250 | | | $ | 37,042,745 | |
| | | | | | | | | |
| | | | | | $ | 37,042,745 | |
| | | | | | | | | |
| |
Total Taxable Municipal Securities — 3.9%
(identified cost $120,308,070) | | | $ | 124,164,968 | |
| | | | | | | | | |
|
| Corporate Bonds & Notes — 1.2% | |
| | |
| | | | | | | | |
| Security | | Principal Amount (000’s omitted) | | | Value | |
|
Education — 0.9% | |
Massachusetts Institute of Technology, 3.308%, 7/1/26 | | $ | 27,000 | | | $ | 28,342,953 | |
| | | | | | | | | |
| | | | | | $ | 28,342,953 | |
| | | | | | | | | |
|
Hospital — 0.3% | |
Dignity Health, 3.812%, 11/1/24 | | $ | 10,050 | | | $ | 10,315,592 | |
| | | | | | | | | |
| | | | | | $ | 10,315,592 | |
| | | | | | | | | |
| |
Total Corporate Bonds & Notes — 1.2%
(identified cost $37,050,000) | | | $ | 38,658,545 | |
| | | | | | | | | |
| |
Total Investments — 111.3%
(identified cost $3,323,543,435) | | | $ | 3,543,978,025 | |
| | | | | | | | | |
| |
Other Assets, Less Liabilities — (11.3)% | | | $ | (358,880,115 | ) |
| | | | | | | | | |
| |
Net Assets — 100.0% | | | $ | 3,185,097,910 | |
| | | | | | | | | |
The percentage shown for each investment category in the Portfolio of Investments is based on net assets.
| | | | |
| | 19 | | See Notes to Financial Statements. |
Eaton Vance
National Municipal Income Fund
September 30, 2015
Portfolio of Investments — continued
| | | | |
| AGC | | – | | Assured Guaranty Corp. |
| AGM | | – | | Assured Guaranty Municipal Corp. |
| AMBAC | | – | | AMBAC Financial Group, Inc. |
| AMT | | – | | Interest earned from these securities may be considered a tax preference item for purposes of the Federal Alternative Minimum Tax. |
| BAM | | – | | Build America Mutual Assurance Co. |
| BHAC | | – | | Berkshire Hathaway Assurance Corp. |
| FGIC | | – | | Financial Guaranty Insurance Company |
| Liq | | – | | Liquidity Provider |
| NPFG | | – | | National Public Finance Guaranty Corp. |
| PSF | | – | | Permanent School Fund |
| SPA | | – | | Standby Bond Purchase Agreement |
At September 30, 2015, the concentration of the Fund’s investments in the various states and territories, determined as a percentage of net assets, is as follows:
| | | | |
| New York | | | 19.5% | |
| Texas | | | 16.4% | |
| California | | | 15.6% | |
| Others, representing less than 10% individually | | | 59.8% | |
The Fund invests primarily in debt securities issued by municipalities. The ability of the issuers of the debt securities to meet their obligations may be affected by economic developments in a specific industry or municipality. In order to reduce the risk associated with such economic developments, at September 30, 2015, 11.5% of total investments are backed by bond insurance of various financial institutions and financial guaranty assurance agencies. The aggregate percentage insured by an individual financial institution or financial guaranty assurance agency ranged from less than 0.1% to 4.0% of total investments.
| | (1) | Represents a payment-in-kind security which may pay interest in additional principal at the issuer’s discretion. |
| | (2) | Security represents the municipal bond held by a trust that issues residual interest bonds (see Note 1I). |
| | (3) | Security (or a portion thereof) has been pledged as collateral for residual interest bond transactions. The aggregate value of such collateral is $104,903,572. |
| | (4) | Amount is less than 0.05%. |
| | (5) | Security exempt from registration pursuant to Rule 144A under the Securities Act of 1933. These securities may be sold in certain transactions (normally to qualified institutional buyers) and remain exempt from registration. At September 30, 2015, the aggregate value of these securities is $56,347,794 or 1.8% of the Fund’s net assets. |
| | (6) | Variable rate demand obligation that may be tendered at par on any day for payment the lesser of 5 business days or 7 calendar days. The stated interest rate, which generally resets weekly, represents the rate in effect at September 30, 2015. |
| | (7) | Security is in default and making only partial interest payments. |
| | (8) | Variable rate security. The stated interest rate represents the rate in effect at September 30, 2015. |
| | (9) | Floating-rate certificate issued by a tender option bond trust that owns the underlying municipal bond. The floating-rate certificate may be tendered at par on any day for payment the lesser of 5 business days or 7 calendar days. The stated interest rate, which generally resets weekly, represents the rate in effect at September 30, 2015. |
| (10) | Defaulted security. Issuer has defaulted on the payment of interest and/or principal or has filed for bankruptcy. |
| (11) | Build America Bond. Represents taxable municipal obligation issued pursuant to the American Recovery and Reinvestment Act of 2009 or other legislation providing for the issuance of taxable municipal debt on which the issuer receives federal support. |
| | | | |
| | 20 | | See Notes to Financial Statements. |
Eaton Vance
Municipal Income Funds
September 30, 2015
Statements of Assets and Liabilities
| | | | | | | | |
| | | September 30, 2015 | |
| Assets | | AMT-Free Fund | | | National Fund | |
Investments — | | | | | | | | |
Identified cost | | $ | 341,880,986 | | | $ | 3,323,543,435 | |
Unrealized appreciation | | | 36,375,689 | | | | 220,434,590 | |
Investments, at value | | $ | 378,256,675 | | | $ | 3,543,978,025 | |
Cash | | $ | 4,204,342 | | | $ | 21,687,313 | |
Restricted cash* | | | 885,000 | | | | 8,150,000 | |
Interest receivable | | | 4,734,808 | | | | 43,124,746 | |
Receivable for investments sold | | | 589,356 | | | | 17,146,131 | |
Receivable for Fund shares sold | | | 546,437 | | | | 2,926,933 | |
Receivable for variation margin on open financial futures contracts | | | 87,203 | | | | 1,125,000 | |
Due from broker for floating rate notes issued | | | — | | | | 695,000 | |
Total assets | | $ | 389,303,821 | | | $ | 3,638,833,148 | |
| | |
| Liabilities | | | | | | | | |
Payable for floating rate notes issued | | $ | 40,685,000 | | | $ | 441,020,000 | |
Payable for Fund shares redeemed | | | 1,193,124 | | | | 7,764,084 | |
Distributions payable | | | 187,380 | | | | 1,772,517 | |
Payable to affiliates: | | | | | | | | |
Investment adviser fee | | | 126,229 | | | | 909,894 | |
Distribution and service fees | | | 74,552 | | | | 891,296 | |
Interest expense and fees payable | | | 73,935 | | | | 830,192 | |
Accrued expenses | | | 114,535 | | | | 547,255 | |
Total liabilities | | $ | 42,454,755 | | | $ | 453,735,238 | |
Net Assets | | $ | 346,849,066 | | | $ | 3,185,097,910 | |
| | |
| Sources of Net Assets | | | | | | | | |
Paid-in capital | | $ | 431,617,773 | | | $ | 4,192,978,725 | |
Accumulated net realized loss | | | (121,995,451 | ) | | | (1,233,374,062 | ) |
Accumulated undistributed net investment income | | | 1,527,986 | | | | 10,671,791 | |
Net unrealized appreciation | | | 35,698,758 | | | | 214,821,456 | |
Net Assets | | $ | 346,849,066 | | | $ | 3,185,097,910 | |
| | | | |
| | 21 | | See Notes to Financial Statements. |
Eaton Vance
Municipal Income Funds
September 30, 2015
Statements of Assets and Liabilities — continued
| | | | | | | | |
| | | September 30, 2015 | |
| Class A Shares | | AMT-Free Fund | | | National Fund | |
Net Assets | | $ | 194,226,617 | | | $ | 1,899,324,316 | |
Shares Outstanding | | | 21,078,777 | | | | 193,545,960 | |
Net Asset Value and Redemption Price Per Share | | | | | | | | |
(net assets ÷ shares of beneficial interest outstanding) | | $ | 9.21 | | | $ | 9.81 | |
Maximum Offering Price Per Share | | | | | | | | |
(100 ÷ 95.25 of net asset value per share) | | $ | 9.67 | | | $ | 10.30 | |
| | |
| Class B Shares | | | | | | | | |
Net Assets | | $ | 782,924 | | | $ | 25,731,517 | |
Shares Outstanding | | | 85,541 | | | | 2,622,458 | |
Net Asset Value and Offering Price Per Share** | | | | | | | | |
(net assets ÷ shares of beneficial interest outstanding) | | $ | 9.15 | | | $ | 9.81 | |
| | |
| Class C Shares | | | | | | | | |
Net Assets | | $ | 41,902,884 | | | $ | 585,345,885 | |
Shares Outstanding | | | 4,573,034 | | | | 59,649,578 | |
Net Asset Value and Offering Price Per Share** | | | | | | | | |
(net assets ÷ shares of beneficial interest outstanding) | | $ | 9.16 | | | $ | 9.81 | |
| | |
| Class I Shares | | | | | | | | |
Net Assets | | $ | 109,936,641 | | | $ | 674,696,192 | |
Shares Outstanding | | | 10,922,746 | | | | 68,751,033 | |
Net Asset Value, Offering Price and Redemption Price Per Share | | | | | | | | |
(net assets ÷ shares of beneficial interest outstanding) | | $ | 10.06 | | | $ | 9.81 | |
On sales of $50,000 or more, the offering price of Class A shares is reduced.
| * | Represents restricted cash on deposit at the broker for open financial futures contracts. |
| ** | Redemption price per share is equal to the net asset value less any applicable contingent deferred sales charge. |
| | | | |
| | 22 | | See Notes to Financial Statements. |
Eaton Vance
Municipal Income Funds
September 30, 2015
Statements of Operations
| | | | | | | | |
| | | Year Ended September 30, 2015 | |
| Investment Income | | AMT-Free Fund | | | National Fund | |
Interest | | $ | 17,116,829 | | | $ | 157,254,439 | |
Total investment income | | $ | 17,116,829 | | | $ | 157,254,439 | |
| | |
| Expenses | | | | | | | | |
Investment adviser fee | | $ | 1,546,385 | | | $ | 11,464,123 | |
Distribution and service fees | | | | | | | | |
Class A | | | 495,849 | | | | 5,007,213 | |
Class B | | | 11,369 | | | | 338,944 | |
Class C | | | 407,602 | | | | 6,181,365 | |
Trustees’ fees and expenses | | | 18,479 | | | | 68,000 | |
Custodian fee | | | 90,072 | | | | 554,292 | |
Transfer and dividend disbursing agent fees | | | 116,941 | | | | 1,349,166 | |
Legal and accounting services | | | 67,859 | | | | 109,932 | |
Printing and postage | | | 27,566 | | | | 172,731 | |
Registration fees | | | 84,232 | | | | 157,295 | |
Interest expense and fees | | | 262,366 | | | | 3,068,903 | |
Miscellaneous | | | 39,820 | | | | 135,625 | |
Total expenses | | $ | 3,168,540 | | | $ | 28,607,589 | |
Deduct — | | | | | | | | |
Reduction of custodian fee | | $ | 1,447 | | | $ | 17,514 | |
Total expense reductions | | $ | 1,447 | | | $ | 17,514 | |
| | |
Net expenses | | $ | 3,167,093 | | | $ | 28,590,075 | |
| | |
Net investment income | | $ | 13,949,736 | | | $ | 128,664,364 | |
| | |
| Realized and Unrealized Gain (Loss) | | | | | | | | |
Net realized gain (loss) — | | | | | | | | |
Investment transactions | | $ | 3,851,745 | | | $ | 76,440,876 | |
Financial futures contracts | | | (2,154,100 | ) | | | (16,566,977 | ) |
Net realized gain | | $ | 1,697,645 | | | $ | 59,873,899 | |
Change in unrealized appreciation (depreciation) — | | | | | | | | |
Investments | | $ | (5,970,914 | ) | | $ | (73,267,937 | ) |
Financial futures contracts | | | (1,030,251 | ) | | | (8,888,894 | ) |
Net change in unrealized appreciation (depreciation) | | $ | (7,001,165 | ) | | $ | (82,156,831 | ) |
| | |
Net realized and unrealized loss | | $ | (5,303,520 | ) | | $ | (22,282,932 | ) |
| | |
Net increase in net assets from operations | | $ | 8,646,216 | | | $ | 106,381,432 | |
| | | | |
| | 23 | | See Notes to Financial Statements. |
Eaton Vance
Municipal Income Funds
September 30, 2015
Statements of Changes in Net Assets
| | | | | | | | |
| | | Year Ended September 30, 2015 | |
| Increase (Decrease) in Net Assets | | AMT-Free Fund | | | National Fund | |
From operations — | | | | | | | | |
Net investment income | | $ | 13,949,736 | | | $ | 128,664,364 | |
Net realized gain from investment transactions and financial futures contracts | | | 1,697,645 | | | | 59,873,899 | |
Net change in unrealized appreciation (depreciation) from investments and financial futures contracts | | | (7,001,165 | ) | | | (82,156,831 | ) |
Net increase in net assets from operations | | $ | 8,646,216 | | | $ | 106,381,432 | |
Distributions to shareholders — | | | | | | | | |
From net investment income | | | | | | | | |
Class A | | $ | (7,936,334 | ) | | $ | (78,357,303 | ) |
Class B | | | (36,880 | ) | | | (1,072,302 | ) |
Class C | | | (1,325,188 | ) | | | (19,544,324 | ) |
Class I | | | (4,573,822 | ) | | | (28,623,549 | ) |
Total distributions to shareholders | | $ | (13,872,224 | ) | | $ | (127,597,478 | ) |
Transactions in shares of beneficial interest — | | | | | | | | |
Proceeds from sale of shares | | | | | | | | |
Class A | | $ | 21,442,536 | | | $ | 107,301,453 | |
Class B | | | 46,128 | | | | 271,900 | |
Class C | | | 9,845,957 | | | | 37,754,925 | |
Class I | | | 24,348,878 | | | | 193,831,273 | |
Net asset value of shares issued to shareholders in payment of distributions declared | | | | | | | | |
Class A | | | 7,174,572 | | | | 66,116,345 | |
Class B | | | 24,886 | | | | 888,634 | |
Class C | | | 995,092 | | | | 15,085,541 | |
Class I | | | 3,375,303 | | | | 23,524,642 | |
Cost of shares redeemed | | | | | | | | |
Class A | | | (32,594,061 | ) | | | (398,588,759 | ) |
Class B | | | (227,228 | ) | | | (7,541,798 | ) |
Class C | | | (5,487,085 | ) | | | (109,373,397 | ) |
Class I | | | (18,521,346 | ) | | | (224,390,619 | ) |
Net asset value of shares exchanged | | | | | | | | |
Class A | | | 694,287 | | | | 10,369,631 | |
Class B | | | (694,287 | ) | | | (10,369,631 | ) |
Net increase (decrease) in net assets from Fund share transactions | | $ | 10,423,632 | | | $ | (295,119,860 | ) |
| | |
Net increase (decrease) in net assets | | $ | 5,197,624 | | | $ | (316,335,906 | ) |
| | |
| Net Assets | | | | | | | | |
At beginning of year | | $ | 341,651,442 | | | $ | 3,501,433,816 | |
At end of year | | $ | 346,849,066 | | | $ | 3,185,097,910 | |
| | |
Accumulated undistributed net investment income
included in net assets | | | | | | | | |
At end of year | | $ | 1,527,986 | | | $ | 10,671,791 | |
| | | | |
| | 24 | | See Notes to Financial Statements. |
Eaton Vance
Municipal Income Funds
September 30, 2015
Statements of Changes in Net Assets — continued
| | | | | | | | |
| | | Year Ended September 30, 2014 | |
| Increase (Decrease) in Net Assets | | AMT-Free Fund | | | National Fund | |
From operations — | | | | | | | | |
Net investment income | | $ | 15,246,350 | | | $ | 160,894,414 | |
Net realized gain from investment transactions and financial futures contracts | | | 1,862,620 | | | | 24,029,933 | |
Net change in unrealized appreciation (depreciation) from investments and financial futures contracts | | | 23,912,174 | | | | 221,575,247 | |
Net increase in net assets from operations | | $ | 41,021,144 | | | $ | 406,499,594 | |
Distributions to shareholders — | | | | | | | | |
From net investment income | | | | | | | | |
Class A | | $ | (9,371,998 | ) | | $ | (99,477,459 | ) |
Class B | | | (80,021 | ) | | | (2,021,368 | ) |
Class C | | | (1,386,129 | ) | | | (25,853,832 | ) |
Class I | | | (4,338,298 | ) | | | (36,405,260 | ) |
Total distributions to shareholders | | $ | (15,176,446 | ) | | $ | (163,757,919 | ) |
Transactions in shares of beneficial interest — | | | | | | | | |
Proceeds from sale of shares | | | | | | | | |
Class A | | $ | 20,110,528 | | | $ | 203,628,591 | |
Class B | | | 92,769 | | | | 444,785 | |
Class C | | | 4,386,915 | | | | 49,933,766 | |
Class I | | | 17,931,150 | | | | 319,714,305 | |
Net asset value of shares issued to shareholders in payment of distributions declared | | | | | | | | |
Class A | | | 8,242,924 | | | | 82,959,583 | |
Class B | | | 58,072 | | | | 1,667,463 | |
Class C | | | 1,046,468 | | | | 19,675,408 | |
Class I | | | 3,172,269 | | | | 31,125,442 | |
Cost of shares redeemed | | | | | | | | |
Class A | | | (69,295,933 | ) | | | (602,870,865 | ) |
Class B | | | (627,087 | ) | | | (12,371,518 | ) |
Class C | | | (11,898,671 | ) | | | (168,173,700 | ) |
Class I | | | (25,188,187 | ) | | | (702,734,261 | ) |
Issued in connection with tax-free reorganizations (see Note 11) | | | | | | | | |
Class A | | | — | | | | 146,588,628 | |
Class B | | | — | | | | 2,461,257 | |
Class C | | | — | | | | 17,625,276 | |
Class I | | | — | | | | 12,263,760 | |
Net asset value of shares exchanged | | | | | | | | |
Class A | | | 926,940 | | | | 12,268,523 | |
Class B | | | (926,940 | ) | | | (12,268,523 | ) |
Net decrease in net assets from Fund share transactions | | $ | (51,968,783 | ) | | $ | (598,062,080 | ) |
| | |
Net decrease in net assets | | $ | (26,124,085 | ) | | $ | (355,320,405 | ) |
| | |
| Net Assets | | | | | | | | |
At beginning of year | | $ | 367,775,527 | | | $ | 3,856,754,221 | |
At end of year | | $ | 341,651,442 | | | $ | 3,501,433,816 | |
| | |
Accumulated undistributed net investment income
included in net assets | | | | | | | | |
At end of year | | $ | 1,538,635 | | | $ | 10,671,794 | |
| | | | |
| | 25 | | See Notes to Financial Statements. |
Eaton Vance
Municipal Income Funds
September 30, 2015
Statements of Cash Flows
| | | | | | | | |
| | | Year Ended September 30, 2015 | |
| Cash Flows From Operating Activities | | AMT-Free Fund | | | National Fund | |
Net increase in net assets from operations | | $ | 8,646,216 | | | $ | 106,381,432 | |
Adjustments to reconcile net increase in net assets from operations to net cash provided by operating activities: | | | | | | | | |
Investments purchased | | | (77,839,167 | ) | | | (2,272,309,827 | ) |
Investments sold | | | 77,607,735 | | | | 2,434,652,326 | |
Net amortization/accretion of premium (discount) | | | (1,615,415 | ) | | | 4,158,027 | |
Decrease in restricted cash | | | 90,000 | | | | 850,000 | |
Decrease (increase) in interest receivable | | | (174,588 | ) | | | 2,794,255 | |
Decrease in receivable for variation margin on open financial futures contracts | | | 17,360 | | | | 93,750 | |
Decrease in payable to affiliate for investment adviser fee | | | (746 | ) | | | (81,658 | ) |
Increase (decrease) in payable to affiliate for distribution and service fees | | | 1,302 | | | | (108,402 | ) |
Decrease in interest expense and fees payable | | | (8,943 | ) | | | (100,014 | ) |
Decrease in accrued expenses | | | (20,158 | ) | | | (72,140 | ) |
Net change in unrealized (appreciation) depreciation from investments | | | 5,970,914 | | | | 73,267,937 | |
Net realized gain from investments | | | (3,851,745 | ) | | | (76,440,876 | ) |
Net cash provided by operating activities | | $ | 8,822,765 | | | $ | 273,084,810 | |
| | |
| Cash Flows From Financing Activities | | | | | | | | |
Proceeds from Fund shares sold | | $ | 55,351,745 | | | $ | 339,585,694 | |
Fund shares redeemed | | | (57,160,993 | ) | | | (742,041,567 | ) |
Distributions paid, net of reinvestments | | | (2,316,910 | ) | | | (22,245,388 | ) |
Proceeds from secured borrowings | | | — | | | | 80,850,000 | |
Repayment of secured borrowings | | | (6,000,000 | ) | | | (100,725,000 | ) |
Net cash used in financing activities | | $ | (10,126,158 | ) | | $ | (444,576,261 | ) |
| | |
Net decrease in cash | | $ | (1,303,393 | ) | | $ | (171,491,451 | ) |
| | |
Cash at beginning of year | | $ | 5,507,735 | | | $ | 193,178,764 | |
| | |
Cash at end of year | | $ | 4,204,342 | | | $ | 21,687,313 | |
| | |
| Supplemental disclosure of cash flow information: | | | | | | | | |
Noncash financing activities not included herein consist of: | | | | | | | | |
Reinvestment of dividends and distributions | | $ | 11,569,853 | | | $ | 105,615,162 | |
Cash paid for interest and fees | | $ | 271,309 | | | $ | 3,168,917 | |
| | | | |
| | 26 | | See Notes to Financial Statements. |
Eaton Vance
Municipal Income Funds
September 30, 2015
Financial Highlights
| | | | | | | | | | | | | | | | | | | | | | | | |
| | | AMT-Free Fund — Class A | |
| | | Year Ended September 30, | | | Nine Months Ended September 30, 2012(1) | | | Year Ended December 31, | |
| | | 2015 | | | 2014 | | | 2013 | | | | 2011 | | | 2010 | |
Net asset value — Beginning of period | | $ | 9.350 | | | $ | 8.670 | | | $ | 9.600 | | | $ | 8.840 | | | $ | 8.320 | | | $ | 8.800 | |
| | | | | |
| Income (Loss) From Operations | | | | | | | | | | | | | | | | | | | | | |
Net investment income(2) | | $ | 0.374 | | | $ | 0.395 | | | $ | 0.400 | | | $ | 0.296 | | | $ | 0.437 | | | $ | 0.436 | |
Net realized and unrealized gain (loss) | | | (0.142 | ) | | | 0.677 | | | | (0.934 | ) | | | 0.758 | | | | 0.505 | | | | (0.487 | ) |
| | | | | | |
Total income (loss) from operations | | $ | 0.232 | | | $ | 1.072 | | | $ | (0.534 | ) | | $ | 1.054 | | | $ | 0.942 | | | $ | (0.051 | ) |
| | | | | | |
| Less Distributions | | | | | | | | | | | | | | | | | | | | | | | | |
From net investment income | | $ | (0.372 | ) | | $ | (0.392 | ) | | $ | (0.396 | ) | | $ | (0.294 | ) | | $ | (0.422 | ) | | $ | (0.429 | ) |
| | | | | | |
Total distributions | | $ | (0.372 | ) | | $ | (0.392 | ) | | $ | (0.396 | ) | | $ | (0.294 | ) | | $ | (0.422 | ) | | $ | (0.429 | ) |
| | | | | | |
Net asset value — End of period | | $ | 9.210 | | | $ | 9.350 | | | $ | 8.670 | | | $ | 9.600 | | | $ | 8.840 | | | $ | 8.320 | |
| | | | | | |
Total Return(3) | | | 2.52 | % | | | 12.63 | % | | | (5.75 | )% | | | 12.06 | %(4) | | | 11.68 | % | | | (0.79 | )% |
| | | | | | |
| Ratios/Supplemental Data | | | | | | | | | | | | | | | | | | | | | | | | |
Net assets, end of period (000’s omitted) | | $ | 194,227 | | | $ | 200,408 | | | $ | 224,506 | | | $ | 293,544 | | | $ | 299,566 | | | $ | 345,914 | |
Ratios (as a percentage of average daily net assets): | | | | | | | | | | | | | | | | | | | | | | | | |
Expenses excluding interest and fees(6) | | | 0.82 | % | | | 0.83 | % | | | 0.83 | % | | | 0.84 | %(5) | | | 0.85 | % | | | 0.83 | % |
Interest and fee expense(7) | | | 0.08 | % | | | 0.09 | % | | | 0.11 | % | | | 0.11 | %(5) | | | 0.12 | % | | | 0.13 | % |
Total expenses(6) | | | 0.90 | % | | | 0.92 | % | | | 0.94 | % | | | 0.95 | %(5) | | | 0.97 | % | | | 0.96 | % |
Net investment income | | | 4.02 | % | | | 4.40 | % | | | 4.26 | % | | | 4.24 | %(5) | | | 5.19 | % | | | 4.90 | % |
Portfolio Turnover | | | 17 | % | | | 24 | % | | | 31 | % | | | 26 | %(4) | | | 20 | % | | | 15 | % |
| (1) | The Fund changed its fiscal year-end from December 31 to September 30. |
| (2) | Computed using average shares outstanding. |
| (3) | Returns are historical and are calculated by determining the percentage change in net asset value with all distributions reinvested and do not reflect the effect of sales charges. |
| (6) | Excludes the effect of custody fee credits, if any, of less than 0.005%. |
| (7) | Interest and fee expense relates to the liability for floating rate notes issued in conjunction with residual interest bond transactions (see Note 1I). |
| | | | |
| | 27 | | See Notes to Financial Statements. |
Eaton Vance
Municipal Income Funds
September 30, 2015
Financial Highlights — continued
| | | | | | | | | | | | | | | | | | | | | | | | |
| | | AMT-Free Fund — Class B | |
| | | Year Ended September 30, | | | Nine Months Ended September 30, 2012(1) | | | Year Ended December 31, | |
| | | 2015 | | | 2014 | | | 2013 | | | | 2011 | | | 2010 | |
Net asset value — Beginning of period | | $ | 9.290 | | | $ | 8.620 | | | $ | 9.540 | | | $ | 8.780 | | | $ | 8.270 | | | $ | 8.740 | |
| | | | | |
| Income (Loss) From Operations | | | | | | | | | | | | | | | | | | | | | |
Net investment income(2) | | $ | 0.303 | | | $ | 0.326 | | | $ | 0.326 | | | $ | 0.242 | | | $ | 0.372 | | | $ | 0.368 | |
Net realized and unrealized gain (loss) | | | (0.143 | ) | | | 0.667 | | | | (0.922 | ) | | | 0.758 | | | | 0.495 | | | | (0.477 | ) |
| | | | | | |
Total income (loss) from operations | | $ | 0.160 | | | $ | 0.993 | | | $ | (0.596 | ) | | $ | 1.000 | | | $ | 0.867 | | | $ | (0.109 | ) |
| | | | | | |
| Less Distributions | | | | | | | | | | | | | | | | | | | | | | | | |
From net investment income | | $ | (0.300 | ) | | $ | (0.323 | ) | | $ | (0.324 | ) | | $ | (0.240 | ) | | $ | (0.357 | ) | | $ | (0.361 | ) |
| | | | | | |
Total distributions | | $ | (0.300 | ) | | $ | (0.323 | ) | | $ | (0.324 | ) | | $ | (0.240 | ) | | $ | (0.357 | ) | | $ | (0.361 | ) |
| | | | | | |
Net asset value — End of period | | $ | 9.150 | | | $ | 9.290 | | | $ | 8.620 | | | $ | 9.540 | | | $ | 8.780 | | | $ | 8.270 | |
| | | | | | |
Total Return(3) | | | 1.74 | % | | | 11.73 | % | | | (6.42 | )% | | | 11.50 | %(4) | | | 10.76 | % | | | (1.43 | )% |
| | | | | | |
| Ratios/Supplemental Data | | | | | | | | | | | | | | | | | | | | | | | | |
Net assets, end of period (000’s omitted) | | $ | 783 | | | $ | 1,647 | | | $ | 2,893 | | | $ | 5,236 | | | $ | 7,771 | | | $ | 13,078 | |
Ratios (as a percentage of average daily net assets): | | | | | | | | | | | | | | | | | | | | | | | | |
Expenses excluding interest and fees(6) | | | 1.57 | % | | | 1.58 | % | | | 1.58 | % | | | 1.59 | %(5) | | | 1.61 | % | | | 1.58 | % |
Interest and fee expense(7) | | | 0.08 | % | | | 0.09 | % | | | 0.11 | % | | | 0.11 | %(5) | | | 0.12 | % | | | 0.13 | % |
Total expenses(6) | | | 1.65 | % | | | 1.67 | % | | | 1.69 | % | | | 1.70 | %(5) | | | 1.73 | % | | | 1.71 | % |
Net investment income | | | 3.27 | % | | | 3.67 | % | | | 3.49 | % | | | 3.50 | %(5) | | | 4.46 | % | | | 4.16 | % |
Portfolio Turnover | | | 17 | % | | | 24 | % | | | 31 | % | | | 26 | %(4) | | | 20 | % | | | 15 | % |
| (1) | The Fund changed its fiscal year-end from December 31 to September 30. |
| (2) | Computed using average shares outstanding. |
| (3) | Returns are historical and are calculated by determining the percentage change in net asset value with all distributions reinvested and do not reflect the effect of sales charges. |
| (6) | Excludes the effect of custody fee credits, if any, of less than 0.005%. |
| (7) | Interest and fee expense relates to the liability for floating rate notes issued in conjunction with residual interest bond transactions (see Note 1I). |
| | | | |
| | 28 | | See Notes to Financial Statements. |
Eaton Vance
Municipal Income Funds
September 30, 2015
Financial Highlights — continued
| | | | | | | | | | | | | | | | | | | | | | | | |
| | | AMT-Free Fund — Class C | |
| | | Year Ended September 30, | | | Nine Months Ended September 30, 2012(1) | | | Year Ended December 31, | |
| | | 2015 | | | 2014 | | | 2013 | | | | 2011 | | | 2010 | |
Net asset value — Beginning of period | | $ | 9.300 | | | $ | 8.620 | | | $ | 9.550 | | | $ | 8.790 | | | $ | 8.280 | | | $ | 8.750 | |
| | | | | |
| Income (Loss) From Operations | | | | | | | | | | | | | | | | | | | | | |
Net investment income(2) | | $ | 0.302 | | | $ | 0.326 | | | $ | 0.327 | | | $ | 0.242 | | | $ | 0.371 | | | $ | 0.367 | |
Net realized and unrealized gain (loss) | | | (0.142 | ) | | | 0.677 | | | | (0.933 | ) | | | 0.758 | | | | 0.496 | | | | (0.475 | ) |
| | | | | | |
Total income (loss) from operations | | $ | 0.160 | | | $ | 1.003 | | | $ | (0.606 | ) | | $ | 1.000 | | | $ | 0.867 | | | $ | (0.108 | ) |
| | | | | | |
| Less Distributions | | | | | | | | | | | | | | | | | | | | | | | | |
From net investment income | | $ | (0.300 | ) | | $ | (0.323 | ) | | $ | (0.324 | ) | | $ | (0.240 | ) | | $ | (0.357 | ) | | $ | (0.362 | ) |
| | | | | | |
Total distributions | | $ | (0.300 | ) | | $ | (0.323 | ) | | $ | (0.324 | ) | | $ | (0.240 | ) | | $ | (0.357 | ) | | $ | (0.362 | ) |
| | | | | | |
Net asset value — End of period | | $ | 9.160 | | | $ | 9.300 | | | $ | 8.620 | | | $ | 9.550 | | | $ | 8.790 | | | $ | 8.280 | |
| | | | | | |
Total Return(3) | | | 1.75 | % | | | 11.84 | % | | | (6.51 | )% | | | 11.49 | %(4) | | | 10.76 | % | | | (1.42 | )% |
| | | | | | |
| Ratios/Supplemental Data | | | | | | | | | | | | | | | | | | | | | | | | |
Net assets, end of period (000’s omitted) | | $ | 41,903 | | | $ | 37,193 | | | $ | 40,823 | | | $ | 50,099 | | | $ | 43,863 | | | $ | 50,369 | |
Ratios (as a percentage of average daily net assets): | | | | | | | | | | | | | | | | | | | | | | | | |
Expenses excluding interest and fees(6) | | | 1.57 | % | | | 1.58 | % | | | 1.58 | % | | | 1.59 | %(5) | | | 1.61 | % | | | 1.57 | % |
Interest and fee expense(7) | | | 0.08 | % | | | 0.09 | % | | | 0.11 | % | | | 0.11 | %(5) | | | 0.12 | % | | | 0.13 | % |
Total expenses(6) | | | 1.65 | % | | | 1.67 | % | | | 1.69 | % | | | 1.70 | %(5) | | | 1.73 | % | | | 1.70 | % |
Net investment income | | | 3.27 | % | | | 3.65 | % | | | 3.52 | % | | | 3.48 | %(5) | | | 4.42 | % | | | 4.14 | % |
Portfolio Turnover | | | 17 | % | | | 24 | % | | | 31 | % | | | 26 | %(4) | | | 20 | % | | | 15 | % |
| (1) | The Fund changed its fiscal year-end from December 31 to September 30. |
| (2) | Computed using average shares outstanding. |
| (3) | Returns are historical and are calculated by determining the percentage change in net asset value with all distributions reinvested and do not reflect the effect of sales charges. |
| (6) | Excludes the effect of custody fee credits, if any, of less than 0.005%. |
| (7) | Interest and fee expense relates to the liability for floating rate notes issued in conjunction with residual interest bond transactions (see Note 1I). |
| | | | |
| | 29 | | See Notes to Financial Statements. |
Eaton Vance
Municipal Income Funds
September 30, 2015
Financial Highlights — continued
| | | | | | | | | | | | | | | | | | | | | | | | |
| | | AMT-Free Fund — Class I | |
| | | Year Ended September 30, | | | Nine Months Ended September 30, 2012(1) | | | Year Ended December 31, | |
| | | 2015 | | | 2014 | | | 2013 | | | | 2011 | | | 2010 | |
Net asset value — Beginning of period | | $ | 10.210 | | | $ | 9.470 | | | $ | 10.480 | | | $ | 9.660 | | | $ | 9.090 | | | $ | 9.610 | |
| | | | | |
| Income (Loss) From Operations | | | | | | | | | | | | | | | | | | | | | |
Net investment income(2) | | $ | 0.434 | | | $ | 0.455 | | | $ | 0.463 | | | $ | 0.341 | | | $ | 0.500 | | | $ | 0.500 | |
Net realized and unrealized gain (loss) | | | (0.152 | ) | | | 0.737 | | | | (1.015 | ) | | | 0.819 | | | | 0.554 | | | | (0.528 | ) |
| | | | | | |
Total income (loss) from operations | | $ | 0.282 | | | $ | 1.192 | | | $ | (0.552 | ) | | $ | 1.160 | | | $ | 1.054 | | | $ | (0.028 | ) |
| | | | | | |
| Less Distributions | | | | | | | | | | | | | | | | | | | | | | | | |
From net investment income | | $ | (0.432 | ) | | $ | (0.452 | ) | | $ | (0.458 | ) | | $ | (0.340 | ) | | $ | (0.484 | ) | | $ | (0.492 | ) |
| | | | | | |
Total distributions | | $ | (0.432 | ) | | $ | (0.452 | ) | | $ | (0.458 | ) | | $ | (0.340 | ) | | $ | (0.484 | ) | | $ | (0.492 | ) |
| | | | | | |
Net asset value — End of period | | $ | 10.060 | | | $ | 10.210 | | | $ | 9.470 | | | $ | 10.480 | | | $ | 9.660 | | | $ | 9.090 | |
| | | | | | |
Total Return(3) | | | 2.70 | % | | | 12.99 | % | | | (5.46 | )% | | | 12.27 | %(4) | | | 11.87 | % | | | (0.50 | )% |
| | | | | | |
| Ratios/Supplemental Data | | | | | | | | | | | | | | | | | | | | | | | | |
Net assets, end of period (000’s omitted) | | $ | 109,937 | | | $ | 102,404 | | | $ | 99,553 | | | $ | 125,642 | | | $ | 101,762 | | | $ | 130,202 | |
Ratios (as a percentage of average daily net assets): | | | | | | | | | | | | | | | | | | | | | | | | |
Expenses excluding interest and fees(6) | | | 0.57 | % | | | 0.58 | % | | | 0.58 | % | | | 0.59 | %(5) | | | 0.60 | % | | | 0.57 | % |
Interest and fee expense(7) | | | 0.08 | % | | | 0.09 | % | | | 0.11 | % | | | 0.11 | %(5) | | | 0.12 | % | | | 0.13 | % |
Total expenses(6) | | | 0.65 | % | | | 0.67 | % | | | 0.69 | % | | | 0.70 | %(5) | | | 0.72 | % | | | 0.70 | % |
Net investment income | | | 4.27 | % | | | 4.64 | % | | | 4.52 | % | | | 4.48 | %(5) | | | 5.42 | % | | | 5.14 | % |
Portfolio Turnover | | | 17 | % | | | 24 | % | | | 31 | % | | | 26 | %(4) | | | 20 | % | | | 15 | % |
| (1) | The Fund changed its fiscal year-end from December 31 to September 30. |
| (2) | Computed using average shares outstanding. |
| (3) | Returns are historical and are calculated by determining the percentage change in net asset value with all distributions reinvested. |
| (6) | Excludes the effect of custody fee credits, if any, of less than 0.005%. |
| (7) | Interest and fee expense relates to the liability for floating rate notes issued in conjunction with residual interest bond transactions (see Note 1I). |
| | | | |
| | 30 | | See Notes to Financial Statements. |
Eaton Vance
Municipal Income Funds
September 30, 2015
Financial Highlights — continued
| | | | | | | | | | | | | | | | | | | | |
| | | National Fund — Class A | |
| | | Year Ended September 30, | |
| | | 2015 | | | 2014 | | | 2013 | | | 2012 | | | 2011 | |
Net asset value — Beginning of year | | $ | 9.870 | | | $ | 9.170 | | | $ | 10.200 | | | $ | 9.360 | | | $ | 10.020 | |
| | | | |
| Income (Loss) From Operations | | | | | | | | | | | | | | | | | |
Net investment income(1) | | $ | 0.389 | | | $ | 0.446 | | | $ | 0.468 | | | $ | 0.477 | | | $ | 0.549 | |
Net realized and unrealized gain (loss) | | | (0.064 | ) | | | 0.707 | | | | (1.032 | ) | | | 0.842 | | | | (0.682 | ) |
| | | | | |
Total income (loss) from operations | | $ | 0.325 | | | $ | 1.153 | | | $ | (0.564 | ) | | $ | 1.319 | | | $ | (0.133 | ) |
| | | | | |
| Less Distributions | | | | | | | | | | | | | | | | | | | | |
From net investment income | | $ | (0.385 | ) | | $ | (0.453 | ) | | $ | (0.466 | ) | | $ | (0.479 | ) | | $ | (0.527 | ) |
| | | | | |
Total distributions | | $ | (0.385 | ) | | $ | (0.453 | ) | | $ | (0.466 | ) | | $ | (0.479 | ) | | $ | (0.527 | ) |
| | | | | |
Net asset value — End of year | | $ | 9.810 | | | $ | 9.870 | | | $ | 9.170 | | | $ | 10.200 | | | $ | 9.360 | |
| | | | | |
Total Return(2) | | | 3.35 | % | | | 12.89 | % | | | (5.77 | )% | | | 14.42 | % | | | (1.00 | )% |
| | | | | |
| Ratios/Supplemental Data | | | | | | | | | | | | | | | | | | | | |
Net assets, end of year (000’s omitted) | | $ | 1,899,324 | | | $ | 2,126,465 | | | $ | 2,134,502 | | | $ | 2,975,655 | | | $ | 2,872,630 | |
Ratios (as a percentage of average daily net assets): | | | | | | | | | | | | | | | | | | | | |
Expenses excluding interest and fees(3) | | | 0.67 | % | | | 0.71 | % | | | 0.66 | % | | | 0.67 | % | | | 0.69 | % |
Interest and fee expense(4) | | | 0.09 | % | | | 0.09 | % | | | 0.11 | % | | | 0.11 | % | | | 0.13 | % |
Total expenses(3) | | | 0.76 | % | | | 0.80 | % | | | 0.77 | % | | | 0.78 | % | | | 0.82 | % |
Net investment income | | | 3.94 | % | | | 4.71 | % | | | 4.67 | % | | | 4.88 | % | | | 6.04 | % |
Portfolio Turnover | | | 57 | % | | | 47 | % | | | 74 | % | | | 59 | % | | | 18 | % |
| (1) | Computed using average shares outstanding. |
| (2) | Returns are historical and are calculated by determining the percentage change in net asset value with all distributions reinvested and do not reflect the effect of sales charges. |
| (3) | Excludes the effect of custody fee credits, if any, of less than 0.005%. |
| (4) | Interest and fee expense relates to the liability for floating rate notes issued in conjunction with residual interest bond transactions (see Note 1I). |
| | | | |
| | 31 | | See Notes to Financial Statements. |
Eaton Vance
Municipal Income Funds
September 30, 2015
Financial Highlights — continued
| | | | | | | | | | | | | | | | | | | | |
| | | National Fund — Class B | |
| | | Year Ended September 30, | |
| | | 2015 | | | 2014 | | | 2013 | | | 2012 | | | 2011 | |
Net asset value — Beginning of year | | $ | 9.870 | | | $ | 9.170 | | | $ | 10.200 | | | $ | 9.360 | | | $ | 10.020 | |
| | | | |
| Income (Loss) From Operations | | | | | | | | | | | | | | | | | |
Net investment income(1) | | $ | 0.315 | | | $ | 0.379 | | | $ | 0.392 | | | $ | 0.405 | | | $ | 0.480 | |
Net realized and unrealized gain (loss) | | | (0.064 | ) | | | 0.704 | | | | (1.031 | ) | | | 0.840 | | | | (0.681 | ) |
| | | | | |
Total income (loss) from operations | | $ | 0.251 | | | $ | 1.083 | | | $ | (0.639 | ) | | $ | 1.245 | | | $ | (0.201 | ) |
| | | | | |
| Less Distributions | | | | | | | | | | | | | | | | | | | | |
From net investment income | | $ | (0.311 | ) | | $ | (0.383 | ) | | $ | (0.391 | ) | | $ | (0.405 | ) | | $ | (0.459 | ) |
| | | | | |
Total distributions | | $ | (0.311 | ) | | $ | (0.383 | ) | | $ | (0.391 | ) | | $ | (0.405 | ) | | $ | (0.459 | ) |
| | | | | |
Net asset value — End of year | | $ | 9.810 | | | $ | 9.870 | | | $ | 9.170 | | | $ | 10.200 | | | $ | 9.360 | |
| | | | | |
Total Return(2) | | | 2.58 | % | | | 12.06 | % | | | (6.47 | )% | | | 13.57 | % | | | (1.73 | )% |
| | | | | |
| Ratios/Supplemental Data | | | | | | | | | | | | | | | | | | | | |
Net assets, end of year (000’s omitted) | | $ | 25,732 | | | $ | 42,655 | | | $ | 59,244 | | | $ | 103,613 | | | $ | 122,288 | |
Ratios (as a percentage of average daily net assets): | | | | | | | | | | | | | | | | | | | | |
Expenses excluding interest and fees(3) | | | 1.42 | % | | | 1.46 | % | | | 1.41 | % | | | 1.42 | % | | | 1.44 | % |
Interest and fee expense(4) | | | 0.09 | % | | | 0.09 | % | | | 0.11 | % | | | 0.11 | % | | | 0.13 | % |
Total expenses(3) | | | 1.51 | % | | | 1.55 | % | | | 1.52 | % | | | 1.53 | % | | | 1.57 | % |
Net investment income | | | 3.20 | % | | | 4.01 | % | | | 3.90 | % | | | 4.15 | % | | | 5.29 | % |
Portfolio Turnover | | | 57 | % | | | 47 | % | | | 74 | % | | | 59 | % | | | 18 | % |
| (1) | Computed using average shares outstanding. |
| (2) | Returns are historical and are calculated by determining the percentage change in net asset value with all distributions reinvested and do not reflect the effect of sales charges. |
| (3) | Excludes the effect of custody fee credits, if any, of less than 0.005%. |
| (4) | Interest and fee expense relates to the liability for floating rate notes issued in conjunction with residual interest bond transactions (see Note 1I). |
| | | | |
| | 32 | | See Notes to Financial Statements. |
Eaton Vance
Municipal Income Funds
September 30, 2015
Financial Highlights — continued
| | | | | | | | | | | | | | | | | | | | |
| | | National Fund — Class C | |
| | | Year Ended September 30, | |
| | | 2015 | | | 2014 | | | 2013 | | | 2012 | | | 2011 | |
Net asset value — Beginning of year | | $ | 9.870 | | | $ | 9.170 | | | $ | 10.200 | | | $ | 9.360 | | | $ | 10.020 | |
| | | | |
| Income (Loss) From Operations | | | | | | | | | | | | | | | | | |
Net investment income(1) | | $ | 0.315 | | | $ | 0.376 | | | $ | 0.392 | | | $ | 0.404 | | | $ | 0.481 | |
Net realized and unrealized gain (loss) | | | (0.064 | ) | | | 0.707 | | | | (1.031 | ) | | | 0.841 | | | | (0.682 | ) |
| | | | | |
Total income (loss) from operations | | $ | 0.251 | | | $ | 1.083 | | | $ | (0.639 | ) | | $ | 1.245 | | | $ | (0.201 | ) |
| | | | | |
| Less Distributions | | | | | | | | | | | | | | | | | | | | |
From net investment income | | $ | (0.311 | ) | | $ | (0.383 | ) | | $ | (0.391 | ) | | $ | (0.405 | ) | | $ | (0.459 | ) |
| | | | | |
Total distributions | | $ | (0.311 | ) | | $ | (0.383 | ) | | $ | (0.391 | ) | | $ | (0.405 | ) | | $ | (0.459 | ) |
| | | | | |
Net asset value — End of year | | $ | 9.810 | | | $ | 9.870 | | | $ | 9.170 | | | $ | 10.200 | | | $ | 9.360 | |
| | | | | |
Total Return(2) | | | 2.58 | % | | | 12.06 | % | | | (6.47 | )% | | | 13.58 | % | | | (1.74 | )% |
| | | | | |
| Ratios/Supplemental Data | | | | | | | | | | | | | | | | | | | | |
Net assets, end of year (000’s omitted) | | $ | 585,346 | | | $ | 645,801 | | | $ | 681,072 | | | $ | 980,799 | | | $ | 932,773 | |
Ratios (as a percentage of average daily net assets): | | | | | | | | | | | | | | | | | | | | |
Expenses excluding interest and fees(3) | | | 1.42 | % | | | 1.46 | % | | | 1.41 | % | | | 1.42 | % | | | 1.44 | % |
Interest and fee expense(4) | | | 0.09 | % | | | 0.09 | % | | | 0.11 | % | | | 0.11 | % | | | 0.13 | % |
Total expenses(3) | | | 1.51 | % | | | 1.55 | % | | | 1.52 | % | | | 1.53 | % | | | 1.57 | % |
Net investment income | | | 3.19 | % | | | 3.98 | % | | | 3.92 | % | | | 4.13 | % | | | 5.29 | % |
Portfolio Turnover | | | 57 | % | | | 47 | % | | | 74 | % | | | 59 | % | | | 18 | % |
| (1) | Computed using average shares outstanding. |
| (2) | Returns are historical and are calculated by determining the percentage change in net asset value with all distributions reinvested and do not reflect the effect of sales charges. |
| (3) | Excludes the effect of custody fee credits, if any, of less than 0.005%. |
| (4) | Interest and fee expense relates to the liability for floating rate notes issued in conjunction with residual interest bond transactions (see Note 1I). |
| | | | |
| | 33 | | See Notes to Financial Statements. |
Eaton Vance
Municipal Income Funds
September 30, 2015
Financial Highlights — continued
| | | | | | | | | | | | | | | | | | | | |
| | | National Fund — Class I | |
| | | Year Ended September 30, | |
| | | 2015 | | | 2014 | | | 2013 | | | 2012 | | | 2011 | |
Net asset value — Beginning of year | | $ | 9.870 | | | $ | 9.180 | | | $ | 10.200 | | | $ | 9.360 | | | $ | 10.020 | |
| | | | |
| Income (Loss) From Operations | | | | | | | | | | | | | | | | | |
Net investment income(1) | | $ | 0.413 | | | $ | 0.478 | | | $ | 0.492 | | | $ | 0.499 | | | $ | 0.565 | |
Net realized and unrealized gain (loss) | | | (0.063 | ) | | | 0.690 | | | | (1.021 | ) | | | 0.844 | | �� | | (0.675 | ) |
| | | | | |
Total income (loss) from operations | | $ | 0.350 | | | $ | 1.168 | | | $ | (0.529 | ) | | $ | 1.343 | | | $ | (0.110 | ) |
| | | | | |
| Less Distributions | | | | | | | | | | | | | | | | | | | | |
From net investment income | | $ | (0.410 | ) | | $ | (0.478 | ) | | $ | (0.491 | ) | | $ | (0.503 | ) | | $ | (0.550 | ) |
| | | | | |
Total distributions | | $ | (0.410 | ) | | $ | (0.478 | ) | | $ | (0.491 | ) | | $ | (0.503 | ) | | $ | (0.550 | ) |
| | | | | |
Net asset value — End of year | | $ | 9.810 | | | $ | 9.870 | | | $ | 9.180 | | | $ | 10.200 | | | $ | 9.360 | |
| | | | | |
Total Return(2) | | | 3.50 | % | | | 13.17 | % | | | (5.43 | )% | | | 14.71 | % | | | (0.75 | )% |
| | | | | |
| Ratios/Supplemental Data | | | | | | | | | | | | | | | | | | | | |
Net assets, end of year (000’s omitted) | | $ | 674,696 | | | $ | 686,514 | | | $ | 981,936 | | | $ | 1,142,323 | | | $ | 796,970 | |
Ratios (as a percentage of average daily net assets): | | | | | | | | | | | | | | | | | | | | |
Expenses excluding interest and fees(3) | | | 0.42 | % | | | 0.46 | % | | | 0.41 | % | | | 0.42 | % | | | 0.43 | % |
Interest and fee expense(4) | | | 0.09 | % | | | 0.09 | % | | | 0.11 | % | | | 0.11 | % | | | 0.13 | % |
Total expenses(3) | | | 0.51 | % | | | 0.55 | % | | | 0.52 | % | | | 0.53 | % | | | 0.56 | % |
Net investment income | | | 4.19 | % | | | 5.07 | % | | | 4.93 | % | | | 5.09 | % | | | 6.23 | % |
Portfolio Turnover | | | 57 | % | | | 47 | % | | | 74 | % | | | 59 | % | | | 18 | % |
| (1) | Computed using average shares outstanding. |
| (2) | Returns are historical and are calculated by determining the percentage change in net asset value with all distributions reinvested. |
| (3) | Excludes the effect of custody fee credits, if any, of less than 0.005%. |
| (4) | Interest and fee expense relates to the liability for floating rate notes issued in conjunction with residual interest bond transactions (see Note 1I). |
| | | | |
| | 34 | | See Notes to Financial Statements. |
Eaton Vance
Municipal Income Funds
September 30, 2015
Notes to Financial Statements
1 Significant Accounting Policies
Eaton Vance AMT-Free Municipal Income Fund (AMT-Free Fund) and Eaton Vance National Municipal Income Fund (National Fund) (each individually referred to as the Fund, and collectively, the Funds) are a diversified series of Eaton Vance Mutual Funds Trust and Eaton Vance Municipals Trust, respectively (collectively, the Trusts). The Trusts are Massachusetts business trusts registered under the Investment Company Act of 1940, as amended (the 1940 Act), as open-end management investment companies. The Funds’ investment objective is to provide current income exempt from regular federal income tax. The Funds offer four classes of shares. Class A shares are generally sold subject to a sales charge imposed at time of purchase. Class B and Class C shares are sold at net asset value and are generally subject to a contingent deferred sales charge (see Note 5). Class I shares are sold at net asset value and are not subject to a sales charge. Class B shares of each Fund automatically convert to Class A shares eight years after their purchase as described in each Fund’s prospectus. Beginning January 1, 2012, Class B shares are only available for purchase upon exchange from another Eaton Vance fund or through reinvestment of distributions. Each class represents a pro-rata interest in the Fund, but votes separately on class-specific matters and (as noted below) is subject to different expenses. Realized and unrealized gains and losses are allocated daily to each class of shares based on the relative net assets of each class to the total net assets of the Fund. Net investment income, other than class-specific expenses, is allocated daily to each class of shares based upon the ratio of the value of each class’s paid shares to the total value of all paid shares. Each class of shares differs in its distribution plan and certain other class-specific expenses.
The following is a summary of significant accounting policies of the Funds. The policies are in conformity with accounting principles generally accepted in the United States of America (U.S. GAAP). Each Fund is an investment company and follows accounting and reporting guidance in the Financial Accounting Standards Board (“FASB”) Accounting Standards Codification Topic 946.
A Investment Valuation — The following methodologies are used to determine the market value or fair value of investments.
Debt Obligations. Debt obligations (including short-term obligations with a remaining maturity of more than sixty days) are generally valued on the basis of valuations provided by third party pricing services, as derived from such services’ pricing models. Inputs to the models may include, but are not limited to, reported trades, executable bid and asked prices, broker/dealer quotations, prices or yields of securities with similar characteristics, interest rates, anticipated prepayments, benchmark curves or information pertaining to the issuer, as well as industry and economic events. The pricing services may use a matrix approach, which considers information regarding securities with similar characteristics to determine the valuation for a security. Short-term obligations purchased with a remaining maturity of sixty days or less are generally valued at amortized cost, which approximates market value.
Derivatives. Financial futures contracts are valued at the closing settlement price established by the board of trade or exchange on which they are traded.
Fair Valuation. Investments for which valuations or market quotations are not readily available or are deemed unreliable are valued at fair value using methods determined in good faith by or at the direction of the Trustees of a Fund in a manner that fairly reflects the security’s value, or the amount that a Fund might reasonably expect to receive for the security upon its current sale in the ordinary course. Each such determination is based on a consideration of relevant factors, which are likely to vary from one pricing context to another. These factors may include, but are not limited to, the type of security, the existence of any contractual restrictions on the security’s disposition, the price and extent of public trading in similar securities of the issuer or of comparable entities, quotations or relevant information obtained from broker/dealers or other market participants, information obtained from the issuer, analysts, and/or the appropriate stock exchange (for exchange-traded securities), an analysis of the entity’s financial condition, and an evaluation of the forces that influence the issuer and the market(s) in which the security is purchased and sold.
B Investment Transactions and Related Income — Investment transactions for financial statement purposes are accounted for on a trade date basis. Realized gains and losses on investments sold are determined on the basis of identified cost. Interest income is recorded on the basis of interest accrued, adjusted for amortization of premium or accretion of discount.
C Federal Taxes — Each Fund’s policy is to comply with the provisions of the Internal Revenue Code applicable to regulated investment companies and to distribute to shareholders each year substantially all of its taxable, if any, and tax-exempt net investment income, and all or substantially all of its net realized capital gains. Accordingly, no provision for federal income or excise tax is necessary. Each Fund intends to satisfy conditions which will enable it to designate distributions from the interest income generated by its investments in non-taxable municipal securities, which are exempt from regular federal income tax when received by each Fund, as exempt-interest dividends. For National Fund, the portion of such interest, if any, earned on private activity bonds issued after August 7, 1986, may be considered a tax preference item to shareholders.
As of September 30, 2015, the Funds had no uncertain tax positions that would require financial statement recognition, de-recognition, or disclosure. Each Fund files a U.S. federal income tax return annually after its fiscal year-end, which is subject to examination by the Internal Revenue Service for a period of three years from the date of filing.
D Expenses — The majority of expenses of the Trusts are directly identifiable to an individual fund. Expenses which are not readily identifiable to a specific fund are allocated taking into consideration, among other things, the nature and type of expense and the relative size of the funds.
E Expense Reduction — State Street Bank and Trust Company (SSBT) serves as custodian of the Funds. Pursuant to the custodian agreement, SSBT receives a fee reduced by credits, which are determined based on the average daily cash balance each Fund maintains with SSBT. All credit balances, if any, used to reduce each Fund’s custodian fees are reported as a reduction of expenses in the Statements of Operations.
Eaton Vance
Municipal Income Funds
September 30, 2015
Notes to Financial Statements — continued
F Legal Fees — Legal fees and other related expenses incurred as part of negotiations of the terms and requirement of capital infusions, or that are expected to result in the restructuring of, or a plan of reorganization for, an investment are recorded as realized losses. Ongoing expenditures to protect or enhance an investment are treated as operating expenses.
G Use of Estimates — The preparation of the financial statements in conformity with U.S. GAAP requires management to make estimates and assumptions that affect the reported amounts of assets and liabilities at the date of the financial statements and the reported amounts of income and expense during the reporting period. Actual results could differ from those estimates.
H Indemnifications — Under each Trust’s organizational documents, its officers and Trustees may be indemnified against certain liabilities and expenses arising out of the performance of their duties to the Funds. Under Massachusetts law, if certain conditions prevail, shareholders of a Massachusetts business trust (such as a Trust) could be deemed to have personal liability for the obligations of the Trust. However, each Trust’s Declaration of Trust contains an express disclaimer of liability on the part of Fund shareholders and the By-laws provide that the Trust shall assume the defense on behalf of any Fund shareholders. Moreover, the By-laws also provide for indemnification out of Fund property of any shareholder held personally liable solely by reason of being or having been a shareholder for all loss or expense arising from such liability. Additionally, in the normal course of business, each Fund enters into agreements with service providers that may contain indemnification clauses. Each Fund’s maximum exposure under these arrangements is unknown as this would involve future claims that may be made against each Fund that have not yet occurred.
I Floating Rate Notes Issued in Conjunction with Securities Held — The Funds may invest in residual interest bonds, also referred to as inverse floating rate securities, whereby a Fund may sell a variable or fixed rate bond for cash to a Special-Purpose Vehicle (the SPV), (which is generally organized as a trust), while at the same time, buying a residual interest in the assets and cash flows of the SPV. The bond is deposited into the SPV with the same CUSIP number as the bond sold to the SPV by the Fund, and which may have been, but is not required to be, the bond purchased from the Fund (the Bond). The SPV also issues floating rate notes (Floating Rate Notes) which are sold to third-parties. The residual interest bond held by a Fund gives the Fund the right (1) to cause the holders of the Floating Rate Notes to generally tender their notes at par, and (2) to have the Bond held by the SPV transferred to the Fund, thereby terminating the SPV. Should the Fund exercise such right, it would generally pay the SPV the par amount due on the Floating Rate Notes and exchange the residual interest bond for the underlying Bond. Pursuant to generally accepted accounting principles for transfers and servicing of financial assets and extinguishment of liabilities, the Funds account for the transaction described above as a secured borrowing by including the Bond in their Portfolio of Investments and the Floating Rate Notes as a liability under the caption “Payable for floating rate notes issued” in their Statement of Assets and Liabilities. The Floating Rate Notes have interest rates that generally reset weekly and their holders have the option to tender their notes to the SPV for redemption at par at each reset date. Accordingly, the fair value of the payable for floating rate notes issued approximates its carrying value. If measured at fair value, the payable for floating rate notes would have been considered as Level 2 in the fair value hierarchy (see Note 10) at September 30, 2015. Interest expense related to the Funds’ liability with respect to Floating Rate Notes is recorded as incurred. The SPV may be terminated by the Fund, as noted above, or by the occurrence of certain termination events as defined in the trust agreement, such as a downgrade in the credit quality of the underlying Bond, bankruptcy of or payment failure by the issuer of the underlying Bond, the inability to remarket Floating Rate Notes that have been tendered due to insufficient buyers in the market, or the failure by the SPV to obtain renewal of the liquidity agreement under which liquidity support is provided for the Floating Rate Notes up to one year. At September 30, 2015, the amounts of the Funds’ Floating Rate Notes and related interest rates and collateral were as follows:
| | | | | | | | |
| | | AMT-Free Fund | | | National Fund | |
| | |
Floating Rate Notes Outstanding | | $ | 40,685,000 | | | $ | 441,020,000 | |
Interest Rate or Range of Interest Rates (%) | | | 0.02 - 0.03 | | | | 0.02 - 0.22 | |
Collateral for Floating Rate Notes Outstanding | | $ | 63,555,110 | | | $ | 679,382,315 | |
For the year ended September 30, 2015, the Funds’ average Floating Rate Notes outstanding and the average interest rate including fees were as follows:
| | | | | | | | |
| | | AMT-Free Fund | | | National Fund | |
| | |
Average Floating Rate Notes Outstanding | | $ | 40,685,000 | | | $ | 474,762,260 | |
Average Interest Rate | | | 0.64 | % | | | 0.65 | % |
In certain circumstances, the Funds may enter into shortfall and forbearance agreements with brokers by which a Fund agrees to reimburse the broker for the difference between the liquidation value of the Bond held by the SPV and the liquidation value of the Floating Rate Notes, as well as any shortfalls in interest cash flows. The Funds had no shortfalls as of September 30, 2015.
Eaton Vance
Municipal Income Funds
September 30, 2015
Notes to Financial Statements — continued
The Funds may also purchase residual interest bonds in a secondary market transaction without first owning the underlying bond. Such transactions are not required to be treated as secured borrowings. Shortfall agreements, if any, related to residual interest bonds purchased in a secondary market transaction are disclosed in the Portfolio of Investments.
The Funds’ investment policies and restrictions expressly permit investments in residual interest bonds. Such bonds typically offer the potential for yields exceeding the yields available on fixed rate bonds with comparable credit quality and maturity. These securities tend to underperform the market for fixed rate bonds in a rising long-term interest rate environment, but tend to outperform the market for fixed rate bonds when long-term interest rates decline. The value and income of residual interest bonds are generally more volatile than that of a fixed rate bond. The Funds’ investment policies do not allow the Funds to borrow money except as permitted by the 1940 Act. Management believes that the Funds’ restrictions on borrowing money and issuing senior securities (other than as specifically permitted) do not apply to Floating Rate Notes issued by the SPV and included as a liability in the Funds’ Statement of Assets and Liabilities. As secured indebtedness issued by an SPV, Floating Rate Notes are distinct from the borrowings and senior securities to which the Funds’ restrictions apply. Residual interest bonds held by the Funds are securities exempt from registration under Rule 144A of the Securities Act of 1933.
On December 10, 2013, five U.S. federal agencies published final rules implementing section 619 of the Dodd-Frank Wall Street Reform and Consumer Protection Act (the “Volcker Rule”). The Volcker Rule prohibits banking entities from engaging in proprietary trading of certain instruments and limits such entities’ investments in, and relationships with, covered funds (such as SPVs), as defined in the rules. The compliance date for the Volcker Rule for certain covered funds was July 21, 2015 while for other covered funds the compliance date is July 21, 2016. The Volcker Rule precludes banking entities and their affiliates from (i) sponsoring residual interest bond programs (as such programs are presently structured) and (ii) continuing relationships with or services for existing residual interest bond programs. As a result, residual interest bond trusts will need to be restructured or unwound. The effects of the Volcker Rule may make it more difficult for the Funds to maintain current or desired levels of leverage and may cause the Funds to incur additional expenses to maintain their leverage.
As of September 30, 2015, the Funds’ investments in residual interest bonds that were required to be compliant with the Volcker Rule by July 21, 2015 were restructured by the required compliance date. Legal and restructuring fees incurred in connection with residual interest bond trusts that were restructured during the year ended September 30, 2015 have been recorded as interest expense.
J Financial Futures Contracts — Upon entering into a financial futures contract, a Fund is required to deposit with the broker, either in cash or securities, an amount equal to a certain percentage of the contract amount (initial margin). Subsequent payments, known as variation margin, are made or received by the Fund each business day, depending on the daily fluctuations in the value of the underlying security, and are recorded as unrealized gains or losses by the Fund. Gains (losses) are realized upon the expiration or closing of the financial futures contracts. Should market conditions change unexpectedly, the Fund may not achieve the anticipated benefits of the financial futures contracts and may realize a loss. Futures contracts have minimal counterparty risk as they are exchange traded and the clearinghouse for the exchange is substituted as the counterparty, guaranteeing counterparty performance.
K Statement of Cash Flows — The cash amount shown in the Statement of Cash Flows of a Fund is the amount included in the Fund’s Statement of Assets and Liabilities and represents the unrestricted cash on hand at its custodian and does not include any short-term investments.
2 Distributions to Shareholders and Income Tax Information
The net investment income of each Fund is determined daily and substantially all of the net investment income so determined is declared as a dividend to shareholders of record at the time of declaration. Distributions are declared separately for each class of shares. Distributions are paid monthly. Distributions of realized capital gains (reduced by available capital loss carryforwards) are made at least annually. Shareholders may reinvest income and capital gain distributions in additional shares of the same class of a Fund at the net asset value as of the reinvestment date or, at the election of the shareholder, receive distributions in cash. Distributions to shareholders are determined in accordance with income tax regulations, which may differ from U.S. GAAP. As required by U.S. GAAP, only distributions in excess of tax basis earnings and profits are reported in the financial statements as a return of capital. Permanent differences between book and tax accounting relating to distributions are reclassified to paid-in capital. For tax purposes, distributions from short-term capital gains are considered to be from ordinary income.
The tax character of distributions declared for the years ended September 30, 2015 and September 30, 2014 was as follows:
| | | | | | | | |
| | | Year Ended September 30, 2015 | |
| | | AMT-Free Fund | | | National Fund | |
| | |
Distributions declared from: | | | | | | | | |
Tax-exempt income | | $ | 13,862,456 | | | $ | 121,386,268 | |
Ordinary income | | $ | 9,768 | | | $ | 6,211,210 | |
Eaton Vance
Municipal Income Funds
September 30, 2015
Notes to Financial Statements — continued
| | | | | | | | |
| | | Year Ended September 30, 2014 | |
| | | AMT-Free Fund | | | National Fund | |
| | |
Distributions declared from: | | | | | | | | |
Tax-exempt income | | $ | 15,150,557 | | | $ | 158,315,622 | |
Ordinary income | | $ | 25,889 | | | $ | 5,442,297 | |
During the year ended September 30, 2015, the following amounts were reclassified due to expired capital loss carryforwards and differences between book and tax accounting, primarily for premium amortization and accretion of market discount.
| | | | | | | | |
| | | AMT-Free Fund | | | National Fund | |
| | |
Change in: | | | | | | | | |
Paid-in capital | | $ | (12,777,842 | ) | | $ | (1,872,342 | ) |
Accumulated net realized loss | | $ | 12,866,003 | | | $ | 2,939,231 | |
Accumulated undistributed net investment income | | $ | (88,161 | ) | | $ | (1,066,889 | ) |
These reclassifications had no effect on the net assets or net asset value per share of the Funds.
As of September 30, 2015, the components of distributable earnings (accumulated losses) and unrealized appreciation (depreciation) on a tax basis were as follows:
| | | | | | | | |
| | | AMT-Free Fund | | | National Fund | |
| | |
Undistributed tax-exempt income | | $ | 1,715,366 | | | $ | 12,507,301 | |
Capital loss carryforwards and deferred capital losses | | $ | (123,004,864 | ) | | $ | (1,270,593,051 | ) |
Net unrealized appreciation | | $ | 36,708,171 | | | $ | 251,977,452 | |
Other temporary differences | | $ | (187,380 | ) | | $ | (1,772,517 | ) |
The differences between components of distributable earnings (accumulated losses) on a tax basis and the amounts reflected in the Statements of Assets and Liabilities are primarily due to wash sales, futures contracts, the timing of recognizing distributions to shareholders, premium amortization, accretion of market discount, defaulted bond interest, residual interest bonds and expenditures on defaulted bonds.
Eaton Vance
Municipal Income Funds
September 30, 2015
Notes to Financial Statements — continued
At September 30, 2015, the following Funds, for federal income tax purposes, had capital loss carryforwards and deferred capital losses which will reduce the respective Fund’s taxable income arising from future net realized gains on investment transactions, if any, to the extent permitted by the Internal Revenue Code, and thus will reduce the amount of distributions to shareholders, which would otherwise be necessary to relieve the Funds of any liability for federal income or excise tax. Under tax regulations, capital losses incurred in taxable years beginning after December 2010 are considered deferred capital losses and are treated as arising on the first day of a Fund’s next taxable year, retaining the same short-term or long-term character as when originally deferred. Deferred capital losses are required to be used prior to capital loss carryforwards, which carry an expiration date. As a result of this ordering rule, capital loss carryforwards may be more likely to expire unused. The amounts and expiration dates of the capital loss carryforwards, whose character is short-term, and the amounts of the deferred capital losses are as follows:
| | | | | | | | |
| Expiration Date | | AMT-Free Fund | | | National Fund | |
| | |
September 30, 2016 | | $ | 23,678,685 | | | $ | 53,981,575 | |
September 30, 2017 | | | 55,876,213 | | | | 16,271,265 | |
September 30, 2018 | | | 10,549,691 | | | | 797,269,779 | |
September 30, 2019 | | | — | | | | 56,374,590 | |
| | |
Total capital loss carryforwards | | $ | 90,104,589 | | | $ | 923,897,209 | |
| | |
Deferred capital losses: | | | | | | | | |
Short-term | | $ | 14,689,583 | | | $ | 171,873,699 | |
Long-term | | $ | 18,210,692 | | | $ | 174,822,143 | |
Included in the amounts above for National Fund are capital loss carryforwards of $11,926,790 as a result of the reorganizations on June 27, 2014 (see Note 11) and capital loss carryforwards of $17,071,947 as a result of the reorganizations which occurred in prior years. Utilization of these capital loss carryforwards may be limited in accordance with certain income tax regulations.
The cost and unrealized appreciation (depreciation) of investments of each Fund at September 30, 2015, as determined on a federal income tax basis, were as follows:
| | | | | | | | |
| | | AMT-Free Fund | | | National Fund | |
| | |
Aggregate cost | | $ | 300,863,504 | | | $ | 2,850,980,573 | |
| | |
Gross unrealized appreciation | | $ | 39,129,971 | | | $ | 281,960,289 | |
Gross unrealized depreciation | | | (2,421,800 | ) | | | (29,982,837 | ) |
| | |
Net unrealized appreciation | | $ | 36,708,171 | | | $ | 251,977,452 | |
Eaton Vance
Municipal Income Funds
September 30, 2015
Notes to Financial Statements — continued
3 Investment Adviser Fee and Other Transactions with Affiliates
The investment adviser fee is earned by Eaton Vance Management (EVM) for AMT-Free Fund and Boston Management and Research (BMR), a subsidiary of EVM, for National Fund as compensation for management and investment advisory services rendered to each Fund. The fee is based upon a percentage of average daily net assets plus a percentage of gross income (i.e., income other than gains from the sale of securities) as presented in the following table and is payable monthly.
| | | | | | | | |
| Daily Net Assets | | Annual Asset Rate | | | Daily Income Rate | |
| | |
Up to $500 million | | | 0.300 | % | | | 3.00 | % |
$500 million up to $1billion | | | 0.275 | | | | 2.75 | |
$1 billion up to $1.5 billion | | | 0.250 | | | | 2.50 | |
$1.5 billion up to $2 billion | | | 0.225 | | | | 2.25 | |
$2 billion up to $3 billion | | | 0.200 | | | | 2.00 | |
$3 billion and over | | | 0.175 | | | | 1.75 | |
For the year ended September 30, 2015, investment adviser fees incurred by the Funds and the effective annual rates, as a percentage of average daily net assets, were as follows:
| | | | | | | | |
| | | AMT-Free Fund | | | National Fund | |
| | |
Investment Adviser Fee | | $ | 1,546,385 | | | $ | 11,464,123 | |
Effective Annual Rate | | | 0.44 | % | | | 0.34 | % |
EVM serves as administrator of each Fund, but receives no compensation. EVM provides sub-transfer agency and related services to the Funds pursuant to a Sub-Transfer Agency Support Services Agreement. Eaton Vance Distributors, Inc. (EVD), an affiliate of EVM and the Funds’ principal underwriter, received a portion of the sales charge on sales of Class A shares of the Funds. EVD also received distribution and service fees from Class A, Class B and Class C shares (see Note 4) and contingent deferred sales charges (see Note 5). Sub-transfer agent fees earned by EVM, which are included in transfer and dividend disbursing agent fees on the Statements of Operations, and Class A sales charges that the Funds were informed were received by EVD for the year ended September 30, 2015 were as follows:
| | | | | | | | |
| | | AMT-Free Fund | | | National Fund | |
| | |
EVM’s Sub-Transfer Agent Fees | | $ | 7,077 | | | $ | 74,811 | |
EVD’s Class A Sales Charges | | $ | 20,277 | | | $ | 183,246 | |
Trustees and officers of the Funds who are members of EVM’s or BMR’s organizations receive remuneration for their services to the Funds out of the investment adviser fee. Trustees of the Funds who are not affiliated with the investment advisers may elect to defer receipt of all or a percentage of their annual fees in accordance with the terms of the Trustees Deferred Compensation Plan. For the year ended September 30, 2015, no significant amounts have been deferred. Certain officers and Trustees of the Funds are officers of the above organizations.
4 Distribution Plans
Each Fund has in effect a distribution plan for Class A shares (Class A Plan) pursuant to Rule 12b-1 under the 1940 Act. Pursuant to the Class A Plan, each Fund pays EVD a distribution and service fee of 0.25% per annum of its average daily net assets attributable to Class A shares for distribution services and facilities provided to each Fund by EVD, as well as for personal services and/or the maintenance of shareholder accounts. Distribution and service fees paid or accrued to EVD for the year ended September 30, 2015 for Class A shares amounted to the following:
| | | | | | | | |
| | | AMT-Free Fund | | | National Fund | |
| | |
Class A Distribution and Service Fees | | $ | 495,849 | | | $ | 5,007,213 | |
Eaton Vance
Municipal Income Funds
September 30, 2015
Notes to Financial Statements — continued
Each Fund also has in effect distribution plans for Class B shares (Class B Plan) and Class C shares (Class C Plan) pursuant to Rule 12b-1 under the 1940 Act. Pursuant to the Class B and Class C Plans, each Fund pays EVD amounts equal to 0.75% per annum of its average daily net assets attributable to Class B and Class C shares for providing ongoing distribution services and facilities to the respective Funds. For the year ended September 30, 2015, the Funds paid or accrued to EVD the following distribution fees:
| | | | | | | | |
| | | AMT-Free Fund | | | National Fund | |
| | |
Class B Distribution Fees | | $ | 8,527 | | | $ | 254,208 | |
Class C Distribution Fees | | $ | 305,702 | | | $ | 4,636,024 | |
Pursuant to the Class B and Class C Plans, each Fund also makes payments of service fees to EVD, financial intermediaries and other persons in amounts equal to 0.25% per annum of the average daily net assets attributable to that class. Service fees paid or accrued are for personal services and/or the maintenance of shareholder accounts. They are separate and distinct from the Class B and Class C sales commissions and distribution fees payable to EVD. Service fees paid or accrued for the year ended September 30, 2015 amounted to the following:
| | | | | | | | |
| | | AMT-Free Fund | | | National Fund | |
| | |
Class B Service Fees | | $ | 2,842 | | | $ | 84,736 | |
Class C Service Fees | | $ | 101,900 | | | $ | 1,545,341 | |
5 Contingent Deferred Sales Charges
A contingent deferred sales charge (CDSC) generally is imposed on redemptions of Class B shares made within six years of purchase and on redemptions of Class C shares made within one year of purchase. Class A shares may be subject to a 1% CDSC if redeemed within eighteen months of purchase (depending on the circumstances of purchase). Generally, the CDSC is based upon the lower of the net asset value at date of redemption or date of purchase. No charge is levied on shares acquired by reinvestment of dividends or capital gain distributions. The CDSC for Class B shares is imposed at declining rates that begin at 5% in the case of redemptions in the first and second year after purchase, declining one percentage point each subsequent year. Class C shares are subject to a 1% CDSC if redeemed within one year of purchase. For the year ended September 30, 2015, the Funds were informed that EVD received approximately the following amounts of CDSCs paid by Class A, Class B and Class C shareholders:
| | | | | | | | |
| | | AMT-Free Fund | | | National Fund | |
| | |
Class A | | $ | — | | | $ | 315,000 | |
Class B | | $ | 1,000 | | | $ | 20,000 | |
Class C | | $ | 2,000 | | | $ | 17,000 | |
6 Purchases and Sales of Investments
Purchases and sales of investments, other than short-term obligations, for the year ended September 30, 2015 were as follows:
| | | | | | | | |
| | | AMT-Free Fund | | | National Fund | |
| | |
Purchases | | $ | 68,943,316 | | | $ | 2,110,459,680 | |
Sales | | $ | 64,492,640 | | | $ | 2,367,158,209 | |
Eaton Vance
Municipal Income Funds
September 30, 2015
Notes to Financial Statements — continued
7 Shares of Beneficial Interest
Each Fund’s Declaration of Trust permits the Trustees to issue an unlimited number of full and fractional shares of beneficial interest (without par value). Such shares may be issued in a number of different series (such as the Funds) and classes. Transactions in Fund shares were as follows:
| | | | | | | | | | | | | | | | |
AMT-Free Fund | |
| | | Year Ended September 30, 2015 | |
| | | Class A | | | Class B | | | Class C | | | Class I | |
| | | | |
Sales | | | 2,305,225 | | | | 4,929 | | | | 1,059,132 | | | | 2,394,293 | |
Issued to shareholders electing to receive payments of distributions in Fund shares | | | 772,082 | | | | 2,691 | | | | 107,698 | | | | 332,557 | |
Redemptions | | | (3,506,604 | ) | | | (24,386 | ) | | | (593,894 | ) | | | (1,830,598 | ) |
Exchange from Class B shares | | | 74,533 | | | | — | | | | — | | | | — | |
Exchange to Class A shares | | | — | | | | (75,016 | ) | | | — | | | | — | |
| | | | |
Net increase (decrease) | | | (354,764 | ) | | | (91,782 | ) | | | 572,936 | | | | 896,252 | |
| | | | |
| | | | | | | | | | | | | | | | |
| | | Year Ended September 30, 2014 | |
| | | Class A | | | Class B | | | Class C | | | Class I | |
| | | | |
Sales | | | 2,260,589 | | | | 10,716 | | | | 493,488 | | | | 1,798,394 | |
Issued to shareholders electing to receive payments of distributions in Fund shares | | | 915,589 | | | | 6,516 | | | | 116,929 | | | | 322,370 | |
Redemptions | | | (7,734,138 | ) | | | (71,258 | ) | | | (1,343,949 | ) | | | (2,603,722 | ) |
Exchange from Class B shares | | | 103,807 | | | | — | | | | — | | | | — | |
Exchange to Class A shares | | | — | | | | (104,467 | ) | | | — | | | | — | |
| | | | |
Net decrease | | | (4,454,153 | ) | | | (158,493 | ) | | | (733,532 | ) | | | (482,958 | ) |
| | | | |
| | | | | | | | | | | | | | | | |
National Fund | |
| | | Year Ended September 30, 2015 | |
| | | Class A | | | Class B | | | Class C | | | Class I | |
| | | | |
Sales | | | 10,853,213 | | | | 27,436 | | | | 3,822,137 | | | | 19,618,605 | |
Issued to shareholders electing to receive payments of distributions in Fund shares | | | 6,706,680 | | | | 90,077 | | | | 1,530,419 | | | | 2,386,179 | |
Redemptions | | | (40,416,710 | ) | | | (764,180 | ) | | | (11,105,550 | ) | | | (22,775,604 | ) |
Exchange from Class B shares | | | 1,051,142 | | | | — | | | | — | | | | — | |
Exchange to Class A shares | | | — | | | | (1,051,100 | ) | | | — | | | | — | |
| | | | |
Net decrease | | | (21,805,675 | ) | | | (1,697,767 | ) | | | (5,752,994 | ) | | | (770,820 | ) |
| | | | |
| | | | | | | | | | | | | | | | |
| | | Year Ended September 30, 2014 | |
| | | Class A | | | Class B | | | Class C | | | Class I | |
| | | | |
Sales | | | 21,532,161 | | | | 47,124 | | | | 5,295,179 | | | | 33,677,725 | |
Issued to shareholders electing to receive payments of distributions in Fund shares | | | 8,748,161 | | | | 176,379 | | | | 2,076,451 | | | | 3,302,382 | |
Redemptions | | | (63,950,083 | ) | | | (1,321,416 | ) | | | (18,016,785 | ) | | | (75,723,092 | ) |
Issued in connection with tax-free reorganizations (see Note 11) | | | 15,076,171 | | | | 253,158 | | | | 1,812,740 | | | | 1,261,236 | |
Exchange from Class B shares | | | 1,293,154 | | | | — | | | | — | | | | — | |
Exchange to Class A shares | | | — | | | | (1,293,046 | ) | | | — | | | | — | |
| | | | |
Net decrease | | | (17,300,436 | ) | | | (2,137,801 | ) | | | (8,832,415 | ) | | | (37,481,749 | ) |
Eaton Vance
Municipal Income Funds
September 30, 2015
Notes to Financial Statements — continued
8 Line of Credit
The Funds participate with other portfolios and funds managed by EVM and its affiliates in a $625 million unsecured line of credit agreement with a group of banks, which is in effect through September 2, 2016. Borrowings are made by the Funds solely to facilitate the handling of unusual and/or unanticipated short-term cash requirements. Interest is charged to each Fund based on its borrowings at an amount above either the Eurodollar rate or Federal Funds rate. In addition, a fee computed at an annual rate of 0.10% on the daily unused portion of the line of credit is allocated among the participating portfolios and funds at the end of each quarter. Because the line of credit is not available exclusively to the Funds, a Fund may be unable to borrow some or all of its requested amounts at any particular time. The Funds did not have any significant borrowings or allocated fees during the year ended September 30, 2015.
9 Financial Instruments
The Funds may trade in financial instruments with off-balance sheet risk in the normal course of their investing activities. These financial instruments may include financial futures contracts and may involve, to a varying degree, elements of risk in excess of the amounts recognized for financial statement purposes. The notional or contractual amounts of these instruments represent the investment a Fund has in particular classes of financial instruments and do not necessarily represent the amounts potentially subject to risk. The measurement of the risks associated with these instruments is meaningful only when all related and offsetting transactions are considered.
A summary of obligations under these financial instruments at September 30, 2015 is as follows:
| | | | | | | | | | | | | | | | | | | | |
| Futures Contracts | |
| Fund | | Expiration Month/Year | | | Contracts | | Position | | Aggregate Cost | | | Value | | | Net
Unrealized
Depreciation | |
| | | | | | |
| AMT-Free | | | 12/15 | | | 245
U.S. 10-Year Treasury Note | | Short | | $ | (31,202,586 | ) | | $ | (31,539,922 | ) | | $ | (337,336 | ) |
| | | | | | |
| | | | 12/15 | | | 121
U.S. Long Treasury Bond | | Short | | | (18,698,999 | ) | | | (19,038,594 | ) | | | (339,595 | ) |
| National | | | 12/15 | | | 2,000
U.S. Long Treasury Bond | | Short | | $ | (309,074,366 | ) | | $ | (314,687,500 | ) | | $ | (5,613,134 | ) |
At September 30, 2015, the Funds had sufficient cash and/or securities to cover commitments under these contracts.
Each Fund is subject to interest rate risk in the normal course of pursuing its investment objective. Because the Funds hold fixed-rate bonds, the value of these bonds may decrease if interest rates rise. The Funds enter into U.S. Treasury futures contracts to hedge against changes in interest rates.
The fair value of open derivative instruments (not considered to be hedging instruments for accounting disclosure purposes) and whose primary underlying risk exposure is interest rate risk at September 30, 2015 were as follows:
| | | | | | | | |
| | | AMT-Free Fund | | | National Fund | |
| | |
Liability Derivative: | | | | | | | | |
Futures Contracts | | $ | (676,931 | )(1) | | $ | (5,613,134 | )(1) |
| | |
Total | | $ | (676,931 | ) | | $ | (5,613,134 | ) |
| (1) | Amount represents cumulative unrealized depreciation on futures contracts in the Futures Contracts table above. Only the current day’s variation margin on open futures contracts is reported within the Statement of Assets and Liabilities as Receivable or Payable for variation margin, as applicable. |
Eaton Vance
Municipal Income Funds
September 30, 2015
Notes to Financial Statements — continued
The effect of derivative instruments (not considered to be hedging instruments for accounting disclosure purposes) on the Statement of Operations and whose primary underlying risk exposure is interest rate risk for the year ended September 30, 2015 was as follows:
| | | | | | | | |
| | | AMT-Free Fund | | | National Fund | |
| | |
Realized Gain (Loss) on Derivatives Recognized in Income | | $ | (2,154,100 | )(1) | | $ | (16,566,977 | )(1) |
Change in Unrealized Appreciation (Depreciation) on Derivatives Recognized in Income | | $ | (1,030,251 | )(2) | | $ | (8,888,894 | )(2) |
| (1) | Statement of Operations location: Net realized gain (loss) – Financial futures contracts. |
| (2) | Statement of Operations location: Change in unrealized appreciation (depreciation) – Financial futures contracts. |
The average notional amount of futures contracts outstanding during the year ended September 30, 2015, which is indicative of the volume of this derivative type, was approximately as follows:
| | | | | | | | |
| | | AMT-Free Fund | | | National Fund | |
| | |
Average Notional Amount: | | | | | | | | |
| | |
Futures Contracts - Short | | $ | 52,490,000 | | | $ | 354,574,000 | |
10 Fair Value Measurements
Under generally accepted accounting principles for fair value measurements, a three-tier hierarchy to prioritize the assumptions, referred to as inputs, is used in valuation techniques to measure fair value. The three-tier hierarchy of inputs is summarized in the three broad levels listed below.
| • | | Level 1 – quoted prices in active markets for identical investments |
| • | | Level 2 – other significant observable inputs (including quoted prices for similar investments, interest rates, prepayment speeds, credit risk, etc.) |
| • | | Level 3 – significant unobservable inputs (including a fund’s own assumptions in determining the fair value of investments) |
In cases where the inputs used to measure fair value fall in different levels of the fair value hierarchy, the level disclosed is determined based on the lowest level input that is significant to the fair value measurement in its entirety. The inputs or methodology used for valuing securities are not necessarily an indication of the risk associated with investing in those securities.
At September 30, 2015, the hierarchy of inputs used in valuing the Funds’ investments and open derivative instruments, which are carried at value, were as follows:
| | | | | | | | | | | | | | | | |
AMT-Free Fund | |
| Asset Description | | Level 1 | | | Level 2 | | | Level 3 | | | Total | |
| | | | |
Tax-Exempt Investments | | $ | — | | | $ | 378,256,675 | | | $ | — | | | $ | 378,256,675 | |
| | | | |
Total Investments | | $ | — | | | $ | 378,256,675 | | | $ | — | | | $ | 378,256,675 | |
| | | | |
Liability Description | | | | | | | | | | | | | | | | |
| | | | |
Futures Contracts | | $ | (676,931 | ) | | $ | — | | | $ | — | | | $ | (676,931 | ) |
| | | | |
Total | | $ | (676,931 | ) | | $ | — | | | $ | — | | | $ | (676,931 | ) |
| | | | |
| | | | | | | | | | | | | | | | |
Eaton Vance
Municipal Income Funds
September 30, 2015
Notes to Financial Statements — continued
| | | | | | | | | | | | | | | | |
National Fund | |
| Asset Description | | Level 1 | | | Level 2 | | | Level 3 | | | Total | |
| | | | |
Tax-Exempt Municipal Securities | | $ | — | | | $ | 3,381,154,512 | | | $ | — | | | $ | 3,381,154,512 | |
Taxable Municipal Securities | | | — | | | | 124,164,968 | | | | — | | | | 124,164,968 | |
Corporate Bonds & Notes | | | — | | | | 38,658,545 | | | | — | | | | 38,658,545 | |
| | | | |
Total Investments | | $ | — | | | $ | 3,543,978,025 | | | $ | — | | | $ | 3,543,978,025 | |
| | | | |
Liability Description | | | | | | | | | | | | | | | | |
| | | | |
Futures Contracts | | $ | (5,613,134 | ) | | $ | — | | | $ | — | | | $ | (5,613,134 | ) |
| | | | |
Total | | $ | (5,613,134 | ) | | $ | — | | | $ | — | | | $ | (5,613,134 | ) |
The Funds held no investments or other financial instruments as of September 30, 2014 whose fair value was determined using Level 3 inputs. At September 30, 2015, there were no investments transferred between Level 1 and Level 2 during the year then ended.
11 Reorganizations
As of the close of business on June 27, 2014, National Fund acquired the net assets of Eaton Vance Alabama Municipal Income Fund (Alabama Fund), Eaton Vance Arkansas Municipal Income Fund (Arkansas Fund), Eaton Vance Kentucky Municipal Income Fund (Kentucky Fund) and Eaton Vance Tennessee Municipal Income Fund (Tennessee Fund) pursuant to a plan of reorganization approved by the shareholders of Alabama Fund, Arkansas Fund, Kentucky Fund and Tennessee Fund, respectively. The purpose of the transaction was to combine five funds managed by BMR with substantially similar investment objectives and policies. The acquisitions were accomplished by a tax-free exchange of shares of Class A, Class B, Class C and Class I of National Fund for shares of Class A, Class B, Class C and Class I of Alabama Fund, Arkansas Fund, Kentucky Fund and Tennessee Fund, respectively, each outstanding on June 27, 2014 as follows:
| | | | | | | | | | | | |
| | | | | | Alabama Fund | |
| | | Shares of National
Fund Issued | | | Shares
Exchanged | | | Net Assets | |
Class A | | | 3,691,256 | | | | 3,716,509 | | | $ | 35,890,818 | |
Class B | | | 36,727 | | | | 33,617 | | | | 357,069 | |
Class C | | | 225,460 | | | | 206,216 | | | | 2,192,152 | |
Class I | | | 420,267 | | | | 423,107 | | | | 4,086,506 | |
| | | |
Total | | | | | | | | | | $ | 42,526,545 | |
| | | |
| | | | | | | | | | | | |
| | | | | | Arkansas Fund | |
| | | Shares of National
Fund Issued | | | Shares
Exchanged | | | Net Assets | |
Class A | | | 4,659,303 | | | | 5,049,539 | | | $ | 45,303,340 | |
Class B | | | 114,585 | | | | 115,588 | | | | 1,114,022 | |
Class C | | | 510,064 | | | | 514,666 | | | | 4,959,348 | |
Class I | | | 207,464 | | | | 225,005 | | | | 2,017,301 | |
| | | |
Total | | | | | | | | | | $ | 53,394,011 | |
Eaton Vance
Municipal Income Funds
September 30, 2015
Notes to Financial Statements — continued
| | | | | | | | | | | | |
| | | | | | Kentucky Fund | |
| | | Shares of National
Fund Issued | | | Shares
Exchanged | | | Net Assets | |
Class A | | | 3,797,691 | | | | 4,154,124 | | | $ | 36,925,713 | |
Class B | | | 31,661 | | | | 32,076 | | | | 307,814 | |
Class C | | | 362,200 | | | | 366,730 | | | | 3,521,673 | |
Class I | | | 580,066 | | | | 634,619 | | | | 5,640,334 | |
| | | |
Total | | | | | | | | | | $ | 46,395,534 | |
| | | |
| | | | | | | | | | | | |
| | | | | | Tennessee Fund | |
| | | Shares of National
Fund Issued | | | Shares
Exchanged | | | Net Assets | |
Class A | | | 2,927,921 | | | | 3,293,416 | | | $ | 28,468,757 | |
Class B | | | 70,185 | | | | 72,464 | | | | 682,352 | |
Class C | | | 715,016 | | | | 738,735 | | | | 6,952,103 | |
Class I | | | 53,439 | | | | 60,153 | | | | 519,619 | |
| | | |
Total | | | | | | | | | | $ | 36,622,831 | |
The investment portfolios of Alabama Fund, Arkansas Fund, Kentucky Fund and Tennessee Fund, with a fair value of $38,863,121, $50,565,357, $45,250,238 and $34,791,586, respectively, and identified cost of $36,052,796, $48,439,943, $42,026,544 and $33,403,232, respectively, were the principal assets acquired by National Fund. For financial reporting purposes, assets received and shares issued by National Fund were recorded at fair value; however, the identified cost of the investments received from Alabama Fund, Arkansas Fund, Kentucky Fund and Tennessee Fund were carried forward to align ongoing reporting of National Fund’s realized and unrealized gains and losses with amounts distributable to shareholders for tax purposes. The aggregate net assets of National Fund immediately before the acquisition were $3,326,647,761. The net assets of Alabama Fund, Arkansas Fund, Kentucky Fund and Tennessee Fund at that date of $42,526,545, $53,394,011, $46,395,534 and $36,622,831, respectively, including $2,989,917, $7,112,190, $2,273,833 and $6,719,288 of accumulated net realized losses, respectively, and $2,810,325, $2,125,414, $3,223,694 and $1,388,354 of unrealized appreciation, respectively, were combined with those of National Fund, resulting in combined net assets of $3,505,586,682.
Assuming the acquisitions had been completed on October 1, 2013, the beginning of National Fund’s annual reporting period, National Fund’s pro forma results of operations for the year ended September 30, 2014 were as follows:
| | | | |
Net investment income | | $ | 166,228,357 | |
Net realized gain | | $ | 23,408,511 | |
Net increase in net assets from operations | | $ | 418,670,891 | |
Because the combined investment portfolios have been managed as a single integrated portfolio since the acquisitions were completed, it was not practicable to separate the amounts of revenue and earnings of Alabama Fund, Arkansas Fund, Kentucky Fund and Tennessee Fund since June 27, 2014 through September 30, 2014.
Eaton Vance
AMT-Free Municipal Income Fund
September 30, 2015
Report of Independent Registered Public Accounting Firm
To the Trustees of Eaton Vance Mutual Funds Trust and Shareholders of Eaton Vance AMT-Free Municipal Income Fund:
We have audited the accompanying statement of assets and liabilities of Eaton Vance AMT-Free Municipal Income Fund (the “Fund”) (one of the funds constituting Eaton Vance Mutual Funds Trust), including the portfolio of investments, as of September 30, 2015, and the related statements of operations and cash flows for the year then ended, the statements of changes in net assets for each of the two years in the period then ended, and the financial highlights for each of the periods presented. These financial statements and financial highlights are the responsibility of the Fund’s management. Our responsibility is to express an opinion on these financial statements and financial highlights based on our audits.
We conducted our audits in accordance with the standards of the Public Company Accounting Oversight Board (United States). Those standards require that we plan and perform the audit to obtain reasonable assurance about whether the financial statements and financial highlights are free of material misstatement. The Fund is not required to have, nor were we engaged to perform, an audit of its internal control over financial reporting. Our audits included consideration of internal control over financial reporting as a basis for designing audit procedures that are appropriate in the circumstances, but not for the purpose of expressing an opinion on the effectiveness of the Fund’s internal control over financial reporting. Accordingly, we express no such opinion. An audit also includes examining, on a test basis, evidence supporting the amounts and disclosures in the financial statements, assessing the accounting principles used and significant estimates made by management, as well as evaluating the overall financial statement presentation. Our procedures included confirmation of securities owned as of September 30, 2015, by correspondence with the custodian and brokers; where replies were not received from brokers, we performed other auditing procedures. We believe that our audits provide a reasonable basis for our opinion.
In our opinion, such financial statements and financial highlights referred to above present fairly, in all material respects, the financial position of Eaton Vance AMT-Free Municipal Income Fund as of September 30, 2015, the results of its operations and its cash flows for the year then ended, the changes in its net assets for each of the two years in the period then ended, and the financial highlights for each of the periods presented, in conformity with accounting principles generally accepted in the United States of America.
DELOITTE & TOUCHE LLP
Boston, Massachusetts
November 18, 2015
Eaton Vance
National Municipal Income Fund
September 30, 2015
Report of Independent Registered Public Accounting Firm
To the Trustees of Eaton Vance Municipals Trust and Shareholders of Eaton Vance National Municipal Income Fund:
We have audited the accompanying statement of assets and liabilities of Eaton Vance National Municipal Income Fund (the “Fund”) (one of the funds constituting Eaton Vance Municipals Trust), including the portfolio of investments, as of September 30, 2015, and the related statements of operations and cash flows for the year then ended, the statements of changes in net assets for each of the two years in the period then ended, and the financial highlights for each of the five years in the period then ended. These financial statements and financial highlights are the responsibility of the Fund’s management. Our responsibility is to express an opinion on these financial statements and financial highlights based on our audits.
We conducted our audits in accordance with the standards of the Public Company Accounting Oversight Board (United States). Those standards require that we plan and perform the audit to obtain reasonable assurance about whether the financial statements and financial highlights are free of material misstatement. The Fund is not required to have, nor were we engaged to perform, an audit of its internal control over financial reporting. Our audits included consideration of internal control over financial reporting as a basis for designing audit procedures that are appropriate in the circumstances, but not for the purpose of expressing an opinion on the effectiveness of the Fund’s internal control over financial reporting. Accordingly, we express no such opinion. An audit also includes examining, on a test basis, evidence supporting the amounts and disclosures in the financial statements, assessing the accounting principles used and significant estimates made by management, as well as evaluating the overall financial statement presentation. Our procedures included confirmation of securities owned as of September 30, 2015, by correspondence with the custodian and brokers; where replies were not received from brokers, we performed other auditing procedures. We believe that our audits provide a reasonable basis for our opinion.
In our opinion, such financial statements and financial highlights referred to above present fairly, in all material respects, the financial position of Eaton Vance National Municipal Income Fund as of September 30, 2015, the results of its operations and its cash flows for the year then ended, the changes in its net assets for each of the two years in the period then ended, and the financial highlights for each of the five years in the period then ended, in conformity with accounting principles generally accepted in the United States of America.
DELOITTE & TOUCHE LLP
Boston, Massachusetts
November 18, 2015
Eaton Vance
Municipal Income Funds
September 30, 2015
Federal Tax Information (Unaudited)
The Form 1099-DIV you receive in February 2016 will show the tax status of all distributions paid to your account in calendar year 2015. Shareholders are advised to consult their own tax adviser with respect to the tax consequences of their investment in the Funds. As required by the Internal Revenue Code and/or regulations, shareholders must be notified regarding exempt-interest dividends.
Exempt-Interest Dividends. For the fiscal year ended September 30, 2015, the Funds designate the following percentages of distributions from net investment income as exempt-interest dividends:
| | | | |
AMT-Free Municipal Income Fund | | | 99.93 | % |
National Municipal Income Fund | | | 95.13 | % |
Eaton Vance
Municipal Income Funds
September 30, 2015
Board of Trustees’ Contract Approval
Overview of the Contract Review Process
The Investment Company Act of 1940, as amended (the “1940 Act”), provides, in substance, that each investment advisory agreement between a fund and its investment adviser will continue in effect from year to year only if its continuation is approved at least annually by the fund’s board of trustees, including by a vote of a majority of the trustees who are not “interested persons” of the fund (“Independent Trustees”), cast in person at a meeting called for the purpose of considering such approval.
At a meeting of the Boards of Trustees (each a “Board”) of the registered investment companies advised, administered and/or distributed by Eaton Vance Management or its affiliates (the “Eaton Vance Funds”) held on April 27, 2015, the Board, including a majority of the Independent Trustees, voted to approve continuation of existing investment advisory and sub-advisory agreements for the Eaton Vance Funds for an additional one-year period. In voting its approval, the Board relied upon the affirmative recommendation of its Contract Review Committee, which is a committee comprised exclusively of Independent Trustees. Prior to making its recommendation, the Contract Review Committee reviewed information furnished by each adviser to the Eaton Vance Funds (including information specifically requested by the Board) for a series of meetings of the Contract Review Committee held between February and April 2015. The Contract Review Committee also considered information received at prior meetings of the Board and its committees, as relevant to its annual evaluation of the investment advisory and sub-advisory agreements.
The information that the Board considered included, among other things, the following:
Information about Fees, Performance and Expenses
| • | | A report from an independent data provider comparing the advisory and related fees paid by each fund with fees paid by comparable funds as identified by the data provider (“comparable funds”); |
| • | | A report from an independent data provider comparing each fund’s total expense ratio and its components to comparable funds; |
| • | | A report from an independent data provider comparing the investment performance of each fund (including, where relevant, yield data, Sharpe ratios and information ratios) to the investment performance of comparable funds over various time periods; |
| • | | Data regarding investment performance in comparison to benchmark indices and customized peer groups identified by the adviser in consultation with the Board; |
| • | | For each fund, comparative information concerning the fees charged and the services provided by each adviser in managing other accounts (including mutual funds, other collective investment funds and institutional accounts) using investment strategies and techniques similar to those used in managing such fund; |
| • | | Profitability analyses for each adviser with respect to each fund; |
Information about Portfolio Management and Trading
| • | | Descriptions of the investment management services provided to each fund, including the investment strategies and processes it employs; |
| • | | The procedures and processes used to determine the fair value of fund assets and actions taken to monitor and test the effectiveness of such procedures and processes; |
| • | | Information about each adviser’s policies and practices with respect to trading, including each adviser’s processes for monitoring best execution of portfolio transactions; |
| • | | Information about the allocation of brokerage transactions and the benefits received by each adviser as a result of brokerage allocation, including information concerning the acquisition of research through client commission arrangements and policies with respect to “soft dollars”; |
| • | | Data relating to portfolio turnover rates of each fund; |
Information about each Adviser
| • | | Reports detailing the financial results and condition of each adviser; |
| • | | Descriptions of the qualifications, education and experience of the individual investment professionals whose responsibilities include portfolio management and investment research for the funds, and information relating to their compensation and responsibilities with respect to managing other mutual funds and investment accounts; |
| • | | The Code of Ethics of each adviser and its affiliates, together with information relating to compliance with and the administration of such codes; |
| • | | Policies and procedures relating to proxy voting and the handling of corporate actions and class actions; |
| • | | Information concerning the resources devoted to compliance efforts undertaken by each adviser and its affiliates (including descriptions of various compliance programs) and their record of compliance; |
| • | | Descriptions of the business continuity and disaster recovery plans of each adviser and its affiliates; |
| • | | A description of Eaton Vance Management’s procedures for overseeing third party advisers and sub-advisers, including with respect to regulatory and compliance issues, investment management and other matters; |
Eaton Vance
Municipal Income Funds
September 30, 2015
Board of Trustees’ Contract Approval — continued
Other Relevant Information
| • | | Information concerning the nature, cost and character of the administrative and other non-investment management services provided by Eaton Vance Management and its affiliates; |
| • | | Information concerning management of the relationship with the custodian, subcustodians and fund accountants by each adviser or the funds’ administrator; and |
| • | | The terms of each investment advisory agreement. |
Over the course of the twelve-month period ended April 30, 2015, with respect to one or more funds, the Board met nine times and the Contract Review Committee, the Audit Committee, the Governance Committee, the Portfolio Management Committee and the Compliance Reports and Regulatory Matters Committee, each of which is a Committee comprised solely of Independent Trustees, met eight, seventeen, seven, eleven and thirteen times, respectively. At such meetings, the Trustees participated in investment and performance reviews with the portfolio managers and other investment professionals of each adviser relating to each fund, and considered the investment and trading strategies used in pursuing each fund’s investment objective, including, where relevant, the use of derivative instruments, as well as processes for monitoring best execution of portfolio transactions and risk management techniques. The Board and its Committees also evaluated issues pertaining to industry and regulatory developments, compliance procedures, fund governance and other issues with respect to the funds, and received and participated in reports and presentations provided by Eaton Vance Management and other fund advisers with respect to such matters. In addition to the formal meetings of the Board and its Committees, the Independent Trustees hold regular teleconferences in between meetings to discuss, among other topics, matters relating to the continuation of investment advisory and sub-advisory agreements.
For funds that invest through one or more underlying portfolios, the Board considered similar information about the portfolio(s) when considering the approval of investment advisory agreements. In addition, in cases where the fund’s investment adviser has engaged a sub-adviser, the Board considered similar information about the sub-adviser when considering the approval of any sub-advisory agreement.
The Contract Review Committee was assisted throughout the contract review process by Goodwin Procter LLP, legal counsel for the Independent Trustees. The members of the Contract Review Committee relied upon the advice of such counsel and their own business judgment in determining the material factors to be considered in evaluating each investment advisory and sub-advisory agreement and the weight to be given to each such factor. The conclusions reached with respect to each investment advisory and sub-advisory agreement were based on a comprehensive evaluation of all the information provided and not any single factor. Moreover, each member of the Contract Review Committee may have placed varying emphasis on particular factors in reaching conclusions with respect to each investment advisory and sub-advisory agreement. In evaluating each investment advisory and sub-advisory agreement, including the specific fee structures and other terms of the agreements, the Contract Review Committee was informed by multiple years of analysis and discussion among the Independent Trustees and the Eaton Vance Funds’ advisers and sub-advisers.
Results of the Process
Based on its consideration of the foregoing, and such other information as it deemed relevant, including the factors and conclusions described below, the Contract Review Committee concluded that the continuation of the investment advisory agreements of the following funds:
| • | | Eaton Vance AMT-Free Municipal Income Fund |
| • | | Eaton Vance National Municipal Income Fund |
(the “Funds”), each with Eaton Vance Management or an affiliate (the “Adviser”), including their fee structures, is in the interests of shareholders and, therefore, the Contract Review Committee recommended to the Board approval of each agreement. The Board accepted the recommendation of the Contract Review Committee as well as the factors considered and conclusions reached by the Contract Review Committee with respect to each agreement. Accordingly, the Board, including a majority of the Independent Trustees, voted to approve continuation of the investment advisory agreement for each Fund.
Nature, Extent and Quality of Services
In considering whether to approve the investment advisory agreements of the Funds, the Board evaluated the nature, extent and quality of services provided to the Funds by the Adviser.
The Board considered the Adviser’s management capabilities and investment process with respect to the types of investments held by each Fund, including the education, experience and number of its investment professionals and other personnel who provide portfolio management, investment research, and similar services to the Funds, including recent changes to such personnel, where relevant. In particular, the Board considered, where relevant, the abilities and experience of such investment personnel in analyzing factors such as credit risk, tax efficiency, and special considerations relevant to investing in municipal obligations. The Board considered the Adviser’s large municipal bond team, which includes portfolio managers and credit specialists who provide services to the Funds. The Board also took into account the resources dedicated to portfolio management and other services, as well as the compensation methods of the Adviser and other factors, such as the reputation and resources of the Adviser to recruit and retain investment personnel. In addition, the Board considered the time and attention devoted to each Fund by senior management, as well as the infrastructure, operational capabilities and support staff in place to assist in the management of the Funds, including the provision of administrative services.
Eaton Vance
Municipal Income Funds
September 30, 2015
Board of Trustees’ Contract Approval — continued
The Board considered the compliance programs of the Adviser and relevant affiliates thereof. Among other matters, the Board considered compliance and reporting matters relating to personal trading by investment personnel, selective disclosure of portfolio holdings, late trading, frequent trading, portfolio valuation, business continuity and the allocation of investment opportunities. The Board also considered the responses of the Adviser and its affiliates to requests in recent years from regulatory authorities such as the Securities and Exchange Commission and the Financial Industry Regulatory Authority.
The Board considered shareholder and other administrative services provided or managed by Eaton Vance Management and its affiliates, including transfer agency and accounting services. The Board evaluated the benefits to shareholders of investing in a fund that is a part of a large family of funds, including the ability, in many cases, to exchange an investment among different funds without incurring additional sales charges.
After consideration of the foregoing factors, among others, the Board concluded that the nature, extent and quality of services provided by the Adviser, taken as a whole, are appropriate and consistent with the terms of the investment advisory agreements.
Fund Performance
The Board compared each Fund’s investment performance to that of comparable funds and appropriate benchmark indices and assessed each Fund’s performance on the basis of total return and current income return. The Board’s review included comparative performance data for the one-, three-, five- and ten-year periods ended September 30, 2014 for each Fund. The Board considered, among other things, the Adviser’s efforts to generate competitive levels of tax-exempt current income over time through investments that, relative to comparable funds, focus on higher quality municipal bonds with longer maturities. The Board concluded that the performance of each Fund was satisfactory.
Management Fees and Expenses
The Board considered contractual fee rates payable by each Fund for advisory and administrative services (referred to collectively as “management fees”). As part of its review, the Board considered each Fund’s management fees and total expense ratio for the year ended September 30, 2014, as compared to those of comparable funds, before and after giving effect to any undertaking to waive fees or reimburse expenses. The Board also considered factors that had an impact on Fund expense ratios, as identified by management in response to inquiries from the Contract Review Committee, as well as actions taken by management in recent years to reduce expenses at the fund complex level.
After considering the foregoing information, and in light of the nature, extent and quality of the services provided by the Adviser, the Board concluded that the management fees charged for advisory and related services are reasonable.
Profitability
The Board considered the level of profits realized by the Adviser and relevant affiliates thereof in providing investment advisory and administrative services to each Fund and to all Eaton Vance Funds as a group. The Board considered the level of profits realized without regard to revenue sharing or other payments by the Adviser and its affiliates to third parties in respect of distribution services. The Board also considered other direct or indirect benefits received by the Adviser and its affiliates in connection with their relationships with the Funds, including the benefits of research services that may be available to the Adviser as a result of securities transactions effected for the Funds and other investment advisory clients.
The Board concluded that, in light of the foregoing factors and the nature, extent and quality of the services rendered, the profits realized by the Adviser and its affiliates are reasonable.
Economies of Scale
In reviewing management fees and profitability, the Board also considered the extent to which the Adviser and its affiliates, on the one hand, and each Fund, on the other hand, can expect to realize benefits from economies of scale as the assets of each Fund increase. The Board acknowledged the difficulty in accurately measuring the benefits resulting from the economies of scale with respect to the management of any specific fund or group of funds. The Board reviewed data summarizing the increases and decreases in the assets of each Fund and of all Eaton Vance Funds as a group over various time periods, and evaluated the extent to which the total expense ratio of each Fund and the profitability of the Adviser and its affiliates may have been affected by such increases or decreases. Based upon the foregoing, the Board concluded that each Fund currently shares in the benefits from economies of scale. The Board also concluded that, assuming reasonably foreseeable increases in the assets of each Fund, the structure of each advisory fee, which includes breakpoints at several asset levels, will allow each Fund to continue to benefit from economies of scale in the future.
Eaton Vance
Municipal Income Funds
September 30, 2015
Management and Organization
Fund Management. The Trustees of Eaton Vance Municipals Trust (MT) and Eaton Vance Mutual Funds Trust (MFT) (collectively, the Trusts) are responsible for the overall management and supervision of the Trusts’ affairs. The Trustees and officers of the Trusts are listed below. Except as indicated, each individual has held the office shown or other offices in the same company for the last five years. Trustees and officers of the Trusts hold indefinite terms of office. The “Noninterested Trustees” consist of those Trustees who are not “interested persons” of the Trusts, as that term is defined under the 1940 Act. The business address of each Trustee and officer is Two International Place, Boston, Massachusetts 02110. As used below, “EVC” refers to Eaton Vance Corp., “EV” refers to Eaton Vance, Inc., “EVM” refers to Eaton Vance Management, “BMR” refers to Boston Management and Research and “EVD” refers to Eaton Vance Distributors, Inc. EVC and EV are the corporate parent and trustee, respectively, of EVM and BMR. EVD is the Funds’ principal underwriter and a wholly-owned subsidiary of EVC. Each officer affiliated with Eaton Vance may hold a position with other Eaton Vance affiliates that is comparable to his or her position with EVM listed below. Each Trustee oversees 174 portfolios in the Eaton Vance Complex (including all master and feeder funds in a master feeder structure). Each officer serves as an officer of certain other Eaton Vance funds. Each Trustee and officer serves until his or her successor is elected.
| | | | | | |
| Name and Year of Birth | | Position(s) with the Trusts | | Trustee Since(1) | | Principal Occupation(s) and Directorships During Past Five Years and Other Relevant Experience |
Interested Trustee | | | | | | |
| | | |
Thomas E. Faust Jr. 1958 | | Trustee | | 2007 | | Chairman, Chief Executive Officer and President of EVC, Director and President of EV, Chief Executive Officer and President of EVM and BMR, and Director of EVD. Trustee and/or officer of 174 registered investment companies. Mr. Faust is an interested person because of his positions with EVM, BMR, EVD, EVC and EV, which are affiliates of the Trusts. Directorships in the Last Five Years.(2) Director of EVC and Hexavest Inc. |
Noninterested Trustees | | | | | | |
| | | |
Scott E. Eston 1956 | | Trustee | | 2011 | | Private investor. Formerly held various positions at Grantham, Mayo, Van Otterloo and Co., L.L.C. (investment management firm) (1997-2009), including Chief Operating Officer (2002-2009), Chief Financial Officer (1997-2009) and Chairman of the Executive Committee (2002-2008); President and Principal Executive Officer, GMO Trust (open-end registered investment company) (2006-2009). Former Partner, Coopers and Lybrand L.L.P. (now PricewaterhouseCoopers) (public accounting firm) (1987-1997). Directorships in the Last Five Years.(2) None. |
| | | |
Cynthia E. Frost 1961 | | Trustee | | 2014 | | Private investor. Formerly, Chief Investment Officer of Brown University (university endowment) (2000-2012); Portfolio Strategist for Duke Management Company (university endowment manager) (1995-2000); Managing Director, Cambridge Associates (1989-1995); Consultant, Bain and Company (1987-1989); Senior Equity Analyst, BA Investment Management Company (1983-1985). Directorships in the Last Five Years. None. |
| | | |
George J. Gorman 1952 | | Trustee | | 2014 | | Principal at George J. Gorman LLC (consulting firm). Formerly, Senior Partner at Ernst & Young LLP (public accounting firm) (1974-2009). Directorships in the Last Five Years. Formerly, Trustee of the Bank of America Money Market Funds Series Trust (2011-2014) and of the Ashmore Funds (2010-2014). |
| | | |
Valerie A. Mosley 1960 | | Trustee | | 2014 | | Chairwoman and Chief Executive Officer of Valmo Ventures (a consulting and investment firm). Former Partner and Senior Vice President, Portfolio Manager and Investment Strategist at Wellington Management Company, LLP (investment management firm) (1992-2012). Former Chief Investment Officer, PG Corbin Asset Management (1990-1992). Formerly worked in institutional corporate bond sales at Kidder Peabody (1986-1990). Directorships in the Last Five Years.(2) Director of Dynex Capital, Inc. (mortgage REIT) (since 2013). |
| | | |
William H. Park 1947 | | Trustee | | 2003 | | Private investor. Formerly, Consultant (2012-2014). Formerly, Chief Financial Officer, Aveon Group L.P. (investment management firm) (2010-2011). Formerly, Vice Chairman, Commercial Industrial Finance Corp. (specialty finance company) (2006-2010). Formerly, President and Chief Executive Officer, Prizm Capital Management, LLC (investment management firm) (2002-2005). Formerly, Executive Vice President and Chief Financial Officer, United Asset Management Corporation (investment management firm) (1982-2001). Formerly, Senior Manager, Price Waterhouse (now PricewaterhouseCoopers) (an independent registered public accounting firm) (1972-1981). Directorships in the Last Five Years.(2) None. |
Eaton Vance
Municipal Income Funds
September 30, 2015
Management and Organization — continued
| | | | | | |
| Name and Year of Birth | | Position(s) with the Trusts | | Trustee Since(1) | | Principal Occupation(s) and Directorships During Past Five Years and Other Relevant Experience |
Noninterested Trustees (continued) |
| | | |
Helen Frame Peters 1948 | | Trustee | | 2008 | | Professor of Finance, Carroll School of Management, Boston College. Formerly, Dean, Carroll School of Management, Boston College (2000-2002). Formerly, Chief Investment Officer, Fixed Income, Scudder Kemper Investments (investment management firm) (1998-1999). Formerly, Chief Investment Officer, Equity and Fixed Income, Colonial Management Associates (investment management firm) (1991-1998). Directorships in the Last Five Years.(2) Formerly, Director of BJ’s Wholesale Club, Inc. (wholesale club retailer) (2004-2011). Formerly, Trustee of SPDR Index Shares Funds and SPDR Series Trust (exchange traded funds) (2000-2009). Formerly, Director of Federal Home Loan Bank of Boston (a bank for banks) (2007-2009). |
| | | |
Susan J. Sutherland(3) 1957 | | Trustee | | 2015 | | Private investor. Formerly, Associate, Counsel and Partner at Skadden, Arps, Slate, Meagher & Flom LLP (law firm) (1982-2013). Directorships in the Last Five Years. Formerly, Director of Montpelier Re Holdings Ltd. (global provider of customized insurance and reinsurance products) (2013-2015). |
| | | |
Harriett Tee Taggart 1948 | | Trustee | | 2011 | | Managing Director, Taggart Associates (a professional practice firm). Formerly, Partner and Senior Vice President, Wellington Management Company, LLP (investment management firm) (1983-2006). Directorships in the Last Five Years.(2) Director of Albemarle Corporation (chemicals manufacturer) (since 2007) and The Hanover Group (specialty property and casualty insurance company) (since 2009). Formerly, Director of Lubrizol Corporation (specialty chemicals) (2007-2011). |
| | | |
Ralph F. Verni 1943 | | Chairman of the Board and Trustee | | 2007 (Chairman) 2005 (Trustee) | | Consultant and private investor. Formerly, Chief Investment Officer (1982-1992), Chief Financial Officer (1988-1990) and Director (1982-1992), New England Life. Formerly, Chairperson, New England Mutual Funds (1982-1992). Formerly, President and Chief Executive Officer, State Street Management & Research (1992-2000). Formerly, Chairperson, State Street Research Mutual Funds (1992-2000). Formerly, Director, W.P. Carey, LLC (1998-2004) and First Pioneer Farm Credit Corp. (2002-2006). Directorships in the Last Five Years.(2) None. |
| | | |
| | | | | | |
Principal Officers who are not Trustees |
| Name and Year of Birth | | Position(s) with the Trusts | | Officer Since(4) | | Principal Occupation(s) During Past Five Years |
| | | |
Payson F. Swaffield 1956 | | President | | 2003 | | Vice President and Chief Income Investment Officer of EVM and BMR. |
| | | |
Maureen A. Gemma 1960 | | Vice President, Secretary and Chief Legal Officer | | 2005 | | Vice President of EVM and BMR. |
| | | |
James F. Kirchner 1967 | | Treasurer | | 2007 | | Vice President of EVM and BMR. |
| | | |
Paul M. O’Neil 1953 | | Chief Compliance Officer | | 2004 | | Vice President of EVM and BMR. |
| (1) | Year first appointed to serve as Trustee for a fund in the Eaton Vance family of funds. Each Trustee has served continuously since appointment unless indicated otherwise. |
| (2) | During their respective tenures, the Trustees (except for Mmes. Frost and Sutherland and Mr. Gorman) also served as Board members of one or more of the following funds (which operated in the years noted): eUnitsTM 2 Year U.S. Market Participation Trust: Upside to Cap / Buffered Downside (launched in 2012 and terminated in 2014); eUnitsTM 2 Year U.S. Market Participation Trust II: Upside to Cap / Buffered Downside (launched in 2012 and terminated in 2014); Eaton Vance Credit Opportunities Fund (launched in 2005 and terminated in 2010); and Eaton Vance National Municipal Income Trust (launched in 1998 and terminated in 2009). However, Ms. Mosley did not serve as a Board member of eUnitsTM 2 Year U.S. Market Participation Trust: Upside to Cap / Buffered Downside (launched in 2012 and terminated in 2014). |
Eaton Vance
Municipal Income Funds
September 30, 2015
Management and Organization — continued
| (3) | Ms. Sutherland began serving as a Trustee effective May 1, 2015. |
| (4) | Year first elected to serve as officer of a fund in the Eaton Vance family of funds when the officer has served continuously. Otherwise, year of most recent election as an officer of a fund in the Eaton Vance family of funds. Titles may have changed since initial election. |
The SAI for the Funds includes additional information about the Trustees and officers of the Funds and can be obtained without charge on Eaton Vance’s website at www.eatonvance.com or by calling 1-800-262-1122.
Eaton Vance Funds
IMPORTANT NOTICES
Privacy. The Eaton Vance organization is committed to ensuring your financial privacy. Each of the financial institutions identified below has in effect the following policy (“Privacy Policy”) with respect to nonpublic personal information about its customers:
| • | | Only such information received from you, through application forms or otherwise, and information about your Eaton Vance fund transactions will be collected. This may include information such as name, address, social security number, tax status, account balances and transactions. |
| • | | None of such information about you (or former customers) will be disclosed to anyone, except as permitted by law (which includes disclosure to employees necessary to service your account). In the normal course of servicing a customer’s account, Eaton Vance may share information with unaffiliated third parties that perform various required services such as transfer agents, custodians and broker-dealers. |
| • | | Policies and procedures (including physical, electronic and procedural safeguards) are in place that are designed to protect the confidentiality of such information. |
| • | | We reserve the right to change our Privacy Policy at any time upon proper notification to you. Customers may want to review our Privacy Policy periodically for changes by accessing the link on our homepage: www.eatonvance.com. |
Our pledge of privacy applies to the following entities within the Eaton Vance organization: the Eaton Vance Family of Funds, Eaton Vance Management, Eaton Vance Investment Counsel, Eaton Vance Distributors, Inc., Eaton Vance Trust Company, Eaton Vance Management’s Real Estate Investment Group and Boston Management and Research. In addition, our Privacy Policy applies only to those Eaton Vance customers who are individuals and who have a direct relationship with us. If a customer’s account (i.e., fund shares) is held in the name of a third-party financial advisor/broker-dealer, it is likely that only such advisor’s privacy policies apply to the customer. This notice supersedes all previously issued privacy disclosures. For more information about Eaton Vance’s Privacy Policy, please call 1-800-262-1122.
Delivery of Shareholder Documents. The Securities and Exchange Commission (SEC) permits funds to deliver only one copy of shareholder documents, including prospectuses, proxy statements and shareholder reports, to fund investors with multiple accounts at the same residential or post office box address. This practice is often called “householding” and it helps eliminate duplicate mailings to shareholders. Eaton Vance, or your financial advisor, may household the mailing of your documents indefinitely unless you instruct Eaton Vance, or your financial advisor, otherwise. If you would prefer that your Eaton Vance documents not be householded, please contact Eaton Vance at 1-800-262-1122, or contact your financial advisor. Your instructions that householding not apply to delivery of your Eaton Vance documents will be effective within 30 days of receipt by Eaton Vance or your financial advisor.
Portfolio Holdings. Each Eaton Vance Fund and its underlying Portfolio(s) (if applicable) will file a schedule of portfolio holdings on Form N-Q with the SEC for the first and third quarters of each fiscal year. The Form N-Q will be available on the Eaton Vance website at www.eatonvance.com, by calling Eaton Vance at 1-800-262-1122 or in the EDGAR database on the SEC’s website at www.sec.gov. Form N-Q may also be reviewed and copied at the SEC’s public reference room in Washington, D.C. (call 1-800-732-0330 for information on the operation of the public reference room).
Proxy Voting. From time to time, funds are required to vote proxies related to the securities held by the funds. The Eaton Vance Funds or their underlying Portfolios (if applicable) vote proxies according to a set of policies and procedures approved by the Funds’ and Portfolios’ Boards. You may obtain a description of these policies and procedures and information on how the Funds or Portfolios voted proxies relating to portfolio securities during the most recent 12-month period ended June 30, without charge, upon request, by calling 1-800-262-1122 and by accessing the SEC’s website at www.sec.gov.
Investment Advisers
AMT-Free Municipal Income Fund
Eaton Vance Management
Two International Place
Boston, MA 02110
National Municipal Income Fund
Boston Management and Research
Two International Place
Boston, MA 02110
Administrator
Eaton Vance Management
Two International Place
Boston, MA 02110
Principal Underwriter*
Eaton Vance Distributors, Inc.
Two International Place
Boston, MA 02110
(617) 482-8260
Custodian
State Street Bank and Trust Company
State Street Financial Center, One Lincoln Street
Boston, MA 02111
Transfer Agent
BNY Mellon Investment Servicing (US) Inc.
Attn: Eaton Vance Funds
P.O. Box 9653
Providence, RI 02940-9653
(800) 262-1122
Independent Registered Public Accounting Firm
Deloitte & Touche LLP
200 Berkeley Street
Boston, MA 02116-5022
Fund Offices
Two International Place
Boston, MA 02110
| * | FINRA BrokerCheck. Investors may check the background of their Investment Professional by contacting the Financial Industry Regulatory Authority (FINRA). FINRA BrokerCheck is a free tool to help investors check the professional background of current and former FINRA-registered securities firms and brokers. FINRA BrokerCheck is available by calling 1-800-289-9999 and at www.FINRA.org. The FINRA BrokerCheck brochure describing this program is available to investors at www.FINRA.org. |
Item 2. Code of Ethics
The registrant has adopted a code of ethics applicable to its Principal Executive Officer, Principal Financial Officer and Principal Accounting Officer. The registrant undertakes to provide a copy of such code of ethics to any person upon request, without charge, by calling 1-800-262-1122.
Item 3. Audit Committee Financial Expert
The registrant’s Board has designated William H. Park, an independent trustee, as its audit committee financial expert. Mr. Park is a certified public accountant who is a private investor. Previously, he served as a consultant, as the Chief Financial Officer of Aveon Group, L.P. (an investment management firm), as the Vice Chairman of Commercial Industrial Finance Corp. (specialty finance company), as President and Chief Executive Officer of Prizm Capital Management, LLC (investment management firm), as Executive Vice President and Chief Financial Officer of United Asset Management Corporation (an institutional investment management firm) and as a Senior Manager at Price Waterhouse (now PricewaterhouseCoopers) (an independent registered public accounting firm).
Item 4. Principal Accountant Fees and Services
(a)-(d)
Eaton Vance AMT-Free Municipal Income Fund, Eaton Vance Atlanta Capital Horizon Growth Fund, and Eaton Vance Core Plus Bond Fund (formerly, Eaton Vance Build America Bond Fund) (the “Fund(s)”) are series of Eaton Vance Mutual Funds Trust (the “Trust”), a Massachusetts business trust, which, including the Funds, contains a total of 37 series (the “Series”). The Trust is registered under the Investment Company Act of 1940 as an open-end management investment company. This Form N-CSR relates to the Funds’ annual reports.
The following tables present the aggregate fees billed to each Fund for the Fund’s fiscal years ended September 30, 2014 and September 30, 2015 by the Fund’s principal accountant, Deloitte & Touche LLP (“D&T”), for professional services rendered for the audit of the Funds’ annual financial statements and fees billed for other services rendered by D&T during those periods.
Eaton Vance AMT-Free Municipal Income Fund
| | | | | | | | |
Fiscal Years Ended | | 9/30/14 | | | 9/30/15 | |
Audit Fees | | $ | 69,342 | | | $ | 54,380 | |
Audit-Related Fees(1) | | $ | 0 | | | $ | 0 | |
Tax Fees(2) | | $ | 13,890 | | | $ | 13,792 | |
All Other Fees(3) | | $ | 0 | | | $ | 0 | |
| | | | | | | | |
Total | | $ | 83,232 | | | $ | 68,172 | |
| | | | | | | | |
Eaton Vance Atlanta Capital Horizon Growth Fund
| | | | | | | | |
Fiscal Years Ended | | 9/30/14 | | | 9/30/15 | |
Audit Fees | | $ | 28,250 | | | $ | 27,000 | |
Audit-Related Fees(1) | | $ | 0 | | | $ | 2,550 | |
Tax Fees(2) | | $ | 10,120 | | | $ | 9,856 | |
All Other Fees(3) | | $ | 0 | | | $ | 0 | |
| | | | | | | | |
Total | | $ | 38,370 | | | $ | 39,406 | |
| | | | | | | | |
Eaton Vance Core Plus Bond Fund (formerly, Eaton Vance Build America Bond Fund)
| | | | | | | | |
Fiscal Years Ended | | 9/30/14 | | | 9/30/15 | |
Audit Fees | | $ | 24,620 | | | $ | 25,320 | |
Audit-Related Fees(1) | | $ | 0 | | | $ | 0 | |
Tax Fees(2) | | $ | 9,940 | | | $ | 10,973 | |
All Other Fees(3) | | $ | 0 | | | $ | 0 | |
| | | | | | | | |
Total | | $ | 34,560 | | | $ | 36,293 | |
| | | | | | | | |
| (1) | Audit-related fees consist of the aggregate fees billed for assurance and related services that are reasonably related to the performance of the audit of the registrant’s financial statements and are not reported under the category of audit fees. Includes consent fee for N-14 registration statements related to fund mergers. |
| (2) | Tax fees consist of the aggregate fees billed for professional services rendered by the principal accountant relating to tax compliance, tax advice, and tax planning and specifically include fees for tax return preparation and other related tax compliance/planning matters. |
| (3) | All other fees consist of the aggregate fees billed for products and services provided by the principal accountant other than audit, audit-related, and tax services. |
The various Series comprising the Trust have differing fiscal year ends (January 31, February 28, August 31, September 30, October 31 or December 31). The following table presents the aggregate audit, audit-related, tax, and other fees billed to all of the Series in the Trust by D&T for the last two fiscal years of each Series.
| | | | | | | | | | | | | | | | | | | | | | | | | | | | | | | | | | | | | | | | | | | | |
Fiscal Years Ended* | | 10/31/13 | | | 12/31/13 | | | 1/31/14 | | | 8/31/14 | | | 9/30/14 | | | 10/31/14 | | | 12/31/14 | | | 1/31/15 | | | 2/28/15 | | | 8/31/15 | | | 9/30/15 | |
Audit Fees | | $ | 556,530 | | | $ | 93,320 | | | $ | 125,080 | | | $ | 47,050 | | | $ | 122,212 | | | $ | 558,976 | | | $ | 97,220 | | | $ | 132,030 | | | $ | 22,050 | | | $ | 48,450 | | | $ | 106,700 | |
Audit-Related Fees(1) | | $ | 0 | | | $ | 0 | | | $ | 0 | | | $ | 0 | | | $ | 0 | | | $ | 0 | | | $ | 0 | | | $ | 0 | | | $ | 0 | | | $ | 0 | | | $ | 2,550 | |
Tax Fees(2) | | $ | 299,460 | | | $ | 57,050 | | | $ | 40,790 | | | $ | 15,655 | | | $ | 33,950 | | | $ | 327,920 | | | $ | 62,110 | | | $ | 48,385 | | | $ | 12,780 | | | $ | 12,002 | | | $ | 34,621 | |
All Other Fees(3) | | $ | 0 | | | $ | 0 | | | $ | 0 | | | $ | 0 | | | $ | 0 | | | $ | 0 | | | $ | 0 | | | $ | 0 | | | $ | 0 | | | $ | 0 | | | $ | 0 | |
| | | | | | | | | | | | | | | | | | | | | | | | | | | | | | | | | | | | | | | | | | | | |
Total | | $ | 855,990 | | | $ | 150,370 | | | $ | 165,870 | | | $ | 62,705 | | | $ | 156,162 | | | $ | 886,896 | | | $ | 159,330 | | | $ | 180,415 | | | $ | 34,830 | | | $ | 60,452 | | | $ | 143,871 | |
| | | | | | | | | | | | | | | | | | | | | | | | | | | | | | | | | | | | | | | | | | | | |
| * | Information is not presented for fiscal year ended 2/28/14, as no Series in the Trust with such fiscal year end was in operation during such period. |
| (1) | Audit-related fees consist of the aggregate fees billed for assurance and related services that are reasonably related to the performance of the audit of the registrant’s financial statements and are not reported under the category of audit fees. Includes consent fee for N-14 registration statements related to fund mergers. |
| (2) | Tax fees consist of the aggregate fees billed for professional services rendered by the principal accountant relating to tax compliance, tax advice, and tax planning and specifically include fees for tax return preparation and other related tax compliance/planning matters. |
| (3) | All other fees consist of the aggregate fees billed for products and services provided by the principal accountant other than audit, audit-related, and tax services. |
(e)(1) The registrant’s audit committee has adopted policies and procedures relating to the pre-approval of services provided by the registrant’s principal accountant (the “Pre-Approval Policies”). The Pre-Approval Policies establish a framework intended to assist the audit committee in the proper discharge of its pre-approval responsibilities. As a general matter, the Pre-Approval Policies (i) specify certain types of audit, audit-related, tax, and other services determined to be pre-approved by the audit committee; and (ii) delineate specific procedures governing the mechanics of the pre-approval process, including the approval and monitoring of audit and non-audit service fees. Unless a service is specifically pre-approved under the Pre-Approval Policies, it must be separately pre-approved by the audit committee.
The Pre-Approval Policies and the types of audit and non-audit services pre-approved therein must be reviewed and ratified by the registrant’s audit committee at least annually. The registrant’s audit committee maintains full responsibility for the appointment, compensation, and oversight of the work of the registrant’s principal accountant.
(e)(2) No services described in paragraphs (b)-(d) above were approved by the registrant’s audit committee pursuant to the “de minimis exception” set forth in Rule 2-01(c)(7)(i)(C) of Regulation S-X.
(f) Not applicable.
(g) The following table presents (i) the aggregate non-audit fees (i.e., fees for audit-related, tax, and other services) billed for services rendered to all of the Series in the Trust by D&T for the last two fiscal years of each Series; and (ii) the aggregate non-audit fees (i.e., fees for audit-related, tax, and other services) billed to the Eaton Vance organization by D&T for the last two fiscal years of each Series.
| | | | | | | | | | | | | | | | | | | | | | | | | | | | | | | | | | | | | | | | | | | | |
Fiscal Years Ended* | | 10/31/13 | | | 12/31/13 | | | 1/31/14 | | | 8/31/14 | | | 9/30/14 | | | 10/31/14 | | | 12/31/14 | | | 1/31/15 | | | 2/28/15 | | | 8/31/15 | | | 9/30/15 | |
Registrant(1) | | $ | 299,460 | | | $ | 57,050 | | | $ | 40,790 | | | $ | 15,655 | | | $ | 33,950 | | | $ | 327,920 | | | $ | 62,110 | | | $ | 48,385 | | | $ | 12,780 | | | $ | 12,002 | | | $ | 37,171 | |
Eaton Vance(2) | | $ | 526,385 | | | $ | 409,385 | | | $ | 370,325 | | | $ | 256,315 | | | $ | 256,315 | | | $ | 99,750 | | | $ | 99,750 | | | $ | 99,750 | | | $ | 99,750 | | | $ | 46,000 | | | $ | 46,000 | |
| * | Information is not presented for fiscal year ended 2/28/14, as no Series in the Trust with such fiscal year end was in operation during such period. |
| (1) | Includes all of the Series of the Trust. During the fiscal years reported above, certain of the Funds were “feeder” funds in a “master-feeder” fund structure or funds of funds. |
| (2) | Various subsidiaries of Eaton Vance Corp. act in either an investment advisory and/or service provider capacity with respect to the Series and/or their respective “master” funds (if applicable). |
(h) The registrant’s audit committee has considered whether the provision by the registrant’s principal accountant of non-audit services to the registrant’s investment adviser and any entity controlling, controlled by, or under common control with the adviser that provides ongoing services to the registrant that were not pre-approved pursuant to Rule 2-01(c)(7)(ii) of Regulation S-X is compatible with maintaining the principal accountant’s independence.
Item 5. Audit Committee of Listed Registrants
Not applicable.
Item 6. Schedule of Investments
Please see schedule of investments contained in the Report to Stockholders included under Item 1 of this Form N-CSR.
Item 7. Disclosure of Proxy Voting Policies and Procedures for Closed-End Management Investment Companies
Not applicable.
Item 8. Portfolio Managers of Closed-End Management Investment Companies
Not applicable.
Item 9. Purchases of Equity Securities by Closed-End Management Investment Company and Affiliated Purchasers
Not applicable.
Item 10. Submission of Matters to a Vote of Security Holders
No material changes.
Item 11. Controls and Procedures
(a) It is the conclusion of the registrant’s principal executive officer and principal financial officer that the effectiveness of the registrant’s current disclosure controls and procedures (such disclosure controls and procedures having been evaluated within 90 days of the date of this filing) provide reasonable assurance that the information required to be disclosed by the registrant has been recorded, processed, summarized and reported within the time period specified in the Commission’s rules and forms and that the information required to be disclosed by the registrant has been accumulated and communicated to the registrant’s principal executive officer and principal financial officer in order to allow timely decisions regarding required disclosure.
(b) There have been no changes in the registrant’s internal controls over financial reporting during the second fiscal quarter of the period covered by this report that has materially affected, or is reasonably likely to materially affect, the registrant’s internal control over financial reporting.
Item 12. Exhibits
| | |
| |
| (a)(1) | | Registrant’s Code of Ethics – Not applicable (please see Item 2). |
| |
| (a)(2)(i) | | Treasurer’s Section 302 certification. |
| |
| (a)(2)(ii) | | President’s Section 302 certification. |
| |
| (b) | | Combined Section 906 certification. |
Signatures
Pursuant to the requirements of the Securities Exchange Act of 1934 and the Investment Company Act of 1940, the registrant has duly caused this report to be signed on its behalf by the undersigned, thereunto duly authorized.
Eaton Vance Mutual Funds Trust
| | |
| By: | | /s/ Payson F. Swaffield |
| | Payson F. Swaffield |
| | President |
| |
| Date: | | November 12, 2015 |
Pursuant to the requirements of the Securities Exchange Act of 1934 and the Investment Company Act of 1940, this report has been signed below by the following persons on behalf of the registrant and in the capacities and on the dates indicated.
| | |
| By: | | /s/ James F. Kirchner |
| | James F. Kirchner |
| | Treasurer |
| |
| Date: | | November 12, 2015 |
| |
| By: | | /s/ Payson F. Swaffield |
| | Payson F. Swaffield |
| | President |
| |
| Date: | | November 12, 2015 |