UNITED STATES
SECURITIES AND EXCHANGE COMMISSION
Washington, D.C. 20549
Form N-CSR
CERTIFIED SHAREHOLDER REPORT OF REGISTERED
MANAGEMENT INVESTMENT COMPANIES
Investment Company Act File Number: 811-04015
Eaton Vance Mutual Funds Trust
(Exact Name of Registrant as Specified in Charter)
Two International Place, Boston, Massachusetts 02110
(Address of Principal Executive Offices)
Maureen A. Gemma
Two International Place, Boston, Massachusetts 02110
(Name and Address of Agent for Services)
(617) 482-8260
(Registrant’s Telephone Number)
December 31
Date of Fiscal Year End
December 31, 2015
Date of Reporting Period
Item 1. Reports to Stockholders

Eaton Vance
Stock Fund
Annual Report
December 31, 2015

Commodity Futures Trading Commission Registration. Effective December 31, 2012, the Commodity Futures Trading Commission (“CFTC”) adopted certain regulatory changes that subject registered investment companies and advisers to regulation by the CFTC if a fund invests more than a prescribed level of its assets in certain CFTC-regulated instruments (including futures, certain options and swap agreements) or markets itself as providing investment exposure to such instruments. The Fund has claimed an exclusion from the definition of the term “commodity pool operator” under the Commodity Exchange Act. Accordingly, neither the Fund nor the adviser with respect to the operation of the Fund is subject to CFTC regulation. Because of its management of other strategies, the Fund’s adviser is registered with the CFTC as a commodity pool operator and a commodity trading advisor.
Fund shares are not insured by the FDIC and are not deposits or other obligations of, or guaranteed by, any depository institution. Shares are subject to investment risks, including possible loss of principal invested.
This report must be preceded or accompanied by a current summary prospectus or prospectus. Before investing, investors should consider carefully the investment objective, risks, and charges and expenses of a mutual fund. This and other important information is contained in the summary prospectus and prospectus, which can be obtained from a financial advisor. Prospective investors should read the prospectus carefully before investing. For further information, please call 1-800-262-1122.
Annual Report December 31, 2015
Eaton Vance
Stock Fund
Table of Contents
| | | | |
Management’s Discussion of Fund Performance | | | 2 | |
| |
Performance | | | 3 | |
| |
Fund Profile | | | 4 | |
| |
Endnotes and Additional Disclosures | | | 5 | |
| |
Fund Expenses | | | 6 | |
| |
Financial Statements | | | 7 | |
| |
Report of Independent Registered Public Accounting Firm | | | 17 and 30 | |
| |
Federal Tax Information | | | 18 | |
| |
Management and Organization | | | 31 | |
| |
Important Notices | | | 34 | |
Eaton Vance
Stock Fund
December 31, 2015
Management’s Discussion of Fund Performance1
Economic and Market Conditions
After a roller-coaster ride, the broad U.S. equity market (as represented by the S&P 500 Index2) finished the year almost where it began, returning 1.38% for the 12 months ended December 31, 2015. The Dow Jones Industrial Average was even flatter, rising just 0.21% in 2015. However, the technology-laden NASDAQ Composite Index rose 6.96%, as a number of Internet-related companies posted strong returns.
U.S. equities were buoyed by a continued modest economic recovery during the period: Nearly every month was marked by meaningful jobs growth, while the unemployment rate dropped to 5.0% for the first time since 2008. Consumers, the chief engine of the U.S. economy, increased their spending, and the consumer discretionary sector was the strongest-performing sector in the S&P 500 Index for the 12-month period.
Yet the period was characterized by significant market volatility, as several factors buffeted U.S. stocks. China replaced Greece as many investors’ biggest overseas concern, with slowing growth in the world’s second-largest economy weighing heavily on U.S. firms doing business in emerging markets. In addition, ongoing uncertainty about when the U.S. Federal Reserve (the Fed) would raise interest rates contributed to market volatility during the period. The Fed finally announced a rate hike in December.
A strengthening U.S. dollar during the period posed another headwind for U.S. companies competing in global markets, making their exports more expensive and decreasing the dollar value of overseas revenues. Falling commodity prices, especially for oil, were more of a double-edged sword. While consumers and many firms saw their fuel and energy bills decline, profits were slashed for numerous energy producers and commodity-related companies.
For the 12-month period, large-cap U.S. stocks (as measured by the Russell 1000® Index) delivered positive returns, but their small-cap counterparts (as measured by the Russell 2000® Index) were in negative territory. Growth stocks as a group outpaced value stocks across the large-, mid- and small-cap categories.
Fund Performance
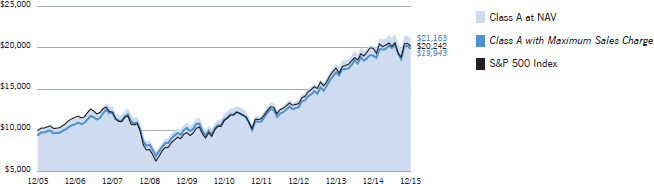
For the 12-month period ended December 31, 2015, Eaton Vance Stock Fund (the Fund) had a total return of 4.51% for Class A shares at net asset value (NAV), outperforming its benchmark, the S&P 500 Index (the Index), which returned 1.38% for the same period.
Stock selection in the consumer staples, health care and consumer discretionary sectors contributed to the
Fund’s performance relative to the Index. Within consumer staples, the Fund’s overweight position versus the Index in alcoholic beverage firm Constellation Brands, Inc. contributed to relative Fund performance, as the company increased sales volumes, saw improved market share for its Mexican beer brands and moderately raised prices. The Fund’s overweight in cigarette maker Reynolds American, Inc. also helped relative Fund performance, as the company’s profits were boosted by better-than-expected pricing and volume trends. The company also benefited from a major acquisition during the period. Elsewhere in consumer staples, the Fund’s out-of-Index position in packaged foods company Pinnacle Foods, Inc. aided relative Fund performance, as its profits benefited from rising sales volumes and increased operating efficiency.
Within the health care sector, the Fund’s out-of-Index holding in AmSurg Corp., an operator of outpatient surgical centers and outsourced physician services, contributed to Fund performance versus the Index. As hospitals and health care providers strove to reduce costs, AmSurg benefited from increased demand for its lower-cost services delivered outside a hospital setting. Within the consumer discretionary sector, the Fund’s overweight relative to the Index in Amazon.com, Inc. had a positive impact on Fund performance versus the Index. The stock rose sharply in response to Amazon’s accelerating growth and profitability, as well as greater disclosure of the financial and operating details of the firm’s cloud computing business.
In contrast, stock selection in the materials and industrials sectors detracted from the Fund’s performance relative to the Index. Within materials, the Fund’s overweight versus the Index in International Paper Company hurt relative Fund performance, as a business slowdown in many parts of the globe led to weaker demand for the firm’s paper and packaging products. The Fund’s overweight in agricultural chemical firm Monsanto Company also dragged on relative Fund performance. Monsanto’s stock declined on negative investor reaction to its failed attempt to acquire a competitor, along with slowing sales amid lower crop prices that cut into farmers’ budgets. Within the industrials sector, the Fund’s overweight in United Technologies Corp. hampered relative Fund performance, as the company was negatively impacted by a global slowdown in new commercial construction, particularly in emerging markets. This decreased demand for United Technologies’ elevators, escalators, and heating and air conditioning equipment. By period end, AmSurg, International Paper and Monsanto had been sold out of the Fund.
See Endnotes and Additional Disclosures in this report.
Past performance is no guarantee of future results. Returns are historical and are calculated by determining the percentage change in net asset value (NAV) or offering price (as applicable) with all distributions reinvested. Investment return and principal value will fluctuate so that shares, when redeemed, may be worth more or less than their original cost. Performance less than one year is cumulative. Performance is for the stated time period only; due to market volatility, the Fund’s current performance may be lower or higher than quoted. Returns are before taxes unless otherwise noted. For performance as of the most recent month-end, please refer to eatonvance.com.
Eaton Vance
Stock Fund
December 31, 2015
Performance2,3
Portfolio Manager Charles B. Gaffney
| | | | | | | | | | | | | | | | | | | | |
| % Average Annual Total Returns | | Class
Inception Date | | | Performance Inception Date | | | One Year | | | Five Years | | | Ten Years | |
Class A at NAV | | | 11/01/2001 | | | | 11/01/2001 | | | | 4.51 | % | | | 11.96 | % | | | 7.78 | % |
Class A with 5.75% Maximum Sales Charge | | | — | | | | — | | | | –1.52 | | | | 10.65 | | | | 7.14 | |
Class C at NAV | | | 10/01/2009 | | | | 11/01/2001 | | | | 3.77 | | | | 11.14 | | | | 7.29 | |
Class C with 1% Maximum Sales Charge | | | — | | | | — | | | | 2.81 | | | | 11.14 | | | | 7.29 | |
Class I at NAV | | | 09/03/2008 | | | | 11/01/2001 | | | | 4.83 | | | | 12.24 | | | | 7.98 | |
S&P 500 Index | | | — | | | | — | | | | 1.38 | % | | | 12.56 | % | | | 7.30 | % |
| | | | | |
| | | | | | | | | | | | | | | | | | | | |
| % Total Annual Operating Expense Ratios4 | | | | | | | | Class A | | | Class C | | | Class I | |
Gross | | | | | | | | | | | 1.27 | % | | | 2.02 | % | | | 1.02 | % |
Net | | | | | | | | | | | 0.98 | | | | 1.73 | | | | 0.73 | |
Growth of $10,000
This graph shows the change in value of a hypothetical investment of $10,000 in Class A of the Fund for the period indicated. For comparison, the same investment is shown in the indicated index.
| | | | | | | | | | | | | | | | |
| Growth of Investment | | Amount Invested | | | Period Beginning | | | At NAV | | | With Maximum Sales Charge | |
Class C | | $ | 10,000 | | | | 12/31/2005 | | | $ | 20,221 | | | | N.A. | |
Class I | | $ | 250,000 | | | | 12/31/2005 | | | $ | 539,187 | | | | N.A. | |
See Endnotes and Additional Disclosures in this report.
Past performance is no guarantee of future results. Returns are historical and are calculated by determining the percentage change in net asset value (NAV) or offering price (as applicable) with all distributions reinvested. Investment return and principal value will fluctuate so that shares, when redeemed, may be worth more or less than their original cost. Performance less than one year is cumulative. Performance is for the stated time period only; due to market volatility, the Fund’s current performance may be lower or higher than quoted. Returns are before taxes unless otherwise noted. For performance as of the most recent month-end, please refer to eatonvance.com.
Eaton Vance
Stock Fund
December 31, 2015
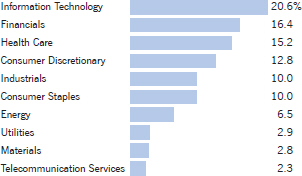
Fund Profile5
Sector Allocation (% of net assets)6
Top 10 Holdings (% of net assets)6
| | | | |
Alphabet, Inc., Class C | | | 3.3 | % |
Apple, Inc. | | | 3.3 | |
Microsoft Corp. | | | 3.0 | |
General Electric Co. | | | 2.9 | |
Johnson & Johnson | | | 2.9 | |
Walt Disney Co. (The) | | | 2.8 | |
United Technologies Corp. | | | 2.3 | |
Verizon Communications, Inc. | | | 2.3 | |
Amazon.com, Inc. | | | 2.3 | |
Dollar General Corp. | | | 2.3 | |
Total | | | 27.4 | % |
See Endnotes and Additional Disclosures in this report.
Eaton Vance
Stock Fund
December 31, 2014
Endnotes and Additional Disclosures
| 1 | The views expressed in this report are those of the portfolio manager(s) and are current only through the date stated at the top of this page. These views are subject to change at any time based upon market or other conditions, and Eaton Vance and the Fund(s) disclaim any responsibility to update such views. These views may not be relied upon as investment advice and, because investment decisions are based on many factors, may not be relied upon as an indication of trading intent on behalf of any Eaton Vance fund. This commentary may contain statements that are not historical facts, referred to as “forward looking statements”. The Fund’s actual future results may differ significantly from those stated in any forward looking statement, depending on factors such as changes in securities or financial markets or general economic conditions, the volume of sales and purchases of Fund shares, the continuation of investment advisory, administrative and service contracts, and other risks discussed from time to time in the Fund’s filings with the Securities and Exchange Commission. |
| 2 | S&P 500 Index is an unmanaged index of large-cap stocks commonly used as a measure of U.S. stock market performance. Dow Jones Industrial Average is a price-weighted average of 30 blue-chip stocks that are generally the leaders in their industry. NASDAQ Composite Index is a market capitalization- weighted index of all domestic and international securities listed on NASDAQ. Russell 1000® Index is an unmanaged index of 1,000 U.S. large-cap stocks. Russell 2000® Index is an unmanaged index of 2,000 U.S. small-cap stocks. Unless otherwise stated, index returns do not reflect the effect of any applicable sales charges, commissions, expenses, taxes or leverage, as applicable. It is not possible to invest directly in an index. |
| 3 | Total Returns at NAV do not include applicable sales charges. If sales charges were deducted, the returns would be lower. Total Returns shown with maximum sales charge reflect the stated maximum sales charge. Unless otherwise stated, performance does not reflect the deduction of taxes on Fund distributions or redemptions of Fund shares. |
| | Performance prior to the inception date of a class may be linked to the performance of an older class of the Fund. This linked performance is adjusted for any applicable sales charge, but is not adjusted for class expense differences. If adjusted for such differences, the performance would be different. Performance presented in the financial highlights included in the financial statements is not linked. In the performance table, the performance of Class C and Class I is linked to Class A. Performance since inception for an index, if presented, is the performance since the Fund’s or oldest share class’ inception, as applicable. |
| 4 | Source: Fund prospectus. Net expense ratio reflects a contractual expense reimbursement that continues through 4/30/17. Without the reimbursement, if applicable, performance would have been lower. |
| 5 | Fund invests in an affiliated investment company (Portfolio) with the same objective(s) and policies as the Fund. References to investments are to the Portfolio’s holdings. |
| 6 | Excludes cash and cash equivalents. |
| | Fund profile subject to change due to active management. |
Eaton Vance
Stock Fund
December 31, 2015
Fund Expenses
Example: As a Fund shareholder, you incur two types of costs: (1) transaction costs, including sales charges (loads) on purchases and redemption fees (if applicable); and (2) ongoing costs, including management fees; distribution and/or service fees; and other Fund expenses. This Example is intended to help you understand your ongoing costs (in dollars) of Fund investing and to compare these costs with the ongoing costs of investing in other mutual funds. The Example is based on an investment of $1,000 invested at the beginning of the period and held for the entire period (July 1, 2015 – December 31, 2015).
Actual Expenses: The first section of the table below provides information about actual account values and actual expenses. You may use the information in this section, together with the amount you invested, to estimate the expenses that you paid over the period. Simply divide your account value by $1,000 (for example, an $8,600 account value divided by $1,000 = 8.6), then multiply the result by the number in the first section under the heading entitled “Expenses Paid During Period” to estimate the expenses you paid on your account during this period.
Hypothetical Example for Comparison Purposes: The second section of the table below provides information about hypothetical account values and hypothetical expenses based on the actual Fund expense ratio and an assumed rate of return of 5% per year (before expenses), which is not the actual Fund return. The hypothetical account values and expenses may not be used to estimate the actual ending account balance or expenses you paid for the period. You may use this information to compare the ongoing costs of investing in your Fund and other funds. To do so, compare this 5% hypothetical example with the 5% hypothetical examples that appear in the shareholder reports of the other funds.
Please note that the expenses shown in the table are meant to highlight your ongoing costs only and do not reflect any transactional costs, such as sales charges (loads) or redemption fees (if applicable). Therefore, the second section of the table is useful in comparing ongoing costs only, and will not help you determine the relative total costs of owning different funds. In addition, if these transactional costs were included, your costs would be higher.
| | | | | | | | | | | | | | | | |
| | | Beginning
Account Value
(7/1/15) | | | Ending
Account Value
(12/31/15) | | | Expenses Paid
During Period*
(7/1/15 – 12/31/15) | | | Annualized
Expense
Ratio | |
| | | | |
| | | | | | | | | | | | | | | | |
Actual | | | | | | | | | | | | | | | | |
Class A | | $ | 1,000.00 | | | $ | 998.00 | | | $ | 5.29 | ** | | | 1.05 | % |
Class C | | $ | 1,000.00 | | | $ | 994.20 | | | $ | 9.05 | ** | | | 1.80 | % |
Class I | | $ | 1,000.00 | | | $ | 999.10 | | | $ | 4.03 | ** | | | 0.80 | % |
| | | | | | | | | | | | | | | | | |
| | | | |
| | | | | | | | | | | | | | | | |
Hypothetical | | | | | | | | | | | | | | | | |
(5% return per year before expenses) | | | | | | | | | | | | | | | | |
Class A | | $ | 1,000.00 | | | $ | 1,019.90 | | | $ | 5.35 | ** | | | 1.05 | % |
Class C | | $ | 1,000.00 | | | $ | 1,016.10 | | | $ | 9.15 | ** | | | 1.80 | % |
Class I | | $ | 1,000.00 | | | $ | 1,021.20 | | | $ | 4.08 | ** | | | 0.80 | % |
| * | Expenses are equal to the Fund’s annualized expense ratio for the indicated Class, multiplied by the average account value over the period, multiplied by 184/365 (to reflect the one-half year period). The Example assumes that the $1,000 was invested at the net asset value per share determined at the close of business on June 30, 2015. The Example reflects the expenses of both the Fund and the Portfolio. |
| ** | Absent an allocation of certain expenses to an affiliate, expenses would be higher. |
Eaton Vance
Stock Fund
December 31, 2015
Statement of Assets and Liabilities
| | | | |
| Assets | | December 31, 2015 | |
Investment in Stock Portfolio, at value (identified cost, $81,077,945) | | $ | 90,818,940 | |
Receivable for Fund shares sold | | | 358,932 | |
Receivable from affiliate | | | 10,744 | |
Total assets | | $ | 91,188,616 | |
| |
| Liabilities | | | | |
Payable for Fund shares redeemed | | $ | 173,505 | |
Payable to affiliates: | | | | |
Distribution and service fees | | | 23,943 | |
Trustees’ fees | | | 125 | |
Accrued expenses | | | 51,133 | |
Total liabilities | | $ | 248,706 | |
Net Assets | | $ | 90,939,910 | |
| |
| Sources of Net Assets | | | | |
Paid-in capital | | $ | 81,153,874 | |
Accumulated net realized gain from Portfolio | | | 19,940 | |
Accumulated undistributed net investment income | | | 25,101 | |
Net unrealized appreciation from Portfolio | | | 9,740,995 | |
Total | | $ | 90,939,910 | |
| |
| Class A Shares | | | | |
Net Assets | | $ | 55,496,357 | |
Shares Outstanding | | | 3,659,549 | |
Net Asset Value and Redemption Price Per Share | | | | |
(net assets ÷ shares of beneficial interest outstanding) | | $ | 15.16 | |
Maximum Offering Price Per Share | | | | |
(100 ÷ 94.25 of net asset value per share) | | $ | 16.08 | |
| |
| Class C Shares | | | | |
Net Assets | | $ | 14,986,217 | |
Shares Outstanding | | | 1,007,566 | |
Net Asset Value and Offering Price Per Share* | | | | |
(net assets ÷ shares of beneficial interest outstanding) | | $ | 14.87 | |
| |
| Class I Shares | | | | |
Net Assets | | $ | 20,457,336 | |
Shares Outstanding | | | 1,348,297 | |
Net Asset Value, Offering Price and Redemption Price Per Share | | | | |
(net assets ÷ shares of beneficial interest outstanding) | | $ | 15.17 | |
On sales of $50,000 or more, the offering price of Class A shares is reduced.
| * | Redemption price per share is equal to the net asset value less any applicable contingent deferred sales charge. |
| | | | |
| | 7 | | See Notes to Financial Statements. |
Eaton Vance
Stock Fund
December 31, 2015
Statement of Operations
| | | | |
| Investment Income | | Year Ended December 31, 2015 | |
Dividends allocated from Portfolio (net of foreign taxes, $7,774) | | $ | 1,485,569 | |
Interest allocated from Portfolio | | | 2,467 | |
Expenses allocated from Portfolio | | | (562,277 | ) |
Total investment income from Portfolio | | $ | 925,759 | |
| |
| Expenses | | | | |
Distribution and service fees | | | | |
Class A | | $ | 131,091 | |
Class C | | | 124,979 | |
Trustees’ fees and expenses | | | 500 | |
Custodian fee | | | 14,554 | |
Transfer and dividend disbursing agent fees | | | 63,102 | |
Legal and accounting services | | | 25,354 | |
Printing and postage | | | 20,800 | |
Registration fees | | | 51,646 | |
Miscellaneous | | | 11,270 | |
Total expenses | | $ | 443,296 | |
Deduct — | | | | |
Allocation of expenses to affiliate | | $ | 109,189 | |
Total expense reductions | | $ | 109,189 | |
| |
Net expenses | | $ | 334,107 | |
| |
Net investment income | | $ | 591,652 | |
| |
| Realized and Unrealized Gain (Loss) from Portfolio | | | | |
Net realized gain (loss) — | | | | |
Investment transactions | | $ | 5,207,464 | |
Foreign currency transactions | | | 5,569 | |
Net realized gain | | $ | 5,213,033 | |
Change in unrealized appreciation (depreciation) — | | | | |
Investments | | $ | (2,468,933 | ) |
Foreign currency | | | (241 | ) |
Net change in unrealized appreciation (depreciation) | | $ | (2,469,174 | ) |
| |
Net realized and unrealized gain | | $ | 2,743,859 | |
| |
Net increase in net assets from operations | | $ | 3,335,511 | |
| | | | |
| | 8 | | See Notes to Financial Statements. |
Eaton Vance
Stock Fund
December 31, 2015
Statements of Changes in Net Assets
| | | | | | | | |
| | | Year Ended December 31, | |
| Increase (Decrease) in Net Assets | | 2015 | | | 2014 | |
From operations — | | | | | | | | |
Net investment income | | $ | 591,652 | | | $ | 383,795 | |
Net realized gain from investment transactions, written options and foreign currency transactions | | | 5,213,033 | | | | 11,496,917 | |
Net change in unrealized appreciation (depreciation) from investments, written options and foreign currency | | | (2,469,174 | ) | | | (3,186,109 | ) |
Net increase in net assets from operations | | $ | 3,335,511 | | | $ | 8,694,603 | |
Distributions to shareholders — | | | | | | | | |
From net investment income | | | | | | | | |
Class A | | $ | (356,510 | ) | | $ | (216,513 | ) |
Class C | | | (12,332 | ) | | | — | |
Class I | | | (183,512 | ) | | | (78,018 | ) |
From net realized gain | | | | | | | | |
Class A | | | (3,693,369 | ) | | | (5,574,996 | ) |
Class C | | | (979,302 | ) | | | (1,242,441 | ) |
Class I | | | (1,279,301 | ) | | | (1,630,978 | ) |
Total distributions to shareholders | | $ | (6,504,326 | ) | | $ | (8,742,946 | ) |
Transactions in shares of beneficial interest — | | | | | | | | |
Proceeds from sale of shares | | | | | | | | |
Class A | | $ | 15,843,763 | | | $ | 13,901,229 | |
Class C | | | 5,250,485 | | | | 4,337,088 | |
Class I | | | 11,581,128 | | | | 21,010,470 | |
Net asset value of shares issued to shareholders in payment of distributions declared | | | | | | | | |
Class A | | | 3,967,963 | | | | 5,649,273 | |
Class C | | | 930,481 | | | | 1,144,420 | |
Class I | | | 1,353,700 | | | | 1,344,114 | |
Cost of shares redeemed | | | | | | | | |
Class A | | | (13,430,679 | ) | | | (11,690,484 | ) |
Class C | | | (2,350,636 | ) | | | (1,668,819 | ) |
Class I | | | (4,306,757 | ) | | | (21,724,642 | ) |
Net increase in net assets from Fund share transactions | | $ | 18,839,448 | | | $ | 12,302,649 | |
| | |
Net increase in net assets | | $ | 15,670,633 | | | $ | 12,254,306 | |
| | |
| Net Assets | | | | | | | | |
At beginning of year | | $ | 75,269,277 | | | $ | 63,014,971 | |
At end of year | | $ | 90,939,910 | | | $ | 75,269,277 | |
| | |
Accumulated undistributed net investment income included in net assets | | | | | | | | |
At end of year | | $ | 25,101 | | | $ | 32,584 | |
| | | | |
| | 9 | | See Notes to Financial Statements. |
Eaton Vance
Stock Fund
December 31, 2015
Financial Highlights
| | | | | | | | | | | | | | | | | | | | |
| | | Class A | |
| | | Year Ended December 31, | |
| | | 2015 | | | 2014 | | | 2013 | | | 2012 | | | 2011 | |
Net asset value — Beginning of year | | $ | 15.680 | | | $ | 15.850 | | | $ | 13.330 | | | $ | 12.980 | | | $ | 13.350 | |
| | | | | |
| Income (Loss) From Operations | | | | | | | | | | | | | | | | | | | | |
Net investment income(1) | | $ | 0.129 | | | $ | 0.095 | | | $ | 0.063 | | | $ | 0.100 | | | $ | 0.098 | |
Net realized and unrealized gain (loss) | | | 0.584 | | | | 1.722 | | | | 4.232 | | | | 1.941 | | | | (0.373 | ) |
| | | | | |
Total income (loss) from operations | | $ | 0.713 | | | $ | 1.817 | | | $ | 4.295 | | | $ | 2.041 | | | $ | (0.275 | ) |
| | | | | |
| Less Distributions | | | | | | | | | | | | | | | | | | | | |
From net investment income | | $ | (0.107 | ) | | $ | (0.073 | ) | | $ | (0.065 | ) | | $ | (0.102 | ) | | $ | (0.095 | ) |
From net realized gain | | | (1.126 | ) | | | (1.914 | ) | | | (1.710 | ) | | | (1.589 | ) | | | — | |
| | | | | |
Total distributions | | $ | (1.233 | ) | | $ | (1.987 | ) | | $ | (1.775 | ) | | $ | (1.691 | ) | | $ | (0.095 | ) |
| | | | | |
Net asset value — End of year | | $ | 15.160 | | | $ | 15.680 | | | $ | 15.850 | | | $ | 13.330 | | | $ | 12.980 | |
| | | | | |
Total Return(2) | | | 4.51 | % | | | 11.99 | % | | | 32.83 | % | | | 15.59 | % | | | (2.06 | )% |
| | | | | |
| Ratios/Supplemental Data | | | | | | | | | | | | | | | | | | | | |
Net assets, end of year (000’s omitted) | | $ | 55,496 | | | $ | 50,826 | | | $ | 43,270 | | | $ | 37,308 | | | $ | 38,113 | |
Ratios (as a percentage of average daily net assets): | | | | | | | | | | | | | | | | | | | | |
Expenses(3) | | | 1.05 | % | | | 1.22 | % | | | 1.25 | % | | | 1.25 | % | | | 1.25 | % |
Net investment income | | | 0.81 | % | | | 0.57 | % | | | 0.41 | % | | | 0.70 | % | | | 0.74 | % |
Portfolio Turnover of the Portfolio | | | 96 | % | | | 109 | % | | | 90 | % | | | 91 | % | | | 64 | % |
| (1) | Computed using average shares outstanding. |
| (2) | Returns are historical and are calculated by determining the percentage change in net asset value with all distributions reinvested and do not reflect the effect of sales charges. |
| (3) | The administrator waived its fees and/or reimbursed certain operating expenses (equal to 0.14%, 0.13%, 0.19%, 0.21% and 0.21% of average daily net assets for the years ended December 31, 2015, 2014, 2013, 2012 and 2011, respectively). Absent the waivers and reimbursement, total return would be lower. |
| | | | |
| | 10 | | See Notes to Financial Statements. |
Eaton Vance
Stock Fund
December 31, 2015
Financial Highlights — continued
| | | | | | | | | | | | | | | | | | | | |
| | | Class C | |
| | | Year Ended December 31, | |
| | | 2015 | | | 2014 | | | 2013 | | | 2012 | | | 2011 | |
Net asset value — Beginning of year | | $ | 15.420 | | | $ | 15.640 | | | $ | 13.200 | | | $ | 12.880 | | | $ | 13.270 | |
| | | | | |
| Income (Loss) From Operations | | | | | | | | | | | | | | | | | | | | |
Net investment income (loss)(1) | | $ | 0.009 | | | $ | (0.029 | ) | | $ | (0.053 | ) | | $ | (0.007 | ) | | $ | 0.005 | |
Net realized and unrealized gain (loss) | | | 0.580 | | | | 1.697 | | | | 4.165 | | | | 1.926 | | | | (0.371 | ) |
| | | | | |
Total income (loss) from operations | | $ | 0.589 | | | $ | 1.668 | | | $ | 4.112 | | | $ | 1.919 | | | $ | (0.366 | ) |
| | | | | |
| Less Distributions | | | | | | | | | | | | | | | | | | | | |
From net investment income | | $ | (0.013 | ) | | $ | — | | | $ | (0.010 | ) | | $ | (0.010 | ) | | $ | (0.024 | ) |
From net realized gain | | | (1.126 | ) | | | (1.888 | ) | | | (1.662 | ) | | | (1.589 | ) | | | — | |
| | | | | |
Total distributions | | $ | (1.139 | ) | | $ | (1.888 | ) | | $ | (1.672 | ) | | $ | (1.599 | ) | | $ | (0.024 | ) |
| | | | | |
Net asset value — End of year | | $ | 14.870 | | | $ | 15.420 | | | $ | 15.640 | | | $ | 13.200 | | | $ | 12.880 | |
| | | | | |
Total Return(2) | | | 3.77 | % | | | 11.16 | % | | | 31.72 | % | | | 14.78 | % | | | (2.76 | )% |
| | | | | |
| Ratios/Supplemental Data | | | | | | | | | | | | | | | | | | | | |
Net assets, end of year (000’s omitted) | | $ | 14,986 | | | $ | 11,683 | | | $ | 8,123 | | | $ | 5,382 | | | $ | 5,276 | |
Ratios (as a percentage of average daily net assets): | | | | | | | | | | | | | | | | | | | | |
Expenses(3) | | | 1.80 | % | | | 1.96 | % | | | 2.00 | % | | | 2.00 | % | | | 2.00 | % |
Net investment income (loss) | | | 0.06 | % | | | (0.18 | )% | | | (0.35 | )% | | | (0.05 | )% | | | 0.04 | % |
Portfolio Turnover of the Portfolio | | | 96 | % | | | 109 | % | | | 90 | % | | | 91 | % | | | 64 | % |
| (1) | Computed using average shares outstanding. |
| (2) | Returns are historical and are calculated by determining the percentage change in net asset value with all distributions reinvested and do not reflect the effect of sales charges. |
| (3) | The administrator waived its fees and/or reimbursed certain operating expenses (equal to 0.14%, 0.13%, 0.19%, 0.21% and 0.21% of average daily net assets for the years ended December 31, 2015, 2014, 2013, 2012 and 2011, respectively). Absent the waivers and reimbursement, total return would be lower. |
| | | | |
| | 11 | | See Notes to Financial Statements. |
Eaton Vance
Stock Fund
December 31, 2015
Financial Highlights — continued
| | | | | | | | | | | | | | | | | | | | |
| | | Class I | |
| | | Year Ended December 31, | |
| | | 2015 | | | 2014 | | | 2013 | | | 2012 | | | 2011 | |
Net asset value — Beginning of year | | $ | 15.680 | | | $ | 15.850 | | | $ | 13.330 | | | $ | 12.980 | | | $ | 13.360 | |
| | | | | |
| Income (Loss) From Operations | | | | | | | | | | | | | | | | | | | | |
Net investment income(1) | | $ | 0.172 | | | $ | 0.126 | | | $ | 0.102 | | | $ | 0.132 | | | $ | 0.130 | |
Net realized and unrealized gain (loss) | | | 0.590 | | | | 1.729 | | | | 4.233 | | | | 1.946 | | | | (0.379 | ) |
| | | | | |
Total income (loss) from operations | | $ | 0.762 | | | $ | 1.855 | | | $ | 4.335 | | | $ | 2.078 | | | $ | (0.249 | ) |
| | | | | |
| Less Distributions | | | | | | | | | | | | | | | | | | | | |
From net investment income | | $ | (0.146 | ) | | $ | (0.111 | ) | | $ | (0.105 | ) | | $ | (0.139 | ) | | $ | (0.131 | ) |
From net realized gain | | | (1.126 | ) | | | (1.914 | ) | | | (1.710 | ) | | | (1.589 | ) | | | — | |
| | | | | |
Total distributions | | $ | (1.272 | ) | | $ | (2.025 | ) | | $ | (1.815 | ) | | $ | (1.728 | ) | | $ | (0.131 | ) |
| | | | | |
Net asset value — End of year | | $ | 15.170 | | | $ | 15.680 | | | $ | 15.850 | | | $ | 13.330 | | | $ | 12.980 | |
| | | | | |
Total Return(2) | | | 4.83 | % | | | 12.24 | % | | | 33.14 | % | | | 15.89 | % | | | (1.86 | )% |
| | | | | |
| Ratios/Supplemental Data | | | | | | | | | | | | | | | | | | | | |
Net assets, end of year (000’s omitted) | | $ | 20,457 | | | $ | 12,760 | | | $ | 11,622 | | | $ | 8,876 | | | $ | 15,454 | |
Ratios (as a percentage of average daily net assets): | | | | | | | | | | | | | | | | | | | | |
Expenses(3) | | | 0.80 | % | | | 0.97 | % | | | 1.00 | % | | | 1.00 | % | | | 1.00 | % |
Net investment income | | | 1.07 | % | | | 0.75 | % | | | 0.66 | % | | | 0.92 | % | | | 0.97 | % |
Portfolio Turnover of the Portfolio | | | 96 | % | | | 109 | % | | | 90 | % | | | 91 | % | | | 64 | % |
| (1) | Computed using average shares outstanding. |
| (2) | Returns are historical and are calculated by determining the percentage change in net asset value with all distributions reinvested. |
| (3) | The administrator waived its fees and/or reimbursed certain operating expenses (equal to 0.14%, 0.13%, 0.19%, 0.21% and 0.21% of average daily net assets for the years ended December 31, 2015, 2014, 2013, 2012 and 2011, respectively). Absent the waivers and reimbursement, total return would be lower. |
| | | | |
| | 12 | | See Notes to Financial Statements. |
Eaton Vance
Stock Fund
December 31, 2015
Notes to Financial Statements
1 Significant Accounting Policies
Eaton Vance Stock Fund (the Fund) is a diversified series of Eaton Vance Mutual Funds Trust (the Trust). The Trust is a Massachusetts business trust registered under the Investment Company Act of 1940, as amended (the 1940 Act), as an open-end management investment company. The Fund offers three classes of shares. Class A shares are generally sold subject to a sales charge imposed at time of purchase. Class C shares are sold at net asset value and are generally subject to a contingent deferred sales charge (see Note 5). Class I shares are sold at net asset value and are not subject to a sales charge. Each class represents a pro-rata interest in the Fund, but votes separately on class-specific matters and (as noted below) is subject to different expenses. Realized and unrealized gains and losses and net investment income and losses, other than class-specific expenses, are allocated daily to each class of shares based on the relative net assets of each class to the total net assets of the Fund. Each class of shares differs in its distribution plan and certain other class-specific expenses. The Fund invests all of its investable assets in interests in Stock Portfolio (the Portfolio), a Massachusetts business trust, having the same investment objective and policies as the Fund. The value of the Fund’s investment in the Portfolio reflects the Fund’s proportionate interest in the net assets of the Portfolio (23.0% at December 31, 2015). The performance of the Fund is directly affected by the performance of the Portfolio. The financial statements of the Portfolio, including the portfolio of investments, are included elsewhere in this report and should be read in conjunction with the Fund’s financial statements.
The following is a summary of significant accounting policies of the Fund. The policies are in conformity with accounting principles generally accepted in the United States of America (U.S. GAAP). The Fund is an investment company and follows accounting and reporting guidance in the Financial Accounting Standards Board (“FASB”) Accounting Standards Codification Topic 946.
A Investment Valuation — Valuation of securities by the Portfolio is discussed in Note 1A of the Portfolio’s Notes to Financial Statements, which are included elsewhere in this report.
B Income — The Fund’s net investment income or loss consists of the Fund’s pro-rata share of the net investment income or loss of the Portfolio, less all actual and accrued expenses of the Fund.
C Federal Taxes — The Fund’s policy is to comply with the provisions of the Internal Revenue Code applicable to regulated investment companies and to distribute to shareholders each year substantially all of its net investment income, and all or substantially all of its net realized capital gains. Accordingly, no provision for federal income or excise tax is necessary.
As of December 31, 2015, the Fund had no uncertain tax positions that would require financial statement recognition, de-recognition, or disclosure. The Fund files a U.S. federal income tax return annually after its fiscal year-end, which is subject to examination by the Internal Revenue Service for a period of three years from the date of filing.
D Expenses — The majority of expenses of the Trust are directly identifiable to an individual fund. Expenses which are not readily identifiable to a specific fund are allocated taking into consideration, among other things, the nature and type of expense and the relative size of the funds.
E Expense Reduction — State Street Bank and Trust Company (SSBT) serves as custodian of the Fund. Pursuant to the custodian agreement, SSBT receives a fee reduced by credits, which are determined based on the average daily cash balance the Fund maintains with SSBT. All credit balances, if any, used to reduce the Fund’s custodian fees are reported as a reduction of expenses in the Statement of Operations.
F Use of Estimates — The preparation of the financial statements in conformity with U.S. GAAP requires management to make estimates and assumptions that affect the reported amounts of assets and liabilities at the date of the financial statements and the reported amounts of income and expense during the reporting period. Actual results could differ from those estimates.
G Indemnifications — Under the Trust’s organizational documents, its officers and Trustees may be indemnified against certain liabilities and expenses arising out of the performance of their duties to the Fund. Under Massachusetts law, if certain conditions prevail, shareholders of a Massachusetts business trust (such as the Trust) could be deemed to have personal liability for the obligations of the Trust. However, the Trust’s Declaration of Trust contains an express disclaimer of liability on the part of Fund shareholders and the By-laws provide that the Trust shall assume the defense on behalf of any Fund shareholders. Moreover, the By-laws also provide for indemnification out of Fund property of any shareholder held personally liable solely by reason of being or having been a shareholder for all loss or expense arising from such liability. Additionally, in the normal course of business, the Fund enters into agreements with service providers that may contain indemnification clauses. The Fund’s maximum exposure under these arrangements is unknown as this would involve future claims that may be made against the Fund that have not yet occurred.
H Other — Investment transactions are accounted for on a trade date basis.
2 Distributions to Shareholders and Income Tax Information
It is the present policy of the Fund to make at least one distribution annually (normally in December) of all or substantially all of its net investment income and to distribute annually all or substantially all of its net realized capital gains. Distributions to shareholders are recorded on the ex-dividend date. Distributions are declared separately for each class of shares. Shareholders may reinvest income and capital gain distributions in additional shares of the same class of the Fund at the net asset value as of the ex-dividend date or, at the election of the shareholder, receive distributions in cash. Distributions to
Eaton Vance
Stock Fund
December 31, 2015
Notes to Financial Statements — continued
shareholders are determined in accordance with income tax regulations, which may differ from U.S. GAAP. As required by U.S. GAAP, only distributions in excess of tax basis earnings and profits are reported in the financial statements as a return of capital. Permanent differences between book and tax accounting relating to distributions are reclassified to paid-in capital. For tax purposes, distributions from short-term capital gains are considered to be from ordinary income.
The tax character of distributions declared for the years ended December 31, 2015 and December 31, 2014 was as follows:
| | | | | | | | |
| | | Year Ended December 31, | |
| | | 2015 | | | 2014 | |
| | |
Distributions declared from: | | | | | | | | |
Ordinary income | | $ | 2,329,755 | | | $ | 2,509,083 | |
Long-term capital gains | | $ | 4,174,571 | | | $ | 6,233,863 | |
During the year ended December 31, 2015, accumulated net realized gain was decreased by $874,837, accumulated undistributed net investment income was decreased by $46,781 and paid-in capital was increased by $921,618 due to the Fund’s use of equalization accounting and differences between book and tax accounting, primarily for foreign currency gain (loss), distributions from real estate investment trusts (REITs) and investments in partnerships. Tax equalization accounting allows the Fund to treat as a distribution that portion of redemption proceeds representing a redeeming shareholder’s portion of undistributed taxable income and net capital gains. These reclassifications had no effect on the net assets or net asset value per share of the Fund.
As of December 31, 2015, the components of distributable earnings (accumulated losses) and unrealized appreciation (depreciation) on a tax basis were as follows:
| | | | |
Undistributed ordinary income | | $ | 92,458 | |
Undistributed long-term capital gains | | $ | 381,816 | |
Post October capital losses | | $ | (286,885 | ) |
Net unrealized appreciation | | $ | 9,598,647 | |
The differences between components of distributable earnings (accumulated losses) on a tax basis and the amounts reflected in the Statement of Assets and Liabilities are primarily due to wash sales, partnership allocations, investments in partnerships and the tax treatment of short-term capital gains.
At December 31, 2015, the Fund had a net capital loss of $286,885 attributable to security transactions incurred after October 31, 2015 that it has elected to defer. This net capital loss is treated as arising on the first day of the Fund’s taxable year ending December 31, 2016.
3 Transactions with Affiliates
Eaton Vance Management (EVM) serves as the administrator of the Fund, but receives no compensation. EVM has agreed to reimburse the Fund’s expenses to the extent that total annual operating expenses (relating to ordinary operating expenses only) exceed 1.05%, 1.80% and 0.80% of the Fund’s average daily net assets for Class A, Class C and Class I, respectively. Pursuant to this agreement, EVM was allocated $109,189 of the Fund’s operating expenses for the year ended December 31, 2015. Effective January 1, 2016, EVM has agreed to reimburse the Fund’s expenses to the extent that total annual operating expenses (relating to ordinary operating expenses only) exceed 0.98%, 1.73% and 0.73% of the Fund’s average daily net assets for Class A, Class C and Class I, respectively. This agreement may be changed or terminated after April 30, 2017. The Portfolio has engaged Boston Management and Research (BMR), a subsidiary of EVM, to render investment advisory services. See Note 2 of the Portfolio’s Notes to Financial Statements which are included elsewhere in this report.
EVM provides sub-transfer agency and related services to the Fund pursuant to a Sub-Transfer Agency Support Services Agreement. For the year ended December 31, 2015, EVM earned $3,437 from the Fund pursuant to such agreement, which is included in transfer and dividend disbursing agent fees on the Statement of Operations. The Fund was informed that Eaton Vance Distributors, Inc. (EVD), an affiliate of EVM and the Fund’s principal underwriter, received $15,101 as its portion of the sales charge on sales of Class A shares for the year ended December 31, 2015. EVD also received distribution and service fees from Class A and Class C shares (see Note 4) and contingent deferred sales charges (see Note 5).
Trustees and officers of the Fund who are members of EVM’s or BMR’s organizations receive remuneration for their services to the Fund out of the investment adviser fee. Certain officers and Trustees of the Fund and the Portfolio are officers of the above organizations.
Eaton Vance
Stock Fund
December 31, 2015
Notes to Financial Statements — continued
4 Distribution Plans
The Fund has in effect a distribution plan for Class A shares (Class A Plan) pursuant to Rule 12b-1 under the 1940 Act. Pursuant to the Class A Plan, the Fund pays EVD a distribution and service fee of 0.25% per annum of its average daily net assets attributable to Class A shares for distribution services and facilities provided to the Fund by EVD, as well as for personal services and/or the maintenance of shareholder accounts. Distribution and service fees paid or accrued to EVD for the year ended December 31, 2015 amounted to $131,091 for Class A shares.
The Fund also has in effect a distribution plan for Class C shares (Class C Plan) pursuant to Rule 12b-1 under the 1940 Act. Pursuant to the Class C Plan, the Fund pays EVD amounts equal to 0.75% per annum of its average daily net assets attributable to Class C shares for providing ongoing distribution services and facilities to the Fund. For the year ended December 31, 2015, the Fund paid or accrued to EVD $93,734 for Class C shares.
Pursuant to the Class C Plan, the Fund also makes payments of service fees to EVD, financial intermediaries and other persons in amounts equal to 0.25% per annum of its average daily net assets attributable to that class. Service fees paid or accrued are for personal services and/or the maintenance of shareholder accounts. They are separate and distinct from the sales commissions and distribution fees payable to EVD. Service fees paid or accrued for the year ended December 31, 2015 amounted to $31,245 for Class C shares.
Distribution and service fees are subject to the limitations contained in the Financial Industry Regulatory Authority’s NASD Conduct Rule 2830(d).
5 Contingent Deferred Sales Charges
A contingent deferred sales charge (CDSC) of 1% generally is imposed on redemptions of Class C shares made within one year of purchase. Class A shares may be subject to a 1% CDSC if redeemed within 18 months of purchase (depending on the circumstances of purchase). Generally, the CDSC is based upon the lower of the net asset value at date of redemption or date of purchase. No charge is levied on shares acquired by reinvestment of dividends or capital gain distributions. For the year ended December 31, 2015, the Fund was informed that EVD received approximately $400 and $500 of CDSCs paid by Class A and Class C shareholders, respectively.
6 Investment Transactions
For the year ended December 31, 2015, increases and decreases in the Fund’s investment in the Portfolio aggregated $20,102,145 and $8,378,450, respectively.
7 Shares of Beneficial Interest
The Fund’s Declaration of Trust permits the Trustees to issue an unlimited number of full and fractional shares of beneficial interest (without par value). Such shares may be issued in a number of different series (such as the Fund) and classes. Transactions in Fund shares were as follows:
| | | | | | | | |
| | | Year Ended December 31, | |
| Class A | | 2015 | | | 2014 | |
| | |
Sales | | | 1,003,651 | | | | 845,764 | |
Issued to shareholders electing to receive payments of distributions in Fund shares | | | 256,555 | | | | 369,924 | |
Redemptions | | | (843,009 | ) | | | (704,100 | ) |
| | |
Net increase | | | 417,197 | | | | 511,588 | |
| | |
| | | | | | | | |
| | | Year Ended December 31, | |
| Class C | | 2015 | | | 2014 | |
| | |
Sales | | | 338,665 | | | | 265,371 | |
Issued to shareholders electing to receive payments of distributions in Fund shares | | | 61,399 | | | | 76,143 | |
Redemptions | | | (150,128 | ) | | | (103,200 | ) |
| | |
Net increase | | | 249,936 | | | | 238,314 | |
Eaton Vance
Stock Fund
December 31, 2015
Notes to Financial Statements — continued
| | | | | | | | |
| | | Year Ended December 31, | |
| Class I | | 2015 | | | 2014 | |
| | |
Sales | | | 718,094 | | | | 1,256,387 | |
Issued to shareholders electing to receive payments of distributions in Fund shares | | | 87,917 | | | | 87,972 | |
Redemptions | | | (271,317 | ) | | | (1,264,132 | ) |
| | |
Net increase | | | 534,694 | | | | 80,227 | |
Eaton Vance
Stock Fund
December 31, 2015
Report of Independent Registered Public Accounting Firm
To the Trustees of Eaton Vance Mutual Funds Trust and Shareholders of Eaton Vance Stock Fund:
We have audited the accompanying statement of assets and liabilities of Eaton Vance Stock Fund (the “Fund”) (one of the funds constituting Eaton Vance Mutual Funds Trust), as of December 31, 2015, and the related statement of operations for the year then ended, the statements of changes in net assets for each of the two years in the period then ended, and the financial highlights for each of the five years in the period then ended. These financial statements and financial highlights are the responsibility of the Fund’s management. Our responsibility is to express an opinion on these financial statements and financial highlights based on our audits.
We conducted our audits in accordance with the standards of the Public Company Accounting Oversight Board (United States). Those standards require that we plan and perform the audit to obtain reasonable assurance about whether the financial statements and financial highlights are free of material misstatement. The Fund is not required to have, nor were we engaged to perform, an audit of its internal control over financial reporting. Our audits included consideration of internal control over financial reporting as a basis for designing audit procedures that are appropriate in the circumstances, but not for the purpose of expressing an opinion on the effectiveness of the Fund’s internal control over financial reporting. Accordingly, we express no such opinion. An audit also includes examining, on a test basis, evidence supporting the amounts and disclosures in the financial statements, assessing the accounting principles used and significant estimates made by management, as well as evaluating the overall financial statement presentation. We believe that our audits provide a reasonable basis for our opinion.
In our opinion, such financial statements and financial highlights referred to above present fairly, in all material respects, the financial position of Eaton Vance Stock Fund as of December 31, 2015, the results of its operations for the year then ended, the changes in its net assets for each of the two years in the period then ended, and the financial highlights for each of the five years in the period then ended, in conformity with accounting principles generally accepted in the United States of America.
DELOITTE & TOUCHE LLP
Boston, Massachusetts
February 19, 2016
Eaton Vance
Stock Fund
December 31, 2015
Federal Tax Information (Unaudited)
The Form 1099-DIV you received in February 2016 showed the tax status of all distributions paid to your account in calendar year 2015. Shareholders are advised to consult their own tax adviser with respect to the tax consequences of their investment in the Fund. As required by the Internal Revenue Code and/or regulations, shareholders must be notified regarding the status of qualified dividend income for individuals, the dividends received deduction for corporations and capital gains dividends.
Qualified Dividend Income. For the fiscal year ended December 31, 2015, the Fund designates approximately $1,256,474, or up to the maximum amount of such dividends allowable pursuant to the Internal Revenue Code, as qualified dividend income eligible for the reduced tax rate of 15%.
Dividends Received Deduction. Corporate shareholders are generally entitled to take the dividends received deduction on the portion of the Fund’s dividend distribution that qualifies under tax law. For the Fund’s fiscal 2015 ordinary income dividends, 51.05% qualifies for the corporate dividends received deduction.
Capital Gains Dividends. The Fund hereby designates as a capital gain dividend with respect to the taxable year ended December 31, 2015, $3,797,312 or, if subsequently determined to be different, the net capital gain of such year.
Stock Portfolio
December 31, 2015
Portfolio of Investments
| | | | | | | | |
| Common Stocks — 99.5% | |
| | |
| | | | | | | | |
| Security | | Shares | | | Value | |
| | | | | | | | |
| | |
Aerospace & Defense — 3.5% | | | | | | | | |
Raytheon Co. | | | 25,609 | | | $ | 3,189,089 | |
Spirit AeroSystems Holdings, Inc., Class A(1) | | | 30,400 | | | | 1,522,128 | |
United Technologies Corp. | | | 96,288 | | | | 9,250,388 | |
| | | | | | | | | |
| | | $ | 13,961,605 | |
| | | | | | | | | |
|
Banks — 3.9% | |
BankUnited, Inc. | | | 147,377 | �� | | $ | 5,314,415 | |
JPMorgan Chase & Co. | | | 80,921 | | | | 5,343,214 | |
PNC Financial Services Group, Inc. (The) | | | 50,150 | | | | 4,779,796 | |
| | | | | | | | | |
| | | $ | 15,437,425 | |
| | | | | | | | | |
|
Beverages — 2.5% | |
Constellation Brands, Inc., Class A | | | 34,287 | | | $ | 4,883,840 | |
Molson Coors Brewing Co., Class B | | | 54,059 | | | | 5,077,222 | |
| | | | | | | | | |
| | | $ | 9,961,062 | |
| | | | | | | | | |
|
Biotechnology — 3.4% | |
Celgene Corp.(1) | | | 17,272 | | | $ | 2,068,495 | |
Gilead Sciences, Inc. | | | 85,873 | | | | 8,689,489 | |
Incyte Corp.(1) | | | 7,800 | | | | 845,910 | |
Vertex Pharmaceuticals, Inc.(1) | | | 13,300 | | | | 1,673,539 | |
| | | | | | | | | |
| | | $ | 13,277,433 | |
| | | | | | | | | |
|
Building Products — 0.6% | |
Masco Corp. | | | 80,100 | | | $ | 2,266,830 | |
| | | | | | | | | |
| | | $ | 2,266,830 | |
| | | | | | | | | |
|
Capital Markets — 3.3% | |
Affiliated Managers Group, Inc.(1) | | | 14,522 | | | $ | 2,320,035 | |
Credit Suisse Group AG | | | 188,422 | | | | 4,058,980 | |
Credit Suisse Group AG(2) | | | 92,644 | | | | 1,995,733 | |
Goldman Sachs Group, Inc. (The) | | | 26,160 | | | | 4,714,817 | |
| | | | | | | | | |
| | | $ | 13,089,565 | |
| | | | | | | | | |
|
Chemicals — 1.2% | |
PPG Industries, Inc. | | | 49,000 | | | $ | 4,842,180 | |
| | | | | | | | | |
| | | $ | 4,842,180 | |
| | | | | | | | | |
|
Consumer Finance — 1.3% | |
Synchrony Financial(1) | | | 174,772 | | | $ | 5,314,816 | |
| | | | | | | | | |
| | | $ | 5,314,816 | |
| | | | | | | | | |
| | | | | | | | |
| Security | | Shares | | | Value | |
| | | | | | | | |
|
Diversified Financial Services — 0.6% | |
McGraw Hill Financial, Inc. | | | 24,000 | | | $ | 2,365,920 | |
| | | | | | | | | |
| | | $ | 2,365,920 | |
| | | | | | | | | |
|
Diversified Telecommunication Services — 2.3% | |
Verizon Communications, Inc. | | | 199,618 | | | $ | 9,226,344 | |
| | | | | | | | | |
| | | $ | 9,226,344 | |
| | | | | | | | | |
|
Electric Utilities — 1.5% | |
NextEra Energy, Inc. | | | 57,914 | | | $ | 6,016,685 | |
| | | | | | | | | |
| | | $ | 6,016,685 | |
| | | | | | | | | |
|
Electrical Equipment — 1.3% | |
Hubbell, Inc. | | | 50,500 | | | $ | 5,102,520 | |
| | | | | | | | | |
| | | $ | 5,102,520 | |
| | | | | | | | | |
|
Energy Equipment & Services — 1.0% | |
Schlumberger, Ltd. | | | 55,900 | | | $ | 3,899,025 | |
| | | | | | | | | |
| | | $ | 3,899,025 | |
| | | | | | | | | |
|
Food & Staples Retailing — 2.6% | |
Kroger Co. (The) | | | 68,840 | | | $ | 2,879,577 | |
Sprouts Farmers Market, Inc.(1) | | | 282,494 | | | | 7,511,516 | |
| | | | | | | | | |
| | | $ | 10,391,093 | |
| | | | | | | | | |
|
Food Products — 3.4% | |
General Mills, Inc. | | | 73,600 | | | $ | 4,243,776 | |
Mondelez International, Inc., Class A | | | 122,600 | | | | 5,497,384 | |
Pinnacle Foods, Inc. | | | 90,046 | | | | 3,823,353 | |
| | | | | | | | | |
| | | $ | 13,564,513 | |
| | | | | | | | | |
|
Health Care Equipment & Supplies — 2.0% | |
Medtronic PLC | | | 102,860 | | | $ | 7,911,991 | |
| | | | | | | | | |
| | | $ | 7,911,991 | |
| | | | | | | | | |
|
Health Care Providers & Services — 1.9% | |
Humana, Inc. | | | 18,300 | | | $ | 3,266,733 | |
McKesson Corp. | | | 21,038 | | | | 4,149,325 | |
| | | | | | | | | |
| | | $ | 7,416,058 | |
| | | | | | | | | |
|
Hotels, Restaurants & Leisure — 0.7% | |
Starbucks Corp. | | | 47,000 | | | $ | 2,821,410 | |
| | | | | | | | | |
| | | $ | 2,821,410 | |
| | | | | | | | | |
| | | | |
| | 19 | | See Notes to Financial Statements. |
Stock Portfolio
December 31, 2015
Portfolio of Investments — continued
| | | | | | | | |
| Security | | Shares | | | Value | |
| | | | | | | | |
|
Household Durables — 1.6% | |
Newell Rubbermaid, Inc. | | | 105,352 | | | $ | 4,643,916 | |
Tempur Sealy International, Inc.(1) | | | 23,000 | | | | 1,620,580 | |
| | | | | | | | | |
| | | $ | 6,264,496 | |
| | | | | | | | | |
|
Industrial Conglomerates — 2.9% | |
General Electric Co. | | | 367,356 | | | $ | 11,443,139 | |
| | | | | | | | | |
| | | $ | 11,443,139 | |
| | | | | | | | | |
|
Insurance — 4.6% | |
ACE, Ltd. | | | 70,757 | | | $ | 8,267,955 | |
Aflac, Inc. | | | 72,600 | | | | 4,348,740 | |
XL Group PLC | | | 140,209 | | | | 5,493,389 | |
| | | | | | | | | |
| | | $ | 18,110,084 | |
| | | | | | | | | |
|
Internet & Catalog Retail — 2.3% | |
Amazon.com, Inc.(1) | | | 13,639 | | | $ | 9,218,464 | |
| | | | | | | | | |
| | | $ | 9,218,464 | |
| | | | | | | | | |
|
Internet Software & Services — 6.1% | |
Alibaba Group Holding, Ltd. ADR(1) | | | 25,500 | | | $ | 2,072,385 | |
Alphabet, Inc., Class C(1) | | | 17,324 | | | | 13,146,837 | |
Facebook, Inc., Class A(1) | | | 72,291 | | | | 7,565,976 | |
Twitter, Inc.(1) | | | 53,000 | | | | 1,226,420 | |
| | | | | | | | | |
| | | $ | 24,011,618 | |
| | | | | | | | | |
|
IT Services — 2.9% | |
Fiserv, Inc.(1) | | | 45,972 | | | $ | 4,204,599 | |
Visa, Inc., Class A | | | 93,300 | | | | 7,235,415 | |
| | | | | | | | | |
| | | $ | 11,440,014 | |
| | | | | | | | | |
|
Leisure Products — 1.1% | |
Vista Outdoor, Inc.(1) | | | 93,357 | | | $ | 4,155,320 | |
| | | | | | | | | |
| | | $ | 4,155,320 | |
| | | | | | | | | |
|
Life Sciences Tools & Services — 1.0% | |
Thermo Fisher Scientific, Inc. | | | 27,862 | | | $ | 3,952,225 | |
| | | | | | | | | |
| | | $ | 3,952,225 | |
| | | | | | | | | |
|
Media — 2.8% | |
Walt Disney Co. (The) | | | 104,427 | | | $ | 10,973,189 | |
| | | | | | | | | |
| | | $ | 10,973,189 | |
| | | | | | | | | |
| | | | | | | | |
| Security | | Shares | | | Value | |
| | | | | | | | |
|
Metals & Mining — 1.5% | |
Compass Minerals International, Inc. | | | 81,200 | | | $ | 6,111,924 | |
| | | | | | | | | |
| | | $ | 6,111,924 | |
| | | | | | | | | |
|
Multi-Utilities — 1.4% | |
Sempra Energy | | | 57,362 | | | $ | 5,392,602 | |
| | | | | | | | | |
| | | $ | 5,392,602 | |
| | | | | | | | | |
|
Multiline Retail — 2.3% | |
Dollar General Corp. | | | 124,737 | | | $ | 8,964,848 | |
| | | | | | | | | |
| | | $ | 8,964,848 | |
| | | | | | | | | |
|
Oil, Gas & Consumable Fuels — 5.5% | |
Anadarko Petroleum Corp. | | | 47,372 | | | $ | 2,301,332 | |
EOG Resources, Inc. | | | 42,800 | | | | 3,029,812 | |
Exxon Mobil Corp. | | | 62,650 | | | | 4,883,567 | |
Occidental Petroleum Corp. | | | 81,329 | | | | 5,498,654 | |
Range Resources Corp. | | | 88,400 | | | | 2,175,524 | |
Royal Dutch Shell PLC, Class B | | | 171,012 | | | | 3,897,521 | |
| | | | | | | | | |
| | | $ | 21,786,410 | |
| | | | | | | | | |
|
Pharmaceuticals — 6.9% | |
Allergan PLC(1) | | | 15,025 | | | $ | 4,695,312 | |
Bristol-Myers Squibb Co. | | | 67,400 | | | | 4,636,446 | |
Johnson & Johnson | | | 110,100 | | | | 11,309,472 | |
Teva Pharmaceutical Industries, Ltd. ADR | | | 102,745 | | | | 6,744,182 | |
| | | | | | | | | |
| | | $ | 27,385,412 | |
| | | | | | | | | |
|
Professional Services — 0.7% | |
Verisk Analytics, Inc.(1) | | | 35,700 | | | $ | 2,744,616 | |
| | | | | | | | | |
| | | $ | 2,744,616 | |
| | | | | | | | | |
|
Real Estate Investment Trusts (REITs) — 2.6% | |
Equity Residential | | | 60,200 | | | $ | 4,911,718 | |
Federal Realty Investment Trust | | | 38,000 | | | | 5,551,800 | |
| | | | | | | | | |
| | | $ | 10,463,518 | |
| | | | | | | | | |
|
Road & Rail — 1.1% | |
Union Pacific Corp. | | | 54,300 | | | $ | 4,246,260 | |
| | | | | | | | | |
| | | $ | 4,246,260 | |
| | | | | | | | | |
|
Semiconductors & Semiconductor Equipment — 2.3% | |
Avago Technologies, Ltd. | | | 36,000 | | | $ | 5,225,400 | |
NXP Semiconductors NV(1) | | | 46,351 | | | | 3,905,072 | |
| | | | | | | | | |
| | | $ | 9,130,472 | |
| | | | | | | | | |
| | | | |
| | 20 | | See Notes to Financial Statements. |
Stock Portfolio
December 31, 2015
Portfolio of Investments — continued
| | | | | | | | |
| Security | | Shares | | | Value | |
| | | | | | | |
|
Software — 6.0% | |
Mentor Graphics Corp. | | | 113,500 | | | $ | 2,090,670 | |
Microsoft Corp. | | | 214,505 | | | | 11,900,737 | |
Oracle Corp. | | | 124,384 | | | | 4,543,748 | |
Tableau Software, Inc., Class A(1) | | | 16,830 | | | | 1,585,723 | |
Verint Systems, Inc.(1) | | | 92,695 | | | | 3,759,709 | |
| | | | | | | | | |
| | | $ | 23,880,587 | |
| | | | | | | | | |
|
Specialty Retail — 2.1% | |
Home Depot, Inc. (The) | | | 62,287 | | | $ | 8,237,456 | |
| | | | | | | | | |
| | | $ | 8,237,456 | |
| | | | | | | | | |
|
Technology Hardware, Storage & Peripherals — 3.3% | |
Apple, Inc. | | | 122,558 | | | $ | 12,900,455 | |
| | | | | | | | | |
| | | $ | 12,900,455 | |
| | | | | | | | | |
|
Tobacco — 1.5% | |
Reynolds American, Inc. | | | 125,733 | | | $ | 5,802,578 | |
| | | | | | | | | |
| | | $ | 5,802,578 | |
| | | | | | | | | |
| |
Total Common Stocks — 99.5%
(identified cost $356,085,406) | | | $ | 393,482,162 | |
| | | | | | | | | |
| | |
| Short-Term Investments — 2.5% | | | | | | | | |
| | |
| | | | | | | | |
| Description | | Interest
(000’s omitted) | | | Value | |
Eaton Vance Cash Reserves Fund, LLC, 0.37%(3) | | $ | 9,928 | | | $ | 9,928,325 | |
| | | | | | | | | |
| |
Total Short-Term Investments
(identified cost $9,928,325) | | | $ | 9,928,325 | |
| | | | | | | | | |
| |
Total Investments — 102.0%
(identified cost $366,013,731) | | | $ | 403,410,487 | |
| | | | | | | | | |
| |
Other Assets, Less Liabilities — (2.0)% | | | $ | (7,918,586 | ) |
| | | | | | | | | |
| |
Net Assets — 100.0% | | | $ | 395,491,901 | |
| | | | | | | | | |
The percentage shown for each investment category in the Portfolio of Investments is based on net assets.
| (1) | Non-income producing security. |
| (2) | Security was acquired in a private offering and may be resold on a designated offshore securities market pursuant to Regulation S under the Securities Act of 1933. |
| (3) | Affiliated investment company, available to Eaton Vance portfolios and funds, which invests in high quality, U.S. dollar denominated money market instruments. The rate shown is the annualized seven-day yield as of December 31, 2015. |
| | | | |
| Abbreviations: |
| | |
| ADR | | – | | American Depositary Receipt |
| | | | |
| | 21 | | See Notes to Financial Statements. |
Stock Portfolio
December 31, 2015
Statement of Assets and Liabilities
| | | | |
| Assets | | December 31, 2015 | |
Unaffiliated investments, at value (identified cost, $356,085,406) | | $ | 393,482,162 | |
Affiliated investment, at value (identified cost, $9,928,325) | | | 9,928,325 | |
Cash | | | 19,552 | |
Foreign currency, at value (identified cost, $74,272) | | | 73,285 | |
Dividends receivable | | | 566,871 | |
Interest receivable from affiliated investment | | | 1,623 | |
Receivable for investments sold | | | 187,564 | |
Tax reclaims receivable | | | 86,615 | |
Total assets | | $ | 404,345,997 | |
|
| Liabilities | |
Payable for investments purchased | | $ | 8,569,747 | |
Payable to affiliates: | | | | |
Investment adviser fee | | | 210,507 | |
Trustees’ fees | | | 4,018 | |
Accrued expenses | | | 69,824 | |
Total liabilities | | $ | 8,854,096 | |
Net Assets applicable to investors’ interest in Portfolio | | $ | 395,491,901 | |
|
| Sources of Net Assets | |
Investors’ capital | | $ | 358,098,045 | |
Net unrealized appreciation | | | 37,393,856 | |
Total | | $ | 395,491,901 | |
| | | | |
| | 22 | | See Notes to Financial Statements. |
Stock Portfolio
December 31, 2015
Statement of Operations
| | | | |
| Investment Income | | Year Ended December 31, 2015 | |
Dividends (net of foreign taxes, $27,712) | | $ | 5,558,157 | |
Interest allocated from affiliated investment | | | 9,895 | |
Expenses allocated from affiliated investment | | | (621 | ) |
Total investment income | | $ | 5,567,431 | |
|
| Expenses | |
Investment adviser fee | | $ | 1,941,084 | |
Trustees’ fees and expenses | | | 15,350 | |
Custodian fee | | | 86,619 | |
Legal and accounting services | | | 41,763 | |
Miscellaneous | | | 13,416 | |
Total expenses | | $ | 2,098,232 | |
Deduct — | | | | |
Reduction of custodian fee | | $ | 1 | |
Total expense reductions | | $ | 1 | |
| |
Net expenses | | $ | 2,098,231 | |
| |
Net investment income | | $ | 3,469,200 | |
|
| Realized and Unrealized Gain (Loss) | |
Net realized gain (loss) — | | | | |
Investment transactions | | $ | 15,793,320 | |
Investment transactions allocated from affiliated investment | | | 7 | |
Foreign currency transactions | | | 22,122 | |
Net realized gain | | $ | 15,815,449 | |
Change in unrealized appreciation (depreciation) — | | | | |
Investments | | $ | (5,535,252 | ) |
Foreign currency | | | (635 | ) |
Net change in unrealized appreciation (depreciation) | | $ | (5,535,887 | ) |
| |
Net realized and unrealized gain | | $ | 10,279,562 | |
| |
Net increase in net assets from operations | | $ | 13,748,762 | |
| | | | |
| | 23 | | See Notes to Financial Statements. |
Stock Portfolio
December 31, 2015
Statements of Changes in Net Assets
| | | | | | | | |
| | | Year Ended December 31, | |
| Increase (Decrease) in Net Assets | | 2015 | | | 2014 | |
From operations — | | | | | | | | |
Net investment income | | $ | 3,469,200 | | | $ | 2,666,212 | |
Net realized gain from investment transactions, written options and foreign currency transactions | | | 15,815,449 | | | | 41,142,651 | |
Net change in unrealized appreciation (depreciation) from investments, written options and foreign currency | | | (5,535,887 | ) | | | (13,740,557 | ) |
Net increase in net assets from operations | | $ | 13,748,762 | | | $ | 30,068,306 | |
Capital transactions — | | | | | | | | |
Contributions | | $ | 140,928,255 | | | $ | 60,069,001 | |
Withdrawals | | | (12,114,450 | ) | | | (74,340,840 | ) |
Net increase (decrease) in net assets from capital transactions | | $ | 128,813,805 | | | $ | (14,271,839 | ) |
| | |
Net increase in net assets | | $ | 142,562,567 | | | $ | 15,796,467 | |
|
| Net Assets | |
At beginning of year | | $ | 252,929,334 | | | $ | 237,132,867 | |
At end of year | | $ | 395,491,901 | | | $ | 252,929,334 | |
| | | | |
| | 24 | | See Notes to Financial Statements. |
Stock Portfolio
December 31, 2015
Supplementary Data
| | | | | | | | | | | | | | | | | | | | |
| | | Year Ended December 31, | |
| Ratios/Supplemental Data | | 2015 | | | 2014 | | | 2013 | | | 2012 | | | 2011 | |
Ratios (as a percentage of average daily net assets): | | | | | | | | | | | | | | | | | | | | |
Expenses(1) | | | 0.70 | % | | | 0.71 | % | | | 0.73 | % | | | 0.73 | % | | | 0.73 | % |
Net investment income | | | 1.16 | % | | | 1.07 | % | | | 0.93 | % | | | 1.21 | % | | | 1.25 | % |
Portfolio Turnover | | | 96 | % | | | 109 | % | | | 90 | % | | | 91 | % | | | 64 | % |
| | | | | |
Total Return | | | 4.88 | % | | | 12.56 | % | | | 33.50 | % | | | 16.18 | % | | | (1.55 | )% |
| | | | | |
Net assets, end of year (000’s omitted) | | $ | 395,492 | | | $ | 252,929 | | | $ | 237,133 | | | $ | 188,806 | | | $ | 204,506 | |
| (1) | Excludes the effect of custody fee credits, if any, of less than 0.005%. |
| | | | |
| | 25 | | See Notes to Financial Statements. |
Stock Portfolio
December 31, 2015
Notes to Financial Statements
1 Significant Accounting Policies
Stock Portfolio (the Portfolio) is a Massachusetts business trust registered under the Investment Company Act of 1940, as amended (the 1940 Act), as a diversified, open-end management investment company. The Portfolio’s investment objective is to achieve long-term capital appreciation by investing in a diversified portfolio of equity securities The Declaration of Trust permits the Trustees to issue interests in the Portfolio. At December 31, 2015, Eaton Vance Stock Fund and Eaton Vance Balanced Fund held an interest of 23.0% and 77.0%, respectively, in the Portfolio.
The following is a summary of significant accounting policies of the Portfolio. The policies are in conformity with accounting principles generally accepted in the United States of America (U.S. GAAP). The Portfolio is an investment company and follows accounting and reporting guidance in the Financial Accounting Standards Board (“FASB”) Accounting Standards Codification Topic 946.
A Investment Valuation — The following methodologies are used to determine the market value or fair value of investments.
Equity Securities. Equity securities listed on a U.S. securities exchange generally are valued at the last sale or closing price on the day of valuation or, if no sales took place on such date, at the mean between the closing bid and asked prices therefore on the exchange where such securities are principally traded. Equity securities listed on the NASDAQ Global or Global Select Market generally are valued at the NASDAQ official closing price. Unlisted or listed securities for which closing sales prices or closing quotations are not available are valued at the mean between the latest available bid and asked prices.
Derivatives. Exchange-traded options (other than FLexible EXchange traded options) are valued at the mean between the bid and asked prices at valuation time as reported by the Options Price Reporting Authority for U.S. listed options or by the relevant exchange or board of trade for non-U.S. listed options. Over-the-counter options and FLexible EXchange traded options traded at the Chicago Board Options Exchange are valued by a third party pricing service using techniques that consider factors including the value of the underlying instrument, the volatility of the underlying instrument and the period of time until option expiration.
Foreign Securities and Currencies. Foreign securities and currencies are valued in U.S. dollars, based on foreign currency exchange rate quotations supplied by a third party pricing service. The pricing service uses a proprietary model to determine the exchange rate. Inputs to the model include reported trades and implied bid/ask spreads. The daily valuation of exchange-traded foreign securities generally is determined as of the close of trading on the principal exchange on which such securities trade. Events occurring after the close of trading on foreign exchanges may result in adjustments to the valuation of foreign securities to more accurately reflect their fair value as of the close of regular trading on the New York Stock Exchange. When valuing foreign equity securities that meet certain criteria, the Portfolio’s Trustees have approved the use of a fair value service that values such securities to reflect market trading that occurs after the close of the applicable foreign markets of comparable securities or other instruments that have a strong correlation to the fair-valued securities.
Affiliated Fund. The Portfolio may invest in Eaton Vance Cash Reserves Fund, LLC (Cash Reserves Fund), an affiliated investment company managed by Eaton Vance Management (EVM). The value of the Portfolio’s investment in Cash Reserves Fund reflects the Portfolio’s proportionate interest in its net assets. Cash Reserves Fund generally values its investment securities utilizing the amortized cost valuation technique in accordance with Rule 2a-7 under the 1940 Act. This technique involves initially valuing a portfolio security at its cost and thereafter assuming a constant amortization to maturity of any discount or premium. If amortized cost is determined not to approximate fair value, Cash Reserves Fund may value its investment securities based on available market quotations provided by a third party pricing service.
Fair Valuation. Investments for which valuations or market quotations are not readily available or are deemed unreliable are valued at fair value using methods determined in good faith by or at the direction of the Trustees of the Portfolio in a manner that fairly reflects the security’s value, or the amount that the Portfolio might reasonably expect to receive for the security upon its current sale in the ordinary course. Each such determination is based on a consideration of relevant factors, which are likely to vary from one pricing context to another. These factors may include, but are not limited to, the type of security, the existence of any contractual restrictions on the security’s disposition, the price and extent of public trading in similar securities of the issuer or of comparable companies or entities, quotations or relevant information obtained from broker/dealers or other market participants, information obtained from the issuer, analysts, and/or the appropriate stock exchange (for exchange-traded securities), an analysis of the company’s or entity’s financial condition, and an evaluation of the forces that influence the issuer and the market(s) in which the security is purchased and sold.
B Investment Transactions — Investment transactions for financial statement purposes are accounted for on a trade date basis. Realized gains and losses on investments sold are determined on the basis of identified cost.
C Income — Dividend income is recorded on the ex-dividend date for dividends received in cash and/or securities. However, if the ex-dividend date has passed, certain dividends from foreign securities are recorded as the Portfolio is informed of the ex-dividend date. Withholding taxes on foreign dividends and capital gains have been provided for in accordance with the Portfolio’s understanding of the applicable countries’ tax rules and rates. Interest income is recorded on the basis of interest accrued, adjusted for amortization of premium or accretion of discount.
D Federal Taxes — The Portfolio has elected to be treated as a partnership for federal tax purposes. No provision is made by the Portfolio for federal or state taxes on any taxable income of the Portfolio because each investor in the Portfolio is ultimately responsible for the payment of any taxes on its share of taxable income. Since at least one of the Portfolio’s investors is a regulated investment company that invests all or substantially all of its assets in the Portfolio, the Portfolio normally must satisfy the applicable source of income and diversification requirements (under the Internal Revenue Code) in order for its investors to satisfy them. The Portfolio will allocate, at least annually among its investors, each investor’s distributive share of the Portfolio’s net investment income, net realized capital gains and losses and any other items of income, gain, loss, deduction or credit.
Stock Portfolio
December 31, 2015
Notes to Financial Statements — continued
As of December 31, 2015, the Portfolio had no uncertain tax positions that would require financial statement recognition, de-recognition, or disclosure. The Portfolio files a U.S. federal income tax return annually after its fiscal year-end, which is subject to examination by the Internal Revenue Service for a period of three years from the date of filing.
E Expense Reduction — State Street Bank and Trust Company (SSBT) serves as custodian of the Portfolio. Pursuant to the custodian agreement, SSBT receives a fee reduced by credits, which are determined based on the average daily cash balance the Portfolio maintains with SSBT. All credit balances, if any, used to reduce the Portfolio’s custodian fees are reported as a reduction of expenses in the Statement of Operations.
F Foreign Currency Translation — Investment valuations, other assets, and liabilities initially expressed in foreign currencies are translated each business day into U.S. dollars based upon current exchange rates. Purchases and sales of foreign investment securities and income and expenses denominated in foreign currencies are translated into U.S. dollars based upon currency exchange rates in effect on the respective dates of such transactions. Recognized gains or losses on investment transactions attributable to changes in foreign currency exchange rates are recorded for financial statement purposes as net realized gains and losses on investments. That portion of unrealized gains and losses on investments that results from fluctuations in foreign currency exchange rates is not separately disclosed.
G Use of Estimates — The preparation of the financial statements in conformity with U.S. GAAP requires management to make estimates and assumptions that affect the reported amounts of assets and liabilities at the date of the financial statements and the reported amounts of income and expense during the reporting period. Actual results could differ from those estimates.
H Indemnifications — Under the Portfolio’s organizational documents, its officers and Trustees may be indemnified against certain liabilities and expenses arising out of the performance of their duties to the Portfolio. Under Massachusetts law, if certain conditions prevail, interestholders in the Portfolio could be deemed to have personal liability for the obligations of the Portfolio. However, the Portfolio’s Declaration of Trust contains an express disclaimer of liability on the part of Portfolio interestholders and the By-laws provide that the Portfolio shall assume the defense on behalf of any Portfolio interestholder. Moreover, the By-laws also provide for indemnification out of Portfolio property of any interestholder held personally liable solely by reason of being or having been an interestholder for all loss or expense arising from such liability. Additionally, in the normal course of business, the Portfolio enters into agreements with service providers that may contain indemnification clauses. The Portfolio’s maximum exposure under these arrangements is unknown as this would involve future claims that may be made against the Portfolio that have not yet occurred.
I Written Options — Upon the writing of a call or a put option, the premium received by the Portfolio is included in the Statement of Assets and Liabilities as a liability. The amount of the liability is subsequently marked-to-market to reflect the current market value of the option written, in accordance with the Portfolio’s policies on investment valuations discussed above. Premiums received from writing options which expire are treated as realized gains. Premiums received from writing options which are exercised or are closed are added to or offset against the proceeds or amount paid on the transaction to determine the realized gain or loss. When an index option is exercised, the Portfolio is required to deliver an amount of cash determined by the excess of the strike price of the option over the value of the index (in the case of a put) or the excess of the value of the index over the strike price of the option (in the case of a call) at contract termination. If a put option on a security is exercised, the premium reduces the cost basis of the securities purchased by the Portfolio. The Portfolio, as a writer of an option, may have no control over whether the underlying securities or other assets may be sold (call) or purchased (put) and, as a result, bears the market risk of an unfavorable change in the price of the securities or other assets underlying the written option. The Portfolio may also bear the risk of not being able to enter into a closing transaction if a liquid secondary market does not exist.
J Purchased Options — Upon the purchase of a call or put option, the premium paid by the Portfolio is included in the Statement of Assets and Liabilities as an investment. The amount of the investment is subsequently marked-to-market to reflect the current market value of the option purchased, in accordance with the Portfolio’s policies on investment valuations discussed above. As the purchaser of an index option, the Portfolio has the right to receive a cash payment equal to any depreciation in the value of the index below the strike price of the option (in the case of a put) or equal to any appreciation in the value of the index over the strike price of the option (in the case of a call) as of the valuation date of the option. If an option which the Portfolio had purchased expires on the stipulated expiration date, the Portfolio will realize a loss in the amount of the cost of the option. If the Portfolio enters into a closing sale transaction, the Portfolio will realize a gain or loss, depending on whether the sales proceeds from the closing sale transaction are greater or less than the cost of the option. If the Portfolio exercises a put option on a security, it will realize a gain or loss from the sale of the underlying security, and the proceeds from such sale will be decreased by the premium originally paid. If the Portfolio exercises a call option on a security, the cost of the security which the Portfolio purchases upon exercise will be increased by the premium originally paid. The risk associated with purchasing options is limited to the premium originally paid.
2 Investment Adviser Fee and Other Transactions with Affiliates
The investment adviser fee is earned by Boston Management and Research (BMR), a subsidiary of EVM, as compensation for investment advisory services rendered to the Portfolio. The fee is computed at an annual rate of 0.65% of the Portfolio’s average daily net assets up to $500 million, and is payable monthly. On net assets of $500 million and over, the annual fee is reduced. For the year ended December 31, 2015, the Portfolio’s investment adviser fee amounted to $1,941,084 or 0.65% of the Portfolio’s average daily net assets. Pursuant to a fee reduction agreement effective January 1, 2016 between the Portfolio and BMR, the fee will be computed at an annual rate of 0.60% of the Portfolio’s average daily net assets up to $500 million, and is payable monthly. On net assets of $500 million and over, the annual fee is reduced. The fee reduction cannot be terminated or reduced without the approval of a majority vote of the Trustees of the Portfolio who are not interested persons of BMR or the Portfolio and by the vote of a majority of holders of interest in
Stock Portfolio
December 31, 2015
Notes to Financial Statements — continued
the Portfolio. The Portfolio invests its cash in Cash Reserves Fund. EVM does not currently receive a fee for advisory services provided to Cash Reserves Fund.
Trustees and officers of the Portfolio who are members of EVM’s or BMR’s organizations receive remuneration for their services to the Portfolio out of the investment adviser fee. Trustees of the Portfolio who are not affiliated with the investment adviser may elect to defer receipt of all or a percentage of their annual fees in accordance with the terms of the Trustees Deferred Compensation Plan. For the year ended December 31, 2015, no significant amounts have been deferred. Certain officers and Trustees of the Portfolio are officers of the above organizations.
3 Purchases and Sales of Investments
Purchases and sales of investments, other than short-term obligations, aggregated $417,795,176 and $285,399,866, respectively, for the year ended December��31, 2015.
4 Federal Income Tax Basis of Investments
The cost and unrealized appreciation (depreciation) of investments of the Portfolio at December 31, 2015, as determined on a federal income tax basis, were as follows:
| | | | |
| |
Aggregate cost | | $ | 366,938,041 | |
| |
Gross unrealized appreciation | | $ | 48,266,533 | |
Gross unrealized depreciation | | | (11,794,087 | ) |
| |
Net unrealized appreciation | | $ | 36,472,446 | |
The net unrealized depreciation on foreign currency transactions at December 31, 2015 on a federal income tax basis was $2,900.
5 Line of Credit
The Portfolio participates with other portfolios and funds managed by EVM and its affiliates in a $625 million unsecured line of credit agreement with a group of banks, which is in effect through September 2, 2016. Borrowings are made by the Portfolio solely to facilitate the handling of unusual and/or unanticipated short-term cash requirements. Interest is charged to the Portfolio based on its borrowings at an amount above either the Eurodollar rate or Federal Funds rate. In addition, a fee computed at an annual rate of 0.10% on the daily unused portion of the line of credit is allocated among the participating portfolios and funds at the end of each quarter. Because the line of credit is not available exclusively to the Portfolio, it may be unable to borrow some or all of its requested amounts at any particular time. The Portfolio did not have any significant borrowings or allocated fees during the year ended December 31, 2015.
6 Fair Value Measurements
Under generally accepted accounting principles for fair value measurements, a three-tier hierarchy to prioritize the assumptions, referred to as inputs, is used in valuation techniques to measure fair value. The three-tier hierarchy of inputs is summarized in the three broad levels listed below.
| • | | Level 1 – quoted prices in active markets for identical investments |
| • | | Level 2 – other significant observable inputs (including quoted prices for similar investments, interest rates, prepayment speeds, credit risk, etc.) |
| • | | Level 3 – significant unobservable inputs (including a fund’s own assumptions in determining the fair value of investments) |
In cases where the inputs used to measure fair value fall in different levels of the fair value hierarchy, the level disclosed is determined based on the lowest level input that is significant to the fair value measurement in its entirety. The inputs or methodology used for valuing securities are not necessarily an indication of the risk associated with investing in those securities.
Stock Portfolio
December 31, 2015
Notes to Financial Statements — continued
At December 31, 2015, the hierarchy of inputs used in valuing the Portfolio’s investments, which are carried at value, were as follows:
| | | | | | | | | | | | | | | | |
| Asset Description | | Level 1 | | | Level 2 | | | Level 3 | | | Total | |
| | | | |
Common Stocks | | | | | | | | | | | | | | | | |
Consumer Discretionary | | $ | 50,635,183 | | | $ | — | | | $ | — | | | $ | 50,635,183 | |
Consumer Staples | | | 39,719,246 | | | | — | | | | — | | | | 39,719,246 | |
Energy | | | 21,787,914 | | | | 3,897,521 | | | | — | | | | 25,685,435 | |
Financials | | | 58,726,615 | | | | 6,054,713 | | | | — | | | | 64,781,328 | |
Health Care | | | 59,943,119 | | | | — | | | | — | | | | 59,943,119 | |
Industrials | | | 39,764,970 | | | | — | | | | — | | | | 39,764,970 | |
Information Technology | | | 81,363,146 | | | | — | | | | — | | | | 81,363,146 | |
Materials | | | 10,954,104 | | | | — | | | | — | | | | 10,954,104 | |
Telecommunication Services | | | 9,226,344 | | | | — | | | | — | | | | 9,226,344 | |
Utilities | | | 11,409,287 | | | | — | | | | — | | | | 11,409,287 | |
| | | | |
Total Common Stocks | | $ | 383,529,928 | | | $ | 9,952,234 | * | | $ | — | | | $ | 393,482,162 | |
| | | | |
Short-Term Investments | | $ | — | | | $ | 9,928,325 | | | $ | — | | | $ | 9,928,325 | |
| | | | |
Total Investments | | $ | 383,529,928 | | | $ | 19,880,559 | | | $ | — | | | $ | 403,410,487 | |
| * | Includes foreign equity securities whose values were adjusted to reflect market trading of comparable securities or other correlated instruments that occurred after the close of trading in their applicable foreign markets. |
The Portfolio held no investments or other financial instruments as of December 31, 2014 whose fair value was determined using Level 3 inputs. At December 31, 2015, there were no investments transferred between Level 1 and Level 2 during the year then ended.
Stock Portfolio
December 31, 2015
Report of Independent Registered Public Accounting Firm
To the Trustees and Investors of Stock Portfolio:
We have audited the accompanying statement of assets and liabilities of Stock Portfolio (the “Portfolio”), including the portfolio of investments, as of December 31, 2015, and the related statement of operations for the year then ended, the statements of changes in net assets for each of the two years in the period then ended, and the supplementary data for each of the five years in the period then ended. These financial statements and supplementary data are the responsibility of the Portfolio’s management. Our responsibility is to express an opinion on these financial statements and supplementary data based on our audits.
We conducted our audits in accordance with the standards of the Public Company Accounting Oversight Board (United States). Those standards require that we plan and perform the audit to obtain reasonable assurance about whether the financial statements and supplementary data are free of material misstatement. The Portfolio is not required to have, nor were we engaged to perform, an audit of its internal control over financial reporting. Our audits included consideration of internal control over financial reporting as a basis for designing audit procedures that are appropriate in the circumstances, but not for the purpose of expressing an opinion on the effectiveness of the Portfolio’s internal control over financial reporting. Accordingly, we express no such opinion. An audit also includes examining, on a test basis, evidence supporting the amounts and disclosures in the financial statements, assessing the accounting principles used and significant estimates made by management, as well as evaluating the overall financial statement presentation. Our procedures included confirmation of securities owned as of December 31, 2015 by correspondence with the custodian and brokers; where replies were not received from brokers, we performed other auditing procedures. We believe that our audits provide a reasonable basis for our opinion.
In our opinion, such financial statements and supplementary data referred to above present fairly, in all material respects, the financial position of Stock Portfolio as of December 31, 2015, the results of its operations for the year then ended, the changes in its net assets for each of the two years in the period then ended, and the supplementary data for each of the five years in the period then ended, in conformity with accounting principles generally accepted in the United States of America.
DELOITTE & TOUCHE LLP
Boston, Massachusetts
February 19, 2016
Eaton Vance
Stock Fund
December 31, 2015
Management and Organization
Fund Management. The Trustees of Eaton Vance Mutual Funds Trust (the Trust) and Stock Portfolio (the Portfolio) are responsible for the overall management and supervision of the Trust’s and Portfolio’s affairs. The Trustees and officers of the Trust and the Portfolio are listed below. Except as indicated, each individual has held the office shown or other offices in the same company for the last five years. Trustees and officers of the Trust and the Portfolio hold indefinite terms of office. The “Noninterested Trustees” consist of those Trustees who are not “interested persons” of the Trust and the Portfolio, as that term is defined under the 1940 Act. The business address of each Trustee and officer is Two International Place, Boston, Massachusetts 02110. As used below, “EVC” refers to Eaton Vance Corp., “EV” refers to Eaton Vance, Inc., “EVM” refers to Eaton Vance Management, “BMR” refers to Boston Management and Research, “EVMI” refers to Eaton Vance Management (International) Limited and “EVD” refers to Eaton Vance Distributors, Inc. EVC and EV are the corporate parent and trustee, respectively, of EVM and BMR. EVMI is an indirect, wholly-owned subsidiary of EVC. EVD is the Fund’s principal underwriter, the Portfolio’s placement agent and a wholly-owned subsidiary of EVC. Each officer affiliated with Eaton Vance may hold a position with other Eaton Vance affiliates that is comparable to his or her position with EVM listed below. Each Trustee oversees 174 portfolios in the Eaton Vance Complex (including all master and feeder funds in a master feeder structure). Each officer serves as an officer of certain other Eaton Vance funds. Each Trustee and officer serves until his or her successor is elected.
| | | | | | |
| Name and Year of Birth | | Position(s) with the Trust and the
Portfolio | | Trustee Since(1) | | Principal Occupation(s) and Directorships During Past Five Years and Other Relevant Experience |
Interested Trustee | | | | | | |
| | | |
Thomas E. Faust Jr. 1958 | | Trustee | | 2007 | | Chairman, Chief Executive Officer and President of EVC, Director and President of EV, Chief Executive Officer and President of EVM and BMR, and Director of EVD and EVMI. Trustee and/or officer of 174 registered investment companies. Mr. Faust is an interested person because of his positions with EVM, BMR, EVD, EVMI, EVC and EV, which are affiliates of the Trust and the Portfolio. Directorships in the Last Five Years.(2) Director of EVC and Hexavest Inc. (investment management firm). |
| | | |
| | | | | | |
Noninterested Trustees | | | | | | |
| | | |
Scott E. Eston 1956 | | Trustee | | 2011 | | Private investor. Formerly held various positions at Grantham, Mayo, Van Otterloo and Co., L.L.C. (investment management firm) (1997-2009), including Chief Operating Officer (2002-2009), Chief Financial Officer (1997-2009) and Chairman of the Executive Committee (2002-2008); President and Principal Executive Officer, GMO Trust (open-end registered investment company) (2006-2009). Former Partner, Coopers and Lybrand L.L.P. (now PricewaterhouseCoopers) (an independent registered public accounting firm) (1987-1997). Directorships in the Last Five Years.(2) None. |
| | | |
Cynthia E. Frost 1961 | | Trustee | | 2014 | | Private investor. Formerly, Chief Investment Officer of Brown University (university endowment) (2000-2012); Portfolio Strategist for Duke Management Company (university endowment manager) (1995-2000); Managing Director, Cambridge Associates (investment consulting company) (1989-1995); Consultant, Bain and Company (management consulting firm) (1987-1989); Senior Equity Analyst, BA Investment Management Company (1983-1985). Directorships in the Last Five Years. None. |
| | | |
George J. Gorman 1952 | | Trustee | | 2014 | | Principal at George J. Gorman LLC (consulting firm). Formerly, Senior Partner at Ernst & Young LLP (public accounting firm) (1974-2009). Directorships in the Last Five Years. Formerly, Trustee of the Bank of America Money Market Funds Series Trust (2011-2014) and of the Ashmore Funds (2010-2014). |
| | | |
Valerie A. Mosley 1960 | | Trustee | | 2014 | | Chairwoman and Chief Executive Officer of Valmo Ventures (a consulting and investment firm). Former Partner and Senior Vice President, Portfolio Manager and Investment Strategist at Wellington Management Company, LLP (investment management firm) (1992-2012). Former Chief Investment Officer, PG Corbin Asset Management (1990-1992). Formerly worked in institutional corporate bond sales at Kidder Peabody (1986-1990). Directorships in the Last Five Years.(2) Director of Dynex Capital, Inc. (mortgage REIT) (since 2013). |
Eaton Vance
Stock Fund
December 31, 2015
Management and Organization — continued
| | | | | | |
| Name and Year of Birth | | Position(s) with the Trust and the
Portfolio | | Trustee Since(1) | | Principal Occupation(s) and Directorships During Past Five Years and Other Relevant Experience |
Noninterested Trustees (continued) |
| | | |
William H. Park 1947 | | Vice-Chairperson of the Board and Trustee | | 2016 (Vice-Chairperson) and 2003 (Trustee) | | Private investor. Formerly, Consultant (2012-2014). Formerly, Chief Financial Officer, Aveon Group L.P. (investment management firm) (2010-2011). Formerly, Vice Chairman, Commercial Industrial Finance Corp. (specialty finance company) (2006-2010). Formerly, President and Chief Executive Officer, Prizm Capital Management, LLC (investment management firm) (2002-2005). Formerly, Executive Vice President and Chief Financial Officer, United Asset Management Corporation (investment management firm) (1982-2001). Formerly, Senior Manager, Price Waterhouse (now PricewaterhouseCoopers) (an independent registered public accounting firm) (1972-1981). Directorships in the Last Five Years.(2) None. |
| | | |
Helen Frame Peters 1948 | | Trustee | | 2008 | | Professor of Finance, Carroll School of Management, Boston College. Formerly, Dean, Carroll School of Management, Boston College (2000-2002). Formerly, Chief Investment Officer, Fixed Income, Scudder Kemper Investments (investment management firm) (1998-1999). Formerly, Chief Investment Officer, Equity and Fixed Income, Colonial Management Associates (investment management firm) (1991-1998). Directorships in the Last Five Years.(2) Formerly, Director of BJ’s Wholesale Club, Inc. (wholesale club retailer) (2004-2011). Formerly, Trustee of SPDR Index Shares Funds and SPDR Series Trust (exchange traded funds) (2000-2009). Formerly, Director of Federal Home Loan Bank of Boston (a bank for banks) (2007-2009). |
| | | |
Susan J. Sutherland(3) 1957 | | Trustee | | 2015 | | Private investor. Formerly, Associate, Counsel and Partner at Skadden, Arps, Slate, Meagher & Flom LLP (law firm) (1982-2013). Directorships in the Last Five Years. Formerly, Director of Montpelier Re Holdings Ltd. (global provider of customized insurance and reinsurance products) (2013-2015). |
| | | |
Harriett Tee Taggart 1948 | | Trustee | | 2011 | | Managing Director, Taggart Associates (a professional practice firm). Formerly, Partner and Senior Vice President, Wellington Management Company, LLP (investment management firm) (1983-2006). Directorships in the Last Five Years.(2) Director of Albemarle Corporation (chemicals manufacturer) (since 2007) and The Hanover Group (specialty property and casualty insurance company) (since 2009). Formerly, Director of Lubrizol Corporation (specialty chemicals) (2007-2011). |
| | | |
Ralph F. Verni 1943 | | Chairperson of the Board and Trustee | | 2007 (Chairperson) and 2005 (Trustee) | | Consultant and private investor. Formerly, Chief Investment Officer (1982-1992), Chief Financial Officer (1988-1990) and Director (1982-1992), New England Life. Formerly, Chairperson, New England Mutual Funds (1982-1992). Formerly, President and Chief Executive Officer, State Street Management & Research (1992-2000). Formerly, Chairperson, State Street Research Mutual Funds (1992-2000). Formerly, Director, W.P. Carey, LLC (1998-2004) and First Pioneer Farm Credit Corp. (2002-2006). Directorships in the Last Five Years.(2) None. |
| | | |
| | | | | | |
Principal Officers who are not Trustees |
| Name and Year of Birth | | Position(s) with the
Trust and the Portfolio | | Officer
Since(4) | | Principal Occupation(s) During Past Five Years |
Payson F. Swaffield 1956 | | President of the Trust | | 2003 | | Vice President and Chief Income Investment Officer of EVM and BMR. |
| | | |
Charles B. Gaffney 1972 | | President of the Portfolio | | 2011 | | Vice President of EVM and BMR. |
Eaton Vance
Stock Fund
December 31, 2015
Management and Organization — continued
| | | | | | |
| Name and Year of Birth | | Position(s) with the
Trust and the Portfolio | | Officer
Since(4) | | Principal Occupation(s) During Past Five Years |
Principal Officers who are not Trustees (continued) |
Maureen A. Gemma 1960 | | Vice President, Secretary and Chief Legal Officer | | 2005 | | Vice President of EVM and BMR. |
| | | |
James F. Kirchner 1967 | | Treasurer | | 2007 | | Vice President of EVM and BMR. |
| | | |
Paul M. O’Neil 1953 | | Chief Compliance Officer | | 2004 | | Vice President of EVM and BMR. |
| (1) | Year first appointed to serve as Trustee for a fund in the Eaton Vance family of funds. Each Trustee has served continuously since appointment unless indicated otherwise. |
| (2) | During their respective tenures, the Trustees (except for Mmes. Frost and Sutherland and Mr. Gorman) also served as Board members of one or more of the following funds (which operated in the years noted): eUnitsTM 2 Year U.S. Market Participation Trust: Upside to Cap / Buffered Downside (launched in 2012 and terminated in 2014); eUnitsTM 2 Year U.S. Market Participation Trust II: Upside to Cap / Buffered Downside (launched in 2012 and terminated in 2014); and Eaton Vance National Municipal Income Trust (launched in 1998 and terminated in 2009). However, Ms. Mosley did not serve as a Board member of eUnitsTM 2 Year U.S. Market Participation Trust: Upside to Cap / Buffered Downside (launched in 2012 and terminated in 2014). |
| (3) | Ms. Sutherland began serving as a Trustee effective May 1, 2015. |
| (4) | Year first elected to serve as officer of a fund in the Eaton Vance family of funds when the officer has served continuously. Otherwise, year of most recent election as an officer of a fund in the Eaton Vance family of funds. Titles may have changed since initial election. |
The SAI for the Fund includes additional information about the Trustees and officers of the Fund and the Portfolio and can be obtained without charge on Eaton Vance’s website at www.eatonvance.com or by calling 1-800-262-1122.
Eaton Vance Funds
IMPORTANT NOTICES
Privacy. The Eaton Vance organization is committed to ensuring your financial privacy. Each of the financial institutions identified below has in effect the following policy (“Privacy Policy”) with respect to nonpublic personal information about its customers:
| • | | Only such information received from you, through application forms or otherwise, and information about your Eaton Vance fund transactions will be collected. This may include information such as name, address, social security number, tax status, account balances and transactions. |
| • | | None of such information about you (or former customers) will be disclosed to anyone, except as permitted by law (which includes disclosure to employees necessary to service your account). In the normal course of servicing a customer’s account, Eaton Vance may share information with unaffiliated third parties that perform various required services such as transfer agents, custodians and broker-dealers. |
| • | | Policies and procedures (including physical, electronic and procedural safeguards) are in place that are designed to protect the confidentiality of such information. |
| • | | We reserve the right to change our Privacy Policy at any time upon proper notification to you. Customers may want to review our Privacy Policy periodically for changes by accessing the link on our homepage: www.eatonvance.com. |
Our pledge of privacy applies to the following entities within the Eaton Vance organization: the Eaton Vance Family of Funds, Eaton Vance Management, Eaton Vance Investment Counsel, Eaton Vance Distributors, Inc., Eaton Vance Trust Company, Eaton Vance Management (International) Limited, Eaton Vance Management’s Real Estate Investment Group and Boston Management and Research. In addition, our Privacy Policy applies only to those Eaton Vance customers who are individuals and who have a direct relationship with us. If a customer’s account (i.e., fund shares) is held in the name of a third-party financial advisor/broker-dealer, it is likely that only such advisor’s privacy policies apply to the customer. This notice supersedes all previously issued privacy disclosures. For more information about Eaton Vance’s Privacy Policy, please call 1-800-262-1122.
Delivery of Shareholder Documents. The Securities and Exchange Commission (SEC) permits funds to deliver only one copy of shareholder documents, including prospectuses, proxy statements and shareholder reports, to fund investors with multiple accounts at the same residential or post office box address. This practice is often called “householding” and it helps eliminate duplicate mailings to shareholders. Eaton Vance, or your financial advisor, may household the mailing of your documents indefinitely unless you instruct Eaton Vance, or your financial advisor, otherwise. If you would prefer that your Eaton Vance documents not be householded, please contact Eaton Vance at 1-800-262-1122, or contact your financial advisor. Your instructions that householding not apply to delivery of your Eaton Vance documents will be effective within 30 days of receipt by Eaton Vance or your financial advisor.
Portfolio Holdings. Each Eaton Vance Fund and its underlying Portfolio(s) (if applicable) will file a schedule of portfolio holdings on Form N-Q with the SEC for the first and third quarters of each fiscal year. The Form N-Q will be available on the Eaton Vance website at www.eatonvance.com, by calling Eaton Vance at 1-800-262-1122 or in the EDGAR database on the SEC’s website at www.sec.gov. Form N-Q may also be reviewed and copied at the SEC’s public reference room in Washington, D.C. (call 1-800-732-0330 for information on the operation of the public reference room).
Proxy Voting. From time to time, funds are required to vote proxies related to the securities held by the funds. The Eaton Vance Funds or their underlying Portfolios (if applicable) vote proxies according to a set of policies and procedures approved by the Funds’ and Portfolios’ Boards. You may obtain a description of these policies and procedures and information on how the Funds or Portfolios voted proxies relating to portfolio securities during the most recent 12-month period ended June 30, without charge, upon request, by calling 1-800-262-1122 and by accessing the SEC’s website at www.sec.gov.
This Page Intentionally Left Blank
This Page Intentionally Left Blank
Investment Adviser of Stock Portfolio
Boston Management and Research
Two International Place
Boston, MA 02110
Administrator of Eaton Vance Stock Fund
Eaton Vance Management
Two International Place
Boston, MA 02110
Principal Underwriter*
Eaton Vance Distributors, Inc.
Two International Place
Boston, MA 02110
(617) 482-8260
Custodian
State Street Bank and Trust Company
State Street Financial Center, One Lincoln Street
Boston, MA 02111
Transfer Agent
BNY Mellon Investment Servicing (US) Inc.
Attn: Eaton Vance Funds
P.O. Box 9653
Providence, RI 02940-9653
(800) 262-1122
Independent Registered Public Accounting Firm
Deloitte & Touche LLP
200 Berkeley Street
Boston, MA 02116-5022
Fund Offices
Two International Place
Boston, MA 02110
| * | FINRA BrokerCheck. Investors may check the background of their Investment Professional by contacting the Financial Industry Regulatory Authority (FINRA). FINRA BrokerCheck is a free tool to help investors check the professional background of current and former FINRA-registered securities firms and brokers. FINRA BrokerCheck is available by calling 1-800-289-9999 and at www.FINRA.org. The FINRA BrokerCheck brochure describing this program is available to investors at www.FINRA.org. |

Eaton Vance
Tax-Managed Growth Funds 1.1 and 1.2
Annual Report
December 31, 2015

Commodity Futures Trading Commission Registration. Effective December 31, 2012, the Commodity Futures Trading Commission (“CFTC”) adopted certain regulatory changes that subject registered investment companies and advisers to regulation by the CFTC if a fund invests more than a prescribed level of its assets in certain CFTC-regulated instruments (including futures, certain options and swap agreements) or markets itself as providing investment exposure to such instruments. Each Fund has claimed an exclusion from the definition of the term “commodity pool operator” under the Commodity Exchange Act. Accordingly, neither the Funds nor the adviser with respect to the operation the Funds is subject to the CFTC regulation. Because of its management of other strategies, each Fund’s adviser is registered with the CFTC as a commodity pool operator and a commodity trading advisor.
Fund shares are not insured by the FDIC and are not deposits or other obligations of, or guaranteed by, any depository institution. Shares are subject to investment risks, including possible loss of principal invested.
This report must be preceded or accompanied by a current summary prospectus or prospectus. Before investing, investors should consider carefully the investment objective, risks, and charges and expenses of a mutual fund. This and other important information is contained in the summary prospectus and prospectus, which can be obtained from a financial advisor. Prospective investors should read the prospectus carefully before investing. For further information, please call 1-800-262-1122.
Annual Report December 31, 2015
Eaton Vance
Tax-Managed Growth Funds 1.1 and 1.2
Table of Contents
| | | | |
Management’s Discussion of Fund Performance | | | 2 | |
| |
Performance | | | | |
| |
| | | | |
Tax-Managed Growth Fund 1.1 | | | 3 | |
Tax-Managed Growth Fund 1.2 | | | 4 | |
| |
| | | | |
| |
Fund Profile | | | 5 | |
| |
Endnotes and Additional Disclosures | | | 6 | |
| |
Fund Expenses | | | 7 | |
| |
Financial Statements | | | 9 | |
| |
Report of Independent Registered Public Accounting Firm | | | 27 | |
| |
Federal Tax Information | | | 28 | |
| |
Management and Organization | | | 29 | |
| |
Important Notices | | | 35 | |
Eaton Vance
Tax-Managed Growth Funds 1.1 and 1.2
December 31, 2015
Management’s Discussion of Fund Performance1
Economic and Market Conditions
After a roller-coaster ride, the broad U.S. equity market (as represented by the S&P 500 Index2) finished the year almost where it began, returning 1.38% for the 12 months ended December 31, 2015. The Dow Jones Industrial Average was even flatter, rising just 0.21% in 2015. However, the technology-laden NASDAQ Composite Index rose 6.96%, as a number of Internet-related companies posted strong returns.
U.S. equities were buoyed by a continued modest economic recovery during the period: Nearly every month was marked by meaningful jobs growth, while the unemployment rate dropped to 5.0% for the first time since 2008. Consumers, the chief engine of the U.S. economy, increased their spending, and the consumer discretionary sector was the strongest-performing sector in the S&P 500 Index for the 12-month period.
Yet the period was characterized by significant market volatility, as several factors buffeted U.S. stocks. China replaced Greece as many investors’ biggest overseas concern, with slowing growth in the world’s second-largest economy weighing heavily on U.S. firms doing business in emerging markets. In addition, ongoing uncertainty about when the U.S. Federal Reserve (the Fed) would raise interest rates contributed to market volatility during the period. The Fed finally announced a rate hike in December.
A strengthening U.S. dollar during the period posed another headwind for U.S. companies competing in global markets, making their exports more expensive and decreasing the dollar value of overseas revenues. Falling commodity prices, especially for oil, were more of a double-edged sword. While consumers and many firms saw their fuel and energy bills decline, profits were slashed for numerous energy producers and commodity-related companies.
For the 12-month period, large-cap U.S. stocks (as measured by the Russell 1000® Index) delivered positive returns, but their small-cap counterparts (as measured by the Russell 2000® Index) were in negative territory. Growth stocks as a group outpaced value stocks across the large-, mid- and small-cap categories.
Fund Performance
For the 12-month period ended December 31, 2015, Eaton Vance Tax-Managed Growth Fund 1.1 and Eaton Vance Tax-Managed Growth Fund 1.2 (each a “Fund” and collectively “the Funds”) had total returns of 2.15% and 2.03%, respectively, for Class A shares at net asset value (NAV), outperforming the Funds’ benchmark, the S&P 500 Index (the Index), which returned 1.38% for the same period.
The Funds’ outperformance relative to the Index was largely the result of sector and industry allocation. Stock selection also contributed to the Funds’ relative performance versus the Index. Of the 10 economic sectors in the Index, five had positive returns for the 12-month period. Each of the Funds recorded positive returns in four sectors.
On a sector basis, consumer discretionary made the largest contribution to the Funds’ relative performance versus the Index. This was largely due to stock selection. Within the sector, the textile, apparel & luxury goods industry was a notable contributor, led by sports apparel leader NIKE, Inc., which was the Funds’ best-performing stock versus the Index amid strong sales growth overseas. In the media industry, Walt Disney Co. was also among the Funds’ leading stocks versus the Index, as the entertainment giant benefitted from solid earnings results and strong box office reception for its new Star Wars movie. In addition, an underweight position versus the Index in the lagging energy sector helped the Funds’ relative performance. In particular, the Funds’ lack of exposure to pipeline company Kinder Morgan, Inc. aided the Funds’ relative performance versus the Index, as the company was hurt by weak pipeline volumes amid falling energy prices during the period. In the information technology sector, an overweight position in the outperforming internet software & services industry further boosted the Funds’ relative performance versus the Index. Among the Funds’ top- performing stocks versus the Index were social media giant Facebook, Inc., which benefitted from strong growth and new business ventures, and internet services leader Alphabet, Inc., which saw higher ad sales for its Google search engine.
Conversely, consumer staples was the Funds’ weakest-performing sector relative to the Index. This was due to stock selection. In particular, the tobacco and food products industries were notable laggards versus the Index. The financials sector also detracted from the Funds’ relative performance versus the Index, due largely to an overweight position in the lagging capital markets industry. Among the Funds’ poorest-performing stocks versus the Index was mutual fund company Franklin Resources, Inc. amid concerns about asset outflows during the period. In the industrials sector, the electrical equipment industry hampered the Funds’ relative performance versus the Index. Overall, the Funds’ worst- performing stock versus the Index was electrical equipment giant Emerson Electric Co., which was hurt by the global economic slowdown during the period, especially in China and other emerging markets.
See Endnotes and Additional Disclosures in this report.
Past performance is no guarantee of future results. Returns are historical and are calculated by determining the percentage change in net asset value (NAV) or offering price (as applicable) with all distributions reinvested. Investment return and principal value will fluctuate so that shares, when redeemed, may be worth more or less than their original cost. Performance less than one year is cumulative. Performance is for the stated time period only; due to market volatility, the Fund’s current performance may be lower or higher than quoted. Returns are before taxes unless otherwise noted. For performance as of the most recent month-end, please refer to eatonvance.com.
Eaton Vance
Tax-Managed Growth Fund 1.1
December 31, 2015
Performance2,3
Portfolio Managers Lewis R. Piantedosi, Michael A. Allison, CFA and Yana S. Barton, CFA
| | | | | | | | | | | | | | | | | | | | |
| % Average Annual Total Returns | | Class
Inception Date | | | Performance
Inception Date | | | One Year | | | Five Years | | | Ten Years | |
Class A at NAV | | | 03/28/1996 | | | | 03/29/1966 | | | | 2.15 | % | | | 11.82 | % | | | 6.68 | % |
Class A with 5.75% Maximum Sales Charge | | | — | | | | — | | | | –3.72 | | | | 10.51 | | | | 6.05 | |
Class B at NAV | | | 03/28/1996 | | | | 03/29/1966 | | | | 1.36 | | | | 10.99 | | | | 5.89 | |
Class B with 5% Maximum Sales Charge | | | — | | | | — | | | | –3.64 | | | | 10.72 | | | | 5.89 | |
Class C at NAV | | | 08/02/1996 | | | | 03/29/1966 | | | | 1.40 | | | | 10.98 | | | | 5.88 | |
Class C with 1% Maximum Sales Charge | | | — | | | | — | | | | 0.40 | | | | 10.98 | | | | 5.88 | |
Class I at NAV | | | 07/02/1999 | | | | 03/29/1966 | | | | 2.41 | | | | 12.10 | | | | 6.96 | |
S&P 500 Index | | | — | | | | — | | | | 1.38 | % | | | 12.56 | % | | | 7.30 | % |
| | | | | |
| | | | | | | | | | | | | | | | | | | | |
| % After-Tax Returns with Maximum Sales Charge | | Class
Inception Date | | | Performance
Inception Date | | | One Year | | | Five Years | | | Ten Years | |
Class A After Taxes on Distributions | | | 03/28/1996 | | | | 03/29/1966 | | | | –3.96 | % | | | 10.26 | % | | | 5.83 | % |
Class A After Taxes on Distributions and Sale of Fund Shares | | | — | | | | — | | | | –1.91 | | | | 8.36 | | | | 4.87 | |
Class B After Taxes on Distributions | | | 03/28/1996 | | | | 03/29/1966 | | | | –3.67 | | | | 10.67 | | | | 5.86 | |
Class B After Taxes on Distributions and Sale of Fund Shares | | | — | | | | — | | | | –2.03 | | | | 8.54 | | | | 4.74 | |
Class C After Taxes on Distributions | | | 08/02/1996 | | | | 03/29/1966 | | | | 0.29 | | | | 10.86 | | | | 5.78 | |
Class C After Taxes on Distributions and Sale of Fund Shares | | | — | | | | — | | | | 0.31 | | | | 8.75 | | | | 4.73 | |
Class I After Taxes on Distributions | | | 07/02/1999 | | | | 03/29/1966 | | | | 2.07 | | | | 11.78 | | | | 6.67 | |
Class I After Taxes on Distributions and Sale of Fund Shares | | | — | | | | — | | | | 1.64 | | | | 9.68 | | | | 5.63 | |
| | | | | |
| | | | | | | | | | | | | | | | | | | | |
| % Total Annual Operating Expense Ratios4 | | | | | Class A | | | Class B | | | Class C | | | Class I | |
| | | | | | | 0.83 | % | | | 1.58 | % | | | 1.58 | % | | | 0.58 | % |
Growth of $10,000
This graph shows the change in value of a hypothetical investment of $10,000 in Class A of the Fund for the period indicated. For comparison, the same investment is shown in the indicated index.

| | | | | | | | | | | | | | | | |
| Growth of Investment | | Amount Invested | | | Period Beginning | | | At NAV | | | With Maximum Sales Charge | |
Class B | | $ | 10,000 | | | | 12/31/2005 | | | $ | 17,729 | | | | N.A. | |
Class C | | $ | 10,000 | | | | 12/31/2005 | | | $ | 17,719 | | | | N.A. | |
Class I | | $ | 250,000 | | | | 12/31/2005 | | | $ | 490,245 | | | | N.A. | |
See Endnotes and Additional Disclosures in this report.
Past performance is no guarantee of future results. Returns are historical and are calculated by determining the percentage change in net asset value (NAV) or offering price (as applicable) with all distributions reinvested. Investment return and principal value will fluctuate so that shares, when redeemed, may be worth more or less than their original cost. Performance less than one year is cumulative. Performance is for the stated time period only; due to market volatility, the Fund’s current performance may be lower or higher than quoted. Returns are before taxes unless otherwise noted. For performance as of the most recent month-end, please refer to eatonvance.com.
Eaton Vance
Tax-Managed Growth Fund 1.2
December 31, 2015
Performance2,3
Portfolio Managers Lewis R. Piantedosi, Michael A. Allison, CFA and Yana S. Barton, CFA
| | | | | | | | | | | | | | | | | | | | |
| % Average Annual Total Returns | | Class Inception Date | | | Performance Inception Date | | | One Year | | | Five Years | | | Ten Years | |
Class A at NAV | | | 02/28/2001 | | | | 03/29/1966 | | | | 2.03 | % | | | 11.64 | % | | | 6.50 | % |
Class A with 5.75% Maximum Sales Charge | | | — | | | | — | | | | –3.85 | | | | 10.33 | | | | 5.88 | |
Class B at NAV | | | 02/28/2001 | | | | 03/29/1966 | | | | 1.24 | | | | 10.79 | | | | 5.71 | |
Class B with 5% Maximum Sales Charge | | | — | | | | — | | | | –3.76 | | | | 10.53 | | | | 5.71 | |
Class C at NAV | | | 02/28/2001 | | | | 03/29/1966 | | | | 1.23 | | | | 10.81 | | | | 5.72 | |
Class C with 1% Maximum Sales Charge | | | — | | | | — | | | | 0.23 | | | | 10.81 | | | | 5.72 | |
Class I at NAV | | | 02/28/2001 | | | | 03/29/1966 | | | | 2.28 | | | | 11.91 | | | | 6.79 | |
S&P 500 Index | | | — | | | | — | | | | 1.38 | % | | | 12.56 | % | | | 7.30 | % |
| | | | | |
| | | | | | | | | | | | | | | | | | | | |
| % After-Tax Returns with Maximum Sales Charge | | Class Inception Date | | | Performance Inception Date | | | One Year | | | Five Years | | | Ten Years | |
Class A After Taxes on Distributions | | | 02/28/2001 | | | | 03/29/1966 | | | | –4.06 | % | | | 10.12 | % | | | 5.68 | % |
Class A After Taxes on Distributions and Sale of Fund Shares | | | — | | | | — | | | | –2.00 | | | | 8.21 | | | | 4.72 | |
Class B After Taxes on Distributions | | | 02/28/2001 | | | | 03/29/1966 | | | | –3.77 | | | | 10.52 | | | | 5.68 | |
Class B After Taxes on Distributions and Sale of Fund Shares | | | — | | | | — | | | | –2.12 | | | | 8.37 | | | | 4.58 | |
Class C After Taxes on Distributions | | | 02/28/2001 | | | | 03/29/1966 | | | | 0.17 | | | | 10.75 | | | | 5.66 | |
Class C After Taxes on Distributions and Sale of Fund Shares | | | — | | | | — | | | | 0.17 | | | | 8.61 | | | | 4.59 | |
Class I After Taxes on Distributions | | | 02/28/2001 | | | | 03/29/1966 | | | | 1.99 | | | | 11.63 | | | | 6.54 | |
Class I After Taxes on Distributions and Sale of Fund Shares | | | — | | | | — | | | | 1.52 | | | | 9.52 | | | | 5.49 | |
| | | | | |
| | | | | | | | | | | | | | | | | | | | |
| % Total Annual Operating Expense Ratios4 | | | | | Class A | | | Class B | | | Class C | | | Class I | |
| | | | | | | 0.99 | % | | | 1.74 | % | | | 1.74 | % | | | 0.74 | % |
Growth of $10,000
This graph shows the change in value of a hypothetical investment of $10,000 in Class A of the Fund for the period indicated. For comparison, the same investment is shown in the indicated index.
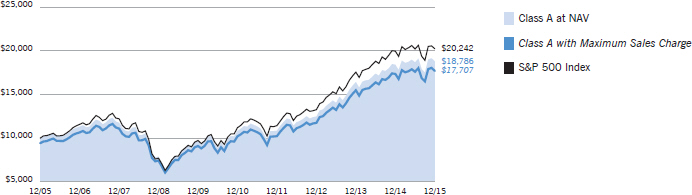
| | | | | | | | | | | | | | | | |
| Growth of Investment | | Amount Invested | | | Period Beginning | | | At NAV | | | With Maximum Sales Charge | |
Class B | | $ | 10,000 | | | | 12/31/2005 | | | $ | 17,429 | | | | N.A. | |
Class C | | $ | 10,000 | | | | 12/31/2005 | | | $ | 17,440 | | | | N.A. | |
Class I | | $ | 250,000 | | | | 12/31/2005 | | | $ | 482,188 | | | | N.A. | |
See Endnotes and Additional Disclosures in this report.
Past performance is no guarantee of future results. Returns are historical and are calculated by determining the percentage change in net asset value (NAV) or offering price (as applicable) with all distributions reinvested. Investment return and principal value will fluctuate so that shares, when redeemed, may be worth more or less than their original cost. Performance less than one year is cumulative. Performance is for the stated time period only; due to market volatility, the Fund’s current performance may be lower or higher than quoted. Returns are before taxes unless otherwise noted. For performance as of the most recent month-end, please refer to eatonvance.com.
Eaton Vance
Tax-Managed Growth Funds 1.1 and 1.2
December 31, 2015
Fund Profile5
Sector Allocation (% of net assets)6
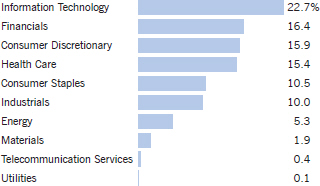
Top 10 Holdings (% of net assets)6
| | | | |
| |
Apple, Inc. | | | 3.2 | % |
NIKE, Inc., Class B | | | 2.7 | |
Facebook, Inc., Class A | | | 2.3 | |
Exxon Mobil Corp. | | | 2.2 | |
Alphabet, Inc., Class C | | | 2.1 | |
Wells Fargo & Co. | | | 2.1 | |
Intel Corp. | | | 2.1 | |
Walt Disney Co. (The) | | | 2.0 | |
Amazon.com, Inc. | | | 2.0 | |
JPMorgan Chase & Co. | | | 2.0 | |
| | | | | |
Total | | | 22.7 | % |
| | | | | |
See Endnotes and Additional Disclosures in this report.
Eaton Vance
Tax-Managed Growth Funds 1.1 and 1.2
December 31, 2015
Endnotes and Additional Disclosures
| 1 | The views expressed in this report are those of the portfolio manager(s) and are current only through the date stated at the top of this page. These views are subject to change at any time based upon market or other conditions, and Eaton Vance and the Fund(s) disclaim any responsibility to update such views. These views may not be relied upon as investment advice and, because investment decisions are based on many factors, may not be relied upon as an indication of trading intent on behalf of any Eaton Vance fund. This commentary may contain statements that are not historical facts, referred to as “forward looking statements”. The Fund’s actual future results may differ significantly from those stated in any forward looking statement, depending on factors such as changes in securities or financial markets or general economic conditions, the volume of sales and purchases of Fund shares, the continuation of investment advisory, administrative and service contracts, and other risks discussed from time to time in the Fund’s filings with the Securities and Exchange Commission. |
| 2 | S&P 500 Index is an unmanaged index of large-cap stocks commonly used as a measure of U.S. stock market performance. Dow Jones Industrial Average is a price-weighted average of 30 blue-chip stocks that are generally the leaders in their industry. NASDAQ Composite Index is a market capitalization- weighted index of all domestic and international securities listed on NASDAQ. Russell 1000® Index is an unmanaged index of 1,000 U.S. large-cap stocks. Russell 2000® Index is an unmanaged index of 2,000 U.S. small-cap stocks. Unless otherwise stated, index returns do not reflect the effect of any applicable sales charges, commissions, expenses, taxes or leverage, as applicable. It is not possible to invest directly in an index. |
| 3 | Total Returns at NAV do not include applicable sales charges.If sales charges were deducted, the returns would be lower. Total Returns shown with maximum sales charge reflect the stated maximum sales charge. Unless otherwise stated, performance does not reflect the deduction of taxes on Fund distributions or redemptions of Fund shares. Performance since inception for an index, if presented, is the performance since the Fund’s or oldest share class’ inception, as applicable. After-tax returns are calculated using certain assumptions, including using the highest historical individual federal income tax rates, and do not reflect the impact of state/local taxes. Actual after-tax returns depend on a shareholder’s tax situation and the actual characterization of distributions and may differ from those shown. After-tax returns are not relevant to shareholders who hold shares in tax-deferred accounts or shares held by nontaxable entities. Return After Taxes on Distributions may be the same as Return Before Taxes for the same period because no taxable distributions were made during that period. Return After Taxes on Distributions and Sale of Fund Shares may be greater than or equal to Return After Taxes on Distributions for the same period because of losses realized on the sale of Fund shares. The Fund’s after-tax returns also may reflect foreign tax credits passed by the Fund to its shareholders. |
| 4 | Source: Fund prospectus. |
| 5 | Fund invests in an affiliated investment company (Portfolio) with the same objective(s) and policies as the Fund. References to investments are to the Portfolio’s holdings. |
| 6 | Excludes cash and cash equivalents. |
| | Fund profile subject to change due to active management. |
Eaton Vance
Tax-Managed Growth Funds 1.1 and 1.2
December 31, 2015
Fund Expenses
Example: As a Fund shareholder, you incur two types of costs: (1) transaction costs, including sales charges (loads) on purchases and redemption fees (if applicable); and (2) ongoing costs, including management fees; distribution or service fees; and other Fund expenses. This Example is intended to help you understand your ongoing costs (in dollars) of Fund investing and to compare these costs with the ongoing costs of investing in other mutual funds. The Example is based on an investment of $1,000 invested at the beginning of the period and held for the entire period (July 1, 2015 – December 31, 2015).
Actual Expenses: The first section of the table below provides information about actual account values and actual expenses. You may use the information in this section, together with the amount you invested, to estimate the expenses that you paid over the period. Simply divide your account value by $1,000 (for example, an $8,600 account value divided by $1,000 = 8.6), then multiply the result by the number in the first section under the heading entitled “Expenses Paid During Period” to estimate the expenses you paid on your account during this period.
Hypothetical Example for Comparison Purposes: The second section of the table below provides information about hypothetical account values and hypothetical expenses based on the actual Fund expense ratio and an assumed rate of return of 5% per year (before expenses), which is not the actual Fund return. The hypothetical account values and expenses may not be used to estimate the actual ending account balance or expenses you paid for the period. You may use this information to compare the ongoing costs of investing in your Fund and other funds. To do so, compare this 5% hypothetical example with the 5% hypothetical examples that appear in the shareholder reports of the other funds.
Please note that the expenses shown in the table are meant to highlight your ongoing costs only and do not reflect any transactional costs, such as sales charges (loads) or redemption fees (if applicable). Therefore, the second section of the table is useful in comparing ongoing costs only, and will not help you determine the relative total costs of owning different funds. In addition, if these transactional costs were included, your costs would be higher.
Eaton Vance Tax-Managed Growth Fund 1.1
| | | | | | | | | | | | | | | | |
| | | Beginning
Account Value
(7/1/15) | | | Ending
Account Value
(12/31/15) | | | Expenses Paid
During Period*
(7/1/15 – 12/31/15) | | | Annualized
Expense
Ratio | |
| | | | |
| | | | | | | | | | | | | | | | |
Actual | | | | | | | | | | | | | | | | |
Class A | | $ | 1,000.00 | | | $ | 1,006.50 | | | $ | 4.10 | | | | 0.81 | % |
Class B | | $ | 1,000.00 | | | $ | 1,002.60 | | | $ | 7.87 | | | | 1.56 | % |
Class C | | $ | 1,000.00 | | | $ | 1,002.50 | | | $ | 7.87 | | | | 1.56 | % |
Class I | | $ | 1,000.00 | | | $ | 1,007.80 | | | $ | 2.83 | | | | 0.56 | % |
| | | | | | | | | | | | | | | | | |
| | | | |
| | | | | | | | | | | | | | | | |
Hypothetical | | | | | | | | | | | | | | | | |
(5% return per year before expenses) | | | | | | | | | | | | | | | | |
Class A | | $ | 1,000.00 | | | $ | 1,021.10 | | | $ | 4.13 | | | | 0.81 | % |
Class B | | $ | 1,000.00 | | | $ | 1,017.30 | | | $ | 7.93 | | | | 1.56 | % |
Class C | | $ | 1,000.00 | | | $ | 1,017.30 | | | $ | 7.93 | | | | 1.56 | % |
Class I | | $ | 1,000.00 | | | $ | 1,022.40 | | | $ | 2.85 | | | | 0.56 | % |
| * | Expenses are equal to the Fund’s annualized expense ratio for the indicated Class, multiplied by the average account value over the period, multiplied by 184/365 (to reflect the one-half year period). The Example assumes that the $1,000 was invested at the net asset value per share determined at the close of business on June 30, 2015. The Example reflects the expenses of both the Fund and the Portfolio. |
Eaton Vance
Tax-Managed Growth Funds 1.1 and 1.2
December 31, 2015
Fund Expenses — continued
| | | | | | | | | | | | | | | | |
Eaton Vance Tax-Managed Growth Fund 1.2 | |
| | | Beginning
Account Value
(7/1/15) | | | Ending
Account Value
(12/31/15) | | | Expenses Paid
During Period*
(7/1/15 – 12/31/15) | | | Annualized
Expense
Ratio | |
| | | | |
| | | | | | | | | | | | | | | | |
Actual | | | | | | | | | | | | | | | | |
Class A | | $ | 1,000.00 | | | $ | 1,005.90 | | | $ | 4.85 | | | | 0.96 | % |
Class B | | $ | 1,000.00 | | | $ | 1,002.00 | | | $ | 8.68 | | | | 1.72 | % |
Class C | | $ | 1,000.00 | | | $ | 1,001.70 | | | $ | 8.63 | | | | 1.71 | % |
Class I | | $ | 1,000.00 | | | $ | 1,007.30 | | | $ | 3.59 | | | | 0.71 | % |
| | | | | | | | | | | | | | | | | |
| | | | |
| | | | | | | | | | | | | | | | |
Hypothetical | | | | | | | | | | | | | | | | |
(5% return per year before expenses) | | | | | | | | | | | | | | | | |
Class A | | $ | 1,000.00 | | | $ | 1,020.40 | | | $ | 4.89 | | | | 0.96 | % |
Class B | | $ | 1,000.00 | | | $ | 1,016.50 | | | $ | 8.74 | | | | 1.72 | % |
Class C | | $ | 1,000.00 | | | $ | 1,016.60 | | | $ | 8.69 | | | | 1.71 | % |
Class I | | $ | 1,000.00 | | | $ | 1,021.60 | | | $ | 3.62 | | | | 0.71 | % |
| * | Expenses are equal to the Fund’s annualized expense ratio for the indicated Class, multiplied by the average account value over the period, multiplied by 184/365 (to reflect the one-half year period). The Example assumes that the $1,000 was invested at the net asset value per share determined at the close of business on June 30, 2015. The Example reflects the expenses of both the Fund and the Portfolio. |
Eaton Vance
Tax-Managed Growth Funds 1.1 and 1.2
December 31, 2015
Statements of Assets and Liabilities
| | | | | | | | |
| | | December 31, 2015 | |
| Assets | | Tax-Managed Growth Fund 1.1 | | | Tax-Managed Growth Fund 1.2 | |
Investment in Tax-Managed Growth Portfolio, at value (identified cost, $536,358,283 and $299,638,305, respectively) | | $ | 1,376,374,064 | | | $ | 619,203,712 | |
Receivable for Fund shares sold | | | 425,257 | | | | 891,695 | |
Total assets | | $ | 1,376,799,321 | | | $ | 620,095,407 | |
|
| Liabilities | |
Payable for Fund shares redeemed | | $ | 1,630,694 | | | $ | 723,052 | |
Payable to affiliates: | | | | | | | | |
Administration fee | | | — | | | | 79,236 | |
Distribution and service fees | | | 457,134 | | | | 233,077 | |
Trustees’ fees | | | 125 | | | | 125 | |
Accrued expenses | | | 234,744 | | | | 112,937 | |
Total liabilities | | $ | 2,322,697 | | | $ | 1,148,427 | |
Net Assets | | $ | 1,374,476,624 | | | $ | 618,946,980 | |
|
| Sources of Net Assets | |
Paid-in capital | | $ | 691,068,558 | | | $ | 405,871,705 | |
Accumulated net realized loss from Portfolio | | | (157,245,690 | ) | | | (106,493,447 | ) |
Accumulated undistributed net investment income | | | 637,975 | | | | 3,315 | |
Net unrealized appreciation from Portfolio | | | 840,015,781 | | | | 319,565,407 | |
Total | | $ | 1,374,476,624 | | | $ | 618,946,980 | |
|
| Class A Shares | |
Net Assets | | $ | 1,055,259,045 | | | $ | 379,684,549 | |
Shares Outstanding | | | 26,831,157 | | | | 21,467,351 | |
Net Asset Value and Redemption Price Per Share | | | | | | | | |
(net assets ÷ shares of beneficial interest outstanding) | | $ | 39.33 | | | $ | 17.69 | |
Maximum Offering Price Per Share | | | | | | | | |
(100 ÷ 94.25 of net asset value per share) | | $ | 41.73 | | | $ | 18.77 | |
|
| Class B Shares | |
Net Assets | | $ | 5,044,093 | | | $ | 4,230,411 | |
Shares Outstanding | | | 130,672 | | | | 241,198 | |
Net Asset Value and Offering Price Per Share* | | | | | | | | |
(net assets ÷ shares of beneficial interest outstanding) | | $ | 38.60 | | | $ | 17.54 | |
|
| Class C Shares | |
Net Assets | | $ | 263,895,585 | | | $ | 173,494,344 | |
Shares Outstanding | | | 7,446,758 | | | | 10,063,999 | |
Net Asset Value and Offering Price Per Share* | | | | | | | | |
(net assets ÷ shares of beneficial interest outstanding) | | $ | 35.44 | | | $ | 17.24 | |
|
| Class I Shares | |
Net Assets | | $ | 50,277,901 | | | $ | 61,537,676 | |
Shares Outstanding | | | 1,366,746 | | | | 3,473,675 | |
Net Asset Value, Offering Price and Redemption Price Per Share | | | | | | | | |
(net assets ÷ shares of beneficial interest outstanding) | | $ | 36.79 | | | $ | 17.72 | |
On sales of $50,000 or more, the offering price of Class A shares is reduced.
| * | Redemption price per share is equal to the net asset value less any applicable contingent deferred sales charge. |
| | | | |
| | 9 | | See Notes to Financial Statements. |
Eaton Vance
Tax-Managed Growth Funds 1.1 and 1.2
December 31, 2015
Statements of Operations
| | | | | | | | |
| | | Year Ended December 31, 2015 | |
| Investment Income | | Tax-Managed
Growth Fund 1.1 | | | Tax-Managed
Growth Fund 1.2 | |
Dividends allocated from Portfolio (net of foreign taxes, $171,213 and $73,557, respectively) | | $ | 27,019,868 | | | $ | 11,706,465 | |
Interest allocated from Portfolio | | | 34,778 | | | | 15,104 | |
Expenses allocated from Portfolio | | | (6,660,802 | ) | | | (2,887,242 | ) |
Total investment income from Portfolio | | $ | 20,393,844 | | | $ | 8,834,327 | |
| | |
| Expenses | | | | | | | | |
Administration fee | | $ | — | | | $ | 918,413 | |
Distribution and service fees | | | | | | | | |
Class A | | | 2,705,916 | | | | 948,875 | |
Class B | | | 62,224 | | | | 50,429 | |
Class C | | | 2,737,883 | | | | 1,716,754 | |
Trustees’ fees and expenses | | | 500 | | | | 500 | |
Custodian fee | | | 61,500 | | | | 42,366 | |
Transfer and dividend disbursing agent fees | | | 876,114 | | | | 360,116 | |
Professional fees | | | 44,018 | | | | 33,639 | |
Printing and postage | | | 89,806 | | | | 45,732 | |
Registration fees | | | 72,918 | | | | 61,833 | |
Miscellaneous | | | 167,968 | | | | 39,282 | |
Total expenses | | $ | 6,818,847 | | | $ | 4,217,939 | |
| | |
Net investment income | | $ | 13,574,997 | | | $ | 4,616,388 | |
|
| Realized and Unrealized Gain (Loss) from Portfolio | |
Net realized gain (loss) — | | | | | | | | |
Investment transactions(1) | | $ | 40,242,912 | | | $ | 23,404,184 | |
Foreign currency transactions | | | (4,455 | ) | | | (1,908 | ) |
Net realized gain | | $ | 40,238,457 | | | $ | 23,402,276 | |
Change in unrealized appreciation (depreciation) — | | | | | | | | |
Investments | | $ | (25,658,554 | ) | | $ | (17,426,685 | ) |
Foreign currency | | | (5,612 | ) | | | (2,572 | ) |
Net change in unrealized appreciation (depreciation) | | $ | (25,664,166 | ) | | $ | (17,429,257 | ) |
| | |
Net realized and unrealized gain | | $ | 14,574,291 | | | $ | 5,973,019 | |
| | |
Net increase in net assets from operations | | $ | 28,149,288 | | | $ | 10,589,407 | |
| (1) | Includes $38,892,562 and $22,892,280, respectively, of net realized gains from redemptions in-kind. |
| | | | |
| | 10 | | See Notes to Financial Statements. |
Eaton Vance
Tax-Managed Growth Funds 1.1 and 1.2
December 31, 2015
Statements of Changes in Net Assets
| | | | | | | | |
| | | Year Ended December 31, 2015 | |
| Increase (Decrease) in Net Assets | | Tax-Managed
Growth Fund 1.1 | | | Tax-Managed
Growth Fund 1.2 | |
From operations — | | | | | | | | |
Net investment income | | $ | 13,574,997 | | | $ | 4,616,388 | |
Net realized gain from investment and foreign currency transactions | | | 40,238,457 | | | | 23,402,276 | |
Net change in unrealized appreciation (depreciation) from investments and foreign currency | | | (25,664,166 | ) | | | (17,429,257 | ) |
Net increase in net assets from operations | | $ | 28,149,288 | | | $ | 10,589,407 | |
Distributions to shareholders — | | | | | | | | |
From net investment income | | | | | | | | |
Class A | | $ | (11,110,967 | ) | | $ | (3,520,897 | ) |
Class B | | | (6,701 | ) | | | (1,318 | ) |
Class C | | | (1,117,582 | ) | | | (398,362 | ) |
Class I | | | (699,690 | ) | | | (710,037 | ) |
Total distributions to shareholders | | $ | (12,934,940 | ) | | $ | (4,630,614 | ) |
Transactions in shares of beneficial interest — | | | | | | | | |
Proceeds from sale of shares | | | | | | | | |
Class A | | $ | 6,728,271 | | | $ | 21,158,633 | |
Class B | | | 66,539 | | | | 55,152 | |
Class C | | | 2,108,549 | | | | 15,769,692 | |
Class I | | | 83,686,902 | | | | 26,939,307 | |
Net asset value of shares issued to shareholders in payment of distributions declared | | | | | | | | |
Class A | | | 9,531,158 | | | | 3,224,373 | |
Class B | | | 6,138 | | | | 1,128 | |
Class C | | | 913,819 | | | | 332,408 | |
Class I | | | 436,395 | | | | 595,784 | |
Cost of shares redeemed | | | | | | | | |
Class A | | | (71,568,663 | ) | | | (27,754,307 | ) |
Class B | | | (527,811 | ) | | | (360,152 | ) |
Class C | | | (22,121,079 | ) | | | (13,851,462 | ) |
Class I | | | (79,262,898 | ) | | | (18,911,023 | ) |
Net asset value of shares exchanged | | | | | | | | |
Class A | | | 2,005,702 | | | | 1,570,466 | |
Class B | | | (2,005,702 | ) | | | (1,570,466 | ) |
Net increase (decrease) in net assets from Fund share transactions | | $ | (70,002,680 | ) | | $ | 7,199,533 | |
| | |
Net increase (decrease) in net assets | | $ | (54,788,332 | ) | | $ | 13,158,326 | |
|
| Net Assets | |
At beginning of year | | $ | 1,429,264,956 | | | $ | 605,788,654 | |
At end of year | | $ | 1,374,476,624 | | | $ | 618,946,980 | |
|
Accumulated undistributed net investment income
included in net assets | |
At end of year | | $ | 637,975 | | | $ | 3,315 | |
| | | | |
| | 11 | | See Notes to Financial Statements. |
Eaton Vance
Tax-Managed Growth Funds 1.1 and 1.2
December 31, 2015
Statements of Changes in Net Assets — continued
| | | | | | | | |
| | | Year Ended December 31, 2014 | |
| Increase (Decrease) in Net Assets | | Tax-Managed
Growth Fund 1.1 | | | Tax-Managed
Growth Fund 1.2 | |
From operations — | | | | | | | | |
Net investment income | | $ | 13,242,628 | | | $ | 4,233,667 | |
Net realized gain from investment and foreign currency transactions | | | 67,341,790 | | | | 24,614,761 | |
Net change in unrealized appreciation (depreciation) from investments and foreign currency | | | 78,293,050 | | | | 36,178,400 | |
Net increase in net assets from operations | | $ | 158,877,468 | | | $ | 65,026,828 | |
Distributions to shareholders — | | | | | | | | |
From net investment income | | | | | | | | |
Class A | | $ | (11,408,721 | ) | | $ | (3,371,773 | ) |
Class B | | | (14,372 | ) | | | (1,415 | ) |
Class C | | | (1,298,306 | ) | | | (373,268 | ) |
Class I | | | (610,067 | ) | | | (586,944 | ) |
Total distributions to shareholders | | $ | (13,331,466 | ) | | $ | (4,333,400 | ) |
Transactions in shares of beneficial interest — | | | | | | | | |
Proceeds from sale of shares | | | | | | | | |
Class A | | $ | 6,660,576 | | | $ | 19,676,710 | |
Class B | | | 33,495 | | | | 43,239 | |
Class C | | | 1,424,318 | | | | 8,351,801 | |
Class I | | | 97,305,407 | | | | 38,108,056 | |
Net asset value of shares issued to shareholders in payment of distributions declared | | | | | | | | |
Class A | | | 9,762,569 | | | | 3,082,951 | |
Class B | | | 13,348 | | | | 1,220 | |
Class C | | | 1,056,218 | | | | 309,337 | |
Class I | | | 390,604 | | | | 524,912 | |
Cost of shares redeemed | | | | | | | | |
Class A | | | (82,734,346 | ) | | | (38,594,775 | ) |
Class B | | | (726,376 | ) | | | (672,583 | ) |
Class C | | | (20,193,880 | ) | | | (14,010,703 | ) |
Class I | | | (97,497,815 | ) | | | (27,518,531 | ) |
Net asset value of shares exchanged | | | | | | | | |
Class A | | | 2,658,431 | | | | 2,093,444 | |
Class B | | | (2,658,431 | ) | | | (2,093,444 | ) |
Net decrease in net assets from Fund share transactions | | $ | (84,505,882 | ) | | $ | (10,698,366 | ) |
| | |
Net increase in net assets | | $ | 61,040,120 | | | $ | 49,995,062 | |
|
| Net Assets | |
At beginning of year | | $ | 1,368,224,836 | | | $ | 555,793,592 | |
At end of year | | $ | 1,429,264,956 | | | $ | 605,788,654 | |
|
Accumulated undistributed net investment income
included in net assets | |
At end of year | | $ | 7,376 | | | $ | 2,914 | |
| | | | |
| | 12 | | See Notes to Financial Statements. |
Eaton Vance
Tax-Managed Growth Funds 1.1 and 1.2
December 31, 2015
Financial Highlights
| | | | | | | | | | | | | | | | | | | | |
| | | Tax-Managed Growth Fund 1.1 — Class A | |
| | | Year Ended December 31, | |
| | | 2015 | | | 2014 | | | 2013 | | | 2012 | | | 2011 | |
Net asset value — Beginning of year | | $ | 38.910 | | | $ | 35.000 | | | $ | 26.810 | | | $ | 23.630 | | | $ | 23.820 | |
| | | | | |
| Income (Loss) From Operations | | | | | | | | | | | | | | | | | | | | |
Net investment income(1) | | $ | 0.435 | | | $ | 0.405 | | | $ | 0.354 | | | $ | 0.366 | | | $ | 0.275 | |
Net realized and unrealized gain (loss) | | | 0.402 | | | | 3.913 | | | | 8.195 | | | | 3.195 | | | | (0.176 | ) |
| | | | | |
Total income from operations | | $ | 0.837 | | | $ | 4.318 | | | $ | 8.549 | | | $ | 3.561 | | | $ | 0.099 | |
| | | | | |
| Less Distributions | | | | | | | | | | | | | | | | | | | | |
From net investment income | | $ | (0.417 | ) | | $ | (0.408 | ) | | $ | (0.359 | ) | | $ | (0.381 | ) | | $ | (0.289 | ) |
| | | | | |
Total distributions | | $ | (0.417 | ) | | $ | (0.408 | ) | | $ | (0.359 | ) | | $ | (0.381 | ) | | $ | (0.289 | ) |
| | | | | |
Net asset value — End of year | | $ | 39.330 | | | $ | 38.910 | | | $ | 35.000 | | | $ | 26.810 | | | $ | 23.630 | |
| | | | | |
Total Return(2) | | | 2.15 | % | | | 12.33 | % | | | 31.92 | % | | | 15.05 | % | | | 0.42 | % |
| | | | | |
| Ratios/Supplemental Data | | | | | | | | | | | | | | | | | | | | |
Net assets, end of year (000’s omitted) | | $ | 1,055,259 | | | $ | 1,096,567 | | | $ | 1,048,081 | | | $ | 863,387 | | | $ | 864,789 | |
Ratios (as a percentage of average daily net assets):(3) | | | | | | | | | | | | | | | | | | | | |
Expenses(4) | | | 0.82 | % | | | 0.83 | % | | | 0.83 | % | | | 0.86 | % | | | 0.86 | % |
Net investment income | | | 1.10 | % | | | 1.11 | % | | | 1.14 | % | | | 1.40 | % | | | 1.15 | % |
Portfolio Turnover of the Portfolio | | | 9 | % | | | 8 | % | | | 3 | % | | | 2 | % | | | 2 | % |
| (1) | Computed using average shares outstanding. |
| (2) | Returns are historical and are calculated by determining the percentage change in net asset value with all distributions reinvested and do not reflect the effect of sales charges. |
| (3) | Includes the Fund’s share of the Portfolio’s allocated expenses. |
| (4) | Excludes the effect of custody fee credits, if any, of less than 0.005%. |
| | | | |
| | 13 | | See Notes to Financial Statements. |
Eaton Vance
Tax-Managed Growth Funds 1.1 and 1.2
December 31, 2015
Financial Highlights — continued
| | | | | | | | | | | | | | | | | | | | |
| | | Tax-Managed Growth Fund 1.1 — Class B | |
| | | Year Ended December 31, | |
| | | 2015 | | | 2014 | | | 2013 | | | 2012 | | | 2011 | |
Net asset value — Beginning of year | | $ | 38.130 | | | $ | 34.260 | | | $ | 26.220 | | | $ | 23.070 | | | $ | 23.190 | |
| | | | | |
| Income (Loss) From Operations | | | | | | | | | | | | | | | | | | | | |
Net investment income(1) | | $ | 0.138 | | | $ | 0.128 | | | $ | 0.117 | | | $ | 0.156 | | | $ | 0.087 | |
Net realized and unrealized gain (loss) | | | 0.382 | | | | 3.814 | | | | 7.997 | | | | 3.118 | | | | (0.163 | ) |
| | | | | |
Total income (loss) from operations | | $ | 0.520 | | | $ | 3.942 | | | $ | 8.114 | | | $ | 3.274 | | | $ | (0.076 | ) |
| | | | | |
| Less Distributions | | | | | | | | | | | | | | | | | | | | |
From net investment income | | $ | (0.050 | ) | | $ | (0.072 | ) | | $ | (0.074 | ) | | $ | (0.124 | ) | | $ | (0.044 | ) |
| | | | | |
Total distributions | | $ | (0.050 | ) | | $ | (0.072 | ) | | $ | (0.074 | ) | | $ | (0.124 | ) | | $ | (0.044 | ) |
| | | | | |
Net asset value — End of year | | $ | 38.600 | | | $ | 38.130 | | | $ | 34.260 | | | $ | 26.220 | | | $ | 23.070 | |
| | | | | |
Total Return(2) | | | 1.36 | % | | | 11.51 | % | | | 30.95 | % | | | 14.18 | % | | | (0.33 | )% |
| | | | | |
| Ratios/Supplemental Data | | | | | | | | | | | | | | | | | | | | |
Net assets, end of year (000’s omitted) | | $ | 5,044 | | | $ | 7,411 | | | $ | 9,872 | | | $ | 11,825 | | | $ | 18,835 | |
Ratios (as a percentage of average daily net assets):(3) | | | | | | | | | | | | | | | | | | | | |
Expenses(4) | | | 1.57 | % | | | 1.58 | % | | | 1.59 | % | | | 1.61 | % | | | 1.61 | % |
Net investment income | | | 0.36 | % | | | 0.36 | % | | | 0.39 | % | | | 0.62 | % | | | 0.37 | % |
Portfolio Turnover of the Portfolio | | | 9 | % | | | 8 | % | | | 3 | % | | | 2 | % | | | 2 | % |
| (1) | Computed using average shares outstanding. |
| (2) | Returns are historical and are calculated by determining the percentage change in net asset value with all distributions reinvested and do not reflect the effect of sales charges. |
| (3) | Includes the Fund’s share of the Portfolio’s allocated expenses. |
| (4) | Excludes the effect of custody fee credits, if any, of less than 0.005%. |
| | | | |
| | 14 | | See Notes to Financial Statements. |
Eaton Vance
Tax-Managed Growth Funds 1.1 and 1.2
December 31, 2015
Financial Highlights — continued
| | | | | | | | | | | | | | | | | | | | |
| | | Tax-Managed Growth Fund 1.1 — Class C | |
| | | Year Ended December 31, | |
| | | 2015 | | | 2014 | | | 2013 | | | 2012 | | | 2011 | |
Net asset value — Beginning of year | | $ | 35.100 | | | $ | 31.630 | | | $ | 24.270 | | | $ | 21.430 | | | $ | 21.630 | |
| | | | | |
| Income (Loss) From Operations | | | | | | | | | | | | | | | | | | | | |
Net investment income(1) | | $ | 0.125 | | | $ | 0.118 | | | $ | 0.110 | | | $ | 0.154 | | | $ | 0.086 | |
Net realized and unrealized gain (loss) | | | 0.365 | | | | 3.515 | | | | 7.402 | | | | 2.889 | | | | (0.167 | ) |
| | | | | |
Total income (loss) from operations | | $ | 0.490 | | | $ | 3.633 | | | $ | 7.512 | | | $ | 3.043 | | | $ | (0.081 | ) |
| | | | | |
| Less Distributions | | | | | | | | | | | | | | | | | | | | |
From net investment income | | $ | (0.150 | ) | | $ | (0.163 | ) | | $ | (0.152 | ) | | $ | (0.203 | ) | | $ | (0.119 | ) |
| | | | | |
Total distributions | | $ | (0.150 | ) | | $ | (0.163 | ) | | $ | (0.152 | ) | | $ | (0.203 | ) | | $ | (0.119 | ) |
| | | | | |
Net asset value — End of year | | $ | 35.440 | | | $ | 35.100 | | | $ | 31.630 | | | $ | 24.270 | | | $ | 21.430 | |
| | | | | |
Total Return(2) | | | 1.40 | % | | | 11.48 | % | | | 30.97 | % | | | 14.19 | % | | | (0.37 | )% |
| | | | | |
| Ratios/Supplemental Data | | | | | | | | | | | | | | | | | | | | |
Net assets, end of year (000’s omitted) | | $ | 263,896 | | | $ | 280,250 | | | $ | 269,668 | | | $ | 222,682 | | | $ | 227,541 | |
Ratios (as a percentage of average daily net assets):(3) | | | | | | | | | | | | | | | | | | | | |
Expenses(4) | | | 1.57 | % | | | 1.58 | % | | | 1.58 | % | | | 1.61 | % | | | 1.61 | % |
Net investment income | | | 0.35 | % | | | 0.36 | % | | | 0.39 | % | | | 0.65 | % | | | 0.39 | % |
Portfolio Turnover of the Portfolio | | | 9 | % | | | 8 | % | | | 3 | % | | | 2 | % | | | 2 | % |
| (1) | Computed using average shares outstanding. |
| (2) | Returns are historical and are calculated by determining the percentage change in net asset value with all distributions reinvested and do not reflect the effect of sales charges. |
| (3) | Includes the Fund’s share of the Portfolio’s allocated expenses. |
| (4) | Excludes the effect of custody fee credits, if any, of less than 0.005%. |
| | | | |
| | 15 | | See Notes to Financial Statements. |
Eaton Vance
Tax-Managed Growth Funds 1.1 and 1.2
December 31, 2015
Financial Highlights — continued
| | | | | | | | | | | | | | | | | | | | |
| | | Tax-Managed Growth Fund 1.1 — Class I | |
| | | Year Ended December 31, | |
| | | 2015 | | | 2014 | | | 2013 | | | 2012 | | | 2011 | |
Net asset value — Beginning of year | | $ | 36.430 | | | $ | 32.790 | | | $ | 25.130 | | | $ | 22.170 | | | $ | 22.380 | |
| | | | | |
| Income (Loss) From Operations | | | | | | | | | | | | | | | | | | | | |
Net investment income(1) | | $ | 0.497 | | | $ | 0.473 | | | $ | 0.416 | | | $ | 0.427 | | | $ | 0.323 | |
Net realized and unrealized gain (loss) | | | 0.381 | | | | 3.669 | | | | 7.683 | | | | 2.982 | | | | (0.180 | ) |
| | | | | |
Total income from operations | | $ | 0.878 | | | $ | 4.142 | | | $ | 8.099 | | | $ | 3.409 | | | $ | 0.143 | |
| | | | | |
| Less Distributions | | | | | | | | | | | | | | | | | | | | |
From net investment income | | $ | (0.518 | ) | | $ | (0.502 | ) | | $ | (0.439 | ) | | $ | (0.449 | ) | | $ | (0.353 | ) |
| | | | | |
Total distributions | | $ | (0.518 | ) | | $ | (0.502 | ) | | $ | (0.439 | ) | | $ | (0.449 | ) | | $ | (0.353 | ) |
| | | | | |
Net asset value — End of year | | $ | 36.790 | | | $ | 36.430 | | | $ | 32.790 | | | $ | 25.130 | | | $ | 22.170 | |
| | | | | |
Total Return(2) | | | 2.41 | % | | | 12.62 | % | | | 32.27 | % | | | 15.35 | % | | | 0.65 | % |
| | | | | |
| Ratios/Supplemental Data | | | | | | | | | | | | | | | | | | | | |
Net assets, end of year (000’s omitted) | | $ | 50,278 | | | $ | 45,037 | | | $ | 40,603 | | | $ | 28,049 | | | $ | 23,857 | |
Ratios (as a percentage of average daily net assets):(3) | | | | | | | | | | | | | | | | | | | | |
Expenses(4) | | | 0.56 | % | | | 0.58 | % | | | 0.59 | % | | | 0.61 | % | | | 0.61 | % |
Net investment income | | | 1.34 | % | | | 1.37 | % | | | 1.42 | % | | | 1.74 | % | | | 1.44 | % |
Portfolio Turnover of the Portfolio | | | 9 | % | | | 8 | % | | | 3 | % | | | 2 | % | | | 2 | % |
| (1) | Computed using average shares outstanding. |
| (2) | Returns are historical and are calculated by determining the percentage change in net asset value with all distributions reinvested. |
| (3) | Includes the Fund’s share of the Portfolio’s allocated expenses. |
| (4) | Excludes the effect of custody fee credits, if any, of less than 0.005%. |
| | | | |
| | 16 | | See Notes to Financial Statements. |
Eaton Vance
Tax-Managed Growth Funds 1.1 and 1.2
December 31, 2015
Financial Highlights — continued
| | | | | | | | | | | | | | | | | | | | |
| | | Tax-Managed Growth Fund 1.2 — Class A | |
| | | Year Ended December 31, | |
| | | 2015 | | | 2014 | | | 2013 | | | 2012 | | | 2011 | |
Net asset value — Beginning of year | | $ | 17.500 | | | $ | 15.750 | | | $ | 12.060 | | | $ | 10.630 | | | $ | 10.720 | |
| | | | | |
| Income (Loss) From Operations | | | | | | | | | | | | | | | | | | | | |
Net investment income(1) | | $ | 0.168 | | | $ | 0.155 | | | $ | 0.137 | | | $ | 0.145 | | | $ | 0.104 | |
Net realized and unrealized gain (loss) | | | 0.187 | | | | 1.752 | | | | 3.691 | | | | 1.437 | | | | (0.083 | ) |
| | | | | |
Total income from operations | | $ | 0.355 | | | $ | 1.907 | | | $ | 3.828 | | | $ | 1.582 | | | $ | 0.021 | |
| | | | | |
| Less Distributions | | | | | | | | | | | | | | | | | | | | |
From net investment income | | $ | (0.165 | ) | | $ | (0.157 | ) | | $ | (0.138 | ) | | $ | (0.152 | ) | | $ | (0.111 | ) |
| | | | | |
Total distributions | | $ | (0.165 | ) | | $ | (0.157 | ) | | $ | (0.138 | ) | | $ | (0.152 | ) | | $ | (0.111 | ) |
| | | | | |
Net asset value — End of year | | $ | 17.690 | | | $ | 17.500 | | | $ | 15.750 | | | $ | 12.060 | | | $ | 10.630 | |
| | | | | |
Total Return(2) | | | 2.03 | % | | | 12.10 | % | | | 31.76 | % | | | 14.87 | % | | | 0.20 | % |
| | | | | |
| Ratios/Supplemental Data | | | | | | | | | | | | | | | | | | | | |
Net assets, end of year (000’s omitted) | | $ | 379,685 | | | $ | 377,644 | | | $ | 352,976 | | | $ | 282,750 | | | $ | 278,401 | |
Ratios (as a percentage of average daily net assets):(3) | | | | | | | | | | | | | | | | | | | | |
Expenses(4) | | | 0.97 | % | | | 0.99 | % | | | 1.00 | % | | | 1.03 | % | | | 1.04 | % |
Net investment income | | | 0.95 | % | | | 0.94 | % | | | 0.98 | % | | | 1.24 | % | | | 0.96 | % |
Portfolio Turnover of the Portfolio | | | 9 | % | | | 8 | % | | | 3 | % | | | 2 | % | | | 2 | % |
| (1) | Computed using average shares outstanding. |
| (2) | Returns are historical and are calculated by determining the percentage change in net asset value with all distributions reinvested and do not reflect the effect of sales charges. |
| (3) | Includes the Fund’s share of the Portfolio’s allocated expenses. |
| (4) | Excludes the effect of custody fee credits, if any, of less than 0.005%. |
| | | | |
| | 17 | | See Notes to Financial Statements. |
Eaton Vance
Tax-Managed Growth Funds 1.1 and 1.2
December 31, 2015
Financial Highlights — continued
| | | | | | | | | | | | | | | | | | | | |
| | | Tax-Managed Growth Fund 1.2 — Class B | |
| | | Year Ended December 31, | |
| | | 2015 | | | 2014 | | | 2013 | | | 2012 | | | 2011 | |
Net asset value — Beginning of year | | $ | 17.330 | | | $ | 15.570 | | | $ | 11.920 | | | $ | 10.470 | | | $ | 10.530 | |
| | | | | |
| Income (Loss) From Operations | | | | | | | | | | | | | | | | | | | | |
Net investment income(1) | | $ | 0.035 | | | $ | 0.033 | | | $ | 0.031 | | | $ | 0.049 | | | $ | 0.019 | |
Net realized and unrealized gain (loss) | | | 0.180 | | | | 1.731 | | | | 3.626 | | | | 1.419 | | | | (0.079 | ) |
| | | | | |
Total income (loss) from operations | | $ | 0.215 | | | $ | 1.764 | | | $ | 3.657 | | | $ | 1.468 | | | $ | (0.060 | ) |
| | | | | |
| Less Distributions | | | | | | | | | | | | | | | | | | | | |
From net investment income | | $ | (0.005 | ) | | $ | (0.004 | ) | | $ | (0.007 | ) | | $ | (0.018 | ) | | $ | — | |
| | | | | |
Total distributions | | $ | (0.005 | ) | | $ | (0.004 | ) | | $ | (0.007 | ) | | $ | (0.018 | ) | | $ | — | |
| | | | | |
Net asset value — End of year | | $ | 17.540 | | | $ | 17.330 | | | $ | 15.570 | | | $ | 11.920 | | | $ | 10.470 | |
| | | | | |
Total Return(2) | | | 1.24 | % | | | 11.33 | % | | | 30.68 | % | | | 14.02 | % | | | (0.57 | )% |
| | | | | |
| Ratios/Supplemental Data | | | | | | | | | | | | | | | | | | | | |
Net assets, end of year (000’s omitted) | | $ | 4,230 | | | $ | 6,027 | | | $ | 8,046 | | | $ | 9,789 | | | $ | 19,064 | |
Ratios (as a percentage of average daily net assets):(3) | | | | | | | | | | | | | | | | | | | | |
Expenses(4) | | | 1.72 | % | | | 1.74 | % | | | 1.75 | % | | | 1.78 | % | | | 1.80 | % |
Net investment income | | | 0.20 | % | | | 0.20 | % | | | 0.22 | % | | | 0.43 | % | | | 0.18 | % |
Portfolio Turnover of the Portfolio | | | 9 | % | | | 8 | % | | | 3 | % | | | 2 | % | | | 2 | % |
| (1) | Computed using average shares outstanding. |
| (2) | Returns are historical and are calculated by determining the percentage change in net asset value with all distributions reinvested and do not reflect the effect of sales charges. |
| (3) | Includes the Fund’s share of the Portfolio’s allocated expenses. |
| (4) | Excludes the effect of custody fee credits, if any, of less than 0.005%. |
| | | | |
| | 18 | | See Notes to Financial Statements. |
Eaton Vance
Tax-Managed Growth Funds 1.1 and 1.2
December 31, 2015
Financial Highlights — continued
| | | | | | | | | | | | | | | | | | | | |
| | | Tax-Managed Growth Fund 1.2 — Class C | |
| | | Year Ended December 31, | |
| | | 2015 | | | 2014 | | | 2013 | | | 2012 | | | 2011 | |
Net asset value — Beginning of year | | $ | 17.070 | | | $ | 15.370 | | | $ | 11.780 | | | $ | 10.390 | | | $ | 10.470 | |
| | | | | |
| Income (Loss) From Operations | | | | | | | | | | | | | | | | | | | | |
Net investment income(1) | | $ | 0.034 | | | $ | 0.031 | | | $ | 0.031 | | | $ | 0.055 | | | $ | 0.022 | |
Net realized and unrealized gain (loss) | | | 0.176 | | | | 1.707 | | | | 3.594 | | | | 1.398 | | | | (0.075 | ) |
| | | | | |
Total income (loss) from operations | | $ | 0.210 | | | $ | 1.738 | | | $ | 3.625 | | | $ | 1.453 | | | $ | (0.053 | ) |
| | | | | |
| Less Distributions | | | | | | | | | | | | | | | | | | | | |
From net investment income | | $ | (0.040 | ) | | $ | (0.038 | ) | | $ | (0.035 | ) | | $ | (0.063 | ) | | $ | (0.027 | ) |
| | | | | |
Total distributions | | $ | (0.040 | ) | | $ | (0.038 | ) | | $ | (0.035 | ) | | $ | (0.063 | ) | | $ | (0.027 | ) |
| | | | | |
Net asset value — End of year | | $ | 17.240 | | | $ | 17.070 | | | $ | 15.370 | | | $ | 11.780 | | | $ | 10.390 | |
| | | | | |
Total Return(2) | | | 1.23 | % | | | 11.30 | % | | | 30.78 | % | | | 13.98 | % | | | (0.50 | )% |
| | | | | |
| Ratios/Supplemental Data | | | | | | | | | | | | | | | | | | | | |
Net assets, end of year (000’s omitted) | | $ | 173,494 | | | $ | 169,638 | | | $ | 158,015 | | | $ | 129,144 | | | $ | 130,802 | |
Ratios (as a percentage of average daily net assets):(3) | | | | | | | | | | | | | | | | | | | | |
Expenses(4) | | | 1.72 | % | | | 1.74 | % | | | 1.75 | % | | | 1.78 | % | | | 1.80 | % |
Net investment income | | | 0.20 | % | | | 0.19 | % | | | 0.23 | % | | | 0.48 | % | | | 0.21 | % |
Portfolio Turnover of the Portfolio | | | 9 | % | | | 8 | % | | | 3 | % | | | 2 | % | | | 2 | % |
| (1) | Computed using average shares outstanding. |
| (2) | Returns are historical and are calculated by determining the percentage change in net asset value with all distributions reinvested and do not reflect the effect of sales charges. |
| (3) | Includes the Fund’s share of the Portfolio’s allocated expenses. |
| (4) | Excludes the effect of custody fee credits, if any, of less than 0.005%. |
| | | | |
| | 19 | | See Notes to Financial Statements. |
Eaton Vance
Tax-Managed Growth Funds 1.1 and 1.2
December 31, 2015
Financial Highlights — continued
| | | | | | | | | | | | | | | | | | | | |
| | | Tax-Managed Growth Fund 1.2 — Class I | |
| | | Year Ended December 31, | |
| | | 2015 | | | 2014 | | | 2013 | | | 2012 | | | 2011 | |
Net asset value — Beginning of year | | $ | 17.530 | | | $ | 15.770 | | | $ | 12.080 | | | $ | 10.650 | | | $ | 10.740 | |
| | | | | |
| Income (Loss) From Operations | | | | | | | | | | | | | | | | | | | | |
Net investment income(1) | | $ | 0.213 | | | $ | 0.198 | | | $ | 0.174 | | | $ | 0.178 | | | $ | 0.135 | |
Net realized and unrealized gain (loss) | | | 0.187 | | | | 1.761 | | | | 3.689 | | | | 1.435 | | | | (0.084 | ) |
| | | | | |
Total income from operations | | $ | 0.400 | | | $ | 1.959 | | | $ | 3.863 | | | $ | 1.613 | | | $ | 0.051 | |
| | | | | |
| Less Distributions | | | | | | | | | | | | | | | | | | | | |
From net investment income | | $ | (0.210 | ) | | $ | (0.199 | ) | | $ | (0.173 | ) | | $ | (0.183 | ) | | $ | (0.141 | ) |
| | | | | |
Total distributions | | $ | (0.210 | ) | | $ | (0.199 | ) | | $ | (0.173 | ) | | $ | (0.183 | ) | | $ | (0.141 | ) |
| | | | | |
Net asset value — End of year | | $ | 17.720 | | | $ | 17.530 | | | $ | 15.770 | | | $ | 12.080 | | | $ | 10.650 | |
| | | | | |
Total Return(2) | | | 2.28 | % | | | 12.42 | % | | | 32.01 | % | | | 15.12 | % | | | 0.48 | % |
| | | | | |
| Ratios/Supplemental Data | | | | | | | | | | | | | | | | | | | | |
Net assets, end of year (000’s omitted) | | $ | 61,538 | | | $ | 52,480 | | | $ | 36,757 | | | $ | 28,021 | | | $ | 21,058 | |
Ratios (as a percentage of average daily net assets):(3) | | | | | | | | | | | | | | | | | | | | |
Expenses(4) | | | 0.72 | % | | | 0.74 | % | | | 0.75 | % | | | 0.79 | % | | | 0.79 | % |
Net investment income | | | 1.20 | % | | | 1.19 | % | | | 1.24 | % | | | 1.51 | % | | | 1.26 | % |
Portfolio Turnover of the Portfolio | | | 9 | % | | | 8 | % | | | 3 | % | | | 2 | % | | | 2 | % |
| (1) | Computed using average shares outstanding. |
| (2) | Returns are historical and are calculated by determining the percentage change in net asset value with all distributions reinvested. |
| (3) | Includes the Fund’s share of the Portfolio’s allocated expenses. |
| (4) | Excludes the effect of custody fee credits, if any, of less than 0.005%. |
| | | | |
| | 20 | | See Notes to Financial Statements. |
Eaton Vance
Tax-Managed Growth Funds 1.1 and 1.2
December 31, 2015
Notes to Financial Statements
1 Significant Accounting Policies
Eaton Vance Tax-Managed Growth Fund 1.1 (Tax-Managed Growth Fund 1.1) and Eaton Vance Tax-Managed Growth Fund 1.2 (Tax-Managed Growth Fund 1.2) (each a Fund, and collectively the Funds) are diversified series of the Eaton Vance Mutual Funds Trust (the Trust). The Trust is a Massachusetts business trust registered under the Investment Company Act of 1940, as amended (the 1940 Act), as an open-end management investment company. Each Fund currently offers Class A, Class B, Class C and Class I shares. Class A shares are generally sold subject to a sales charge imposed at time of purchase. Class B and Class C shares are sold at net asset value and are generally subject to a contingent deferred sales charge (see Note 5). Class I shares are sold at net asset value and are not subject to a sales charge. Class B shares automatically convert to Class A shares eight years after their purchase as described in the Funds’ prospectus. Currently, Class B shares are only available for purchase upon exchange from another Eaton Vance fund or through reinvestment of distributions. Tax-Managed Growth Fund 1.1 is closed to new investors. Each class represents a pro-rata interest in each Fund, but votes separately on class-specific matters and (as noted below) is subject to different expenses. Realized and unrealized gains and losses and net investment income and losses, other than class-specific expenses, are allocated daily to each class of shares based on the relative net assets of each class to the total net assets of the Fund. Each class of shares differs in its distribution plan and certain other class-specific expenses. Each Fund typically invests all of its investable assets in interests in Tax-Managed Growth Portfolio (the Portfolio), a Massachusetts business trust, having the same investment objective and policies as the Funds. The value of each Fund’s investment in the Portfolio reflects the Fund’s proportionate interest in the net assets of the Portfolio (12.5% and 5.6% for Tax-Managed Growth Fund 1.1 and Tax-Managed Growth Fund 1.2, respectively, at December 31, 2015). The performance of each Fund is directly affected by the performance of the Portfolio. The financial statements of the Portfolio, including the portfolio of investments, are included elsewhere in this report and should be read in conjunction with the Funds’ financial statements.
The following is a summary of significant accounting policies of the Funds. The policies are in conformity with accounting principles generally accepted in the United States of America (U.S. GAAP). Each Fund is an investment company and follows accounting and reporting guidance in the Financial Accounting Standards Board (FASB) Accounting Standards Codification Topic 946 “Financial Services — Investment Companies.”
A Investment Valuation — Valuation of securities by the Portfolio is discussed in Note 1A of the Portfolio’s Notes to Financial Statements, which are included elsewhere in this report.
B Income — Each Fund’s net investment income or loss consists of the Fund’s pro-rata share of the net investment income or loss of the Portfolio, less all actual and accrued expenses of the Fund.
C Federal Taxes — Each Fund’s policy is to comply with the provisions of the Internal Revenue Code applicable to regulated investment companies and to distribute to shareholders each year substantially all of its net investment income, and all or substantially all of its net realized capital gains. Accordingly, no provision for federal income or excise tax is necessary.
As of December 31, 2015, the Funds had no uncertain tax positions that would require financial statement recognition, de-recognition, or disclosure. Each Fund files a U.S. federal income tax return annually after its fiscal year-end, which is subject to examination by the Internal Revenue Service for a period of three years from the date of filing.
D Expenses — The majority of expenses of the Trust are directly identifiable to an individual fund. Expenses which are not readily identifiable to a specific fund are allocated taking into consideration, among other things, the nature and type of expense and the relative size of the funds.
E Expense Reduction — State Street Bank and Trust Company (SSBT) serves as custodian of the Funds. Pursuant to the custodian agreement, SSBT receives a fee reduced by credits, which are determined based on the average daily cash balance each Fund maintains with SSBT. All credit balances, if any, used to reduce each Fund’s custodian fees are reported as a reduction of expenses in the Statements of Operations.
F Use of Estimates — The preparation of the financial statements in conformity with U.S. GAAP requires management to make estimates and assumptions that affect the reported amounts of assets and liabilities at the date of the financial statements and the reported amounts of income and expense during the reporting period. Actual results could differ from those estimates.
G Indemnifications — Under the Trust’s organizational documents, its officers and Trustees may be indemnified against certain liabilities and expenses arising out of the performance of their duties to each Fund. Under Massachusetts law, if certain conditions prevail, shareholders of a Massachusetts business trust (such as the Trust) could be deemed to have personal liability for the obligations of the Trust. However, the Trust’s Declaration of Trust contains an express disclaimer of liability on the part of Fund shareholders and the By-laws provide that the Trust shall assume the defense on behalf of any Fund shareholders. Moreover, the By-laws also provide for indemnification out of Fund property of any shareholder held personally liable solely by reason of being or having been a shareholder for all loss or expense arising from such liability. Additionally, in the normal course of business, each Fund enters into agreements with service providers that may contain indemnification clauses. Each Fund’s maximum exposure under these arrangements is unknown as this would involve future claims that may be made against each Fund that have not yet occurred.
H Other — Investment transactions are accounted for on a trade date basis.
Eaton Vance
Tax-Managed Growth Funds 1.1 and 1.2
December 31, 2015
Notes to Financial Statements — continued
2 Distributions to Shareholders and Income Tax Information
It is the present policy of each Fund to make at least one distribution annually (normally in December) of all or substantially all of its net investment income and to distribute annually all or substantially all of its net realized capital gains (reduced by available capital loss carryforwards from prior years). Distributions to shareholders are recorded on the ex-dividend date. Distributions are declared separately for each class of shares. Shareholders may reinvest income and capital gain distributions in additional shares of the same class of a Fund at the net asset value as of the ex-dividend date or, at the election of the shareholder, receive distributions in cash. Distributions to shareholders are determined in accordance with income tax regulations, which may differ from U.S. GAAP. As required by U.S. GAAP, only distributions in excess of tax basis earnings and profits are reported in the financial statements as a return of capital. Permanent differences between book and tax accounting relating to distributions are reclassified to paid-in capital. For tax purposes, distributions from short-term capital gains are considered to be from ordinary income.
The tax character of distributions declared for the years ended December 31, 2015 and December 31, 2014 was as follows:
| | | | | | | | |
| | | Tax-Managed
Growth Fund 1.1 | | | Tax-Managed
Growth Fund 1.2 | |
| | |
Distributions declared from: | | | | | | | | |
Ordinary income | | | | | | | | |
December 31, 2015 | | $ | 12,934,940 | | | $ | 4,630,614 | |
December 31, 2014 | | $ | 13,331,466 | | | $ | 4,333,400 | |
During the year ended December 31, 2015, the following amounts were reclassified due to differences between book and tax accounting, primarily for redemptions in-kind.
| | | | | | | | |
| | | Tax-Managed
Growth Fund 1.1 | | | Tax-Managed
Growth Fund 1.2 | |
| | |
Change in: | | | | | | | | |
Paid-in capital | | $ | 38,897,433 | | | $ | 22,876,822 | |
Accumulated net realized loss | | $ | (38,887,975 | ) | | $ | (22,891,449 | ) |
Accumulated undistributed net investment income | | $ | (9,458 | ) | | $ | 14,627 | |
These reclassifications had no effect on the net assets or net asset value per share of the Funds.
As of December 31, 2015, the components of distributable earnings (accumulated losses) and unrealized appreciation (depreciation) on a tax basis were as follows:
| | | | | | | | |
| | | Tax-Managed
Growth Fund 1.1 | | | Tax-Managed
Growth Fund 1.2 | |
| | |
Undistributed ordinary income | | $ | 629,652 | | | $ | — | |
Capital loss carryforwards and deferred capital losses | | $ | (3,589,152 | ) | | $ | (16,852,973 | ) |
Net unrealized appreciation (depreciation) | | $ | 686,367,566 | | | $ | 229,928,248 | |
The differences between components of distributable earnings (accumulated losses) on a tax basis and the amounts reflected in the Statements of Assets and Liabilities are primarily due to partnership allocations.
At December 31, 2015, the Funds, for federal income tax purposes, had capital loss carryforwards and/or deferred capital losses which will reduce the respective Fund’s taxable income arising from future net realized gains on investment transactions, if any, to the extent permitted by the Internal Revenue Code, and thus will reduce the amount of distributions to shareholders, which would otherwise be necessary to relieve the Funds of any liability for federal income or excise tax. Under tax regulations, capital losses incurred in taxable years beginning after December 2010 are considered deferred capital losses and are treated as arising on the first day of the Fund’s next taxable year, retaining the same short-term or long-term character as when originally deferred. Deferred capital losses are required to be used prior to capital loss carryforwards, which carry an expiration date. As a result of this ordering rule, capital
Eaton Vance
Tax-Managed Growth Funds 1.1 and 1.2
December 31, 2015
Notes to Financial Statements — continued
loss carryforwards may be more likely to expire if unused. The amounts and expiration dates of the capital loss carryforwards, whose character is short-term, and the amounts of the deferred capital losses are as follows:
| | | | | | | | |
| Expiration Date | | Tax-Managed
Growth Fund 1.1 | | | Tax-Managed
Growth Fund 1.2 | |
| | |
December 31, 2016 | | $ | — | | | $ | 5,627,596 | |
December 31, 2017 | | | — | | | | 10,124,862 | |
Total capital loss carryforwards | | $ | — | | | $ | 15,752,458 | |
| | |
Deferred capital losses | | | | | | | | |
Short-term | | $ | 3,589,152 | | | $ | 1,100,515 | |
Long-term | | | — | | | | — | |
3 Transactions with Affiliates
Eaton Vance Management (EVM) serves as the administrator to the Funds. EVM receives no compensation from Tax-Managed Growth Fund 1.1 for such services and a fee computed at an annual rate of 0.15% of average daily net assets from Tax-Managed Growth Fund 1.2 for such services. For the year ended December 31, 2015, the administration fee for Tax-Managed Growth Fund 1.2 amounted to $918,413. The Portfolio has engaged Boston Management and Research (BMR), a subsidiary of EVM, to render investment advisory services. See Note 2 of the Portfolio’s Notes to Financial Statements which are included elsewhere in this report.
EVM provides sub-transfer agency and related services to the Funds pursuant to a Sub-Transfer Agency Support Services Agreement. Eaton Vance Distributors, Inc. (EVD), an affiliate of EVM and the Funds’ principal underwriter, received a portion of the sales charge on sales of Class A shares of the Funds. EVD also received distribution and service fees from Class A, Class B and Class C shares (see Note 4) and contingent deferred sales charges (see Note 5). Sub-transfer agent fees earned by EVM, which are included in transfer and dividend disbursing agent fees on the Statements of Operations, and Class A sales charges that the Funds were informed were received by EVD for the year ended December 31, 2015 were as follows:
| | | | | | | | |
| | | Tax-Managed
Growth Fund 1.1 | | | Tax-Managed
Growth Fund 1.2 | |
| | |
EVM’s Sub-Transfer Agent Fees | | $ | 120,295 | | | $ | 38,281 | |
EVD’s Class A Sales Charges | | $ | 9,141 | | | $ | 32,983 | |
Trustees and officers of the Funds who are members of EVM’s or BMR’s organizations receive remuneration for their services to the Funds out of the investment adviser fee. Certain officers and Trustees of the Funds and the Portfolio are officers of the above organizations.
4 Distribution Plans
Each Fund has in effect a distribution plan for Class A shares (Class A Plan) pursuant to Rule 12b-1 under the 1940 Act. Pursuant to the Class A Plan, each Fund pays EVD a distribution and service fee of 0.25% per annum of its average daily net assets attributable to Class A shares for distribution services and facilities provided to each Fund by EVD, as well as for personal services and/or the maintenance of shareholder accounts. Distribution and service fees paid or accrued to EVD for the year ended December 31, 2015 for Class A shares amounted to the following:
| | | | | | | | |
| | | Tax-Managed
Growth Fund 1.1 | | | Tax-Managed
Growth Fund 1.2 | |
| | |
Class A Distribution and Service Fees | | $ | 2,705,916 | | �� | $ | 948,875 | |
Eaton Vance
Tax-Managed Growth Funds 1.1 and 1.2
December 31, 2015
Notes to Financial Statements — continued
Each Fund also has in effect distribution plans for Class B shares (Class B Plan) and Class C shares (Class C Plan) pursuant to Rule 12b-1 under the 1940 Act. Pursuant to the Class B and Class C Plans, each Fund pays EVD amounts equal to 0.75% per annum of its average daily net assets attributable to Class B and Class C shares for providing ongoing distribution services and facilities to the respective Fund. For the year ended December 31, 2015, the Funds paid or accrued to EVD the following distribution fees:
| | | | | | | | |
| | | Tax-Managed
Growth Fund 1.1 | | | Tax-Managed
Growth Fund 1.2 | |
| | |
Class B Distribution Fees | | $ | 46,668 | | | $ | 37,822 | |
Class C Distribution Fees | | $ | 2,053,412 | | | $ | 1,287,565 | |
Pursuant to the Class B and Class C Plans, each Fund also makes payments of service fees to EVD, financial intermediaries and other persons in amounts equal to 0.25% per annum of its average daily net assets attributable to that class. Service fees paid or accrued are for personal services and/or the maintenance of shareholder accounts. They are separate and distinct from the sales commissions and distribution fees payable to EVD. Service fees paid or accrued for the year ended December 31, 2015 amounted to the following:
| | | | | | | | |
| | | Tax-Managed
Growth Fund 1.1 | | | Tax-Managed
Growth Fund 1.2 | |
| | |
Class B Service Fees | | $ | 15,556 | | | $ | 12,607 | |
Class C Service Fees | | $ | 684,471 | | | $ | 429,189 | |
Distribution and service fees are subject to the limitations contained in the Financial Industry Regulatory Authority’s NASD Conduct Rule 2830(d), and Class B shares of Tax-Managed Growth Fund 1.1 are further limited to a 5% maximum sales charge as determined in accordance with such rule.
5 Contingent Deferred Sales Charges
A contingent deferred sales charge (CDSC) generally is imposed on redemptions of Class B shares made within six years of purchase and on redemptions of Class C shares made within one year of purchase. Class A shares may be subject to a 1% CDSC if redeemed within 18 months of purchase (depending on the circumstances of purchase). Generally, the CDSC is based upon the lower of the net asset value at date of redemption or date of purchase. No charge is levied on shares acquired by reinvestment of dividends or capital gain distributions. The CDSC for Class B shares is imposed at declining rates that begin at 5% in the case of redemptions in the first and second year after purchase, declining one percentage point each subsequent year. Class C shares are subject to a 1% CDSC if redeemed within one year of purchase. For the year ended December 31, 2015, the Funds were informed that EVD received approximately the following amounts of CDSCs paid by Class A, Class B, and Class C shareholders:
| | | | | | | | |
| | | Tax-Managed
Growth Fund 1.1 | | | Tax-Managed
Growth Fund 1.2 | |
| | |
Class A | | $ | 44 | | | $ | 2,259 | |
Class B | | $ | 1,345 | | | $ | 1,351 | |
Class C | | $ | 361 | | | $ | 4,156 | |
6 Investment Transactions
For the year ended December 31, 2015, increases and decreases in each Fund’s investment in the Portfolio aggregated, as follows:
| | | | | | | | |
| Fund | | Increases | | | Decreases | |
| | |
Tax-Managed Growth Fund 1.1 | | $ | 315,003 | | | $ | 89,500,025 | |
Tax-Managed Growth Fund 1.2 | | | 13,202,655 | | | | 14,439,244 | |
Eaton Vance
Tax-Managed Growth Funds 1.1 and 1.2
December 31, 2015
Notes to Financial Statements — continued
Decreases in each Fund’s investment in the Portfolio include distributions of securities as the result of redemptions in-kind, as follows:
| | | | |
| Fund | | Redemptions in-kind | |
| |
Tax-Managed Growth Fund 1.1 | | $ | 71,402,865 | |
Tax-Managed Growth Fund 1.2 | | | 8,075,096 | |
7 Shares of Beneficial Interest
Each Fund’s Declaration of Trust permits the Trustees to issue an unlimited number of full and fractional shares of beneficial interest (without par value). Such shares may be issued in a number of different series (such as the Funds) and classes. Sales and redemptions of Class I shares include shares purchased and redeemed in connection with the ReFlow liquidity program, a program designed to provide an alternative liquidity source for mutual funds experiencing net redemptions of their shares. Transactions in Fund shares were as follows:
| | | | | | | | | | | | | | | | |
Tax-Managed Growth Fund 1.1 | | | | | | | | | | | | |
| | | Year Ended December 31, 2015 | |
| | | Class A | | | Class B | | | Class C | | | Class I | |
| | | | |
Sales | | | 170,806 | | | | 1,759 | | | | 59,479 | | | | 2,259,075 | |
Issued to shareholders electing to receive payments of distributions in Fund shares | | | 242,030 | | | | 159 | | | | 25,741 | | | | 11,849 | |
Redemptions | | | (1,812,658 | ) | | | (13,748 | ) | | | (621,891 | ) | | | (2,140,431 | ) |
Exchange from Class B shares | | | 50,673 | | | | — | | | | — | | | | — | |
Exchange to Class A shares | | | — | | | | (51,872 | ) | | | — | | | | — | |
| | | | |
Net increase (decrease) | | | (1,349,149 | ) | | | (63,702 | ) | | | (536,671 | ) | | | 130,493 | |
| | | | |
| | | | | | | | | | | | | | | | |
| | | Year Ended December 31, 2014 | |
| | | Class A | | | Class B | | | Class C | | | Class I | |
| | | | |
Sales | | | 181,805 | | | | 958 | | | | 43,144 | | | | 2,840,826 | |
Issued to shareholders electing to receive payments of distributions in Fund shares | | | 249,555 | | | | 348 | | | | 29,921 | | | | 10,666 | |
Redemptions | | | (2,270,126 | ) | | | (20,485 | ) | | | (615,798 | ) | | | (2,853,491 | ) |
Exchange from Class B shares | | | 72,821 | | | | — | | | | — | | | | — | |
Exchange to Class A shares | | | — | | | | (74,628 | ) | | | — | | | | — | |
| | | | |
Net decrease | | | (1,765,945 | ) | | | (93,807 | ) | | | (542,733 | ) | | | (1,999 | ) |
| | | | |
| | | | | | | | | | | | | | | | |
Tax-Managed Growth Fund 1.2 | | | | | | | | | | | | |
| | | Year Ended December 31, 2015 | |
| | | Class A | | | Class B | | | Class C | | | Class I | |
| | | | |
Sales | | | 1,191,243 | | | | 3,124 | | | | 912,801 | | | | 1,519,437 | |
Issued to shareholders electing to receive payments of distributions in Fund shares | | | 182,065 | | | | 64 | | | | 19,248 | | | | 33,584 | |
Redemptions | | | (1,569,286 | ) | | | (20,563 | ) | | | (806,216 | ) | | | (1,072,836 | ) |
Exchange from Class B shares | | | 88,060 | | | | — | | | | — | | | | — | |
Exchange to Class A shares | | | — | | | | (89,136 | ) | | | — | | | | — | |
| | | | |
Net increase (decrease) | | | (107,918 | ) | | | (106,511 | ) | | | 125,833 | | | | 480,185 | |
Eaton Vance
Tax-Managed Growth Funds 1.1 and 1.2
December 31, 2015
Notes to Financial Statements — continued
| | | | | | | | | | | | | | | | |
| | | Year Ended December 31, 2014 | |
| | | Class A | | | Class B | | | Class C | | | Class I | |
| | | | |
Sales | | | 1,201,734 | | | | 2,470 | | | | 517,529 | | | | 2,311,723 | |
Issued to shareholders electing to receive payments of distributions in Fund shares | | | 175,168 | | | | 70 | | | | 18,016 | | | | 29,774 | |
Redemptions | | | (2,344,560 | ) | | | (41,999 | ) | | | (878,986 | ) | | | (1,678,885 | ) |
Exchange from Class B shares | | | 127,640 | | | | — | | | | — | | | | — | |
Exchange to Class A shares | | | — | | | | (129,437 | ) | | | — | | | | — | |
| | | | |
Net increase (decrease) | | | (840,018 | ) | | | (168,896 | ) | | | (343,441 | ) | | | 662,612 | |
Eaton Vance
Tax-Managed Growth Funds 1.1 and 1.2
December 31, 2015
Report of Independent Registered Public Accounting Firm
To the Trustees of Eaton Vance Mutual Funds Trust and Shareholders of Eaton Vance Tax-Managed Growth Fund 1.1 and Eaton Vance Tax-Managed Growth Fund 1.2:
We have audited the accompanying statements of assets and liabilities of Eaton Vance Tax-Managed Growth Fund 1.1 and Eaton Vance Tax-Managed Growth Fund 1.2 (collectively the “Funds”) (each a fund constituting Eaton Vance Mutual Funds Trust), as of December 31, 2015, and the related statements of operations for the year then ended, the statements of changes in net assets for each of the two years in the period then ended, and the financial highlights for each of the five years in the period then ended. These financial statements and financial highlights are the responsibility of the Funds’ management. Our responsibility is to express an opinion on these financial statements and financial highlights based on our audits.
We conducted our audits in accordance with the standards of the Public Company Accounting Oversight Board (United States). Those standards require that we plan and perform the audit to obtain reasonable assurance about whether the financial statements and financial highlights are free of material misstatement. The Funds are not required to have, nor were we engaged to perform, an audit of their internal control over financial reporting. Our audits included consideration of internal control over financial reporting as a basis for designing audit procedures that are appropriate in the circumstances, but not for the purpose of expressing an opinion on the effectiveness of the Funds’ internal control over financial reporting. Accordingly, we express no such opinion. An audit also includes examining, on a test basis, evidence supporting the amounts and disclosures in the financial statements, assessing the accounting principles used and significant estimates made by management, as well as evaluating the overall financial statement presentation. We believe that our audits provide a reasonable basis for our opinion.
In our opinion, such financial statements and financial highlights referred to above present fairly, in all material respects, the financial positions of Eaton Vance Tax-Managed Growth Fund 1.1 and Eaton Vance Tax-Managed Growth Fund 1.2 as of December 31, 2015, the results of their operations for the year then ended, the changes in their net assets for each of the two years in the period then ended, and the financial highlights for each of the five years in the period then ended, in conformity with accounting principles generally accepted in the United States of America.
DELOITTE & TOUCHE LLP
Boston, Massachusetts
February 19, 2016
Eaton Vance
Tax-Managed Growth Funds 1.1 and 1.2
December 31, 2015
Federal Tax Information (Unaudited)
The Form 1099-DIV you received in February 2016 showed the tax status of all distributions paid to your account in calendar year 2015. Shareholders are advised to consult their own tax adviser with respect to the tax consequences of their investment in the Funds. As required by the Internal Revenue Code and/or regulations, shareholders must be notified regarding the status of qualified dividend income for individuals and the dividends received deduction for corporations.
Qualified Dividend Income. For the fiscal year ended December 31, 2015, each Fund designates approximately the following amounts, or up to the maximum amount of such dividends allowable pursuant to the Internal Revenue Code, as qualified dividend income eligible for the reduced tax rate of 15%.
| | | | |
Tax Managed Growth Fund 1.1 | | $ | 26,752,327 | |
Tax Managed Growth Fund 1.2 | | $ | 11,589,942 | |
Dividends Received Deduction. Corporate shareholders are generally entitled to take the dividends received deduction on the portion of each Fund’s dividend distribution that qualifies under tax law. For each Fund’s fiscal 2015 ordinary income dividends, the following percentages qualify for the corporate dividends received deduction.
| | | | |
Tax Managed Growth Fund 1.1 | | | 100 | % |
Tax Managed Growth Fund 1.2 | | | 100 | % |
Tax-Managed Growth Portfolio
December 31, 2015
Portfolio of Investments
| | | | | | | | |
| Common Stocks — 98.6% | |
| | |
| | | | | | | | |
| Security | | Shares | | | Value | |
| | | | | | | | |
|
Aerospace & Defense — 2.9% | |
Boeing Co. (The) | | | 968,896 | | | $ | 140,092,672 | |
General Dynamics Corp. | | | 103,638 | | | | 14,235,716 | |
Honeywell International, Inc. | | | 307,475 | | | | 31,845,186 | |
Huntington Ingalls Industries, Inc. | | | 2,546 | | | | 322,960 | |
Lockheed Martin Corp. | | | 37,571 | | | | 8,158,543 | |
Northrop Grumman Corp. | | | 16,117 | | | | 3,043,051 | |
Precision Castparts Corp. | | | 19,025 | | | | 4,413,990 | |
Raytheon Co. | | | 60,143 | | | | 7,489,608 | |
Rockwell Collins, Inc. | | | 166,787 | | | | 15,394,440 | |
United Technologies Corp. | | | 971,265 | | | | 93,309,428 | |
| | | | | | | | | |
| | | | | | $ | 318,305,594 | |
| | | | | | | | | |
|
Air Freight & Logistics — 1.5% | |
C.H. Robinson Worldwide, Inc. | | | 181,485 | | | $ | 11,255,700 | |
FedEx Corp. | | | 269,864 | | | | 40,207,037 | |
United Parcel Service, Inc., Class B | | | 1,153,201 | | | | 110,972,532 | |
| | | | | | | | | |
| | | | | | $ | 162,435,269 | |
| | | | | | | | | |
|
Auto Components — 0.3% | |
BorgWarner, Inc. | | | 2,000 | | | $ | 86,460 | |
Johnson Controls, Inc. | | | 847,645 | | | | 33,473,501 | |
| | | | | | | | | |
| | | | | | $ | 33,559,961 | |
| | | | | | | | | |
|
Automobiles — 0.1% | |
Daimler AG | | | 38,000 | | | $ | 3,178,700 | |
Ford Motor Co.(1) | | | 140,000 | | | | 1,972,600 | |
Ford Motor Co. | | | 196,080 | | | | 2,762,767 | |
Harley-Davidson, Inc. | | | 800 | | | | 36,312 | |
| | | | | | | | | |
| | | | | | $ | 7,950,379 | |
| | | | | | | | | |
|
Banks — 6.7% | |
Bank of America Corp. | | | 1,884,063 | | | $ | 31,708,780 | |
Bank of Montreal | | | 18,320 | | | | 1,033,614 | |
BB&T Corp. | | | 1,208,302 | | | | 45,685,899 | |
Citigroup, Inc. | | | 808,317 | | | | 41,830,405 | |
Commerce Bancshares, Inc. | | | 23,000 | | | | 978,420 | |
Fifth Third Bancorp | | | 1,152,954 | | | | 23,174,375 | |
HSBC Holdings PLC | | | 220,592 | | | | 1,741,315 | |
HSBC Holdings PLC ADR | | | 424 | | | | 16,735 | |
Huntington Bancshares, Inc. | | | 85,471 | | | | 945,309 | |
ING Groep NV ADR | | | 131,742 | | | | 1,773,247 | |
JPMorgan Chase & Co. | | | 3,340,662 | | | | 220,583,912 | |
KeyCorp | | | 111,718 | | | | 1,473,560 | |
| | | | | | | | |
| Security | | Shares | | | Value | |
| | | | | | | | |
|
Banks (continued) | |
M&T Bank Corp. | | | 25,977 | | | $ | 3,147,893 | |
PNC Financial Services Group, Inc. (The) | | | 71,422 | | | | 6,807,231 | |
Regions Financial Corp. | | | 580,537 | | | | 5,573,155 | |
Societe Generale SA | | | 460,793 | | | | 21,234,329 | |
SunTrust Banks, Inc. | | | 324,267 | | | | 13,891,598 | |
Synovus Financial Corp. | | | 1,565 | | | | 50,675 | |
Toronto-Dominion Bank (The) | | | 29,644 | | | | 1,161,156 | |
U.S. Bancorp | | | 1,858,329 | | | | 79,294,898 | |
Wells Fargo & Co. | | | 4,294,157 | | | | 233,430,375 | |
Zions Bancorporation | | | 38,805 | | | | 1,059,377 | |
| | | | | | | | | |
| | | | | | $ | 736,596,258 | |
| | | | | | | | | |
|
Beverages — 2.9% | |
Boston Beer Co., Inc. (The), Class A(2) | | | 2,200 | | | $ | 444,202 | |
Coca-Cola Co. (The) | | | 3,060,678 | | | | 131,486,727 | |
Molson Coors Brewing Co., Class B | | | 186,000 | | | | 17,469,120 | |
Monster Beverage Corp.(2) | | | 23,832 | | | | 3,550,015 | |
PepsiCo, Inc. | | | 1,653,824 | | | | 165,250,094 | |
| | | | | | | | | |
| | | | | | $ | 318,200,158 | |
| | | | | | | | | |
|
Biotechnology — 4.8% | |
AbbVie, Inc. | | | 1,595,392 | | | $ | 94,511,022 | |
Agios Pharmaceuticals, Inc.(2) | | | 54,880 | | | | 3,562,810 | |
Alexion Pharmaceuticals, Inc.(2) | | | 179,063 | | | | 34,156,267 | |
Alexion Pharmaceuticals, Inc.(1)(2) | | | 27,835 | | | | 5,309,526 | |
Alexion Pharmaceuticals, Inc.(1)(2) | | | 15,952 | | | | 3,042,844 | |
Amgen, Inc. | | | 1,053,422 | | | | 171,001,993 | |
Baxalta, Inc. | | | 24,552 | | | | 958,265 | |
Biogen, Inc.(2) | | | 47,097 | | | | 14,428,166 | |
Celgene Corp.(2) | | | 545,998 | | | | 65,388,720 | |
Gilead Sciences, Inc. | | | 1,021,051 | | | | 103,320,151 | |
Vertex Pharmaceuticals, Inc.(2) | | | 289,000 | | | | 36,364,870 | |
| | | | | | | | | |
| | | | | | $ | 532,044,634 | |
| | | | | | | | | |
|
Building Products — 0.0%(3) | |
Fortune Brands Home & Security, Inc. | | | 1,600 | | | $ | 88,800 | |
| | | | | | | | | |
| | | | | | $ | 88,800 | |
| | | | | | | | | |
|
Capital Markets — 4.5% | |
Affiliated Managers Group, Inc.(2) | | | 275 | | | $ | 43,934 | |
Ameriprise Financial, Inc. | | | 215,235 | | | | 22,905,309 | |
Bank of New York Mellon Corp. (The) | | | 452,521 | | | | 18,652,916 | |
BlackRock, Inc. | | | 7,289 | | | | 2,482,050 | |
Charles Schwab Corp. (The) | | | 2,745,966 | | | | 90,424,660 | |
| | | | |
| | 29 | | See Notes to Financial Statements. |
Tax-Managed Growth Portfolio
December 31, 2015
Portfolio of Investments — continued
| | | | | | | | |
| Security | | Shares | | | Value | |
| | | | | | | | |
|
Capital Markets (continued) | |
E*TRADE Financial Corp.(2) | | | 4,593 | | | $ | 136,136 | |
Franklin Resources, Inc. | | | 980,865 | | | | 36,115,449 | |
Goldman Sachs Group, Inc. (The) | | | 537,244 | | | | 96,827,486 | |
Invesco, Ltd. | | | 4,040 | | | | 135,259 | |
Legg Mason, Inc. | | | 122,902 | | | | 4,821,445 | |
LPL Financial Holdings, Inc. | | | 76,195 | | | | 3,249,717 | |
Morgan Stanley | | | 2,232,607 | | | | 71,019,229 | |
Northern Trust Corp. | | | 709,098 | | | | 51,118,875 | |
State Street Corp. | | | 769,379 | | | | 51,055,990 | |
Stifel Financial Corp.(2) | | | 112,796 | | | | 4,778,039 | |
T. Rowe Price Group, Inc. | | | 568,037 | | | | 40,608,965 | |
UBS AG(2) | | | 29,488 | | | | 571,183 | |
Waddell & Reed Financial, Inc., Class A | | | 8,833 | | | | 253,154 | |
| | | | | | | | | |
| | | | | | $ | 495,199,796 | |
| | | | | | | | | |
|
Chemicals — 1.8% | |
Air Products and Chemicals, Inc. | | | 12,258 | | | $ | 1,594,888 | |
Ashland, Inc. | | | 25,092 | | | | 2,576,948 | |
Chemours Co. (The) | | | 138,214 | | | | 740,827 | |
Dow Chemical Co. (The) | | | 177,703 | | | | 9,148,151 | |
E.I. du Pont de Nemours & Co. | | | 719,954 | | | | 47,948,936 | |
Eastman Chemical Co. | | | 1,500 | | | | 101,265 | |
Ecolab, Inc. | | | 483,542 | | | | 55,307,534 | |
Monsanto Co. | | | 503,295 | | | | 49,584,624 | |
PPG Industries, Inc. | | | 235,308 | | | | 23,253,137 | |
Praxair, Inc. | | | 3,573 | | | | 365,875 | |
Sherwin-Williams Co. (The) | | | 10,994 | | | | 2,854,042 | |
Valspar Corp. (The) | | | 20,000 | | | | 1,659,000 | |
Westlake Chemical Corp. | | | 1,000 | | | | 54,320 | |
| | | | | | | | | |
| | | | | | $ | 195,189,547 | |
| | | | | | | | | |
|
Commercial Services & Supplies — 0.3% | |
ADT Corp. (The) | | | 9,805 | | | $ | 323,369 | |
Cintas Corp. | | | 52,914 | | | | 4,817,820 | |
Pitney Bowes, Inc. | | | 14,270 | | | | 294,675 | |
Stericycle, Inc.(2) | | | 139,917 | | | | 16,873,990 | |
Tyco International, PLC | | | 96,051 | | | | 3,063,066 | |
Waste Management, Inc. | | | 108,226 | | | | 5,776,022 | |
| | | | | | | | | |
| | | | | | $ | 31,148,942 | |
| | | | | | | | | |
|
Communications Equipment — 1.4% | |
Arista Networks, Inc.(2) | | | 108,200 | | | $ | 8,422,288 | |
Arista Networks, Inc.(1)(2) | | | 327,000 | | | | 25,415,499 | |
Brocade Communications Systems, Inc. | | | 176,629 | | | | 1,621,454 | |
Cisco Systems, Inc. | | | 1,486,647 | | | | 40,369,899 | |
| | | | | | | | |
| Security | | Shares | | | Value | |
| | | | | | | | |
|
Communications Equipment (continued) | |
Juniper Networks, Inc. | | | 242,092 | | | $ | 6,681,739 | |
Motorola Solutions, Inc. | | | 2,986 | | | | 204,392 | |
Nokia Oyj ADR | | | 192 | | | | 1,348 | |
Palo Alto Networks, Inc.(2) | | | 20,808 | | | | 3,665,121 | |
QUALCOMM, Inc. | | | 1,441,630 | | | | 72,059,876 | |
| | | | | | | | | |
| | | | | | $ | 158,441,616 | |
| | | | | | | | | |
|
Construction & Engineering — 0.0%(3) | |
Jacobs Engineering Group, Inc.(2) | | | 56,851 | | | $ | 2,384,899 | |
| | | | | | | | | |
| | | | | | $ | 2,384,899 | |
| | | | | | | | | |
|
Construction Materials — 0.0%(3) | |
Vulcan Materials Co. | | | 25,199 | | | $ | 2,393,149 | |
| | | | | | | | | |
| | | | | | $ | 2,393,149 | |
| | | | | | | | | |
|
Consumer Finance — 1.6% | |
American Express Co. | | | 982,298 | | | $ | 68,318,826 | |
Capital One Financial Corp. | | | 77,831 | | | | 5,617,841 | |
Discover Financial Services(1) | | | 84,984 | | | | 4,556,842 | |
Discover Financial Services | | | 828,988 | | | | 44,450,337 | |
LendingClub Corp.(2) | | | 46,365 | | | | 512,333 | |
Navient Corp. | | | 10,200 | | | | 116,790 | |
SLM Corp.(2) | | | 10,200 | | | | 66,504 | |
Synchrony Financial(2) | | | 1,716,548 | | | | 52,200,225 | |
| | | | | | | | | |
| | | | | | $ | 175,839,698 | |
| | | | | | | | | |
|
Containers & Packaging — 0.0%(3) | |
International Paper Co. | | | 42,000 | | | $ | 1,583,400 | |
| | | | | | | | | |
| | | | | | $ | 1,583,400 | |
| | | | | | | | | |
|
Distributors — 0.1% | |
Genuine Parts Co. | | | 188,424 | | | $ | 16,183,737 | |
| | | | | | | | | |
| | | | | | $ | 16,183,737 | |
| | | | | | | | | |
|
Diversified Consumer Services — 0.0%(3) | |
H&R Block, Inc. | | | 22,181 | | | $ | 738,849 | |
| | | | | | | | | |
| | | | | | $ | 738,849 | |
| | | | | | | | | |
|
Diversified Financial Services — 2.7% | |
Berkshire Hathaway, Inc., Class A(2) | | | 453 | | | $ | 89,603,400 | |
Berkshire Hathaway, Inc., Class B(2) | | | 1,121,368 | | | | 148,065,431 | |
CBOE Holdings, Inc. | | | 151,225 | | | | 9,814,502 | |
CME Group, Inc. | | | 188,243 | | | | 17,054,816 | |
| | | | |
| | 30 | | See Notes to Financial Statements. |
Tax-Managed Growth Portfolio
December 31, 2015
Portfolio of Investments — continued
| | | | | | | | |
| Security | | Shares | | | Value | |
| | | | | | | | |
|
Diversified Financial Services (continued) | |
Intercontinental Exchange, Inc. | | | 14,292 | | | $ | 3,662,468 | |
McGraw Hill Financial, Inc. | | | 86,290 | | | | 8,506,468 | |
Moody’s Corp. | | | 184,847 | | | | 18,547,548 | |
| | | | | | | | | |
| | | | | | $ | 295,254,633 | |
| | | | | | | | | |
|
Diversified Telecommunication Services — 0.4% | |
AT&T, Inc. | | | 574,891 | | | $ | 19,781,999 | |
CenturyLink, Inc. | | | 5,086 | | | | 127,964 | |
Deutsche Telekom AG ADR | | | 50,092 | | | | 895,645 | |
Frontier Communications Corp. | | | 13,417 | | | | 62,657 | |
Verizon Communications, Inc. | | | 419,226 | | | | 19,376,626 | |
Windstream Holdings, Inc. | | | 11,811 | | | | 76,063 | |
| | | | | | | | | |
| | | | | | $ | 40,320,954 | |
| | | | | | | | | |
|
Electric Utilities — 0.1% | |
Duke Energy Corp. | | | 47,098 | | | $ | 3,362,326 | |
Exelon Corp. | | | 8,420 | | | | 233,823 | |
NextEra Energy, Inc. | | | 63,830 | | | | 6,631,299 | |
Southern Co. (The) | | | 98,717 | | | | 4,618,969 | |
| | | | | | | | | |
| | | | | | $ | 14,846,417 | |
| | | | | | | | | |
|
Electrical Equipment — 1.0% | |
AMETEK, Inc. | | | 37,403 | | | $ | 2,004,427 | |
Eaton Corp. PLC | | | 60,233 | | | | 3,134,525 | |
Emerson Electric Co. | | | 2,019,272 | | | | 96,581,780 | |
Rockwell Automation, Inc. | | | 122,921 | | | | 12,612,924 | |
SolarCity Corp.(2) | | | 7,671 | | | | 391,374 | |
| | | | | | | | | |
| | | | | | $ | 114,725,030 | |
| | | | | | | | | |
|
Electronic Equipment, Instruments & Components — 0.3% | |
Corning, Inc. | | | 1,490,118 | | | $ | 27,239,357 | |
Keysight Technologies, Inc.(2) | | | 131,228 | | | | 3,717,689 | |
Knowles Corp.(2) | | | 138,592 | | | | 1,847,432 | |
TE Connectivity, Ltd. | | | 687 | | | | 44,387 | |
| | | | | | | | | |
| | | | | | $ | 32,848,865 | |
| | | | | | | | | |
|
Energy Equipment & Services — 1.0% | |
Cameron International Corp.(2) | | | 120 | | | $ | 7,584 | |
Halliburton Co. | | | 908,146 | | | | 30,913,290 | |
Schlumberger, Ltd. | | | 1,208,048 | | | | 84,261,348 | |
Transocean, Ltd. | | | 2,884 | | | | 35,704 | |
| | | | | | | | | |
| | | | | | $ | 115,217,926 | |
| | | | | | | | | |
| | | | | | | | |
| Security | | Shares | | | Value | |
| | | | | | | | |
|
Food & Staples Retailing — 3.8% | |
Costco Wholesale Corp. | | | 876,862 | | | $ | 141,613,213 | |
CVS Health Corp. | | | 1,166,975 | | | | 114,095,146 | |
Kroger Co. (The) | | | 147,263 | | | | 6,160,011 | |
Sprouts Farmers Market, Inc.(2) | | | 1,447,581 | | | | 38,491,179 | |
Sysco Corp. | | | 378,674 | | | | 15,525,634 | |
Wal-Mart Stores, Inc. | | | 1,203,850 | | | | 73,796,005 | |
Walgreens Boots Alliance, Inc. | | | 299,569 | | | | 25,509,798 | |
| | | | | | | | | |
| | | | | | $ | 415,190,986 | |
| | | | | | | | | |
|
Food Products — 1.7% | |
Archer-Daniels-Midland Co. | | | 174,432 | | | $ | 6,398,166 | |
Campbell Soup Co. | | | 18,260 | | | | 959,563 | |
ConAgra Foods, Inc. | | | 219,407 | | | | 9,250,199 | |
Flowers Foods, Inc. | | | 147,169 | | | | 3,162,662 | |
General Mills, Inc. | | | 15,587 | | | | 898,746 | |
Hain Celestial Group, Inc. (The)(2) | | | 3,608 | | | | 145,727 | |
Hershey Co. (The) | | | 544,424 | | | | 48,600,731 | |
JM Smucker Co. (The) | | | 12,283 | | | | 1,514,985 | |
Kellogg Co. | | | 58,497 | | | | 4,227,578 | |
Keurig Green Mountain, Inc. | | | 48,584 | | | | 4,371,588 | |
Kraft Heinz Co. (The) | | | 7,111 | | | | 517,396 | |
McCormick & Co., Inc. | | | 48,129 | | | | 4,117,917 | |
Mondelez International, Inc., Class A | | | 263,944 | | | | 11,835,249 | |
Nestle SA | | | 1,191,874 | | | | 88,479,043 | |
| | | | | | | | | |
| | | | | | $ | 184,479,550 | |
| | | | | | | | | |
|
Health Care Equipment & Supplies — 1.8% | |
Abbott Laboratories | | | 1,561,748 | | | $ | 70,138,102 | |
Bard (C.R.), Inc. | | | 25,000 | | | | 4,736,000 | |
Baxter International, Inc. | | | 230,275 | | | | 8,784,991 | |
Becton, Dickinson and Co. | | | 73,732 | | | | 11,361,364 | |
Boston Scientific Corp.(2) | | | 27,329 | | | | 503,947 | |
Dexcom, Inc.(1)(2) | | | 25,000 | | | | 2,043,405 | |
Dexcom, Inc.(2) | | | 27,289 | | | | 2,234,969 | |
Halyard Health, Inc.(2) | | | 2,456 | | | | 82,055 | |
Intuitive Surgical, Inc.(2) | | | 22,100 | | | | 12,070,136 | |
Medtronic PLC | | | 525,473 | | | | 40,419,383 | |
St. Jude Medical, Inc. | | | 152,388 | | | | 9,413,007 | |
Stryker Corp. | | | 242,583 | | | | 22,545,664 | |
Zimmer Biomet Holdings, Inc. | | | 133,186 | | | | 13,663,552 | |
| | | | | | | | | |
| | | | | | $ | 197,996,575 | |
| | | | | | | | | |
|
Health Care Providers & Services — 0.9% | |
AmerisourceBergen Corp. | | | 124,953 | | | $ | 12,958,876 | |
Anthem, Inc. | | | 54,347 | | | | 7,578,146 | |
| | | | |
| | 31 | | See Notes to Financial Statements. |
Tax-Managed Growth Portfolio
December 31, 2015
Portfolio of Investments — continued
| | | | | | | | |
| Security | | Shares | | | Value | |
| | | | | | | | |
|
Health Care Providers & Services (continued) | |
Cardinal Health, Inc. | | | 251,636 | | | $ | 22,463,546 | |
Cigna Corp. | | | 1,464 | | | | 214,227 | |
DaVita HealthCare Partners, Inc.(2) | | | 136,458 | | | | 9,512,487 | |
Express Scripts Holding Co.(2) | | | 367,509 | | | | 32,123,962 | |
HCA Holdings, Inc.(2) | | | 145,114 | | | | 9,814,060 | |
Henry Schein, Inc.(2) | | | 11,249 | | | | 1,779,479 | |
Humana, Inc. | | | 482 | | | | 86,042 | |
McKesson Corp. | | | 2,384 | | | | 470,196 | |
PharMerica Corp.(2) | | | 1,805 | | | | 63,175 | |
UnitedHealth Group, Inc. | | | 61,085 | | | | 7,186,039 | |
| | | | | | | | | |
| | | | | | $ | 104,250,235 | |
| | | | | | | | | |
|
Health Care Technology — 0.0%(3) | |
Cerner Corp.(2) | | | 1,200 | | | $ | 72,204 | |
| | | | | | | | | |
| | | | | | $ | 72,204 | |
| | | | | | | | | |
|
Hotels, Restaurants & Leisure — 3.2% | |
Chipotle Mexican Grill, Inc.(2) | | | 659 | | | $ | 316,221 | |
Marriott International, Inc., Class A(1) | | | 240,419 | | | | 16,117,690 | |
Marriott International, Inc., Class A | | | 664,621 | | | | 44,556,192 | |
McDonald’s Corp. | | | 502,993 | | | | 59,423,593 | |
Starbucks Corp. | | | 3,535,937 | | | | 212,262,298 | |
Yum! Brands, Inc. | | | 290,179 | | | | 21,197,576 | |
| | | | | | | | | |
| | | | | | $ | 353,873,570 | |
| | | | | | | | | |
|
Household Durables — 0.0%(3) | |
D.R. Horton, Inc. | | | 1,455 | | | $ | 46,604 | |
Harman International Industries, Inc. | | | 26,105 | | | | 2,459,352 | |
| | | | | | | | | |
| | | | | | $ | 2,505,956 | |
| | | | | | | | | |
|
Household Products — 1.7% | |
Colgate-Palmolive Co. | | | 1,205,768 | | | $ | 80,328,264 | |
Kimberly-Clark Corp. | | | 22,323 | | | | 2,841,718 | |
Procter & Gamble Co. (The) | | | 1,330,552 | | | | 105,659,134 | |
| | | | | | | | | |
| | | | | | $ | 188,829,116 | |
| | | | | | | | | |
|
Independent Power and Renewable Electricity Producers — 0.0%(3) | |
AES Corp. (The) | | | 1,730 | | | $ | 16,556 | |
| | | | | | | | | |
| | | | | | $ | 16,556 | |
| | | | | | | | | |
|
Industrial Conglomerates — 2.2% | |
3M Co. | | | 806,829 | | | $ | 121,540,721 | |
Danaher Corp. | | | 51,993 | | | | 4,829,110 | |
| | | | | | | | |
| Security | | Shares | | | Value | |
| | | | | | | | |
|
Industrial Conglomerates (continued) | |
General Electric Co. | | | 3,661,810 | | | $ | 114,065,381 | |
| | | | | | | | | |
| | | | | | $ | 240,435,212 | |
| | | | | | | | | |
|
Insurance — 1.0% | |
Aegon NV ADR | | | 1,673,725 | | | $ | 9,490,021 | |
Aflac, Inc. | | | 218,366 | | | | 13,080,123 | |
Alleghany Corp.(2) | | | 3,985 | | | | 1,904,551 | |
Allstate Corp. (The) | | | 583 | | | | 36,198 | |
Aon PLC | | | 71,029 | | | | 6,549,584 | |
Arthur J. Gallagher & Co. | | | 47,054 | | | | 1,926,391 | |
Chubb Corp. | | | 4,856 | | | | 644,100 | |
Cincinnati Financial Corp. | | | 141,081 | | | | 8,347,763 | |
Hartford Financial Services Group, Inc. | | | 5,762 | | | | 250,417 | |
Markel Corp.(2) | | | 6,362 | | | | 5,619,873 | |
Marsh & McLennan Cos., Inc. | | | 79,454 | | | | 4,405,724 | |
Progressive Corp. | | | 1,230,644 | | | | 39,134,479 | |
Prudential Financial, Inc. | | | 18,767 | | | | 1,527,822 | |
Torchmark Corp. | | | 78,790 | | | | 4,503,636 | |
Travelers Companies, Inc. (The) | | | 88,806 | | | | 10,022,645 | |
Willis Group Holdings PLC | | | 277 | | | | 13,454 | |
| | | | | | | | | |
| | | | | | $ | 107,456,781 | |
| | | | | | | | | |
|
Internet & Catalog Retail — 2.5% | |
Amazon.com, Inc.(2) | | | 330,638 | | | $ | 223,474,918 | |
Expedia, Inc. | | | 2,575 | | | | 320,072 | |
Priceline Group, Inc. (The)(2) | | | 38,308 | | | | 48,840,785 | |
| | | | | | | | | |
| | | | | | $ | 272,635,775 | |
| | | | | | | | | |
|
Internet Software & Services — 7.6% | |
Akamai Technologies, Inc.(2) | | | 200,000 | | | $ | 10,526,000 | |
Alibaba Group Holding, Ltd. ADR(2) | | | 113,189 | | | | 9,198,870 | |
Alphabet, Inc., Class A(2) | | | 279,768 | | | | 217,662,302 | |
Alphabet, Inc., Class C(2) | | | 307,667 | | | | 233,482,333 | |
eBay, Inc.(2) | | | 1,280,740 | | | | 35,194,735 | |
Facebook, Inc., Class A(2) | | | 2,451,691 | | | | 256,593,980 | |
IAC/InterActiveCorp | | | 17,583 | | | | 1,055,859 | |
LinkedIn Corp., Class A(1)(2) | | | 190,000 | | | | 42,756,647 | |
LinkedIn Corp., Class A(2) | | | 12,245 | | | | 2,756,105 | |
Pandora Media, Inc.(2) | | | 37,000 | | | | 496,170 | |
Twitter, Inc.(2) | | | 1,063,532 | | | | 24,610,130 | |
VeriSign, Inc.(2) | | | 17,631 | | | | 1,540,244 | |
Yahoo! Inc.(2) | | | 138,604 | | | | 4,609,969 | |
| | | | | | | | | |
| | | | | | $ | 840,483,344 | |
| | | | | | | | | |
| | | | |
| | 32 | | See Notes to Financial Statements. |
Tax-Managed Growth Portfolio
December 31, 2015
Portfolio of Investments — continued
| | | | | | | | |
| Security | | Shares | | | Value | |
| | | | | | | | |
|
IT Services — 2.7% | |
Accenture PLC, Class A | | | 969,203 | | | $ | 101,281,714 | |
Automatic Data Processing, Inc. | | | 103,070 | | | | 8,732,090 | |
Broadridge Financial Solutions, Inc. | | | 1,652 | | | | 88,762 | |
Cognizant Technology Solutions Corp.,
Class A(2) | | | 3,510 | | | | 210,670 | |
Fidelity National Information Services, Inc. | | | 63,791 | | | | 3,865,735 | |
Fiserv, Inc.(2) | | | 47,012 | | | | 4,299,718 | |
International Business Machines Corp. | | | 473,506 | | | | 65,163,896 | |
MasterCard, Inc., Class A | | | 20,912 | | | | 2,035,992 | |
Paychex, Inc. | | | 695,192 | | | | 36,768,705 | |
PayPal Holdings, Inc.(2) | | | 985,838 | | | | 35,687,336 | |
Total System Services, Inc. | | | 32,405 | | | | 1,613,769 | |
Visa, Inc., Class A | | | 497,568 | | | | 38,586,398 | |
Western Union Co. | | | 60,362 | | | | 1,081,083 | |
| | | | | | | | | |
| | | | | | $ | 299,415,868 | |
| | | | | | | | | |
|
Leisure Products — 0.0%(3) | |
Mattel, Inc. | | | 26,506 | | | $ | 720,168 | |
Polaris Industries, Inc. | | | 4,104 | | | | 352,739 | |
| | | | | | | | | |
| | | | | | $ | 1,072,907 | |
| | | | | | | | | |
|
Life Sciences Tools & Services — 0.3% | |
Agilent Technologies, Inc.(1) | | | 172,823 | | | $ | 7,225,730 | |
Agilent Technologies, Inc. | | | 471,456 | | | | 19,711,575 | |
Illumina, Inc.(2) | | | 10,000 | | | | 1,919,450 | |
Thermo Fisher Scientific, Inc. | | | 19,676 | | | | 2,791,041 | |
| | | | | | | | | |
| | | | | | $ | 31,647,796 | |
| | | | | | | | | |
|
Machinery — 1.7% | |
Caterpillar, Inc. | | | 138,411 | | | $ | 9,406,412 | |
Deere & Co. | | | 570,334 | | | | 43,499,374 | |
Donaldson Co., Inc. | | | 89,373 | | | | 2,561,430 | |
Dover Corp. | | | 332,307 | | | | 20,373,742 | |
Illinois Tool Works, Inc. | | | 1,034,623 | | | | 95,888,860 | |
Ingersoll-Rand PLC | | | 2,232 | | | | 123,407 | |
Manitowoc Co., Inc. (The) | | | 45,741 | | | | 702,124 | |
PACCAR, Inc. | | | 171,748 | | | | 8,140,855 | |
Parker-Hannifin Corp. | | | 16,957 | | | | 1,644,490 | |
Pentair PLC | | | 4,385 | | | | 217,189 | |
Snap-On, Inc. | | | 14,911 | | | | 2,556,193 | |
WABCO Holdings, Inc.(2) | | | 1,156 | | | | 118,213 | |
Wabtec Corp. | | | 12,082 | | | | 859,272 | |
| | | | | | | | | |
| | | | | | $ | 186,091,561 | |
| | | | | | | | | |
| | | | | | | | |
| Security | | Shares | | | Value | |
| | | | | | | | |
|
Media — 3.2% | |
CBS Corp., Class B | | | 129,378 | | | $ | 6,097,585 | |
Comcast Corp., Class A | | | 1,448,018 | | | | 81,711,656 | |
Discovery Communications, Inc., Class A(2) | | | 6,930 | | | | 184,892 | |
Discovery Communications, Inc., Class C(2) | | | 20,394 | | | | 514,337 | |
Liberty Broadband Corp., Series A(2) | | | 3,091 | | | | 159,650 | |
Liberty Broadband Corp., Series C(2) | | | 6,183 | | | | 320,650 | |
Liberty Global PLC, Class A(2) | | | 8,854 | | | | 375,055 | |
Liberty Global PLC, Class C(2) | | | 27,614 | | | | 1,125,823 | |
Liberty Global PLC LiLAC, Class A(2) | | | 442 | | | | 18,286 | |
Liberty Global PLC LiLAC, Class C(2) | | | 1,380 | | | | 59,340 | |
Liberty Media Corp., Series A(2) | | | 12,367 | | | | 485,405 | |
Liberty Media Corp., Series C(2) | | | 24,734 | | | | 941,871 | |
News Corp., Class A | | | 24 | | | | 321 | |
Omnicom Group, Inc. | | | 148,152 | | | | 11,209,180 | |
TEGNA, Inc. | | | 3,563 | | | | 90,928 | |
Time Warner, Inc. | | | 350,629 | | | | 22,675,177 | |
Time, Inc. | | | 109 | | | | 1,708 | |
Twenty-First Century Fox, Inc., Class A | | | 5,783 | | | | 157,066 | |
Viacom, Inc., Class B | | | 133,554 | | | | 5,497,083 | |
Walt Disney Co. (The) | | | 2,148,322 | | | | 225,745,676 | |
| | | | | | | | | |
| | | | | | $ | 357,371,689 | |
| | | | | | | | | |
|
Metals & Mining — 0.1% | |
Alcoa, Inc. | | | 52,760 | | | $ | 520,741 | |
Cliffs Natural Resources, Inc.(2) | | | 278,122 | | | | 439,433 | |
Freeport-McMoRan, Inc. | | | 498 | | | | 3,372 | |
Glencore PLC | | | 598,405 | | | | 792,962 | |
Lonmin PLC(2) | | | 64 | | | | 78 | |
Nucor Corp. | | | 231,500 | | | | 9,329,450 | |
| | | | | | | | | |
| | | | | | $ | 11,086,036 | |
| | | | | | | | | |
|
Multi-Utilities — 0.0%(3) | |
Consolidated Edison, Inc. | | | 782 | | | $ | 50,259 | |
Dominion Resources, Inc. | | | 1,700 | | | | 114,988 | |
Sempra Energy | | | 1,443 | | | | 135,657 | |
| | | | | | | | | |
| | | | | | $ | 300,904 | |
| | | | | | | | | |
|
Multiline Retail — 0.2% | |
Dollar Tree, Inc.(2) | | | 26,085 | | | $ | 2,014,284 | |
Dollar Tree, Inc.(1)(2) | | | 105,998 | | | | 8,168,795 | |
Target Corp. | | | 140,332 | | | | 10,189,506 | |
| | | | | | | | | |
| | | | | | $ | 20,372,585 | |
| | | | | | | | | |
|
Oil, Gas & Consumable Fuels — 4.2% | |
Anadarko Petroleum Corp. | | | 797,255 | | | $ | 38,730,648 | |
| | | | |
| | 33 | | See Notes to Financial Statements. |
Tax-Managed Growth Portfolio
December 31, 2015
Portfolio of Investments — continued
| | | | | | | | |
| Security | | Shares | | | Value | |
| | | | | | | | |
|
Oil, Gas & Consumable Fuel (continued) | |
Antero Resources Corp.(2) | | | 633,484 | | | $ | 13,809,951 | |
Antero Resources Corp.(1)(2) | | | 535,000 | | | | 11,260,627 | |
Apache Corp. | | | 263,107 | | | | 11,700,368 | |
California Resources Corp. | | | 2,000 | | | | 4,660 | |
Cheniere Energy, Inc.(2) | | | 316,849 | | | | 11,802,625 | |
Cheniere Energy, Inc.(1)(2) | | | 14,169 | | | | 527,795 | |
Chesapeake Energy Corp. | | | 288 | | | | 1,296 | |
Chevron Corp. | | | 645,534 | | | | 58,072,239 | |
Concho Resources, Inc.(2) | | | 40,000 | | | | 3,714,400 | |
ConocoPhillips | | | 258,161 | | | | 12,053,537 | |
Devon Energy Corp. | | | 570,333 | | | | 18,250,656 | |
EOG Resources, Inc. | | | 152,793 | | | | 10,816,216 | |
Exxon Mobil Corp. | | | 3,114,878 | | | | 242,804,740 | |
Hess Corp. | | | 39,579 | | | | 1,918,790 | |
Kinder Morgan, Inc. | | | 5,815 | | | | 86,760 | |
Marathon Oil Corp. | | | 170,827 | | | | 2,150,712 | |
Marathon Petroleum Corp. | | | 160,826 | | | | 8,337,220 | |
Murphy Oil Corp. | | | 145,312 | | | | 3,262,254 | |
Occidental Petroleum Corp. | | | 8,074 | | | | 545,883 | |
Phillips 66 | | | 158,490 | | | | 12,964,482 | |
Range Resources Corp. | | | 4,900 | | | | 120,589 | |
Royal Dutch Shell PLC, Class A ADR | | | 70,142 | | | | 3,211,802 | �� |
Southwestern Energy Co.(2) | | | 730 | | | | 5,190 | |
Spectra Energy Corp. | | | 8,040 | | | | 192,478 | |
Williams Cos., Inc. | | | 4,625 | | | | 118,863 | |
WPX Energy, Inc.(2) | | | 666 | | | | 3,823 | |
| | | | | | | | | |
| | | | | | $ | 466,468,604 | |
| | | | | | | | | |
|
Personal Products — 0.0%(3) | |
Estee Lauder Cos., Inc. (The), Class A | | | 42,343 | | | $ | 3,728,725 | |
| | | | | | | | | |
| | | | | | $ | 3,728,725 | |
| | | | | | | | | |
|
Pharmaceuticals — 7.6% | |
Allergan PLC(2) | | | 115,855 | | | $ | 36,204,688 | |
Bristol-Myers Squibb Co. | | | 2,176,423 | | | | 149,716,138 | |
Catalent, Inc.(2) | | | 45,943 | | | | 1,149,953 | |
Eli Lilly & Co. | | | 1,192,455 | | | | 100,476,258 | |
GlaxoSmithKline PLC ADR | | | 1,468 | | | | 59,234 | |
Johnson & Johnson | | | 1,917,044 | | | | 196,918,760 | |
Mallinckrodt PLC(2) | | | 17,707 | | | | 1,321,473 | |
Merck & Co., Inc. | | | 1,287,918 | | | | 68,027,829 | |
Novartis AG ADR | | | 111,303 | | | | 9,576,510 | |
Novo Nordisk A/S ADR | | | 1,249,240 | | | | 72,555,859 | |
Perrigo Co. PLC | | | 31,500 | | | | 4,558,050 | |
Pfizer, Inc. | | | 2,087,698 | | | | 67,390,892 | |
| | | | | | | | |
| Security | | Shares | | | Value | |
| | | | | | | | |
|
Pharmaceuticals (continued) | |
Roche Holding AG ADR | | | 35,808 | | | $ | 1,234,302 | |
Sanofi ADR | | | 5,100 | | | | 217,515 | |
Teva Pharmaceutical Industries, Ltd. ADR | | | 1,671,886 | | | | 109,742,597 | |
Zoetis, Inc. | | | 361,174 | | | | 17,307,458 | |
| | | | | | | | | |
| | | | | | $ | 836,457,516 | |
| | | | | | | | | |
|
Professional Services — 0.1% | |
Equifax, Inc. | | | 8,854 | | | $ | 986,070 | |
Nielsen Holdings PLC | | | 72,356 | | | | 3,371,790 | |
On Assignment, Inc.(1) | | | 105,500 | | | | 4,732,740 | |
Verisk Analytics, Inc.(2) | | | 46,792 | | | | 3,597,369 | |
| | | | | | | | | |
| | | | | | $ | 12,687,969 | |
| | | | | | | | | |
|
Real Estate Investment Trusts (REITs) — 0.0%(3) | |
American Tower Corp. | | | 10,718 | | | $ | 1,039,110 | |
Communications Sales & Leasing, Inc. | | | 14,173 | | | | 264,893 | |
Host Hotels & Resorts, Inc. | | | 3,140 | | | | 48,168 | |
Simon Property Group, Inc. | | | 18,096 | | | | 3,518,586 | |
Weyerhaeuser Co. | | | 1,200 | | | | 35,976 | |
| | | | | | | | | |
| | | | | | $ | 4,906,733 | |
| | | | | | | | | |
|
Real Estate Management & Development — 0.0%(3) | |
Brookfield Asset Management, Inc., Class A | | | 8,547 | | | $ | 269,487 | |
| | | | | | | | | |
| | | | | | $ | 269,487 | |
| | | | | | | | | |
|
Road & Rail — 0.3% | |
CSX Corp. | | | 28,990 | | | $ | 752,290 | |
Kansas City Southern | | | 14,386 | | | | 1,074,203 | |
Norfolk Southern Corp. | | | 71,844 | | | | 6,077,284 | |
Union Pacific Corp. | | | 307,149 | | | | 24,019,052 | |
| | | | | | | | | |
| | | | | | $ | 31,922,829 | |
| | | | | | | | | |
|
Semiconductors & Semiconductor Equipment — 3.2% | |
Analog Devices, Inc. | | | 599,209 | | | $ | 33,148,242 | |
Applied Materials, Inc. | | | 100,000 | | | | 1,867,000 | |
Broadcom Corp., Class A | | | 52,688 | | | | 3,046,420 | |
Cypress Semiconductor Corp.(2) | | | 108,454 | | | | 1,063,934 | |
Intel Corp. | | | 6,754,454 | | | | 232,690,940 | |
Linear Technology Corp. | | | 68,494 | | | | 2,908,940 | |
Marvell Technology Group, Ltd. | | | 95,391 | | | | 841,349 | |
Microchip Technology, Inc. | | | 23,733 | | | | 1,104,534 | |
NVIDIA Corp. | | | 360,148 | | | | 11,870,478 | |
Texas Instruments, Inc. | | | 1,012,454 | | | | 55,492,604 | |
| | | | |
| | 34 | | See Notes to Financial Statements. |
Tax-Managed Growth Portfolio
December 31, 2015
Portfolio of Investments — continued
| | | | | | | | |
| Security | | Shares | | | Value | |
| | | | | | | | |
|
Semiconductors & Semiconductor Equipment (continued) | |
Xilinx, Inc. | | | 90,186 | | | $ | 4,236,036 | |
| | | | | | | | | |
| | | | | | $ | 348,270,477 | |
| | | | | | | | | |
|
Software — 3.8% | |
Activision Blizzard, Inc. | | | 218,092 | | | $ | 8,442,341 | |
Adobe Systems, Inc.(2) | | | 475,452 | | | | 44,663,961 | |
CA, Inc. | | | 7,339 | | | | 209,602 | |
Cadence Design Systems, Inc.(2) | | | 214,974 | | | | 4,473,609 | |
CDK Global, Inc. | | | 34,056 | | | | 1,616,638 | |
Check Point Software Technologies, Ltd.(2) | | | 150,000 | | | | 12,207,000 | |
FireEye, Inc.(2) | | | 82,732 | | | | 1,715,862 | |
Fortinet, Inc.(2) | | | 20,000 | | | | 623,400 | |
Infoblox, Inc.(2) | | | 41,046 | | | | 754,836 | |
Manhattan Associates, Inc.(2) | | | 7,486 | | | | 495,349 | |
Microsoft Corp. | | | 3,212,061 | | | | 178,205,144 | |
Oracle Corp. | | | 3,892,530 | | | | 142,194,121 | |
salesforce.com, inc.(2) | | | 1,745 | | | | 136,808 | |
ServiceNow, Inc.(2) | | | 182,216 | | | | 15,772,617 | |
Splunk, Inc.(2) | | | 100,000 | | | | 5,881,000 | |
Symantec Corp. | | | 72,900 | | | | 1,530,900 | |
Tableau Software, Inc., Class A(2) | | | 13,699 | | | | 1,290,720 | |
Workday, Inc., Class A(2) | | | 54,405 | | | | 4,334,990 | |
| | | | | | | | | |
| | | | | | $ | 424,548,898 | |
| | | | | | | | | |
|
Specialty Retail — 3.3% | |
AutoNation, Inc.(2) | | | 2,317 | | | $ | 138,232 | |
Bed Bath & Beyond, Inc.(2) | | | 7,000 | | | | 337,750 | |
Best Buy Co., Inc. | | | 133,011 | | | | 4,050,185 | |
Dick’s Sporting Goods, Inc. | | | 35,000 | | | | 1,237,250 | |
Gap, Inc. (The) | | | 89,138 | | | | 2,201,709 | |
GNC Holdings, Inc., Class A | | | 900 | | | | 27,918 | |
Home Depot, Inc. (The) | | | 960,872 | | | | 127,075,322 | |
L Brands, Inc. | | | 41,877 | | | | 4,012,654 | |
Lowe’s Companies, Inc. | | | 400,443 | | | | 30,449,686 | |
Ross Stores, Inc.(1) | | | 9,460 | | | | 509,043 | |
Ross Stores, Inc.(1) | | | 60,327 | | | | 3,245,547 | |
Ross Stores, Inc. | | | 71,306 | | | | 3,836,976 | |
Signet Jewelers, Ltd. | | | 65,332 | | | | 8,080,915 | |
Staples, Inc. | | | 144,626 | | | | 1,369,608 | |
Tiffany & Co. | | | 600 | | | | 45,774 | |
TJX Cos., Inc. (The) | | | 2,239,573 | | | | 158,808,121 | |
Tractor Supply Co. | | | 93,481 | | | | 7,992,625 | |
Ulta Salon, Cosmetics & Fragrance, Inc.(2) | | | 63,595 | | | | 11,765,075 | |
| | | | | | | | | |
| | | | | | $ | 365,184,390 | |
| | | | | | | | | |
| | | | | | | | |
| Security | | Shares | | | Value | |
| | | | | | | | |
|
Technology Hardware, Storage & Peripherals — 3.6% | |
Apple, Inc. | | | 3,329,939 | | | $ | 350,509,379 | |
EMC Corp. | | | 1,586,936 | | | | 40,752,516 | |
Hewlett Packard Enterprise Co. | | | 31,477 | | | | 478,450 | |
HP, Inc. | | | 31,477 | | | | 372,688 | |
NetApp, Inc. | | | 414,967 | | | | 11,009,075 | |
| | | | | | | | | |
| | | | | | $ | 403,122,108 | |
| | | | | | | | | |
|
Textiles, Apparel & Luxury Goods — 3.0% | |
Coach, Inc. | | | 10,800 | | | $ | 353,484 | |
Hanesbrands, Inc. | | | 997,238 | | | | 29,348,714 | |
NIKE, Inc., Class B | | | 4,709,690 | | | | 294,355,625 | |
VF Corp. | | | 36,058 | | | | 2,244,611 | |
| | | | | | | | | |
| | | | | | $ | 326,302,434 | |
| | | | | | | | | |
|
Tobacco — 0.4% | |
Altria Group, Inc. | | | 157,274 | | | $ | 9,154,920 | |
Philip Morris International, Inc. | | | 460,941 | | | | 40,521,323 | |
| | | | | | | | | |
| | | | | | $ | 49,676,243 | |
| | | | | | | | | |
|
Trading Companies & Distributors — 0.0%(3) | |
Fastenal Co. | | | 661 | | | $ | 26,982 | |
United Rentals, Inc.(2) | | | 2,000 | | | | 145,080 | |
| | | | | | | | | |
| | | | | | $ | 172,062 | |
| | | | | | | | | |
|
Wireless Telecommunication Services — 0.1% | |
America Movil SAB de CV ADR, Series L | | | 345,447 | | | $ | 4,856,985 | |
Sprint Corp.(2) | | | 135,160 | | | | 489,279 | |
Vodafone Group PLC ADR | | | 97,896 | | | | 3,158,125 | |
| | | | | | | | | |
| | | | | | $ | 8,504,389 | |
| | | | | | | | | |
| |
Total Common Stocks
(identified cost $6,020,617,885) | | | $ | 10,899,306,581 | |
| | | | | | | | | |
|
| Rights — 0.0%(3) | |
| | |
| | | | | | | | |
| Security | | Shares | | | Value | |
| | |
Pharmaceuticals — 0.0%(3) | | | | | | | | |
Sanofi, Exp. 12/31/20(2) | | | 6,984 | | | $ | 786 | |
| | | | | | | | | |
| |
Total Rights
(identified cost $16,440) | | | $ | 786 | |
| | | | | | | | | |
| | | | |
| | 35 | | See Notes to Financial Statements. |
Tax-Managed Growth Portfolio
December 31, 2015
Portfolio of Investments — continued
| | | | | | | | |
| Short-Term Investments — 1.3% | |
| | |
| | | | | | | | |
| Description | | Interest
(000’s omitted) | | | Value | |
| | | | | | | | |
Eaton Vance Cash Reserves Fund, LLC, 0.37%(4) | | $ | 143,572 | | | $ | 143,572,044 | |
| | | | | | | | | |
| |
Total Short-Term Investments
(identified cost $143,572,044) | | | $ | 143,572,044 | |
| | | | | | | | | |
| |
Total Investments — 99.9%
(identified cost $6,164,206,369) | | | $ | 11,042,879,411 | |
| | | | | | | | | |
| |
Other Assets, Less Liabilities — 0.1% | | | $ | 12,505,409 | |
| | | | | | | | | |
| |
Net Assets — 100.0% | | | $ | 11,055,384,820 | |
| | | | | | | | | |
The percentage shown for each investment category in the Portfolio of Investments is based on net assets.
| (1) | Restricted security (see Note 5). |
| (2) | Non-income producing security. |
| (3) | Amount is less than 0.05%. |
| (4) | Affiliated investment company, available to Eaton Vance portfolios and funds, which invests in high quality, U.S. dollar denominated money market instruments. The rate shown is the annualized seven-day yield as of December 31, 2015. |
Abbreviations:
| | | | |
| ADR | | – | | American Depositary Receipt |
| | | | |
| | 36 | | See Notes to Financial Statements. |
Tax-Managed Growth Portfolio
December 31, 2015
Statement of Assets and Liabilities
| | | | |
| Assets | | December 31, 2015 | |
Unaffiliated investments, at value (identified cost, $6,020,634,325) | | $ | 10,899,307,367 | |
Affiliated investment, at value (identified cost, $143,572,044) | | | 143,572,044 | |
Cash | | | 10,413 | |
Dividends receivable | | | 12,265,989 | |
Interest receivable from affiliated investment | | | 37,670 | |
Receivable for investments sold | | | 1,979,967 | |
Tax reclaims receivable | | | 3,053,583 | |
Total assets | | $ | 11,060,227,033 | |
|
| Liabilities | |
Payable to affiliates: | | | | |
Investment adviser fee | | $ | 4,129,961 | |
Trustees’ fees | | | 17,000 | |
Accrued expenses | | | 695,252 | |
Total liabilities | | $ | 4,842,213 | |
Net Assets applicable to investors’ interest in Portfolio | | $ | 11,055,384,820 | |
|
| Sources of Net Assets | |
Investors’ capital | | $ | 6,176,834,987 | |
Net unrealized appreciation | | | 4,878,549,833 | |
Total | | $ | 11,055,384,820 | |
| | | | |
| | 37 | | See Notes to Financial Statements. |
Tax-Managed Growth Portfolio
December 31, 2015
Statement of Operations
| | | | |
| Investment Income | | Year Ended December 31, 2015 | |
Dividends (net of foreign taxes, $1,675,505) | | $ | 204,101,957 | |
Interest allocated from affiliated investment | | | 264,432 | |
Expenses allocated from affiliated investment | | | (18,850 | ) |
Total investment income | | $ | 204,347,539 | |
| |
| Expenses | | | | |
Investment adviser fee | | $ | 48,180,067 | |
Trustees’ fees and expenses | | | 68,000 | |
Custodian fee | | | 1,611,239 | |
Professional fees | | | 289,293 | |
Miscellaneous | | | 310,354 | |
Total expenses | | $ | 50,458,953 | |
Deduct — | | | | |
Reduction of custodian fee | | $ | 73 | |
Total expense reductions | | $ | 73 | |
| |
Net expenses | | $ | 50,458,880 | |
| |
Net investment income | | $ | 153,888,659 | |
| |
| Realized and Unrealized Gain (Loss) | | | | |
Net realized gain (loss) — | | | | |
Investment transactions(1) | | $ | 302,075,060 | |
Investment transactions allocated from affiliated investment | | | 196 | |
Foreign currency transactions | | | (33,493 | ) |
Net realized gain | | $ | 302,041,763 | |
Change in unrealized appreciation (depreciation) — | | | | |
Investments | | $ | (194,026,970 | ) |
Foreign currency | | | (46,130 | ) |
Net change in unrealized appreciation (depreciation) | | $ | (194,073,100 | ) |
| |
Net realized and unrealized gain | | $ | 107,968,663 | |
| |
Net increase in net assets from operations | | $ | 261,857,322 | |
| (1) | Includes net realized gains of $295,777,082 from redemptions in-kind. |
| | | | |
| | 38 | | See Notes to Financial Statements. |
Tax-Managed Growth Portfolio
December 31, 2015
Statements of Changes in Net Assets
| | | | | | | | |
| | | Year Ended December 31, | |
| Increase (Decrease) in Net Assets | | 2015 | | | 2014 | |
From operations — | | | | | | | | |
Net investment income | | $ | 153,888,659 | | | $ | 140,633,457 | |
Net realized gain from investment and foreign currency transactions | | | 302,041,763 | | | | 394,327,081 | |
Net change in unrealized appreciation (depreciation) from investments and foreign currency | | | (194,073,100 | ) | | | 633,200,165 | |
Net increase in net assets from operations | | $ | 261,857,322 | | | $ | 1,168,160,703 | |
Capital transactions — | | | | | | | | |
Contributions | | $ | 1,134,112,358 | | | $ | 795,426,515 | |
Withdrawals | | | (886,281,300 | ) | | | (832,845,111 | ) |
Net increase (decrease) in net assets from capital transactions | | $ | 247,831,058 | | | $ | (37,418,596 | ) |
| | |
Net increase in net assets | | $ | 509,688,380 | | | $ | 1,130,742,107 | |
| | |
| Net Assets | | | | | | | | |
At beginning of year | | $ | 10,545,696,440 | | | $ | 9,414,954,333 | |
At end of year | | $ | 11,055,384,820 | | | $ | 10,545,696,440 | |
| | | | |
| | 39 | | See Notes to Financial Statements. |
Tax-Managed Growth Portfolio
December 31, 2015
Supplementary Data
| | | | | | | | | | | | | | | | | | | | |
| | | Year Ended December 31, | |
| Ratios/Supplemental Data | | 2015 | | | 2014 | | | 2013 | | | 2012 | | | 2011 | |
Ratios (as a percentage of average daily net assets): | | | | | | | | | | | | | | | | | | | | |
Expenses(1) | | | 0.47 | % | | | 0.47 | % | | | 0.48 | % | | | 0.48 | % | | | 0.48 | % |
Net investment income | | | 1.44 | % | | | 1.45 | % | | | 1.50 | % | | | 1.78 | % | | | 1.53 | % |
Portfolio Turnover | | | 9 | % | | | 8 | % | | | 3 | % | | | 2 | % | | | 2 | % |
| | | | | |
Total Return | | | 2.53 | % | | | 12.73 | % | | | 32.39 | % | | | 15.48 | % | | | 0.80 | % |
| | | | | |
Net assets, end of year (000’s omitted) | | $ | 11,055,385 | | | $ | 10,545,696 | | | $ | 9,414,954 | | | $ | 7,729,091 | | | $ | 8,072,683 | |
| (1) | Excludes the effect of custody fee credits, if any, of less than 0.005%. |
| | | | |
| | 40 | | See Notes to Financial Statements. |
Tax-Managed Growth Portfolio
December 31, 2015
Notes to Financial Statements
1 Significant Accounting Policies
Tax-Managed Growth Portfolio (the Portfolio) is a Massachusetts business trust registered under the Investment Company Act of 1940, as amended (the 1940 Act), as a diversified, open-end management investment company. The Portfolio’s investment objective is to achieve long-term, after-tax returns for interestholders through investing in a diversified portfolio of equity securities. The Declaration of Trust permits the Trustees to issue interests in the Portfolio. At December 31, 2015, Eaton Vance Tax-Managed Growth Fund 1.0, Eaton Vance Tax-Managed Growth Fund 1.1, Eaton Vance Tax-Managed Growth Fund 1.2 and Eaton Vance Tax-Managed Equity Asset Allocation Fund held an interest of 7.3%, 12.5%, 5.6%, and 1.2% respectively, in the Portfolio. In addition, an unregistered fund managed by the adviser to the Portfolio held an aggregate interest of 73.4% in the Portfolio.
The following is a summary of significant accounting policies of the Portfolio. The policies are in conformity with accounting principles generally accepted in the United States of America (U.S. GAAP). The Portfolio is an investment company and follows accounting and reporting guidance in the Financial Accounting Standards Board (FASB) Accounting Standards Codification Topic 946 “Financial Services — Investment Companies.”
A Investment Valuation — The following methodologies are used to determine the market value or fair value of investments.
Equity Securities. Equity securities listed on a U.S. securities exchange generally are valued at the last sale or closing price on the day of valuation or, if no sales took place on such date, at the mean between the closing bid and asked prices therefore on the exchange where such securities are principally traded. Equity securities listed on the NASDAQ Global or Global Select Market generally are valued at the NASDAQ official closing price. Unlisted or listed securities for which closing sales prices or closing quotations are not available are valued at the mean between the latest available bid and asked prices or, in the case of preferred equity securities that are not listed or traded in the over-the-counter market, by a third party pricing service that uses various techniques that consider factors including, but not limited to, prices or yields of securities with similar characteristics, benchmark yields, broker/dealer quotes, quotes of underlying common stock, issuer spreads, as well as industry and economic events.
Foreign Securities and Currencies. Foreign securities and currencies are valued in U.S. dollars, based on foreign currency exchange rate quotations supplied by a third party pricing service. The pricing service uses a proprietary model to determine the exchange rate. Inputs to the model include reported trades and implied bid/ask spreads. The daily valuation of exchange-traded foreign securities generally is determined as of the close of trading on the principal exchange on which such securities trade. Events occurring after the close of trading on foreign exchanges may result in adjustments to the valuation of foreign securities to more accurately reflect their fair value as of the close of regular trading on the New York Stock Exchange. When valuing foreign equity securities that meet certain criteria, the Portfolio’s Trustees have approved the use of a fair value service that values such securities to reflect market trading that occurs after the close of the applicable foreign markets of comparable securities or other instruments that have a strong correlation to the fair-valued securities.
Affiliated Fund. The Portfolio may invest in Eaton Vance Cash Reserves Fund, LLC (Cash Reserves Fund), an affiliated investment company managed by Eaton Vance Management (EVM). The value of the Portfolio’s investment in Cash Reserves Fund reflects the Portfolio’s proportionate interest in its net assets. Cash Reserves Fund generally values its investment securities utilizing the amortized cost valuation technique in accordance with Rule 2a-7 under the 1940 Act. This technique involves initially valuing a portfolio security at its cost and thereafter assuming a constant amortization to maturity of any discount or premium. If amortized cost is determined not to approximate fair value, Cash Reserves Fund may value its investment securities based on available market quotations provided by a third party pricing service.
Fair Valuation. Investments for which valuations or market quotations are not readily available or are deemed unreliable are valued at fair value using methods determined in good faith by or at the direction of the Trustees of the Portfolio in a manner that fairly reflects the security’s value, or the amount that the Portfolio might reasonably expect to receive for the security upon its current sale in the ordinary course. Each such determination is based on a consideration of relevant factors, which are likely to vary from one pricing context to another. These factors may include, but are not limited to, the type of security, the existence of any contractual restrictions on the security’s disposition, the price and extent of public trading in similar securities of the issuer or of comparable companies or entities, quotations or relevant information obtained from broker/dealers or other market participants, information obtained from the issuer, analysts, and/or the appropriate stock exchange (for exchange-traded securities), an analysis of the company’s or entity’s financial condition, and an evaluation of the forces that influence the issuer and the market(s) in which the security is purchased and sold.
B Investment Transactions — Investment transactions for financial statement purposes are accounted for on a trade date basis. Realized gains and losses on investments sold are determined on the basis of identified cost.
C Income — Dividend income is recorded on the ex-dividend date for dividends received in cash and/or securities. However, if the ex-dividend date has passed, certain dividends from foreign securities are recorded as the Portfolio is informed of the ex-dividend date. Withholding taxes on foreign dividends and capital gains have been provided for in accordance with the Portfolio’s understanding of the applicable countries’ tax rules and rates. Interest income is recorded on the basis of interest accrued, adjusted for amortization of premium or accretion of discount.
D Federal Taxes — The Portfolio has elected to be treated as a partnership for federal tax purposes. No provision is made by the Portfolio for federal or state taxes on any taxable income of the Portfolio because each investor in the Portfolio is ultimately responsible for the payment of any taxes on its share of taxable income. Since at least one of the Portfolio’s investors is a regulated investment company that invests all or substantially all of its assets in the Portfolio, the Portfolio normally must satisfy the applicable source of income and diversification requirements (under the Internal Revenue Code) in order for its investors to satisfy them. The Portfolio will allocate, at least annually among its investors, each investor’s distributive share of the Portfolio’s net investment income, net realized capital gains and losses, and any other items of income, gain, loss, deduction or credit.
Tax-Managed Growth Portfolio
December 31, 2015
Notes to Financial Statements — continued
As of December 31, 2015, the Portfolio had no uncertain tax positions that would require financial statement recognition, de-recognition, or disclosure. The Portfolio files a U.S. federal income tax return annually after its fiscal year-end, which is subject to examination by the Internal Revenue Service for a period of three years from the date of filing.
E Expense Reduction — State Street Bank and Trust Company (SSBT) serves as custodian of the Portfolio. Pursuant to the custodian agreement, SSBT receives a fee reduced by credits, which are determined based on the average daily cash balance the Portfolio maintains with SSBT. All credit balances, if any, used to reduce the Portfolio’s custodian fees are reported as a reduction of expenses in the Statement of Operations.
F Foreign Currency Translation — Investment valuations, other assets, and liabilities initially expressed in foreign currencies are translated each business day into U.S. dollars based upon current exchange rates. Purchases and sales of foreign investment securities and income and expenses denominated in foreign currencies are translated into U.S. dollars based upon currency exchange rates in effect on the respective dates of such transactions. Recognized gains or losses on investment transactions attributable to changes in foreign currency exchange rates are recorded for financial statement purposes as net realized gains and losses on investments. That portion of unrealized gains and losses on investments that results from fluctuations in foreign currency exchange rates is not separately disclosed.
G Use of Estimates — The preparation of the financial statements in conformity with U.S. GAAP requires management to make estimates and assumptions that affect the reported amounts of assets and liabilities at the date of the financial statements and the reported amounts of income and expense during the reporting period. Actual results could differ from those estimates.
H Indemnifications — Under the Portfolio’s organizational documents, its officers and Trustees may be indemnified against certain liabilities and expenses arising out of the performance of their duties to the Portfolio. Under Massachusetts law, if certain conditions prevail, interestholders in the Portfolio could be deemed to have personal liability for the obligations of the Portfolio. However, the Portfolio’s Declaration of Trust contains an express disclaimer of liability on the part of Portfolio interestholders and the By-laws provide that the Portfolio shall assume the defense on behalf of any Portfolio interestholder. Moreover, the By-laws also provide for indemnification out of Portfolio property of any interestholder held personally liable solely by reason of being or having been an interestholder for all loss or expense arising from such liability. Additionally, in the normal course of business, the Portfolio enters into agreements with service providers that may contain indemnification clauses. The Portfolio’s maximum exposure under these arrangements is unknown as this would involve future claims that may be made against the Portfolio that have not yet occurred.
2 Investment Adviser Fee and Other Transactions with Affiliates
The investment adviser fee is earned by Boston Management and Research (BMR), a subsidiary of EVM, as compensation for investment advisory services rendered to the Portfolio. Under the investment advisory agreement, BMR receives a monthly advisory fee at a rate of 0.625% annually of the Portfolio’s average daily net assets up to $500 million. The advisory fee on net assets of $500 million or more is reduced as follows:
| | | | |
| Average Daily Net Assets | | Annual Fee Rate
(for each level) | |
| |
$500 million but less than $1 billion | | | 0.5625 | % |
$1 billion but less than $1.5 billion | | | 0.5000 | % |
$1.5 billion but less than $7 billion | | | 0.4375 | % |
$7 billion but less than $10 billion | | | 0.4250 | % |
$10 billion but less than $15 billion | | | 0.4125 | % |
$15 billion but less than $20 billion | | | 0.4000 | % |
$20 billion but less than $25 billion | | | 0.3900 | % |
$25 billion and over | | | 0.3800 | % |
The Portfolio invests its cash in Cash Reserves Fund. EVM does not currently receive a fee for advisory services provided to Cash Reserves Fund. For the year ended December 31, 2015, the Portfolio’s investment adviser fee amounted to $48,180,067 or 0.45% of the Portfolio’s average daily net assets.
Officers and Trustees of the Portfolio who are members of EVM’s or BMR’s organizations receive remuneration for their services to the Portfolio out of the investment adviser fee. Trustees of the Portfolio who are not affiliated with the investment adviser may elect to defer receipt of all or a percentage of their annual fees in accordance with the terms of the Trustees Deferred Compensation Plan. For the year ended December 31, 2015, no significant amounts have been deferred. Certain officers and Trustees of the Portfolio are officers of the above organizations.
Tax-Managed Growth Portfolio
December 31, 2015
Notes to Financial Statements — continued
3 Purchases and Sales of Investments
Purchases and sales of investments, other than short-term obligations, aggregated $310,499,986 and $120,659,140, respectively, for the year ended December 31, 2015. In addition, investors contributed securities with a value of $1,041,922,912 and investments having an aggregate market value of $805,304,737 at dates of withdrawal were distributed in payment for capital withdrawals, during the year ended December 31, 2015.
4 Federal Income Tax Basis of Investments
The cost and unrealized appreciation (depreciation) of investments of the Portfolio at December 31, 2015, as determined on a federal income tax basis, were as follows:
| | | | |
| |
Aggregate cost | | $ | 2,078,560,427 | |
| |
Gross unrealized appreciation | | $ | 8,965,841,545 | |
Gross unrealized depreciation | | | (1,522,561 | ) |
| |
Net unrealized appreciation | | $ | 8,964,318,984 | |
The net unrealized depreciation on foreign currency transactions at December 31, 2015 on a federal income tax basis was $123,209.
5 Restricted Securities
At December 31, 2015, the Portfolio owned the following securities (representing 1.2% of net assets) which were restricted as to public resale and not registered under the Securities Act of 1933. The Portfolio has various registration rights (exercisable under a variety of circumstances) with respect to these securities. The value of these securities is determined based on valuations provided by brokers when available, or if not available, they are valued at fair value using methods determined in good faith by or at the direction of the Trustees.
| | | | | | | | | | | | | | | | | | | | |
| Common Stocks | | Date of Acquisition | | | Eligible for Resale | | | Shares | | | Cost | | | Value | |
| | | | | |
Agilent Technologies, Inc. | | | 6/18/15 | | | | 6/18/16 | | | | 172,823 | | | $ | 6,836,947 | | | $ | 7,225,730 | |
Alexion Pharmaceuticals, Inc. | | | 3/19/15 | | | | 3/19/16 | | | | 15,952 | | | | 3,000,028 | | | | 3,042,844 | |
Alexion Pharmaceuticals, Inc. | | | 6/18/15 | | | | 6/18/16 | | | | 27,835 | | | | 5,000,006 | | | | 5,309,526 | |
Antero Resources Corp | | | 12/17/15 | | | | 12/17/16 | | | | 535,000 | | | | 10,439,324 | | | | 11,260,627 | |
Arista Networks, Inc. | | | 9/17/15 | | | | 9/17/16 | | | | 327,000 | | | | 20,705,467 | | | | 25,415,499 | |
Cheniere Energy, Inc. | | | 6/18/15 | | | | 6/18/16 | | | | 14,169 | | | | 1,000,040 | | | | 527,795 | |
Dexcom, Inc. | | | 12/17/15 | | | | 12/17/16 | | | | 25,000 | | | | 2,050,090 | | | | 2,043,405 | |
Discover Financial Services | | | 6/18/15 | | | | 6/18/16 | | | | 84,984 | | | | 4,936,029 | | | | 4,556,842 | |
Dollar Tree, Inc. | | | 12/17/15 | | | | 12/17/16 | | | | 105,998 | | | | 8,357,860 | | | | 8,168,795 | |
Ford Motor Co. | | | 6/18/15 | | | | 6/18/16 | | | | 140,000 | | | | 2,100,697 | | | | 1,972,600 | |
LinkedIn Corp., Class A. | | | 9/17/15 | | | | 9/17/16 | | | | 190,000 | | | | 37,538,479 | | | | 42,756,647 | |
Marriott International, Inc., Class A | | | 3/19/15 | | | | 3/19/16 | | | | 240,419 | | | | 20,000,068 | | | | 16,117,690 | |
On Assignment, Inc. | | | 12/17/15 | | | | 12/17/16 | | | | 105,500 | | | | 4,717,016 | | | | 4,732,740 | |
Ross Stores, Inc. | | | 3/19/15 | | | | 3/19/16 | | | | 9,460 | | | | 500,089 | | | | 509,043 | |
Ross Stores, Inc. | | | 9/17/15 | | | | 9/17/16 | | | | 60,327 | | | | 3,000,068 | | | | 3,245,547 | |
| | | | | |
Total Restricted Securities | | | | | | | | | | | | | | $ | 130,182,208 | | | $ | 136,885,330 | |
6 Line of Credit
The Portfolio participates with other portfolios and funds managed by EVM and its affiliates in a $625 million unsecured line of credit agreement with a group of banks, which is in effect through September 2, 2016. Borrowings are made by the Portfolio solely to facilitate the handling of unusual and/or unanticipated short-term cash requirements. Interest is charged to the Portfolio based on its borrowings at an amount above either the Eurodollar rate or Federal Funds rate. In addition, a fee computed at an annual rate of 0.10% on the daily unused portion of the line of credit is allocated among the
Tax-Managed Growth Portfolio
December 31, 2015
Notes to Financial Statements — continued
participating portfolios and funds at the end of each quarter. Because the line of credit is not available exclusively to the Portfolio, it may be unable to borrow some or all of its requested amounts at any particular time. The Portfolio did not have any borrowings or significant allocated fees during the year ended December 31, 2015.
7 Fair Value Measurements
Under generally accepted accounting principles for fair value measurements, a three-tier hierarchy to prioritize the assumptions, referred to as inputs, is used in valuation techniques to measure fair value. The three-tier hierarchy of inputs is summarized in the three broad levels listed below.
| • | | Level 1 – quoted prices in active markets for identical investments |
| • | | Level 2 – other significant observable inputs (including quoted prices for similar investments, interest rates, prepayment speeds, credit risk, etc.) |
| • | | Level 3 – significant unobservable inputs (including a fund’s own assumptions in determining the fair value of investments) |
In cases where the inputs used to measure fair value fall in different levels of the fair value hierarchy, the level disclosed is determined based on the lowest level input that is significant to the fair value measurement in its entirety. The inputs or methodology used for valuing securities are not necessarily an indication of the risk associated with investing in those securities.
At December 31, 2015, the hierarchy of inputs used in valuing the Portfolio’s investments, which are carried at value, were as follows:
| | | | | | | | | | | | | | | | |
| Asset Description | | Level 1 | | | Level 2 | | | Level 3 | | | Total | |
| | | | |
Common Stocks | | | | | | | | | | | | | | | | |
Consumer Discretionary | | $ | 1,746,337,890 | | | $ | 11,414,342 | | | $ | — | | | $ | 1,757,752,232 | |
Consumer Staples | | | 1,071,625,735 | | | | 88,479,043 | | | | — | | | | 1,160,104,778 | |
Energy | | | 570,425,903 | | | | 11,260,627 | | | | — | | | | 581,686,530 | |
Financials | | | 1,792,547,742 | | | | 22,975,644 | | | | — | | | | 1,815,523,386 | |
Health Care | | | 1,700,425,555 | | | | 2,043,405 | | | | — | | | | 1,702,468,960 | |
Industrials | | | 1,095,665,427 | | | | 4,732,740 | | | | — | | | | 1,100,398,167 | |
Information Technology | | | 2,438,959,030 | | | | 68,172,146 | | | | — | | | | 2,507,131,176 | |
Materials | | | 209,459,092 | | | | 793,040 | | | | — | | | | 210,252,132 | |
Telecommunication Services | | | 48,825,343 | | | | — | | | | — | | | | 48,825,343 | |
Utilities | | | 15,163,877 | | | | — | | | | — | | | | 15,163,877 | |
| | | | |
Total Common Stocks | | $ | 10,689,435,594 | | | $ | 209,870,987 | * | | $ | — | | | $ | 10,899,306,581 | |
| | | | |
Rights | | $ | 786 | | | $ | — | | | $ | — | | | $ | 786 | |
Short-Term Investments | | | — | | | | 143,572,044 | | | | — | | | | 143,572,044 | |
| | | | |
Total Investments | | $ | 10,689,436,380 | | | $ | 353,443,031 | | | $ | — | | | $ | 11,042,879,411 | |
| * | Includes foreign equity securities whose values were adjusted to reflect market trading of comparable securities or other correlated instruments that occurred after the close of trading in their applicable foreign markets. |
Level 3 investments at the beginning and/or end of the period in relation to net assets were not significant and accordingly, a reconciliation of Level 3 assets for the year ended December 31, 2015 is not presented. At December 31, 2015, the value of investments transferred between Level 1 and Level 2 during the year ended was not significant.
Tax-Managed Growth Portfolio
December 31, 2015
Notes to Financial Statements — continued
8 Legal Proceedings
In November 2010, the Portfolio was named as defendant and a putative member of the proposed defendant class of shareholders in the case entitled Official Committee of Unsecured Creditors (UCC) of the Tribune Company v. FitzSimons, et al. as a result of its ownership of shares in the Tribune Company (Tribune) in 2007 when Tribune effected a leveraged buyout transaction (LBO) and was converted to a privately held company. The UCC, which has been replaced by a Litigation Trustee pursuant to Tribune’s plan of reorganization, seeks to recover payments of the proceeds of the LBO. This action is now part of a multi-district litigation proceeding in the Southern District of New York. The motion to dismiss was granted, and the plaintiff appealed. A decision on the appeal is expected in 2016. The value of the proceeds received by the Portfolio is approximately $48,237,000 (equal to 0.44% of net assets at December 31, 2015).
The Portfolio cannot predict the outcome of these proceedings or the effect, if any, on the Portfolio’s net asset value. The attorneys’ fees and costs related to these actions are expensed by the Portfolio as incurred.
Tax-Managed Growth Portfolio
December 31, 2015
Report of Independent Registered Public Accounting Firm
To the Trustees and Investors of Tax-Managed Growth Portfolio:
We have audited the accompanying statement of assets and liabilities of Tax-Managed Growth Portfolio (the “Portfolio”), including the portfolio of investments, as of December 31, 2015, and the related statement of operations for the year then ended, the statements of changes in net assets for each of the two years in the period then ended, and the supplementary data for each of the five years in the period then ended. These financial statements and supplementary data are the responsibility of the Portfolio’s management. Our responsibility is to express an opinion on these financial statements and supplementary data based on our audits.
We conducted our audits in accordance with the standards of the Public Company Accounting Oversight Board (United States). Those standards require that we plan and perform the audit to obtain reasonable assurance about whether the financial statements and supplementary data are free of material misstatement. The Portfolio is not required to have, nor were we engaged to perform, an audit of its internal control over financial reporting. Our audits included consideration of internal control over financial reporting as a basis for designing audit procedures that are appropriate in the circumstances, but not for the purpose of expressing an opinion on the effectiveness of the Portfolio’s internal control over financial reporting. Accordingly, we express no such opinion. An audit also includes examining, on a test basis, evidence supporting the amounts and disclosures in the financial statements, assessing the accounting principles used and significant estimates made by management, as well as evaluating the overall financial statement presentation. Our procedures included confirmation of securities owned as of December 31, 2015, by correspondence with the custodian and brokers; where replies were not received from brokers, we performed other auditing procedures. We believe that our audits provide a reasonable basis for our opinion.
In our opinion, such financial statements and supplementary data referred to above present fairly, in all material respects, the financial position of Tax-Managed Growth Portfolio as of December 31, 2015, the results of its operations for the year then ended, the changes in its net assets for each of the two years in the period then ended, and the supplementary data for each of the five years in the period then ended, in conformity with accounting principles generally accepted in the United States of America.
DELOITTE & TOUCHE LLP
Boston, Massachusetts
February 19, 2016
Eaton Vance
Tax-Managed Growth Fund 1.1
December 31, 2015
Management and Organization
Fund Management. The Trustees of Eaton Vance Mutual Funds Trust (the Trust) and Tax-Managed Growth Portfolio (the Portfolio) are responsible for the overall management and supervision of the Trust’s and Portfolio’s affairs. The Trustees and officers of the Trust and the Portfolio are listed below. Except as indicated, each individual has held the office shown or other offices in the same company for the last five years. Trustees and officers of the Trust and the Portfolio hold indefinite terms of office. The “Noninterested Trustees” consist of those Trustees who are not “interested persons” of the Trust and the Portfolio, as that term is defined under the 1940 Act. The business address of each Trustee and officer is Two International Place, Boston, Massachusetts 02110. As used below, “EVC” refers to Eaton Vance Corp., “EV” refers to Eaton Vance, Inc., “EVM” refers to Eaton Vance Management, “BMR” refers to Boston Management and Research, “EVMI” refers to Eaton Vance Management (International) Limited and “EVD” refers to Eaton Vance Distributors, Inc. EVC and EV are the corporate parent and trustee, respectively, of EVM and BMR. EVMI is an indirect, wholly-owned subsidiary of EVC. EVD is the Fund’s principal underwriter, the Portfolio’s placement agent and a wholly-owned subsidiary of EVC. Each officer affiliated with Eaton Vance may hold a position with other Eaton Vance affiliates that is comparable to his or her position with EVM listed below. Each Trustee oversees 174 portfolios in the Eaton Vance Complex (including all master and feeder funds in a master feeder structure). Each officer serves as an officer of certain other Eaton Vance funds. Each Trustee and officer serves until his or her successor is elected.
| | | | | | |
| Name and Year of Birth | | Position(s) with the Trust
and the
Portfolio | | Trustee Since(1) | | Principal Occupation(s) and Directorships During Past Five Years and Other Relevant Experience |
Interested Trustee | | | | | | |
Thomas E. Faust Jr. 1958 | | Trustee | | 2007 | | Chairman, Chief Executive Officer and President of EVC, Director and President of EV, Chief Executive Officer and President of EVM and BMR, and Director of EVD and EVMI. Trustee and/or officer of 174 registered investment companies. Mr. Faust is an interested person because of his positions with EVM, BMR, EVD, EVMI, EVC and EV, which are affiliates of the Trust and the Portfolio. Directorships in the Last Five Years.(2) Director of EVC and Hexavest Inc. (investment management firm). |
| | | |
| | | | | | |
Noninterested Trustees | | | | | | |
Scott E. Eston 1956 | | Trustee | | 2011 | | Private investor. Formerly held various positions at Grantham, Mayo, Van Otterloo and Co., L.L.C. (investment management firm) (1997-2009), including Chief Operating Officer (2002-2009), Chief Financial Officer (1997-2009) and Chairman of the Executive Committee (2002-2008); President and Principal Executive Officer, GMO Trust (open-end registered investment company) (2006-2009). Former Partner, Coopers and Lybrand L.L.P. (now PricewaterhouseCoopers) (an independent registered public accounting firm) (1987-1997). Directorships in the Last Five Years.(2) None. |
Cynthia E. Frost 1961 | | Trustee | | 2014 | | Private investor. Formerly, Chief Investment Officer of Brown University (university endowment) (2000-2012); Portfolio Strategist for Duke Management Company (university endowment manager) (1995-2000); Managing Director, Cambridge Associates (investment consulting company) (1989-1995); Consultant, Bain and Company (management consulting firm) (1987-1989); Senior Equity Analyst, BA Investment Management Company (1983-1985). Directorships in the Last Five Years. None. |
George J. Gorman 1952 | | Trustee | | 2014 | | Principal at George J. Gorman LLC (consulting firm). Formerly, Senior Partner at Ernst & Young LLP (public accounting firm) (1974-2009). Directorships in the Last Five Years. Formerly, Trustee of the Bank of America Money Market Funds Series Trust (2011-2014) and of the Ashmore Funds (2010-2014). |
Valerie A. Mosley 1960 | | Trustee | | 2014 | | Chairwoman and Chief Executive Officer of Valmo Ventures (a consulting and investment firm). Former Partner and Senior Vice President, Portfolio Manager and Investment Strategist at Wellington Management Company, LLP (investment management firm) (1992-2012). Former Chief Investment Officer, PG Corbin Asset Management (1990-1992). Formerly worked in institutional corporate bond sales at Kidder Peabody (1986-1990). Directorships in the Last Five Years.(2) Director of Dynex Capital, Inc. (mortgage REIT) (since 2013). |
Eaton Vance
Tax-Managed Growth Fund 1.1
December 31, 2015
Management and Organization — continued
| | | | | | |
| Name and Year of Birth | | Position(s) with the Trust
and the
Portfolio | | Trustee Since(1) | | Principal Occupation(s) and Directorships During Past Five Years and Other Relevant Experience |
Noninterested Trustees (continued) | | |
| | | |
William H. Park 1947 | | Vice-Chairperson of the Board and Trustee | | 2016 (Vice-Chairperson) and 2003 (Trustee) | | Private investor. Formerly, Consultant (2012-2014). Formerly, Chief Financial Officer, Aveon Group L.P. (investment management firm) (2010-2011). Formerly, Vice Chairman, Commercial Industrial Finance Corp. (specialty finance company) (2006-2010). Formerly, President and Chief Executive Officer, Prizm Capital Management, LLC (investment management firm) (2002-2005). Formerly, Executive Vice President and Chief Financial Officer, United Asset Management Corporation (investment management firm) (1982-2001). Formerly, Senior Manager, Price Waterhouse (now PricewaterhouseCoopers) (an independent registered public accounting firm) (1972-1981). Directorships in the Last Five Years.(2) None. |
| | | |
Helen Frame Peters 1948 | | Trustee | | 2008 | | Professor of Finance, Carroll School of Management, Boston College. Formerly, Dean, Carroll School of Management, Boston College (2000-2002). Formerly, Chief Investment Officer, Fixed Income, Scudder Kemper Investments (investment management firm) (1998-1999). Formerly, Chief Investment Officer, Equity and Fixed Income, Colonial Management Associates (investment management firm) (1991-1998). Directorships in the Last Five Years.(2) Formerly, Director of BJ’s Wholesale Club, Inc. (wholesale club retailer) (2004-2011). Formerly, Trustee of SPDR Index Shares Funds and SPDR Series Trust (exchange traded funds) (2000-2009). Formerly, Director of Federal Home Loan Bank of Boston (a bank for banks) (2007-2009). |
| | | |
Susan J. Sutherland(3) 1957 | | Trustee | | 2015 | | Private investor. Formerly, Associate, Counsel and Partner at Skadden, Arps, Slate, Meagher & Flom LLP (law firm) (1982-2013). Directorships in the Last Five Years. Formerly, Director of Montpelier Re Holdings Ltd. (global provider of customized insurance and reinsurance products) (2013-2015). |
| | | |
Harriett Tee Taggart 1948 | | Trustee | | 2011 | | Managing Director, Taggart Associates (a professional practice firm). Formerly, Partner and Senior Vice President, Wellington Management Company, LLP (investment management firm) (1983-2006). Directorships in the Last Five Years.(2) Director of Albemarle Corporation (chemicals manufacturer) (since 2007) and The Hanover Group (specialty property and casualty insurance company) (since 2009). Formerly, Director of Lubrizol Corporation (specialty chemicals) (2007-2011). |
| | | |
Ralph F. Verni 1943 | | Chairperson of the Board and Trustee | | 2007 (Chairperson) and 2005 (Trustee) | | Consultant and private investor. Formerly, Chief Investment Officer (1982-1992), Chief Financial Officer (1988-1990) and Director (1982-1992), New England Life. Formerly, Chairperson, New England Mutual Funds (1982-1992). Formerly, President and Chief Executive Officer, State Street Management & Research (1992-2000). Formerly, Chairperson, State Street Research Mutual Funds (1992-2000). Formerly, Director, W.P. Carey, LLC (1998-2004) and First Pioneer Farm Credit Corp. (2002-2006). Directorships in the Last Five Years.(2) None. |
| | | |
| | | | | | |
Principal Officers who are not Trustees |
| Name and Year of Birth | | Position(s) with the Trust and the Portfolio | | Officer
Since(4) | | Principal Occupation(s) During Past Five Years |
| | | |
Payson F. Swaffield 1956 | | President of the Trust | | 2003 | | Vice President and Chief Income Investment Officer of EVM and BMR. |
| | | |
Lewis R. Piantedosi 1965 | | President of the Portfolio | | 2002 | | Vice President of EVM and BMR. |
| | | |
Maureen A. Gemma 1960 | | Vice President, Secretary and Chief Legal Officer | | 2005 | | Vice President of EVM and BMR. |
Eaton Vance
Tax-Managed Growth Fund 1.1
December 31, 2015
Management and Organization — continued
| | | | | | |
| Name and Year of Birth | | Position(s) with the Trust and the Portfolio | | Officer
Since(4) | | Principal Occupation(s) During Past Five Years |
Principal Officers who are not Trustees (continued) |
| | | |
James F. Kirchner 1967 | | Treasurer | | 2007 | | Vice President of EVM and BMR. |
| | | |
Paul M. O’Neil 1953 | | Chief Compliance Officer | | 2004 | | Vice President of EVM and BMR. |
| (1) | Year first appointed to serve as Trustee for a fund in the Eaton Vance family of funds. Each Trustee has served continuously since appointment unless indicated otherwise. |
| (2) | During their respective tenures, the Trustees (except for Mmes. Frost and Sutherland and Mr. Gorman) also served as Board members of one or more of the following funds (which operated in the years noted): eUnitsTM 2 Year U.S. Market Participation Trust: Upside to Cap / Buffered Downside (launched in 2012 and terminated in 2014); eUnitsTM 2 Year U.S. Market Participation Trust II: Upside to Cap / Buffered Downside (launched in 2012 and terminated in 2014); and Eaton Vance National Municipal Income Trust (launched in 1998 and terminated in 2009). However, Ms. Mosley did not serve as a Board member of eUnitsTM 2 Year U.S. Market Participation Trust: Upside to Cap / Buffered Downside (launched in 2012 and terminated in 2014). |
| (3) | Ms. Sutherland began serving as a Trustee effective May 1, 2015. |
| (4) | Year first elected to serve as officer of a fund in the Eaton Vance family of funds when the officer has served continuously. Otherwise, year of most recent election as an officer of a fund in the Eaton Vance family of funds. Titles may have changed since initial election. |
The SAI for the Fund includes additional information about the Trustees and officers of the Fund and the Portfolio and can be obtained without charge on Eaton Vance’s website at www.eatonvance.com or by calling 1-800-262-1122.
Eaton Vance
Tax-Managed Growth Fund 1.2
December 31, 2015
Management and Organization
Fund Management. The Trustees of Eaton Vance Mutual Funds Trust (the Trust) and Tax-Managed Growth Portfolio (the Portfolio) are responsible for the overall management and supervision of the Trust’s and Portfolio’s affairs. The Trustees and officers of the Trust and the Portfolio are listed below. Except as indicated, each individual has held the office shown or other offices in the same company for the last five years. Trustees and officers of the Trust and the Portfolio hold indefinite terms of office. The “Noninterested Trustees” consist of those Trustees who are not “interested persons” of the Trust and the Portfolio, as that term is defined under the 1940 Act. The business address of each Trustee and officer is Two International Place, Boston, Massachusetts 02110. As used below, “EVC” refers to Eaton Vance Corp., “EV” refers to Eaton Vance, Inc., “EVM” refers to Eaton Vance Management, “BMR” refers to Boston Management and Research, “EVMI” refers to Eaton Vance Management (International) Limited and “EVD” refers to Eaton Vance Distributors, Inc. EVC and EV are the corporate parent and trustee, respectively, of EVM and BMR. EVMI is an indirect, wholly-owned subsidiary of EVC. EVD is the Fund’s principal underwriter, the Portfolio’s placement agent and a wholly-owned subsidiary of EVC. Each officer affiliated with Eaton Vance may hold a position with other Eaton Vance affiliates that is comparable to his or her position with EVM listed below. Each Trustee oversees 174 portfolios in the Eaton Vance Complex (including all master and feeder funds in a master feeder structure). Each officer serves as an officer of certain other Eaton Vance funds. Each Trustee and officer serves until his or her successor is elected.
| | | | | | |
| Name and Year of Birth | | Position(s) with the Trust
and the Portfolio | | Trustee Since(1) | | Principal Occupation(s) and Directorships During Past Five Years and Other Relevant Experience |
Interested Trustee | | | | | | |
| | | |
Thomas E. Faust Jr. 1958 | | Trustee | | 2007 | | Chairman, Chief Executive Officer and President of EVC, Director and President of EV, Chief Executive Officer and President of EVM and BMR, and Director of EVD and EVMI. Trustee and/or officer of 174 registered investment companies. Mr. Faust is an interested person because of his positions with EVM, BMR, EVD, EVMI, EVC and EV, which are affiliates of the Trust and the Portfolio. Directorships in the Last Five Years.(2) Director of EVC and Hexavest Inc. (investment management firm). |
| | | |
| | | | | | |
Noninterested Trustees | | | | | | |
| | | |
Scott E. Eston 1956 | | Trustee | | 2011 | | Private investor. Formerly held various positions at Grantham, Mayo, Van Otterloo and Co., L.L.C. (investment management firm) (1997-2009), including Chief Operating Officer (2002-2009), Chief Financial Officer (1997-2009) and Chairman of the Executive Committee (2002-2008); President and Principal Executive Officer, GMO Trust (open-end registered investment company) (2006-2009). Former Partner, Coopers and Lybrand L.L.P. (now PricewaterhouseCoopers) (an independent registered public accounting firm) (1987-1997). Directorships in the Last Five Years.(2) None. |
| | | |
Cynthia E. Frost 1961 | | Trustee | | 2014 | | Private investor. Formerly, Chief Investment Officer of Brown University (university endowment) (2000-2012); Portfolio Strategist for Duke Management Company (university endowment manager) (1995-2000); Managing Director, Cambridge Associates (investment consulting company) (1989-1995); Consultant, Bain and Company (management consulting firm) (1987-1989); Senior Equity Analyst, BA Investment Management Company (1983-1985). Directorships in the Last Five Years. None. |
| | | |
George J. Gorman 1952 | | Trustee | | 2014 | | Principal at George J. Gorman LLC (consulting firm). Formerly, Senior Partner at Ernst & Young LLP (public accounting firm) (1974-2009). Directorships in the Last Five Years. Formerly, Trustee of the Bank of America Money Market Funds Series Trust (2011-2014) and of the Ashmore Funds (2010-2014). |
| | | |
Valerie A. Mosley 1960 | | Trustee | | 2014 | | Chairwoman and Chief Executive Officer of Valmo Ventures (a consulting and investment firm). Former Partner and Senior Vice President, Portfolio Manager and Investment Strategist at Wellington Management Company, LLP (investment management firm) (1992-2012). Former Chief Investment Officer, PG Corbin Asset Management (1990-1992). Formerly worked in institutional corporate bond sales at Kidder Peabody (1986-1990). Directorships in the Last Five Years.(2) Director of Dynex Capital, Inc. (mortgage REIT) (since 2013). |
Eaton Vance
Tax-Managed Growth Fund 1.2
December 31, 2015
Management and Organization — continued
| | | | | | |
| Name and Year of Birth | | Position(s) with the Trust
and the Portfolio | | Trustee Since(1) | | Principal Occupation(s) and Directorships During Past Five Years and Other Relevant Experience |
Noninterested Trustees (continued) | | |
| | | |
William H. Park 1947 | | Vice-Chairperson of the Board and Trustee | | 2016 (Vice-Chairperson) and 2003 (Trustee) | | Private investor. Formerly, Consultant (2012-2014). Formerly, Chief Financial Officer, Aveon Group L.P. (investment management firm) (2010-2011). Formerly, Vice Chairman, Commercial Industrial Finance Corp. (specialty finance company) (2006-2010). Formerly, President and Chief Executive Officer, Prizm Capital Management, LLC (investment management firm) (2002-2005). Formerly, Executive Vice President and Chief Financial Officer, United Asset Management Corporation (investment management firm) (1982-2001). Formerly, Senior Manager, Price Waterhouse (now PricewaterhouseCoopers) (an independent registered public accounting firm) (1972-1981). Directorships in the Last Five Years.(2) None. |
| | | |
Helen Frame Peters 1948 | | Trustee | | 2008 | | Professor of Finance, Carroll School of Management, Boston College. Formerly, Dean, Carroll School of Management, Boston College (2000-2002). Formerly, Chief Investment Officer, Fixed Income, Scudder Kemper Investments (investment management firm) (1998-1999). Formerly, Chief Investment Officer, Equity and Fixed Income, Colonial Management Associates (investment management firm) (1991-1998). Directorships in the Last Five Years.(2) Formerly, Director of BJ’s Wholesale Club, Inc. (wholesale club retailer) (2004-2011). Formerly, Trustee of SPDR Index Shares Funds and SPDR Series Trust (exchange traded funds) (2000-2009). Formerly, Director of Federal Home Loan Bank of Boston (a bank for banks) (2007-2009). |
| | | |
Susan J. Sutherland(3) 1957 | | Trustee | | 2015 | | Private investor. Formerly, Associate, Counsel and Partner at Skadden, Arps, Slate, Meagher & Flom LLP (law firm) (1982-2013). Directorships in the Last Five Years. Formerly, Director of Montpelier Re Holdings Ltd. (global provider of customized insurance and reinsurance products) (2013-2015). |
| | | |
Harriett Tee Taggart 1948 | | Trustee | | 2011 | | Managing Director, Taggart Associates (a professional practice firm). Formerly, Partner and Senior Vice President, Wellington Management Company, LLP (investment management firm) (1983-2006). Directorships in the Last Five Years.(2) Director of Albemarle Corporation (chemicals manufacturer) (since 2007) and The Hanover Group (specialty property and casualty insurance company) (since 2009). Formerly, Director of Lubrizol Corporation (specialty chemicals) (2007-2011). |
| | | |
Ralph F. Verni 1943 | | Chairperson of the Board and Trustee | | 2007 (Chairperson) and 2005 (Trustee) | | Consultant and private investor. Formerly, Chief Investment Officer (1982-1992), Chief Financial Officer (1988-1990) and Director (1982-1992), New England Life. Formerly, Chairperson, New England Mutual Funds (1982-1992). Formerly, President and Chief Executive Officer, State Street Management & Research (1992-2000). Formerly, Chairperson, State Street Research Mutual Funds (1992-2000). Formerly, Director, W.P. Carey, LLC (1998-2004) and First Pioneer Farm Credit Corp. (2002-2006). Directorships in the Last Five Years.(2) None. |
| | | |
| | | | | | |
Principal Officers who are not Trustees |
| Name and Year of Birth | | Position(s) with the Trust and the Portfolio | | Officer
Since(4) | | Principal Occupation(s) During Past Five Years |
| | | |
Payson F. Swaffield 1956 | | President of the Trust | | 2003 | | Vice President and Chief Income Investment Officer of EVM and BMR. |
| | | |
Lewis R. Piantedosi 1965 | | President of the Portfolio | | 2002 | | Vice President of EVM and BMR. |
Eaton Vance
Tax-Managed Growth Fund 1.2
December 31, 2015
Management and Organization — continued
| | | | | | |
| Name and Year of Birth | | Position(s) with the Trust and the Portfolio | | Officer
Since(4) | | Principal Occupation(s) During Past Five Years |
Principal Officers who are not Trustees (continued) |
| | | |
Maureen A. Gemma 1960 | | Vice President, Secretary and Chief Legal Officer | | 2005 | | Vice President of EVM and BMR. |
| | | |
James F. Kirchner 1967 | | Treasurer | | 2007 | | Vice President of EVM and BMR. |
| | | |
Paul M. O’Neil 1953 | | Chief Compliance Officer | | 2004 | | Vice President of EVM and BMR. |
| (1) | Year first appointed to serve as Trustee for a fund in the Eaton Vance family of funds. Each Trustee has served continuously since appointment unless indicated otherwise. |
| (2) | During their respective tenures, the Trustees (except for Mmes. Frost and Sutherland and Mr. Gorman) also served as Board members of one or more of the following funds (which operated in the years noted): eUnitsTM 2 Year U.S. Market Participation Trust: Upside to Cap / Buffered Downside (launched in 2012 and terminated in 2014); eUnitsTM 2 Year U.S. Market Participation Trust II: Upside to Cap / Buffered Downside (launched in 2012 and terminated in 2014); and Eaton Vance National Municipal Income Trust (launched in 1998 and terminated in 2009). However, Ms. Mosley did not serve as a Board member of eUnitsTM 2 Year U.S. Market Participation Trust: Upside to Cap / Buffered Downside (launched in 2012 and terminated in 2014). |
| (3) | Ms. Sutherland began serving as a Trustee effective May 1, 2015. |
| (4) | Year first elected to serve as officer of a fund in the Eaton Vance family of funds when the officer has served continuously. Otherwise, year of most recent election as an officer of a fund in the Eaton Vance family of funds. Titles may have changed since initial election. |
The SAI for the Fund includes additional information about the Trustees and officers of the Fund and the Portfolio and can be obtained without charge on Eaton Vance’s website at www.eatonvance.com or by calling 1-800-262-1122.
Eaton Vance Funds
IMPORTANT NOTICES
Privacy. The Eaton Vance organization is committed to ensuring your financial privacy. Each of the financial institutions identified below has in effect the following policy (“Privacy Policy”) with respect to nonpublic personal information about its customers:
| • | | Only such information received from you, through application forms or otherwise, and information about your Eaton Vance fund transactions will be collected. This may include information such as name, address, social security number, tax status, account balances and transactions. |
| • | | None of such information about you (or former customers) will be disclosed to anyone, except as permitted by law (which includes disclosure to employees necessary to service your account). In the normal course of servicing a customer’s account, Eaton Vance may share information with unaffiliated third parties that perform various required services such as transfer agents, custodians and broker-dealers. |
| • | | Policies and procedures (including physical, electronic and procedural safeguards) are in place that are designed to protect the confidentiality of such information. |
| • | | We reserve the right to change our Privacy Policy at any time upon proper notification to you. Customers may want to review our Privacy Policy periodically for changes by accessing the link on our homepage: www.eatonvance.com. |
Our pledge of privacy applies to the following entities within the Eaton Vance organization: the Eaton Vance Family of Funds, Eaton Vance Management, Eaton Vance Investment Counsel, Eaton Vance Distributors, Inc., Eaton Vance Trust Company, Eaton Vance Management (International) Limited, Eaton Vance Management’s Real Estate Investment Group and Boston Management and Research. In addition, our Privacy Policy applies only to those Eaton Vance customers who are individuals and who have a direct relationship with us. If a customer’s account (i.e., fund shares) is held in the name of a third-party financial advisor/broker-dealer, it is likely that only such advisor’s privacy policies apply to the customer. This notice supersedes all previously issued privacy disclosures. For more information about Eaton Vance’s Privacy Policy, please call 1-800-262-1122.
Delivery of Shareholder Documents. The Securities and Exchange Commission (SEC) permits funds to deliver only one copy of shareholder documents, including prospectuses, proxy statements and shareholder reports, to fund investors with multiple accounts at the same residential or post office box address. This practice is often called “householding” and it helps eliminate duplicate mailings to shareholders. Eaton Vance, or your financial advisor, may household the mailing of your documents indefinitely unless you instruct Eaton Vance, or your financial advisor, otherwise. If you would prefer that your Eaton Vance documents not be householded, please contact Eaton Vance at 1-800-262-1122, or contact your financial advisor. Your instructions that householding not apply to delivery of your Eaton Vance documents will be effective within 30 days of receipt by Eaton Vance or your financial advisor.
Portfolio Holdings. Each Eaton Vance Fund and its underlying Portfolio(s) (if applicable) will file a schedule of portfolio holdings on Form N-Q with the SEC for the first and third quarters of each fiscal year. The Form N-Q will be available on the Eaton Vance website at www.eatonvance.com, by calling Eaton Vance at 1-800-262-1122 or in the EDGAR database on the SEC’s website at www.sec.gov. Form N-Q may also be reviewed and copied at the SEC’s public reference room in Washington, D.C. (call 1-800-732-0330 for information on the operation of the public reference room).
Proxy Voting. From time to time, funds are required to vote proxies related to the securities held by the funds. The Eaton Vance Funds or their underlying Portfolios (if applicable) vote proxies according to a set of policies and procedures approved by the Funds’ and Portfolios’ Boards. You may obtain a description of these policies and procedures and information on how the Funds or Portfolios voted proxies relating to portfolio securities during the most recent 12-month period ended June 30, without charge, upon request, by calling 1-800-262-1122 and by accessing the SEC’s website at www.sec.gov.
This Page Intentionally Left Blank
This Page Intentionally Left Blank
This Page Intentionally Left Blank
Investment Adviser of Tax-Managed Growth Portfolio
Boston Management and Research
Two International Place
Boston, MA 02110
Administrator of Eaton Vance Tax-Managed Growth Funds 1.1 and 1.2
Eaton Vance Management
Two International Place
Boston, MA 02110
Principal Underwriter*
Eaton Vance Distributors, Inc.
Two International Place
Boston, MA 02110
(617) 482-8260
Custodian
State Street Bank and Trust Company
State Street Financial Center, One Lincoln Street
Boston, MA 02111
Transfer Agent
BNY Mellon Investment Servicing (US) Inc.
Attn: Eaton Vance Funds
P.O. Box 9653
Providence, RI 02940-9653
(800) 262-1122
Independent Registered Public Accounting Firm
Deloitte & Touche LLP
200 Berkeley Street
Boston, MA 02116-5022
Fund Offices
Two International Place
Boston, MA 02110
| * | FINRA BrokerCheck. Investors may check the background of their Investment Professional by contacting the Financial Industry Regulatory Authority (FINRA). FINRA BrokerCheck is a free tool to help investors check the professional background of current and former FINRA-registered securities firms and brokers. FINRA BrokerCheck is available by calling 1-800-289-9999 and at www.FINRA.org. The FINRA BrokerCheck brochure describing this program is available to investors at www.FINRA.org. |
4966 12.31.15

Parametric Commodity Strategy Fund
Annual Report
December 31, 2015

Commodity Futures Trading Commission Registration. Effective December 31, 2012, the Commodity Futures Trading Commission (“CFTC”) adopted certain regulatory changes that subject registered investment companies and advisers to regulation by the CFTC if a fund invests more than a prescribed level of its assets in certain CFTC-regulated instruments (including futures, certain options and swap agreements) or markets itself as providing investment exposure to such instruments. The Fund is considered to be a commodity pool operator under CFTC regulations. The Fund’s adviser and sub-adviser are registered with the CFTC as commodity pool operators and commodity trading advisors. The CFTC has neither reviewed nor approved the Fund’s investment strategies.
Fund shares are not insured by the FDIC and are not deposits or other obligations of, or guaranteed by, any depository institution. Shares are subject to investment risks, including possible loss of principal invested.
This report must be preceded or accompanied by a current summary prospectus or prospectus. Before investing, investors should consider carefully the investment objective, risks, and charges and expenses of a mutual fund. This and other important information is contained in the summary prospectus and prospectus, which can be obtained from a financial advisor. Prospective investors should read the prospectus carefully before investing. For further information, please call 1-800-260-0761.
Annual Report December 31, 2015
Parametric Commodity Strategy Fund
Table of Contents
| | | | |
Management’s Discussion of Fund Performance | | | 2 | |
| |
Performance | | | 3 | |
| |
Fund Profile | | | 4 | |
| |
Endnotes and Additional Disclosures | | | 5 | |
| |
Fund Expenses | | | 6 | |
| |
Financial Statements | | | 7 | |
| |
Report of Independent Registered Public Accounting Firm | | | 21 | |
| |
Federal Tax Information | | | 22 | |
| |
Management and Organization | | | 23 | |
| |
Important Notices | | | 26 | |
Parametric Commodity Strategy Fund
December 31, 2015
Management’s Discussion of Fund Performance1
Economic and Market Conditions
The commodity asset class, as measured by the Bloomberg Commodity Index Total Return2 remained highly volatile over the course of 2015. Commodity prices struggled in the first quarter, recovered slightly in the spring, then dropped sharply over the second half of the year. This decline was widespread, with all but one commodity in the Index dropping for the year, as most commodity markets found themselves facing ample supplies and declining demand in the face of economic slowdowns in China and Europe.
Energy was the largest decliner during the 12-month period, primarily on the back of dropping crude oil prices. This was due to the continued strength of crude oil supplies from North American oilfields, new exports of crude oil from Iran and the reluctance of the Organization of Petroleum Exporting Countries (OPEC) to cut production targets, despite falling prices. Gasoline and gas oil prices broadly mirrored the decline in the price of crude oil, one of the main inputs in producing both commodities.
Industrial metals similarly experienced ongoing weakness over the course of 2015, as increased output and diminishing demand from China resulted in an over-supplied market, with aluminum, copper, zinc and nickel declining by more than 20% for the year.
Grains and precious metals also dropped over the year. Wheat, corn and soybeans had their third consecutive year of strong harvests this fall, resulting in ample supplies and lower prices, while precious metals dropped on the increasing strength of the dollar.
Fund Performance
For the fiscal year ended December 31, 2015, Parametric Commodity Strategy Fund (the Fund) Investor Class shares had a total return of -22.36% at net asset value (NAV), outperforming the Fund’s benchmark, the Bloomberg Commodity Index Total Return (the Index), which had a total return of -24.66% during the same period.
The main contributors to Fund returns versus the Index were the Fund’s large underweight to Brent and WTI crude oil. Both commodities saw a sharp decline in price over the year, primarily due to the continued strength in global supply and declining demand. In addition, the Fund benefited from its overweight to silver. Finally, non-Index holdings contributed
to Fund performance versus the Index, as the portfolio gained from the relative outperformance of cocoa and lead.
The largest detractor from the Fund’s relative performance versus the Index was its overweight position in gas oil. The plunge in crude oil prices in the fourth quarter was echoed in the price of this commodity. An overweight to nickel also detracted from relative performance, as this key ingredient for stainless steel dropped more than 40% in the face of collapsing demand from China. In addition, an underweight to gold hurt relative performance versus the Index, as it was one of the strongest-performing commodities of 2015.
See Endnotes and Additional Disclosures in this report.
Past performance is no guarantee of future results. Returns are historical and are calculated by determining the percentage change in net asset value (NAV) or offering price (as applicable) with all distributions reinvested. Investment return and principal value will fluctuate so that shares, when redeemed, may be worth more or less than their original cost. Performance less than one year is cumulative. Performance is for the stated time period only; due to market volatility, the Fund’s current performance may be lower or higher than quoted. Returns are before taxes unless otherwise noted. For performance as of the most recent month-end, please refer to eatonvance.com.
Parametric Commodity Strategy Fund
December 31, 2015
Performance2,3
Portfolio Managers Thomas C. Seto and Timothy W. Atwill, Ph.D., CFA, each of Parametric Portfolio Associates, LLC
| | | | | | | | | | | | | | | | | | | | |
| % Average Annual Total Returns | | Class Inception Date | | | Performance Inception Date | | | One Year | | | Five Years | | | Since Inception | |
Investor Class at NAV | | | 01/03/2012 | | | | 05/25/2011 | | | | –22.36 | % | | | — | | | | –13.24 | % |
Institutional Class at NAV | | | 05/25/2011 | | | | 05/25/2011 | | | | –22.22 | | | | — | | | | –13.06 | |
Bloomberg Commodity Index Total Return | | | — | | | | — | | | | –24.66 | % | | | –13.46 | % | | | –14.70 | % |
| | | | | |
| | | | | | | | | | | | | | | | | | | | |
| % Total Annual Operating Expense Ratios4 | | | | | | | | | | | Investor Class | | | Institutional Class | |
Gross | | | | | | | | | | | | | | | 1.24 | % | | | 0.99 | % |
Net | | | | | | | | | | | | | | | 0.95 | | | | 0.70 | |
Growth of $10,000
This graph shows the change in value of a hypothetical investment of $10,000 in Investor Class of the Fund for the period indicated. For comparison, the same investment is shown in the indicated index.
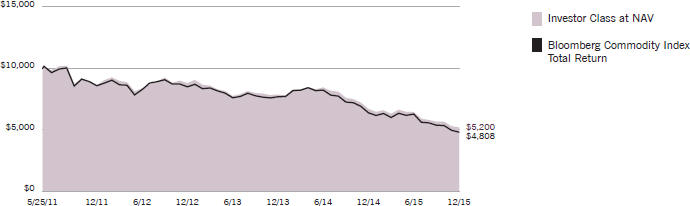
| | | | | | | | | | | | | | | | |
| Growth of Investment | | Amount Invested | | | Period Beginning | | | At NAV | | | With Maximum Sales Charge | |
Institutional Class | | $ | 50,000 | | | | 05/25/2011 | | | $ | 26,244 | | | | N.A. | |
See Endnotes and Additional Disclosures in this report.
Past performance is no guarantee of future results. Returns are historical and are calculated by determining the percentage change in net asset value (NAV) or offering price (as applicable) with all distributions reinvested. Investment return and principal value will fluctuate so that shares, when redeemed, may be worth more or less than their original cost. Performance less than one year is cumulative. Performance is for the stated time period only; due to market volatility, the Fund’s current performance may be lower or higher than quoted. Returns are before taxes unless otherwise noted. For performance as of the most recent month-end, please refer to eatonvance.com.
Parametric Commodity Strategy Fund
December 31, 2015
Fund Profile
Commodity Exposure (% of net assets)5
Commodities Futures Contracts
| | | | | | | | | | |
Agriculture | | | 24.91 | % | | Industrial Metals | | | 24.08 | % |
Coffee | | | 3.60 | | | Copper | | | 7.15 | |
Corn | | | 3.57 | | | Aluminum | | | 7.05 | |
Soybeans | | | 3.56 | | | Nickel | | | 3.61 | |
Soybean Oil | | | 3.55 | | | Zinc | | | 3.57 | |
Sugar | | | 3.54 | | | Lead | | | 1.81 | |
Wheat | | | 3.54 | | | Tin | | | 0.89 | |
Cotton | | | 1.78 | | | | | | | |
Cocoa | | | 1.77 | | | Precious Metals | | | 17.82 | % |
| | | | | | Gold | | | 7.14 | |
Energy | | | 24.90 | % | | Silver | | | 7.04 | |
Natural Gas | | | 7.14 | | | Palladium | | | 1.84 | |
Unleaded Gasoline | | | 7.14 | | | Platinum | | | 1.80 | |
GasOil | | | 7.04 | | | | | | | |
Crude Oil-Brent | | | 1.80 | | | Livestock | | | 8.03 | % |
Crude Oil-WTI | | | 1.78 | | | Live Cattle | | | 3.56 | |
| | | | | | Lean Hogs | | | 3.55 | |
| | | | | | Feeder Cattle | | | 0.92 | |
Asset Allocation (% of net assets)6

| * | Short-Term Investments are held as collateral for the Fund’s futures |
See Endnotes and Additional Disclosures in this report.
Parametric Commodity Strategy Fund
December 31, 2015
Endnotes and Additional Disclosures
| 1 | The views expressed in this report are those of the portfolio manager(s) and are current only through the date stated at the top of this page. These views are subject to change at any time based upon market or other conditions, and Eaton Vance and the Fund(s) disclaim any responsibility to update such views. These views may not be relied upon as investment advice and, because investment decisions are based on many factors, may not be relied upon as an indication of trading intent on behalf of any Eaton Vance fund. This commentary may contain statements that are not historical facts, referred to as “forward looking statements”. The Fund’s actual future results may differ significantly from those stated in any forward looking statement, depending on factors such as changes in securities or financial markets or general economic conditions, the volume of sales and purchases of Fund shares, the continuation of investment advisory, administrative and service contracts, and other risks discussed from time to time in the Fund’s filings with the Securities and Exchange Commission. |
| 2 | Bloomberg Commodity Index Total Return is designed to provide diversified commodity exposure, with weightings based on each underlying commodity’s liquidity and economic significance. Unless otherwise stated, index returns do not reflect the effect of any applicable sales charges, commissions, expenses, taxes or leverage, as applicable. It is not possible to invest directly in an index. |
| 3 | Returns are historical and are calculated by determining the percentage change in net asset value (NAV) with all distributions reinvested. Unless otherwise stated, performance does not reflect the deduction of taxes on Fund distributions or redemptions of Fund shares. |
| | Performance prior to the inception date of a class may be linked to the performance of an older class of the Fund. This linked performance is adjusted for any applicable sales charge, but is not adjusted for class expense differences. If adjusted for such differences, the performance would be different. Performance presented in the financial highlights included in the financial statements is not linked. In the performance table, the performance of Investor Class is linked to Institutional Class. Performance since inception for an index, if presented, is the performance since the Fund’s or oldest share class’ inception, as applicable. |
| 4 | Source: Fund prospectus. Net expense ratio reflects a contractual expense reimbursement that continues through 4/30/16. Without the reimbursement, if applicable, performance would have been lower. |
| 5 | Commodity Exposure reflects the Fund’s net exposure to commodities through its investment in commodity-linked derivative instruments. |
| 6 | Other Net Assets represents other assets less liabilities and includes investment types, if any, each less than 1% of net assets. |
| | Fund profile subject to change due to active management. |
Parametric Commodity Strategy Fund
December 31, 2015
Fund Expenses
Example: As a Fund shareholder, you incur two types of costs: (1) transaction costs, including sales charges (loads) on purchases and redemption fees (if applicable); and (2) ongoing costs, including management fees; distribution and/or service fees; and other Fund expenses. This Example is intended to help you understand your ongoing costs (in dollars) of Fund investing and to compare these costs with the ongoing costs of investing in other mutual funds. The Example is based on an investment of $1,000 invested at the beginning of the period and held for the entire period (July 1, 2015 – December 31, 2015).
Actual Expenses: The first section of the table below provides information about actual account values and actual expenses. You may use the information in this section, together with the amount you invested, to estimate the expenses that you paid over the period. Simply divide your account value by $1,000 (for example, an $8,600 account value divided by $1,000 = 8.6), then multiply the result by the number in the first section under the heading entitled “Expenses Paid During Period” to estimate the expenses you paid on your account during this period.
Hypothetical Example for Comparison Purposes: The second section of the table below provides information about hypothetical account values and hypothetical expenses based on the actual Fund expense ratio and an assumed rate of return of 5% per year (before expenses), which is not the actual Fund return. The hypothetical account values and expenses may not be used to estimate the actual ending account balance or expenses you paid for the period. You may use this information to compare the ongoing costs of investing in your Fund and other funds. To do so, compare this 5% hypothetical example with the 5% hypothetical examples that appear in the shareholder reports of the other funds.
Please note that the expenses shown in the table are meant to highlight your ongoing costs only and do not reflect any transactional costs, such as sales charges (loads) or redemption fees (if applicable). Therefore, the second section of the table is useful in comparing ongoing costs only, and will not help you determine the relative total costs of owning different funds. In addition, if these transactional costs were included, your costs would be higher.
| | | | | | | | | | | | | | | | |
| | | Beginning
Account Value
(7/1/15) | | | Ending
Account Value
(12/31/15) | | | Expenses Paid
During Period*
(7/1/15 – 12/31/15) | | | Annualized
Expense
Ratio | |
| | | | |
| | | | | | | | | | | | | | | | |
Actual | | | | | | | | | | | | | |
Investor Class | | $ | 1,000.00 | | | $ | 806.40 | | | $ | 4.33 | ** | | | 0.95 | % |
Institutional Class | | $ | 1,000.00 | | | $ | 807.70 | | | $ | 3.19 | ** | | | 0.70 | % |
| | | | | | | | | | | | | | | | | |
| | | | |
| | | | | | | | | | | | | | | | |
Hypothetical | | | | | | | | | | | | | |
(5% return per year before expenses) | | | | | | | | | | | | | |
Investor Class | | $ | 1,000.00 | | | $ | 1,020.40 | | | $ | 4.84 | ** | | | 0.95 | % |
Institutional Class | | $ | 1,000.00 | | | $ | 1,021.70 | | | $ | 3.57 | ** | | | 0.70 | % |
| * | Expenses are equal to the Fund’s annualized expense ratio for the indicated Class, multiplied by the average account value over the period, multiplied by 184/365 (to reflect the one-half year period). The Example assumes that the $1,000 was invested at the net asset value per share determined at the close of business on June 30, 2015. |
| ** | Absent an allocation of certain expenses to affiliates, the expenses would be higher. |
Parametric Commodity Strategy Fund
December 31, 2015
Consolidated Portfolio of Investments
| | | | | | | | |
| Short-Term Investments — 99.9% | |
|
| U.S. Treasury Obligations — 80.7% | |
| | |
| | | | | | | | |
| Security | | Principal
Amount
(000’s omitted) | | | Value | |
| | | | | | | | |
U.S. Treasury Bill, 0.00%, 1/7/16(1) | | $ | 18,850 | | | $ | 18,849,925 | |
U.S. Treasury Bill, 0.00%, 5/26/16 | | | 12,000 | | | | 11,982,072 | |
U.S. Treasury Bill, 0.00%, 9/15/16(1) | | | 55,700 | | | | 55,501,039 | |
| | | | | | | | | |
| |
Total U.S. Treasury Obligations
(identified cost $86,383,675) | | | $ | 86,333,036 | |
| | | | | | | | | |
| | |
| Other — 19.2% | | | | | | | | |
| | |
| | | | | | | | |
| Description | | Interest
(000’s omitted) | | | Value | |
Eaton Vance Cash Reserves Fund, LLC, 0.37% (2) | | $ | 20,487 | | | $ | 20,486,522 | |
| | | | | | | | | |
| |
Total Other
(identified cost $20,486,522) | | | $ | 20,486,522 | |
| | | | | | | | | |
| |
Total Short-Term Investments
(identified cost $106,870,197) | | | $ | 106,819,558 | |
| | | | | | | | | |
| |
Total Investments — 99.9%
(identified cost $106,870,197) | | | $ | 106,819,558 | |
| | | | | | | | | |
| |
Other Assets, Less Liabilities — 0.1% | | | $ | 117,763 | |
| | | | | | | | | |
| |
Net Assets — 100.0% | | | $ | 106,937,321 | |
| | | | | | | | | |
The percentage shown for each investment category in the Consolidated Portfolio of Investments is based on net assets.
| (1) | Security (or a portion thereof) has been pledged as collateral for open futures contracts. |
| (2) | Affiliated investment company, available to Eaton Vance portfolios and funds, which invests in high quality, U.S. dollar denominated money market instruments. The rate shown is the annualized seven-day yield as of December 31, 2015. |
| | | | | | | | | | | | | | | | | | | | |
| Futures Contracts | |
| Description | | Contracts | | | Position | | Expiration
Month/Year | | Aggregate Cost | | | Value | | | Net Unrealized
Appreciation
(Depreciation) | |
| | | | | | |
Commodity Futures | | | | | | | | | | | | | | | | | | | | |
| Brent Crude Oil | | | 50 | | | Long | | Apr-16 | | $ | 2,195,150 | | | $ | 1,926,500 | | | $ | (268,650 | ) |
| Cocoa | | | 59 | | | Long | | Mar-16 | | | 1,886,965 | | | | 1,894,490 | | | | 7,525 | |
| Coffee | | | 81 | | | Long | | Mar-16 | | | 3,827,006 | | | | 3,848,513 | | | | 21,507 | |
| Corn | | | 213 | | | Long | | Mar-16 | | | 4,114,838 | | | | 3,820,688 | | | | (294,150 | ) |
| Cotton No.2 | | | 60 | | | Long | | Mar-16 | | | 1,878,572 | | | | 1,898,400 | | | | 19,828 | |
| Feeder Cattle | | | 12 | | | Long | | Mar-16 | | | 996,050 | | | | 981,900 | | | | (14,150 | ) |
| Gold | | | 72 | | | Long | | Apr-16 | | | 7,648,860 | | | | 7,637,760 | | | | (11,100 | ) |
| Lean Hogs | | | 144 | | | Long | | Apr-16 | | | 3,598,000 | | | | 3,798,720 | | | | 200,720 | |
| Live Cattle | | | 69 | | | Long | | Apr-16 | | | 3,584,520 | | | | 3,808,110 | | | | 223,590 | |
| LME Copper | | | 56 | | | Long | | Jan-16 | | | 7,249,400 | | | | 6,597,500 | | | | (651,900 | ) |
| LME Copper | | | 45 | | | Long | | Feb-16 | | | 5,726,775 | | | | 5,300,156 | | | | (426,619 | ) |
| LME Copper | | | 69 | | | Long | | Mar-16 | | | 7,882,281 | | | | 8,121,731 | | | | 239,450 | |
| LME Copper | | | 56 | | | Short | | Jan-16 | | | (7,222,919 | ) | | | (6,597,500 | ) | | | 625,419 | |
| LME Copper | | | 45 | | | Short | | Feb-16 | | | (5,106,937 | ) | | | (5,300,156 | ) | | | (193,219 | ) |
| | | | |
| | 7 | | See Notes to Consolidated Financial Statements. |
Parametric Commodity Strategy Fund
December 31, 2015
Consolidated Portfolio of Investments — continued
| | | | | | | | | | | | | | | | | | | | |
| Futures Contracts (continued) | |
| Description | | Contracts | | | Position | | Expiration
Month/Year | | Aggregate Cost | | | Value | | | Net Unrealized
Appreciation
(Depreciation) | |
| LME Copper | | | 4 | | | Short | | Mar-16 | | $ | (458,437 | ) | | $ | (470,825 | ) | | $ | (12,388 | ) |
| LME Lead | | | 43 | | | Long | | Jan-16 | | | 1,749,600 | | | | 1,931,506 | | | | 181,906 | |
| LME Lead | | | 33 | | | Long | | Feb-16 | | | 1,389,175 | | | | 1,482,938 | | | | 93,763 | |
| LME Lead | | | 46 | | | Long | | Mar-16 | | | 1,896,246 | | | | 2,066,263 | | | | 170,017 | |
| LME Lead | | | 43 | | | Short | | Jan-16 | | | (1,835,962 | ) | | | (1,931,506 | ) | | | (95,544 | ) |
| LME Lead | | | 33 | | | Short | | Feb-16 | | | (1,348,319 | ) | | | (1,482,938 | ) | | | (134,619 | ) |
| LME Lead | | | 3 | | | Short | | Mar-16 | | | (126,468 | ) | | | (134,756 | ) | | | (8,288 | ) |
| LME Nickel | | | 61 | | | Long | | Jan-16 | | | 3,647,472 | | | | 3,216,408 | | | | (431,064 | ) |
| LME Nickel | | | 52 | | | Long | | Feb-16 | | | 3,038,826 | | | | 2,746,068 | | | | (292,758 | ) |
| LME Nickel | | | 76 | | | Long | | Mar-16 | | | 4,010,418 | | | | 4,019,184 | | | | 8,766 | |
| LME Nickel | | | 61 | | | Short | | Jan-16 | | | (3,691,602 | ) | | | (3,216,408 | ) | | | 475,194 | |
| LME Nickel | | | 52 | | | Short | | Feb-16 | | | (2,729,916 | ) | | | (2,746,068 | ) | | | (16,152 | ) |
| LME Nickel | | | 3 | | | Short | | Mar-16 | | | (160,344 | ) | | | (158,652 | ) | | | 1,692 | |
| LME Primary Aluminum | | | 190 | | | Long | | Jan-16 | | | 7,452,825 | | | | 7,151,125 | | | | (301,700 | ) |
| LME Primary Aluminum | | | 152 | | | Long | | Feb-16 | | | 5,704,631 | | | | 5,733,250 | | | | 28,619 | |
| LME Primary Aluminum | | | 214 | | | Long | | Mar-16 | | | 7,969,652 | | | | 8,066,463 | | | | 96,811 | |
| LME Primary Aluminum | | | 190 | | | Short | | Jan-16 | | | (7,122,300 | ) | | | (7,151,125 | ) | | | (28,825 | ) |
| LME Primary Aluminum | | | 152 | | | Short | | Feb-16 | | | (5,607,331 | ) | | | (5,733,250 | ) | | | (125,919 | ) |
| LME Primary Aluminum | | | 14 | | | Short | | Mar-16 | | | (527,763 | ) | | | (527,713 | ) | | | 50 | |
| LME Tin | | | 11 | | | Long | | Jan-16 | | | 857,560 | | | | 803,000 | | | | (54,560 | ) |
| LME Tin | | | 9 | | | Long | | Feb-16 | | | 667,250 | | | | 655,875 | | | | (11,375 | ) |
| LME Tin | | | 13 | | | Long | | Mar-16 | | | 962,825 | | | | 946,400 | | | | (16,425 | ) |
| LME Tin | | | 11 | | | Short | | Jan-16 | | | (825,275 | ) | | | (803,000 | ) | | | 22,275 | |
| LME Tin | | | 9 | | | Short | | Feb-16 | | | (666,045 | ) | | | (655,875 | ) | | | 10,170 | |
| LME Zinc | | | 90 | | | Long | | Jan-16 | | | 3,761,975 | | | | 3,600,000 | | | | (161,975 | ) |
| LME Zinc | | | 74 | | | Long | | Feb-16 | | | 3,066,282 | | | | 2,967,863 | | | | (98,419 | ) |
| LME Zinc | | | 103 | | | Long | | Mar-16 | | | 3,927,511 | | | | 4,143,175 | | | | 215,664 | |
| LME Zinc | | | 90 | | | Short | | Jan-16 | | | (3,829,388 | ) | | | (3,600,000 | ) | | | 229,388 | |
| LME Zinc | | | 74 | | | Short | | Feb-16 | | | (2,808,759 | ) | | | (2,967,863 | ) | | | (159,104 | ) |
| LME Zinc | | | 8 | | | Short | | Mar-16 | | | (309,625 | ) | | | (321,800 | ) | | | (12,175 | ) |
| Low Sulphur Gasoil | | | 220 | | | Long | | Mar-16 | | | 8,841,425 | | | | 7,529,500 | | | | (1,311,925 | ) |
| Natural Gas | | | 266 | | | Long | | Jan-17 | | | 7,477,170 | | | | 7,639,520 | | | | 162,350 | |
| Palladium | | | 35 | | | Long | | Mar-16 | | | 2,088,260 | | | | 1,967,000 | | | | (121,260 | ) |
| Platinum | | | 43 | | | Long | | Apr-16 | | | 1,829,330 | | | | 1,920,380 | | | | 91,050 | |
| RBOB Gasoline | | | 140 | | | Long | | Mar-16 | | | 7,746,484 | | | | 7,633,416 | | | | (113,068 | ) |
| Silver | | | 109 | | | Long | | Mar-16 | | | 8,187,623 | | | | 7,522,635 | | | | (664,988 | ) |
| Soybean | | | 88 | | | Long | | Mar-16 | | | 3,890,600 | | | | 3,802,700 | | | | (87,900 | ) |
| Soybean Oil | | | 206 | | | Long | | Mar-16 | | | 3,638,556 | | | | 3,800,700 | | | | 162,144 | |
| Sugar No.11 | | | 222 | | | Long | | Mar-16 | | | 3,357,205 | | | | 3,789,274 | | | | 432,069 | |
| Wheat | | | 161 | | | Long | | Mar-16 | | | 4,021,900 | | | | 3,783,500 | | | | (238,400 | ) |
| WTI Crude Oil | | | 50 | | | Long | | Mar-16 | | | 2,103,860 | | | | 1,908,500 | | | | (195,360 | ) |
| |
| | | | $ | (2,834,012 | ) |
Abbreviations:
| | | | |
| LME | | – | | London Metal Exchange |
| WTI | | – | | West Texas Intermediate |
| | | | |
| | 8 | | See Notes to Consolidated Financial Statements. |
Parametric Commodity Strategy Fund
December 31, 2015
Consolidated Statement of Assets and Liabilities
| | | | |
| Assets | | December 31, 2015 | |
Unaffiliated investments, at value (identified cost, $86,383,675) | | $ | 86,333,036 | |
Affiliated investment, at value (identified cost, $20,486,522) | | | 20,486,522 | |
Restricted cash* | | | 2,167,000 | |
Interest receivable from affiliated investment | | | 3,681 | |
Receivable for Fund shares sold | | | 922,212 | |
Receivable from affiliates | | | 13,741 | |
Total assets | | $ | 109,926,192 | |
|
| Liabilities | |
Payable for Fund shares redeemed | | $ | 1,596,611 | |
Payable for variation margin on open futures contracts | | | 442,933 | |
Due to custodian | | | 755,169 | |
Payable to affiliates: | | | | |
Investment adviser and administration fee | | | 48,185 | |
Distribution and service fees | | | 1,789 | |
Trustees’ fees | | | 1,625 | |
Accrued expenses | | | 142,559 | |
Total liabilities | | $ | 2,988,871 | |
Net Assets | | $ | 106,937,321 | |
|
| Sources of Net Assets | |
Paid-in capital | | $ | 110,810,628 | |
Accumulated net realized loss | | | (988,656 | ) |
Net unrealized depreciation | | | (2,884,651 | ) |
Total | | $ | 106,937,321 | |
|
| Investor Class Shares | |
Net Assets | | $ | 9,578,561 | |
Shares Outstanding | | | 1,914,907 | |
Net Asset Value, Offering Price and Redemption Price Per Share | | | | |
(net assets ÷ shares of beneficial interest outstanding) | | $ | 5.00 | |
|
| Institutional Class Shares | |
Net Assets | | $ | 97,358,760 | |
Shares Outstanding | | | 19,301,396 | |
Net Asset Value, Offering Price and Redemption Price Per Share | | | | |
(net assets ÷ shares of beneficial interest outstanding) | | $ | 5.04 | |
| * | Represents restricted cash on deposit at the broker for open futures contracts. |
| | | | |
| | 9 | | See Notes to Consolidated Financial Statements. |
Parametric Commodity Strategy Fund
December 31, 2015
Consolidated Statement of Operations
| | | | |
| Investment Income | | Year Ended December 31, 2015 | |
Interest | | $ | 154,237 | |
Interest allocated from affiliated investment | | | 20,686 | |
Expenses allocated from affiliated investment | | | (1,364 | ) |
Total investment income | | $ | 173,559 | |
|
| Expenses | |
Investment adviser and administration fee | | $ | 566,190 | |
Distribution and service fees | | | | |
Investor Class | | | 9,065 | |
Trustees’ fees and expenses | | | 6,030 | |
Custodian fee | | | 154,850 | |
Transfer and dividend disbursing agent fees | | | 30,033 | |
Legal and accounting services | | | 83,089 | |
Printing and postage | | | 16,493 | |
Registration fees | | | 67,586 | |
Miscellaneous | | | 14,067 | |
Total expenses | | $ | 947,403 | |
Deduct — | | | | |
Allocation of expenses to affiliates | | $ | 278,721 | |
Reduction of custodian fee | | | 24 | |
Total expense reductions | | $ | 278,745 | |
| |
Net expenses | | $ | 668,658 | |
| |
Net investment loss | | $ | (495,099 | ) |
|
| Realized and Unrealized Gain (Loss) | |
Net realized gain (loss) — | | | | |
Investment transactions | | $ | (520,820 | ) |
Investment transactions allocated from affiliated investment | | | 12 | |
Futures contracts | | | (6,787,082 | ) |
Swap contracts | | | (14,513,176 | ) |
Net realized loss | | $ | (21,821,066 | ) |
Change in unrealized appreciation (depreciation) — | | | | |
Investments | | $ | 38,129 | |
Futures contracts | | | (2,834,012 | ) |
Swap contracts | | | 2,330,462 | |
Net change in unrealized appreciation (depreciation) | | $ | (465,421 | ) |
| |
Net realized and unrealized loss | | $ | (22,286,487 | ) |
| |
Net decrease in net assets from operations | | $ | (22,781,586 | ) |
| | | | |
| | 10 | | See Notes to Consolidated Financial Statements. |
Parametric Commodity Strategy Fund
December 31, 2015
Consolidated Statements of Changes in Net Assets
| | | | | | | | |
| | | Year Ended December 31, | |
| Increase (Decrease) in Net Assets | | 2015 | | | 2014 | |
From operations — | | | | | | | | |
Net investment loss | | $ | (495,099 | ) | | $ | (608,083 | ) |
Net realized loss from investment transactions, futures contracts and swap contracts | | | (21,821,066 | ) | | | (11,612,561 | ) |
Net change in unrealized appreciation (depreciation) from investments, futures contracts and swap contracts | | | (465,421 | ) | | | (2,598,140 | ) |
Net decrease in net assets from operations | | $ | (22,781,586 | ) | | $ | (14,818,784 | ) |
Transactions in shares of beneficial interest — | | | | | | | | |
Proceeds from sale of shares | | | | | | | | |
Investor Class | | $ | 11,148,161 | | | $ | 987,929 | |
Institutional Class | | | 131,549,417 | | | | 79,570,041 | |
Cost of shares redeemed | | | | | | | | |
Investor Class | | | (2,558,845 | ) | | | (869,935 | ) |
Institutional Class | | | (101,227,739 | ) | | | (60,414,727 | ) |
Net increase in net assets from Fund share transactions | | $ | 38,910,994 | | | $ | 19,273,308 | |
| | |
Net increase in net assets | | $ | 16,129,408 | | | $ | 4,454,524 | |
|
| Net Assets | |
At beginning of year | | $ | 90,807,913 | | | $ | 86,353,389 | |
At end of year | | $ | 106,937,321 | | | $ | 90,807,913 | |
| | | | |
| | 11 | | See Notes to Consolidated Financial Statements. |
Parametric Commodity Strategy Fund
December 31, 2015
Consolidated Financial Highlights
| | | | | | | | | | | | | | | | |
| | | Investor Class | |
| | | Year Ended December 31, | | | Period Ended
December 31, 2012(1) | |
| | | 2015 | | | 2014 | | | 2013 | | |
Net asset value — Beginning of period | | $ | 6.440 | | | $ | 7.560 | | | $ | 8.460 | | | $ | 8.800 | |
| |
| Income (Loss) From Operations | | | | | |
Net investment loss(2) | | $ | (0.042 | ) | | $ | (0.067 | ) | | $ | (0.068 | ) | | $ | (0.076 | ) |
Net realized and unrealized gain (loss) | | | (1.398 | ) | | | (1.053 | ) | | | (0.832 | ) | | | 0.052 | |
| | | | |
Total loss from operations | | $ | (1.440 | ) | | $ | (1.120 | ) | | $ | (0.900 | ) | | $ | (0.024 | ) |
| |
| Less Distributions | | | | | |
From net investment income | | $ | — | | | $ | — | | | $ | — | | | $ | (0.081 | ) |
From net realized gain | | | — | | | | — | | | | — | | | | (0.003 | ) |
Tax return of capital | | | — | | | | — | | | | — | | | | (0.232 | ) |
| | | | |
Total distributions | | $ | — | | | $ | — | | | $ | — | | | $ | (0.316 | ) |
| | | | |
Net asset value — End of period | | $ | 5.000 | | | $ | 6.440 | | | $ | 7.560 | | | $ | 8.460 | |
| | | | |
Total Return(3) | | | (22.36 | )% | | | (14.81 | )% | | | (10.64 | )% | | | (0.27 | )%(4) |
| |
| Ratios/Supplemental Data | | | | | |
Net assets, end of period (000’s omitted) | | $ | 9,579 | | | $ | 2,047 | | | $ | 2,280 | | | $ | 683 | |
Ratios (as a percentage of average daily net assets): | | | | | | | | | | | | | | | | |
Expenses(5)(6) | | | 0.95 | % | | | 0.98 | % | | | 1.00 | % | | | 1.00 | %(7) |
Net investment loss | | | (0.74 | )% | | | (0.88 | )% | | | (0.87 | )% | | | (0.87 | )%(7) |
Portfolio Turnover | | | 573 | %(8) | | | 1,232 | %(8) | | | 2,797 | %(8) | | | 3,455 | %(8)(9) |
| (1) | For the period from the commencement of operations, January 3, 2012, to December 31, 2012. |
| (2) | Computed using average shares outstanding. |
| (3) | Returns are historical and are calculated by determining the percentage change in net asset value with all distributions reinvested and do not reflect the effect of sales charges, if any. |
| (5) | The investment adviser and administrator and sub-adviser reimbursed certain operating expenses (equal to 0.29%, 0.26%, 0.39% and 0.43% of average daily net assets for the years ended December 31, 2015, 2014 and 2013 and the period ended December 31, 2012, respectively). Absent this reimbursement, total return would be lower. |
| (6) | Excludes the effect of custody fee credits, if any, of less than 0.005%. |
| (8) | Excluding the Fund’s investment in exchange-traded notes, which are used as temporary cash investments but offer commodity exposure, the portfolio turnover would be 0%. |
| (9) | For the year ended December 31, 2012. |
| | | | |
| | 12 | | See Notes to Consolidated Financial Statements. |
Parametric Commodity Strategy Fund
December 31, 2015
Consolidated Financial Highlights — continued
| | | | | | | | | | | | | | | | | | | | |
| | | Institutional Class | |
| | | Year Ended December 31, | | | Period Ended December 31, 2011(1) | |
| | | 2015 | | | 2014 | | | 2013 | | | 2012 | | |
Net asset value — Beginning of period | | $ | 6.480 | | | $ | 7.590 | | | $ | 8.470 | | | $ | 8.600 | | | $ | 10.000 | |
| |
| Income (Loss) From Operations | | | | | |
Net investment loss(2) | | $ | (0.030 | ) | | $ | (0.048 | ) | | $ | (0.049 | ) | | $ | (0.055 | ) | | $ | (0.038 | ) |
Net realized and unrealized gain (loss) | | | (1.410 | ) | | | (1.062 | ) | | | (0.831 | ) | | | 0.252 | | | | (1.339 | ) |
| | | | | |
Total income (loss) from operations | | $ | (1.440 | ) | | $ | (1.110 | ) | | $ | (0.880 | ) | | $ | 0.197 | | | $ | (1.377 | ) |
| |
| Less Distributions | | | | | |
From net investment income | | $ | — | | | $ | — | | | $ | — | | | $ | (0.084 | ) | | $ | (0.023 | ) |
From net realized gain | | | — | | | | — | | | | — | | | | (0.003 | ) | | | — | |
Tax return of capital | | | — | | | | — | | | | — | | | | (0.240 | ) | | | — | |
| | | | | |
Total distributions | | $ | — | | | $ | — | | | $ | — | | | $ | (0.327 | ) | | $ | (0.023 | ) |
| | | | | |
Net asset value — End of period | | $ | 5.040 | | | $ | 6.480 | | | $ | 7.590 | | | $ | 8.470 | | | $ | 8.600 | |
| | | | | |
Total Return(3) | | | (22.22 | )% | | | (14.62 | )% | | | (10.39 | )% | | | 2.30 | % | | | (13.77 | )%(4)(5) |
| |
| Ratios/Supplemental Data | | | | | |
Net assets, end of period (000’s omitted) | | $ | 97,359 | | | $ | 88,761 | | | $ | 84,073 | | | $ | 78,938 | | | $ | 29,701 | |
Ratios (as a percentage of average daily net assets): | | | | | | | | | | | | | | | | | | | | |
Expenses(6)(7) | | | 0.70 | % | | | 0.73 | % | | | 0.75 | % | | | 0.75 | % | | | 0.75 | %(8) |
Net investment loss | | | (0.51 | )% | | | (0.63 | )% | | | (0.62 | )% | | | (0.63 | )% | | | (0.67 | )%(8) |
Portfolio Turnover | | | 573 | %(9) | | | 1,232 | %(9) | | | 2,797 | %(9) | | | 3,455 | %(9) | | | 1,732 | %(4)(9) |
| (1) | For the period from the start of business, May 25, 2011, to December 31, 2011. |
| (2) | Computed using average shares outstanding. |
| (3) | Returns are historical and are calculated by determining the percentage change in net asset value with all distributions reinvested. |
| (5) | During the period ended December 31, 2011, the Fund received a payment made by an affiliate for a trading error which amounted to $0.024 per share. Had the Fund not received this payment, total return would have been lower by 0.20%. |
| (6) | The investment adviser and administrator and sub-adviser reimbursed certain operating expenses (equal to 0.29%, 0.26%, 0.39%, 0.43% and 1.90% of average daily net assets for the years ended December 31, 2015, 2014, 2013 and 2012 and the period ended December 31, 2011, respectively). Absent this reimbursement, total return would be lower. |
| (7) | Excludes the effect of custody fee credits, if any, of less than 0.005%. |
| (9) | Excluding the Fund’s investment in exchange-traded notes, which are used as temporary cash investments but offer commodity exposure, the portfolio turnover would be 0%. |
| | | | |
| | 13 | | See Notes to Consolidated Financial Statements. |
Parametric Commodity Strategy Fund
December 31, 2015
Notes to Consolidated Financial Statements
1 Significant Accounting Policies
Parametric Commodity Strategy Fund (the Fund) is a diversified series of Eaton Vance Mutual Funds Trust (the Trust). The Trust is a Massachusetts business trust registered under the Investment Company Act of 1940, as amended (the 1940 Act), as an open-end management investment company. The Fund’s investment objective is to seek total return. The Fund offers Investor Class and Institutional Class shares, which are offered at net asset value and are not subject to a sales charge. Each class represents a pro-rata interest in the Fund, but votes separately on class-specific matters and (as noted below) is subject to different expenses. Realized and unrealized gains and losses and net investment income and losses, other than class-specific expenses, are allocated daily to each class of shares based on the relative net assets of each class to the total net assets of the Fund. Each class of shares differs in its distribution plan and certain other class-specific expenses.
The Fund seeks to gain exposure to the commodity markets, in whole or in part, through investments in PSC Commodity Subsidiary, Ltd. (the Subsidiary), a wholly-owned subsidiary of the Fund organized under the laws of the Cayman Islands with the same objective and investment policies and restrictions as the Fund. The Fund may invest up to 25% of its total assets in the Subsidiary. The net assets of the Subsidiary at December 31, 2015 were $17,840,098 or 16.7% of the Fund’s consolidated net assets. The accompanying consolidated financial statements include the accounts of the Subsidiary. Intercompany balances and transactions have been eliminated in consolidation.
The following is a summary of significant accounting policies of the Fund. The policies are in conformity with accounting principles generally accepted in the United States of America (U.S. GAAP). The Fund is an investment company and follows accounting and reporting guidance in the Financial Accounting Standards Board (“FASB”) Accounting Standards Codification Topic 946.
A Investment Valuation — The following methodologies are used to determine the market value or fair value of investments.
Debt Obligations. Debt obligations (including short-term obligations with a remaining maturity of more than sixty days) are generally valued on the basis of valuations provided by third party pricing services, as derived from such services’ pricing models. Inputs to the models may include, but are not limited to, reported trades, executable bid and asked prices, broker/dealer quotations, prices or yields of securities with similar characteristics, interest rates, anticipated prepayments, benchmark curves or information pertaining to the issuer, as well as industry and economic events. The pricing services may use a matrix approach, which considers information regarding securities with similar characteristics to determine the valuation for a security. Exchange-traded notes are valued at the last sale price on the primary market or exchange on which they are traded on the day of valuation. Short-term obligations purchased with a remaining maturity of sixty days or less are generally valued at amortized cost, which approximates market value.
Derivatives. Financial and commodities futures contracts are valued at the closing settlement price established by the board of trade or exchange on which they are traded. Total return swaps are valued using valuations provided by a third party pricing service based on the value of the underlying index or instrument and reference interest rate.
Affiliated Fund. The Fund may invest in Eaton Vance Cash Reserves Fund, LLC (Cash Reserves Fund), an affiliated investment company managed by Eaton Vance Management (EVM). The value of the Fund’s investment in Cash Reserves Fund reflects the Fund’s proportionate interest in its net assets. Cash Reserves Fund generally values its investment securities utilizing the amortized cost valuation technique in accordance with Rule 2a-7 under the 1940 Act. This technique involves initially valuing a portfolio security at its cost and thereafter assuming a constant amortization to maturity of any discount or premium. If amortized cost is determined not to approximate fair value, Cash Reserves Fund may value its investment securities in the same manner as debt obligations described above.
Fair Valuation. Investments for which valuations or market quotations are not readily available or are deemed unreliable are valued at fair value using methods determined in good faith by or at the direction of the Trustees of the Fund in a manner that fairly reflects the security’s value, or the amount that the Fund might reasonably expect to receive for the security upon its current sale in the ordinary course. Each such determination is based on a consideration of relevant factors, which are likely to vary from one pricing context to another. These factors may include, but are not limited to, the type of security, the existence of any contractual restrictions on the security’s disposition, the price and extent of public trading in similar securities of the issuer or of comparable companies or entities, quotations or relevant information obtained from broker/dealers or other market participants, information obtained from the issuer, analysts, and/or the appropriate stock exchange (for exchange-traded securities), an analysis of the company’s or entity’s financial condition, and an evaluation of the forces that influence the issuer and the market(s) in which the security is purchased and sold.
B Investment Transactions — Investment transactions for financial statement purposes are accounted for on a trade date basis. Realized gains and losses on investments sold are determined on the basis of identified cost.
C Income — Interest income is recorded on the basis of interest accrued, adjusted for amortization of premium or accretion of discount.
D Federal Taxes — The Fund’s policy is to comply with the provisions of the Internal Revenue Code applicable to regulated investment companies and to distribute to shareholders each year substantially all of its net investment income, and all or substantially all of its net realized capital gains. Accordingly, no provision for federal income or excise tax is necessary.
The Subsidiary is treated as a controlled foreign corporation under the Internal Revenue Code and is not expected to be subject to U.S. federal income tax. The Fund is treated as a U.S. shareholder of the Subsidiary. As a result, the Fund is required to include in gross income for U.S. federal tax purposes all of the Subsidiary’s income, whether or not such income is distributed by the Subsidiary. If a net loss is realized by the Subsidiary, such loss is not generally available to offset the income earned by the Fund.
Parametric Commodity Strategy Fund
December 31, 2015
Notes to Consolidated Financial Statements — continued
As of December 31, 2015, the Fund had no uncertain tax positions that would require financial statement recognition, de-recognition, or disclosure. The Fund files a U.S. federal income tax return annually after its fiscal year-end, which is subject to examination by the Internal Revenue Service for a period of three years from the date of filing.
E Expenses — The majority of expenses of the Trust are directly identifiable to an individual fund. Expenses which are not readily identifiable to a specific fund are allocated taking into consideration, among other things, the nature and type of expense and the relative size of the funds.
F Expense Reduction — State Street Bank and Trust Company (SSBT) serves as custodian of the Fund. Pursuant to the custodian agreement, SSBT receives a fee reduced by credits, which are determined based on the average daily cash balance the Fund maintains with SSBT. All credit balances, if any, used to reduce the Fund’s custodian fees are reported as a reduction of expenses in the Consolidated Statement of Operations.
G Use of Estimates — The preparation of the consolidated financial statements in conformity with U.S. GAAP requires management to make estimates and assumptions that affect the reported amounts of assets and liabilities at the date of the consolidated financial statements and the reported amounts of income and expense during the reporting period. Actual results could differ from those estimates.
H Indemnifications — Under the Trust’s organizational documents, its officers and Trustees may be indemnified against certain liabilities and expenses arising out of the performance of their duties to the Fund. Under Massachusetts law, if certain conditions prevail, shareholders of a Massachusetts business trust (such as the Trust) could be deemed to have personal liability for the obligations of the Trust. However, the Trust’s Declaration of Trust contains an express disclaimer of liability on the part of Fund shareholders and the By-laws provide that the Trust shall assume the defense on behalf of any Fund shareholders. Moreover, the By-laws also provide for indemnification out of Fund property of any shareholder held personally liable solely by reason of being or having been a shareholder for all loss or expense arising from such liability. Additionally, in the normal course of business, the Fund enters into agreements with service providers that may contain indemnification clauses. The Fund’s maximum exposure under these arrangements is unknown as this would involve future claims that may be made against the Fund that have not yet occurred.
I Financial and Commodities Futures Contracts — Upon entering into a financial or commodities futures contract, the Fund is required to deposit with the broker, either in cash or securities, an amount equal to a certain percentage of the contract amount (initial margin). Subsequent payments, known as variation margin, are made or received by the Fund each business day, depending on the daily fluctuations in the value of the underlying security, commodity or currency, and are recorded as unrealized gains or losses by the Fund. Gains (losses) are realized upon the expiration or closing of the financial or commodities futures contracts. Should market conditions change unexpectedly, the Fund may not achieve the anticipated benefits of the financial or commodities futures contracts and may realize a loss. Futures contracts have minimal counterparty risk as they are exchange traded and the clearinghouse for the exchange is substituted as the counterparty, guaranteeing counterparty performance.
J Total Return Swaps — In a total return swap, the buyer receives a periodic return equal to the total return of a specified security, securities or index for a specified period of time. In return, the buyer pays the counterparty a fixed or variable stream of payments, typically based upon short-term interest rates, possibly plus or minus an agreed upon spread. During the term of the outstanding swap agreement, changes in the underlying value of the swap are recorded as unrealized gains and losses. Periodic payments received or made are recorded as realized gains or losses. The Fund is exposed to credit loss in the event of nonperformance by the swap counterparty. Risk may also arise from the unanticipated movements in value of exchange rates, interest rates, securities, or the index.
2 Distributions to Shareholders and Income Tax Information
It is the present policy of the Fund to make at least one distribution annually (normally in December) of all or substantially all of its net investment income and to distribute annually all or substantially all of its net realized capital gains. Distributions to shareholders are recorded on the ex-dividend date. Distributions are declared separately for each class of shares. Shareholders may reinvest income and capital gain distributions in additional shares of the same class of the Fund at the net asset value as of the ex-dividend date or, at the election of the shareholder, receive distributions in cash. Distributions to shareholders are determined in accordance with income tax regulations, which may differ from U.S. GAAP. As required by U.S. GAAP, only distributions in excess of tax basis earnings and profits are reported in the financial statements as a return of capital. Permanent differences between book and tax accounting relating to distributions are reclassified to paid-in capital. For tax purposes, distributions from short-term capital gains are considered to be from ordinary income.
During the year ended December 31, 2015, accumulated net realized loss was decreased by $21,823,489, accumulated net investment loss was decreased by $495,099 and paid-in capital was decreased by $22,318,588 due to differences between book and tax accounting, primarily for net operating losses, swap contracts, investments in partnerships and the Fund’s investment in the Subsidiary. These reclassifications had no effect on the net assets or net asset value per share of the Fund.
Parametric Commodity Strategy Fund
December 31, 2015
Notes to Consolidated Financial Statements — continued
As of December 31, 2015, the components of distributable earnings (accumulated losses) and unrealized appreciation (depreciation) on a tax basis were as follows:
| | | | |
Deferred capital losses | | $ | (50,851 | ) |
Net unrealized depreciation | | $ | (3,822,456 | ) |
The differences between components of distributable earnings (accumulated losses) on a tax basis and the amounts reflected in the Consolidated Statement of Assets and Liabilities are primarily due to investments in partnerships and the Fund’s investment in the Subsidiary.
At December 31, 2015, the Fund, for federal income tax purposes, had deferred capital losses of $50,851, which would reduce its taxable income arising from future net realized gains on investment transactions, if any, to the extent permitted by the Internal Revenue Code, and thus would reduce the amount of distributions to shareholders, which would otherwise be necessary to relieve the Fund of any liability for federal income or excise tax. The deferred capital losses are treated as arising on the first day of the Fund’s next taxable year and retain the same short-term or long-term character as when originally deferred. Of the deferred capital losses at December 31, 2015, $17,949 are short-term and $32,902 are long-term.
The cost and unrealized appreciation (depreciation) of investments of the Fund, including the Fund’s investment in the Subsidiary, at December 31, 2015, as determined on a federal income tax basis, were as follows:
| | | | |
| |
Aggregate cost | | $ | 157,807,570 | |
| |
Gross unrealized appreciation | | $ | 318 | |
Gross unrealized depreciation | | | (50,077,578 | ) |
| |
Net unrealized depreciation | | $ | (50,077,260 | ) |
3 Investment Adviser and Administration Fee and Other Transactions with Affiliates
The investment adviser and administration fee is earned by EVM as compensation for investment advisory and administrative services rendered to the Fund and the Subsidiary. Pursuant to the investment advisory and administrative agreement between the Trust and EVM and the investment advisory agreement between the Subsidiary and EVM, the Fund and Subsidiary pay EVM an aggregate fee at an annual rate of 0.60% of the Fund’s consolidated average daily net assets up to $500 million and at reduced rates on consolidated net assets of $500 million and over, and is payable monthly. For the year ended December 31, 2015, the investment adviser and administration fee amounted to $566,190 or 0.60% of the Fund’s consolidated average daily net assets. Pursuant to a sub-advisory agreement, EVM has delegated the investment management of the Fund to Parametric Portfolio Associates LLC (Parametric), a majority-owned subsidiary of Eaton Vance Corp. EVM pays Parametric a portion of its advisory and administration fee for sub-advisory services provided to the Fund. EVM and Parametric have agreed to reimburse the Fund’s expenses, including expenses of the Subsidiary, to the extent that total annual operating expenses (relating to ordinary operating expenses only) exceed 0.95% and 0.70% of the Fund’s consolidated average daily net assets of Investor Class and Institutional Class, respectively. This agreement may be changed or terminated at any time after April 30, 2016. Pursuant to this agreement, EVM and Parametric were allocated $278,721 in total of the Fund’s operating expenses for the year ended December 31, 2015.
EVM provides sub-transfer agency and related services to the Fund pursuant to a Sub-Transfer Agency Support Services Agreement. For the year ended December 31, 2015, EVM earned $591 from the Fund pursuant to such agreement, which is included in transfer and dividend disbursing agent fees on the Consolidated Statement of Operations. Eaton Vance Distributors, Inc. (EVD), an affiliate of EVM and the Fund’s principal underwriter, received distribution and service fees from Investor Class (see Note 4).
Trustees and officers of the Fund who are members of EVM’s organization receive remuneration for their services to the Fund out of the investment adviser and administration fee. Trustees of the Fund who are not affiliated with EVM may elect to defer receipt of all or a percentage of their annual fees in accordance with the terms of the Trustees Deferred Compensation Plan. For the year ended December 31, 2015, no significant amounts have been deferred. Certain officers and Trustees of the Fund are officers of the above organizations.
4 Distribution Plan
The Fund has in effect a distribution plan for Investor Class shares (Investor Class Plan) pursuant to Rule 12b-1 under the 1940 Act. Pursuant to the Investor Class Plan, the Fund pays EVD a distribution and service fee of 0.25% per annum of its average daily net assets attributable to Investor Class shares for distribution services and facilities provided to the Fund by EVD, as well as for personal services and/or the maintenance of shareholder accounts. Distribution and service fees paid or accrued to EVD for the year ended December 31, 2015 amounted to $9,065 for Investor Class shares.
Distribution and service fees are subject to the limitations contained in the Financial Industry Regulatory Authority’s NASD Conduct Rule 2830(d).
Parametric Commodity Strategy Fund
December 31, 2015
Notes to Consolidated Financial Statements — continued
5 Purchases and Sales of Investments
Purchases and sales of investments, other than short-term obligations, aggregated $7,820,491 and $7,800,170, respectively, for the year ended December 31, 2015.
6 Shares of Beneficial Interest
The Fund’s Declaration of Trust permits the Trustees to issue an unlimited number of full and fractional shares of beneficial interest (without par value). Such shares may be issued in a number of different series (such as the Fund) and classes. Transactions in Fund shares were as follows:
| | | | | | | | |
| | | Year Ended December 31, | |
| Investor Class | | 2015 | | | 2014 | |
| | |
Sales | | | 2,066,196 | | | | 133,856 | |
Redemptions | | | (469,180 | ) | | | (117,694 | ) |
| | |
Net increase | | | 1,597,016 | | | | 16,162 | |
| | |
| | | | | | | | |
| | | Year Ended December 31, | |
| Institutional Class | | 2015 | | | 2014 | |
| | |
Sales | | | 23,702,478 | | | | 10,944,763 | |
Redemptions | | | (18,096,424 | ) | | | (8,331,303 | ) |
| | |
Net increase | | | 5,606,054 | | | | 2,613,460 | |
7 Financial Instruments
The Fund may trade in financial instruments with off-balance sheet risk in the normal course of its investing activities. These financial instruments may include swap contracts and futures contracts and may involve, to a varying degree, elements of risk in excess of the amounts recognized for financial statement purposes. The notional or contractual amounts of these instruments represent the investment the Fund has in particular classes of financial instruments and do not necessarily represent the amounts potentially subject to risk. The measurement of the risks associated with these instruments is meaningful only when all related and offsetting transactions are considered. A summary of obligations under these financial instruments at December 31, 2015 is included in the Consolidated Portfolio of Investments. At December 31, 2015, the Fund had sufficient cash and/or securities to cover commitments under these contracts.
The Fund is subject to commodity risk in the normal course of pursuing its investment objective. Commodity risk is the risk that the value of a commodity or commodity index will fluctuate based on increases or decreases in the commodities market and factors specific to a particular industry or commodity. The Fund invests primarily in commodities-linked derivative investments, including commodity futures contracts and commodity exchange-traded notes that provide exposure to the investment returns of the commodities markets, without investing directly in physical commodities. During the year ended December 31, 2015, the Fund also invested in total return swaps based on a commodity index that provided exposure to the investment returns of the commodities market, without investing directly in physical commodities.
The Fund enters into swap contracts that may contain provisions whereby the counterparty may terminate the contract under certain conditions, including but not limited to a decline in the Fund’s net assets below a certain level over a certain period of time, which would trigger a payment by the Fund for those derivatives in a liability position. At December 31, 2015, the Fund had no open derivatives with credit-related contingent features in a net liability position.
The over-the-counter (OTC) derivatives in which the Fund invests are subject to the risk that the counterparty to the contract fails to perform its obligations under the contract. To mitigate this risk, the Fund (and Subsidiary) has entered into an International Swaps and Derivatives Association, Inc. Master Agreement (“ISDA Master Agreement”) or similar agreement with substantially all its derivative counterparties. An ISDA Master Agreement is a bilateral agreement between the Fund and a counterparty that governs certain OTC derivatives and typically contains, among other things, set-off provisions in the event of a default and/or termination event as defined under the relevant ISDA Master Agreement. Under an ISDA Master Agreement, the Fund (and Subsidiary) may, under certain circumstances, offset with the counterparty certain derivative financial instruments’ payables and/or receivables with collateral held and/or posted and create one single net payment. The provisions of the ISDA Master Agreement typically permit a single net payment in the event of default including the bankruptcy or insolvency of the counterparty. However, bankruptcy or insolvency laws of a particular jurisdiction may impose
Parametric Commodity Strategy Fund
December 31, 2015
Notes to Consolidated Financial Statements — continued
restrictions on or prohibitions against the right of offset in bankruptcy or insolvency. Certain ISDA Master Agreements allow counterparties to OTC derivatives to terminate derivative contracts prior to maturity in the event the Fund’s net assets decline by a stated percentage or the Fund fails to meet the terms of its ISDA Master Agreements, which would cause the counterparty to accelerate payment by the Fund of any net liability owed to it.
The collateral requirements for derivatives traded under an ISDA Master Agreement are governed by a Credit Support Annex to the ISDA Master Agreement. Collateral requirements are determined at the close of business each day and are typically based on changes in market values for each transaction under an ISDA Master Agreement and netted into one amount for such agreement. Generally, the amount of collateral due from or to a counterparty is subject to a minimum transfer threshold amount before a transfer is required, which may vary by counterparty. Collateral pledged for the benefit of the Fund (and Subsidiary) and/or counterparty is held in segregated accounts by the Fund’s custodian and cannot be sold, re-pledged, assigned or otherwise used while pledged. The portion of such collateral representing cash, if any, is reflected as restricted cash and, in the case of cash pledged by a counterparty for the benefit of the Fund, a corresponding liability on the Consolidated Statement of Assets and Liabilities. Securities pledged by the Fund as collateral, if any, are identified as such in the Consolidated Portfolio of Investments. Because the Subsidiary is not registered under the 1940 Act, it may not be able to negotiate terms with its counterparties that are equivalent to those a registered portfolio may negotiate. As a result, the Subsidiary may have greater exposure to those counterparties than a registered portfolio.
The fair value of open derivative instruments (not considered to be hedging instruments for accounting disclosure purposes) and whose primary underlying risk exposure is commodity risk at December 31, 2015 was as follows:
| | | | | | | | |
| | | Fair Value | |
| Derivative | | Asset Derivative | | | Liability Derivative | |
| | |
Futures contracts | | $ | 3,719,967 | (1) | | $ | (6,553,979 | )(1) |
| | |
Total derivatives not subject to master netting or similar agreements | | $ | 3,719,967 | | | $ | (6,553,979 | ) |
| (1) | Amount represents cumulative unrealized appreciation or (depreciation) on futures contracts. Only the current day’s variation margin on open futures contracts is reported within the Consolidated Statement of Assets and Liabilities as Receivable or Payable for variation margin, as applicable. |
The effect of derivative instruments (not considered to be hedging instruments for accounting disclosure purposes) on the Consolidated Statement of Operations and whose primary underlying risk exposure is commodity risk for the year ended December 31, 2015 was as follows:
| | | | | | | | |
| Derivative | | Realized Gain (Loss)
on Derivatives Recognized
in Income(1) | | | Change in Unrealized
Appreciation (Depreciation) on
Derivatives Recognized in Income(2) | |
| | |
Futures contracts | | $ | (6,787,082 | ) | | $ | (2,834,012 | ) |
Swap contracts | | | (14,513,176 | ) | | | 2,330,462 | |
| | |
Total | | $ | (21,300,258 | ) | | $ | (503,550 | ) |
| (1) | Consolidated Statement of Operations location: Net realized gain (loss) – Futures contracts and Swap contracts, respectively. |
| (2) | Consolidated Statement of Operations location: Change in unrealized appreciation (depreciation) – Futures contracts and Swap contracts, respectively. |
The average notional amounts of derivative contracts outstanding during the year ended December 31, 2015, which are indicative of the volume of these derivative types, were as follows:
| | | | | | | | | | |
Futures
Contracts — Long | | | Futures
Contracts — Short | | | Swap Contracts | |
| | |
| | $52,842,000 | | | $ | 13,525,000 | | | $ | 57,233,000 | |
Parametric Commodity Strategy Fund
December 31, 2015
Notes to Consolidated Financial Statements — continued
8 Line of Credit
The Fund participates with other portfolios and funds managed by EVM and its affiliates in a $625 million unsecured line of credit agreement with a group of banks, which is in effect through September 2, 2016. Borrowings are made by the Fund solely to facilitate the handling of unusual and/or unanticipated short-term cash requirements. Interest is charged to the Fund based on its borrowings at an amount above either the Eurodollar rate or Federal Funds rate. In addition, a fee computed at an annual rate of 0.10% on the daily unused portion of the line of credit is allocated among the participating portfolios and funds at the end of each quarter. Because the line of credit is not available exclusively to the Fund, it may be unable to borrow some or all of its requested amounts at any particular time. The Fund did not have any significant borrowings or allocated fees during the year ended December 31, 2015.
9 Overdraft Advances
Pursuant to the custodian agreement, SSBT may, in its discretion, advance funds to the Fund to make properly authorized payments. When such payments result in an overdraft, the Fund is obligated to repay SSBT at the current rate of interest charged by SSBT for secured loans (currently, the Federal Funds rate plus 2%). This obligation is payable on demand to SSBT. SSBT has a lien on the Fund’s assets to the extent of any overdraft. At December 31, 2015, the Fund had a payment due to SSBT pursuant to the foregoing arrangement of $755,169. Based on the short-term nature of these payments and the variable interest rate, the carrying value of the overdraft advances approximated its fair value at December 31, 2015. If measured at fair value, overdraft advances would have been considered as Level 2 in the fair value hierarchy (see Note 11) at December 31, 2015. The Fund’s average overdraft advances during the year ended December 31, 2015 were not significant.
10 Risks Associated with Commodities
The commodities which underlie commodity-linked derivatives in which the Fund invests may be subject to additional economic and non-economic variables, such as drought, floods, weather, livestock disease, embargoes, tariffs, and international economic, political and regulatory developments. These factors may have a larger impact on commodity prices and commodity-linked instruments than on traditional securities. Certain commodities are also subject to limited pricing flexibility because of supply and demand factors. Others are subject to broad price fluctuations as a result of the volatility of the prices for certain raw materials and the instability of supplies of other materials. These additional variables may create additional investment risks which subject the Fund’s investments to greater volatility than investments in traditional securities.
11 Fair Value Measurements
Under generally accepted accounting principles for fair value measurements, a three-tier hierarchy to prioritize the assumptions, referred to as inputs, is used in valuation techniques to measure fair value. The three-tier hierarchy of inputs is summarized in the three broad levels listed below.
| • | | Level 1 – quoted prices in active markets for identical investments |
| • | | Level 2 – other significant observable inputs (including quoted prices for similar investments, interest rates, prepayment speeds, credit risk, etc.) |
| • | | Level 3 – significant unobservable inputs (including a fund’s own assumptions in determining the fair value of investments) |
In cases where the inputs used to measure fair value fall in different levels of the fair value hierarchy, the level disclosed is determined based on the lowest level input that is significant to the fair value measurement in its entirety. The inputs or methodology used for valuing securities are not necessarily an indication of the risk associated with investing in those securities.
Parametric Commodity Strategy Fund
December 31, 2015
Notes to Consolidated Financial Statements — continued
At December 31, 2015, the hierarchy of inputs used in valuing the Fund’s investments and open derivative instruments, which are carried at value, were as follows:
| | | | | | | | | | | | | | | | |
| Asset Description | | Level 1 | | | Level 2 | | | Level 3 | | | Total | |
| | | |
Short-Term Investments — | | | | | | | | | | | | |
U.S. Treasury Obligations | | $ | — | | | $ | 86,333,036 | | | $ | — | | | $ | 86,333,036 | |
Other | | | — | | | | 20,486,522 | | | | — | | | | 20,486,522 | |
| | | | |
Total Investments | | $ | — | | | $ | 106,819,558 | | | $ | — | | | $ | 106,819,558 | |
| | | | |
Futures Contracts | | $ | 3,719,967 | | | $ | — | | | $ | — | | | $ | 3,719,967 | |
| | | | |
Total | | $ | 3,719,967 | | | $ | 106,819,558 | | | $ | — | | | $ | 110,539,525 | |
| | | | |
Liability Description | | | | | | | | | | | | | | | | |
| | | | |
Futures Contracts | | $ | (6,553,979 | ) | | $ | — | | | $ | — | | | $ | (6,553,979 | ) |
| | | | |
Total | | $ | (6,553,979 | ) | | $ | — | | | $ | — | | | $ | (6,553,979 | ) |
The Fund held no investments or other financial instruments as of December 31, 2014 whose fair value was determined using Level 3 inputs. At December 31, 2015, there were no investments transferred between Level 1 and Level 2 during the year then ended.
Parametric Commodity Strategy Fund
December 31, 2015
Report of Independent Registered Public Accounting Firm
To the Trustees of Eaton Vance Mutual Funds Trust and Shareholders of Parametric Commodity Strategy Fund:
We have audited the accompanying consolidated statement of assets and liabilities of Parametric Commodity Strategy Fund and subsidiary (the “Fund”) (one of the funds constituting Eaton Vance Mutual Funds Trust), including the consolidated portfolio of investments, as of December 31, 2015, and the related consolidated statement of operations for the year then ended, the consolidated statements of changes in net assets for each of the two years in the period then ended and the consolidated financial highlights for each of the periods presented. These financial statements and financial highlights are the responsibility of the Fund’s management. Our responsibility is to express an opinion on these financial statements and financial highlights based on our audits.
We conducted our audits in accordance with the standards of the Public Company Accounting Oversight Board (United States). Those standards require that we plan and perform the audit to obtain reasonable assurance about whether the financial statements and financial highlights are free of material misstatement. The Fund is not required to have, nor were we engaged to perform, an audit of its internal control over financial reporting. Our audits included consideration of internal control over financial reporting as a basis for designing audit procedures that are appropriate in the circumstances, but not for the purpose of expressing an opinion on the effectiveness of the Fund’s internal control over financial reporting. Accordingly, we express no such opinion. An audit also includes examining, on a test basis, evidence supporting the amounts and disclosures in the financial statements, assessing the accounting principles used and significant estimates made by management, as well as evaluating the overall financial statement presentation. Our procedures included confirmation of securities owned as of December 31, 2015, by correspondence with the custodian and brokers; where replies were not received from brokers, we performed other auditing procedures. We believe that our audits provide a reasonable basis for our opinion.
In our opinion, such consolidated financial statements and consolidated financial highlights referred to above present fairly, in all material respects, the financial position of Parametric Commodity Strategy Fund and subsidiary as of December 31, 2015, the results of their operations for the year then ended, the changes in their net assets for each of the two years in the period then ended and the financial highlights for each of the periods presented, in conformity with accounting principles generally accepted in the United States of America.
DELOITTE & TOUCHE LLP
Boston, Massachusetts
February 23, 2016
Parametric Commodity Strategy Fund
December 31, 2015
Federal Tax Information (Unaudited)
Shareholders are advised to consult their own tax adviser with respect to the tax consequences of their investment in the Fund.
Parametric Commodity Strategy Fund
December 31, 2015
Management and Organization
Fund Management. The Trustees of Eaton Vance Mutual Funds Trust (the Trust) are responsible for the overall management and supervision of the Trust’s affairs. The Trustees and officers of the Trust are listed below. Except as indicated, each individual has held the office shown or other offices in the same company for the last five years. Trustees and officers of the Trust hold indefinite terms of office. The “Noninterested Trustees” consist of those Trustees who are not “interested persons” of the Trust, as that term is defined under the 1940 Act. The business address of each Trustee and officer is Two International Place, Boston, Massachusetts 02110. As used below, “EVC” refers to Eaton Vance Corp., “EV” refers to Eaton Vance, Inc., “EVM” refers to Eaton Vance Management, “BMR” refers to Boston Management and Research, “EVMI” refers to Eaton Vance Management (International) Limited and “EVD” refers to Eaton Vance Distributors, Inc. EVC and EV are the corporate parent and trustee, respectively, of EVM and BMR. EVMI is an indirect, wholly-owned subsidiary of EVC. EVD is the Fund’s principal underwriter and a wholly-owned subsidiary of EVC. Each officer affiliated with Eaton Vance may hold a position with other Eaton Vance affiliates that is comparable to his or her position with EVM listed below. Each Trustee oversees 174 portfolios in the Eaton Vance Complex (including all master and feeder funds in a master feeder structure). Each officer serves as an officer of certain other Eaton Vance funds. Each Trustee and officer serves until his or her successor is elected.
| | | | | | |
| Name and Year of Birth | | Position(s) with the
Trust | | Trustee Since(1) | | Principal Occupation(s) and Directorships During Past Five Years and Other Relevant Experience |
Interested Trustee | | | | | | |
| | | |
Thomas E. Faust Jr. 1958 | | Trustee | | 2007 | | Chairman, Chief Executive Officer and President of EVC, Director and President of EV, Chief Executive Officer and President of EVM and BMR, and Director of EVD and EVMI. Trustee and/or officer of 174 registered investment companies. Mr. Faust is an interested person because of his positions with EVM, BMR, EVD, EVMI, EVC and EV, which are affiliates of the Trust. Directorships in the Last Five Years.(2) Director of EVC and Hexavest Inc. (investment management firm). |
| | | |
| | | | | | |
Noninterested Trustees | | | | | | |
| | | |
Scott E. Eston 1956 | | Trustee | | 2011 | | Private investor. Formerly held various positions at Grantham, Mayo, Van Otterloo and Co., L.L.C. (investment management firm) (1997-2009), including Chief Operating Officer (2002-2009), Chief Financial Officer (1997-2009) and Chairman of the Executive Committee (2002-2008); President and Principal Executive Officer, GMO Trust (open-end registered investment company) (2006-2009). Former Partner, Coopers and Lybrand L.L.P. (now PricewaterhouseCoopers) (an independent registered public accounting firm) (1987-1997). Directorships in the Last Five Years.(2) None. |
| | | |
Cynthia E. Frost 1961 | | Trustee | | 2014 | | Private investor. Formerly, Chief Investment Officer of Brown University (university endowment) (2000-2012); Portfolio Strategist for Duke Management Company (university endowment manager) (1995-2000); Managing Director, Cambridge Associates (investment consulting company) (1989-1995); Consultant, Bain and Company (management consulting firm) (1987-1989); Senior Equity Analyst, BA Investment Management Company (1983-1985). Directorships in the Last Five Years. None. |
| | | |
George J. Gorman 1952 | | Trustee | | 2014 | | Principal at George J. Gorman LLC (consulting firm). Formerly, Senior Partner at Ernst & Young LLP (public accounting firm) (1974-2009). Directorships in the Last Five Years. Formerly, Trustee of the Bank of America Money Market Funds Series Trust (2011-2014) and of the Ashmore Funds (2010-2014). |
| | | |
Valerie A. Mosley 1960 | | Trustee | | 2014 | | Chairwoman and Chief Executive Officer of Valmo Ventures (a consulting and investment firm). Former Partner and Senior Vice President, Portfolio Manager and Investment Strategist at Wellington Management Company, LLP (investment management firm) (1992-2012). Former Chief Investment Officer, PG Corbin Asset Management (1990-1992). Formerly worked in institutional corporate bond sales at Kidder Peabody (1986-1990). Directorships in the Last Five Years.(2) Director of Dynex Capital, Inc. (mortgage REIT) (since 2013). |
Parametric Commodity Strategy Fund
December 31, 2015
Management and Organization — continued
| | | | | | |
| Name and Year of Birth | | Position(s) with the
Trust | | Trustee Since(1) | | Principal Occupation(s) and Directorships During Past Five Years and Other Relevant Experience |
Noninterested Trustees (continued) |
| | | |
William H. Park 1947 | | Vice-Chairperson of the Board and Trustee | | 2016 (Vice-Chairperson) and 2003 (Trustee) | | Private investor. Formerly, Consultant (2012-2014). Formerly, Chief Financial Officer, Aveon Group L.P. (investment management firm) (2010-2011). Formerly, Vice Chairman, Commercial Industrial Finance Corp. (specialty finance company) (2006-2010). Formerly, President and Chief Executive Officer, Prizm Capital Management, LLC (investment management firm) (2002-2005). Formerly, Executive Vice President and Chief Financial Officer, United Asset Management Corporation (investment management firm) (1982-2001). Formerly, Senior Manager, Price Waterhouse (now PricewaterhouseCoopers) (an independent registered public accounting firm) (1972-1981). Directorships in the Last Five Years.(2) None. |
| | | |
Helen Frame Peters 1948 | | Trustee | | 2008 | | Professor of Finance, Carroll School of Management, Boston College. Formerly, Dean, Carroll School of Management, Boston College (2000-2002). Formerly, Chief Investment Officer, Fixed Income, Scudder Kemper Investments (investment management firm) (1998-1999). Formerly, Chief Investment Officer, Equity and Fixed Income, Colonial Management Associates (investment management firm) (1991-1998). Directorships in the Last Five Years.(2) Formerly, Director of BJ’s Wholesale Club, Inc. (wholesale club retailer) (2004-2011). Formerly, Trustee of SPDR Index Shares Funds and SPDR Series Trust (exchange traded funds) (2000-2009). Formerly, Director of Federal Home Loan Bank of Boston (a bank for banks) (2007-2009). |
| | | |
Susan J. Sutherland(3) 1957 | | Trustee | | 2015 | | Private investor. Formerly, Associate, Counsel and Partner at Skadden, Arps, Slate, Meagher & Flom LLP (law firm) (1982-2013). Directorships in the Last Five Years. Formerly, Director of Montpelier Re Holdings Ltd. (global provider of customized insurance and reinsurance products) (2013-2015). |
| | | |
Harriett Tee Taggart 1948 | | Trustee | | 2011 | | Managing Director, Taggart Associates (a professional practice firm). Formerly, Partner and Senior Vice President, Wellington Management Company, LLP (investment management firm) (1983-2006). Directorships in the Last Five Years.(2) Director of Albemarle Corporation (chemicals manufacturer) (since 2007) and The Hanover Group (specialty property and casualty insurance company) (since 2009). Formerly, Director of Lubrizol Corporation (specialty chemicals) (2007-2011). |
| | | |
Ralph F. Verni 1943 | | Chairperson of the Board and Trustee | | 2007 (Chairperson) and 2005 (Trustee) | | Consultant and private investor. Formerly, Chief Investment Officer (1982-1992), Chief Financial Officer (1988-1990) and Director (1982-1992), New England Life. Formerly, Chairperson, New England Mutual Funds (1982-1992). Formerly, President and Chief Executive Officer, State Street Management & Research (1992-2000). Formerly, Chairperson, State Street Research Mutual Funds (1992-2000). Formerly, Director, W.P. Carey, LLC (1998-2004) and First Pioneer Farm Credit Corp. (2002-2006). Directorships in the Last Five Years.(2) None. |
| | | |
| | | | | | |
Principal Officers who are not Trustees |
| Name and Year of Birth | | Position(s)
with the
Trust | | Officer
Since(4) | | Principal Occupation(s) During Past Five Years |
Payson F. Swaffield 1956 | | President | | 2003 | | Vice President and Chief Income Investment Officer of EVM and BMR. |
| | | |
Maureen A. Gemma 1960 | | Vice President, Secretary and Chief Legal Officer | | 2005 | | Vice President of EVM and BMR. |
| | | |
James F. Kirchner 1967 | | Treasurer | | 2007 | | Vice President of EVM and BMR. |
Parametric Commodity Strategy Fund
December 31, 2015
Management and Organization — continued
| | | | | | |
| Name and Year of Birth | | Position(s)
with the
Trust | | Officer
Since(4) | | Principal Occupation(s) During Past Five Years |
Principal Officers who are not Trustees (continued) |
Paul M. O’Neil 1953 | | Chief Compliance Officer | | 2004 | | Vice President of EVM and BMR. |
| (1) | Year first appointed to serve as Trustee for a fund in the Eaton Vance family of funds. Each Trustee has served continuously since appointment unless indicated otherwise. |
| (2) | During their respective tenures, the Trustees (except for Mmes. Frost and Sutherland and Mr. Gorman) also served as Board members of one or more of the following funds (which operated in the years noted): eUnitsTM 2 Year U.S. Market Participation Trust: Upside to Cap / Buffered Downside (launched in 2012 and terminated in 2014); eUnitsTM 2 Year U.S. Market Participation Trust II: Upside to Cap / Buffered Downside (launched in 2012 and terminated in 2014); and Eaton Vance National Municipal Income Trust (launched in 1998 and terminated in 2009). However, Ms. Mosley did not serve as a Board member of eUnitsTM 2 Year U.S. Market Participation Trust: Upside to Cap / Buffered Downside (launched in 2012 and terminated in 2014). |
| (3) | Ms. Sutherland began serving as a Trustee effective May 1, 2015. |
| (4) | Year first elected to serve as officer of a fund in the Eaton Vance family of funds when the officer has served continuously. Otherwise, year of most recent election as an officer of a fund in the Eaton Vance family of funds. Titles may have changed since initial election. |
The SAI for the Fund includes additional information about the Trustees and officers of the Fund and can be obtained without charge on Eaton Vance’s website at www.eatonvance.com or by calling 1-800-260-0761.
Eaton Vance Funds
IMPORTANT NOTICES
Privacy. The Eaton Vance organization is committed to ensuring your financial privacy. Each of the financial institutions identified below has in effect the following policy (“Privacy Policy”) with respect to nonpublic personal information about its customers:
| • | | Only such information received from you, through application forms or otherwise, and information about your Eaton Vance fund transactions will be collected. This may include information such as name, address, social security number, tax status, account balances and transactions. |
| • | | None of such information about you (or former customers) will be disclosed to anyone, except as permitted by law (which includes disclosure to employees necessary to service your account). In the normal course of servicing a customer’s account, Eaton Vance may share information with unaffiliated third parties that perform various required services such as transfer agents, custodians and broker-dealers. |
| • | | Policies and procedures (including physical, electronic and procedural safeguards) are in place that are designed to protect the confidentiality of such information. |
| • | | We reserve the right to change our Privacy Policy at any time upon proper notification to you. Customers may want to review our Privacy Policy periodically for changes by accessing the link on our homepage: www.eatonvance.com. |
Our pledge of privacy applies to the following entities within the Eaton Vance organization: the Eaton Vance Family of Funds, Eaton Vance Management, Eaton Vance Investment Counsel, Eaton Vance Distributors, Inc., Eaton Vance Trust Company, Eaton Vance Management (International) Limited, Eaton Vance Management’s Real Estate Investment Group and Boston Management and Research. In addition, our Privacy Policy applies only to those Eaton Vance customers who are individuals and who have a direct relationship with us. If a customer’s account (i.e., fund shares) is held in the name of a third-party financial advisor/broker-dealer, it is likely that only such advisor’s privacy policies apply to the customer. This notice supersedes all previously issued privacy disclosures. For more information about Eaton Vance’s Privacy Policy, please call 1-800-262-1122.
Delivery of Shareholder Documents. The Securities and Exchange Commission (SEC) permits funds to deliver only one copy of shareholder documents, including prospectuses, proxy statements and shareholder reports, to fund investors with multiple accounts at the same residential or post office box address. This practice is often called “householding” and it helps eliminate duplicate mailings to shareholders. Eaton Vance, or your financial advisor, may household the mailing of your documents indefinitely unless you instruct Eaton Vance, or your financial advisor, otherwise. If you would prefer that your Eaton Vance documents not be householded, please contact Eaton Vance at 1-800-260-0761, or contact your financial advisor. Your instructions that householding not apply to delivery of your Eaton Vance documents will be effective within 30 days of receipt by Eaton Vance or your financial advisor.
Portfolio Holdings. Each Eaton Vance Fund and its underlying Portfolio(s) (if applicable) will file a schedule of portfolio holdings on Form N-Q with the SEC for the first and third quarters of each fiscal year. The Form N-Q will be available on the Eaton Vance website at www.eatonvance.com, by calling Eaton Vance at 1-800-260-0761 or in the EDGAR database on the SEC’s website at www.sec.gov. Form N-Q may also be reviewed and copied at the SEC’s public reference room in Washington, D.C. (call 1-800-732-0330 for information on the operation of the public reference room).
Proxy Voting. From time to time, funds are required to vote proxies related to the securities held by the funds. The Eaton Vance Funds or their underlying Portfolios (if applicable) vote proxies according to a set of policies and procedures approved by the Funds’ and Portfolios’ Boards. You may obtain a description of these policies and procedures and information on how the Funds or Portfolios voted proxies relating to portfolio securities during the most recent 12-month period ended June 30, without charge, upon request, by calling 1-800-260-0761 and by accessing the SEC’s website at www.sec.gov.
This Page Intentionally Left Blank
This Page Intentionally Left Blank
Investment Adviser and Administrator
Eaton Vance Management
Two International Place
Boston, MA 02110
Sub-Adviser
Parametric Portfolio Associates LLC
1918 Eighth Avenue, Suite 3100
Seattle, WA 98101
Principal Underwriter*
Eaton Vance Distributors, Inc.
Two International Place
Boston, MA 02110
(617) 482-8260
Custodian
State Street Bank and Trust Company
State Street Financial Center, One Lincoln Street
Boston, MA 02111
Transfer Agent
BNY Mellon Investment Servicing (US) Inc.
Attn: Eaton Vance Funds
P.O. Box 9653
Providence, RI 02940-9653
(800) 260-0761
Independent Registered Public Accounting Firm
Deloitte & Touche LLP
200 Berkeley Street
Boston, MA 02116-5022
Fund Offices
Two International Place
Boston, MA 02110
| * | FINRA BrokerCheck. Investors may check the background of their Investment Professional by contacting the Financial Industry Regulatory Authority (FINRA). FINRA BrokerCheck is a free tool to help investors check the professional background of current and former FINRA-registered securities firms and brokers. FINRA BrokerCheck is available by calling 1-800-289-9999 and at www.FINRA.org. The FINRA BrokerCheck brochure describing this program is available to investors at www.FINRA.org. |
5255 12.31.15
Item 2. Code of Ethics
The registrant has adopted a code of ethics applicable to its Principal Executive Officer, Principal Financial Officer and Principal Accounting Officer. The registrant undertakes to provide a copy of such code of ethics to any person upon request, without charge, by calling 1-800-262-1122.
Item 3. Audit Committee Financial Expert
The registrant’s Board has designated William H. Park, an independent trustee, as its audit committee financial expert. Mr. Park is a certified public accountant who is a private investor. Previously, he served as a consultant, as the Chief Financial Officer of Aveon Group, L.P. (an investment management firm), as the Vice Chairman of Commercial Industrial Finance Corp. (specialty finance company), as President and Chief Executive Officer of Prizm Capital Management, LLC (investment management firm), as Executive Vice President and Chief Financial Officer of United Asset Management Corporation (an institutional investment management firm) and as a Senior Manager at Price Waterhouse (now PricewaterhouseCoopers) (an independent registered public accounting firm).
Item 4. Principal Accountant Fees and Services
(a)-(d)
Parametric Commodity Strategy Fund, Eaton Vance Stock Fund, Eaton Vance Tax-Managed Growth Fund 1.1 and Eaton Vance Tax-Managed Growth Fund 1.2 (the “Fund(s)”) are series of Eaton Vance Mutual Funds Trust (the “Trust”), a Massachusetts business trust, which, including the Funds, contains a total of 35 series (the “Series”). The Trust is registered under the Investment Company Act of 1940 as an open-end management investment company. This Form N-CSR relates to the Funds’ annual reports.
The following tables present the aggregate fees billed to each Fund for the Fund’s fiscal years ended December 31, 2014 and December 31, 2015 by the Fund’s principal accountant, Deloitte & Touche LLP (“D&T”), for professional services rendered for the audit of the Fund’s annual financial statements and fees billed for other services rendered by D&T during such periods.
Parametric Commodity Strategy Fund
| | | | | | | | |
Fiscal Years Ended | | 12/31/14 | | | 12/31/15 | |
Audit Fees | | $ | 51,960 | | | $ | 52,560 | |
Audit-Related Fees(1) | | $ | 0 | | | $ | 0 | |
Tax Fees(2) | | $ | 35,800 | | | $ | 28,701 | |
All Other Fees(3) | | $ | 0 | | | $ | 0 | |
| | | | | | | | |
Total | | $ | 87,760 | | | $ | 81,261 | |
| | | | | | | | |
Eaton Vance Stock Fund
| | | | | | | | |
Fiscal Years Ended | | 12/31/14 | | | 12/31/15 | |
Audit Fees | | $ | 13,340 | | | $ | 15,740 | |
Audit-Related Fees(1) | | $ | 0 | | | $ | 0 | |
Tax Fees(2) | | $ | 11,290 | | | $ | 8,111 | |
All Other Fees(3) | | $ | 0 | | | $ | 0 | |
| | | | | | | | |
Total | | $ | 24,630 | | | $ | 23,851 | |
| | | | | | | | |
Eaton Vance Tax-Managed Growth Fund 1.1
| | | | | | | | |
Fiscal Years Ended | | 12/31/14 | | | 12/31/15 | |
Audit Fees | | $ | 15,960 | | | $ | 18,360 | |
Audit-Related Fees(1) | | $ | 0 | | | $ | 0 | |
Tax Fees(2) | | $ | 7,510 | | | $ | 7,220 | |
All Other Fees(3) | | $ | 0 | | | $ | 0 | |
| | | | | | | | |
Total | | $ | 23,470 | | | $ | 25,580 | |
| | | | | | | | |
Eaton Vance Tax-Managed Growth Fund 1.2
| | | | | | | | |
Fiscal Years Ended | | 12/31/14 | | | 12/31/15 | |
Audit Fees | | $ | 15,960 | | | $ | 18,360 | |
Audit-Related Fees(1) | | $ | 0 | | | $ | 0 | |
Tax Fees(2) | | $ | 7,510 | | | $ | 7,220 | |
All Other Fees(3) | | $ | 0 | | | $ | 0 | |
| | | | | | | | |
Total | | $ | 23,470 | | | $ | 25,580 | |
| | | | | | | | |
| (1) | Audit-related fees consist of the aggregate fees billed for assurance and related services that are reasonably related to the performance of the audit of financial statements and are not reported under the category of audit fees. |
| (2) | Tax fees consist of the aggregate fees billed for professional services rendered by the principal accountant relating to tax compliance, tax advice, and tax planning and specifically include fees for tax return preparation and other related tax compliance/planning matters. |
| (3) | All other fees consist of the aggregate fees billed for products and services provided by the principal accountant other than audit, audit-related, and tax services. |
The various Series comprising the Trust have differing fiscal year ends (January 31, February 28, August 31, September 30, October 31 or December 31). The following table presents the aggregate audit, audit-related, tax, and other fees billed to all of the Series in the Trust by D&T for the last two fiscal years of each Series.
| | | | | | | | | | | | | | | | | | | | | | | | | | | | | | | | | | | | | | | | | | | | |
Fiscal Years Ended* | | 1/31/14 | | | 8/31/14 | | | 9/30/14 | | | 10/31/14 | | | 12/31/14 | | | 1/31/15 | | | 2/28/15 | | | 8/31/15 | | | 9/30/15 | | | 10/31/15 | | | 12/31/15 | |
Audit Fees | | $ | 125,080 | | | $ | 47,050 | | | $ | 122,212 | | | $ | 558,976 | | | $ | 97,220 | | | $ | 132,030 | | | $ | 22,050 | | | $ | 48,450 | | | $ | 106,700 | | | $ | 581,560 | | | $ | 105,020 | |
Audit-Related Fees(1) | | $ | 0 | | | $ | 0 | | | $ | 0 | | | $ | 0 | | | $ | 0 | | | $ | 0 | | | $ | 0 | | | $ | 0 | | | $ | 2,550 | | | $ | 0 | | | $ | 0 | |
Tax Fees(2) | | $ | 40,790 | | | $ | 15,655 | | | $ | 33,950 | | | $ | 327,920 | | | $ | 62,110 | | | $ | 48,385 | | | $ | 12,780 | | | $ | 12,002 | | | $ | 34,621 | | | $ | 338,673 | | | $ | 51,252 | |
All Other Fees(3) | | $ | 0 | | | $ | 0 | | | $ | 0 | | | $ | 0 | | | $ | 0 | | | $ | 0 | | | $ | 0 | | | $ | 0 | | | $ | 0 | | | $ | 0 | | | $ | 0 | |
| | | | | | | | | | | | | | | | | | | | | | | | | | | | | | | | | | | | | | | | | | | | |
Total | | $ | 165,870 | | | $ | 62,705 | | | $ | 156,162 | | | $ | 886,896 | | | $ | 159,330 | | | $ | 180,415 | | | $ | 34,830 | | | $ | 60,452 | | | $ | 143,871 | | | $ | 920,233 | | | $ | 156,272 | |
| | | | | | | | | | | | | | | | | | | | | | | | | | | | | | | | | | | | | | | | | | | | |
| * | Information is not presented for fiscal year ended 2/28/14 as no Series in the Trust with such fiscal year end was in operation during such period. |
| (1) | Audit-related fees consist of the aggregate fees billed for assurance and related services that are reasonably related to the performance of the audit of financial statements and are not reported under the category of audit fees. |
| (2) | Tax fees consist of the aggregate fees billed for professional services rendered by the principal accountant relating to tax compliance, tax advice, and tax planning and specifically include fees for tax return preparation and other related tax compliance/planning matters. |
| (3) | All other fees consist of the aggregate fees billed for products and services provided by the principal accountant other than audit, audit-related, and tax services. |
(e)(1) The registrant’s audit committee has adopted policies and procedures relating to the pre-approval of services provided by the registrant’s principal accountant (the “Pre-Approval Policies”). The Pre-Approval Policies establish a framework intended to assist the audit committee in the proper discharge of its pre-approval responsibilities. As a general matter, the Pre-Approval Policies (i) specify certain types of audit, audit-related, tax, and other services determined to be pre-approved by the audit committee; and (ii) delineate specific procedures governing the mechanics of the pre-approval process, including the approval and monitoring of audit and non-audit service fees. Unless a service is specifically pre-approved under the Pre-Approval Policies, it must be separately pre-approved by the audit committee.
The Pre-Approval Policies and the types of audit and non-audit services pre-approved therein must be reviewed and ratified by the registrant’s audit committee at least annually. The registrant’s audit committee maintains full responsibility for the appointment, compensation, and oversight of the work of the registrant’s principal accountant.
(e)(2) No services described in paragraphs (b)-(d) above were approved by the registrant’s audit committee pursuant to the “de minimis exception” set forth in Rule 2-01(c)(7)(i)(C) of Regulation S-X.
(f) Not applicable.
(g) The following table presents (i) the aggregate non-audit fees (i.e., fees for audit-related, tax, and other services) billed for services rendered to all of the Series in the Trust by D&T for the last two fiscal years of each Series; and (ii) the aggregate non-audit fees (i.e., fees for audit-related, tax, and other services) billed to the Eaton Vance organization by D&T for the last two fiscal years of each Series.
| | | | | | | | | | | | | | | | | | | | | | | | | | | | | | | | | | | | | | | | | | | | |
Fiscal Years Ended* | | 1/31/14 | | | 8/31/14 | | | 9/30/14 | | | 10/31/14 | | | 12/31/14 | | | 1/31/15 | | | 2/28/15 | | | 8/31/15 | | | 9/30/15 | | | 10/31/15 | | | 12/31/15 | |
Registrant(1) | | $ | 40,790 | | | $ | 15,655 | | | $ | 33,950 | | | $ | 327,920 | | | $ | 62,110 | | | $ | 48,385 | | | $ | 12,780 | | | $ | 12,002 | | | $ | 37,171 | | | $ | 338,673 | | | $ | 51,252 | |
Eaton Vance(2) | | $ | 370,325 | | | $ | 256,315 | | | $ | 256,315 | | | $ | 99,750 | | | $ | 99,750 | | | $ | 99,750 | | | $ | 99,750 | | | $ | 46,000 | | | $ | 46,000 | | | $ | 46,000 | | | $ | 56,434 | |
| * | Information is not presented for fiscal year ended 2/28/14 as no Series in the Trust with such fiscal year end was in operation during such period. |
| (1) | Includes all of the Series of the Trust. During the fiscal years reported above, certain of the Funds were “feeder” funds in a “master-feeder” fund structure or funds of funds. |
| (2) | Various subsidiaries of Eaton Vance Corp. act in either an investment advisory and/or service provider capacity with respect to the Series and/or their respective “master” funds (if applicable). |
(h) The registrant’s audit committee has considered whether the provision by the registrant’s principal accountant of non-audit services to the registrant’s investment adviser and any entity controlling, controlled by, or under common control with the adviser that provides ongoing services to the registrant that were not pre-approved pursuant to Rule 2-01(c)(7)(ii) of Regulation S-X is compatible with maintaining the principal accountant’s independence.
Item 5. Audit Committee of Listed Registrants
Not applicable.
Item 6. Schedule of Investments
Please see schedule of investments contained in the Report to Stockholders included under Item 1 of this Form N-CSR.
Item 7. Disclosure of Proxy Voting Policies and Procedures for Closed-End Management Investment Companies
Not applicable.
Item 8. Portfolio Managers of Closed-End Management Investment Companies
Not applicable.
Item 9. Purchases of Equity Securities by Closed-End Management Investment Company and Affiliated Purchasers
Not applicable.
Item 10. Submission of Matters to a Vote of Security Holders
No material changes.
Item 11. Controls and Procedures
(a) It is the conclusion of the registrant’s principal executive officer and principal financial officer that the effectiveness of the registrant’s current disclosure controls and procedures (such disclosure controls and procedures having been evaluated within 90 days of the date of this filing) provide reasonable assurance that the information required to be disclosed by the registrant has been recorded, processed, summarized and reported within the time period specified in the Commission’s rules and forms and that the information required to be disclosed by the registrant has been accumulated and communicated to the registrant’s principal executive officer and principal financial officer in order to allow timely decisions regarding required disclosure.
(b) There have been no changes in the registrant’s internal controls over financial reporting during the second fiscal quarter of the period covered by this report that has materially affected, or is reasonably likely to materially affect, the registrant’s internal control over financial reporting.
Item 12. Exhibits
| | |
| (a)(1) | | Registrant’s Code of Ethics – Not applicable (please see Item 2). |
| |
| (a)(2)(i) | | Treasurer’s Section 302 certification. |
| |
| (a)(2)(ii) | | President’s Section 302 certification. |
| |
| (b) | | Combined Section 906 certification. |
Signatures
Pursuant to the requirements of the Securities Exchange Act of 1934 and the Investment Company Act of 1940, the registrant has duly caused this report to be signed on its behalf by the undersigned, thereunto duly authorized.
Eaton Vance Mutual Funds Trust
| | |
| |
| By: | | /s/ Payson F. Swaffield |
| | Payson F. Swaffield |
| | President |
| |
| Date: | | February 22, 2016 |
Pursuant to the requirements of the Securities Exchange Act of 1934 and the Investment Company Act of 1940, this report has been signed below by the following persons on behalf of the registrant and in the capacities and on the dates indicated.
| | |
| By: | | /s/ James F. Kirchner |
| | James F. Kirchner |
| | Treasurer |
| |
| Date: | | February 22, 2016 |
| |
| By: | | /s/ Payson F. Swaffield |
| | Payson F. Swaffield |
| | President |
| |
| Date: | | February 22, 2016 |