UNITED STATES
SECURITIES AND EXCHANGE COMMISSION
Washington, D.C. 20549
Form N-CSR
CERTIFIED SHAREHOLDER REPORT OF REGISTERED
MANAGEMENT INVESTMENT COMPANIES
Investment Company Act File Number: 811-04015
Eaton Vance Mutual Funds Trust
(Exact Name of Registrant as Specified in Charter)
Two International Place, Boston, Massachusetts 02110
(Address of Principal Executive Offices)
Maureen A. Gemma
Two International Place, Boston, Massachusetts 02110
(Name and Address of Agent for Services)
(617) 482-8260
(Registrant’s Telephone Number)
August 31
Date of Fiscal Year End
August 31, 2017
Date of Reporting Period
Item 1. Reports to Stockholders

Parametric Emerging Markets Core Fund
Annual Report
August 31, 2017

Commodity Futures Trading Commission Registration. Effective December 31, 2012, the Commodity Futures Trading Commission (“CFTC”) adopted certain regulatory changes that subject registered investment companies and advisers to regulation by the CFTC if a fund invests more than a prescribed level of its assets in certain CFTC-regulated instruments (including futures, certain options and swap agreements) or markets itself as providing investment exposure to such instruments. The Fund has claimed an exclusion from the definition of the term “commodity pool operator” under the Commodity Exchange Act. Accordingly, neither the Fund nor the adviser with respect to the operation of the Fund is subject to CFTC regulation. Because of its management of other strategies, the Fund’s adviser is registered with the CFTC as a commodity pool operator and a commodity trading advisor.
Fund shares are not insured by the FDIC and are not deposits or other obligations of, or guaranteed by, any depository institution. Shares are subject to investment risks, including possible loss of principal invested.
This report must be preceded or accompanied by a current summary prospectus or prospectus. Before investing, investors should consider carefully the investment objective, risks, and charges and expenses of a mutual fund. This and other important information is contained in the summary prospectus and prospectus, which can be obtained from a financial advisor. Prospective investors should read the prospectus carefully before investing. For further information, please call 1-800-260-0761.
Annual Report August 31, 2017
Parametric Emerging Markets Core Fund
Table of Contents
| | | | |
Management’s Discussion of Fund Performance | | | 2 | |
| |
Performance | | | 3 | |
| |
Fund Profile | | | 4 | |
| |
Endnotes and Additional Disclosures | | | 5 | |
| |
Fund Expenses | | | 6 | |
| |
Financial Statements | | | 7 | |
| |
Report of Independent Registered Public Accounting Firm | | | 28 | |
| |
Federal Tax Information | | | 29 | |
| |
Board of Trustees’ Contract Approval | | | 30 | |
| |
Management and Organization | | | 34 | |
| |
Important Notices | | | 37 | |
Parametric Emerging Markets Core Fund
August 31, 2017
Management’s Discussion of Fund Performance1
Economic and Market Conditions
For the 12-month period ended August 31, 2017, emerging market equities were generally characterized by dramatic volatility, fed by country-specific themes such as political unrest, fiscal challenges and unstable currency values.
The 12-month period started with investors uncertain about emerging markets, with numerous changes in sentiment over the latter half of 2016. Initially, optimism was fostered by China’s rebound from earlier in the year, and Brazil’s continued rally amid signs that the country’s three-year-long recession was coming to an end. However, the tide turned after the U.S. elections in November, as many worried that a Trump administration could result in global trade restrictions. Accordingly, the end of 2016 saw the emerging markets asset class swoon, with China and other large export-driven economies seeing a marked decline as investors grew increasingly concerned about their prospects.
However, 2017 saw emerging market equities stage a sharp rally, with eight consecutive months of positive benchmark returns. Investors were initially drawn to the asset class based on its attractive valuation versus U.S. equities, as well as signs that the Trump trade policy was not as draconian as feared. Moreover, the rally drew strength from the growing consensus that global growth was back on track and should allow for a prolonged period of expansion in emerging market economies. At the country level, Poland advanced over 50%, as equity markets rallied in response to the economic expansion across the eurozone. Chinese equities rose on data showing continued strength across the economy, while the tech-heavy markets of Korea and Taiwan benefited from the global rally in information technology stocks.
Fund Performance
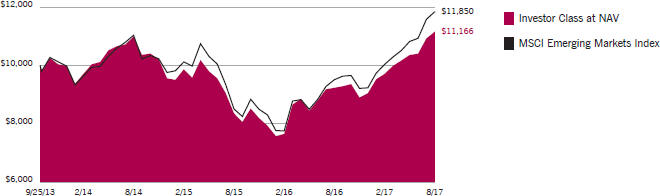
For the 12-month period ended August 31, 2017, Parametric Emerging Markets Core Fund (the Fund) had a total return of 20.89% for Investor Class shares at net asset value (NAV), underperforming the Fund’s benchmark, the MSCI Emerging Markets Index (the Index),2 which had a total return of 24.53% for the same period.
Among the largest detractors from relative performance was the Fund’s underweight position in China, where the equity market outperformed the broader Index due to accelerating
growth across its economy. In addition, an overweight to the Philippines hurt relative performance, as markets suffered due to an exodus of foreign investors in reaction to the increasingly strident anti-U.S. proclamations of President Duarte. The Fund’s overweight to Pakistan also weighed on relative results, as the country’s equity markets declined sharply over the period amid worries of a currency devaluation and a Supreme Court decision to oust Prime Minister Sharif.
Among the largest contributors to relative performance was the Fund’s overweight position in Poland, where equity markets soared as the country’s GDP growth trajectory of 3% was perceived to be back on track due to growing domestic consumption and initial signs of recovery in the eurozone. An overweight to Greece also lifted performance relative to the Index. Greek stocks advanced as investors cheered a debt deal between the Greek government and eurozone authorities. The Fund’s out-of-benchmark position in Kuwait also contributed to relative results, as the country’s equity markets benefitted from a surge in oil prices in late 2016 and early 2017.
See Endnotes and Additional Disclosures in this report.
Past performance is no guarantee of future results. Returns are historical and are calculated by determining the percentage change in net asset value (NAV) or offering price (as applicable) with all distributions reinvested. Investment return and principal value will fluctuate so that shares, when redeemed, may be worth more or less than their original cost. Performance less than or equal to one year is cumulative. Performance is for the stated time period only; due to market volatility, the Fund’s current performance may be lower or higher than quoted. Returns are before taxes unless otherwise noted. For performance as of the most recent month-end, please refer to eatonvance.com.
Parametric Emerging Markets Core Fund
August 31, 2017
Performance2,3
Portfolio Managers Thomas Seto and Timothy W. Atwill, Ph.D., CFA, each of Parametric Portfolio Associates LLC
| | | | | | | | | | | | | | | | | | | | |
| % Average Annual Total Returns | | Class
Inception Date | | | Performance Inception Date | | | One Year | | | Five Years | | | Since Inception | |
Investor Class at NAV | | | 09/25/2013 | | | | 09/25/2013 | | | | 20.89 | % | | | — | | | | 2.84 | % |
Institutional Class at NAV | | | 09/25/2013 | | | | 09/25/2013 | | | | 21.29 | | | | — | | | | 3.10 | |
MSCI Emerging Markets Index | | | — | | | | — | | | | 24.53 | % | | | 5.29 | % | | | 4.41 | % |
| | | | | |
| | | | | | | | | | | | | | | | | | | | |
| % Total Annual Operating Expense Ratios4 | | | | | | | | | | | Investor
Class | | | Institutional
Class | |
Gross | | | | | | | | | | | | | | | 3.29 | % | | | 3.04 | % |
Net | | | | | | | | | | | | | | | 1.15 | | | | 0.90 | |
Growth of $10,000
This graph shows the change in value of a hypothetical investment of $10,000 in Investor Class of the Fund for the period indicated. For comparison, the same investment is shown in the indicated index.
| | | | | | | | | | | | | | | | |
| Growth of Investment | | Amount Invested | | | Period Beginning | | | At NAV | | | With Maximum Sales Charge | |
Institutional Class | | $ | 50,000 | | | | 09/25/2013 | | | $ | 56,388 | | | | N.A. | |
See Endnotes and Additional Disclosures in this report.
Past performance is no guarantee of future results. Returns are historical and are calculated by determining the percentage change in net asset value (NAV) or offering price (as applicable) with all distributions reinvested. Investment return and principal value will fluctuate so that shares, when redeemed, may be worth more or less than their original cost. Performance less than or equal to one year is cumulative. Performance is for the stated time period only; due to market volatility, the Fund’s current performance may be lower or higher than quoted. Returns are before taxes unless otherwise noted. For performance as of the most recent month-end, please refer to eatonvance.com.
Parametric Emerging Markets Core Fund
August 31, 2017
Fund Profile
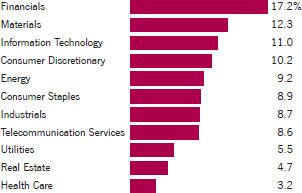
Sector Allocation (% of net assets)5
Top 10 Holdings (% of net assets)5
| | | | |
Samsung Electronics Co., Ltd. | | | 1.8 | % |
| |
Naspers, Ltd., Class N | | | 1.5 | |
| |
Tencent Holdings, Ltd. | | | 1.3 | |
| |
America Movil SAB de CV, Series L ADR | | | 1.1 | |
| |
Sberbank of Russia PJSC ADR | | | 1.0 | |
| |
China Mobile, Ltd. | | | 0.9 | |
| |
Reliance Industries, Ltd. GDR | | | 0.8 | |
| |
Taiwan Semiconductor Manufacturing Co., Ltd. | | | 0.7 | |
| |
Magnit PJSC | | | 0.7 | |
| |
Vale SA, PFC Shares | | | 0.7 | |
| |
Total | | | 10.5 | % |
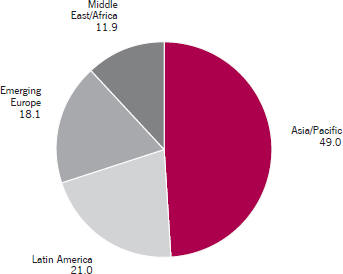
Geographic Allocation (% of common stocks)
See Endnotes and Additional Disclosures in this report.
Parametric Emerging Markets Core Fund
August 31, 2017
Endnotes and Additional Disclosures
| 1 | The views expressed in this report are those of the portfolio manager(s) and are current only through the date stated at the top of this page. These views are subject to change at any time based upon market or other conditions, and Eaton Vance and the Fund(s) disclaim any responsibility to update such views. These views may not be relied upon as investment advice and, because investment decisions are based on many factors, may not be relied upon as an indication of trading intent on behalf of any Eaton Vance fund. This commentary may contain statements that are not historical facts, referred to as “forward looking statements”. The Fund’s actual future results may differ significantly from those stated in any forward looking statement, depending on factors such as changes in securities or financial markets or general economic conditions, the volume of sales and purchases of Fund shares, the continuation of investment advisory, administrative and service contracts, and other risks discussed from time to time in the Fund’s filings with the Securities and Exchange Commission. |
| 2 | MSCI Emerging Markets Index is an unmanaged index of emerging markets common stocks. MSCI indexes are net of foreign withholding taxes. Source: MSCI. MSCI data may not be reproduced or used for any other purpose. MSCI provides no warranties, has not prepared or approved this report, and has no liability hereunder. Unless otherwise stated, index returns do not reflect the effect of any applicable sales charges, commissions, expenses, taxes or leverage, as applicable. It is not possible to invest directly in an index. |
| 3 | Returns are historical and are calculated by determining the percentage change in NAV with all distributions reinvested. Unless otherwise stated, performance does not reflect the deduction of taxes on Fund distributions or redemptions of Fund shares. Performance since inception for an index, if presented, is the performance since the Fund’s or oldest share class’ inception, as applicable. |
| 4 | Source: Fund prospectus. Net expense ratios reflect a contractual expense reimbursement that continues through 12/31/17. Without the reimbursement, performance would have been lower. The expense ratios for the current reporting period can be found in the Financial Highlights section of this report. |
| 5 | Excludes cash and cash equivalents. |
| | Fund profile subject to change due to active management. |
| | Important Notice to Shareholders |
| | On October 17, 2017, the Fund’s Trustees approved a Plan of Liquidation and Termination for the Fund. On November 30, 2017, the Fund expects to discontinue sales of its shares to new investors, with limited exceptions. All of the Fund’s outstanding shares are expected to be redeemed and the Fund liquidated on or about December 15, 2017. |
Parametric Emerging Markets Core Fund
August 31, 2017
Fund Expenses
Example: As a Fund shareholder, you incur two types of costs: (1) transaction costs, including sales charges (loads) on purchases and redemption fees (if applicable); and (2) ongoing costs, including management fees; distribution and/or service fees; and other Fund expenses. This Example is intended to help you understand your ongoing costs (in dollars) of Fund investing and to compare these costs with the ongoing costs of investing in other mutual funds. The Example is based on an investment of $1,000 invested at the beginning of the period and held for the entire period (March 1, 2017 – August 31, 2017).
Actual Expenses: The first section of the table below provides information about actual account values and actual expenses. You may use the information in this section, together with the amount you invested, to estimate the expenses that you paid over the period. Simply divide your account value by $1,000 (for example, an $8,600 account value divided by $1,000 = 8.6), then multiply the result by the number in the first section under the heading entitled “Expenses Paid During Period” to estimate the expenses you paid on your account during this period.
Hypothetical Example for Comparison Purposes: The second section of the table below provides information about hypothetical account values and hypothetical expenses based on the actual Fund expense ratio and an assumed rate of return of 5% per year (before expenses), which is not the actual Fund return. The hypothetical account values and expenses may not be used to estimate the actual ending account balance or expenses you paid for the period. You may use this information to compare the ongoing costs of investing in your Fund and other funds. To do so, compare this 5% hypothetical example with the 5% hypothetical examples that appear in the shareholder reports of the other funds.
Please note that the expenses shown in the table are meant to highlight your ongoing costs only and do not reflect any transactional costs, such as sales charges (loads) or redemption fees (if applicable). Therefore, the second section of the table is useful in comparing ongoing costs only, and will not help you determine the relative total costs of owning different funds. In addition, if these transactional costs were included, your costs would be higher.
| | | | | | | | | | | | | | | | |
| | | Beginning Account Value
(3/1/17) | | | Ending Account Value
(8/31/17) | | | Expenses Paid During Period*
(3/1/17 – 8/31/17) | | | Annualized Expense
Ratio | |
Actual | | | | | | | | | | | | | | | | |
Investor Class | | $ | 1,000.00 | | | $ | 1,149.80 | | | $ | 6.23 | ** | | | 1.15 | % |
Institutional Class | | $ | 1,000.00 | | | $ | 1,150.70 | | | $ | 4.88 | ** | | | 0.90 | % |
| | | | | | | | | | | | | | | | | |
| | | | |
| | | | | | | | | | | | | | | | |
Hypothetical | | | | | | | | | | | | | | | | |
(5% return per year before expenses) | | | | | | | | | | | | | | | | |
Investor Class | | $ | 1,000.00 | | | $ | 1,019.40 | | | $ | 5.85 | ** | | | 1.15 | % |
Institutional Class | | $ | 1,000.00 | | | $ | 1,020.70 | | | $ | 4.58 | ** | | | 0.90 | % |
| * | Expenses are equal to the Fund’s annualized expense ratio for the indicated Class, multiplied by the average account value over the period, multiplied by 184/365 (to reflect the one-half year period). The Example assumes that the $1,000 was invested at the net asset value per share determined at the close of business on February 28, 2017. |
| ** | Absent an allocation of certain expenses to affiliates, expenses would be higher. |
Parametric Emerging Markets Core Fund
August 31, 2017
Portfolio of Investments
| | | | | | | | |
| Common Stocks — 99.5% | |
| | |
| | | | | | | | |
| Security | | Shares | | | Value | |
| | | | | | | | |
| | |
Brazil — 6.5% | | | | | | | | |
Alpargatas SA, PFC Shares | | | 3,400 | | | $ | 14,905 | |
AMBEV SA ADR | | | 5,500 | | | | 34,430 | |
B3 SA - Brasil Bolsa Balcao(1) | | | 1,569 | | | | 11,025 | |
Banco Bradesco SA, PFC Shares | | | 2,182 | | | | 23,272 | |
Banco do Brasil SA | | | 600 | | | | 5,852 | |
BB Seguridade Participacoes SA | | | 700 | | | | 6,164 | |
BR Malls Participacoes SA | | | 1,046 | | | | 4,519 | |
BR Properties SA | | | 279 | | | | 974 | |
BRF SA ADR(1) | | | 1,100 | | | | 14,784 | |
CCR SA | | | 3,400 | | | | 18,859 | |
Centrais Eletricas Brasileiras SA ADR(1) | | | 1,200 | | | | 6,732 | |
Cia de Saneamento Basico do Estado de Sao Paulo | | | 900 | | | | 9,192 | |
Cia de Saneamento de Minas Gerais-COPASA | | | 287 | | | | 3,931 | |
Cia Energetica de Minas Gerais SA, PFC Shares | | | 3,030 | | | | 8,066 | |
Cia Energetica de Sao Paulo, Class B, PFC Shares | | | 1,600 | | | | 7,487 | |
Cia Hering | | | 1,000 | | | | 8,577 | |
Cia Paranaense de Energia-Copel ADR | | | 400 | | | | 3,648 | |
Cia Siderurgica Nacional SA(1) | | | 1,200 | | | | 3,313 | |
Cielo SA | | | 7,291 | | | | 51,952 | |
Cosan SA Industria e Comercio | | | 300 | | | | 3,678 | |
CPFL Energia SA ADR | | | 931 | | | | 15,967 | |
Cyrela Brazil Realty SA Empreendimentos e Participacoes | | | 1,900 | | | | 7,955 | |
EDP-Energias do Brasil SA | | | 1,000 | | | | 4,841 | |
Embraer SA | | | 2,900 | | | | 16,518 | |
Engie Brasil Energia SA | | | 500 | | | | 5,734 | |
Equatorial Energia SA | | | 500 | | | | 9,708 | |
Estacio Participacoes SA | | | 900 | | | | 7,379 | |
Fibria Celulose SA ADR | | | 400 | | | | 5,264 | |
Gerdau SA, PFC Shares | | | 1,300 | | | | 4,894 | |
Iochpe Maxion SA | | | 400 | | | | 2,567 | |
Itau Unibanco Holding SA, PFC Shares | | | 1,752 | | | | 22,458 | |
Itausa-Investimentos Itau SA, PFC Shares | | | 3,319 | | | | 10,755 | |
JBS SA | | | 1,700 | | | | 4,682 | |
Klabin SA, PFC Shares | | | 4,500 | | | | 4,403 | |
Kroton Educacional SA | | | 2,888 | | | | 16,487 | |
Localiza Rent a Car SA | | | 735 | | | | 13,905 | |
Lojas Americanas SA, PFC Shares | | | 1,590 | | | | 8,976 | |
Lojas Renner SA | | | 1,980 | | | | 19,247 | |
M Dias Branco SA | | | 300 | | | | 4,679 | |
Marcopolo SA, PFC Shares | | | 7,400 | | | | 9,145 | |
Metalurgica Gerdau SA, PFC Shares(1) | | | 3,700 | | | | 6,653 | |
MRV Engenharia e Participacoes SA | | | 1,400 | | | | 6,000 | |
Multiplan Empreendimentos Imobiliarios SA(1) | | | 300 | | | | 6,966 | |
Natura Cosmeticos SA | | | 300 | | | | 2,811 | |
| | | | | | | | |
| Security | | Shares | | | Value | |
| | | | | | | | |
| | |
Brazil (continued) | | | | | | | | |
Odontoprev SA | | | 2,500 | | | $ | 11,770 | |
Oi SA ADR(1) | | | 3,960 | | | | 4,514 | |
Petroleo Brasileiro SA, PFC Shares(1) | | | 9,800 | | | | 42,496 | |
Qualicorp SA | | | 1,800 | | | | 19,928 | |
Raia Drogasil SA | | | 400 | | | | 8,812 | |
Rumo SA(1) | | | 3,731 | | | | 12,244 | |
Suzano Papel e Celulose SA, Class A, PFC Shares | | | 1,800 | | | | 10,007 | |
Telefonica Brasil SA, PFC Shares | | | 2,910 | | | | 45,150 | |
TIM Participacoes SA | | | 6,900 | | | | 24,725 | |
Totvs SA | | | 1,100 | | | | 10,854 | |
Ultrapar Participacoes SA | | | 700 | | | | 16,333 | |
Usinas Siderurgicas de Minas Gerais SA, Class A, PFC Shares(1) | | | 3,800 | | | | 8,317 | |
Vale SA, PFC Shares | | | 7,600 | | | | 78,635 | |
Weg SA | | | 2,820 | | | | 18,329 | |
| | | | | | | | | |
| | | $ | 771,468 | |
| | | | | | | | | |
| | |
Chile — 3.6% | | | | | | | | |
AES Gener SA | | | 17,883 | | | $ | 6,292 | |
Aguas Andinas SA, Series A | | | 13,740 | | | | 8,827 | |
AntarChile SA | | | 1,700 | | | | 25,015 | |
Banco de Chile ADR | | | 261 | | | | 22,843 | |
Banco de Credito e Inversiones | | | 231 | | | | 15,105 | |
Banco Santander Chile ADR | | | 800 | | | | 23,400 | |
Cap SA | | | 380 | | | | 4,492 | |
Cencosud SA | | | 3,560 | | | | 10,746 | |
Cia Cervecerias Unidas SA ADR | | | 200 | | | | 5,480 | |
Colbun SA | | | 36,400 | | | | 8,838 | |
Embotelladora Andina SA, Series A ADR | | | 300 | | | | 7,209 | |
Embotelladora Andina SA, Series B ADR | | | 180 | | | | 5,081 | |
Empresa Nacional de Telecomunicaciones SA | | | 2,697 | | | | 28,384 | |
Empresas CMPC SA | | | 5,960 | | | | 15,681 | |
Empresas COPEC SA | | | 3,510 | | | | 44,728 | |
Enel Americas SA ADR | | | 1,720 | | | | 18,473 | |
Enel Chile SA ADR | | | 1,720 | | | | 10,079 | |
Enel Generacion Chile SA ADR | | | 350 | | | | 8,817 | |
Itau CorpBanca ADR | | | 1,250 | | | | 18,187 | |
Latam Airlines Group SA ADR | | | 1,037 | | | | 13,066 | |
Parque Arauco SA | | | 4,808 | | | | 13,227 | |
Quinenco SA | | | 3,270 | | | | 9,676 | |
S.A.C.I. Falabella | | | 5,230 | | | | 52,699 | |
Sigdo Koppers SA | | | 4,680 | | | | 8,271 | |
Sociedad Quimica y Minera de Chile SA ADR | | | 540 | | | | 25,342 | |
Sonda SA | | | 4,030 | | | | 7,446 | |
Vina Concha y Toro SA ADR | | | 200 | | | | 6,753 | |
| | | | | | | | | |
| | | $ | 424,157 | |
| | | | | | | | | |
| | | | |
| | 7 | | See Notes to Financial Statements. |
Parametric Emerging Markets Core Fund
August 31, 2017
Portfolio of Investments — continued
| | | | | | | | |
| Security | | Shares | | | Value | |
| | | | | | | | |
| | |
China — 13.6% | | | | | | | | |
AAC Technologies Holdings, Inc. | | | 1,000 | | | $ | 18,300 | |
Agricultural Bank of China, Ltd., Class H | | | 22,000 | | | | 10,379 | |
Air China, Ltd., Class H | | | 8,000 | | | | 7,136 | |
Aisino Corp. | | | 1,500 | | | | 4,492 | |
Aluminum Corp. of China, Ltd., Class H(1) | | | 14,000 | | | | 10,418 | |
Anhui Conch Cement Co., Ltd., Class H | | | 5,000 | | | | 18,710 | |
Baidu, Inc. ADR(1) | | | 200 | | | | 45,610 | |
Bank of China, Ltd., Class H | | | 19,000 | | | | 10,041 | |
Bank of Communications, Ltd., Class H | | | 7,000 | | | | 5,364 | |
BBMG Corp., Class H | | | 14,000 | | | | 7,225 | |
Beijing Enterprises Holdings, Ltd. | | | 500 | | | | 2,798 | |
Beijing Enterprises Water Group, Ltd. | | | 14,000 | | | | 11,926 | |
Beijing Originwater Technology Co., Ltd., Class A | | | 1,700 | | | | 4,886 | |
Brilliance China Automotive Holdings, Ltd. | | | 12,000 | | | | 31,110 | |
BYD Co., Ltd., Class H | | | 1,000 | | | | 5,967 | |
CGN Power Co., Ltd., Class H(2) | | | 33,000 | | | | 9,125 | |
China Bluechemical, Ltd., Class H | | | 8,000 | | | | 2,469 | |
China Cinda Asset Management Co., Ltd., Class H | | | 11,000 | | | | 4,100 | |
China CITIC Bank Corp., Ltd., Class H | | | 9,000 | | | | 5,957 | |
China Coal Energy Co., Ltd., Class H | | | 8,000 | | | | 4,038 | |
China Communications Construction Co., Ltd., Class H | | | 7,000 | | | | 9,341 | |
China Communications Services Corp., Ltd., Class H | | | 8,000 | | | | 4,342 | |
China Construction Bank Corp., Class H | | | 23,000 | | | | 20,236 | |
China Everbright International, Ltd. | | | 6,000 | | | | 7,941 | |
China Evergrande Group(1) | | | 12,000 | | | | 36,342 | |
China Gas Holdings, Ltd. | | | 10,000 | | | | 25,294 | |
China Hongqiao Group, Ltd.(1)(3) | | | 9,000 | | | | 4,054 | |
China Life Insurance Co., Ltd., Class H | | | 2,000 | | | | 6,440 | |
China Longyuan Power Group Corp., Ltd., Class H | | | 5,000 | | | | 3,755 | |
China Medical System Holdings, Ltd. | | | 4,000 | | | | 7,384 | |
China Mengniu Dairy Co., Ltd. | | | 8,000 | | | | 18,721 | |
China Merchants Bank Co., Ltd., Class H | | | 4,000 | | | | 15,122 | |
China Merchants Port Holdings Co., Ltd. | | | 2,000 | | | | 6,552 | |
China Merchants Shekou Industrial Zone Holdings Co., Ltd., Class A | | | 1,800 | | | | 5,179 | |
China Minsheng Banking Corp., Ltd., Class H | | | 6,000 | | | | 5,996 | |
China Mobile, Ltd. | | | 10,500 | | | | 111,434 | |
China National Building Material Co., Ltd., Class H | | | 6,000 | | | | 3,780 | |
China Northern Rare Earth Group High-Tech Co., Ltd. | | | 2,420 | | | | 6,643 | |
China Oilfield Services, Ltd., Class H | | | 2,000 | | | | 1,646 | |
China Overseas Land & Investment, Ltd. | | | 8,000 | | | | 28,058 | |
China Pacific Insurance (Group) Co., Ltd., Class H | | | 1,800 | | | | 8,510 | |
China Petroleum & Chemical Corp., Class H | | | 50,000 | | | | 38,276 | |
China Railway Construction Corp., Ltd., Class H | | | 4,500 | | | | 5,916 | |
China Railway Group, Ltd., Class H | | | 9,000 | | | | 7,216 | |
China Resources Beer Holdings Co., Ltd. | | | 6,000 | | | | 15,068 | |
| | | | | | | | |
| Security | | Shares | | | Value | |
| | | | | | | | |
| | |
China (continued) | | | | | | | | |
China Resources Gas Group, Ltd. | | | 2,000 | | | $ | 7,066 | |
China Resources Land, Ltd. | | | 4,444 | | | | 13,932 | |
China Resources Power Holdings Co., Ltd. | | | 4,000 | | | | 7,356 | |
China Shenhua Energy Co., Ltd., Class H | | | 4,500 | | | | 11,622 | |
China Shipbuilding Industry Co., Ltd.(1)(3) | | | 4,400 | | | | 3,314 | |
China State Construction Engineering Corp., Ltd. | | | 3,500 | | | | 5,304 | |
China State Construction International Holdings, Ltd. | | | 4,000 | | | | 5,806 | |
China Telecom Corp., Ltd., Class H | | | 26,000 | | | | 13,390 | |
China Unicom (Hong Kong), Ltd.(1) | | | 8,000 | | | | 11,622 | |
China United Network Communications, Ltd.(1) | | | 5,800 | | | | 7,071 | |
China Vanke Co., Ltd., Class H | | | 2,600 | | | | 7,804 | |
China Yangtze Power Co., Ltd. | | | 2,500 | | | | 5,683 | |
CITIC, Ltd. | | | 4,000 | | | | 6,154 | |
CNOOC, Ltd. | | | 25,000 | | | | 30,176 | |
COSCO SHIPPING Holdings Co., Ltd., Class H(1) | | | 11,500 | | | | 7,302 | |
COSCO SHIPPING Ports, Ltd. | | | 4,000 | | | | 4,735 | |
Country Garden Holdings Co., Ltd. | | | 19,000 | | | | 25,308 | |
CSPC Pharmaceutical Group, Ltd. | | | 8,000 | | | | 12,501 | |
Ctrip.com International, Ltd. ADR(1) | | | 400 | | | | 20,580 | |
Datang International Power Generation Co., Ltd., Class H(1) | | | 10,000 | | | | 3,289 | |
Dongfeng Motor Group Co., Ltd., Class H | | | 6,000 | | | | 7,804 | |
Fullshare Holdings, Ltd. | | | 17,500 | | | | 6,980 | |
GCL-Poly Energy Holdings, Ltd.(1) | | | 18,000 | | | | 2,029 | |
GD Power Development Co., Ltd.(3) | | | 10,100 | | | | 4,409 | |
Geely Automobile Holdings, Ltd. | | | 10,000 | | | | 24,667 | |
Great Wall Motor Co., Ltd., Class H | | | 6,000 | | | | 7,552 | |
Gree Electric Appliances, Inc. of Zhuhai, Class A | | | 900 | | | | 5,279 | |
Guangdong Investment, Ltd. | | | 6,000 | | | | 8,873 | |
Guangzhou Automobile Group Co., Ltd., Class H | | | 6,000 | | | | 11,858 | |
Haier Electronics Group Co., Ltd. | | | 3,000 | | | | 7,995 | |
Hangzhou Hikvision Digital Technology Co., Ltd., Class A | | | 1,100 | | | | 5,373 | |
Hengan International Group Co., Ltd. | | | 2,500 | | | | 20,925 | |
Huadian Power International Corp., Ltd., Class H | | | 22,000 | | | | 9,037 | |
Huaneng Power International, Inc., Class H | | | 28,000 | | | | 18,316 | |
Industrial & Commercial Bank of China, Ltd., Class H | | | 23,000 | | | | 17,284 | |
Inner Mongolia Yili Industrial Group Co., Ltd. | | | 1,800 | | | | 6,366 | |
Jiangsu Expressway Co., Ltd., Class H | | | 4,000 | | | | 6,140 | |
Jiangsu Hengrui Medicine Co., Ltd. | | | 1,080 | | | | 8,863 | |
Jiangsu Yanghe Brewery Joint-Stock Co., Ltd., Class A | | | 400 | | | | 5,423 | |
Jiangxi Copper Co., Ltd., Class H | | | 6,000 | | | | 10,445 | |
Kingboard Chemical Holdings, Ltd. | | | 2,500 | | | | 13,666 | |
Kunlun Energy Co., Ltd. | | | 4,000 | | | | 3,882 | |
Kweichow Moutai Co., Ltd. | | | 100 | | | | 7,448 | |
Lee & Man Paper Manufacturing, Ltd. | | | 8,000 | | | | 9,348 | |
Lenovo Group, Ltd. | | | 6,000 | | | | 3,290 | |
Longfor Properties Co., Ltd. | | | 3,500 | | | | 8,421 | |
| | | | |
| | 8 | | See Notes to Financial Statements. |
Parametric Emerging Markets Core Fund
August 31, 2017
Portfolio of Investments — continued
| | | | | | | | |
| Security | | Shares | | | Value | |
| | | | | | | | |
| | |
China (continued) | | | | | | | | |
Midea Group Co., Ltd., Class A | | | 900 | | | $ | 5,600 | |
NetEase, Inc. ADR | | | 100 | | | | 27,584 | |
New Oriental Education & Technology Group, Inc. ADR(1) | | | 290 | | | | 23,708 | |
Nine Dragons Paper Holdings, Ltd. | | | 7,000 | | | | 11,709 | |
Offshore Oil Engineering Co., Ltd. | | | 4,400 | | | | 4,273 | |
PetroChina Co., Ltd., Class H | | | 40,000 | | | | 25,630 | |
PICC Property & Casualty Co., Ltd., Class H | | | 4,000 | | | | 7,536 | |
Ping An Bank Co., Ltd., Class A | | | 3,600 | | | | 6,158 | |
Ping An Insurance (Group) Co. of China, Ltd., Class H | | | 1,000 | | | | 7,965 | |
Poly Real Estate Group Co., Ltd. | | | 4,200 | | | | 6,569 | |
SAIC Motor Corp., Ltd. | | | 1,300 | | | | 5,870 | |
Sanan Optoelectronics Co., Ltd. | | | 2,600 | | | | 7,730 | |
Semiconductor Manufacturing International Corp.(1) | | | 6,000 | | | | 5,656 | |
Shandong Gold Mining Co., Ltd. | | | 900 | | | | 4,461 | |
Shandong Weigao Group Medical Polymer Co., Ltd., Class H | | | 12,000 | | | | 9,577 | |
Shanghai Fosun Pharmaceutical Group Co., Ltd. | | | 3,000 | | | | 11,295 | |
Shanghai Industrial Holdings, Ltd. | | | 2,000 | | | | 6,097 | |
Shanghai Oriental Pearl Group Co., Ltd. | | | 1,400 | | | | 4,482 | |
Shanghai Pharmaceuticals Holding Co., Ltd., Class H | | | 4,100 | | | | 10,091 | |
Shanghai Pudong Development Bank Co., Ltd. | | | 2,588 | | | | 4,990 | |
Shimao Property Holdings, Ltd. | | | 2,000 | | | | 4,136 | |
Sihuan Pharmaceutical Holdings Group, Ltd. | | | 14,000 | | | | 5,395 | |
SINA Corp.(1) | | | 100 | | | | 10,183 | |
Sino Biopharmaceutical, Ltd. | | | 19,000 | | | | 16,707 | |
Sino-Ocean Group Holding, Ltd. | | | 8,500 | | | | 5,878 | |
Sinopec Shanghai Petrochemical Co., Ltd., Class H | | | 21,000 | | | | 13,109 | |
Sinopharm Group Co., Ltd., Class H | | | 5,200 | | | | 23,541 | |
Sohu.com, Inc.(1) | | | 100 | | | | 5,334 | |
Sun Art Retail Group, Ltd. | | | 4,500 | | | | 4,144 | |
Sunac China Holdings, Ltd. | | | 5,000 | | | | 15,043 | |
Tencent Holdings, Ltd. | | | 3,600 | | | | 151,487 | |
Tianqi Lithium Corp., Class A | | | 500 | | | | 5,300 | |
Tingyi (Cayman Islands) Holding Corp. | | | 4,000 | | | | 5,332 | |
Tsingtao Brewery Co., Ltd., Class H | | | 1,000 | | | | 4,156 | |
Want Want China Holdings, Ltd. | | | 20,000 | | | | 13,245 | |
Weibo Corp. ADR(1) | | | 20 | | | | 2,022 | |
Weichai Power Co., Ltd., Class H | | | 4,000 | | | | 4,131 | |
WH Group, Ltd.(2) | | | 17,000 | | | | 17,818 | |
Wuliangye Yibin Co., Ltd., Class A | | | 600 | | | | 5,050 | |
Xinyi Glass Holdings, Ltd. | | | 6,000 | | | | 5,990 | |
Yangzijiang Shipbuilding Holdings, Ltd. | | | 7,000 | | | | 7,737 | |
Yanzhou Coal Mining Co., Ltd., Class H | | | 4,000 | | | | 4,029 | |
Yunnan Baiyao Group Co., Ltd., Class A | | | 400 | | | | 5,278 | |
Zhejiang Expressway Co., Ltd., Class H | | | 6,000 | | | | 7,510 | |
Zijin Mining Group Co., Ltd., Class H | | | 20,000 | | | | 7,343 | |
| | | | | | | | | |
| | | $ | 1,621,864 | |
| | | | | | | | | |
| | | | | | | | |
| Security | | Shares | | | Value | |
| | | | | | | | |
| | |
Colombia — 1.7% | | | | | | | | |
Almacenes Exito SA | | | 1,060 | | | $ | 5,521 | |
Avianca Holdings SA, PFC Shares | | | 8,314 | | | | 7,921 | |
Banco de Bogota SA | | | 340 | | | | 7,952 | |
Bancolombia SA | | | 1,001 | | | | 11,200 | |
Bancolombia SA ADR, PFC Shares | | | 340 | | | | 15,439 | |
Cementos Argos SA | | | 1,910 | | | | 7,745 | |
Cemex Latam Holdings SA(1) | | | 2,933 | | | | 11,138 | |
Corporacion Financiera Colombiana SA | | | 531 | | | | 5,182 | |
Ecopetrol SA ADR | | | 2,860 | | | | 26,341 | |
Empresa de Energia de Bogota SA | | | 12,100 | | | | 8,000 | |
Grupo Argos SA | | | 2,148 | | | | 15,280 | |
Grupo Aval Acciones y Valores SA | | | 15,110 | | | | 6,712 | |
Grupo Aval Acciones y Valores SA, PFC Shares | | | 14,800 | | | | 6,624 | |
Grupo de Inversiones Suramericana SA | | | 540 | | | | 7,598 | |
Grupo Nutresa SA | | | 2,220 | | | | 20,429 | |
Interconexion Electrica SA | | | 8,220 | | | | 37,236 | |
| | | | | | | | | |
| | | $ | 200,318 | |
| | | | | | | | | |
| | |
Czech Republic — 0.9% | | | | | | | | |
CEZ AS | | | 1,842 | | | $ | 34,959 | |
Komercni Banka AS | | | 980 | | | | 43,184 | |
Pegas Nonwovens SA | | | 400 | | | | 18,351 | |
Unipetrol AS | | | 1,100 | | | | 14,727 | |
| | | | | | | | | |
| | | $ | 111,221 | |
| | | | | | | | | |
| | |
Egypt — 0.8% | | | | | | | | |
Commercial International Bank Egypt SAE | | | 5,300 | | | $ | 25,254 | |
Eastern Tobacco | | | 700 | | | | 11,500 | |
Egyptian Financial Group-Hermes Holding Co. | | | 3,700 | | | | 4,321 | |
ElSewedy Electric Co. | | | 1,300 | | | | 6,497 | |
Ezz Steel(1) | | | 7,139 | | | | 6,757 | |
Global Telecom Holding SAE(1) | | | 25,093 | | | | 9,861 | |
Juhayna Food Industries(1) | | | 11,399 | | | | 4,649 | |
Medinet Nasr Housing | | | 10,630 | | | | 5,901 | |
Oriental Weavers Co. | | | 6,200 | | | | 6,429 | |
Talaat Moustafa Group | | | 16,900 | | | | 7,401 | |
Telecom Egypt | | | 7,836 | | | | 5,632 | |
| | | | | | | | | |
| | | $ | 94,202 | |
| | | | | | | | | |
| | |
Greece — 1.9% | | | | | | | | |
Aegean Airlines SA | | | 769 | | | $ | 7,291 | |
Alpha Bank AE(1) | | | 2,958 | | | | 7,504 | |
Athens Water Supply & Sewage Co. SA | | | 901 | | | | 6,485 | |
Costamare, Inc. | | | 500 | | | | 3,135 | |
Diana Shipping, Inc.(1) | | | 1,630 | | | | 6,471 | |
| | | | |
| | 9 | | See Notes to Financial Statements. |
Parametric Emerging Markets Core Fund
August 31, 2017
Portfolio of Investments — continued
| | | | | | | | |
| Security | | Shares | | | Value | |
| | | | | | | | |
| | |
Greece (continued) | | | | | | | | |
Ellaktor SA(1) | | | 2,996 | | | $ | 5,736 | |
Eurobank Ergasias SA(1) | | | 7,607 | | | | 8,210 | |
GasLog, Ltd. | | | 200 | | | | 3,360 | |
Hellenic Exchanges - Athens Stock Exchange SA | | | 1,170 | | | | 7,111 | |
Hellenic Petroleum SA | | | 1,050 | | | | 9,520 | |
Hellenic Telecommunications Organization SA | | | 2,050 | | | | 26,113 | |
Holding Co. ADMIE IPTO SA(1) | | | 2,630 | | | | 6,512 | |
JUMBO SA | | | 1,035 | | | | 17,255 | |
Motor Oil (Hellas) Corinth Refineries SA | | | 972 | | | | 21,861 | |
Mytilineos Holdings SA(1) | | | 1,510 | | | | 15,427 | |
National Bank of Greece SA(1) | | | 31,854 | | | | 12,909 | |
OPAP SA | | | 1,233 | | | | 13,778 | |
Public Power Corp. SA(1) | | | 2,630 | | | | 7,046 | |
Sarantis SA | | | 600 | | | | 8,572 | |
Titan Cement Co. SA | | | 890 | | | | 25,250 | |
Tsakos Energy Navigation, Ltd. | | | 1,100 | | | | 4,950 | |
| | | | | | | | | |
| | | $ | 224,496 | |
| | | | | | | | | |
| | |
Hungary — 1.0% | | | | | | | | |
Magyar Telekom Telecommunications PLC | | | 5,560 | | | $ | 10,567 | |
MOL Hungarian Oil & Gas Rt. | | | 400 | | | | 37,110 | |
OTP Bank PLC | | | 970 | | | | 39,466 | |
Richter Gedeon Nyrt. | | | 1,210 | | | | 31,506 | |
| | | | | | | | | |
| | | $ | 118,649 | |
| | | | | | | | | |
| | |
India — 6.5% | | | | | | | | |
Axis Bank, Ltd. GDR(4) | | | 966 | | | $ | 37,239 | |
Dr. Reddy’s Laboratories, Ltd. ADR | | | 2,100 | | | | 67,599 | |
ICICI Bank, Ltd. ADR | | | 4,667 | | | | 43,730 | |
Infosys, Ltd. ADR | | | 4,790 | | | | 71,850 | |
Larsen & Toubro, Ltd. GDR(4) | | | 2,543 | | | | 45,011 | |
Larsen & Toubro, Ltd. GDR(4) | | | 2,284 | | | | 40,510 | |
Mahindra & Mahindra, Ltd. GDR | | | 1,470 | | | | 30,743 | |
Mahindra & Mahindra, Ltd. GDR | | | 224 | | | | 4,670 | |
MakeMyTrip, Ltd.(1) | | | 786 | | | | 26,803 | |
Reliance Industries, Ltd. GDR(2) | | | 1,933 | | | | 95,786 | |
Reliance Industries, Ltd. GDR(2) | | | 782 | | | | 38,670 | |
State Bank of India GDR(4) | | | 771 | | | | 33,416 | |
Tata Motors, Ltd. ADR(1) | | | 952 | | | | 28,427 | |
Tata Steel, Ltd. GDR(4) | | | 3,667 | | | | 36,191 | |
Tata Steel, Ltd. GDR(4) | | | 3,122 | | | | 30,814 | |
Vedanta, Ltd. ADR | | | 2,931 | | | | 57,448 | |
Videocon d2h, Ltd. ADR(1) | | | 2,700 | | | | 24,948 | |
Wipro, Ltd. ADR | | | 5,336 | | | | 31,696 | |
WNS Holdings, Ltd. ADR(1) | | | 819 | | | | 28,665 | |
| | | | | | | | | |
| | | $ | 774,216 | |
| | | | | | | | | |
| | | | | | | | |
| Security | | Shares | | | Value | |
| | | | | | | | |
| | |
Indonesia — 3.3% | | | | | | | | |
Adaro Energy Tbk PT | | | 189,400 | | | $ | 25,978 | |
AKR Corporindo Tbk PT | | | 14,000 | | | | 7,115 | |
Aneka Tambang Persero Tbk PT(1) | | | 40,500 | | | | 2,250 | |
Astra International Tbk PT | | | 51,000 | | | | 30,148 | |
Bank Central Asia Tbk PT | | | 14,700 | | | | 20,882 | |
Bank CIMB Niaga Tbk PT(1) | | | 736 | | | | 77 | |
Bank Danamon Indonesia Tbk PT | | | 14,000 | | | | 5,730 | |
Bank Mandiri Persero Tbk PT | | | 23,500 | | | | 23,118 | |
Bank Negara Indonesia Persero Tbk PT | | | 22,000 | | | | 12,156 | |
Bank Rakyat Indonesia Persero Tbk PT | | | 12,700 | | | | 14,438 | |
Bumi Resources Tbk PT(1) | | | 116,500 | | | | 1,996 | |
Bumi Serpong Damai Tbk PT | | | 38,500 | | | | 5,306 | |
Charoen Pokphand Indonesia Tbk PT | | | 23,500 | | | | 4,885 | |
Global Mediacom Tbk PT | | | 29,500 | | | | 1,080 | |
Gudang Garam Tbk PT | | | 1,500 | | | | 7,788 | |
Indo Tambangraya Megah Tbk PT | | | 2,000 | | | | 2,919 | |
Indocement Tunggal Prakarsa Tbk PT | | | 7,000 | | | | 10,402 | |
Indofood CBP Sukses Makmur Tbk PT | | | 11,000 | | | | 7,202 | |
Indofood Sukses Makmur Tbk PT | | | 14,500 | | | | 9,120 | |
Jasa Marga (Persero) Tbk PT | | | 10,673 | | | | 4,659 | |
Kalbe Farma Tbk PT | | | 210,800 | | | | 27,079 | |
Lippo Karawaci Tbk PT | | | 62,500 | | | | 3,680 | |
Medco Energi Internasional Tbk PT(1) | | | 21,000 | | | | 5,199 | |
Media Nusantara Citra Tbk PT | | | 19,000 | | | | 2,123 | |
Mitra Keluarga Karyasehat Tbk PT | | | 26,800 | | | | 4,568 | |
MNC Investama Tbk PT(1) | | | 214,500 | | | | 1,592 | |
Pembangunan Perumahan Persero Tbk PT | | | 50,556 | | | | 10,667 | |
Perusahaan Gas Negara Persero Tbk PT | | | 39,500 | | | | 6,286 | |
Semen Indonesia Persero Tbk PT | | | 15,500 | | | | 12,191 | |
Sugih Energy Tbk PT(1)(3) | | | 194,200 | | | | 582 | |
Summarecon Agung Tbk PT | | | 62,500 | | | | 4,907 | |
Surya Semesta Internusa Tbk PT | | | 78,000 | | | | 3,894 | |
Tambang Batubara Bukit Asam Tbk PT | | | 5,000 | | | | 4,646 | |
Telekomunikasi Indonesia Persero Tbk PT | | | 168,500 | | | | 59,440 | |
Tower Bersama Infrastructure Tbk PT | | | 10,000 | | | | 4,820 | |
Unilever Indonesia Tbk PT | | | 3,500 | | | | 13,269 | |
United Tractors Tbk PT | | | 9,000 | | | | 20,459 | |
Vale Indonesia Tbk PT(1) | | | 22,500 | | | | 5,009 | |
Wijaya Karya Persero Tbk PT | | | 30,000 | | | | 4,472 | |
XL Axiata Tbk PT(1) | | | 13,500 | | | | 3,645 | |
| | | | | | | | | |
| | | $ | 395,777 | |
| | | | | | | | | |
| | |
Kuwait — 1.6% | | | | | | | | |
Agility Public Warehousing Co. KSC | | | 8,561 | | | $ | 24,810 | |
Commercial Real Estate Co. KSCC | | | 16,000 | | | | 5,111 | |
Gulf Bank | | | 16,537 | | | | 13,159 | |
| | | | |
| | 10 | | See Notes to Financial Statements. |
Parametric Emerging Markets Core Fund
August 31, 2017
Portfolio of Investments — continued
| | | | | | | | |
| Security | | Shares | | | Value | |
| | | | | | | | |
| | |
Kuwait (continued) | | | | | | | | |
Gulf National Holding Co.(1)(3) | | | 3,323 | | | $ | 0 | |
Jazeera Airways Co. KSC | | | 3,859 | | | | 7,273 | |
Kuwait Finance House KSCP | | | 10,528 | | | | 20,613 | |
Mabanee Co. SAKC | | | 6,654 | | | | 17,448 | |
Mobile Telecommunications Co. | | | 17,436 | | | | 28,776 | |
National Bank of Kuwait SAK | | | 10,098 | | | | 24,783 | |
National Industries Group Holding SAK(1) | | | 14,099 | | | | 6,620 | |
Qurain Petrochemical Industries Co. KSC | | | 25,000 | | | | 29,028 | |
Salhia Real Estate Co. KSCP | | | 4,000 | | | | 4,896 | |
VIVA Kuwait Telecom Co. | | | 1,924 | | | | 5,111 | |
| | | | | | | | | |
| | | $ | 187,628 | |
| | | | | | | | | |
| | |
Malaysia — 3.3% | | | | | | | | |
AMMB Holdings Bhd | | | 2,300 | | | $ | 2,312 | |
Astro Malaysia Holdings Bhd | | | 5,400 | | | | 3,392 | |
Axiata Group Bhd | | | 6,900 | | | | 7,989 | |
Batu Kawan Bhd | | | 1,500 | | | | 6,636 | |
Berjaya Sports Toto Bhd | | | 3,915 | | | | 2,063 | |
British American Tobacco Malaysia Bhd | | | 400 | | | | 4,142 | |
Bumi Armada Bhd(1) | | | 35,450 | | | | 6,133 | |
CIMB Group Holdings Bhd | | | 4,700 | | | | 7,809 | |
Dialog Group Bhd | | | 17,336 | | | | 8,337 | |
Digi.com Bhd | | | 8,900 | | | | 10,096 | |
Felda Global Ventures Holdings Bhd | | | 3,700 | | | | 1,347 | |
Gamuda Bhd | | | 3,100 | | | | 3,879 | |
Genting Bhd | | | 6,900 | | | | 15,722 | |
Genting Malaysia Bhd | | | 11,200 | | | | 15,451 | |
HAP Seng Consolidated Bhd | | | 1,800 | | | | 3,838 | |
Hong Leong Bank Bhd | | | 1,100 | | | | 3,982 | |
Hong Leong Financial Group Bhd | | | 1,100 | | | | 4,360 | |
IGB Real Estate Investment Trust | | | 15,400 | | | | 6,207 | |
IHH Healthcare Bhd | | | 15,700 | | | | 21,978 | |
IJM Corp. Bhd | | | 10,200 | | | | 7,982 | |
IOI Corp. Bhd | | | 11,600 | | | | 12,360 | |
IOI Properties Group Bhd | | | 15,799 | | | | 7,374 | |
KLCCP Stapled Group | | | 2,500 | | | | 4,572 | |
Kuala Lumpur Kepong Bhd | | | 1,800 | | | | 10,347 | |
Lafarge Malaysia Bhd | | | 2,700 | | | | 3,429 | |
Magnum Bhd | | | 4,900 | | | | 2,181 | |
Malayan Banking Bhd | | | 2,400 | | | | 5,322 | |
Maxis Bhd | | | 3,300 | | | | 4,470 | |
MISC Bhd | | | 3,100 | | | | 5,411 | |
My EG Services Bhd | | | 33,600 | | | | 16,731 | |
Parkson Holdings Bhd(1) | | | 5,513 | | | | 667 | |
Petronas Chemicals Group Bhd | | | 14,000 | | | | 23,479 | |
Petronas Dagangan Bhd | | | 2,200 | | | | 12,578 | |
| | | | | | | | |
| Security | | Shares | | | Value | |
| | | | | | | | |
| | |
Malaysia (continued) | | | | | | | | |
Petronas Gas Bhd | | | 1,900 | | | $ | 8,209 | |
PPB Group Bhd | | | 1,100 | | | | 4,301 | |
Public Bank Bhd | | | 2,900 | | | | 13,994 | |
RHB Bank Bhd | | | 2,608 | | | | 3,089 | |
Sapura Energy Bhd | | | 32,400 | | | | 10,543 | |
Silverlake Axis, Ltd. | | | 19,000 | | | | 8,492 | |
Sime Darby Bhd | | | 4,400 | | | | 9,276 | |
Sunway Bhd | | | 11,110 | | | | 11,304 | |
Telekom Malaysia Bhd | | | 5,700 | | | | 8,587 | |
Tenaga Nasional Bhd | | | 5,900 | | | | 19,751 | |
Top Glove Corp. Bhd | | | 5,200 | | | | 6,846 | |
UEM Sunrise Bhd(1) | | | 24,400 | | | | 6,589 | |
UMW Holdings Bhd(1) | | | 1,300 | | | | 1,855 | |
UMW Oil & Gas Corp. Bhd(1) | | | 1,340 | | | | 96 | |
Unisem (M) Bhd | | | 11,300 | | | | 10,884 | |
Yinson Holdings Bhd | | | 7,700 | | | | 6,566 | |
YTL Corp. Bhd | | | 10,500 | | | | 3,521 | |
YTL Power International Bhd | | | 9,555 | | | | 3,157 | |
| | | | | | | | | |
| | | $ | 389,636 | |
| | | | | | | | | |
| | |
Mexico — 7.4% | | | | | | | | |
Alfa SAB de CV, Series A | | | 21,217 | | | $ | 29,667 | |
Alsea SAB de CV | | | 3,900 | | | | 14,178 | |
America Movil SAB de CV, Series L ADR | | | 6,700 | | | | 125,156 | |
Arca Continental SAB de CV | | | 2,500 | | | | 18,245 | |
Bolsa Mexicana de Valores SAB de CV | | | 3,200 | | | | 5,520 | |
Cemex SAB de CV ADR(1) | | | 6,023 | | | | 56,074 | |
Coca-Cola Femsa SAB de CV ADR | | | 140 | | | | 11,456 | |
Concentradora Fibra Danhos SA de CV | | | 9,600 | | | | 17,010 | |
Concentradora Hipotecaria SAPI de CV | | | 4,600 | | | | 5,699 | |
Corp. Inmobiliaria Vesta SAB de CV | | | 5,300 | | | | 7,787 | |
El Puerto de Liverpool SAB de CV | | | 1,270 | | | | 11,308 | |
Fibra Uno Administracion SA de CV | | | 24,700 | | | | 43,959 | |
Fomento Economico Mexicano SAB de CV ADR | | | 500 | | | | 50,030 | |
Gentera SAB de CV | | | 4,100 | | | | 6,315 | |
Grupo Aeroportuario del Pacifico SAB de CV, Class B | | | 3,000 | | | | 33,144 | |
Grupo Aeroportuario del Sureste SAB de CV, Class B | | | 1,290 | | | | 26,262 | |
Grupo Bimbo SAB de CV, Series A | | | 6,800 | | | | 16,449 | |
Grupo Carso SAB de CV, Series A1 | | | 2,700 | | | | 10,882 | |
Grupo Elektra SAB de CV | | | 260 | | | | 11,314 | |
Grupo Financiero Banorte SAB de CV, Class O | | | 10,600 | | | | 72,330 | |
Grupo Financiero Inbursa SAB de CV, Class O | | | 10,400 | | | | 17,421 | |
Grupo Financiero Santander Mexico SAB de CV, Class B | | | 8,000 | | | | 16,430 | |
Grupo Mexico SAB de CV, Series B | | | 10,400 | | | | 34,319 | |
Grupo Televisa SAB ADR | | | 2,900 | | | | 74,907 | |
| | | | |
| | 11 | | See Notes to Financial Statements. |
Parametric Emerging Markets Core Fund
August 31, 2017
Portfolio of Investments — continued
| | | | | | | | |
| Security | | Shares | | | Value | |
| | | | | | | | |
| | |
Mexico (continued) | | | | | | | | |
Impulsora del Desarrollo y el Empleo en America Latina SA de CV, Series B1(1) | | | 4,800 | | | $ | 9,155 | |
Industrias Penoles SAB de CV | | | 590 | | | | 15,349 | |
Infraestructura Energetica Nova SAB de CV | | | 4,200 | | | | 22,901 | |
Kimberly-Clark de Mexico SAB de CV, Class A | | | 5,100 | | | | 10,023 | |
Macquarie Mexico Real Estate Management SA de CV | | | 7,900 | | | | 10,587 | |
Mexichem SAB de CV | | | 4,203 | | | | 11,190 | |
Minera Frisco SAB de CV(1) | | | 3,600 | | | | 2,477 | |
Nemak SAB de CV(2) | | | 9,400 | | | | 7,912 | |
PLA Administradora Industrial S de RL de CV(1) | | | 5,900 | | | | 10,055 | |
Prologis Property Mexico SA de CV | | | 3,500 | | | | 7,137 | |
Promotora y Operadora de Infraestructura SAB de CV | | | 1,500 | | | | 16,392 | |
Wal-Mart de Mexico SAB de CV, Series V | | | 18,600 | | | | 45,254 | |
| | | | | | | | | |
| | | $ | 884,294 | |
| | | | | | | | | |
| | |
Pakistan — 1.2% | | | | | | | | |
Bank AL Habib, Ltd. | | | 12,000 | | | $ | 6,322 | |
Engro Corp., Ltd. | | | 3,000 | | | | 8,063 | |
Engro Foods, Ltd. | | | 3,100 | | | | 2,538 | |
Fauji Fertilizer Co., Ltd. | | | 8,400 | | | | 5,654 | |
Ferozsons Laboratories, Ltd. | | | 600 | | | | 1,732 | |
Habib Bank, Ltd. | | | 5,800 | | | | 9,795 | |
Honda Atlas Cars Pakistan, Ltd. | | | 750 | | | | 3,923 | |
Hub Power Co., Ltd. | | | 13,500 | | | | 14,442 | |
Indus Motor Co., Ltd. | | | 300 | | | | 4,855 | |
K-Electric, Ltd.(1) | | | 66,000 | | | | 3,816 | |
Kot Addu Power Co., Ltd. | | | 7,500 | | | | 5,197 | |
Lucky Cement, Ltd. | | | 2,000 | | | | 11,355 | |
MCB Bank, Ltd. | | | 6,000 | | | | 11,031 | |
Millat Tractors, Ltd. | | | 450 | | | | 4,998 | |
Nishat Mills, Ltd. | | | 4,500 | | | | 6,117 | |
Oil & Gas Development Co., Ltd. | | | 8,500 | | | | 11,395 | |
Pak Elektron, Ltd. | | | 6,500 | | | | 4,542 | |
Pak Suzuki Motor Co., Ltd. | | | 750 | | | | 3,214 | |
Pakistan Petroleum, Ltd. | | | 4,500 | | | | 7,059 | |
Pakistan State Oil Co., Ltd. | | | 1,800 | | | | 7,188 | |
Pakistan Telecommunication Co., Ltd. | | | 34,500 | | | | 4,555 | |
Searle Co., Ltd. (The) | | | 1,984 | | | | 7,445 | |
| | | | | | | | | |
| | | $ | 145,236 | |
| | | | | | | | | |
| | |
Peru — 1.7% | | | | | | | | |
Alicorp SAA | | | 11,251 | | | $ | 30,389 | |
Cia de Minas Buenaventura SA ADR | | | 1,677 | | | | 22,522 | |
Credicorp, Ltd. | | | 365 | | | | 74,037 | |
Ferreycorp SAA | | | 13,414 | | | | 7,950 | |
| | | | | | | | |
| Security | | Shares | | | Value | |
| | | | | | | | |
| | |
Peru (continued) | | | | | | | | |
Grana y Montero SAA(1) | | | 5,300 | | | $ | 3,730 | |
Intercorp Financial Services, Inc. | | | 220 | | | | 7,700 | |
Southern Copper Corp. | | | 1,275 | | | | 51,893 | |
Volcan Cia Minera SAA, Class B | | | 17,440 | | | | 5,007 | |
| | | | | | | | | |
| | | $ | 203,228 | |
| | | | | | | | | |
| | |
Philippines — 3.2% | | | | | | | | |
Aboitiz Equity Ventures, Inc. | | | 8,900 | | | $ | 12,948 | |
Aboitiz Power Corp. | | | 16,600 | | | | 12,823 | |
ABS-CBN Holdings Corp. | | | 5,000 | | | | 3,908 | |
Alliance Global Group, Inc. | | | 16,900 | | | | 4,591 | |
Ayala Corp. | | | 710 | | | | 12,782 | |
Ayala Land, Inc. | | | 16,000 | | | | 13,145 | |
Bank of the Philippine Islands | | | 4,747 | | | | 9,828 | |
BDO Unibank, Inc. | | | 6,471 | | | | 16,098 | |
Bloomberry Resorts Corp.(1) | | | 36,500 | | | | 7,999 | |
CEMEX Holdings Philippines, Inc.(1)(2) | | | 36,600 | | | | 4,292 | |
Cosco Capital, Inc. | | | 33,300 | | | | 5,104 | |
D&L Industries, Inc. | | | 58,400 | | | | 11,807 | |
Emperador, Inc. | | | 20,800 | | | | 2,854 | |
Energy Development Corp. | | | 66,300 | | | | 8,791 | |
First Gen Corp. | | | 8,400 | | | | 2,763 | |
Globe Telecom, Inc. | | | 260 | | | | 10,164 | |
GT Capital Holdings, Inc. | | | 230 | | | | 5,027 | |
International Container Terminal Services, Inc. | | | 4,940 | | | | 10,096 | |
JG Summit Holdings, Inc. | | | 11,440 | | | | 16,055 | |
Jollibee Foods Corp. | | | 3,780 | | | | 17,618 | |
LT Group, Inc. | | | 17,100 | | | | 5,924 | |
Manila Electric Co. | | | 2,270 | | | | 12,021 | |
Manila Water Co. | | | 7,700 | | | | 4,663 | |
Megaworld Corp. | | | 42,400 | | | | 4,098 | |
Melco Resorts And Entertainment (Philippines) Corp.(1) | | | 23,000 | | | | 3,999 | |
Metro Pacific Investments Corp. | | | 64,900 | | | | 8,062 | |
Metropolitan Bank & Trust Co. | | | 5,781 | | | | 9,898 | |
Petron Corp. | | | 33,700 | | | | 6,457 | |
PLDT, Inc. | | | 890 | | | | 30,118 | |
Puregold Price Club, Inc. | | | 10,600 | | | | 9,955 | |
Robinsons Land Corp. | | | 9,100 | | | | 4,128 | |
Robinsons Retail Holdings, Inc. | | | 4,660 | | | | 8,269 | |
Semirara Mining & Power Corp. | | | 5,250 | | | | 17,811 | |
SM Investments Corp. | | | 1,200 | | | | 19,009 | |
SM Prime Holdings, Inc. | | | 38,500 | | | | 25,134 | |
Travellers International Hotel Group, Inc. | | | 27,500 | | | | 1,833 | |
Universal Robina Corp. | | | 6,350 | | | | 18,156 | |
| | | | | | | | | |
| | | $ | 378,228 | |
| | | | | | | | | |
| | | | |
| | 12 | | See Notes to Financial Statements. |
Parametric Emerging Markets Core Fund
August 31, 2017
Portfolio of Investments — continued
| | | | | | | | |
| Security | | Shares | | | Value | |
| | |
Poland — 3.8% | | | | | | | | |
Alior Bank SA(1) | | | 348 | | | $ | 6,439 | |
AmRest Holdings SE(1) | | | 88 | | | | 8,809 | |
Asseco Poland SA | | | 1,570 | | | | 19,946 | |
Bank Pekao SA | | | 530 | | | | 19,039 | |
Bank Zachodni WBK SA | | | 146 | | | | 15,137 | |
Bioton SA(1) | | | 1,668 | | | | 2,689 | |
Budimex SA | | | 123 | | | | 7,838 | |
CCC SA | | | 180 | | | | 13,233 | |
Ciech SA(1) | | | 245 | | | | 4,310 | |
Cyfrowy Polsat SA | | | 1,700 | | | | 12,779 | |
Enea SA | | | 1,934 | | | | 8,275 | |
Energa SA(1) | | | 1,332 | | | | 5,101 | |
Eurocash SA | | | 1,060 | | | | 11,636 | |
Grupa Lotos SA(1) | | | 393 | | | | 6,492 | |
ING Bank Slaski SA(1) | | | 210 | | | | 11,784 | |
Jastrzebska Spolka Weglowa SA(1) | | | 688 | | | | 20,070 | |
KGHM Polska Miedz SA | | | 897 | | | | 31,744 | |
KRUK SA | | | 110 | | | | 10,518 | |
LPP SA | | | 10 | | | | 24,494 | |
mBank SA(1) | | | 70 | | | | 8,609 | |
Orange Polska SA(1) | | | 10,040 | | | | 16,881 | |
PGE SA | | | 10,129 | | | | 40,561 | |
PKP Cargo SA(1) | | | 622 | | | | 11,133 | |
Polski Koncern Naftowy ORLEN SA | | | 1,260 | | | | 41,684 | |
Polskie Gornictwo Naftowe i Gazownictwo SA | | | 5,950 | | | | 11,394 | |
Powszechna Kasa Oszczednosci Bank Polski SA(1) | | | 3,370 | | | | 34,674 | |
Powszechny Zaklad Ubezpieczen SA | | | 2,300 | | | | 31,312 | |
Synthos SA | | | 3,160 | | | | 4,235 | |
Tauron Polska Energia SA(1) | | | 10,610 | | | | 11,666 | |
| | | | | | | | | |
| | | $ | 452,482 | |
| | | | | | | | | |
| | |
Qatar — 1.2% | | | | | | | | |
Barwa Real Estate Co. | | | 775 | | | $ | 6,664 | |
Doha Bank QPSC | | | 1,370 | | | | 11,233 | |
Industries Qatar | | | 490 | | | | 12,139 | |
Masraf Al Rayan QSC | | | 2,100 | | | | 21,759 | |
Ooredoo QSC | | | 560 | | | | 13,349 | |
Qatar Electricity & Water Co. QSC | | | 528 | | | | 26,618 | |
Qatar Gas Transport Co., Ltd. | | | 4,990 | | | | 23,090 | |
Qatar Islamic Bank | | | 1,120 | | | | 28,241 | |
United Development Co. QSC | | | 1,300 | | | | 5,358 | |
| | | | | | | | | |
| | | $ | 148,451 | |
| | | | | | | | | |
| | |
Russia — 6.1% | | | | | | | | |
Alrosa PJSC | | | 10,400 | | | $ | 14,477 | |
Gazprom PJSC ADR | | | 13,537 | | | | 54,095 | |
| | | | | | | | |
| Security | | Shares | | | Value | |
| | |
Russia (continued) | | | | | | | | |
Globaltrans Investment PLC GDR(4) | | | 780 | | | $ | 7,919 | |
Inter RAO UES PJSC | | | 196,000 | | | | 13,081 | |
Lukoil PJSC ADR | | | 1,022 | | | | 51,460 | |
Magnit PJSC | | | 430 | | | | 80,440 | |
Mail.ru Group, Ltd. GDR(1)(4) | | | 660 | | | | 19,566 | |
MegaFon PJSC GDR(4) | | | 1,200 | | | | 11,874 | |
MMC Norilsk Nickel PJSC ADR | | | 1,990 | | | | 33,373 | |
MMC Norilsk Nickel PJSC ADR | | | 690 | | | | 11,585 | |
Mobile TeleSystems PJSC | | | 12,250 | | | | 57,065 | |
Novatek PJSC GDR(4) | | | 178 | | | | 18,831 | |
Novolipetsk Steel PJSC GDR | | | 440 | | | | 10,462 | |
Polymetal International PLC | | | 980 | | | | 11,199 | |
Rosneft Oil Co. PJSC GDR(4) | | | 2,470 | | | | 12,857 | |
RusHydro PJSC ADR | | | 13,220 | | | | 18,740 | |
Sberbank of Russia PJSC ADR | | | 8,342 | | | | 114,207 | |
Severstal PJSC GDR(4) | | | 615 | | | | 9,740 | |
Sistema PJSC FC | | | 20,540 | | | | 4,122 | |
Surgutneftegas OJSC ADR | | | 2,614 | | | | 11,969 | |
Surgutneftegas OJSC, PFC Shares | | | 19,130 | | | | 9,448 | |
Tatneft PJSC ADR | | | 642 | | | | 25,666 | |
Transneft PJSC, PFC Shares | | | 4 | | | | 12,277 | |
VEON, Ltd. ADR | | | 1,300 | | | | 5,486 | |
VTB Bank PJSC GDR(4) | | | 5,395 | | | | 12,084 | |
X5 Retail Group NV GDR(1)(4) | | | 770 | | | | 31,426 | |
Yandex NV, Class A(1) | | | 2,000 | | | | 60,020 | |
| | | | | | | | | |
| | | $ | 723,469 | |
| | | | | | | | | |
| | |
South Africa — 6.8% | | | | | | | | |
AECI, Ltd. | | | 410 | | | $ | 3,374 | |
African Rainbow Minerals, Ltd. | | | 1,915 | | | | 16,216 | |
Anglo American Platinum, Ltd.(1) | | | 150 | | | | 4,067 | |
AngloGold Ashanti, Ltd. | | | 920 | | | | 9,315 | |
Aspen Pharmacare Holdings, Ltd. | | | 1,570 | | | | 35,004 | |
Assore, Ltd. | | | 120 | | | | 2,562 | |
AVI, Ltd. | | | 840 | | | | 6,386 | |
Barclays Africa Group, Ltd. | | | 710 | | | | 8,102 | |
Barloworld, Ltd. | | | 1,160 | | | | 11,465 | |
Bid Corp., Ltd. | | | 1,270 | | | | 28,867 | |
Bidvest Group, Ltd. (The) | | | 1,270 | | | | 16,748 | |
Coronation Fund Managers, Ltd. | | | 730 | | | | 3,955 | |
DataTec, Ltd. | | | 1,300 | | | | 5,657 | |
Discovery, Ltd. | | | 820 | | | | 9,500 | |
Exxaro Resources, Ltd. | | | 370 | | | | 3,729 | |
FirstRand, Ltd. | | | 4,690 | | | | 20,049 | |
Fortress Income Fund, Ltd., Class A | | | 1,635 | | | | 2,205 | |
Fortress Income Fund, Ltd., Class B | | | 1,635 | | | | 4,955 | |
| | | | |
| | 13 | | See Notes to Financial Statements. |
Parametric Emerging Markets Core Fund
August 31, 2017
Portfolio of Investments — continued
| | | | | | | | |
| Security | | Shares | | | Value | |
| | |
South Africa (continued) | | | | | | | | |
Foschini Group, Ltd. (The) | | | 460 | | | $ | 5,426 | |
Gold Fields, Ltd. | | | 1,860 | | | | 8,306 | |
Grindrod, Ltd.(1) | | | 2,010 | | | | 2,088 | |
Growthpoint Properties, Ltd. | | | 5,530 | | | | 10,701 | |
Hosken Consolidated Investments, Ltd. | | | 500 | | | | 5,113 | |
Impala Platinum Holdings, Ltd.(1) | | | 1,260 | | | | 3,897 | |
Imperial Holdings, Ltd. | | | 400 | | | | 6,424 | |
Investec, Ltd. | | | 760 | | | | 5,794 | |
Kumba Iron Ore, Ltd. | | | 150 | | | | 2,470 | |
Life Healthcare Group Holdings, Ltd. | | | 2,100 | | | | 4,269 | |
Massmart Holdings, Ltd. | | | 280 | | | | 2,619 | |
MMI Holdings, Ltd. | | | 2,370 | | | | 3,793 | |
Mondi, Ltd. | | | 330 | | | | 9,010 | |
Mr Price Group, Ltd. | | | 420 | | | | 5,855 | |
MTN Group, Ltd. | | | 6,420 | | | | 63,880 | |
Murray & Roberts Holdings, Ltd. | | | 2,770 | | | | 3,247 | |
Nampak, Ltd.(1) | | | 1,560 | | | | 2,270 | |
Naspers, Ltd., Class N | | | 780 | | | | 176,693 | |
Nedbank Group, Ltd. | | | 390 | | | | 6,593 | |
Netcare, Ltd. | | | 2,470 | | | | 4,593 | |
PPC, Ltd.(1) | | | 1,620 | | | | 707 | |
Rand Merchant Investment Holdings, Ltd. | | | 1,790 | | | | 5,731 | |
Redefine Properties, Ltd. | | | 6,150 | | | | 5,041 | |
Remgro, Ltd. | | | 860 | | | | 14,379 | |
Reunert, Ltd. | | | 1,110 | | | | 5,938 | |
RMB Holdings, Ltd. | | | 1,540 | | | | 7,868 | |
Sanlam, Ltd. | | | 3,380 | | | | 18,673 | |
Sappi, Ltd. | | | 1,216 | | | | 8,180 | |
Sasol, Ltd. | | | 2,180 | | | | 65,919 | |
Shoprite Holdings, Ltd. | | | 1,910 | | | | 33,086 | |
SPAR Group, Ltd. (The) | | | 390 | | | | 5,071 | |
Standard Bank Group, Ltd. | | | 2,250 | | | | 28,999 | |
Steinhoff International Holdings NV | | | 3,060 | | | | 14,758 | |
Tiger Brands, Ltd. | | | 950 | | | | 29,448 | |
Trencor, Ltd. | | | 730 | | | | 2,218 | |
Truworths International, Ltd. | | | 910 | | | | 5,806 | |
Vodacom Group, Ltd. | | | 1,240 | | | | 17,309 | |
Wilson Bayly Holmes-Ovcon, Ltd. | | | 480 | | | | 5,130 | |
Woolworths Holdings, Ltd. | | | 1,220 | | | | 5,570 | |
| | | | | | | | | |
| | | $ | 805,028 | |
| | | | | | | | | |
| | |
South Korea — 7.6% | | | | | | | | |
AMOREPACIFIC Corp. | | | 100 | | | $ | 25,606 | |
BNK Financial Group, Inc. | | | 484 | | | | 4,237 | |
Celltrion, Inc.(1) | | | 125 | | | | 12,799 | |
E-MART, Inc. | | | 50 | | | | 9,956 | |
| | | | | | | | |
| Security | | Shares | | | Value | |
| | |
South Korea (continued) | | | | | | | | |
GS Holdings Corp. | | | 190 | | | $ | 11,928 | |
Hana Financial Group, Inc. | | | 470 | | | | 20,440 | |
Hanwha Chemical Corp. | | | 360 | | | | 11,332 | |
Hanwha Corp. | | | 150 | | | | 6,553 | |
Hyosung Corp. | | | 80 | | | | 11,278 | |
Hyundai Construction Equipment Co., Ltd.(1) | | | 2 | | | | 596 | |
Hyundai Electric & Energy System Co., Ltd.(1) | | | 2 | | | | 483 | |
Hyundai Engineering & Construction Co., Ltd. | | | 120 | | | | 4,338 | |
Hyundai Glovis Co., Ltd. | | | 60 | | | | 8,267 | |
Hyundai Heavy Industries Co., Ltd.(1) | | | 37 | | | | 4,887 | |
Hyundai Mobis Co., Ltd. | | | 70 | | | | 14,668 | |
Hyundai Motor Co. | | | 170 | | | | 21,227 | |
Hyundai Robotics Co., Ltd.(1) | | | 7 | | | | 2,752 | |
Hyundai Steel Co. | | | 120 | | | | 6,146 | |
Industrial Bank of Korea | | | 490 | | | | 6,497 | |
KB Financial Group, Inc. | | | 600 | | | | 29,519 | |
Kia Motors Corp. | | | 300 | | | | 9,448 | |
Korea Electric Power Corp. | | | 630 | | | | 24,074 | |
Korea Investment Holdings Co., Ltd. | | | 130 | | | | 7,592 | |
Korea Zinc Co., Ltd. | | | 30 | | | | 13,737 | |
KT Corp. | | | 360 | | | | 9,964 | |
KT&G Corp. | | | 180 | | | | 18,300 | |
Kwangju Bank Co., Ltd. | | | 45 | | | | 507 | |
LG Chem, Ltd. | | | 90 | | | | 30,328 | |
LG Corp. | | | 160 | | | | 11,944 | |
LG Display Co., Ltd. | | | 330 | | | | 9,156 | |
LG Electronics, Inc. | | | 200 | | | | 14,498 | |
LG Household & Health Care, Ltd. | | | 20 | | | | 17,037 | |
Lotte Chemical Corp. | | | 30 | | | | 10,662 | |
Lotte Shopping Co., Ltd. | | | 30 | | | | 6,846 | |
Macquarie Korea Infrastructure Fund | | | 930 | | | | 7,010 | |
Naver Corp. | | | 30 | | | | 20,122 | |
OCI Co., Ltd. | | | 40 | | | | 3,500 | |
POSCO | | | 145 | | | | 44,071 | |
S-Oil Corp. | | | 90 | | | | 10,048 | |
Samsung C&T Corp. | | | 59 | | | | 6,772 | |
Samsung Electro-Mechanics Co., Ltd. | | | 100 | | | | 9,002 | |
Samsung Electronics Co., Ltd. | | | 105 | | | | 216,144 | |
Samsung Fire & Marine Insurance Co., Ltd. | | | 60 | | | | 14,739 | |
Samsung Heavy Industries Co., Ltd.(1) | | | 230 | | | | 2,190 | |
Samsung Life Insurance Co., Ltd. | | | 230 | | | | 23,581 | |
Samsung SDI Co., Ltd. | | | 94 | | | | 16,425 | |
Samsung Securities Co., Ltd. | | | 150 | | | | 4,870 | |
Shinhan Financial Group Co., Ltd. | | | 710 | | | | 32,739 | |
SK Holdings Co., Ltd. | | | 29 | | | | 6,893 | |
SK Hynix, Inc. | | | 550 | | | | 33,577 | |
| | | | |
| | 14 | | See Notes to Financial Statements. |
Parametric Emerging Markets Core Fund
August 31, 2017
Portfolio of Investments — continued
| | | | | | | | |
| Security | | Shares | | | Value | |
| | |
South Korea (continued) | | | | | | | | |
SK Innovation Co., Ltd. | | | 100 | | | $ | 16,777 | |
SK Telecom Co., Ltd. | | | 100 | | | | 22,578 | |
Woori Bank | | | 595 | | | | 9,821 | |
| | | | | | | | | |
| | | $ | 898,461 | |
| | | | | | | | | |
| | |
Taiwan — 6.7% | | | | | | | | |
Advanced Semiconductor Engineering, Inc. | | | 12,374 | | | $ | 14,978 | |
Asia Cement Corp. | | | 7,140 | | | | 6,482 | |
Asustek Computer, Inc. | | | 1,000 | | | | 8,297 | |
AU Optronics Corp. | | | 25,000 | | | | 10,292 | |
Catcher Technology Co., Ltd. | | | 2,000 | | | | 25,581 | |
Cathay Financial Holding Co., Ltd. | | | 11,210 | | | | 18,352 | |
Chailease Holding Co., Ltd. | | | 2,288 | | | | 6,238 | |
Chang Hwa Commercial Bank, Ltd. | | | 10,931 | | | | 5,982 | |
Cheng Shin Rubber Industry Co., Ltd. | | | 6,000 | | | | 12,089 | |
China Development Financial Holding Corp. | | | 23,000 | | | | 7,194 | |
China Life Insurance Co., Ltd. | | | 7,172 | | | | 7,936 | |
China Steel Corp. | | | 24,480 | | | | 20,549 | |
Chunghwa Telecom Co., Ltd. | | | 10,000 | | | | 34,780 | |
Compal Electronics, Inc. | | | 13,000 | | | | 9,358 | |
CTBC Financial Holding Co., Ltd. | | | 24,211 | | | | 15,710 | |
Delta Electronics, Inc. | | | 3,157 | | | | 17,368 | |
E.Sun Financial Holding Co., Ltd. | | | 14,553 | | | | 8,984 | |
Far Eastern New Century Corp. | | | 9,363 | | | | 7,506 | |
Far EasTone Telecommunications Co., Ltd. | | | 6,000 | | | | 14,553 | |
First Financial Holding Co., Ltd. | | | 13,360 | | | | 8,690 | |
Formosa Chemicals & Fibre Corp. | | | 7,000 | | | | 22,046 | |
Formosa Petrochemical Corp. | | | 4,000 | | | | 14,151 | |
Formosa Plastics Corp. | | | 9,000 | | | | 28,057 | |
Fubon Financial Holding Co., Ltd. | | | 10,000 | | | | 16,112 | |
Giant Manufacturing Co., Ltd. | | | 2,000 | | | | 10,126 | |
Hon Hai Precision Industry Co., Ltd. | | | 16,816 | | | | 65,667 | |
Hotai Motor Co., Ltd. | | | 1,000 | | | | 11,807 | |
HTC Corp.(1) | | | 2,000 | | | | 4,566 | |
Hua Nan Financial Holdings Co., Ltd. | | | 13,416 | | | | 7,502 | |
Innolux Corp. | | | 22,577 | | | | 11,039 | |
Inventec Corp. | | | 10,000 | | | | 7,957 | |
Kenda Rubber Industrial Co., Ltd. | | | 3,437 | | | | 4,919 | |
Lite-On Technology Corp. | | | 6,090 | | | | 9,029 | |
MediaTek, Inc. | | | 2,000 | | | | 17,985 | |
Mega Financial Holding Co., Ltd. | | | 12,839 | | | | 10,331 | |
Merida Industry Co., Ltd. | | | 2,100 | | | | 9,243 | |
Nan Ya Plastics Corp. | | | 11,000 | | | | 27,825 | |
Pou Chen Corp. | | | 11,000 | | | | 14,297 | |
President Chain Store Corp. | | | 2,000 | | | | 16,759 | |
Quanta Computer, Inc. | | | 6,000 | | | | 13,692 | |
| | | | | | | | |
| Security | | Shares | | | Value | |
| | |
Taiwan (continued) | | | | | | | | |
Ruentex Industries, Ltd. | | | 2,190 | | | $ | 3,534 | |
Shin Kong Financial Holding Co., Ltd. | | | 16,458 | | | | 4,792 | |
Siliconware Precision Industries Co., Ltd. | | | 8,000 | | | | 12,681 | |
SinoPac Financial Holdings Co., Ltd. | | | 16,692 | | | | 5,368 | |
Taishin Financial Holding Co., Ltd. | | | 15,467 | | | | 6,878 | |
Taiwan Cement Corp. | | | 8,000 | | | | 9,256 | |
Taiwan Cooperative Financial Holding Co., Ltd. | | | 13,662 | | | | 7,207 | |
Taiwan Fertilizer Co., Ltd. | | | 2,000 | | | | 2,671 | |
Taiwan Mobile Co., Ltd. | | | 5,000 | | | | 17,898 | |
Taiwan Semiconductor Manufacturing Co., Ltd. | | | 12,000 | | | | 86,370 | |
Uni-President Enterprises Corp. | | | 14,331 | | | | 30,536 | |
United Microelectronics Corp. | | | 26,000 | | | | 12,996 | |
Yuanta Financial Holding Co., Ltd. | | | 15,778 | | | | 6,869 | |
Yulon Motor Co., Ltd. | | | 6,000 | | | | 5,175 | |
| | | | | | | | | |
| | | $ | 796,260 | |
| | | | | | | | | |
| | |
Thailand — 3.3% | | | | | | | | |
Advanced Info Service PCL(5) | | | 4,200 | | | $ | 23,747 | |
Airports of Thailand PCL(5) | | | 17,000 | | | | 27,958 | |
Bangkok Bank PCL(5) | | | 1,500 | | | | 8,342 | |
Bangkok Dusit Medical Services PCL(5) | | | 17,000 | | | | 10,705 | |
Bank of Ayudhya PCL NVDR | | | 8,000 | | | | 9,274 | |
BEC World PCL(5) | | | 4,700 | | | | 2,450 | |
Berli Jucker PCL(5) | | | 12,000 | | | | 17,820 | |
BTS Group Holdings PCL(5) | | | 25,200 | | | | 6,571 | |
Central Pattana PCL(5) | | | 5,500 | | | | 11,935 | |
Charoen Pokphand Foods PCL(5) | | | 13,800 | | | | 11,337 | |
CP ALL PCL(5) | | | 16,300 | | | | 30,463 | |
Delta Electronics (Thailand) PCL(5) | | | 4,800 | | | | 12,869 | |
Electricity Generating PCL(5) | | | 800 | | | | 5,641 | |
Glow Energy PCL(5) | | | 2,000 | | | | 5,167 | |
Hana Microelectronics PCL(5) | | | 8,200 | | | | 10,810 | |
Home Product Center PCL(5) | | | 25,601 | | | | 7,721 | |
Indorama Ventures PCL(5) | | | 9,600 | | | | 11,288 | |
Intouch Holdings PCL(5) | | | 5,300 | | | | 9,064 | |
IRPC PCL(5) | | | 63,400 | | | | 11,374 | |
Kasikornbank PCL(5) | | | 1,300 | | | | 7,885 | |
Krung Thai Bank PCL(5) | | | 13,500 | | | | 7,611 | |
Minor International PCL(5) | | | 10,010 | | | | 11,983 | |
PTT Exploration & Production PCL(5) | | | 4,320 | | | | 11,404 | |
PTT Global Chemical PCL(5) | | | 4,720 | | | | 10,890 | |
PTT PCL(5) | | | 2,600 | | | | 31,276 | |
Siam Cement PCL(5) | | | 900 | | | | 13,562 | |
Siam Commercial Bank PCL(5) | | | 1,780 | | | | 8,082 | |
Sino-Thai Engineering & Construction PCL(5) | | | 8,600 | | | | 6,745 | |
Thai Beverage PCL(5) | | | 40,000 | | | | 27,462 | |
| | | | |
| | 15 | | See Notes to Financial Statements. |
Parametric Emerging Markets Core Fund
August 31, 2017
Portfolio of Investments — continued
| | | | | | | | |
| Security | | Shares | | | Value | |
| | |
Thailand (continued) | | | | | | | | |
Thai Oil PCL(5) | | | 2,500 | | | $ | 7,101 | |
TMB Bank PCL(5) | | | 91,700 | | | | 6,522 | |
Total Access Communication PCL NVDR | | | 2,800 | | | | 4,627 | |
True Corp. PCL(1)(5) | | | 47,094 | | | | 7,949 | |
| | | | | | | | | |
| | | $ | 397,635 | |
| | | | | | | | | |
| | |
Turkey — 4.3% | | | | | | | | |
Akbank Turk AS | | | 5,450 | | | $ | 16,346 | |
AKIS Gayrimenkul Yatirimi AS | | | 8,650 | | | | 8,094 | |
Aksa Enerji Uretim AS(1) | | | 5,741 | | | | 6,173 | |
Anadolu Efes Biracilik ve Malt Sanayii AS | | | 1,210 | | | | 7,433 | |
Arcelik AS | | | 3,691 | | | | 25,679 | |
Aygaz AS | | | 2,227 | | | | 10,104 | |
BIM Birlesik Magazalar AS | | | 1,535 | | | | 34,028 | |
Coca-Cola Icecek AS | | | 510 | | | | 5,934 | |
Emlak Konut Gayrimenkul Yatirim Ortakligi AS(1) | | | 41,477 | | | | 35,354 | |
Enka Insaat ve Sanayi AS | | | 2,500 | | | | 3,877 | |
Eregli Demir ve Celik Fabrikalari TAS | | | 17,580 | | | | 41,883 | |
Ford Otomotiv Sanayi AS | | | 944 | | | | 13,004 | |
Haci Omer Sabanci Holding AS | | | 4,000 | | | | 12,295 | |
Is Gayrimenkul Yatirim Ortakligi AS | | | 14,555 | | | | 5,990 | |
Kardemir Karabuk Demir Celik Sanayi ve Ticaret AS, Class D(1) | | | 14,403 | | | | 9,943 | |
KOC Holding AS | | | 2,420 | | | | 12,652 | |
Koza Altin Isletmeleri AS(1) | | | 500 | | | | 4,655 | |
Petkim Petrokimya Holding AS | | | 6,975 | | | | 12,621 | |
TAV Havalimanlari Holding AS | | | 1,100 | | | | 6,766 | |
Tekfen Holding AS | | | 2,900 | | | | 10,767 | |
Tofas Turk Otomobil Fabrikasi AS | | | 1,748 | | | | 16,014 | |
Tupras-Turkiye Petrol Rafinerileri AS | | | 2,020 | | | | 68,688 | |
Turk Hava Yollari AO(1) | | | 2,870 | | | | 8,126 | |
Turk Sise ve Cam Fabrikalari AS | | | 4,023 | | | | 5,180 | |
Turk Telekomunikasyon AS(1) | | | 6,720 | | | | 13,993 | |
Turk Traktor ve Ziraat Makineleri AS | | | 180 | | | | 4,326 | |
Turkcell Iletisim Hizmetleri AS | | | 11,482 | | | | 43,971 | |
Turkiye Garanti Bankasi AS | | | 6,150 | | | | 19,162 | |
Turkiye Halk Bankasi AS | | | 1,700 | | | | 7,310 | |
Turkiye Is Bankasi, Class B | | | 3,980 | | | | 8,648 | |
Turkiye Vakiflar Bankasi TAO, Class D | | | 5,920 | | | | 12,369 | |
Ulker Biskuvi Sanayi AS | | | 1,532 | | | | 9,163 | |
Yapi ve Kredi Bankasi AS(1) | | | 3,250 | | | | 4,582 | |
Yazicilar Holding AS | | | 700 | | | | 4,575 | |
| | | | | | | | | |
| | | $ | 509,705 | |
| | | | | | | | | |
| | |
United Arab Emirates — 1.5% | | | | | | | | |
Air Arabia PJSC | | | 28,550 | | | $ | 8,705 | |
Arabtec Holding PJSC(1) | | | 4,568 | | | | 3,985 | |
| | | | | | | | |
| Security | | Shares | | | Value | |
| | |
United Arab Emirates (continued) | | | | | | | | |
DP World, Ltd. | | | 1,500 | | | $ | 34,334 | |
Emaar Properties PJSC | | | 15,477 | | | | 35,983 | |
Emirates Telecommunications Group Co. PJSC | | | 6,320 | | | | 31,025 | |
First Abu Dhabi Bank PJSC | | | 20,742 | | | | 58,763 | |
| | | | | | | | | |
| | | $ | 172,795 | |
| | | | | | | | | |
| | |
Total Common Stocks
(identified cost $11,177,749) | | | | | | $ | 11,828,904 | |
| | | | | | | | | |
| | |
| Rights — 0.0% | | | | | | | | |
| | |
| | | | | | | | |
| Security | | Shares | | | Value | |
Macquarie Korea Infrastructure Fund, Expires 9/15/17(1) | | | 9 | | | $ | 0 | |
| | | | | | | | | |
| | |
Total Rights
(identified cost $0) | | | | | | $ | 0 | |
| | | | | | | | | |
| | |
| Warrants — 0.0%(6) | | | | | | | | |
| | |
| | | | | | | | |
| Security | | Shares | | | Value | |
Minor International PCL, Expires 11/3/17, Strike THB 36.36 (1) | | | 455 | | | $ | 46 | |
| | | | | | | | | |
| | |
Total Warrants
(identified cost $0) | | | | | | $ | 46 | |
| | | | | | | | | |
| | |
| Short-Term Investments — 0.1% | | | | | | | | |
| | |
| | | | | | | | |
| Description | | Units | | | Value | |
Eaton Vance Cash Reserves Fund, LLC, 1.32%(7) | | | 8,909 | | | $ | 8,911 | |
| | | | | | | | | |
| | |
Total Short-Term Investments
(identified cost $8,911) | | | | | | $ | 8,911 | |
| | | | | | | | | |
| | |
Total Investments — 99.6%
(identified cost $11,186,660) | | | | | | $ | 11,837,861 | |
| | | | | | | | | |
| | |
Other Assets, Less Liabilities — 0.4% | | | | | | $ | 47,982 | |
| | | | | | | | | |
| | |
Net Assets — 100.0% | | | | | | $ | 11,885,843 | |
| | | | | | | | | |
The percentage shown for each investment category in the Portfolio of Investments is based on net assets.
| (1) | Non-income producing security. |
| (2) | Security exempt from registration pursuant to Rule 144A under the Securities Act of 1933, as amended. These securities may be sold in certain transactions in reliance on an exemption from registration (normally to qualified institutional buyers). At August 31, 2017, the aggregate value of these securities is $173,603 or 1.5% of the Fund’s net assets. |
| | | | |
| | 16 | | See Notes to Financial Statements. |
Parametric Emerging Markets Core Fund
August 31, 2017
Portfolio of Investments — continued
| (3) | For fair value measurement disclosure purposes, security is categorized as Level 3 (see Note 9). |
| (4) | Security exempt from registration under Regulation S of the Securities Act of 1933, which exempts from registration securities offered and sold outside the United States. Security may not be offered or sold in the United States except pursuant to an exemption from, or in a transaction not subject to, the registration requirements of the Securities Act of 1933. At August 31, 2017, the aggregate value of these securities is $347,478 or 2.9% of the Fund’s net assets. |
| (5) | Indicates a foreign registered security. Shares issued to foreign investors in markets that have foreign ownership limits. |
| (6) | Amount is less than 0.05%. |
| (7) | Affiliated investment company, available to Eaton Vance portfolios and funds, which invests in high quality, U.S. dollar denominated money market instruments. The rate shown is the annualized seven-day yield as of August 31, 2017. |
Abbreviations:
| | | | |
| ADR | | – | | American Depositary Receipt |
| GDR | | – | | Global Depositary Receipt |
| NVDR | | – | | Non-Voting Depositary Receipt |
| PCL | | – | | Public Company Ltd. |
| PFC Shares | | – | | Preference Shares |
Currency Abbreviations:
| | | | | | | | |
| Currency Concentration of Portfolio | |
| | |
| | | | | | | | |
| Currency | | Percentage
of Net Assets | | | Value | |
United States Dollar | | | 19.0 | % | | $ | 2,257,382 | |
Hong Kong Dollar | | | 11.2 | | | | 1,327,612 | |
South Korean Won | | | 7.6 | | | | 898,461 | |
New Taiwan Dollar | | | 6.7 | | | | 796,260 | |
South African Rand | | | 6.6 | | | | 790,270 | |
Brazilian Real | | | 5.8 | | | | 686,129 | |
Mexican Peso | | | 4.8 | | | | 566,671 | |
New Turkish Lira | | | 4.3 | | | | 509,705 | |
Polish Zloty | | | 3.8 | | | | 452,482 | |
Indonesian Rupiah | | | 3.3 | | | | 395,777 | |
Malaysian Ringgit | | | 3.2 | | | | 381,144 | |
Philippine Peso | | | 3.2 | | | | 378,228 | |
Thai Baht | | | 3.1 | | | | 370,219 | |
Chilean Peso | | | 2.2 | | | | 259,427 | |
Euro | | | 1.9 | | | | 221,338 | |
Russian Ruble | | | 1.6 | | | | 190,910 | |
Kuwaiti Dinar | | | 1.6 | | | | 187,628 | |
Colombian Peso | | | 1.3 | | | | 158,538 | |
Chinese Yuan Renminbi | | | 1.3 | | | | 151,494 | |
Qatari Riyal | | | 1.2 | | | | 148,451 | |
Pakistani Rupee | | | 1.2 | | | | 145,236 | |
United Arab Emirates Dirham | | | 1.2 | | | | 138,461 | |
Hungarian Forint | | | 1.0 | | | | 118,649 | |
Other currency, less than 1% each | | | 2.5 | | | | 307,389 | |
| | |
Total Investments | | | 99.6 | % | | $ | 11,837,861 | |
| | |
| | | | | | | | |
| Sector Classification of Portfolio | |
| | |
| | | | | | | | |
| Sector | | Percentage
of Net Assets | | | Value | |
Financials | | | 17.2 | % | | $ | 2,050,983 | |
Materials | | | 12.3 | | | | 1,460,061 | |
Information Technology | | | 11.0 | | | | 1,305,228 | |
Consumer Discretionary | | | 10.2 | | | | 1,214,757 | |
Energy | | | 9.2 | | | | 1,090,086 | |
Consumer Staples | | | 8.9 | | | | 1,056,310 | |
Industrials | | | 8.7 | | | | 1,030,643 | |
Telecommunication Services | | | 8.6 | | | | 1,029,847 | |
Utilities | | | 5.5 | | | | 654,541 | |
Real Estate | | | 4.7 | | | | 555,352 | |
Health Care | | | 3.2 | | | | 381,142 | |
Short-Term Investments | | | 0.1 | | | | 8,911 | |
| | |
Total Investments | | | 99.6 | % | | $ | 11,837,861 | |
| | |
| | | | |
| | 17 | | See Notes to Financial Statements. |
Parametric Emerging Markets Core Fund
August 31, 2017
Statement of Assets and Liabilities
| | | | |
| Assets | | August 31, 2017 | |
Unaffiliated investments, at value (identified cost, $11,177,749) | | $ | 11,828,950 | |
Affiliated investment, at value (identified cost, $8,911) | | | 8,911 | |
Cash | | | 14 | |
Foreign currency, at value (identified cost, $100,009) | | | 100,830 | |
Dividends receivable | | | 21,062 | |
Dividends receivable from affiliated investment | | | 81 | |
Receivable for Fund shares sold | | | 252 | |
Tax reclaims receivable | | | 525 | |
Receivable from affiliates | | | 22,269 | |
Total assets | | $ | 11,982,894 | |
| |
| Liabilities | | | | |
Payable to affiliates: | | | | |
Investment adviser and administration fee | | $ | 7,419 | |
Distribution and service fees | | | 32 | |
Accrued expenses | | | 89,600 | |
Total liabilities | | $ | 97,051 | |
Net Assets | | $ | 11,885,843 | |
| |
| Sources of Net Assets | | | | |
Paid-in capital | | $ | 11,162,851 | |
Accumulated net realized loss | | | (83,553 | ) |
Accumulated undistributed net investment income | | | 154,385 | |
Net unrealized appreciation | | | 652,160 | |
Total | | $ | 11,885,843 | |
| |
| Investor Class Shares | | | | |
Net Assets | | $ | 149,953 | |
Shares Outstanding | | | 14,365 | |
Net Asset Value, Offering Price and Redemption Price Per Share | | | | |
(net assets ÷ shares of beneficial interest outstanding) | | $ | 10.44 | |
| |
| Institutional Class Shares | | | | |
Net Assets | | $ | 11,735,890 | |
Shares Outstanding | | | 1,122,386 | |
Net Asset Value, Offering Price and Redemption Price Per Share | | | | |
(net assets ÷ shares of beneficial interest outstanding) | | $ | 10.46 | |
| | | | |
| | 18 | | See Notes to Financial Statements. |
Parametric Emerging Markets Core Fund
August 31, 2017
Statement of Operations
| | | | |
| Investment Income | | Year Ended
August 31, 2017 | |
Dividends (net of foreign taxes, $35,183) | | $ | 278,239 | |
Interest allocated from/dividends from affiliated investment | | | 489 | |
Total investment income | | $ | 278,728 | |
|
| Expenses | |
Investment adviser and administration fee | | $ | 78,164 | |
Distribution and service fees | | | | |
Investor Class | | | 225 | |
Trustees’ fees and expenses | | | 1,085 | |
Custodian fee | | | 95,217 | |
Transfer and dividend disbursing agent fees | | | 905 | |
Legal and accounting services | | | 61,141 | |
Printing and postage | | | 7,568 | |
Registration fees | | | 41,465 | |
Miscellaneous | | | 29,235 | |
Total expenses | | $ | 315,005 | |
Deduct — | | | | |
Allocation of expenses to affiliates | | $ | 221,005 | |
Total expense reductions | | $ | 221,005 | |
| |
Net expenses | | $ | 94,000 | |
| |
Net investment income | | $ | 184,728 | |
|
| Realized and Unrealized Gain (Loss) | |
Net realized gain (loss) — | | | | |
Investment transactions (net of foreign capital gains taxes of $1,402) | | $ | (78,832 | ) |
Investment transactions in/allocated from affiliated investment | | | 21 | |
Foreign currency transactions | | | 974 | |
Net realized loss | | $ | (77,837 | ) |
Change in unrealized appreciation (depreciation) — | | | | |
Investments (including net decrease of $397 in accrued foreign capital gains taxes) | | $ | 1,968,879 | |
Foreign currency | | | 860 | |
Net change in unrealized appreciation (depreciation) | | $ | 1,969,739 | |
| |
Net realized and unrealized gain | | $ | 1,891,902 | |
| |
Net increase in net assets from operations | | $ | 2,076,630 | |
| | | | |
| | 19 | | See Notes to Financial Statements. |
Parametric Emerging Markets Core Fund
August 31, 2017
Statements of Changes in Net Assets
| | | | | | | | |
| | | Year Ended August 31, | |
| Increase (Decrease) in Net Assets | | 2017 | | | 2016 | |
From operations — | | | | | | | | |
Net investment income | | $ | 184,728 | | | $ | 172,107 | |
Net realized loss | | | (77,837 | ) | | | (126 | ) |
Net change in unrealized appreciation (depreciation) | | | 1,969,739 | | | | 784,624 | |
Net increase in net assets from operations | | $ | 2,076,630 | | | $ | 956,605 | |
Distributions to shareholders — | | | | | | | | |
From net investment income | | | | | | | | |
Investor Class | | $ | (1,568 | ) | | $ | (610 | ) |
Institutional Class | | | (178,146 | ) | | | (143,584 | ) |
From net realized gain | | | | | | | | |
Investor Class | | | — | | | | (396 | ) |
Institutional Class | | | — | | | | (72,007 | ) |
Total distributions to shareholders | | $ | (179,714 | ) | | $ | (216,597 | ) |
Transactions in shares of beneficial interest — | | | | | | | | |
Proceeds from sale of shares | | | | | | | | |
Investor Class | | $ | 123,211 | | | $ | 17,772 | |
Institutional Class | | | 32,211 | | | | 423,686 | |
Net asset value of shares issued to shareholders in payment of distributions declared | | | | | | | | |
Investor Class | | | 1,568 | | | | 1,006 | |
Institutional Class | | | 178,146 | | | | 215,591 | |
Cost of shares redeemed | | | | | | | | |
Investor Class | | | (54,741 | ) | | | (22,341 | ) |
Institutional Class | | | (47,856 | ) | | | (108,382 | ) |
Net increase in net assets from Fund share transactions | | $ | 232,539 | | | $ | 527,332 | |
| | |
Net increase in net assets | | $ | 2,129,455 | | | $ | 1,267,340 | |
|
| Net Assets | |
At beginning of year | | $ | 9,756,388 | | | $ | 8,489,048 | |
At end of year | | $ | 11,885,843 | | | $ | 9,756,388 | |
|
Accumulated undistributed net investment income included in net assets | |
At end of year | | $ | 154,385 | | | $ | 141,793 | |
| | | | |
| | 20 | | See Notes to Financial Statements. |
Parametric Emerging Markets Core Fund
August 31, 2017
Financial Highlights
| | | | | | | | | | | | | | | | |
| | | Investor Class | |
| | | Year Ended August 31, | | | Period Ended
August 31, 2014(1) | |
| | | 2017 | | | 2016 | | | 2015 | | |
Net asset value — Beginning of period | | $ | 8.790 | | | $ | 8.130 | | | $ | 10.980 | | | $ | 10.000 | |
| | | | |
| Income (Loss) From Operations | | | | | | | | | | | | | | | | |
Net investment income(2) | | $ | 0.152 | | | $ | 0.134 | | | $ | 0.138 | | | $ | 0.184 | |
Net realized and unrealized gain (loss) | | | 1.647 | | | | 0.696 | | | | (2.739 | ) | | | 0.809 | |
| | | | |
Total income (loss) from operations | | $ | 1.799 | | | $ | 0.830 | | | $ | (2.601 | ) | | $ | 0.993 | |
| | | | |
| Less Distributions | | | | | | | | | | | | | | | | |
From net investment income | | $ | (0.149 | ) | | $ | (0.103 | ) | | $ | (0.160 | ) | | $ | (0.013 | ) |
From net realized gain | | | — | | | | (0.067 | ) | | | (0.089 | ) | | | — | |
| | | | |
Total distributions | | $ | (0.149 | ) | | $ | (0.170 | ) | | $ | (0.249 | ) | | $ | (0.013 | ) |
| | | | |
Net asset value — End of period | | $ | 10.440 | | | $ | 8.790 | | | $ | 8.130 | | | $ | 10.980 | |
| | | | |
Total Return(3)(4) | | | 20.89 | % | | | 10.52 | % | | | (23.99 | )% | | | 9.94 | %(5) |
| | | | |
| Ratios/Supplemental Data | | | | | | | | | | | | | | | | |
Net assets, end of period (000’s omitted) | | $ | 150 | | | $ | 60 | | | $ | 60 | | | $ | 97 | |
Ratios (as a percentage of average daily net assets): | | | | | | | | | | | | | | | | |
Expenses(4) | | | 1.15 | % | | | 1.15 | % | | | 1.15 | % | | | 1.15 | %(6) |
Net investment income | | | 1.63 | % | | | 1.66 | % | | | 1.43 | % | | | 1.93 | %(6) |
Portfolio Turnover | | | 10 | % | | | 14 | % | | | 5 | % | | | 11 | %(5) |
| (1) | For the period from the start of business, September 25, 2013, to August 31, 2014. |
| (2) | Computed using average shares outstanding. |
| (3) | Returns are historical and are calculated by determining the percentage change in net asset value with all distributions reinvested. |
| (4) | The investment adviser and administrator and/or the sub-adviser reimbursed certain operating expenses (equal to 2.12%, 2.14%, 1.89% and 2.59% of average daily net assets for the years ended August 31, 2017, 2016 and 2015 and the period ended August 31, 2014, respectively). Absent this reimbursement, total return would be lower. |
| | | | |
| | 21 | | See Notes to Financial Statements. |
Parametric Emerging Markets Core Fund
August 31, 2017
Financial Highlights — continued
| | | | | | | | | | | | | | | | |
| | | Institutional Class | |
| | | Year Ended August 31, | | | Period Ended
August 31, 2014(1) | |
| | | 2017 | | | 2016 | | | 2015 | | |
Net asset value — Beginning of period | | $ | 8.790 | | | $ | 8.150 | | | $ | 11.000 | | | $ | 10.000 | |
| | | | |
| Income (Loss) From Operations | | | | | | | | | | | | | | | | |
Net investment income(2) | | $ | 0.164 | | | $ | 0.157 | | | $ | 0.164 | | | $ | 0.167 | |
Net realized and unrealized gain (loss) | | | 1.667 | | | | 0.683 | | | | (2.744 | ) | | | 0.851 | |
| | | | |
Total income (loss) from operations | | $ | 1.831 | | | $ | 0.840 | | | $ | (2.580 | ) | | $ | 1.018 | |
| | | | |
| Less Distributions | | | | | | | | | | | | | | | | |
From net investment income | | $ | (0.161 | ) | | $ | (0.133 | ) | | $ | (0.181 | ) | | $ | (0.018 | ) |
From net realized gain | | | — | | | | (0.067 | ) | | | (0.089 | ) | | | — | |
| | | | |
Total distributions | | $ | (0.161 | ) | | $ | (0.200 | ) | | $ | (0.270 | ) | | $ | (0.018 | ) |
| | | | |
Net asset value — End of period | | $ | 10.460 | | | $ | 8.790 | | | $ | 8.150 | | | $ | 11.000 | |
| | | | |
Total Return(3)(4) | | | 21.29 | % | | | 10.68 | % | | | (23.77 | )% | | | 10.20 | %(5) |
| | | | |
| Ratios/Supplemental Data | | | | | | | | | | | | | | | | |
Net assets, end of period (000’s omitted) | | $ | 11,736 | | | $ | 9,697 | | | $ | 8,429 | | | $ | 11,010 | |
Ratios (as a percentage of average daily net assets): | | | | | | | | | | | | | | | | |
Expenses(4) | | | 0.90 | % | | | 0.90 | % | | | 0.90 | % | | | 0.90 | %(6) |
Net investment income | | | 1.77 | % | | | 1.96 | % | | | 1.70 | % | | | 1.76 | %(6) |
Portfolio Turnover | | | 10 | % | | | 14 | % | | | 5 | % | | | 11 | %(5) |
| (1) | For the period from the start of business, September 25, 2013, to August 31, 2014. |
| (2) | Computed using average shares outstanding. |
| (3) | Returns are historical and are calculated by determining the percentage change in net asset value with all distributions reinvested. |
| (4) | The investment adviser and administrator and/or the sub-adviser reimbursed certain operating expenses (equal to 2.12%, 2.14%, 1.89% and 2.59% of average daily net assets for the years ended August 31, 2017, 2016 and 2015 and the period ended August 31, 2014, respectively). Absent this reimbursement, total return would be lower. |
| | | | |
| | 22 | | See Notes to Financial Statements. |
Parametric Emerging Markets Core Fund
August 31, 2017
Notes to Financial Statements
1 Significant Accounting Policies
Parametric Emerging Markets Core Fund (the Fund) is a diversified series of Eaton Vance Mutual Funds Trust (the Trust). The Trust is a Massachusetts business trust registered under the Investment Company Act of 1940, as amended (the 1940 Act), as an open-end management investment company. The Fund’s investment objective is long-term capital appreciation. The Fund offers Investor Class and Institutional Class shares, which are offered at net asset value and are not subject to a sales charge. Each class represents a pro-rata interest in the Fund, but votes separately on class-specific matters and (as noted below) is subject to different expenses. Realized and unrealized gains and losses and net investment income and losses, other than class-specific expenses, are allocated daily to each class of shares based on the relative net assets of each class to the total net assets of the Fund. Each class of shares differs in its distribution plan and certain other class-specific expenses.
The following is a summary of significant accounting policies of the Fund. The policies are in conformity with accounting principles generally accepted in the United States of America (U.S. GAAP). The Fund is an investment company and follows accounting and reporting guidance in the Financial Accounting Standards Board (FASB) Accounting Standards Codification Topic 946.
A Investment Valuation — The following methodologies are used to determine the market value or fair value of investments.
Equity Securities. Equity securities listed on a U.S. securities exchange generally are valued at the last sale or closing price on the day of valuation or, if no sales took place on such date, at the mean between the closing bid and asked prices therefore on the exchange where such securities are principally traded. Equity securities listed on the NASDAQ Global or Global Select Market generally are valued at the NASDAQ official closing price. Unlisted or listed securities for which closing sales prices or closing quotations are not available are valued at the mean between the latest available bid and asked prices.
Foreign Securities and Currencies. Foreign securities and currencies are valued in U.S. dollars, based on foreign currency exchange rate quotations supplied by a third party pricing service. The pricing service uses a proprietary model to determine the exchange rate. Inputs to the model include reported trades and implied bid/ask spreads. The daily valuation of exchange-traded foreign securities generally is determined as of the close of trading on the principal exchange on which such securities trade. Events occurring after the close of trading on foreign exchanges may result in adjustments to the valuation of foreign securities to more accurately reflect their fair value as of the close of regular trading on the New York Stock Exchange. When valuing foreign equity securities that meet certain criteria, the Fund’s Trustees have approved the use of a fair value service that values such securities to reflect market trading that occurs after the close of the applicable foreign markets of comparable securities or other instruments that have a strong correlation to the fair-valued securities.
Affiliated Fund. The Fund may invest in Eaton Vance Cash Reserves Fund, LLC (Cash Reserves Fund), an affiliated investment company managed by Eaton Vance Management (EVM). While Cash Reserves Fund is not a registered money market mutual fund, it conducts all of its investment activities in accordance with the requirements of Rule 2a-7 under the 1940 Act. Investments in Cash Reserves Fund are valued at the closing net asset value per unit on the valuation day. Cash Reserves Fund generally values its investment securities based on available market quotations provided by a third party pricing service. Prior to Cash Reserves Fund’s issuance of units in October 2016, the value of the Fund’s investment in Cash Reserves Fund reflected the Fund’s proportionate interest in its net assets and the Fund recorded its pro-rata share of Cash Reserves Fund’s income, expenses and realized gain or loss.
Fair Valuation. Investments for which valuations or market quotations are not readily available or are deemed unreliable are valued at fair value using methods determined in good faith by or at the direction of the Trustees of the Fund in a manner that fairly reflects the security’s value, or the amount that the Fund might reasonably expect to receive for the security upon its current sale in the ordinary course. Each such determination is based on a consideration of relevant factors, which are likely to vary from one pricing context to another. These factors may include, but are not limited to, the type of security, the existence of any contractual restrictions on the security’s disposition, the price and extent of public trading in similar securities of the issuer or of comparable companies or entities, quotations or relevant information obtained from broker/dealers or other market participants, information obtained from the issuer, analysts, and/or the appropriate stock exchange (for exchange-traded securities), an analysis of the company’s or entity’s financial condition, and an evaluation of the forces that influence the issuer and the market(s) in which the security is purchased and sold.
B Investment Transactions — Investment transactions for financial statement purposes are accounted for on a trade date basis. Realized gains and losses on investments sold are determined on the basis of identified cost.
C Income — Dividend income is recorded on the ex-dividend date for dividends received in cash and/or securities. However, if the ex-dividend date has passed, certain dividends from foreign securities are recorded as the Fund is informed of the ex-dividend date. Withholding taxes on foreign dividends and capital gains have been provided for in accordance with the Fund’s understanding of the applicable countries’ tax rules and rates. Interest income is recorded on the basis of interest accrued, adjusted for amortization of premium or accretion of discount.
D Federal and Other Taxes — The Fund’s policy is to comply with the provisions of the Internal Revenue Code applicable to regulated investment companies and to distribute to shareholders each year substantially all of its net investment income, and all or substantially all of its net realized capital gains. Accordingly, no provision for federal income or excise tax is necessary.
In addition to the requirements of the Internal Revenue Code, the Fund may also be subject to local taxes on the recognition of capital gains in certain countries. In determining the daily net asset value, the Fund estimates the accrual for such taxes, if any, based on the unrealized appreciation on certain portfolio securities and the related tax rates. Taxes attributable to unrealized appreciation are included in the change in unrealized appreciation (depreciation) on investments. Capital gains taxes on securities sold are included in net realized gain (loss) on investments.
Parametric Emerging Markets Core Fund
August 31, 2017
Notes to Financial Statements — continued
As of August 31, 2017, the Fund had no uncertain tax positions that would require financial statement recognition, de-recognition, or disclosure. The Fund files a U.S. federal income tax return annually after its fiscal year-end, which is subject to examination by the Internal Revenue Service for a period of three years from the date of filing.
E Expenses — The majority of expenses of the Trust are directly identifiable to an individual fund. Expenses which are not readily identifiable to a specific fund are allocated taking into consideration, among other things, the nature and type of expense and the relative size of the funds.
F Foreign Currency Translation — Investment valuations, other assets, and liabilities initially expressed in foreign currencies are translated each business day into U.S. dollars based upon current exchange rates. Purchases and sales of foreign investment securities and income and expenses denominated in foreign currencies are translated into U.S. dollars based upon currency exchange rates in effect on the respective dates of such transactions. Recognized gains or losses on investment transactions attributable to changes in foreign currency exchange rates are recorded for financial statement purposes as net realized gains and losses on investments. That portion of unrealized gains and losses on investments that results from fluctuations in foreign currency exchange rates is not separately disclosed.
G Use of Estimates — The preparation of the financial statements in conformity with U.S. GAAP requires management to make estimates and assumptions that affect the reported amounts of assets and liabilities at the date of the financial statements and the reported amounts of income and expense during the reporting period. Actual results could differ from those estimates.
H Indemnifications — Under the Trust’s organizational documents, its officers and Trustees may be indemnified against certain liabilities and expenses arising out of the performance of their duties to the Fund. Under Massachusetts law, if certain conditions prevail, shareholders of a Massachusetts business trust (such as the Trust) could be deemed to have personal liability for the obligations of the Trust. However, the Trust’s Declaration of Trust contains an express disclaimer of liability on the part of Fund shareholders and the By-laws provide that the Trust shall assume the defense on behalf of any Fund shareholders. Moreover, the By-laws also provide for indemnification out of Fund property of any shareholder held personally liable solely by reason of being or having been a shareholder for all loss or expense arising from such liability. Additionally, in the normal course of business, the Fund enters into agreements with service providers that may contain indemnification clauses. The Fund’s maximum exposure under these arrangements is unknown as this would involve future claims that may be made against the Fund that have not yet occurred.
2 Distributions to Shareholders and Income Tax Information
It is the present policy of the Fund to make one distribution annually (normally in December) of all or substantially all of its net investment income and to distribute annually all or substantially all of its net realized capital gains. Distributions to shareholders are recorded on the ex-dividend date. Distributions are declared separately for each class of shares. Shareholders may reinvest income and capital gain distributions in additional shares of the same class of the Fund at the net asset value as of the ex-dividend date or, at the election of the shareholder, receive distributions in cash. Distributions to shareholders are determined in accordance with income tax regulations, which may differ from U.S. GAAP. As required by U.S. GAAP, only distributions in excess of tax basis earnings and profits are reported in the financial statements as a return of capital. Permanent differences between book and tax accounting relating to distributions are reclassified to paid-in capital. For tax purposes, distributions from short-term capital gains are considered to be from ordinary income.
The tax character of distributions declared for the years ended August 31, 2017 and August 31, 2016 was as follows:
| | | | | | | | |
| | | Year Ended August 31, | |
| | | 2017 | | | 2016 | |
| | |
Distributions declared from: | | | | | | | | |
Ordinary income | | $ | 179,714 | | | $ | 144,514 | |
Long-term capital gains | | $ | — | | | $ | 72,083 | |
During the year ended August 31, 2017, accumulated net realized loss was increased by $7,578 and accumulated undistributed net investment income was increased by $7,578 due to differences between book and tax accounting, primarily for foreign currency gain (loss), foreign capital gains taxes, investments in passive foreign investment companies (PFICs), investments in partnerships and dividend redesignations. These reclassifications had no effect on the net assets or net asset value per share of the Fund.
As of August 31, 2017, the components of distributable earnings (accumulated losses) on a tax basis were as follows:
| | | | |
Undistributed ordinary income | | $ | 183,407 | |
Deferred capital losses | | $ | (82,947 | ) |
Net unrealized appreciation | | $ | 622,532 | |
Parametric Emerging Markets Core Fund
August 31, 2017
Notes to Financial Statements — continued
The differences between components of distributable earnings (accumulated losses) on a tax basis and the amounts reflected in the Statement of Assets and Liabilities are primarily due to wash sales, investments in partnerships and investments in PFICs.
At August 31, 2017, the Fund, for federal income tax purposes, had deferred capital losses of $82,947 which would reduce its taxable income arising from future net realized gains on investment transactions, if any, to the extent permitted by the Internal Revenue Code, and thus would reduce the amount of distributions to shareholders, which would otherwise be necessary to relieve the Fund of any liability for federal income or excise tax. The deferred capital losses are treated as arising on the first day of the Fund’s next taxable year and retain the same short-term or long-term character as when originally deferred. Of the deferred capital losses at August 31, 2017, $82,947 are long-term.
The cost and unrealized appreciation (depreciation) of investments of the Fund at August 31, 2017, as determined on a federal income tax basis, were as follows:
| | | | |
| |
Aggregate cost | | $ | 11,216,288 | |
| |
Gross unrealized appreciation | | $ | 2,089,045 | |
Gross unrealized depreciation | | | (1,467,472 | ) |
| |
Net unrealized appreciation | | $ | 621,573 | |
3 Investment Adviser and Administration Fee and Other Transactions with Affiliates
The investment adviser and administration fee is earned by EVM as compensation for investment advisory and administrative services rendered to the Fund. The fee is computed at an annual rate of 0.75% of the Fund’s average daily net assets up to $500 million and is payable monthly. On net assets of $500 million and over, the annual fee is reduced. For the year ended August 31, 2017, the investment adviser and administration fee amounted to $78,164 or 0.75% of the Fund’s average daily net assets. Pursuant to a sub-advisory agreement, EVM has delegated the investment management of the Fund to Parametric Portfolio Associates LLC (Parametric), a majority-owned subsidiary of Eaton Vance Corp. EVM pays Parametric a portion of its investment adviser and administration fee for sub-advisory services provided to the Fund. The Fund invests its cash in Cash Reserves Fund. EVM does not currently receive a fee for advisory services provided to Cash Reserves Fund.
EVM and Parametric have agreed to reimburse the Fund’s expenses to the extent that total annual operating expenses (relating to ordinary operating expenses only) exceed 1.15% and 0.90% of the Fund’s average daily net assets for Investor Class and Institutional Class, respectively. This agreement may be changed or terminated after December 31, 2017. Pursuant to this agreement, EVM and Parametric were allocated $221,005 in total of the Fund’s operating expenses for the year ended August 31, 2017.
EVM provides sub-transfer agency and related services to the Fund pursuant to a Sub-Transfer Agency Support Services Agreement. For the year ended August 31, 2017, EVM earned $145 from the Fund pursuant to such agreement, which is included in transfer and dividend disbursing agent fees on the Statement of Operations. Eaton Vance Distributors, Inc. (EVD), an affiliate of EVM and the Fund’s principal underwriter, received distribution and service fees from Investor Class shares (see Note 4).
Trustees and officers of the Fund who are members of EVM’s organization receive remuneration for their services to the Fund out of the investment adviser and administration fee. Trustees of the Fund who are not affiliated with EVM may elect to defer receipt of all or a percentage of their annual fees in accordance with the terms of the Trustees Deferred Compensation Plan. For the year ended August 31, 2017, no significant amounts have been deferred. Certain officers and Trustees of the Fund are officers of EVM.
4 Distribution Plan
The Fund has in effect a distribution plan for Investor Class shares (Investor Class Plan) pursuant to Rule 12b-1 under the 1940 Act. Pursuant to the Investor Class Plan, the Fund pays EVD a distribution and service fee of 0.25% per annum of its average daily net assets attributable to Investor Class shares for distribution services and facilities provided to the Fund by EVD, as well as for personal services and/or the maintenance of shareholder accounts. Distribution and service fees paid or accrued to EVD for the year ended August 31, 2017 amounted to $225 for Investor Class shares.
Distribution and service fees are subject to the limitations contained in the Financial Industry Regulatory Authority Rule 2341(d).
5 Purchases and Sales of Investments
Purchases and sales of investments, other than short-term obligations, aggregated $1,189,646 and $1,010,209, respectively, for the year ended August 31, 2017.
Parametric Emerging Markets Core Fund
August 31, 2017
Notes to Financial Statements — continued
6 Shares of Beneficial Interest
The Fund’s Declaration of Trust permits the Trustees to issue an unlimited number of full and fractional shares of beneficial interest (without par value). Such shares may be issued in a number of different series (such as the Fund) and classes. Transactions in Fund shares were as follows:
| | | | | | | | |
| | | Year Ended August 31, | |
| Investor Class | | 2017 | | | 2016 | |
| | |
Sales | | | 13,427 | | | | 2,180 | |
Issued to shareholders electing to receive payments of distributions in Fund shares | | | 188 | | | | 132 | |
Redemptions | | | (6,063 | ) | | | (2,863 | ) |
| | |
Net increase (decrease) | | | 7,552 | | | | (551 | ) |
| | |
| | | | | | | | |
| | | Year Ended August 31, | |
| Institutional Class | | 2017 | | | 2016 | |
| | |
Sales | | | 3,567 | | | | 53,959 | |
Issued to shareholders electing to receive payments of distributions in Fund shares | | | 21,309 | | | | 28,256 | |
Redemptions | | | (5,290 | ) | | | (14,287 | ) |
| | |
Net increase | | | 19,586 | | | | 67,928 | |
At August 31, 2017, EVM owned 94.8% of the value of the outstanding shares of the Fund.
7 Line of Credit
The Fund participates with other portfolios and funds managed by EVM and its affiliates in a $625 million unsecured line of credit agreement with a group of banks, which is in effect through September 1, 2017. Pursuant to an amendment dated August 16, 2017 to the line of credit agreement, the expiration date was extended to October 31, 2017. Borrowings are made by the Fund solely to facilitate the handling of unusual and/or unanticipated short-term cash requirements. Interest is charged to the Fund based on its borrowings at an amount above either the Eurodollar rate or Federal Funds rate. In addition, a fee computed at an annual rate of 0.15% on the daily unused portion of the line of credit is allocated among the participating portfolios and funds at the end of each quarter. Because the line of credit is not available exclusively to the Fund, it may be unable to borrow some or all of its requested amounts at any particular time. The Fund did not have any significant borrowings or allocated fees during the year ended August 31, 2017.
8 Risks Associated with Foreign Investments
Investing in securities issued by companies whose principal business activities are outside the United States may involve significant risks not present in domestic investments. For example, there is generally less publicly available information about foreign companies, particularly those not subject to the disclosure and reporting requirements of the U.S. securities laws. Certain foreign issuers are generally not bound by uniform accounting, auditing, and financial reporting requirements and standards of practice comparable to those applicable to domestic issuers. Investments in foreign securities also involve the risk of possible adverse changes in investment or exchange control regulations, expropriation or confiscatory taxation, limitation on the removal of funds or other assets of the Fund, political or financial instability or diplomatic and other developments which could affect such investments. Foreign securities markets, while growing in volume and sophistication, are generally not as developed as those in the United States, and securities of some foreign issuers (particularly those located in developing countries) may be less liquid and more volatile than securities of comparable U.S. companies. In general, there is less overall governmental supervision and regulation of foreign securities markets, broker/dealers and issuers than in the United States. The foregoing risks of foreign investing can be more significant in less developed countries characterized as emerging market countries.
9 Fair Value Measurements
Under generally accepted accounting principles for fair value measurements, a three-tier hierarchy to prioritize the assumptions, referred to as inputs, is used in valuation techniques to measure fair value. The three-tier hierarchy of inputs is summarized in the three broad levels listed below.
| • | | Level 1 – quoted prices in active markets for identical investments |
| • | | Level 2 – other significant observable inputs (including quoted prices for similar investments, interest rates, prepayment speeds, credit risk, etc.) |
| • | | Level 3 – significant unobservable inputs (including a fund’s own assumptions in determining the fair value of investments) |
Parametric Emerging Markets Core Fund
August 31, 2017
Notes to Financial Statements — continued
In cases where the inputs used to measure fair value fall in different levels of the fair value hierarchy, the level disclosed is determined based on the lowest level input that is significant to the fair value measurement in its entirety. The inputs or methodology used for valuing securities are not necessarily an indication of the risk associated with investing in those securities.
At August 31, 2017, the hierarchy of inputs used in valuing the Fund’s investments, which are carried at value, were as follows:
| | | | | | | | | | | | | | | | |
| Asset Description | | Level 1 | | | Level 2 | | | Level 3* | | | Total | |
| | | | |
Common Stocks | | | | | | | | | | | | | | | | |
Asia/Pacific | | $ | 672,591 | | | $ | 5,112,363 | | | $ | 12,359 | | | $ | 5,797,313 | |
Emerging Europe | | | 101,519 | | | | 2,038,503 | | | | — | | | | 2,140,022 | |
Latin America | | | 2,483,465 | | | | — | | | | — | | | | 2,483,465 | |
Middle East/Africa | | | — | | | | 1,408,104 | | | | 0 | | | | 1,408,104 | |
| | | | |
Total Common Stocks | | $ | 3,257,575 | | | $ | 8,558,970 | ** | | $ | 12,359 | | | $ | 11,828,904 | |
Rights | | $ | — | | | $ | 0 | | | $ | — | | | $ | 0 | |
Warrants | | | 46 | | | | — | | | | — | | | | 46 | |
Short-Term Investments | | | — | | | | 8,911 | | | | — | | | | 8,911 | |
| | | | |
Total Investments | | $ | 3,257,621 | | | $ | 8,567,881 | | | $ | 12,359 | | | $ | 11,837,861 | |
| * | None of the unobservable inputs for Level 3 assets, individually or collectively, had a material impact on the Fund. |
| ** | Includes foreign equity securities whose values were adjusted to reflect market trading of comparable securities or other correlated instruments that occurred after the close of trading in their applicable foreign markets. |
Level 3 investments at the beginning and/or end of the period in relation to net assets were not significant and accordingly, a reconciliation of Level 3 assets for the year ended August 31, 2017 is not presented. At August 31, 2017, the value of investments transferred between Level 1 and Level 2 during the year then ended was not significant.
10 Plan of Liquidation and Termination
On October 17, 2017, the Fund’s Trustees approved a Plan of Liquidation and Termination for the Fund. On November 30, 2017, the Fund expects to discontinue sales of its shares to new investors, with limited exceptions. All of the Fund’s outstanding shares are expected to be redeemed and the Fund liquidated on or about December 15, 2017.
Parametric Emerging Markets Core Fund
August 31, 2017
Report of Independent Registered Public Accounting Firm
To the Trustees of Eaton Vance Mutual Funds Trust and Shareholders of Parametric Emerging Markets Core Fund:
We have audited the accompanying statement of assets and liabilities of Parametric Emerging Markets Core Fund (the “Fund”) (one of the funds constituting Eaton Vance Mutual Funds Trust), including the portfolio of investments, as of August 31, 2017, and the related statement of operations for the year then ended, the statements of changes in net assets for each of the two years in the period then ended, and the financial highlights for each of the periods presented. These financial statements and financial highlights are the responsibility of the Fund’s management. Our responsibility is to express an opinion on these financial statements and financial highlights based on our audits.
We conducted our audits in accordance with the standards of the Public Company Accounting Oversight Board (United States). Those standards require that we plan and perform the audit to obtain reasonable assurance about whether the financial statements and financial highlights are free of material misstatement. The Fund is not required to have, nor were we engaged to perform, an audit of its internal control over financial reporting. Our audits included consideration of internal control over financial reporting as a basis for designing audit procedures that are appropriate in the circumstances, but not for the purpose of expressing an opinion on the effectiveness of the Fund’s internal control over financial reporting. Accordingly, we express no such opinion. An audit also includes examining, on a test basis, evidence supporting the amounts and disclosures in the financial statements, assessing the accounting principles used and significant estimates made by management, as well as evaluating the overall financial statement presentation. Our procedures included confirmation of securities owned as of August 31, 2017, by correspondence with the custodian and brokers; where replies were not received from brokers, we performed other auditing procedures. We believe that our audits provide a reasonable basis for our opinion.
In our opinion, such financial statements and financial highlights referred to above present fairly, in all material respects, the financial position of Parametric Emerging Markets Core Fund as of August 31, 2017, the results of its operations for the year then ended, the changes in its net assets for each of the two years in the period then ended, and the financial highlights for each of the periods presented, in conformity with accounting principles generally accepted in the United States of America.
As discussed in Note 10 to the financial statements, on October 17, 2017, the Fund’s Trustees approved the liquidation of the Fund. All of the Fund’s outstanding shares are expected to be redeemed and the Fund liquidated on or about December 15, 2017.
DELOITTE & TOUCHE LLP
Boston, Massachusetts
October 20, 2017
Parametric Emerging Markets Core Fund
August 31, 2017
Federal Tax Information (Unaudited)
The Form 1099-DIV you receive in February 2018 will show the tax status of all distributions paid to your account in calendar year 2017. Shareholders are advised to consult their own tax adviser with respect to the tax consequences of their investment in the Fund. As required by the Internal Revenue Code and/or regulations, shareholders must be notified regarding the status of qualified dividend income for individuals and the foreign tax credit.
Qualified Dividend Income. For the fiscal year ended August 31, 2017, the Fund designates approximately $192,517, or up to the maximum amount of such dividends allowable pursuant to the Internal Revenue Code, as qualified dividend income eligible for the reduced tax rate of 15%.
Foreign Tax Credit. For the fiscal year ended August 31, 2017, the Fund paid foreign taxes of $35,143 and recognized foreign source income of $313,422.
Parametric Emerging Markets Core Fund
August 31, 2017
Board of Trustees’ Contract Approval
Overview of the Contract Review Process
The Investment Company Act of 1940, as amended (the “1940 Act”), provides, in substance, that each investment advisory agreement between a fund and its investment adviser will continue in effect from year to year only if its continuation is approved at least annually by the fund’s board of trustees, including by a vote of a majority of the trustees who are not “interested persons” of the fund (“Independent Trustees”), cast in person at a meeting called for the purpose of considering such approval.
At a meeting of the Boards of Trustees (each a “Board”) of the registered investment companies advised by either Eaton Vance Management or its affiliate, Boston Management and Research, (the “Eaton Vance Funds”) held on April 25, 2017, the Board, including a majority of the Independent Trustees, voted to approve continuation of existing investment advisory and sub-advisory agreements for the Eaton Vance Funds for an additional one-year period. In voting its approval, the Board relied upon the affirmative recommendation of its Contract Review Committee, which is a committee comprised exclusively of Independent Trustees. Prior to making its recommendation, the Contract Review Committee reviewed information furnished by each adviser to the Eaton Vance Funds (including information specifically requested by the Board) for a series of meetings of the Contract Review Committee held between February and April 2017. The Contract Review Committee also considered information received at prior meetings of the Board and its committees, as relevant to its annual evaluation of the investment advisory and sub-advisory agreements.
The information that the Board considered included, among other things, the following (for funds that invest through one or more underlying portfolio(s), references to “each fund” in this section may include information that was considered at the portfolio-level):
Information about Fees, Performance and Expenses
| • | | A report from an independent data provider comparing the advisory and related fees paid by each fund with fees paid by comparable funds as identified by the independent data provider (“comparable funds”); |
| • | | A report from an independent data provider comparing each fund’s total expense ratio and its components to comparable funds; |
| • | | A report from an independent data provider comparing the investment performance of each fund (including, where relevant, yield data, Sharpe ratios and information ratios) to the investment performance of comparable funds over various time periods; |
| • | | Data regarding investment performance in comparison to benchmark indices, as well as customized groups of peer funds and blended indices identified by the adviser in consultation with the Board; |
| • | | For each fund, comparative information concerning the fees charged and the services provided by each adviser in managing other accounts (including mutual funds, other collective investment funds and institutional accounts) using investment strategies and techniques similar to those used in managing such fund; |
| • | | Profitability analyses for each adviser with respect to each fund; |
Information about Portfolio Management and Trading
| • | | Descriptions of the investment management services provided to each fund, including the investment strategies and processes it employs; |
| • | | The procedures and processes used to determine the fair value of fund assets and actions taken to monitor and test the effectiveness of such procedures and processes; |
| • | | Information about each adviser’s policies and practices with respect to trading, including each adviser’s processes for monitoring best execution of portfolio transactions; |
| • | | Information about the allocation of brokerage transactions and the benefits received by each adviser as a result of brokerage allocation, including information concerning the acquisition of research through client commission arrangements and policies with respect to “soft dollars”; |
| • | | Data relating to portfolio turnover rates of each fund; |
Information about each Adviser
| • | | Reports detailing the financial results and condition of each adviser; |
| • | | Descriptions of the qualifications, education and experience of the individual investment professionals whose responsibilities include portfolio management and investment research for the funds, and information relating to their compensation and responsibilities with respect to managing other mutual funds and investment accounts; |
| • | | The Code of Ethics of each adviser and its affiliates, together with information relating to compliance with and the administration of such codes; |
| • | | Policies and procedures relating to proxy voting and the handling of corporate actions and class actions; |
| • | | Information concerning the resources devoted to compliance efforts undertaken by each adviser and its affiliates (including descriptions of various compliance programs) and their record of compliance; |
| • | | Information concerning the business continuity and disaster recovery plans of each adviser and its affiliates; |
| • | | A description of Eaton Vance Management’s procedures for overseeing third party advisers and sub-advisers, including with respect to regulatory and compliance issues, investment management and other matters; |
Parametric Emerging Markets Core Fund
August 31, 2017
Board of Trustees’ Contract Approval — continued
Other Relevant Information
| • | | Information concerning the nature, cost and character of the administrative and other non-investment advisory services provided by Eaton Vance Management and its affiliates; |
| • | | Information concerning management of the relationship with the custodian, subcustodians and fund accountants by each adviser or the funds’ administrator; and |
| • | | The terms of each investment advisory agreement. |
Over the course of the twelve-month period ended April 30, 2017, with respect to one or more funds, the Board met ten times and the Contract Review Committee, the Audit Committee, the Governance Committee, the Portfolio Management Committee and the Compliance Reports and Regulatory Matters Committee, each of which is a Committee comprised solely of Independent Trustees, met seven, thirteen, six, eight and ten times, respectively. At such meetings, the Trustees participated in investment and performance reviews with the portfolio managers and other investment professionals of each investment adviser relating to each fund, and considered various investment and trading strategies used in pursuing each fund’s investment objective, such as the use of derivative instruments, as well as risk management techniques. The Board and its Committees also evaluated issues pertaining to industry and regulatory developments, compliance procedures, fund governance and other issues with respect to the funds, and received and participated in reports and presentations provided by Eaton Vance Management and other fund advisers with respect to such matters. In addition to the formal meetings of the Board and its Committees, the Independent Trustees hold regular teleconferences in between meetings to discuss, among other topics, matters relating to the continuation of investment advisory and sub-advisory agreements.
For funds that invest through one or more underlying portfolios, the Board considered similar information about the portfolio(s) when considering the approval of investment advisory agreements. In addition, in cases where the fund’s investment adviser has engaged a sub-adviser, the Board considered similar information about the sub-adviser when considering the approval of any sub-advisory agreement.
The Contract Review Committee was assisted throughout the contract review process by Goodwin Procter LLP, independent legal counsel for the Independent Trustees. The members of the Contract Review Committee relied upon the advice of such counsel and their own business judgment in determining the material factors to be considered in evaluating each investment advisory and sub-advisory agreement and the weight to be given to each such factor. The conclusions reached with respect to each investment advisory and sub-advisory agreement were based on a comprehensive evaluation of all the information provided and not any single factor. Moreover, each member of the Contract Review Committee may have placed varying emphasis on particular factors in reaching conclusions with respect to each investment advisory and sub-advisory agreement. In evaluating each investment advisory and sub-advisory agreement, including the specific fee structures and other terms of the agreements, the Contract Review Committee was informed by multiple years of analysis and discussion among the Independent Trustees and the Eaton Vance Funds’ advisers and sub-advisers.
Results of the Process
Based on its consideration of the foregoing, and such other information as it deemed relevant, including the factors and conclusions described below, the Contract Review Committee concluded that the continuation of the investment advisory and administrative agreement of Parametric Emerging Markets Core Fund (the “Fund”) with Eaton Vance Management (the “Adviser”) and the sub-advisory agreement with Parametric Portfolio Associates LLC (the “Sub-adviser”), an affiliate of the Adviser, including their fee structures, is in the interests of shareholders and, therefore, the Contract Review Committee recommended to the Board approval of each agreement. The Board accepted the recommendation of the Contract Review Committee based on the material factors considered and conclusions reached by the Contract Review Committee with respect to the agreements. Accordingly, the Board, including a majority of the Independent Trustees, voted to approve continuation of the investment advisory and administrative agreement and the sub-advisory agreement for the Fund.
Nature, Extent and Quality of Services
In considering whether to approve the investment advisory and administrative agreement and the sub-advisory agreement of the Fund, the Board evaluated the nature, extent and quality of services provided to the Fund by the Adviser and the Sub-adviser.
The Board considered the Adviser’s and the Sub-adviser’s management capabilities and investment process with respect to the types of investments held by the Fund, including the education, experience and number of its investment professionals and other personnel who provide portfolio management, investment research, and similar services to the Fund. With respect to the Adviser, the Board considered the Adviser’s responsibilities overseeing the Sub-adviser and coordinating activities in implementing the Fund’s investment strategies. In particular, the Board considered the experience of the Sub-adviser’s investment professionals in employing a top-down, disciplined and systematic investment processes that emphasizes broad exposure and diversification among emerging market countries, economic sectors and issuers. The Board also took into account the resources dedicated to portfolio management and other services, as well as the compensation methods of the Adviser and other factors, such as the reputation and resources of the Adviser to recruit and retain highly qualified research, advisory and supervisory investment professionals. In addition, the Board considered the time and attention devoted to the Eaton Vance Funds, including the Fund, by senior management, as well as the infrastructure, operational capabilities and support staff in place to assist in the portfolio management and operations of the Fund, including the provision of administrative services. The Board also considered the business-related and other risks to which the Adviser or its affiliates may be subject in managing the Fund.
Parametric Emerging Markets Core Fund
August 31, 2017
Board of Trustees’ Contract Approval — continued
The Board considered the compliance programs of the Adviser and relevant affiliates thereof, including the Sub-adviser. Among other matters, the Board considered compliance and reporting matters relating to personal trading by investment professionals, selective disclosure of portfolio holdings, late trading, frequent trading, portfolio valuation, business continuity and the allocation of investment opportunities. The Board also considered the responses of the Adviser and its affiliates to requests in recent years from regulatory authorities such as the Securities and Exchange Commission and the Financial Industry Regulatory Authority.
The Board was aware that on April 24, 2017 a former employee of the Adviser agreed to plead guilty to fraud charges arising from the individual’s prior activities as an equity options trader for certain Eaton Vance Funds. The Board was informed that the Adviser became aware of the matter on April 18, 2017, at which time management contacted federal authorities, alerted the Board and began an internal investigation. The Adviser represented to the Board that, based on information available as of April 25, 2017, management had no reason to believe that any other employee of the Adviser or its affiliates was involved in any wrongful activities or that any fund had been materially harmed. The Adviser agreed to keep the Board fully apprised as additional information is learned, and assured the Board that any fund harmed by the former employee’s wrongful activities will be made whole, as determined in consultation with the Board. The Board concluded that the Adviser’s actions in response to these events are appropriate and consistent with the Adviser’s commitment to protect and provide quality services to the Eaton Vance Funds.
The Board considered shareholder and other administrative services provided or managed by the Adviser and its affiliates, including transfer agency and accounting services. The Board evaluated the benefits to shareholders of investing in a fund that is a part of a large fund complex offering exposure to a variety of asset classes and investment disciplines, as well as the ability, in many cases, to exchange an investment among different funds without incurring additional sales charges.
After consideration of the foregoing factors, among others, the Board concluded that the nature, extent and quality of services provided by the Adviser and the Sub-adviser, taken as a whole, are appropriate and consistent with the terms of the investment advisory and administrative agreement and the sub-advisory agreement.
Fund Performance
The Board compared the Fund’s investment performance to that of comparable funds and appropriate benchmark indices. The Board’s review included comparative performance data for the one- and three-year periods ended September 30, 2016 for the Fund. On the basis of the foregoing and other relevant information provided by the Adviser in response to inquiries from the Contract Review Committee, the Board concluded that the performance of the Fund was satisfactory.
Management Fees and Expenses
The Board considered contractual fee rates payable by the Fund for advisory and administrative services (referred to collectively as “management fees”). As part of its review, the Board considered the Fund’s management fees and total expense ratio for the one year period ended September 30, 2016, as compared to those of comparable funds, before and after giving effect to any undertaking to waive fees or reimburse expenses. The Board also received and considered information about the services offered and the fee rates charged by the Adviser and/or Sub-adviser to other types of clients with investment objectives and strategies that are substantially similar to and/or managed in a similar investment style as the Fund. In this regard, the Board received information about the differences in the nature and scope of services the Adviser and/or Sub-adviser provide to the Fund as compared to other types of clients and the material differences in compliance, reporting and other legal burdens and risks to the Adviser and/or Sub-adviser as between the Fund and other types of clients. The Board also considered factors that had an impact on Fund expense ratios relative to comparable funds.
After considering the foregoing information, and in light of the nature, extent and quality of the services provided by the Adviser and the Sub-adviser, the Board concluded that the management fees charged for advisory and related services are reasonable.
Profitability and Other “Fall-Out” Benefits
The Board considered the level of profits realized by the Adviser and relevant affiliates thereof, including the Sub-adviser, in providing investment advisory and administrative services to the Fund and to all Eaton Vance Funds as a group. The Board considered the level of profits realized without regard to marketing support or other payments by the Adviser and its affiliates to third parties in respect of distribution services. The Board also considered other direct or indirect fall-out benefits received by the Adviser and its affiliates, including the Sub-adviser, in connection with their relationships with the Fund, including the benefits of research services that may be available to the Adviser or the Sub-adviser as a result of securities transactions effected for the Fund and other investment advisory clients.
The Board concluded that, in light of the foregoing factors and the nature, extent and quality of the services rendered, the profits realized by the Adviser and its affiliates, including the Sub-adviser, are deemed not to be excessive.
Parametric Emerging Markets Core Fund
August 31, 2017
Board of Trustees’ Contract Approval — continued
Economies of Scale
In reviewing management fees and profitability, the Board also considered the extent to which the Adviser and its affiliates, on the one hand, and the Fund, on the other hand, can expect to realize benefits from economies of scale as the assets of the Fund increase. The Board acknowledged the difficulty in accurately measuring the benefits resulting from economies of scale, if any, with respect to the management of any specific fund or group of funds. The Board reviewed data summarizing the increases and decreases in the assets of the Fund and of all Eaton Vance Funds as a group over various time periods, and evaluated the extent to which the total expense ratio of the Fund and the profitability of the Adviser and its affiliates may have been affected by such increases or decreases. Based upon the foregoing, the Board concluded that the Fund currently shares in any benefits from economies of scale. The Board also concluded that, assuming reasonably foreseeable increases in the assets of the Fund, the structure of the advisory fee, which includes breakpoints at several asset levels, will allow the Fund to continue to benefit from any economies of scale in the future.
Parametric Emerging Markets Core Fund
August 31, 2017
Management and Organization
Fund Management. The Trustees of Eaton Vance Mutual Funds Trust (the Trust) are responsible for the overall management and supervision of the Trust’s affairs. The Trustees and officers of the Trust are listed below. Except as indicated, each individual has held the office shown or other offices in the same company for the last five years. Trustees and officers of the Trust hold indefinite terms of office. The “Noninterested Trustees” consist of those Trustees who are not “interested persons” of the Trust, as that term is defined under the 1940 Act. The business address of each Trustee and officer is Two International Place, Boston, Massachusetts 02110. As used below, “EVC” refers to Eaton Vance Corp., “EV” refers to Eaton Vance, Inc., “EVM” refers to Eaton Vance Management, “BMR” refers to Boston Management and Research, “EVMI” refers to Eaton Vance Management (International) Limited and “EVD” refers to Eaton Vance Distributors, Inc. EVC and EV are the corporate parent and trustee, respectively, of EVM and BMR. EVMI is an indirect, wholly-owned subsidiary of EVC. EVD is the Fund’s principal underwriter and a wholly-owned subsidiary of EVC. Each officer affiliated with Eaton Vance may hold a position with other Eaton Vance affiliates that is comparable to his or her position with EVM listed below. Each Trustee oversees 176 portfolios in the Eaton Vance Complex (including all master and feeder funds in a master feeder structure). Each officer serves as an officer of certain other Eaton Vance funds. Each Trustee and officer serves until his or her successor is elected.
| | | | | | |
| Name and Year of Birth | | Position(s) with the Trust | | Trustee
Since(1) | | Principal Occupation(s) and Directorships During Past Five Years and Other Relevant Experience |
Interested Trustee |
| | | |
Thomas E. Faust Jr. 1958 | | Trustee | | 2007 | | Chairman, Chief Executive Officer and President of EVC, Director and President of EV, Chief Executive Officer and President of EVM and BMR, and Director of EVD and EVMI. Trustee and/or officer of 176 registered investment companies. Mr. Faust is an interested person because of his positions with EVM, BMR, EVD, EVMI, EVC and EV, which are affiliates of the Trust. Directorships in the Last Five Years.(2) Director of EVC and Hexavest Inc. (investment management firm). |
| | | |
| | | | | | |
Noninterested Trustees |
| | | |
Mark R. Fetting 1954 | | Trustee | | 2016 | | Private investor. Formerly held various positions at Legg Mason, Inc. (investment management firm) (2000-2012), including President, Chief Executive Officer, Director and Chairman (2008-2012), Senior Executive Vice President (2004-2008) and Executive Vice President (2001-2004). Formerly, President of Legg Mason family of funds (2001-2008). Formerly, Division President and Senior Officer of Prudential Financial Group, Inc. and related companies (investment management firm) (1991-2000). Directorships in the Last Five Years. Formerly, Director and Chairman of Legg Mason, Inc. (2008-2012); Director/Trustee and Chairman of Legg Mason family of funds (14 funds) (2008-2012); and Director/Trustee of the Royce family of funds (35 funds) (2001-2012). |
| | | |
Cynthia E. Frost 1961 | | Trustee | | 2014 | | Private investor. Formerly, Chief Investment Officer of Brown University (university endowment) (2000-2012); Portfolio Strategist for Duke Management Company (university endowment manager) (1995-2000); Managing Director, Cambridge Associates (investment consulting company) (1989-1995); Consultant, Bain and Company (management consulting firm) (1987-1989); Senior Equity Analyst, BA Investment Management Company (1983-1985). Directorships in the Last Five Years. None. |
| | | |
George J. Gorman 1952 | | Trustee | | 2014 | | Principal at George J. Gorman LLC (consulting firm). Formerly, Senior Partner at Ernst & Young LLP (a registered public accounting firm) (1974-2009). Directorships in the Last Five Years. Formerly, Trustee of the BofA Funds Series Trust (11 funds) (2011-2014) and of the Ashmore Funds (9 funds) (2010-2014). |
| | | |
Valerie A. Mosley 1960 | | Trustee | | 2014 | | Chairwoman and Chief Executive Officer of Valmo Ventures (a consulting and investment firm). Former Partner and Senior Vice President, Portfolio Manager and Investment Strategist at Wellington Management Company, LLP (investment management firm) (1992-2012). Former Chief Investment Officer, PG Corbin Asset Management (1990-1992). Formerly worked in institutional corporate bond sales at Kidder Peabody (1986-1990). Directorships in the Last Five Years.(2) Director of Dynex Capital, Inc. (mortgage REIT) (since 2013). |
Parametric Emerging Markets Core Fund
August 31, 2017
Management and Organization — continued
| | | | | | |
| Name and Year of Birth | | Position(s) with the Trust | | Trustee
Since(1) | | Principal Occupation(s) and Directorships During Past Five Years and Other Relevant Experience |
Noninterested Trustees (continued) |
| | | |
William H. Park 1947 | | Chairperson of the Board and Trustee | | 2016 (Chairperson); 2003 (Trustee) | | Private investor. Formerly, Consultant (management and transactional) (2012-2014). Formerly, Chief Financial Officer, Aveon Group L.P. (investment management firm) (2010-2011). Formerly, Vice Chairman, Commercial Industrial Finance Corp. (specialty finance company) (2006-2010). Formerly, President and Chief Executive Officer, Prizm Capital Management, LLC (investment management firm) (2002-2005). Formerly, Executive Vice President and Chief Financial Officer, United Asset Management Corporation (investment management firm) (1982-2001). Formerly, Senior Manager, Price Waterhouse (now PricewaterhouseCoopers) (a registered public accounting firm) (1972-1981). Directorships in the Last Five Years.(2) None. |
| | | |
Helen Frame Peters 1948 | | Trustee | | 2008 | | Professor of Finance, Carroll School of Management, Boston College. Formerly, Dean, Carroll School of Management, Boston College (2000-2002). Formerly, Chief Investment Officer, Fixed Income, Scudder Kemper Investments (investment management firm) (1998-1999). Formerly, Chief Investment Officer, Equity and Fixed Income, Colonial Management Associates (investment management firm) (1991-1998). Directorships in the Last Five Years.(2) Formerly, Director of BJ’s Wholesale Club, Inc. (wholesale club retailer) (2004-2011). Formerly, Trustee of SPDR Index Shares Funds and SPDR Series Trust (exchange traded funds) (2000-2009). Formerly, Director of Federal Home Loan Bank of Boston (a bank for banks) (2007-2009). |
| | | |
Susan J. Sutherland 1957 | | Trustee | | 2015 | | Private investor. Formerly, Associate, Counsel and Partner at Skadden, Arps, Slate, Meagher & Flom LLP (law firm) (1982-2013). Directorships in the Last Five Years. Formerly, Director of Montpelier Re Holdings Ltd. (global provider of customized insurance and reinsurance products) (2013-2015). |
| | | |
Harriett Tee Taggart 1948 | | Trustee | | 2011 | | Managing Director, Taggart Associates (a professional practice firm). Formerly, Partner and Senior Vice President, Wellington Management Company, LLP (investment management firm) (1983-2006). Directorships in the Last Five Years.(2) Director of Albemarle Corporation (chemicals manufacturer) (since 2007) and The Hanover Group (specialty property and casualty insurance company) (since 2009). Formerly, Director of Lubrizol Corporation (specialty chemicals) (2007-2011). |
| | | |
Scott E. Wennerholm 1959 | | Trustee | | 2016 | | Trustee at Wheelock College (postsecondary institution) (since 2012). Formerly, Consultant at GF Parish Group (executive recruiting firm) (2016-2017). Formerly, Chief Operating Officer and Executive Vice President at BNY Mellon Asset Management (investment management firm) (2005-2011). Formerly, Chief Operating Officer and Chief Financial Officer at Natixis Global Asset Management (investment management firm) (1997-2004). Formerly, Vice President at Fidelity Investments Institutional Services (investment management firm) (1994-1997). Directorships in the Last Five Years. None. |
Parametric Emerging Markets Core Fund
August 31, 2017
Management and Organization — continued
| | | | | | |
Principal Officers who are not Trustees |
| Name and Year of Birth | | Position(s) with the Trust | | Officer
Since(3) | | Principal Occupation(s) During Past Five Years |
Payson F. Swaffield 1956 | | President | | 2003 | | Vice President and Chief Income Investment Officer of EVM and BMR. Also Vice President of Calvert Research and Management (“CRM”). |
Maureen A. Gemma 1960 | | Vice President, Secretary and Chief Legal Officer | | 2005 | | Vice President of EVM and BMR. Also Vice President of CRM. |
James F. Kirchner 1967 | | Treasurer | | 2007 | | Vice President of EVM and BMR. Also Vice President of CRM. |
Paul M. O’Neil 1953 | | Chief Compliance Officer | | 2004 | | Vice President of EVM and BMR. |
| (1) | Year first appointed to serve as Trustee for a fund in the Eaton Vance family of funds. Each Trustee has served continuously since appointment unless indicated otherwise. |
| (2) | During their respective tenures, the Trustees (except for Mmes. Frost and Sutherland and Messrs. Fetting, Gorman and Wennerholm) also served as Board members of one or more of the following funds (which operated in the years noted): eUnitsTM 2 Year U.S. Market Participation Trust: Upside to Cap / Buffered Downside (launched in 2012 and terminated in 2014); eUnitsTM 2 Year U.S. Market Participation Trust II: Upside to Cap / Buffered Downside (launched in 2012 and terminated in 2014); and Eaton Vance National Municipal Income Trust (launched in 1998 and terminated in 2009). However, Ms. Mosley did not serve as a Board member of eUnitsTM 2 Year U.S. Market Participation Trust: Upside to Cap / Buffered Downside (launched in 2012 and terminated in 2014). |
| (3) | Year first elected to serve as officer of a fund in the Eaton Vance family of funds when the officer has served continuously. Otherwise, year of most recent election as an officer of a fund in the Eaton Vance family of funds. Titles may have changed since initial election. |
The SAI for the Fund includes additional information about the Trustees and officers of the Fund and can be obtained without charge on Eaton Vance’s website at www.eatonvance.com or by calling 1-800-260-0761.
Eaton Vance Funds
IMPORTANT NOTICES
Privacy. The Eaton Vance organization is committed to ensuring your financial privacy. Each of the financial institutions identified below has in effect the following policy (“Privacy Policy”) with respect to nonpublic personal information about its customers:
| • | | Only such information received from you, through application forms or otherwise, and information about your Eaton Vance fund transactions will be collected. This may include information such as name, address, social security number, tax status, account balances and transactions. |
| • | | None of such information about you (or former customers) will be disclosed to anyone, except as permitted by law (which includes disclosure to employees necessary to service your account). In the normal course of servicing a customer’s account, Eaton Vance may share information with unaffiliated third parties that perform various required services such as transfer agents, custodians and broker-dealers. |
| • | | Policies and procedures (including physical, electronic and procedural safeguards) are in place that are designed to protect the confidentiality of such information. |
| • | | We reserve the right to change our Privacy Policy at any time upon proper notification to you. Customers may want to review our Privacy Policy periodically for changes by accessing the link on our homepage: www.eatonvance.com. |
Our pledge of privacy applies to the following entities within the Eaton Vance organization: the Eaton Vance Family of Funds, Eaton Vance Management, Eaton Vance Investment Counsel, Eaton Vance Distributors, Inc., Eaton Vance Trust Company, Eaton Vance Management (International) Limited, Eaton Vance Management’s Real Estate Investment Group and Boston Management and Research. In addition, our Privacy Policy applies only to those Eaton Vance customers who are individuals and who have a direct relationship with us. If a customer’s account (i.e., fund shares) is held in the name of a third-party financial advisor/broker-dealer, it is likely that only such advisor’s privacy policies apply to the customer. This notice supersedes all previously issued privacy disclosures. For more information about Eaton Vance’s Privacy Policy, please call 1-800-262-1122.
Delivery of Shareholder Documents. The Securities and Exchange Commission (SEC) permits funds to deliver only one copy of shareholder documents, including prospectuses, proxy statements and shareholder reports, to fund investors with multiple accounts at the same residential or post office box address. This practice is often called “householding” and it helps eliminate duplicate mailings to shareholders. Eaton Vance, or your financial advisor, may household the mailing of your documents indefinitely unless you instruct Eaton Vance, or your financial advisor, otherwise. If you would prefer that your Eaton Vance documents not be householded, please contact Eaton Vance at 1-800-260-0761, or contact your financial advisor. Your instructions that householding not apply to delivery of your Eaton Vance documents will typically be effective within 30 days of receipt by Eaton Vance or your financial advisor. Separate statements will be generated for each separate account and will be householded as described above.
Portfolio Holdings. Each Eaton Vance Fund and its underlying Portfolio(s) (if applicable) will file a schedule of portfolio holdings on Form N-Q with the SEC for the first and third quarters of each fiscal year. The Form N-Q will be available on the Eaton Vance website at www.eatonvance.com, by calling Eaton Vance at 1-800-260-0761 or in the EDGAR database on the SEC’s website at www.sec.gov. Form N-Q may also be reviewed and copied at the SEC’s public reference room in Washington, D.C. (call 1-800-732-0330 for information on the operation of the public reference room).
Proxy Voting. From time to time, funds are required to vote proxies related to the securities held by the funds. The Eaton Vance Funds or their underlying Portfolios (if applicable) vote proxies according to a set of policies and procedures approved by the Funds’ and Portfolios’ Boards. You may obtain a description of these policies and procedures and information on how the Funds or Portfolios voted proxies relating to portfolio securities during the most recent 12-month period ended June 30, without charge, upon request, by calling 1-800-260-0761 and by accessing the SEC’s website at www.sec.gov.
This Page Intentionally Left Blank
This Page Intentionally Left Blank
This Page Intentionally Left Blank
Investment Adviser and Administrator
Eaton Vance Management
Two International Place
Boston, MA 02110
Sub-Adviser
Parametric Portfolio Associates LLC
1918 Eighth Avenue, Suite 3100
Seattle, WA 98101
Principal Underwriter*
Eaton Vance Distributors, Inc.
Two International Place
Boston, MA 02110
(617) 482-8260
Custodian
State Street Bank and Trust Company
State Street Financial Center, One Lincoln Street
Boston, MA 02111
Transfer Agent
BNY Mellon Investment Servicing (US) Inc.
Attn: Eaton Vance Funds
P.O. Box 9653
Providence, RI 02940-9653
(800) 260-0761
Independent Registered Public Accounting Firm
Deloitte & Touche LLP
200 Berkeley Street
Boston, MA 02116-5022
Fund Offices
Two International Place
Boston, MA 02110
| * | FINRA BrokerCheck. Investors may check the background of their Investment Professional by contacting the Financial Industry Regulatory Authority (FINRA). FINRA BrokerCheck is a free tool to help investors check the professional background of current and former FINRA-registered securities firms and brokers. FINRA BrokerCheck is available by calling 1-800-289-9999 and at www.FINRA.org. The FINRA BrokerCheck brochure describing this program is available to investors at www.FINRA.org. |
16103 8.31.17
Item 2. Code of Ethics
The registrant has adopted a code of ethics applicable to its Principal Executive Officer, Principal Financial Officer and Principal Accounting Officer. The registrant undertakes to provide a copy of such code of ethics to any person upon request, without charge, by calling 1-800-262-1122. The registrant has amended the code of ethics as described in Form N-CSR during the period covered by this report to make clarifying changes consistent with Rule 21F-17 of the Securities Exchange Act of 1934, as amended. The registrant has not granted any waiver, including an implicit waiver, from a provision of the code of ethics as described in Form N-CSR during the period covered by this report.
Item 3. Audit Committee Financial Expert
The registrant’s Board has designated William H. Park, an independent trustee, as its audit committee financial expert. Mr. Park is a certified public accountant who is a private investor. Previously, he served as a consultant, as the Chief Financial Officer of Aveon Group, L.P. (an investment management firm), as the Vice Chairman of Commercial Industrial Finance Corp. (specialty finance company), as President and Chief Executive Officer of Prizm Capital Management, LLC (investment management firm), as Executive Vice President and Chief Financial Officer of United Asset Management Corporation (an institutional investment management firm) and as a Senior Manager at Price Waterhouse (now PricewaterhouseCoopers) (an independent registered public accounting firm).
Item 4. Principal Accountant Fees and Services
Parametric Emerging Markets Core Fund (the “Fund(s)”) is a series of Eaton Vance Mutual Funds Trust (the “Trust”), a Massachusetts business trust, which, including the Fund, contains a total of 34 series (the “Series”). The Trust is registered under the Investment Company Act of 1940 as an open-end management investment company. This Form N-CSR relates to the Fund’s annual report.
Rule 2-01(c)(1)(ii)(A) of Regulation S-X (the “Loan Rule”) prohibits an accounting firm, such as the Trust’s principal accountant, Deloitte & Touche LLP (“D&T”), from having certain financial relationships with their audit clients and affiliated entities. Specifically, the Loan Rule provides, in relevant part, that an accounting firm generally would not be independent if it or a “covered person” of the accounting firm (within the meaning of applicable SEC rules relating to auditor independence) receives a loan from a lender that is a “record or beneficial owner of more than ten percent of the audit client’s equity securities.” Based on information provided to the Audit Committee of the Board of Trustees (the “Audit Committee”) of the Eaton Vance family of funds by D&T, certain relationships between D&T and its affiliates (“Deloitte Entities”) and one or more lenders who are record owners of shares of one or more funds within the Eaton Vance family of funds (the “Funds”) implicate the Loan Rule, calling into question D&T’s independence with respect to the Funds. The Funds are providing this disclosure to explain the facts and circumstances as well as D&T’s conclusions concerning D&T’s objectivity and impartiality with respect to the audits of the Funds notwithstanding the existence of one or more breaches of the Loan Rule.
On June 20, 2016, the U.S. Securities and Exchange Commission (the “SEC”) issued no-action relief to another mutual fund complex (see Fidelity Management & Research Company et al., No-Action Letter (June 20, 2016) (the “No-Action Letter”)) related to an auditor independence issue arising under the Loan Rule. In the No-Action Letter, the SEC indicated that it would not recommend enforcement action against the fund group if the auditor is not in compliance with the Loan Rule provided that: (1) the auditor has complied with PCAOB Rule 3526(b)(1) and 3526(b)(2); (2) the auditor’s non-compliance under the Loan Rule is with respect to certain lending relationships; and (3) notwithstanding such non-compliance, the auditor has concluded that it is objective and impartial with respect to the issues encompassed within its engagement as auditor of the funds. The SEC has indicated that the no-action relief will expire 18 months from its issuance.
Based on information provided by D&T to the Audit Committee, the requirements of the No-Action Letter appear to be met with respect to D&T’s lending relationships described above. Among other things, D&T has advised the Audit Committee of its conclusion that the consequences of the breach of the Loan Rule have been satisfactorily addressed, that D&T’s objectivity and impartiality in the planning and conduct of the audits of the Fund’s financial statements has not been compromised and that, notwithstanding the breach, D&T is in a position to continue as the auditor for the Funds and D&T does not believe any actions need to be taken with respect to previously issued reports by D&T. D&T has advised the Audit Committee that these conclusions were based in part on its consideration of the No-Action Letter and other relevant information communicated to the Audit Committee.
(a) –(d)
The following table presents the aggregate fees billed to the Fund for the Fund’s fiscal years ended August 31, 2016 and August 31, 2017 by D&T, for professional services rendered for the audit of the Fund’s annual financial statements and fees billed for other services rendered by D&T during such periods.
Parametric Emerging Markets Core Fund
| | | | | | | | |
Fiscal Years Ended | | 8/31/16 | | | 8/31/17 | |
Audit Fees | | $ | 48,950 | | | $ | 48,950 | |
Audit-Related Fees(1) | | $ | 0 | | | $ | 0 | |
Tax Fees(2) | | $ | 12,259 | | | $ | 12,420 | |
All Other Fees(3) | | $ | 0 | | | $ | 0 | |
| | | | | | | | |
Total | | $ | 61,209 | | | $ | 61,370 | |
| | | | | | | | |
| (1) | Audit-related fees consist of the aggregate fees billed for assurance and related services that are reasonably related to the performance of the audit of financial statements and are not reported under the category of audit fees. |
| (2) | Tax fees consist of the aggregate fees billed for professional services rendered by the principal accountant relating to tax compliance, tax advice, and tax planning and specifically include fees for tax return preparation and other related tax compliance/planning matters. |
| (3) | All other fees consist of the aggregate fees billed for products and services provided by the principal accountant other than audit, audit-related, and tax services. |
The various Series comprising the Trust have differing fiscal year ends (January 31, February 28/29, August 31, September 30, October 31, or December 31). The following table presents the aggregate audit, audit-related, tax, and other fees billed to all of the Series in the Trust by D&T for the last two fiscal years of each Series.
| | | | | | | | | | | | | | | | | | | | | | | | | | | | | | | | | | | | | | | | | | | | | | | | |
Fiscal Years Ended | | 9/30/15 | | | 10/31/15 | | | 12/31/15 | | | 1/31/16 | | | 2/29/16 | | | 8/31/16 | | | 9/30/16 | | | 10/31/16 | | | 12/31/16 | | | 1/31/17 | | | 2/28/17 | | | 8/31/17 | |
Audit Fees | | $ | 106,700 | | | $ | 581,560 | | | $ | 105,020 | | | $ | 136,480 | | | $ | 22,650 | | | $ | 48,950 | | | $ | 97,730 | | | $ | 570,575 | | | $ | 105,320 | | | $ | 114,580 | | | $ | 25,850 | | | $ | 48,950 | |
Audit-Related Fees(1) | | $ | 2,550 | | | $ | 0 | | | $ | 0 | | | $ | 0 | | | $ | 0 | | | $ | 0 | | | $ | 0 | | | $ | 0 | | | $ | 0 | | | $ | 0 | | | $ | 0 | | | $ | 0 | |
Tax Fees(2) | | $ | 34,621 | | | $ | 338,673 | | | $ | 51,252 | | | $ | 49,348 | | | $ | 9,648 | | | $ | 12,259 | | | $ | 25,000 | | | $ | 360,983 | | | $ | 61,414 | | | $ | 36,811 | | | $ | 9,744 | | | $ | 12,420 | |
All Other Fees(3) | | $ | 0 | | | $ | 0 | | | $ | 0 | | | $ | 0 | | | $ | 0 | | | $ | 0 | | | $ | 0 | | | $ | 0 | | | $ | 0 | | | $ | 0 | | | $ | 0 | | | $ | 0 | |
| | | | | | | | | | | | | | | | | | | | | | | | | | | | | | | | | | | | | | | | | | | | | | | | |
Total | | $ | 143,871 | | | $ | 920,233 | | | $ | 156,272 | | | $ | 185,828 | | | $ | 32,298 | | | $ | 61,209 | | | $ | 122,730 | | | $ | 931,558 | | | $ | 166,734 | | | $ | 151,391 | | | $ | 35,594 | | | $ | 61,370 | |
| | | | | | | | | | | | | | | | | | | | | | | | | | | | | | | | | | | | | | | | | | | | | | | | |
| (1) | Audit-related fees consist of the aggregate fees billed for assurance and related services that are reasonably related to the performance of the audit of financial statements and are not reported under the category of audit fees. |
| (2) | Tax fees consist of the aggregate fees billed for professional services rendered by the principal accountant relating to tax compliance, tax advice, and tax planning and specifically include fees for tax return preparation and other related tax compliance/planning matters. |
| (3) | All other fees consist of the aggregate fees billed for products and services provided by the principal accountant other than audit, audit-related, and tax services. |
(e)(1) The registrant’s audit committee has adopted policies and procedures relating to the pre-approval of services provided by the registrant’s principal accountant (the “Pre-Approval Policies”). The Pre-Approval Policies establish a framework intended to assist the audit committee in the proper discharge of its pre-approval responsibilities. As a general matter, the Pre-Approval Policies (i) specify certain types of audit, audit-related, tax, and other services determined to be pre-approved by the audit committee; and (ii) delineate specific procedures governing the mechanics of the pre-approval process, including the approval and monitoring of audit and non-audit service fees. Unless a service is specifically pre-approved under the Pre-Approval Policies, it must be separately pre-approved by the audit committee.
The Pre-Approval Policies and the types of audit and non-audit services pre-approved therein must be reviewed and ratified by the registrant’s audit committee at least annually. The registrant’s audit committee maintains full responsibility for the appointment, compensation, and oversight of the work of the registrant’s principal accountant.
(e)(2) No services described in paragraphs (b)-(d) above were approved by the registrant’s audit committee pursuant to the “de minimis exception” set forth in Rule 2-01(c)(7)(i)(C) of Regulation S-X.
(f) Not applicable.
(g) The following table presents (i) the aggregate non-audit fees (i.e., fees for audit-related, tax, and other services) billed for services rendered to all of the Series in the Trust by D&T for the last two fiscal years of each Series; and (ii) the aggregate non-audit fees (i.e., fees for audit-related, tax, and other services) billed to the Eaton Vance organization by D&T for the last two fiscal years of each Series.
| | | | | | | | | | | | | | | | | | | | | | | | | | | | | | | | | | | | | | | | | | | | | | | | |
Fiscal Years
Ended | | 9/30/15 | | | 10/31/15 | | | 12/31/15 | | | 1/31/16 | | | 2/29/16 | | | 8/31/16 | | | 9/30/16 | | | 10/31/16 | | | 12/31/16 | | | 1/31/17 | | | 2/28/17 | | | 8/31/17 | |
Registrant(1) | | $ | 37,171 | | | $ | 338,673 | | | $ | 51,252 | | | $ | 49,348 | | | $ | 9,648 | | | $ | 12,259 | | | $ | 25,000 | | | $ | 360,983 | | | $ | 61,414 | | | $ | 36,811 | | | $ | 9,744 | | | $ | 12,420 | |
Eaton Vance(2) | | $ | 46,000 | | | $ | 46,000 | | | $ | 56,434 | | | $ | 56,434 | | | $ | 56,434 | | | $ | 56,434 | | | $ | 56,434 | | | $ | 56,434 | | | $ | 46,000 | | | $ | 46,000 | | | $ | 46,000 | | | $ | 148,018 | |
| (1) | Includes all of the Series of the Trust. During the fiscal years reported above, certain of the Funds were “feeder” funds in a “master-feeder” fund structure or funds of funds. |
| (2) | Various subsidiaries of Eaton Vance Corp. act in either an investment advisory and/or service provider capacity with respect to the Series and/or their respective “master” funds (if applicable). |
(h) The registrant’s audit committee has considered whether the provision by the registrant’s principal accountant of non-audit services to the registrant’s investment adviser and any entity controlling, controlled by, or under common control with the adviser that provides ongoing services to the registrant that were not pre-approved pursuant to Rule 2-01(c)(7)(ii) of Regulation S-X is compatible with maintaining the principal accountant’s independence.
Item 5. Audit Committee of Listed Registrants
Not applicable.
Item 6. Schedule of Investments
Please see schedule of investments contained in the Report to Stockholders included under Item 1 of this Form N-CSR.
Item 7. Disclosure of Proxy Voting Policies and Procedures for Closed-End Management Investment Companies
Not applicable.
Item 8. Portfolio Managers of Closed-End Management Investment Companies
Not applicable.
Item 9. Purchases of Equity Securities by Closed-End Management Investment Company and Affiliated Purchasers
Not applicable.
Item 10. Submission of Matters to a Vote of Security Holders
No material changes.
Item 11. Controls and Procedures
(a) It is the conclusion of the registrant’s principal executive officer and principal financial officer that the effectiveness of the registrant’s current disclosure controls and procedures (such disclosure controls and procedures having been evaluated within 90 days of the date of this filing) provide reasonable assurance that the information required to be disclosed by the registrant has been recorded, processed, summarized and reported within the time period specified in the Commission’s rules and forms and that the information required to be disclosed by the registrant has been accumulated and communicated to the registrant’s principal executive officer and principal financial officer in order to allow timely decisions regarding required disclosure.
(b) There have been no changes in the registrant’s internal controls over financial reporting during the second fiscal quarter of the period covered by this report that has materially affected, or is reasonably likely to materially affect, the registrant’s internal control over financial reporting.
Item 12. Exhibits
| | |
| |
(a)(1) | | Registrant’s Code of Ethics – Not applicable (please see Item 2). |
| |
(a)(2)(i) | | Treasurer’s Section 302 certification. |
| |
(a)(2)(ii) | | President’s Section 302 certification. |
| |
(b) | | Combined Section 906 certification. |
Signatures
Pursuant to the requirements of the Securities Exchange Act of 1934 and the Investment Company Act of 1940, the registrant has duly caused this report to be signed on its behalf by the undersigned, thereunto duly authorized.
| | |
| Eaton Vance Mutual Funds Trust |
| |
| By: | | /s/ Payson F. Swaffield |
| | Payson F. Swaffield |
| | President |
| |
| Date: | | October 24, 2017 |
Pursuant to the requirements of the Securities Exchange Act of 1934 and the Investment Company Act of 1940, this report has been signed below by the following persons on behalf of the registrant and in the capacities and on the dates indicated.
| | |
| By: | | /s/ James F. Kirchner |
| | James F. Kirchner |
| | Treasurer |
| |
| Date: | | October 24, 2017 |
| |
| By: | | /s/ Payson F. Swaffield |
| | Payson F. Swaffield |
| | President |
| |
| Date: | | October 24, 2017 |