UNITED STATES
SECURITIES AND EXCHANGE COMMISSION
Washington, D.C. 20549
FormN-CSR
CERTIFIED SHAREHOLDER REPORT OF REGISTERED
MANAGEMENT INVESTMENT COMPANIES
Investment Company Act File Number: 811-04015
Eaton Vance Mutual Funds Trust
(Exact Name of Registrant as Specified in Charter)
Two International Place, Boston, Massachusetts 02110
(Address of Principal Executive Offices)
Maureen A. Gemma
Two International Place, Boston, Massachusetts 02110
(Name and Address of Agent for Services)
(617)482-8260
(Registrant’s Telephone Number)
January 31
Date of Fiscal Year End
January 31, 2019
Date of Reporting Period
Item 1. Reports to Stockholders

Eaton Vance
Emerging Markets Debt Fund
Annual Report
January 31, 2019
Important Note. Beginning on January 1, 2021, as permitted by regulations adopted by the Securities and Exchange Commission, paper copies of the Fund’s annual and semi-annual shareholder reports will no longer be sent by mail unless you specifically request paper copies of the reports. Instead, the reports will be made available on the Fund’s website (eatonvance.com/funddocuments), and you will be notified by mail each time a report is posted and provided with a website address to access the report.
If you already elected to receive shareholder reports electronically, you will not be affected by this change and you need not take any action. If you are a direct investor, you may elect to receive shareholder reports and other communications from the Fund electronically by signing up for e-Delivery at eatonvance.com/edelivery. If you own your shares through a financial intermediary (such as a broker-dealer or bank), you must contact your financial intermediary to sign up.
You may elect to receive all future Fund shareholder reports in paper free of charge. If you are a direct investor, you can inform the Fund that you wish to continue receiving paper copies of your shareholder reports by calling 1-800-262-1122. If you own these shares through a financial intermediary, you must contact your financial intermediary or follow instructions included with this disclosure, if applicable, to elect to continue to receive paper copies of your shareholder reports. Your election to receive reports in paper will apply to all Eaton Vance funds held directly or to all funds held through your financial intermediary, as applicable.

Commodity Futures Trading Commission Registration. Effective December 31, 2012, the Commodity Futures Trading Commission (“CFTC”) adopted certain regulatory changes that subject registered investment companies and advisers to regulation by the CFTC if a fund invests more than a prescribed level of its assets in certain CFTC-regulated instruments (including futures, certain options and swap agreements) or markets itself as providing investment exposure to such instruments. The Fund is considered to be a commodity pool operator under CFTC regulations. The Fund’s adviser is registered with the CFTC as a commodity pool operator and a commodity trading advisor. The CFTC has neither reviewed nor approved the Fund’s investment strategies.
Fund shares are not insured by the FDIC and are not deposits or other obligations of, or guaranteed by, any depository institution. Shares are subject to investment risks, including possible loss of principal invested.
This report must be preceded or accompanied by a current summary prospectus or prospectus. Before investing, investors should consider carefully the investment objective, risks, and charges and expenses of a mutual fund. This and other important information is contained in the summary prospectus and prospectus, which can be obtained from a financial advisor. Prospective investors should read the prospectus carefully before investing. For further information, please call 1-800-262-1122.
Annual ReportJanuary 31, 2019
Eaton Vance
Emerging Markets Debt Fund
Table of Contents
| | | | |
Management’s Discussion of Fund Performance | | | 2 | |
| |
Performance | | | 3 | |
| |
Fund Profile | | | 3 | |
| |
Endnotes and Additional Disclosures | | | 4 | |
| |
Fund Expenses | | | 5 | |
| |
Financial Statements | | | 6 | |
| |
Report of Independent Registered Public Accounting Firm | | | 22 | |
| |
Federal Tax Information | | | 23 | |
| |
Special Meeting of Shareholders | | | 24 | |
| |
Management and Organization | | | 25 | |
| |
Important Notices | | | 28 | |
Eaton Vance
Emerging Markets Debt Fund
January 31, 2019
Management’s Discussion of Fund Performance1
Economic and Market Conditions
U.S. dollar-denominated (USD) emerging market sovereign debt, as measured by the JPMorgan Emerging Market Bond Index (EMBI) Global Diversified (the Index),2 returned 0.01% during the12-month period ended January 31, 2019. While USD emerging market sovereign debt rallied strongly in the last two months of the period, these gains were offset by losses from earlier in the fiscal year.
The U.S. Federal Reserve Board (the Fed) gradually raised interest rates throughout the period and reduced the size of its balance sheet. Overseas, the European Central Bank (ECB) tapered its monthly bond purchases and ended them entirely on December 31, 2018. However, the ECB held interest rates at record lows amid softening economic growth and heightened political uncertainty in the region. The Bank of Japan remained highly accommodative in an effort to revive inflation but allowed 10–year government bond yields to edge higher.
During much of 2018, the backdrop for emerging markets deteriorated as global liquidity tightened, the eurozone economy lost momentum and China’s already-slowing economy began to feel the effects of U.S. trade tariffs. In addition, the U.S. dollar strengthened against most foreign currencies. Developments in a handful of larger emerging countries exacerbated these broad headwinds, including U.S. sanctions against Russia, a currency crisis in Argentina and escalating political tensions between the U.S. and Turkey.
Investor sentiment on emerging markets improved near the end of the period due, in large part, to signs that the Fed might slow the pace of U.S. monetary tightening. Investors also welcomed reports that suggested the U.S. and China were making progress toward reaching a trade agreement.
Fund Performance
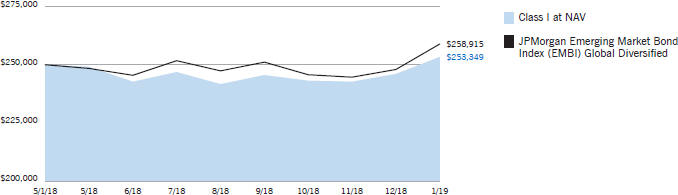
Since its inception on May 1, 2018, through January 31, 2019, Eaton Vance Emerging Markets Debt Fund (the Fund) returned 1.34% for Class I shares at net asset value (NAV). By comparison, the Index returned 3.57% during the period.
With respect to risk factors, the Fund’s allocation to interest rates had the largest negative impact on relative performance. In particular, the Fund’s lower average U.S. duration7 compared to the Index was unfavorable, as yields on longer-term U.S. Treasury securities declined during the period. The Fund’s allocations to sovereign credit and corporate credit also detracted.
In terms of regions, the Fund’s underperformance relative to the Index was driven by positioning in Latin America. Within Latin America, the main detractor was anout-of-Index investment in the USD sovereign debt of Barbados. The newly elected prime minister of Barbados shocked markets with an announcement on June 1, 2018, that the country would be suspending interest payments to external commercial creditors. Bond prices dropped on the news while investors questioned both the legality and motivation behind the decision. An overweight position in Brazil and a small allocation to Mexican corporate credit were modest drags on Fund performance versus the Index.
Holdings in both the Middle East and Africa (MEA) region and Eastern Europe favorably impacted relative results. In MEA, anout-of-Index position in Tanzania was especially helpful amid robust economic growth in the country. Overweight positions in Saudi Arabia and Kenya, as well as a lack of exposure to Lebanon, added a meaningful amount of value. The Fund sold positions in Saudia Arabia during the period. In Eastern Europe, the top relative contributor was an overweight position in Turkey, a large oil importer. This position performed well late in the period when political tensions with the U.S. eased and the price of oil fell sharply.Out-of-Index investments in Albania and Macedonia were other key sources of relative strength.
On an overall basis, positions in Asia did not have a material effect on relative returns. That said, one of the best-performing investments in the Fund was an overweight exposure to Sri Lanka. Despite political turmoil in the country, Sri Lanka maintained its track record of debt payments by repaying a sizeable USD sovereign bond in January 2019.
See Endnotes and Additional Disclosures in this report.
Past performance is no guarantee of future results. Returns are historical and are calculated by determining the percentage change in net asset value (NAV) or offering price (as applicable) with all distributions reinvested. Investment return and principal value will fluctuate so that shares, when redeemed, may be worth more or less than their original cost. Performance less than or equal to one year is cumulative. Performance is for the stated time period only; due to market volatility, the Fund’s current performance may be lower or higher than quoted. Returns are before taxes unless otherwise noted. For performance as of the most recent month-end, please refer to eatonvance.com.
Eaton Vance
Emerging Markets Debt Fund
January 31, 2019
Performance2,3
Portfolio ManagersJohn R. Baur, Michael A. Cirami, CFA and Eric A. Stein, CFA
| | | | | | | | | | | | | | | | | | | | |
| % Cumulative Total Returns | | Class
Inception Date | | | Performance
Inception Date | | | One Year | | | Five Years | | | Since
Inception | |
Class I at NAV | | | 05/01/2018 | | | | 05/01/2018 | | | | — | | | | — | | | | 1.34 | % |
JPMorgan Emerging Market Bond Index (EMBI) Global Diversified | | | — | | | | — | | | | 0.01 | % | | | 5.84 | % | | | 3.57 | % |
| | | | | |
| | | | | | | | | | | | | | | | | | | | |
% Total Annual Operating Expense Ratios4 | | | Class I | |
Gross | | | | | | | | | | | | | | | | | | | 1.00 | % |
Net | | | | | | | | | | | | | | | | | | | 0.85 | |
Growth of $250,000
This graph shows the change in value of a hypothetical investment of $250,000 in Class I of the Fund for the period indicated. For comparison, the same investment is shown in the indicated index.
Fund Profile
|
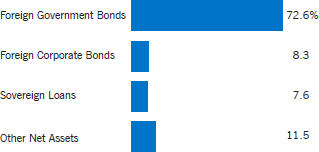
Asset Allocation (% of net assets)5 |
Country Allocation (% of net assets)6
| | | | | | | | | | |
| | | |
Bahrain | | | 10.4 | % | | Mexico | | | 2.6 | % |
| | | |
Argentina | | | 6.4 | | | Bahamas | | | 2.6 | |
| | | |
Turkey | | | 5.9 | | | Nigeria | | | 2.6 | |
| | | |
Tanzania | | | 5.0 | | | El Salvador | | | 2.6 | |
| | | |
Sri Lanka | | | 4.9 | | | Fiji | | | 2.5 | |
| | | |
Ukraine | | | 4.4 | | | Mongolia | | | 2.5 | |
| | | |
Albania | | | 4.0 | | | Macedonia | | | 2.5 | |
| | | |
Brazil | | | 3.9 | | | Ecuador | | | 2.5 | |
| | | |
Indonesia | | | 3.9 | | | Kenya | | | 2.5 | |
| | | |
Egypt | | | 3.8 | | | Barbados | | | 2.4 | |
| | | |
Honduras | | | 3.7 | | | Tunisia | | | 2.1 | |
| | | |
Dominican Republic | | | 3.0 | | | Vietnam | | | 1.8 | |
See Endnotes and Additional Disclosures in this report.
Past performance is no guarantee of future results. Returns are historical and are calculated by determining the percentage change in net asset value (NAV) or offering price (as applicable) with all distributions reinvested. Investment return and principal value will fluctuate so that shares, when redeemed, may be worth more or less than their original cost. Performance less than or equal to one year is cumulative. Performance is for the stated time period only; due to market volatility, the Fund’s current performance may be lower or higher than quoted. Returns are before taxes unless otherwise noted. For performance as of the most recentmonth-end, please refer to eatonvance.com.
Eaton Vance
Emerging Markets Debt Fund
January 31, 2019
Endnotes and Additional Disclosures
| 1 | The views expressed in this report are those of the portfolio manager(s) and are current only through the date stated at the top of this page. These views are subject to change at any time based upon market or other conditions, and Eaton Vance and the Fund(s) disclaim any responsibility to update such views. These views may not be relied upon as investment advice and, because investment decisions are based on many factors, may not be relied upon as an indication of trading intent on behalf of any Eaton Vance fund. This commentary may contain statements that are not historical facts, referred to as “forward looking statements.” The Fund’s actual future results may differ significantly from those stated in any forward looking statement, depending on factors such as changes in securities or financial markets or general economic conditions, the volume of sales and purchases of Fund shares, the continuation of investment advisory, administrative and service contracts, and other risks discussed from time to time in the Fund’s filings with the Securities and Exchange Commission. |
| 2 | JPMorgan Emerging Market Bond Index (EMBI) Global Diversified is amarket-cap weighted index that measuresUSD-denominated Brady Bonds, Eurobonds, and traded loans issued by sovereign entities. Unless otherwise stated, index returns do not reflect the effect of any applicable sales charges, commissions, expenses, taxes or leverage, as applicable. It is not possible to invest directly in an index. |
| 3 | Class I shares are offered at net asset value (NAV). Cumulative Total Returns are historical and are calculated by determining the percentage change in NAV with all distributions reinvested. Unless otherwise stated, performance does not reflect the deduction of taxes on Fund distributions or redemptions of Fund shares. Performance since inception for an index, if presented, is the performance since the Fund’s or oldest share class’ inception, as applicable. |
| 4 | Source: Fund prospectus. Net expense ratio reflects a contractual expense reimbursement that continues through 5/31/19. Without the reimbursement, performance would have been lower. The expense ratios for the current reporting period can be found in the Financial Highlights section of this report. |
| 5 | Other Net Assets represents other assets less liabilities and includes any investment type that represents less than 1% of net assets. |
| 6 | Excludes cash and cash equivalents. |
| 7 | Duration is a measure of the expected change in price of a bond — in percentage terms — given a one percent change in interest rates, all else being constant. Securities with lower durations tend to be less sensitive to interest rate changes. |
| | Fund profile subject to change due to active management. |
Eaton Vance
Emerging Markets Debt Fund
January 31, 2019
Fund Expenses
Example: As a Fund shareholder, you incur two types of costs: (1) transaction costs, including sales charges (loads) on purchases and redemption fees (if applicable); and (2) ongoing costs, including management fees; and other Fund expenses. This Example is intended to help you understand your ongoing costs (in dollars) of Fund investing and to compare these costs with the ongoing costs of investing in other mutual funds. The Example is based on an investment of $1,000 invested at the beginning of the period and held for the entire period (August 1, 2018 – January 31, 2019).
Actual Expenses: The first section of the table below provides information about actual account values and actual expenses. You may use the information in this section, together with the amount you invested, to estimate the expenses that you paid over the period. Simply divide your account value by $1,000 (for example, an $8,600 account value divided by $1,000 = 8.6), then multiply the result by the number in the first section under the heading entitled “Expenses Paid During Period” to estimate the expenses you paid on your account during this period.
Hypothetical Example for Comparison Purposes: The second section of the table below provides information about hypothetical account values and hypothetical expenses based on the actual Fund expense ratio and an assumed rate of return of 5% per year (before expenses), which is not the actual Fund return. The hypothetical account values and expenses may not be used to estimate the actual ending account balance or expenses you paid for the period. You may use this information to compare the ongoing costs of investing in your Fund and other funds. To do so, compare this 5% hypothetical example with the 5% hypothetical examples that appear in the shareholder reports of the other funds.
Please note that the expenses shown in the table are meant to highlight your ongoing costs only and do not reflect any transactional costs, such as sales charges (loads) or redemption fees (if applicable). Therefore, the second section of the table is useful in comparing ongoing costs only, and will not help you determine the relative total costs of owning different funds. In addition, if these transactional costs were included, your costs would be higher.
| | | | | | | | | | | | | | | | |
| | | Beginning
Account Value
(8/1/18) | | | Ending
Account Value
(1/31/19) | | | Expenses Paid
During Period*
(8/1/18 – 1/31/19) | | | Annualized
Expense
Ratio | |
| | | |
Actual | | | | | | | | | | | | | |
Class I | | $ | 1,000.00 | | | $ | 1,026.30 | | | $ | 4.34 | ** | | | 0.85 | % |
| | | | |
Hypothetical | | | | | | | | | | | | | |
(5% return per year before expenses) | | | | | | | | | | | | | |
Class I | | $ | 1,000.00 | | | $ | 1,020.90 | | | $ | 4.33 | ** | | | 0.85 | % |
| * | Expenses are equal to the Fund’s annualized expense ratio for the indicated Class, multiplied by the average account value over the period, multiplied by 184/365 (to reflect the one-half year period). The Example assumes that the $1,000 was invested at the net asset value per share determined at the close of business on July 31, 2018. |
| ** | Absent an allocation of certain expenses to an affiliate, expenses would be higher. |
Eaton Vance
Emerging Markets Debt Fund
January 31, 2019
Portfolio of Investments
| | | | | | | | | | | | |
| Foreign Government Bonds — 72.6% | |
| Security | | | | | Principal
Amount
(000’s omitted) | | | Value | |
|
| Albania — 4.0% | |
| | | |
Republic of Albania, 3.50%, 10/9/25(1) | | | EUR | | | | 270 | | | $ | 312,531 | |
| | | |
Total Albania | | | | | | | | | | $ | 312,531 | |
|
| Argentina — 6.4% | |
| | | |
Republic of Argentina, 6.25%, 11/9/47 | | | EUR | | | | 320 | | | $ | 280,381 | |
| | | |
Republic of Argentina, 6.625%, 7/6/28 | | | USD | | | | 270 | | | | 223,495 | |
| | | |
Total Argentina | | | | | | | | | | $ | 503,876 | |
|
| Bahamas — 2.6% | |
| | | |
Commonwealth of Bahamas, 5.75%, 1/16/24(1) | | | USD | | | | 200 | | | $ | 204,500 | |
| | | |
Total Bahamas | | | | | | | | | | $ | 204,500 | |
|
| Bahrain — 10.4% | |
| | | |
Kingdom of Bahrain, 6.125%, 8/1/23(1) | | | USD | | | | 200 | | | $ | 209,756 | |
| | | |
Kingdom of Bahrain, 7.00%, 1/26/26(1) | | | USD | | | | 200 | | | | 212,224 | |
| | | |
Kingdom of Bahrain, 7.50%, 9/20/47(1) | | | USD | | | | 400 | | | | 400,246 | |
| | | |
Total Bahrain | | | | | | | | | | $ | 822,226 | |
|
| Barbados — 2.4% | |
| | | |
Government of Barbados,
7.25%, 12/15/21(1)(2) | | | USD | | | | 350 | | | $ | 188,545 | |
| | | |
Total Barbados | | | | | | | | | | $ | 188,545 | |
|
| Brazil — 3.9% | |
| | | |
Federative Republic of Brazil, 5.00%, 1/27/45 | | | USD | | | | 200 | | | $ | 184,827 | |
| | | |
Federative Republic of Brazil, 8.875%, 4/15/24 | | | USD | | | | 100 | | | | 124,375 | |
| | | |
Total Brazil | | | | | | | | | | $ | 309,202 | |
|
| Dominican Republic — 3.0% | |
| | | |
Dominican Republic, 8.625%, 4/20/27(1) | | | USD | | | | 200 | | | $ | 232,450 | |
| | | |
Total Dominican Republic | | | | | | | | | | $ | 232,450 | |
|
| Ecuador — 2.5% | |
| | | |
Republic of Ecuador, 9.65%, 12/13/26(1) | | | USD | | | | 200 | | | $ | 196,290 | |
| | | |
Total Ecuador | | | | | | | | | | $ | 196,290 | |
|
| Egypt — 3.8% | |
| | | |
Arab Republic of Egypt, 4.75%, 4/16/26(1) | | | EUR | | | | 100 | | | $ | 107,300 | |
| | | |
Arab Republic of Egypt, 8.50%, 1/31/47(1) | | | USD | | | | 200 | | | | 193,080 | |
| | | |
Total Egypt | | | | | | | | | | $ | 300,380 | |
| | | | | | | | | | | | |
| Security | | | | | Principal
Amount
(000’s omitted) | | | Value | |
|
| El Salvador — 2.6% | |
| | | |
Republic of El Salvador, 7.65%, 6/15/35(1) | | | USD | | | | 200 | | | $ | 200,934 | |
| | | |
Total El Salvador | | | | | | | | | | $ | 200,934 | |
|
| Fiji — 2.5% | |
| | | |
Republic of Fiji, 6.625%, 10/2/20(1) | | | USD | | | | 200 | | | $ | 199,567 | |
| | | |
Total Fiji | | | | | | | | | | $ | 199,567 | |
|
| Honduras — 3.7% | |
| | | |
Republic of Honduras, 6.25%, 1/19/27(1) | | | USD | | | | 285 | | | $ | 293,886 | |
| | | |
Total Honduras | | | | | | | | | | $ | 293,886 | |
|
| Kenya — 2.5% | |
| | | |
Republic of Kenya, 7.25%, 2/28/28(1) | | | USD | | | | 200 | | | $ | 195,677 | |
| | | |
Total Kenya | | | | | | | | | | $ | 195,677 | |
|
| Macedonia — 2.5% | |
| | | |
Republic of Macedonia, 2.75%, 1/18/25(1) | | | EUR | | | | 170 | | | $ | 196,916 | |
| | | |
Total Macedonia | | | | | | | | | | $ | 196,916 | |
|
| Mongolia — 2.5% | |
| | | |
Mongolia International Bond, 5.625%, 5/1/23(1) | | | USD | | | | 200 | | | $ | 196,984 | |
| | | |
Total Mongolia | | | | | | | | | | $ | 196,984 | |
|
| Sri Lanka — 4.9% | |
| | | |
Republic of Sri Lanka, 6.125%, 6/3/25(1) | | | USD | | | | 400 | | | $ | 383,567 | |
| | | |
Total Sri Lanka | | | | | | | | | | $ | 383,567 | |
|
| Tunisia — 2.1% | |
| | | |
Banque Centrale de Tunisie International Bond, 5.625%, 2/17/24(1) | | | EUR | | | | 156 | | | $ | 166,280 | |
| | | |
Total Tunisia | | | | | | | | | | $ | 166,280 | |
|
| Turkey — 5.9% | |
| | | |
Republic of Turkey, 6.125%, 10/24/28 | | | USD | | | | 215 | | | $ | 206,582 | |
| | | |
Republic of Turkey, 6.625%, 2/17/45 | | | USD | | | | 275 | | | | 261,594 | |
| | | |
Total Turkey | | | | | | | | | | $ | 468,176 | |
|
| Ukraine — 4.4% | |
| | | |
Ukraine Government International Bond, 9.75%, 11/1/28(1) | | | USD | | | | 351 | | | $ | 349,245 | |
| | | |
Total Ukraine | | | | | | | | | | $ | 349,245 | |
| |
Total Foreign Government Bonds
(identified cost $5,887,684) | | | $ | 5,721,232 | |
| | | | |
| | 6 | | See Notes to Financial Statements. |
Eaton Vance
Emerging Markets Debt Fund
January 31, 2019
Portfolio of Investments — continued
| | | | | | | | | | | | |
| Foreign Corporate Bonds — 8.3% | |
| Security | | | | | Principal
Amount
(000’s omitted) | | | Value | |
|
| Indonesia — 3.9% | |
| | | |
Perusahaan Listrik Negara PT, 5.25%, 10/24/42(1) | | | USD | | | | 320 | | | $ | 307,200 | |
| | | |
Total Indonesia | | | | | | | | | | $ | 307,200 | |
|
| Mexico — 2.6% | |
| | | |
Petroleos Mexicanos, 6.625%(1)(3) | | | USD | | | | 250 | | | $ | 208,750 | |
| | | |
Total Mexico | | | | | | | | | | $ | 208,750 | |
|
| Vietnam — 1.8% | |
| | | |
Debt and Asset Trading Corp., 1.00%, 10/10/25(1) | | | USD | | | | 200 | | | $ | 138,500 | |
| | | |
Total Vietnam | | | | | | | | | | $ | 138,500 | |
| |
Total Foreign Corporate Bonds
(identified cost $665,241) | | | $ | 654,450 | |
|
| Sovereign Loans — 7.6% | |
| Borrower | | | | | Principal
Amount
(000’s omitted) | | | Value | |
|
| Nigeria — 2.6% | |
| | | |
Bank of Industry Limited, Term Loan, 8.74%, (3 mo. USD LIBOR + 6.00%), Maturing May 21, 2021(4)(5) | | | | | | $ | 200 | | | $ | 201,534 | |
| | | |
Total Nigeria | | | | | | | | | | $ | 201,534 | |
|
| Tanzania — 5.0% | |
| | | |
Government of the United Republic of Tanzania, Term Loan, 8.09%, (6 mo. USD LIBOR + 5.20%), Maturing May 23, 2023(5) | | | | | | $ | 400 | | | $ | 395,734 | |
| | | |
Total Tanzania | | | | | | | | | | $ | 395,734 | |
| |
Total Sovereign Loans
(identified cost $596,122) | | | $ | 597,268 | |
| | | | | | | | | | |
| Short-Term Investments — 0.3% | |
| Description | | | | Units | | | Value | |
| | | |
Eaton Vance Cash Reserves Fund, LLC, 2.61%(6) | | | | | 24,800 | | | $ | 24,800 | |
| |
Total Short-Term Investments
(identified cost $24,800) | | | $ | 24,800 | |
| |
Total Investments — 88.8%
(identified cost $7,173,847) | | | $ | 6,997,750 | |
| |
Other Assets, Less Liabilities — 11.2% | | | $ | 880,722 | |
| |
Net Assets — 100.0% | | | $ | 7,878,472 | |
The percentage shown for each investment category in the Portfolio of Investments is based on net assets.
| (1) | Security exempt from registration under Regulation S of the Securities Act of 1933, which exempts from registration securities offered and sold outside the United States. Security may not be offered or sold in the United States except pursuant to an exemption from, or in a transaction not subject to, the registration requirements of the Securities Act of 1933. At January 31, 2019, the aggregate value of these securities is $5,094,428 or 64.7% of the Fund’s net assets. |
| (2) | Issuer is in default with respect to interest payments. |
| (3) | Perpetual security with no stated maturity date but may be subject to calls by the issuer. |
| (4) | Loan is subject to scheduled mandatory prepayments. Maturity date shown reflects the final maturity date. |
| (5) | Variable rate security. The stated interest rate represents the rate in effect at January 31, 2019. |
| (6) | Affiliated investment company, available to Eaton Vance portfolios and funds, which invests in high quality, U.S. dollar denominated money market instruments. The rate shown is the annualized seven-day yield as of January 31, 2019. |
| | | | |
| | 7 | | See Notes to Financial Statements. |
Eaton Vance
Emerging Markets Debt Fund
January 31, 2019
Portfolio of Investments — continued
| | | | | | | | | | | | | | | | | | | | | | | | |
| Forward Foreign Currency Exchange Contracts | |
| | | | | |
| Currency Purchased | | | Currency Sold | | | Counterparty | | Settlement Date | | | Unrealized Appreciation | | | Unrealized (Depreciation) | |
| | | | | | | |
| USD | | | 187,388 | | | EUR | | | 163,044 | | | Citibank, N.A. | | | 2/1/19 | | | $ | 768 | | | $ | — | |
| | | | | | | |
| USD | | | 112,294 | | | EUR | | | 97,161 | | | Citibank, N.A. | | | 4/15/19 | | | | 407 | | | | — | |
| | | | | | | |
| USD | | | 111,682 | | | EUR | | | 96,632 | | | Citibank, N.A. | | | 4/15/19 | | | | 405 | | | | — | |
| | | | | | | |
| EUR | | | 163,044 | | | USD | | | 188,587 | | | Citibank, N.A. | | | 4/16/19 | | | | — | | | | (817 | ) |
| | | | | | | |
| USD | | | 162,277 | | | EUR | | | 141,363 | | | Citibank, N.A. | | | 4/16/19 | | | | — | | | | (524 | ) |
| | | | | | | |
| USD | | | 182,657 | | | EUR | | | 159,116 | | | Citibank, N.A. | | | 4/16/19 | | | | — | | | | (589 | ) |
| | | | | | | |
| USD | | | 194,140 | | | EUR | | | 169,119 | | | Citibank, N.A. | | | 4/16/19 | | | | — | | | | (626 | ) |
| | | | | | | |
| USD | | | 505,127 | | | EUR | | | 440,024 | | | Citibank, N.A. | | | 4/16/19 | | | | — | | | | (1,629 | ) |
| | | | | | | |
| | | | | | | | | | | | | | | | | | | $ | 1,580 | | | $ | (4,185 | ) |
| | | | | | | | | | | | | | | | | | | | |
| Futures Contracts | |
| | | | | |
| Description | | Number of Contracts | | | Position | | | Expiration Date | | | Notional Amount | | | Value/
Unrealized Appreciation
(Depreciation) | |
| | | | | |
Interest Rate Futures | | | | | | | | | | | | | | | | | | | | |
| | | | | |
| U.S. 5-Year Treasury Note | | | 24 | | | | Long | | | | 3/29/19 | | | $ | 2,756,625 | | | $ | 31,820 | |
| | | | | |
| U.S. 10-Year Treasury Note | | | 14 | | | | Long | | | | 3/20/19 | | | | 1,714,562 | | | | 33,999 | |
| | | | | |
| U.S. Long Treasury Bond | | | 2 | | | | Short | | | | 3/20/19 | | | | (293,375 | ) | | | (3,003 | ) |
| | | | | |
| U.S. Ultra-Long Treasury Bond | | | 2 | | | | Long | | | | 3/20/19 | | | | 322,250 | | | | 7,497 | |
| |
| | | | $ | 70,313 | |
| | | | | | | | | | | | | | | | | | | | | | |
| Centrally Cleared Interest Rate Swaps | |
| | | | | | | |
Notional Amount (000’s omitted) | | | Fund Pays/Receives Floating Rate | | Floating Rate | | Annual Fixed Rate | | Termination Date | | Value | | Unamortized Upfront Receipts
(Payments) | | | Unrealized Depreciation | |
| | | | | | | | |
| EUR | | | 165 | | | Receives | | 6-month EURIBOR (pays semi-annually) | | 0.37% (pays annually) | | 5/9/23 | | $(3,259) | | $ | (35 | ) | | $ | (3,294 | ) |
| | | | | | | | |
| EUR | | | 30 | | | Receives | | 6-month EURIBOR (pays semi-annually) | | 0.40% (pays annually) | | 5/15/23 | | (643) | | | — | | | | (643 | ) |
| | | | | | | | |
| EUR | | | 370 | | | Receives | | 6-month EURIBOR (pays semi-annually) | | 0.40% (pays annually) | | 10/4/23 | | (7,097) | | | 392 | | | | (6,705 | ) |
| | | | | | | | |
| EUR | | | 66 | | | Receives | | 6-month EURIBOR (pays semi-annually) | | 1.06% (pays annually) | | 10/16/28 | | (3,376) | | | (15 | ) | | | (3,391 | ) |
| | | | | | | | |
| EUR | | | 22 | | | Receives | | 6-month EURIBOR (pays semi-annually) | | 1.60% (pays annually) | | 5/18/48 | | (2,637) | | | 567 | | | | (2,070 | ) |
| | | | | | | | |
| EUR | | | 50 | | | Receives | | 6-month EURIBOR (pays semi-annually) | | 1.46% (pays annually) | | 5/31/48 | | (3,941) | | | (44 | ) | | | (3,985 | ) |
| | | | | | | | |
| EUR | | | 35 | | | Receives | | 6-month EURIBOR (pays semi-annually) | | 1.47% (pays annually) | | 11/28/48 | | (2,658) | | | — | | | | (2,658 | ) |
| | | | |
| | 8 | | See Notes to Financial Statements. |
Eaton Vance
Emerging Markets Debt Fund
January 31, 2019
Portfolio of Investments — continued
| | | | | | | | | | | | | | | | | | | | | | | | |
| Centrally Cleared Interest Rate Swaps (continued) | |
| | | | | | | |
Notional Amount (000’s omitted) | | | Fund Pays/Receives Floating Rate | | Floating Rate | | Annual Fixed Rate | | Termination Date | | Value | | | Unamortized Upfront Receipts
(Payments) | | | Unrealized Depreciation | |
| | | | | | | | |
| USD | | | 200 | | | Receives | | 3-month USD-LIBOR (pays quarterly) | | 3.06% (pays semi-annually) | | 10/2/23 | | $ | (6,241 | ) | | $ | (23 | ) | | $ | (6,264 | ) |
| | | | | | | | |
| USD | | | 173 | | | Receives | | 3-month USD-LIBOR (pays quarterly) | | 3.10% (pays semi-annually) | | 10/31/23 | | | (5,767 | ) | | | (142 | ) | | | (5,909 | ) |
| | | | | | | | |
| USD | | | 170 | | | Receives | | 3-month USD-LIBOR (pays quarterly) | | 2.63% (pays semi-annually) | | 1/11/24 | | | (725 | ) | | | — | | | | (725 | ) |
| | | | | | | | |
| USD | | | 213 | | | Receives | | 3-month USD-LIBOR (pays quarterly) | | 3.11% (pays semi-annually) | | 5/17/28 | | | (8,418 | ) | | | 34 | | | | (8,384 | ) |
| | | | | | | | |
| USD | | | 113 | | | Receives | | 3-month USD-LIBOR (pays quarterly) | | 3.29% (pays semi-annually) | | 11/13/28 | | | (6,340 | ) | | | — | | | | (6,340 | ) |
| | | | | | | | |
| USD | | | 258 | | | Receives | | 3-month USD-LIBOR (pays quarterly) | | 2.76% (pays semi-annually) | | 1/22/29 | | | (2,314 | ) | | | — | | | | (2,314 | ) |
| | | | | | | | |
| USD | | | 220 | | | Receives | | 3-month USD-LIBOR (pays quarterly) | | 2.74% (pays semi-annually) | | 1/31/29 | | | (1,588 | ) | | | — | | | | (1,588 | ) |
| | | | | | | | |
| USD | | | 185 | | | Receives | | 3-month USD-LIBOR (pays quarterly) | | 2.89% (pays semi-annually) | | 1/29/39 | | | (2,637 | ) | | | — | | | | (2,637 | ) |
| | | | | | | | |
| USD | | | 109 | | | Receives | | 3-month USD-LIBOR (pays quarterly) | | 3.14% (pays semi-annually) | | 10/1/48 | | | (8,308 | ) | | | 153 | | | | (8,155 | ) |
| | | | | | | | |
| USD | | | 9 | | | Receives | | 3-month USD-LIBOR (pays quarterly) | | 3.22% (pays semi-annually) | | 10/9/48 | | | (839 | ) | | | (68 | ) | | | (907 | ) |
| | | | | | | | |
| USD | | | 100 | | | Receives | | 3-month USD-LIBOR (pays quarterly) | | 2.95% (pays semi-annually) | | 12/20/48 | | | (3,027 | ) | | | — | | | | (3,027 | ) |
| | | | | | | | |
| USD | | | 120 | | | Receives | | 3-month USD-LIBOR (pays quarterly) | | 2.88% (pays semi-annually) | | 1/25/49 | | | (2,027 | ) | | | — | | | | (2,027 | ) |
| | | | | | | | |
| USD | | | 100 | | | Receives | | 3-month USD-LIBOR (pays quarterly) | | 2.88% (pays semi-annually) | | 1/29/49 | | | (1,687 | ) | | | — | | | | (1,687 | ) |
| | | | | | | | |
| USD | | | 95 | | | Receives | | 3-month USD-LIBOR (pays quarterly) | | 2.88% (pays semi-annually) | | 1/31/49 | | | (1,468 | ) | | | (50 | ) | | | (1,518 | ) |
| | | | | | | | |
| | | | | | | | | | | | | | | $ | (74,997 | ) | | $ | 769 | | | $ | (74,228 | ) |
| | | | | | | | | | | | | | | | | | | | | | | | | | | | |
| Centrally Cleared Credit Default Swaps — Sell Protection | |
| | | | | | | | |
| Reference Entity | | | | | Notional Amount* (000’s omitted) | | | Contract Annual Fixed Rate** | | Termination Date | | Current Market Annual Fixed Rate*** | | | Value | | | Unamortized Upfront Receipts
(Payments) | | | Unrealized Appreciation
(Depreciation) | |
| | | | | | | | |
| Brazil | | | | | | $ | 200 | | | 1.00% (pays quarterly)(1) | | 12/20/23 | | | 1.64 | % | | $ | (5,510 | ) | | $ | 15,997 | | | $ | 10,487 | |
| | | | | | | | |
| Mexico | | | | | | | 200 | | | 1.00% (pays quarterly)(1) | | 12/20/23 | | | 1.35 | | | | (2,881 | ) | | | 1,584 | | | | (1,297 | ) |
| | | | | | | | |
| Russia | | | | | | | 200 | | | 1.00% (pays quarterly)(1) | | 12/20/23 | | | 1.30 | | | | (2,474 | ) | | | 5,032 | | | | 2,558 | |
| | | | | | | | |
Total | | | | | | $ | 600 | | | | | | | | | | | $ | (10,865 | ) | | $ | 22,613 | | | $ | 11,748 | |
| | | | |
| | 9 | | See Notes to Financial Statements. |
Eaton Vance
Emerging Markets Debt Fund
January 31, 2019
Portfolio of Investments — continued
| | | | | | | | | | | | | | | | | | | | | | | | | | | | |
| Credit Default Swaps — Sell Protection | |
| | | | | | | | |
| Reference Entity | | Counterparty | | | Notional Amount* (000’s omitted) | | | Contract Annual Fixed Rate** | | Termination Date | | Current Market Annual Fixed Rate*** | | | Value | | | Unamortized Upfront Receipts
(Payments) | | | Unrealized Depreciation | |
| | | | | | | | |
| Turkey | | | Citibank, N.A. | | | $ | 210 | | | 1.00% (pays quarterly)(1) | | 6/20/23 | | | 2.89 | % | | $ | (15,242 | ) | | $ | 12,992 | | | $ | (2,250 | ) |
| | | | | | | | |
Total | | | | | | $ | 210 | | | | | | | | | | | $ | (15,242 | ) | | $ | 12,992 | | | $ | (2,250 | ) |
| * | If the Fund is the seller of credit protection, the notional amount is the maximum potential amount of future payments the Fund could be required to make if a credit event, as defined in the credit default swap agreement, were to occur. At January 31, 2019, such maximum potential amount for all open credit default swaps in which the Fund is the seller was $810,000. |
| ** | The contract annual fixed rate represents the fixed rate of interest received by the Fund (as a seller of protection) on the notional amount of the credit default swap contract. |
| *** | Current market annual fixed rates, utilized in determining the net unrealized appreciation or depreciation as of period end, serve as an indicator of the market’s perception of the current status of the payment/performance risk associated with the credit derivative. The current market annual fixed rate of a particular reference entity reflects the cost, as quoted by the pricing vendor, of selling protection against default of that entity as of period end and may include upfront payments required to be made to enter into the agreement. The higher the fixed rate, the greater the market perceived risk of a credit event involving the reference entity. A rate identified as “Defaulted” indicates a credit event has occurred for the reference entity. |
| (1) | Upfront payment is exchanged with the counterparty as a result of the standardized trading coupon. |
Abbreviations:
| | | | |
| | |
| EURIBOR | | – | | Euro Interbank Offered Rate |
| | |
| LIBOR | | – | | London Interbank Offered Rate |
Currency Abbreviations:
| | | | |
| | |
| EUR | | – | | Euro |
| | |
| USD | | – | | United States Dollar |
| | | | |
| | 10 | | See Notes to Financial Statements. |
Eaton Vance
Emerging Markets Debt Fund
January 31, 2019
Statement of Assets and Liabilities
| | | | |
| Assets | | January 31, 2019 | |
| |
Unaffiliated investments, at value (identified cost, $7,149,047) | | $ | 6,972,950 | |
| |
Affiliated investment, at value (identified cost, $24,800) | | | 24,800 | |
| |
Cash | | | 57,901 | |
| |
Deposits for derivatives collateral — | | | | |
| |
Financial futures contracts | | | 21,440 | |
| |
Centrally cleared swap contracts | | | 286,733 | |
| |
Foreign currency, at value (identified cost, $42,725) | | | 42,840 | |
| |
Interest receivable | | | 120,027 | |
| |
Dividends receivable from affiliated investment | | | 275 | |
| |
Receivable for investments sold | | | 586,089 | |
| |
Receivable for Fund shares sold | | | 7,500 | |
| |
Receivable for variation margin on open financial futures contracts | | | 70,313 | |
| |
Receivable for open forward foreign currency exchange contracts | | | 1,580 | |
| |
Receivable from affiliate | | | 20,114 | |
| |
Total assets | | $ | 8,212,562 | |
| |
| Liabilities | | | | |
| |
Payable for investments purchased | | $ | 208,025 | |
| |
Payable for variation margin on open centrally cleared swap contracts | | | 17,415 | |
| |
Payable for open forward foreign currency exchange contracts | | | 4,185 | |
| |
Payable for open swap contracts | | | 2,250 | |
| |
Upfront receipts on open non-centrally cleared swap contracts | | | 12,992 | |
| |
Payable to affiliate: | | | | |
| |
Investment adviser and administration fee | | | 4,282 | |
| |
Accrued expenses | | | 84,941 | |
| |
Total liabilities | | $ | 334,090 | |
| |
Net Assets | | $ | 7,878,472 | |
| |
| Sources of Net Assets | | | | |
| |
Paid-in capital | | $ | 8,004,122 | |
| |
Accumulated loss | | | (125,650 | ) |
| |
Total | | $ | 7,878,472 | |
| |
| Class I Shares | | | | |
| |
Net Assets | | $ | 7,878,472 | |
| |
Shares Outstanding | | | 800,770 | |
| |
Net Asset Value, Offering Price and Redemption Price Per Share | | | | |
| |
(net assets ÷ shares of beneficial interest outstanding) | | $ | 9.84 | |
| | | | |
| | 11 | | See Notes to Financial Statements. |
Eaton Vance
Emerging Markets Debt Fund
January 31, 2019
Statement of Operations
| | | | |
| Investment Income | | Period Ended
January 31, 2019(1) | |
| |
Interest | | $ | 271,467 | |
| |
Dividends from affiliated investment | | | 7,570 | |
| |
Total investment income | | $ | 279,037 | |
| |
| Expenses | | | | |
| |
Investment adviser and administration fee | | $ | 38,007 | |
| |
Trustees’ fees and expenses | | | 882 | |
| |
Custodian fee | | | 47,466 | |
| |
Transfer and dividend disbursing agent fees | | | 135 | |
| |
Legal and accounting services | | | 53,393 | |
| |
Printing and postage | | | 5,616 | |
| |
Registration fees | | | 27,391 | |
| |
Miscellaneous | | | 8,161 | |
| |
Total expenses | | $ | 181,051 | |
| |
Deduct — | | | | |
| |
Allocation of expenses to affiliate | | $ | 131,208 | |
| |
Total expense reductions | | $ | 131,208 | |
| |
Net expenses | | $ | 49,843 | |
| |
Net investment income | | $ | 229,194 | |
| |
| Realized and Unrealized Gain (Loss) | | | | |
| |
Net realized gain (loss) — | | | | |
| |
Investment transactions | | $ | (33,851 | ) |
| |
Investment transactions — affiliated investment | | | 700 | |
| |
Financial futures contracts | | | 16,232 | |
| |
Swap contracts | | | 5,380 | |
| |
Foreign currency transactions | | | 1,422 | |
| |
Forward foreign currency exchange contracts | | | 61,262 | |
| |
Net realized gain | | $ | 51,145 | |
| |
Change in unrealized appreciation (depreciation) — | | | | |
| |
Investments | | $ | (176,097 | ) |
| |
Financial futures contracts | | | 70,313 | |
| |
Swap contracts | | | (64,730 | ) |
| |
Foreign currency | | | (568 | ) |
| |
Forward foreign currency exchange contracts | | | (2,605 | ) |
| |
Net change in unrealized appreciation (depreciation) | | $ | (173,687 | ) |
| |
Net realized and unrealized loss | | $ | (122,542 | ) |
| |
Net increase in net assets from operations | | $ | 106,652 | |
| (1) | For the period from the start of business, May 1, 2018, to January 31, 2019. |
| | | | |
| | 12 | | See Notes to Financial Statements. |
Eaton Vance
Emerging Markets Debt Fund
January 31, 2019
Statement of Changes in Net Assets
| | | | |
| Increase (Decrease) in Net Assets | | Period Ended January 31, 2019(1) | |
| |
From operations — | | | | |
| |
Net investment income | | $ | 229,194 | |
| |
Net realized gain | | | 51,145 | |
| |
Net change in unrealized appreciation (depreciation) | | | (173,687 | ) |
| |
Net increase in net assets from operations | | $ | 106,652 | |
| |
Distributions to shareholders | | $ | (235,680 | ) |
| |
Total distributions to shareholders | | $ | (235,680 | ) |
| |
Transactions in shares of beneficial interest — | | | | |
| |
Proceeds from sale of shares | | $ | 8,007,500 | |
| |
Net increase in net assets from Fund share transactions | | $ | 8,007,500 | |
| |
Net increase in net assets | | $ | 7,878,472 | |
| |
| Net Assets | | | | |
| |
At beginning of period | | $ | — | |
| |
At end of period | | $ | 7,878,472 | |
| (1) | For the period from the start of business, May 1, 2018, to January 31, 2019. |
| | | | |
| | 13 | | See Notes to Financial Statements. |
Eaton Vance
Emerging Markets Debt Fund
January 31, 2019
Financial Highlights
| | | | |
| | | Class I | |
| | | Period Ended January 31, 2019(1) | |
| |
Net asset value — Beginning of period | | $ | 10.000 | |
| |
| Income (Loss) From Operations | | | | |
| |
Net investment income(2) | | $ | 0.286 | |
| |
Net realized and unrealized loss | | | (0.151 | ) |
| |
Total income from operations | | $ | 0.135 | |
| |
| Less Distributions | | | | |
| |
From net investment income | | $ | (0.219 | ) |
| |
From net realized gain | | | (0.076 | ) |
| |
Total distributions | | $ | (0.295 | ) |
| |
Net asset value — End of period | | $ | 9.840 | |
| |
Total Return(3)(4) | | | 1.34 | %(5) |
| |
| Ratios/Supplemental Data | | | | |
| |
Net assets, end of period (000’s omitted) | | $ | 7,878 | |
| |
Ratios (as a percentage of average daily net assets): | | | | |
| |
Expenses(4) | | | 0.85 | %(6) |
| |
Net investment income | | | 3.92 | %(6) |
| |
Portfolio Turnover | | | 82 | %(5) |
| (1) | For the period from the start of business, May 1, 2018, to January 31, 2019. |
| (2) | Computed using average shares outstanding. |
| (3) | Returns are historical and are calculated by determining the percentage change in net asset value with all distributions reinvested. |
| (4) | The investment adviser and administrator reimbursed certain operating expenses (equal to 2.24% of average daily net assets for the period ended January 31, 2019). Absent this reimbursement, total return would be lower. |
| | | | |
| | 14 | | See Notes to Financial Statements. |
Eaton Vance
Emerging Markets Debt Fund
January 31, 2019
Notes to Financial Statements
1 Significant Accounting Policies
Eaton Vance Emerging Markets Debt Fund (the Fund) is a non-diversified series of Eaton Vance Mutual Funds Trust (the Trust). The Trust is a Massachusetts business trust registered under the Investment Company Act of 1940, as amended (the 1940 Act), as an open-end management investment company. The Fund commenced operations on May 1, 2018. The Fund’s investment objective is total return. The Fund offers Class I shares, which are sold at net asset value and are not subject to a sales charge.
The following is a summary of significant accounting policies of the Fund. The policies are in conformity with accounting principles generally accepted in the United States of America (U.S. GAAP). The Fund is an investment company and follows accounting and reporting guidance in the Financial Accounting Standards Board (FASB) Accounting Standards Codification Topic 946.
A Investment Valuation — The following methodologies are used to determine the market value or fair value of investments.
Debt Obligations. Debt obligations are generally valued on the basis of valuations provided by third party pricing services, as derived from such services’ pricing models. Inputs to the models may include, but are not limited to, reported trades, executable bid and ask prices, broker/dealer quotations, prices or yields of securities with similar characteristics, interest rates, anticipated prepayments, benchmark curves or information pertaining to the issuer, as well as industry and economic events. The pricing services may use a matrix approach, which considers information regarding securities with similar characteristics to determine the valuation for a security. Short-term debt obligations purchased with a remaining maturity of sixty days or less for which a valuation from a third party pricing service is not readily available may be valued at amortized cost, which approximates fair value.
Derivatives. Financial futures contracts are valued at the closing settlement price established by the board of trade or exchange on which they are traded. Forward foreign currency exchange contracts are generally valued at the mean of the average bid and average ask prices that are reported by currency dealers to a third party pricing service at the valuation time. Such third party pricing service valuations are supplied for specific settlement periods and the Fund’s forward foreign currency exchange contracts are valued at an interpolated rate between the closest preceding and subsequent settlement period reported by the third party pricing service. Swaps are normally valued using valuations provided by a third party pricing service. Such pricing service valuations are based on the present value of fixed and projected floating rate cash flows over the term of the swap contract, and in the case of credit default swaps, based on credit spread quotations obtained from broker/dealers and expected default recovery rates determined by the pricing service using proprietary models. Future cash flows on swaps are discounted to their present value using swap rates provided by electronic data services or by broker/dealers.
Foreign Securities and Currencies. Foreign securities and currencies are valued in U.S. dollars, based on foreign currency exchange rate quotations supplied by a third party pricing service. The pricing service uses a proprietary model to determine the exchange rate. Inputs to the model include reported trades and implied bid/ask spreads.
Affiliated Fund. The Fund may invest in Eaton Vance Cash Reserves Fund, LLC (Cash Reserves Fund), an affiliated investment company managed by Eaton Vance Management (EVM). While Cash Reserves Fund is not a registered money market mutual fund, it conducts all of its investment activities in accordance with the requirements of Rule 2a-7 under the 1940 Act. Investments in Cash Reserves Fund are valued at the closing net asset value per unit on the valuation day. Cash Reserves Fund generally values its investment securities based on available market quotations provided by a third party pricing service.
Fair Valuation. Investments for which valuations or market quotations are not readily available or are deemed unreliable are valued at fair value using methods determined in good faith by or at the direction of the Trustees of the Fund in a manner that fairly reflects the security’s value, or the amount that the Fund might reasonably expect to receive for the security upon its current sale in the ordinary course. Each such determination is based on a consideration of relevant factors, which are likely to vary from one pricing context to another. These factors may include, but are not limited to, the type of security, the existence of any contractual restrictions on the security’s disposition, the price and extent of public trading in similar securities of the issuer or of comparable companies or entities, quotations or relevant information obtained from broker/dealers or other market participants, information obtained from the issuer, analysts, and/or the appropriate stock exchange (for exchange-traded securities), an analysis of the company’s or entity’s financial condition, and an evaluation of the forces that influence the issuer and the market(s) in which the security is purchased and sold.
B Investment Transactions — Investment transactions for financial statement purposes are accounted for on a trade date basis. Realized gains and losses on investments sold are determined on the basis of identified cost.
C Income — Interest income is recorded on the basis of interest accrued, adjusted for amortization of premium or accretion of discount. Dividend income is recorded on the ex-dividend date for dividends received in cash and/or securities.
D Federal Taxes — The Fund’s policy is to comply with the provisions of the Internal Revenue Code applicable to regulated investment companies and to distribute to shareholders each year substantially all of its net investment income, and all or substantially all of its net realized capital gains. Accordingly, no provision for federal income or excise tax is necessary.
As of January 31, 2019, the Fund had no uncertain tax positions that would require financial statement recognition, de-recognition, or disclosure. The Fund files a U.S. federal income tax return annually after its fiscal year-end, which is subject to examination by the Internal Revenue Service for a period of three years from the date of filing.
Eaton Vance
Emerging Markets Debt Fund
January 31, 2019
Notes to Financial Statements — continued
E Foreign Currency Translation — Investment valuations, other assets, and liabilities initially expressed in foreign currencies are translated each business day into U.S. dollars based upon current exchange rates. Purchases and sales of foreign investment securities and income and expenses denominated in foreign currencies are translated into U.S. dollars based upon currency exchange rates in effect on the respective dates of such transactions. Recognized gains or losses on investment transactions attributable to changes in foreign currency exchange rates are recorded for financial statement purposes as net realized gains and losses on investments. That portion of unrealized gains and losses on investments that results from fluctuations in foreign currency exchange rates is not separately disclosed.
F Unfunded Loan Commitments — The Fund may enter into certain loan agreements all or a portion of which may be unfunded. The Fund is obligated to fund these commitments at the borrower’s discretion. These commitments, if any, are disclosed in the accompanying Portfolio of Investments.
G Use of Estimates — The preparation of the financial statements in conformity with U.S. GAAP requires management to make estimates and assumptions that affect the reported amounts of assets and liabilities at the date of the financial statements and the reported amounts of income and expense during the reporting period. Actual results could differ from those estimates.
H Indemnifications — Under the Trust’s organizational documents, its officers and Trustees may be indemnified against certain liabilities and expenses arising out of the performance of their duties to the Fund. Under Massachusetts law, if certain conditions prevail, shareholders of a Massachusetts business trust (such as the Trust) could be deemed to have personal liability for the obligations of the Trust. However, the Trust’s Declaration of Trust contains an express disclaimer of liability on the part of Fund shareholders and the By-laws provide that the Trust shall assume the defense on behalf of any Fund shareholders. Moreover, the By-laws also provide for indemnification out of Fund property of any shareholder held personally liable solely by reason of being or having been a shareholder for all loss or expense arising from such liability. Additionally, in the normal course of business, the Fund enters into agreements with service providers that may contain indemnification clauses. The Fund’s maximum exposure under these arrangements is unknown as this would involve future claims that may be made against the Fund that have not yet occurred.
I Financial Futures Contracts — Upon entering into a financial futures contract, the Fund is required to deposit with the broker, either in cash or securities, an amount equal to a certain percentage of the contract amount (initial margin). Daily fluctuations in the value of the futures contract are recorded as variation margin receivable or payable and unrealized gains or losses by the Fund. In addition to initial margin, the Fund may be required to make additional payments to the broker as collateral for open futures contracts. Gains (losses) are realized upon the expiration or closing of the financial futures contracts. Should market conditions change unexpectedly, the Fund may not achieve the anticipated benefits of the financial futures contracts and may realize a loss. Futures contracts have minimal counterparty risk as they are exchange traded and the clearinghouse for the exchange is substituted as the counterparty, guaranteeing counterparty performance.
J Forward Foreign Currency Exchange Contracts — The Fund may enter into forward foreign currency exchange contracts for the purchase or sale of a specific foreign currency at a fixed price on a future date. The forward foreign currency exchange contracts are adjusted by the daily exchange rate of the underlying currency and any gains or losses are recorded as unrealized until such time as the contracts have been closed. Risks may arise upon entering these contracts from the potential inability of counterparties to meet the terms of their contracts and from movements in the value of a foreign currency relative to the U.S. dollar.
K Interest Rate Swaps — Swap contracts are privately negotiated agreements between the Fund and a counterparty. Certain swap contracts may be centrally cleared (“centrally cleared swaps”), whereby all payments made or received by the Fund pursuant to the contract are with a central clearing party (CCP) rather than the original counterparty. The CCP guarantees the performance of the original parties to the contract. Upon entering into centrally cleared swaps, the Fund is required to deposit with the CCP, either in cash or securities, an amount of initial margin determined by the CCP, which is subject to adjustment.
Pursuant to interest rate swap agreements, the Fund either makes floating-rate payments to the counterparty (or CCP in the case of centrally cleared swaps) based on a benchmark interest rate in exchange for fixed-rate payments or the Fund makes fixed-rate payments to the counterparty (or CCP in the case of a centrally cleared swap) in exchange for payments on a floating benchmark interest rate. Payments received or made, including amortization of upfront payments/receipts, are recorded as realized gains or losses. During the term of the outstanding swap agreement, changes in the underlying value of the swap are recorded as unrealized gains or losses. For centrally cleared swaps, the daily change in valuation is recorded as a receivable or payable for variation margin and settled in cash with the CCP daily. The value of the swap is determined by changes in the relationship between two rates of interest. The Fund is exposed to credit loss in the event of non-performance by the swap counterparty. In the case of centrally cleared swaps, counterparty risk is minimal due to protections provided by the CCP. Risk may also arise from movements in interest rates.
L Credit Default Swaps — When the Fund is the buyer of a credit default swap contract, the Fund is entitled to receive the par (or other agreed-upon) value of a referenced debt obligation (or basket of debt obligations) from the counterparty (or CCP in the case of a centrally cleared swap) to the contract if a credit event by a third party, such as a U.S. or foreign corporate issuer or sovereign issuer, on the debt obligation occurs. In return, the Fund pays the counterparty a periodic stream of payments over the term of the contract provided that no credit event has occurred. If no credit event occurs, the Fund would have spent the stream of payments and received no proceeds from the contract. When the Fund is the seller of a credit default swap contract, it receives the stream of payments, but is obligated to pay to the buyer of the protection an amount up to the notional amount of the swap and in certain instances take delivery of securities of the reference entity upon the occurrence of a credit event, as defined under the terms of that particular swap agreement. Credit events are contract specific but may include bankruptcy, failure to pay, restructuring, obligation acceleration and repudiation/
Eaton Vance
Emerging Markets Debt Fund
January 31, 2019
Notes to Financial Statements — continued
moratorium. If the Fund is a seller of protection and a credit event occurs, the maximum potential amount of future payments that the Fund could be required to make would be an amount equal to the notional amount of the agreement. This potential amount would be partially offset by any recovery value of the respective referenced obligation, or net amount received from the settlement of a buy protection credit default swap agreement entered into by the Fund for the same referenced obligation. As the seller, the Fund may create economic leverage to its portfolio because, in addition to its total net assets, the Fund is subject to investment exposure on the notional amount of the swap. The interest fee paid or received on the swap contract, which is based on a specified interest rate on a fixed notional amount, is accrued daily as a component of unrealized appreciation (depreciation) and is recorded as realized gain upon receipt or realized loss upon payment. The Fund also records an increase or decrease to unrealized appreciation (depreciation) in an amount equal to the daily valuation. For centrally cleared swaps, the daily change in valuation is recorded as a receivable or payable for variation margin and settled in cash with the CCP daily. All upfront payments and receipts, if any, are amortized over the life of the swap contract as realized gains or losses. Those upfront payments or receipts for non-centrally cleared swaps are recorded as other assets or other liabilities, respectively, net of amortization. For financial reporting purposes, unamortized upfront payments or receipts, if any, are netted with unrealized appreciation or depreciation on swap contracts to determine the market value of swaps as presented in Notes 6 and 9. The Fund segregates assets in the form of cash or liquid securities in an amount equal to the notional amount of the credit default swaps of which it is the seller. The Fund segregates assets in the form of cash or liquid securities in an amount equal to any unrealized depreciation of the credit default swaps of which it is the buyer, marked-to-market on a daily basis. These transactions involve certain risks, including the risk that the seller may be unable to fulfill the transaction. In the case of centrally cleared swaps, counterparty risk is minimal due to protections provided by the CCP.
2 Distributions to Shareholders and Income Tax Information
It is the present policy of the Fund to make monthly distributions of all or substantially all of its net investment income and to distribute annually all or substantially all of its net realized capital gains. Distributions to shareholders are recorded on the ex-dividend date. Shareholders may reinvest income and capital gain distributions in additional shares of the Fund at the net asset value as of the ex-dividend date or, at the election of the shareholder, receive distributions in cash. Distributions to shareholders are determined in accordance with income tax regulations, which may differ from U.S. GAAP. As required by U.S. GAAP, only distributions in excess of tax basis earnings and profits are reported in the financial statements as a return of capital. Permanent differences between book and tax accounting relating to distributions are reclassified to paid-in capital. For tax purposes, distributions from short-term capital gains are considered to be from ordinary income.
The tax character of distributions declared for the period ended January 31, 2019 was as follows:
| | | | |
| | | Period Ended January 31, 2019 | |
| |
Ordinary income | | $ | 235,680 | |
During the period ended January 31, 2019, accumulated loss was decreased by $3,378 and paid-in capital was decreased by $3,378 due to differences between book and tax accounting for non-deductible expenses. These reclassifications had no effect on the net assets or net asset value per share of the Fund.
As of January 31, 2019, the components of distributable earnings (accumulated loss) on a tax basis were as follows:
| | | | |
| | |
Undistributed ordinary income | | $ | 41,144 | |
| |
Undistributed long-term capital gains | | $ | 51,949 | |
| |
Net unrealized depreciation | | $ | (218,743 | ) |
The cost and unrealized appreciation (depreciation) of investments, including open derivative contracts, of the Fund at January 31, 2019, as determined on a federal income tax basis, were as follows:
| | | | |
| |
Aggregate cost | | $ | 7,149,438 | |
| |
Gross unrealized appreciation | | $ | 76,396 | |
| |
Gross unrealized depreciation | | | (294,572 | ) |
| |
Net unrealized depreciation | | $ | (218,176 | ) |
Eaton Vance
Emerging Markets Debt Fund
January 31, 2019
Notes to Financial Statements — continued
3 Investment Adviser and Administration Fee and Other Transactions with Affiliates
The investment adviser and administration fee is earned by EVM as compensation for investment advisory and administrative services rendered to the Fund. The fee is computed at an annual rate of 0.65% of the Fund’s average daily net assets up to $500 million and is payable monthly. On net assets of $500 million and over, the annual fee is reduced. For the period ended January 31, 2019, the investment adviser and administration fee amounted to $38,007 or 0.65% (annualized) of the Fund’s average daily net assets. The Fund invests its cash in Cash Reserves Fund. EVM does not currently receive a fee for advisory services provided to Cash Reserves Fund.
EVM has agreed to reimburse the Fund’s expenses to the extent that total annual operating expenses (relating to ordinary operating expenses only) exceed 0.85% of the Fund’s average daily net assets for Class I. This agreement may be changed or terminated after May 31, 2019. Pursuant to this agreement, EVM was allocated $131,208 of the Fund’s operating expenses for the period ended January 31, 2019.
EVM provides sub-transfer agency and related services to the Fund pursuant to a Sub-Transfer Agency Support Services Agreement. For the period ended January 31, 2019, EVM earned $10 from the Fund pursuant to such agreement, which is included in transfer and dividend disbursing agent fees on the Statement of Operations.
Trustees and officers of the Fund who are members of EVM’s organization receive remuneration for their services to the Fund out of the investment adviser and administration fee. Trustees of the Fund who are not affiliated with EVM may elect to defer receipt of all or a percentage of their annual fees in accordance with the terms of the Trustees Deferred Compensation Plan. For the period ended January 31, 2019, no significant amounts have been deferred. Certain officers and Trustees of the Fund are officers of EVM.
4 Purchases and Sales of Investments
Purchases and sales of investments, other than short-term obligations, aggregated $13,042,579 and $5,838,427, respectively, for the period ended January 31, 2019.
5 Shares of Beneficial Interest
The Trust’s Declaration of Trust permits the Trustees to issue an unlimited number of full and fractional shares of beneficial interest (without par value) in one or more series (such as the Fund). Transactions in Fund shares were as follows:
| | | | |
| | | Period Ended January 31, 2019(1) | |
| |
Sales | | | 800,770 | |
| |
Net increase | | | 800,770 | |
| (1) | For the period from the start of business, May 1, 2018, to January 31, 2019. |
At January 31, 2019, EVM owned 99.8% of the outstanding shares of the Fund.
6 Financial Instruments
The Fund may trade in financial instruments with off-balance sheet risk in the normal course of its investing activities. These financial instruments may include forward foreign currency exchange contracts, financial futures contracts and swap contracts and may involve, to a varying degree, elements of risk in excess of the amounts recognized for financial statement purposes. The notional or contractual amounts of these instruments represent the investment the Fund has in particular classes of financial instruments and do not necessarily represent the amounts potentially subject to risk. The measurement of the risks associated with these instruments is meaningful only when all related and offsetting transactions are considered. A summary of obligations under these financial instruments at January 31, 2019 is included in the Portfolio of Investments. At January 31, 2019, the Fund had sufficient cash and/or securities to cover commitments under these contracts.
In the normal course of pursuing its investment objective, the Fund is subject to the following risks:
Credit Risk: The Fund enters into credit default swap contracts to enhance total return and/or as a substitute for the purchase or sale of securities.
Foreign Exchange Risk: The Fund engages in forward foreign currency exchange contracts to enhance total return and or to seek to hedge against fluctuations in currency exchange rates.
Interest Rate Risk: The Fund utilizes various interest rate derivatives including interest rate futures contracts and interest rate swaps to enhance total return, to seek to hedge against fluctuations in interest rates, and/or to change the effective duration of its portfolio.
Eaton Vance
Emerging Markets Debt Fund
January 31, 2019
Notes to Financial Statements — continued
The Fund enters into over-the-counter (OTC) derivatives that may contain provisions whereby the counterparty may terminate the contract under certain conditions, including but not limited to a decline in the Fund’s net assets below a certain level over a certain period of time, which would trigger a payment by the Fund for those derivatives in a liability position. At January 31, 2019, the fair value of derivatives with credit-related contingent features in a net liability position was $19,427. At January 31, 2019, there were no assets pledged by the Fund for such liability.
The OTC derivatives in which the Fund invests are subject to the risk that the counterparty to the contract fails to perform its obligations under the contract. To mitigate this risk, the Fund has entered into an International Swaps and Derivatives Association, Inc. Master Agreement (“ISDA Master Agreement”) or similar agreement with substantially all its derivative counterparties. An ISDA Master Agreement is a bilateral agreement between the Fund and a counterparty that governs certain OTC derivatives and typically contains, among other things, set-off provisions in the event of a default and/or termination event as defined under the relevant ISDA Master Agreement. Under an ISDA Master Agreement, the Fund may, under certain circumstances, offset with the counterparty certain derivative financial instruments’ payables and/or receivables with collateral held and/or posted and create one single net payment. The provisions of the ISDA Master Agreement typically permit a single net payment in the event of default including the bankruptcy or insolvency of the counterparty. However, bankruptcy or insolvency laws of a particular jurisdiction may impose restrictions on or prohibitions against the right of offset in bankruptcy or insolvency. Certain ISDA Master Agreements allow counterparties to OTC derivatives to terminate derivative contracts prior to maturity in the event the Fund’s net assets decline by a stated percentage or the Fund fails to meet the terms of its ISDA Master Agreements, which would cause the counterparty to accelerate payment by the Fund of any net liability owed to it.
The collateral requirements for derivatives traded under an ISDA Master Agreement are governed by a Credit Support Annex to the ISDA Master Agreement. Collateral requirements are determined at the close of business each day and are typically based on changes in market values for each transaction under an ISDA Master Agreement and netted into one amount for such agreement. Generally, the amount of collateral due from or to a counterparty is subject to a minimum transfer threshold amount before a transfer is required, which may vary by counterparty. Collateral pledged for the benefit of the Fund and/or counterparty is held in segregated accounts by the Fund’s custodian and cannot be sold, re-pledged, assigned or otherwise used while pledged. The portion of such collateral representing cash, if any, is reflected as deposits for derivatives collateral and, in the case of cash pledged by a counterparty for the benefit of the Fund, a corresponding liability on the Statement of Assets and Liabilities. Securities pledged by the Fund as collateral, if any, are identified as such in the Portfolio of Investments.
The fair value of open derivative instruments (not considered to be hedging instruments for accounting disclosure purposes) by risk exposure at January 31, 2019 was as follows:
| | | | | | | | | | | | | | | | |
| | | Fair Value | |
| Statement of Assets and Liabilities Caption | | Credit | | | Foreign
Exchange | | | Interest
Rate | | | Total | |
| | | | |
Not applicable | | $ | — | | | $ | — | | | $ | 73,316 | * | | $ | 73,316 | |
| | | | |
Receivable for open forward foreign currency exchange contracts | | | — | | | | 1,580 | | | | — | | | | 1,580 | |
| | | | |
Total Asset Derivatives | | $ | — | | | $ | 1,580 | | | $ | 73,316 | | | $ | 74,896 | |
| | | | |
Derivatives not subject to master netting or similar agreements | | $ | — | | | $ | — | | | $ | 73,316 | | | $ | 73,316 | |
| | | | |
Total Asset Derivatives subject to master netting or similar agreements | | $ | — | | | $ | 1,580 | | | $ | — | | | $ | 1,580 | |
| | | | |
Not applicable | | $ | (10,865 | )* | | $ | — | | | $ | (78,000 | )* | | $ | (88,865 | ) |
| | | | |
Payable for open forward foreign currency exchange contracts | | | — | | | | (4,185 | ) | | | — | | | | (4,185 | ) |
| | | | |
Payable for open swap contracts; Upfront receipts on open non-centrally cleared swap contracts | | | (15,242 | ) | | | — | | | | — | | | | (15,242 | ) |
| | | | |
Total Liability Derivatives | | $ | (26,107 | ) | | $ | (4,185 | ) | | $ | (78,000 | ) | | $ | (108,292 | ) |
| | | | |
Derivatives not subject to master netting or similar agreements | | $ | (10,865 | ) | | $ | — | | | $ | (78,000 | ) | | $ | (88,865 | ) |
| | | | |
Total Liability Derivatives subject to master netting or similar agreements | | $ | (15,242 | ) | | $ | (4,185 | ) | | $ | — | | | $ | (19,427 | ) |
| * | For futures contracts and centrally cleared swap contracts, amount represents value as shown in the Portfolio of Investments. Only the variation margin on open futures contracts and centrally cleared swap contracts is reported within the Statement of Assets and Liabilities as Receivable or Payable for variation margin on open financial futures contracts and centrally cleared swap contracts, as applicable. |
Eaton Vance
Emerging Markets Debt Fund
January 31, 2019
Notes to Financial Statements — continued
The Fund’s derivative assets and liabilities at fair value by risk, which are reported gross in the Statement of Assets and Liabilities, are presented in the table above. The following tables present the Fund’s derivative assets and liabilities by counterparty, net of amounts available for offset under a master netting agreement and net of the related collateral received by the Fund for such assets and pledged by the Fund for such liabilities as of January 31, 2019.
| | | | | | | | | | | | | | | | | | | | |
| Counterparty | | Derivative Assets Subject to Master Netting Agreement | | | Derivatives Available for Offset | | | Non-cash Collateral Received(a) | | | Cash Collateral Received(a) | | | Net Amount of Derivative Assets(b) | |
| | | | | |
Citibank, N.A. | | $ | 1,580 | | | $ | (1,580 | ) | | $ | — | | | $ | — | | | $ | — | |
| | | | | |
| Counterparty | | Derivative Liabilities Subject to Master Netting Agreement | | | Derivatives Available for Offset | | | Non-cash Collateral Pledged(a) | | | Cash Collateral Pledged(a) | | | Net Amount of Derivative Liabilities(c) | |
| | | | | |
Citibank, N.A. | | $ | (19,427 | ) | | $ | 1,580 | | | $ | — | | | $ | — | | | $ | (17,847 | ) |
| (a) | In some instances, the total collateral received and/or pledged may be more than the amount shown due to overcollateralization. |
| (b) | Net amount represents the net amount due from the counterparty in the event of default. |
| (c) | Net amount represents the net amount payable to the counterparty in the event of default. |
The effect of derivative instruments (not considered to be hedging instruments for accounting disclosure purposes) on the Statement of Operations by risk exposure for the period ended January 31, 2019 was as follows:
| | | | | | | | | | | | |
| Statement of Operations Caption | | Credit | | | Foreign
Exchange | | | Interest
Rate | |
| | | |
Net realized gain (loss) — | | | | | | | | | | | | |
| | | |
Financial futures contracts | | $ | — | | | $ | — | | | $ | 16,232 | |
| | | |
Swap contracts | | | 2,456 | | | | — | | | | 2,924 | |
| | | |
Forward foreign currency exchange contracts | | | — | | | | 61,262 | | | | — | |
| | | |
Total | | $ | 2,456 | | | $ | 61,262 | | | $ | 19,156 | |
| | | |
Change in unrealized appreciation (depreciation) — | | | | | | | | | | | | |
| | | |
Financial futures contracts | | $ | — | | | $ | — | | | $ | 70,313 | |
| | | |
Swap contracts | | | 9,498 | | | | — | | | | (74,228 | ) |
| | | |
Forward foreign currency exchange contracts | | | — | | | | (2,605 | ) | | | — | |
| | | |
Total | | $ | 9,498 | | | $ | (2,605 | ) | | $ | (3,915 | ) |
The average notional cost of futures contracts and average notional amounts of other derivative contracts outstanding during the period ended January 31, 2019, which are indicative of the volume of these derivative types, were approximately as follows:
| | | | | | | | | | | | | | |
Futures
Contracts — Long | | | Futures
Contracts — Short | | | Forward
Foreign Currency
Exchange Contracts* | | | Swap
Contracts | |
| | | |
| | $2,672,000 | | | $ | 32,000 | | | $ | 1,168,000 | | | $ | 2,147,000 | |
| * | The average notional amount for forward foreign currency exchange contracts is based on the absolute value of notional amounts of currency purchased and currency sold. |
Eaton Vance
Emerging Markets Debt Fund
January 31, 2019
Notes to Financial Statements — continued
7 Line of Credit
The Fund participates with other portfolios and funds managed by EVM and its affiliates in a $625 million unsecured line of credit agreement with a group of banks, which is in effect through October 29, 2019. Borrowings are made by the Fund solely to facilitate the handling of unusual and/or unanticipated short-term cash requirements. Interest is charged to the Fund based on its borrowings at an amount above either the Eurodollar rate or Federal Funds rate. In addition, a fee computed at an annual rate of 0.15% on the daily unused portion of the line of credit is allocated among the participating portfolios and funds at the end of each quarter. Because the line of credit is not available exclusively to the Fund, it may be unable to borrow some or all of its requested amounts at any particular time. The Fund did not have any significant borrowings or allocated fees during the period ended January 31, 2019.
8 Risks Associated with Foreign Investments
The Fund’s investments in foreign instruments can be adversely affected by changes in currency exchange rates and political, economic and market developments abroad. In emerging or less developed countries, these risks can be more significant. Investment markets in emerging market countries are typically substantially smaller, less liquid and more volatile than the major markets in developed countries. Emerging market countries may have relatively unstable governments and economies. Emerging market investments often are subject to speculative trading, which typically contributes to volatility.
The Fund may have difficulties enforcing its legal or contractual rights in a foreign country. Economic data as reported by foreign governments and other issuers may be delayed, inaccurate or fraudulent. In the event of a default by a sovereign entity, there are typically no assets to be seized or cash flows to be attached. Furthermore, the willingness or ability of a foreign government to renegotiate defaulted debt may be limited.
9 Fair Value Measurements
Under generally accepted accounting principles for fair value measurements, a three-tier hierarchy to prioritize the assumptions, referred to as inputs, is used in valuation techniques to measure fair value. The three-tier hierarchy of inputs is summarized in the three broad levels listed below.
| • | | Level 1 – quoted prices in active markets for identical investments |
| • | | Level 2 – other significant observable inputs (including quoted prices for similar investments, interest rates, prepayment speeds, credit risk, etc.) |
| • | | Level 3 – significant unobservable inputs (including a fund’s own assumptions in determining the fair value of investments) |
In cases where the inputs used to measure fair value fall in different levels of the fair value hierarchy, the level disclosed is determined based on the lowest level input that is significant to the fair value measurement in its entirety. The inputs or methodology used for valuing securities are not necessarily an indication of the risk associated with investing in those securities.
At January 31, 2019, the hierarchy of inputs used in valuing the Fund’s investments and open derivative instruments, which are carried at value, were as follows:
| | | | | | | | | | | | | | | | |
| Asset Description | | Level 1 | | | Level 2 | | | Level 3 | | | Total | |
| | | | |
Foreign Government Bonds | | $ | — | | | $ | 5,721,232 | | | $ | — | | | $ | 5,721,232 | |
| | | | |
Foreign Corporate Bonds | | | — | | | | 654,450 | | | | — | | | | 654,450 | |
| | | | |
Sovereign Loans | | | — | | | | 597,268 | | | | — | | | | 597,268 | |
| | | | |
Short-Term Investments | | | — | | | | 24,800 | | | | — | | | | 24,800 | |
| | | | |
Total Investments | | $ | — | | | $ | 6,997,750 | | | $ | — | | | $ | 6,997,750 | |
| | | | |
Forward Foreign Currency Exchange Contracts | | $ | — | | | $ | 1,580 | | | $ | — | | | $ | 1,580 | |
| | | | |
Futures Contracts | | | 73,316 | | | | — | | | | — | | | | 73,316 | |
| | | | |
Total | | $ | 73,316 | | | $ | 6,999,330 | | | $ | — | | | $ | 7,072,646 | |
| | | | |
Liability Description | | | | | | | | | | | | | | | | |
| | | | |
Forward Foreign Currency Exchange Contracts | | $ | — | | | $ | (4,185 | ) | | $ | — | | | $ | (4,185 | ) |
| | | | |
Futures Contracts | | | (3,003 | ) | | | — | | | | — | | | | (3,003 | ) |
| | | | |
Swap Contracts | | | — | | | | (101,104 | ) | | | — | | | | (101,104 | ) |
| | | | |
Total | | $ | (3,003 | ) | | $ | (105,289 | ) | | $ | — | | | $ | (108,292 | ) |
Eaton Vance
Emerging Markets Debt Fund
January 31, 2019
Report of Independent Registered Public Accounting Firm
To the Trustees of Eaton Vance Mutual Funds Trust and Shareholders of Eaton Vance Emerging Markets Debt Fund:
Opinion on the Financial Statements and Financial Highlights
We have audited the accompanying statement of assets and liabilities of Eaton Vance Emerging Markets Debt Fund (the “Fund”) (one of the funds constituting Eaton Vance Mutual Funds Trust), including the portfolio of investments, as of January 31, 2019, and the related statements of operations, changes in net assets, and the financial highlights for the period from the start of business, May 1, 2018, to January 31, 2019, and the related notes. In our opinion, the financial statements and financial highlights present fairly, in all material respects, the financial position of the Fund as of January 31, 2019, and the results of its operations, the changes in its net assets, and the financial highlights for the period from the start of business, May 1, 2018, to January 31, 2019, in conformity with accounting principles generally accepted in the United States of America.
Basis for Opinion
These financial statements and financial highlights are the responsibility of the Fund’s management. Our responsibility is to express an opinion on the Fund’s financial statements and financial highlights based on our audit. We are a public accounting firm registered with the Public Company Accounting Oversight Board (United States) (PCAOB) and are required to be independent with respect to the Fund in accordance with the U.S. federal securities laws and the applicable rules and regulations of the Securities and Exchange Commission and the PCAOB.
We conducted our audit in accordance with the standards of the PCAOB. Those standards require that we plan and perform the audit to obtain reasonable assurance about whether the financial statements and financial highlights are free of material misstatement, whether due to error or fraud. The Fund is not required to have, nor were we engaged to perform, an audit of its internal control over financial reporting. As part of our audit we are required to obtain an understanding of internal control over financial reporting but not for the purpose of expressing an opinion on the effectiveness of the Fund’s internal control over financial reporting. Accordingly, we express no such opinion.
Our audit included performing procedures to assess the risks of material misstatement of the financial statements and financial highlights, whether due to error or fraud, and performing procedures that respond to those risks. Such procedures included examining, on a test basis, evidence regarding the amounts and disclosures in the financial statements and financial highlights. Our audit also included evaluating the accounting principles used and significant estimates made by management, as well as evaluating the overall presentation of the financial statements and financial highlights. Our procedures included confirmation of securities owned as of January 31, 2019, by correspondence with the custodian and brokers; when replies were not received from brokers, we performed other auditing procedures. We believe that our audit provides a reasonable basis for our opinion.
/s/ Deloitte & Touche LLP
Boston, Massachusetts
March 21, 2019
We have served as the auditor of one or more Eaton Vance investment companies since 1959.
Eaton Vance
Emerging Markets Debt Fund
January 31, 2019
Federal Tax Information (Unaudited)
The Form 1099-DIV you receive in February 2020 will show the tax status of all distributions paid to your account in calendar year 2019. Shareholders are advised to consult their own tax adviser with respect to the tax consequences of their investment in the Fund. As required by the Internal Revenue Code and/or regulations, shareholders must be notified regarding the status of capital gains dividends.
Capital Gains Dividends. The Fund hereby designates as a capital gain dividend with respect to the taxable year ended January 31, 2019, $51,949 or, if subsequently determined to be different, the net capital gain of such year.
Eaton Vance
Emerging Markets Debt Fund
January 31, 2019
Special Meeting of Shareholders (Unaudited)
The Fund held a Special Meeting of Shareholders on September 20, 2018 to elect the five Trustees listed below. The other Trustees named herein continue to serve as Trustees. As of the record date, EVM owned 100% of the outstanding shares of the Fund. The Trustees were elected by the shareholders of the remaining series of the Trust.
| | | | |
| Nominee for Trustee | | | |
| |
Mark R. Fetting | | | | |
| |
Keith Quinton | | | | |
| |
Marcus L. Smith | | | | |
| |
Susan J. Sutherland | | | | |
| |
Scott E. Wennerholm | | | | |
Eaton Vance
Emerging Markets Debt Fund
January 31, 2019
Management and Organization
Fund Management. The Trustees of Eaton Vance Mutual Funds Trust (the Trust) are responsible for the overall management and supervision of the Trust’s affairs. The Trustees and officers of the Trust are listed below. Except as indicated, each individual has held the office shown or other offices in the same company for the last five years. Trustees and officers of the Trust hold indefinite terms of office. The “noninterested Trustees” consist of those Trustees who are not “interested persons” of the Trust, as that term is defined under the 1940 Act. The business address of each Trustee and officer is Two International Place, Boston, Massachusetts 02110. As used below, “EVC” refers to Eaton Vance Corp., “EV” refers to Eaton Vance, Inc., “EVM” refers to Eaton Vance Management, “BMR” refers to Boston Management and Research and “EVD” refers to Eaton Vance Distributors, Inc. EVC and EV are the corporate parent and trustee, respectively, of EVM and BMR. EVD is the Fund’s principal underwriter and a wholly-owned subsidiary of EVC. Each officer affiliated with Eaton Vance may hold a position with other Eaton Vance affiliates that is comparable to his or her position with EVM listed below. Each Trustee oversees 175 portfolios in the Eaton Vance Complex (including all master and feeder funds in a master feeder structure). Each officer serves as an officer of certain other Eaton Vance funds. Each Trustee and officer serves until his or her successor is elected.
| | | | | | |
| Name and Year of Birth | | Position(s)
with the
Trust | | Trustee
Since(1) | | Principal Occupation(s) and Directorships
During Past Five Years and Other Relevant Experience |
|
| Interested Trustee |
| | | |
Thomas E. Faust Jr. 1958 | | Trustee | | 2007 | | Chairman, Chief Executive Officer and President of EVC, Director and President of EV, Chief Executive Officer and President of EVM and BMR, and Director of EVD. Trustee and/or officer of 175 registered investment companies. Mr. Faust is an interested person because of his positions with EVM, BMR, EVD, EVC and EV, which are affiliates of the Trust. Directorships in the Last Five Years.(2)Director of EVC and Hexavest Inc. (investment management firm). |
|
| Noninterested Trustees |
| | | |
Mark R. Fetting 1954 | | Trustee | | 2016 | | Private investor. Formerly held various positions at Legg Mason, Inc. (investment management firm) (2000-2012), including President, Chief Executive Officer, Director and Chairman (2008-2012), Senior Executive Vice President(2004-2008) and Executive Vice President (2001-2004). Formerly, President of Legg Mason family of funds (2001-2008). Formerly, Division President and Senior Officer of Prudential Financial Group, Inc. and related companies (investment management firm) (1991-2000). Directorships in the Last Five Years. None. |
| | | |
Cynthia E. Frost 1961 | | Trustee | | 2014 | | Private investor. Formerly, Chief Investment Officer of Brown University (university endowment) (2000-2012). Formerly, Portfolio Strategist for Duke Management Company (university endowment manager) (1995-2000). Formerly, Managing Director, Cambridge Associates (investment consulting company)(1989-1995). Formerly, Consultant, Bain and Company (management consulting firm)(1987-1989). Formerly, Senior Equity Analyst, BA Investment Management Company (1983-1985). Directorships in the Last Five Years. None. |
| | | |
George J. Gorman 1952 | | Trustee | | 2014 | | Principal at George J. Gorman LLC (consulting firm). Formerly, Senior Partner at Ernst & Young LLP (a registered public accounting firm) (1974-2009). Directorships in the Last Five Years. Formerly, Trustee of the BofA Funds Series Trust (11 funds) (2011-2014) and of the Ashmore Funds (9 funds)(2010-2014). |
| | | |
Valerie A. Mosley 1960 | | Trustee | | 2014 | | Chairwoman and Chief Executive Officer of Valmo Ventures (a consulting and investment firm). Former Partner and Senior Vice President, Portfolio Manager and Investment Strategist at Wellington Management Company, LLP (investment management firm) (1992-2012). Former Chief Investment Officer, PG Corbin Asset Management (1990-1992). Formerly worked in institutional corporate bond sales at Kidder Peabody (1986-1990). Directorships in the Last Five Years.(2) Director of Envestnet, Inc. (provider of intelligent systems for wealth management and financial wellness) (since 2018). |
Eaton Vance
Emerging Markets Debt Fund
January 31, 2019
Management and Organization — continued
| | | | | | |
| Name and Year of Birth | | Position(s)
with the
Trust | | Trustee
Since(1) | | Principal Occupation(s) and Directorships
During Past Five Years and Other Relevant Experience |
|
| Noninterested Trustees (continued) |
| | | |
William H. Park 1947 | | Chairperson of the Board and Trustee | | 2016 (Chairperson) 2003 (Trustee) | | Private investor. Formerly, Consultant (management and transactional)(2012-2014). Formerly, Chief Financial Officer, Aveon Group L.P. (investment management firm) (2010-2011). Formerly, Vice Chairman, Commercial Industrial Finance Corp. (specialty finance company) (2006-2010). Formerly, President and Chief Executive Officer, Prizm Capital Management, LLC (investment management firm) (2002-2005). Formerly, Executive Vice President and Chief Financial Officer, United Asset Management Corporation (investment management firm) (1982-2001). Formerly, Senior Manager, Price Waterhouse (now PricewaterhouseCoopers) (a registered public accounting firm)(1972-1981). Directorships in the Last Five Years.(2)None. |
| | | |
Helen Frame Peters 1948 | | Trustee | | 2008 | | Professor of Finance, Carroll School of Management, Boston College. Formerly, Dean, Carroll School of Management, Boston College (2000-2002). Formerly, Chief Investment Officer, Fixed Income, Scudder Kemper Investments (investment management firm) (1998-1999). Formerly, Chief Investment Officer, Equity and Fixed Income, Colonial Management Associates (investment management firm) (1991-1998). Directorships in the Last Five Years.(2)None. |
| | | |
Keith Quinton(3) 1958 | | Trustee | | 2018 | | Independent Investment Committee Member at New Hampshire Retirement System (since 2017). Advisory Committee member at Northfield Information Services, Inc. (risk management analytics provider) (since 2016). Formerly, Portfolio Manager and Senior Quantitative Analyst at Fidelity Investments (investment management firm) (2001-2014). Directorships in the Last Five Years. Director of New Hampshire Municipal Bond Bank (since 2016). |
| | | |
Marcus L. Smith(3) 1966 | | Trustee | | 2018 | | Member of Posse Boston Advisory Board (foundation) (since 2015); Trustee at University of Mount Union (since 2008). Formerly, Portfolio Manager at MFS Investment Management (investment management firm) (1994-2017). Directorships in the Last Five Years. Director of MSCI Inc. (global provider of investment decision support tools) (since 2017). Director of DCT Industrial Trust Inc. (logistics real estate company) (since 2017). |
| | | |
Susan J. Sutherland 1957 | | Trustee | | 2015 | | Private investor. Formerly, Associate, Counsel and Partner at Skadden, Arps, Slate, Meagher & Flom LLP (law firm) (1982-2013). Directorships in the Last Five Years. Formerly, Director of Montpelier Re Holdings Ltd. (global provider of customized insurance and reinsurance products)(2013-2015). |
| | | |
Scott E. Wennerholm 1959 | | Trustee | | 2016 | | Formerly, Trustee at Wheelock College (postsecondary institution)(2012-2018). Formerly, Consultant at GF Parish Group (executive recruiting firm)(2016-2017). Formerly, Chief Operating Officer and Executive Vice President at BNY Mellon Asset Management (investment management firm) (2005-2011). Formerly, Chief Operating Officer and Chief Financial Officer at Natixis Global Asset Management (investment management firm) (1997-2004). Formerly, Vice President at Fidelity Investments Institutional Services (investment management firm)(1994-1997). Directorships in the Last Five Years. None. |
| | | | | | |
| Name and Year of Birth | | Position(s)
with the
Trust | | Officer
Since(4) | | Principal Occupation(s)
During Past Five Years |
|
| Principal Officers who are not Trustees |
| | | |
Payson F. Swaffield 1956 | | President | | 2003 | | Vice President and Chief Income Investment Officer of EVM and BMR. Also Vice President of Calvert Research and Management (“CRM”). |
| | | |
Maureen A. Gemma 1960 | | Vice President, Secretary and Chief Legal Officer | | 2005 | | Vice President of EVM and BMR. Also Vice President and officer of CRM. |
Eaton Vance
Emerging Markets Debt Fund
January 31, 2019
Management and Organization — continued
| | | | | | |
| Name and Year of Birth | | Position(s)
with the
Trust | | Officer
Since(4) | | Principal Occupation(s)
During Past Five Years |
|
| Principal Officers who are not Trustees (continued) |
| | | |
James F. Kirchner 1967 | | Treasurer | | 2007 | | Vice President of EVM and BMR. Also Vice President and officer of CRM. |
| | | |
Richard F. Froio 1968 | | Chief Compliance Officer | | 2017 | | Vice President of EVM and BMR since 2017. Formerly Deputy Chief Compliance Officer (Adviser/Funds) and Chief Compliance Officer (Distribution) at PIMCO (2012-2017) and Managing Director at BlackRock/Barclays Global Investors (2009-2012). |
| (1) | Year first appointed to serve as Trustee for a fund in the Eaton Vance family of funds. Each Trustee has served continuously since appointment unless indicated otherwise. |
| (2) | During their respective tenures, the Trustees (except for Mmes. Frost and Sutherland and Messrs. Fetting, Gorman, Quinton, Smith and Wennerholm) also served as Board members of one or more of the following funds (which operated in the years noted): eUnitsTM 2 Year U.S. Market Participation Trust: Upside to Cap / Buffered Downside (launched in 2012 and terminated in 2014); and eUnitsTM 2 Year U.S. Market Participation Trust II: Upside to Cap / Buffered Downside (launched in 2012 and terminated in 2014). However, Ms. Mosley did not serve as a Board member of eUnitsTM 2 Year U.S. Market Participation Trust: Upside to Cap / Buffered Downside (launched in 2012 and terminated in 2014). |
| (3) | Messrs. Quinton and Smith began serving as Trustees effective October 1, 2018. |
| (4) | Year first elected to serve as officer of a fund in the Eaton Vance family of funds when the officer has served continuously. Otherwise, year of most recent election as an officer of a fund in the Eaton Vance family of funds. Titles may have changed since initial election. |
The SAI for the Fund includes additional information about the Trustees and officers of the Fund and can be obtained without charge on Eaton Vance’s website at www.eatonvance.com or by calling 1-800-262-1122.
Eaton Vance Funds
IMPORTANT NOTICES
Privacy. The Eaton Vance organization is committed to ensuring your financial privacy. Each of the financial institutions identified below has in effect the following policy (“Privacy Policy”) with respect to nonpublic personal information about its customers:
| • | | Only such information received from you, through application forms or otherwise, and information about your Eaton Vance fund transactions will be collected. This may include information such as name, address, social security number, tax status, account balances and transactions. |
| • | | None of such information about you (or former customers) will be disclosed to anyone, except as permitted by law (which includes disclosure to employees necessary to service your account). In the normal course of servicing a customer’s account, Eaton Vance may share information with unaffiliated third parties that perform various required services such as transfer agents, custodians and broker-dealers. |
| • | | Policies and procedures (including physical, electronic and procedural safeguards) are in place that are designed to protect the confidentiality of such information. |
| • | | We reserve the right to change our Privacy Policy at any time upon proper notification to you. Customers may want to review our Privacy Policy periodically for changes by accessing the link on our homepage: www.eatonvance.com. |
Our pledge of privacy applies to the following entities within the Eaton Vance organization: the Eaton Vance Family of Funds, Eaton Vance Management, Eaton Vance Investment Counsel, Eaton Vance Distributors, Inc., Eaton Vance Trust Company, Eaton Vance Management (International) Limited, Eaton Vance Advisers International Ltd., Eaton Vance Management’s Real Estate Investment Group and Boston Management and Research. In addition, our Privacy Policy applies only to those Eaton Vance customers who are individuals and who have a direct relationship with us. If a customer’s account (i.e., fund shares) is held in the name of a third-party financial advisor/broker-dealer, it is likely that only such advisor’s privacy policies apply to the customer. This notice supersedes all previously issued privacy disclosures. For more information about Eaton Vance’s Privacy Policy, please call 1-800-262-1122.
Delivery of Shareholder Documents. The Securities and Exchange Commission (SEC) permits funds to deliver only one copy of shareholder documents, including prospectuses, proxy statements and shareholder reports, to fund investors with multiple accounts at the same residential or post office box address. This practice is often called “householding” and it helps eliminate duplicate mailings to shareholders.Eaton Vance, or your financial advisor, may household the mailing of your documents indefinitely unless you instruct Eaton Vance, or your financial advisor, otherwise.If you would prefer that your Eaton Vance documents not be householded, please contact Eaton Vance at 1-800-262-1122, or contact your financial advisor. Your instructions that householding not apply to delivery of your Eaton Vance documents will typically be effective within 30 days of receipt by Eaton Vance or your financial advisor.
Portfolio Holdings. Each Eaton Vance Fund and its underlying Portfolio(s) (if applicable) will file a schedule of portfolio holdings on Form N-Q with the SEC for the first and third quarters of each fiscal year. The Form N-Q will be available on the Eaton Vance website at www.eatonvance.com, by calling Eaton Vance at 1-800-262-1122 or in the EDGAR database on the SEC’s website at www.sec.gov. Form N-Q may also be reviewed and copied at the SEC’s public reference room in Washington, D.C. (call 1-800-732-0330 for information on the operation of the public reference room).
Proxy Voting. From time to time, funds are required to vote proxies related to the securities held by the funds. The Eaton Vance Funds or their underlying Portfolios (if applicable) vote proxies according to a set of policies and procedures approved by the Funds’ and Portfolios’ Boards. You may obtain a description of these policies and procedures and information on how the Funds or Portfolios voted proxies relating to portfolio securities during the most recent 12-month period ended June 30, without charge, upon request, by calling 1-800-262-1122 and by accessing the SEC’s website at www.sec.gov.
Investment Adviser and Administrator
Eaton Vance Management
Two International Place
Boston, MA 02110
Principal Underwriter*
Eaton Vance Distributors, Inc.
Two International Place
Boston, MA 02110
(617) 482-8260
Custodian
State Street Bank and Trust Company
State Street Financial Center, One Lincoln Street
Boston, MA 02111
Transfer Agent
BNY Mellon Investment Servicing (US) Inc.
Attn: Eaton Vance Funds
P.O. Box 9653
Providence, RI 02940-9653
(800) 262-1122
Independent Registered Public Accounting Firm
Deloitte & Touche LLP
200 Berkeley Street
Boston, MA 02116-5022
Fund Offices
Two International Place
Boston, MA 02110
| * | FINRA BrokerCheck. Investors may check the background of their Investment Professional by contacting the Financial Industry Regulatory Authority (FINRA). FINRA BrokerCheck is a free tool to help investors check the professional background of current and former FINRA-registered securities firms and brokers. FINRA BrokerCheck is available by calling 1-800-289-9999 and at www.FINRA.org. The FINRA BrokerCheck brochure describing this program is available to investors at www.FINRA.org. |

29948 1.31.19

Parametric
Emerging Markets Fund
Annual Report
January 31, 2019
Important Note. Beginning on January 1, 2021, as permitted by regulations adopted by the Securities and Exchange Commission, paper copies of the Fund’s annual and semi-annual shareholder reports will no longer be sent by mail unless you specifically request paper copies of the reports. Instead, the reports will be made available on the Fund’s website (eatonvance.com/ppafunddocuments), and you will be notified by mail each time a report is posted and provided with a website address to access the report.
If you already elected to receive shareholder reports electronically, you will not be affected by this change and you need not take any action. If you are a direct investor, you may elect to receive shareholder reports and other communications from the Fund electronically by signing up for e-Delivery at eatonvance.com/edelivery. If you own your shares through a financial intermediary (such as a broker-dealer or bank), you must contact your financial intermediary to sign up.
You may elect to receive all future Fund shareholder reports in paper free of charge. If you are a direct investor, you can inform the Fund that you wish to continue receiving paper copies of your shareholder reports by calling 1-800-260-0761. If you own these shares through a financial intermediary, you must contact your financial intermediary or follow instructions included with this disclosure, if applicable, to elect to continue to receive paper copies of your shareholder reports. Your election to receive reports in paper will apply to all Eaton Vance funds held directly or to all funds held through your financial intermediary, as applicable.

Commodity Futures Trading Commission Registration. Effective December 31, 2012, the Commodity Futures Trading Commission (“CFTC”) adopted certain regulatory changes that subject registered investment companies and advisers to regulation by the CFTC if a fund invests more than a prescribed level of its assets in certain CFTC-regulated instruments (including futures, certain options and swap agreements) or markets itself as providing investment exposure to such instruments. The Fund has claimed an exclusion from the definition of the term “commodity pool operator” under the Commodity Exchange Act. Accordingly, neither the Fund nor the adviser with respect to the operation of the Fund is subject to CFTC regulation. Because of its management of other strategies, the Fund’s adviser is registered with the CFTC as a commodity pool operator and a commodity trading advisor.
Fund shares are not insured by the FDIC and are not deposits or other obligations of, or guaranteed by, any depository institution. Shares are subject to investment risks, including possible loss of principal invested.
This report must be preceded or accompanied by a current summary prospectus or prospectus. Before investing, investors should consider carefully the investment objective, risks, and charges and expenses of a mutual fund. This and other important information is contained in the summary prospectus and prospectus, which can be obtained from a financial advisor. Prospective investors should read the prospectus carefully before investing. For further information, please call 1-800-260-0761.
Annual ReportJanuary 31, 2019
Parametric
Emerging Markets Fund
Table of Contents
| | | | |
Management’s Discussion of Fund Performance | | | 2 | |
| |
Performance | | | 3 | |
| |
Fund Profile | | | 4 | |
| |
Endnotes and Additional Disclosures | | | 5 | |
| |
Fund Expenses | | | 6 | |
| |
Financial Statements | | | 7 | |
| |
Report of Independent Registered Public Accounting Firm | | | 40 | |
| |
Federal Tax Information | | | 41 | |
| |
Special Meeting of Shareholders | | | 42 | |
| |
Management and Organization | | | 43 | |
| |
Important Notices | | | 46 | |
Parametric
Emerging Markets Fund
January 31, 2019
Management’s Discussion of Fund Performance1
Economic and Market Conditions
For the12-month period ended January 31, 2019, emerging market equities experienced a sharp correction, with the MSCI Emerging Markets Index (the Index)2 declining 14.24%.
Trade-war fears grew in severity during the period, adversely impacting many trade-centric economies. Fears of a currency crisis riled markets during the middle of 2018, although the effects were mostly limited to Turkey and Argentina. Generally, the U.S. dollar strengthened during the period, resulting in a strong headwind for emerging market equity returns when stated in U.S. dollar terms.
At the country level, Qatar, Russia and Brazil were the only Index constituents to post positive results. On the other end of the spectrum, Turkey declined over 30% as the country suffered a loss of investor confidence amid political turmoil and a plunge in the Turkish lira. Chinese stocks fell on increasing signs of weakness in the country’s economy, which also created headwinds for major China trade partner, South Korea.
Frontier markets (as measured by the MSCI Frontier Markets Index) delivered lower returns than emerging markets (as measured by the Index) during the period. This decline was broad-based, with only three frontier market countries — Kuwait, Bahrain and Tunisia — delivering positive returns.
Fund Performance
For the12-month period ended January 31, 2019, Parametric Emerging Markets Fund (the Fund) returned –13.43% for Investor Class shares at net asset value (NAV), outperforming its benchmark, the Index, which returned –14.24%.
The largest contributor to performance relative to the Index was an underweight exposure to China, as escalations in the U.S.–China trade war and growing signs of an economic slowdown weighed on the country’s equity markets. Also benefiting relative results was the inclusion ofnon-Index country Kuwait. Kuwaiti equities rose in response to a rally in the price of crude oil during the period, along with MSCI’s announcement that Kuwait will be included in its 2019 annual market review for potential inclusion in the emerging markets index. The sector diversification6 process within Taiwan also aided relative performance, particularly due to an underweight position in technology, which fell amid a slowdown in semiconductor demand during the period.
The largest detractor from performance relative to the Index was the sector diversification process in Brazil. This was partially due to an overweight position in the information technology sector, which struggled due to payment processor Cielo SA losing exclusive rights to Mastercard, Inc. and Visa, Inc. transactions in Brazil. An overweight position in Turkey further hurt relative performance. Investors fled the country due to spiraling inflation, a plunging currency and a government that has acted slowly to resolve long-standing structural issues that triggered these problems. The sector diversification process within India further weighed on relative results due, in part, to an overweight position in communication services. Weakness in the country’s mobile phone industry, which posted losses on back-breaking competition among wireless providers, weighed on the broader sector during the period.
See Endnotes and Additional Disclosures in this report.
Past performance is no guarantee of future results. Returns are historical and are calculated by determining the percentage change in net asset value (NAV) or offering price (as applicable) with all distributions reinvested. Investment return and principal value will fluctuate so that shares, when redeemed, may be worth more or less than their original cost. Performance less than or equal to one year is cumulative. Performance is for the stated time period only; due to market volatility, the Fund’s current performance may be lower or higher than quoted. Returns are before taxes unless otherwise noted. For performance as of the most recentmonth-end, please refer to eatonvance.com.
Parametric
Emerging Markets Fund
January 31, 2019
Performance2,3
Portfolio Managers Thomas Seto and Timothy W. Atwill, Ph.D., CFA, each of Parametric Portfolio Associates LLC
| | | | | | | | | | | | | | | | | | | | |
| % Average Annual Total Returns | | Class Inception Date | | | Performance Inception Date | | | One Year | | | Five Years | | | Ten Years | |
Investor Class at NAV | | | 06/30/2006 | | | | 06/30/2006 | | | | –13.43 | % | | | 2.16 | % | | | 8.78 | % |
Class C at NAV | | | 06/30/2006 | | | | 06/30/2006 | | | | –14.10 | | | | 1.39 | | | | 7.99 | |
Class C with 1% Maximum Sales Charge | | | — | | | | — | | | | –14.95 | | | | 1.39 | | | | 7.99 | |
Institutional Class at NAV | | | 06/30/2006 | | | | 06/30/2006 | | | | –13.20 | | | | 2.42 | | | | 9.07 | |
Class R6 at NAV | | | 07/01/2014 | | | | 06/30/2006 | | | | –13.18 | | | | 2.47 | | | | 9.10 | |
MSCI Emerging Markets Index | | | — | | | | — | | | | –14.24 | % | | | 4.76 | % | | | 9.66 | % |
| | | | | |
| | | | | | | | | | | | | | | | | | | | |
| % Total Annual Operating Expense Ratios4 | | | | | Investor Class | | | Class C | | | Institutional Class | | | Class R6 | |
| | | | | | | 1.37 | % | | | 2.12 | % | | | 1.12 | % | | | 1.07 | % |
Growth of $10,000
This graph shows the change in value of a hypothetical investment of $10,000 in Investor Class of the Fund for the period indicated. For comparison, the same investment is shown in the indicated index.
| | | | | | | | | | | | | | | | |
| Growth of Investment3 | | Amount Invested | | | Period Beginning | | | At NAV | | | With Maximum Sales Charge | |
Class C | | $ | 10,000 | | | | 01/31/2009 | | | $ | 21,573 | | | | N.A. | |
Institutional Class | | $ | 50,000 | | | | 01/31/2009 | | | $ | 119,199 | | | | N.A. | |
Class R6 | | $ | 1,000,000 | | | | 01/31/2009 | | | $ | 2,390,686 | | | | N.A. | |
See Endnotes and Additional Disclosures in this report.
Past performance is no guarantee of future results. Returns are historical and are calculated by determining the percentage change in net asset value (NAV) or offering price (as applicable) with all distributions reinvested. Investment return and principal value will fluctuate so that shares, when redeemed, may be worth more or less than their original cost. Performance less than or equal to one year is cumulative. Performance is for the stated time period only; due to market volatility, the Fund’s current performance may be lower or higher than quoted. Returns are before taxes unless otherwise noted. For performance as of the most recentmonth-end, please refer to eatonvance.com.
Parametric
Emerging Markets Fund
January 31, 2019
Fund Profile
Sector Allocation (% of net assets)5
Top 10 Holdings (% of net assets)5
| | | | |
| |
Sberbank of Russia PJSC | | | 0.8 | % |
| |
America Movil SAB de CV, Series L | | | 0.7 | |
| |
Credicorp, Ltd. | | | 0.7 | |
| |
Lukoil PJSC ADR | | | 0.7 | |
| |
Naspers, Ltd., Class N | | | 0.7 | |
| |
Gazprom PJSC ADR | | | 0.6 | |
| |
Petroleo Brasileiro SA, PFC Shares | | | 0.5 | |
| |
Samsung Electronics Co., Ltd. | | | 0.5 | |
| |
Tencent Holdings, Ltd. | | | 0.5 | |
| |
Grupo Financiero Banorte SAB de CV, Class O | | | 0.5 | |
| |
Total | | | 6.2 | % |
Geographic Allocation (% of common stocks)
See Endnotes and Additional Disclosures in this report.
Parametric
Emerging Markets Fund
January 31, 2019
Endnotes and Additional Disclosures
| 1 | The views expressed in this report are those of the portfolio manager(s) and are current only through the date stated at the top of this page. These views are subject to change at any time based upon market or other conditions, and Eaton Vance and the Fund(s) disclaim any responsibility to update such views. These views may not be relied upon as investment advice and, because investment decisions are based on many factors, may not be relied upon as an indication of trading intent on behalf of any Eaton Vance fund. This commentary may contain statements that are not historical facts, referred to as “forward looking statements.” The Fund’s actual future results may differ significantly from those stated in any forward looking statement, depending on factors such as changes in securities or financial markets or general economic conditions, the volume of sales and purchases of Fund shares, the continuation of investment advisory, administrative and service contracts, and other risks discussed from time to time in the Fund’s filings with the Securities and Exchange Commission. |
| 2 | MSCI Emerging Markets Index is an unmanaged index of emerging markets common stocks. MSCI Frontier Markets Index is an unmanaged index that measures the performance of stock markets with less-developed economies and financial markets than emerging markets, and that typically have more restrictions on foreign stock ownership. MSCI indexes are net of foreign withholding taxes. Source: MSCI. MSCI data may not be reproduced or used for any other purpose. MSCI provides no warranties, has not prepared or approved this report, and has no liability hereunder. Unless otherwise stated, index returns do not reflect the effect of any applicable sales charges, commissions, expenses, taxes or leverage, as applicable. It is not possible to invest directly in an index. |
| 3 | Total Returns at NAV do not include applicable sales charges. If sales charges were deducted, the returns would be lower. Total Returns shown with maximum sales charge reflect the stated maximum sales charge. Investor Class, Institutional Class and Class R6 shares are offered without a sales charge. Unless otherwise stated, performance does not reflect the deduction of taxes on Fund distributions or redemptions of Fund shares. |
| | Performance prior to the inception date of a class may be linked to the performance of an older class of the Fund. This linked performance is adjusted for any applicable sales charge, but is not adjusted for class expense differences. If adjusted for such differences, the performance would be different. The performance of Class R6 is linked to Institutional Class. Performance since inception for an index, if presented, is the performance since the Fund’s or oldest share class’ inception, as applicable. Performance presented in the Financial Highlights included in the financial statements is not linked. |
| 4 | Source: Fund prospectus. The expense ratios for the current reporting period can be found in the Financial Highlights section of this report. |
| 5 | Excludes cash and cash equivalents. |
| 6 | Diversification cannot ensure a profit or eliminate the risk of loss. |
| | Fund profile subject to change due to active management. |
| | Important Notice to Shareholders |
| | Effective May 1, 2019, the portfolio managers of the Fund will be Thomas Seto, Paul Bouchey and Jennifer Sireklove, each of Parametric Portfolio Associates LLC. |
Parametric
Emerging Markets Fund
January 31, 2019
Fund Expenses
Example: As a Fund shareholder, you incur two types of costs: (1) transaction costs, including sales charges (loads) on purchases and redemption fees (if applicable); and (2) ongoing costs, including management fees; distribution and/or service fees; and other Fund expenses. This Example is intended to help you understand your ongoing costs (in dollars) of Fund investing and to compare these costs with the ongoing costs of investing in other mutual funds. The Example is based on an investment of $1,000 invested at the beginning of the period and held for the entire period (August 1, 2018 – January 31, 2019).
Actual Expenses: The first section of the table below provides information about actual account values and actual expenses. You may use the information in this section, together with the amount you invested, to estimate the expenses that you paid over the period. Simply divide your account value by $1,000 (for example, an $8,600 account value divided by $1,000 = 8.6), then multiply the result by the number in the first section under the heading entitled “Expenses Paid During Period” to estimate the expenses you paid on your account during this period.
Hypothetical Example for Comparison Purposes: The second section of the table below provides information about hypothetical account values and hypothetical expenses based on the actual Fund expense ratio and an assumed rate of return of 5% per year (before expenses), which is not the actual Fund return. The hypothetical account values and expenses may not be used to estimate the actual ending account balance or expenses you paid for the period. You may use this information to compare the ongoing costs of investing in your Fund and other funds. To do so, compare this 5% hypothetical example with the 5% hypothetical examples that appear in the shareholder reports of the other funds.
Please note that the expenses shown in the table are meant to highlight your ongoing costs only and do not reflect any transactional costs, such as sales charges (loads) or redemption fees (if applicable). Therefore, the second section of the table is useful in comparing ongoing costs only, and will not help you determine the relative total costs of owning different funds. In addition, if these transactional costs were included, your costs would be higher.
| | | | | | | | | | | | | | | | |
| | | Beginning
Account Value
(8/1/18) | | | Ending
Account Value
(1/31/19) | | | Expenses Paid
During Period*
(8/1/18 – 1/31/19) | | | Annualized
Expense
Ratio | |
| | | | |
Actual | | | | | | | | | | | | | | | | |
Investor Class | | $ | 1,000.00 | | | $ | 973.80 | | | $ | 7.41 | | | | 1.49 | % |
Class C | | $ | 1,000.00 | | | $ | 969.80 | | | $ | 11.07 | | | | 2.23 | % |
Institutional Class | | $ | 1,000.00 | | | $ | 974.70 | | | $ | 6.12 | | | | 1.23 | % |
Class R6 | | $ | 1,000.00 | | | $ | 975.40 | | | $ | 6.12 | | | | 1.23 | % |
| | | | | |
Hypothetical | | | | | | | | | | | | | | | | |
(5% return per year before expenses) | | | | | | | | | | | | | | | | |
Investor Class | | $ | 1,000.00 | | | $ | 1,017.70 | | | $ | 7.58 | | | | 1.49 | % |
Class C | | $ | 1,000.00 | | | $ | 1,014.00 | | | $ | 11.32 | | | | 2.23 | % |
Institutional Class | | $ | 1,000.00 | | | $ | 1,019.00 | | | $ | 6.26 | | | | 1.23 | % |
Class R6 | | $ | 1,000.00 | | | $ | 1,019.00 | | | $ | 6.26 | | | | 1.23 | % |
| * | Expenses are equal to the Fund’s annualized expense ratio for the indicated Class, multiplied by the average account value over the period, multiplied by 184/365 (to reflect the one-half year period). The Example assumes that the $1,000 was invested at the net asset value per share determined at the close of business on July 31, 2018. |
Parametric
Emerging Markets Fund
January 31, 2019
Portfolio of Investments
| | | | | | | | |
| Common Stocks — 99.8% | |
| Security | | Shares | | | Value | |
|
| Argentina — 0.8% | |
| | |
Adecoagro SA(1) | | | 132,806 | | | $ | 1,011,982 | |
| | |
Arcos Dorados Holdings, Inc., Class A | | | 50,414 | | | | 462,296 | |
| | |
Banco Macro SA, Class B ADR | | | 6,487 | | | | 375,403 | |
| | |
BBVA Banco Frances SA ADR | | | 25,288 | | | | 342,652 | |
| | |
Cresud SA ADR(1) | | | 44,263 | | | | 596,665 | |
| | |
Grupo Financiero Galicia SA, Class B ADR | | | 30,387 | | | | 1,109,429 | |
| | |
IRSA Inversiones y Representaciones SA ADR(1) | | | 35,110 | | | | 542,099 | |
| | |
MercadoLibre, Inc.(1) | | | 9,722 | | | | 3,538,808 | |
| | |
Pampa Energia SA ADR(1) | | | 50,499 | | | | 1,800,289 | |
| | |
Transportadora de Gas del Sur SA ADR | | | 20,764 | | | | 349,458 | |
| | |
YPF SA ADR | | | 110,424 | | | | 1,805,433 | |
| | |
| | | | | | | $ | 11,934,514 | |
|
| Bahrain — 0.7% | |
| | |
Ahli United Bank BSC | | | 7,546,245 | | | $ | 5,778,869 | |
| | |
Al Salam Bank-Bahrain BSC | | | 7,773,078 | | | | 1,927,712 | |
| | |
GFH Financial Group BSC | | | 8,992,415 | | | | 2,409,056 | |
| | |
Ithmaar Holding BSC(1) | | | 14,771,027 | | | | 1,365,430 | |
| | |
| | | | | | | $ | 11,481,067 | |
|
| Bangladesh — 0.8% | |
| | |
ACI, Ltd. | | | 62,264 | | | $ | 225,576 | |
| | |
Aftab Automobiles, Ltd. | | | 349,827 | | | | 191,244 | |
| | |
Bangladesh Export Import Co., Ltd. | | | 1,512,367 | | | | 456,975 | |
| | |
Bangladesh Submarine Cable Co., Ltd. | | | 192,647 | | | | 325,587 | |
| | |
Beximco Pharmaceuticals, Ltd. | | | 116,421 | | | | 119,514 | |
| | |
BSRM Steels, Ltd. | | | 938,510 | | | | 705,932 | |
| | |
City Bank, Ltd. (The) | | | 414,335 | | | | 162,582 | |
| | |
Grameenphone, Ltd. | | | 239,524 | | | | 1,134,131 | |
| | |
Heidelberger Cement Bangladesh, Ltd. | | | 146,500 | | | | 611,645 | |
| | |
Islami Bank Bangladesh, Ltd. | | | 1,269,074 | | | | 411,349 | |
| | |
Jamuna Oil Co., Ltd. | | | 135,692 | | | | 321,570 | |
| | |
Khulna Power Co., Ltd. | | | 320,573 | | | | 244,515 | |
| | |
LankaBangla Finance, Ltd. | | | 829,367 | | | | 265,805 | |
| | |
Meghna Petroleum, Ltd. | | | 128,418 | | | | 336,184 | |
| | |
National Bank, Ltd.(1) | | | 3,385,339 | | | | 439,549 | |
| | |
Olympic Industries, Ltd. | | | 458,511 | | | | 1,299,878 | |
| | |
Orion Pharma, Ltd. | | | 258,206 | | | | 115,897 | |
| | |
Padma Oil Co., Ltd. | | | 98,234 | | | | 282,288 | |
| | |
Pubali Bank, Ltd. | | | 1,011,767 | | | | 331,684 | |
| | |
Renata, Ltd. | | | 14,460 | | | | 196,165 | |
| | |
Singer Bangladesh, Ltd. | | | 142,500 | | | | 398,330 | |
| | |
Social Islami Bank, Ltd.(1) | | | 1,070,644 | | | | 219,100 | |
| | |
Southeast Bank, Ltd.(1) | | | 1,875,226 | | | | 381,520 | |
| | | | | | | | |
| Security | | Shares | | | Value | |
|
| Bangladesh (continued) | |
| | |
Square Pharmaceuticals, Ltd. | | | 280,321 | | | $ | 875,903 | |
| | |
Summit Power, Ltd. | | | 912,732 | | | | 456,735 | |
| | |
Titas Gas Transmission & Distribution Co., Ltd. | | | 623,246 | | | | 301,098 | |
| | |
Unique Hotel & Resorts, Ltd. | | | 450,062 | | | | 285,272 | |
| | |
United Airways Bangladesh, Ltd.(1) | | | 6,170,401 | | | | 220,524 | |
| | |
United Commercial Bank, Ltd. | | | 1,220,971 | | | | 276,266 | |
| | |
| | | | | | | $ | 11,592,818 | |
|
| Botswana — 0.6% | |
| | |
Barclays Bank of Botswana, Ltd. | | | 1,539,465 | | | $ | 779,622 | |
| | |
Botswana Insurance Holdings, Ltd. | | | 859,111 | | | | 1,460,065 | |
| | |
First National Bank of Botswana, Ltd. | | | 7,940,100 | | | | 1,899,000 | |
| | |
Letshego Holdings, Ltd. | | | 17,758,614 | | | | 2,814,401 | |
| | |
Sechaba Breweries Holdings, Ltd. | | | 1,220,550 | | | | 2,372,749 | |
| | |
Standard Chartered Bank Botswana, Ltd.(1) | | | 531,120 | | | | 196,175 | |
| | |
| | | | | | | $ | 9,522,012 | |
|
| Brazil — 6.2% | |
| | |
AES Tiete Energia SA | | | 98,400 | | | $ | 314,312 | |
| | |
AMBEV SA | | | 874,450 | | | | 4,198,185 | |
| | |
B2W Cia Digital(1) | | | 55,270 | | | | 757,705 | |
| | |
B3 SA - Brasil Bolsa Balcao | | | 164,000 | | | | 1,415,080 | |
| | |
Banco Bradesco SA, PFC Shares | | | 226,422 | | | | 2,809,788 | |
| | |
Banco do Brasil SA | | | 84,998 | | | | 1,208,597 | |
| | |
BB Seguridade Participacoes SA | | | 51,500 | | | | 438,580 | |
| | |
BR Malls Participacoes SA | | | 146,211 | | | | 583,289 | |
| | |
Bradespar SA, PFC Shares | | | 50,800 | | | | 391,809 | |
| | |
Braskem SA, PFC Shares | | | 26,060 | | | | 373,409 | |
| | |
BRF SA(1) | | | 208,040 | | | | 1,342,746 | |
| | |
CCR SA | | | 472,000 | | | | 1,925,685 | |
| | |
Centrais Eletricas Brasileiras SA, PFC Shares(1) | | | 136,300 | | | | 1,521,005 | |
| | |
Cia Brasileira de Distribuicao, PFC Shares | | | 54,469 | | | | 1,452,825 | |
| | |
Cia de Saneamento Basico do Estado de Sao Paulo | | | 114,160 | | | | 1,357,512 | |
| | |
Cia de Saneamento de Minas Gerais-COPASA | | | 34,800 | | | | 568,773 | |
| | |
Cia de Transmissao de Energia Eletrica Paulista, PFC Shares | | | 16,690 | | | | 359,728 | |
| | |
Cia Energetica de Minas Gerais, PFC Shares | | | 345,255 | | | | 1,311,083 | |
| | |
Cia Energetica de Sao Paulo, Class B, PFC Shares | | | 78,800 | | | | 492,392 | |
| | |
Cia Hering | | | 68,200 | | | | 583,417 | |
| | |
Cia Paranaense de Energia, PFC Shares | | | 59,600 | | | | 577,011 | |
| | |
Cia Siderurgica Nacional SA(1) | | | 81,200 | | | | 227,089 | |
| | |
Cielo SA | | | 1,724,706 | | | | 5,646,246 | |
| | |
Construtora Tenda SA | | | 55,284 | | | | 560,692 | |
| | |
Cosan SA | | | 56,800 | | | | 691,312 | |
| | |
Cyrela Brazil Realty SA Empreendimentos e Participacoes | | | 177,400 | | | | 827,367 | |
| | | | |
| | 7 | | See Notes to Financial Statements. |
Parametric
Emerging Markets Fund
January 31, 2019
Portfolio of Investments — continued
| | | | | | | | |
| Security | | Shares | | | Value | |
|
| Brazil (continued) | |
| | |
Duratex SA | | | 37,558 | | | $ | 126,045 | |
| | |
EDP-Energias do Brasil SA | | | 102,800 | | | | 473,243 | |
| | |
Embraer SA | | | 60,800 | | | | 322,404 | |
| | |
Embraer SA ADR | | | 55,148 | | | | 1,173,549 | |
| | |
Engie Brasil Energia SA | | | 69,650 | | | | 799,203 | |
| | |
Equatorial Energia SA | | | 52,000 | | | | 1,256,800 | |
| | |
Estacio Participacoes SA | | | 124,600 | | | | 1,062,475 | |
| | |
Even Construtora e Incorporadora SA(1) | | | 160,300 | | | | 295,794 | |
| | |
Ez Tec Empreendimentos e Participacoes SA | | | 61,898 | | | | 469,937 | |
| | |
Fleury SA | | | 304,200 | | | | 1,858,296 | |
| | |
Gafisa SA(1) | | | 55,284 | | | | 213,727 | |
| | |
Gerdau SA, PFC Shares | | | 142,400 | | | | 611,033 | |
| | |
Gol Linhas Aereas Inteligentes SA, PFC Shares(1) | | | 30,400 | | | | 206,045 | |
| | |
Hypera SA | | | 177,000 | | | | 1,545,693 | |
| | |
Iochpe Maxion SA | | | 61,000 | | | | 373,807 | |
| | |
Itau Unibanco Holding SA, PFC Shares | | | 291,520 | | | | 3,099,678 | |
| | |
Itausa-Investimentos Itau SA, PFC Shares | | | 328,875 | | | | 1,217,321 | |
| | |
JBS SA | | | 343,825 | | | | 1,422,549 | |
| | |
Klabin SA, PFC Shares | | | 787,900 | | | | 680,491 | |
| | |
Kroton Educacional SA | | | 512,836 | | | | 1,607,182 | |
| | |
Light SA | | | 80,000 | | | | 437,377 | |
| | |
Localiza Rent a Car SA | | | 212,652 | | | | 1,941,575 | |
| | |
LOG Commercial Properties e Participacoes SA(1) | | | 9,877 | | | | 52,133 | |
| | |
Lojas Americanas SA, PFC Shares | | | 187,800 | | | | 1,084,927 | |
| | |
Lojas Renner SA | | | 167,070 | | | | 2,084,252 | |
| | |
Marcopolo SA, PFC Shares | | | 403,000 | | | | 450,823 | |
| | |
Marfrig Global Foods SA(1) | | | 287,155 | | | | 478,697 | |
| | |
Metalurgica Gerdau SA, PFC Shares | | | 111,800 | | | | 228,370 | |
| | |
MRV Engenharia e Participacoes SA | | | 136,900 | | | | 563,035 | |
| | |
Multiplus SA | | | 60,200 | | | | 429,151 | |
| | |
Natura Cosmeticos SA | | | 73,200 | | | | 951,929 | |
| | |
Odontoprev SA | | | 688,600 | | | | 3,086,919 | |
| | |
Petroleo Brasileiro SA, PFC Shares | | | 1,148,900 | | | | 8,057,924 | |
| | |
Qualicorp Consultoria e Corretora de Seguros SA | | | 485,600 | | | | 2,110,320 | |
| | |
Randon SA Implementos e Participacoes, PFC Shares | | | 196,700 | | | | 539,318 | |
| | |
Rumo SA(1) | | | 185,919 | | | | 1,001,675 | |
| | |
Smiles Fidelidade SA | | | 22,500 | | | | 275,759 | |
| | |
Suzano Papel e Celulose SA | | | 77,820 | | | | 981,498 | |
| | |
Telefonica Brasil SA, PFC Shares | | | 415,500 | | | | 5,546,911 | |
| | |
TIM Participacoes SA | | | 968,150 | | | | 3,291,583 | |
| | |
Totvs SA | | | 306,690 | | | | 2,796,806 | |
| | |
Transmissora Alianca de Energia Electrica SA | | | 91,000 | | | | 641,731 | |
| | |
Ultrapar Participacoes SA | | | 88,584 | | | | 1,389,286 | |
| | |
Usinas Siderurgicas de Minas Gerais SA, Class A, PFC Shares | | | 87,850 | | | | 236,293 | |
| | |
Vale SA | | | 381,347 | | | | 4,757,427 | |
| | | | | | | | |
| Security | | Shares | | | Value | |
|
| Brazil (continued) | |
| | |
Valid Solucoes SA | | | 100,870 | | | $ | 577,751 | |
| | |
Weg SA | | | 309,752 | | | | 1,600,057 | |
| | |
| | | | | | | $ | 96,344,436 | |
|
| Bulgaria — 0.1% | |
| | |
CB First Investment Bank AD(1) | | | 235,000 | | | $ | 511,362 | |
| | |
Chimimport AD | | | 329,922 | | | | 373,013 | |
| | |
MonBat AD | | | 60,235 | | | | 272,463 | |
| | |
Petrol AD(1) | | | 25,625 | | | | 11,922 | |
| | |
Sopharma AD | | | 354,600 | | | | 730,382 | |
| | |
| | | | | | | $ | 1,899,142 | |
|
| Chile — 3.0% | |
| | |
AES Gener SA | | | 1,325,140 | | | $ | 402,129 | |
| | |
Aguas Andinas SA, Series A | | | 1,073,898 | | | | 634,710 | |
| | |
Banco de Chile | | | 14,370,869 | | | | 2,279,880 | |
| | |
Banco de Credito e Inversiones SA | | | 24,308 | | | | 1,732,510 | |
| | |
Banco Santander Chile | | | 24,707,062 | | | | 1,992,991 | |
| | |
Cap SA | | | 56,612 | | | | 611,164 | |
| | |
Cencosud SA | | | 1,099,117 | | | | 2,220,692 | |
| | |
Cia Cervecerias Unidas SA | | | 131,295 | | | | 1,784,835 | |
| | |
Cia Sud Americana de Vapores SA(1) | | | 14,510,741 | | | | 431,472 | |
| | |
Colbun SA | | | 2,922,868 | | | | 664,086 | |
| | |
Embotelladora Andina SA, Class B, PFC Shares | | | 154,121 | | | | 596,461 | |
| | |
Empresa Nacional de Telecomunicaciones SA | | | 191,089 | | | | 1,840,958 | |
| | |
Empresas CMPC SA | | | 710,444 | | | | 2,567,478 | |
| | |
Empresas COPEC SA | | | 396,674 | | | | 5,443,834 | |
| | |
Enel Americas SA | | | 10,652,906 | | | | 2,176,715 | |
| | |
Enel Chile SA | | | 9,679,267 | | | | 1,019,880 | |
| | |
Engie Energia Chile SA | | | 229,055 | | | | 461,044 | |
| | |
Forus SA | | | 87,698 | | | | 264,110 | |
| | |
Inversiones Aguas Metropolitanas SA | | | 218,715 | | | | 340,179 | |
| | |
Inversiones La Construccion SA | | | 27,038 | | | | 502,994 | |
| | |
Itau CorpBanca | | | 91,142,033 | | | | 915,868 | |
| | |
Latam Airlines Group SA | | | 412,844 | | | | 4,934,864 | |
| | |
Parque Arauco SA | | | 541,699 | | | | 1,486,823 | |
| | |
Ripley Corp. SA | | | 721,671 | | | | 643,760 | |
| | |
S.A.C.I. Falabella | | | 580,600 | | | | 4,661,267 | |
| | |
Sociedad Matriz SAAM SA | | | 6,242,812 | | | | 599,912 | |
| | |
Sociedad Quimica y Minera de Chile SA, Series B, PFC Shares | | | 58,504 | | | | 2,493,423 | |
| | |
Sonda SA | | | 736,417 | | | | 1,274,749 | |
| | |
Vina Concha y Toro SA | | | 433,836 | | | | 899,029 | |
| | |
| | | | | | | $ | 45,877,817 | |
| | | | |
| | 8 | | See Notes to Financial Statements. |
Parametric
Emerging Markets Fund
January 31, 2019
Portfolio of Investments — continued
| | | | | | | | |
| Security | | Shares | | | Value | |
|
| China — 11.6% | |
| | |
3SBio, Inc.(2) | | | 954,500 | | | $ | 1,598,972 | |
| | |
AECC Aviation Power Co., Ltd. | | | 40,221 | | | | 132,459 | |
| | |
Agile Group Holdings, Ltd. | | | 254,000 | | | | 337,545 | |
| | |
Agricultural Bank of China, Ltd., Class H | | | 1,832,000 | | | | 867,364 | |
| | |
Aier Eye Hospital Group Co., Ltd., Class A | | | 30,246 | | | | 123,215 | |
| | |
Air China, Ltd., Class H | | | 938,000 | | | | 939,070 | |
| | |
Aisino Corp. | | | 38,800 | | | | 141,715 | |
| | |
Alibaba Group Holding, Ltd. ADR(1) | | | 15,200 | | | | 2,561,048 | |
| | |
Aluminum Corp. of China, Ltd., Class H(1) | | | 3,986,000 | | | | 1,471,807 | |
| | |
Angang Steel Co., Ltd., Class H | | | 968,000 | | | | 728,174 | |
| | |
Anhui Conch Cement Co., Ltd., Class H | | | 653,500 | | | | 3,563,754 | |
| | |
ANTA Sports Products, Ltd. | | | 213,000 | | | | 1,101,840 | |
| | |
AVIC Aircraft Co., Ltd., Class A | | | 125,600 | | | | 261,329 | |
| | |
Baidu, Inc. ADR(1) | | | 11,300 | | | | 1,950,719 | |
| | |
Bank of Beijing Co., Ltd. | | | 182,760 | | | | 163,401 | |
| | |
Bank of China, Ltd., Class H | | | 2,420,000 | | | | 1,125,159 | |
| | |
Bank of Communications, Ltd., Class H | | | 1,053,900 | | | | 895,875 | |
| | |
Bank of Nanjing Co., Ltd. | | | 169,400 | | | | 177,191 | |
| | |
Bank of Ningbo Co., Ltd., Class A | | | 67,000 | | | | 175,228 | |
| | |
Beijing Capital International Airport Co., Ltd., Class H | | | 436,000 | | | | 408,970 | |
| | |
Beijing Enterprises Holdings, Ltd. | | | 171,500 | | | | 974,932 | |
| | |
Beijing Enterprises Water Group, Ltd. | | | 2,088,000 | | | | 1,209,045 | |
| | |
Beijing Orient Landscape & Environment Co., Ltd., Class A | | | 79,000 | | | | 71,260 | |
| | |
Beijing Originwater Technology Co., Ltd., Class A | | | 127,500 | | | | 135,871 | |
| | |
Beijing Sanju Environmental Protection and New Material Co., Ltd., Class A | | | 98,410 | | | | 108,447 | |
| | |
Beijing Tongrentang Co., Ltd. | | | 22,000 | | | | 86,744 | |
| | |
Beijing Water Business Doctor Co., Ltd., Class A | | | 101,700 | | | | 100,776 | |
| | |
Beijing Xinwei Technology Group Co., Ltd.(1)(3) | | | 93,610 | | | | 0 | |
| | |
Beiqi Foton Motor Co., Ltd. | | | 407,100 | | | | 104,134 | |
| | |
BOE Technology Group Co., Ltd., Class A | | | 514,900 | | | | 198,018 | |
| | |
Brilliance China Automotive Holdings, Ltd. | | | 1,086,000 | | | | 1,028,257 | |
| | |
BYD Co., Ltd., Class H | | | 207,700 | | | | 1,229,285 | |
| | |
Cangzhou Mingzhu Plastic Co., Ltd., Class A | | | 135,226 | | | | 81,321 | |
| | |
CGN Power Co., Ltd., Class H(2) | | | 4,108,000 | | | | 1,075,010 | |
| | |
Changchun High & New Technology Industry Group, Inc., Class A | | | 7,000 | | | | 195,064 | |
| | |
Changjiang Securities Co., Ltd., Class A | | | 213,800 | | | | 170,351 | |
| | |
Chengdu Xingrong Environment Co., Ltd., Class A | | | 243,600 | | | | 154,773 | |
| | |
China Agri-Industries Holdings, Ltd. | | | 2,074,000 | | | | 738,413 | |
| | |
China Biologic Products Holdings, Inc.(1) | | | 20,100 | | | | 1,631,919 | |
| | |
China Bluechemical, Ltd., Class H | | | 1,270,000 | | | | 414,054 | |
| | |
China Cinda Asset Management Co., Ltd., Class H | | | 1,495,000 | | | | 386,854 | |
| | |
China CITIC Bank Corp., Ltd., Class H | | | 343,000 | | | | 223,463 | |
| | |
China Coal Energy Co., Ltd., Class H | | | 1,058,000 | | | | 446,921 | |
| | |
China Communications Construction Co., Ltd., Class H | | | 1,087,000 | | | | 1,090,729 | |
| | | | | | | | |
| Security | | Shares | | | Value | |
|
| China (continued) | |
| | |
China Communications Services Corp., Ltd., Class H | | | 658,000 | | | $ | 617,743 | |
| | |
China Construction Bank Corp., Class H | | | 2,573,630 | | | | 2,318,329 | |
| | |
China Dongxiang Group Co., Ltd. | | | 4,257,000 | | | | 647,090 | |
| | |
China Everbright Bank Co., Ltd. | | | 174,500 | | | | 106,884 | |
| | |
China Everbright International, Ltd. | | | 373,925 | | | | 377,599 | |
| | |
China Everbright, Ltd. | | | 186,000 | | | | 350,996 | |
| | |
China Evergrande Group | | | 354,000 | | | | 1,116,571 | |
| | |
China Fortune Land Development Co., Ltd. | | | 52,329 | | | | 213,979 | |
| | |
China Gas Holdings, Ltd. | | | 619,800 | | | | 1,978,408 | |
| | |
China Gezhouba Group Co., Ltd. | | | 152,700 | | | | 141,042 | |
| | |
China Huishan Dairy Holdings Co., Ltd.(1)(3) | | | 1,800,000 | | | | 0 | |
| | |
China International Marine Containers Co., Ltd. | | | 482,672 | | | | 517,236 | |
| | |
China International Travel Service Corp., Ltd. | | | 16,300 | | | | 133,384 | |
| | |
China Life Insurance Co., Ltd., Class H | | | 335,000 | | | | 831,877 | |
| | |
China Longyuan Power Group Corp., Ltd., Class H | | | 1,260,000 | | | | 943,240 | |
| | |
China Mengniu Dairy Co., Ltd. | | | 816,000 | | | | 2,527,447 | |
| | |
China Merchants Bank Co., Ltd., Class H | | | 441,524 | | | | 1,946,570 | |
| | |
China Merchants Port Holdings Co., Ltd. | | | 318,035 | | | | 630,644 | |
| | |
China Merchants Shekou Industrial Zone Holdings Co., Ltd., Class A | | | 74,674 | | | | 216,102 | |
| | |
China Minsheng Banking Corp., Ltd., Class H | | | 1,109,788 | | | | 850,192 | |
| | |
China Mobile, Ltd. | | | 224,000 | | | | 2,355,883 | |
| | |
China Molybdenum Co., Ltd., Class H | | | 2,058,000 | | | | 838,424 | |
| | |
China National Building Material Co., Ltd., Class H | | | 1,138,000 | | | | 908,122 | |
| | |
China National Nuclear Power Co., Ltd. | | | 210,800 | | | | 169,858 | |
| | |
China Northern Rare Earth Group High-Tech Co., Ltd. | | | 117,100 | | | | 150,072 | |
| | |
China Oilfield Services, Ltd., Class H | | | 698,000 | | | | 691,680 | |
| | |
China Overseas Land & Investment, Ltd. | | | 554,160 | | | | 2,090,364 | |
| | |
China Pacific Insurance (Group) Co., Ltd., Class H | | | 196,400 | | | | 691,608 | |
| | |
China Petroleum & Chemical Corp., Class H | | | 4,722,300 | | | | 3,948,760 | |
| | |
China Railway Construction Corp., Ltd., Class H | | | 876,000 | | | | 1,216,491 | |
| | |
China Railway Group, Ltd., Class H | | | 1,385,000 | | | | 1,297,046 | |
| | |
China Resources Beer Holdings Co., Ltd. | | | 408,000 | | | | 1,434,018 | |
| | |
China Resources Gas Group, Ltd. | | | 328,000 | | | | 1,290,715 | |
| | |
China Resources Land, Ltd. | | | 392,000 | | | | 1,529,492 | |
| | |
China Resources Medical Holdings Co., Ltd. | | | 355,000 | | | | 248,477 | |
| | |
China Resources Power Holdings Co., Ltd. | | | 675,600 | | | | 1,354,126 | |
| | |
China Shenhua Energy Co., Ltd., Class H | | | 837,000 | | | | 2,130,224 | |
| | |
China Shineway Pharmaceutical Group, Ltd. | | | 381,000 | | | | 446,933 | |
| | |
China Shipbuilding Industry Co., Ltd. | | | 185,800 | | | | 119,578 | |
| | |
China Southern Airlines Co., Ltd., Class H | | | 564,000 | | | | 404,162 | |
| | |
China State Construction Engineering Corp., Ltd. | | | 156,440 | | | | 143,351 | |
| | |
China Taiping Insurance Holdings Co., Ltd. | | | 110,200 | | | | 304,210 | |
| | |
China Telecom Corp., Ltd., Class H | | | 1,120,000 | | | | 608,071 | |
| | |
China Travel International Investment Hong Kong, Ltd. | | | 1,998,000 | | | | 578,615 | |
| | |
China Unicom (Hong Kong), Ltd. | | | 356,372 | | | | 408,216 | |
| | |
China United Network Communications, Ltd., Class A | | | 711,800 | | | | 566,423 | |
| | | | |
| | 9 | | See Notes to Financial Statements. |
Parametric
Emerging Markets Fund
January 31, 2019
Portfolio of Investments — continued
| | | | | | | | |
| Security | | Shares | | | Value | |
|
| China (continued) | |
| | |
China Vanke Co., Ltd., Class H | | | 742,520 | | | $ | 3,010,987 | |
| | |
China Yangtze Power Co., Ltd. | | | 162,200 | | | | 398,562 | |
| | |
Chongqing Changan Automobile Co., Ltd., Class A | | | 98,800 | | | | 111,195 | |
| | |
CIFI Holdings Group Co., Ltd. | | | 772,000 | | | | 510,802 | |
| | |
CITIC Guoan Information Industry Co., Ltd., Class A | | | 138,800 | | | | 68,623 | |
| | |
CITIC, Ltd. | | | 813,000 | | | | 1,231,585 | |
| | |
CNOOC, Ltd. | | | 2,111,000 | | | | 3,528,367 | |
| | |
COFCO Tunhe Sugar Co., Ltd. | | | 118,100 | | | | 122,221 | |
| | |
COSCO SHIPPING Development Co., Ltd., Class H(1) | | | 4,252,000 | | | | 490,569 | |
| | |
COSCO SHIPPING Energy Transportation Co., Ltd., Class H | | | 912,000 | | | | 518,650 | |
| | |
COSCO SHIPPING Holdings Co., Ltd., Class H(1) | | | 1,482,975 | | | | 601,512 | |
| | |
COSCO SHIPPING Ports, Ltd. | | | 516,000 | | | | 538,589 | |
| | |
Country Garden Holdings Co., Ltd. | | | 1,086,631 | | | | 1,544,638 | |
| | |
Country Garden Services Holdings Co., Ltd.(1) | | | 155,589 | | | | 241,023 | |
| | |
CSPC Pharmaceutical Group, Ltd. | | | 1,192,000 | | | | 2,056,429 | |
| | |
Ctrip.com International, Ltd. ADR(1) | | | 43,354 | | | | 1,443,688 | |
| | |
Daqin Railway Co., Ltd. | | | 104,300 | | | | 133,360 | |
| | |
Datang International Power Generation Co., Ltd., Class H | | | 3,294,000 | | | | 859,676 | |
| | |
Dong-E-E-Jiao Co., Ltd., Class A | | | 16,200 | | | | 99,407 | |
| | |
Dongfeng Motor Group Co., Ltd., Class H | | | 1,128,000 | | | | 1,182,526 | |
| | |
Dr Peng Telecom & Media Group Co., Ltd. | | | 104,900 | | | | 119,698 | |
| | |
East Money Information Co., Ltd., Class A | | | 113,760 | | | | 219,956 | |
| | |
Financial Street Holdings Co., Ltd., Class A | | | 144,798 | | | | 152,631 | |
| | |
Focus Media Information Technology Co., Ltd., Class A | | | 196,344 | | | | 160,685 | |
| | |
Fullshare Holdings, Ltd. | | | 1,662,500 | | | | 377,692 | |
| | |
GD Power Development Co., Ltd. | | | 269,900 | | | | 96,771 | |
| | |
Gemdale Corp. | | | 80,700 | | | | 132,698 | |
| | |
GoerTek, Inc., Class A | | | 63,700 | | | | 63,577 | |
| | |
Golden Eagle Retail Group, Ltd. | | | 739,000 | | | | 782,502 | |
| | |
Great Wall Motor Co., Ltd., Class H | | | 1,771,500 | | | | 1,206,013 | |
| | |
Gree Electric Appliances, Inc. of Zhuhai, Class A(1) | | | 46,500 | | | | 290,678 | |
| | |
Guangdong Baolihua New Energy Stock Co., Ltd., Class A | | | 255,400 | | | | 244,428 | |
| | |
Guangdong Investment, Ltd. | | | 784,000 | | | | 1,497,188 | |
| | |
Guangzhou Automobile Group Co., Ltd., Class H | | | 579,218 | | | | 629,080 | |
| | |
Guangzhou Baiyunshan Pharmaceutical Holdings Co., Ltd., Class H | | | 320,000 | | | | 1,237,634 | |
| | |
Guangzhou R&F Properties Co., Ltd., Class H | | | 302,000 | | | | 602,470 | |
| | |
Guosen Securities Co., Ltd., Class A | | | 117,628 | | | | 147,126 | |
| | |
Guoyuan Securities Co., Ltd., Class A | | | 113,850 | | | | 127,552 | |
| | |
Haier Electronics Group Co., Ltd. | | | 161,000 | | | | 462,525 | |
| | |
Han’s Laser Technology Industry Group Co., Ltd., Class A | | | 42,100 | | | | 200,192 | |
| | |
Hangzhou Hikvision Digital Technology Co., Ltd., Class A | | | 70,700 | | | | 319,049 | |
| | | | | | | | |
| Security | | Shares | | | Value | |
|
| China (continued) | |
| | |
Harbin Pharmaceutical Group Co., Ltd. | | | 150,900 | | | $ | 81,661 | |
| | |
Henan Shuanghui Investment & Development Co., Ltd., Class A | | | 34,200 | | | | 127,834 | |
| | |
Hengan International Group Co., Ltd. | | | 271,500 | | | | 2,123,930 | |
| | |
Hengtong Optic-electric Co., Ltd. | | | 38,780 | | | | 100,984 | |
| | |
Hesteel Co., Ltd., Class A | | | 506,400 | | | | 232,576 | |
| | |
Huadian Power International Corp., Ltd., Class H | | | 1,100,000 | | | | 512,145 | |
| | |
Huadong Medicine Co., Ltd., Class A | | | 47,211 | | | | 187,849 | |
| | |
Huaneng Power International, Inc., Class H | | | 3,390,000 | | | | 2,130,762 | |
| | |
Huaneng Renewables Corp., Ltd., Class H | | | 1,716,000 | | | | 494,843 | |
| | |
Huaxia Bank Co., Ltd. | | | 146,972 | | | | 166,525 | |
| | |
Huayu Automotive Systems Co., Ltd. | | | 82,008 | | | | 248,388 | |
| | |
Hubei Energy Group Co., Ltd., Class A | | | 277,714 | | | | 153,884 | |
| | |
Humanwell Healthcare Group Co., Ltd. | | | 69,600 | | | | 97,264 | |
| | |
Hundsun Technologies, Inc. | | | 28,100 | | | | 263,417 | |
| | |
Iflytek Co., Ltd., Class A | | | 34,550 | | | | 141,628 | |
| | |
Industrial & Commercial Bank of China, Ltd., Class H | | | 2,353,000 | | | | 1,827,960 | |
| | |
Industrial Bank Co., Ltd. | | | 97,902 | | | | 240,768 | |
| | |
Inner Mongolia BaoTou Steel Union Co., Ltd. | | | 707,000 | | | | 155,553 | |
| | |
Inner Mongolia Yili Industrial Group Co., Ltd., Class A | | | 92,700 | | | | 336,502 | |
| | |
JD.com, Inc. ADR(1) | | | 33,900 | | | | 842,415 | |
| | |
Jiangsu Changjiang Electronics Technology Co., Ltd. | | | 76,300 | | | | 101,793 | |
| | |
Jiangsu Expressway Co., Ltd., Class H | | | 428,000 | | | | 619,640 | |
| | |
Jiangsu Hengrui Medicine Co., Ltd. | | | 36,432 | | | | 322,982 | |
| | |
Jiangsu Yanghe Brewery Joint-Stock Co., Ltd., Class A | | | 14,600 | | | | 206,987 | |
| | |
Jiangxi Copper Co., Ltd., Class H | | | 925,000 | | | | 1,175,984 | |
| | |
Jiangxi Ganfeng Lithium Co., Ltd., Class A | | | 51,150 | | | | 149,202 | |
| | |
Jilin Aodong Pharmaceutical Group Co., Ltd., Class A | | | 60,400 | | | | 133,215 | |
| | |
Jinke Properties Group Co., Ltd., Class A | | | 265,299 | | | | 226,907 | |
| | |
Jinyu Bio-Technology Co., Ltd. | | | 43,862 | | | | 93,304 | |
| | |
Jizhong Energy Resources Co., Ltd., Class A | | | 231,400 | | | | 128,168 | |
| | |
Kaidi Ecological and Environmental Technology Co., Ltd., Class A(1) | | | 297,600 | | | | 42,612 | |
| | |
Kangde Xin Composite Material Group Co., Ltd., Class A | | | 76,700 | | | | 48,822 | |
| | |
Kangmei Pharmaceutical Co., Ltd. | | | 61,700 | | | | 53,963 | |
| | |
Kingboard Holdings., Ltd. | | | 256,100 | | | | 901,151 | |
| | |
Kingfa Sci & Tech Co., Ltd. | | | 171,338 | | | | 117,604 | |
| | |
Kunlun Energy Co., Ltd. | | | 668,000 | | | | 713,643 | |
| | |
Kweichow Moutai Co., Ltd. | | | 5,700 | | | | 588,740 | |
| | |
KWG Group Holdings, Ltd. | | | 476,000 | | | | 471,214 | |
| | |
Lee & Man Paper Manufacturing, Ltd. | | | 788,000 | | | | 704,802 | |
| | |
Lenovo Group, Ltd. | | | 1,316,000 | | | | 960,747 | |
| | |
Lepu Medical Technology Beijing Co., Ltd., Class A | | | 69,200 | | | | 210,844 | |
| | |
Li Ning Co., Ltd.(1) | | | 774,208 | | | | 952,605 | |
| | |
Liaoning Cheng Da Co., Ltd. | | | 72,100 | | | | 107,021 | |
| | |
Longfor Group Holdings, Ltd. | | | 316,500 | | | | 986,229 | |
| | | | |
| | 10 | | See Notes to Financial Statements. |
Parametric
Emerging Markets Fund
January 31, 2019
Portfolio of Investments — continued
| | | | | | | | |
| Security | | Shares | | | Value | |
|
| China (continued) | |
| | |
LONGi Green Energy Technology Co., Ltd. | | | 46,340 | | | $ | 154,283 | |
| | |
Luxshare Precision Industry Co., Ltd., Class A | | | 71,110 | | | | 175,202 | |
| | |
Luye Pharma Group, Ltd.(2) | | | 496,500 | | | | 370,982 | |
| | |
Luzhou Laojiao Co., Ltd., Class A | | | 27,300 | | | | 174,764 | |
| | |
Maanshan Iron & Steel Co., Ltd., Class H | | | 1,832,000 | | | | 879,318 | |
| | |
Midea Group Co., Ltd., Class A | | | 60,900 | | | | 396,838 | |
| | |
NARI Technology Co., Ltd. | | | 48,600 | | | | 139,240 | |
| | |
NetEase, Inc. ADR | | | 5,100 | | | | 1,284,843 | |
| | |
New Oriental Education & Technology Group, Inc. ADR(1) | | | 21,700 | | | | 1,671,768 | |
| | |
Nine Dragons Paper Holdings, Ltd. | | | 615,000 | | | | 628,521 | |
| | |
O-film Tech Co., Ltd., Class A | | | 65,800 | | | | 99,282 | |
| | |
Oceanwide Holdings Co., Ltd., Class A | | | 204,000 | | | | 140,281 | |
| | |
Offshore Oil Engineering Co., Ltd. | | | 217,300 | | | | 170,038 | |
| | |
Oriental Energy Co., Ltd., Class A | | | 132,900 | | | | 158,514 | |
| | |
PetroChina Co., Ltd., Class H | | | 4,840,000 | | | | 3,123,807 | |
| | |
Ping An Bank Co., Ltd., Class A | | | 151,588 | | | | 252,904 | |
| | |
Ping An Insurance (Group) Co. of China, Ltd., Class H | | | 315,500 | | | | 3,071,569 | |
| | |
Pingdingshan Tianan Coal Mining Co., Ltd.(1) | | | 262,600 | | | | 139,971 | |
| | |
Poly Developments and Holdings Group Co., Ltd., Class A | | | 179,100 | | | | 346,569 | |
| | |
Poly Property Group Co., Ltd. | | | 2,078,000 | | | | 736,716 | |
| | |
Power Construction Corp. of China, Ltd. | | | 187,000 | | | | 139,958 | |
| | |
Qingdao Haier Co., Ltd. | | | 66,800 | | | | 160,286 | |
| | |
RiseSun Real Estate Development Co., Ltd., Class A | | | 163,200 | | | | 224,889 | |
| | |
SAIC Motor Corp., Ltd. | | | 82,400 | | | | 328,203 | |
| | |
Sanan Optoelectronics Co., Ltd. | | | 84,900 | | | | 125,036 | |
| | |
Sany Heavy Industry Co., Ltd. | | | 122,300 | | | | 167,326 | |
| | |
SDIC Power Holdings Co., Ltd. | | | 98,000 | | | | 119,075 | |
| | |
Semiconductor Manufacturing International Corp.(1) | | | 787,700 | | | | 744,358 | |
| | |
Shandong Gold Mining Co., Ltd. | | | 42,500 | | | | 194,710 | |
| | |
Shandong Weigao Group Medical Polymer Co., Ltd., Class H | | | 1,720,000 | | | | 1,441,124 | |
| | |
Shanghai Electric Group Co., Ltd., Class H | | | 1,792,000 | | | | 626,639 | |
| | |
Shanghai Industrial Holdings, Ltd. | | | 204,000 | | | | 429,671 | |
| | |
Shanghai Oriental Pearl Group Co., Ltd., Class A | | | 75,920 | | | | 112,217 | |
| | |
Shanghai Pudong Development Bank Co., Ltd., Class A | | | 136,500 | | | | 219,740 | |
| | |
Shanghai Zhangjiang High-Tech Park Development Co., Ltd., Class A | | | 75,395 | | | | 156,560 | |
| | |
Shanxi Lu’an Environmental Energy Development Co., Ltd. | | | 152,200 | | | | 158,323 | |
| | |
Shanxi Xishan Coal & Electricity Power Co., Ltd., Class A | | | 152,700 | | | | 125,119 | |
| | |
Shenwan Hongyuan Group Co., Ltd., Class A | | | 198,901 | | | | 131,456 | |
| | |
Shenzhen Inovance Technology Co., Ltd., Class A | | | 56,300 | | | | 183,365 | |
| | |
Shenzhen Investment, Ltd. | | | 674,000 | | | | 235,108 | |
| | | | | | | | |
| Security | | Shares | | | Value | |
|
| China (continued) | |
| | |
Shenzhen Overseas Chinese Town Co., Ltd., Class A | | | 176,600 | | | $ | 169,550 | |
| | |
Shenzhen Zhongjin Lingnan Nonfemet Co., Ltd., Class A | | | 171,300 | | | | 103,716 | |
| | |
Shimao Property Holdings, Ltd. | | | 227,000 | | | | 646,417 | |
| | |
Siasun Robot & Automation Co., Ltd., Class A | | | 55,000 | | | | 112,069 | |
| | |
Sichuan Chuantou Energy Co., Ltd. | | | 152,000 | | | | 206,674 | |
| | |
Sihuan Pharmaceutical Holdings Group, Ltd. | | | 3,161,000 | | | | 667,442 | |
| | |
SINA Corp.(1) | | | 11,900 | | | | 730,898 | |
| | |
Sino Biopharmaceutical, Ltd. | | | 2,445,000 | | | | 2,068,320 | |
| | |
Sino-Ocean Group Holding, Ltd. | | | 1,455,500 | | | | 715,394 | |
| | |
Sinopec Shanghai Petrochemical Co., Ltd., Class H | | | 2,375,000 | | | | 1,128,455 | |
| | |
Sinopharm Group Co., Ltd., Class H | | | 479,200 | | | | 2,141,580 | |
| | |
Sun Art Retail Group, Ltd. | | | 1,011,500 | | | | 1,005,349 | |
| | |
Sunac China Holdings, Ltd. | | | 406,000 | | | | 1,617,061 | |
| | |
Suning.com Co., Ltd, Class A | | | 69,200 | | | | 108,061 | |
| | |
Tasly Pharmaceutical Group Co., Ltd. | | | 46,760 | | | | 126,470 | |
| | |
TCL Corp., Class A | | | 373,200 | | | | 153,474 | |
| | |
Tencent Holdings, Ltd. | | | 168,702 | | | | 7,509,699 | |
| | |
Tencent Music Entertainment Group ADR(1) | | | 43 | | | | 1,875 | |
| | |
Tianqi Lithium Corp., Class A | | | 44,850 | | | | 180,866 | |
| | |
Tingyi (Cayman Islands) Holding Corp. | | | 838,000 | | | | 1,167,040 | |
| | |
Tonghua Dongbao Pharmaceutical Co., Ltd. | | | 30,168 | | | | 50,610 | |
| | |
Tongling Nonferrous Metals Group Co., Ltd., Class A | | | 776,200 | | | | 229,943 | |
| | |
Tsinghua Tongfang Co., Ltd. | | | 100,600 | | | | 129,130 | |
| | |
Tsingtao Brewery Co., Ltd., Class H | | | 324,000 | | | | 1,425,742 | |
| | |
Tus-Sound Environmental Resources Co., Ltd., Class A | | | 65,660 | | | | 90,380 | |
| | |
Wanhua Chemical Group Co., Ltd. | | | 19,665 | | | | 96,645 | |
| | |
Want Want China Holdings, Ltd. | | | 2,409,000 | | | | 1,952,289 | |
| | |
Weichai Power Co., Ltd., Class H | | | 887,600 | | | | 1,197,938 | |
| | |
Wens Foodstuffs Group Co., Ltd., Class A | | | 100,500 | | | | 417,543 | |
| | |
West China Cement, Ltd. | | | 3,420,000 | | | | 489,793 | |
| | |
Western Mining Co., Ltd. | | | 169,300 | | | | 137,490 | |
| | |
WH Group, Ltd.(2) | | | 3,233,000 | | | | 2,772,414 | |
| | |
Wintime Energy Co., Ltd.(1) | | | 327,670 | | | | 77,181 | |
| | |
Wuliangye Yibin Co., Ltd., Class A | | | 36,700 | | | | 332,078 | |
| | |
Xinhu Zhongbao Co., Ltd. | | | 301,800 | | | | 127,843 | |
| | |
Yang Quan Coal Industry Group Co., Ltd. | | | 189,300 | | | | 144,186 | |
| | |
Yango Group Co., Ltd., Class A | | | 206,192 | | | | 174,143 | |
| | |
Yangzijiang Shipbuilding Holdings, Ltd. | | | 326,900 | | | | 341,660 | |
| | |
Yanzhou Coal Mining Co., Ltd., Class H | | | 518,000 | | | | 476,241 | |
| | |
Yonghui Superstores Co., Ltd. | | | 124,700 | | | | 150,439 | |
| | |
Youngor Group Co., Ltd. | | | 132,440 | | | | 150,531 | |
| | |
Yuan Longping High-tech Agriculture Co., Ltd., Class A | | | 65,900 | | | | 123,556 | |
| | |
Yuexiu Property Co., Ltd. | | | 1,590,000 | | | | 309,077 | |
| | |
Yunnan Baiyao Group Co., Ltd., Class A | | | 21,200 | | | | 246,835 | |
| | | | |
| | 11 | | See Notes to Financial Statements. |
Parametric
Emerging Markets Fund
January 31, 2019
Portfolio of Investments — continued
| | | | | | | | |
| Security | | Shares | | | Value | |
|
| China (continued) | |
| | |
Yunnan Chihong Zinc & Germanium Co., Ltd. | | | 160,600 | | | $ | 99,909 | |
| | |
Zhaojin Mining Industry Co., Ltd., Class H | | | 372,500 | | | | 391,037 | |
| | |
Zhejiang China Commodities City Group Co., Ltd. | | | 167,200 | | | | 89,794 | |
| | |
Zhejiang Dahua Technology Co., Ltd., Class A | | | 69,550 | | | | 129,232 | |
| | |
Zhejiang Expressway Co., Ltd., Class H | | | 566,000 | | | | 582,764 | |
| | |
Zhejiang Huahai Pharmaceutical Co., Ltd. | | | 37,500 | | | | 57,700 | |
| | |
Zhejiang Wanfeng Auto Wheel Co., Ltd., Class A | | | 84,800 | | | | 90,941 | |
| | |
Zhejiang Zheneng Electric Power Co., Ltd. | | | 246,600 | | | | 164,834 | |
| | |
Zhengzhou Yutong Bus Co., Ltd. | | | 66,400 | | | | 114,974 | |
| | |
Zhongjin Gold Corp., Ltd. | | | 115,900 | | | | 137,075 | |
| | |
Zhongtian Financial Group Co., Ltd., Class A | | | 315,000 | | | | 148,915 | |
| | |
Zhuzhou CRRC Times Electric Co., Ltd., Class H | | | 89,500 | | | | 497,856 | |
| | |
Zijin Mining Group Co., Ltd., Class H | | | 5,360,000 | | | | 2,011,561 | |
| | |
ZTE Corp., Class H(1) | | | 456,103 | | | | 924,772 | |
| | |
| | | | | | | $ | 179,002,383 | |
|
| Colombia — 1.5% | |
| | |
Almacenes Exito SA | | | 313,607 | | | $ | 1,424,109 | |
| | |
Avianca Holdings SA, PFC Shares | | | 551,298 | | | | 305,389 | |
| | |
Banco Davivienda SA, PFC Shares | | | 45,448 | | | | 521,664 | |
| | |
Bancolombia SA | | | 114,355 | | | | 1,227,889 | |
| | |
Bancolombia SA ADR, PFC Shares | | | 47,000 | | | | 2,096,200 | |
| | |
Celsia SA ESP | | | 740,070 | | | | 1,021,320 | |
| | |
Cementos Argos SA | | | 487,554 | | | | 1,268,740 | |
| | |
Cementos Argos SA, PFC Shares | | | 148,603 | | | | 320,657 | |
| | |
Cemex Latam Holdings SA(1) | | | 173,596 | | | | 243,761 | |
| | |
Corporacion Financiera Colombiana SA(1) | | | 51,420 | | | | 314,647 | |
| | |
Ecopetrol SA | | | 3,868,755 | | | | 3,638,250 | |
| | |
Grupo Argos SA | | | 346,526 | | | | 2,071,344 | |
| | |
Grupo Argos SA, PFC Shares | | | 51,292 | | | | 256,047 | |
| | |
Grupo Aval Acciones y Valores SA, PFC Shares | | | 1,808,732 | | | | 623,299 | |
| | |
Grupo de Inversiones Suramericana SA | | | 106,459 | | | | 1,182,192 | |
| | |
Grupo de Inversiones Suramericana SA, PFC Shares | | | 48,367 | | | | 515,292 | |
| | |
Grupo Nutresa SA | | | 367,495 | | | | 3,141,165 | |
| | |
Interconexion Electrica SA | | | 674,487 | | | | 3,023,787 | |
| | |
| | | | | | | $ | 23,195,752 | |
|
| Croatia — 0.7% | |
| | |
AD Plastik DD | | | 5,907 | | | $ | 157,812 | |
| | |
Adris Grupa DD, PFC Shares | | | 26,905 | | | | 1,728,088 | |
| | |
Atlantic Grupa DD | | | 1,465 | | | | 266,672 | |
| | |
Atlantska Plovidba DD(1) | | | 4,389 | | | | 211,906 | |
| | |
Ericsson Nikola Tesla DD | | | 5,888 | | | | 913,451 | |
| | |
Hrvatski Telekom DD | | | 100,074 | | | | 2,346,274 | |
| | |
INA Industrija Nafte DD | | | 900 | | | | 436,109 | |
| | |
Koncar-Elektroindustrija DD | | | 4,119 | | | | 385,735 | |
| | | | | | | | |
| Security | | Shares | | | Value | |
|
| Croatia (continued) | |
| | |
Kras DD | | | 4,381 | | | $ | 266,077 | |
| | |
Ledo DD(1)(3) | | | 978 | | | | 0 | |
| | |
Podravka Prehrambena Industrija DD | | | 19,726 | | | | 1,155,788 | |
| | |
Valamar Riviera DD | | | 359,330 | | | | 1,884,310 | |
| | |
Zagrebacka Banka DD | | | 115,125 | | | | 1,052,048 | |
| | |
| | | | | | | $ | 10,804,270 | |
|
| Czech Republic — 0.7% | |
| | |
CEZ AS | | | 197,400 | | | $ | 4,983,053 | |
| | |
Komercni Banka AS | | | 122,188 | | | | 4,926,580 | |
| | |
Philip Morris CR AS | | | 1,978 | | | | 1,271,959 | |
| | |
| | | | | | | $ | 11,181,592 | |
|
| Egypt — 0.7% | |
| | |
Alexandria Mineral Oils Co. | | | 519,744 | | | $ | 166,703 | |
| | |
Commercial International Bank Egypt SAE | | | 584,996 | | | | 2,744,411 | |
| | |
Eastern Tobacco | | | 1,158,450 | | | | 1,100,318 | |
| | |
Egypt Kuwait Holding Co. SAE | | | 501,725 | | | | 637,462 | |
| | |
Egyptian Financial Group-Hermes Holding Co.(1) | | | 264,772 | | | | 255,693 | |
| | |
ElSewedy Electric Co. | | | 1,380,970 | | | | 1,368,500 | |
| | |
Ezz Steel Co SAE(1) | | | 330,083 | | | | 381,787 | |
| | |
Global Telecom Holding SAE(1) | | | 3,850,624 | | | | 953,214 | |
| | |
Juhayna Food Industries | | | 658,122 | | | | 427,868 | |
| | |
Orascom Investment Holding(1) | | | 7,289,225 | | | | 238,712 | |
| | |
Oriental Weavers Co. | | | 383,580 | | | | 234,310 | |
| | |
Palm Hills Developments SAE(1) | | | 2,709,769 | | | | 364,579 | |
| | |
Pioneers Holding for Financial Investments SAE(1) | | | 485,980 | | | | 180,752 | |
| | |
Sidi Kerir Petrochemicals Co. | | | 344,688 | | | | 347,183 | |
| | |
Six of October Development & Investment Co.(1) | | | 382,178 | | | | 331,683 | |
| | |
Talaat Moustafa Group | | | 1,510,986 | | | | 958,642 | |
| | |
Telecom Egypt | | | 576,834 | | | | 462,705 | |
| | |
| | | | | | | $ | 11,154,522 | |
|
| Estonia — 0.6% | |
| | |
AS Merko Ehitus | | | 78,018 | | | $ | 821,824 | |
| | |
AS Tallink Grupp | | | 3,623,652 | | | | 4,520,602 | |
| | |
AS Tallinna Kaubamaja Grupp | | | 192,740 | | | | 1,986,555 | |
| | |
AS Tallinna Vesi | | | 116,590 | | | | 1,413,832 | |
| | |
Nordecon AS | | | 145,374 | | | | 163,272 | |
| | |
| | | | | | | $ | 8,906,085 | |
|
| Ghana — 0.2% | |
| | |
CAL Bank, Ltd.(1) | | | 2,063,694 | | | $ | 374,349 | |
| | |
Ghana Commercial Bank, Ltd. | | | 1,626,918 | | | | 1,370,093 | |
| | | | |
| | 12 | | See Notes to Financial Statements. |
Parametric
Emerging Markets Fund
January 31, 2019
Portfolio of Investments — continued
| | | | | | | | |
| Security | | Shares | | | Value | |
|
| Ghana (continued) | |
| | |
Produce Buying Co., Ltd.(1) | | | 28 | | | $ | 0 | |
| | |
Standard Chartered Bank of Ghana, Ltd.(1) | | | 244,300 | | | | 1,036,860 | |
| | |
| | | | | | | $ | 2,781,302 | |
|
| Greece — 1.4% | |
| | |
Aegean Airlines SA | | | 63,648 | | | $ | 554,446 | |
| | |
Alpha Bank AE(1) | | | 994,698 | | | | 998,028 | |
| | |
Athens Water Supply & Sewage Co. SA | | | 85,511 | | | | 523,168 | |
| | |
Costamare, Inc. | | | 71,719 | | | | 364,333 | |
| | |
Diana Shipping, Inc.(1) | | | 116,290 | | | | 341,893 | |
| | |
Ellaktor SA(1) | | | 260,188 | | | | 412,558 | |
| | |
Eurobank Ergasias SA(1) | | | 668,793 | | | | 418,455 | |
| | |
FF Group(1)(3) | | | 46,335 | | | | 0 | |
| | |
GasLog, Ltd. | | | 44,301 | | | | 794,317 | |
| | |
GEK Terna Holding Real Estate Construction SA(1) | | | 125,544 | | | | 621,870 | |
| | |
Grivalia Properties REIC AE | | | 14,830 | | | | 143,884 | |
| | |
Hellenic Exchanges - Athens Stock Exchange SA | | | 197,541 | | | | 826,883 | |
| | |
Hellenic Petroleum SA | | | 66,399 | | | | 584,315 | |
| | |
Hellenic Telecommunications Organization SA | | | 294,869 | | | | 3,692,933 | |
| | |
Holding Co. ADMIE IPTO SA | | | 236,407 | | | | 426,779 | |
| | |
JUMBO SA | | | 106,682 | | | | 1,743,392 | |
| | |
Motor Oil (Hellas) Corinth Refineries SA | | | 71,410 | | | | 1,781,262 | |
| | |
Mytilineos Holdings SA | | | 136,635 | | | | 1,291,043 | |
| | |
National Bank of Greece SA(1) | | | 576,181 | | | | 647,604 | |
| | |
OPAP SA | | | 198,753 | | | | 1,944,483 | |
| | |
Public Power Corp. SA(1) | | | 211,088 | | | | 315,903 | |
| | |
StealthGas, Inc.(1) | | | 37,397 | | | | 124,906 | |
| | |
Terna Energy SA | | | 60,987 | | | | 416,751 | |
| | |
Titan Cement Co. SA | | | 105,165 | | | | 2,362,144 | |
| | |
Tsakos Energy Navigation, Ltd. | | | 106,400 | | | | 342,608 | |
| | |
| | | | | | | $ | 21,673,958 | |
|
| Hungary — 0.7% | |
| | |
Magyar Telekom Telecommunications PLC | | | 521,442 | | | $ | 881,147 | |
| | |
MOL Hungarian Oil & Gas PLC | | | 294,700 | | | | 3,535,733 | |
| | |
OTP Bank Nyrt | | | 82,600 | | | | 3,407,543 | |
| | |
Richter Gedeon Nyrt. | | | 156,100 | | | | 3,333,697 | |
| | |
| | | | | | | $ | 11,158,120 | |
|
| India — 5.5% | |
| | |
ABB India, Ltd. | | | 19,900 | | | $ | 356,231 | |
| | |
ACC, Ltd. | | | 18,085 | | | | 361,877 | |
| | |
Adani Enterprises, Ltd. | | | 180,900 | | | | 347,289 | |
| | |
Adani Gas, Ltd.(1) | | | 180,900 | | | | 234,646 | |
| | |
Adani Ports and Special Economic Zone, Ltd. | | | 286,020 | | | | 1,364,177 | |
| | | | | | | | |
| Security | | Shares | | | Value | |
|
| India (continued) | |
| | |
Adani Power, Ltd.(1) | | | 556,250 | | | $ | 364,630 | |
| | |
Adani Transmission, Ltd.(1) | | | 227,715 | | | | 683,855 | |
| | |
Aditya Birla Capital, Ltd.(1) | | | 94,280 | | | | 107,595 | |
| | |
Aditya Birla Fashion and Retail, Ltd.(1) | | | 92,050 | | | | 271,892 | |
| | |
Ambuja Cements, Ltd. | | | 191,950 | | | | 567,650 | |
| | |
Asian Paints, Ltd. | | | 57,800 | | | | 1,146,033 | |
| | |
Aurobindo Pharma, Ltd. | | | 18,125 | | | | 200,454 | |
| | |
Axis Bank, Ltd.(1) | | | 66,806 | | | | 678,879 | |
| | |
Bajaj Auto, Ltd. | | | 20,320 | | | | 733,883 | |
| | |
Bank of Baroda(1) | | | 175,282 | | | | 279,347 | |
| | |
Bank of India(1) | | | 109,562 | | | | 160,798 | |
| | |
Bharat Forge, Ltd. | | | 68,789 | | | | 475,967 | |
| | |
Bharat Heavy Electricals, Ltd. | | | 648,450 | | | | 589,963 | |
| | |
Bharat Petroleum Corp., Ltd. | | | 119,072 | | | | 583,116 | |
| | |
Bharti Airtel, Ltd. | | | 881,336 | | | | 3,793,382 | |
| | |
Bharti Infratel, Ltd. | | | 315,991 | | | | 1,319,387 | |
| | |
Biocon, Ltd. | | | 87,659 | | | | 805,127 | |
| | |
Canara Bank(1) | | | 67,631 | | | | 239,429 | |
| | |
CG Power and Industrial Solutions, Ltd.(1) | | | 213,600 | | | | 113,466 | |
| | |
Cipla, Ltd. | | | 131,806 | | | | 958,264 | |
| | |
Coal India, Ltd. | | | 170,799 | | | | 538,513 | |
| | |
Colgate-Palmolive (India), Ltd. | | | 33,518 | | | | 604,612 | |
| | |
Container Corp. of India, Ltd. | | | 102,800 | | | | 948,063 | |
| | |
Crompton Greaves Consumer Electricals, Ltd. | | | 213,600 | | | | 640,817 | |
| | |
Cummins India, Ltd. | | | 49,900 | | | | 560,408 | |
| | |
Dabur India, Ltd. | | | 146,992 | | | | 925,344 | |
| | |
Divi’s Laboratories, Ltd. | | | 31,384 | | | | 668,011 | |
| | |
DLF, Ltd. | | | 327,850 | | | | 762,048 | |
| | |
Dr. Reddy’s Laboratories, Ltd. | | | 29,945 | | | | 1,145,209 | |
| | |
Eicher Motors, Ltd. | | | 2,146 | | | | 575,077 | |
| | |
GAIL (India), Ltd. | | | 278,493 | | | | 1,306,868 | |
| | |
GlaxoSmithKline Pharmaceuticals, Ltd. | | | 17,360 | | | | 343,936 | |
| | |
Glenmark Pharmaceuticals, Ltd. | | | 61,248 | | | | 563,227 | |
| | |
GMR Infrastructure, Ltd.(1) | | | 1,721,400 | | | | 372,880 | |
| | |
Godrej Consumer Products, Ltd. | | | 33,317 | | | | 333,321 | |
| | |
Grasim Industries, Ltd. | | | 67,343 | | | | 682,653 | |
| | |
Gujarat State Petronet, Ltd. | | | 176,208 | | | | 441,701 | |
| | |
Havells India, Ltd. | | | 40,009 | | | | 402,851 | |
| | |
HCL Technologies, Ltd. | | | 63,623 | | | | 901,899 | |
| | |
HDFC Bank, Ltd. | | | 72,123 | | | | 2,103,711 | |
| | |
Hero MotoCorp, Ltd. | | | 17,877 | | | | 661,089 | |
| | |
Hindalco Industries, Ltd. | | | 182,020 | | | | 536,655 | |
| | |
Hindustan Petroleum Corp., Ltd. | | | 81,188 | | | | 269,557 | |
| | |
Hindustan Unilever, Ltd. | | | 108,191 | | | | 2,672,800 | |
| | |
Hindustan Zinc, Ltd. | | | 103,100 | | | | 381,174 | |
| | |
Housing Development Finance Corp., Ltd. | | | 67,502 | | | | 1,826,029 | |
| | | | |
| | 13 | | See Notes to Financial Statements. |
Parametric
Emerging Markets Fund
January 31, 2019
Portfolio of Investments — continued
| | | | | | | | |
| Security | | Shares | | | Value | |
|
| India (continued) | |
| | |
ICICI Bank, Ltd. | | | 136,725 | | | $ | 702,849 | |
| | |
IDBI Bank, Ltd.(1) | | | 161,700 | | | | 126,248 | |
| | |
IDFC Bank, Ltd.(1) | | | 260,034 | | | | 165,392 | |
| | |
IDFC, Ltd. | | | 260,034 | | | | 145,810 | |
| | |
Indiabulls Housing Finance, Ltd. | | | 19,115 | | | | 178,786 | |
| | |
Indiabulls Real Estate, Ltd.(1) | | | 228,961 | | | | 236,846 | |
| | |
Indian Hotels Co., Ltd. (The) | | | 197,136 | | | | 395,156 | |
| | |
Indian Oil Corp., Ltd. | | | 242,425 | | | | 468,116 | |
| | |
Infosys, Ltd. | | | 370,892 | | | | 3,910,829 | |
| | |
ITC, Ltd. | | | 511,495 | | | | 2,003,667 | |
| | |
Jindal Steel & Power, Ltd.(1) | | | 129,924 | | | | 247,993 | |
| | |
JSW Steel, Ltd. | | | 203,796 | | | | 791,042 | |
| | |
Kotak Mahindra Bank, Ltd. | | | 31,020 | | | | 549,037 | |
| | |
Larsen & Toubro, Ltd. | | | 78,408 | | | | 1,444,352 | |
| | |
LIC Housing Finance, Ltd. | | | 13,663 | | | | 86,842 | |
| | |
Lupin, Ltd. | | | 80,300 | | | | 989,382 | |
| | |
Mahindra & Mahindra, Ltd. | | | 121,720 | | | | 1,168,594 | |
| | |
Maruti Suzuki India, Ltd. | | | 17,711 | | | | 1,657,045 | |
| | |
Nestle India, Ltd. | | | 6,323 | | | | 1,022,291 | |
| | |
NTPC, Ltd. | | | 942,277 | | | | 1,854,125 | |
| | |
Oberoi Realty, Ltd. | | | 31,878 | | | | 199,772 | |
| | |
Oil & Natural Gas Corp., Ltd. | | | 334,009 | | | | 662,502 | |
| | |
Oracle Financial Services Software, Ltd. | | | 5,025 | | | | 268,623 | |
| | |
Piramal Enterprises, Ltd. | | | 31,480 | | | | 896,111 | |
| | |
Power Grid Corporation of India, Ltd. | | | 772,100 | | | | 2,051,546 | |
| | |
Reliance Capital, Ltd. | | | 36,735 | | | | 100,367 | |
| | |
Reliance Communications, Ltd.(1) | | | 1,412,060 | | | | 239,661 | |
| | |
Reliance Industries, Ltd. | | | 352,852 | | | | 6,102,445 | |
| | |
Reliance Infrastructure, Ltd. | | | 101,537 | | | | 384,719 | |
| | |
Reliance Power, Ltd.(1) | | | 658,646 | | | | 245,508 | |
| | |
Siemens, Ltd. | | | 47,180 | | | | 684,424 | |
| | |
Sobha, Ltd. | | | 26,300 | | | | 174,064 | |
| | |
State Bank of India(1) | | | 73,106 | | | | 304,156 | |
| | |
Steel Authority of India, Ltd.(1) | | | 513,200 | | | | 341,094 | |
| | |
Sun Pharmaceutical Industries, Ltd. | | | 306,109 | | | | 1,816,396 | |
| | |
Sun TV Network, Ltd. | | | 55,449 | | | | 414,476 | |
| | |
Suzlon Energy, Ltd.(1) | | | 2,099,450 | | | | 142,151 | |
| | |
Tata Communications, Ltd. | | | 127,400 | | | | 896,004 | |
| | |
Tata Consultancy Services, Ltd. | | | 91,269 | | | | 2,583,035 | |
| | |
Tata Global Beverages, Ltd. | | | 74,700 | | | | 213,523 | |
| | |
Tata Motors, Ltd.(1) | | | 208,855 | | | | 532,862 | |
| | |
Tata Power Co., Ltd. (The) | | | 697,463 | | | | 700,492 | |
| | |
Tata Steel, Ltd. | | | 70,165 | | | | 473,065 | |
| | |
Tech Mahindra, Ltd. | | | 57,252 | | | | 589,599 | |
| | |
Titan Co., Ltd. | | | 72,453 | | | | 1,019,900 | |
| | |
UltraTech Cement, Ltd. | | | 19,390 | | | | 961,333 | |
| | | | | | | | |
| Security | | Shares | | | Value | |
|
| India (continued) | |
| | |
Unitech, Ltd.(1) | | | 2,836,900 | | | $ | 64,067 | |
| | |
United Spirits, Ltd.(1) | | | 80,035 | | | | 607,104 | |
| | |
UPL, Ltd. | | | 81,496 | | | | 901,913 | |
| | |
Vedanta, Ltd. | | | 337,085 | | | | 943,705 | |
| | |
Vodafone Idea, Ltd.(1) | | | 1,816,900 | | | | 771,255 | |
| | |
Voltas, Ltd. | | | 110,261 | | | | 839,158 | |
| | |
Wipro, Ltd. | | | 134,983 | | | | 699,926 | |
| | |
Yes Bank, Ltd. | | | 156,523 | | | | 429,506 | |
| | |
Zee Entertainment Enterprises, Ltd. | | | 206,320 | | | | 1,100,425 | |
| | |
| | | | | | | $ | 85,405,079 | |
|
| Indonesia — 3.1% | |
| | |
Adaro Energy Tbk PT | | | 13,411,400 | | | $ | 1,340,262 | |
| | |
AKR Corporindo Tbk PT | | | 1,649,000 | | | | 621,256 | |
| | |
Aneka Tambang Tbk | | | 10,251,500 | | | | 711,951 | |
| | |
Astra Argo Lestari Tbk PT | | | 544,200 | | | | 545,650 | |
| | |
Astra International Tbk PT | | | 8,931,800 | | | | 5,418,491 | |
| | |
Bank Central Asia Tbk PT | | | 1,547,600 | | | | 3,130,661 | |
| | |
Bank Danamon Indonesia Tbk PT | | | 591,903 | | | | 385,998 | |
| | |
Bank Mandiri Persero Tbk PT | | | 2,743,800 | | | | 1,470,468 | |
| | |
Bank Negara Indonesia Persero Tbk PT | | | 1,034,000 | | | | 674,641 | |
| | |
Bank Pan Indonesia Tbk PT(1) | | | 4,945,000 | | | | 499,339 | |
| | |
Bank Pembangunan Daerah Jawa Barat Dan Banten Tbk PT | | | 1,068,100 | | | | 178,390 | |
| | |
Bank Rakyat Indonesia Persero Tbk PT | | | 7,661,900 | | | | 2,123,801 | |
| | |
Bank Tabungan Negara Tbk PT | | | 1,779,800 | | | | 350,655 | |
| | |
Berlian Laju Tanker Tbk PT(1)(3) | | | 7,544,500 | | | | 0 | |
| | |
Bukit Asam Tbk PT | | | 2,764,800 | | | | 855,414 | |
| | |
Bumi Serpong Damai Tbk PT(1) | | | 3,215,100 | | | | 307,142 | |
| | |
Charoen Pokphand Indonesia Tbk PT | | | 2,754,600 | | | | 1,460,095 | |
| | |
Gudang Garam Tbk PT | | | 188,000 | | | | 1,126,096 | |
| | |
Hanson International Tbk PT(1) | | | 23,744,500 | | | | 183,512 | |
| | |
Indo Tambangraya Megah Tbk PT | | | 361,400 | | | | 591,083 | |
| | |
Indocement Tunggal Prakarsa Tbk PT | | | 1,491,100 | | | | 2,055,573 | |
| | |
Indofood Sukses Makmur Tbk PT | | | 1,858,100 | | | | 1,033,512 | |
| | |
Jasa Marga (Persero) Tbk PT | | | 1,900,900 | | | | 672,666 | |
| | |
Kalbe Farma Tbk PT | | | 15,101,700 | | | | 1,730,798 | |
| | |
Lippo Karawaci Tbk PT | | | 6,134,800 | | | | 122,788 | |
| | |
Matahari Department Store Tbk PT | | | 686,300 | | | | 344,995 | |
| | |
Medco Energi Internasional Tbk PT(1) | | | 11,768,600 | | | | 854,051 | |
| | |
Media Nusantara Citra Tbk PT | | | 3,201,000 | | | | 194,236 | |
| | |
Mitra Keluarga Karyasehat Tbk PT(1) | | | 3,345,900 | | | | 361,405 | |
| | |
MNC Investama Tbk PT(1) | | | 49,042,500 | | | | 273,642 | |
| | |
Perusahaan Gas Negara Persero Tbk PT | | | 10,991,700 | | | | 2,030,374 | |
| | |
Perusahaan Perkebunan London Sumatra Indonesia Tbk PT | | | 5,297,700 | | | | 557,623 | |
| | | | |
| | 14 | | See Notes to Financial Statements. |
Parametric
Emerging Markets Fund
January 31, 2019
Portfolio of Investments — continued
| | | | | | | | |
| Security | | Shares | | | Value | |
|
| Indonesia (continued) | |
| | |
PP Persero Tbk PT | | | 3,729,389 | | | $ | 626,800 | |
| | |
Semen Indonesia Persero Tbk PT | | | 2,290,000 | | | | 2,081,023 | |
| | |
Sigmagold Inti Perkasa Tbk PT(1)(3) | | | 17,097,000 | | | | 19,578 | |
| | |
Siloam International Hospitals Tbk PT(1) | | | 2,296,600 | | | | 530,666 | |
| | |
Surya Semesta Internusa Tbk PT | | | 10,457,000 | | | | 365,377 | |
| | |
Telekomunikasi Indonesia Persero Tbk PT | | | 16,703,800 | | | | 4,661,674 | |
| | |
Tower Bersama Infrastructure Tbk PT | | | 1,253,400 | | | | 441,950 | |
| | |
Unilever Indonesia Tbk PT | | | 407,000 | | | | 1,456,275 | |
| | |
United Tractors Tbk PT | | | 931,483 | | | | 1,717,939 | |
| | |
Vale Indonesia Tbk PT(1) | | | 5,222,500 | | | | 1,448,536 | |
| | |
Waskita Karya Persero Tbk PT | | | 4,712,800 | | | | 669,167 | |
| | |
Wijaya Karya Persero Tbk PT | | | 3,456,700 | | | | 470,526 | |
| | |
XL Axiata Tbk PT(1) | | | 2,604,900 | | | | 404,479 | |
| | |
| | | | | | | $ | 47,100,558 | |
|
| Jordan — 0.7% | |
| | |
Al-Eqbal Investment Co. PLC(1) | | | 59,475 | | | $ | 1,132,586 | |
| | |
Arab Bank PLC | | | 558,504 | | | | 4,905,386 | |
| | |
Arab Potash Co. PLC | | | 49,175 | | | | 1,215,755 | |
| | |
Bank of Jordan | | | 119,866 | | | | 419,092 | |
| | |
Cairo Amman Bank | | | 183,573 | | | | 299,778 | |
| | |
Capital Bank of Jordan | | | 243,043 | | | | 343,024 | |
| | |
Jordan Ahli Bank | | | 241,627 | | | | 374,334 | |
| | |
Jordan Islamic Bank | | | 85,631 | | | | 346,293 | |
| | |
Jordan Petroleum Refinery | | | 225,864 | | | | 782,136 | |
| | |
Jordanian Electric Power Co. | | | 235,398 | | | | 413,979 | |
| | |
| | | | | | | $ | 10,232,363 | |
|
| Kazakhstan — 0.7% | |
| | |
Halyk Savings Bank of Kazakhstan JSC GDR(4) | | | 447,782 | | | $ | 4,510,061 | |
| | |
KAZ Minerals PLC | | | 550,742 | | | | 4,300,376 | |
| | |
Kcell JSC GDR(4) | | | 414,605 | | | | 2,060,815 | |
| | |
Nostrum Oil & Gas PLC(1) | | | 75,523 | | | | 136,982 | |
| | |
| | | | | | | $ | 11,008,234 | |
|
| Kenya — 0.7% | |
| | |
ARM Cement, Ltd.(1)(3) | | | 1,653,600 | | | $ | 45,523 | |
| | |
Bamburi Cement Co., Ltd. | | | 325,100 | | | | 415,345 | |
| | |
Barclays Bank of Kenya, Ltd. | | | 5,213,860 | | | | 592,899 | |
| | |
British American Tobacco Kenya, Ltd. | | | 52,000 | | | | 329,359 | |
| | |
Co-operative Bank of Kenya, Ltd. (The) | | | 4,117,749 | | | | 649,223 | |
| | |
East African Breweries, Ltd. | | | 1,086,780 | | | | 2,301,446 | |
| | |
Equity Group Holdings PLC | | | 3,843,700 | | | | 1,558,973 | |
| | |
KCB Group, Ltd. | | | 3,265,620 | | | | 1,320,099 | |
| | |
KenolKobil, Ltd. | | | 2,894,200 | | | | 607,357 | |
| | | | | | | | |
| Security | | Shares | | | Value | |
|
| Kenya (continued) | |
| | |
Kenya Power & Lighting, Ltd.(1) | | | 7,482,654 | | | $ | 330,793 | |
| | |
Nation Media Group PLC | | | 488,284 | | | | 303,322 | |
| | |
Safaricom PLC | | | 10,817,072 | | | | 2,636,627 | |
| | |
Standard Chartered Bank Kenya, Ltd. | | | 219,542 | | | | 425,322 | |
| | |
| | | | | | | $ | 11,516,288 | |
|
| Kuwait — 1.4% | |
| | |
Agility Public Warehousing Co. KSC | | | 786,226 | | | $ | 2,010,018 | |
| | |
Ahli United Bank | | | 229,353 | | | | 228,166 | |
| | |
Al Ahli Bank of Kuwait KSCP | | | 209,247 | | | | 210,164 | |
| | |
Al-Mazaya Holding Co. | | | 882,500 | | | | 209,382 | |
| | |
ALAFCO Aviation Lease and Finance Co. KSCP | | | 225,463 | | | | 242,453 | |
| | |
Boubyan Bank KSCP | | | 235,713 | | | | 450,427 | |
| | |
Boubyan Petrochemicals Co. KSCP | | | 541,078 | | | | 1,674,535 | |
| | |
Burgan Bank SAK | | | 257,673 | | | | 248,360 | |
| | |
Commercial Bank of Kuwait KSCP | | | 330,022 | | | | 546,916 | |
| | |
Commercial Real Estate Co. KSCC | | | 2,296,205 | | | | 686,754 | |
| | |
Gulf Bank KSCP | | | 553,473 | | | | 511,421 | |
| | |
Gulf Cable & Electrical Industries Co. KSCP | | | 152,800 | | | | 193,590 | |
| | |
Gulf National Holding Co.(1)(3) | | | 297,856 | | | | 0 | |
| | |
Jazeera Airways Co. KSC | | | 81,382 | | | | 198,415 | |
| | |
Kuwait Cement Co. | | | 492,329 | | | | 565,154 | |
| | |
Kuwait Finance House KSCP | | | 929,257 | | | | 1,865,429 | |
| | |
Kuwait Portland Cement Co. KSC | | | 103,150 | | | | 392,643 | |
| | |
Kuwait Projects Co. Holdings KSC | | | 378,400 | | | | 252,711 | |
| | |
Kuwait Real Estate Co. KSC(1) | | | 2,762,965 | | | | 514,090 | |
| | |
Mabanee Co. SAKC | | | 618,024 | | | | 1,270,893 | |
| | |
Mezzan Holding Co. KSCC | | | 65,569 | | | | 97,820 | |
| | |
Mobile Telecommunications Co. | | | 2,429,010 | | | | 3,691,157 | |
| | |
National Bank of Kuwait SAK | | | 1,081,244 | | | | 3,096,848 | |
| | |
National Industries Group Holding SAK | | | 930,803 | | | | 513,119 | |
| | |
National Real Estate Co. KPSC(1) | | | 948,370 | | | | 255,340 | |
| | |
Qurain Petrochemical Industries Co. | | | 830,580 | | | | 1,042,355 | |
| | |
Warba Bank KSCP(1) | | | 508,308 | | | | 368,700 | |
| | |
| | | | | | | $ | 21,336,860 | |
|
| Latvia — 0.0%(5) | |
| | |
Grindeks | | | 42,000 | | | $ | 374,054 | |
| | |
| | | | | | | $ | 374,054 | |
|
| Lithuania — 0.2% | |
| | |
Apranga PVA | | | 427,588 | | | $ | 785,258 | |
| | |
Energijos Skirstymo Operatorius AB | | | 128,934 | | | | 108,168 | |
| | |
Klaipedos Nafta AB | | | 1,345,900 | | | | 650,414 | |
| | |
Pieno Zvaigzdes(1) | | | 104,200 | | | | 120,010 | |
| | | | |
| | 15 | | See Notes to Financial Statements. |
Parametric
Emerging Markets Fund
January 31, 2019
Portfolio of Investments — continued
| | | | | | | | |
| Security | | Shares | | | Value | |
|
| Lithuania (continued) | |
| | |
Rokiskio Suris | | | 122,500 | | | $ | 362,625 | |
| | |
Siauliu Bankas | | | 2,303,871 | | | | 1,158,834 | |
| | |
| | | | | | | $ | 3,185,309 | |
|
| Malaysia — 2.8% | |
| | |
Aeon Co. (M) Bhd | | | 661,200 | | | $ | 250,906 | |
| | |
AirAsia Group Bhd | | | 800,000 | | | | 596,370 | |
| | |
Alliance Bank Malaysia Bhd | | | 150,000 | | | | 155,733 | |
| | |
AMMB Holdings Bhd | | | 145,400 | | | | 160,320 | |
| | |
Astro Malaysia Holdings Bhd | | | 979,300 | | | | 402,709 | |
| | |
Axiata Group Bhd | | | 1,451,450 | | | | 1,428,029 | |
| | |
Berjaya Corp. Bhd(1) | | | 2,090,591 | | | | 140,567 | |
| | |
Berjaya Sports Toto Bhd | | | 830,250 | | | | 458,676 | |
| | |
British American Tobacco Malaysia Bhd | | | 46,200 | | | | 433,949 | |
| | |
Bursa Malaysia Bhd | | | 122,550 | | | | 218,824 | |
| | |
CIMB Group Holdings Bhd | | | 387,500 | | | | 533,420 | |
| | |
Dialog Group Bhd | | | 2,709,814 | | | | 1,988,441 | |
| | |
Digi.com Bhd | | | 995,700 | | | | 1,137,742 | |
| | |
FGV Holdings Bhd(1) | | | 884,500 | | | | 216,546 | |
| | |
Gamuda Bhd | | | 965,900 | | | | 651,762 | |
| | |
Genting Bhd | | | 903,900 | | | | 1,534,611 | |
| | |
Genting Malaysia Bhd | | | 1,434,100 | | | | 1,155,646 | |
| | |
Genting Plantations Bhd | | | 122,000 | | | | 304,420 | |
| | |
Globetronics Technology Bhd | | | 736,900 | | | | 347,159 | |
| | |
Hartalega Holdings Bhd | | | 350,100 | | | | 463,254 | |
| | |
Hong Leong Bank Bhd | | | 57,100 | | | | 288,398 | |
| | |
IGB Real Estate Investment Trust | | | 474,900 | | | | 206,458 | |
| | |
IHH Healthcare Bhd | | | 1,474,300 | | | | 2,024,951 | |
| | |
IJM Corp. Bhd | | | 967,680 | | | | 432,735 | |
| | |
Inari Amertron Bhd | | | 2,886,200 | | | | 1,063,583 | |
| | |
IOI Corp. Bhd | | | 686,018 | | | | 780,794 | |
| | |
IOI Properties Group Bhd | | | 1,044,058 | | | | 398,589 | |
| | |
KLCCP Stapled Group | | | 399,100 | | | | 759,601 | |
| | |
Kuala Lumpur Kepong Bhd | | | 113,300 | | | | 682,846 | |
| | |
Lafarge Malaysia Bhd(1) | | | 942,950 | | | | 431,714 | |
| | |
Magnum Bhd | | | 940,340 | | | | 473,592 | |
| | |
Malayan Banking Bhd | | | 447,687 | | | | 1,044,425 | |
| | |
Malaysia Airports Holdings Bhd | | | 342,800 | | | | 674,942 | |
| | |
Maxis Bhd | | | 516,400 | | | | 726,383 | |
| | |
MISC Bhd | | | 482,400 | | | | 800,347 | |
| | |
MMC Corp. Bhd | | | 1,217,800 | | | | 250,566 | |
| | |
My EG Services Bhd | | | 3,438,350 | | | | 843,562 | |
| | |
Nestle Malaysia Bhd | | | 12,300 | | | | 446,119 | |
| | |
Petronas Chemicals Group Bhd | | | 1,048,400 | | | | 2,166,708 | |
| | |
Petronas Dagangan Bhd | | | 233,500 | | | | 1,508,281 | |
| | |
Petronas Gas Bhd | | | 209,200 | | | | 924,725 | |
| | | | | | | | |
| Security | | Shares | | | Value | |
|
| Malaysia (continued) | |
| | |
PPB Group Bhd | | | 134,500 | | | $ | 597,354 | |
| | |
Press Metal Aluminium Holdings Bhd | | | 1,092,820 | | | | 1,155,185 | |
| | |
Public Bank Bhd | | | 233,920 | | | | 1,416,962 | |
| | |
RHB Bank Bhd | | | 206,400 | | | | 274,088 | |
| | |
Sapura Energy Bhd(1) | | | 5,340,168 | | | | 347,051 | |
| | |
Scientex Bhd | | | 71,100 | | | | 152,980 | |
| | |
Silverlake Axis, Ltd. | | | 1,724,000 | | | | 621,293 | |
| | |
Sime Darby Bhd | | | 1,193,039 | | | | 655,424 | |
| | |
Sime Darby Plantation Bhd | | | 711,339 | | | | 897,702 | |
| | |
Sime Darby Property Bhd | | | 1,732,039 | | | | 487,595 | |
| | |
SP Setia Bhd Group | | | 575,400 | | | | 361,983 | |
| | |
Sunway Bhd | | | 1,117,740 | | | | 442,691 | |
| | |
Sunway Real Estate Investment Trust | | | 688,700 | | | | 294,657 | |
| | |
Supermax Corp. Bhd | | | 1,203,600 | | | | 446,740 | |
| | |
Telekom Malaysia Bhd | | | 884,700 | | | | 629,928 | |
| | |
Tenaga Nasional Bhd | | | 727,825 | | | | 2,298,294 | |
| | |
Top Glove Corp. Bhd | | | 871,100 | | | | 1,027,606 | |
| | |
UEM Sunrise Bhd | | | 1,683,050 | | | | 310,892 | |
| | |
UMW Holdings Bhd | | | 376,500 | | | | 537,429 | |
| | |
VS Industry Bhd | | | 2,509,800 | | | | 498,129 | |
| | |
YTL Corp. Bhd | | | 1,680,734 | | | | 452,007 | |
| | |
YTL Power International Bhd | | | 1,397,760 | | | | 307,432 | |
| | |
| | | | | | | $ | 43,721,825 | |
|
| Mauritius — 0.7% | |
| | |
Alteo, Ltd. | | | 852,532 | | | $ | 562,627 | |
| | |
CIEL, Ltd. | | | 1,801,109 | | | | 332,359 | |
| | |
CIM Financial Services, Ltd. | | | 543,905 | | | | 115,564 | |
| | |
Lavastone, Ltd.(1) | | | 543,905 | | | | 48,577 | |
| | |
MCB Group, Ltd. | | | 477,035 | | | | 3,828,596 | |
| | |
Phoenix Beverages, Ltd. | | | 24,345 | | | | 388,740 | |
| | |
Rogers & Co., Ltd. | | | 1,906,627 | | | | 2,175,544 | |
| | |
SBM Holdings, Ltd. | | | 6,041,362 | | | | 1,067,833 | |
| | |
Sun, Ltd., Class A | | | 516,880 | | | | 741,787 | |
| | |
Terra Mauricia, Ltd. | | | 432,330 | | | | 267,218 | |
| | |
United Basalt Products, Ltd. | | | 334,219 | | | | 1,260,404 | |
| | |
| | | | | | | $ | 10,789,249 | |
|
| Mexico — 5.7% | |
| | |
Alfa SAB de CV, Series A | | | 2,825,972 | | | $ | 3,566,040 | |
| | |
Alsea SAB de CV | | | 694,800 | | | | 1,922,102 | |
| | |
America Movil SAB de CV, Series L | | | 14,049,950 | | | | 11,307,703 | |
| | |
Arca Continental SAB de CV | | | 292,880 | | | | 1,699,331 | |
| | |
Bolsa Mexicana de Valores SAB de CV | | | 912,575 | | | | 1,825,412 | |
| | |
Cemex SAB de CV, Series CPO(1) | | | 7,329,339 | | | | 3,974,702 | |
| | | | |
| | 16 | | See Notes to Financial Statements. |
Parametric
Emerging Markets Fund
January 31, 2019
Portfolio of Investments — continued
| | | | | | | | |
| Security | | Shares | | | Value | |
|
| Mexico (continued) | |
| | |
Coca-Cola Femsa SAB de CV, Series L | | | 287,500 | | | $ | 1,796,513 | |
| | |
El Puerto de Liverpool SAB de CV | | | 163,780 | | | | 1,073,010 | |
| | |
Fibra Uno Administracion SA de CV | | | 2,054,090 | | | | 2,822,967 | |
| | |
Fomento Economico Mexicano SAB de CV, Series UBD | | | 752,856 | | | | 6,850,498 | |
| | |
Genomma Lab Internacional SAB de CV(1) | | | 2,417,000 | | | | 1,681,084 | |
| | |
Gentera SAB de CV | | | 917,500 | | | | 670,291 | |
| | |
Grupo Aeroportuario del Pacifico SAB de CV, Class B | | | 312,487 | | | | 2,811,889 | |
| | |
Grupo Aeroportuario del Sureste SAB de CV, Class B | | | 177,515 | | | | 3,214,574 | |
| | |
Grupo Bimbo SAB de CV, Series A | | | 1,148,945 | | | | 2,274,187 | |
| | |
Grupo Carso SAB de CV, Series A1 | | | 800,500 | | | | 3,139,667 | |
| | |
Grupo Elektra SAB de CV | | | 29,498 | | | | 1,601,220 | |
| | |
Grupo Financiero Banorte SAB de CV, Class O | | | 1,306,700 | | | | 7,267,322 | |
| | |
Grupo Financiero Inbursa SAB de CV, Class O | | | 2,577,000 | | | | 3,723,542 | |
| | |
Grupo Mexico SAB de CV, Series B | | | 2,139,079 | | | | 5,090,901 | |
| | |
Grupo Sanborns SAB de CV | | | 226,889 | | | | 223,065 | |
| | |
Grupo Televisa SAB ADR | | | 219,400 | | | | 2,744,694 | |
| | |
Grupo Televisa SAB, Series CPO | | | 325,100 | | | | 814,864 | |
| | |
Impulsora del Desarrollo y el Empleo en America Latina SA de CV, Series B1(1) | | | 500,000 | | | | 875,943 | |
| | |
Industrias CH SAB de CV, Series B(1) | | | 222,900 | | | | 941,269 | |
| | |
Industrias Penoles SAB de CV | | | 95,765 | | | | 1,307,149 | |
| | |
Infraestructura Energetica Nova SAB de CV | | | 180,000 | | | | 705,984 | |
| | |
Kimberly-Clark de Mexico SAB de CV, Class A | | | 712,600 | | | | 1,193,614 | |
| | |
Mexichem SAB de CV | | | 675,699 | | | | 1,809,544 | |
| | |
Minera Frisco SAB de CV(1) | | | 714,800 | | | | 185,034 | |
| | |
Organizacion Soriana SAB de CV, Class B(1) | | | 120,000 | | | | 168,809 | |
| | |
Promotora y Operadora de Infraestructura SAB de CV | | | 193,500 | | | | 1,969,177 | |
| | |
Telesites SAB de CV(1) | | | 1,126,268 | | | | 705,013 | |
| | |
Ternium SA ADR | | | 26,100 | | | | 793,962 | |
| | |
Wal-Mart de Mexico SAB de CV, Series V | | | 2,143,280 | | | | 5,629,931 | |
| | |
| | | | | | | $ | 88,381,007 | |
|
| Morocco — 0.7% | |
| | |
Attijariwafa Bank | | | 37,995 | | | $ | 1,796,694 | |
| | |
Banque Centrale Populaire | | | 42,503 | | | | 1,224,941 | |
| | |
BMCE Bank | | | 29,719 | | | | 562,335 | |
| | |
Cosumar | | | 68,623 | | | | 1,242,134 | |
| | |
Douja Promotion Groupe Addoha SA | | | 160,235 | | | | 235,070 | |
| | |
Label Vie | | | 1,418 | | | | 287,827 | |
| | |
LafargeHolcim Maroc SA | | | 9,792 | | | | 1,665,478 | |
| | |
Lesieur Cristal | | | 19,185 | | | | 283,995 | |
| | |
Managem SA | | | 2,236 | | | | 242,596 | |
| | |
Maroc Telecom | | | 128,998 | | | | 2,012,967 | |
| | |
Samir(1)(3) | | | 15,717 | | | | 0 | |
| | |
Societe d’Exploitation des Ports | | | 29,732 | | | | 556,540 | |
| | | | | | | | |
| Security | | Shares | | | Value | |
|
| Morocco (continued) | |
| | |
Taqa Morocco | | | 6,028 | | | $ | 588,098 | |
| | |
TOTAL Maroc SA | | | 1,894 | | | | 219,635 | |
| | |
| | | | | | | $ | 10,918,310 | |
|
| Nigeria — 0.7% | |
| | |
Access Bank PLC | | | 15,309,588 | | | $ | 244,130 | |
| | |
Afriland Properties PLC(1)(3) | | | 1,286,159 | | | | 0 | |
| | |
Dangote Cement PLC | | | 3,225,641 | | | | 1,651,215 | |
| | |
Ecobank Transnational, Inc.(1) | | | 5,093,625 | | | | 196,827 | |
| | |
FBN Holdings PLC | | | 28,227,890 | | | | 576,208 | |
| | |
Flour Mills of Nigeria PLC | | | 3,215,556 | | | | 165,215 | |
| | |
Guaranty Trust Bank PLC | | | 21,291,456 | | | | 1,968,043 | |
| | |
Guiness Nigeria PLC | | | 1,391,550 | | | | 230,380 | |
| | |
Lafarge Africa PLC | | | 5,061,475 | | | | 175,232 | |
| | |
Lekoil, Ltd.(1) | | | 1,111,089 | | | | 154,006 | |
| | |
Nestle Nigeria PLC | | | 355,667 | | | | 1,370,857 | |
| | |
Nigerian Breweries PLC | | | 4,747,707 | | | | 967,995 | |
| | |
SEPLAT Petroleum Development Co. PLC(2) | | | 604,091 | | | | 935,480 | |
| | |
Stanbic IBTC Holdings PLC | | | 1,977,675 | | | | 245,587 | |
| | |
Transnational Corp. of Nigeria PLC | | | 44,100,342 | | | | 152,048 | |
| | |
United Bank for Africa PLC | | | 25,521,594 | | | | 477,957 | |
| | |
Zenith Bank PLC | | | 19,093,381 | | | | 1,187,527 | |
| | |
| | | | | | | $ | 10,698,707 | |
|
| Oman — 0.7% | |
| | |
Bank Dhofar SAOG | | | 1,196,840 | | | $ | 496,670 | |
| | |
Bank Muscat SAOG | | | 2,383,792 | | | | 2,513,464 | |
| | |
Bank Nizwa SAOG(1) | | | 1,001,800 | | | | 229,199 | |
| | |
Bank Sohar SAOG | | | 1,707,287 | | | | 491,863 | |
| | |
HSBC Bank Oman SAOG | | | 915,535 | | | | 292,947 | |
| | |
National Bank of Oman SAOG | | | 1,396,197 | | | | 683,825 | |
| | |
Oman Cables Industry SAOG | | | 127,600 | | | | 314,334 | |
| | |
Oman Cement Co. SAOG | | | 743,500 | | | | 558,446 | |
| | |
Oman Flour Mills Co. SAOG | | | 90,796 | | | | 138,455 | |
| | |
Oman Telecommunications Co. SAOG | | | 913,435 | | | | 1,703,115 | |
| | |
Ominvest | | | 356,584 | | | | 321,759 | |
| | |
Ooredoo | | | 738,509 | | | | 999,930 | |
| | |
Raysut Cement Co. SAOG | | | 322,669 | | | | 322,469 | |
| | |
Renaissance Services SAOG(1) | | | 1,429,609 | | | | 1,261,283 | |
| | |
Sembcorp Salalah Power & Water Co. | | | 1,120,000 | | | | 488,916 | |
| | |
| | | | | | | $ | 10,816,675 | |
|
| Pakistan — 0.7% | |
| | |
Bank Alfalah, Ltd. | | | 865,691 | | | $ | 307,003 | |
| | |
D.G. Khan Cement Co., Ltd. | | | 322,232 | | | | 199,634 | |
| | | | |
| | 17 | | See Notes to Financial Statements. |
Parametric
Emerging Markets Fund
January 31, 2019
Portfolio of Investments — continued
| | | | | | | | |
| Security | | Shares | | | Value | |
|
| Pakistan (continued) | |
| | |
Engro Corp., Ltd. | | | 245,987 | | | $ | 596,174 | |
| | |
Engro Fertilizers, Ltd. | | | 610,528 | | | | 335,019 | |
| | |
Fauji Fertilizer Co., Ltd. | | | 560,610 | | | | 432,135 | |
| | |
Habib Bank, Ltd. | | | 612,217 | | | | 660,406 | |
| | |
Hub Power Co., Ltd. (The) | | | 2,206,400 | | | | 1,489,694 | |
| | |
K-Electric, Ltd.(1) | | | 4,344,000 | | | | 202,393 | |
| | |
Kot Addu Power Co., Ltd. | | | 765,900 | | | | 279,314 | |
| | |
Lucky Cement, Ltd. | | | 147,650 | | | | 501,172 | |
| | |
Maple Leaf Cement Factory, Ltd. | | | 624,937 | | | | 200,902 | |
| | |
Mari Petroleum Co., Ltd. | | | 24,530 | | | | 228,768 | |
| | |
MCB Bank, Ltd. | | | 460,830 | | | | 695,294 | |
| | |
Millat Tractors, Ltd. | | | 66,390 | | | | 425,212 | |
| | |
National Bank of Pakistan(1) | | | 672,540 | | | | 229,199 | |
| | |
Nishat Mills, Ltd. | | | 884,171 | | | | 911,702 | |
| | |
Oil & Gas Development Co., Ltd. | | | 520,591 | | | | 566,757 | |
| | |
Pak Elektron, Ltd. | | | 892,000 | | | | 178,319 | |
| | |
Pakistan Oilfields, Ltd. | | | 128,520 | | | | 439,923 | |
| | |
Pakistan Petroleum, Ltd. | | | 453,143 | | | | 621,170 | |
| | |
Pakistan State Oil Co., Ltd. | | | 194,028 | | | | 345,796 | |
| | |
Searle Co., Ltd. (The) | | | 269,627 | | | | 512,828 | |
| | |
SUI Southern Gas Co., Ltd.(1) | | | 864,051 | | | | 158,850 | |
| | |
TRG Pakistan(1) | | | 989,500 | | | | 195,459 | |
| | |
United Bank, Ltd. | | | 406,745 | | | | 450,251 | |
| | |
| | | | | | | $ | 11,163,374 | |
|
| Panama — 0.3% | |
| | |
Copa Holdings SA, Class A | | | 42,529 | | | $ | 4,033,876 | |
| | |
| | | | | | | $ | 4,033,876 | |
|
| Peru — 1.4% | |
| | |
Alicorp SAA | | | 410,225 | | | $ | 1,301,871 | |
| | |
Cementos Pacasmayo SAA | | | 192,689 | | | | 390,879 | |
| | |
Cia de Minas Buenaventura SA ADR | | | 237,550 | | | | 3,717,658 | |
| | |
Credicorp, Ltd. | | | 44,600 | | | | 10,827,988 | |
| | |
Ferreycorp SAA | | | 1,797,472 | | | | 1,361,271 | |
| | |
Southern Copper Corp. | | | 97,376 | | | | 3,273,781 | |
| | |
Volcan Cia Minera SAA, Class B | | | 2,886,275 | | | | 650,550 | |
| | |
| | | | | | | $ | 21,523,998 | |
|
| Philippines — 3.0% | |
| | |
Aboitiz Equity Ventures, Inc. | | | 940,610 | | | $ | 1,164,285 | |
| | |
Aboitiz Power Corp. | | | 1,953,600 | | | | 1,442,797 | |
| | |
Alliance Global Group, Inc. | | | 1,585,400 | | | | 417,048 | |
| | |
Ayala Corp. | | | 99,465 | | | | 1,773,938 | |
| | |
Ayala Land, Inc. | | | 2,273,300 | | | | 1,942,326 | |
| | | | | | | | |
| Security | | Shares | | | Value | |
|
| Philippines (continued) | |
| | |
Ayala Land, Inc., PFC Shares(3) | | | 3,951,800 | | | $ | 0 | |
| | |
Bank of the Philippine Islands | | | 702,040 | | | | 1,228,840 | |
| | |
BDO Unibank, Inc. | | | 657,594 | | | | 1,708,513 | |
| | |
Bloomberry Resorts Corp. | | | 5,797,500 | | | | 1,229,282 | |
| | |
Cosco Capital, Inc. | | | 3,726,300 | | | | 528,203 | |
| | |
D&L Industries, Inc. | | | 4,201,800 | | | | 914,720 | |
| | |
DMCI Holdings, Inc. | | | 1,492,900 | | | | 361,043 | |
| | |
First Gen Corp. | | | 1,549,522 | | | | 607,792 | |
| | |
First Philippine Holdings Corp. | | | 327,190 | | | | 456,781 | |
| | |
Globe Telecom, Inc. | | | 35,150 | | | | 1,367,131 | |
| | |
GT Capital Holdings, Inc. | | | 31,780 | | | | 652,734 | |
| | |
International Container Terminal Services, Inc. | | | 352,920 | | | | 734,024 | |
| | |
JG Summit Holdings, Inc. | | | 1,166,370 | | | | 1,450,136 | |
| | |
Jollibee Foods Corp. | | | 561,600 | | | | 3,410,660 | |
| | |
LT Group, Inc. | | | 1,202,200 | | | | 358,254 | |
| | |
Manila Electric Co. | | | 330,160 | | | | 2,322,569 | |
| | |
Manila Water Co. | | | 909,900 | | | | 480,800 | |
| | |
Megaworld Corp. | | | 6,000,000 | | | | 595,783 | |
| | |
Metro Pacific Investments Corp. | | | 4,416,700 | | | | 412,864 | |
| | |
Metropolitan Bank & Trust Co. | | | 661,527 | | | | 1,067,817 | |
| | |
Nickel Asia Corp. | | | 9,507,240 | | | | 448,116 | |
| | |
Petron Corp. | | | 4,267,400 | | | | 612,675 | |
| | |
PLDT, Inc. | | | 101,670 | | | | 2,527,065 | |
| | |
Puregold Price Club, Inc. | | | 1,430,700 | | | | 1,250,016 | |
| | |
Robinsons Land Corp. | | | 1,000,882 | | | | 423,561 | |
| | |
Robinsons Retail Holdings, Inc. | | | 652,000 | | | | 1,100,778 | |
| | |
San Miguel Corp. | | | 154,070 | | | | 488,772 | |
| | |
Security Bank Corp. | | | 101,780 | | | | 350,126 | |
| | |
Semirara Mining & Power Corp. | | | 2,596,920 | | | | 1,181,948 | |
| | |
SM Investments Corp. | | | 191,533 | | | | 3,653,752 | |
| | |
SM Prime Holdings, Inc. | | | 4,438,199 | | | | 3,254,150 | |
| | |
Travellers International Hotel Group, Inc.(1) | | | 3,521,900 | | | | 371,572 | |
| | |
Universal Robina Corp. | | | 1,157,020 | | | | 3,290,605 | |
| | |
Vista Land & Lifescapes, Inc. | | | 1,567,200 | | | | 175,764 | |
| | |
| | | | | | | $ | 45,757,240 | |
|
| Poland — 2.9% | |
| | |
Alior Bank SA(1) | | | 35,865 | | | $ | 555,508 | |
| | |
AmRest Holdings SE(1) | | | 81,550 | | | | 863,390 | |
| | |
Asseco Poland SA | | | 272,089 | | | | 3,511,446 | |
| | |
Bank Handlowy w Warszawie SA | | | 18,785 | | | | 349,283 | |
| | |
Bank Millennium SA(1) | | | 281,290 | | | | 668,104 | |
| | |
Bank Polska Kasa Opieki SA | | | 62,942 | | | | 1,873,236 | |
| | |
Boryszew SA(1) | | | 122,670 | | | | 155,213 | |
| | |
Budimex SA | | | 20,575 | | | | 597,938 | |
| | |
CCC SA | | | 28,164 | | | | 1,356,047 | |
| | | | |
| | 18 | | See Notes to Financial Statements. |
Parametric
Emerging Markets Fund
January 31, 2019
Portfolio of Investments — continued
| | | | | | | | |
| Security | | Shares | | | Value | |
|
| Poland (continued) | |
| | |
Ciech SA | | | 42,262 | | | $ | 596,929 | |
| | |
Cyfrowy Polsat SA(1) | | | 206,500 | | | | 1,315,677 | |
| | |
Enea SA(1) | | | 258,387 | | | | 745,543 | |
| | |
Energa SA(1) | | | 275,523 | | | | 753,026 | |
| | |
Eurocash SA | | | 317,200 | | | | 1,716,329 | |
| | |
Grupa Azoty SA | | | 74,494 | | | | 742,340 | |
| | |
Grupa Lotos SA | | | 35,648 | | | | 891,276 | |
| | |
ING Bank Slaski SA | | | 14,380 | | | | 739,592 | |
| | |
Jastrzebska Spolka Weglowa SA(1) | | | 58,043 | | | | 1,067,216 | |
| | |
KGHM Polska Miedz SA(1) | | | 119,177 | | | | 3,023,427 | |
| | |
LPP SA | | | 1,317 | | | | 2,959,649 | |
| | |
Lubelski Wegiel Bogdanka SA(1) | | | 8,815 | | | | 133,154 | |
| | |
mBank SA | | | 5,230 | | | | 631,532 | |
| | |
Netia SA(1) | | | 195,572 | | | | 270,767 | |
| | |
Orange Polska SA(1) | | | 1,362,301 | | | | 2,051,191 | |
| | |
PGE SA(1) | | | 972,070 | | | | 3,109,120 | |
| | |
PKP Cargo SA(1) | | | 40,141 | | | | 443,177 | |
| | |
Polski Koncern Naftowy ORLEN SA | | | 115,790 | | | | 3,262,471 | |
| | |
Polskie Gornictwo Naftowe i Gazownictwo SA | | | 659,050 | | | | 1,352,863 | |
| | |
Powszechna Kasa Oszczednosci Bank Polski SA | | | 339,105 | | | | 3,604,715 | |
| | |
Powszechny Zaklad Ubezpieczen SA | | | 224,111 | | | | 2,692,951 | |
| | |
Santander Bank Polska SA | | | 13,875 | | | | 1,395,926 | |
| | |
Tauron Polska Energia SA(1) | | | 1,248,226 | | | | 798,190 | |
| | |
| | | | | | | $ | 44,227,226 | |
|
| Qatar — 1.4% | |
| | |
Aamal Co. QSC | | | 46,535 | | | $ | 123,191 | |
| | |
Al Meera Consumer Goods Co. | | | 3,672 | | | | 152,088 | |
| | |
Barwa Real Estate Co. | | | 137,167 | | | | 1,533,452 | |
| | |
Commercial Bank PQSC (The) | | | 48,818 | | | | 568,406 | |
| | |
Doha Bank QPSC | | | 33,740 | | | | 195,355 | |
| | |
Gulf International Services QSC(1) | | | 73,013 | | | | 334,092 | |
| | |
Industries Qatar | | | 80,097 | | | | 3,148,361 | |
| | |
Masraf Al Rayan QSC | | | 94,538 | | | | 1,056,721 | |
| | |
Medicare Group | | | 9,576 | | | | 172,648 | |
| | |
Ooredoo QPSC | | | 70,926 | | | | 1,476,296 | |
| | |
Qatar Electricity & Water Co. QSC | | | 35,645 | | | | 1,842,916 | |
| | |
Qatar Gas Transport Co., Ltd. | | | 167,929 | | | | 920,050 | |
| | |
Qatar Insurance Co. | | | 34,837 | | | | 372,547 | |
| | |
Qatar International Islamic Bank | | | 11,705 | | | | 220,556 | |
| | |
Qatar Islamic Bank | | | 27,302 | | | | 1,182,843 | |
| | |
Qatar National Bank QPSC | | | 108,439 | | | | 5,878,756 | |
| | |
Qatar Navigation QSC | | | 24,021 | | | | 454,274 | |
| | |
United Development Co. QSC | | | 120,269 | | | | 553,745 | |
| | |
Vodafone Qatar QSC(1) | | | 275,224 | | | | 632,673 | |
| | |
| | | | | | | $ | 20,818,970 | |
| | | | | | | | |
| Security | | Shares | | | Value | |
|
| Romania — 0.7% | |
| | |
Banca Transilvania SA | | | 7,987,271 | | | $ | 3,042,840 | |
| | |
BRD-Groupe Societe Generale SA | | | 578,630 | | | | 1,403,525 | |
| | |
OMV Petrom SA | | | 24,032,674 | | | | 1,870,213 | |
| | |
Societatea Energetica Electrica SA | | | 548,668 | | | | 1,264,199 | |
| | |
Societatea Nationala de Gaze Naturale ROMGAZ SA | | | 198,170 | | | | 1,339,250 | |
| | |
Transelectrica SA | | | 114,909 | | | | 541,503 | |
| | |
Transgaz SA Medias | | | 9,856 | | | | 783,673 | |
| | |
| | | | | | | $ | 10,245,203 | |
|
| Russia — 6.3% | |
| | |
Aeroflot PJSC | | | 312,896 | | | $ | 516,422 | |
| | |
Alrosa PJSC | | | 650,100 | | | | 976,773 | |
| | |
Evraz PLC | | | 167,352 | | | | 1,096,257 | |
| | |
Federal Grid Co. Unified Energy System PJSC | | | 279,085,440 | | | | 707,764 | |
| | |
Gazprom PJSC ADR | | | 1,848,133 | | | | 9,035,921 | |
| | |
Globaltrans Investment PLC GDR(4) | | | 156,200 | | | | 1,544,786 | |
| | |
Inter RAO UES PJSC | | | 27,837,070 | | | | 1,634,357 | |
| | |
Lenta, Ltd. GDR(1)(4) | | | 168,201 | | | | 556,875 | |
| | |
LSR Group PJSC GDR(4) | | | 186,400 | | | | 366,479 | |
| | |
Lukoil PJSC ADR(6) | | | 1,600 | | | | 128,320 | |
| | |
Lukoil PJSC ADR(6) | | | 129,202 | | | | 10,374,590 | |
| | |
Luxoft Holding, Inc.(1) | | | 17,500 | | | | 1,015,525 | |
| | |
Magnit PJSC | | | 45,747 | | | | 2,905,909 | |
| | |
Magnit PJSC GDR(4) | | | 66,434 | | | | 1,059,186 | |
| | |
Magnitogorsk Iron & Steel Works PJSC | | | 721,700 | | | | 479,941 | |
| | |
Mail.ru Group, Ltd. GDR(1)(4) | | | 102,282 | | | | 2,523,292 | |
| | |
Mechel PJSC ADR(1) | | | 152,000 | | | | 363,280 | |
| | |
MMC Norilsk Nickel PJSC ADR(6) | | | 23,923 | | | | 502,622 | |
| | |
MMC Norilsk Nickel PJSC ADR(6) | | | 311,892 | | | | 6,496,189 | |
| | |
Mobile TeleSystems PJSC | | | 796,357 | | | | 3,189,575 | |
| | |
Moscow Exchange MICEX-RTS PJSC(1) | | | 606,740 | | | | 867,769 | |
| | |
Mosenergo PJSC | | | 8,811,603 | | | | 295,119 | |
| | |
Novatek PJSC GDR(4) | | | 24,803 | | | | 4,553,804 | |
| | |
Novolipetsk Steel PJSC GDR | | | 57,500 | | | | 1,347,945 | |
| | |
PhosAgro PJSC GDR(4)(6) | | | 12,600 | | | | 171,612 | |
| | |
PhosAgro PJSC GDR(4)(6) | | | 28,064 | | | | 382,628 | |
| | |
Polymetal International PLC | | | 120,800 | | | | 1,378,318 | |
| | |
QIWI PLC ADR(1) | | | 32,866 | | | | 525,856 | |
| | |
Rosneft Oil Co. PJSC GDR(4)(6) | | | 3,905 | | | | 24,406 | |
| | |
Rosneft Oil Co. PJSC GDR(4)(6) | | | 364,424 | | | | 2,278,816 | |
| | |
Rostelecom PJSC | | | 836,637 | | | | 926,759 | |
| | |
RusHydro PJSC | | | 167,955,080 | | | | 1,319,448 | |
| | |
Sberbank of Russia PJSC | | | 3,870,588 | | | | 12,893,669 | |
| | |
Severstal PJSC GDR(4) | | | 112,006 | | | | 1,710,459 | |
| | |
Sistema PJSFC | | | 3,328,078 | | | | 490,132 | |
| | |
Sollers PJSC(1) | | | 3,142 | | | | 20,055 | |
| | | | |
| | 19 | | See Notes to Financial Statements. |
Parametric
Emerging Markets Fund
January 31, 2019
Portfolio of Investments — continued
| | | | | | | | |
| Security | | Shares | | | Value | |
|
| Russia (continued) | |
| | |
Surgutneftegas PJSC ADR | | | 318,172 | | | $ | 1,317,039 | |
| | |
Surgutneftegas PJSC, PFC Shares | | | 2,610,900 | | | | 1,620,936 | |
| | |
Tatneft PJSC ADR(6) | | | 3,614 | | | | 266,894 | |
| | |
Tatneft PJSC ADR(6) | | | 77,782 | | | | 5,716,889 | |
| | |
TMK PJSC GDR(4) | | | 64,757 | | | | 210,241 | |
| | |
Transneft PJSC, PFC Shares | | | 545 | | | | 1,459,636 | |
| | |
Unipro PJSC | | | 8,737,000 | | | | 370,035 | |
| | |
VEON, Ltd. ADR | | | 370,784 | | | | 938,084 | |
| | |
VTB Bank PJSC | | | 2,002,190,000 | | | | 1,149,215 | |
| | |
X5 Retail Group NV GDR(4) | | | 100,500 | | | | 2,651,122 | |
| | |
Yandex NV, Class A(1) | | | 186,600 | | | | 6,266,028 | |
| | |
| | | | | | | $ | 96,626,977 | |
|
| Saudi Arabia — 1.4% | |
| | |
Abdullah Al Othaim Markets Co. | | | 23,008 | | | $ | 424,155 | |
| | |
Al Hammadi Co. for Development and Investment(1) | | | 38,317 | | | | 262,658 | |
| | |
Al Rajhi Bank | | | 50,461 | | | | 1,363,323 | |
| | |
Al Tayyar Travel Group Holding Co. | | | 72,186 | | | | 443,170 | |
| | |
Aldrees Petroleum and Transport Services Co. | | | 16,600 | | | | 155,317 | |
| | |
Alinma Bank | | | 39,712 | | | | 255,754 | |
| | |
Almarai Co. JSC | | | 80,694 | | | | 1,163,668 | |
| | |
Arab National Bank | | | 49,700 | | | | 497,981 | |
| | |
Arriyadh Development Co. | | | 47,846 | | | | 234,392 | |
| | |
Banque Saudi Fransi | | | 49,100 | | | | 485,127 | |
| | |
Dallah Healthcare Co. | | | 9,149 | | | | 160,304 | |
| | |
Dar Al Arkan Real Estate Development Co. | | | 491,437 | | | | 1,311,291 | |
| | |
Emaar Economic City(1) | | | 249,842 | | | | 624,101 | |
| | |
Etihad Etisalat Co.(1) | | | 95,838 | | | | 460,724 | |
| | |
Fawaz Abdulaziz Al Hokair & Co.(1) | | | 59,694 | | | | 337,701 | |
| | |
Jarir Marketing Co. | | | 31,417 | | | | 1,279,326 | |
| | |
Mobile Telecommunications Co. Saudi Arabia(1) | | | 123,207 | | | | 306,292 | |
| | |
Mouwasat Medical Services Co. | | | 20,399 | | | | 411,187 | |
| | |
National Agriculture Development Co. (The)(1) | | | 17,649 | | | | 132,075 | |
| | |
National Industrialization Co.(1) | | | 30,681 | | | | 131,268 | |
| | |
National Medical Care Co. | | | 9,934 | | | | 123,263 | |
| | |
Rabigh Refining & Petrochemical Co. | | | 64,000 | | | | 344,540 | |
| | |
Riyad Bank | | | 68,200 | | | | 411,922 | |
| | |
Sahara Petrochemical Co. | | | 43,292 | | | | 178,997 | |
| | |
Samba Financial Group | | | 61,205 | | | | 593,889 | |
| | |
Saudi Airlines Catering Co. | | | 21,881 | | | | 504,978 | |
| | |
Saudi Arabian Amiantit Co.(1) | | | 106,500 | | | | 203,031 | |
| | |
Saudi Arabian Fertilizer Co. | | | 12,058 | | | | 271,023 | |
| | |
Saudi Arabian Mining Co.(1) | | | 21,900 | | | | 321,235 | |
| | |
Saudi Basic Industries Corp. | | | 38,437 | | | | 1,260,085 | |
| | |
Saudi British Bank (The) | | | 58,524 | | | | 574,572 | |
| | |
Saudi Ceramic Co.(1) | | | 21,700 | | | | 117,166 | |
| | | | | | | | |
| Security | | Shares | | | Value | |
|
| Saudi Arabia (continued) | |
| | |
Saudi Chemical Co. | | | 25,900 | | | $ | 229,544 | |
| | |
Saudi Co. for Hardware CJSC | | | 7,287 | | | | 129,078 | |
| | |
Saudi Electricity Co. | | | 336,411 | | | | 1,563,037 | |
| | |
Saudi Ground Services Co. | | | 39,900 | | | | 328,759 | |
| | |
Saudi Industrial Investment Group | | | 35,563 | | | | 221,502 | |
| | |
Saudi International Petrochemical Co. | | | 40,200 | | | | 203,990 | |
| | |
Saudi Kayan Petrochemical Co.(1) | | | 59,809 | | | | 222,805 | |
| | |
Saudi Pharmaceutical Industries & Medical Appliances Corp. | | | 19,138 | | | | 147,716 | |
| | |
Saudi Public Transport Co. | | | 48,600 | | | | 189,655 | |
| | |
Saudi Telecom Co. | | | 71,171 | | | | 1,909,039 | |
| | |
Savola Group (The) | | | 97,172 | | | | 878,741 | |
| | |
United Electronics Co. | | | 10,324 | | | | 166,359 | |
| | |
United International Transportation Co. | | | 37,546 | | | | 281,546 | |
| | |
Yanbu National Petrochemical Co. | | | 18,678 | | | | 343,643 | |
| | |
| | | | | | | $ | 22,159,929 | |
|
| Slovenia — 0.7% | |
| | |
Cinkarna Celje DD | | | 2,659 | | | $ | 636,841 | |
| | |
KRKA DD | | | 53,647 | | | | 3,529,057 | |
| | |
Luka Koper | | | 42,830 | | | | 1,355,857 | |
| | |
Petrol | | | 5,432 | | | | 2,007,988 | |
| | |
Pozavarovalnica Sava DD | | | 47,857 | | | | 868,521 | |
| | |
Telekom Slovenije DD | | | 16,325 | | | | 1,148,825 | |
| | |
Zavarovalnica Triglav DD | | | 31,851 | | | | 1,154,171 | |
| | |
| | | | | | | $ | 10,701,260 | |
|
| South Africa — 5.9% | |
| | |
Absa Group, Ltd. | | | 94,735 | | | $ | 1,329,450 | |
| | |
AECI, Ltd. | | | 52,556 | | | | 352,220 | |
| | |
African Rainbow Minerals, Ltd. | | | 57,934 | | | | 650,332 | |
| | |
Anglo American Platinum, Ltd. | | | 12,485 | | | | 602,649 | |
| | |
AngloGold Ashanti, Ltd. | | | 123,324 | | | | 1,739,284 | |
| | |
Aspen Pharmacare Holdings, Ltd. | | | 392,807 | | | | 4,317,869 | |
| | |
Astral Foods, Ltd. | | | 18,500 | | | | 226,387 | |
| | |
AVI, Ltd. | | | 186,900 | | | | 1,313,758 | |
| | |
Barloworld, Ltd. | | | 383,475 | | | | 3,514,605 | |
| | |
Bid Corp., Ltd. | | | 119,527 | | | | 2,565,081 | |
| | |
Bidvest Group, Ltd. (The) | | | 380,754 | | | | 5,839,690 | |
| | |
Capitec Bank Holdings, Ltd. | | | 12,100 | | | | 1,067,333 | |
| | |
Clicks Group, Ltd. | | | 129,100 | | | | 1,919,690 | |
| | |
DataTec, Ltd.(1) | | | 160,600 | | | | 352,851 | |
| | |
Discovery, Ltd. | | | 77,690 | | | | 933,951 | |
| | |
Exxaro Resources, Ltd. | | | 118,010 | | | | 1,375,493 | |
| | |
FirstRand, Ltd. | | | 445,046 | | | | 2,338,617 | |
| | | | |
| | 20 | | See Notes to Financial Statements. |
Parametric
Emerging Markets Fund
January 31, 2019
Portfolio of Investments — continued
| | | | | | | | |
| Security | | Shares | | | Value | |
|
| South Africa (continued) | |
| | |
Foschini Group, Ltd. (The) | | | 63,545 | | | $ | 814,049 | |
| | |
Gold Fields, Ltd. | | | 283,431 | | | | 1,150,166 | |
| | |
Grindrod, Ltd.(1) | | | 340,300 | | | | 196,508 | |
| | |
Growthpoint Properties, Ltd. | | | 1,042,876 | | | | 2,042,453 | |
| | |
Harmony Gold Mining Co., Ltd.(1) | | | 296,711 | | | | 595,811 | |
| | |
Hyprop Investments, Ltd. | | | 92,800 | | | | 629,917 | |
| | |
Impala Platinum Holdings, Ltd.(1) | | | 301,273 | | | | 884,872 | |
| | |
Imperial Logistics, Ltd. | | | 60,958 | | | | 312,642 | |
| | |
Investec, Ltd. | | | 62,594 | | | | 412,572 | |
| | |
JSE, Ltd. | | | 40,800 | | | | 505,369 | |
| | |
Kumba Iron Ore, Ltd. | | | 14,360 | | | | 369,632 | |
| | |
Liberty Holdings, Ltd. | | | 47,175 | | | | 381,167 | |
| | |
Life Healthcare Group Holdings, Ltd. | | | 1,510,419 | | | | 3,096,259 | |
| | |
Massmart Holdings, Ltd. | | | 98,355 | | | | 685,391 | |
| | |
Mediclinic International PLC | | | 253,849 | | | | 1,059,735 | |
| | |
MMI Holdings, Ltd.(1) | | | 365,188 | | | | 462,707 | |
| | |
Mondi, Ltd. | | | 40,419 | | | | 1,005,078 | |
| | |
Motus Holdings, Ltd.(1) | | | 60,958 | | | | 410,224 | |
| | |
Mr Price Group, Ltd. | | | 59,321 | | | | 998,548 | |
| | |
MTN Group, Ltd. | | | 289,276 | | | | 1,892,686 | |
| | |
Murray & Roberts Holdings, Ltd. | | | 915,850 | | | | 987,628 | |
| | |
Nampak, Ltd.(1) | | | 465,438 | | | | 490,506 | |
| | |
Naspers, Ltd., Class N | | | 44,057 | | | | 10,191,430 | |
| | |
Nedbank Group, Ltd. | | | 44,331 | | | | 959,445 | |
| | |
Netcare, Ltd. | | | 1,305,994 | | | | 2,458,266 | |
| | |
Northam Platinum, Ltd.(1) | | | 207,738 | | | | 756,382 | |
| | |
Pick’n Pay Stores, Ltd. | | | 225,781 | | | | 1,183,544 | |
| | |
PPC, Ltd.(1) | | | 468,427 | | | | 196,127 | |
| | |
Rand Merchant Investment Holdings, Ltd. | | | 241,697 | | | | 674,772 | |
| | |
Redefine Properties, Ltd. | | | 2,311,150 | | | | 1,841,653 | |
| | |
Remgro, Ltd. | | | 82,517 | | | | 1,316,385 | |
| | |
Reunert, Ltd. | | | 371,825 | | | | 1,974,194 | |
| | |
RMB Holdings, Ltd. | | | 137,064 | | | | 867,938 | |
| | |
Sanlam, Ltd. | | | 213,591 | | | | 1,357,691 | |
| | |
Sappi, Ltd. | | | 166,248 | | | | 982,129 | |
| | |
Sasol, Ltd. | | | 126,856 | | | | 3,837,930 | |
| | |
Shoprite Holdings, Ltd. | | | 172,823 | | | | 2,138,472 | |
| | |
Sibanye Gold, Ltd.(1) | | | 534,218 | | | | 464,310 | |
| | |
SPAR Group, Ltd. (The) | | | 91,631 | | | | 1,382,659 | |
| | |
Standard Bank Group, Ltd. | | | 130,101 | | | | 1,922,204 | |
| | |
Steinhoff International Holdings NV(1) | | | 787,883 | | | | 102,144 | |
| | |
Telkom SA SOC, Ltd. | | | 188,450 | | | | 953,499 | |
| | |
Tiger Brands, Ltd. | | | 76,630 | | | | 1,606,820 | |
| | |
Tongaat Hulett, Ltd. | | | 99,910 | | | | 379,591 | |
| | |
Truworths International, Ltd. | | | 105,912 | | | | 644,612 | |
| | |
Vodacom Group, Ltd. | | | 116,477 | | | | 1,059,870 | |
| | | | | | | | |
| Security | | Shares | | | Value | |
|
| South Africa (continued) | |
| | |
Wilson Bayly Holmes-Ovcon, Ltd. | | | 106,200 | | | $ | 1,117,328 | |
| | |
Woolworths Holdings, Ltd. | | | 245,524 | | | | 933,086 | |
| | |
| | | | | | | $ | 91,125,661 | |
|
| South Korea — 5.8% | |
| | |
AMOREPACIFIC Corp.(1) | | | 5,380 | | | $ | 879,835 | |
| | |
AMOREPACIFIC Group(1) | | | 6,000 | | | | 370,759 | |
| | |
BNK Financial Group, Inc. | | | 34,935 | | | | 231,098 | |
| | |
Celltrion, Inc.(1) | | | 14,223 | | | | 2,816,080 | |
| | |
Cheil Worldwide, Inc. | | | 31,519 | | | | 665,671 | |
| | |
CJ CheilJedang Corp.(1) | | | 2,752 | | | | 848,314 | |
| | |
CJ Corp. | | | 1,800 | | | | 195,459 | |
| | |
CJ Corp., PFC Shares(1) | | | 270 | | | | 11,791 | |
| | |
CJ ENM Co., Ltd.(1) | | | 2,216 | | | | 423,587 | |
| | |
CJ Logistics Corp.(1) | | | 2,049 | | | | 309,844 | |
| | |
Coway Co., Ltd. | | | 11,040 | | | | 832,002 | |
| | |
Daelim Industrial Co., Ltd.(1) | | | 3,151 | | | | 302,277 | |
| | |
Daesang Corp.(1) | | | 8,000 | | | | 181,586 | |
| | |
Daewoo Engineering & Construction Co., Ltd.(1) | | | 36,541 | | | | 170,840 | |
| | |
Daewoo Industrial Development Co., Ltd.(1) | | | 3,657 | | | | 8,825 | |
| | |
Daewoong Pharmaceutical Co., Ltd.(1) | | | 4,700 | | | | 820,331 | |
| | |
DB Insurance Co., Ltd. | | | 5,340 | | | | 333,483 | |
| | |
DGB Financial Group Co., Ltd. | | | 34,537 | | | | 269,749 | |
| | |
Dong-A Pharmaceutical Co., Ltd.(1) | | | 2,407 | | | | 227,703 | |
| | |
Dong-A ST Co., Ltd.(1) | | | 4,078 | | | | 370,860 | |
| | |
Dongkuk Steel Mill Co., Ltd.(1) | | | 50,333 | | | | 376,812 | |
| | |
Doosan Corp. | | | 1,901 | | | | 201,527 | |
| | |
Doosan Heavy Industries & Construction Co., Ltd.(1) | | | 11,535 | | | | 118,263 | |
| | |
E-MART, Inc. | | | 5,525 | | | | 954,347 | |
| | |
GS Engineering & Construction Corp. | | | 10,435 | | | | 442,312 | |
| | |
GS Holdings Corp. | | | 24,620 | | | | 1,205,038 | |
| | |
Hana Financial Group, Inc. | | | 27,700 | | | | 995,995 | |
| | |
Hanjin Kal Corp.(1) | | | 10,383 | | | | 258,990 | |
| | |
Hankook Tire Co., Ltd.(1) | | | 14,523 | | | | 546,299 | |
| | |
Hanmi Pharm Co., Ltd.(1) | | | 2,304 | | | | 901,517 | |
| | |
Hanmi Science Co., Ltd.(1) | | | 9,239 | | | | 610,062 | |
| | |
Hansol Holdings Co., Ltd.(1) | | | 37,566 | | | | 169,308 | |
| | |
Hansol Paper Co., Ltd. | | | 12,933 | | | | 200,040 | |
| | |
Hanwha Aerospace Co., Ltd.(1) | | | 9,095 | | | | 257,422 | |
| | |
Hanwha Chemical Corp.(1) | | | 28,250 | | | | 572,988 | |
| | |
Hanwha Corp.(1) | | | 6,080 | | | | 192,721 | |
| | |
HDC Hyundai Development Co-Engineering & Construction, Class E(1) | | | 4,650 | | | | 206,677 | |
| | |
Hite-Jinro Co., Ltd.(1) | | | 20,121 | | | | 306,241 | |
| | |
Hyosung Chemical Corp.(1) | | | 760 | | | | 96,777 | |
| | |
Hyosung Corp.(1) | | | 3,287 | | | | 207,574 | |
| | | | |
| | 21 | | See Notes to Financial Statements. |
Parametric
Emerging Markets Fund
January 31, 2019
Portfolio of Investments — continued
| | | | | | | | |
| Security | | Shares | | | Value | |
|
| South Korea (continued) | |
| | |
Hyosung TNC Co., Ltd.(1) | | | 1,031 | | | $ | 159,726 | |
| | |
Hyundai Department Store Co., Ltd. | | | 2,715 | | | | 233,723 | |
| | |
Hyundai Engineering & Construction Co., Ltd.(1) | | | 7,842 | | | | 440,647 | |
| | |
Hyundai Glovis Co., Ltd. | | | 3,070 | | | | 392,530 | |
| | |
Hyundai Heavy Industries Co., Ltd.(1) | | | 4,301 | | | | 538,241 | |
| | |
Hyundai Heavy Industries Holdings Co., Ltd.(1) | | | 867 | | | | 280,637 | |
| | |
Hyundai Marine & Fire Insurance Co., Ltd. | | | 5,856 | | | | 196,549 | |
| | |
Hyundai Mipo Dockyard Co., Ltd. | | | 4,150 | | | | 235,164 | |
| | |
Hyundai Mobis Co., Ltd.(1) | | | 9,659 | | | | 1,956,596 | |
| | |
Hyundai Motor Co. | | | 19,239 | | | | 2,242,912 | |
| | |
Hyundai Steel Co. | | | 16,100 | | | | 740,832 | |
| | |
Hyundai Wia Corp.(1) | | | 5,400 | | | | 212,464 | |
| | |
Industrial Bank of Korea(1) | | | 26,180 | | | | 335,341 | |
| | |
Kakao Corp.(1) | | | 3,565 | | | | 319,379 | |
| | |
Kangwon Land, Inc.(1) | | | 23,766 | | | | 727,130 | |
| | |
KB Financial Group, Inc. | | | 38,300 | | | | 1,645,648 | |
| | |
KCC Corp. | | | 745 | | | | 219,358 | |
| | |
Kia Motors Corp. | | | 28,703 | | | | 938,533 | |
| | |
Korea Electric Power Corp.(1) | | | 99,395 | | | | 3,071,653 | |
| | |
Korea Gas Corp.(1) | | | 15,148 | | | | 738,244 | |
| | |
Korea Investment Holdings Co., Ltd.(1) | | | 4,490 | | | | 260,412 | |
| | |
Korea Zinc Co., Ltd.(1) | | | 1,988 | | | | 787,253 | |
| | |
Korean Air Lines Co., Ltd.(1) | | | 10,010 | | | | 327,887 | |
| | |
Korean Reinsurance Co. | | | 29,387 | | | | 237,472 | |
| | |
KT Corp. | | | 69,653 | | | | 1,790,449 | |
| | |
KT Corp. ADR(1) | | | 3,700 | | | | 51,134 | |
| | |
KT&G Corp.(1) | | | 25,725 | | | | 2,290,600 | |
| | |
Kumho Petrochemical Co., Ltd. | | | 4,400 | | | | 356,859 | |
| | |
LG Chem, Ltd. | | | 6,650 | | | | 2,206,096 | |
| | |
LG Corp. | | | 13,532 | | | | 946,177 | |
| | |
LG Display Co., Ltd.(1) | | | 19,325 | | | | 329,156 | |
| | |
LG Electronics, Inc. | | | 15,743 | | | | 944,932 | |
| | |
LG Hausys, Ltd. | | | 2,858 | | | | 179,969 | |
| | |
LG Household & Health Care, Ltd. | | | 1,800 | | | | 2,047,996 | |
| | |
LG Uplus Corp. | | | 103,900 | | | | 1,412,217 | |
| | |
Lotte Chemical Corp. | | | 2,291 | | | | 619,656 | |
| | |
Lotte Corp.(1) | | | 5,796 | | | | 273,298 | |
| | |
LOTTE Fine Chemical Co., Ltd. | | | 9,050 | | | | 370,069 | |
| | |
Lotte Shopping Co., Ltd.(1) | | | 1,923 | | | | 339,197 | |
| | |
LS Corp. | | | 3,530 | | | | 182,435 | |
| | |
LS Industrial Systems Co., Ltd. | | | 3,300 | | | | 156,097 | |
| | |
Medy-Tox, Inc. | | | 1,853 | | | | 867,919 | |
| | |
Mirae Asset Daewoo Co., Ltd.(1) | | | 44,889 | | | | 307,739 | |
| | |
Naver Corp. | | | 6,970 | | | | 854,421 | |
| | |
NCsoft Corp. | | | 1,263 | | | | 531,828 | |
| | |
NH Investment & Securities Co., Ltd.(1) | | | 21,508 | | | | 270,929 | |
| | | | | | | | |
| Security | | Shares | | | Value | |
|
| South Korea (continued) | |
| | |
NHN Entertainment Corp.(1) | | | 4,718 | | | $ | 251,492 | |
| | |
Nong Shim Co., Ltd. | | | 3,000 | | | | 754,286 | |
| | |
OCI Co., Ltd.(1) | | | 4,137 | | | | 399,873 | |
| | |
Orion Corp. of Republic of Korea(1) | | | 8,200 | | | | 837,413 | |
| | |
POSCO | | | 10,900 | | | | 2,690,686 | |
| | |
Posco Daewoo Corp. | | | 9,000 | | | | 162,702 | |
| | |
S-Oil Corp. | | | 18,080 | | | | 1,702,436 | |
| | |
S1 Corp. | | | 3,266 | | | | 301,786 | |
| | |
Samsung Biologics Co., Ltd.(1)(2) | | | 2,681 | | | | 967,583 | |
| | |
Samsung C&T Corp. | | | 8,300 | | | | 897,990 | |
| | |
Samsung Card Co., Ltd. | | | 3,060 | | | | 91,679 | |
| | |
Samsung Electro-Mechanics Co., Ltd. | | | 3,583 | | | | 350,650 | |
| | |
Samsung Electronics Co., Ltd. | | | 188,330 | | | | 7,852,251 | |
| | |
Samsung Fire & Marine Insurance Co., Ltd. | | | 3,579 | | | | 878,133 | |
| | |
Samsung Heavy Industries Co., Ltd.(1) | | | 67,350 | | | | 553,227 | |
| | |
Samsung Life Insurance Co., Ltd. | | | 8,610 | | | | 684,609 | |
| | |
Samsung SDI Co., Ltd. | | | 2,525 | | | | 509,693 | |
| | |
Samsung Securities Co., Ltd. | | | 9,540 | | | | 287,991 | |
| | |
Shinhan Financial Group Co., Ltd. | | | 44,051 | | | | 1,703,807 | |
| | |
Shinsegae, Inc. | | | 1,984 | | | | 473,781 | |
| | |
SK Chemicals Co., Ltd. | | | 5,375 | | | | 331,831 | |
| | |
SK Holdings Co., Ltd. | | | 3,484 | | | | 827,585 | |
| | |
SK Hynix, Inc. | | | 24,100 | | | | 1,611,560 | |
| | |
SK Innovation Co., Ltd. | | | 24,291 | | | | 4,123,355 | |
| | |
SK Networks Co., Ltd. | | | 41,210 | | | | 220,260 | |
| | |
SK Telecom Co., Ltd. | | | 13,100 | | | | 3,032,759 | |
| | |
ViroMed Co., Ltd.(1) | | | 5,376 | | | | 1,342,900 | |
| | |
Woori Bank(1)(3) | | | 48,286 | | | | 642,280 | |
| | |
Yuhan Corp.(1) | | | 4,620 | | | | 989,086 | |
| | |
Zyle Motor Sales Corp.(1) | | | 5,113 | | | | 7,582 | |
| | |
| | | | | | | $ | 89,139,774 | |
|
| Sri Lanka — 0.7% | |
| | |
Access Engineering PLC | | | 1,359,048 | | | $ | 104,854 | |
| | |
Aitken Spence PLC | | | 984,592 | | | | 253,789 | |
| | |
Ceylon Tobacco Co. PLC | | | 122,121 | | | | 960,455 | |
| | |
Chevron Lubricants Lanka PLC | | | 686,662 | | | | 281,784 | |
| | |
Commercial Bank of Ceylon PLC | | | 1,876,179 | | | | 1,197,612 | |
| | |
DFCC Bank PLC | | | 293,137 | | | | 133,943 | |
| | |
Dialog Axiata PLC | | | 8,819,002 | | | | 489,195 | |
| | |
Hatton National Bank PLC | | | 1,114,305 | | | | 1,278,868 | |
| | |
Hemas Holdings PLC | | | 500,000 | | | | 237,939 | |
| | |
John Keells Holdings PLC | | | 2,738,134 | | | | 2,415,958 | |
| | |
Lanka IOC PLC | | | 1,004,003 | | | | 115,272 | |
| | |
Melstacorp PLC(1) | | | 5,523,537 | | | | 1,398,715 | |
| | |
National Development Bank PLC | | | 538,000 | | | | 312,978 | |
| | | | |
| | 22 | | See Notes to Financial Statements. |
Parametric
Emerging Markets Fund
January 31, 2019
Portfolio of Investments — continued
| | | | | | | | |
| Security | | Shares | | | Value | |
|
| Sri Lanka (continued) | |
| | |
Nations Trust Bank PLC(1) | | | 386,337 | | | $ | 190,909 | |
| | |
Sampath Bank PLC(1) | | | 538,064 | | | | 722,736 | |
| | |
Teejay Lanka PLC | | | 1,705,074 | | | | 334,723 | |
| | |
| | | | | | | $ | 10,429,730 | |
|
| Taiwan — 5.5% | |
| | |
AcBel Polytech, Inc. | | | 429,000 | | | $ | 284,459 | |
| | |
Acer, Inc. | | | 263,519 | | | | 171,809 | |
| | |
AirTAC International Group | | | 92,714 | | | | 1,093,495 | |
| | |
AmTRAN Technology Co., Ltd.(1) | | | 650,067 | | | | 248,407 | |
| | |
ASE Technology Holding Co., Ltd. | | | 198,561 | | | | 399,333 | |
| | |
Asia Cement Corp. | | | 280,356 | | | | 337,090 | |
| | |
Asustek Computer, Inc. | | | 40,325 | | | | 314,344 | |
| | |
AU Optronics Corp. | | | 578,837 | | | | 226,903 | |
| | |
Capital Securities Corp. | | | 761,762 | | | | 228,674 | |
| | |
Catcher Technology Co., Ltd. | | | 37,183 | | | | 286,236 | |
| | |
Cathay Financial Holding Co., Ltd. | | | 647,533 | | | | 931,201 | |
| | |
Center Laboratories, Inc. | | | 548,831 | | | | 1,470,878 | |
| | |
Chailease Holding Co., Ltd. | | | 132,328 | | | | 494,236 | |
| | |
Chang Hwa Commercial Bank, Ltd. | | | 584,655 | | | | 342,677 | |
| | |
Cheng Shin Rubber Industry Co., Ltd. | | | 593,672 | | | | 841,185 | |
| | |
Chicony Electronics Co., Ltd. | | | 100,164 | | | | 221,030 | |
| | |
China Airlines, Ltd. | | | 2,591,887 | | | | 899,081 | |
| | |
China Development Financial Holding Corp. | | | 1,527,050 | | | | 501,599 | |
| | |
China Life Insurance Co., Ltd. | | | 352,389 | | | | 321,058 | |
| | |
China Motor Corp. | | | 762,315 | | | | 596,052 | |
| | |
China Petrochemical Development Corp.(1) | | | 414,564 | | | | 145,989 | |
| | |
China Steel Corp. | | | 1,629,734 | | | | 1,358,887 | |
| | |
Chipbond Technology Corp. | | | 68,000 | | | | 151,101 | |
| | |
Chong Hong Construction Co., Ltd. | | | 184,999 | | | | 512,790 | |
| | |
Chunghwa Telecom Co., Ltd. | | | 1,412,746 | | | | 4,955,894 | |
| | |
Clevo Co. | | | 260,155 | | | | 250,515 | |
| | |
Compal Electronics, Inc. | | | 260,345 | | | | 156,124 | |
| | |
CTBC Financial Holding Co., Ltd. | | | 1,792,275 | | | | 1,220,436 | |
| | |
Delta Electronics, Inc. | | | 95,151 | | | | 475,448 | |
| | |
Dynapack International Technology Corp. | | | 97,374 | | | | 150,385 | |
| | |
E Ink Holdings, Inc. | | | 172,000 | | | | 184,268 | |
| | |
E.Sun Financial Holding Co., Ltd. | | | 1,040,040 | | | | 728,967 | |
| | |
Eclat Textile Co., Ltd. | | | 47,159 | | | | 541,994 | |
| | |
Elan Microelectronics Corp. | | | 66,710 | | | | 188,193 | |
| | |
EVA Airways Corp. | | | 1,981,733 | | | | 968,916 | |
| | |
Evergreen International Storage & Transport Corp. | | | 868,000 | | | | 382,881 | |
| | |
Evergreen Marine Corp. | | | 1,881,441 | | | | 741,240 | |
| | |
Everlight Electronics Co., Ltd. | | | 142,291 | | | | 142,849 | |
| | |
Far Eastern Department Stores, Ltd. | | | 1,001,995 | | | | 538,427 | |
| | |
Far Eastern New Century Corp. | | | 1,833,695 | | | | 1,799,850 | |
| | | | | | | | |
| Security | | Shares | | | Value | |
|
| Taiwan (continued) | |
| | |
Far EasTone Telecommunications Co., Ltd. | | | 791,084 | | | $ | 1,856,698 | |
| | |
Feng Hsin Steel Co., Ltd. | | | 183,260 | | | | 349,139 | |
| | |
First Financial Holding Co., Ltd. | | | 719,322 | | | | 479,671 | |
| | |
Formosa Chemicals & Fibre Corp. | | | 439,399 | | | | 1,529,170 | |
| | |
Formosa International Hotels Corp. | | | 118,084 | | | | 525,371 | |
| | |
Formosa Petrochemical Corp. | | | 915,320 | | | | 3,250,235 | |
| | |
Formosa Plastics Corp. | | | 480,896 | | | | 1,609,324 | |
| | |
Formosa Taffeta Co., Ltd. | | | 432,000 | | | | 498,562 | |
| | |
Formosan Rubber Group, Inc. | | | 350,730 | | | | 173,656 | |
| | |
Foxconn Technology Co., Ltd. | | | 109,087 | | | | 212,883 | |
| | |
Fubon Financial Holding Co., Ltd. | | | 692,596 | | | | 1,015,509 | |
| | |
Giant Manufacturing Co., Ltd. | | | 90,208 | | | | 452,587 | |
| | |
Goldsun Building Materials Co., Ltd. | | | 1,672,928 | | | | 477,018 | |
| | |
Great Wall Enterprise Co., Ltd. | | | 996,050 | | | | 1,135,909 | |
| | |
Highwealth Construction Corp. | | | 441,669 | | | | 696,185 | |
| | |
Hiwin Technologies Corp. | | | 115,241 | | | | 933,719 | |
| | |
Hon Hai Precision Industry Co., Ltd. | | | 546,747 | | | | 1,267,318 | |
| | |
Hota Industrial Manufacturing Co., Ltd. | | | 58,360 | | | | 233,024 | |
| | |
Hotai Motor Co., Ltd. | | | 119,000 | | | | 1,152,215 | |
| | |
Hu Lane Associate, Inc. | | | 90,000 | | | | 265,244 | |
| | |
Hua Nan Financial Holdings Co., Ltd. | | | 777,678 | | | | 469,803 | |
| | |
Innolux Corp. | | | 623,762 | | | | 215,106 | |
| | |
Inventec Corp. | | | 324,966 | | | | 253,725 | |
| | |
Kenda Rubber Industrial Co., Ltd. | | | 238,367 | | | | 233,154 | |
| | |
Kinpo Electronics, Inc. | | | 1,125,000 | | | | 411,799 | |
| | |
Largan Precision Co., Ltd. | | | 4,795 | | | | 609,676 | |
| | |
MediaTek, Inc. | | | 77,462 | | | | 627,670 | |
| | |
Mega Financial Holding Co., Ltd. | | | 1,027,730 | | | | 897,186 | |
| | |
Merida Industry Co., Ltd. | | | 54,657 | | | | 271,691 | |
| | |
Nan Kang Rubber Tire Co., Ltd. | | | 831,253 | | | | 717,427 | |
| | |
Nan Ya Plastics Corp. | | | 671,214 | | | | 1,677,146 | |
| | |
Novatek Microelectronics Corp., Ltd. | | | 41,942 | | | | 220,343 | |
| | |
Pegatron Corp. | | | 135,028 | | | | 230,653 | |
| | |
Pou Chen Corp. | | | 656,819 | | | | 796,584 | |
| | |
Powertech Technology, Inc. | | | 111,865 | | | | 262,614 | |
| | |
President Chain Store Corp. | | | 286,664 | | | | 3,044,768 | |
| | |
Quanta Computer, Inc. | | | 198,508 | | | | 365,799 | |
| | |
Radium Life Tech Co., Ltd.(1) | | | 633,422 | | | | 295,555 | |
| | |
Realtek Semiconductor Corp. | | | 46,002 | | | | 252,098 | |
| | |
Ruentex Development Co., Ltd. | | | 314,860 | | | | 482,008 | |
| | |
Sanyang Motor Co., Ltd. | | | 1,013,866 | | | | 669,655 | |
| | |
ScinoPharm Taiwan, Ltd. | | | 255,343 | | | | 224,611 | |
| | |
Shin Kong Financial Holding Co., Ltd. | | | 1,243,256 | | | | 357,120 | |
| | |
Sino-American Silicon Products, Inc. | | | 70,233 | | | | 154,517 | |
| | |
SinoPac Financial Holdings Co., Ltd. | | | 894,414 | | | | 305,186 | |
| | |
St. Shine Optical Co., Ltd. | | | 22,000 | | | | 412,747 | |
| | | | |
| | 23 | | See Notes to Financial Statements. |
Parametric
Emerging Markets Fund
January 31, 2019
Portfolio of Investments — continued
| | | | | | | | |
| Security | | Shares | | | Value | |
|
| Taiwan (continued) | |
| | |
Synnex Technology International Corp. | | | 169,358 | | | $ | 211,628 | |
| | |
Tainan Spinning Co., Ltd. | | | 941,822 | | | | 371,931 | |
| | |
Taishin Financial Holding Co., Ltd. | | | 1,129,729 | | | | 503,885 | |
| | |
Taiwan Business Bank | | | 366,613 | | | | 133,128 | |
| | |
Taiwan Cement Corp. | | | 613,513 | | | | 760,388 | |
| | |
Taiwan Cooperative Financial Holding Co., Ltd. | | | 943,886 | | | | 572,478 | |
| | |
Taiwan Fertilizer Co., Ltd. | | | 130,000 | | | | 184,761 | |
| | |
Taiwan Glass Industry Corp. | | | 542,564 | | | | 233,393 | |
| | |
Taiwan Mobile Co., Ltd. | | | 790,296 | | | | 2,824,117 | |
| | |
Taiwan Semiconductor Manufacturing Co., Ltd. | | | 697,465 | | | | 5,173,771 | |
| | |
Taiwan Tea Corp. | | | 395,711 | | | | 204,852 | |
| | |
Tatung Co., Ltd.(1) | | | 427,785 | | | | 381,901 | |
| | |
Teco Electric & Machinery Co., Ltd. | | | 1,627,000 | | | | 992,843 | |
| | |
Tong Yang Industry Co., Ltd. | | | 374,608 | | | | 479,939 | |
| | |
Tripod Technology Corp. | | | 68,535 | | | | 184,387 | |
| | |
TSRC Corp. | | | 417,063 | | | | 382,994 | |
| | |
TTY Biopharm Co., Ltd. | | | 534,330 | | | | 1,403,129 | |
| | |
Tung Ho Steel Enterprise Corp. | | | 798,060 | | | | 514,641 | |
| | |
U-Ming Marine Transport Corp. | | | 186,000 | | | | 185,873 | |
| | |
Uni-President Enterprises Corp. | | | 2,351,831 | | | | 5,573,114 | |
| | |
United Microelectronics Corp. | | | 816,090 | | | | 311,679 | |
| | |
United Renewable Energy Co., Ltd.(1) | | | 685,542 | | | | 187,122 | |
| | |
Walsin Lihwa Corp. | | | 1,614,000 | | | | 936,265 | |
| | |
Wan Hai Lines, Ltd. | | | 518,962 | | | | 267,680 | |
| | |
Waterland Financial Holdings | | | 723,556 | | | | 234,489 | |
| | |
Wei Chuan Food Corp.(1) | | | 623,000 | | | | 433,165 | |
| | |
Wistron Corp. | | | 289,489 | | | | 202,888 | |
| | |
Xxentria Technology Materials Corp. | | | 234,700 | | | | 558,004 | |
| | |
Yageo Corp. | | | 19,591 | | | | 214,215 | |
| | |
Yang Ming Marine Transport(1) | | | 1,153,621 | | | | 338,846 | |
| | |
YFY, Inc. | | | 531,120 | | | | 201,062 | |
| | |
Yieh Phui Enterprise Co., Ltd. | | | 1,480,438 | | | | 486,145 | |
| | |
Yuanta Financial Holding Co., Ltd. | | | 843,629 | | | | 472,016 | |
| | |
Yulon Motor Co., Ltd. | | | 454,950 | | | | 273,870 | |
| | |
| | | | | | | $ | 84,767,578 | |
|
| Thailand — 3.0% | |
| | |
Advanced Info Service PCL(7) | | | 410,700 | | | $ | 2,355,924 | |
| | |
Airports of Thailand PCL(7) | | | 1,290,100 | | | | 2,857,017 | |
| | |
AP Thailand PCL(7) | | | 1,657,700 | | | | 371,695 | |
| | |
Bangkok Bank PCL(7) | | | 101,600 | | | | 701,090 | |
| | |
Bangkok Dusit Medical Services PCL(7) | | | 2,943,300 | | | | 2,225,437 | |
| | |
Bangkok Land PCL(7) | | | 7,258,500 | | | | 390,704 | |
| | |
Banpu PCL(7) | | | 403,300 | | | | 215,011 | |
| | |
BEC World PCL(1)(7) | | | 1,120,800 | | | | 196,098 | |
| | |
Berli Jucker PCL(7) | | | 285,600 | | | | 446,677 | |
| | | | | | | | |
| Security | | Shares | | | Value | |
|
| Thailand (continued) | |
| | |
BTS Group Holdings PCL(7) | | | 1,624,000 | | | $ | 520,813 | |
| | |
Bumrungrad Hospital PCL(7) | | | 295,800 | | | | 1,762,479 | |
| | |
Central Pattana PCL(7) | | | 537,000 | | | | 1,374,216 | |
| | |
Central Plaza Hotel PCL(7) | | | 268,400 | | | | 370,628 | |
| | |
CH. Karnchang PCL(7) | | | 187,120 | | | | 154,533 | |
| | |
Charoen Pokphand Foods PCL(7) | | | 793,800 | | | | 693,603 | |
| | |
CP ALL PCL(7) | | | 829,400 | | | | 2,067,201 | |
| | |
Delta Electronics (Thailand) PCL(7) | | | 663,300 | | | | 1,477,112 | |
| | |
Electricity Generating PCL(7) | | | 185,800 | | | | 1,559,734 | |
| | |
Glow Energy PCL(7) | | | 391,300 | | | | 1,157,105 | |
| | |
Hana Microelectronics PCL(7) | | | 933,400 | | | | 1,033,135 | |
| | |
Home Product Center PCL(7) | | | 2,064,255 | | | | 1,032,629 | |
| | |
Indorama Ventures PCL(7) | | | 657,600 | | | | 1,014,070 | |
| | |
IRPC PCL(7) | | | 2,114,500 | | | | 390,367 | |
| | |
Italian-Thai Development PCL(1)(7) | | | 2,682,406 | | | | 219,942 | |
| | |
Jasmine International PCL(7) | | | 662,900 | | | | 108,530 | |
| | |
Kasikornbank PCL(7) | | | 193,300 | | | | 1,240,519 | |
| | |
KCE Electronics PCL(7) | | | 562,600 | | | | 473,691 | |
| | |
Khon Kaen Sugar Industry PCL(7) | | | 1,189,180 | | | | 121,377 | |
| | |
Kiatnakin Bank PCL(7) | | | 103,100 | | | | 226,618 | |
| | |
Krung Thai Bank PCL(7) | | | 535,400 | | | | 340,044 | |
| | |
L.P.N. Development PCL(7) | | | 1,255,000 | | | | 283,826 | |
| | |
Land & Houses PCL(7) | | | 2,593,500 | | | | 889,518 | |
| | |
Minor International PCL(7) | | | 1,283,877 | | | | 1,598,282 | |
| | |
Pruksa Holding PCL(7) | | | 518,200 | | | | 295,558 | |
| | |
PTT Exploration & Production PCL(7) | | | 259,798 | | | | 1,026,164 | |
| | |
PTT Global Chemical PCL(7) | | | 470,200 | | | | 1,027,111 | |
| | |
PTT PCL(7) | | | 1,396,800 | | | | 2,175,141 | |
| | |
Quality House PCL(7) | | | 6,862,846 | | | | 651,535 | |
| | |
Ratchaburi Electricity Generating Holding PCL(7) | | | 441,300 | | | | 784,802 | |
| | |
Robinson PCL(7) | | | 315,200 | | | | 687,121 | |
| | |
Samart Corp. PCL(7) | | | 867,800 | | | | 186,581 | |
| | |
Siam Cement PCL(7) | | | 94,300 | | | | 1,412,502 | |
| | |
Siam City Cement PCL(7) | | | 39,783 | | | | 295,637 | |
| | |
Siam Commercial Bank PCL(7) | | | 281,600 | | | | 1,201,054 | |
| | |
Siam Global House PCL (The)(7) | | | 1,162,656 | | | | 696,927 | |
| | |
Sino-Thai Engineering & Construction PCL(1)(7) | | | 452,157 | | | | 328,879 | |
| | |
Super Energy Corp. PCL(1)(7) | | | 11,910,000 | | | | 221,556 | |
| | |
Thai Airways International PCL(1)(7) | | | 472,700 | | | | 201,827 | |
| | |
Thai Beverage PCL(7) | | | 1,968,200 | | | | 1,067,001 | |
| | |
Thai Oil PCL(7) | | | 158,700 | | | | 366,863 | |
| | |
Thai Union Group PCL(7) | | | 465,900 | | | | 279,286 | |
| | |
Thanachart Capital PCL(7) | | | 139,700 | | | | 240,806 | |
| | |
Thoresen Thai Agencies PCL(7) | | | 1,334,265 | | | | 220,472 | |
| | |
TMB Bank PCL(7) | | | 4,639,200 | | | | 327,263 | |
| | |
Total Access Communication PCL(7) | | | 473,300 | | | | 728,133 | |
| | | | |
| | 24 | | See Notes to Financial Statements. |
Parametric
Emerging Markets Fund
January 31, 2019
Portfolio of Investments — continued
| | | | | | | | |
| Security | | Shares | | | Value | |
|
| Thailand (continued) | |
| | |
TPI Polene PCL(7) | | | 4,974,200 | | | $ | 340,665 | |
| | |
True Corp. PCL(7) | | | 5,357,890 | | | | 877,459 | |
| | |
TTW PCL(7) | | | 2,149,000 | | | | 873,522 | |
| | |
| | | | | | | $ | 46,383,490 | |
|
| Tunisia — 0.3% | |
| | |
Attijari Bank | | | 16,957 | | | $ | 236,703 | |
| | |
Banque de Tunisie | | | 168,735 | | | | 444,573 | |
| | |
Banque Internationale Arabe de Tunisie | | | 8,448 | | | | 334,450 | |
| | |
Banque Nationale Agricole(1) | | | 87,115 | | | | 385,302 | |
| | |
Carthage Cement(1) | | | 597,550 | | | | 262,134 | |
| | |
Euro Cycles SA | | | 18,760 | | | | 99,874 | |
| | |
Poulina Group | | | 122,715 | | | | 667,476 | |
| | |
Societe d’Articles Hygieniques SA(1) | | | 95,830 | | | | 350,126 | |
| | |
Societe Frigorifique et Brasserie de Tunis SA | | | 92,682 | | | | 723,727 | |
| | |
Telnet Holding | | | 95,416 | | | | 356,852 | |
| | |
Union Internationale de Banques SA | | | 40,688 | | | | 302,473 | |
| | |
| | | | | | | $ | 4,163,690 | |
|
| Turkey — 3.1% | |
| | |
AG Anadolu Grubu Holding AS | | | 109,884 | | | $ | 272,553 | |
| | |
Akbank T.A.S. | | | 1,154,240 | | | | 1,585,128 | |
| | |
Aksa Akrilik Kimya Sanayii AS | | | 251,413 | | | | 422,164 | |
| | |
Aksa Enerji Uretim AS(1) | | | 600,923 | | | | 350,996 | |
| | |
Albaraka Turk Katilim Bankasi AS | | | 522,467 | | | | 128,518 | |
| | |
Anadolu Efes Biracilik ve Malt Sanayii AS | | | 199,790 | | | | 853,308 | |
| | |
Arcelik AS | | | 516,256 | | | | 1,852,201 | |
| | |
Aygaz AS | | | 279,132 | | | | 658,369 | |
| | |
BIM Birlesik Magazalar AS | | | 186,400 | | | | 3,257,245 | |
| | |
Cimsa Cimento Sanayi ve Ticaret AS | | | 141,400 | | | | 223,013 | |
| | |
Coca-Cola Icecek AS | | | 102,495 | | | | 655,776 | |
| | |
Dogan Sirketler Grubu Holding AS(1) | | | 907,806 | | | | 198,447 | |
| | |
EIS Eczacibasi Ilac ve Sinai ve Finansal Yatirimlar Sanayi ve Ticaret AS | | | 440,700 | | | | 253,637 | |
| | |
Emlak Konut Gayrimenkul Yatirim Ortakligi AS | | | 8,770,367 | | | | 2,682,147 | |
| | |
Enka Insaat ve Sanayi AS | | | 910,424 | | | | 871,261 | |
| | |
Eregli Demir ve Celik Fabrikalari TAS | | | 1,987,373 | | | | 3,264,136 | |
| | |
Ford Otomotiv Sanayi AS | | | 157,461 | | | | 1,827,191 | |
| | |
Haci Omer Sabanci Holding AS | | | 498,524 | | | | 904,876 | |
| | |
Is Gayrimenkul Yatirim Ortakligi AS | | | 1,682,412 | | | | 345,859 | |
| | |
Kardemir Karabuk Demir Celik Sanayi ve Ticaret AS, Class D(1) | | | 1,752,188 | | | | 889,772 | |
| | |
KOC Holding AS | | | 538,149 | | | | 1,804,472 | |
| | |
Koza Altin Isletmeleri AS(1) | | | 77,300 | | | | 802,722 | |
| | |
Migros Ticaret AS(1) | | | 75,000 | | | | 247,055 | |
| | |
Net Holding AS(1) | | | 325,363 | | | | 116,368 | |
| | | | | | | | |
| Security | | Shares | | | Value | |
|
| Turkey (continued) | |
| | |
Pegasus Hava Tasimaciligi AS(1) | | | 36,600 | | | $ | 214,566 | |
| | |
Petkim Petrokimya Holding AS | | | 1,139,360 | | | | 1,272,951 | |
| | |
TAV Havalimanlari Holding AS | | | 101,888 | | | | 550,169 | |
| | |
Tekfen Holding AS | | | 99,500 | | | | 474,617 | |
| | |
Tofas Turk Otomobil Fabrikasi AS | | | 266,109 | | | | 1,085,154 | |
| | |
Trakya Cam Sanayii AS | | | 365,441 | | | | 256,879 | |
| | |
Tupras-Turkiye Petrol Rafinerileri AS | | | 246,878 | | | | 6,642,401 | |
| | |
Turk Hava Yollari AO(1) | | | 406,634 | | | | 1,211,345 | |
| | |
Turk Sise ve Cam Fabrikalari AS | | | 339,000 | | | | 446,087 | |
| | |
Turk Telekomunikasyon AS(1) | | | 1,160,995 | | | | 1,133,990 | |
| | |
Turkcell Iletisim Hizmetleri AS | | | 2,012,673 | | | | 5,651,411 | |
| | |
Turkiye Garanti Bankasi AS | | | 882,172 | | | | 1,547,725 | |
| | |
Turkiye Halk Bankasi AS | | | 267,144 | | | | 393,829 | |
| | |
Turkiye Is Bankasi AS, Class C | | | 563,039 | | | | 619,647 | |
| | |
Turkiye Sinai Kalkinma Bankasi AS | | | 1,026,653 | | | | 168,993 | |
| | |
Turkiye Vakiflar Bankasi TAO, Class D | | | 458,258 | | | | 424,696 | |
| | |
Ulker Biskuvi Sanayi AS | | | 213,500 | | | | 761,765 | |
| | |
Vestel Elektronik Sanayi ve Ticaret AS(1) | | | 242,175 | | | | 318,801 | |
| | |
Yapi ve Kredi Bankasi AS(1) | | | 609,032 | | | | 230,137 | |
| | |
| | | | | | | $ | 47,872,377 | |
|
| United Arab Emirates — 1.4% | |
| | |
Abu Dhabi Commercial Bank PJSC | | | 762,399 | | | $ | 1,944,173 | |
| | |
Abu Dhabi National Hotels | | | 108,000 | | | | 83,241 | |
| | |
Agthia Group PJSC | | | 883,903 | | | | 936,551 | |
| | |
Air Arabia PJSC | | | 2,563,979 | | | | 698,336 | |
| | |
Al Waha Capital PJSC | | | 702,377 | | | | 344,864 | |
| | |
Aldar Properties PJSC | | | 2,692,498 | | | | 1,168,304 | |
| | |
Arabtec Holding PJSC | | | 1,029,141 | | | | 606,265 | |
| | |
Dana Gas PJSC | | | 4,421,906 | | | | 1,082,336 | |
| | |
DP World, Ltd. | | | 175,489 | | | | 3,119,415 | |
| | |
Dubai Financial Market PJSC | | | 801,704 | | | | 183,142 | |
| | |
Dubai Investments PJSC | | | 1,856,227 | | | | 667,950 | |
| | |
Dubai Islamic Bank PJSC | | | 593,639 | | | | 824,582 | |
| | |
DXB Entertainments PJSC(1) | | | 3,800,000 | | | | 277,189 | |
| | |
Emaar Properties PJSC | | | 2,521,156 | | | | 2,973,136 | |
| | |
Emirates Telecommunications Group Co. PJSC | | | 577,000 | | | | 2,676,403 | |
| | |
First Abu Dhabi Bank PJSC | | | 949,103 | | | | 3,813,420 | |
| | |
RAK Properties PJSC | | | 2,150,800 | | | | 272,258 | |
| | |
| | | | | | | $ | 21,671,565 | |
|
| Vietnam — 1.4% | |
| | |
Bank for Foreign Trade of Vietnam JSC | | | 964,355 | | | $ | 2,371,637 | |
| | |
Bao Viet Holdings | | | 307,150 | | | | 1,226,293 | |
| | |
Development Investment Construction Corp.(1) | | | 341,447 | | | | 231,310 | |
| | | | |
| | 25 | | See Notes to Financial Statements. |
Parametric
Emerging Markets Fund
January 31, 2019
Portfolio of Investments — continued
| | | | | | | | |
| Security | | Shares | | | Value | |
|
| Vietnam (continued) | |
| | |
FLC Faros Construction JSC(1) | | | 383,532 | | | $ | 519,830 | |
| | |
FPT Corp. | | | 80,712 | | | | 151,275 | |
| | |
HAGL JSC(1) | | | 1,155,511 | | | | 249,795 | |
| | |
Hoa Phat Group JSC(1) | | | 2,092,337 | | | | 2,507,809 | |
| | |
KIDO Group Corp. | | | 529,520 | | | | 457,927 | |
| | |
Kinh Bac City Development Share Holding Corp.(1) | | | 328,860 | | | | 200,684 | |
| | |
Masan Group Corp.(1) | | | 377,350 | | | | 1,269,028 | |
| | |
PetroVietnam Drilling & Well Services JSC(1) | | | 813,305 | | | | 574,850 | |
| | |
PetroVietnam Fertilizer & Chemical JSC | | | 685,220 | | | | 671,809 | |
| | |
PetroVietnam Gas JSC | | | 215,050 | | | | 818,618 | |
| | |
PetroVietnam Technical Services Corp. | | | 817,700 | | | | 653,568 | |
| | |
Phu Nhuan Jewelry JSC | | | 37,990 | | | | 156,150 | |
| | |
SSI Securities Corp. | | | 198,000 | | | | 224,062 | |
| | |
Vietjet Aviation JSC | | | 278,536 | | | | 1,487,399 | |
| | |
Vietnam Dairy Products JSC | | | 471,127 | | | | 2,745,387 | |
| | |
Vietnam Joint Stock Commercial Bank for Industry and Trade(1) | | | 3 | | | | 3 | |
| | |
Vingroup JSC(1) | | | 1,036,707 | | | | 4,653,142 | |
| | |
| | | | | | | $ | 21,170,576 | |
| |
Total Common Stocks
(identified cost $1,331,335,169) | | | $ | 1,537,976,802 | |
|
| Rights(1) — 0.0% | |
| Security | | Shares | | | Value | |
| | |
Attijari Bank, Exp. 5/25/48 | | | 28 | | | $ | 0 | |
| | |
Banque Nationale Agricole, Exp. 6/20/48 | | | 6 | | | | 0 | |
| | |
Societe d’Articles Hygieniques SA, Exp. 8/6/48 | | | 7 | | | | 0 | |
| | |
Societe d’Articles Hygieniques SA, Exp. 12/3/48 | | | 13 | | | | 0 | |
| |
Total Rights
(identified cost $0) | | | $ | 0 | |
| |
Total Investments — 99.8%
(identified cost $1,331,335,169) | | | $ | 1,537,976,802 | |
| |
Other Assets, Less Liabilities — 0.2% | | | $ | 3,541,552 | |
| |
Net Assets — 100.0% | | | $ | 1,541,518,354 | |
The percentage shown for each investment category in the Portfolio of Investments is based on net assets.
| (1) | Non-income producing security. |
| (2) | Security exempt from registration pursuant to Rule 144A under the Securities Act of 1933, as amended. These securities may be sold in certain transactions in reliance on an exemption from registration (normally to qualified institutional buyers). At January 31, 2019, the aggregate value of these securities is $7,720,441 or 0.5% of the Fund’s net assets. |
| (3) | For fair value measurement disclosure purposes, security is categorized as Level 3 (see Note 10). |
| (4) | Security exempt from registration under Regulation S of the Securities Act of 1933, which exempts from registration securities offered and sold outside the United States. Security may not be offered or sold in the United States except pursuant to an exemption from, or in a transaction not subject to, the registration requirements of the Securities Act of 1933. At January 31, 2019, the aggregate value of these securities is $24,604,582 or 1.6% of the Fund’s net assets. |
| (5) | Amount is less than 0.05%. |
| (6) | Securities are traded on separate exchanges for the same entity. |
| (7) | Indicates a foreign registered security. Shares issued to foreign investors in markets that have foreign ownership limits. |
| | | | | | | | |
| Currency Concentration of Portfolio | |
| Currency | | Percentage
of Net Assets | | | Value | |
| | |
Hong Kong Dollar | | | 9.3 | % | | $ | 143,957,238 | |
| | |
United States Dollar | | | 8.2 | | | | 127,391,227 | |
| | |
Brazilian Real | | | 6.2 | | | | 95,170,887 | |
| | |
South African Rand | | | 5.9 | | | | 91,023,517 | |
| | |
South Korean Won | | | 5.8 | | | | 89,088,640 | |
| | |
Indian Rupee | | | 5.5 | | | | 85,405,079 | |
| | |
Mexican Peso | | | 5.5 | | | | 84,842,351 | |
| | |
New Taiwan Dollar | | | 5.5 | | | | 84,767,578 | |
| | |
New Turkish Lira | | | 3.1 | | | | 47,872,377 | |
| | |
Indonesian Rupiah | | | 3.1 | | | | 47,100,558 | |
| | |
Chilean Peso | | | 3.0 | | | | 45,877,817 | |
| | |
Philippine Peso | | | 3.0 | | | | 45,757,240 | |
| | |
Thai Baht | | | 2.9 | | | | 45,316,489 | |
| | |
Polish Zloty | | | 2.9 | | | | 44,227,226 | |
| | |
Malaysian Ringgit | | | 2.8 | | | | 43,100,532 | |
| | |
Euro | | | 2.8 | | | | 42,974,753 | |
| | |
Russian Ruble | | | 2.0 | | | | 31,823,514 | |
| | |
Kuwaiti Dinar | | | 1.8 | | | | 28,481,159 | |
| | |
United Arab Emirates Dirham | | | 1.5 | | | | 22,888,918 | |
| | |
Chinese Yuan Renminbi | | | 1.5 | | | | 22,584,312 | |
| | |
Saudi Riyal | | | 1.4 | | | | 22,159,929 | |
| | |
Vietnamese Dong | | | 1.4 | | | | 21,170,576 | |
| | |
Colombian Peso | | | 1.4 | | | | 21,099,552 | |
| | |
Qatari Riyal | | | 1.4 | | | | 20,818,970 | |
| | |
Other currency, less than 1% each | | | 11.9 | | | | 183,076,363 | |
| | |
Total Investments | | | 99.8 | % | | $ | 1,537,976,802 | |
| | | | |
| | 26 | | See Notes to Financial Statements. |
Parametric
Emerging Markets Fund
January 31, 2019
Portfolio of Investments — continued
| | | | | | | | |
| Sector Classification of Portfolio | |
| Sector | | Percentage
of Net Assets | | | Value | |
| | |
Financials | | | 19.0 | % | | $ | 293,180,849 | |
| | |
Materials | | | 11.2 | | | | 172,668,520 | |
| | |
Consumer Staples | | | 11.0 | | | | 169,488,812 | |
| | |
Industrials | | | 10.9 | | | | 167,571,702 | |
| | |
Communication Services | | | 9.7 | | | | 150,036,474 | |
| | |
Energy | | | 9.5 | | | | 146,082,738 | |
| | |
Consumer Discretionary | | | 8.4 | | | | 129,602,919 | |
| | |
Utilities | | | 6.2 | | | | 96,074,580 | |
| | |
Health Care | | | 5.3 | | | | 80,971,056 | |
| | |
Real Estate | | | 4.5 | | | | 69,445,689 | |
| | |
Information Technology | | | 4.1 | | | | 62,853,463 | |
| | |
Total Investments | | | 99.8 | % | | $ | 1,537,976,802 | |
Abbreviations:
| | | | |
| | |
| ADR | | – | | American Depositary Receipt |
| | |
| GDR | | – | | Global Depositary Receipt |
| | |
| PCL | | – | | Public Company Ltd. |
| | |
| PFC Shares | | – | | Preference Shares |
| | | | |
| | 27 | | See Notes to Financial Statements. |
Parametric
Emerging Markets Fund
January 31, 2019
Statement of Assets and Liabilities
| | | | |
| Assets | | January 31, 2019 | |
| |
Unaffiliated investments, at value (identified cost, $1,331,335,169) | | $ | 1,537,976,802 | |
| |
Cash | | | 2,663,171 | |
| |
Foreign currency, at value (identified cost, $1,148,330) | | | 1,150,787 | |
| |
Dividends receivable | | | 2,783,351 | |
| |
Receivable for investments sold | | | 2,845,717 | |
| |
Receivable for Fund shares sold | | | 2,023,247 | |
| |
Tax reclaims receivable | | | 71,521 | |
| |
Other assets | | | 7,366 | |
| |
Total assets | | $ | 1,549,521,962 | |
| |
| Liabilities | | | | |
| |
Payable for investments purchased | | $ | 53,597 | |
| |
Payable for Fund shares redeemed | | | 4,740,599 | |
| |
Payable to affiliates: | | | | |
| |
Investment adviser fee | | | 1,016,774 | |
| |
Administration fee | | | 188,576 | |
| |
Distribution and service fees | | | 41,072 | |
| |
Accrued foreign capital gains taxes | | | 885,641 | |
| |
Accrued expenses | | | 1,077,349 | |
| |
Total liabilities | | $ | 8,003,608 | |
| |
Net Assets | | $ | 1,541,518,354 | |
| |
| Sources of Net Assets | | | | |
| |
Paid-in capital | | $ | 1,676,331,421 | |
| |
Accumulated loss | | | (134,813,067 | ) |
| |
Total | | $ | 1,541,518,354 | |
| |
| Investor Class Shares | | | | |
| |
Net Assets | | $ | 172,773,068 | |
| |
Shares Outstanding | | | 12,099,777 | |
| |
Net Asset Value, Offering Price and Redemption Price Per Share | | | | |
| |
(net assets ÷ shares of beneficial interest outstanding) | | $ | 14.28 | |
| |
| Class C Shares | | | | |
| |
Net Assets | | $ | 5,884,832 | |
| |
Shares Outstanding | | | 420,003 | |
| |
Net Asset Value and Offering Price Per Share* | | | | |
| |
(net assets ÷ shares of beneficial interest outstanding) | | $ | 14.01 | |
| |
| Institutional Class Shares | | | | |
| |
Net Assets | | $ | 1,268,617,894 | |
| |
Shares Outstanding | | | 88,634,378 | |
| |
Net Asset Value, Offering Price and Redemption Price Per Share | | | | |
| |
(net assets ÷ shares of beneficial interest outstanding) | | $ | 14.31 | |
| |
| Class R6 Shares | | | | |
| |
Net Assets | | $ | 94,242,560 | |
| |
Shares Outstanding | | | 6,588,707 | |
| |
Net Asset Value, Offering Price and Redemption Price Per Share | | | | |
| |
(net assets ÷ shares of beneficial interest outstanding) | | $ | 14.30 | |
| * | Redemption price per share is equal to the net asset value less any applicable contingent deferred sales charge. |
| | | | |
| | 28 | | See Notes to Financial Statements. |
Parametric
Emerging Markets Fund
January 31, 2019
Statement of Operations
| | | | |
| Investment Income | | Year Ended
January 31, 2019 | |
| |
Dividends (net of foreign taxes, $8,384,175) | | $ | 72,052,673 | |
| |
Interest | | | 12,952 | |
| |
Total investment income | | $ | 72,065,625 | |
| |
| Expenses | | | | |
| |
Investment adviser fee | | $ | 17,428,449 | |
| |
Administration fee | | | 3,281,395 | |
| |
Distribution and service fees | | | | |
| |
Investor Class | | | 647,534 | |
| |
Class C | | | 82,292 | |
| |
Trustees’ fees and expenses | | | 89,070 | |
| |
Custodian fee | | | 2,720,322 | |
| |
Transfer and dividend disbursing agent fees | | | 1,284,635 | |
| |
Legal and accounting services | | | 150,210 | |
| |
Printing and postage | | | 291,121 | |
| |
Registration fees | | | 116,224 | |
| |
Interest expense and fees | | | 289,741 | |
| |
Miscellaneous | | | 187,278 | |
| |
Total expenses | | $ | 26,568,271 | |
| |
Net investment income | | $ | 45,497,354 | |
| |
| Realized and Unrealized Gain (Loss) | | | | |
| |
Net realized gain (loss) — | | | | |
| |
Investment transactions (net of foreign capital gains taxes of $284,339) | | $ | 38,311,124 | |
| |
Foreign currency transactions | | | (1,880,111 | ) |
| |
Net realized gain | | $ | 36,431,013 | |
| |
Change in unrealized appreciation (depreciation) — | | | | |
| |
Investments (including net increase in accrued foreign capital gains taxes of $11,166) | | $ | (493,193,714 | ) |
| |
Foreign currency | | | (22,139 | ) |
| |
Net change in unrealized appreciation (depreciation) | | $ | (493,215,853 | ) |
| |
Net realized and unrealized loss | | $ | (456,784,840 | ) |
| |
Net decrease in net assets from operations | | $ | (411,287,486 | ) |
| | | | |
| | 29 | | See Notes to Financial Statements. |
Parametric
Emerging Markets Fund
January 31, 2019
Statements of Changes in Net Assets
| | | | | | | | |
| | | Year Ended January 31, | |
| Increase (Decrease) in Net Assets | | 2019 | | | 2018 | |
| | |
From operations — | | | | | | | | |
| | |
Net investment income | | $ | 45,497,354 | | | $ | 48,219,970 | |
| | |
Net realized gain | | | 36,431,013 | | | | 14,886,813 | |
| | |
Net change in unrealized appreciation (depreciation) | | | (493,215,853 | ) | | | 704,772,106 | |
| | |
Net increase (decrease) in net assets from operations | | $ | (411,287,486 | ) | | $ | 767,878,889 | |
| | |
Distributions to shareholders(1) — | | | | | | | | |
| | |
Investor Class | | $ | (3,545,868 | ) | | $ | (10,183,156 | ) |
| | |
Class C | | | (92,406 | ) | | | (168,458 | ) |
| | |
Institutional Class | | | (30,416,590 | ) | | | (49,803,465 | ) |
| | |
Class R6 | | | (2,160,862 | ) | | | (16,110,983 | ) |
| | |
Total distributions to shareholders | | $ | (36,215,726 | ) | | $ | (76,266,062 | ) |
| | |
Transactions in shares of beneficial interest — | | | | | | | | |
| | |
Proceeds from sale of shares | | | | | | | | |
| | |
Investor Class | | $ | 41,632,451 | | | $ | 55,520,901 | |
| | |
Class C | | | 206,360 | | | | 885,164 | |
| | |
Institutional Class | | | 280,037,814 | | | | 420,440,001 | |
| | |
Class R6 | | | 38,528,359 | | | | 80,751,262 | |
| | |
Net asset value of shares issued to shareholders in payment of distributions declared | | | | | | | | |
| | |
Investor Class | | | 3,432,138 | | | | 9,992,931 | |
| | |
Class C | | | 87,818 | | | | 158,118 | |
| | |
Institutional Class | | | 23,229,644 | | | | 36,505,344 | |
| | |
Class R6 | | | 2,160,862 | | | | 15,633,121 | |
| | |
Cost of shares redeemed | | | | | | | | |
| | |
Investor Class | | | (220,377,035 | ) | | | (292,705,286 | ) |
| | |
Class C | | | (1,907,825 | ) | | | (2,294,846 | ) |
| | |
Institutional Class | | | (757,598,270 | ) | | | (756,611,346 | ) |
| | |
Class R6 | | | (463,667,721 | ) | | | (171,183,425 | ) |
| | |
Net asset value of shares converted | | | | | | | | |
| | |
Investor Class | | | 1,071,377 | | | | — | |
| | |
Class C | | | (1,071,377 | ) | | | — | |
| | |
Net decrease in net assets from Fund share transactions | | $ | (1,054,235,405 | ) | | $ | (602,908,061 | ) |
| | |
Net increase (decrease) in net assets | | $ | (1,501,738,617 | ) | | $ | 88,704,766 | |
|
| Net Assets | |
| | |
At beginning of year | | $ | 3,043,256,971 | | | $ | 2,954,552,205 | |
| | |
At end of year | | $ | 1,541,518,354 | | | $ | 3,043,256,971 | (2) |
| (1) | For the year ended January 31, 2018, the source of distributions was from net investment income. The current year presentation of distributions conforms with the Disclosure Update and Simplification Rule issued by the Securities and Exchange Commission, effective November 5, 2018. |
| (2) | Includes accumulated distributions in excess of net investment income of $(23,728,662) at January 31, 2018. The requirement to disclose the corresponding amount as of January 31, 2019 was eliminated. |
| | | | |
| | 30 | | See Notes to Financial Statements. |
Parametric
Emerging Markets Fund
January 31, 2019
Financial Highlights
| | | | | | | | | | | | | | | | | | | | |
| | | Investor Class | |
| |
| | | Year Ended January 31, | |
| | | 2019 | | | 2018 | | | 2017 | | | 2016 | | | 2015 | |
| | | | | | |
Net asset value — Beginning of year | | $ | 16.850 | | | $ | 13.340 | | | $ | 10.990 | | | $ | 13.850 | | | $ | 14.070 | |
| | | | | |
| Income (Loss) From Operations | | | | | | | | | | | | | | | | | | | | |
| | | | | |
Net investment income(1) | | $ | 0.283 | | | $ | 0.223 | | | $ | 0.179 | | | $ | 0.185 | | | $ | 0.204 | |
| | | | | |
Net realized and unrealized gain (loss) | | | (2.570 | ) | | | 3.650 | | | | 2.364 | | | | (2.851 | ) | | | (0.166 | ) |
| | | | | |
Total income (loss) from operations | | $ | (2.287 | ) | | $ | 3.873 | | | $ | 2.543 | | | $ | (2.666 | ) | | $ | 0.038 | |
| | | | | |
| Less Distributions | | | | | | | | | | | | | | | | | | | | |
| | | | | |
From net investment income | | $ | (0.283 | ) | | $ | (0.363 | ) | | $ | (0.193 | ) | | $ | (0.016 | ) | | $ | (0.180 | ) |
| | | | | |
From net realized gain | | | — | | | | — | | | | — | | | | (0.178 | ) | | | (0.078 | ) |
| | | | | |
Total distributions | | $ | (0.283 | ) | | $ | (0.363 | ) | | $ | (0.193 | ) | | $ | (0.194 | ) | | $ | (0.258 | ) |
| | | | | |
Net asset value — End of year | | $ | 14.280 | | | $ | 16.850 | | | $ | 13.340 | | | $ | 10.990 | | | $ | 13.850 | |
| | | | | |
Total Return(2) | | | (13.43 | )% | | | 29.33 | % | | | 23.32 | % | | | (19.59 | )% | | | 0.25 | % |
| | | | | |
| Ratios/Supplemental Data | | | | | | | | | | | | | | | | | | | | |
| | | | | |
Net assets, end of year (000’s omitted) | | $ | 172,773 | | | $ | 400,814 | | | $ | 520,939 | | | $ | 527,198 | | | $ | 599,094 | |
| | | | | |
Ratios (as a percentage of average daily net assets): | | | | | | | | | | | | | | | | | | | | |
| | | | | |
Expenses(3) | | | 1.44 | % | | | 1.37 | % | | | 1.38 | % | | | 1.37 | % | | | 1.36 | % |
| | | | | |
Net investment income | | | 1.89 | % | | | 1.52 | % | | | 1.44 | % | | | 1.43 | % | | | 1.34 | % |
| | | | | |
Portfolio Turnover | | | 2 | % | | | 3 | % | | | 6 | % | | | 8 | % | | | 9 | % |
| (1) | Computed using average shares outstanding. |
| (2) | Returns are historical and are calculated by determining the percentage change in net asset value with all distributions reinvested. |
| (3) | Excludes the effect of custody fee credits, if any, of less than 0.005%. Effective September 1, 2015, custody fee credits, which were earned on cash deposit balances, were discontinued by the custodian. |
| | | | |
| | 31 | | See Notes to Financial Statements. |
Parametric
Emerging Markets Fund
January 31, 2019
Financial Highlights — continued
| | | | | | | | | | | | | | | | | | | | |
| | | Class C | |
| |
| | | Year Ended January 31, | |
| | | 2019 | | | 2018 | | | 2017 | | | 2016 | | | 2015 | |
| | | | | | |
Net asset value — Beginning of year | | $ | 16.530 | | | $ | 13.120 | | | $ | 10.840 | | | $ | 13.760 | | | $ | 13.960 | |
| | | | | |
| Income (Loss) From Operations | | | | | | | | | | | | | | | | | | | | |
| | | | | |
Net investment income(1) | | $ | 0.146 | | | $ | 0.096 | | | $ | 0.083 | | | $ | 0.096 | | | $ | 0.094 | |
| | | | | |
Net realized and unrealized gain (loss) | | | (2.484 | ) | | | 3.580 | | | | 2.340 | | | | (2.834 | ) | | | (0.163 | ) |
| | | | | |
Total income (loss) from operations | | $ | (2.338 | ) | | $ | 3.676 | | | $ | 2.423 | | | $ | (2.738 | ) | | $ | (0.069 | ) |
| | | | | |
| Less Distributions | | | | | | | | | | | | | | | | | | | | |
| | | | | |
From net investment income | | $ | (0.182 | ) | | $ | (0.266 | ) | | $ | (0.143 | ) | | $ | (0.004 | ) | | $ | (0.053 | ) |
| | | | | |
From net realized gain | | | — | | | | — | | | | — | | | | (0.178 | ) | | | (0.078 | ) |
| | | | | |
Total distributions | | $ | (0.182 | ) | | $ | (0.266 | ) | | $ | (0.143 | ) | | $ | (0.182 | ) | | $ | (0.131 | ) |
| | | | | |
Net asset value — End of year | | $ | 14.010 | | | $ | 16.530 | | | $ | 13.120 | | | $ | 10.840 | | | $ | 13.760 | |
| | | | | |
Total Return(2) | | | (14.10 | )% | | | 28.32 | % | | | 22.50 | % | | | (20.23 | )% | | | (0.51 | )% |
| | | | | |
| Ratios/Supplemental Data | | | | | | | | | | | | | | | | | | | | |
| | | | | |
Net assets, end of year (000’s omitted) | | $ | 5,885 | | | $ | 10,152 | | | $ | 9,209 | | | $ | 9,573 | | | $ | 15,996 | |
| | | | | |
Ratios (as a percentage of average daily net assets): | | | | | | | | | | | | | | | | | | | | |
| | | | | |
Expenses(3) | | | 2.19 | % | | | 2.12 | % | | | 2.13 | % | | | 2.12 | % | | | 2.11 | % |
| | | | | |
Net investment income | | | 1.01 | % | | | 0.66 | % | | | 0.68 | % | | | 0.74 | % | | | 0.63 | % |
| | | | | |
Portfolio Turnover | | | 2 | % | | | 3 | % | | | 6 | % | | | 8 | % | | | 9 | % |
| (1) | Computed using average shares outstanding. |
| (2) | Returns are historical and are calculated by determining the percentage change in net asset value with all distributions reinvested and do not reflect the effect of sales charges. |
| (3) | Excludes the effect of custody fee credits, if any, of less than 0.005%. Effective September 1, 2015, custody fee credits, which were earned on cash deposit balances, were discontinued by the custodian. |
| | | | |
| | 32 | | See Notes to Financial Statements. |
Parametric
Emerging Markets Fund
January 31, 2019
Financial Highlights — continued
| | | | | | | | | | | | | | | | | | | | |
| | | Institutional Class | |
| |
| | | Year Ended January 31, | |
| | | 2019 | | | 2018 | | | 2017 | | | 2016 | | | 2015 | |
| | | | | | |
Net asset value — Beginning of year | | $ | 16.910 | | | $ | 13.400 | | | $ | 11.040 | | | $ | 13.890 | | | $ | 14.110 | |
| | | | | |
| Income (Loss) From Operations | | | | | | | | | | | | | | | | | | | | |
| | | | | |
Net investment income(1) | | $ | 0.304 | | | $ | 0.245 | | | $ | 0.212 | | | $ | 0.233 | | | $ | 0.243 | |
| | | | | |
Net realized and unrealized gain (loss) | | | (2.565 | ) | | | 3.673 | | | | 2.375 | | | | (2.880 | ) | | | (0.162 | ) |
| | | | | |
Total income (loss) from operations | | $ | (2.261 | ) | | $ | 3.918 | | | $ | 2.587 | | | $ | (2.647 | ) | | $ | 0.081 | |
| | | | | |
| Less Distributions | | | | | | | | | | | | | | | | | | | | |
| | | | | |
From net investment income | | $ | (0.339 | ) | | $ | (0.408 | ) | | $ | (0.227 | ) | | $ | (0.025 | ) | | $ | (0.223 | ) |
| | | | | |
From net realized gain | | | — | | | | — | | | | — | | | | (0.178 | ) | | | (0.078 | ) |
| | | | | |
Total distributions | | $ | (0.339 | ) | | $ | (0.408 | ) | | $ | (0.227 | ) | | $ | (0.203 | ) | | $ | (0.301 | ) |
| | | | | |
Net asset value — End of year | | $ | 14.310 | | | $ | 16.910 | | | $ | 13.400 | | | $ | 11.040 | | | $ | 13.890 | |
| | | | | |
Total Return(2) | | | (13.20 | )% | | | 29.56 | % | | | 23.64 | % | | | (19.40 | )% | | | 0.55 | % |
| | | | | |
| Ratios/Supplemental Data | | | | | | | | | | | | | | | | | | | | |
| | | | | |
Net assets, end of year (000’s omitted) | | $ | 1,268,618 | | | $ | 2,030,663 | | | $ | 1,884,610 | | | $ | 1,803,056 | | | $ | 3,227,614 | |
| | | | | |
Ratios (as a percentage of average daily net assets): | | | | | | | | | | | | | | | | | | | | |
| | | | | |
Expenses(3) | | | 1.19 | % | | | 1.12 | % | | | 1.13 | % | | | 1.12 | % | | | 1.11 | % |
| | | | | |
Net investment income | | | 2.04 | % | | | 1.65 | % | | | 1.68 | % | | | 1.77 | % | | | 1.59 | % |
| | | | | |
Portfolio Turnover | | | 2 | % | | | 3 | % | | | 6 | % | | | 8 | % | | | 9 | % |
| (1) | Computed using average shares outstanding. |
| (2) | Returns are historical and are calculated by determining the percentage change in net asset value with all distributions reinvested. |
| (3) | Excludes the effect of custody fee credits, if any, of less than 0.005%. Effective September 1, 2015, custody fee credits, which were earned on cash deposit balances, were discontinued by the custodian. |
| | | | |
| | 33 | | See Notes to Financial Statements. |
Parametric
Emerging Markets Fund
January 31, 2019
Financial Highlights — continued
| | | | | | | | | | | | | | | | | | | | |
| | | Class R6 | |
| | |
| | | Year Ended January 31, | | | Period Ended
January 31, 2015(1) | |
| | | 2019 | | | 2018 | | | 2017 | | | 2016 | |
| | | | | |
Net asset value — Beginning of period | | $ | 16.910 | | | $ | 13.400 | | | $ | 11.040 | | | $ | 13.890 | | | $ | 16.010 | |
| | | | | |
| Income (Loss) From Operations | | | | | | | | | | | | | | | | | | | | |
| | | | | |
Net investment income(2) | | $ | 0.380 | | | $ | 0.249 | | | $ | 0.225 | | | $ | 0.223 | | | $ | 0.027 | |
| | | | | |
Net realized and unrealized gain (loss) | | | (2.639 | ) | | | 3.676 | | | | 2.370 | | | | (2.861 | ) | | | (1.842 | ) |
| | | | | |
Total income (loss) from operations | | $ | (2.259 | ) | | $ | 3.925 | | | $ | 2.595 | | | $ | (2.638 | ) | | $ | (1.815 | ) |
| | | | | |
| Less Distributions | | | | | | | | | | | | | | | | | | | | |
| | | | | |
From net investment income | | $ | (0.351 | ) | | $ | (0.415 | ) | | $ | (0.235 | ) | | $ | (0.034 | ) | | $ | (0.227 | ) |
| | | | | |
From net realized gain | | | — | | | | — | | | | — | | | | (0.178 | ) | | | (0.078 | ) |
| | | | | |
Total distributions | | $ | (0.351 | ) | | $ | (0.415 | ) | | $ | (0.235 | ) | | $ | (0.212 | ) | | $ | (0.305 | ) |
| | | | | |
Net asset value — End of period | | $ | 14.300 | | | $ | 16.910 | | | $ | 13.400 | | | $ | 11.040 | | | $ | 13.890 | |
| | | | | |
Total Return(3) | | | (13.18 | )% | | | 29.69 | % | | | 23.71 | % | | | (19.34 | )% | | | (11.36 | )%(4) |
| | | | | |
| Ratios/Supplemental Data | | | | | | | | | | | | | | | | | | | | |
| | | | | |
Net assets, end of period (000’s omitted) | | $ | 94,243 | | | $ | 601,629 | | | $ | 539,794 | | | $ | 555,338 | | | $ | 593,622 | |
| | | | | |
Ratios (as a percentage of average daily net assets): | | | | | | | | | | | | | | | | | | | | |
| | | | | |
Expenses(5) | | | 1.13 | % | | | 1.07 | % | | | 1.08 | % | | | 1.07 | % | | | 1.07 | %(6) |
| | | | | |
Net investment income | | | 2.48 | % | | | 1.67 | % | | | 1.79 | % | | | 1.72 | % | | | 0.31 | %(6) |
| | | | | |
Portfolio Turnover | | | 2 | % | | | 3 | % | | | 6 | % | | | 8 | % | | | 9 | %(7) |
| (1) | For the period from the commencement of operations, July 1, 2014, to January 31, 2015. |
| (2) | Computed using average shares outstanding. |
| (3) | Returns are historical and are calculated by determining the percentage change in net asset value with all distributions reinvested. |
| (5) | Excludes the effect of custody fee credits, if any, of less than 0.005%. Effective September 1, 2015, custody fee credits, which were earned on cash deposit balances, were discontinued by the custodian. |
| (7) | For the Fund’s year ended January 31, 2015. |
| | | | |
| | 34 | | See Notes to Financial Statements. |
Parametric
Emerging Markets Fund
January 31, 2019
Notes to Financial Statements
1 Significant Accounting Policies
Parametric Emerging Markets Fund (the Fund) is a diversified series of Eaton Vance Mutual Funds Trust (the Trust). The Trust is a Massachusetts business trust registered under the Investment Company Act of 1940, as amended (the 1940 Act), as an open-end management investment company. The Fund’s investment objective is to seek long-term capital appreciation. The Fund offers four classes of shares. Investor Class, Institutional Class and Class R6 shares are sold at net asset value and are not subject to a sales charge. Class C shares are sold at net asset value and are generally subject to a contingent deferred sales charge (see Note 5). Effective March 1, 2013, Class C shares of the Fund are no longer available for purchase, except by existing shareholders (including shares acquired through the reinvestment of dividends and distributions) or employer sponsored retirement plans. Effective January 25, 2019, Class C shares of the Fund generally automatically convert to Investor Class shares ten years after their purchase as described in the Fund’s prospectus. Each class represents a pro-rata interest in the Fund, but votes separately on class-specific matters and (as noted below) is subject to different expenses. Realized and unrealized gains and losses and net investment income and losses, other than class-specific expenses, are allocated daily to each class of shares based on the relative net assets of each class to the total net assets of the Fund. Sub-accounting, recordkeeping and similar administrative fees payable to financial intermediaries, which are a component of transfer and dividend disbursing agent fees on the Statement of Operations, are not allocated to Class R6 shares. Each class of shares differs in its distribution plan and certain other class-specific expenses.
The following is a summary of significant accounting policies of the Fund. The policies are in conformity with accounting principles generally accepted in the United States of America (U.S. GAAP). The Fund is an investment company and follows accounting and reporting guidance in the Financial Accounting Standards Board (FASB) Accounting Standards Codification Topic 946.
A Investment Valuation — The following methodologies are used to determine the market value or fair value of investments.
Equity Securities.Equity securities listed on a U.S. securities exchange generally are valued at the last sale or closing price on the day of valuation or, if no sales took place on such date, at the mean between the closing bid and ask prices on the exchange where such securities are principally traded. Equity securities listed on the NASDAQ Global or Global Select Market generally are valued at the NASDAQ official closing price. Unlisted or listed securities for which closing sales prices or closing quotations are not available are valued at the mean between the latest available bid and ask prices.
Short-Term Debt Securities.Short-term debt securities with a remaining maturity at time of purchase of more than sixty days are valued on the basis of valuations provided by a third party pricing service. Short-term debt securities of sufficient credit quality purchased with remaining maturities of sixty days or less are valued at amortized cost, which approximates fair value.
Foreign Securities and Currencies.Foreign securities and currencies are valued in U.S. dollars, based on foreign currency exchange rate quotations supplied by a third party pricing service. The pricing service uses a proprietary model to determine the exchange rate. Inputs to the model include reported trades and implied bid/ask spreads. The daily valuation of exchange-traded foreign securities generally is determined as of the close of trading on the principal exchange on which such securities trade. Events occurring after the close of trading on foreign exchanges may result in adjustments to the valuation of foreign securities to more accurately reflect their fair value as of the close of regular trading on the New York Stock Exchange. When valuing foreign equity securities that meet certain criteria, the Fund’s Trustees have approved the use of a fair value service that values such securities to reflect market trading that occurs after the close of the applicable foreign markets of comparable securities or other instruments that have a strong correlation to the fair-valued securities.
Fair Valuation.Investments for which valuations or market quotations are not readily available or are deemed unreliable are valued at fair value using methods determined in good faith by or at the direction of the Trustees of the Fund in a manner that fairly reflects the security’s value, or the amount that the Fund might reasonably expect to receive for the security upon its current sale in the ordinary course. Each such determination is based on a consideration of relevant factors, which are likely to vary from one pricing context to another. These factors may include, but are not limited to, the type of security, the existence of any contractual restrictions on the security’s disposition, the price and extent of public trading in similar securities of the issuer or of comparable companies or entities, quotations or relevant information obtained from broker/dealers or other market participants, information obtained from the issuer, analysts, and/or the appropriate stock exchange (for exchange-traded securities), an analysis of the company’s or entity’s financial condition, and an evaluation of the forces that influence the issuer and the market(s) in which the security is purchased and sold.
B Investment Transactions — Investment transactions for financial statement purposes are accounted for on a trade date basis. Realized gains and losses on investments sold are determined on the basis of identified cost.
C Income — Dividend income is recorded on the ex-dividend date for dividends received in cash and/or securities. However, if the ex-dividend date has passed, certain dividends from foreign securities are recorded as the Fund is informed of the ex-dividend date. Withholding taxes on foreign dividends and capital gains have been provided for in accordance with the Fund’s understanding of the applicable countries’ tax rules and rates. Interest income is recorded on the basis of interest accrued, adjusted for amortization of premium or accretion of discount.
D Federal and Other Taxes — The Fund’s policy is to comply with the provisions of the Internal Revenue Code applicable to regulated investment companies and to distribute to shareholders each year substantially all of its net investment income, and all or substantially all of its net realized capital gains. Accordingly, no provision for federal income or excise tax is necessary.
In addition to the requirements of the Internal Revenue Code, the Fund may also be subject to local taxes on the recognition of capital gains in certain countries. In determining the daily net asset value, the Fund estimates the accrual for such taxes, if any, based on the unrealized appreciation on certain
Parametric
Emerging Markets Fund
January 31, 2019
Notes to Financial Statements — continued
portfolio securities and the related tax rates. Taxes attributable to unrealized appreciation are included in the change in unrealized appreciation (depreciation) on investments. Capital gains taxes on securities sold are included in net realized gain (loss) on investments.
As of January 31, 2019, the Fund had no uncertain tax positions that would require financial statement recognition, de-recognition, or disclosure. The Fund files a U.S. federal income tax return annually after its fiscal year-end, which is subject to examination by the Internal Revenue Service for a period of three years from the date of filing.
E Expenses — The majority of expenses of the Trust are directly identifiable to an individual fund. Expenses which are not readily identifiable to a specific fund are allocated taking into consideration, among other things, the nature and type of expense and the relative size of the funds.
F Foreign Currency Translation — Investment valuations, other assets, and liabilities initially expressed in foreign currencies are translated each business day into U.S. dollars based upon current exchange rates. Purchases and sales of foreign investment securities and income and expenses denominated in foreign currencies are translated into U.S. dollars based upon currency exchange rates in effect on the respective dates of such transactions. Recognized gains or losses on investment transactions attributable to changes in foreign currency exchange rates are recorded for financial statement purposes as net realized gains and losses on investments. That portion of unrealized gains and losses on investments that results from fluctuations in foreign currency exchange rates is not separately disclosed.
G Use of Estimates — The preparation of the financial statements in conformity with U.S. GAAP requires management to make estimates and assumptions that affect the reported amounts of assets and liabilities at the date of the financial statements and the reported amounts of income and expense during the reporting period. Actual results could differ from those estimates.
H Indemnifications — Under the Trust’s organizational documents, its officers and Trustees may be indemnified against certain liabilities and expenses arising out of the performance of their duties to the Fund. Under Massachusetts law, if certain conditions prevail, shareholders of a Massachusetts business trust (such as the Trust) could be deemed to have personal liability for the obligations of the Trust. However, the Trust’s Declaration of Trust contains an express disclaimer of liability on the part of Fund shareholders and the By-laws provide that the Trust shall assume the defense on behalf of any Fund shareholders. Moreover, the By-laws also provide for indemnification out of Fund property of any shareholder held personally liable solely by reason of being or having been a shareholder for all loss or expense arising from such liability. Additionally, in the normal course of business, the Fund enters into agreements with service providers that may contain indemnification clauses. The Fund’s maximum exposure under these arrangements is unknown as this would involve future claims that may be made against the Fund that have not yet occurred.
2 Distributions to Shareholders and Income Tax Information
It is the present policy of the Fund to make at least one distribution annually (normally in December) of all or substantially all of its net investment income and to distribute annually all or substantially all of its net realized capital gains. Distributions to shareholders are recorded on the ex-dividend date. Distributions are declared separately for each class of shares. Shareholders may reinvest income and capital gain distributions in additional shares of the same class of the Fund at the net asset value as of the ex-dividend date or, at the election of the shareholder, receive distributions in cash. Distributions to shareholders are determined in accordance with income tax regulations, which may differ from U.S. GAAP. As required by U.S. GAAP, only distributions in excess of tax basis earnings and profits are reported in the financial statements as a return of capital. Permanent differences between book and tax accounting relating to distributions are reclassified to paid-in capital. For tax purposes, distributions from short-term capital gains are considered to be from ordinary income.
The tax character of distributions declared for the years ended January 31, 2019 and January 31, 2018 was as follows:
| | | | | | | | |
| | | Year Ended January 31, | |
| | | 2019 | | | 2018 | |
| | |
Ordinary income | | $ | 36,215,726 | | | $ | 76,266,062 | |
During the year ended January 31, 2019, accumulated loss was increased by $7,122,467 and paid-in capital was increased by $7,122,467 due to the Fund’s use of equalization accounting. Tax equalization accounting allows the Fund to treat as a distribution that portion of redemption proceeds representing a redeeming shareholder’s portion of undistributed taxable income and net capital gains. These reclassifications had no effect on the net assets or net asset value per share of the Fund.
As of January 31, 2019, the components of distributable earnings (accumulated loss) on a tax basis were as follows:
| | | | |
| | |
Deferred capital losses | | $ | (321,812,527 | ) |
| |
Net unrealized appreciation | | $ | 186,999,460 | |
Parametric
Emerging Markets Fund
January 31, 2019
Notes to Financial Statements — continued
At January 31, 2019, the Fund, for federal income tax purposes, had deferred capital losses of $321,812,527 which would reduce its taxable income arising from future net realized gains on investment transactions, if any, to the extent permitted by the Internal Revenue Code, and thus would reduce the amount of distributions to shareholders, which would otherwise be necessary to relieve the Fund of any liability for federal income or excise tax. The deferred capital losses are treated as arising on the first day of the Fund’s next taxable year and retain the same short-term or long-term character as when originally deferred. Of the deferred capital losses at January 31, 2019, $321,812,527 are long-term.
The cost and unrealized appreciation (depreciation) of investments of the Fund at January 31, 2019, as determined on a federal income tax basis, were as follows:
| | | | |
| |
Aggregate cost | | $ | 1,350,122,111 | |
| |
Gross unrealized appreciation | | $ | 475,214,865 | |
| |
Gross unrealized depreciation | | | (287,360,174 | ) |
| |
Net unrealized appreciation | | $ | 187,854,691 | |
3 Investment Adviser Fee and Other Transactions with Affiliates
The investment adviser fee is earned by Eaton Vance Management (EVM) as compensation for management and investment advisory services rendered to the Fund. Pursuant to the investment advisory agreement and subsequent fee reduction agreement between the Fund and EVM, the fee is computed at an annual rate of 0.85% of the Fund’s average daily net assets up to $500 million, 0.80% on net assets of $500 million but less than $1 billion, 0.775% on net assets of $1 billion but less than $2.5 billion, 0.75% on net assets of $2.5 billion but less than $5 billion, 0.73% on net assets of $5 billion but less than $7.5 billion and 0.71% on net assets of $7.5 billion and over, and is payable monthly. The fee reduction cannot be terminated or reduced without the approval of a majority vote of the Trustees of the Fund who are not interested persons of EVM or the Fund and by the vote of a majority of shareholders. For the year ended January 31, 2019, the investment adviser fee amounted to $17,428,449 or 0.80% of the Fund’s average daily net assets. Pursuant to a sub-advisory agreement, EVM has delegated the investment management of the Fund to Parametric Portfolio Associates LLC (Parametric), a majority-owned subsidiary of Eaton Vance Corp. EVM pays Parametric a portion of its investment adviser fee for sub-advisory services provided to the Fund. The administration fee is earned by EVM for administering the business affairs of the Fund and is computed at an annual rate of 0.15% of the Fund’s average daily net assets. For the year ended January 31, 2019, the administration fee amounted to $3,281,395.
EVM provides sub-transfer agency and related services to the Fund pursuant to a Sub-Transfer Agency Support Services Agreement. For the year ended January 31, 2019, EVM earned $59,727 from the Fund pursuant to such agreement, which is included in transfer and dividend disbursing agent fees on the Statement of Operations. Eaton Vance Distributors, Inc. (EVD), an affiliate of EVM and the Fund’s principal underwriter, received distribution and service fees from Investor Class and Class C shares (see Note 4) and contingent deferred sales charges (see Note 5).
Trustees and officers of the Fund who are members of EVM’s organization receive remuneration for their services to the Fund out of the investment adviser fee. Trustees of the Fund who are not affiliated with EVM may elect to defer receipt of all or a percentage of their annual fees in accordance with the terms of the Trustees Deferred Compensation Plan. For the year ended January 31, 2019, no significant amounts have been deferred. Certain officers and Trustees of the Fund are officers of EVM.
4 Distribution Plans
The Fund has in effect a distribution plan for Investor Class shares (Investor Class Plan) pursuant to Rule 12b-1 under the 1940 Act. Pursuant to the Investor Class Plan, the Fund pays EVD a distribution and service fee of 0.25% per annum of its average daily net assets attributable to Investor Class shares for distribution services and facilities provided to the Fund by EVD, as well as for personal services and/or the maintenance of shareholder accounts. Distribution and service fees paid or accrued to EVD for the year ended January 31, 2019 amounted to $647,534 for Investor Class shares.
The Fund also has in effect a distribution plan for Class C shares (Class C Plan) pursuant to Rule 12b-1 under the 1940 Act. Pursuant to the Class C Plan, the Fund pays EVD amounts equal to 0.75% per annum of its average daily net assets attributable to Class C shares for providing ongoing distribution services and facilities to the Fund. For the year ended January 31, 2019, the Fund paid or accrued to EVD $61,719 for Class C shares.
Pursuant to the Class C Plan, the Fund also makes payments of service fees to EVD, financial intermediaries and other persons in amounts equal to 0.25% per annum of its average daily net assets attributable to that class. Service fees paid or accrued are for personal services and/or the maintenance of shareholder accounts. They are separate and distinct from the sales commissions and distribution fees payable to EVD. Service fees paid or accrued for the year ended January 31, 2019 amounted to $20,573 for Class C shares.
Distribution and service fees are subject to the limitations contained in the Financial Industry Regulatory Authority Rule 2341(d).
Parametric
Emerging Markets Fund
January 31, 2019
Notes to Financial Statements — continued
5 Contingent Deferred Sales Charges
A contingent deferred sales charge (CDSC) of 1% generally is imposed on redemptions of Class C shares made within one year of purchase. Generally, the CDSC is based upon the lower of the net asset value at date of redemption or date of purchase. No charge is levied on shares acquired by reinvestment of dividends or capital gain distributions. For the year ended January 31, 2019, the Fund was informed that EVD received less than $100 of CDSCs paid by Class C shareholders.
6 Purchases and Sales of Investments
Purchases and sales of investments, other than short-term obligations, aggregated $52,887,993 and $1,096,570,736, respectively, for the year ended January 31, 2019.
7 Shares of Beneficial Interest
The Fund’s Declaration of Trust permits the Trustees to issue an unlimited number of full and fractional shares of beneficial interest (without par value). Such shares may be issued in a number of different series (such as the Fund) and classes. Transactions in Fund shares were as follows:
| | | | | | | | |
| | | Year Ended January 31, | |
| Investor Class | | 2019 | | | 2018 | |
| | |
Sales | | | 2,821,720 | | | | 3,766,534 | |
| | |
Issued to shareholders electing to receive payments of distributions in Fund shares | | | 260,627 | | | | 654,358 | |
| | |
Redemptions | | | (14,848,715 | ) | | | (19,672,231 | ) |
| | |
Converted from Class C shares | | | 77,276 | | | | — | |
| | |
Net decrease | | | (11,689,092 | ) | | | (15,251,339 | ) |
| |
| | | Year Ended January 31, | |
| Class C | | 2019 | | | 2018 | |
| | |
Sales | | | 13,559 | | | | 58,977 | |
| | |
Issued to shareholders electing to receive payments of distributions in Fund shares | | | 6,807 | | | | 10,606 | |
| | |
Redemptions | | | (135,557 | ) | | | (157,753 | ) |
| | |
Converted to Investor Class shares | | | (78,753 | ) | | | — | |
| | |
Net decrease | | | (193,944 | ) | | | (88,170 | ) |
| |
| | | Year Ended January 31, | |
| Institutional Class | | 2019 | | | 2018 | |
| | |
Sales | | | 18,769,605 | | | | 28,311,462 | |
| | |
Issued to shareholders electing to receive payments of distributions in Fund shares | | | 1,758,840 | | | | 2,369,982 | |
| | |
Redemptions | | | (51,951,337 | ) | | | (51,281,512 | ) |
| | |
Net decrease | | | (31,422,892 | ) | | | (20,600,068 | ) |
| |
| | | Year Ended January 31, | |
| Class R6 | | 2019 | | | 2018 | |
| | |
Sales | | | 2,639,075 | | | | 5,554,714 | |
| | |
Issued to shareholders electing to receive payments of distributions in Fund shares | | | 162,478 | | | | 1,015,051 | |
| | |
Redemptions | | | (31,780,927 | ) | | | (11,291,637 | ) |
| | |
Net decrease | | | (28,979,374 | ) | | | (4,721,872 | ) |
Parametric
Emerging Markets Fund
January 31, 2019
Notes to Financial Statements — continued
8 Line of Credit
The Fund participates with other portfolios and funds managed by EVM and its affiliates in a $625 million unsecured line of credit agreement with a group of banks, which is in effect through October 29, 2019. Borrowings are made by the Fund solely to facilitate the handling of unusual and/or unanticipated short-term cash requirements. Interest is charged to the Fund based on its borrowings at an amount above either the Eurodollar rate or Federal Funds rate. In addition, a fee computed at an annual rate of 0.15% on the daily unused portion of the line of credit is allocated among the participating portfolios and funds at the end of each quarter. Because the line of credit is not available exclusively to the Fund, it may be unable to borrow some or all of its requested amounts at any particular time. Average borrowings and the average interest rate (excluding fees) for the year ended January 31, 2019 were $9,287,000 and 3.01%, respectively.
9 Risks Associated with Foreign Investments
Investing in securities issued by companies whose principal business activities are outside the United States may involve significant risks not present in domestic investments. For example, there is generally less publicly available information about foreign companies, particularly those not subject to the disclosure and reporting requirements of the U.S. securities laws. Certain foreign issuers are generally not bound by uniform accounting, auditing, and financial reporting requirements and standards of practice comparable to those applicable to domestic issuers. Investments in foreign securities also involve the risk of possible adverse changes in investment or exchange control regulations, expropriation or confiscatory taxation, limitation on the removal of funds or other assets of the Fund, political or financial instability or diplomatic and other developments which could affect such investments. Foreign securities markets, while growing in volume and sophistication, are generally not as developed as those in the United States, and securities of some foreign issuers (particularly those located in developing countries) may be less liquid and more volatile than securities of comparable U.S. companies. In general, there is less overall governmental supervision and regulation of foreign securities markets, broker/dealers and issuers than in the United States. The foregoing risks of foreign investing can be more significant in less developed countries characterized as emerging market countries.
10 Fair Value Measurements
Under generally accepted accounting principles for fair value measurements, a three-tier hierarchy to prioritize the assumptions, referred to as inputs, is used in valuation techniques to measure fair value. The three-tier hierarchy of inputs is summarized in the three broad levels listed below.
| • | | Level 1 – quoted prices in active markets for identical investments |
| • | | Level 2 – other significant observable inputs (including quoted prices for similar investments, interest rates, prepayment speeds, credit risk, etc.) |
| • | | Level 3 – significant unobservable inputs (including a fund’s own assumptions in determining the fair value of investments) |
In cases where the inputs used to measure fair value fall in different levels of the fair value hierarchy, the level disclosed is determined based on the lowest level input that is significant to the fair value measurement in its entirety. The inputs or methodology used for valuing securities are not necessarily an indication of the risk associated with investing in those securities.
At January 31, 2019, the hierarchy of inputs used in valuing the Fund’s investments, which are carried at value, were as follows:
| | | | | | | | | | | | | | | | |
| Asset Description | | Level 1 | | | Level 2 | | | Level 3* | | | Total | |
| | | | |
Common Stocks | | | | | | | | | | | | | | | | |
| | | | |
Asia/Pacific | | $ | 12,568,400 | | | $ | 673,412,401 | | | $ | 661,858 | | | $ | 686,642,659 | |
| | | | |
Emerging Europe | | | 12,182,606 | | | | 266,672,967 | | | | 0 | | | | 278,855,573 | |
| | | | |
Latin America | | | 291,291,400 | | | | — | | | | — | | | | 291,291,400 | |
| | | | |
Middle East/Africa | | | 3,027,725 | | | | 278,113,922 | | | | 45,523 | | | | 281,187,170 | |
| | | | |
Total Common Stocks | | $ | 319,070,131 | | | $ | 1,218,199,290 | ** | | $ | 707,381 | | | $ | 1,537,976,802 | |
| | | | |
Rights | | $ | — | | | $ | 0 | | | $ | — | | | $ | 0 | |
| | | | |
Total Investments | | $ | 319,070,131 | | | $ | 1,218,199,290 | | | $ | 707,381 | | | $ | 1,537,976,802 | |
| * | None of the unobservable inputs for Level 3 assets, individually or collectively, had a material impact on the Fund. |
| ** | Includes foreign equity securities whose values were adjusted to reflect market trading of comparable securities or other correlated instruments that occurred after the close of trading in their applicable foreign markets. |
Level 3 investments at the beginning and/or end of the period in relation to net assets were not significant and accordingly, a reconciliation of Level 3 assets for the year ended January 31, 2019 is not presented.
Parametric
Emerging Markets Fund
January 31, 2019
Report of Independent Registered Public Accounting Firm
To the Trustees of Eaton Vance Mutual Funds Trust and Shareholders of Parametric Emerging Markets Fund:
Opinion on the Financial Statements and Financial Highlights
We have audited the accompanying statement of assets and liabilities of Parametric Emerging Markets Fund (the “Fund”) (one of the funds constituting Eaton Vance Mutual Funds Trust), including the portfolio of investments, as of January 31, 2019, the related statement of operations for the year then ended, the statements of changes in net assets for each of the two years in the period then ended, the financial highlights for each of the five years in the period then ended, and the related notes. In our opinion, the financial statements and financial highlights present fairly, in all material respects, the financial position of the Fund as of January 31, 2019, and the results of its operations for the year then ended, the changes in its net assets for each of the two years in the period then ended, and the financial highlights for each of the five years in the period then ended, in conformity with accounting principles generally accepted in the United States of America.
Basis for Opinion
These financial statements and financial highlights are the responsibility of the Fund’s management. Our responsibility is to express an opinion on the Fund’s financial statements and financial highlights based on our audits. We are a public accounting firm registered with the Public Company Accounting Oversight Board (United States) (PCAOB) and are required to be independent with respect to the Fund in accordance with the U.S. federal securities laws and the applicable rules and regulations of the Securities and Exchange Commission and the PCAOB.
We conducted our audits in accordance with the standards of the PCAOB. Those standards require that we plan and perform the audit to obtain reasonable assurance about whether the financial statements and financial highlights are free of material misstatement, whether due to error or fraud. The Fund is not required to have, nor were we engaged to perform, an audit of its internal control over financial reporting. As part of our audits we are required to obtain an understanding of internal control over financial reporting but not for the purpose of expressing an opinion on the effectiveness of the Fund’s internal control over financial reporting. Accordingly, we express no such opinion.
Our audits included performing procedures to assess the risks of material misstatement of the financial statements and financial highlights, whether due to error or fraud, and performing procedures that respond to those risks. Such procedures included examining, on a test basis, evidence regarding the amounts and disclosures in the financial statements and financial highlights. Our audits also included evaluating the accounting principles used and significant estimates made by management, as well as evaluating the overall presentation of the financial statements and financial highlights. Our procedures included confirmation of securities owned as of January 31, 2019, by correspondence with the custodian and brokers; when replies were not received from brokers, we performed other auditing procedures. We believe that our audits provide a reasonable basis for our opinion.
/s/ Deloitte & Touche LLP
Boston, Massachusetts
March 21, 2019
We have served as the auditor of one or more Eaton Vance investment companies since 1959.
Parametric
Emerging Markets Fund
January 31, 2019
Federal Tax Information (Unaudited)
The Form 1099-DIV you receive in February 2020 will show the tax status of all distributions paid to your account in calendar year 2019. Shareholders are advised to consult their own tax adviser with respect to the tax consequences of their investment in the Fund. As required by the Internal Revenue Code and/or regulations, shareholders must be notified regarding the status of qualified dividend income for individuals and the foreign tax credit.
Qualified Dividend Income. For the fiscal year ended January 31, 2019, the Fund designates approximately $46,897,598, or up to the maximum amount of such dividends allowable pursuant to the Internal Revenue Code, as qualified dividend income eligible for the reduced tax rate of 15%.
Foreign Tax Credit. For the fiscal year ended January 31, 2019, the Fund paid foreign taxes of $8,431,806 and recognized foreign source income of $80,223,542.
Parametric
Emerging Markets Fund
January 31, 2019
Special Meeting of Shareholders (Unaudited)
The Fund held a Special Meeting of Shareholders on September 20, 2018 to elect the five Trustees listed below. The other Trustees named herein continue to serve as Trustees. The results of the vote with respect to the Fund were as follows:
| | | | | | | | |
| Nominee for Trustee | | Number of Shares | |
| | For | | | Withheld | |
| | |
Mark R. Fetting | | | 101,277,238 | | | | 3,556,585 | |
| | |
Keith Quinton | | | 101,276,452 | | | | 3,557,370 | |
| | |
Marcus L. Smith | | | 101,282,473 | | | | 3,551,350 | |
| | |
Susan J. Sutherland | | | 101,282,249 | | | | 3,551,574 | |
| | |
Scott E. Wennerholm | | | 101,274,142 | | | | 3,559,680 | |
Results are rounded to the nearest whole number.
Parametric
Emerging Markets Fund
January 31, 2019
Management and Organization
Fund Management. The Trustees of Eaton Vance Mutual Funds Trust (the Trust) are responsible for the overall management and supervision of the Trust’s affairs. The Trustees and officers of the Trust are listed below. Except as indicated, each individual has held the office shown or other offices in the same company for the last five years. Trustees and officers of the Trust hold indefinite terms of office. The “noninterested Trustees” consist of those Trustees who are not “interested persons” of the Trust, as that term is defined under the 1940 Act. The business address of each Trustee and officer is Two International Place, Boston, Massachusetts 02110. As used below, “EVC” refers to Eaton Vance Corp., “EV” refers to Eaton Vance, Inc., “EVM” refers to Eaton Vance Management, “BMR” refers to Boston Management and Research and “EVD” refers to Eaton Vance Distributors, Inc. EVC and EV are the corporate parent and trustee, respectively, of EVM and BMR. EVD is the Fund’s principal underwriter and a wholly-owned subsidiary of EVC. Each officer affiliated with Eaton Vance may hold a position with other Eaton Vance affiliates that is comparable to his or her position with EVM listed below. Each Trustee oversees 175 portfolios in the Eaton Vance Complex (including all master and feeder funds in a master feeder structure). Each officer serves as an officer of certain other Eaton Vance funds. Each Trustee and officer serves until his or her successor is elected.
| | | | | | |
| Name and Year of Birth | | Position(s)
with the
Trust | | Trustee Since(1) | | Principal Occupation(s) and Directorships During Past Five Years and Other Relevant Experience |
|
| Interested Trustee |
| | | |
Thomas E. Faust Jr. 1958 | | Trustee | | 2007 | | Chairman, Chief Executive Officer and President of EVC, Director and President of EV, Chief Executive Officer and President of EVM and BMR, and Director of EVD. Trustee and/or officer of 175 registered investment companies. Mr. Faust is an interested person because of his positions with EVM, BMR, EVD, EVC and EV, which are affiliates of the Trust. Directorships in the Last Five Years.(2) Director of EVC and Hexavest Inc. (investment management firm). |
|
| Noninterested Trustees |
| | | |
Mark R. Fetting 1954 | | Trustee | | 2016 | | Private investor. Formerly held various positions at Legg Mason, Inc. (investment management firm) (2000-2012), including President, Chief Executive Officer, Director and Chairman (2008-2012), Senior Executive Vice President (2004-2008) and Executive Vice President (2001-2004). Formerly, President of Legg Mason family of funds (2001-2008). Formerly, Division President and Senior Officer of Prudential Financial Group, Inc. and related companies (investment management firm)(1991-2000). Directorships in the Last Five Years. None. |
| | | |
Cynthia E. Frost 1961 | | Trustee | | 2014 | | Private investor. Formerly, Chief Investment Officer of Brown University (university endowment) (2000-2012). Formerly, Portfolio Strategist for Duke Management Company (university endowment manager) (1995-2000). Formerly, Managing Director, Cambridge Associates (investment consulting company) (1989-1995). Formerly, Consultant, Bain and Company (management consulting firm) (1987-1989). Formerly, Senior Equity Analyst, BA Investment Management Company (1983-1985). Directorships in the Last Five Years. None. |
| | | |
George J. Gorman 1952 | | Trustee | | 2014 | | Principal at George J. Gorman LLC (consulting firm). Formerly, Senior Partner at Ernst & Young LLP (a registered public accounting firm) (1974-2009). Directorships in the Last Five Years. Formerly, Trustee of the BofA Funds Series Trust (11 funds) (2011-2014) and of the Ashmore Funds (9 funds) (2010-2014). |
| | | |
Valerie A. Mosley 1960 | | Trustee | | 2014 | | Chairwoman and Chief Executive Officer of Valmo Ventures (a consulting and investment firm). Former Partner and Senior Vice President, Portfolio Manager and Investment Strategist at Wellington Management Company, LLP (investment management firm) (1992-2012). Former Chief Investment Officer, PG Corbin Asset Management (1990-1992). Formerly worked in institutional corporate bond sales at Kidder Peabody (1986-1990). Directorships in the Last Five Years.(2) Director of Envestnet, Inc. (provider of intelligent systems for wealth management and financial wellness) (since 2018). |
Parametric
Emerging Markets Fund
January 31, 2019
Management and Organization — continued
| | | | | | |
| Name and Year of Birth | | Position(s)
with the
Trust | | Trustee Since(1) | | Principal Occupation(s) and Directorships During Past Five Years and Other Relevant Experience |
|
| Noninterested Trustees (continued) |
| | | |
William H. Park 1947 | | Chairperson of the Board and Trustee | | 2016 (Chairperson) 2003 (Trustee) | | Private investor. Formerly, Consultant (management and transactional) (2012-2014). Formerly, Chief Financial Officer, Aveon Group L.P. (investment management firm) (2010-2011). Formerly, Vice Chairman, Commercial Industrial Finance Corp. (specialty finance company) (2006-2010). Formerly, President and Chief Executive Officer, Prizm Capital Management, LLC (investment management firm) (2002-2005). Formerly, Executive Vice President and Chief Financial Officer, United Asset Management Corporation (investment management firm) (1982-2001). Formerly, Senior Manager, Price Waterhouse (now PricewaterhouseCoopers) (a registered public accounting firm) (1972-1981). Directorships in the Last Five Years.(2) None. |
| | | |
Helen Frame Peters 1948 | | Trustee | | 2008 | | Professor of Finance, Carroll School of Management, Boston College. Formerly, Dean, Carroll School of Management, Boston College (2000-2002). Formerly, Chief Investment Officer, Fixed Income, Scudder Kemper Investments (investment management firm) (1998-1999). Formerly, Chief Investment Officer, Equity and Fixed Income, Colonial Management Associates (investment management firm) (1991-1998). Directorships in the Last Five Years.(2) None. |
| | | |
Keith Quinton(3) 1958 | | Trustee | | 2018 | | Independent Investment Committee Member at New Hampshire Retirement System (since 2017). Advisory Committee member at Northfield Information Services, Inc. (risk management analytics provider) (since 2016). Formerly, Portfolio Manager and Senior Quantitative Analyst at Fidelity Investments (investment management firm)(2001-2014). Directorships in the Last Five Years. Director of New Hampshire Municipal Bond Bank (since 2016). |
| | | |
Marcus L. Smith(3) 1966 | | Trustee | | 2018 | | Member of Posse Boston Advisory Board (foundation) (since 2015); Trustee at University of Mount Union (since 2008). Formerly, Portfolio Manager at MFS Investment Management (investment management firm) (1994-2017). Directorships in the Last Five Years. Director of MSCI Inc. (global provider of investment decision support tools) (since 2017). Director of DCT Industrial Trust Inc. (logistics real estate company) (since 2017). |
| | | |
Susan J. Sutherland 1957 | | Trustee | | 2015 | | Private investor. Formerly, Associate, Counsel and Partner at Skadden, Arps, Slate, Meagher & Flom LLP (law firm) (1982-2013). Directorships in the Last Five Years. Formerly, Director of Montpelier Re Holdings Ltd. (global provider of customized insurance and reinsurance products) (2013-2015). |
| | | |
Scott E. Wennerholm 1959 | | Trustee | | 2016 | | Formerly, Trustee at Wheelock College (postsecondary institution) (2012-2018). Formerly, Consultant at GF Parish Group (executive recruiting firm) (2016-2017). Formerly, Chief Operating Officer and Executive Vice President at BNY Mellon Asset Management (investment management firm) (2005-2011). Formerly, Chief Operating Officer and Chief Financial Officer at Natixis Global Asset Management (investment management firm) (1997-2004). Formerly, Vice President at Fidelity Investments Institutional Services (investment management firm) (1994-1997). Directorships in the Last Five Years. None. |
| | | | | | |
| Name and Year of Birth | | Position(s)
with the
Trust | | Officer
Since(4) | | Principal Occupation(s) During Past Five Years |
|
| Principal Officers who are not Trustees |
| | | |
Payson F. Swaffield 1956 | | President | | 2003 | | Vice President and Chief Income Investment Officer of EVM and BMR. Also Vice President of Calvert Research and Management (“CRM”). |
| | | |
Maureen A. Gemma 1960 | | Vice President, Secretary and Chief Legal Officer | | 2005 | | Vice President of EVM and BMR. Also Vice President and officer of CRM. |
Parametric
Emerging Markets Fund
January 31, 2019
Management and Organization — continued
| | | | | | |
| Name and Year of Birth | | Position(s)
with the
Trust | | Officer
Since(4) | | Principal Occupation(s) During Past Five Years |
|
| Principal Officers who are not Trustees (continued) |
| | | |
James F. Kirchner 1967 | | Treasurer | | 2007 | | Vice President of EVM and BMR. Also Vice President and officer of CRM. |
| | | |
Richard F. Froio 1968 | | Chief Compliance Officer | | 2017 | | Vice President of EVM and BMR since 2017. Formerly Deputy Chief Compliance Officer (Adviser/Funds) and Chief Compliance Officer (Distribution) at PIMCO (2012-2017) and Managing Director at BlackRock/Barclays Global Investors (2009-2012). |
| (1) | Year first appointed to serve as Trustee for a fund in the Eaton Vance family of funds. Each Trustee has served continuously since appointment unless indicated otherwise. |
| (2) | During their respective tenures, the Trustees (except for Mmes. Frost and Sutherland and Messrs. Fetting, Gorman, Quinton, Smith and Wennerholm) also served as Board members of one or more of the following funds (which operated in the years noted): eUnitsTM 2 Year U.S. Market Participation Trust: Upside to Cap / Buffered Downside (launched in 2012 and terminated in 2014); and eUnitsTM 2 Year U.S. Market Participation Trust II: Upside to Cap / Buffered Downside (launched in 2012 and terminated in 2014). However, Ms. Mosley did not serve as a Board member of eUnitsTM 2 Year U.S. Market Participation Trust: Upside to Cap / Buffered Downside (launched in 2012 and terminated in 2014). |
| (3) | Messrs. Quinton and Smith began serving as Trustees effective October 1, 2018. |
| (4) | Year first elected to serve as officer of a fund in the Eaton Vance family of funds when the officer has served continuously. Otherwise, year of most recent election as an officer of a fund in the Eaton Vance family of funds. Titles may have changed since initial election. |
The SAI for the Fund includes additional information about the Trustees and officers of the Fund and can be obtained without charge on Eaton Vance’s website at www.eatonvance.com or by calling 1-800-260-0761.
Eaton Vance Funds
IMPORTANT NOTICES
Privacy. The Eaton Vance organization is committed to ensuring your financial privacy. Each of the financial institutions identified below has in effect the following policy (“Privacy Policy”) with respect to nonpublic personal information about its customers:
| • | | Only such information received from you, through application forms or otherwise, and information about your Eaton Vance fund transactions will be collected. This may include information such as name, address, social security number, tax status, account balances and transactions. |
| • | | None of such information about you (or former customers) will be disclosed to anyone, except as permitted by law (which includes disclosure to employees necessary to service your account). In the normal course of servicing a customer’s account, Eaton Vance may share information with unaffiliated third parties that perform various required services such as transfer agents, custodians and broker-dealers. |
| • | | Policies and procedures (including physical, electronic and procedural safeguards) are in place that are designed to protect the confidentiality of such information. |
| • | | We reserve the right to change our Privacy Policy at any time upon proper notification to you. Customers may want to review our Privacy Policy periodically for changes by accessing the link on our homepage: www.eatonvance.com. |
Our pledge of privacy applies to the following entities within the Eaton Vance organization: the Eaton Vance Family of Funds, Eaton Vance Management, Eaton Vance Investment Counsel, Eaton Vance Distributors, Inc., Eaton Vance Trust Company, Eaton Vance Management (International) Limited, Eaton Vance Advisers International Ltd., Eaton Vance Management’s Real Estate Investment Group and Boston Management and Research. In addition, our Privacy Policy applies only to those Eaton Vance customers who are individuals and who have a direct relationship with us. If a customer’s account (i.e., fund shares) is held in the name of a third-party financial advisor/broker-dealer, it is likely that only such advisor’s privacy policies apply to the customer. This notice supersedes all previously issued privacy disclosures. For more information about Eaton Vance’s Privacy Policy, please call 1-800-262-1122.
Delivery of Shareholder Documents. The Securities and Exchange Commission (SEC) permits funds to deliver only one copy of shareholder documents, including prospectuses, proxy statements and shareholder reports, to fund investors with multiple accounts at the same residential or post office box address. This practice is often called “householding” and it helps eliminate duplicate mailings to shareholders.Eaton Vance, or your financial advisor, may household the mailing of your documents indefinitely unless you instruct Eaton Vance, or your financial advisor, otherwise.If you would prefer that your Eaton Vance documents not be householded, please contact Eaton Vance at 1-800-260-0761, or contact your financial advisor. Your instructions that householding not apply to delivery of your Eaton Vance documents will typically be effective within 30 days of receipt by Eaton Vance or your financial advisor.
Portfolio Holdings. Each Eaton Vance Fund and its underlying Portfolio(s) (if applicable) will file a schedule of portfolio holdings on Form N-Q with the SEC for the first and third quarters of each fiscal year. The Form N-Q will be available on the Eaton Vance website at www.eatonvance.com, by calling Eaton Vance at 1-800-260-0761 or in the EDGAR database on the SEC’s website at www.sec.gov. Form N-Q may also be reviewed and copied at the SEC’s public reference room in Washington, D.C. (call 1-800-732-0330 for information on the operation of the public reference room).
Proxy Voting. From time to time, funds are required to vote proxies related to the securities held by the funds. The Eaton Vance Funds or their underlying Portfolios (if applicable) vote proxies according to a set of policies and procedures approved by the Funds’ and Portfolios’ Boards. You may obtain a description of these policies and procedures and information on how the Funds or Portfolios voted proxies relating to portfolio securities during the most recent 12-month period ended June 30, without charge, upon request, by calling 1-800-260-0761 and by accessing the SEC’s website at www.sec.gov.
This Page Intentionally Left Blank
This Page Intentionally Left Blank
Investment Adviser and Administrator
Eaton Vance Management
Two International Place
Boston, MA 02110
Investment Sub-Adviser
Parametric Portfolio Associates LLC
1918 Eighth Avenue, Suite 3100
Seattle, WA 98101
Principal Underwriter*
Eaton Vance Distributors, Inc.
Two International Place
Boston, MA 02110
(617) 482-8260
Custodian
State Street Bank and Trust Company
State Street Financial Center, One Lincoln Street
Boston, MA 02111
Transfer Agent
BNY Mellon Investment Servicing (US) Inc.
Attn: Eaton Vance Funds
P.O. Box 9653
Providence, RI 02940-9653
(800) 260-0761
Independent Registered Public Accounting Firm
Deloitte & Touche LLP
200 Berkeley Street
Boston, MA 02116-5022
Fund Offices
Two International Place
Boston, MA 02110
| * | FINRA BrokerCheck. Investors may check the background of their Investment Professional by contacting the Financial Industry Regulatory Authority (FINRA). FINRA BrokerCheck is a free tool to help investors check the professional background of current and former FINRA-registered securities firms and brokers. FINRA BrokerCheck is available by calling 1-800-289-9999 and at www.FINRA.org. The FINRA BrokerCheck brochure describing this program is available to investors at www.FINRA.org. |

2774 1.31.19

Parametric
International Equity Fund
Annual Report
January 31, 2019
Important Note. Beginning on January 1, 2021, as permitted by regulations adopted by the Securities and Exchange Commission, paper copies of the Fund’s annual and semi-annual shareholder reports will no longer be sent by mail unless you specifically request paper copies of the reports. Instead, the reports will be made available on the Fund’s website (eatonvance.com/ppafunddocuments), and you will be notified by mail each time a report is posted and provided with a website address to access the report.
If you already elected to receive shareholder reports electronically, you will not be affected by this change and you need not take any action. If you are a direct investor, you may elect to receive shareholder reports and other communications from the Fund electronically by signing up for e-Delivery at eatonvance.com/edelivery. If you own your shares through a financial intermediary (such as a broker-dealer or bank), you must contact your financial intermediary to sign up.
You may elect to receive all future Fund shareholder reports in paper free of charge. If you are a direct investor, you can inform the Fund that you wish to continue receiving paper copies of your shareholder reports by calling 1-800-260-0761. If you own these shares through a financial intermediary, you must contact your financial intermediary or follow instructions included with this disclosure, if applicable, to elect to continue to receive paper copies of your shareholder reports. Your election to receive reports in paper will apply to all Eaton Vance funds held directly or to all funds held through your financial intermediary, as applicable.

Commodity Futures Trading Commission Registration. Effective December 31, 2012, the Commodity Futures Trading Commission (“CFTC”) adopted certain regulatory changes that subject registered investment companies and advisers to regulation by the CFTC if a fund invests more than a prescribed level of its assets in certain CFTC-regulated instruments (including futures, certain options and swap agreements) or markets itself as providing investment exposure to such instruments. The Fund has claimed an exclusion from the definition of the term “commodity pool operator” under the Commodity Exchange Act. Accordingly, neither the Fund nor the adviser with respect to the operation of the Fund is subject to CFTC regulation. Because of its management of other strategies, the Fund’s adviser is registered with the CFTC as a commodity pool operator and a commodity trading advisor.
Fund shares are not insured by the FDIC and are not deposits or other obligations of, or guaranteed by, any depository institution. Shares are subject to investment risks, including possible loss of principal invested.
This report must be preceded or accompanied by a current summary prospectus or prospectus. Before investing, investors should consider carefully the investment objective, risks, and charges and expenses of a mutual fund. This and other important information is contained in the summary prospectus and prospectus, which can be obtained from a financial advisor. Prospective investors should read the prospectus carefully before investing. For further information, please call 1-800-260-0761.
Annual ReportJanuary 31, 2019
Parametric
International Equity Fund
Table of Contents
| | | | |
Management’s Discussion of Fund Performance | | | 2 | |
| |
Performance | | | 3 | |
| |
Fund Profile | | | 4 | |
| |
Endnotes and Additional Disclosures | | | 5 | |
| |
Fund Expenses | | | 6 | |
| |
Financial Statements | | | 7 | |
| |
Report of Independent Registered Public Accounting Firm | | | 33 | |
| |
Federal Tax Information | | | 34 | |
| |
Special Meeting of Shareholders | | | 35 | |
| |
Management and Organization | | | 36 | |
| |
Important Notices | | | 39 | |
Parametric
International Equity Fund
January 31, 2019
Management’s Discussion of Fund Performance1
Economic and Market Conditions
For the 12-month period ended January 31, 2019, developed international equity markets declined 12.51%, as measured by the MSCI EAFE Index (the Index).2 The decline was broad-based, with only one country — Israel — posting a positive return during the period.
The beginning of the period was marked by a return to volatility following a buoyant 2017. Investor sentiment shifted as geopolitical risks began to outweigh positive economic results. Deteriorating global trade relations, indications of tightening from the European Central Bank and growing political risk entered the forefront of investor concerns during the period.
European countries declined the most due, in part, to investor concerns about slowing economic growth and the negative impact of global trade skirmishes on Europe’s trade-dependent economy. In addition, the aggressively anti-euro attitude of Italy’s newly elected government caused concerns throughout the eurozone.
The U.K. declined less than the broader market. Investor concerns around the looming Brexit deadline were outweighed by a perceived decline in the probability of a no-deal Brexit, along with strength in the energy sector due to rising commodity prices for much of the period and positive results in the health care sector.
Japan also modestly outperformed the Index during the period as investors flocked to the traditional safe-haven country at the end of 2018. Despite investor fears of U.S. tariffs impacting Japan’s export-led economy, strong economic growth and the re-election of Prime Minister Abe bolstered the country’s equity markets.
The strengthening U.S. dollar also detracted from Index returns. An increase in the value of the dollar during the period served to decrease the worth of foreign-denominated assets when stated in U.S. dollar terms.
Fund Performance
For the 12-month period ended January 31, 2019, Parametric International Equity Fund (the Fund) returned –9.73% for Investor Class shares at net asset value (NAV), outperforming the Index, which returned –12.51%.
Factors contributing to Fund performance relative to the Index included the Fund’s sector diversification6 process
within Germany, particularly due to the overweight position in real estate as investors anticipated increased demand for housing as a result of employers moving staff to Germany due to Brexit. The sector diversification process in Japan also added to excess returns due, in part, to an overweight position in the traditionally defensive utilities sector, which returned nearly 20%, as traditionally cyclical asset classes saw outflows. Out-of-Index small-cap holdings in Sweden also aided relative results during the period.
Factors detracting from Fund performance relative to the Index included the sector diversification process within Switzerland. This was partially due to an underweight position in the health care sector, which rose on strong earnings from major pharmaceutical constituents. An underweight position in the U.K., as well as out-of-Index small-cap holdings within the U.K. health care market, also weighed on relative results. Additionally, the sector diversification process within Hong Kong detracted from relative performance during the period.
See Endnotes and Additional Disclosures in this report.
Past performance is no guarantee of future results. Returns are historical and are calculated by determining the percentage change in net asset value (NAV) or offering price (as applicable) with all distributions reinvested. Investment return and principal value will fluctuate so that shares, when redeemed, may be worth more or less than their original cost. Performance less than or equal to one year is cumulative. Performance is for the stated time period only; due to market volatility, the Fund’s current performance may be lower or higher than quoted. Returns are before taxes unless otherwise noted. For performance as of the most recentmonth-end, please refer to eatonvance.com.
Parametric
International Equity Fund
January 31, 2019
Performance2,3
Portfolio Managers Thomas Seto, Timothy W. Atwill, Ph.D., CFA and Paul Bouchey, CFA, each of Parametric Portfolio Associates LLC
| | | | | | | | | | | | | | | | | | | | |
| % Average Annual Total Returns | | Class Inception Date | | | Performance Inception Date | | | One Year | | | Five Years | | | Since
Inception | |
Investor Class at NAV | | | 04/01/2010 | | | | 04/01/2010 | | | | –9.73 | % | | | 4.13 | % | | | 5.27 | % |
Institutional Class at NAV | | | 04/01/2010 | | | | 04/01/2010 | | | | –9.53 | | | | 4.39 | | | | 5.54 | |
Class R at NAV | | | 08/10/2015 | | | | 04/01/2010 | | | | –9.96 | | | | 3.93 | | | | 5.16 | |
Class R6 at NAV | | | 08/10/2015 | | | | 04/01/2010 | | | | –9.56 | | | | 4.40 | | | | 5.54 | |
MSCI EAFE Index | | | — | | | | — | | | | –12.51 | % | | | 2.66 | % | | | 4.53 | % |
| | | | | |
| | | | | | | | | | | | | | | | | | | | |
| % Total Annual Operating Expense Ratios4 | | | | | Investor Class | | | Institutional Class | | | Class R | | | Class R6 | |
Gross | | | | | | | 0.86 | % | | | 0.61 | % | | | 1.11 | % | | | 0.58 | % |
Net | | | | | | | 0.75 | | | | 0.50 | | | | 1.00 | | | | 0.47 | |
Growth of $10,000
This graph shows the change in value of a hypothetical investment of $10,000 in Investor Class of the Fund for the period indicated. For comparison, the same investment is shown in the indicated index.
| | | | | | | | | | | | | | | | |
| Growth of Investment3 | | Amount Invested | | | Period Beginning | | | At NAV | | | With Maximum Sales Charge | |
Institutional Class | | $ | 50,000 | | | | 04/01/2010 | | | $ | 80,526 | | | | N.A. | |
Class R | | $ | 10,000 | | | | 04/01/2010 | | | $ | 15,601 | | | | N.A. | |
Class R6 | | $ | 1,000,000 | | | | 04/01/2010 | | | $ | 1,611,540 | | | | N.A. | |
See Endnotes and Additional Disclosures in this report.
Past performance is no guarantee of future results. Returns are historical and are calculated by determining the percentage change in net asset value (NAV) or offering price (as applicable) with all distributions reinvested. Investment return and principal value will fluctuate so that shares, when redeemed, may be worth more or less than their original cost. Performance less than or equal to one year is cumulative. Performance is for the stated time period only; due to market volatility, the Fund’s current performance may be lower or higher than quoted. Returns are before taxes unless otherwise noted. For performance as of the most recentmonth-end, please refer to eatonvance.com.
Parametric
International Equity Fund
January 31, 2019
Fund Profile
Sector Allocation (% of net assets)5
Top 10 Holdings (% of net assets)5
| | | | |
| |
Nestle SA | | | 1.1 | % |
| |
Compagnie Financiere Richemont SA, Class A | | | 0.9 | |
| |
Sanofi | | | 0.8 | |
| |
Total SA | | | 0.8 | |
| |
Unilever NV | | | 0.7 | |
| |
Air Liquide SA | | | 0.7 | |
| |
Deutsche Telekom AG | | | 0.6 | |
| |
SAP SE | | | 0.6 | |
| |
Orange SA | | | 0.6 | |
| |
Novartis AG | | | 0.6 | |
| |
Total | | | 7.4 | % |
Geographic Allocation (% of common stocks)
See Endnotes and Additional Disclosures in this report.
Parametric
International Equity Fund
January 31, 2019
Endnotes and Additional Disclosures
| 1 | The views expressed in this report are those of the portfolio manager(s) and are current only through the date stated at the top of this page. These views are subject to change at any time based upon market or other conditions, and Eaton Vance and the Fund(s) disclaim any responsibility to update such views. These views may not be relied upon as investment advice and, because investment decisions are based on many factors, may not be relied upon as an indication of trading intent on behalf of any Eaton Vance fund. This commentary may contain statements that are not historical facts, referred to as “forward looking statements.” The Fund’s actual future results may differ significantly from those stated in any forward looking statement, depending on factors such as changes in securities or financial markets or general economic conditions, the volume of sales and purchases of Fund shares, the continuation of investment advisory, administrative and service contracts, and other risks discussed from time to time in the Fund’s filings with the Securities and Exchange Commission. |
| 2 | MSCI EAFE Index is an unmanaged index of equities in the developed markets, excluding the U.S. and Canada. MSCI indexes are net of foreign withholding taxes. Source: MSCI. MSCI data may not be reproduced or used for any other purpose. MSCI provides no warranties, has not prepared or approved this report, and has no liability hereunder. Unless otherwise stated, index returns do not reflect the effect of any applicable sales charges, commissions, expenses, taxes or leverage, as applicable. It is not possible to invest directly in an index. |
| 3 | Returns are historical and are calculated by determining the percentage change in NAV with all distributions reinvested. Unless otherwise stated, performance does not reflect the deduction of taxes on Fund distributions or redemptions of Fund shares. |
| | Performance prior to the inception date of a class may be linked to the performance of an older class of the Fund. This linked performance is adjusted for any applicable sales charge, but is not adjusted for class expense differences. If adjusted for such differences, the performance would be different. The performance of Class R is linked to Investor Class and the performance of Class R6 is linked to Institutional Class. Performance since inception for an index, if presented, is the performance since the Fund’s or oldest share class’ inception, as applicable. Performance presented in the Financial Highlights included in the financial statements is not linked. |
| 4 | Source: Fund prospectus. Net expense ratio reflects a contractual expense reimbursement that continues through 5/31/19. Without the reimbursement, performance would have been lower. The expense ratios for the current reporting period can be found in the Financial Highlights section of this report. |
| 5 | Excludes cash and cash equivalents. |
| 6 | Diversification cannot ensure a profit or eliminate the risk of loss. |
| | Fund profile subject to change due to active management. |
| | Important Notice to Shareholders |
| | Effective May 1, 2019, the portfolio managers of the Fund will be Thomas Seto, Paul Bouchey and Jennifer Sireklove, each of Parametric Portfolio Associates LLC. |
Parametric
International Equity Fund
January 31, 2019
Fund Expenses
Example: As a Fund shareholder, you incur two types of costs: (1) transaction costs, including sales charges (loads) on purchases and redemption fees (if applicable); and (2) ongoing costs, including management fees; distribution and/or service fees; and other Fund expenses. This Example is intended to help you understand your ongoing costs (in dollars) of Fund investing and to compare these costs with the ongoing costs of investing in other mutual funds. The Example is based on an investment of $1,000 invested at the beginning of the period and held for the entire period (August 1, 2018 – January 31, 2019).
Actual Expenses: The first section of the table below provides information about actual account values and actual expenses. You may use the information in this section, together with the amount you invested, to estimate the expenses that you paid over the period. Simply divide your account value by $1,000 (for example, an $8,600 account value divided by $1,000 = 8.6), then multiply the result by the number in the first section under the heading entitled “Expenses Paid During Period” to estimate the expenses you paid on your account during this period.
Hypothetical Example for Comparison Purposes: The second section of the table below provides information about hypothetical account values and hypothetical expenses based on the actual Fund expense ratio and an assumed rate of return of 5% per year (before expenses), which is not the actual Fund return. The hypothetical account values and expenses may not be used to estimate the actual ending account balance or expenses you paid for the period. You may use this information to compare the ongoing costs of investing in your Fund and other funds. To do so, compare this 5% hypothetical example with the 5% hypothetical examples that appear in the shareholder reports of the other funds.
Please note that the expenses shown in the table are meant to highlight your ongoing costs only and do not reflect any transactional costs, such as sales charges (loads) or redemption fees (if applicable). Therefore, the second section of the table is useful in comparing ongoing costs only, and will not help you determine the relative total costs of owning different funds. In addition, if these transactional costs were included, your costs would be higher.
| | | | | | | | | | | | | | | | |
| | | Beginning
Account Value
(8/1/18) | | | Ending
Account Value
(1/31/19) | | | Expenses Paid
During Period*
(8/1/18 – 1/31/19) | | | Annualized
Expense
Ratio | |
| | | | |
Actual | | | | | | | | | | | | | | | | |
Investor Class | | $ | 1,000.00 | | | $ | 932.00 | | | $ | 3.65 | ** | | | 0.75 | % |
Institutional Class | | $ | 1,000.00 | | | $ | 932.50 | | | $ | 2.44 | ** | | | 0.50 | % |
Class R | | $ | 1,000.00 | | | $ | 930.30 | | | $ | 4.87 | ** | | | 1.00 | % |
Class R6 | | $ | 1,000.00 | | | $ | 932.20 | | | $ | 2.29 | ** | | | 0.47 | % |
| | | | | |
Hypothetical | | | | | | | | | | | | | | | | |
(5% return per year before expenses) | | | | | | | | | | | | | | | | |
Investor Class | | $ | 1,000.00 | | | $ | 1,021.40 | | | $ | 3.82 | ** | | | 0.75 | % |
Institutional Class | | $ | 1,000.00 | | | $ | 1,022.70 | | | $ | 2.55 | ** | | | 0.50 | % |
Class R | | $ | 1,000.00 | | | $ | 1,020.20 | | | $ | 5.09 | ** | | | 1.00 | % |
Class R6 | | $ | 1,000.00 | | | $ | 1,022.80 | | | $ | 2.40 | ** | | | 0.47 | % |
| * | Expenses are equal to the Fund’s annualized expense ratio for the indicated Class, multiplied by the average account value over the period, multiplied by 184/365 (to reflect the one-half year period). The Example assumes that the $1,000 was invested at the net asset value per share determined at the close of business on July 31, 2018. |
| ** | Absent an allocation of certain expenses to affiliates, the expenses would be higher. |
Parametric
International Equity Fund
January 31, 2019
Portfolio of Investments
| | | | | | | | |
| Common Stocks — 98.5% | |
| Security | | Shares | | | Value | |
|
| Australia — 8.8% | |
| | |
Adelaide Brighton, Ltd. | | | 13,200 | | | $ | 43,095 | |
| | |
Alumina, Ltd. | | | 55,500 | | | | 98,705 | |
| | |
Amcor, Ltd. | | | 17,100 | | | | 169,781 | |
| | |
AMP, Ltd. | | | 110,100 | | | | 181,531 | |
| | |
APA Group | | | 168,000 | | | | 1,123,049 | |
| | |
ARB Corp., Ltd. | | | 5,909 | | | | 67,368 | |
| | |
Aristocrat Leisure, Ltd. | | | 35,900 | | | | 645,683 | |
| | |
Atlas Arteria, Ltd. | | | 33,880 | | | | 164,161 | |
| | |
Atlassian Corp. PLC, Class A(1) | | | 10,500 | | | | 1,033,200 | |
| | |
Aurizon Holdings, Ltd. | | | 93,250 | | | | 298,812 | |
| | |
AusNet Services | | | 424,500 | | | | 510,098 | |
| | |
Australia and New Zealand Banking Group, Ltd. | | | 27,700 | | | | 504,247 | |
| | |
Australian Pharmaceutical Industries, Ltd. | | | 100,174 | | | | 91,893 | |
| | |
BHP Group, Ltd. | | | 28,450 | | | | 726,411 | |
| | |
Boral, Ltd. | | | 21,487 | | | | 77,734 | |
| | |
Brambles, Ltd. | | | 56,335 | | | | 437,100 | |
| | |
Bravura Solutions, Ltd. | | | 34,000 | | | | 104,213 | |
| | |
BWP Trust | | | 43,000 | | | | 114,023 | |
| | |
Caltex Australia, Ltd. | | | 14,550 | | | | 284,392 | |
| | |
carsales.com, Ltd. | | | 36,600 | | | | 336,584 | |
| | |
Charter Hall Retail REIT | | | 49,000 | | | | 162,369 | |
| | |
Cimic Group, Ltd. | | | 4,546 | | | | 148,201 | |
| | |
Cleanaway Waste Management, Ltd. | | | 110,518 | | | | 145,473 | |
| | |
Coca-Cola Amatil, Ltd. | | | 40,900 | | | | 249,795 | |
| | |
Cochlear, Ltd. | | | 2,716 | | | | 383,839 | |
| | |
Coles Group, Ltd.(1) | | | 66,300 | | | | 602,900 | |
| | |
Commonwealth Bank of Australia | | | 13,350 | | | | 680,225 | |
| | |
Computershare, Ltd. | | | 41,000 | | | | 531,140 | |
| | |
Corporate Travel Management, Ltd. | | | 4,900 | | | | 83,920 | |
| | |
Cromwell Property Group | | | 233,500 | | | | 180,191 | |
| | |
Crown Resorts, Ltd. | | | 25,500 | | | | 222,207 | |
| | |
CSL, Ltd. | | | 12,050 | | | | 1,713,438 | |
| | |
CSR, Ltd. | | | 25,925 | | | | 55,183 | |
| | |
Dexus | | | 45,000 | | | | 376,790 | |
| | |
Domino’s Pizza Enterprises, Ltd. | | | 3,000 | | | | 99,497 | |
| | |
DuluxGroup, Ltd. | | | 13,768 | | | | 68,657 | |
| | |
Evolution Mining, Ltd. | | | 44,676 | | | | 130,421 | |
| | |
Flight Centre Travel Group, Ltd. | | | 5,800 | | | | 182,002 | |
| | |
Fortescue Metals Group, Ltd. | | | 27,000 | | | | 111,535 | |
| | |
GPT Group (The) | | | 81,100 | | | | 342,918 | |
| | |
GrainCorp, Ltd., Class A | | | 25,572 | | | | 176,625 | |
| | |
GUD Holdings, Ltd. | | | 8,300 | | | | 67,780 | |
| | |
GWA Group, Ltd. | | | 32,000 | | | | 65,073 | |
| | |
Hansen Technologies, Ltd. | | | 30,805 | | | | 77,029 | |
| | |
Harvey Norman Holdings, Ltd. | | | 37,504 | | | | 92,101 | |
| | | | | | | | |
| Security | | Shares | | | Value | |
|
| Australia (continued) | |
| | |
IDP Education, Ltd. | | | 14,400 | | | $ | 119,057 | |
| | |
Incitec Pivot, Ltd. | | | 42,949 | | | | 103,661 | |
| | |
Inghams Group, Ltd. | | | 53,650 | | | | 179,620 | |
| | |
InvoCare, Ltd. | | | 7,600 | | | | 67,497 | |
| | |
James Hardie Industries PLC CDI | | | 6,121 | | | | 68,177 | |
| | |
JB Hi-Fi, Ltd. | | | 6,499 | | | | 105,897 | |
| | |
Link Administration Holdings, Ltd. | | | 75,000 | | | | 390,786 | |
| | |
Mirvac Group | | | 185,300 | | | | 324,900 | |
| | |
MYOB Group, Ltd. | | | 32,500 | | | | 80,215 | |
| | |
National Australia Bank, Ltd. | | | 23,600 | | | | 409,806 | |
| | |
Navitas, Ltd. | | | 32,100 | | | | 131,285 | |
| | |
Newcrest Mining, Ltd. | | | 10,706 | | | | 190,468 | |
| | |
Nine Entertainment Co. Holdings, Ltd. | | | 385,413 | | | | 409,169 | |
| | |
Northern Star Resources, Ltd. | | | 21,243 | | | | 135,785 | |
| | |
Oil Search, Ltd. | | | 69,256 | | | | 394,321 | |
| | |
Orica, Ltd. | | | 5,800 | | | | 72,405 | |
| | |
Orora, Ltd. | | | 42,869 | | | | 98,784 | |
| | |
Premier Investments, Ltd. | | | 7,193 | | | | 72,440 | |
| | |
Qantas Airways, Ltd. | | | 38,249 | | | | 151,640 | |
| | |
Qube Holdings, Ltd. | | | 57,000 | | | | 111,681 | |
| | |
Ramsay Health Care, Ltd. | | | 2,800 | | | | 115,641 | |
| | |
Rio Tinto, Ltd. | | | 5,548 | | | | 352,773 | |
| | |
Santos, Ltd. | | | 98,500 | | | | 464,743 | |
| | |
Scentre Group | | | 188,500 | | | | 545,949 | |
| | |
Shopping Centres Australasia Property Group | | | 68,000 | | | | 123,394 | |
| | |
Sonic Healthcare, Ltd. | | | 8,700 | | | | 145,930 | |
| | |
Southern Cross Media Group, Ltd. | | | 275,000 | | | | 210,348 | |
| | |
Spark Infrastructure Group | | | 361,000 | | | | 634,331 | |
| | |
SpeedCast International, Ltd. | | | 89,600 | | | | 189,876 | |
| | |
Star Entertainment Group, Ltd. (The) | | | 62,300 | | | | 201,585 | |
| | |
Sydney Airport | | | 45,111 | | | | 215,328 | |
| | |
Technology One, Ltd. | | | 75,000 | | | | 381,235 | |
| | |
Telstra Corp., Ltd. | | | 446,000 | | | | 1,011,187 | |
| | |
Transurban Group | | | 78,900 | | | | 699,706 | |
| | |
Vicinity Centres | | | 125,495 | | | | 238,926 | |
| | |
Viva Energy Group, Ltd.(1)(2) | | | 60,000 | | | | 80,531 | |
| | |
Washington H. Soul Pattinson & Co., Ltd. | | | 17,626 | | | | 338,053 | |
| | |
Wesfarmers, Ltd. | | | 32,900 | | | | 771,787 | |
| | |
Westpac Banking Corp. | | | 27,100 | | | | 484,332 | |
| | |
Woodside Petroleum, Ltd. | | | 42,550 | | | | 1,064,321 | |
| | |
Woolworths Group, Ltd. | | | 57,600 | | | | 1,230,796 | |
| | |
| | | | | | | $ | 27,079,755 | |
|
| Austria — 1.1% | |
| | |
ams AG | | | 19,000 | | | $ | 509,313 | |
| | |
ANDRITZ AG | | | 4,700 | | | | 232,030 | |
| | | | |
| | 7 | | See Notes to Financial Statements. |
Parametric
International Equity Fund
January 31, 2019
Portfolio of Investments — continued
| | | | | | | | |
| Security | | Shares | | | Value | |
|
| Austria (continued) | |
| | |
CA Immobilien Anlagen AG | | | 5,940 | | | $ | 212,657 | |
| | |
DO & Co. AG | | | 1,870 | | | | 178,189 | |
| | |
Erste Group Bank AG | | | 7,150 | | | | 249,574 | |
| | |
EVN AG | | | 5,000 | | | | 80,917 | |
| | |
IMMOFINANZ AG | | | 9,282 | | | | 245,409 | |
| | |
Lenzing AG | | | 1,180 | | | | 115,443 | |
| | |
Oesterreichische Post AG | | | 3,050 | | | | 114,763 | |
| | |
OMV AG | | | 9,350 | | | | 464,908 | |
| | |
Porr AG | | | 3,440 | | | | 78,727 | |
| | |
Rhi Magnesita NV | | | 2,046 | | | | 114,521 | |
| | |
Telekom Austria AG | | | 32,350 | | | | 247,331 | |
| | |
UNIQA Insurance Group AG | | | 14,300 | | | | 130,558 | |
| | |
Verbund AG | | | 7,300 | | | | 373,083 | |
| | |
Wienerberger AG | | | 6,800 | | | | 152,660 | |
| | |
| | | | | | | $ | 3,500,083 | |
|
| Belgium — 2.2% | |
| | |
Ageas | | | 5,900 | | | $ | 274,329 | |
| | |
AGFA-Gevaert NV(1) | | | 19,500 | | | | 76,701 | |
| | |
Anheuser-Busch InBev SA/NV | | | 12,500 | | | | 955,041 | |
| | |
Barco NV | | | 1,818 | | | | 222,390 | |
| | |
Befimmo SA | | | 3,060 | | | | 183,525 | |
| | |
Bekaert SA | | | 9,000 | | | | 242,407 | |
| | |
bpost SA | | | 23,800 | | | | 218,184 | |
| | |
Colruyt SA | | | 1,550 | | | | 111,315 | |
| | |
D’ieteren SA/NV | | | 3,850 | | | | 145,873 | |
| | |
Econocom Group SA/NV | | | 45,600 | | | | 165,353 | |
| | |
Elia System Operator SA/NV | | | 4,210 | | | | 308,052 | |
| | |
Euronav SA | | | 27,200 | | | | 212,969 | |
| | |
Fagron | | | 6,200 | | | | 113,046 | |
| | |
Gimv NV | | | 1,000 | | | | 57,232 | |
| | |
Ion Beam Applications(1) | | | 3,519 | | | | 50,018 | |
| | |
KBC Group NV | | | 6,400 | | | | 434,496 | |
| | |
Materialise NV ADR(1) | | | 5,000 | | | | 82,650 | |
| | |
Mithra Pharmaceuticals SA(1) | | | 3,200 | | | | 105,757 | |
| | |
Proximus SA | | | 19,900 | | | | 534,230 | |
| | |
Retail Estates NV | | | 755 | | | | 66,984 | |
| | |
Sofina SA | | | 780 | | | | 154,708 | |
| | |
Solvay SA | | | 4,800 | | | | 522,575 | |
| | |
Telenet Group Holding NV | | | 9,400 | | | | 435,130 | |
| | |
Tessenderlo Group SA(1) | | | 2,900 | | | | 102,700 | |
| | |
UCB SA | | | 6,120 | | | | 530,317 | |
| | |
Warehouses De Pauw CVA | | | 4,300 | | | | 628,298 | |
| | |
| | | | | | | $ | 6,934,280 | |
| | | | | | | | |
| Security | | Shares | | | Value | |
|
| Denmark — 2.2% | |
| | |
Alm Brand A/S | | | 9,000 | | | $ | 77,471 | |
| | |
Ascendis Pharma A/S ADR(1) | | | 1,000 | | | | 71,460 | |
| | |
Bakkafrost P/F | | | 2,234 | | | | 116,137 | |
| | |
Carlsberg A/S, Class B | | | 5,325 | | | | 609,628 | |
| | |
Chr. Hansen Holding A/S | | | 4,700 | | | | 446,340 | |
| | |
Danske Bank A/S | | | 24,000 | | | | 444,657 | |
| | |
Dfds A/S | | | 2,300 | | | | 108,585 | |
| | |
DSV A/S | | | 3,700 | | | | 295,291 | |
| | |
GN Store Nord A/S | | | 3,600 | | | | 155,183 | |
| | |
H Lundbeck AS | | | 1,459 | | | | 64,064 | |
| | |
ISS A/S | | | 4,580 | | | | 129,801 | |
| | |
Jyske Bank A/S | | | 2,000 | | | | 75,026 | |
| | |
Netcompany Group AS(1)(2) | | | 2,900 | | | | 97,635 | |
| | |
Nilfisk Holding A/S(1) | | | 2,150 | | | | 79,469 | |
| | |
Novo Nordisk A/S, Class B | | | 15,050 | | | | 705,334 | |
| | |
Novozymes A/S, Class B | | | 10,460 | | | | 437,408 | |
| | |
Orsted A/S(2) | | | 13,900 | | | | 1,004,450 | |
| | |
Pandora A/S | | | 13,100 | | | | 568,901 | |
| | |
Ringkjoebing Landbobank A/S | | | 2,260 | | | | 120,972 | |
| | |
Rockwool International A/S, Class B | | | 246 | | | | 65,981 | |
| | |
Royal Unibrew A/S | | | 1,899 | | | | 143,020 | |
| | |
Scandinavian Tobacco Group AS(2) | | | 5,600 | | | | 72,451 | |
| | |
SimCorp A/S | | | 4,300 | | | | 339,365 | |
| | |
Topdanmark A/S | | | 2,527 | | | | 120,397 | |
| | |
Tryg A/S | | | 3,700 | | | | 94,399 | |
| | |
Vestas Wind Systems A/S | | | 3,900 | | | | 322,387 | |
| | |
| | | | | | | $ | 6,765,812 | |
|
| Finland — 2.1% | |
| | |
Amer Sports Oyj | | | 12,000 | | | $ | 532,654 | |
| | |
Citycon Oyj | | | 50,397 | | | | 103,071 | |
| | |
Cramo Oyj | | | 3,655 | | | | 69,834 | |
| | |
DNA Oyj | | | 5,000 | | | | 105,342 | |
| | |
Elisa Oyj | | | 13,450 | | | | 562,715 | |
| | |
Fortum Oyj | | | 28,965 | | | | 658,314 | |
| | |
Huhtamaki Oyj | | | 4,124 | | | | 135,925 | |
| | |
Kemira Oyj | | | 9,600 | | | | 116,763 | |
| | |
Kesko Oyj, Class B | | | 9,180 | | | | 528,242 | |
| | |
Kone Oyj, Class B | | | 6,200 | | | | 301,463 | |
| | |
Metsa Board Oyj | | | 9,623 | | | | 70,048 | |
| | |
Neste Oyj | | | 7,977 | | | | 730,854 | |
| | |
Nokia Oyj | | | 105,000 | | | | 663,354 | |
| | |
Oriola Oyj, Series B | | | 21,185 | | | | 52,718 | |
| | |
Orion Oyj, Class B | | | 13,100 | | | | 463,098 | |
| | |
Sampo Oyj, Class A | | | 7,880 | | | | 361,025 | |
| | |
Terveystalo Oyj(2) | | | 7,800 | | | | 74,612 | |
| | | | |
| | 8 | | See Notes to Financial Statements. |
Parametric
International Equity Fund
January 31, 2019
Portfolio of Investments — continued
| | | | | | | | |
| Security | | Shares | | | Value | |
|
| Finland (continued) | |
| | |
Tieto Oyj | | | 2,033 | | | $ | 58,310 | |
| | |
Tokmanni Group Corp. | | | 17,360 | | | | 169,497 | |
| | |
UPM-Kymmene Oyj | | | 12,756 | | | | 370,456 | |
| | |
Valmet Oyj | | | 3,811 | | | | 85,864 | |
| | |
Wartsila Oyj Abp | | | 7,700 | | | | 125,731 | |
| | |
YIT Oyj | | | 13,000 | | | | 84,062 | |
| | |
| | | | | | | $ | 6,423,952 | |
|
| France — 9.1% | |
| | |
Aeroports de Paris | | | 489 | | | $ | 93,546 | |
| | |
Air Liquide SA | | | 17,650 | | | | 2,142,701 | |
| | |
Airbus SE | | | 4,550 | | | | 524,433 | |
| | |
Alstom SA | | | 2,298 | | | | 92,448 | |
| | |
Alten SA | | | 2,800 | | | | 268,335 | |
| | |
Altran Technologies SA | | | 25,000 | | | | 236,169 | |
| | |
Arkema SA | | | 3,800 | | | | 360,040 | |
| | |
Atos SE | | | 5,000 | | | | 455,899 | |
| | |
AXA SA | | | 38,000 | | | | 881,226 | |
| | |
Bureau Veritas SA | | | 4,718 | | | | 104,815 | |
| | |
Carrefour SA | | | 19,800 | | | | 391,562 | |
| | |
Christian Dior SE | | | 216 | | | | 91,189 | |
| | |
Cie Generale des Etablissements Michelin SCA | | | 1,700 | | | | 184,657 | |
| | |
CNP Assurances | | | 10,100 | | | | 229,461 | |
| | |
Covivio | | | 6,550 | | | | 669,506 | |
| | |
Credit Agricole SA | | | 29,900 | | | | 341,500 | |
| | |
Dassault Systemes SE | | | 7,370 | | | | 923,694 | |
| | |
Edenred | | | 2,500 | | | | 101,242 | |
| | |
Eiffage SA | | | 1,270 | | | | 118,981 | |
| | |
Elior Group SA(2) | | | 3,613 | | | | 50,858 | |
| | |
Elis SA | | | 4,300 | | | | 69,558 | |
| | |
Engie SA | | | 83,000 | | | | 1,330,599 | |
| | |
EssilorLuxottica SA | | | 5,834 | | | | 739,046 | |
| | |
Eurazeo SE | | | 2,700 | | | | 200,683 | |
| | |
Eutelsat Communications SA | | | 5,093 | | | | 108,006 | |
| | |
Fnac Darty SA(1) | | | 1,400 | | | | 98,600 | |
| | |
Gaztransport Et Technigaz SA | | | 1,000 | | | | 84,467 | |
| | |
Gecina SA | | | 6,300 | | | | 925,864 | |
| | |
Getlink SE | | | 10,600 | | | | 155,022 | |
| | |
Hermes International | | | 370 | | | | 221,737 | |
| | |
Ingenico Group SA | | | 4,930 | | | | 268,723 | |
| | |
L’Oreal SA | | | 4,810 | | | | 1,159,331 | |
| | |
Lagardere SCA | | | 3,693 | | | | 96,493 | |
| | |
Legrand SA | | | 2,162 | | | | 128,091 | |
| | |
LVMH Moet Hennessy Louis Vuitton SE | | | 3,070 | | | | 984,857 | |
| | |
Neopost SA | | | 5,400 | | | | 135,534 | |
| | |
Orange SA | | | 119,900 | | | | 1,859,696 | |
| | | | | | | | |
| Security | | Shares | | | Value | |
|
| France (continued) | |
| | |
Pernod-Ricard SA | | | 4,660 | | | $ | 773,155 | |
| | |
Peugeot SA | | | 5,850 | | | | 147,159 | |
| | |
Publicis Groupe SA | | | 7,200 | | | | 439,631 | |
| | |
Remy Cointreau SA | | | 2,000 | | | | 232,257 | |
| | |
Renault SA | | | 2,980 | | | | 210,880 | |
| | |
Rubis SCA | | | 5,550 | | | | 331,286 | |
| | |
Safran SA | | | 2,850 | | | | 374,459 | |
| | |
Sanofi | | | 29,600 | | | | 2,572,769 | |
| | |
SCOR SE | | | 7,100 | | | | 298,766 | |
| | |
SEB SA | | | 492 | | | | 75,443 | |
| | |
Societe BIC SA | | | 850 | | | | 85,128 | |
| | |
Societe Generale SA | | | 15,000 | | | | 467,692 | |
| | |
Sodexo SA | | | 2,760 | | | | 287,319 | |
| | |
Suez | | | 25,209 | | | | 323,095 | |
| | |
Talend SA ADR(1) | | | 5,300 | | | | 197,160 | |
| | |
Teleperformance | | | 618 | | | | 106,358 | |
| | |
Thales SA | | | 1,146 | | | | 126,735 | |
| | |
Total SA | | | 44,500 | | | | 2,439,540 | |
| | |
Unibail-Rodamco-Westfield | | | 5,223 | | | | 939,365 | |
| | |
Veolia Environnement SA | | | 25,000 | | | | 528,141 | |
| | |
Vinci SA | | | 4,433 | | | | 390,061 | |
| | |
| | | | | | | $ | 28,174,968 | |
|
| Germany — 8.8% | |
| | |
Aareal Bank AG | | | 5,640 | | | $ | 182,378 | |
| | |
adidas AG | | | 2,650 | | | | 630,544 | |
| | |
Allianz SE | | | 6,160 | | | | 1,306,982 | |
| | |
alstria office REIT AG | | | 16,144 | | | | 242,968 | |
| | |
Axel Springer SE | | | 2,680 | | | | 164,092 | |
| | |
BASF SE | | | 21,500 | | | | 1,575,039 | |
| | |
Bayerische Motoren Werke AG | | | 4,900 | | | | 412,827 | |
| | |
Bayerische Motoren Werke AG, PFC Shares | | | 2,656 | | | | 196,312 | |
| | |
Bechtle AG | | | 1,900 | | | | 151,183 | |
| | |
Beiersdorf AG | | | 8,460 | | | | 846,861 | |
| | |
Brenntag AG | | | 1,852 | | | | 87,688 | |
| | |
CANCOM SE | | | 3,700 | | | | 143,629 | |
| | |
Carl Zeiss Meditec AG | | | 2,900 | | | | 263,210 | |
| | |
Continental AG | | | 2,620 | | | | 414,055 | |
| | |
Covestro AG(2) | | | 4,700 | | | | 259,720 | |
| | |
Delivery Hero SE(1)(2) | | | 4,560 | | | | 168,416 | |
| | |
Deutsche Boerse AG | | | 3,050 | | | | 406,101 | |
| | |
Deutsche EuroShop AG | | | 6,000 | | | | 186,717 | |
| | |
Deutsche Lufthansa AG | | | 3,000 | | | | 75,738 | |
| | |
Deutsche Post AG | | | 14,859 | | | | 438,877 | |
| | |
Deutsche Telekom AG | | | 119,400 | | | | 1,941,546 | |
| | | | |
| | 9 | | See Notes to Financial Statements. |
Parametric
International Equity Fund
January 31, 2019
Portfolio of Investments — continued
| | | | | | | | |
| Security | | Shares | | | Value | |
|
| Germany (continued) | |
| | |
Deutsche Wohnen SE | | | 18,060 | | | $ | 902,229 | |
| | |
Dialog Semiconductor PLC(1) | | | 6,400 | | | | 187,114 | |
| | |
Evonik Industries AG | | | 7,050 | | | | 192,807 | |
| | |
Evotec AG(1) | | | 8,500 | | | | 199,594 | |
| | |
Fielmann AG | | | 1,390 | | | | 94,375 | |
| | |
Fraport AG | | | 716 | | | | 56,588 | |
| | |
Fresenius Medical Care AG & Co. KGaA | | | 5,830 | | | | 428,797 | |
| | |
Fresenius SE & Co. KGaA | | | 11,100 | | | | 575,534 | |
| | |
Fuchs Petrolub SE, PFC Shares | | | 3,000 | | | | 140,730 | |
| | |
GEA Group AG | | | 2,527 | | | | 69,620 | |
| | |
Gerresheimer AG | | | 3,000 | | | | 203,163 | |
| | |
Grand City Properties SA | | | 12,766 | | | | 317,624 | |
| | |
Hannover Rueck SE | | | 1,092 | | | | 157,612 | |
| | |
HeidelbergCement AG | | | 4,100 | | | | 283,913 | |
| | |
Henkel AG & Co. KGaA | | | 9,360 | | | | 857,949 | |
| | |
Hochtief AG | | | 680 | | | | 101,706 | |
| | |
Hugo Boss AG | | | 2,780 | | | | 199,327 | |
| | |
Innogy SE(2) | | | 13,850 | | | | 656,191 | |
| | |
KION Group AG | | | 1,800 | | | | 103,929 | |
| | |
KWS Saat SE | | | 205 | | | | 64,747 | |
| | |
LEG Immobilien AG | | | 3,814 | | | | 448,036 | |
| | |
MAN SE | | | 700 | | | | 72,365 | |
| | |
Merck KGaA | | | 3,400 | | | | 356,997 | |
| | |
Metro AG | | | 27,200 | | | | 460,303 | |
| | |
MorphoSys AG(1) | | | 1,650 | | | | 178,507 | |
| | |
MTU Aero Engines AG | | | 820 | | | | 176,827 | |
| | |
Muenchener Rueckversicherungs-Gesellschaft AG | | | 2,455 | | | | 547,858 | |
| | |
Nemetschek SE | | | 1,300 | | | | 166,846 | |
| | |
Osram Licht AG | | | 1,420 | | | | 60,424 | |
| | |
ProSiebenSat.1 Media SE | | | 13,700 | | | | 244,553 | |
| | |
Puma SE | | | 350 | | | | 195,072 | |
| | |
Rational AG | | | 114 | | | | 71,512 | |
| | |
Rheinmetall AG | | | 1,350 | | | | 140,225 | |
| | |
RWE AG | | | 44,500 | | | | 1,106,788 | |
| | |
RWE AG, PFC Shares | | | 13,100 | | | | 321,509 | |
| | |
SAP SE | | | 18,350 | | | | 1,897,485 | |
| | |
Sartorius AG, PFC Shares | | | 1,950 | | | | 292,724 | |
| | |
Siemens AG | | | 11,550 | | | | 1,268,165 | |
| | |
Siemens Healthineers AG(1)(2) | | | 5,200 | | | | 205,200 | |
| | |
Software AG | | | 5,200 | | | | 188,923 | |
| | |
Suedzucker AG | | | 24,000 | | | | 390,134 | |
| | |
Symrise AG | | | 3,400 | | | | 282,407 | |
| | |
TAG Immobilien AG | | | 15,000 | | | | 379,107 | |
| | |
Talanx AG(1) | | | 1,940 | | | | 72,084 | |
| | |
Telefonica Deutschland Holding AG(2) | | | 72,400 | | | | 253,824 | |
| | |
TLG Immobilien AG | | | 9,950 | | | | 305,486 | |
| | | | | | | | |
| Security | | Shares | | | Value | |
|
| Germany (continued) | |
| | |
TUI AG | | | 16,400 | | | $ | 248,319 | |
| | |
Uniper SE | | | 25,000 | | | | 724,918 | |
| | |
VERBIO Vereinigte BioEnergie AG | | | 4,576 | | | | 36,604 | |
| | |
Zalando SE(1)(2) | | | 6,600 | | | | 201,389 | |
| | |
| | | | | | | $ | 27,183,023 | |
|
| Hong Kong — 4.4% | |
| | |
AIA Group, Ltd. | | | 151,200 | | | $ | 1,365,261 | |
| | |
Alibaba Health Information Technology, Ltd.(1) | | | 162,000 | | | | 149,267 | |
| | |
ASM Pacific Technology, Ltd. | | | 26,500 | | | | 285,518 | |
| | |
Bank of East Asia, Ltd. (The) | | | 30,000 | | | | 101,192 | |
| | |
Beijing Tong Ren Tang Chinese Medicine Co., Ltd. | | | 108,000 | | | | 190,505 | |
| | |
BOC Hong Kong Holdings, Ltd. | | | 70,000 | | | | 270,474 | |
| | |
Brightoil Petroleum Holdings, Ltd.(1)(3) | | | 262,000 | | | | 0 | |
| | |
Cafe de Coral Holdings, Ltd. | | | 38,000 | | | | 102,620 | |
| | |
Champion REIT | | | 76,000 | | | | 57,776 | |
| | |
China Goldjoy Group, Ltd. | | | 996,000 | | | | 47,857 | |
| | |
Chow Tai Fook Jewellery Group, Ltd. | | | 78,600 | | | | 70,196 | |
| | |
CK Asset Holdings, Ltd. | | | 45,000 | | | | 378,846 | |
| | |
CK Hutchison Holdings, Ltd. | | | 36,500 | | | | 368,621 | |
| | |
CLP Holdings, Ltd. | | | 60,000 | | | | 698,823 | |
| | |
Esprit Holdings, Ltd.(1) | | | 257,000 | | | | 53,445 | |
| | |
First Pacific Co., Ltd. | | | 282,000 | | | | 122,308 | |
| | |
Fortune REIT | | | 70,000 | | | | 86,513 | |
| | |
Galaxy Entertainment Group, Ltd. | | | 79,000 | | | | 550,049 | |
| | |
Global Cord Blood Corp. | | | 20,900 | | | | 131,252 | |
| | |
Hang Lung Group, Ltd. | | | 21,000 | | | | 61,714 | |
| | |
Hang Lung Properties, Ltd. | | | 57,000 | | | | 124,810 | |
| | |
Hang Seng Bank, Ltd. | | | 12,000 | | | | 276,083 | |
| | |
Henderson Land Development Co., Ltd. | | | 37,152 | | | | 211,199 | |
| | |
HK Electric Investments & HK Electric Investments, Ltd. | | | 145,500 | | | | 148,442 | |
| | |
HKBN, Ltd. | | | 228,000 | | | | 352,482 | |
| | |
HKT Trust and HKT, Ltd. | | | 427,000 | | | | 629,724 | |
| | |
Hong Kong & China Gas Co., Ltd. | | | 343,210 | | | | 745,811 | |
| | |
Hongkong Land Holdings, Ltd. | | | 27,800 | | | | 199,990 | |
| | |
Hutchison Telecommunications Hong Kong Holdings, Ltd. | | | 180,000 | | | | 71,320 | |
| | |
Hysan Development Co., Ltd. | | | 18,000 | | | | 93,669 | |
| | |
Jardine Matheson Holdings, Ltd. | | | 9,000 | | | | 602,052 | |
| | |
Jardine Strategic Holdings, Ltd. | | | 7,900 | | | | 302,854 | |
| | |
Kerry Properties, Ltd. | | | 26,000 | | | | 107,992 | |
| | |
Li & Fung, Ltd. | | | 630,000 | | | | 107,076 | |
| | |
Lifestyle International Holdings, Ltd. | | | 40,000 | | | | 60,392 | |
| | |
Link REIT | | | 35,000 | | | | 384,725 | |
| | |
Luk Fook Holdings International, Ltd. | | | 27,000 | | | | 78,485 | |
| | |
Macau Legend Development, Ltd. | | | 273,000 | | | | 47,489 | |
| | |
Madison Holdings Group, Ltd.(1) | | | 760,000 | | | | 84,443 | |
| | | | |
| | 10 | | See Notes to Financial Statements. |
Parametric
International Equity Fund
January 31, 2019
Portfolio of Investments — continued
| | | | | | | | |
| Security | | Shares | | | Value | |
|
| Hong Kong (continued) | |
| | |
Melco Resorts & Entertainment, Ltd. ADR | | | 6,900 | | | $ | 148,902 | |
| | |
MGM China Holdings, Ltd. | | | 76,400 | | | | 148,343 | |
| | |
MTR Corp., Ltd. | | | 69,000 | | | | 385,901 | |
| | |
Nexteer Automotive Group, Ltd. | | | 48,000 | | | | 72,670 | |
| | |
NWS Holdings, Ltd. | | | 138,000 | | | | 315,597 | |
| | |
Pacific Textiles Holdings, Ltd. | | | 81,000 | | | | 70,645 | |
| | |
PCCW, Ltd. | | | 617,000 | | | | 367,293 | |
| | |
Power Assets Holdings, Ltd. | | | 53,500 | | | | 360,404 | |
| | |
Shangri-La Asia, Ltd. | | | 50,000 | | | | 65,291 | |
| | |
SmarTone Telecommunication Holdings, Ltd. | | | 80,000 | | | | 94,979 | |
| | |
Superb Summit International Group, Ltd.(1)(3) | | | 230,000 | | | | 0 | |
| | |
Swire Pacific, Ltd., Class A | | | 9,500 | | | | 112,511 | |
| | |
Swire Pacific, Ltd., Class B | | | 45,000 | | | | 80,423 | |
| | |
Swire Properties, Ltd. | | | 25,400 | | | | 99,141 | |
| | |
Techtronic Industries Co., Ltd. | | | 53,000 | | | | 309,390 | |
| | |
Tongda Group Holdings, Ltd. | | | 910,000 | | | | 123,650 | |
| | |
Town Health International Medical Group, Ltd.(1)(3) | | | 604,000 | | | | 26,555 | |
| | |
Vitasoy International Holdings, Ltd. | | | 166,000 | | | | 675,321 | |
| | |
VSTECS Holdings, Ltd. | | | 154,000 | | | | 74,030 | |
| | |
VTech Holdings, Ltd. | | | 23,000 | | | | 219,699 | |
| | |
Wharf Real Estate Investment Co., Ltd. | | | 22,000 | | | | 150,502 | |
| | |
Yue Yuen Industrial Holdings, Ltd. | | | 43,000 | | | | 146,665 | |
| | |
| | | | | | | $ | 13,769,187 | |
|
| Ireland — 2.2% | |
| | |
AIB Group PLC | | | 84,800 | | | $ | 379,623 | |
| | |
Bank of Ireland Group PLC | | | 111,400 | | | | 668,464 | |
| | |
Cairn Homes PLC(1) | | | 117,000 | | | | 174,059 | |
| | |
CRH PLC | | | 29,100 | | | | 837,631 | |
| | |
Dalata Hotel Group PLC | | | 17,000 | | | | 111,148 | |
| | |
Fly Leasing, Ltd. ADR(1) | | | 9,000 | | | | 101,610 | |
| | |
Glanbia PLC | | | 7,647 | | | | 146,130 | |
| | |
Grafton Group PLC | | | 23,500 | | | | 226,892 | |
| | |
Greencore Group PLC | | | 42,726 | | | | 108,366 | |
| | |
Hibernia REIT PLC | | | 257,300 | | | | 386,914 | |
| | |
ICON PLC(1) | | | 5,780 | | | | 808,506 | |
| | |
Irish Continental Group PLC | | | 48,700 | | | | 264,738 | |
| | |
Irish Residential Properties REIT PLC | | | 165,400 | | | | 283,750 | |
| | |
Kerry Group PLC, Class A | | | 7,100 | | | | 724,970 | |
| | |
Kingspan Group PLC | | | 10,449 | | | | 427,351 | |
| | |
Paddy Power Betfair PLC | | | 8,826 | | | | 720,926 | |
| | |
Smurfit Kappa Group PLC | | | 7,000 | | | | 201,850 | |
| | |
UDG Healthcare PLC | | | 27,700 | | | | 210,878 | |
| | |
| | | | | | | $ | 6,783,806 | |
| | | | | | | | |
| Security | | Shares | | | Value | |
|
| Israel — 2.2% | |
| | |
Airport City, Ltd.(1) | | | 12,070 | | | $ | 159,129 | |
| | |
Amot Investments, Ltd. | | | 22,481 | | | | 118,561 | |
| | |
Bank Leumi Le-Israel B.M. | | | 49,930 | | | | 330,107 | |
| | |
Bayside Land Corp. | | | 83 | | | | 39,712 | |
| | |
Bezeq The Israeli Telecommunication Corp., Ltd. | | | 701,000 | | | | 562,253 | |
| | |
Brack Capital Properties NV(1) | | | 284 | | | | 28,123 | |
| | |
Check Point Software Technologies, Ltd.(1) | | | 2,350 | | | | 263,012 | |
| | |
CyberArk Software, Ltd.(1) | | | 1,000 | | | | 87,760 | |
| | |
Delek Automotive Systems, Ltd. | | | 13,963 | | | | 63,059 | |
| | |
Delta-Galil Industries, Ltd. | | | 1,119 | | | | 32,369 | |
| | |
Elbit Systems, Ltd. | | | 4,150 | | | | 514,067 | |
| | |
Electra Consumer Products 1970, Ltd. | | | 7,750 | | | | 87,032 | |
| | |
Electra, Ltd. | | | 291 | | | | 68,642 | |
| | |
First International Bank of Israel, Ltd. | | | 4,135 | | | | 97,907 | |
| | |
Gazit-Globe, Ltd. | | | 11,000 | | | | 89,998 | |
| | |
IDI Insurance Co., Ltd. | | | 672 | | | | 36,997 | |
| | |
Inrom Construction Industries, Ltd. | | | 18,751 | | | | 60,907 | |
| | |
Israel Chemicals, Ltd. | | | 141,700 | | | | 822,438 | |
| | |
Israel Discount Bank, Ltd., Series A | | | 46,000 | | | | 162,695 | |
| | |
Kenon Holdings, Ltd. | | | 3,095 | | | | 56,670 | |
| | |
Melisron, Ltd. | | | 3,626 | | | | 167,014 | |
| | |
Mizrahi Tefahot Bank, Ltd. | | | 7,050 | | | | 131,150 | |
| | |
Nice, Ltd.(1) | | | 2,738 | | | | 301,853 | |
| | |
Oil Refineries, Ltd. | | | 592,800 | | | | 288,767 | |
| | |
Orbotech, Ltd.(1) | | | 1,735 | | | | 106,408 | |
| | |
Paz Oil Co., Ltd. | | | 2,936 | | | | 439,157 | |
| | |
Rami Levi Chain Stores Hashikma Marketing 2006, Ltd. | | | 4,240 | | | | 230,446 | |
| | |
Reit 1, Ltd. | | | 19,864 | | | | 82,130 | |
| | |
Sella Capital Real Estate, Ltd. | | | 44,539 | | | | 76,387 | |
| | |
Shapir Engineering and Industry, Ltd. | | | 30,000 | | | | 105,283 | |
| | |
Strauss Group, Ltd. | | | 17,550 | | | | 426,337 | |
| | |
Taro Pharmaceutical Industries, Ltd. | | | 1,000 | | | | 95,140 | |
| | |
Teva Pharmaceutical Industries, Ltd. ADR(1) | | | 38,320 | | | | 760,652 | |
| | |
| | | | | | | $ | 6,892,162 | |
|
| Italy — 4.4% | |
| | |
A2A SpA | | | 44,663 | | | $ | 81,493 | |
| | |
Amplifon SpA | | | 21,600 | | | | 386,973 | |
| | |
Assicurazioni Generali SpA | | | 21,540 | | | | 377,107 | |
| | |
ASTM SpA | | | 5,700 | | | | 136,766 | |
| | |
Atlantia SpA | | | 22,750 | | | | 538,472 | |
| | |
Autogrill SpA | | | 9,900 | | | | 89,052 | |
| | |
Banca Mediolanum SpA | | | 14,000 | | | | 85,414 | |
| | |
Banca Popolare di Sondrio SCPA | | | 17,850 | | | | 47,626 | |
| | |
Bio-On SpA(1) | | | 3,700 | | | | 254,711 | |
| | |
BPER Banca | | | 16,800 | | | | 56,934 | |
| | | | |
| | 11 | | See Notes to Financial Statements. |
Parametric
International Equity Fund
January 31, 2019
Portfolio of Investments — continued
| | | | | | | | |
| Security | | Shares | | | Value | |
|
| Italy (continued) | |
| | |
Brembo SpA | | | 8,900 | | | $ | 101,664 | |
| | |
Brunello Cucinelli SpA | | | 2,300 | | | | 83,175 | |
| | |
Cementir Holding SpA | | | 27,092 | | | | 184,560 | |
| | |
Cerved Group SpA | | | 9,600 | | | | 84,494 | |
| | |
COSMO Pharmaceuticals NV(1) | | | 2,550 | | | | 227,372 | |
| | |
Danieli & C Officine Meccaniche SpA, PFC Shares | | | 3,048 | | | | 49,464 | |
| | |
Datalogic SpA | | | 3,000 | | | | 81,102 | |
| | |
Davide Campari-Milano SpA | | | 93,200 | | | | 837,362 | |
| | |
De’Longhi SpA | | | 3,050 | | | | 76,100 | |
| | |
DiaSorin SpA | | | 4,790 | | | | 438,637 | |
| | |
El.En. SpA | | | 5,604 | | | | 102,657 | |
| | |
Enav SpA(2) | | | 13,855 | | | | 70,927 | |
| | |
Enel SpA | | | 188,000 | | | | 1,136,256 | |
| | |
ENI SpA | | | 68,600 | | | | 1,163,169 | |
| | |
Ferrari NV(4) | | | 400 | | | | 50,520 | |
| | |
Ferrari NV(4) | | | 3,540 | | | | 440,766 | |
| | |
FinecoBank Banca Fineco SpA | | | 8,950 | | | | 97,322 | |
| | |
Hera SpA | | | 21,000 | | | | 70,970 | |
| | |
IMA Industria Macchine Automatiche SpA | | | 1,000 | | | | 66,298 | |
| | |
Infrastrutture Wireless Italiane SpA(2) | | | 68,200 | | | | 542,928 | |
| | |
International Game Technology PLC | | | 5,600 | | | | 91,616 | |
| | |
Interpump Group SpA | | | 6,800 | | | | 219,077 | |
| | |
Intesa Sanpaolo SpA | | | 203,000 | | | | 464,489 | |
| | |
Italgas SpA | | | 13,643 | | | | 82,601 | |
| | |
Leonardo SpA | | | 21,600 | | | | 209,305 | |
| | |
Mediobanca Banca di Credito Finanziario SpA | | | 17,200 | | | | 149,894 | |
| | |
Moncler SpA | | | 7,850 | | | | 295,432 | |
| | |
OVS SpA(1)(2) | | | 51,000 | | | | 77,816 | |
| | |
Pirelli & C SpA(1)(2) | | | 19,600 | | | | 128,113 | |
| | |
Poste Italiane SpA(2) | | | 8,902 | | | | 76,661 | |
| | |
Prada SpA | | | 18,400 | | | | 60,894 | |
| | |
Prysmian SpA | | | 10,536 | | | | 226,348 | |
| | |
Reply SpA | | �� | 3,300 | | | | 182,937 | |
| | |
Retelit SpA | | | 143,500 | | | | 252,478 | |
| | |
Salvatore Ferragamo SpA | | | 3,800 | | | | 76,212 | |
| | |
Saras SpA | | | 65,200 | | | | 138,922 | |
| | |
Snam SpA | | | 65,544 | | | | 312,994 | |
| | |
Societa Iniziative Autostradali e Servizi SpA | | | 4,176 | | | | 64,273 | |
| | |
STMicroelectronics NV | | | 92,200 | | | | 1,468,715 | |
| | |
Telecom Italia SpA(1) | | | 1,372,000 | | | | 763,387 | |
| | |
Terna Rete Elettrica Nazionale SpA | | | 40,600 | | | | 250,220 | |
| | |
Tod’s SpA | | | 1,500 | | | | 69,814 | |
| | |
Unione di Banche Italiane SpA | | | 29,142 | | | | 74,770 | |
| | |
UnipolSai Assicurazioni SpA | | | 28,030 | | | | 69,968 | |
| | |
| | | | | | | $ | 13,767,227 | |
| | | | | | | | |
| Security | | Shares | | | Value | |
|
| Japan — 13.1% | |
| | |
Activia Properties, Inc. | | | 50 | | | $ | 216,397 | |
| | |
Advance Residence Investment Corp. | | | 55 | | | | 162,666 | |
| | |
Aeon Co., Ltd. | | | 11,400 | | | | 232,016 | |
| | |
Air Water, Inc. | | | 6,900 | | | | 115,115 | |
| | |
Aisin Seiki Co., Ltd. | | | 2,800 | | | | 110,697 | |
| | |
Ajinomoto Co., Inc. | | | 11,700 | | | | 202,582 | |
| | |
Alps Alpine Co., Ltd. | | | 3,900 | | | | 82,215 | |
| | |
Asahi Intecc Co., Ltd. | | | 4,400 | | | | 191,497 | |
| | |
Asahi Kasei Corp. | | | 29,100 | | | | 319,297 | |
| | |
Astellas Pharma, Inc. | | | 30,000 | | | | 445,147 | |
| | |
Bandai Namco Holdings, Inc. | | | 2,900 | | | | 128,112 | |
| | |
Bridgestone Corp. | | | 4,200 | | | | 161,664 | |
| | |
Calbee, Inc. | | | 3,300 | | | | 106,267 | |
| | |
Canon, Inc. | | | 12,800 | | | | 368,131 | |
| | |
Central Japan Railway Co. | | | 1,100 | | | | 237,734 | |
| | |
Chubu Electric Power Co., Inc. | | | 38,600 | | | | 610,982 | |
| | |
Chugai Pharmaceutical Co., Ltd. | | | 3,600 | | | | 212,567 | |
| | |
Chugoku Bank, Ltd. (The) | | | 9,000 | | | | 82,631 | |
| | |
Chugoku Electric Power Co., Inc. (The) | | | 21,400 | | | | 292,842 | |
| | |
Citizen Watch Co., Ltd. | | | 12,000 | | | | 64,055 | |
| | |
Dai Nippon Printing Co., Ltd. | | | 5,700 | | | | 131,927 | |
| | |
Daicel Corp. | | | 9,200 | | | | 96,493 | |
| | |
Daido Steel Co., Ltd. | | | 2,900 | | | | 121,226 | |
| | |
Daiichi Sankyo Co., Ltd. | | | 9,700 | | | | 336,472 | |
| | |
Daikin Industries, Ltd. | | | 2,400 | | | | 259,779 | |
| | |
Daito Trust Construction Co., Ltd. | | | 2,200 | | | | 305,563 | |
| | |
Daiwa House REIT Investment Corp. | | | 77 | | | | 181,325 | |
| | |
Daiwa Securities Group, Inc. | | | 25,000 | | | | 124,681 | |
| | |
DeNA Co., Ltd. | | | 5,700 | | | | 100,856 | |
| | |
Dentsu, Inc. | | | 2,100 | | | | 99,612 | |
| | |
Don Quijote Holdings Co., Ltd. | | | 1,700 | | | | 98,857 | |
| | |
East Japan Railway Co. | | | 2,500 | | | | 231,624 | |
| | |
Eisai Co., Ltd. | | | 4,000 | | | | 310,586 | |
| | |
Ezaki Glico Co., Ltd. | | | 2,200 | | | | 109,789 | |
| | |
FamilyMart UNY Holdings Co., Ltd. | | | 1,800 | | | | 210,857 | |
| | |
FUJIFILM Holdings Corp. | | | 5,800 | | | | 249,204 | |
| | |
Fujitsu, Ltd. | | | 3,700 | | | | 248,327 | |
| | |
GLP J-REIT | | | 205 | | | | 217,867 | |
| | |
Hachijuni Bank, Ltd. (The) | | | 24,100 | | | | 106,714 | |
| | |
Hamamatsu Photonics K.K. | | | 2,800 | | | | 100,256 | |
| | |
Hankyu Hanshin Holdings, Inc. | | | 2,700 | | | | 96,376 | |
| | |
Hirose Electric Co., Ltd. | | | 840 | | | | 90,225 | |
| | |
Hisamitsu Pharmaceutical Co., Inc. | | | 4,100 | | | | 209,961 | |
| | |
Hitachi, Ltd. | | | 10,400 | | | | 327,168 | |
| | |
Hokuhoku Financial Group, Inc. | | | 8,000 | | | | 91,709 | |
| | |
Hulic Co., Ltd. | | | 17,000 | | | | 156,866 | |
| | | | |
| | 12 | | See Notes to Financial Statements. |
Parametric
International Equity Fund
January 31, 2019
Portfolio of Investments — continued
| | | | | | | | |
| Security | | Shares | | | Value | |
|
| Japan (continued) | |
| | |
Idemitsu Kosan Co., Ltd. | | | 7,100 | | | $ | 250,541 | |
| | |
INPEX Corp. | | | 46,500 | | | | 446,977 | |
| | |
ITOCHU Corp. | | | 8,400 | | | | 154,091 | |
| | |
Japan Airlines Co., Ltd. | | | 2,000 | | | | 72,817 | |
| | |
Japan Exchange Group, Inc. | | | 7,500 | | | | 132,065 | |
| | |
Japan Hotel REIT Investment Corp. | | | 191 | | | | 146,519 | |
| | |
Japan Post Bank Co., Ltd. | | | 8,600 | | | | 100,094 | |
| | |
Japan Post Holdings Co., Ltd. | | | 24,900 | | | | 306,096 | |
| | |
Japan Prime Realty Investment Corp. | | | 38 | | | | 154,986 | |
| | |
Japan Real Estate Investment Corp. | | | 34 | | | | 199,295 | |
| | |
Japan Retail Fund Investment Corp. | | | 95 | | | | 194,884 | |
| | |
Japan Tobacco, Inc. | | | 13,700 | | | | 346,825 | |
| | |
JFE Holdings, Inc. | | | 13,200 | | | | 232,682 | |
| | |
JSR Corp. | | | 6,500 | | | | 105,095 | |
| | |
JXTG Holdings, Inc. | | | 128,500 | | | | 701,884 | |
| | |
Kajima Corp. | | | 10,500 | | | | 149,359 | |
| | |
Kakaku.com, Inc. | | | 3,700 | | | | 64,956 | |
| | |
Kaneka Corp. | | | 1,800 | | | | 70,371 | |
| | |
Kansai Paint Co., Ltd. | | | 6,000 | | | | 105,282 | |
| | |
Kao Corp. | | | 6,900 | | | | 487,818 | |
| | |
KDDI Corp. | | | 48,300 | | | | 1,206,758 | |
| | |
Keikyu Corp. | | | 5,900 | | | | 100,489 | |
| | |
Keio Corp. | | | 1,400 | | | | 80,426 | |
| | |
Kenedix Office Investment Corp. | | | 30 | | | | 206,037 | |
| | |
Keyence Corp. | | | 1,100 | | | | 566,077 | |
| | |
Kintetsu Group Holdings Co., Ltd. | | | 2,700 | | | | 117,837 | |
| | |
Konami Holdings Corp. | | | 2,400 | | | | 110,225 | |
| | |
Konica Minolta, Inc. | | | 10,000 | | | | 100,690 | |
| | |
Kubota Corp. | | | 6,200 | | | | 98,295 | |
| | |
Kuraray Co., Ltd. | | | 12,500 | | | | 192,233 | |
| | |
Kyushu Electric Power Co., Inc. | | | 30,600 | | | | 379,176 | |
| | |
Lawson, Inc. | | | 1,600 | | | | 98,627 | |
| | |
Lion Corp. | | | 5,000 | | | | 104,205 | |
| | |
M3, Inc. | | | 11,400 | | | | 164,992 | |
| | |
Makita Corp. | | | 2,000 | | | | 70,864 | |
| | |
Marubeni Corp. | | | 12,600 | | | | 98,212 | |
| | |
Maruichi Steel Tube, Ltd. | | | 3,000 | | | | 96,360 | |
| | |
Mebuki Financial Group, Inc. | | | 47,600 | | | | 133,461 | |
| | |
MEIJI Holdings Co., Ltd. | | | 2,200 | | | | 170,115 | |
| | |
Mitsubishi Chemical Holdings Corp. | | | 29,800 | | | | 256,087 | |
| | |
Mitsubishi Corp. | | | 11,000 | | | | 322,390 | |
| | |
Mitsubishi Heavy Industries, Ltd. | | | 2,500 | | | | 96,664 | |
| | |
Mitsubishi Materials Corp. | | | 3,000 | | | | 85,877 | |
| | |
Mitsubishi Motors Corp. | | | 16,700 | | | | 103,760 | |
| | |
Mitsubishi Tanabe Pharma Corp. | | | 6,300 | | | | 98,699 | |
| | |
Mitsubishi UFJ Financial Group, Inc. | | | 120,000 | | | | 643,670 | |
| | | | | | | | |
| Security | | Shares | | | Value | |
|
| Japan (continued) | |
| | |
Mitsui & Co., Ltd. | | | 8,900 | | | $ | 145,407 | |
| | |
Mitsui Chemicals, Inc. | | | 4,200 | | | | 105,441 | |
| | |
Mizuho Financial Group, Inc. | | | 260,000 | | | | 426,753 | |
| | |
MS&AD Insurance Group Holdings, Inc. | | | 7,800 | | | | 230,908 | |
| | |
Murata Manufacturing Co., Ltd. | | | 2,300 | | | | 345,496 | |
| | |
NEC Corp. | | | 4,500 | | | | 151,222 | |
| | |
NH Foods, Ltd. | | | 3,000 | | | | 118,714 | |
| | |
Nidec Corp. | | | 1,500 | | | | 180,387 | |
| | |
Nintendo Co., Ltd. | | | 1,200 | | | | 363,945 | |
| | |
Nippon Building Fund, Inc. | | | 44 | | | | 284,701 | |
| | |
Nippon Express Co., Ltd. | | | 1,400 | | | | 88,594 | |
| | |
Nippon Kayaku Co., Ltd. | | | 11,400 | | | | 143,544 | |
| | |
Nippon Paint Holdings Co., Ltd. | | | 6,400 | | | | 214,788 | |
| | |
Nippon Paper Industries Co., Ltd. | | | 5,100 | | | | 100,002 | |
| | |
Nippon Prologis REIT, Inc. | | | 100 | | | | 218,089 | |
| | |
Nippon Shokubai Co., Ltd. | | | 1,400 | | | | 92,799 | |
| | |
Nippon Steel & Sumitomo Metal Corp. | | | 14,000 | | | | 259,256 | |
| | |
Nippon Telegraph & Telephone Corp. | | | 23,300 | | | | 1,001,624 | |
| | |
Nissan Chemical Corp. | | | 3,100 | | | | 164,824 | |
| | |
Nissan Motor Co., Ltd. | | | 27,500 | | | | 234,850 | |
| | |
Nissin Foods Holdings Co., Ltd. | | | 1,600 | | | | 101,860 | |
| | |
Nitori Holdings Co., Ltd. | | | 800 | | | | 104,176 | |
| | |
Nitto Denko Corp. | | | 3,200 | | | | 181,009 | |
| | |
Nomura Real Estate Master Fund, Inc. | | | 165 | | | | 236,450 | |
| | |
Nomura Research Institute, Ltd. | | | 2,400 | | | | 98,213 | |
| | |
NTT Data Corp. | | | 12,500 | | | | 149,015 | |
| | |
NTT DoCoMo, Inc. | | | 40,800 | | | | 980,293 | |
| | |
Obic Co., Ltd. | | | 1,700 | | | | 161,106 | |
| | |
Odakyu Electric Railway Co., Ltd. | | | 4,900 | | | | 110,109 | |
| | |
Oji Holdings Corp. | | | 32,100 | | | | 185,878 | |
| | |
Okinawa Electric Power Co., Inc. (The) | | | 6,962 | | | | 131,715 | |
| | |
Olympus Corp. | | | 7,300 | | | | 299,454 | |
| | |
Omron Corp. | | | 2,900 | | | | 119,098 | |
| | |
Ono Pharmaceutical Co., Ltd. | | | 10,600 | | | | 231,568 | |
| | |
Oracle Corp. Japan | | | 1,900 | | | | 138,432 | |
| | |
Oriental Land Co., Ltd. | | | 2,200 | | | | 225,574 | |
| | |
Orix JREIT, Inc. | | | 116 | | | | 202,754 | |
| | |
Osaka Gas Co., Ltd. | | | 19,900 | | | | 393,988 | |
| | |
Otsuka Corp. | | | 3,000 | | | | 97,104 | |
| | |
Otsuka Holdings Co., Ltd. | | | 8,700 | | | | 356,835 | |
| | |
Pigeon Corp. | | | 3,700 | | | | 145,067 | |
| | |
Rakuten, Inc. | | | 18,600 | | | | 140,426 | |
| | |
Recruit Holdings Co., Ltd. | | | 10,300 | | | | 276,457 | |
| | |
Relo Group, Inc. | | | 6,000 | | | | 158,365 | |
| | |
Ricoh Co., Ltd. | | | 15,500 | | | | 165,120 | |
| | |
Rinnai Corp. | | | 1,700 | | | | 112,558 | |
| | | | |
| | 13 | | See Notes to Financial Statements. |
Parametric
International Equity Fund
January 31, 2019
Portfolio of Investments — continued
| | | | | | | | |
| Security | | Shares | | | Value | |
|
| Japan (continued) | |
| | |
Ryohin Keikaku Co., Ltd. | | | 400 | | | $ | 95,336 | |
| | |
Sawai Pharmaceutical Co., Ltd. | | | 1,900 | | | | 97,911 | |
| | |
SECOM Co., Ltd. | | | 1,300 | | | | 108,838 | |
| | |
Seiko Epson Corp. | | | 6,000 | | | | 93,390 | |
| | |
Sekisui Chemical Co., Ltd. | | | 7,200 | | | | 111,755 | |
| | |
Sekisui House, Ltd. | | | 11,000 | | | | 164,399 | |
| | |
Seven & i Holdings Co., Ltd. | | | 9,000 | | | | 391,887 | |
| | |
Seven Bank, Ltd. | | | 26,300 | | | | 78,343 | |
| | |
Shimadzu Corp. | | | 10,900 | | | | 250,672 | |
| | |
Shimamura Co., Ltd. | | | 1,000 | | | | 86,596 | |
| | |
Shimano, Inc. | | | 800 | | | | 112,253 | |
| | |
Shionogi & Co., Ltd. | | | 5,100 | | | | 314,556 | |
| | |
Shiseido Co., Ltd. | | | 5,700 | | | | 339,074 | |
| | |
Showa Shell Sekiyu K.K. | | | 9,300 | | | | 138,563 | |
| | |
Sompo Holdings, Inc. | | | 4,900 | | | | 184,750 | |
| | |
Sony Corp. | | | 7,600 | | | | 380,813 | |
| | |
Subaru Corp. | | | 7,000 | | | | 164,374 | |
| | |
Sumitomo Corp. | | | 9,500 | | | | 147,093 | |
| | |
Sumitomo Mitsui Financial Group, Inc. | | | 16,000 | | | | 595,231 | |
| | |
Sumitomo Mitsui Trust Holdings, Inc. | | | 6,100 | | | | 231,064 | |
| | |
Sumitomo Osaka Cement Co., Ltd. | | | 2,500 | | | | 110,923 | |
| | |
Sumitomo Realty & Development Co., Ltd. | | | 11,600 | | | | 443,002 | |
| | |
Suntory Beverage & Food, Ltd. | | | 4,100 | | | | 181,534 | |
| | |
Suzuki Motor Corp. | | | 4,600 | | | | 240,214 | |
| | |
Sysmex Corp. | | | 2,900 | | | | 161,666 | |
| | |
T&D Holdings, Inc. | | | 8,800 | | | | 109,244 | |
| | |
Taiheiyo Cement Corp. | | | 3,000 | | | | 103,001 | |
| | |
Taisei Corp. | | | 2,100 | | | | 98,873 | |
| | |
Taisho Pharmaceutical Holdings Co., Ltd. | | | 1,400 | | | | 142,197 | |
| | |
Takashimaya Co., Ltd. | | | 7,000 | | | | 95,129 | |
| | |
Takeda Pharmaceutical Co., Ltd. | | | 10,800 | | | | 436,031 | |
| | |
TEIJIN, Ltd. | | | 5,500 | | | | 95,056 | |
| | |
Toho Gas Co., Ltd. | | | 7,500 | | | | 322,143 | |
| | |
Tohoku Electric Power Co., Inc. | | | 30,000 | | | | 406,728 | |
| | |
Tokio Marine Holdings, Inc. | | | 7,000 | | | | 342,760 | |
| | |
Tokyo Gas Co., Ltd. | | | 20,700 | | | | 544,311 | |
| | |
Tokyu Corp. | | | 6,500 | | | | 111,245 | |
| | |
Tokyu Fudosan Holdings Corp. | | | 35,500 | | | | 193,405 | |
| | |
Toray Industries, Inc. | | | 32,000 | | | | 237,155 | |
| | |
Toshiba Corp. | | | 4,500 | | | | 142,500 | |
| | |
Tosoh Corp. | | | 8,200 | | | | 116,461 | |
| | |
Toyota Motor Corp. | | | 14,500 | | | | 892,476 | |
| | |
Trend Micro, Inc. | | | 2,500 | | | | 133,017 | |
| | |
Tsuruha Holdings, Inc. | | | 1,300 | | | | 120,336 | |
| | |
Ube Industries, Ltd. | | | 3,200 | | | | 72,361 | |
| | |
Unicharm Corp. | | | 6,800 | | | | 210,444 | |
| | | | | | | | |
| Security | | Shares | | | Value | |
|
| Japan (continued) | |
| | |
United Urban Investment Corp. | | | 96 | | | $ | 153,273 | |
| | |
USS Co., Ltd. | | | 5,000 | | | | 87,548 | |
| | |
West Japan Railway Co. | | | 1,300 | | | | 94,947 | |
| | |
Yahoo! Japan Corp. | | | 24,900 | | | | 67,303 | |
| | |
Yakult Honsha Co., Ltd. | | | 2,100 | | | | 140,149 | |
| | |
Yamaguchi Financial Group, Inc. | | | 8,000 | | | | 81,323 | |
| | |
Yamaha Corp. | | | 2,400 | | | | 105,033 | |
| | |
Yamato Holdings Co., Ltd. | | | 3,300 | | | | 87,930 | |
| | |
Yamazaki Baking Co., Ltd. | | | 4,400 | | | | 86,427 | |
| | |
Yokogawa Electric Corp. | | | 4,800 | | | | 89,391 | |
| | |
| | | | | | | $ | 40,598,199 | |
|
| Netherlands — 4.5% | |
| | |
ABN AMRO Group NV(2) | | | 7,600 | | | $ | 189,513 | |
| | |
Accell Group | | | 2,450 | | | | 53,874 | |
| | |
Adyen NV(1)(2) | | | 530 | | | | 393,273 | |
| | |
Aegon NV | | | 27,000 | | | | 139,097 | |
| | |
AerCap Holdings NV(1) | | | 3,800 | | | | 179,588 | |
| | |
Akzo Nobel NV | | | 12,747 | | | | 1,097,072 | |
| | |
Argenx SE(1) | | | 1,000 | | | | 106,106 | |
| | |
ASM International NV | | | 2,469 | | | | 119,605 | |
| | |
ASML Holding NV | | | 8,580 | | | | 1,500,363 | |
| | |
ASR Nederland NV | | | 2,400 | | | | 101,228 | |
| | |
Cimpress NV(1) | | | 1,473 | | | | 122,509 | |
| | |
Corbion NV | | | 11,200 | | | | 317,220 | |
| | |
Eurocommercial Properties NV | | | 4,700 | | | | 152,281 | |
| | |
Euronext NV(2) | | | 1,764 | | | | 108,665 | |
| | |
Flow Traders(2) | | | 2,849 | | | | 88,053 | |
| | |
Gemalto NV(1) | | | 3,224 | | | | 186,970 | |
| | |
GrandVision NV(2) | | | 5,474 | | | | 122,048 | |
| | |
IMCD NV | | | 2,169 | | | | 158,290 | |
| | |
ING Groep NV | | | 81,200 | | | | 963,504 | |
| | |
InterXion Holding NV(1) | | | 1,800 | | | | 108,072 | |
| | |
Koninklijke Ahold Delhaize NV | | | 39,650 | | | | 1,044,623 | |
| | |
Koninklijke KPN NV | | | 222,500 | | | | 684,014 | |
| | |
Koninklijke Philips NV | | | 30,100 | | | | 1,186,695 | |
| | |
Koninklijke Vopak NV | | | 4,430 | | | | 225,129 | |
| | |
NN Group NV | | | 5,540 | | | | 233,939 | |
| | |
NSI NV | | | 1,162 | | | | 48,960 | |
| | |
NXP Semiconductors NV | | | 5,300 | | | | 461,259 | |
| | |
PostNL NV | | | 28,142 | | | | 72,713 | |
| | |
QIAGEN NV(1) | | | 6,909 | | | | 255,175 | |
| | |
SBM Offshore NV | | | 11,300 | | | | 186,515 | |
| | |
Signify NV(2) | | | 11,700 | | | | 289,843 | |
| | |
Takeaway.com NV(1)(2) | | | 1,800 | | | | 114,172 | |
| | |
TKH Group NV | | | 1,737 | | | | 83,890 | |
| | | | |
| | 14 | | See Notes to Financial Statements. |
Parametric
International Equity Fund
January 31, 2019
Portfolio of Investments — continued
| | | | | | | | |
| Security | | Shares | | | Value | |
|
| Netherlands (continued) | |
| | |
Unilever NV | | | 40,400 | | | $ | 2,163,427 | |
| | |
uniQure NV(1) | | | 1,800 | | | | 61,650 | |
| | |
Vastned Retail NV | | | 1,000 | | | | 38,981 | |
| | |
Wolters Kluwer NV | | | 9,100 | | | | 565,938 | |
| | |
| | | | | | | $ | 13,924,254 | |
|
| New Zealand — 1.1% | |
| | |
A2 Milk Co., Ltd.(1) | | | 39,500 | | | $ | 347,383 | |
| | |
Air New Zealand, Ltd. | | | 34,574 | | | | 67,236 | |
| | |
Auckland International Airport, Ltd. | | | 51,500 | | | | 262,114 | |
| | |
Contact Energy, Ltd. | | | 28,474 | | | | 119,140 | |
| | |
Fisher & Paykel Healthcare Corp., Ltd. | | | 27,900 | | | | 242,814 | |
| | |
Fletcher Building, Ltd.(1) | | | 94,663 | | | | 327,243 | |
| | |
Goodman Property Trust | | | 65,888 | | | | 72,675 | |
| | |
Infratil, Ltd. | | | 38,198 | | | | 99,632 | |
| | |
Kiwi Property Group, Ltd. | | | 150,000 | | | | 147,555 | |
| | |
Mercury NZ, Ltd. | | | 47,223 | | | | 115,399 | |
| | |
Precinct Properties New Zealand, Ltd. | | | 121,300 | | | | 125,474 | |
| | |
Pushpay Holdings, Ltd.(1) | | | 28,817 | | | | 70,453 | |
| | |
Restaurant Brands New Zealand, Ltd. | | | 18,100 | | | | 107,060 | |
| | |
SKYCITY Entertainment Group, Ltd. | | | 89,400 | | | | 237,599 | |
| | |
Spark New Zealand, Ltd. | | | 101,061 | | | | 284,092 | |
| | |
Summerset Group Holdings, Ltd. | | | 16,945 | | | | 71,674 | |
| | |
Xero, Ltd.(1) | | | 9,348 | | | | 297,823 | |
| | |
Z Energy, Ltd. | | | 88,000 | | | | 365,397 | |
| | |
| | | | | | | $ | 3,360,763 | |
|
| Norway — 2.2% | |
| | |
Aker Solutions ASA(1)(2) | | | 20,000 | | | $ | 109,175 | |
| | |
Atea ASA | | | 18,187 | | | | 251,315 | |
| | |
Austevoll Seafood ASA | | | 16,139 | | | | 206,102 | |
| | |
Borr Drilling, Ltd.(1) | | | 22,000 | | | | 56,356 | |
| | |
Borregaard ASA | | | 15,600 | | | | 138,625 | |
| | |
DNB ASA | | | 28,300 | | | | 502,303 | |
| | |
DNO ASA | | | 44,400 | | | | 85,399 | |
| | |
Entra ASA(2) | | | 24,547 | | | | 355,708 | |
| | |
Equinor ASA | | | 24,850 | | | | 568,225 | |
| | |
Europris ASA(2) | | | 70,000 | | | | 225,326 | |
| | |
Gjensidige Forsikring ASA | | | 7,400 | | | | 127,821 | |
| | |
Golar LNG, Ltd. | | | 2,320 | | | | 51,666 | |
| | |
Grieg Seafood ASA | | | 4,800 | | | | 62,020 | |
| | |
Kongsberg Gruppen ASA | | | 18,000 | | | | 250,912 | |
| | |
Leroy Seafood Group ASA | | | 14,660 | | | | 117,235 | |
| | |
Marine Harvest ASA(1) | | | 20,400 | | | | 450,647 | |
| | |
Nordic Nanovector ASA(1) | | | 4,831 | | | | 24,446 | |
| | | | | | | | |
| Security | | Shares | | | Value | |
|
| Norway (continued) | |
| | |
REC Silicon ASA(1) | | | 1,637,420 | | | $ | 111,939 | |
| | |
Salmar ASA | | | 2,400 | | | | 125,667 | |
| | |
Sbanken ASA(2) | | | 7,500 | | | | 68,104 | |
| | |
Scatec Solar ASA(2) | | | 15,500 | | | | 154,958 | |
| | |
Ship Finance International, Ltd. | | | 5,500 | | | | 66,880 | |
| | |
SpareBank 1 SMN | | | 8,400 | | | | 86,345 | |
| | |
Storebrand ASA | | | 14,600 | | | | 111,892 | |
| | |
Telenor ASA | | | 49,400 | | | | 935,237 | |
| | |
Tomra Systems ASA | | | 20,000 | | | | 519,633 | |
| | |
Veidekke ASA | | | 15,372 | | | | 167,858 | |
| | |
Yara International ASA | | | 18,400 | | | | 760,861 | |
| | |
| | | | | | | $ | 6,692,655 | |
|
| Portugal — 1.1% | |
| | |
Altri SGPS SA | | | 42,000 | | | $ | 347,529 | |
| | |
Banco Comercial Portugues SA(1) | | | 1,828,000 | | | | 504,019 | |
| | |
Corticeira Amorim SGPS SA | | | 6,355 | | | | 70,778 | |
| | |
CTT-Correios de Portugal SA | | | 69,614 | | | | 250,648 | |
| | |
EDP Renovaveis SA | | | 12,421 | | | | 111,896 | |
| | |
EDP-Energias de Portugal SA | | | 91,800 | | | | 335,309 | |
| | |
Galp Energia SGPS SA, Class B | | | 31,400 | | | | 490,610 | |
| | |
Jeronimo Martins SGPS SA | | | 40,550 | | | | 574,681 | |
| | |
NOS SGPS SA | | | 75,600 | | | | 490,404 | |
| | |
REN - Redes Energeticas Nacionais SGPS SA | | | 15,211 | | | | 45,689 | |
| | |
Semapa-Sociedade de Investimento e Gestao | | | 7,300 | | | | 127,546 | |
| | |
| | | | | | | $ | 3,349,109 | |
|
| Singapore — 2.3% | |
| | |
AEM Holdings, Ltd. | | | 100,000 | | | $ | 72,970 | |
| | |
Ascendas Real Estate Investment Trust | | | 69,500 | | | | 141,734 | |
| | |
BOC Aviation, Ltd.(2) | | | 11,800 | | | | 100,336 | |
| | |
CapitaLand Commercial Trust, Ltd. | | | 94,500 | | | | 132,286 | |
| | |
CapitaLand Mall Trust | | | 45,800 | | | | 81,787 | |
| | |
CDL Hospitality Trusts | | | 40,000 | | | | 49,656 | |
| | |
China Aviation Oil Singapore Corp, Ltd. | | | 40,000 | | | | 34,590 | |
| | |
ComfortDelGro Corp., Ltd. | | | 86,500 | | | | 150,098 | |
| | |
DBS Group Holdings, Ltd. | | | 26,400 | | | | 470,515 | |
| | |
Ezion Holdings, Ltd.(1) | | | 1,126,000 | | | | 45,528 | |
| | |
First Resources, Ltd. | | | 40,000 | | | | 50,850 | |
| | |
Flex, Ltd.(1) | | | 63,700 | | | | 612,794 | |
| | |
Frasers Logistics & Industrial Trust | | | 110,000 | | | | 88,480 | |
| | |
Genting Singapore, Ltd. | | | 689,800 | | | | 565,302 | |
| | |
Golden Agri-Resources, Ltd. | | | 650,000 | | | | 122,663 | |
| | |
Hutchison Port Holdings Trust | | | 196,200 | | | | 49,212 | |
| | |
Jardine Cycle & Carriage, Ltd. | | | 11,400 | | | | 320,344 | |
| | | | |
| | 15 | | See Notes to Financial Statements. |
Parametric
International Equity Fund
January 31, 2019
Portfolio of Investments — continued
| | | | | | | | |
| Security | | Shares | | | Value | |
|
| Singapore (continued) | |
| | |
Keppel Infrastructure Trust | | | 291,400 | | | $ | 110,425 | |
| | |
Keppel REIT | | | 66,000 | | | | 57,888 | |
| | |
M1, Ltd. | | | 44,000 | | | | 67,048 | |
| | |
Mapletree Commercial Trust | | | 77,600 | | | | 101,532 | |
| | |
Mapletree Industrial Trust | | | 68,200 | | | | 101,495 | |
| | |
Mapletree Logistics Trust | | | 70,400 | | | | 71,741 | |
| | |
Mapletree North Asia Commercial Trust | | | 106,100 | | | | 100,895 | |
| | |
Midas Holdings, Ltd.(1)(3) | | | 480,000 | | | | 0 | |
| | |
Raffles Medical Group, Ltd. | | | 140,800 | | | | 116,323 | |
| | |
Sembcorp Industries, Ltd. | | | 47,500 | | | | 91,638 | |
| | |
Sembcorp Marine, Ltd. | | | 80,000 | | | | 95,479 | |
| | |
Sheng Siong Group, Ltd. | | | 91,200 | | | | 75,269 | |
| | |
Singapore Airlines, Ltd. | | | 22,900 | | | | 164,513 | |
| | |
Singapore Airport Terminal Services, Ltd. | | | 25,700 | | | | 92,711 | |
| | |
Singapore Exchange, Ltd. | | | 21,600 | | | | 122,827 | |
| | |
Singapore Post, Ltd. | | | 72,300 | | | | 53,004 | |
| | |
Singapore Technologies Engineering, Ltd. | | | 47,600 | | | | 131,814 | |
| | |
Singapore Telecommunications, Ltd. | | | 315,000 | | | | 708,248 | |
| | |
StarHub, Ltd. | | | 90,000 | | | | 119,268 | |
| | |
Suntec Real Estate Investment Trust | | | 45,000 | | | | 64,568 | |
| | |
United Overseas Bank, Ltd. | | | 22,300 | | | | 417,929 | |
| | |
Venture Corp., Ltd. | | | 29,800 | | | | 361,973 | |
| | |
Wilmar International, Ltd. | | | 298,500 | | | | 739,312 | |
| | |
| | | | | | | $ | 7,055,045 | |
|
| Spain — 4.4% | |
| | |
Aena SME SA(2) | | | 3,850 | | | $ | 665,499 | |
| | |
Almirall SA | | | 9,140 | | | | 155,070 | |
| | |
Amadeus IT Group SA | | | 15,400 | | | | 1,119,863 | |
| | |
Banco Bilbao Vizcaya Argentaria SA | | | 64,200 | | | | 381,037 | |
| | |
Banco de Sabadell SA | | | 101,565 | | | | 116,455 | |
| | |
Bankia SA | | | 48,100 | | | | 140,210 | |
| | |
Bankinter SA | | | 23,700 | | | | 185,056 | |
| | |
Bolsas y Mercados Espanoles SHMSF SA | | | 1,920 | | | | 58,019 | |
| | |
CaixaBank SA | | | 55,000 | | | | 208,010 | |
| | |
Cellnex Telecom SA(2) | | | 3,584 | | | | 100,996 | |
| | |
Cia de Distribucion Integral Logista Holdings SA | | | 4,197 | | | | 108,378 | |
| | |
Coca-Cola European Partners PLC | | | 24,300 | | | | 1,156,194 | |
| | |
Construcciones y Auxiliar de Ferrocarriles SA | | | 2,050 | | | | 92,360 | |
| | |
Ebro Foods SA | | | 12,141 | | | | 249,958 | |
| | |
Enagas SA | | | 10,000 | | | | 291,479 | |
| | |
Ence Energia y Celulosa SA | | | 28,978 | | | | 225,019 | |
| | |
Endesa SA | | | 11,000 | | | | 275,126 | |
| | |
Ercros SA | | | 35,810 | | | | 148,820 | |
| | |
Faes Farma SA | | | 22,576 | | | | 84,790 | |
| | |
Grifols SA | | | 23,811 | | | | 621,143 | |
| | | | | | | | |
| Security | | Shares | | | Value | |
|
| Spain (continued) | |
| | |
Grifols SA ADR | | | 23,300 | | | $ | 433,846 | |
| | |
Grupo Catalana Occidente SA | | | 2,596 | | | | 102,873 | |
| | |
Iberdrola SA | | | 97,296 | | | | 804,147 | |
| | |
Indra Sistemas SA(1) | | | 10,000 | | | | 102,890 | |
| | |
Industria de Diseno Textil SA | | | 40,679 | | | | 1,137,922 | |
| | |
Lar Espana Real Estate Socimi SA | | | 30,961 | | | | 298,208 | |
| | |
Mapfre SA | | | 26,500 | | | | 73,733 | |
| | |
Masmovil Ibercom SA(1) | | | 3,750 | | | | 81,769 | |
| | |
Melia Hotels International SA | | | 8,000 | | | | 80,261 | |
| | |
Merlin Properties Socimi SA | | | 62,100 | | | | 833,120 | |
| | |
Naturgy Energy Group SA | | | 5,600 | | | | 156,547 | |
| | |
NH Hotel Group SA | | | 14,274 | | | | 71,204 | |
| | |
Prosegur Cash SA(2) | | | 47,137 | | | | 110,306 | |
| | |
Prosegur Cia de Seguridad SA | | | 16,517 | | | | 89,412 | |
| | |
Red Electrica Corp. SA | | | 7,578 | | | | 174,638 | |
| | |
Repsol SA | | | 61,293 | | | | 1,075,879 | |
| | |
Siemens Gamesa Renewable Energy SA(1) | | | 16,900 | | | | 239,932 | |
| | |
Tecnicas Reunidas SA | | | 3,280 | | | | 83,898 | |
| | |
Telefonica SA | | | 121,600 | | | | 1,045,952 | |
| | |
Telepizza Group SA(2) | | | 11,173 | | | | 77,981 | |
| | |
Tubacex SA | | | 34,340 | | | | 111,739 | |
| | |
| | | | | | | $ | 13,569,739 | |
|
| Sweden — 4.6% | |
| | |
AAK AB | | | 18,550 | | | $ | 266,825 | |
| | |
Alfa Laval AB | | | 3,749 | | | | 84,997 | |
| | |
Arjo AB, Class B | | | 39,200 | | | | 139,471 | |
| | |
Assa Abloy AB, Class B | | | 12,450 | | | | 231,995 | |
| | |
Attendo AB(2) | | | 14,762 | | | | 113,397 | |
| | |
Avanza Bank Holding AB | | | 4,300 | | | | 195,606 | |
| | |
Betsson AB(1) | | | 10,000 | | | | 92,099 | |
| | |
BillerudKorsnas AB | | | 24,100 | | | | 304,343 | |
| | |
BioGaia AB, Class B | | | 2,949 | | | | 119,905 | |
| | |
Bonava AB, Class B | | | 4,887 | | | | 61,225 | |
| | |
Castellum AB | | | 23,000 | | | | 436,035 | |
| | |
Dios Fastigheter AB | | | 12,669 | | | | 90,906 | |
| | |
Dometic Group AB(2) | | | 18,000 | | | | 128,428 | |
| | |
Elekta AB, Class B | | | 33,800 | | | | 451,884 | |
| | |
Epiroc AB, Class A(1) | | | 7,200 | | | | 69,137 | |
| | |
Epiroc AB, Class B(1) | | | 11,200 | | | | 100,386 | |
| | |
Essity Aktiebolag, Class B | | | 30,400 | | | | 841,124 | |
| | |
Fabege AB | | | 24,200 | | | | 353,123 | |
| | |
Granges AB | | | 14,300 | | | | 137,534 | |
| | |
Hennes & Mauritz AB, Class B | | | 33,400 | | | | 519,697 | |
| | |
Hexagon AB, Class B | | | 6,200 | | | | 303,623 | |
| | |
Hexpol AB | | | 32,000 | | | | 283,251 | |
| | | | |
| | 16 | | See Notes to Financial Statements. |
Parametric
International Equity Fund
January 31, 2019
Portfolio of Investments — continued
| | | | | | | | |
| Security | | Shares | | | Value | |
|
| Sweden (continued) | |
| | |
Holmen AB, Class B | | | 14,400 | | | $ | 308,596 | |
| | |
Hufvudstaden AB, Class A | | | 11,335 | | | | 188,253 | |
| | |
Husqvarna AB, Class B | | | 26,200 | | | | 200,252 | |
| | |
Indutrade AB | | | 3,149 | | | | 79,202 | |
| | |
JM AB | | | 3,850 | | | | 77,834 | |
| | |
Karo Pharma AB | | | 18,000 | | | | 76,898 | |
| | |
Kungsleden AB | | | 20,778 | | | | 157,730 | |
| | |
Lundin Petroleum AB | | | 22,200 | | | | 710,077 | |
| | |
Modern Times Group MTG AB, Class B | | | 4,800 | | | | 161,724 | |
| | |
Mycronic AB | | | 12,782 | | | | 163,635 | |
| | |
NCC AB, Class B | | | 4,080 | | | | 61,733 | |
| | |
NetEnt AB | | | 26,464 | | | | 128,166 | |
| | |
Nibe Industrier AB, Class B | | | 6,212 | | | | 70,641 | |
| | |
Nordea Bank AB | | | 33,950 | | | | 308,989 | |
| | |
Pandox AB | | | 5,668 | | | | 98,682 | |
| | |
Paradox Interactive AB | | | 4,600 | | | | 75,815 | |
| | |
RaySearch Laboratories AB(1) | | | 6,321 | | | | 70,998 | |
| | |
Recipharm AB, Class B(1) | | | 10,000 | | | | 128,947 | |
| | |
Saab AB, Class B | | | 1,818 | | | | 62,817 | |
| | |
Sandvik AB | | | 19,450 | | | | 310,808 | |
| | |
Scandic Hotels Group AB(2) | | | 6,000 | | | | 57,264 | |
| | |
Securitas AB, Class B | | | 6,225 | | | | 100,097 | |
| | |
Skandinaviska Enskilda Banken AB, Class A | | | 36,400 | | | | 382,078 | |
| | |
Skanska AB, Class B | | | 9,000 | | | | 157,592 | |
| | |
Svenska Cellulosa AB SCA, Class B | | | 53,200 | | | | 467,946 | |
| | |
Svenska Handelsbanken AB, Class A | | | 35,900 | | | | 390,407 | |
| | |
Swedbank AB, Class A | | | 21,000 | | | | 477,045 | |
| | |
Swedish Match AB | | | 9,263 | | | | 415,001 | |
| | |
Swedish Orphan Biovitrum AB(1) | | | 15,200 | | | | 359,245 | |
| | |
Tele2 AB, Class B | | | 28,100 | | | | 351,792 | |
| | |
Telefonaktiebolaget LM Ericsson, Class B | | | 113,700 | | | | 1,013,461 | |
| | |
Telia Co. AB | | | 187,000 | | | | 814,937 | |
| | |
Thule Group AB(2) | | | 5,900 | | | | 120,459 | |
| | |
Trelleborg AB, Class B | | | 7,200 | | | | 121,279 | |
| | |
Wallenstam AB, Class B | | | 24,800 | | | | 249,746 | |
| | |
| | | | | | | $ | 14,245,137 | |
|
| Switzerland — 8.6% | |
| | |
Adecco Group AG | | | 6,900 | | | $ | 345,766 | |
| | |
Allreal Holding AG | | | 2,465 | | | | 399,856 | |
| | |
ALSO Holding AG | | | 1,183 | | | | 153,047 | |
| | |
Ascom Holding AG | | | 5,950 | | | | 76,406 | |
| | |
Baloise Holding AG | | | 1,432 | | | | 221,785 | |
| | |
Banque Cantonale Vaudoise | | | 202 | | | | 160,198 | |
| | |
Belimo Holding AG | | | 28 | | | | 121,557 | |
| | |
BKW AG | | | 1,604 | | | | 112,875 | |
| | | | | | | | |
| Security | | Shares | | | Value | |
|
| Switzerland (continued) | |
| | |
Cembra Money Bank AG | | | 2,620 | | | $ | 226,249 | |
| | |
Clariant AG | | | 31,700 | | | | 629,659 | |
| | |
Comet Holding AG | | | 2,450 | | | | 218,050 | |
| | |
Compagnie Financiere Richemont SA, Class A | | | 41,500 | | | | 2,860,508 | |
| | |
Daetwyler Holding AG, Bearer Shares | | | 950 | | | | 143,506 | |
| | |
DKSH Holding AG | | | 2,430 | | | | 182,132 | |
| | |
dormakaba Holding AG | | | 270 | | | | 177,864 | |
| | |
Emmi AG | | | 245 | | | | 206,860 | |
| | |
Ems-Chemie Holding AG | | | 1,030 | | | | 514,449 | |
| | |
Flughafen Zurich AG | | | 1,375 | | | | 242,878 | |
| | |
Forbo Holding AG | | | 364 | | | | 507,523 | |
| | |
Geberit AG | | | 1,480 | | | | 578,578 | |
| | |
Georg Fischer AG | | | 250 | | | | 221,598 | |
| | |
Givaudan SA | | | 555 | | | | 1,346,461 | |
| | |
Helvetia Holding AG | | | 372 | | | | 220,238 | |
| | |
Inficon Holding AG | | | 320 | | | | 170,226 | |
| | |
Intershop Holding AG | | | 234 | | | | 117,015 | |
| | |
Julius Baer Group, Ltd. | | | 6,100 | | | | 245,173 | |
| | |
Komax Holding AG | | | 326 | | | | 86,424 | |
| | |
Kuehne & Nagel International AG | | | 2,225 | | | | 300,889 | |
| | |
Landis+Gyr Group AG | | | 4,400 | | | | 284,167 | |
| | |
LEM Holding SA | | | 53 | | | | 63,468 | |
| | |
Mobimo Holding AG | | | 900 | | | | 220,625 | |
| | |
Nestle SA | | | 39,840 | | | | 3,473,406 | |
| | |
Novartis AG | | | 20,500 | | | | 1,789,666 | |
| | |
Panalpina Welttransport Holding AG | | | 731 | | | | 128,622 | |
| | |
Pargesa Holding SA, Bearer Shares | | | 2,500 | | | | 197,341 | |
| | |
Partners Group Holding AG | | | 465 | | | | 319,829 | |
| | |
PSP Swiss Property AG | | | 4,660 | | | | 479,418 | |
| | |
Roche Holding AG | | | 5,760 | | | | 1,532,366 | |
| | |
Roche Holding AG, Bearer Shares | | | 473 | | | | 124,334 | |
| | |
Schindler Holding AG | | | 842 | | | | 177,844 | |
| | |
Schindler Holding AG PC | | | 1,650 | | | | 350,988 | |
| | |
SFS Group AG | | | 1,782 | | | | 143,411 | |
| | |
SGS SA | | | 198 | | | | 477,980 | |
| | |
Sika AG | | | 9,290 | | | | 1,226,799 | |
| | |
Sonova Holding AG | | | 585 | | | | 109,790 | |
| | |
Sulzer AG | | | 1,130 | | | | 103,797 | |
| | |
Sunrise Communications Group AG(1)(2) | | | 2,000 | | | | 168,616 | |
| | |
Swiss Life Holding AG | | | 900 | | | | 371,296 | |
| | |
Swiss Re AG | | | 7,050 | | | | 676,128 | |
| | |
Swisscom AG | | | 2,280 | | | | 1,092,809 | |
| | |
Temenos AG | | | 4,862 | | | | 656,294 | |
| | |
u-blox Holding AG(1) | | | 975 | | | | 83,225 | |
| | |
Valiant Holding AG | | | 1,138 | | | | 122,910 | |
| | |
Valora Holding AG | | | 1,820 | | | | 483,682 | |
| | | | |
| | 17 | | See Notes to Financial Statements. |
Parametric
International Equity Fund
January 31, 2019
Portfolio of Investments — continued
| | | | | | | | |
| Security | | Shares | | | Value | |
|
| Switzerland (continued) | |
| | |
Vontobel Holding AG | | | 2,114 | | | $ | 119,167 | |
| | |
Zurich Insurance Group AG | | | 2,800 | | | | 878,788 | |
| | |
| | | | | | | $ | 26,644,536 | |
|
| United Kingdom — 9.1% | |
| | |
3i Group PLC | | | 7,509 | | | $ | 83,806 | |
| | |
Admiral Group PLC | | | 3,026 | | | | 82,283 | |
| | |
Antofagasta PLC | | | 7,200 | | | | 82,310 | |
| | |
Ascential PLC | | | 22,460 | | | | 112,127 | |
| | |
Assura PLC | | | 171,909 | | | | 135,003 | |
| | |
AstraZeneca PLC | | | 12,300 | | | | 891,035 | |
| | |
Atlantica Yield PLC | | | 8,200 | | | | 147,518 | |
| | |
Auto Trader Group PLC(2) | | | 30,000 | | | | 180,041 | |
| | |
Avast PLC(1)(2) | | | 27,000 | | | | 101,644 | |
| | |
Aveva Group PLC | | | 4,558 | | | | 162,930 | |
| | |
Aviva PLC | | | 25,000 | | | | 135,965 | |
| | |
B&M European Value Retail SA | | | 21,315 | | | | 90,761 | |
| | |
Babcock International Group PLC | | | 11,872 | | | | 82,689 | |
| | |
BAE Systems PLC | | | 37,500 | | | | 252,276 | |
| | |
Barratt Developments PLC | | | 16,000 | | | | 113,170 | |
| | |
Barrick Gold Corp. | | | 8,456 | | | | 111,621 | |
| | |
Berkeley Group Holdings PLC | | | 3,100 | | | | 152,633 | |
| | |
BHP Group PLC | | | 26,800 | | | | 598,784 | |
| | |
Big Yellow Group PLC | | | 8,638 | | | | 108,657 | |
| | |
BP PLC | | | 199,600 | | | | 1,363,496 | |
| | |
British American Tobacco PLC | | | 18,600 | | | | 655,651 | |
| | |
BT Group PLC | | | 194,000 | | | | 591,584 | |
| | |
BTG PLC(1) | | | 10,830 | | | | 118,272 | |
| | |
Bunzl PLC | | | 6,100 | | | | 192,346 | |
| | |
Burberry Group PLC | | | 6,550 | | | | 154,835 | |
| | |
Carnival PLC | | | 2,885 | | | | 163,230 | |
| | |
Centrica PLC | | | 274,800 | | | | 493,828 | |
| | |
Cineworld Group PLC | | | 74,300 | | | | 254,992 | |
| | |
Cobham PLC(1) | | | 77,000 | | | | 109,014 | |
| | |
Compass Group PLC | | | 21,200 | | | | 453,649 | |
| | |
Computacenter PLC | | | 4,400 | | | | 60,426 | |
| | |
ConvaTec Group PLC(2) | | | 54,000 | | | | 101,242 | |
| | |
Croda International PLC | | | 2,464 | | | | 156,004 | |
| | |
Daily Mail & General Trust PLC, Class A | | | 27,600 | | | | 219,554 | |
| | |
Dechra Pharmaceuticals PLC | | | 4,650 | | | | 144,470 | |
| | |
Derwent London PLC | | | 4,800 | | | | 204,155 | |
| | |
Direct Line Insurance Group PLC | | | 15,813 | | | | 69,894 | |
| | |
DS Smith PLC | | | 32,520 | | | | 144,222 | |
| | |
Electrocomponents PLC | | | 32,000 | | | | 228,424 | |
| | |
Elementis PLC | | | 29,679 | | | | 71,053 | |
| | |
Equiniti Group PLC(2) | | | 31,115 | | | | 84,534 | |
| | | | | | | | |
| Security | | Shares | | | Value | |
|
| United Kingdom (continued) | |
| | |
Essentra PLC | | | 15,665 | | | $ | 76,758 | |
| | |
Experian PLC | | | 10,400 | | | | 261,119 | |
| | |
F&C Commercial Property Trust, Ltd. | | | 51,629 | | | | 87,975 | |
| | |
Ferguson PLC | | | 2,207 | | | | 147,788 | |
| | |
FirstGroup PLC(1) | | | 47,376 | | | | 57,574 | |
| | |
Fresnillo PLC | | | 9,748 | | | | 128,702 | |
| | |
GlaxoSmithKline PLC | | | 48,800 | | | | 947,919 | |
| | |
Great Portland Estates PLC | | | 23,700 | | | | 227,668 | |
| | |
Greene King PLC | | | 13,600 | | | | 107,287 | |
| | |
Halma PLC | | | 17,200 | | | | 316,341 | |
| | |
Hammerson PLC | | | 33,097 | | | | 161,803 | |
| | |
Howden Joinery Group PLC | | | 23,000 | | | | 152,583 | |
| | |
HSBC Holdings PLC | | | 115,000 | | | | 968,329 | |
| | |
Imperial Brands PLC | | | 11,971 | | | | 397,366 | |
| | |
Indivior PLC(1) | | | 55,500 | | | | 82,688 | |
| | |
Informa PLC | | | 34,500 | | | | 306,439 | |
| | |
Inmarsat PLC | | | 40,064 | | | | 194,498 | |
| | |
Intertek Group PLC | | | 1,680 | | | | 108,409 | |
| | |
Johnson Matthey PLC | | | 5,400 | | | | 215,727 | |
| | |
Kingfisher PLC | | | 57,123 | | | | 166,876 | |
| | |
Land Securities Group PLC | | | 28,800 | | | | 327,524 | |
| | |
Legal & General Group PLC | | | 61,800 | | | | 210,546 | |
| | |
Lloyds Banking Group PLC | | | 478,000 | | | | 364,410 | |
| | |
London Stock Exchange Group PLC | | | 2,149 | | | | 129,243 | |
| | |
LondonMetric Property PLC | | | 56,300 | | | | 138,666 | |
| | |
Marks & Spencer Group PLC | | | 21,900 | | | | 82,860 | |
| | |
Meggitt PLC | | | 11,454 | | | | 77,575 | |
| | |
Merlin Entertainments PLC(2) | | | 20,000 | | | | 88,630 | |
| | |
Micro Focus International PLC | | | 26,200 | | | | 499,505 | |
| | |
Mimecast, Ltd.(1) | | | 2,500 | | | | 93,925 | |
| | |
Mondi PLC | | | 9,300 | | | | 224,903 | |
| | |
National Grid PLC | | | 119,846 | | | | 1,305,050 | |
| | |
NCC Group PLC | | | 32,556 | | | | 54,883 | |
| | |
Next PLC | | | 1,670 | | | | 106,210 | |
| | |
Pearson PLC | | | 19,600 | | | | 233,023 | |
| | |
Persimmon PLC | | | 7,100 | | | | 221,489 | |
| | |
Playtech PLC | | | 12,000 | | | | 61,022 | |
| | |
Primary Health Properties PLC | | | 90,643 | | | | 136,998 | |
| | |
Provident Financial PLC(1) | | | 10,491 | | | | 72,378 | |
| | |
Reckitt Benckiser Group PLC | | | 7,980 | | | | 614,019 | |
| | |
RELX PLC | | | 19,100 | | | | 423,056 | |
| | |
Rentokil Initial PLC | | | 39,000 | | | | 172,229 | |
| | |
Rightmove PLC | | | 44,000 | | | | 272,465 | |
| | |
Rio Tinto PLC | | | 14,600 | | | | 807,703 | |
| | |
Rolls-Royce Holdings PLC | | | 18,600 | | | | 216,196 | |
| | |
Royal Bank of Scotland Group PLC | | | 50,000 | | | | 158,611 | |
| | |
Royal Dutch Shell PLC, Class A | | | 41,500 | | | | 1,286,518 | |
| | | | |
| | 18 | | See Notes to Financial Statements. |
Parametric
International Equity Fund
January 31, 2019
Portfolio of Investments — continued
| | | | | | | | |
| Security | | Shares | | | Value | |
|
| United Kingdom (continued) | |
| | |
Royal Mail PLC | | | 29,400 | | | $ | 103,589 | |
| | |
RPC Group PLC | | | 11,288 | | | | 117,534 | |
| | |
RSA Insurance Group PLC | | | 15,500 | | | | 104,514 | |
| | |
Safestore Holdings PLC | | | 11,400 | | | | 86,287 | |
| | |
Segro PLC | | | 42,800 | | | | 363,830 | |
| | |
Severn Trent PLC | | | 13,453 | | | | 353,507 | |
| | |
Shaftesbury PLC | | | 18,300 | | | | 211,735 | |
| | |
Smith & Nephew PLC | | | 16,400 | | | | 308,955 | |
| | |
Spectris PLC | | | 8,200 | | | | 279,945 | |
| | |
Spirax-Sarco Engineering PLC | | | 959 | | | | 80,652 | |
| | |
SSP Group PLC | | | 11,932 | | | | 104,436 | |
| | |
St. James’s Place PLC | | | 10,600 | | | | 130,657 | |
| | |
Standard Life Aberdeen PLC | | | 23,890 | | | | 78,980 | |
| | |
TalkTalk Telecom Group PLC | | | 127,917 | | | | 187,527 | |
| | |
Tate & Lyle PLC | | | 25,503 | | | | 230,210 | |
| | |
Taylor Wimpey PLC | | | 52,000 | | | | 112,749 | |
| | |
Travis Perkins PLC | | | 9,000 | | | | 144,660 | |
| | |
Tritax Big Box REIT PLC | | | 103,900 | | | | 190,422 | |
| | |
Unilever PLC | | | 10,100 | | | | 530,594 | |
| | |
UNITE Group PLC (The) | | | 18,800 | | | | 224,528 | |
| | |
United Utilities Group PLC | | | 30,000 | | | | 328,111 | |
| | |
Victrex PLC | | | 4,400 | | | | 132,124 | |
| | |
WH Smith PLC | | | 2,540 | | | | 65,202 | |
| | |
Whitbread PLC | | | 3,020 | | | | 193,507 | |
| | |
William Hill PLC | | | 26,650 | | | | 61,682 | |
| | |
WM Morrison Supermarkets PLC | | | 81,700 | | | | 251,241 | |
| | |
| | | | | | | $ | 28,130,792 | |
| |
Total Common Stocks
(identified cost $285,899,399) | | | $ | 304,844,484 | |
|
| Rights(1) — 0.0%(5) | |
| Security | | Shares | | | Value | |
| | |
BUWOG AG, Exp. 3/29/19(3) | | | 3,930 | | | $ | 0 | |
| | |
Tritax Big Box REIT PLC, Exp. 2/8/19 | | | 13,552 | | | | 1,724 | |
| |
Total Rights
(identified cost $0) | | | $ | 1,724 | |
|
| Warrants(1) — 0.0% | |
| Security | | Shares | | | Value | |
| | |
Ezion Holdings, Ltd., Exp. 4/16/23, Strike SGD 0.2763 | | | 135,600 | | | $ | 0 | |
| |
Total Warrants
(identified cost $0) | | | $ | 0 | |
| | | | | | | | |
| Short-Term Investments — 0.8% | |
| Description | | Units | | | Value | |
| | |
Eaton Vance Cash Reserves Fund, LLC, 2.61%(6) | | | 2,447,022 | | | $ | 2,447,022 | |
| |
Total Short-Term Investments
(identified cost $2,447,022) | | | $ | 2,447,022 | |
| |
Total Investments — 99.3%
(identified cost $288,346,421) | | | $ | 307,293,230 | |
| |
Other Assets, Less Liabilities — 0.7% | | | $ | 2,181,054 | |
| |
Net Assets — 100.0% | | | $ | 309,474,284 | |
The percentage shown for each investment category in the Portfolio of Investments is based on net assets.
| (1) | Non-income producing security. |
| (2) | Security exempt from registration pursuant to Rule 144A under the Securities Act of 1933, as amended. These securities may be sold in certain transactions in reliance on an exemption from registration (normally to qualified institutional buyers). At January 31, 2019, the aggregate value of these securities is $8,439,933 or 2.7% of the Fund’s net assets. |
| (3) | For fair value measurement disclosure purposes, security is categorized as Level 3 (see Note 9). |
| (4) | Securities are traded on separate exchanges for the same entity. |
| (5) | Amount is less than 0.05%. |
| (6) | Affiliated investment company, available to Eaton Vance portfolios and funds, which invests in high quality, U.S. dollar denominated money market instruments. The rate shown is the annualized seven-day yield as of January 31, 2019. |
| | | | | | | | |
| Currency Concentration of Portfolio | |
| Currency | | Percentage
of Net Assets | | | Value | |
| | |
Euro | | | 38.1 | % | | $ | 118,048,706 | |
| | |
Japanese Yen | | | 13.1 | | | | 40,598,199 | |
| | |
British Pound Sterling | | | 9.3 | | | | 28,800,049 | |
| | |
Swiss Franc | | | 8.9 | | | | 27,381,221 | |
| | |
Australian Dollar | | | 8.5 | | | | 26,344,378 | |
| | |
Swedish Krona | | | 4.6 | | | | 14,245,137 | |
| | |
Hong Kong Dollar | | | 4.1 | | | | 12,545,367 | |
| | |
United States Dollar | | | 3.6 | | | | 11,126,879 | |
| | |
Norwegian Krone | | | 2.2 | | | | 6,690,246 | |
| | |
Danish Krone | | | 2.1 | | | | 6,578,215 | |
| | |
Singapore Dollar | | | 2.0 | | | | 6,292,703 | |
| | |
Israeli Shekel | | | 1.8 | | | | 5,579,190 | |
| | |
New Zealand Dollar | | | 1.0 | | | | 3,062,940 | |
| | |
Total Investments | | | 99.3 | % | | $ | 307,293,230 | |
| | | | |
| | 19 | | See Notes to Financial Statements. |
Parametric
International Equity Fund
January 31, 2019
Portfolio of Investments — continued
| | | | | | | | |
| Sector Classification of Portfolio | |
| Sector | | Percentage
of Net Assets | | | Value | |
| | |
Financials | | | 10.7 | % | | $ | 33,079,755 | |
| | |
Consumer Staples | | | 10.6 | | | | 32,658,165 | |
| | |
Industrials | | | 10.4 | | | | 32,222,734 | |
| | |
Consumer Discretionary | | | 9.7 | | | | 30,144,766 | |
| | |
Health Care | | | 9.3 | | | | 28,775,697 | |
| | |
Materials | | | 9.2 | | | | 28,606,919 | |
| | |
Information Technology | | | 9.1 | | | | 28,150,362 | |
| | |
Communication Services | | | 8.6 | | | | 26,517,140 | |
| | |
Real Estate | | | 8.1 | | | | 25,144,985 | |
| | |
Utilities | | | 7.1 | | | | 21,972,191 | |
| | |
Energy | | | 5.7 | | | | 17,573,494 | |
| | |
Short-Term Investments | | | 0.8 | | | | 2,447,022 | |
| | |
Total Investments | | | 99.3 | % | | $ | 307,293,230 | |
Abbreviations:
| | | | |
| | |
| ADR | | – | | American Depositary Receipt |
| | |
| CDI | | – | | CHESS Depositary Interest |
| | |
| PC | | – | | Participation Certificate |
| | |
| PFC Shares | | – | | Preference Shares |
Currency Abbreviations:
| | | | |
| | 20 | | See Notes to Financial Statements. |
Parametric
International Equity Fund
January 31, 2019
Statement of Assets and Liabilities
| | | | |
| Assets | | January 31, 2019 | |
| |
Unaffiliated investments, at value (identified cost, $285,899,399) | | $ | 304,846,208 | |
| |
Affiliated investment, at value (identified cost, $2,447,022) | | | 2,447,022 | |
| |
Foreign currency, at value (identified cost, $280,079) | | | 281,650 | |
| |
Dividends receivable | | | 249,619 | |
| |
Dividends receivable from affiliated investment | | | 5,324 | |
| |
Receivable for investments sold | | | 489,600 | |
| |
Receivable for Fund shares sold | | | 1,201,709 | |
| |
Tax reclaims receivable | | | 581,454 | |
| |
Receivable from affiliates | | | 54,788 | |
| |
Total assets | | $ | 310,157,374 | |
| |
| Liabilities | | | | |
| |
Payable for investments purchased | | $ | 207,208 | |
| |
Payable for Fund shares redeemed | | | 225,257 | |
| |
Payable to affiliates: | | | | |
| |
Investment adviser and administration fee | | | 99,747 | |
| |
Distribution and service fees | | | 14,396 | |
| |
Accrued expenses | | | 136,482 | |
| |
Total liabilities | | $ | 683,090 | |
| |
Net Assets | | $ | 309,474,284 | |
| |
| Sources of Net Assets | | | | |
| |
Paid-in capital | | $ | 292,209,460 | |
| |
Distributable earnings | | | 17,264,824 | |
| |
Total | | $ | 309,474,284 | |
| |
| Investor Class Shares | | | | |
| |
Net Assets | | $ | 65,056,208 | |
| |
Shares Outstanding | | | 5,181,031 | |
| |
Net Asset Value, Offering Price and Redemption Price Per Share | | | | |
| |
(net assets ÷ shares of beneficial interest outstanding) | | $ | 12.56 | |
| |
| Institutional Class Shares | | | | |
| |
Net Assets | | $ | 151,107,385 | |
| |
Shares Outstanding | | | 11,982,377 | |
| |
Net Asset Value, Offering Price and Redemption Price Per Share | | | | |
| |
(net assets ÷ shares of beneficial interest outstanding) | | $ | 12.61 | |
| |
| Class R Shares | | | | |
| |
Net Assets | | $ | 1,939,348 | |
| |
Shares Outstanding | | | 155,221 | |
| |
Net Asset Value, Offering Price and Redemption Price Per Share | | | | |
| |
(net assets ÷ shares of beneficial interest outstanding) | | $ | 12.49 | |
| |
| Class R6 Shares | | | | |
| |
Net Assets | | $ | 91,371,343 | |
| |
Shares Outstanding | | | 7,249,093 | |
| |
Net Asset Value, Offering Price and Redemption Price Per Share | | | | |
| |
(net assets ÷ shares of beneficial interest outstanding) | | $ | 12.60 | |
| | | | |
| | 21 | | See Notes to Financial Statements. |
Parametric
International Equity Fund
January 31, 2019
Statement of Operations
| | | | |
| Investment Income | | Year Ended
January 31, 2019 | |
| |
Dividends (net of foreign taxes, $860,543) | | $ | 7,659,155 | |
| |
Dividends from affiliated investment | | | 44,895 | |
| |
Total investment income | | $ | 7,704,050 | |
| |
| Expenses | | | | |
| |
Investment adviser and administration fee | | $ | 1,022,997 | |
| |
Distribution and service fees | | | | |
| |
Investor Class | | | 154,000 | |
| |
Class R | | | 7,236 | |
| |
Trustees’ fees and expenses | | | 13,711 | |
| |
Custodian fee | | | 166,360 | |
| |
Transfer and dividend disbursing agent fees | | | 115,955 | |
| |
Legal and accounting services | | | 57,441 | |
| |
Printing and postage | | | 29,509 | |
| |
Registration fees | | | 91,299 | |
| |
Miscellaneous | | | 51,104 | |
| |
Total expenses | | $ | 1,709,612 | |
| |
Deduct — | | | | |
| |
Allocation of expenses to affiliates | | $ | 292,662 | |
| |
Total expense reductions | | $ | 292,662 | |
| |
Net expenses | | $ | 1,416,950 | |
| |
Net investment income | | $ | 6,287,100 | |
| |
| Realized and Unrealized Gain (Loss) | | | | |
| |
Net realized gain (loss) — | | | | |
| |
Investment transactions | | $ | 2,059,028 | |
| |
Investment transactions — affiliated investment | | | 1,036 | |
| |
Foreign currency transactions | | | (112,606 | ) |
| |
Net realized gain | | $ | 1,947,458 | |
| |
Change in unrealized appreciation (depreciation) — | | | | |
| |
Investments | | $ | (32,082,846 | ) |
| |
Investments — affiliated investment | | | (219 | ) |
| |
Foreign currency | | | (33,692 | ) |
| |
Net change in unrealized appreciation (depreciation) | | $ | (32,116,757 | ) |
| |
Net realized and unrealized loss | | $ | (30,169,299 | ) |
| |
Net decrease in net assets from operations | | $ | (23,882,199 | ) |
| | | | |
| | 22 | | See Notes to Financial Statements. |
Parametric
International Equity Fund
January 31, 2019
Statements of Changes in Net Assets
| | | | | | | | |
| | | Year Ended January 31, | |
| Increase (Decrease) in Net Assets | | 2019 | | | 2018 | |
| | |
From operations — | | | | | | | | |
| | |
Net investment income | | $ | 6,287,100 | | | $ | 5,300,423 | |
| | |
Net realized gain | | | 1,947,458 | | | | 5,586,140 | |
| | |
Net change in unrealized appreciation (depreciation) | | | (32,116,757 | ) | | | 43,457,767 | |
| | |
Net increase (decrease) in net assets from operations | | $ | (23,882,199 | ) | | $ | 54,344,330 | |
| | |
Distributions to shareholders(1) — | | | | | | | | |
| | |
Investor Class | | $ | (1,966,658 | ) | | $ | (1,486,587 | ) |
| | |
Institutional Class | | | (3,780,522 | ) | | | (2,196,786 | ) |
| | |
Class R | | | (44,240 | ) | | | (25,865 | ) |
| | |
Class R6 | | | (2,734,087 | ) | | | (2,816,034 | ) |
| | |
Total distributions to shareholders | | $ | (8,525,507 | ) | | $ | (6,525,272 | ) |
| | |
Transactions in shares of beneficial interest — | | | | | | | | |
| | |
Proceeds from sale of shares | | | | | | | | |
| | |
Investor Class | | $ | 43,303,796 | | | $ | 33,141,322 | |
| | |
Institutional Class | | | 116,046,127 | | | | 35,797,290 | |
| | |
Class R | | | 2,412,325 | | | | 463,484 | |
| | |
Class R6 | | | 26,275,473 | | | | 48,292,478 | |
| | |
Net asset value of shares issued to shareholders in payment of distributions declared | | | | | | | | |
| | |
Investor Class | | | 1,705,158 | | | | 1,162,366 | |
| | |
Institutional Class | | | 3,519,375 | | | | 1,799,165 | |
| | |
Class R | | | 44,237 | | | | 25,865 | |
| | |
Class R6 | | | 2,734,087 | | | | 2,215,954 | |
| | |
Cost of shares redeemed | | | | | | | | |
| | |
Investor Class | | | (31,664,113 | ) | | | (19,269,279 | ) |
| | |
Institutional Class | | | (42,712,163 | ) | | | (21,722,920 | ) |
| | |
Class R | | | (1,510,692 | ) | | | (343,580 | ) |
| | |
Class R6 | | | (34,967,907 | ) | | | (48,038,853 | ) |
| | |
Net increase in net assets from Fund share transactions | | $ | 85,185,703 | | | $ | 33,523,292 | |
| | |
Net increase in net assets | | $ | 52,777,997 | | | $ | 81,342,350 | |
| | |
| Net Assets | | | | | | | | |
| | |
At beginning of year | | $ | 256,696,287 | | | $ | 175,353,937 | |
| | |
At end of year | | $ | 309,474,284 | | | $ | 256,696,287 | (2) |
| (1) | For the year ended January 31, 2018, the source of distributions was from net investment income. The current year presentation of distributions conforms with the Disclosure Update and Simplification Rule issued by the Securities and Exchange Commission, effective November 5, 2018. |
| (2) | Includes accumulated distributions in excess of net investment income of $(1,383,428) at January 31, 2018. The requirement to disclose the corresponding amount as of January 31, 2019 was eliminated. |
| | | | |
| | 23 | | See Notes to Financial Statements. |
Parametric
International Equity Fund
January 31, 2019
Financial Highlights
| | | | | | | | | | | | | | | | | | | | |
| | | Investor Class | |
| |
| | | Year Ended January 31, | |
| | | 2019 | | | 2018 | | | 2017 | | | 2016 | | | 2015 | |
| | | | | |
Net asset value — Beginning of year | | $ | 14.350 | | | $ | 11.570 | | | $ | 10.750 | | | $ | 11.410 | | | $ | 11.960 | |
| | | | | |
| Income (Loss) From Operations | | | | | | | | | | | | | | | | | | | | |
| | | | | |
Net investment income(1) | | $ | 0.301 | | | $ | 0.272 | | | $ | 0.198 | | | $ | 0.217 | | | $ | 0.355 | (2) |
| | | | | |
Net realized and unrealized gain (loss) | | | (1.700 | ) | | | 2.869 | | | | 0.810 | | | | (0.607 | ) | | | (0.242 | ) |
| | | | | |
Total income (loss) from operations | | $ | (1.399 | ) | | $ | 3.141 | | | $ | 1.008 | | | $ | (0.390 | ) | | $ | 0.113 | |
| | | | | |
| Less Distributions | | | | | | | | | | | | | | | | | | | | |
| | | | | |
From net investment income | | $ | (0.211 | ) | | $ | (0.361 | ) | | $ | (0.178 | ) | | $ | (0.266 | ) | | $ | (0.251 | ) |
| | | | | |
From net realized gain | | | (0.180 | ) | | | — | | | | (0.010 | ) | | | (0.004 | ) | | | (0.412 | ) |
| | | | | |
Total distributions | | $ | (0.391 | ) | | $ | (0.361 | ) | | $ | (0.188 | ) | | $ | (0.270 | ) | | $ | (0.663 | ) |
| | | | | |
Net asset value — End of year | | $ | 12.560 | | | $ | 14.350 | | | $ | 11.570 | | | $ | 10.750 | | | $ | 11.410 | |
| | | | | |
Total Return(3)(4) | | | (9.73 | )% | | | 27.29 | % | | | 9.55 | % | | | (3.73 | )% | | | 1.01 | % |
| | | | | |
| Ratios/Supplemental Data | | | | | | | | | | | | | | | | | | | | |
| | | | | |
Net assets, end of year (000’s omitted) | | $ | 65,056 | | | $ | 59,858 | | | $ | 34,386 | | | $ | 12,069 | | | $ | 8,503 | |
| | | | | |
Ratios (as a percentage of average daily net assets): | | | | | | | | | | | | | | | | | | | | |
| | | | | |
Expenses(4)(5) | | | 0.75 | % | | | 0.75 | % | | | 0.84 | % | | | 0.90 | % | | | 0.97 | % |
| | | | | |
Net investment income | | | 2.27 | % | | | 2.06 | % | | | 1.75 | % | | | 1.86 | % | | | 2.83 | %(2) |
| | | | | |
Portfolio Turnover | | | 30 | % | | | 36 | % | | | 22 | % | | | 34 | % | | | 63 | % |
| (1) | Computed using average shares outstanding. |
| (2) | Net investment income per share reflects special dividends which amounted to $0.059 per share. Excluding special dividends, the ratio of net investment income to average daily net assets would have been 2.35%. |
| (3) | Returns are historical and are calculated by determining the percentage change in net asset value with all distributions reinvested. |
| (4) | The investment adviser, sub-adviser and administrator reimbursed certain operating expenses (equal to 0.11%, 0.11%, 0.23%, 0.35% and 0.32% of average daily net assets for the years ended January 31, 2019, 2018, 2017, 2016 and 2015, respectively). Absent this reimbursement, total return would be lower. |
| (5) | Excludes the effect of custody fee credits, if any, of less than 0.005%. Effective September 1, 2015, custody fee credits, which were earned on cash deposit balances, were discontinued by the custodian. |
| | | | |
| | 24 | | See Notes to Financial Statements. |
Parametric
International Equity Fund
January 31, 2019
Financial Highlights — continued
| | | | | | | | | | | | | | | | | | | | |
| | | Institutional Class | |
| |
| | | Year Ended January 31, | |
| | | 2019 | | | 2018 | | | 2017 | | | 2016 | | | 2015 | |
| | | | | |
Net asset value — Beginning of year | | $ | 14.410 | | | $ | 11.610 | | | $ | 10.770 | | | $ | 11.430 | | | $ | 11.990 | |
| | | | | |
| Income (Loss) From Operations | | | | | | | | | | | | | | | | | | | | |
| | | | | |
Net investment income(1) | | $ | 0.310 | | | $ | 0.312 | | | $ | 0.257 | | | $ | 0.325 | | | $ | 0.333 | (2) |
| | | | | |
Net realized and unrealized gain (loss) | | | (1.689 | ) | | | 2.874 | | | | 0.788 | | | | (0.693 | ) | | | (0.184 | ) |
| | | | | |
Total income (loss) from operations | | $ | (1.379 | ) | | $ | 3.186 | | | $ | 1.045 | | | $ | (0.368 | ) | | $ | 0.149 | |
| | | | | |
| Less Distributions | | | | | | | | | | | | | | | | | | | | |
| | | | | |
From net investment income | | $ | (0.241 | ) | | $ | (0.386 | ) | | $ | (0.195 | ) | | $ | (0.288 | ) | | $ | (0.297 | ) |
| | | | | |
From net realized gain | | | (0.180 | ) | | | — | | | | (0.010 | ) | | | (0.004 | ) | | | (0.412 | ) |
| | | | | |
Total distributions | | $ | (0.421 | ) | | $ | (0.386 | ) | | $ | (0.205 | ) | | $ | (0.292 | ) | | $ | (0.709 | ) |
| | | | | |
Net asset value — End of year | | $ | 12.610 | | | $ | 14.410 | | | $ | 11.610 | | | $ | 10.770 | | | $ | 11.430 | |
| | | | | |
Total Return(3)(4) | | | (9.53 | )% | | | 27.60 | % | | | 9.78 | % | | | (3.37 | )% | | | 1.22 | % |
| | | | | |
| Ratios/Supplemental Data | | | | | | | | | | | | | | | | | | | | |
| | | | | |
Net assets, end of year (000’s omitted) | | $ | 151,107 | | | $ | 86,446 | | | $ | 55,324 | | | $ | 30,808 | | | $ | 84,195 | |
| | | | | |
Ratios (as a percentage of average daily net assets): | | | | | | | | | | | | | | | | | | | | |
| | | | | |
Expenses(4)(5) | | | 0.50 | % | | | 0.50 | % | | | 0.60 | % | | | 0.65 | % | | | 0.72 | % |
| | | | | |
Net investment income | | | 2.35 | % | | | 2.36 | % | | | 2.26 | % | | | 2.72 | % | | | 2.66 | %(2) |
| | | | | |
Portfolio Turnover | | | 30 | % | | | 36 | % | | | 22 | % | | | 34 | % | | | 63 | % |
| (1) | Computed using average shares outstanding. |
| (2) | Net investment income per share reflects special dividends which amounted to $0.048 per share. Excluding special dividends, the ratio of net investment income to average daily net assets would have been 2.28%. |
| (3) | Returns are historical and are calculated by determining the percentage change in net asset value with all distributions reinvested. |
| (4) | The investment adviser, sub-adviser and administrator reimbursed certain operating expenses (equal to 0.11%, 0.11%, 0.24%, 0.35% and 0.32% of average daily net assets for the years ended January 31, 2019, 2018, 2017, 2016 and 2015, respectively). Absent this reimbursement, total return would be lower. |
| (5) | Excludes the effect of custody fee credits, if any, of less than 0.005%. Effective September 1, 2015, custody fee credits, which were earned on cash deposit balances, were discontinued by the custodian. |
| | | | |
| | 25 | | See Notes to Financial Statements. |
Parametric
International Equity Fund
January 31, 2019
Financial Highlights — continued
| | | | | | | | | | | | | | | | |
| | | Class R | |
| | |
| | | Year Ended January 31, | | | Period Ended
January 31, 2016(1) | |
| | | 2019 | | | 2018 | | | 2017 | |
| | | | |
Net asset value — Beginning of period | | $ | 14.290 | | | $ | 11.530 | | | $ | 10.740 | | | $ | 12.340 | |
| | | | |
| Income (Loss) From Operations | | | | | | | | | | | | | | | | |
| | | | |
Net investment income(2) | | $ | 0.231 | | | $ | 0.259 | | | $ | 0.064 | | | $ | 0.044 | |
| | | | |
Net realized and unrealized gain (loss) | | | (1.657 | ) | | | 2.827 | | | | 0.919 | | | | (1.384 | ) |
| | | | |
Total income (loss) from operations | | $ | (1.426 | ) | | $ | 3.086 | | | $ | 0.983 | | | $ | (1.340 | ) |
| | | | |
| Less Distributions | | | | | | | | | | | | | | | | |
| | | | |
From net investment income | | $ | (0.194 | ) | | $ | (0.326 | ) | | $ | (0.183 | ) | | $ | (0.256 | ) |
| | | | |
From net realized gain | | | (0.180 | ) | | | — | | | | (0.010 | ) | | | (0.004 | ) |
| | | | |
Total distributions | | $ | (0.374 | ) | | $ | (0.326 | ) | | $ | (0.193 | ) | | $ | (0.260 | ) |
| | | | |
Net asset value — End of period | | $ | 12.490 | | | $ | 14.290 | | | $ | 11.530 | | | $ | 10.740 | |
| | | | |
Total Return(3)(4) | | | (9.96 | )% | | | 26.90 | % | | | 9.22 | % | | | (10.98 | )%(5) |
| | | | |
| Ratios/Supplemental Data | | | | | | | | | | | | | | | | |
| | | | |
Net assets, end of period (000’s omitted) | | $ | 1,939 | | | $ | 1,167 | | | $ | 786 | | | $ | 1 | |
| | | | |
Ratios (as a percentage of average daily net assets): | | | | | | | | | | | | | | | | |
| | | | |
Expenses(4) | | | 1.00 | % | | | 1.00 | % | | | 1.04 | % | | | 1.15 | %(6) |
| | | | |
Net investment income | | | 1.77 | % | | | 1.98 | % | | | 0.56 | % | | | 0.82 | %(6) |
| | | | |
Portfolio Turnover | | | 30 | % | | | 36 | % | | | 22 | % | | | 34 | %(7) |
| (1) | For the period from commencement of operations, August 10, 2015, to January 31, 2016. |
| (2) | Computed using average shares outstanding. |
| (3) | Returns are historical and are calculated by determining the percentage change in net asset value with all distributions reinvested. |
| (4) | The investment adviser, sub-adviser and administrator reimbursed certain operating expenses (equal to 0.11%, 0.11%, 0.19% and 0.35% of average daily net assets for the years ended January 31, 2019, 2018 and 2017 and the period ended January 31, 2016, respectively). Absent this reimbursement, total return would be lower. |
| (7) | For the Fund’s year ended January 31, 2016. |
| | | | |
| | 26 | | See Notes to Financial Statements. |
Parametric
International Equity Fund
January 31, 2019
Financial Highlights — continued
| | | | | | | | | | | | | | | | |
| | | Class R6 | |
| | |
| | | Year Ended January 31, | | | Period Ended
January 31, 2016(1) | |
| | | 2019 | | | 2018 | | | 2017 | |
| | | | |
Net asset value — Beginning of period | | $ | 14.410 | | | $ | 11.610 | | | $ | 10.770 | | | $ | 12.380 | |
| | | | |
| Income (Loss) From Operations | | | | | | | | | | | | | | | | |
| | | | |
Net investment income(2) | | $ | 0.363 | | | $ | 0.319 | | | $ | 0.267 | | | $ | 0.059 | |
| | | | |
Net realized and unrealized gain (loss) | | | (1.746 | ) | | | 2.875 | | | | 0.780 | | | | (1.374 | ) |
| | | | |
Total income (loss) from operations | | $ | (1.383 | ) | | $ | 3.194 | | | $ | 1.047 | | | $ | (1.315 | ) |
| | | | |
| Less Distributions | | | | | | | | | | | | | | | | |
| | | | |
From net investment income | | $ | (0.247 | ) | | $ | (0.394 | ) | | $ | (0.197 | ) | | $ | (0.291 | ) |
| | | | |
From net realized gain | | | (0.180 | ) | | | — | | | | (0.010 | ) | | | (0.004 | ) |
| | | | |
Total distributions | | $ | (0.427 | ) | | $ | (0.394 | ) | | $ | (0.207 | ) | | $ | (0.295 | ) |
| | | | |
Net asset value — End of period | | $ | 12.600 | | | $ | 14.410 | | | $ | 11.610 | | | $ | 10.770 | |
| | | | |
Total Return(3)(4) | | | (9.56 | )% | | | 27.67 | % | | | 9.79 | % | | | (10.77 | )%(5) |
| | | | |
| Ratios/Supplemental Data | | | | | | | | | | | | | | | | |
| | | | |
Net assets, end of period (000’s omitted) | | $ | 91,371 | | | $ | 109,225 | | | $ | 84,858 | | | $ | 60,608 | |
| | | | |
Ratios (as a percentage of average daily net assets): | | | | | | | | | | | | | | | | |
| | | | |
Expenses(4) | | | 0.47 | % | | | 0.47 | % | | | 0.58 | % | | | 0.62 | %(6) |
| | | | |
Net investment income | | | 2.72 | % | | | 2.42 | % | | | 2.34 | % | | | 1.10 | %(6) |
| | | | |
Portfolio Turnover | | | 30 | % | | | 36 | % | | | 22 | % | | | 34 | %(7) |
| (1) | For the period from commencement of operations, August 10, 2015, to January 31, 2016. |
| (2) | Computed using average shares outstanding. |
| (3) | Returns are historical and are calculated by determining the percentage change in net asset value with all distributions reinvested. |
| (4) | The investment adviser, sub-adviser and administrator reimbursed certain operating expenses (equal to 0.11%, 0.11%, 0.25% and 0.35% of average daily net assets for the years ended January 31, 2019, 2018 and 2017 and the period ended January 31, 2016, respectively). Absent this reimbursement, total return would be lower. |
| (7) | For the Fund’s year ended January 31, 2016. |
| | | | |
| | 27 | | See Notes to Financial Statements. |
Parametric
International Equity Fund
January 31, 2019
Notes to Financial Statements
1 Significant Accounting Policies
Parametric International Equity Fund (the Fund) is a diversified series of Eaton Vance Mutual Funds Trust (the Trust). The Trust is a Massachusetts business trust registered under the Investment Company Act of 1940, as amended (the 1940 Act), as an open-end management investment company. The Fund’s investment objective is to seek long-term capital appreciation. The Fund offers four classes of shares, Investor Class, Institutional Class, Class R and Class R6, all of which are sold at net asset value and are not subject to a sales charge. Each class represents a pro-rata interest in the Fund, but votes separately on class-specific matters and (as noted below) is subject to different expenses. Realized and unrealized gains and losses and net investment income and losses, other than class-specific expenses, are allocated daily to each class of shares based on the relative net assets of each class to the total net assets of the Fund. Sub-accounting, recordkeeping and similar administrative fees payable to financial intermediaries, which are a component of transfer and dividend disbursing agent fees on the Statement of Operations, are not allocated to Class R6 shares. Each class of shares differs in its distribution plan and certain other class-specific expenses.
The following is a summary of significant accounting policies of the Fund. The policies are in conformity with accounting principles generally accepted in the United States of America (U.S. GAAP). The Fund is an investment company and follows accounting and reporting guidance in the Financial Accounting Standards Board (FASB) Accounting Standards Codification Topic 946.
A Investment Valuation — The following methodologies are used to determine the market value or fair value of investments.
Equity Securities.Equity securities listed on a U.S. securities exchange generally are valued at the last sale or closing price on the day of valuation or, if no sales took place on such date, at the mean between the closing bid and ask prices on the exchange where such securities are principally traded. Equity securities listed on the NASDAQ Global or Global Select Market generally are valued at the NASDAQ official closing price. Unlisted or listed securities for which closing sales prices or closing quotations are not available are valued at the mean between the latest available bid and ask prices.
Foreign Securities and Currencies.Foreign securities and currencies are valued in U.S. dollars, based on foreign currency exchange rate quotations supplied by a third party pricing service. The pricing service uses a proprietary model to determine the exchange rate. Inputs to the model include reported trades and implied bid/ask spreads. The daily valuation of exchange-traded foreign securities generally is determined as of the close of trading on the principal exchange on which such securities trade. Events occurring after the close of trading on foreign exchanges may result in adjustments to the valuation of foreign securities to more accurately reflect their fair value as of the close of regular trading on the New York Stock Exchange. When valuing foreign equity securities that meet certain criteria, the Fund’s Trustees have approved the use of a fair value service that values such securities to reflect market trading that occurs after the close of the applicable foreign markets of comparable securities or other instruments that have a strong correlation to the fair-valued securities.
Affiliated Fund.The Fund may invest in Eaton Vance Cash Reserves Fund, LLC (Cash Reserves Fund), an affiliated investment company managed by Eaton Vance Management (EVM). While Cash Reserves Fund is not a registered money market mutual fund, it conducts all of its investment activities in accordance with the requirements of Rule 2a-7 under the 1940 Act. Investments in Cash Reserves Fund are valued at the closing net asset value per unit on the valuation day. Cash Reserves Fund generally values its investment securities based on available market quotations provided by a third party pricing service.
Fair Valuation.Investments for which valuations or market quotations are not readily available or are deemed unreliable are valued at fair value using methods determined in good faith by or at the direction of the Trustees of the Fund in a manner that fairly reflects the security’s value, or the amount that the Fund might reasonably expect to receive for the security upon its current sale in the ordinary course. Each such determination is based on a consideration of relevant factors, which are likely to vary from one pricing context to another. These factors may include, but are not limited to, the type of security, the existence of any contractual restrictions on the security’s disposition, the price and extent of public trading in similar securities of the issuer or of comparable companies or entities, quotations or relevant information obtained from broker/dealers or other market participants, information obtained from the issuer, analysts, and/or the appropriate stock exchange (for exchange-traded securities), an analysis of the company’s or entity’s financial condition, and an evaluation of the forces that influence the issuer and the market(s) in which the security is purchased and sold.
B Investment Transactions — Investment transactions for financial statement purposes are accounted for on a trade date basis. Realized gains and losses on investments sold are determined on the basis of identified cost.
C Income — Dividend income is recorded on the ex-dividend date for dividends received in cash and/or securities. However, if the ex-dividend date has passed, certain dividends from foreign securities are recorded as the Fund is informed of the ex-dividend date. Withholding taxes on foreign dividends and capital gains have been provided for in accordance with the Fund’s understanding of the applicable countries’ tax rules and rates.
D Federal Taxes — The Fund’s policy is to comply with the provisions of the Internal Revenue Code applicable to regulated investment companies and to distribute to shareholders each year substantially all of its net investment income, and all or substantially all of its net realized capital gains. Accordingly, no provision for federal income or excise tax is necessary.
As of January 31, 2019, the Fund had no uncertain tax positions that would require financial statement recognition, de-recognition, or disclosure. The Fund files a U.S. federal income tax return annually after its fiscal year-end, which is subject to examination by the Internal Revenue Service for a period of three years from the date of filing.
Parametric
International Equity Fund
January 31, 2019
Notes to Financial Statements — continued
E Expenses — The majority of expenses of the Trust are directly identifiable to an individual fund. Expenses which are not readily identifiable to a specific fund are allocated taking into consideration, among other things, the nature and type of expense and the relative size of the funds.
F Foreign Currency Translation — Investment valuations, other assets, and liabilities initially expressed in foreign currencies are translated each business day into U.S. dollars based upon current exchange rates. Purchases and sales of foreign investment securities and income and expenses denominated in foreign currencies are translated into U.S. dollars based upon currency exchange rates in effect on the respective dates of such transactions. Recognized gains or losses on investment transactions attributable to changes in foreign currency exchange rates are recorded for financial statement purposes as net realized gains and losses on investments. That portion of unrealized gains and losses on investments that results from fluctuations in foreign currency exchange rates is not separately disclosed.
G Use of Estimates — The preparation of the financial statements in conformity with U.S. GAAP requires management to make estimates and assumptions that affect the reported amounts of assets and liabilities at the date of the financial statements and the reported amounts of income and expense during the reporting period. Actual results could differ from those estimates.
H Indemnifications — Under the Trust’s organizational documents, its officers and Trustees may be indemnified against certain liabilities and expenses arising out of the performance of their duties to the Fund. Under Massachusetts law, if certain conditions prevail, shareholders of a Massachusetts business trust (such as the Trust) could be deemed to have personal liability for the obligations of the Trust. However, the Trust’s Declaration of Trust contains an express disclaimer of liability on the part of Fund shareholders and the By-laws provide that the Trust shall assume the defense on behalf of any Fund shareholders. Moreover, the By-laws also provide for indemnification out of Fund property of any shareholder held personally liable solely by reason of being or having been a shareholder for all loss or expense arising from such liability. Additionally, in the normal course of business, the Fund enters into agreements with service providers that may contain indemnification clauses. The Fund’s maximum exposure under these arrangements is unknown as this would involve future claims that may be made against the Fund that have not yet occurred.
2 Distributions to Shareholders and Income Tax Information
It is the present policy of the Fund to make at least one distribution annually (normally in December) of all or substantially all of its net investment income and to distribute annually all or substantially all of its net realized capital gains. Distributions to shareholders are recorded on the ex-dividend date. Distributions are declared separately for each class of shares. Shareholders may reinvest income and capital gain distributions in additional shares of the same class of the Fund at the net asset value as of the ex-dividend date or, at the election of the shareholder, receive distributions in cash. Distributions to shareholders are determined in accordance with income tax regulations, which may differ from U.S. GAAP. As required by U.S. GAAP, only distributions in excess of tax basis earnings and profits are reported in the financial statements as a return of capital. Permanent differences between book and tax accounting relating to distributions are reclassified to paid-in capital. For tax purposes, distributions from short-term capital gains are considered to be from ordinary income.
The tax character of distributions declared for the years ended January 31, 2019 and January 31, 2018 was as follows:
| | | | | | | | |
| | | Year Ended January 31, | |
| | | 2019 | | | 2018 | |
| | |
Ordinary income | | $ | 6,650,789 | | | $ | 6,525,272 | |
| | |
Long-term capital gains | | $ | 1,874,718 | | | $ | — | |
During the year ended January 31, 2019, distributable earnings was decreased by $1,142,997 and paid-in capital was increased by $1,142,997 due to the Fund’s use of equalization accounting. Tax equalization accounting allows the Fund to treat as a distribution that portion of redemption proceeds representing a redeeming shareholder’s portion of undistributed taxable income and net capital gains. These reclassifications had no effect on the net assets or net asset value per share of the Fund.
As of January 31, 2019, the components of distributable earnings (accumulated loss) on a tax basis were as follows:
| | | | |
| | |
Undistributed ordinary income | | $ | 865,900 | |
| |
Undistributed long-term capital gains | | $ | 197,420 | |
| |
Net unrealized appreciation | | $ | 16,201,504 | |
Parametric
International Equity Fund
January 31, 2019
Notes to Financial Statements — continued
The cost and unrealized appreciation (depreciation) of investments of the Fund at January 31, 2019, as determined on a federal income tax basis, were as follows:
| | | | |
| |
Aggregate cost | | $ | 291,084,128 | |
| |
Gross unrealized appreciation | | $ | 32,160,655 | |
| |
Gross unrealized depreciation | | | (15,951,553 | ) |
| |
Net unrealized appreciation | | $ | 16,209,102 | |
3 Investment Adviser and Administration Fee and Other Transactions with Affiliates
The investment adviser and administration fee is earned by EVM as compensation for investment advisory and administrative services rendered to the Fund. Pursuant to the investment advisory and administrative agreement and subsequent fee reduction agreements between the Fund and EVM, the fee is computed at an annual rate of 0.40% of the Fund’s average daily net assets up to $1 billion and is payable monthly. On net assets of $1 billion and over, the annual fee is reduced. The fee reductions cannot be terminated or reduced without the approval of a majority vote of the Trustees of the Fund who are not interested persons of EVM or the Fund and by the vote of a majority of shareholders. For the year ended January 31, 2019, the investment adviser and administration fee amounted to $1,022,997 or 0.40% of the Fund’s average daily net assets. Pursuant to a sub-advisory agreement, EVM has delegated the investment management of the Fund to Parametric Portfolio Associates LLC (Parametric), a majority-owned subsidiary of Eaton Vance Corp. EVM pays Parametric a portion of its investment adviser and administration fee for sub-advisory services provided to the Fund. The Fund invests its cash in Cash Reserves Fund. EVM does not currently receive a fee for advisory services provided to Cash Reserves Fund.
EVM and Parametric have agreed to reimburse the Fund’s expenses to the extent that total annual operating expenses (relating to ordinary operating expenses only) exceed 0.75%, 0.50%, 1.00% and 0.47% of the Fund’s average daily net assets for Investor Class, Institutional Class, Class R and Class R6, respectively. This agreement may be changed or terminated after May 31, 2019. Pursuant to this agreement, EVM and Parametric were allocated $292,662 in total of the Fund’s operating expenses for the year ended January 31, 2019.
EVM provides sub-transfer agency and related services to the Fund pursuant to a Sub-Transfer Agency Support Services Agreement. For the year ended January 31, 2019, EVM earned $7,613 from the Fund pursuant to such agreement, which is included in transfer and dividend disbursing agent fees on the Statement of Operations. Eaton Vance Distributors, Inc. (EVD), an affiliate of EVM and the Fund’s principal underwriter, received distribution and service fees from Investor Class and Class R shares (see Note 4).
Trustees and officers of the Fund who are members of EVM’s organization receive remuneration for their services to the Fund out of the investment adviser and administration fee. Trustees of the Fund who are not affiliated with EVM may elect to defer receipt of all or a percentage of their annual fees in accordance with the terms of the Trustees Deferred Compensation Plan. For the year ended January 31, 2019, no significant amounts have been deferred. Certain officers and Trustees of the Fund are officers of EVM.
4 Distribution Plans
The Fund has in effect a distribution plan for Investor Class shares (Investor Class Plan) pursuant to Rule 12b-1 under the 1940 Act. Pursuant to the Investor Class Plan, the Fund pays EVD a distribution and service fee of 0.25% per annum of its average daily net assets attributable to Investor Class shares for distribution services and facilities provided to the Fund by EVD, as well as for personal services and/or the maintenance of shareholder accounts. Distribution and service fees paid or accrued to EVD for the year ended January 31, 2019 amounted to $154,000 for Investor Class shares.
The Fund also has in effect a distribution plan for Class R shares (Class R Plan) pursuant to Rule 12b-1 under the 1940 Act. The Class R Plan requires the Fund to pay EVD an amount up to 0.50% per annum of its average daily net assets attributable to Class R shares for providing ongoing distribution services and facilities to the Fund. The Trustees of the Trust have currently limited Class R distribution payments to 0.25% per annum of the average daily net assets attributable to Class R shares. For the year ended January 31, 2019, the Fund paid or accrued to EVD $3,618 for Class R shares.
Pursuant to the Class R Plan, the Fund also makes payments of service fees to EVD, financial intermediaries and other persons in amounts equal to 0.25% per annum of its average daily net assets attributable to that class. Service fees paid or accrued are for personal services and/or the maintenance of shareholder accounts. They are separate and distinct from the sales commissions and distribution fees payable to EVD. Service fees paid or accrued for the year ended January 31, 2019 amounted to $3,618 for Class R shares.
Distribution and service fees are subject to the limitations contained in the Financial Industry Regulatory Authority Rule 2341(d).
Parametric
International Equity Fund
January 31, 2019
Notes to Financial Statements — continued
5 Purchases and Sales of Investments
Purchases and sales of investments, other than short-term obligations, aggregated $155,874,171 and $75,688,847, respectively, for the year ended January 31, 2019.
6 Shares of Beneficial Interest
The Fund’s Declaration of Trust permits the Trustees to issue an unlimited number of full and fractional shares of beneficial interest (without par value). Such shares may be issued in a number of different series (such as the Fund) and classes. Transactions in Fund shares were as follows:
| | | | | | | | |
| | | Year Ended January 31, | |
| Investor Class | | 2019 | | | 2018 | |
| | |
Sales | | | 3,305,438 | | | | 2,564,884 | |
| | |
Issued to shareholders electing to receive payments of distributions in Fund shares | | | 136,439 | | | | 84,844 | |
| | |
Redemptions | | | (2,432,842 | ) | | | (1,449,992 | ) |
| | |
Net increase | | | 1,009,035 | | | | 1,199,736 | |
| |
| | | Year Ended January 31, | |
| Institutional Class | | 2019 | | | 2018 | |
| | |
Sales | | | 8,991,953 | | | | 2,743,459 | |
| | |
Issued to shareholders electing to receive payments of distributions in Fund shares | | | 285,209 | | | | 130,848 | |
| | |
Redemptions | | | (3,294,832 | ) | | | (1,640,319 | ) |
| | |
Net increase | | | 5,982,330 | | | | 1,233,988 | |
| |
| | | Year Ended January 31, | |
| Class R | | 2019 | | | 2018 | |
| | |
Sales | | | 189,290 | | | | 38,290 | |
| | |
Issued to shareholders electing to receive payments of distributions in Fund shares | | | 3,620 | | | | 1,895 | |
| | |
Redemptions | | | (119,318 | ) | | | (26,742 | ) |
| | |
Net increase | | | 73,592 | | | | 13,443 | |
| |
| | | Year Ended January 31, | |
| Class R6 | | 2019 | | | 2018 | |
| | |
Sales | | | 2,048,683 | | | | 3,754,669 | |
| | |
Issued to shareholders electing to receive payments of distributions in Fund shares | | | 219,111 | | | | 161,160 | |
| | |
Redemptions | | | (2,600,467 | ) | | | (3,643,473 | ) |
| | |
Net increase (decrease) | | | (332,673 | ) | | | 272,356 | |
At January 31, 2019, donor advised and pooled income funds (established and maintained by a public charity) managed by EVM owned in the aggregate 14.5% of the value of the outstanding shares of the Fund.
Parametric
International Equity Fund
January 31, 2019
Notes to Financial Statements — continued
7 Line of Credit
The Fund participates with other portfolios and funds managed by EVM and its affiliates in a $625 million unsecured line of credit agreement with a group of banks, which is in effect through October 29, 2019. Borrowings are made by the Fund solely to facilitate the handling of unusual and/or unanticipated short-term cash requirements. Interest is charged to the Fund based on its borrowings at an amount above either the Eurodollar rate or Federal Funds rate. In addition, a fee computed at an annual rate of 0.15% on the daily unused portion of the line of credit is allocated among the participating portfolios and funds at the end of each quarter. Because the line of credit is not available exclusively to the Fund, it may be unable to borrow some or all of its requested amounts at any particular time. The Fund did not have any significant borrowings or allocated fees during the year ended January 31, 2019.
8 Risks Associated with Foreign Investments
Investing in securities issued by companies whose principal business activities are outside the United States may involve significant risks not present in domestic investments. For example, there is generally less publicly available information about foreign companies, particularly those not subject to the disclosure and reporting requirements of the U.S. securities laws. Certain foreign issuers are generally not bound by uniform accounting, auditing, and financial reporting requirements and standards of practice comparable to those applicable to domestic issuers. Investments in foreign securities also involve the risk of possible adverse changes in investment or exchange control regulations, expropriation or confiscatory taxation, limitation on the removal of funds or other assets of the Fund, political or financial instability or diplomatic and other developments which could affect such investments. Foreign securities markets, while growing in volume and sophistication, are generally not as developed as those in the United States, and securities of some foreign issuers (particularly those located in developing countries) may be less liquid and more volatile than securities of comparable U.S. companies. In general, there is less overall governmental supervision and regulation of foreign securities markets, broker/dealers and issuers than in the United States.
9 Fair Value Measurements
Under generally accepted accounting principles for fair value measurements, a three-tier hierarchy to prioritize the assumptions, referred to as inputs, is used in valuation techniques to measure fair value. The three-tier hierarchy of inputs is summarized in the three broad levels listed below.
| • | | Level 1 – quoted prices in active markets for identical investments |
| • | | Level 2 – other significant observable inputs (including quoted prices for similar investments, interest rates, prepayment speeds, credit risk, etc.) |
| • | | Level 3 – significant unobservable inputs (including a fund’s own assumptions in determining the fair value of investments) |
In cases where the inputs used to measure fair value fall in different levels of the fair value hierarchy, the level disclosed is determined based on the lowest level input that is significant to the fair value measurement in its entirety. The inputs or methodology used for valuing securities are not necessarily an indication of the risk associated with investing in those securities.
At January 31, 2019, the hierarchy of inputs used in valuing the Fund’s investments, which are carried at value, were as follows:
| | | | | | | | | | | | | | | | |
| Asset Description | | Level 1 | | | Level 2 | | | Level 3* | | | Total | |
| | | | |
Common Stocks | | | | | | | | | | | | | | | | |
| | | | |
Asia/Pacific | | $ | 2,529,048 | | | $ | 89,307,346 | | | $ | 26,555 | | | $ | 91,862,949 | |
| | | | |
Developed Europe | | | 4,398,250 | | | | 201,691,123 | | | | — | | | | 206,089,373 | |
| | | | |
Developed Middle East | | | 1,312,972 | | | | 5,579,190 | | | | — | | | | 6,892,162 | |
| | | | |
Total Common Stocks | | $ | 8,240,270 | | | $ | 296,577,659 | ** | | $ | 26,555 | | | $ | 304,844,484 | |
| | | | |
Rights | | $ | — | | | $ | 1,724 | | | $ | 0 | | | $ | 1,724 | |
| | | | |
Warrants | | | — | | | | 0 | | | | — | | | | 0 | |
| | | | |
Short-Term Investments | | | — | | | | 2,447,022 | | | | — | | | | 2,447,022 | |
| | | | |
Total Investments | | $ | 8,240,270 | | | $ | 299,026,405 | | | $ | 26,555 | | | $ | 307,293,230 | |
| * | None of the unobservable inputs for Level 3 assets, individually or collectively, had a material impact on the Fund. |
| ** | Includes foreign equity securities whose values were adjusted to reflect market trading of comparable securities or other correlated instruments that occurred after the close of trading in their applicable foreign markets. |
Level 3 investments at the beginning and/or end of the period in relation to net assets were not significant and accordingly, a reconciliation of Level 3 assets for the year ended January 31, 2019 is not presented.
Parametric
International Equity Fund
January 31, 2019
Report of Independent Registered Public Accounting Firm
To the Trustees of Eaton Vance Mutual Funds Trust and Shareholders of Parametric International Equity Fund:
Opinion on the Financial Statements and Financial Highlights
We have audited the accompanying statement of assets and liabilities of Parametric International Equity Fund (the “Fund”) (one of the funds constituting Eaton Vance Mutual Funds Trust), including the portfolio of investments, as of January 31, 2019, the related statement of operations for the year then ended, the statements of changes in net assets for each of the two years in the period then ended, the financial highlights for each of the five years in the period then ended, and the related notes. In our opinion, the financial statements and financial highlights present fairly, in all material respects, the financial position of the Fund as of January 31, 2019, and the results of its operations for the year then ended, the changes in its net assets for each of the two years in the period then ended, and the financial highlights for each of the five years in the period then ended, in conformity with accounting principles generally accepted in the United States of America.
Basis for Opinion
These financial statements and financial highlights are the responsibility of the Fund’s management. Our responsibility is to express an opinion on the Fund’s financial statements and financial highlights based on our audits. We are a public accounting firm registered with the Public Company Accounting Oversight Board (United States) (PCAOB) and are required to be independent with respect to the Fund in accordance with the U.S. federal securities laws and the applicable rules and regulations of the Securities and Exchange Commission and the PCAOB.
We conducted our audits in accordance with the standards of the PCAOB. Those standards require that we plan and perform the audit to obtain reasonable assurance about whether the financial statements and financial highlights are free of material misstatement, whether due to error or fraud. The Fund is not required to have, nor were we engaged to perform, an audit of its internal control over financial reporting. As part of our audits we are required to obtain an understanding of internal control over financial reporting but not for the purpose of expressing an opinion on the effectiveness of the Fund’s internal control over financial reporting. Accordingly, we express no such opinion.
Our audits included performing procedures to assess the risks of material misstatement of the financial statements and financial highlights, whether due to error or fraud, and performing procedures that respond to those risks. Such procedures included examining, on a test basis, evidence regarding the amounts and disclosures in the financial statements and financial highlights. Our audits also included evaluating the accounting principles used and significant estimates made by management, as well as evaluating the overall presentation of the financial statements and financial highlights. Our procedures included confirmation of securities owned as of January 31, 2019, by correspondence with the custodian and brokers; when replies were not received from brokers, we performed other auditing procedures. We believe that our audits provide a reasonable basis for our opinion.
/s/ Deloitte & Touche LLP
Boston, Massachusetts
March 21, 2019
We have served as the auditor of one or more Eaton Vance investment companies since 1959.
Parametric
International Equity Fund
January 31, 2019
Federal Tax Information (Unaudited)
The Form 1099-DIV you receive in February 2020 will show the tax status of all distributions paid to your account in calendar year 2019. Shareholders are advised to consult their own tax adviser with respect to the tax consequences of their investment in the Fund. As required by the Internal Revenue Code and/or regulations, shareholders must be notified regarding the status of qualified dividend income for individuals, the foreign tax credit and capital gains dividends.
Qualified Dividend Income. For the fiscal year ended January 31, 2019, the Fund designates approximately $7,261,163, or up to the maximum amount of such dividends allowable pursuant to the Internal Revenue Code, as qualified dividend income eligible for the reduced tax rate of 15%.
Foreign Tax Credit. For the fiscal year ended January 31, 2019, the Fund paid foreign taxes of $795,171 and recognized foreign source income of $8,519,698.
Capital Gains Dividends. The Fund hereby designates as a capital gain dividend with respect to the taxable year ended January 31, 2019, $987,904 or, if subsequently determined to be different, the net capital gain of such year.
Parametric
International Equity Fund
January 31, 2019
Special Meeting of Shareholders (Unaudited)
The Fund held a Special Meeting of Shareholders on September 20, 2018 to elect the five Trustees listed below. The other Trustees named herein continue to serve as Trustees. The results of the vote with respect to the Fund were as follows:
| | | | | | | | |
| | | Number of Shares | |
| Nominee for Trustee | | For | | | Withheld | |
| | |
Mark R. Fetting | | | 9,544,524 | | | | 75,771 | |
| | |
Keith Quinton | | | 9,395,667 | | | | 224,628 | |
| | |
Marcus L. Smith | | | 9,544,524 | | | | 75,771 | |
| | |
Susan J. Sutherland | | | 9,544,524 | | | | 75,771 | |
| | |
Scott E. Wennerholm | | | 9,544,524 | | | | 75,771 | |
Results are rounded to the nearest whole number.
Parametric
International Equity Fund
January 31, 2019
Management and Organization
Fund Management. The Trustees of Eaton Vance Mutual Funds Trust (the Trust) are responsible for the overall management and supervision of the Trust’s affairs. The Trustees and officers of the Trust are listed below. Except as indicated, each individual has held the office shown or other offices in the same company for the last five years. Trustees and officers of the Trust hold indefinite terms of office. The “noninterested Trustees” consist of those Trustees who are not “interested persons” of the Trust, as that term is defined under the 1940 Act. The business address of each Trustee and officer is Two International Place, Boston, Massachusetts 02110. As used below, “EVC” refers to Eaton Vance Corp., “EV” refers to Eaton Vance, Inc., “EVM” refers to Eaton Vance Management, “BMR” refers to Boston Management and Research and “EVD” refers to Eaton Vance Distributors, Inc. EVC and EV are the corporate parent and trustee, respectively, of EVM and BMR. EVD is the Fund’s principal underwriter and a wholly-owned subsidiary of EVC. Each officer affiliated with Eaton Vance may hold a position with other Eaton Vance affiliates that is comparable to his or her position with EVM listed below. Each Trustee oversees 175 portfolios in the Eaton Vance Complex (including all master and feeder funds in a master feeder structure). Each officer serves as an officer of certain other Eaton Vance funds. Each Trustee and officer serves until his or her successor is elected.
| | | | | | |
| Name and Year of Birth | | Position(s)
with the
Trust | | Trustee
Since(1) | | Principal Occupation(s) and Directorships
During Past Five Years and Other Relevant Experience |
|
| Interested Trustee |
| | | |
Thomas E. Faust Jr. 1958 | | Trustee | | 2007 | | Chairman, Chief Executive Officer and President of EVC, Director and President of EV, Chief Executive Officer and President of EVM and BMR, and Director of EVD. Trustee and/or officer of 175 registered investment companies. Mr. Faust is an interested person because of his positions with EVM, BMR, EVD, EVC and EV, which are affiliates of the Trust. Directorships in the Last Five Years.(2) Director of EVC and Hexavest Inc. (investment management firm). |
|
| Noninterested Trustees |
| | | |
Mark R. Fetting 1954 | | Trustee | | 2016 | | Private investor. Formerly held various positions at Legg Mason, Inc. (investment management firm) (2000-2012), including President, Chief Executive Officer, Director and Chairman (2008-2012), Senior Executive Vice President(2004-2008) and Executive Vice President (2001-2004). Formerly, President of Legg Mason family of funds (2001-2008). Formerly, Division President and Senior Officer of Prudential Financial Group, Inc. and related companies (investment management firm)(1991-2000). Directorships in the Last Five Years. None. |
| | | |
Cynthia E. Frost 1961 | | Trustee | | 2014 | | Private investor. Formerly, Chief Investment Officer of Brown University (university endowment) (2000-2012). Formerly, Portfolio Strategist for Duke Management Company (university endowment manager) (1995-2000). Formerly, Managing Director, Cambridge Associates (investment consulting company) (1989-1995). Formerly, Consultant, Bain and Company (management consulting firm)(1987-1989). Formerly, Senior Equity Analyst, BA Investment Management Company (1983-1985). Directorships in the Last Five Years. None. |
| | | |
George J. Gorman 1952 | | Trustee | | 2014 | | Principal at George J. Gorman LLC (consulting firm). Formerly, Senior Partner at Ernst & Young LLP (a registered public accounting firm) (1974-2009). Directorships in the Last Five Years. Formerly, Trustee of the BofA Funds Series Trust (11 funds) (2011-2014) and of the Ashmore Funds (9 funds) (2010-2014). |
| | | |
Valerie A. Mosley 1960 | | Trustee | | 2014 | | Chairwoman and Chief Executive Officer of Valmo Ventures (a consulting and investment firm). Former Partner and Senior Vice President, Portfolio Manager and Investment Strategist at Wellington Management Company, LLP (investment management firm)(1992-2012). Former Chief Investment Officer, PG Corbin Asset Management (1990-1992). Formerly worked in institutional corporate bond sales at Kidder Peabody (1986-1990). Directorships in the Last Five Years.(2) Director of Envestnet, Inc. (provider of intelligent systems for wealth management and financial wellness) (since 2018). |
| | | |
William H. Park 1947 | | Chairperson of the Board and Trustee | | 2016 (Chairperson) 2003 (Trustee) | | Private investor. Formerly, Consultant (management and transactional)(2012-2014). Formerly, Chief Financial Officer, Aveon Group L.P. (investment management firm)(2010-2011). Formerly, Vice Chairman, Commercial Industrial Finance Corp. (specialty finance company) (2006-2010). Formerly, President and Chief Executive Officer, Prizm Capital Management, LLC (investment management firm) (2002-2005). Formerly, Executive Vice President and Chief Financial Officer, United Asset Management Corporation (investment management firm) (1982-2001). Formerly, Senior Manager, Price Waterhouse (now PricewaterhouseCoopers) (a registered public accounting firm)(1972-1981). Directorships in the Last Five Years.(2) None. |
Parametric
International Equity Fund
January 31, 2019
Management and Organization — continued
| | | | | | |
| Name and Year of Birth | | Position(s)
with the
Trust | | Trustee
Since(1) | | Principal Occupation(s) and Directorships
During Past Five Years and Other Relevant Experience |
|
| Noninterested Trustees (continued) |
| | | |
Helen Frame Peters 1948 | | Trustee | | 2008 | | Professor of Finance, Carroll School of Management, Boston College. Formerly, Dean, Carroll School of Management, Boston College (2000-2002). Formerly, Chief Investment Officer, Fixed Income, Scudder Kemper Investments (investment management firm)(1998-1999). Formerly, Chief Investment Officer, Equity and Fixed Income, Colonial Management Associates (investment management firm) (1991-1998). Directorships in the Last Five Years.(2) None. |
| | | |
Keith Quinton(3) 1958 | | Trustee | | 2018 | | Independent Investment Committee Member at New Hampshire Retirement System (since 2017). Advisory Committee member at Northfield Information Services, Inc. (risk management analytics provider) (since 2016). Formerly, Portfolio Manager and Senior Quantitative Analyst at Fidelity Investments (investment management firm)(2001-2014). Directorships in the Last Five Years. Director of New Hampshire Municipal Bond Bank (since 2016). |
| | | |
Marcus L. Smith(3) 1966 | | Trustee | | 2018 | | Member of Posse Boston Advisory Board (foundation) (since 2015); Trustee at University of Mount Union (since 2008). Formerly, Portfolio Manager at MFS Investment Management (investment management firm) (1994-2017). Directorships in the Last Five Years. Director of MSCI Inc. (global provider of investment decision support tools) (since 2017). Director of DCT Industrial Trust Inc. (logistics real estate company) (since 2017). |
| | | |
Susan J. Sutherland 1957 | | Trustee | | 2015 | | Private investor. Formerly, Associate, Counsel and Partner at Skadden, Arps, Slate, Meagher & Flom LLP (law firm) (1982-2013). Directorships in the Last Five Years. Formerly, Director of Montpelier Re Holdings Ltd. (global provider of customized insurance and reinsurance products) (2013-2015). |
| | | |
Scott E. Wennerholm 1959 | | Trustee | | 2016 | | Formerly, Trustee at Wheelock College (postsecondary institution) (2012-2018). Formerly, Consultant at GF Parish Group (executive recruiting firm) (2016-2017). Formerly, Chief Operating Officer and Executive Vice President at BNY Mellon Asset Management (investment management firm) (2005-2011). Formerly, Chief Operating Officer and Chief Financial Officer at Natixis Global Asset Management (investment management firm) (1997-2004). Formerly, Vice President at Fidelity Investments Institutional Services (investment management firm) (1994-1997). Directorships in the Last Five Years. None. |
| | | | | | |
| Name and Year of Birth | | Position(s)
with the
Trust | | Officer
Since(4) | | Principal Occupation(s)
During Past Five Years |
|
| Principal Officers who are not Trustees |
| | | |
Payson F. Swaffield 1956 | | President | | 2003 | | Vice President and Chief Income Investment Officer of EVM and BMR. Also Vice President of Calvert Research and Management (“CRM”). |
| | | |
Maureen A. Gemma 1960 | | Vice President, Secretary and Chief Legal Officer | | 2005 | | Vice President of EVM and BMR. Also Vice President and officer of CRM. |
| | | |
James F. Kirchner 1967 | | Treasurer | | 2007 | | Vice President of EVM and BMR. Also Vice President and officer of CRM. |
| | | |
Richard F. Froio 1968 | | Chief Compliance Officer | | 2017 | | Vice President of EVM and BMR since 2017. Formerly Deputy Chief Compliance Officer (Adviser/Funds) and Chief Compliance Officer (Distribution) at PIMCO (2012-2017) and Managing Director at BlackRock/Barclays Global Investors (2009-2012). |
| (1) | Year first appointed to serve as Trustee for a fund in the Eaton Vance family of funds. Each Trustee has served continuously since appointment unless indicated otherwise. |
| (2) | During their respective tenures, the Trustees (except for Mmes. Frost and Sutherland and Messrs. Fetting, Gorman, Quinton, Smith and Wennerholm) also served as Board members of one or more of the following funds (which operated in the years noted): eUnitsTM 2 Year U.S. Market Participation Trust: Upside to Cap / Buffered Downside (launched in 2012 and terminated in 2014); and eUnitsTM 2 Year U.S. Market Participation Trust II: Upside to Cap / Buffered Downside (launched in 2012 and terminated in 2014). However, Ms. Mosley did not serve as a Board member of eUnitsTM 2 Year U.S. Market Participation Trust: Upside to Cap / Buffered Downside (launched in 2012 and terminated in 2014). |
Parametric
International Equity Fund
January 31, 2019
Management and Organization — continued
| (3) | Messrs. Quinton and Smith began serving as Trustees effective October 1, 2018. |
| (4) | Year first elected to serve as officer of a fund in the Eaton Vance family of funds when the officer has served continuously. Otherwise, year of most recent election as an officer of a fund in the Eaton Vance family of funds. Titles may have changed since initial election. |
The SAI for the Fund includes additional information about the Trustees and officers of the Fund and can be obtained without charge on Eaton Vance’s website at www.eatonvance.com or by calling 1-800-260-0761.
Eaton Vance Funds
IMPORTANT NOTICES
Privacy. The Eaton Vance organization is committed to ensuring your financial privacy. Each of the financial institutions identified below has in effect the following policy (“Privacy Policy”) with respect to nonpublic personal information about its customers:
| • | | Only such information received from you, through application forms or otherwise, and information about your Eaton Vance fund transactions will be collected. This may include information such as name, address, social security number, tax status, account balances and transactions. |
| • | | None of such information about you (or former customers) will be disclosed to anyone, except as permitted by law (which includes disclosure to employees necessary to service your account). In the normal course of servicing a customer’s account, Eaton Vance may share information with unaffiliated third parties that perform various required services such as transfer agents, custodians and broker-dealers. |
| • | | Policies and procedures (including physical, electronic and procedural safeguards) are in place that are designed to protect the confidentiality of such information. |
| • | | We reserve the right to change our Privacy Policy at any time upon proper notification to you. Customers may want to review our Privacy Policy periodically for changes by accessing the link on our homepage: www.eatonvance.com. |
Our pledge of privacy applies to the following entities within the Eaton Vance organization: the Eaton Vance Family of Funds, Eaton Vance Management, Eaton Vance Investment Counsel, Eaton Vance Distributors, Inc., Eaton Vance Trust Company, Eaton Vance Management (International) Limited, Eaton Vance Advisers International Ltd., Eaton Vance Management’s Real Estate Investment Group and Boston Management and Research. In addition, our Privacy Policy applies only to those Eaton Vance customers who are individuals and who have a direct relationship with us. If a customer’s account (i.e., fund shares) is held in the name of a third-party financial advisor/broker-dealer, it is likely that only such advisor’s privacy policies apply to the customer. This notice supersedes all previously issued privacy disclosures. For more information about Eaton Vance’s Privacy Policy, please call 1-800-262-1122.
Delivery of Shareholder Documents. The Securities and Exchange Commission (SEC) permits funds to deliver only one copy of shareholder documents, including prospectuses, proxy statements and shareholder reports, to fund investors with multiple accounts at the same residential or post office box address. This practice is often called “householding” and it helps eliminate duplicate mailings to shareholders.Eaton Vance, or your financial advisor, may household the mailing of your documents indefinitely unless you instruct Eaton Vance, or your financial advisor, otherwise.If you would prefer that your Eaton Vance documents not be householded, please contact Eaton Vance at 1-800-260-0761, or contact your financial advisor. Your instructions that householding not apply to delivery of your Eaton Vance documents will typically be effective within 30 days of receipt by Eaton Vance or your financial advisor.
Portfolio Holdings. Each Eaton Vance Fund and its underlying Portfolio(s) (if applicable) will file a schedule of portfolio holdings on Form N-Q with the SEC for the first and third quarters of each fiscal year. The Form N-Q will be available on the Eaton Vance website at www.eatonvance.com, by calling Eaton Vance at 1-800-260-0761 or in the EDGAR database on the SEC’s website at www.sec.gov. Form N-Q may also be reviewed and copied at the SEC’s public reference room in Washington, D.C. (call 1-800-732-0330 for information on the operation of the public reference room).
Proxy Voting. From time to time, funds are required to vote proxies related to the securities held by the funds. The Eaton Vance Funds or their underlying Portfolios (if applicable) vote proxies according to a set of policies and procedures approved by the Funds’ and Portfolios’ Boards. You may obtain a description of these policies and procedures and information on how the Funds or Portfolios voted proxies relating to portfolio securities during the most recent 12-month period ended June 30, without charge, upon request, by calling 1-800-260-0761 and by accessing the SEC’s website at www.sec.gov.
This Page Intentionally Left Blank
Investment Adviser and Administrator
Eaton Vance Management
Two International Place
Boston, MA 02110
Investment Sub-Adviser
Parametric Portfolio Associates LLC
1918 Eighth Avenue, Suite 3100
Seattle, WA 98101
Principal Underwriter*
Eaton Vance Distributors, Inc.
Two International Place
Boston, MA 02110
(617) 482-8260
Custodian
State Street Bank and Trust Company
State Street Financial Center, One Lincoln Street
Boston, MA 02111
Transfer Agent
BNY Mellon Investment Servicing (US) Inc.
Attn: Eaton Vance Funds
P.O. Box 9653
Providence, RI 02940-9653
(800) 260-0761
Independent Registered Public Accounting Firm
Deloitte & Touche LLP
200 Berkeley Street
Boston, MA 02116-5022
Fund Offices
Two International Place
Boston, MA 02110
| * | FINRA BrokerCheck. Investors may check the background of their Investment Professional by contacting the Financial Industry Regulatory Authority (FINRA). FINRA BrokerCheck is a free tool to help investors check the professional background of current and former FINRA-registered securities firms and brokers. FINRA BrokerCheck is available by calling 1-800-289-9999 and at www.FINRA.org. The FINRA BrokerCheck brochure describing this program is available to investors at www.FINRA.org. |

4736 1.31.19

Parametric
Volatility Risk Premium - Defensive Fund
Annual Report
January 31, 2019
Important Note. Beginning on January 1, 2021, as permitted by regulations adopted by the Securities and Exchange Commission, paper copies of the Fund’s annual and semi-annual shareholder reports will no longer be sent by mail unless you specifically request paper copies of the reports. Instead, the reports will be made available on the Fund’s website (eatonvance.com/ppafunddocuments), and you will be notified by mail each time a report is posted and provided with a website address to access the report.
If you already elected to receive shareholder reports electronically, you will not be affected by this change and you need not take any action. If you are a direct investor, you may elect to receive shareholder reports and other communications from the Fund electronically by signing up for e-Delivery at eatonvance.com/edelivery. If you own your shares through a financial intermediary (such as a broker-dealer or bank), you must contact your financial intermediary to sign up.
You may elect to receive all future Fund shareholder reports in paper free of charge. If you are a direct investor, you can inform the Fund that you wish to continue receiving paper copies of your shareholder reports by calling1-800-260-0761. If you own these shares through a financial intermediary, you must contact your financial intermediary or follow instructions included with this disclosure, if applicable, to elect to continue to receive paper copies of your shareholder reports. Your election to receive reports in paper will apply to all Eaton Vance funds held directly or to all funds held through your financial intermediary, as applicable.

Commodity Futures Trading Commission Registration. Effective December 31, 2012, the Commodity Futures Trading Commission (“CFTC”) adopted certain regulatory changes that subject registered investment companies and advisers to regulation by the CFTC if a fund invests more than a prescribed level of its assets in certain CFTC-regulated instruments (including futures, certain options and swap agreements) or markets itself as providing investment exposure to such instruments. The Fund has claimed an exclusion from the definition of the term “commodity pool operator” under the Commodity Exchange Act. Accordingly, neither the Fund nor the adviser with respect to the operation of the Fund is subject to CFTC regulation. Because of its management of other strategies, the Fund’s adviser is registered with the CFTC as a commodity pool operator and a commodity trading advisor.
Fund shares are not insured by the FDIC and are not deposits or other obligations of, or guaranteed by, any depository institution. Shares are subject to investment risks, including possible loss of principal invested.
This report must be preceded or accompanied by a current summary prospectus or prospectus. Before investing, investors should consider carefully the investment objective, risks, and charges and expenses of a mutual fund. This and other important information is contained in the summary prospectus and prospectus, which can be obtained from a financial advisor. Prospective investors should read the prospectus carefully before investing. For further information, please call1-800-260-0761.
Annual ReportJanuary 31, 2019
Parametric
Volatility Risk Premium - Defensive Fund
Table of Contents
| | | | |
Management’s Discussion of Fund Performance | | | 2 | |
| |
Performance | | | 3 | |
| |
Fund Profile | | | 4 | |
| |
Endnotes and Additional Disclosures | | | 5 | |
| |
Fund Expenses | | | 6 | |
| |
Financial Statements | | | 7 | |
| |
Report of Independent Registered Public Accounting Firm | | | 22 | |
| |
Federal Tax Information | | | 23 | |
| |
Special Meeting of Shareholders | | | 24 | |
| |
Management and Organization | | | 25 | |
| |
Important Notices | | | 28 | |
Parametric
Volatility Risk Premium - Defensive Fund
January 31, 2019
Management’s Discussion of Fund Performance1
Economic and Market Conditions
For the 12-month period ended January 31, 2019, U.S. equities opened the period on an upswing as investors reacted favorably to passage of the Republican tax reform package in December 2017. Sharp cuts in corporate taxes, a key element of the bill, raised corporate-profit expectations. U.S. stocks also got a boost from positive domestic economic data.
In February 2018, however, U.S. stocks pulled back amid fears that rising interest rates might boost the appeal of fixed-income investments. After a brief rebound, equity markets again weakened in the spring of 2018 as investors confronted the prospect of a global trade war due to President Trump’s then-new tariffs, which drew retaliatory actions from impacted countries including China, Canada and certain countries in the European Union.
The volatility spike in February 2018 resulted in financial insurance repricing during the period. Increased insurance premiums and deductibles resulted in wider strike prices and a more profitable environment in the second and third calendar quarters of 2018 for option sellers. Despite rising rhetoric over international tariffs, trade wars and border walls, U.S. equities rallied from April to September 2018, even as non-U.S. stocks declined.
But widening credit spreads and a flattening yield curve6 signaled serious concerns. Though October 2018 started with the lowest U.S. unemployment rate — 3.7% — since the late 1960s, the S&P 500® Index2 dropped 6%, followed by two additional big volatility repricing events.
The second half of 2018 represented the “best and worst of times.” The third quarter was the best in five years for the S&P 500® Index — and the fourth quarter was the worst in seven years. After hitting record lows in 2017, the average Cboe Volatility Index® (VIX® Index) price in 2018 was higher than the highest closing price in all of 2017. As the volatility regime shifted, the average implied volatility (IV) to realized volatility (RV) spread (IV-RV spread) was much narrower in 2018 — at 1.0 volatility point — compared to the average 4.2 volatility points since 1990. IV represents the market price of volatility or the volatility implied by the option price, and RV is the subsequent realized or actual volatility. Capturing a volatility risk premium relies on a positive IV-RV spread rather than the absolute level of volatility.
Fund Performance
For the 12-month period ended January 31, 2019, Parametric Volatility Risk Premium – Defensive Fund (the Fund) returned –0.55% for Institutional Class shares at net asset value (NAV), outperforming its primary benchmark, the Cboe S&P 500 BuyWrite IndexSM (the Index), which returned –2.43%. The Fund underperformed its secondary benchmark — a custom index consisting of 50% S&P 500® Index / 50% ICE BofAML 3-Month U.S. Treasury Bill Index (the Secondary Index) — which returned of 0.11% during the period.
The Fund’s investment strategy is to structurally de-risk the portfolio by holding a base portfolio of 50% equity and 50% cash-equivalents, and to write out-of-the money equity index calls and puts to enhance returns by harvesting the volatility risk premium (VRP). The VRP is the difference between implied volatility and subsequently realized volatility, and is historically positive and uncorrelated with other sources of returns.
The Index is a passive covered call-writing index. The Fund outperformed the passive options-writing Index by 1.88% during the period. While equities tumbled –2.31% as measured by the S&P 500® Index, the structurally de-risked portfolio benefited from the allocation to Treasury bills and written options to capture the VRP.
The Fund’s options strategy — consisting of the systematic sale of out-of-the-money options — detracted modestly from returns. The blend of put and call options was beneficial to the options strategy given the volatility spikes in February, October and December 2018. The written calls added to returns but the puts detracted from returns. Taken together, the net losses from puts outweighed the net profits on calls.
The Fund’s common stock portfolio underperformed the S&P 500® Index and detracted from returns relative to the Secondary Index. The underperformance was due to security selections among the mega-cap companies represented by the S&P 500® Index. As a reminder, the stock portfolio is passively managed to approximate the S&P 500® Index, but is actively managed to mitigate tax impact. Sampling techniques are used to help mitigate the tax impact on investors, and no capital gains were distributed to Fund investors in 2018.
The Fund’s deliberate and disciplined approach provided important capital protection during the most treacherous market since the global financial crisis.
See Endnotes and Additional Disclosures in this report.
Past performance is no guarantee of future results. Returns are historical and are calculated by determining the percentage change in net asset value (NAV) or offering price (as applicable) with all distributions reinvested. Investment return and principal value will fluctuate so that shares, when redeemed, may be worth more or less than their original cost. Performance less than or equal to one year is cumulative. Performance is for the stated time period only; due to market volatility, the Fund’s current performance may be lower or higher than quoted. Returns are before taxes unless otherwise noted. For performance as of the most recentmonth-end, please refer to eatonvance.com.
Parametric
Volatility Risk Premium - Defensive Fund
January 31, 2019
Performance2,3
Portfolio Managers Thomas Seto, Thomas B. Lee, CFA and Jay Strohmaier, CFA, each of Parametric Portfolio Associates LLC
| | | | | | | | | | | | | | | | | | | | |
| % Average Annual Total Returns | | Class Inception Date | | | Performance Inception Date | | | One Year | | | Five Years | | | Since
Inception | |
Institutional Class at NAV | | | 02/09/2017 | | | | 02/09/2017 | | | | –0.55 | % | | | — | | | | 5.03 | % |
Cboe S&P 500 BuyWrite IndexSM | | | — | | | | — | | | | –2.43 | % | | | 6.21 | % | | | 4.01 | % |
Blended Index | | | — | | | | — | | | | 0.11 | | | | 5.86 | | | | 6.10 | |
| | | | | |
| | | | | | | | | | | | | | | | | | | | |
| % Total Annual Operating Expense Ratios4 | | | | | | | | | | | | | | Institutional Class | |
Gross | | | | | | | | | | | | | | | | | | | 0.63 | % |
Net | | | | | | | | | | | | | | | | | | | 0.55 | |
Growth of $50,000
This graph shows the change in value of a hypothetical investment of $50,000 in Institutional Class of the Fund for the period indicated. For comparison, the same investment is shown in the indicated index.
See Endnotes and Additional Disclosures in this report.
Past performance is no guarantee of future results. Returns are historical and are calculated by determining the percentage change in net asset value (NAV) or offering price (as applicable) with all distributions reinvested. Investment return and principal value will fluctuate so that shares, when redeemed, may be worth more or less than their original cost. Performance less than or equal to one year is cumulative. Performance is for the stated time period only; due to market volatility, the Fund’s current performance may be lower or higher than quoted. Returns are before taxes unless otherwise noted. For performance as of the most recentmonth-end, please refer to eatonvance.com.
Parametric
Volatility Risk Premium - Defensive Fund
January 31, 2019
Fund Profile
Common Stock Sector Allocation (% of net assets)
Top 10 Holdings (% of net assets)5
| | | | |
| |
Microsoft Corp. | | | 1.9 | % |
| |
Apple, Inc. | | | 1.8 | |
| |
Amazon.com, Inc. | | | 1.7 | |
| |
Berkshire Hathaway, Inc., Class B | | | 1.0 | |
| |
Facebook, Inc., Class A | | | 1.0 | |
| |
JPMorgan Chase & Co. | | | 0.9 | |
| |
Johnson & Johnson | | | 0.9 | |
| |
Exxon Mobil Corp. | | | 0.8 | |
| |
Alphabet, Inc., Class C | | | 0.8 | |
| |
Alphabet, Inc., Class A | | | 0.8 | |
| |
Total | | | 11.6 | % |
Asset Allocation (% of total investments)
See Endnotes and Additional Disclosures in this report.
Parametric
Volatility Risk Premium - Defensive Fund
January 31, 2019
Endnotes and Additional Disclosures
| 1 | The views expressed in this report are those of the portfolio manager(s) and are current only through the date stated at the top of this page. These views are subject to change at any time based upon market or other conditions, and Eaton Vance and the Fund(s) disclaim any responsibility to update such views. These views may not be relied upon as investment advice and, because investment decisions are based on many factors, may not be relied upon as an indication of trading intent on behalf of any Eaton Vance fund. This commentary may contain statements that are not historical facts, referred to as “forward looking statements.” The Fund’s actual future results may differ significantly from those stated in any forward looking statement, depending on factors such as changes in securities or financial markets or general economic conditions, the volume of sales and purchases of Fund shares, the continuation of investment advisory, administrative and service contracts, and other risks discussed from time to time in the Fund’s filings with the Securities and Exchange Commission. |
| 2 | S&P 500® Index is an unmanaged index of large-cap stocks commonly used as a measure of U.S. stock market performance. Cboe Volatility Index® tracks the implied volatilities of a wide range of S&P 500® Index options. Cboe S&P 500 BuyWrite IndexSM measures the performance of a hypothetical buy-write strategy on the S&P 500® Index. ICE BofAML 3-Month U.S. Treasury Bill Index is an unmanaged index of U.S. Treasury securities maturing in 90 days. ICE® BofAML® indices are not for redistribution or other uses; provided “as is”, without warranties, and with no liability. Eaton Vance has prepared this report and ICE Data Indices, LLC does not endorse it, or guarantee, review, or endorse Eaton Vance’s products. BofAML® is a licensed registered trademark of Bank of America Corporation in the United States and other countries. The Blended Index consists of 50% S&P 500® Index and 50% ICE BofAML 3-Month U.S. Treasury Bill Index. Unless otherwise stated, index returns do not reflect the effect of any applicable sales charges, commissions, expenses, taxes or leverage, as applicable. It is not possible to invest directly in an index. |
| 3 | Returns are historical and are calculated by determining the percentage change in NAV with all distributions reinvested. Unless otherwise stated, performance does not reflect the deduction of taxes on Fund distributions or redemptions of Fund shares. Performance since inception for an index, if presented, is the performance since the Fund’s or oldest share class’ inception, as applicable. |
| 4 | Source: Fund prospectus. Net expense ratios reflect a contractual expense reimbursement that continues through 5/31/19. Without the reimbursement, performance would have been lower. The expense ratios for the current reporting period can be found in the Financial Highlights section of this report. |
| 5 | Depictions do not reflect the Fund’s option positions. Excludes short-term investments. |
| 6 | Yield curve is a graphical representation of the yields offered by bonds of various maturities. The yield curve flattens when long- term rates fall and/or short-term rates increase, and the yield curve steepens when long-term rates increase and/or short-term rates fall. |
| | Fund profile subject to change due to active management. |
Parametric
Volatility Risk Premium - Defensive Fund
January 31, 2019
Fund Expenses
Example: As a Fund shareholder, you incur two types of costs: (1) transaction costs, including sales charges (loads) on purchases and redemption fees (if applicable); and (2) ongoing costs, including management fees; distribution and/or service fees; and other Fund expenses. This Example is intended to help you understand your ongoing costs (in dollars) of Fund investing and to compare these costs with the ongoing costs of investing in other mutual funds. The Example is based on an investment of $1,000 invested at the beginning of the period and held for the entire period (August 1, 2018 – January 31, 2019).
Actual Expenses: The first section of the table below provides information about actual account values and actual expenses. You may use the information in this section, together with the amount you invested, to estimate the expenses that you paid over the period. Simply divide your account value by $1,000 (for example, an $8,600 account value divided by $1,000 = 8.6), then multiply the result by the number in the first section under the heading entitled “Expenses Paid During Period” to estimate the expenses you paid on your account during this period.
Hypothetical Example for Comparison Purposes: The second section of the table below provides information about hypothetical account values and hypothetical expenses based on the actual Fund expense ratio and an assumed rate of return of 5% per year (before expenses), which is not the actual Fund return. The hypothetical account values and expenses may not be used to estimate the actual ending account balance or expenses you paid for the period. You may use this information to compare the ongoing costs of investing in your Fund and other funds. To do so, compare this 5% hypothetical example with the 5% hypothetical examples that appear in the shareholder reports of the other funds.
Please note that the expenses shown in the table are meant to highlight your ongoing costs only and do not reflect any transactional costs, such as sales charges (loads) or redemption fees (if applicable). Therefore, the second section of the table is useful in comparing ongoing costs only, and will not help you determine the relative total costs of owning different funds. In addition, if these transactional costs were included, your costs would be higher.
| | | | | | | | | | | | | | | | |
| | | Beginning
Account Value
(8/1/18) | | | Ending
Account Value
(1/31/19) | | | Expenses Paid
During Period*
(8/1/18 – 1/31/19) | | | Annualized
Expense
Ratio | |
| | | |
Actual | | | | | | | | | | | | | |
Institutional Class | | $ | 1,000.00 | | | $ | 978.50 | | | $ | 2.54 | | | | 0.51 | % |
| | | | |
Hypothetical | | | | | | | | | | | | | |
(5% return per year before expenses) | | | | | | | | | | | | | |
Institutional Class | | $ | 1,000.00 | | | $ | 1,022.60 | | | $ | 2.60 | | | | 0.51 | % |
| * | Expenses are equal to the Fund’s annualized expense ratio for the indicated Class, multiplied by the average account value over the period, multiplied by 184/365 (to reflect theone-half year period). The Example assumes that the $1,000 was invested at the net asset value per share determined at the close of business on July 31, 2018. |
Parametric
Volatility Risk Premium - Defensive Fund
January 31, 2019
Portfolio of Investments
| | | | | | | | |
| Common Stocks — 50.8% | |
| Security | | Shares | | | Value | |
|
| Aerospace & Defense — 1.2% | |
| | |
Arconic, Inc. | | | 23,957 | | | $ | 450,871 | |
| | |
Boeing Co. (The) | | | 6,601 | | | | 2,545,478 | |
| | |
Harris Corp. | | | 4,662 | | | | 714,125 | |
| | |
Huntington Ingalls Industries, Inc. | | | 2,972 | | | | 613,569 | |
| | |
United Technologies Corp. | | | 8,558 | | | | 1,010,443 | |
| | |
| | | | | | | $ | 5,334,486 | |
|
| Air Freight & Logistics — 0.2% | |
| | |
C.H. Robinson Worldwide, Inc. | | | 4,753 | | | $ | 412,418 | |
| | |
Expeditors International of Washington, Inc. | | | 5,804 | | | | 402,217 | |
| | |
| | | | | | | $ | 814,635 | |
|
| Airlines — 0.2% | |
| | |
Alaska Air Group, Inc. | | | 6,622 | | | $ | 423,477 | |
| | |
American Airlines Group, Inc. | | | 8,361 | | | | 299,073 | |
| | |
| | | | | | | $ | 722,550 | |
|
| Auto Components — 0.1% | |
| | |
BorgWarner, Inc. | | | 12,045 | | | $ | 492,641 | |
| | |
Goodyear Tire & Rubber Co. (The) | | | 7,895 | | | | 167,295 | |
| | |
| | | | | | | $ | 659,936 | |
|
| Banks — 3.2% | |
| | |
Bank of America Corp. | | | 114,264 | | | $ | 3,253,096 | |
| | |
Citigroup, Inc. | | | 15,393 | | | | 992,233 | |
| | |
Citizens Financial Group, Inc. | | | 16,495 | | | | 559,510 | |
| | |
Fifth Third Bancorp | | | 26,275 | | | | 704,696 | |
| | |
JPMorgan Chase & Co. | | | 39,071 | | | | 4,043,849 | |
| | |
People’s United Financial, Inc. | | | 19,646 | | | | 321,801 | |
| | |
U.S. Bancorp | | | 24,584 | | | | 1,257,717 | |
| | |
Wells Fargo & Co. | | | 52,542 | | | | 2,569,829 | |
| | |
Zions BanCorp NA | | | 5,266 | | | | 250,609 | |
| | |
| | | | | | | $ | 13,953,340 | |
|
| Beverages — 1.0% | |
| | |
Brown-Forman Corp., Class B | | | 2,407 | | | $ | 113,731 | |
| | |
Coca-Cola Co. (The) | | | 44,190 | | | | 2,126,864 | |
| | |
PepsiCo, Inc. | | | 18,749 | | | | 2,112,450 | |
| | |
| | | | | | | $ | 4,353,045 | |
|
| Biotechnology — 1.5% | |
| | |
AbbVie, Inc. | | | 17,445 | | | $ | 1,400,659 | |
| | |
Amgen, Inc. | | | 9,485 | | | | 1,774,738 | |
| | | | | | | | |
| Security | | Shares | | | Value | |
|
| Biotechnology (continued) | |
| | |
Celgene Corp.(1) | | | 6,160 | | | $ | 544,914 | |
| | |
Gilead Sciences, Inc. | | | 19,071 | | | | 1,335,161 | |
| | |
Regeneron Pharmaceuticals, Inc.(1) | | | 1,944 | | | | 834,501 | |
| | |
Vertex Pharmaceuticals, Inc.(1) | | | 4,484 | | | | 856,040 | |
| | |
| | | | | | | $ | 6,746,013 | |
|
| Building Products — 0.2% | |
| | |
A.O. Smith Corp. | | | 3,943 | | | $ | 188,712 | |
| | |
Allegion PLC | | | 1,855 | | | | 159,270 | |
| | |
Fortune Brands Home & Security, Inc. | | | 9,330 | | | | 422,649 | |
| | |
| | | | | | | $ | 770,631 | |
|
| Capital Markets — 1.5% | |
| | |
Affiliated Managers Group, Inc. | | | 5,891 | | | $ | 618,260 | |
| | |
Cboe Global Markets, Inc. | | | 4,121 | | | | 384,366 | |
| | |
Charles Schwab Corp. (The) | | | 22,040 | | | | 1,030,811 | |
| | |
E*TRADE Financial Corp. | | | 11,508 | | | | 536,963 | |
| | |
Invesco Ltd. | | | 39,254 | | | | 715,208 | |
| | |
Morgan Stanley | | | 28,211 | | | | 1,193,325 | |
| | |
Nasdaq, Inc. | | | 7,421 | | | | 653,345 | |
| | |
Raymond James Financial, Inc. | | | 5,176 | | | | 416,668 | |
| | |
S&P Global, Inc. | | | 5,431 | | | | 1,040,851 | |
| | |
| | | | | | | $ | 6,589,797 | |
|
| Chemicals — 1.2% | |
| | |
Albemarle Corp. | | | 1,442 | | | $ | 116,413 | |
| | |
CF Industries Holdings, Inc. | | | 6,507 | | | | 284,031 | |
| | |
DowDuPont, Inc. | | | 34,037 | | | | 1,831,531 | |
| | |
Eastman Chemical Co. | | | 7,576 | | | | 610,777 | |
| | |
Ecolab, Inc. | | | 4,269 | | | | 675,228 | |
| | |
FMC Corp. | | | 5,124 | | | | 408,895 | |
| | |
Linde PLC | | | 1,725 | | | | 281,192 | |
| | |
Sherwin-Williams Co. (The) | | | 2,262 | | | | 953,478 | |
| | |
| | | | | | | $ | 5,161,545 | |
|
| Commercial Services & Supplies — 0.1% | |
| | |
Republic Services, Inc. | | | 6,290 | | | $ | 482,506 | |
| | |
Rollins, Inc. | | | 2,364 | | | | 88,035 | |
| | |
| | | | | | | $ | 570,541 | |
|
| Communications Equipment — 0.6% | |
| | |
Cisco Systems, Inc. | | | 53,976 | | | $ | 2,552,525 | |
| | |
| | | | | | | $ | 2,552,525 | |
| | | | |
| | 7 | | See Notes to Financial Statements. |
Parametric
Volatility Risk Premium - Defensive Fund
January 31, 2019
Portfolio of Investments — continued
| | | | | | | | |
| Security | | Shares | | | Value | |
|
| Construction & Engineering — 0.1% | |
| | |
Fluor Corp. | | | 4,133 | | | $ | 151,144 | |
| | |
Jacobs Engineering Group, Inc. | | | 4,549 | | | | 294,775 | |
| | |
Quanta Services, Inc. | | | 3,788 | | | | 133,868 | |
| | |
| | | | | | | $ | 579,787 | |
|
| Containers & Packaging — 0.2% | |
| | |
Avery Dennison Corp. | | | 3,979 | | | $ | 415,606 | |
| | |
Packaging Corp. of America | | | 3,774 | | | | 355,964 | |
| | |
Sealed Air Corp. | | | 8,112 | | | | 320,424 | |
| | |
| | | | | | | $ | 1,091,994 | |
|
| Distributors — 0.1% | |
| | |
LKQ Corp.(1) | | | 9,137 | | | $ | 239,572 | |
| | |
| | | | | | | $ | 239,572 | |
|
| Diversified Consumer Services — 0.0%(2) | |
| | |
H&R Block, Inc. | | | 6,471 | | | $ | 152,651 | |
| | |
| | | | | | | $ | 152,651 | |
|
| Diversified Financial Services — 1.2% | |
| | |
Berkshire Hathaway, Inc., Class B(1) | | | 22,334 | | | $ | 4,590,530 | |
| | |
Jefferies Financial Group, Inc. | | | 24,810 | | | | 516,296 | |
| | |
| | | | | | | $ | 5,106,826 | |
|
| Diversified Telecommunication Services — 1.1% | |
| | |
AT&T, Inc. | | | 83,986 | | | $ | 2,524,619 | |
| | |
Verizon Communications, Inc. | | | 39,417 | | | | 2,170,300 | |
| | |
| | | | | | | $ | 4,694,919 | |
|
| Electric Utilities — 0.9% | |
| | |
Alliant Energy Corp. | | | 8,824 | | | $ | 392,403 | |
| | |
Entergy Corp. | | | 6,313 | | | | 563,056 | |
| | |
Exelon Corp. | | | 19,609 | | | | 936,526 | |
| | |
NextEra Energy, Inc. | | | 8,062 | | | | 1,442,937 | |
| | |
Pinnacle West Capital Corp. | | | 5,884 | | | | 518,498 | |
| | |
| | | | | | | $ | 3,853,420 | |
|
| Electrical Equipment — 0.2% | |
| | |
Eaton Corp. PLC | | | 13,499 | | | $ | 1,029,299 | |
| | |
nVent Electric PLC | | | 2,975 | | | | 74,434 | |
| | |
| | | | | | | $ | 1,103,733 | |
| | | | | | | | |
| Security | | Shares | | | Value | |
|
| Electronic Equipment, Instruments & Components — 0.3% | |
| | |
FLIR Systems, Inc. | | | 10,664 | | | $ | 521,256 | |
| | |
TE Connectivity, Ltd. | | | 11,446 | | | | 926,554 | |
| | |
| | | | | | | $ | 1,447,810 | |
|
| Energy Equipment & Services — 0.3% | |
| | |
National Oilwell Varco, Inc. | | | 20,716 | | | $ | 610,708 | |
| | |
TechnipFMC PLC | | | 23,519 | | | | 539,996 | |
| | |
| | | | | | | $ | 1,150,704 | |
|
| Entertainment — 1.0% | |
| | |
Netflix, Inc.(1) | | | 4,575 | | | $ | 1,553,212 | |
| | |
Twenty-First Century Fox, Inc., Class B | | | 11,328 | | | | 555,752 | |
| | |
Walt Disney Co. (The) | | | 18,965 | | | | 2,114,977 | |
| | |
| | | | | | | $ | 4,223,941 | |
|
| Equity Real Estate Investment Trusts (REITs) — 1.4% | |
| | |
Alexandria Real Estate Equities, Inc. | | | 4,866 | | | $ | 640,901 | |
| | |
American Tower Corp. | | | 6,955 | | | | 1,202,102 | |
| | |
Apartment Investment & Management Co., Class A | | | 10,692 | | | | 529,468 | |
| | |
Duke Realty Corp. | | | 17,835 | | | | 521,495 | |
| | |
Essex Property Trust, Inc. | | | 2,047 | | | | 555,146 | |
| | |
Extra Space Storage, Inc. | | | 3,926 | | | | 387,143 | |
| | |
Host Hotels & Resorts, Inc. | | | 17,060 | | | | 308,104 | |
| | |
Kimco Realty Corp. | | | 16,982 | | | | 288,864 | |
| | |
Macerich Co. (The) | | | 7,031 | | | | 324,551 | |
| | |
Public Storage | | | 3,057 | | | | 649,674 | |
| | |
SL Green Realty Corp. | | | 4,690 | | | | 433,497 | |
| | |
UDR, Inc. | | | 10,043 | | | | 439,381 | |
| | |
| | | | | | | $ | 6,280,326 | |
|
| Food & Staples Retailing — 0.8% | |
| | |
Costco Wholesale Corp. | | | 4,959 | | | $ | 1,064,350 | |
| | |
Kroger Co. (The) | | | 18,737 | | | | 530,819 | |
| | |
Sysco Corp. | | | 8,910 | | | | 568,904 | |
| | |
Walmart, Inc. | | | 15,667 | | | | 1,501,369 | |
| | |
| | | | | | | $ | 3,665,442 | |
|
| Food Products — 0.5% | |
| | |
Campbell Soup Co. | | | 8,871 | | | $ | 314,299 | |
| | |
Conagra Brands, Inc. | | | 15,284 | | | | 330,746 | |
| | |
Hormel Foods Corp. | | | 12,863 | | | | 544,362 | |
| | |
JM Smucker Co. (The) | | | 5,435 | | | | 570,023 | |
| | |
McCormick & Co., Inc. | | | 4,716 | | | | 583,086 | |
| | |
| | | | | | | $ | 2,342,516 | |
| | | | |
| | 8 | | See Notes to Financial Statements. |
Parametric
Volatility Risk Premium - Defensive Fund
January 31, 2019
Portfolio of Investments — continued
| | | | | | | | |
| Security | | Shares | | | Value | |
|
| Health Care Equipment & Supplies — 1.5% | |
| | |
Abbott Laboratories | | | 21,988 | | | $ | 1,604,684 | |
| | |
Boston Scientific Corp.(1) | | | 23,382 | | | | 892,023 | |
| | |
Cooper Cos., Inc. (The) | | | 1,487 | | | | 414,516 | |
| | |
Dentsply Sirona, Inc. | | | 8,384 | | | | 351,709 | |
| | |
IDEXX Laboratories, Inc.(1) | | | 2,236 | | | | 475,776 | |
| | |
Intuitive Surgical, Inc.(1) | | | 1,693 | | | | 886,523 | |
| | |
Medtronic PLC | | | 20,032 | | | | 1,770,629 | |
| | |
| | | | | | | $ | 6,395,860 | |
|
| Health Care Providers & Services — 1.7% | |
| | |
Cardinal Health, Inc. | | | 7,043 | | | $ | 351,939 | |
| | |
Centene Corp.(1) | | | 5,317 | | | | 694,241 | |
| | |
Cigna Corp.(1) | | | 7,310 | | | | 1,460,611 | |
| | |
CVS Health Corp. | | | 12,157 | | | | 796,891 | |
| | |
DaVita, Inc.(1) | | | 4,911 | | | | 275,655 | |
| | |
Henry Schein, Inc.(1) | | | 6,989 | | | | 543,045 | |
| | |
UnitedHealth Group, Inc. | | | 12,036 | | | | 3,252,127 | |
| | |
| | | | | | | $ | 7,374,509 | |
|
| Hotels, Restaurants & Leisure — 0.8% | |
| | |
McDonald’s Corp. | | | 9,949 | | | $ | 1,778,682 | |
| | |
Royal Caribbean Cruises, Ltd. | | | 5,609 | | | | 673,361 | |
| | |
Starbucks Corp. | | | 15,343 | | | | 1,045,472 | |
| | |
| | | | | | | $ | 3,497,515 | |
|
| Household Durables — 0.3% | |
| | |
Garmin, Ltd. | | | 2,621 | | | $ | 181,321 | |
| | |
Leggett & Platt, Inc. | | | 3,079 | | | | 126,116 | |
| | |
Mohawk Industries, Inc.(1) | | | 2,182 | | | | 281,020 | |
| | |
Newell Brands, Inc. | | | 16,759 | | | | 355,458 | |
| | |
PulteGroup, Inc. | | | 16,196 | | | | 450,411 | |
| | |
Whirlpool Corp. | | | 1,073 | | | | 142,719 | |
| | |
| | | | | | | $ | 1,537,045 | |
|
| Household Products — 0.8% | |
| | |
Clorox Co. (The) | | | 4,039 | | | $ | 599,307 | |
| | |
Procter & Gamble Co. (The) | | | 31,813 | | | | 3,069,000 | |
| | |
| | | | | | | $ | 3,668,307 | |
|
| Industrial Conglomerates — 0.8% | |
| | |
3M Co. | | | 8,590 | | | $ | 1,720,577 | |
| | |
General Electric Co. | | | 26,262 | | | | 266,822 | |
| | |
Honeywell International, Inc. | | | 10,733 | | | | 1,541,581 | |
| | |
| | | | | | | $ | 3,528,980 | |
| | | | | | | | |
| Security | | Shares | | | Value | |
|
| Insurance — 1.1% | |
| | |
Aflac, Inc. | | | 16,231 | | | $ | 774,219 | |
| | |
Arthur J. Gallagher & Co. | | | 7,651 | | | | 571,606 | |
| | |
Assurant, Inc. | | | 3,323 | | | | 320,304 | |
| | |
Everest Re Group, Ltd. | | | 1,571 | | | | 344,128 | |
| | |
Hartford Financial Services Group, Inc. | | | 17,770 | | | | 833,768 | |
| | |
Progressive Corp. (The) | | | 12,829 | | | | 863,263 | |
| | |
Torchmark Corp. | | | 6,661 | | | | 557,925 | |
| | |
Unum Group | | | 12,243 | | | | 425,567 | |
| | |
| | | | | | | $ | 4,690,780 | |
|
| Interactive Media & Services — 2.6% | |
| | |
Alphabet, Inc., Class A(1) | | | 3,132 | | | $ | 3,526,288 | |
| | |
Alphabet, Inc., Class C(1) | | | 3,204 | | | | 3,576,850 | |
| | |
Facebook, Inc., Class A(1) | | | 25,354 | | | | 4,226,258 | |
| | |
TripAdvisor, Inc.(1) | | | 3,538 | | | | 203,010 | |
| | |
| | | | | | | $ | 11,532,406 | |
|
| Internet & Direct Marketing Retail — 1.9% | |
| | |
Amazon.com, Inc.(1) | | | 4,337 | | | $ | 7,454,132 | |
| | |
Booking Holdings, Inc.(1) | | | 535 | | | | 980,553 | |
| | |
| | | | | | | $ | 8,434,685 | |
|
| IT Services — 2.3% | |
| | |
Accenture PLC, Class A | | | 7,488 | | | $ | 1,149,783 | |
| | |
Alliance Data Systems Corp. | | | 1,856 | | | | 329,607 | |
| | |
Global Payments, Inc. | | | 3,090 | | | | 346,945 | |
| | |
International Business Machines Corp. | | | 11,590 | | | | 1,557,928 | |
| | |
Mastercard, Inc., Class A | | | 10,284 | | | | 2,171,261 | |
| | |
PayPal Holdings, Inc.(1) | | | 12,776 | | | | 1,133,998 | |
| | |
VeriSign, Inc.(1) | | | 2,742 | | | | 464,138 | |
| | |
Visa, Inc., Class A | | | 20,129 | | | | 2,717,616 | |
| | |
Western Union Co. (The) | | | 6,053 | | | | 110,467 | |
| | |
| | | | | | | $ | 9,981,743 | |
|
| Life Sciences Tools & Services — 0.4% | |
| | |
PerkinElmer, Inc. | | | 5,742 | | | $ | 519,651 | |
| | |
Thermo Fisher Scientific, Inc. | | | 5,244 | | | | 1,288,293 | |
| | |
| | | | | | | $ | 1,807,944 | |
|
| Machinery — 0.7% | |
| | |
Deere & Co. | | | 6,278 | | | $ | 1,029,592 | |
| | |
Flowserve Corp. | | | 3,129 | | | | 137,801 | |
| | |
PACCAR, Inc. | | | 10,677 | | | | 699,557 | |
| | |
Pentair PLC | | | 10,565 | | | | 435,173 | |
| | |
Stanley Black & Decker, Inc. | | | 5,241 | | | | 662,672 | |
| | |
| | | | | | | $ | 2,964,795 | |
| | | | |
| | 9 | | See Notes to Financial Statements. |
Parametric
Volatility Risk Premium - Defensive Fund
January 31, 2019
Portfolio of Investments — continued
| | | | | | | | |
| Security | | Shares | | | Value | |
|
| Media — 0.7% | |
| | |
Comcast Corp., Class A | | | 54,536 | | | $ | 1,994,381 | |
| | |
Discovery, Inc., Class A(1) | | | 6,335 | | | | 179,787 | |
| | |
Discovery, Inc., Class C(1) | | | 8,661 | | | | 230,816 | |
| | |
DISH Network Corp., Class A(1) | | | 7,168 | | | | 219,843 | |
| | |
Interpublic Group of Cos., Inc. (The) | | | 4,968 | | | | 113,022 | |
| | |
News Corp., Class A | | | 6,794 | | | | 87,167 | |
| | |
News Corp., Class B | | | 8,717 | | | | 112,711 | |
| | |
| | | | | | | $ | 2,937,727 | |
|
| Metals & Mining — 0.1% | |
| | |
Nucor Corp. | | | 9,087 | | | $ | 556,488 | |
| | |
| | | | | | | $ | 556,488 | |
|
| Multi-Utilities — 0.7% | |
| | |
Centerpoint Energy, Inc. | | | 17,448 | | | $ | 539,492 | |
| | |
CMS Energy Corp. | | | 14,119 | | | | 736,165 | |
| | |
Dominion Energy, Inc. | | | 5,490 | | | | 385,618 | |
| | |
NiSource, Inc. | | | 17,073 | | | | 465,751 | |
| | |
WEC Energy Group, Inc. | | | 10,356 | | | | 756,299 | |
| | |
| | | | | | | $ | 2,883,325 | |
|
| Multiline Retail — 0.2% | |
| | |
Dollar Tree, Inc.(1) | | | 5,035 | | | $ | 487,539 | |
| | |
Kohl’s Corp. | | | 4,977 | | | | 341,870 | |
| | |
Macy’s, Inc. | | | 5,588 | | | | 146,965 | |
| | |
| | | | | | | $ | 976,374 | |
|
| Oil, Gas & Consumable Fuels — 2.4% | |
| | |
Cabot Oil & Gas Corp. | | | 21,553 | | | $ | 537,748 | |
| | |
Chevron Corp. | | | 24,462 | | | | 2,804,568 | |
| | |
Devon Energy Corp. | | | 18,469 | | | | 492,199 | |
| | |
Exxon Mobil Corp. | | | 50,514 | | | | 3,701,666 | |
| | |
Hess Corp. | | | 12,824 | | | | 692,496 | |
| | |
HollyFrontier Corp. | | | 8,241 | | | | 464,298 | |
| | |
Marathon Oil Corp. | | | 49,385 | | | | 779,789 | |
| | |
Newfield Exploration Co.(1) | | | 30,897 | | | | 564,797 | |
| | |
ONEOK, Inc. | | | 9,533 | | | | 612,114 | |
| | |
| | | | | | | $ | 10,649,675 | |
|
| Pharmaceuticals — 2.6% | |
| | |
Bristol-Myers Squibb Co. | | | 18,348 | | | $ | 905,841 | |
| | |
Eli Lilly & Co. | | | 12,143 | | | | 1,455,460 | |
| | |
Johnson & Johnson | | | 29,386 | | | | 3,910,689 | |
| | |
Merck & Co., Inc. | | | 29,385 | | | | 2,187,126 | |
| | | | | | | | |
| Security | | Shares | | | Value | |
|
| Pharmaceuticals(continued) | |
| | |
Nektar Therapeutics(1) | | | 2,331 | | | $ | 98,694 | |
| | |
Perrigo Co. PLC | | | 2,404 | | | | 111,666 | |
| | |
Pfizer, Inc. | | | 68,790 | | | | 2,920,135 | |
| | |
| | | | | | | $ | 11,589,611 | |
|
| Professional Services — 0.3% | |
| | |
Equifax, Inc. | | | 2,588 | | | $ | 276,967 | |
| | |
Nielsen Holdings PLC | | | 10,044 | | | | 257,930 | |
| | |
Robert Half International, Inc. | | | 2,728 | | | | 175,765 | |
| | |
Verisk Analytics, Inc.(1) | | | 3,497 | | | | 410,583 | |
| | |
| | | | | | | $ | 1,121,245 | |
|
| Real Estate Management & Development — 0.1% | |
| | |
CBRE Group, Inc., Class A(1) | | | 8,686 | | | $ | 397,385 | |
| | |
| | | | | | | $ | 397,385 | |
|
| Road & Rail — 0.6% | |
| | |
J.B. Hunt Transport Services, Inc. | | | 4,441 | | | $ | 475,365 | |
| | |
Kansas City Southern | | | 2,916 | | | | 308,367 | |
| | |
Union Pacific Corp. | | | 10,623 | | | | 1,689,800 | |
| | |
| | | | | | | $ | 2,473,532 | |
|
| Semiconductors & Semiconductor Equipment — 1.8% | |
| | |
Broadcom, Inc. | | | 5,328 | | | $ | 1,429,236 | |
| | |
Intel Corp. | | | 50,077 | | | | 2,359,628 | |
| | |
KLA-Tencor Corp. | | | 6,598 | | | | 703,149 | |
| | |
NVIDIA Corp. | | �� | 7,788 | | | | 1,119,525 | |
| | |
Qorvo, Inc.(1) | | | 2,215 | | | | 144,773 | |
| | |
QUALCOMM, Inc. | | | 14,191 | | | | 702,738 | |
| | |
Texas Instruments, Inc. | | | 14,535 | | | | 1,463,384 | |
| | |
| | | | | | | $ | 7,922,433 | |
|
| Software — 3.2% | |
| | |
Adobe, Inc.(1) | | | 6,074 | | | $ | 1,505,259 | |
| | |
Intuit, Inc. | | | 850 | | | | 183,447 | |
| | |
Microsoft Corp. | | | 80,719 | | | | 8,429,485 | |
| | |
Oracle Corp. | | | 32,400 | | | | 1,627,452 | |
| | |
Red Hat, Inc.(1) | | | 3,939 | | | | 700,512 | |
| | |
salesforce.com, Inc.(1) | | | 10,617 | | | | 1,613,465 | |
| | |
| | | | | | | $ | 14,059,620 | |
|
| Specialty Retail — 1.0% | |
| | |
CarMax, Inc.(1) | | | 9,412 | | | $ | 553,237 | |
| | |
Foot Locker, Inc. | | | 1,891 | | | | 105,688 | |
| | | | |
| | 10 | | See Notes to Financial Statements. |
Parametric
Volatility Risk Premium - Defensive Fund
January 31, 2019
Portfolio of Investments — continued
| | | | | | | | |
| Security | | Shares | | | Value | |
|
| Specialty Retail (continued) | |
| | |
Gap, Inc. (The) | | | 10,272 | | | $ | 261,320 | |
| | |
Home Depot, Inc. (The) | | | 14,666 | | | | 2,691,651 | |
| | |
L Brands, Inc. | | | 5,793 | | | | 161,277 | |
| | |
Ross Stores, Inc. | | | 6,619 | | | | 609,742 | |
| | |
Tiffany & Co. | | | 1,278 | | | | 113,397 | |
| | |
| | | | | | | $ | 4,496,312 | |
|
| Technology Hardware, Storage & Peripherals — 1.9% | |
| | |
Apple, Inc. | | | 46,502 | | | $ | 7,739,793 | |
| | |
NetApp, Inc. | | | 3,814 | | | | 243,219 | |
| | |
Seagate Technology PLC | | | 6,158 | | | | 272,676 | |
| | |
Western Digital Corp. | | | 4,190 | | | | 188,508 | |
| | |
Xerox Corp. | | | 4,717 | | | | 133,067 | |
| | |
| | | | | | | $ | 8,577,263 | |
|
| Textiles, Apparel & Luxury Goods — 0.4% | |
| | |
Capri Holdings, Ltd.(1) | | | 4,016 | | | $ | 170,600 | |
| | |
NIKE, Inc., Class B | | | 15,466 | | | | 1,266,356 | |
| | |
Ralph Lauren Corp., | | | 1,633 | | | | 189,656 | |
| | |
Under Armour, Inc., Class A(1) | | | 7,697 | | | | 159,636 | |
| | |
Under Armour, Inc., Class C(1) | | | 6,050 | | | | 114,587 | |
| | |
| | | | | | | $ | 1,900,835 | |
|
| Tobacco — 0.5% | |
| | |
Altria Group, Inc. | | | 23,780 | | | $ | 1,173,543 | |
| | |
Philip Morris International, Inc. | | | 13,555 | | | | 1,039,940 | |
| | |
| | | | | | �� | $ | 2,213,483 | |
|
| Trading Companies & Distributors — 0.2% | |
| | |
Fastenal Co. | | | 3,445 | | | $ | 208,285 | |
| | |
United Rentals, Inc.(1) | | | 2,350 | | | | 294,361 | |
| | |
W.W. Grainger, Inc. | | | 696 | | | | 205,591 | |
| | |
| | | | | | | $ | 708,237 | |
|
| Water Utilities — 0.1% | |
| | |
American Water Works Co., Inc. | | | 5,263 | | | $ | 503,511 | |
| | |
| | | | | | | $ | 503,511 | |
| | |
Total Common Stocks
(identified cost $205,441,787) | | | | | | $ | 223,544,310 | |
| | | | | | | | |
| Short-Term Investments — 48.5% | |
|
| U.S. Treasury Obligations — 47.6% | |
| Security | | Principal
Amount (000’s omitted) | | | Value | |
| | |
| U.S. Treasury Bills: | | | | | | |
| | |
0.00%, 3/28/19(3) | | $ | 20,000 | | | $ | 19,927,622 | |
| | |
0.00%, 6/20/19(3) | | | 20,010 | | | | 19,826,892 | |
| | |
0.00%, 7/18/19(3) | | | 30,880 | | | | 30,536,382 | |
| |
| | | | $ | 70,290,896 | |
| | |
| U.S. Treasury Notes: | | | | | | |
| | |
0.75%, 7/15/19 | | $ | 10,690 | | | $ | 10,607,946 | |
| | |
0.875%, 9/15/19(3) | | | 18,550 | | | | 18,360,885 | |
| | |
1.00%, 10/15/19 | | | 23,860 | | | | 23,604,157 | |
| | |
1.00%, 11/30/19 | | | 15,000 | | | | 14,810,742 | |
| | |
1.25%, 4/30/19 | | | 23,500 | | | | 23,432,529 | |
| | |
1.25%, 8/31/19(3) | | | 25,000 | | | | 24,818,848 | |
| | |
1.375%, 12/15/19 | | | 23,700 | | | | 23,460,685 | |
| | |
| | | | | | | $ | 139,095,792 | |
| |
Total U.S. Treasury Obligations
(identified cost $209,362,716) | | | $ | 209,386,688 | |
|
| Other— 0.9% | |
| Description | | Units | | | Value | |
| | |
Eaton Vance Cash Reserves Fund, LLC, 2.61%(4) | | | 3,709,933 | | | $ | 3,709,933 | |
| |
Total Other
(identified cost $3,709,933) | | | $ | 3,709,933 | |
| |
Total Short-Term Investments
(identified cost $213,072,649) | | | $ | 213,096,621 | |
| |
Total Investments — 99.3%
(identified cost $418,514,436) | | | $ | 436,640,931 | |
| |
Total Written Options — (0.7)%
(premiums received $2,417,903) | | | $ | (3,076,780 | ) |
| |
Other Assets, Less Liabilities — 1.4% | | | $ | 6,094,229 | |
| |
Net Assets — 100.0% | | | $ | 439,658,380 | |
The percentage shown for each investment category in the Portfolio of Investments is based on net assets.
| (1) | Non-income producing security. |
| (2) | Amount is less than 0.05%. |
| (3) | Security (or a portion thereof) has been pledged as collateral for written options. |
| | | | |
| | 11 | | See Notes to Financial Statements. |
Parametric
Volatility Risk Premium - Defensive Fund
January 31, 2019
Portfolio of Investments — continued
| (4) | Affiliated investment company, available to Eaton Vance portfolios and funds, which invests in high quality, U.S. dollar denominated money market instruments. The rate shown is the annualizedseven-day yield as of January 31, 2019. |
| | | | | | | | | | | | | | | | | | | | |
| Written Call Options — (0.6)% | |
|
| Exchange-Traded Options — (0.6)% | |
| | | | | |
| Description | | Number of
Contracts | | | Notional
Amount | | | Exercise
Price | | | Expiration
Date | | | Value | |
| | | | | |
| S&P 500 Index | | | 70 | | | $ | 18,928,700 | | | $ | 2,635 | | | | 2/1/19 | | | $ | (490,700 | ) |
| | | | | |
| S&P 500 Index | | | 66 | | | | 17,847,060 | | | | 2,650 | | | | 2/4/19 | | | | (375,540 | ) |
| | | | | |
| S&P 500 Index | | | 66 | | | | 17,847,060 | | | | 2,650 | | | | 2/6/19 | | | | (393,360 | ) |
| | | | | |
| S&P 500 Index | | | 66 | | | | 17,847,060 | | | | 2,670 | | | | 2/8/19 | | | | (295,680 | ) |
| | | | | |
| S&P 500 Index | | | 65 | | | | 17,576,650 | | | | 2,700 | | | | 2/11/19 | | | | (174,525 | ) |
| | | | | |
| S&P 500 Index | | | 68 | | | | 18,387,880 | | | | 2,690 | | | | 2/13/19 | | | | (245,820 | ) |
| | | | | |
| S&P 500 Index | | | 70 | | | | 18,928,700 | | | | 2,755 | | | | 2/15/19 | | | | (70,350 | ) |
| | | | | |
| S&P 500 Index | | | 74 | | | | 20,010,340 | | | | 2,715 | | | | 2/19/19 | | | | (196,840 | ) |
| | | | | |
| S&P 500 Index | | | 73 | | | | 19,739,930 | | | | 2,720 | | | | 2/20/19 | | | | (183,960 | ) |
| | | | | |
| S&P 500 Index | | | 75 | | | | 20,280,750 | | | | 2,750 | | | | 2/22/19 | | | | (117,000 | ) |
| | | | | |
| S&P 500 Index | | | 70 | | | | 18,928,700 | | | | 2,720 | | | | 2/25/19 | | | | (201,950 | ) |
| | | | | |
| S&P 500 Index | | | 58 | | | | 15,683,780 | | | | 2,760 | | | | 2/27/19 | | | | (88,450 | ) |
| | | | | |
Total | | | | | | | | | | | | | | | | | | $ | (2,834,175 | ) |
|
| Written Put Options — (0.1)% | |
|
| Exchange-Traded Options— (0.1)% | |
| | | | | |
| Description | | Number of
Contracts | | | Notional
Amount | | | Exercise
Price | | | Expiration
Date | | | Value | |
| | | | | |
| S&P 500 Index | | | 70 | | | $ | 18,928,700 | | | $ | 2,395 | | | | 2/1/19 | | | $ | (175 | ) |
| | | | | |
| S&P 500 Index | | | 75 | | | | 20,280,750 | | | | 2,430 | | | | 2/4/19 | | | | (562 | ) |
| | | | | |
| S&P 500 Index | | | 75 | | | | 20,280,750 | | | | 2,430 | | | | 2/6/19 | | | | (1,125 | ) |
| | | | | |
| S&P 500 Index | | | 75 | | | | 20,280,750 | | | | 2,440 | | | | 2/8/19 | | | | (2,625 | ) |
| | | | | |
| S&P 500 Index | | | 75 | | | | 20,280,750 | | | | 2,435 | | | | 2/11/19 | | | | (4,313 | ) |
| | | | | |
| S&P 500 Index | | | 75 | | | | 20,280,750 | | | | 2,455 | | | | 2/13/19 | | | | (9,000 | ) |
| | | | | |
| S&P 500 Index | | | 75 | | | | 20,280,750 | | | | 2,560 | | | | 2/15/19 | | | | (32,625 | ) |
| | | | | |
| S&P 500 Index | | | 75 | | | | 20,280,750 | | | | 2,505 | | | | 2/19/19 | | | | (22,500 | ) |
| | | | | |
| S&P 500 Index | | | 57 | | | | 15,413,370 | | | | 2,500 | | | | 2/20/19 | | | | (18,525 | ) |
| | | | | |
| S&P 500 Index | | | 83 | | | | 22,444,030 | | | | 2,555 | | | | 2/22/19 | | | | (55,195 | ) |
| | | | | |
| S&P 500 Index | | | 67 | | | | 18,117,470 | | | | 2,520 | | | | 2/25/19 | | | | (35,510 | ) |
| | | | | |
| S&P 500 Index | | | 62 | | | | 16,765,420 | | | | 2,570 | | | | 2/27/19 | | | | (60,450 | ) |
| | | | | |
Total | | | | | | | | | | | | | | | | | | $ | (242,605 | ) |
| | | | |
| | 12 | | See Notes to Financial Statements. |
Parametric
Volatility Risk Premium - Defensive Fund
January 31, 2019
Statement of Assets and Liabilities
| | | | |
| Assets | | January 31, 2019 | |
| |
Unaffiliated investments, at value (identified cost, $414,804,503) | | $ | 432,930,998 | |
| |
Affiliated investment, at value (identified cost, $3,709,933) | | | 3,709,933 | |
| |
Dividends receivable | | | 248,633 | |
| |
Interest receivable | | | 414,881 | |
| |
Dividends receivable from affiliated investment | | | 19,136 | |
| |
Receivable for investments sold | | | 3,682,691 | |
| |
Receivable for Fund shares sold | | | 5,324,088 | |
| |
Total assets | | $ | 446,330,360 | |
| |
| Liabilities | | | | |
| |
Written options outstanding, at value (premiums received, $2,417,903) | | $ | 3,076,780 | |
| |
Payable for investments purchased | | | 3,068,505 | |
| |
Payable for Fund shares redeemed | | | 292,783 | |
| |
Payable to affiliate: | | | | |
| |
Investment adviser and administration fee | | | 139,182 | |
| |
Accrued expenses | | | 94,730 | |
| |
Total liabilities | | $ | 6,671,980 | |
| |
Net Assets | | $ | 439,658,380 | |
| |
| Sources of Net Assets | | | | |
| |
Paid-in capital | | $ | 433,658,136 | |
| |
Distributable earnings | | | 6,000,244 | |
| |
Total | | $ | 439,658,380 | |
| |
| Institutional Class Shares | | | | |
| |
Net Assets | | $ | 439,658,380 | |
| |
Shares Outstanding | | | 40,585,419 | |
| |
Net Asset Value, Offering Price and Redemption Price Per Share | | | | |
| |
(net assets ÷ shares of beneficial interest outstanding) | | $ | 10.83 | |
| | | | |
| | 13 | | See Notes to Financial Statements. |
Parametric
Volatility Risk Premium - Defensive Fund
January 31, 2019
Statement of Operations
| | | | |
| Investment Income | | Year Ended January 31, 2019 | |
| |
Dividends | | $ | 3,166,141 | |
| |
Dividends from affiliated investment | | | 219,890 | |
| |
Interest | | | 3,147,259 | |
| |
Total investment income | | $ | 6,533,290 | |
| |
| Expenses | | | | |
| |
Investment adviser and administration fee | | $ | 1,290,065 | |
| |
Trustees’ fees and expenses | | | 18,046 | |
| |
Custodian fee | | | 138,145 | |
| |
Transfer and dividend disbursing agent fees | | | 55,454 | |
| |
Legal and accounting services | | | 65,937 | |
| |
Printing and postage | | | 17,497 | |
| |
Registration fees | | | 65,728 | |
| |
Miscellaneous | | | 20,484 | |
| |
Total expenses | | $ | 1,671,356 | |
| |
Net investment income | | $ | 4,861,934 | |
| |
| Realized and Unrealized Gain (Loss) | | | | |
| |
Net realized gain (loss) — | | | | |
| |
Investment transactions | | $ | (6,662,789 | ) |
| |
Investment transactions — affiliated investment | | | (513 | ) |
| |
Written options | | | (857,560 | ) |
| |
Net realized loss | | $ | (7,520,862 | ) |
| |
Change in unrealized appreciation (depreciation) — | | | | |
| |
Investments | | $ | 3,387,923 | |
| |
Investments — affiliated investment | | | (822 | ) |
| |
Written options | | | (350,083 | ) |
| |
Net change in unrealized appreciation (depreciation) | | $ | 3,037,018 | |
| |
Net realized and unrealized loss | | $ | (4,483,844 | ) |
| |
Net increase in net assets from operations | | $ | 378,090 | |
| | | | |
| | 14 | | See Notes to Financial Statements. |
Parametric
Volatility Risk Premium - Defensive Fund
January 31, 2019
Statements of Changes in Net Assets
| | | | | | | | |
| Increase (Decrease) in Net Assets | | Year Ended January 31, 2019 | | | Period Ended
January 31, 2018(1) | |
| | |
From operations — | | | | | | | | |
| | |
Net investment income | | $ | 4,861,934 | | | $ | 1,080,463 | |
| | |
Net realized loss | | | (7,520,862 | ) | | | (4,013,204 | ) |
| | |
Net change in unrealized appreciation (depreciation) | | | 3,037,018 | | | | 14,430,600 | |
| | |
Net increase in net assets from operations | | $ | 378,090 | | | $ | 11,497,859 | |
| | |
Distributions to shareholders(2) | | $ | (4,589,694 | ) | | $ | (912,813 | ) |
| | |
Transactions in shares of beneficial interest — | | | | | | | | |
| | |
Proceeds from sale of shares | | $ | 362,151,763 | | | $ | 216,359,045 | |
| | |
Net asset value of shares issued to shareholders in payment of distributions declared | | | 3,283,866 | | | | 873,797 | |
| | |
Cost of shares redeemed | | | (116,156,718 | ) | | | (33,226,815 | ) |
| | |
Net increase in net assets from Fund share transactions | | $ | 249,278,911 | | | $ | 184,006,027 | |
| | |
Net increase in net assets | | $ | 245,067,307 | | | $ | 194,591,073 | |
| |
| Net Assets | | | | | |
| | |
At beginning of period | | $ | 194,591,073 | | | $ | — | |
| | |
At end of period | | $ | 439,658,380 | | | $ | 194,591,073 | (3) |
| (1) | For the period from the start of business, February 9, 2017, to January 31, 2018. |
| (2) | For the period ended January 31, 2018, the source of distributions was from net investment income. The current year presentation of distributions conforms with the Disclosure Update and Simplification Rule issued by the Securities and Exchange Commission, effective November 5, 2018. |
| (3) | Includes accumulated undistributed net investment income of $47,369 at January 31, 2018. The requirement to disclose the corresponding amount as of January 31, 2019 was eliminated. |
| | | | |
| | 15 | | See Notes to Financial Statements. |
Parametric
Volatility Risk Premium - Defensive Fund
January 31, 2019
Financial Highlights
| | | | | | | | |
| | | Institutional Class | |
| | | Year Ended
January 31, 2019 | | | Period Ended January 31, 2018(1) | |
| | |
Net asset value — Beginning of period | | $ | 11.020 | | | $ | 10.000 | |
| |
| Income (Loss) From Operations | | | | | |
| | |
Net investment income(2) | | $ | 0.165 | | | $ | 0.104 | |
| | |
Net realized and unrealized gain (loss) | | | (0.226 | ) | | | 0.974 | |
| | |
Total income (loss) from operations | | $ | (0.061 | ) | | $ | 1.078 | |
| |
| Less Distributions | | | | | |
| | |
From net investment income | | $ | (0.129 | ) | | $ | (0.058 | ) |
| | |
Total distributions | | $ | (0.129 | ) | | $ | (0.058 | ) |
| | |
Net asset value — End of period | | $ | 10.830 | | | $ | 11.020 | |
| | |
Total Return(3) | | | (0.55 | )% | | | 10.79 | %(4)(5) |
| |
| Ratios/Supplemental Data | | | | | |
| | |
Net assets, end of period (000’s omitted) | | $ | 439,658 | | | $ | 194,591 | |
| | |
Ratios (as a percentage of average daily net assets): | | | | | | | | |
| | |
Expenses | | | 0.52 | % | | | 0.55 | %(4)(6) |
| | |
Net investment income | | | 1.50 | % | | | 1.00 | %(6) |
| | |
Portfolio Turnover | | | 55 | % | | | 26 | %(5) |
| (1) | For the period from the start of business, February 9, 2017, to January 31, 2018. |
| (2) | Computed using average shares outstanding. |
| (3) | Returns are historical and are calculated by determining the percentage change in net asset value with all distributions reinvested. |
| (4) | The investment adviser and administrator andsub-adviser reimbursed certain operating expenses (equal to 0.08% of average daily net assets for the period ended January 31, 2018). Absent this reimbursement, total return would be lower. |
| | | | |
| | 16 | | See Notes to Financial Statements. |
Parametric
Volatility Risk Premium - Defensive Fund
January 31, 2019
Notes to Financial Statements
1 Significant Accounting Policies
Parametric Volatility Risk Premium — Defensive Fund (the Fund) is a diversified series of Eaton Vance Mutual Funds Trust (the Trust). The Trust is a Massachusetts business trust registered under the Investment Company Act of 1940, as amended (the 1940 Act), as anopen-end management investment company. The Fund’s investment objective is total return. The Fund offers Institutional Class shares, which are sold at net asset value and are not subject to a sales charge.
The following is a summary of significant accounting policies of the Fund. The policies are in conformity with accounting principles generally accepted in the United States of America (U.S. GAAP). The Fund is an investment company and follows accounting and reporting guidance in the Financial Accounting Standards Board (FASB) Accounting Standards Codification Topic 946.
A Investment Valuation — The following methodologies are used to determine the market value or fair value of investments.
Equity Securities.Equity securities listed on a U.S. securities exchange generally are valued at the last sale or closing price on the day of valuation or, if no sales took place on such date, at the mean between the closing bid and ask prices on the exchange where such securities are principally traded. Equity securities listed on the NASDAQ Global or Global Select Market generally are valued at the NASDAQ official closing price. Unlisted or listed securities for which closing sales prices or closing quotations are not available are valued at the mean between the latest available bid and ask prices.
Debt Obligations.Debt obligations are generally valued on the basis of valuations provided by third party pricing services, as derived from such services’ pricing models. Inputs to the models may include, but are not limited to, reported trades, executable bid and ask prices, broker/dealer quotations, prices or yields of securities with similar characteristics, interest rates, anticipated prepayments, benchmark curves or information pertaining to the issuer, as well as industry and economic events. The pricing services may use a matrix approach, which considers information regarding securities with similar characteristics to determine the valuation for a security. Short-term debt obligations purchased with a remaining maturity of sixty days or less for which a valuation from a third party pricing service is not readily available may be valued at amortized cost, which approximates fair value.
Derivatives. U.S. exchange-traded options are valued at the mean between the bid and ask prices at valuation time as reported by the Options Price Reporting Authority. Non U.S. exchange-traded options andover-the-counter options are valued by a third party pricing service using techniques that consider factors including the value of the underlying instrument, the volatility of the underlying instrument and the period of time until option expiration.
Affiliated Fund.The Fund may invest in Eaton Vance Cash Reserves Fund, LLC (Cash Reserves Fund), an affiliated investment company managed by Eaton Vance Management (EVM). While Cash Reserves Fund is not a registered money market mutual fund, it conducts all of its investment activities in accordance with the requirements of Rule2a-7 under the 1940 Act. Investments in Cash Reserves Fund are valued at the closing net asset value per unit on the valuation day. Cash Reserves Fund generally values its investment securities based on available market quotations provided by a third party pricing service.
Fair Valuation.Investments for which valuations or market quotations are not readily available or are deemed unreliable are valued at fair value using methods determined in good faith by or at the direction of the Trustees of the Fund in a manner that fairly reflects the security’s value, or the amount that the Fund might reasonably expect to receive for the security upon its current sale in the ordinary course. Each such determination is based on a consideration of relevant factors, which are likely to vary from one pricing context to another. These factors may include, but are not limited to, the type of security, the existence of any contractual restrictions on the security’s disposition, the price and extent of public trading in similar securities of the issuer or of comparable companies or entities, quotations or relevant information obtained from broker/dealers or other market participants, information obtained from the issuer, analysts, and/or the appropriate stock exchange (for exchange-traded securities), an analysis of the company’s or entity’s financial condition, and an evaluation of the forces that influence the issuer and the market(s) in which the security is purchased and sold.
B Investment Transactions — Investment transactions for financial statement purposes are accounted for on a trade date basis. Realized gains and losses on investments sold are determined on the basis of identified cost.
C Income — Dividend income is recorded on theex-dividend date for dividends received in cash and/or securities. Interest income is recorded on the basis of interest accrued, adjusted for amortization of premium or accretion of discount.
D Federal Taxes — The Fund’s policy is to comply with the provisions of the Internal Revenue Code applicable to regulated investment companies and to distribute to shareholders each year substantially all of its net investment income, and all or substantially all of its net realized capital gains. Accordingly, no provision for federal income or excise tax is necessary.
As of January 31, 2019, the Fund had no uncertain tax positions that would require financial statement recognition,de-recognition, or disclosure. The Fund files a U.S. federal income tax return annually after its fiscalyear-end, which is subject to examination by the Internal Revenue Service for a period of three years from the date of filing.
E Expenses — The majority of expenses of the Trust are directly identifiable to an individual fund. Expenses which are not readily identifiable to a specific fund are allocated taking into consideration, among other things, the nature and type of expense and the relative size of the funds.
F Use of Estimates — The preparation of the financial statements in conformity with U.S. GAAP requires management to make estimates and assumptions that affect the reported amounts of assets and liabilities at the date of the financial statements and the reported amounts of income and expense during the reporting period. Actual results could differ from those estimates.
Parametric
Volatility Risk Premium - Defensive Fund
January 31, 2019
Notes to Financial Statements — continued
G Indemnifications — Under the Trust’s organizational documents, its officers and Trustees may be indemnified against certain liabilities and expenses arising out of the performance of their duties to the Fund. Under Massachusetts law, if certain conditions prevail, shareholders of a Massachusetts business trust (such as the Trust) could be deemed to have personal liability for the obligations of the Trust. However, the Trust’s Declaration of Trust contains an express disclaimer of liability on the part of Fund shareholders and theBy-laws provide that the Trust shall assume the defense on behalf of any Fund shareholders. Moreover, theBy-laws also provide for indemnification out of Fund property of any shareholder held personally liable solely by reason of being or having been a shareholder for all loss or expense arising from such liability. Additionally, in the normal course of business, the Fund enters into agreements with service providers that may contain indemnification clauses. The Fund’s maximum exposure under these arrangements is unknown as this would involve future claims that may be made against the Fund that have not yet occurred.
H Written Options — Upon the writing of a call or a put option, the premium received by the Fund is included in the Statement of Assets and Liabilities as a liability. The amount of the liability is subsequentlymarked-to-market to reflect the current market value of the option written, in accordance with the Fund’s policies on investment valuations discussed above. Premiums received from writing options which expire are treated as realized gains. Premiums received from writing options which are exercised or are closed are added to or offset against the proceeds or amount paid on the transaction to determine the realized gain or loss. When an index option is exercised, the Fund is required to deliver an amount of cash determined by the excess of the exercise price of the option over the value of the index (in the case of a put) or the excess of the value of the index over the exercise price of the option (in the case of a call) at contract termination. If a put option on a security is exercised, the premium reduces the cost basis of the securities purchased by the Fund. The Fund, as a writer of an option, may have no control over whether the underlying securities or other assets may be sold (call) or purchased (put) and, as a result, bears the market risk of an unfavorable change in the price of the securities or other assets underlying the written option. The Fund may also bear the risk of not being able to enter into a closing transaction if a liquid secondary market does not exist.
2 Distributions to Shareholders and Income Tax Information
It is the present policy of the Fund to make at least one distribution annually (normally in December) of all or substantially all of its net investment income and to distribute annually all or substantially all of its net realized capital gains. Distributions to shareholders are recorded on theex-dividend date. Shareholders may reinvest income and capital gain distributions in additional shares of the Fund at the net asset value as of theex-dividend date or, at the election of the shareholder, receive distributions in cash. Distributions to shareholders are determined in accordance with income tax regulations, which may differ from U.S. GAAP. As required by U.S. GAAP, only distributions in excess of tax basis earnings and profits are reported in the financial statements as a return of capital. Permanent differences between book and tax accounting relating to distributions are reclassified topaid-in capital. For tax purposes, distributions from short-term capital gains are considered to be from ordinary income.
The tax character of distributions declared for the year ended January 31, 2019 and the period ended January 31, 2018 was as follows:
| | | | | | | | |
| | | Year Ended January 31, 2019 | | | Period Ended
January 31, 2018 | |
| | |
Ordinary income | | $ | 4,589,694 | | | $ | 912,813 | |
During the year ended January 31, 2019, distributable earnings was decreased by $262,325 andpaid-in capital was increased by $262,325 due to the Fund’s use of equalization accounting and differences between book and tax accounting for investments in partnerships. Tax equalization accounting allows the Fund to treat as a distribution that portion of redemption proceeds representing a redeeming shareholder’s portion of undistributed taxable income and net capital gains. These reclassifications had no effect on the net assets or net asset value per share of the Fund.
As of January 31, 2019, the components of distributable earnings (accumulated loss) on a tax basis were as follows:
| | | | |
| | |
Deferred capital losses | | $ | (11,992,674 | ) |
| |
Net unrealized appreciation | | $ | 17,992,918 | |
At January 31, 2019, the Fund, for federal income tax purposes, had deferred capital losses of $11,992,674 which would reduce its taxable income arising from future net realized gains on investment transactions, if any, to the extent permitted by the Internal Revenue Code, and thus would reduce the amount of distributions to shareholders, which would otherwise be necessary to relieve the Fund of any liability for federal income or excise tax. The deferred capital losses are treated as arising on the first day of the Fund’s next taxable year and retain the same short-term or long-term character as when originally deferred. Of the deferred capital losses at January 31, 2019, $10,423,109 are short-term and $1,569,565 are long-term.
Parametric
Volatility Risk Premium - Defensive Fund
January 31, 2019
Notes to Financial Statements — continued
The cost and unrealized appreciation (depreciation) of investments, including open derivative contracts, of the Fund at January 31, 2019, as determined on a federal income tax basis, were as follows:
| | | | |
| |
Aggregate cost | | $ | 418,648,013 | |
| |
Gross unrealized appreciation | | $ | 19,925,362 | |
| |
Gross unrealized depreciation | | | (1,932,444 | ) |
| |
Net unrealized appreciation | | $ | 17,992,918 | |
3 Investment Adviser and Administration Fee and Other Transactions with Affiliates
The investment adviser and administration fee is earned by EVM as compensation for investment advisory and administrative services rendered to the Fund. The fee is computed at an annual rate of 0.40% of the Fund’s average daily net assets up to $1 billion and is payable monthly. On net assets of $1 billion and over, the annual fee is reduced. For the year ended January 31, 2019, the investment adviser and administration fee amounted to $1,290,065 or 0.40% of the Fund’s average daily net assets. Pursuant to asub-advisory agreement, EVM has delegated the investment management of the Fund to Parametric Portfolio Associates LLC (Parametric), a majority-owned subsidiary of Eaton Vance Corp. EVM pays Parametric a portion of its investment adviser and administration fee forsub-advisory services provided to the Fund. The Fund invests its cash in Cash Reserves Fund. EVM does not currently receive a fee for advisory services provided to Cash Reserves Fund.
EVM and Parametric have agreed to reimburse the Fund’s expenses to the extent that total annual operating expenses (relating to ordinary operating expenses only) exceed 0.55% of the Fund’s average daily net assets. This agreement may be changed or terminated after May 31, 2019. Pursuant to this agreement, EVM and Parametric reimbursed no expenses for the year ended January 31, 2019.
EVM providessub-transfer agency and related services to the Fund pursuant to aSub-Transfer Agency Support Services Agreement. For the year ended January 31, 2019, EVM earned $21,490 from the Fund pursuant to such agreement, which is included in transfer and dividend disbursing agent fees on the Statement of Operations.
Trustees and officers of the Fund who are members of EVM’s organization receive remuneration for their services to the Fund out of the investment adviser and administration fee. Trustees of the Fund who are not affiliated with EVM may elect to defer receipt of all or a percentage of their annual fees in accordance with the terms of the Trustees Deferred Compensation Plan. For the year ended January 31, 2019, no significant amounts have been deferred. Certain officers and Trustees of the Fund are officers of EVM.
4 Purchases and Sales of Investments
Purchases and sales of investments, other than short-term obligations, aggregated $215,952,035 and $88,214,356, respectively, for the year ended January 31, 2019.
5 Shares of Beneficial Interest
The Fund’s Declaration of Trust permits the Trustees to issue an unlimited number of full and fractional shares of beneficial interest (without par value). Transactions in Fund shares were as follows:
| | | | | | | | |
| Institutional Class | | Year Ended
January 31, 2019 | | | Period Ended
January 31, 2018(1) | |
| | |
Sales | | | 33,112,331 | | | | 20,659,414 | |
| | |
Issued to shareholders electing to receive payments of distributions in Fund shares | | | 303,219 | | | | 80,386 | |
| | |
Redemptions | | | (10,481,974 | ) | | | (3,087,957 | ) |
| | |
Net increase | | | 22,933,576 | | | | 17,651,843 | |
| (1) | For the period from the start of business, February 9, 2017, to January 31, 2018. |
Parametric
Volatility Risk Premium - Defensive Fund
January 31, 2019
Notes to Financial Statements — continued
6 Financial Instruments
The Fund may trade in financial instruments withoff-balance sheet risk in the normal course of its investing activities. These financial instruments may include written options and may involve, to a varying degree, elements of risk in excess of the amounts recognized for financial statement purposes. The notional or contractual amounts of these instruments represent the investment the Fund has in particular classes of financial instruments and do not necessarily represent the amounts potentially subject to risk. The measurement of the risks associated with these instruments is meaningful only when all related and offsetting transactions are considered. A summary of obligations under these financial instruments at January 31, 2019 is included in the Portfolio of Investments. At January 31, 2019, the Fund had sufficient cash and/or securities to cover commitments under these contracts.
The Fund is subject to equity price risk in the normal course of pursuing its investment objective. The Fund employs a systematic, rules based options strategy of writing call and put options on the S&P 500 Index, that seeks to take advantage of the volatility risk premium ( i.e., the tendency for volatility priced into an option to be higher, on average, than the volatility actually experienced on the securities underlying the option). Premium received from writing options can offset the equity risk premium foregone.
The fair value of open derivative instruments (not considered to be hedging instruments for accounting disclosure purposes) and whose primary underlying risk exposure is equity price risk at January 31, 2019 was as follows:
| | | | | | | | | | | | |
| | | Fair Value | |
| Derivative | | Asset Derivative | | | Liability Derivative(1) | |
| | | |
Written options | | $ | | | | | — | | | $ | (3,076,780 | ) |
| (1) | Statement of Assets and Liabilities location: Written options outstanding, at value. |
The effect of derivative instruments (not considered to be hedging instruments for accounting disclosure purposes) on the Statement of Operations and whose primary underlying risk exposure is equity price risk for the year ended January 31, 2019 was as follows:
| | | | | | | | |
| Derivative | | Realized Gain (Loss) on Derivatives Recognized in Income(1) | | | Change in Unrealized
Appreciation (Depreciation) on Derivatives Recognized in Income(2) | |
| | |
Written options | | $ | (857,560 | ) | | $ | (350,083 | ) |
| (1) | Statement of Operations location: Net realized gain (loss) – Written options. |
| (2) | Statement of Operations location: Change in unrealized appreciation (depreciation) – Written options. |
The average number of written options contracts outstanding during the year ended January 31, 2019, which is indicative of the volume of this derivative type, was 1,188 contracts.
7 Line of Credit
The Fund participates with other portfolios and funds managed by EVM and its affiliates in a $625 million unsecured line of credit agreement with a group of banks, which is in effect through October 29, 2019. Borrowings are made by the Fund solely to facilitate the handling of unusual and/or unanticipated short-term cash requirements. Interest is charged to the Fund based on its borrowings at an amount above either the Eurodollar rate or Federal Funds rate. In addition, a fee computed at an annual rate of 0.15% on the daily unused portion of the line of credit is allocated among the participating portfolios and funds at the end of each quarter. Because the line of credit is not available exclusively to the Fund, it may be unable to borrow some or all of its requested amounts at any particular time. The Fund did not have any significant borrowings or allocated fees during the year ended January 31, 2019.
8 Fair Value Measurements
Under generally accepted accounting principles for fair value measurements, a three-tier hierarchy to prioritize the assumptions, referred to as inputs, is used in valuation techniques to measure fair value. The three-tier hierarchy of inputs is summarized in the three broad levels listed below.
| • | | Level 1 – quoted prices in active markets for identical investments |
| • | | Level 2 – other significant observable inputs (including quoted prices for similar investments, interest rates, prepayment speeds, credit risk, etc.) |
| • | | Level 3 – significant unobservable inputs (including a fund’s own assumptions in determining the fair value of investments) |
Parametric
Volatility Risk Premium - Defensive Fund
January 31, 2019
Notes to Financial Statements — continued
In cases where the inputs used to measure fair value fall in different levels of the fair value hierarchy, the level disclosed is determined based on the lowest level input that is significant to the fair value measurement in its entirety. The inputs or methodology used for valuing securities are not necessarily an indication of the risk associated with investing in those securities.
At January 31, 2019, the hierarchy of inputs used in valuing the Fund’s investments and open derivative instruments, which are carried at value, were as follows:
| | | | | | | | | | | | | | | | |
| Asset Description | | Level 1 | | | Level 2 | | | Level 3 | | | Total | |
| | | | |
Common Stocks | | $ | 223,544,310 | * | | $ | — | | | $ | — | | | $ | 223,544,310 | |
| | | | |
Short-Term Investments — | | | | | | | | | | | | | | | | |
| | | | |
U.S. Treasury Obligations | | | — | | | | 209,386,688 | | | | — | | | | 209,386,688 | |
| | | | |
Other | | | — | | | | 3,709,933 | | | | — | | | | 3,709,933 | |
| | | | |
Total Investments | | $ | 223,544,310 | | | $ | 213,096,621 | | | $ | — | | | $ | 436,640,931 | |
| | | | |
Liability Description | | | | | | | | | | | | | | | | |
| | | | |
Written Call Options | | $ | (2,834,175 | ) | | $ | — | | | $ | — | | | $ | (2,834,175 | ) |
| | | | |
Written Put Options | | | (242,605 | ) | | | — | | | | — | | | | (242,605 | ) |
| | | | |
Total | | $ | (3,076,780 | ) | | $ | — | | | $ | — | | | $ | (3,076,780 | ) |
| * | The level classification by major category of investments is the same as the category presentation in the Portfolio of Investments. |
Parametric
Volatility Risk Premium - Defensive Fund
January 31, 2019
Report of Independent Registered Public Accounting Firm
To the Trustees of Eaton Vance Mutual Funds Trust and Shareholders of Parametric Volatility Risk Premium - Defensive Fund:
Opinion on the Financial Statements and Financial Highlights
We have audited the accompanying statement of assets and liabilities of Parametric Volatility Risk Premium - Defensive Fund (the “Fund”) (one of the funds constituting Eaton Vance Mutual Funds Trust), including the portfolio of investments, as of January 31, 2019, and the related statement of operations for the year then ended, the statements of changes in net assets and the financial highlights for the year ended January 31, 2019 and for the period from the start of business, February 9, 2017, to January 31, 2018, and the related notes. In our opinion, the financial statements and financial highlights present fairly, in all material respects, the financial position of the Fund as of January 31, 2019, and the results of its operations for the year then ended, and the changes in its net assets and the financial highlights for the year ended January 31, 2019 and for the period from the start of business, February 9, 2017, to January 31, 2018, in conformity with accounting principles generally accepted in the United States of America.
Basis for Opinion
These financial statements and financial highlights are the responsibility of the Fund’s management. Our responsibility is to express an opinion on the Fund’s financial statements and financial highlights based on our audits. We are a public accounting firm registered with the Public Company Accounting Oversight Board (United States) (PCAOB) and are required to be independent with respect to the Fund in accordance with the U.S. federal securities laws and the applicable rules and regulations of the Securities and Exchange Commission and the PCAOB.
We conducted our audits in accordance with the standards of the PCAOB. Those standards require that we plan and perform the audit to obtain reasonable assurance about whether the financial statements and financial highlights are free of material misstatement, whether due to error or fraud. The Fund is not required to have, nor were we engaged to perform, an audit of its internal control over financial reporting. As part of our audits we are required to obtain an understanding of internal control over financial reporting but not for the purpose of expressing an opinion on the effectiveness of the Fund’s internal control over financial reporting. Accordingly, we express no such opinion.
Our audits included performing procedures to assess the risks of material misstatement of the financial statements and financial highlights, whether due to error or fraud, and performing procedures that respond to those risks. Such procedures included examining, on a test basis, evidence regarding the amounts and disclosures in the financial statements and financial highlights. Our audits also included evaluating the accounting principles used and significant estimates made by management, as well as evaluating the overall presentation of the financial statements and financial highlights. Our procedures included confirmation of securities owned as of January 31, 2019, by correspondence with the custodian and brokers; when replies were not received from brokers, we performed other auditing procedures. We believe that our audits provide a reasonable basis for our opinion.
/s/ Deloitte & Touche LLP
Boston, Massachusetts
March 21, 2019
We have served as the auditor of one or more Eaton Vance investment companies since 1959.
Parametric
Volatility Risk Premium - Defensive Fund
January 31, 2019
Federal Tax Information (Unaudited)
The Form1099-DIV you receive in February 2020 will show the tax status of all distributions paid to your account in calendar year 2019. Shareholders are advised to consult their own tax adviser with respect to the tax consequences of their investment in the Fund. As required by the Internal Revenue Code and/or regulations, shareholders must be notified regarding the status of qualified dividend income for individuals and the dividends received deduction for corporations.
Qualified Dividend Income. For the fiscal year ended January 31, 2019, the Fund designates approximately $2,922,658, or up to the maximum amount of such dividends allowable pursuant to the Internal Revenue Code, as qualified dividend income eligible for the reduced tax rate of 15%.
Dividends Received Deduction. Corporate shareholders are generally entitled to take the dividends received deduction on the portion of the Fund’s dividend distribution that qualifies under tax law. For the Fund’s fiscal 2019 ordinary income dividends, 57.65% qualifies for the corporate dividends received deduction.
Parametric
Volatility Risk Premium - Defensive Fund
January 31, 2019
Special Meeting of Shareholders (Unaudited)
The Fund held a Special Meeting of Shareholders on September 20, 2018 to elect the five Trustees listed below. The other Trustees named herein continue to serve as Trustees. The results of the vote with respect to the Fund were as follows:
| | | | | | | | |
| | | Number of Shares | |
| Nominee for Trustee | | For | | | Withheld | |
| | |
Mark R. Fetting | | | 12,632,117 | | | | 1,900 | |
| | |
Keith Quinton | | | 12,632,117 | | | | 1,900 | |
| | |
Marcus L. Smith | | | 12,632,117 | | | | 1,900 | |
| | |
Susan J. Sutherland | | | 12,632,117 | | | | 1,900 | |
| | |
Scott E. Wennerholm | | | 12,632,117 | | | | 1,900 | |
Results are rounded to the nearest whole number.
Parametric
Volatility Risk Premium - Defensive Fund
January 31, 2019
Management and Organization
Fund Management. The Trustees of Eaton Vance Mutual Funds Trust (the Trust) are responsible for the overall management and supervision of the Trust’s affairs. The Trustees and officers of the Trust are listed below. Except as indicated, each individual has held the office shown or other offices in the same company for the last five years. Trustees and officers of the Trust hold indefinite terms of office. The “noninterested Trustees” consist of those Trustees who are not “interested persons” of the Trust, as that term is defined under the 1940 Act. The business address of each Trustee and officer is Two International Place, Boston, Massachusetts 02110. As used below, “EVC” refers to Eaton Vance Corp., “EV” refers to Eaton Vance, Inc., “EVM” refers to Eaton Vance Management, “BMR” refers to Boston Management and Research and “EVD” refers to Eaton Vance Distributors, Inc. EVC and EV are the corporate parent and trustee, respectively, of EVM and BMR. EVD is the Fund’s principal underwriter and a wholly-owned subsidiary of EVC. Each officer affiliated with Eaton Vance may hold a position with other Eaton Vance affiliates that is comparable to his or her position with EVM listed below. Each Trustee oversees 175 portfolios in the Eaton Vance Complex (including all master and feeder funds in a master feeder structure). Each officer serves as an officer of certain other Eaton Vance funds. Each Trustee and officer serves until his or her successor is elected.
| | | | | | |
| Name and Year of Birth | | Position(s) with the Trust | | Trustee Since(1) | | Principal Occupation(s) and Directorships
During Past Five Years and Other Relevant Experience |
|
| Interested Trustee |
| | | |
Thomas E. Faust Jr. 1958 | | Trustee | | 2007 | | Chairman, Chief Executive Officer and President of EVC, Director and President of EV, Chief Executive Officer and President of EVM and BMR, and Director of EVD. Trustee and/or officer of 175 registered investment companies. Mr. Faust is an interested person because of his positions with EVM, BMR, EVD, EVC and EV, which are affiliates of the Trust. Directorships in the Last Five Years.(2)Director of EVC and Hexavest Inc. (investment management firm). |
|
| Noninterested Trustees |
| | | |
Mark R. Fetting 1954 | | Trustee | | 2016 | | Private investor. Formerly held various positions at Legg Mason, Inc. (investment management firm) (2000-2012), including President, Chief Executive Officer, Director and Chairman (2008-2012), Senior Executive Vice President (2004-2008) and Executive Vice President (2001-2004). Formerly, President of Legg Mason family of funds (2001-2008). Formerly, Division President and Senior Officer of Prudential Financial Group, Inc. and related companies (investment management firm)(1991-2000). Directorships in the Last Five Years. None. |
| | | |
Cynthia E. Frost 1961 | | Trustee | | 2014 | | Private investor. Formerly, Chief Investment Officer of Brown University (university endowment) (2000-2012). Formerly, Portfolio Strategist for Duke Management Company (university endowment manager) (1995-2000). Formerly, Managing Director, Cambridge Associates (investment consulting company) (1989-1995). Formerly, Consultant, Bain and Company (management consulting firm) (1987-1989). Formerly, Senior Equity Analyst, BA Investment Management Company (1983-1985). Directorships in the Last Five Years.None. |
| | | |
George J. Gorman 1952 | | Trustee | | 2014 | | Principal at George J. Gorman LLC (consulting firm). Formerly, Senior Partner at Ernst & Young LLP (a registered public accounting firm) (1974-2009). Directorships in the Last Five Years.Formerly, Trustee of the BofA Funds Series Trust (11 funds) (2011-2014) and of the Ashmore Funds (9 funds) (2010-2014). |
| | | |
Valerie A. Mosley 1960 | | Trustee | | 2014 | | Chairwoman and Chief Executive Officer of Valmo Ventures (a consulting and investment firm). Former Partner and Senior Vice President, Portfolio Manager and Investment Strategist at Wellington Management Company, LLP (investment management firm) (1992-2012). Former Chief Investment Officer, PG Corbin Asset Management (1990-1992). Formerly worked in institutional corporate bond sales at Kidder Peabody (1986-1990). Directorships in the Last Five Years.(2)Director of Envestnet, Inc. (provider of intelligent systems for wealth management and financial wellness) (since 2018). |
| | | |
William H. Park 1947 | | Chairperson of the Board and Trustee | | 2016 (Chairperson) 2003 (Trustee) | | Private investor. Formerly, Consultant (management and transactional) (2012-2014). Formerly, Chief Financial Officer, Aveon Group L.P. (investment management firm) (2010-2011). Formerly, Vice Chairman, Commercial Industrial Finance Corp. (specialty finance company) (2006-2010). Formerly, President and Chief Executive Officer, Prizm Capital Management, LLC (investment management firm) (2002-2005). Formerly, Executive Vice President and Chief Financial Officer, United Asset Management Corporation (investment management firm) (1982-2001). Formerly, Senior Manager, Price Waterhouse (now PricewaterhouseCoopers) (a registered public accounting firm) (1972-1981). Directorships in the Last Five Years.(2)None. |
Parametric
Volatility Risk Premium - Defensive Fund
January 31, 2019
Management and Organization — continued
| | | | | | |
| Name and Year of Birth | | Position(s) with the Trust | | Trustee Since(1) | | Principal Occupation(s) and Directorships
During Past Five Years and Other Relevant Experience |
|
| Noninterested Trustees (continued) |
| | | |
Helen Frame Peters 1948 | | Trustee | | 2008 | | Professor of Finance, Carroll School of Management, Boston College. Formerly, Dean, Carroll School of Management, Boston College (2000-2002). Formerly, Chief Investment Officer, Fixed Income, Scudder Kemper Investments (investment management firm) (1998-1999). Formerly, Chief Investment Officer, Equity and Fixed Income, Colonial Management Associates (investment management firm) (1991-1998). Directorships in the Last Five Years.(2) None. |
| | | |
Keith Quinton(3) 1958 | | Trustee | | 2018 | | Independent Investment Committee Member at New Hampshire Retirement System (since 2017). Advisory Committee member at Northfield Information Services, Inc. (risk management analytics provider) (since 2016). Formerly, Portfolio Manager and Senior Quantitative Analyst at Fidelity Investments (investment management firm)(2001-2014). Directorships in the Last Five Years. Director of New Hampshire Municipal Bond Bank (since 2016). |
| | | |
Marcus L. Smith(3) 1966 | | Trustee | | 2018 | | Member of Posse Boston Advisory Board (foundation) (since 2015); Trustee at University of Mount Union (since 2008). Formerly, Portfolio Manager at MFS Investment Management (investment management firm) (1994-2017). Directorships in the Last Five Years. Director of MSCI Inc. (global provider of investment decision support tools) (since 2017). Director of DCT Industrial Trust Inc. (logistics real estate company) (since 2017). |
| | | |
Susan J. Sutherland 1957 | | Trustee | | 2015 | | Private investor. Formerly, Associate, Counsel and Partner at Skadden, Arps, Slate, Meagher & Flom LLP (law firm) (1982-2013). Directorships in the Last Five Years. Formerly, Director of Montpelier Re Holdings Ltd. (global provider of customized insurance and reinsurance products) (2013-2015). |
| | | |
Scott E. Wennerholm 1959 | | Trustee | | 2016 | | Formerly, Trustee at Wheelock College (postsecondary institution) (2012-2018). Formerly, Consultant at GF Parish Group (executive recruiting firm) (2016-2017). Formerly, Chief Operating Officer and Executive Vice President at BNY Mellon Asset Management (investment management firm) (2005-2011). Formerly, Chief Operating Officer and Chief Financial Officer at Natixis Global Asset Management (investment management firm) (1997-2004). Formerly, Vice President at Fidelity Investments Institutional Services (investment management firm) (1994-1997). Directorships in the Last Five Years. None. |
| | | | | | |
| Name and Year of Birth | | Position(s) with the Trust | | Officer
Since(4) | | Principal Occupation(s)
During Past Five Years |
|
| Principal Officers who are not Trustees |
| | | |
Payson F. Swaffield 1956 | | President | | 2003 | | Vice President and Chief Income Investment Officer of EVM and BMR. Also Vice President of Calvert Research and Management (“CRM”). |
| | | |
Maureen A. Gemma 1960 | | Vice President, Secretary and Chief Legal Officer | | 2005 | | Vice President of EVM and BMR. Also Vice President and officer of CRM. |
| | | |
James F. Kirchner 1967 | | Treasurer | | 2007 | | Vice President of EVM and BMR. Also Vice President and officer of CRM. |
| | | |
Richard F. Froio 1968 | | Chief Compliance Officer | | 2017 | | Vice President of EVM and BMR since 2017. Formerly, Deputy Chief Compliance Officer (Adviser/Funds) and Chief Compliance Officer (Distribution) at PIMCO(2012-2017) and Managing Director at BlackRock/Barclays Global Investors(2009-2012). |
| (1) | Year first appointed to serve as Trustee for a fund in the Eaton Vance family of funds. Each Trustee has served continuously since appointment unless indicated otherwise. |
| (2) | During their respective tenures, the Trustees (except for Mmes. Frost and Sutherland and Messrs. Fetting, Gorman, Quinton, Smith and Wennerholm) also served as Board members of one or more of the following funds (which operated in the years noted): eUnitsTM 2 Year U.S. Market Participation Trust: Upside to Cap / Buffered Downside (launched in 2012 and terminated in 2014); and eUnitsTM 2 Year U.S. Market Participation Trust II: Upside to Cap / Buffered Downside (launched in 2012 and terminated in 2014). However, Ms. Mosley did not serve as a Board member of eUnitsTM 2 Year U.S. Market Participation Trust: Upside to Cap / Buffered Downside (launched in 2012 and terminated in 2014). |
Parametric
Volatility Risk Premium - Defensive Fund
January 31, 2019
Management and Organization — continued
| (3) | Messrs. Quinton and Smith began serving as Trustees effective October 1, 2018. |
| (4) | Year first elected to serve as officer of a fund in the Eaton Vance family of funds when the officer has served continuously. Otherwise, year of most recent election as an officer of a fund in the Eaton Vance family of funds. Titles may have changed since initial election. |
The SAI for the Fund includes additional information about the Trustees and officers of the Fund and can be obtained without charge on Eaton Vance’s website at www.eatonvance.com or by calling1-800-260-0761.
Eaton Vance Funds
IMPORTANT NOTICES
Privacy. The Eaton Vance organization is committed to ensuring your financial privacy. Each of the financial institutions identified below has in effect the following policy (“Privacy Policy”) with respect to nonpublic personal information about its customers:
| • | | Only such information received from you, through application forms or otherwise, and information about your Eaton Vance fund transactions will be collected. This may include information such as name, address, social security number, tax status, account balances and transactions. |
| • | | None of such information about you (or former customers) will be disclosed to anyone, except as permitted by law (which includes disclosure to employees necessary to service your account). In the normal course of servicing a customer’s account, Eaton Vance may share information with unaffiliated third parties that perform various required services such as transfer agents, custodians and broker-dealers. |
| • | | Policies and procedures (including physical, electronic and procedural safeguards) are in place that are designed to protect the confidentiality of such information. |
| • | | We reserve the right to change our Privacy Policy at any time upon proper notification to you. Customers may want to review our Privacy Policy periodically for changes by accessing the link on our homepage: www.eatonvance.com. |
Our pledge of privacy applies to the following entities within the Eaton Vance organization: the Eaton Vance Family of Funds, Eaton Vance Management, Eaton Vance Investment Counsel, Eaton Vance Distributors, Inc., Eaton Vance Trust Company, Eaton Vance Management (International) Limited, Eaton Vance Advisers International Ltd., Eaton Vance Management’s Real Estate Investment Group and Boston Management and Research. In addition, our Privacy Policy applies only to those Eaton Vance customers who are individuals and who have a direct relationship with us. If a customer’s account (i.e., fund shares) is held in the name of a third-party financial advisor/broker-dealer, it is likely that only such advisor’s privacy policies apply to the customer. This notice supersedes all previously issued privacy disclosures. For more information about Eaton Vance’s Privacy Policy, please call1-800-262-1122.
Delivery of Shareholder Documents. The Securities and Exchange Commission (SEC) permits funds to deliver only one copy of shareholder documents, including prospectuses, proxy statements and shareholder reports, to fund investors with multiple accounts at the same residential or post office box address. This practice is often called “householding” and it helps eliminate duplicate mailings to shareholders.Eaton Vance, or your financial advisor, may household the mailing of your documents indefinitely unless you instruct Eaton Vance, or your financial advisor, otherwise.If you would prefer that your Eaton Vance documents not be householded, please contact Eaton Vance at1-800-260-0761, or contact your financial advisor. Your instructions that householding not apply to delivery of your Eaton Vance documents will typically be effective within 30 days of receipt by Eaton Vance or your financial advisor.
Portfolio Holdings. Each Eaton Vance Fund and its underlying Portfolio(s) (if applicable) will file a schedule of portfolio holdings on FormN-Q with the SEC for the first and third quarters of each fiscal year. The FormN-Q will be available on the Eaton Vance website at www.eatonvance.com, by calling Eaton Vance at1-800-260-0761 or in the EDGAR database on the SEC’s website at www.sec.gov. FormN-Q may also be reviewed and copied at the SEC’s public reference room in Washington, D.C. (call1-800-732-0330 for information on the operation of the public reference room).
Proxy Voting. From time to time, funds are required to vote proxies related to the securities held by the funds. The Eaton Vance Funds or their underlying Portfolios (if applicable) vote proxies according to a set of policies and procedures approved by the Funds’ and Portfolios’ Boards. You may obtain a description of these policies and procedures and information on how the Funds or Portfolios voted proxies relating to portfolio securities during the most recent12-month period ended June 30, without charge, upon request, by calling1-800-260-0761 and by accessing the SEC’s website at www.sec.gov.
Investment Adviser and Administrator
Eaton Vance Management
Two International Place
Boston, MA 02110
InvestmentSub-Adviser
Parametric Portfolio Associates LLC
1918 Eighth Avenue, Suite 3100
Seattle, WA 98101
Principal Underwriter*
Eaton Vance Distributors, Inc.
Two International Place
Boston, MA 02110
(617)482-8260
Custodian
State Street Bank and Trust Company
State Street Financial Center, One Lincoln Street
Boston, MA 02111
Transfer Agent
BNY Mellon Investment Servicing (US) Inc.
Attn: Eaton Vance Funds
P.O. Box 9653
Providence, RI 02940-9653
(800)260-0761
Independent Registered Public Accounting Firm
Deloitte & Touche LLP
200 Berkeley Street
Boston, MA 02116-5022
Fund Offices
Two International Place
Boston, MA 02110
| * | FINRA BrokerCheck. Investors may check the background of their Investment Professional by contacting the Financial Industry Regulatory Authority (FINRA). FINRA BrokerCheck is a free tool to help investors check the professional background of current and former FINRA-registered securities firms and brokers. FINRA BrokerCheck is available by calling1-800-289-9999 and at www.FINRA.org. The FINRA BrokerCheck brochure describing this program is available to investors at www.FINRA.org. |

24691 1.31.19
Item 2. Code of Ethics
The registrant has adopted a code of ethics applicable to its Principal Executive Officer, Principal Financial Officer and Principal Accounting Officer. The registrant undertakes to provide a copy of such code of ethics to any person upon request, without charge, by calling1-800-262-1122. The registrant has not amended the code of ethics as described in FormN-CSR during the period covered by this report. The registrant has not granted any waiver, including an implicit waiver, from a provision of the code of ethics as described in FormN-CSR during the period covered by this report.
Item 3. Audit Committee Financial Expert
The registrant’s Board has designated George J. Gorman and William H. Park, each an independent trustee, as audit committee financial experts. Mr. Gorman is a certified public accountant who is the Principal at George J. Gorman LLC (a consulting firm). Previously, Mr. Gorman served in various capacities at Ernst & Young LLP (a registered public accounting firm), including as Senior Partner. Mr. Gorman also has experience serving as an independent trustee and audit committee financial expert of other mutual fund complexes. Mr. Park is a certified public accountant who is a private investor. Previously, he served as a consultant, as the Chief Financial Officer of Aveon Group, L.P. (an investment management firm), as the Vice Chairman of Commercial Industrial Finance Corp. (specialty finance company), as President and Chief Executive Officer of Prizm Capital Management, LLC (investment management firm), as Executive Vice President and Chief Financial Officer of United Asset Management Corporation (an institutional investment management firm) and as a Senior Manager at Price Waterhouse (now PricewaterhouseCoopers) (a registered public accounting firm).
Item 4. Principal Accountant Fees and Services
Eaton Vance Emerging Markets Debt Fund, Parametric Emerging Markets Fund, Parametric International Equity Fund and Parametric Volatility Risk Premium - Defensive Fund (the “Fund(s)”) are series of Eaton Vance Mutual Funds Trust (the “Trust”), a Massachusetts business trust, which, including the Funds, contains a total of 34 series (the “Series”). The Trust is registered under the Investment Company Act of 1940 as anopen-end management investment company. This FormN-CSR relates to the Funds’ annual reports.
(a)-(d)
The following table presents the aggregate fees billed to each Fund for the Fund’s fiscal periods ended January 31, 2018 and January 31, 2019 by the registrant’s principal accountant, Deloitte & Touche LLP (“D&T”), for professional services rendered for the audit of the Fund’s annual financial statements and fees billed for other services rendered by D&T during such periods.
| | | | |
Eaton Vance Emerging Markets Debt Fund Fiscal Period Ended* | | 1/31/19 | |
Audit Fees | | $ | 37,050 | |
Audit-Related Fees(1) | | $ | 0 | |
Tax Fees(2) | | $ | 16,000 | |
All Other Fees(3) | | $ | 0 | |
| | | | |
Total | | $ | 53,050 | |
| | | | |
| * | This fund commenced operations on May 1, 2018. |
| | | | | | | | |
Parametric Emerging Markets Fund Fiscal Years Ended | | 1/31/18 | | | 1/31/19 | |
Audit Fees | | $ | 80,670 | | | $ | 80,670 | |
Audit-Related Fees(1) | | $ | 0 | | | $ | 0 | |
Tax Fees(2) | | $ | 18,235 | | | $ | 36,008 | |
All Other Fees(3) | | $ | 0 | | | $ | 0 | |
| | | | | | | | |
Total | | $ | 98,905 | | | $ | 116,678 | |
| | | | | | | | |
| | | | | | | | |
Parametric International Equity Fund Fiscal Years Ended | | 1/31/18 | | | 1/31/19 | |
Audit Fees | | $ | 36,910 | | | $ | 36,910 | |
Audit-Related Fees(1) | | $ | 0 | | | $ | 0 | |
Tax Fees(2) | | $ | 14,549 | | | $ | 15,124 | |
All Other Fees(3) | | $ | 0 | | | $ | 0 | |
| | | | | | | | |
Total | | $ | 51,459 | | | $ | 52,034 | |
| | | | | | | | |
| | | | | | | | |
Parametric Volatility Risk Premium — Defensive Fund Fiscal Period Ended * | | 1/31/18 | | | 1/31/19 | |
Audit Fees | | $ | 37,050 | | | $ | 37,050 | |
Audit-Related Fees(1) | | $ | 0 | | | $ | 0 | |
Tax Fees(2) | | $ | 20,100 | | | $ | 18,825 | |
All Other Fees(3) | | $ | 0 | | | $ | 0 | |
| | | | | | | | |
Total | | $ | 57,150 | | | $ | 55,875 | |
| | | | | | | | |
| * | This fund commenced operations on February 9, 2017. |
| (1) | Audit-related fees consist of the aggregate fees billed for assurance and related services that are reasonably related to the performance of the audit of financial statements and are not reported under the category of audit fees. |
| (2) | Tax fees consist of the aggregate fees billed for professional services rendered by the principal accountant relating to tax compliance, tax advice, and tax planning and specifically include fees for tax return preparation and other related tax/compliance planning matters. |
| (3) | All other fees consist of the aggregate fees billed for products and services provided by the principal accountant other than audit, audit-related, and tax services. |
The various Series comprising the Trust have differing fiscal year ends (January 31, February 28, July 31*, September 30, October 31 or December 31). The following table presents the aggregate audit, audit-related, tax, and other fees billed to all of the Series in the Trust by D&T for the last two fiscal years of each Series.
| | | | | | | | | | | | | | | | | | | | | | | | | | | | | | | | | | | | | | | | | | | | |
Fiscal
Years
Ended | | 2/28/17 | | | 8/31/17* | | | 9/30/17 | | | 10/31/17 | | | 12/31/17 | | | 1/31/18 | | | 2/28/18 | | | 9/30/18 | | | 10/31/18 | | | 12/31/18 | | | 1/31/19 | |
Audit Fees | | $ | 25,850 | | | $ | 48,950 | | | $ | 99,675 | | | $ | 571,663 | | | $ | 105,320 | | | $ | 154,630 | | | $ | 25,850 | | | $ | 99,625 | | | $ | 621,075 | | | $ | 105,320 | | | $ | 191,680 | |
Audit-Related Fees(1) | | $ | 0 | | | $ | 0 | | | $ | 0 | | | $ | 0 | | | $ | 0 | | | $ | 0 | | | $ | 0 | | | $ | 0 | | | $ | 0 | | | $ | 0 | | | $ | 0 | |
Tax Fees(2) | | $ | 9,744 | | | $ | 12,420 | | | $ | 25,606 | | | $ | 351,829 | | | $ | 63,439 | | | $ | 52,884 | | | $ | 9,890 | | | $ | 28,606 | | | $ | 430,938 | | | $ | 65,089 | | | $ | 85,957 | |
All Other Fees(3) | | $ | 0 | | | $ | 0 | | | $ | 0 | | | $ | 0 | | | $ | 0 | | | $ | 0 | | | $ | 0 | | | $ | 0 | | | $ | 0 | | | $ | 0 | | | $ | 0 | |
| | | | | | | | | | | | | | | | | | | | | | | | | | | | | | | | | | | | | | | | | | | | |
Total | | $ | 35,594 | | | $ | 61,370 | | | $ | 125,281 | | | $ | 923,492 | | | $ | 168,759 | | | $ | 207,514 | | | $ | 35,740 | | | $ | 128,231 | | | $ | 1,052,013 | | | $ | 170,409 | | | $ | 277,637 | |
| | | | | | | | | | | | | | | | | | | | | | | | | | | | | | | | | | | | | | | | | | | | |
| * | As of 12/15/2017, no Series in the Trust had an August 31 fiscal year end. .Information is not presented for fiscal years ended 7/31/18 and 8/31/18, as no Series in the Trust with such fiscal years end were in operation during such period. |
| (1) | Audit-related fees consist of the aggregate fees billed for assurance and related services that are reasonably related to the performance of the audit of financial statements and are not reported under the category of audit fees. |
| (2) | Tax fees consist of the aggregate fees billed for professional services rendered by the principal accountant relating to tax compliance, tax advice, and tax planning and specifically include fees for tax return preparation and other related tax/compliance planning matters. |
| (3) | All other fees consist of the aggregate fees billed for products and services provided by the principal accountant other than audit, audit-related, and tax services. |
(e)(1) The registrant’s audit committee has adopted policies and procedures relating to thepre-approval of services provided by the registrant’s principal accountant (the“Pre-Approval Policies”). ThePre-Approval Policies establish a framework intended to assist the audit committee in the proper discharge of itspre-approval responsibilities. As a general matter, thePre-Approval Policies (i) specify certain types of audit, audit-related, tax, and other services determined to bepre-approved by the audit committee; and (ii) delineate specific procedures governing the mechanics of thepre-approval process, including the approval and monitoring of audit andnon-audit service fees. Unless a service is specificallypre-approved under thePre-Approval Policies, it must be separatelypre-approved by the audit committee.
ThePre-Approval Policies and the types of audit andnon-audit servicespre-approved therein must be reviewed and ratified by the registrant’s audit committee at least annually. The registrant’s audit committee maintains full responsibility for the appointment, compensation, and oversight of the work of the registrant’s principal accountant.
(e)(2) No services described in paragraphs (b)-(d) above were approved by the registrant’s audit committee pursuant to the “de minimis exception” set forth in Rule2-01(c)(7)(i)(C) of RegulationS-X.
(f) Not applicable.
(g)The following table presents (i) the aggregatenon-audit fees (i.e., fees for audit-related, tax, and other services) billed for services rendered to all of the Series in the Trust by D&T for the last two fiscal years of each Series; and (ii) the aggregatenon-audit fees (i.e., fees for audit-related, tax, and other services) billed to the Eaton Vance organization by D&T for the last two fiscal years of each Series.
| | | | | | | | | | | | | | | | | | | | | | | | | | | | | | | | | | | | | | | | | | | | |
Fiscal Years Ended | | 2/28/17 | | | 8/31/17* | | | 9/30/17 | | | 10/31/17 | | | 12/31/17 | | | 1/31/18 | | | 2/28/18 | | | 9/30/18 | | | 10/31/18 | | | 12/31/18 | | | 1/31/19 | |
Registrant(1) | | $ | 9,744 | | | $ | 12,420 | | | $ | 25,606 | | | $ | 351,829 | | | $ | 63,439 | | | $ | 52,884 | | | $ | 9,890 | | | $ | 28,606 | | | $ | 430,938 | | | $ | 65,089 | | | $ | 85,957 | |
Eaton Vance(2) | | $ | 46,000 | | | $ | 148,018 | | | $ | 148,018 | | | $ | 148,018 | | | $ | 148,018 | | | $ | 148,018 | | | $ | 148,018 | | | $ | 126,485 | | | $ | 126,485 | | | $ | 126,485 | | | $ | 126,485 | |
| * | As of 12/15/2017, no Series in the Trust had an August 31 fiscal year end. Information is not presented for fiscal years ended 7/31/18 and 8/31/18, as no Series in the Trust with such fiscal years end were in operation during such period. |
| (1) | Includes all of the Series of the Trust. During the fiscal years reported above, certain of the Funds were “feeder” funds in a “master-feeder” fund structure or funds of funds. |
| (2) | Various subsidiaries of Eaton Vance Corp. act in either an investment advisory and/or service provider capacity with respect to the Series and/or their respective “master” funds (if applicable). |
(h) The registrant’s audit committee has considered whether the provision by the registrant’s principal accountant ofnon-audit services to the registrant’s investment adviser and any entity controlling, controlled by, or under common control with the adviser that provides ongoing services to the registrant that were notpre-approved pursuant to Rule2-01(c)(7)(ii) of RegulationS-X is compatible with maintaining the principal accountant’s independence.
Item 5. Audit Committee of Listed Registrants
Not applicable.
Item 6. Schedule of Investments
Please see schedule of investments contained in the Report to Stockholders included under Item 1 of this FormN-CSR.
Item 7. Disclosure of Proxy Voting Policies and Procedures forClosed-End Management Investment Companies
Not applicable.
Item 8. Portfolio Managers ofClosed-End Management Investment Companies
Not applicable.
Item 9. Purchases of Equity Securities byClosed-End Management Investment Company and Affiliated Purchasers
Not applicable.
Item 10. Submission of Matters to a Vote of Security Holders
No material changes.
Item 11. Controls and Procedures
(a) It is the conclusion of the registrant’s principal executive officer and principal financial officer that the effectiveness of the registrant’s current disclosure controls and procedures (such disclosure controls and procedures having been evaluated within 90 days of the date of this filing) provide reasonable assurance that the information required to be disclosed by the registrant has been recorded, processed, summarized and reported within the time period specified in the Commission’s rules and forms and that the information required to be disclosed by the registrant has been accumulated and communicated to the registrant’s principal executive officer and principal financial officer in order to allow timely decisions regarding required disclosure.
(b) There have been no changes in the registrant’s internal controls over financial reporting during the second fiscal quarter of the period covered by this report that has materially affected, or is reasonably likely to materially affect, the registrant’s internal control over financial reporting.
Item 12. Disclosure of Securities Lending Activities forClosed-End Management Investment Companies
Not applicable.
Item 13. Exhibits
| | |
| |
(a)(1) | | Registrant’s Code of Ethics – Not applicable (please see Item 2). |
| |
(a)(2)(i) | | Treasurer’s Section 302 certification. |
| |
(a)(2)(ii) | | President’s Section 302 certification. |
| |
(b) | | Combined Section 906 certification. |
Signatures
Pursuant to the requirements of the Securities Exchange Act of 1934 and the Investment Company Act of 1940, the registrant has duly caused this report to be signed on its behalf by the undersigned, thereunto duly authorized.
Eaton Vance Mutual Funds Trust
| | |
| By: | | /s/ Payson F. Swaffield |
| | Payson F. Swaffield |
| | President |
| |
| Date: | | March 22, 2019 |
Pursuant to the requirements of the Securities Exchange Act of 1934 and the Investment Company Act of 1940, this report has been signed below by the following persons on behalf of the registrant and in the capacities and on the dates indicated.
| | |
| By: | | /s/ James F. Kirchner |
| | James F. Kirchner |
| | Treasurer |
| |
| Date: | | March 22, 2019 |
| |
| By: | | /s/ Payson F. Swaffield |
| | Payson F. Swaffield |
| | President |
| |
| Date: | | March 22, 2019 |