UNITED STATES
SECURITIES AND EXCHANGE COMMISSION
Washington, D.C. 20549
FormN-CSR
CERTIFIED SHAREHOLDER REPORT OF REGISTERED
MANAGEMENT INVESTMENT COMPANIES
Investment Company Act File Number:811-04015
Eaton Vance Mutual Funds Trust
(Exact Name of Registrant as Specified in Charter)
Two International Place, Boston, Massachusetts 02110
(Address of Principal Executive Offices)
Maureen A. Gemma
Two International Place, Boston, Massachusetts 02110
(Name and Address of Agent for Services)
(617)482-8260
(Registrant’s Telephone Number)
September 30
Date of Fiscal Year End
September 30, 2019
Date of Reporting Period
Item 1. Reports to Stockholders

Eaton Vance
Core Plus Bond Fund
Annual Report
September 30, 2019
Important Note. Beginning on January 1, 2021, as permitted by regulations adopted by the Securities and Exchange Commission, paper copies of the Fund’s annual and semi-annual shareholder reports will no longer be sent by mail unless you specifically request paper copies of the reports. Instead, the reports will be made available on the Fund’s website (eatonvance.com/funddocuments), and you will be notified by mail each time a report is posted and provided with a website address to access the report.
If you already elected to receive shareholder reports electronically, you will not be affected by this change and you need not take any action. If you are a direct investor, you may elect to receive shareholder reports and other communications from the Fund electronically by signing up for e-Delivery at eatonvance.com/edelivery. If you own your shares through a financial intermediary (such as a broker-dealer or bank), you must contact your financial intermediary to sign up.
You may elect to receive all future Fund shareholder reports in paper free of charge. If you are a direct investor, you can inform the Fund that you wish to continue receiving paper copies of your shareholder reports by calling 1-800-262-1122. If you own these shares through a financial intermediary, you must contact your financial intermediary or follow instructions included with this disclosure, if applicable, to elect to continue to receive paper copies of your shareholder reports. Your election to receive reports in paper will apply to all Eaton Vance funds held directly or to all funds held through your financial intermediary, as applicable.

Commodity Futures Trading Commission Registration. Effective December 31, 2012, the Commodity Futures Trading Commission (“CFTC”) adopted certain regulatory changes that subject registered investment companies and advisers to regulation by the CFTC if a fund invests more than a prescribed level of its assets in certain CFTC-regulated instruments (including futures, certain options and swap agreements) or markets itself as providing investment exposure to such instruments. The Fund has claimed an exclusion from the definition of the term “commodity pool operator” under the Commodity Exchange Act. Accordingly, neither the Fund nor the adviser with respect to the operation of the Fund is subject to CFTC regulation. Because of its management of other strategies, the Fund’s adviser is registered with the CFTC as a commodity pool operator and a commodity trading advisor.
Fund shares are not insured by the FDIC and are not deposits or other obligations of, or guaranteed by, any depository institution. Shares are subject to investment risks, including possible loss of principal invested.
This report must be preceded or accompanied by a current summary prospectus or prospectus. Before investing, investors should consider carefully the investment objective, risks, and charges and expenses of a mutual fund. This and other important information is contained in the summary prospectus and prospectus, which can be obtained from a financial intermediary. Prospective investors should read the prospectus carefully before investing. For further information, please call 1-800-262-1122.
Annual ReportSeptember 30, 2019
Eaton Vance
Core Plus Bond Fund
Table of Contents
| | | | |
Management’s Discussion of Fund Performance | | | 2 | |
| |
Performance | | | 3 | |
| |
Fund Profile | | | 4 | |
| |
Endnotes and Additional Disclosures | | | 5 | |
| |
Fund Expenses | | | 6 | |
| |
Financial Statements | | | 7 | |
| |
Report of Independent Registered Public Accounting Firm | | | 27 | |
| |
Federal Tax Information | | | 28 | |
| |
Board of Trustees’ Contract Approval | | | 29 | |
| |
Management and Organization | | | 32 | |
| |
Important Notices | | | 34 | |
Eaton Vance
Core Plus Bond Fund
September 30, 2019
Management’s Discussion of Fund Performance1
Economic and Market Conditions
During the12-month period ended September 30, 2019, investors witnessed a dramatic turnaround in U.S. fixed-income markets. The rising interest-rate environment at the beginning of the period gave way to a falling interest-rate climate against the backdrop of multiple domestic and international uncertainties.
With U.S. economic data largely positive in calendar year 2018, the U.S. Federal Reserve Board (the Fed) raised its benchmark federal funds rate four times — from a low range of1.50%-1.75% to2.25%-2.50% — with the last quarter-point increase on December 19, 2018.
As 2018 came to a close, investors became increasingly concerned about a growing U.S.-China trade war and looming U.S. government shutdown. In connection with its December 2018 rate hike, the Fed lowered its number of projected interest-rate increases in 2019 from three to two, which some investors viewed as indicating weakness in the U.S. economy. The result was a “flight to quality” by investors seeking the relative safety of fixed-income investments over stocks. This bond rally pushed longer-term bond prices up and yields down in the final month of 2018.
The first two months of 2019 were relatively quiet for bonds. Downward pressure on interest rates and upward pressure on prices resumed in March 2019 and continued through the end of the period propelled by lower-than-desired inflation, Brexit concerns, low European interest rates, andon-again/off-again trade-conflict rhetoric. This combination of factors fueled investor concerns about both U.S. and global growth potential during the period.
After holding interest rates steady through the first half of 2019, the Fed cut its benchmark interest rate to2.00%-2.25% on July 31 — its first reduction in over a decade — followed by a second interest-rate drop to1.75%-2.00% on September 18. Lower rates are intended to help stimulate economic activity by making borrowing costs relatively more affordable.
As a whole, the12-month period ended September 30, 2019, was marked by strong performance across U.S. bond markets. As investors searched for yield in an ongoing low interest-rate environment, lower-rated5 investment-grade bonds generally outperformed higher-rated investment-grade bonds, while longer-duration6 issues outperformed shorter-duration issues during the period. In addition, the Bloomberg Barclays U.S. Aggregate Bond Index (the Index),2 a broad measure of the U.S. bond market, returned 10.30%, outperforming the 4.25% return of the S&P 500® Index, a broad measure of the U.S. stock market.
U.S. investment-grade corporate bonds, driven by continued strength in the U.S. economy, were among the best-performing bond asset classes during the period, with the Bloomberg Barclays U.S. Corporate Bond Index returning 13.00%. Worries about slowing global growth, however, weighed on the high yield sector, one of the weaker fixed-income areas, with the ICE BofAML
U.S. High Yield Index returning 6.30% during the period.
Fund Performance
For the12-month period ended September 30, 2019, Eaton Vance Core Plus Bond Fund (the Fund) returned 7.76% for Class A shares at net asset value (NAV), underperforming its benchmark, the Index which returned 10.30%.
The Fund trailed the Index due to its underweight allocation to U.S. Treasury bonds, which outperformed during the period. Fund management took a cautious stance toward U.S. Treasurys due to concern about high valuations. However, amid the U.S. trade war with China and other economic uncertainties, investors sought safe havens, driving U.S. Treasury prices higher.
During the period, the Fund increased its allocation to investment-grade corporate bonds, dollar-denominated bonds issued outside the U.S. and high yield securities. Fund management maintained an inflation-defensive investment approach during most of the period given their expectation of rising inflation. Late in the period, Fund management changed to a more benign view of inflation and adjusted the Fund portfolio accordingly.
In addition to the Fund’s underweight in U.S. Treasurys, an overweight allocation to U.S. Treasury Inflation Protected Securities (TIPS), anout-of-Index segment, also detracted from relative performance versus the Index. TIPS underperformed during the period, as inflation was dormant.
In the convertible bond segment, also out of Index, the Fund’s overweight position as well as security selection detracted from Fund returns relative to the Index. In particular, the Fund’s holdings of debt issuances by oil and gas driller Chesapeake Energy Corp. constrained Fund performance during a period of low energy prices. The Fund’s allocation to high yield bonds, anotherout-of-Index segment, also hampered Fund performance relative to the Index.
On the positive side, the Fund’s overweight allocation to U.S. dollar-denominated emerging market corporate bonds contributed to Fund returns relative to the Index during the period. The Fund’s holdings were concentrated in Brazil and Mexico, which benefited from economic reforms instituted by new governments in both countries.
The Fund’s overweight position in commercial mortgage-backed securities (CMBS) boosted Fund returns relative to the Index. Investor worries about one particular CMBS sector — retail loans — drove broad negative investor sentiment across the entire CMBS market. However, with commercial real estate extending its strong financial performance, the CMBS segment, including retail, delivered solid returns during a period of relative U.S. economic strength.
The Fund’s overweight position in asset-backed securities (ABS) also contributed to Fund performance relative to the Index during the period. The ABS segment, which includes securities backed by automobiles and other consumer assets, outperformed as consumer balance sheets were generally healthy during the period. In addition, the uncertain economic outlook along with concerns about security valuations led Fund management to maintain an above-average cash position, which aided relative Fund performance versus the Index during the period.
See Endnotes and Additional Disclosures in this report.
Past performance is no guarantee of future results. Returns are historical and are calculated by determining the percentage change in net asset value (NAV) or offering price (as applicable) with all distributions reinvested. Investment return and principal value will fluctuate so that shares, when redeemed, may be worth more or less than their original cost. Performance less than or equal to one year is cumulative. Performance is for the stated time period only; due to market volatility, the Fund’s current performance may be lower or higher than quoted. Returns are before taxes unless otherwise noted. For performance as of the most recentmonth-end, please refer to eatonvance.com.
Eaton Vance
Core Plus Bond Fund
September 30, 2019
Performance2,3
Portfolio ManagersMatthew T. Buckley, CFA, John H. Croft, CFA and Vishal Khanduja, CFA
| | | | | | | | | | | | | | | | | | | | |
| % Average Annual Total Returns | | Class Inception Date | | | Performance Inception Date | | | One Year | | | Five Years | | | Since Inception | |
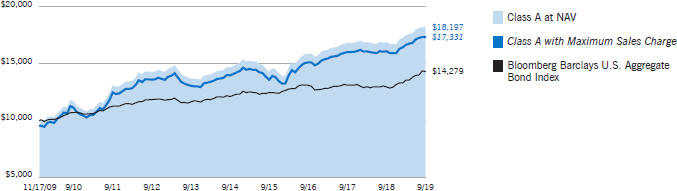
Class A at NAV | | | 11/17/2009 | | | | 11/17/2009 | | | | 7.76 | % | | | 4.41 | % | | | 6.25 | % |
Class A with 4.75% Maximum Sales Charge | | | — | | | | — | | | | 2.62 | | | | 3.40 | | | | 5.73 | |
Class C at NAV | | | 11/17/2009 | | | | 11/17/2009 | | | | 7.05 | | | | 3.65 | | | | 5.48 | |
Class C with 1% Maximum Sales Charge | | | — | | | | — | | | | 6.05 | | | | 3.65 | | | | 5.48 | |
Class I at NAV | | | 11/17/2009 | | | | 11/17/2009 | | | | 8.12 | | | | 4.69 | | | | 6.51 | |
Bloomberg Barclays U.S. Aggregate Bond Index | | | — | | | | — | | | | 10.30 | % | | | 3.38 | % | | | 3.67 | % |
| | | | | |
| | | | | | | | | | | | | | | | | | | | |
| % Total Annual Operating Expense Ratios4 | | | | | | | | Class A | | | Class C | | | Class I | |
Gross | | | | | | | | | | | 0.96 | % | | | 1.71 | % | | | 0.71 | % |
Net | | | | | | | | | | | 0.74 | | | | 1.49 | | | | 0.49 | |
Growth of $10,000
This graph shows the change in value of a hypothetical investment of $10,000 in Class A of the Fund for the period indicated. For comparison, the same investment is shown in the indicated index.
| | | | | | | | | | | | | | | | |
| Growth of Investment | | Amount Invested | | | Period Beginning | | | At NAV | | | With Maximum Sales Charge | |
Class C | | $ | 10,000 | | | | 11/17/2009 | | | $ | 16,933 | | | | N.A. | |
Class I | | $ | 250,000 | | | | 11/17/2009 | | | $ | 465,907 | | | | N.A. | |
See Endnotes and Additional Disclosures in this report.
Past performance is no guarantee of future results. Returns are historical and are calculated by determining the percentage change in net asset value (NAV) or offering price (as applicable) with all distributions reinvested. Investment return and principal value will fluctuate so that shares, when redeemed, may be worth more or less than their original cost. Performance less than or equal to one year is cumulative. Performance is for the stated time period only; due to market volatility, the Fund’s current performance may be lower or higher than quoted. Returns are before taxes unless otherwise noted. For performance as of the most recentmonth-end, please refer to eatonvance.com.
Eaton Vance
Core Plus Bond Fund
September 30, 2019
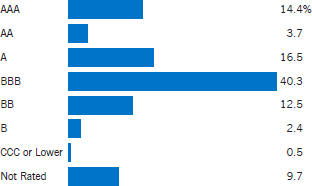
Fund Profile
Credit Quality (% of bond holdings)5
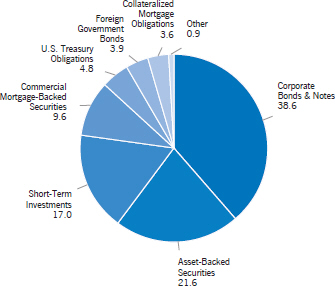
Asset Allocation (% of total investments)
See Endnotes and Additional Disclosures in this report.
Eaton Vance
Core Plus Bond Fund
September 30, 2019
Endnotes and Additional Disclosures
| 1 | The views expressed in this report are those of the portfolio manager(s) and are current only through the date stated at the top of this page. These views are subject to change at any time based upon market or other conditions, and Eaton Vance and the Fund(s) disclaim any responsibility to update such views. These views may not be relied upon as investment advice and, because investment decisions are based on many factors, may not be relied upon as an indication of trading intent on behalf of any Eaton Vance fund. This commentary may contain statements that are not historical facts, referred to as “forward looking statements.” The Fund’s actual future results may differ significantly from those stated in any forward looking statement, depending on factors such as changes in securities or financial markets or general economic conditions, the volume of sales and purchases of Fund shares, the continuation of investment advisory, administrative and service contracts, and other risks discussed from time to time in the Fund’s filings with the Securities and Exchange Commission. |
| 2 | Bloomberg Barclays U.S. Aggregate Bond Index is an unmanaged index of domestic investment-grade bonds, including corporate, government and mortgage-backed securities. Bloomberg Barclays U.S. Corporate Bond Index measures the performance of investment-grade U.S. corporate securities with a maturity of one year or more. S&P 500® Index is an unmanaged index oflarge-cap stocks commonly used as a measure of U.S. stock market performance. S&P Dow Jones Indices are a product of S&P Dow Jones Indices LLC (“S&P DJI”) and have been licensed for use. S&P® and S&P 500® are registered trademarks of S&P DJI; Dow Jones® is a registered trademark of Dow Jones Trademark Holdings LLC (“Dow Jones”); S&P DJI, Dow Jones and their respective affiliates do not sponsor, endorse, sell or promote the Fund, will not have any liability with respect thereto and do not have any liability for any errors, omissions, or interruptions of the S&P Dow Jones Indices. ICE BofAML U.S. High Yield Index is an unmanaged index of below-investment grade U.S. corporate bonds. ICE® BofAML® indices are not for redistribution or other uses; provided “as is”, without warranties, and with no liability. Eaton Vance has prepared this report and ICE Data Indices, LLC does not endorse it, or guarantee, review, or endorse Eaton Vance’s products. BofAML® is a licensed registered trademark of Bank of America Corporation in the United States and other countries. Unless otherwise stated, index returns do not reflect the effect of any applicable sales charges, commissions, expenses, taxes or leverage, as applicable. It is not possible to invest directly in an index. |
| 3 | Total Returns at NAV do not include applicable sales charges. If sales charges were deducted, the returns would be lower. Total Returns shown with maximum sales charge reflect the stated maximum sales charge. Unless otherwise stated, performance does not reflect the deduction of taxes on Fund distributions or redemptions of Fund shares. Performance since inception for an index, if presented, is the performance since the Fund’s or oldest share class’ inception, as applicable. |
| | Effective May 1, 2015, the Fund changed its investment objective and policies. Prior to May 1, 2015, the Fund invested primarily in Build America Bonds. Performance prior to May 1, 2015 reflects the Fund’s performance under its former investment objective and policies. |
| 4 | Source: Fund prospectus. Net expense ratios reflect a contractual expense reimbursement that continues through 1/31/20. Without the reimbursement, performance would have been lower. The expense ratios for the current reporting period can be found in the Financial Highlights section of this report. |
| 5 | Ratings are based on Moody’s Investors Service, Inc. (“Moody’s”), S&P Global Ratings (“S&P”) or Fitch Ratings (“Fitch”), as applicable. If securities are rated differently by the ratings agencies, the highest rating is applied. Ratings, which are subject to change, apply to the creditworthiness of the issuers of the underlying securities and not to the Fund or its shares. Credit ratings measure the quality of a bond based on the issuer’s creditworthiness, with ratings ranging from AAA, being the highest, to D, being the lowest based on S&P’s measures. Ratings of BBB or higher by S&P or Fitch (Baa or higher by Moody’s) are considered to be investment-grade quality. Credit ratings are based largely on the ratings agency’s analysis at the time of rating. The rating assigned to any particular security is not necessarily a reflection of the issuer’s current financial condition and does not necessarily reflect its assessment of the volatility of a security’s market value or of the liquidity of an investment in the security. Holdings designated as “Not Rated” (if any) are not rated by the national ratings agencies stated above. |
| 6 | Duration is a measure of the expected change in price of a bond — in percentage terms — given a one percent change in interest rates, all else being constant. Securities with lower durations tend to be less sensitive to interest rate changes. |
Fund profile subject to change due to active management.
Important Notice to Shareholders
| | Effective June 24, 2019 the portfolio managers of the Fund are Matthew T. Buckley, John H. Croft and Vishal Khanduja. |
Eaton Vance
Core Plus Bond Fund
September 30, 2019
Fund Expenses
Example: As a Fund shareholder, you incur two types of costs: (1) transaction costs, including sales charges (loads) on purchases and redemption fees (if applicable); and (2) ongoing costs, including management fees; distribution and/or service fees; and other Fund expenses. This Example is intended to help you understand your ongoing costs (in dollars) of Fund investing and to compare these costs with the ongoing costs of investing in other mutual funds. The Example is based on an investment of $1,000 invested at the beginning of the period and held for the entire period (April 1, 2019 – September 30, 2019).
Actual Expenses: The first section of the table below provides information about actual account values and actual expenses. You may use the information in this section, together with the amount you invested, to estimate the expenses that you paid over the period. Simply divide your account value by $1,000 (for example, an $8,600 account value divided by $1,000 = 8.6), then multiply the result by the number in the first section under the heading entitled “Expenses Paid During Period” to estimate the expenses you paid on your account during this period.
Hypothetical Example for Comparison Purposes: The second section of the table below provides information about hypothetical account values and hypothetical expenses based on the actual Fund expense ratio and an assumed rate of return of 5% per year (before expenses), which is not the actual Fund return. The hypothetical account values and expenses may not be used to estimate the actual ending account balance or expenses you paid for the period. You may use this information to compare the ongoing costs of investing in your Fund and other funds. To do so, compare this 5% hypothetical example with the 5% hypothetical examples that appear in the shareholder reports of the other funds.
Please note that the expenses shown in the table are meant to highlight your ongoing costs only and do not reflect any transactional costs, such as sales charges (loads) or redemption fees (if applicable). Therefore, the second section of the table is useful in comparing ongoing costs only, and will not help you determine the relative total costs of owning different funds. In addition, if these transactional costs were included, your costs would be higher.
| | | | | | | | | | | | | | | | |
| | | Beginning
Account Value
(4/1/19) | | | Ending
Account Value
(9/30/19) | | | Expenses Paid
During Period*
(4/1/19 – 9/30/19) | | | Annualized
Expense
Ratio | |
| | | | |
Actual | | | | | | | | | | | | | | | | |
Class A | | $ | 1,000.00 | | | $ | 1,041.60 | | | $ | 3.79 | ** | | | 0.74 | % |
Class C | | $ | 1,000.00 | | | $ | 1,038.60 | | | $ | 7.61 | ** | | | 1.49 | % |
Class I | | $ | 1,000.00 | | | $ | 1,043.80 | | | $ | 2.51 | ** | | | 0.49 | % |
| | | | |
Hypothetical | | | | | | | | | | | | | |
(5% return per year before expenses) | | | | | | | | | | | | | |
Class A | | $ | 1,000.00 | | | $ | 1,021.40 | | | $ | 3.75 | ** | | | 0.74 | % |
Class C | | $ | 1,000.00 | | | $ | 1,017.60 | | | $ | 7.54 | ** | | | 1.49 | % |
Class I | | $ | 1,000.00 | | | $ | 1,022.60 | | | $ | 2.48 | ** | | | 0.49 | % |
| * | Expenses are equal to the Fund’s annualized expense ratio for the indicated Class, multiplied by the average account value over the period, multiplied by 183/365 (to reflect the one-half year period). The Example assumes that the $1,000 was invested at the net asset value per share determined at the close of business on March 31, 2019. |
| ** | Absent an allocation of certain expenses to an affiliate, expenses would be higher. |
Eaton Vance
Core Plus Bond Fund
September 30, 2019
Portfolio of Investments
| | | | | | | | | | | | |
| Corporate Bonds & Notes — 38.5% | |
| Security | | | | | Principal Amount
(000’s omitted) | | | Value | |
|
| Aerospace & Defense — 0.7% | |
| | | |
Azul Investments LLP, 5.875%, 10/26/24(1) | | | | | | $ | 5,665 | | | $ | 5,672,081 | |
| | | |
| | | | | | | | | | | $ | 5,672,081 | |
|
| Automotive — 0.1% | |
| | | |
Ford Motor Credit Co., LLC, 4.542%, 8/1/26 | | | | | | $ | 733 | | | $ | 733,711 | |
| | | |
| | | | | | | | | | | $ | 733,711 | |
|
| Banks — 4.1% | |
| | | |
Banco Mercantil del Norte SA/Grand Cayman, 5.75% to 10/4/26, 10/4/31(1)(2) | | | | | | $ | 6,225 | | | $ | 6,248,406 | |
| | | |
Banco Mercantil del Norte SA/Grand Cayman, 7.50% to 6/27/29(1)(2)(3) | | | | | | | 745 | | | | 757,106 | |
| | | |
Banco Santander SA, 3.80%, 2/23/28 | | | | | | | 6,400 | | | | 6,711,577 | |
| | | |
Barclays PLC, 5.088% to 6/20/29, 6/20/30(2) | | | | | | | 3,340 | | | | 3,488,363 | |
| | | |
BBVA Bancomer SA, 5.125% to 1/17/28, 1/18/33(1)(2) | | | | | | | 5,320 | | | | 5,087,250 | |
| | | |
Commonwealth Bank of Australia, 3.61% to 9/12/29, 9/12/34(1)(2) | | | | | | | 7,600 | | | | 7,620,893 | |
| | | |
Westpac Banking Corp., 4.11% to 7/24/29, 7/24/34(2) | | | | | | | 3,134 | | | | 3,271,523 | |
| | | |
| | | | | | | | | | | $ | 33,185,118 | |
|
| Building Materials — 1.1% | |
| | | |
Owens Corning, 3.95%, 8/15/29 | | | | | | $ | 8,564 | | | $ | 8,727,080 | |
| | | |
| | | | | | | | | | | $ | 8,727,080 | |
|
| Chemicals — 1.1% | |
| | | |
Alpek SAB de CV, 4.25%, 9/18/29(1) | | | | | | $ | 2,490 | | | $ | 2,513,033 | |
| | | |
Huntsman International, LLC, 4.50%, 5/1/29 | | | | | | | 6,420 | | | | 6,774,953 | |
| | | |
| | | | | | | | | | | $ | 9,287,986 | |
|
| Commercial Services — 0.5% | |
| | | |
Ashtead Capital, Inc., 4.125%, 8/15/25(1) | | | | | | $ | 4,070 | | | $ | 4,161,575 | |
| | | |
| | | | | | | | | | | $ | 4,161,575 | |
|
| Communications Services — 0.3% | |
| | | |
CommScope Technologies, LLC, 5.00%, 3/15/27(1) | | | | | | $ | 2,720 | | | $ | 2,257,600 | |
| | | |
| | | | | | | | | | | $ | 2,257,600 | |
|
| Computers — 0.2% | |
| | | |
Hewlett Packard Enterprise Co., 2.807%, (3 mo. USD LIBOR + 0.68%), 3/12/21(4) | | | | | | $ | 2,013 | | | $ | 2,017,609 | |
| | | |
| | | | | | | | | | | $ | 2,017,609 | |
| | | | | | | | | | | | |
| Security | | | | | Principal Amount
(000’s omitted) | | | Value | |
|
| Consumer Products — 1.0% | |
| | | |
Grupo KUO SAB de CV, 5.75%, 7/7/27(1) | | | | | | $ | 4,155 | | | $ | 4,196,591 | |
| | | |
JBS USA LUX SA/JBS USA Food Co./JBS USA Finance, Inc., 5.50%, 1/15/30(1) | | | | | | | 3,610 | | | | 3,835,553 | |
| | | |
| | | | | | | | | | | $ | 8,032,144 | |
|
| Diversified Financial Services — 4.9% | |
| | | |
Banco BTG Pactual SA/Cayman Islands, 5.75%, 9/28/22(1) | | | | | | $ | 3,130 | | | $ | 3,255,231 | |
| | | |
Brookfield Finance, Inc., 4.70%, 9/20/47 | | | | | | | 3,240 | | | | 3,559,046 | |
| | | |
Credito Real SAB de CV SOFOM ER, 9.50%, 2/7/26(1) | | | | | | | 2,875 | | | | 3,320,625 | |
| | | |
Jefferies Group, LLC/Jefferies Group Capital Finance, Inc., 4.15%, 1/23/30 | | | | | | | 5,604 | | | | 5,604,410 | |
| | | |
Neuberger Berman Group, LLC/Neuberger Berman Finance Corp., 4.875%, 4/15/45(1) | | | | | | | 1,685 | | | | 1,766,068 | |
| | | |
Springleaf Finance Corp., 6.625%, 1/15/28 | | | | | | | 210 | | | | 226,338 | |
| | | |
Springleaf Finance Corp., 7.125%, 3/15/26 | | | | | | | 5,390 | | | | 5,989,368 | |
| | | |
Synchrony Financial, 3.95%, 12/1/27 | | | | | | | 6,175 | | | | 6,336,909 | |
| | | |
UniCredit SpA, 5.861% to 6/19/27, 6/19/32(1)(2) | | | | | | | 6,349 | | | | 6,551,124 | |
| | | |
Unifin Financiera SAB de CV SOFOM ER, 7.375%, 2/12/26(1) | | | | | | | 3,155 | | | | 3,099,819 | |
| | | |
| | | | | | | | | | | $ | 39,708,938 | |
|
| Electric Utilities — 0.8% | |
| | | |
Enel Finance International NV, 3.625%, 5/25/27(1) | | | | | | $ | 3,358 | | | $ | 3,488,378 | |
| | | |
Trinidad Generation Unlimited, 5.25%, 11/4/27(1) | | | | | | | 2,963 | | | | 3,037,105 | |
| | | |
| | | | | | | | | | | $ | 6,525,483 | |
|
| Electrical and Electronic Equipment — 1.2% | |
| | | |
Avnet, Inc., 4.625%, 4/15/26 | | | | | | $ | 1,536 | | | $ | 1,654,455 | |
| | | |
Ingram Micro, Inc., 5.45%, 12/15/24 | | | | | | | 7,537 | | | | 7,813,891 | |
| | | |
| | | | | | | | | | | $ | 9,468,346 | |
|
| Financial Services — 1.6% | |
| | | |
Carlyle Finance Subsidiary, LLC, 3.50%, 9/19/29(1) | | | | | | $ | 7,675 | | | $ | 7,592,482 | |
| | | |
KKR Group Finance Co. VI, LLC, 3.75%, 7/1/29(1) | | | | | | | 2,690 | | | | 2,839,003 | |
| | | |
WP Carey, Inc., 3.85%, 7/15/29 | | | | | | | 2,416 | | | | 2,559,244 | |
| | | |
| | | | | | | | | | | $ | 12,990,729 | |
|
| Home Construction — 0.6% | |
| | | |
MDC Holdings, Inc., 6.00%, 1/15/43 | | | | | | $ | 4,500 | | | $ | 4,668,750 | |
| | | |
| | | | | | | | | | | $ | 4,668,750 | |
| | | | |
| | 7 | | See Notes to Financial Statements. |
Eaton Vance
Core Plus Bond Fund
September 30, 2019
Portfolio of Investments — continued
| | | | | | | | | | | | |
| Security | | | | | Principal Amount
(000’s omitted) | | | Value | |
|
| Insurance — 1.5% | |
| | | |
Brown & Brown, Inc., 4.50%, 3/15/29 | | | | | | $ | 3,180 | | | $ | 3,467,367 | |
| | | |
Radian Group, Inc., 4.875%, 3/15/27 | | | | | | | 8,554 | | | | 8,682,310 | |
| | | |
| | | | | | | | | | | $ | 12,149,677 | |
|
| Internet Software & Services — 1.1% | |
| | | |
Symantec Corp., 5.00%, 4/15/25(1) | | | | | | $ | 8,565 | | | $ | 8,665,991 | |
| | | |
| | | | | | | | | | | $ | 8,665,991 | |
|
| Machinery — 1.3% | |
| | | |
nVent Finance S.a.r.l., 4.55%, 4/15/28 | | | | | | $ | 4,610 | | | $ | 4,819,694 | |
| | | |
Wabtec Corp., 4.95%, 9/15/28 | | | | | | | 4,990 | | | | 5,511,355 | |
| | | |
| | | | | | | | | | | $ | 10,331,049 | |
|
| Media — 0.7% | |
| | | |
Charter Communications Operating, LLC/Charter Communications Operating Capital, 3.75%, 2/15/28 | | | | | | $ | 5,225 | | | $ | 5,366,679 | |
| | | |
| | | | | | | | | | | $ | 5,366,679 | |
|
| Mining — 0.6% | |
| | | |
Freeport-McMoRan, Inc., 5.40%, 11/14/34 | | | | | | $ | 5,215 | | | $ | 4,980,325 | |
| | | |
| | | | | | | | | | | $ | 4,980,325 | |
|
| Oil and Gas — 2.7% | |
| | | |
Apache Corp., 4.25%, 1/15/30 | | | | | | $ | 2,540 | | | $ | 2,582,337 | |
| | | |
Gran Tierra Energy, Inc., 7.75%, 5/23/27(1) | | | | | | | 1,200 | | | | 1,131,000 | |
| | | |
Gran Tierra Energy International Holdings, Ltd., 6.25%, 2/15/25(1) | | | | | | | 3,125 | | | | 2,812,500 | |
| | | |
Occidental Petroleum Corp., 3.637%, (3 mo. USD LIBOR + 1.45%), 8/15/22(4) | | | | | | | 7,674 | | | | 7,725,642 | |
| | | |
Oceaneering International, Inc., 4.65%, 11/15/24 | | | | | | | 525 | | | | 496,125 | |
| | | |
Oceaneering International, Inc., 6.00%, 2/1/28 | | | | | | | 1,198 | | | | 1,153,075 | |
| | | |
Patterson-UTI Energy, Inc., 3.95%, 2/1/28 | | | | | | | 5,555 | | | | 5,584,358 | |
| | | |
Petrobras Global Finance BV, 5.093%, 1/15/30(1) | | | | | | | 869 | | | | 907,584 | |
| | | |
| | | | | | | | | | | $ | 22,392,621 | |
|
| Pharmaceuticals — 1.2% | |
| | | |
CVS Health Corp., 3.25%, 8/15/29 | | | | | | $ | 6,875 | | | $ | 6,926,844 | |
| | | |
Teva Pharmaceutical Finance Netherlands III BV, 3.15%, 10/1/26 | | | | | | | 3,635 | | | | 2,553,587 | |
| | | |
| | | | | | | | | | | $ | 9,480,431 | |
| | | | | | | | | | | | |
| Security | | | | | Principal Amount
(000’s omitted) | | | Value | |
|
| Pipelines — 0.6% | |
| | | |
Plains All America Pipeline, L.P./PAA Finance Corp., 3.55%, 12/15/29 | | | | | | $ | 4,976 | | | $ | 4,902,226 | |
| | | |
| | | | | | | | | | | $ | 4,902,226 | |
|
| Real Estate Investment Trusts (REITs) — 4.2% | |
| | | |
CBL & Associates, L.P., 4.60%, 10/15/24 | | | | | | $ | 950 | | | $ | 631,750 | |
| | | |
CBL & Associates, L.P., 5.95%, 12/15/26 | | | | | | | 2,200 | | | | 1,556,500 | |
| | | |
EPR Properties, 3.75%, 8/15/29 | | | | | | | 9,364 | | | | 9,377,356 | |
| | | |
Iron Mountain, Inc., 4.875%, 9/15/29(1) | | | | | | | 1,647 | | | | 1,676,317 | |
| | | |
Iron Mountain, Inc., 5.25%, 3/15/28(1) | | | | | | | 679 | | | | 705,291 | |
| | | |
Newmark Group, Inc., 6.125%, 11/15/23 | | | | | | | 4,792 | | | | 5,202,330 | |
| | | |
SBA Tower Trust, 2.836%, 1/15/25(1) | | | | | | | 5,370 | | | | 5,384,833 | |
| | | |
Service Properties Trust, 4.35%, 10/1/24 | | | | | | | 3,138 | | | | 3,179,218 | |
| | | |
Service Properties Trust, 4.75%, 10/1/26 | | | | | | | 6,580 | | | | 6,619,599 | |
| | | |
| | | | | | | | | | | $ | 34,333,194 | |
|
| Retail – Specialty and Apparel — 3.4% | |
| | | |
Best Buy Co., Inc., 4.45%, 10/1/28 | | | | | | $ | 6,135 | | | $ | 6,670,694 | |
| | | |
Macy’s Retail Holdings, Inc., 4.30%, 2/15/43 | | | | | | | 8,507 | | | | 6,883,192 | |
| | | |
Nordstrom, Inc., 5.00%, 1/15/44 | | | | | | | 8,015 | | | | 7,478,580 | |
| | | |
Tapestry, Inc., 4.125%, 7/15/27 | | | | | | | 6,291 | | | | 6,421,532 | |
| | | |
| | | | | | | | | | | $ | 27,453,998 | |
|
| Technology — 0.4% | |
| | | |
Trimble, Inc., 4.90%, 6/15/28 | | | | | | $ | 2,965 | | | $ | 3,220,343 | |
| | | |
| | | | | | | | | | | $ | 3,220,343 | |
|
| Telecommunications — 0.2% | |
| | | |
CommScope Technologies, LLC, 6.00%, 6/15/25(1) | | | | | | $ | 1,515 | | | $ | 1,374,863 | |
| | | |
| | | | | | | | | | | $ | 1,374,863 | |
|
| Thrifts & Mortgage Finance — 0.7% | |
| | | |
Nationwide Building Society, 4.125% to 10/18/27, 10/18/32(1)(2) | | | | | | $ | 6,160 | | | $ | 6,144,042 | |
| | | |
| | | | | | | | | | | $ | 6,144,042 | |
|
| Toys, Games & Hobbies — 0.5% | |
| | | |
Mattel, Inc., 3.15%, 3/15/23 | | | | | | $ | 3,040 | | | $ | 2,888,000 | |
| | | |
Mattel, Inc., 5.45%, 11/1/41 | | | | | | | 1,830 | | | | 1,436,550 | |
| | | |
Mattel, Inc., 6.20%, 10/1/40 | | | | | | | 185 | | | | 155,400 | |
| | | |
| | | | | | | | | | | $ | 4,479,950 | |
| | | | |
| | 8 | | See Notes to Financial Statements. |
Eaton Vance
Core Plus Bond Fund
September 30, 2019
Portfolio of Investments — continued
| | | | | | | | | | | | |
| Security | | | | | Principal Amount
(000’s omitted) | | | Value | |
|
| Transportation — 1.2% | |
| | | |
A.P. Moller - Maersk A/S, 3.875%, 9/28/25(1) | | | | | | $ | 1,631 | | | $ | 1,672,038 | |
| | | |
A.P. Moller - Maersk A/S, 4.50%, 6/20/29(1) | | | | | | | 4,090 | | | | 4,327,948 | |
| | | |
JSL Europe S.A., 7.75%, 7/26/24(1) | | | | | | | 3,920 | | | | 4,223,918 | |
| | | |
| | | | | | | | | | | $ | 10,223,904 | |
| |
Total Corporate Bonds & Notes
(identified cost $303,842,926) | | | $ | 312,936,443 | |
| |
| Collateralized Mortgage Obligations — 3.7% | | | | | |
| Security | | | | | Principal
Amount
(000’s omitted) | | | Value | |
| | | |
Federal Home Loan Mortgage Corp. Structured
Agency Credit Risk Debt Notes: | | | | | | | | | |
| | | |
Series 2017-DNA3, Class M1, 2.768%, (1 mo. USD LIBOR + 0.75%), 3/25/30(4) | | | | | | $ | 2,920 | | | $ | 2,925,080 | |
| | | |
Series 2017-HQA1, Class M1, 3.218%, (1 mo. USD LIBOR + 1.20%), 8/25/29(4) | | | | | | | 2,615 | | | | 2,622,557 | |
| | | |
Series 2019-DNA3, Class M2, 4.195%, (1 mo. USD LIBOR + 2.05%), 7/25/49(1)(4) | | | | | | | 2,143 | | | | 2,145,674 | |
| | | |
Series 2019-HQA3, Class B1, 5.057%, (1 mo. USD LIBOR + 3.00%), 9/25/49(1)(4) | | | | | | | 492 | | | | 492,613 | |
| | | |
Series 2019-HQA3, Class M2, 3.907%, (1 mo. USD LIBOR + 1.85%), 9/25/49(1)(4) | | | | | | | 1,220 | | | | 1,221,522 | |
| | | |
| | | | | | | | | | | $ | 9,407,446 | |
| | | |
Federal National Mortgage Association
Connecticut Avenue Securities: | | | | | | | | | |
| | | |
Series 2014-C03, Class 1M2, 5.018%, (1 mo. USD LIBOR + 3.00%), 7/25/24(4) | | | | | | $ | 2,720 | | | $ | 2,872,151 | |
| | | |
Series 2017-C03, Class 1M1, 2.968%, (1 mo. USD LIBOR + 0.95%), 10/25/29(4) | | | | | | | 648 | | | | 649,722 | |
| | | |
Series 2017-C04, Class 2M1, 2.868%, (1 mo. USD LIBOR + 0.85%), 11/25/29(4) | | | | | | | 760 | | | | 761,314 | |
| | | |
Series 2017-C07, Class 1M1, 2.668%, (1 mo. USD LIBOR + 0.65%), 5/25/30(4) | | | | | | | 5,172 | | | | 5,178,359 | |
| | | |
Series 2018-C03, Class 1M1, 2.698%, (1 mo. USD LIBOR + 0.68%), 10/25/30(4) | | | | | | | 3,009 | | | | 3,011,389 | |
| | | |
Series 2018-C05, Class 1M1, 2.738%, (1 mo. USD LIBOR + 0.72%), 1/25/31(4) | | | | | | | 1,811 | | | | 1,813,142 | |
| | | |
Series 2018-C06, Class 1M1, 2.568%, (1 mo. USD LIBOR + 0.55%), 3/25/31(4) | | | | | | | 786 | | | | 786,182 | |
| | | |
Series 2019-R05, Class 1B1, 6.118%, (1 mo. USD LIBOR + 4.10%), 7/25/39(1)(4) | | | | | | | 808 | | | | 828,324 | |
| | | |
Series 2019-R05, Class 1M1, 2.768%, (1 mo. USD LIBOR + 0.75%), 7/25/39(1)(4) | | | | | | | 1,720 | | | | 1,723,649 | |
| | | | | | | | | | | | |
| Security | | | | | Principal
Amount
(000’s omitted) | | | Value | |
| | | |
Federal National Mortgage Association
Connecticut Avenue Securities: (continued) | | | | | | | | | |
| | | |
Series 2019-R05, Class 1M2, 4.018%, (1 mo. USD LIBOR + 2.00%), 7/25/39(1)(4) | | | | | | $ | 2,594 | | | $ | 2,603,520 | |
| | | |
| | | | | | | | | | | $ | 20,227,752 | |
| |
Total Collateralized Mortgage Obligations
(identified cost $29,574,196) | | | $ | 29,635,198 | |
|
| Commercial Mortgage-Backed Securities — 9.5% | |
| Security | | | | | Principal
Amount
(000’s omitted) | | | Value | |
|
| CFCRE Commercial Mortgage Trust | |
| | | |
Series 2016-C3, Class D, 3.052%, 1/10/48(1)(5) | | | | | | $ | 1,500 | | | $ | 1,374,341 | |
| | | |
Series 2016-C7, Class D, 4.581%, 12/10/54(1)(5) | | | | | | | 1,725 | | | | 1,714,803 | |
|
| Citigroup Commercial Mortgage Trust | |
| | | |
Series 2017-MDRB, Class C, 4.528%, (1 mo. USD LIBOR + 2.50%), 7/15/30(1)(4) | | | | | | | 1,000 | | | | 1,000,909 | |
| | | |
Series 2017-MDRC, Class C, 3.328%, (1 mo. USD LIBOR + 1.30%), 7/15/30(1)(4) | | | | | | | 1,500 | | | | 1,493,857 | |
| | | |
Series 2017-MDRC, Class D, 4.278%, (1 mo. USD LIBOR + 2.25%), 7/15/30(1)(4) | | | | | | | 1,600 | | | | 1,598,810 | |
|
| COMM Mortgage Trust | |
| | | |
Series 2014-CR19, Class A3, 3.53%, 8/10/47 | | | | | | | 3,677 | | | | 3,674,817 | |
| | | |
Series 2015-CR22, Class D, 4.254%, 3/10/48(1)(5) | | | | | | | 2,324 | | | | 2,320,629 | |
|
| Credit Suisse Mortgage Trust | |
| | | |
Series 2016-NXSR, Class D, 4.506%, 12/15/49(1)(5) | | | | | | | 2,000 | | | | 1,813,241 | |
|
| GS Mortgage Securities Trust | |
| | | |
Series 2018-FBLU, Class A, 2.978%, (1 mo. USD LIBOR + 0.95%), 11/15/35(1)(4) | | | | | | | 1,900 | | | | 1,901,867 | |
|
| JPMBB Commercial Mortgage Securities Trust | |
| | | |
Series 2014-C22, Class C, 4.709%, 9/15/47(5) | | | | | | | 700 | | | | 723,841 | |
| | | |
Series 2014-C22, Class D, 4.709%, 9/15/47(1)(5) | | | | | | | 1,220 | | | | 1,132,196 | |
| | | |
Series 2014-C25, Class D, 4.104%, 11/15/47(1)(5) | | | | | | | 3,575 | | | | 3,227,706 | |
| | | |
Series 2015-C29, Class D, 3.795%, 5/15/48(5) | | | | | | | 500 | | | | 434,680 | |
|
| JPMorgan Chase Commercial Mortgage Securities Trust | |
| | | |
Series 2011-C5, Class D, 5.554%, 8/15/46(1)(5) | | | | | | | 2,454 | | | | 2,504,122 | |
| | | |
Series 2013-C16, Class D, 5.195%, 12/15/46(1)(5) | | | | | | | 1,500 | | | | 1,585,178 | |
| | | |
Series 2014-DSTY, Class B, 3.771%, 6/10/27(1) | | | | | | | 859 | | | | 855,250 | |
|
| MelTel Land Funding, LLC | |
| | | |
Series 2019-1A, Class B, 4.701%, 4/15/49(1) | | | | | | | 515 | | | | 532,474 | |
|
| Morgan Stanley Bank of America Merrill Lynch Trust | |
| | | |
Series 2016-C29, Class D, 3.00%, 5/15/49(1) | | | | | | | 7,048 | | | | 5,934,092 | |
| | | |
Series 2016-C32, Class D, 3.396%, 12/15/49(1)(5) | | | | | | | 2,815 | | | | 2,349,596 | |
| | | | |
| | 9 | | See Notes to Financial Statements. |
Eaton Vance
Core Plus Bond Fund
September 30, 2019
Portfolio of Investments — continued
| | | | | | | | | | |
| Security | | | | Principal
Amount
(000’s omitted) | | | Value | |
|
| Morgan Stanley Capital I Trust | |
| | | |
Series 2016-UB12, Class D, 3.312%, 12/15/49(1) | | | | $ | 5,995 | | | $ | 4,706,020 | |
| | | |
Series 2019-BPR, Class B, 4.128%, (1 mo. USD LIBOR + 2.10%), 5/15/36(1)(4) | | | | | 4,000 | | | | 4,006,510 | |
| | | |
Series 2019-BPR, Class C, 5.078%, (1 mo. USD LIBOR + 3.05%), 5/15/36(1)(4) | | | | | 1,540 | | | | 1,546,227 | |
|
| Motel 6 Trust | |
| | | |
Series 2017-MTL6, Class C, 3.428%, (1 mo. USD LIBOR + 1.40%), 8/15/34(1)(4) | | | | | 840 | | | | 841,893 | |
| | | |
Series 2017-MTL6, Class E, 5.278%, (1 mo. USD LIBOR + 3.25%), 8/15/34(1)(4) | | | | | 695 | | | | 701,222 | |
|
| Natixis Commercial Mortgage Securities Trust | |
| | | |
Series 2018-FL1, Class C, 4.395%, (1 mo. USD LIBOR + 2.20%), 6/15/35(1)(4) | | | | | 1,500 | | | | 1,488,096 | |
|
| Progress Residential Trust | |
| | | |
Series 2015-SFR3, Class E, 5.66%, 11/12/32(1) | | | | | 2,360 | | | | 2,365,956 | |
| | | |
Series 2019-SFR3, Class A, 2.271%, 9/17/36(1) | | | | | 3,440 | | | | 3,405,259 | |
|
| RETL Trust | |
| | | |
Series 2019-RVP, Class B, 3.578%, (1 mo. USD LIBOR + 1.55%), 3/15/36(1)(4) | | | | | 3,625 | | | | 3,636,035 | |
|
| Stack Infrastructure Issuer, LLC | |
| | | |
Series 2019-1A, Class A2, 4.54%, 2/25/44(1) | | | | | 4,141 | | | | 4,344,917 | |
|
| Toorak Mortgage Corp. | |
| | | |
Series 2019-2, Class A1, 3.721%, 9/25/22 | | | | | 2,400 | | | | 2,407,249 | |
|
| Tricon American Homes Trust | |
| | | |
Series 2016-SFR1, Class D, 3.886%, 11/17/33(1) | | | | | 200 | | | | 202,590 | |
|
| UBS-Barclays Commercial Mortgage Trust | |
| | | |
Series 2013-C6, Class D, 4.454%, 4/10/46(1)(5) | | | | | 2,000 | | | | 1,950,387 | |
|
| Wells Fargo Commercial Mortgage Trust | |
| | | |
Series 2015-C31, Class D, 3.852%, 11/15/48 | | | | | 5,065 | | | | 4,712,054 | |
| | | |
Series 2015-SG1, Class C, 4.616%, 9/15/48(5) | | | | | 23 | | | | 23,558 | |
| | | |
Series 2016-C35, Class D, 3.142%, 7/15/48(1) | | | | | 2,150 | | | | 1,894,715 | |
| | | |
Series 2016-C36, Class D, 2.942%, 11/15/59(1) | | | | | 3,000 | | | | 2,380,647 | |
|
| WF-RBS Commercial Mortgage Trust | |
| | | |
Series 2014-C24, Class D, 3.692%, 11/15/47(1) | | | | | 940 | | | | 780,061 | |
| |
Total Commercial Mortgage-Backed Securities
(identified cost $75,118,274) | | | $ | 77,565,805 | |
|
| Asset-Backed Securities — 21.6% | |
| Security | | | | Principal
Amount
(000’s omitted) | | | Value | |
|
| ARI Fleet Lease Trust | |
| | | |
Series 2018-B, Class A2, 3.22%, 8/16/27(1) | | | | $ | 854 | | | $ | 862,054 | |
|
| Avant Loans Funding Trust | |
| | | |
Series 2018-A, Class C, 4.79%, 5/15/24(1) | | | | | 7,560 | | | | 7,659,497 | |
| | | |
Series 2018-B, Class A, 3.42%, 1/18/22(1) | | | | | 1,602 | | | | 1,607,098 | |
| | | | | | | | | | |
| Security | | | | Principal
Amount
(000’s omitted) | | | Value | |
|
| Avant Loans Funding Trust (continued) | |
| | | |
Series 2019-A, Class A, 3.48%, 7/15/22(1) | | | | $ | 1,091 | | | $ | 1,095,227 | |
| | | |
Series 2019-B, Class A, 2.72%, 10/15/26(1) | | | | | 11,425 | | | | 11,437,283 | |
|
| Avis Budget Rental Car Funding, LLC | |
| | | |
Series 2014-2A, Class A, 2.50%, 2/20/21(1) | | | | | 8,083 | | | | 8,086,694 | |
| | | |
Series 2015-1A, Class B, 3.22%, 7/20/21(1) | | | | | 3,650 | | | | 3,665,321 | |
|
| CIG Auto Receivables Trust | |
| | | |
Series 2019-1A, Class A, 3.33%, 8/15/24(1) | | | | | 1,618 | | | | 1,628,956 | |
|
| Coinstar Funding, LLC | |
| | | |
Series 2017-1A, Class A2, 5.216%, 4/25/47(1) | | | | | 2,458 | | | | 2,534,583 | |
|
| Conn’s Receivables Funding, LLC | |
| | | |
Series 2017-B, Class B, 4.52%, 4/15/21(1) | | | | | 278 | | | | 278,085 | |
| | | |
Series 2018-A, Class A, 3.25%, 1/15/23(1) | | | | | 116 | | | | 115,958 | |
| | | |
Series 2018-A, Class B, 4.65%, 1/15/23(1) | | | | | 222 | | | | 223,260 | |
| | | |
Series 2019-A, Class A, 3.40%, 10/16/23(1) | | | | | 662 | | | | 666,655 | |
| | | |
Series 2019-A, Class B, 4.36%, 10/16/23(1) | | | | | 3,350 | | | | 3,387,607 | |
|
| Consumer Loan Underlying Bond Credit Trust | |
| | | |
Series 2017-P2, Class A, 2.61%, 1/15/24(1) | | | | | 2,982 | | | | 2,983,282 | |
| | | |
Series 2019-P1, Class A, 2.94%, 7/15/26(1) | | | | | 5,541 | | | | 5,565,545 | |
| | | |
Series 2019-P2, Class A, 2.47%, 10/15/26(1) | | | | | 1,645 | | | | 1,643,488 | |
|
| Driven Brands Funding, LLC | |
| | | |
Series 2019-2A, Class A2, 3.981%, 10/20/49(1) | | | | | 3,690 | | | | 3,730,221 | |
|
| Enterprise Fleet Financing, LLC | |
| | | |
Series 2017-1, Class A2, 2.13%, 7/20/22(1) | | | | | 900 | | | | 899,848 | |
|
| Exeter Automobile Receivables Trust | |
| | | |
Series 2017-1A, Class B, 3.00%, 12/15/21(1) | | | | | 3,228 | | | | 3,236,335 | |
| | | |
Series 2019-3A, Class A, 2.59%, 9/15/22(1) | | | | | 2,786 | | | | 2,791,191 | |
|
| ExteNet LLC | |
| | | |
Series 2019-1A, Class A2, 3.204%, 7/26/49(1) | | | | | 1,895 | | | | 1,920,761 | |
| | | |
Series 2019-1A, Class B, 4.14%, 7/26/49(1) | | | | | 2,450 | | | | 2,474,811 | |
| | | |
Series 2019-1A, Class C, 5.219%, 7/26/49(1) | | | | | 2,090 | | | | 2,107,680 | |
|
| FOCUS Brands Funding, LLC | |
| | | |
Series 2017-1A, Class A2I, 3.857%, 4/30/47(1) | | | | | 2,830 | | | | 2,850,434 | |
|
| Foundation Finance Trust | |
| | | |
Series 2017-1A, Class A, 3.30%, 7/15/33(1) | | | | | 381 | | | | 382,883 | |
|
| FREED ABS Trust | |
| | | |
Series 2019-1, Class A, 3.42%, 6/18/26(1) | | | | | 3,888 | | | | 3,913,682 | |
|
| Horizon Aircraft Finance I, Ltd. | |
| | | |
Series 2018-1, Class A, 4.458%, 12/15/38(1) | | | | | 1,333 | | | | 1,385,579 | |
|
| Horizon Aircraft Finance II, Ltd. | |
| | | |
Series 2019-1, Class A, 3.721%, 7/15/39(1) | | | | | 2,305 | | | | 2,316,747 | |
| | | |
Series 2019-1, Class B, 4.703%, 7/15/39(1) | | | | | 2,544 | | | | 2,551,840 | |
| | | |
Series 2019-1, Class C, 6.90%, 7/15/39(1) | | | | | 805 | | | | 822,543 | |
|
| HPEFS Equipment Trust | |
| | | |
Series 2019-1A, Class A1, 2.15%, 10/20/20(1) | | | | | 4,425 | | | | 4,430,528 | |
|
| Jack in the Box Funding, LLC | |
| | | |
Series 2019-1A, Class A2I, 3.982%, 8/25/49(1) | | | | | 1,235 | | | | 1,257,415 | |
| | | | |
| | 10 | | See Notes to Financial Statements. |
Eaton Vance
Core Plus Bond Fund
September 30, 2019
Portfolio of Investments — continued
| | | | | | | | | | |
| Security | | | | Principal
Amount
(000’s omitted) | | | Value | |
|
| Marlette Funding Trust | |
| | | |
Series 2018-1A, Class A, 2.61%, 3/15/28(1) | | | | $ | 614 | | | $ | 614,018 | |
| | | |
Series 2018-3A, Class C, 4.63%, 9/15/28(1) | | | | | 3,435 | | | | 3,534,760 | |
| | | |
Series 2019-2A, Class A, 3.13%, 7/16/29(1) | | | | | 924 | | | | 931,488 | |
|
| OneMain Financial Issuance Trust | |
| | | |
Series 2017-1A, Class A1, 2.37%, 9/14/32(1) | | | | | 6,000 | | | | 5,996,476 | |
|
| OSCAR US Funding X, LLC | |
| | | |
Series 2019-1A, Class A2, 3.10%, 4/11/22(1) | | | | | 1,091 | | | | 1,096,078 | |
|
| Planet Fitness Master Issuer, LLC | |
| | | |
Series 2018-1A, Class A2I, 4.262%, 9/5/48(1) | | | | | 4,079 | | | | 4,180,595 | |
|
| Prestige Auto Receivables Trust | |
| | | |
Series 2019-1A, Class A2, 2.44%, 7/15/22(1) | | | | | 1,865 | | | | 1,867,545 | |
|
| Prosper Marketplace Issuance Trust | |
| | | |
Series 2017-2A, Class C, 5.37%, 9/15/23(1) | | | | | 890 | | | | 898,650 | |
| | | |
Series 2017-3A, Class B, 3.36%, 11/15/23(1) | | | | | 725 | | | | 725,134 | |
| | | |
Series 2018-1A, Class C, 4.87%, 6/17/24(1) | | | | | 1,250 | | | | 1,266,920 | |
| | | |
Series 2018-2A, Class A, 3.35%, 10/15/24(1) | | | | | 782 | | | | 784,418 | |
|
| Purchasing Power Funding, LLC | |
| | | |
Series 2018-A, Class A, 3.34%, 8/15/22(1) | | | | | 1,100 | | | | 1,101,924 | |
|
| SERVPRO Master Issuer, LLC | |
| | | |
Series 2019-1A, Class A2, 3.882%, 10/25/49(1)(6) | | | | | 6,856 | | | | 6,936,551 | |
|
| Sierra Timeshare Receivables Funding, LLC | |
| | | |
Series 2015-1A, Class B, 3.05%, 3/22/32(1) | | | | | 31 | | | | 31,161 | |
|
| Skopos Auto Receivables Trust | |
| | | |
Series 2019-1A, Class A, 2.90%, 12/15/22(1) | | | | | 6,255 | | | | 6,256,075 | |
|
| Small Business Lending Trust | |
| | | |
Series 2019-A, Class A, 2.85%, 7/15/26(1) | | | | | 3,960 | | | | 3,955,875 | |
|
| SpringCastle Funding Asset-Backed Notes | |
| | | |
Series 2019-AA, Class A, 3.20%, 5/27/36(1) | | | | | 4,438 | | | | 4,488,644 | |
|
| Springleaf Funding Trust | |
| | | |
Series 2015-BA, Class A, 3.48%, 5/15/28(1) | | | | | 1,700 | | | | 1,719,368 | |
| | | |
Series 2016-AA, Class A, 2.90%, 11/15/29(1) | | | | | 648 | | | | 647,924 | |
|
| Start, Ltd. | |
| | | |
Series 2019-1, Class B, 5.095%, 3/15/44(1) | | | | | 2,203 | | | | 2,247,850 | |
|
| Tesla Auto Lease Trust | |
| | | |
Series 2018-A, Class B, 2.75%, 2/20/20(1) | | | | | 3,430 | | | | 3,431,554 | |
| | | |
Series 2018-B, Class A, 3.71%, 8/20/21(1) | | | | | 5,396 | | | | 5,484,266 | |
| | | |
Series 2018-B, Class B, 4.12%, 10/20/21(1) | | | | | 1,000 | | | | 1,026,395 | |
|
| Thunderbolt Aircraft Lease, Ltd. | |
| | | |
Series 2017-A, Class B, 5.75% to 4/15/24, 5/17/32(1)(7) | | | | | 2,945 | | | | 3,067,016 | |
|
| Trafigura Securitisation Finance PLC | |
| | | |
Series 2017-1A, Class A2, 2.47%, 12/15/20(1) | | | | | 1,950 | | | | 1,945,874 | |
| | | |
Series 2017-1A, Class B, 3.727%, (1 mo. USD LIBOR + 1.70%), 12/15/20(1)(4) | | | | | 500 | | | | 501,317 | |
|
| Upgrade Receivables Trust | |
| | | |
Series 2019-1A, Class A, 3.48%, 3/15/25(1) | | | | | 2,861 | | | | 2,875,347 | |
| | | | | | | | | | | | |
| Security | | | | | Principal
Amount
(000’s omitted) | | | Value | |
|
| Upgrade Receivables Trust (continued) | |
| | | |
Series 2019-1A, Class B, 4.09%, 3/15/25(1) | | | | | | $ | 4,000 | | | $ | 4,051,859 | |
| | | |
Series 2019-2A, Class A, 2.77%, 10/15/25(1) | | | | | | | 2,760 | | | | 2,763,019 | |
|
| Vantage Data Centers Issuer, LLC | |
| | | |
Series 2018-1A, Class A2, 4.072%, 2/16/43(1) | | | | | | | 1,230 | | | | 1,279,755 | |
| | | |
Series 2018-2A, Class A2, 4.196%, 11/16/43(1) | | | | | | | 992 | | | | 1,025,433 | |
| | | |
Series 2019-1A, Class A2, 3.188%, 7/15/44(1) | | | | | | | 2,708 | | | | 2,740,190 | |
|
| VB-S1 Issuer, LLC | |
| | | |
Series 2016-1A, Class C, 3.065%, 6/15/46(1) | | | | | | | 4,000 | | | | 4,003,918 | |
|
| Veros Automobile Receivables Trust | |
| | | |
Series 2018-1, Class A, 3.63%, 5/15/23(1) | | | | | | | 1,100 | | | | 1,103,180 | |
| |
Total Asset-Backed Securities
(identified cost $174,256,708) | | | $ | 175,093,668 | |
|
| Foreign Government Bonds — 3.9% | |
| Security | | | | | Principal
Amount
(000’s omitted) | | | Value | |
|
| Argentina — 0.4% | |
| | | |
Republic of Argentina, 7.50%, 4/22/26 | | | USD | | | | 7,325 | | | $ | 3,268,855 | |
| | | |
| | | | | | | | | | | $ | 3,268,855 | |
|
| Brazil — 0.5% | |
| | | |
Nota do Tesouro Nacional, 10.00%, 1/1/25 | | | BRL | | | | 15,970 | | | $ | 4,415,883 | |
| | | |
| | | | | | | | | | | $ | 4,415,883 | |
|
| Malaysia — 0.3% | |
| | | |
Malaysia Government Bond, 3.441%, 2/15/21 | | | MYR | | | | 8,515 | | | $ | 2,042,396 | |
| | | |
| | | | | | | | | | | $ | 2,042,396 | |
|
| Mexico — 0.6% | |
| | | |
Mexican Bonos, 7.75%, 5/29/31 | | | MXN | | | | 89,055 | | | $ | 4,785,883 | |
| | | |
| | | | | | | | | | | $ | 4,785,883 | |
|
| Supranational — 2.1% | |
| | | |
European Bank for Reconstruction & Development, 9.25%, 12/2/20 | | | IDR | | | | 140,260,000 | | | $ | 10,132,216 | |
| | | |
International Finance Corp., 6.30%, 11/25/24 | | | INR | | | | 315,460 | | | | 4,421,278 | |
| | | |
International Finance Corp., 7.45%, 11/8/21 | | | INR | | | | 200,500 | | | | 2,886,130 | |
| | | |
| | | | | | | | | | | $ | 17,439,624 | |
| |
Total Foreign Government Bonds
(identified cost $33,715,290) | | | $ | 31,952,641 | |
| | | | |
| | 11 | | See Notes to Financial Statements. |
Eaton Vance
Core Plus Bond Fund
September 30, 2019
Portfolio of Investments — continued
| | | | | | | | | | | | |
| Preferred Stocks — 0.9% | |
| Security | | | | | Shares | | | Value | |
|
| Oil and Gas — 0.0%(8) | |
| | | |
Chesapeake Energy Corp., 5.75%, Convertible | | | | | | | 400 | | | $ | 158,334 | |
| | | |
| | | | | | | | | | | $ | 158,334 | |
|
| Real Estate Investment Trusts (REITs) — 0.9% | |
| | | |
Brookfield Property Partners, L.P., Series A2, 6.375% | | | | | | | 275,000 | | | $ | 7,139,000 | |
| | | |
| | | | | | | | | | | $ | 7,139,000 | |
| |
Total Preferred Stocks
(identified cost $7,193,050) | | | $ | 7,297,334 | |
|
| U.S. Treasury Obligations — 4.8% | |
| Security | | | | | Principal
Amount
(000’s omitted) | | | Value | |
| | | |
U.S. Treasury Inflation-Protected Note, 0.25%, 1/15/25(9) | | | | | | $ | 18,154 | | | $ | 18,220,546 | |
| | | |
U.S. Treasury Inflation-Protected Note, 0.50%, 1/15/28(9) | | | | | | | 4,576 | | | | 4,690,360 | |
| | | |
U.S. Treasury Inflation-Protected Note, 0.625%, 4/15/23(9) | | | | | | | 15,663 | | | | 15,802,993 | |
| |
Total U.S. Treasury Obligations
(identified cost $38,128,539) | | | $ | 38,713,899 | |
|
| Short-Term Investments — 16.9% | |
|
| Commercial Paper — 1.0% | |
| Security | | | | | Principal
Amount
(000’s omitted) | | | Value | |
| | | |
Jabil, Inc., 2.64%, 11/21/19 (1)(10) | | | | | | $ | 7,875 | | | $ | 7,846,105 | |
| |
Total Commercial Paper
(identified cost $7,846,105) | | | $ | 7,846,105 | |
| | | | | | | | | | |
| Other — 15.9% | |
| Description | | | | Units | | | Value | |
| | | |
Eaton Vance Cash Reserves Fund, LLC, 2.09%(11) | | | | | 129,690,879 | | | $ | 129,677,910 | |
| |
Total Other
(identified cost $129,677,394) | | | $ | 129,677,910 | |
| |
Total Short-Term Investments
(identified cost $137,523,499) | | | $ | 137,524,015 | |
| |
Total Investments — 99.8%
(identified cost $799,352,482) | | | $ | 810,719,003 | |
| |
Other Assets, Less Liabilities — 0.2% | | | $ | 1,898,441 | |
| |
Net Assets — 100.0% | | | $ | 812,617,444 | |
The percentage shown for each investment category in the Portfolio of Investments is based on net assets.
| | (1) | Security exempt from registration pursuant to Rule 144A under the Securities Act of 1933, as amended. These securities may be sold in certain transactions in reliance on an exemption from registration (normally to qualified institutional buyers). At September 30, 2019, the aggregate value of these securities is $373,870,929 or 46.0% of the Fund’s net assets. |
| | (2) | Security converts to variable rate after the indicated fixed-rate coupon period. |
| | (3) | Perpetual security with no stated maturity date but may be subject to calls by the issuer. |
| | (4) | Variable rate security. The stated interest rate represents the rate in effect at September 30, 2019. |
| | (5) | Weighted average fixed-rate coupon that changes/updates monthly. Rate shown is the rate at September 30, 2019. |
| | (6) | When-issued security. |
| | (7) | Step coupon bond. Interest rate represents the rate in effect at September 30, 2019. |
| | (8) | Amount is less than 0.05%. |
| | (9) | Inflation-linked security whose principal is adjusted for inflation based on changes in the U.S. Consumer Price Index. Interest is calculated based on the inflation-adjusted principal. |
| (10) | Security exempt from registration under Section 4(2) of the Securities Act of 1933. Such securities may be sold in transactions exempt from registration only to dealers in that program or other “accredited investors.” At September 30, 2019, the aggregate value of these securities is $7,846,105, representing 1.0% of the Fund’s net assets. |
| (11) | Affiliated investment company, available to Eaton Vance portfolios and funds, which invests in high quality, U.S. dollar denominated money market instruments. The rate shown is the annualized seven-day yield as of September 30, 2019. |
| | | | |
| | 12 | | See Notes to Financial Statements. |
Eaton Vance
Core Plus Bond Fund
September 30, 2019
Portfolio of Investments — continued
| | | | | | | | |
| Country Concentration of Portfolio | | | | | | | | |
| Country | | Percentage of
Total Investments | | | Value | |
| | |
United States | | | 82.4 | % | | $ | 668,343,206 | |
| | |
Mexico | | | 3.7 | | | | 30,008,713 | |
| | |
United Kingdom | | | 2.3 | | | | 18,613,674 | |
| | |
Brazil | | | 2.3 | | | | 18,474,697 | |
| | |
Supranational | | | 2.2 | | | | 17,439,624 | |
| | |
Australia | | | 1.4 | | | | 10,892,416 | |
| | |
Italy | | | 1.2 | | | | 10,039,502 | |
| | |
Canada | | | 0.9 | | | | 7,502,546 | |
| | |
Spain | | | 0.8 | | | | 6,711,577 | |
| | |
Denmark | | | 0.7 | | | | 5,999,986 | |
| | |
Argentina | | | 0.4 | | | | 3,268,855 | |
| | |
Trinidad and Tobago | | | 0.4 | | | | 3,037,105 | |
| | |
Israel | | | 0.3 | | | | 2,553,587 | |
| | |
Ireland | | | 0.3 | | | | 2,447,191 | |
| | |
Bermuda | | | 0.3 | | | | 2,247,850 | |
| | |
Malaysia | | | 0.3 | | | | 2,042,396 | |
| | |
Japan | | | 0.1 | | | | 1,096,078 | |
| | |
Total Investments | | | 100.0 | % | | $ | 810,719,003 | |
| | | | | | | | | | | | | | | | |
| Futures Contracts | | | | | | | | | | | | | |
| | | | | |
| Description | | Number of
Contracts | | | Position | | Expiration
Date | | Notional
Amount | | | Value/Unrealized
Depreciation | |
|
Interest Rate Futures | |
| | | | | |
| U.S. 2-Year Treasury Note | | | 399 | | | Long | | 12/31/19 | | $ | 85,984,500 | | | $ | (208,851 | ) |
| | | | | |
| U.S. Ultra-Long Treasury Bond | | | 72 | | | Long | | 12/19/19 | | | 13,817,250 | | | | (120,937 | ) |
| |
| | | | $ | (329,788 | ) |
Abbreviations:
| | | | |
| | |
| LIBOR | | – | | London Interbank Offered Rate |
Currency Abbreviations:
| | | | |
| | |
| BRL | | – | | Brazilian Real |
| | |
| IDR | | – | | Indonesian Rupiah |
| | |
| INR | | – | | Indian Rupee |
| | |
| MXN | | – | | Mexican Peso |
| | |
| MYR | | – | | Malaysian Ringgit |
| | |
| USD | | – | | United States Dollar |
| | | | |
| | 13 | | See Notes to Financial Statements. |
Eaton Vance
Core Plus Bond Fund
September 30, 2019
Statement of Assets and Liabilities
| | | | |
| Assets | | September 30, 2019 | |
| |
Unaffiliated investments, at value (identified cost, $669,675,088) | | $ | 681,041,093 | |
| |
Affiliated investment, at value (identified cost, $129,677,394) | | | 129,677,910 | |
| |
Cash | | | 2,776,893 | |
| |
Deposits for derivatives collateral — financial futures contracts | | | 617,000 | |
| |
Interest receivable | | | 5,270,048 | |
| |
Dividends receivable from affiliated investment | | | 202,710 | |
| |
Receivable for investments sold | | | 128,403 | |
| |
Receivable for Fund shares sold | | | 6,385,804 | |
| |
Tax reclaims receivable | | | 27,412 | |
| |
Receivable from affiliate | | | 70,111 | |
| |
Total assets | | $ | 826,197,384 | |
|
| Liabilities | |
| |
Payable for investments purchased | | $ | 3,732,683 | |
| |
Payable for when-issued securities | | | 6,883,384 | |
| |
Payable for Fund shares redeemed | | | 2,375,398 | |
| |
Distributions payable | | | 12,789 | |
| |
Payable for variation margin on open financial futures contracts | | | 7,964 | |
| |
Payable to affiliates: | | | | |
| |
Investment adviser fee | | | 288,406 | |
| |
Distribution and service fees | | | 68,376 | |
| |
Trustees’ fees | | | 7,208 | |
| |
Accrued foreign capital gains taxes | | | 1,951 | |
| |
Accrued expenses | | | 201,781 | |
| |
Total liabilities | | $ | 13,579,940 | |
| |
Net Assets | | $ | 812,617,444 | |
|
| Sources of Net Assets | |
| |
Paid-in capital | | $ | 799,990,437 | |
| |
Distributable earnings | | | 12,627,007 | |
| |
Net Assets | | $ | 812,617,444 | |
| |
| Class A Shares | | | | |
| |
Net Assets | | $ | 137,889,159 | |
| |
Shares Outstanding | | | 11,495,863 | |
| |
Net Asset Value and Redemption Price Per Share | | | | |
| |
(net assets ÷ shares of beneficial interest outstanding) | | $ | 11.99 | |
| |
Maximum Offering Price Per Share | | | | |
| |
(100 ÷ 95.25 of net asset value per share) | | $ | 12.59 | |
|
| Class C Shares | |
| |
Net Assets | | $ | 52,001,318 | |
| |
Shares Outstanding | | | 4,337,447 | |
| |
Net Asset Value and Offering Price Per Share* | | | | |
| |
(net assets ÷ shares of beneficial interest outstanding) | | $ | 11.99 | |
|
| Class I Shares | |
| |
Net Assets | | $ | 622,726,967 | |
| |
Shares Outstanding | | | 51,955,726 | |
| |
Net Asset Value, Offering Price and Redemption Price Per Share | | | | |
| |
(net assets ÷ shares of beneficial interest outstanding) | | $ | 11.99 | |
On sales of $50,000 or more, the offering price of Class A shares is reduced.
| * | Redemption price per share is equal to the net asset value less any applicable contingent deferred sales charge. |
| | | | |
| | 14 | | See Notes to Financial Statements. |
Eaton Vance
Core Plus Bond Fund
September 30, 2019
Statement of Operations
| | | | |
| Investment Income | | Year Ended September 30, 2019 | |
| |
Interest (net of foreign taxes, $1,446) | | $ | 16,689,072 | |
| |
Dividends (net of foreign taxes, $758) | | | 78,846 | |
| |
Dividends from affiliated investment | | | 1,962,568 | |
| |
Total investment income | | $ | 18,730,486 | |
| |
| Expenses | | | | |
| |
Investment adviser fee | | $ | 1,915,983 | |
| |
Distribution and service fees | | | | |
| |
Class A | | | 184,962 | |
| |
Class C | | | 308,623 | |
| |
Trustees’ fees and expenses | | | 28,940 | |
| |
Custodian fee | | | 90,613 | |
| |
Transfer and dividend disbursing agent fees | | | 223,943 | |
| |
Legal and accounting services | | | 67,584 | |
| |
Printing and postage | | | 45,880 | |
| |
Registration fees | | | 168,760 | |
| |
Miscellaneous | | | 27,481 | |
| |
Total expenses | | $ | 3,062,769 | |
| |
Deduct — | | | | |
| |
Allocation of expenses to affiliate | | $ | 482,518 | |
| |
Total expense reductions | | $ | 482,518 | |
| |
Net expenses | | $ | 2,580,251 | |
| |
Net investment income | | $ | 16,150,235 | |
| |
| Realized and Unrealized Gain (Loss) | | | | |
| |
Net realized gain (loss) — | | | | |
| |
Investment transactions | | $ | 2,527,112 | |
| |
Investment transactions — affiliated investment | | | (9,539 | ) |
| |
Financial futures contracts | | | (118,909 | ) |
| |
Foreign currency transactions | | | (2,729 | ) |
| |
Net realized gain | | $ | 2,395,935 | |
| |
Change in unrealized appreciation (depreciation) — | | | | |
| |
Investments (including net decrease of $165 in accrued foreign capital gains taxes) | | $ | 16,037,126 | |
| |
Investments — affiliated investment | | | 1,311 | |
| |
Financial futures contracts | | | (329,788 | ) |
| |
Foreign currency | | | 1,398 | |
| |
Net change in unrealized appreciation (depreciation) | | $ | 15,710,047 | |
| |
Net realized and unrealized gain | | $ | 18,105,982 | |
| |
Net increase in net assets from operations | | $ | 34,256,217 | |
| | | | |
| | 15 | | See Notes to Financial Statements. |
Eaton Vance
Core Plus Bond Fund
September 30, 2019
Statements of Changes in Net Assets
| | | | | | | | |
| | | Year Ended September 30, | |
| Increase (Decrease) in Net Assets | | 2019 | | | 2018 | |
| | |
From operations — | | | | | | | | |
| | |
Net investment income | | $ | 16,150,235 | | | $ | 5,501,270 | |
| | |
Net realized gain | | | 2,395,935 | | | | 813,844 | |
| | |
Net change in unrealized appreciation (depreciation) | | | 15,710,047 | | | | (5,655,214 | ) |
| | |
Net increase in net assets from operations | | $ | 34,256,217 | | | $ | 659,900 | |
| | |
Distributions to shareholders — | | | | | | | | |
| | |
Class A | | $ | (2,807,716 | ) | | $ | (1,477,677 | ) |
| | |
Class C | | | (955,369 | ) | | | (583,378 | ) |
| | |
Class I | | | (13,044,946 | ) | | | (3,671,748 | ) |
| | |
Total distributions to shareholders | | $ | (16,808,031 | ) | | $ | (5,732,803 | ) |
| | |
Transactions in shares of beneficial interest — | | | | | | | | |
| | |
Proceeds from sale of shares | | | | | | | | |
| | |
Class A | | $ | 106,534,158 | | | $ | 27,400,537 | |
| | |
Class C | | | 36,217,560 | | | | 6,825,122 | |
| | |
Class I | | | 554,980,078 | | | | 142,333,086 | |
| | |
Net asset value of shares issued to shareholders in payment of distributions declared | | | | | | | | |
| | |
Class A | | | 2,704,090 | | | | 1,362,034 | |
| | |
Class C | | | 907,018 | | | | 539,859 | |
| | |
Class I | | | 12,950,089 | | | | 3,643,148 | |
| | |
Cost of shares redeemed | | | | | | | | |
| | |
Class A | | | (18,826,622 | ) | | | (17,879,234 | ) |
| | |
Class C | | | (6,212,159 | ) | | | (4,992,017 | ) |
| | |
Class I | | | (110,877,083 | ) | | | (32,054,112 | ) |
| | |
Net asset value of shares converted | | | | | | | | |
| | |
Class A | | | 1,058,491 | | | | — | |
| | |
Class C | | | (1,058,491 | ) | | | — | |
| | |
Net increase in net assets from Fund share transactions | | $ | 578,377,129 | | | $ | 127,178,423 | |
| | |
Net increase in net assets | | $ | 595,825,315 | | | $ | 122,105,520 | |
|
| Net Assets | |
| | |
At beginning of year | | $ | 216,792,129 | | | $ | 94,686,609 | |
| | |
At end of year | | $ | 812,617,444 | | | $ | 216,792,129 | |
| | | | |
| | 16 | | See Notes to Financial Statements. |
Eaton Vance
Core Plus Bond Fund
September 30, 2019
Financial Highlights
| | | | | | | | | | | | | | | | | | | | |
| | | Class A | |
| |
| | | Year Ended September 30, | |
| | | 2019 | | | 2018 | | | 2017 | | | 2016 | | | 2015 | |
| | | | | |
Net asset value — Beginning of year | | $ | 11.570 | | | $ | 11.930 | | | $ | 11.630 | | | $ | 11.040 | | | $ | 11.780 | |
| | | | | |
| Income (Loss) From Operations | | | | | | | | | | | | | | | | | | | | |
| | | | | |
Net investment income(1) | | $ | 0.427 | | | $ | 0.402 | | | $ | 0.367 | | | $ | 0.415 | | | $ | 0.358 | |
| | | | | |
Net realized and unrealized gain (loss) | | | 0.451 | | | | (0.344 | ) | | | 0.319 | | | | 0.774 | | | | (0.668 | ) |
| | | | | |
Total income (loss) from operations | | $ | 0.878 | | | $ | 0.058 | | | $ | 0.686 | | | $ | 1.189 | | | $ | (0.310 | ) |
| | | | | |
| Less Distributions | | | | | | | | | | | | | | | | | | | | |
| | | | | |
From net investment income | | $ | (0.458 | ) | | $ | (0.409 | ) | | $ | (0.322 | ) | | $ | (0.450 | ) | | $ | (0.430 | ) |
| | | | | |
From net realized gain | | | — | | | | (0.009 | ) | | | — | | | | (0.149 | ) | | | — | |
| | | | | |
Tax return of capital | | | — | | | | — | | | | (0.064 | ) | | | — | | | | — | |
| | | | | |
Total distributions | | $ | (0.458 | ) | | $ | (0.418 | ) | | $ | (0.386 | ) | | $ | (0.599 | ) | | $ | (0.430 | ) |
| | | | | |
Net asset value — End of year | | $ | 11.990 | | | $ | 11.570 | | | $ | 11.930 | | | $ | 11.630 | | | $ | 11.040 | |
| | | | | |
Total Return(2)(3) | | | 7.76 | % | | | 0.50 | % | | | 6.01 | % | | | 11.21 | % | | | (2.80 | )% |
| | | | | |
| Ratios/Supplemental Data | | | | | | | | | | | | | | | | | | | | |
| | | | | |
Net assets, end of year (000’s omitted) | | $ | 137,889 | | | $ | 43,503 | | | $ | 33,927 | | | $ | 17,977 | | | $ | 15,588 | |
| | | | | |
Ratios (as a percentage of average daily net assets): | | | | | | | | | | | | | | | | | | | | |
| | | | | |
Expenses(3)(4) | | | 0.74 | % | | | 0.74 | % | | | 0.77 | % | | | 0.80 | % | | | 0.85 | % |
| | | | | |
Net investment income | | | 3.62 | % | | | 3.43 | % | | | 3.13 | % | | | 3.74 | % | | | 3.03 | % |
| | | | | |
Portfolio Turnover | | | 75 | % | | | 43 | % | | | 61 | % | | | 71 | % | | | 119 | % |
| (1) | Computed using average shares outstanding. |
| (2) | Returns are historical and are calculated by determining the percentage change in net asset value with all distributions reinvested and do not reflect the effect of sales charges. |
| (3) | The investment adviser and administrator reimbursed certain operating expenses (equal to 0.11%, 0.22%, 0.36%, 0.53% and 0.34% of average daily net assets for the years ended September 30, 2019, 2018, 2017, 2016 and 2015, respectively). Absent this reimbursement, total return would be lower. |
| (4) | Excludes the effect of custody fee credits, if any, of less than 0.005%. Effective September 1, 2015, custody fee credits, which were earned on cash deposit balances, were discontinued by the custodian. |
| | | | |
| | 17 | | See Notes to Financial Statements. |
Eaton Vance
Core Plus Bond Fund
September 30, 2019
Financial Highlights — continued
| | | | | | | | | | | | | | | | | | | | |
| | | Class C | |
| |
| | | Year Ended September 30, | |
| | | 2019 | | | 2018 | | | 2017 | | | 2016 | | | 2015 | |
| | | | | |
Net asset value — Beginning of year | | $ | 11.560 | | | $ | 11.920 | | | $ | 11.620 | | | $ | 11.040 | | | $ | 11.770 | |
| | | | | |
| Income (Loss) From Operations | | | | | | | | | | | | | | | | | | | | |
| | | | | |
Net investment income(1) | | $ | 0.344 | | | $ | 0.313 | | | $ | 0.282 | | | $ | 0.331 | | | $ | 0.266 | |
| | | | | |
Net realized and unrealized gain (loss) | | | 0.456 | | | | (0.343 | ) | | | 0.317 | | | | 0.765 | | | | (0.655 | ) |
| | | | | |
Total income (loss) from operations | | $ | 0.800 | | | $ | (0.030 | ) | | $ | 0.599 | | | $ | 1.096 | | | $ | (0.389 | ) |
| | | | | |
| Less Distributions | | | | | | | | | | | | | | | | | | | | |
| | | | | |
From net investment income | | $ | (0.370 | ) | | $ | (0.321 | ) | | $ | (0.249 | ) | | $ | (0.367 | ) | | $ | (0.341 | ) |
| | | | | |
From net realized gain | | | — | | | | (0.009 | ) | | | — | | | | (0.149 | ) | | | — | |
| | | | | |
Tax return of capital | | | — | | | | — | | | | (0.050 | ) | | | — | | | | — | |
| | | | | |
Total distributions | | $ | (0.370 | ) | | $ | (0.330 | ) | | $ | (0.299 | ) | | $ | (0.516 | ) | | $ | (0.341 | ) |
| | | | | |
Net asset value — End of year | | $ | 11.990 | | | $ | 11.560 | | | $ | 11.920 | | | $ | 11.620 | | | $ | 11.040 | |
| | | | | |
Total Return(2)(3) | | | 7.05 | % | | | (0.25 | )% | | | 5.23 | % | | | 10.30 | % | | | (3.44 | )% |
| | | | | |
| Ratios/Supplemental Data | | | | | | | | | | | | | | | | | | | | |
| | | | | |
Net assets, end of year (000’s omitted) | | $ | 52,001 | | | $ | 20,926 | | | $ | 19,197 | | | $ | 12,574 | | | $ | 10,457 | |
| | | | | |
Ratios (as a percentage of average daily net assets): | | | | | | | | | | | | | | | | | | | | |
| | | | | |
Expenses(3)(4) | | | 1.49 | % | | | 1.49 | % | | | 1.52 | % | | | 1.55 | % | | | 1.60 | % |
| | | | | |
Net investment income | | | 2.93 | % | | | 2.67 | % | | | 2.41 | % | | | 2.98 | % | | | 2.25 | % |
| | | | | |
Portfolio Turnover | | | 75 | % | | | 43 | % | | | 61 | % | | | 71 | % | | | 119 | % |
| (1) | Computed using average shares outstanding. |
| (2) | Returns are historical and are calculated by determining the percentage change in net asset value with all distributions reinvested and do not reflect the effect of sales charges. |
| (3) | The investment adviser and administrator reimbursed certain operating expenses (equal to 0.11%, 0.22%, 0.36%, 0.53% and 0.34% of average daily net assets for the years ended September 30, 2019, 2018, 2017, 2016 and 2015, respectively). Absent this reimbursement, total return would be lower. |
| (4) | Excludes the effect of custody fee credits, if any, of less than 0.005%. Effective September 1, 2015, custody fee credits, which were earned on cash deposit balances, were discontinued by the custodian. |
| | | | |
| | 18 | | See Notes to Financial Statements. |
Eaton Vance
Core Plus Bond Fund
September 30, 2019
Financial Highlights — continued
| | | | | | | | | | | | | | | | | | | | |
| | | Class I | |
| |
| | | Year Ended September 30, | |
| | | 2019 | | | 2018 | | | 2017 | | | 2016 | | | 2015 | |
| | | | | |
Net asset value — Beginning of year | | $ | 11.560 | | | $ | 11.920 | | | $ | 11.620 | | | $ | 11.040 | | | $ | 11.770 | |
| | | | | |
| Income (Loss) From Operations | | | | | | | | | | | | | | | | | | | | |
| | | | | |
Net investment income(1) | | $ | 0.457 | | | $ | 0.440 | | | $ | 0.399 | | | $ | 0.442 | | | $ | 0.380 | |
| | | | | |
Net realized and unrealized gain (loss) | | | 0.460 | | | | (0.352 | ) | | | 0.316 | | | | 0.765 | | | | (0.651 | ) |
| | | | | |
Total income (loss) from operations | | $ | 0.917 | | | $ | 0.088 | | | $ | 0.715 | | | $ | 1.207 | | | $ | (0.271 | ) |
| | | | | |
| Less Distributions | | | | | | | | | | | | | | | | | | | | |
| | | | | |
From net investment income | | $ | (0.487 | ) | | $ | (0.439 | ) | | $ | (0.346 | ) | | $ | (0.478 | ) | | $ | (0.459 | ) |
| | | | | |
From net realized gain | | | — | | | | (0.009 | ) | | | — | | | | (0.149 | ) | | | — | |
| | | | | |
Tax return of capital | | | — | | | | — | | | | (0.069 | ) | | | — | | | | — | |
| | | | | |
Total distributions | | $ | (0.487 | ) | | $ | (0.448 | ) | | $ | (0.415 | ) | | $ | (0.627 | ) | | $ | (0.459 | ) |
| | | | | |
Net asset value — End of year | | $ | 11.990 | | | $ | 11.560 | | | $ | 11.920 | | | $ | 11.620 | | | $ | 11.040 | |
| | | | | |
Total Return(2)(3) | | | 8.12 | % | | | 0.74 | % | | | 6.28 | % | | | 11.40 | % | | | (2.47 | )% |
| | | | | |
| Ratios/Supplemental Data | | | | | | | | | | | | | | | | | | | | |
| | | | | |
Net assets, end of year (000’s omitted) | | $ | 622,727 | | | $ | 152,363 | | | $ | 41,563 | | | $ | 6,700 | | | $ | 6,969 | |
| | | | | |
Ratios (as a percentage of average daily net assets): | | | | | | | | | | | | | | | | | | | | |
| | | | | |
Expenses(3)(4) | | | 0.49 | % | | | 0.49 | % | | | 0.52 | % | | | 0.55 | % | | | 0.60 | % |
| | | | | |
Net investment income | | | 3.89 | % | | | 3.77 | % | | | 3.40 | % | | | 4.00 | % | | | 3.21 | % |
| | | | | |
Portfolio Turnover | | | 75 | % | | | 43 | % | | | 61 | % | | | 71 | % | | | 119 | % |
| (1) | Computed using average shares outstanding. |
| (2) | Returns are historical and are calculated by determining the percentage change in net asset value with all distributions reinvested. |
| (3) | The investment adviser and administrator reimbursed certain operating expenses (equal to 0.11%, 0.22%, 0.36%, 0.53% and 0.34% of average daily net assets for the years ended September 30, 2019, 2018, 2017, 2016 and 2015, respectively). Absent this reimbursement, total return would be lower. |
| (4) | Excludes the effect of custody fee credits, if any, of less than 0.005%. Effective September 1, 2015, custody fee credits, which were earned on cash deposit balances, were discontinued by the custodian. |
| | | | |
| | 19 | | See Notes to Financial Statements. |
Eaton Vance
Core Plus Bond Fund
September 30, 2019
Notes to Financial Statements
1 Significant Accounting Policies
Eaton Vance Core Plus Bond Fund (the Fund) is a diversified series of Eaton Vance Mutual Funds Trust (the Trust). The Trust is a Massachusetts business trust registered under the Investment Company Act of 1940, as amended (the 1940 Act), as an open-end management investment company. The Fund’s investment objective is total return. The Fund offers three classes of shares. Class A shares are generally sold subject to a sales charge imposed at time of purchase. Class C shares are sold at net asset value and are generally subject to a contingent deferred sales charge (see Note 5). Effective January 25, 2019, Class C shares generally automatically convert to Class A shares ten years after their purchase as described in the Fund’s prospectus. Class I shares are sold at net asset value and are not subject to a sales charge. Each class represents a pro-rata interest in the Fund, but votes separately on class-specific matters and (as noted below) is subject to different expenses. Realized and unrealized gains and losses are allocated daily to each class of shares based on the relative net assets of each class to the total net assets of the Fund. Net investment income, other than class-specific expenses, is allocated daily to each class of shares based upon the ratio of the value of each class’s paid shares to the total value of all paid shares. Each class of shares differs in its distribution plan and certain other class-specific expenses.
The following is a summary of significant accounting policies of the Fund. The policies are in conformity with accounting principles generally accepted in the United States of America (U.S. GAAP). The Fund is an investment company and follows accounting and reporting guidance in the Financial Accounting Standards Board (FASB) Accounting Standards Codification Topic 946.
A Investment Valuation — The following methodologies are used to determine the market value or fair value of investments.
Debt Obligations. Debt obligations are generally valued on the basis of valuations provided by third party pricing services, as derived from such services’ pricing models. Inputs to the models may include, but are not limited to, reported trades, executable bid and ask prices, broker/dealer quotations, prices or yields of securities with similar characteristics, interest rates, anticipated prepayments, benchmark curves or information pertaining to the issuer, as well as industry and economic events. The pricing services may use a matrix approach, which considers information regarding securities with similar characteristics to determine the valuation for a security. Short-term debt obligations purchased with a remaining maturity of sixty days or less for which a valuation from a third party pricing service is not readily available may be valued at amortized cost, which approximates fair value.
Equity Securities. Equity securities listed on a U.S. securities exchange generally are valued at the last sale or closing price on the day of valuation or, if no sales took place on such date, at the mean between the closing bid and ask prices on the exchange where such securities are principally traded. Equity securities listed on the NASDAQ Global or Global Select Market generally are valued at the NASDAQ official closing price. Unlisted or listed securities for which closing sales prices or closing quotations are not available are valued at the mean between the latest available bid and ask prices or, in the case of preferred equity securities that are not listed or traded in the over-the-counter market, by a third party pricing service that uses various techniques that consider factors including, but not limited to, prices or yields of securities with similar characteristics, benchmark yields, broker/dealer quotes, quotes of underlying common stock, issuer spreads, as well as industry and economic events.
Derivatives. Financial futures contracts are valued at the closing settlement price established by the board of trade or exchange on which they are traded.
Foreign Securities and Currencies. Foreign securities and currencies are valued in U.S. dollars, based on foreign currency exchange rate quotations supplied by a third party pricing service. The pricing service uses a proprietary model to determine the exchange rate. Inputs to the model include reported trades and implied bid/ask spreads.
Affiliated Fund. The Fund may invest in Eaton Vance Cash Reserves Fund, LLC (Cash Reserves Fund), an affiliated investment company managed by Eaton Vance Management (EVM). While Cash Reserves Fund is not a registered money market mutual fund, it conducts all of its investment activities in accordance with the requirements of Rule 2a-7 under the 1940 Act. Investments in Cash Reserves Fund are valued at the closing net asset value per unit on the valuation day. Cash Reserves Fund generally values its investment securities based on available market quotations provided by a third party pricing service.
Fair Valuation. Investments for which valuations or market quotations are not readily available or are deemed unreliable are valued at fair value using methods determined in good faith by or at the direction of the Trustees of the Fund in a manner that most fairly reflects the security’s “fair value”, which is the amount that the Fund might reasonably expect to receive for the security upon its current sale in the ordinary course. Each such determination is based on a consideration of relevant factors, which are likely to vary from one pricing context to another. These factors may include, but are not limited to, the type of security, the existence of any contractual restrictions on the security’s disposition, the price and extent of public trading in similar securities of the issuer or of comparable companies or entities, quotations or relevant information obtained from broker/dealers or other market participants, information obtained from the issuer, analysts, and/or the appropriate stock exchange (for exchange-traded securities), an analysis of the company’s or entity’s financial statements, and an evaluation of the forces that influence the issuer and the market(s) in which the security is purchased and sold.
B Investment Transactions — Investment transactions for financial statement purposes are accounted for on a trade date basis. Realized gains and losses on investments sold are determined on the basis of identified cost.
C Income — Interest income is recorded on the basis of interest accrued, adjusted for amortization of premium or accretion of discount. Fees associated with loan amendments are recognized immediately. Dividend income is recorded on the ex-dividend date for dividends received in cash and/or securities. Withholding taxes on foreign interest have been provided for in accordance with the Fund’s understanding of the applicable countries’ tax rules and rates. Inflation adjustments to the principal amount of inflation-adjusted bonds and notes are reflected as interest income. Deflation adjustments to the principal amount of an inflation-adjusted bond or note are reflected as reductions to interest income to the extent of interest income previously recorded on such bond or note.
Eaton Vance
Core Plus Bond Fund
September 30, 2019
Notes to Financial Statements — continued
D Federal Taxes — The Fund’s policy is to comply with the provisions of the Internal Revenue Code applicable to regulated investment companies and to distribute to shareholders each year substantially all of its net investment income, and all or substantially all of its net realized capital gains. Accordingly, no provision for federal income or excise tax is necessary.
In addition to the requirements of the Internal Revenue Code, the Fund may also be subject to local taxes on the recognition of capital gains in certain countries. In determining the daily net asset value, the Fund estimates the accrual for such taxes, if any, based on the unrealized appreciation on certain portfolio securities and the related tax rates. Taxes attributable to unrealized appreciation are included in the change in unrealized appreciation (depreciation) on investments. Capital gains taxes on securities sold are included in net realized gain (loss) on investments.
As of September 30, 2019, the Fund had no uncertain tax positions that would require financial statement recognition, de-recognition, or disclosure. The Fund files a U.S. federal income tax return annually after its fiscal year-end, which is subject to examination by the Internal Revenue Service for a period of three years from the date of filing.
E Expenses — The majority of expenses of the Trust are directly identifiable to an individual fund. Expenses which are not readily identifiable to a specific fund are allocated taking into consideration, among other things, the nature and type of expense and the relative size of the funds.
F Foreign Currency Translation — Investment valuations, other assets, and liabilities initially expressed in foreign currencies are translated each business day into U.S. dollars based upon current exchange rates. Purchases and sales of foreign investment securities and income and expenses denominated in foreign currencies are translated into U.S. dollars based upon currency exchange rates in effect on the respective dates of such transactions. Recognized gains or losses on investment transactions attributable to changes in foreign currency exchange rates are recorded for financial statement purposes as net realized gains and losses on investments. That portion of unrealized gains and losses on investments that results from fluctuations in foreign currency exchange rates is not separately disclosed.
G Use of Estimates — The preparation of the financial statements in conformity with U.S. GAAP requires management to make estimates and assumptions that affect the reported amounts of assets and liabilities at the date of the financial statements and the reported amounts of income and expense during the reporting period. Actual results could differ from those estimates.
H Indemnifications — Under the Trust’s organizational documents, its officers and Trustees may be indemnified against certain liabilities and expenses arising out of the performance of their duties to the Fund. Under Massachusetts law, if certain conditions prevail, shareholders of a Massachusetts business trust (such as the Trust) could be deemed to have personal liability for the obligations of the Trust. However, the Trust’s Declaration of Trust contains an express disclaimer of liability on the part of Fund shareholders and the By-laws provide that the Trust shall assume, upon request by the shareholder, the defense on behalf of any Fund shareholders. Moreover, the By-laws also provide for indemnification out of Fund property of any shareholder held personally liable solely by reason of being or having been a shareholder for all loss or expense arising from such liability. Additionally, in the normal course of business, the Fund enters into agreements with service providers that may contain indemnification clauses. The Fund’s maximum exposure under these arrangements is unknown as this would involve future claims that may be made against the Fund that have not yet occurred.
I Financial Futures Contracts — Upon entering into a financial futures contract, the Fund is required to deposit with the broker, either in cash or securities, an amount equal to a certain percentage of the contract amount (initial margin). Subsequent payments, known as variation margin, are made or received by the Fund each business day, depending on the daily fluctuations in the value of the underlying security, and are recorded as unrealized gains or losses by the Fund. Gains (losses) are realized upon the expiration or closing of the financial futures contracts. Should market conditions change unexpectedly, the Fund may not achieve the anticipated benefits of the financial futures contracts and may realize a loss. Futures contracts have minimal counterparty risk as they are exchange traded and the clearinghouse for the exchange is substituted as the counterparty, guaranteeing counterparty performance.
J When-Issued Securities and Delayed Delivery Transactions — The Fund may purchase or sell securities on a delayed delivery or when-issued basis. Payment and delivery may take place after the customary settlement period for that security. At the time the transaction is negotiated, the price of the security that will be delivered is fixed. The Fund maintains cash and/or security positions for these commitments such that sufficient liquid assets will be available to make payments upon settlement. Securities purchased on a delayed delivery or when-issued basis are marked-to-market daily and begin earning interest on settlement date. Losses may arise due to changes in the market value of the underlying securities or if the counterparty does not perform under the contract.
2 Distributions to Shareholders and Income Tax Information
The Fund declares dividends daily to shareholders of record at the time of declaration. Distributions are generally paid monthly. Distributions of realized capital gains are made at least annually. Distributions to shareholders are recorded on the ex-dividend date. Distributions are declared separately for each class of shares. Shareholders may reinvest income and capital gain distributions in additional shares of the same class of the Fund at the net asset value as of the ex-dividend date or, at the election of the shareholder, receive distributions in cash. Distributions to shareholders are determined in accordance with income tax regulations, which may differ from U.S. GAAP. As required by U.S. GAAP, only distributions in excess of tax basis earnings and profits are reported in the financial statements as a return of capital. Permanent differences between book and tax accounting relating to distributions are reclassified to paid-in capital. For tax purposes, distributions from short-term capital gains are considered to be from ordinary income.
Eaton Vance
Core Plus Bond Fund
September 30, 2019
Notes to Financial Statements — continued
The tax character of distributions declared for the years ended September 30, 2019 and September 30, 2018 was as follows:
| | | | | | | | |
| | | Year Ended September 30, | |
| | | 2019 | | | 2018 | |
| | |
Ordinary income | | $ | 16,808,031 | | | $ | 5,570,305 | |
| | |
Long-term capital gains | | $ | — | | | $ | 162,498 | |
During the year ended September 30, 2019, distributable earnings was decreased by $422,735 and paid-in capital was increased by $422,735 due to the Fund’s use of equalization accounting. Tax equalization accounting allows the Fund to treat as a distribution that portion of redemption proceeds representing a redeeming shareholder’s portion of undistributed taxable income and net capital gains. These reclassifications had no effect on the net assets or net asset value per share of the Fund.
As of September 30, 2019, the components of distributable earnings (accumulated loss) on a tax basis were as follows:
| | | | |
| | |
Undistributed ordinary income | | $ | 9,092 | |
| |
Net unrealized appreciation | | $ | 12,630,704 | |
| |
Distributions payable | | $ | (12,789 | ) |
The cost and unrealized appreciation (depreciation) of investments, including open derivative contracts, of the Fund at September 30, 2019, as determined on a federal income tax basis, were as follows:
| | | | |
| |
Aggregate cost | | $ | 798,078,626 | |
| |
Gross unrealized appreciation | | $ | 17,500,083 | |
| |
Gross unrealized depreciation | | | (4,859,706 | ) |
| |
Net unrealized appreciation | | $ | 12,640,377 | |
3 Investment Adviser Fee and Other Transactions with Affiliates
The investment adviser fee is earned by Boston Management and Research (BMR), a subsidiary of EVM, as compensation for investment advisory services rendered to the Fund. Pursuant to the investment advisory agreement and subsequent fee reduction agreement between the Fund and BMR, the fee is computed at an annual rate of 0.45% of the Fund’s average daily net assets up to $1 billion and is payable monthly. On net assets of $1 billion and over, the annual fee is reduced. The fee reduction cannot be terminated without the consent of the Trustees and shareholders. For the year ended September 30, 2019, the Fund’s investment adviser fee amounted to $1,915,983 or 0.45% of the Fund’s average daily net assets. The Fund invests its cash in Cash Reserves Fund. EVM does not currently receive a fee for advisory services provided to Cash Reserves Fund.
BMR has agreed to reimburse the Fund’s expenses to the extent that total annual operating expenses (relating to ordinary operating expenses only) exceed 0.74%, 1.49% and 0.49% of the Fund’s average daily net assets for Class A, Class C and Class I, respectively. This agreement may be changed or terminated after January 31, 2020. Pursuant to this agreement, BMR was allocated $482,518 of the Fund’s operating expenses for the year ended September 30, 2019.
EVM serves as the administrator of the Fund, but receives no compensation. EVM provides sub-transfer agency and related services to the Fund pursuant to a Sub-Transfer Agency Support Services Agreement. For the year ended September 30, 2019, EVM earned $5,364 from the Fund pursuant to such agreement, which is included in transfer and dividend disbursing agent fees on the Statement of Operations. The Fund was informed that Eaton Vance Distributors, Inc. (EVD), an affiliate of EVM and the Fund’s principal underwriter, received $52,170 as its portion of the sales charge on sales of Class A shares for the year ended September 30, 2019. EVD also received distribution and service fees from Class A and Class C shares (see Note 4) and contingent deferred sales charges (see Note 5).
Trustees and officers of the Fund who are members of EVM’s or BMR’s organizations receive remuneration for their services to the Fund out of the investment adviser fee. Trustees of the Fund who are not affiliated with the investment adviser may elect to defer receipt of all or a percentage of their annual fees in accordance with the terms of the Trustees Deferred Compensation Plan. For the year ended September 30, 2019, no significant amounts have been deferred. Certain officers and Trustees of the Fund are officers of the above organizations.
Eaton Vance
Core Plus Bond Fund
September 30, 2019
Notes to Financial Statements — continued
4 Distribution Plans
The Fund has in effect a distribution plan for Class A shares (Class A Plan) pursuant to Rule 12b-1 under the 1940 Act. Pursuant to the Class A Plan, the Fund pays EVD a distribution and service fee of 0.25% per annum of its average daily net assets attributable to Class A shares for distribution services and facilities provided to the Fund by EVD, as well as for personal services and/or the maintenance of shareholder accounts. Distribution and service fees paid or accrued to EVD for the year ended September 30, 2019 amounted to $184,962 for Class A shares.
The Fund also has in effect a distribution plan for Class C shares (Class C Plan) pursuant to Rule 12b-1 under the 1940 Act. Pursuant to the Class C Plan, the Fund pays EVD amounts equal to 0.75% per annum of its average daily net assets attributable to Class C shares for providing ongoing distribution services and facilities to the Fund. For the year ended September 30, 2019, the Fund paid or accrued to EVD $231,467 for Class C shares.
Pursuant to the Class C Plan, the Fund also makes payments of service fees to EVD, financial intermediaries and other persons in amounts equal to 0.25% per annum of its average daily net assets attributable to that class. Service fees paid or accrued are for personal services and/or the maintenance of shareholder accounts. They are separate and distinct from the sales commissions and distribution fees payable to EVD. Service fees paid or accrued for the year ended September 30, 2019 amounted to $77,156 for Class C shares.
Distribution and service fees are subject to the limitations contained in the Financial Industry Regulatory Authority Rule 2341(d).
5 Contingent Deferred Sales Charges
A contingent deferred sales charge (CDSC) of 1% generally is imposed on redemptions of Class C shares made within one year of purchase. Class A shares may be subject to a 1% CDSC if redeemed within 18 months of purchase (depending on the circumstances of purchase). Generally, the CDSC is based upon the lower of the net asset value at date of redemption or date of purchase. No charge is levied on shares acquired by reinvestment of dividends or capital gain distributions. For the year ended September 30, 2019, the Fund was informed that EVD received approximately $100 and $3,000 of CDSCs paid by Class A and Class C shareholders, respectively.
6 Purchases and Sales of Investments
Purchases and sales of investments, other than short-term obligations and including maturities, paydowns and principal repayments on Senior Loans, for the year ended September 30, 2019 were as follows:
| | | | | | | | |
| | | Purchases | | | Sales | |
| | |
Investments (non-U.S. Government) | | $ | 669,039,913 | | | $ | 243,776,715 | |
| | |
U.S. Government and Agency Securities | | | 67,779,960 | | | | 15,594,596 | |
| | |
| | | $ | 736,819,873 | | | $ | 259,371,311 | |
7 Shares of Beneficial Interest
The Fund’s Declaration of Trust permits the Trustees to issue an unlimited number of full and fractional shares of beneficial interest (without par value). Such shares may be issued in a number of different series (such as the Fund) and classes. Transactions in Fund shares were as follows:
| | | | | | | | |
| | | Year Ended September 30, | |
| Class A | | 2019 | | | 2018 | |
| | |
Sales | | | 9,020,427 | | | | 2,323,804 | |
| | |
Issued to shareholders electing to receive payments of distributions in Fund shares | | | 229,199 | | | | 116,194 | |
| | |
Redemptions | | | (1,607,150 | ) | | | (1,522,948 | ) |
| | |
Converted from Class C shares | | | 92,036 | | | | — | |
| | |
Net increase | | | 7,734,512 | | | | 917,050 | |
Eaton Vance
Core Plus Bond Fund
September 30, 2019
Notes to Financial Statements — continued
| | | | | | | | |
| | | Year Ended September 30, | |
| Class C | | 2019 | | | 2018 | |
| | |
Sales | | | 3,073,859 | | | | 579,842 | |
| | |
Issued to shareholders electing to receive payments of distributions in Fund shares | | | 77,163 | | | | 46,064 | |
| | |
Redemptions | | | (531,535 | ) | | | (425,935 | ) |
| | |
Converted to Class A shares | | | (92,028 | ) | | | — | |
| | |
Net increase | | | 2,527,459 | | | | 199,971 | |
| |
| | | Year Ended September 30, | |
| Class I | | 2019 | | | 2018 | |
| | |
Sales | | | 47,131,144 | | | | 12,128,224 | |
| | |
Issued to shareholders electing to receive payments of distributions in Fund shares | | | 1,098,871 | | | | 311,985 | |
| | |
Redemptions | | | (9,455,127 | ) | | | (2,745,878 | ) |
| | |
Net increase | | | 38,774,888 | | | | 9,694,331 | |
8 Financial Instruments
The Fund may trade in financial instruments with off-balance sheet risk in the normal course of its investing activities. These financial instruments may include futures contracts and may involve, to a varying degree, elements of risk in excess of the amounts recognized for financial statement purposes. The notional or contractual amounts of these instruments represent the investment the Fund has in particular classes of financial instruments and do not necessarily represent the amounts potentially subject to risk. The measurement of the risks associated with these instruments is meaningful only when all related and offsetting transactions are considered. A summary of obligations under these financial instruments at September 30, 2019 is included in the Portfolio of Investments. At September 30, 2019, the Fund had sufficient cash and/or securities to cover commitments under these contracts.
The Fund is subject to interest rate risk in the normal course of pursuing its investment objective. Because the Fund holds fixed-rate bonds, the value of these bonds may decrease if interest rates rise. The Fund enters into U.S. Treasury futures contracts to hedge against fluctuations in interest rates.
The fair value of open derivative instruments (not considered to be hedging instruments for accounting disclosure purposes) and whose primary underlying risk exposure is interest rate risk at September 30, 2019 was as follows:
| | | | | | | | |
| | | Fair Value | |
| Derivative | | Asset Derivative(1) | | | Liability Derivative(1) | |
| | |
Financial futures contracts | | $ | — | | | $ | (329,788 | ) |
| (1) | Only the current day’s variation margin on open futures contracts is reported within the Statement of Assets and Liabilities as Receivable or Payable for variation margin on open financial futures contracts, as applicable. |
The effect of derivative instruments (not considered to be hedging instruments for accounting disclosure purposes) on the Statement of Operations and whose primary underlying risk exposure is interest rate risk for the year ended September 30, 2019 was as follows:
| | | | | | | | |
| Derivative | | Realized Gain (Loss) on Derivatives Recognized in Income(1) | | | Change in Unrealized Appreciation (Depreciation) on Derivatives Recognized in Income(2) | |
| | |
Financial futures contracts | | $ | (118,909 | ) | | $ | (329,788 | ) |
| (1) | Statement of Operations location: Net realized gain (loss) – Financial futures contracts. |
| (2) | Statement of Operations location: Change in unrealized appreciation (depreciation) – Financial futures contracts. |
Eaton Vance
Core Plus Bond Fund
September 30, 2019
Notes to Financial Statements — continued
The average notional cost of futures contracts (long) outstanding during the year ended September 30, 2019, which is indicative of the volume of this derivative type, was approximately $14,454,000.
9 Line of Credit
The Fund participates with other portfolios and funds managed by EVM and its affiliates in a $625 million unsecured line of credit agreement with a group of banks, which is in effect through October 29, 2019. Borrowings are made by the Fund solely to facilitate the handling of unusual and/or unanticipated short-term cash requirements. Interest is charged to the Fund based on its borrowings at an amount above either the Eurodollar rate or Federal Funds rate. In addition, a fee computed at an annual rate of 0.15% on the daily unused portion of the line of credit is allocated among the participating portfolios and funds at the end of each quarter. Because the line of credit is not available exclusively to the Fund, it may be unable to borrow some or all of its requested amounts at any particular time. The Fund did not have any significant borrowings or allocated fees during the year ended September 30, 2019.
Effective October 29, 2019, the Fund renewed its line of credit agreement, which expires October 27, 2020. In connection with the renewal, funds managed by Calvert Research and Management, an affiliate of EVM, were added as participating funds to the agreement and the borrowing limit was increased from $625 million to $800 million.
10 Risks Associated with Foreign Investments
Investing in securities issued by companies whose principal business activities are outside the United States may involve significant risks not present in domestic investments. For example, there is generally less publicly available information about foreign companies, particularly those not subject to the disclosure and reporting requirements of the U.S. securities laws. Certain foreign issuers are generally not bound by uniform accounting, auditing, and financial reporting requirements and standards of practice comparable to those applicable to domestic issuers. Investments in foreign securities also involve the risk of possible adverse changes in investment or exchange control regulations, expropriation or confiscatory taxation, limitation on the removal of funds or other assets of the Fund, political or financial instability or diplomatic and other developments which could affect such investments. Foreign securities markets, while growing in volume and sophistication, are generally not as developed as those in the United States, and securities of some foreign issuers (particularly those located in developing countries) may be less liquid and more volatile than securities of comparable U.S. companies. In general, there is less overall governmental supervision and regulation of foreign securities markets, broker/dealers and issuers than in the United States.
11 Investments in Affiliated Funds
At September 30, 2019, the value of the Fund’s investment in affiliated funds was $129,677,910, which represents 15.9% of the Fund’s net assets. Transactions in affiliated funds by the Fund for the year ended September 30, 2019 were as follows:
| | | | | | | | | | | | | | | | | | | | | | | | | | | | | | | | |
Name of
affiliated fund | | Value,
beginning
of period | | | Purchases | | | Sales proceeds | | | Net
realized
gain (loss) | | | Change in
unrealized
appreciation
(depreciation) | | | Value, end of period | | | Dividend
income | | | Units, end of period | |
| | | | | | | | |
Short-Term Investments | | | | | | | | | | | | | | | | | | | | | | | | | | | | | | | | |
| | | | | | | | |
Eaton Vance Cash Reserves Fund, LLC, 2.09% | | $ | 40,656,217 | | | $ | 480,078,939 | | | $ | (391,049,018 | ) | | $ | (9,539 | ) | | $ | 1,311 | | | $ | 129,677,910 | | | $ | 1,962,568 | | | | 129,690,879 | |
12 Fair Value Measurements
Under generally accepted accounting principles for fair value measurements, a three-tier hierarchy to prioritize the assumptions, referred to as inputs, is used in valuation techniques to measure fair value. The three-tier hierarchy of inputs is summarized in the three broad levels listed below.
| • | | Level 1 – quoted prices in active markets for identical investments |
| • | | Level 2 – other significant observable inputs (including quoted prices for similar investments, interest rates, prepayment speeds, credit risk, etc.) |
| • | | Level 3 – significant unobservable inputs (including a fund’s own assumptions in determining the fair value of investments) |
Eaton Vance
Core Plus Bond Fund
September 30, 2019
Notes to Financial Statements — continued
In cases where the inputs used to measure fair value fall in different levels of the fair value hierarchy, the level disclosed is determined based on the lowest level input that is significant to the fair value measurement in its entirety. The inputs or methodology used for valuing securities are not necessarily an indication of the risk associated with investing in those securities.
At September 30, 2019, the hierarchy of inputs used in valuing the Fund’s investments and open derivative instruments, which are carried at value, were as follows:
| | | | | | | | | | | | | | | | |
| Asset Description | | Level 1 | | | Level 2 | | | Level 3 | | | Total | |
| | | | |
Corporate Bonds & Notes | | $ | — | | | $ | 312,936,443 | | | $ | — | | | $ | 312,936,443 | |
| | | | |
Collateralized Mortgage Obligations | | | — | | | | 29,635,198 | | | | — | | | | 29,635,198 | |
| | | | |
Commercial Mortgage-Backed Securities | | | — | | | | 77,565,805 | | | | — | | | | 77,565,805 | |
| | | | |
Asset-Backed Securities | | | — | | | | 175,093,668 | | | | — | | | | 175,093,668 | |
| | | | |
Foreign Government Bonds | | | — | | | | 31,952,641 | | | | — | | | | 31,952,641 | |
| | | | |
Preferred Stocks | | | 7,139,000 | | | | 158,334 | | | | — | | | | 7,297,334 | |
| | | | |
U.S. Treasury Obligations | | | — | | | | 38,713,899 | | | | — | | | | 38,713,899 | |
| | | | |
Short-Term Investments — | | | | | | | | | | | | | | | | |
| | | | |
Commercial Paper | | | — | | | | 7,846,105 | | | | — | | | | 7,846,105 | |
| | | | |
Other | | | — | | | | 129,677,910 | | | | — | | | | 129,677,910 | |
| | | | |
Total Investments | | $ | 7,139,000 | | | $ | 803,580,003 | | | $ | — | | | $ | 810,719,003 | |
| | | | |
Liability Description | | | | | | | | | | | | | | | | |
| | | | |
Futures Contracts | | $ | (329,788 | ) | | $ | — | | | $ | — | | | $ | (329,788 | ) |
| | | | |
Total | | $ | (329,788 | ) | | $ | — | | | $ | — | | | $ | (329,788 | ) |
Eaton Vance
Core Plus Bond Fund
September 30, 2019
Report of Independent Registered Public Accounting Firm
To the Trustees of Eaton Vance Mutual Funds Trust and Shareholders of Eaton Vance Core Plus Bond Fund:
Opinion on the Financial Statements and Financial Highlights
We have audited the accompanying statement of assets and liabilities of Eaton Vance Core Plus Bond Fund (the “Fund”) (one of the funds constituting Eaton Vance Mutual Funds Trust), including the portfolio of investments, as of September 30, 2019, the related statement of operations for the year then ended, the statements of changes in net assets for each of the two years in the period then ended, the financial highlights for each of the five years in the period then ended, and the related notes. In our opinion, the financial statements and financial highlights present fairly, in all material respects, the financial position of the Fund as of September 30, 2019, and the results of its operations for the year then ended, the changes in its net assets for each of the two years in the period then ended, and the financial highlights for each of the five years in the period then ended, in conformity with accounting principles generally accepted in the United States of America.
Basis for Opinion
These financial statements and financial highlights are the responsibility of the Fund’s management. Our responsibility is to express an opinion on the Fund’s financial statements and financial highlights based on our audits. We are a public accounting firm registered with the Public Company Accounting Oversight Board (United States) (PCAOB) and are required to be independent with respect to the Fund in accordance with the U.S. federal securities laws and the applicable rules and regulations of the Securities and Exchange Commission and the PCAOB.
We conducted our audits in accordance with the standards of the PCAOB. Those standards require that we plan and perform the audit to obtain reasonable assurance about whether the financial statements and financial highlights are free of material misstatement, whether due to error or fraud. The Fund is not required to have, nor were we engaged to perform, an audit of its internal control over financial reporting. As part of our audits we are required to obtain an understanding of internal control over financial reporting but not for the purpose of expressing an opinion on the effectiveness of the Fund’s internal control over financial reporting. Accordingly, we express no such opinion.
Our audits included performing procedures to assess the risks of material misstatement of the financial statements and financial highlights, whether due to error or fraud, and performing procedures that respond to those risks. Such procedures included examining, on a test basis, evidence regarding the amounts and disclosures in the financial statements and financial highlights. Our audits also included evaluating the accounting principles used and significant estimates made by management, as well as evaluating the overall presentation of the financial statements and financial highlights. Our procedures included confirmation of securities owned as of September 30, 2019, by correspondence with the custodian and brokers; when replies were not received from brokers, we performed other auditing procedures. We believe that our audits provide a reasonable basis for our opinion.
/s/ Deloitte & Touche LLP
Boston, Massachusetts
November 19, 2019
We have served as the auditor of one or more Eaton Vance investment companies since 1959.
Eaton Vance
Core Plus Bond Fund
September 30, 2019
Federal Tax Information (Unaudited)
The Form 1099-DIV you receive in February 2020 will show the tax status of all distributions paid to your account in calendar year 2019. Shareholders are advised to consult their own tax adviser with respect to the tax consequences of their investment in the Fund.
Eaton Vance
Core Plus Bond Fund
September 30, 2019
Board of Trustees’ Contract Approval
Overview of the Contract Review Process
The Investment Company Act of 1940, as amended (the “1940 Act”), provides, in substance, that the investment advisory agreement between a fund and its investment adviser will continue in effect from year-to-year only if its continuation is approved on an annual basis by a vote of the fund’s board of trustees, including a majority of the trustees who are not “interested persons” of the fund (“independent trustees”), cast in person at a meeting called for the purpose of considering such approval.
At a meeting held on April 24, 2019, the Boards of Trustees/Directors (collectively, the “Board”) of the registered investment companies advised by Eaton Vance Management or its affiliate, Boston Management and Research (the “Eaton Vance Funds”), including a majority of the independent trustees (the “Independent Trustees”), voted to approve the continuation of existing investment advisory and sub-advisory agreements for each of the Eaton Vance Funds for an additional one-year period. In voting its approval, the Board relied upon the affirmative recommendation of its Contract Review Committee, which is a committee exclusively comprised of Independent Trustees. Prior to making its recommendation, the Contract Review Committee reviewed information furnished by the adviser and sub-adviser (where applicable) to each of the Eaton Vance Funds (including information specifically requested by the Board) for a series of meetings held between February and April 2019. Members of the Contract Review Committee also considered information received at prior meetings of the Board and its committees, to the extent such information was relevant to the Contract Review Committee’s annual evaluation of the investment advisory and sub-advisory agreements.
Among other things, the information the Board considered included the following (for funds that invest through one or more underlying portfolios, references to “each fund” in this section may include information that was considered at the portfolio-level):
Information about Fees, Performance and Expenses
| | • | | A report from an independent data provider comparing advisory and related fees paid by each fund to such fees paid by comparable funds, as identified by the independent data provider (“comparable funds”); |
| | • | | A report from an independent data provider comparing each fund’s total expense ratio (and its components) to those of comparable funds; |
| | • | | A report from an independent data provider comparing the investment performance of each fund (including, where relevant, yield data, Sharpe ratios and information ratios) to the investment performance of comparable funds over various time periods; |
| | • | | Data regarding investment performance relative to benchmark indices and, in certain instances, to customized groups of peer funds and blended indices identified by the adviser in consultation with the Portfolio Management Committee of the Board; |
| | • | | Comparative information concerning the fees charged and services provided by the adviser and sub-adviser (where applicable) to each fund in managing other accounts (including mutual funds, other collective investment funds and institutional accounts) using investment strategies and techniques similar to those used in managing such fund(s), if any; |
| | • | | Profitability analyses with respect to the adviser and sub-adviser (where applicable) to each of the funds; |
Information about Portfolio Management and Trading
| | • | | Descriptions of the investment management services provided to each fund, as well as each of the funds’ investment strategies and policies; |
| | • | | The procedures and processes used to determine the fair value of fund assets, when necessary, and actions taken to monitor and test the effectiveness of such procedures and processes; |
| | • | | Information about the policies and practices of each fund’s adviser and sub-adviser (where applicable and in the context of a sub-adviser with trading responsibilities) with respect to trading, including their processes for seeking best execution of portfolio transactions; |
| | • | | Information about the allocation of brokerage transactions and the benefits, if any, received by the adviser and sub-adviser (where applicable and in the context of a sub-adviser with trading responsibilities) to each fund as a result of brokerage allocation, including information concerning the acquisition of research through client commission arrangements and policies with respect to “soft dollars”; |
| | • | | Data relating to the portfolio turnover rate of each fund; |
Information about each Adviser and Sub-adviser
| | • | | Reports detailing the financial results and condition of the adviser and sub-adviser (where applicable) to each fund; |
| | • | | Information regarding the individual investment professionals whose responsibilities include portfolio management and investment research for the funds, and, for portfolio managers and certain other investment professionals, information relating to their responsibilities with respect to managing other mutual funds and investment accounts, if applicable; |
| | • | | The Code of Ethics of the adviser and its affiliates and the sub-adviser (where applicable) of each fund, together with information relating to compliance with, and the administration of, such codes; |
| | • | | Policies and procedures relating to proxy voting and the handling of corporate actions and class actions; |
| | • | | Information concerning the resources devoted to compliance efforts undertaken by the adviser and its affiliates and the sub-adviser (where applicable) of each fund, if any, including descriptions of their various compliance programs and their record of compliance; |
| | • | | Information concerning the business continuity and disaster recovery plans of the adviser and its affiliates and the sub-adviser (where applicable) of each fund, if any; |
Eaton Vance
Core Plus Bond Fund
September 30, 2019
Board of Trustees’ Contract Approval — continued
| | • | | A description of Eaton Vance Management’s and Boston Management and Research’s oversight of sub-advisers, including with respect to regulatory and compliance issues, investment management and other matters; |
Other Relevant Information
| | • | | Information concerning the nature, cost and character of the administrative and other non-investment advisory services provided by Eaton Vance Management and its affiliates; |
| | • | | Information concerning management of the relationship with the custodian, subcustodians and fund accountants by the adviser or administrator to each of the funds; and |
| | • | | The terms of each investment advisory agreement. |
During the various meetings of the Board and its committees throughout the twelve months ended April 2019, the Trustees received information from portfolio managers and other investment professionals of the advisers and sub-advisers (where applicable) of the funds regarding investment and performance matters, and considered various investment and trading strategies used in pursuing the funds’ investment objectives. The Trustees also received information regarding risk management techniques employed in connection with the management of the funds. The Board and its Committees evaluated issues pertaining to industry and regulatory developments, compliance procedures, fund governance and other issues with respect to the funds, and received and participated in reports and presentations provided by Eaton Vance Management, Boston Management and Research and fundsub-advisers (as applicable), with respect to such matters. In addition to the formal meetings of the Board and its committees, the Independent Trustees held regular teleconferences to discuss, among other topics, matters relating to the continuation of investment advisory and sub-advisory agreements.
The Contract Review Committee was advised throughout the contract review process by Goodwin Procter LLP, independent legal counsel for the Independent Trustees. The members of the Contract Review Committee, with the advice of such counsel, exercised their own business judgment in determining the material factors to be considered in evaluating each investment advisory and sub-advisory agreement and the weight to be given to each such factor. The conclusions reached with respect to each investment advisory and sub-advisory agreement were based on a comprehensive evaluation of all the information provided and not any single factor. Moreover, each member of the Contract Review Committee may have placed varying emphasis on particular factors in reaching conclusions with respect to each investment advisory and sub-advisory agreement. In evaluating each investment advisory and sub-advisory agreement, including the fee structures and other terms contained in such agreements, the members of the Contract Review Committee were also informed by multiple years of analysis and discussion with the adviser and sub-adviser (where applicable) to each of the Eaton Vance Funds.
Results of the Process
Based on its consideration of the foregoing, and such other information as it deemed relevant, including the factors and conclusions described below, the Contract Review Committee concluded that the continuation of the investment advisory agreement between Eaton Vance Core Plus Bond Fund (the “Fund”) and Boston Management and Research (the “Adviser”), including its fee structure, is in the interests of shareholders and, therefore, recommended to the Board approval of the agreement. Based on the recommendation of the Contract Review Committee, the Board, including a majority of the Independent Trustees, voted to approve continuation of the investment advisory agreement for the Fund.
Nature, Extent and Quality of Services
In considering whether to approve the investment advisory agreement for the Fund, the Board evaluated the nature, extent and quality of services provided to the Fund by the Adviser.
The Board considered the Adviser’s management capabilities and investment processes in light of the types of investments held by the Fund, including the education, experience and number of investment professionals and other personnel who provide portfolio management, investment research, and similar services to the Fund. The Board considered, where relevant, the abilities and experience of the Adviser’s investment professionals in analyzing factors such as credit risk and special considerations relevant to investing in income securities. The Board considered the Adviser’s in-house research capabilities. The Board also took into account the resources dedicated to portfolio management and other services, the compensation methods of the Adviser and other factors, including the reputation and resources of the Adviser to recruit and retain highly qualified research, advisory and supervisory investment professionals. In addition, the Board considered the time and attention devoted to the Eaton Vance Funds, including the Fund, by senior management, as well as the infrastructure, operational capabilities and support staff in place to assist in the portfolio management and operations of the Fund, including the provision of administrative services. The Board also considered the business-related and other risks to which the Adviser or its affiliates may be subject in managing the Fund.
The Board considered the compliance programs of the Adviser and relevant affiliates thereof. The Board considered compliance and reporting matters regarding, among other things, personal trading by investment professionals, disclosure of portfolio holdings, late trading, frequent trading, portfolio valuation, business continuity and the allocation of investment opportunities. The Board also considered the responses of the Adviser and its affiliates to requests in recent years from regulatory authorities, such as the Securities and Exchange Commission and the Financial Industry Regulatory Authority.
Eaton Vance
Core Plus Bond Fund
September 30, 2019
Board of Trustees’ Contract Approval — continued
The Board considered shareholder and other administrative services provided or managed by Eaton Vance Management and its affiliates, including transfer agency and accounting services. The Board evaluated the benefits to shareholders of investing in a fund that is a part of a large fund complex offering exposure to a variety of asset classes and investment disciplines, as well as the ability, in many cases, to exchange an investment among different funds without incurring additional sales charges.
After consideration of the foregoing factors, among others, the Board concluded that the nature, extent and quality of services provided by the Adviser, taken as a whole, are appropriate and consistent with the terms of the investment advisory agreement.
Fund Performance
The Board compared the Fund’s investment performance to that of comparable funds and appropriate benchmark indices. The Board’s review included comparative performance data with respect to the Fund for the one-, three- and five-year periods ended September 30, 2018. In this regard, the Board noted that the performance of the Fund was higher than the median performance of the Fund’s peer group for the three-year period. The Board also noted that the performance of the Fund was higher than its benchmark index for the three-year period. The Board concluded that the performance of the Fund was satisfactory.
Management Fees and Expenses
The Board considered contractual fee rates payable by the Fund for advisory and administrative services (referred to collectively as “management fees”). As part of its review, the Board considered the Fund’s management fees and total expense ratio for the one-year period ended September 30, 2018, as compared to those of comparable funds, before and after giving effect to any undertaking to waive fees or reimburse expenses. The Board also considered factors that had an impact on the Fund’s total expense ratio relative to comparable funds.
After considering the foregoing information, and in light of the nature, extent and quality of the services provided by the Adviser, the Board concluded that the management fees charged for advisory and related services are reasonable.
Profitability and “Fall-Out” Benefits
The Board considered the level of profits realized by the Adviser and relevant affiliates thereof in providing investment advisory and administrative services to the Fund and to all Eaton Vance Funds as a group. The Board considered the level of profits realized without regard to marketing support or other payments by the Adviser and its affiliates to third parties in respect of distribution services.
The Board concluded that, in light of the foregoing factors and the nature, extent and quality of the services rendered, the profits realized by the Adviser and its affiliates are deemed not to be excessive.
The Board also considered direct or indirect fall-out benefits received by the Adviser and its affiliates in connection with their respective relationships with the Fund, including the benefits of research services that may be available to the Adviser as a result of securities transactions effected for the Fund and other investment advisory clients.
Economies of Scale
In reviewing management fees and profitability, the Board also considered the extent to which the Adviser and its affiliates, on the one hand, and the Fund, on the other hand, can expect to realize benefits from economies of scale as the assets of the Fund increase. The Board acknowledged the difficulty in accurately measuring the benefits resulting from economies of scale, if any, with respect to the management of any specific fund or group of funds. The Board reviewed data summarizing the increases and decreases in the assets of the Fund and of all Eaton Vance Funds as a group over various time periods, and evaluated the extent to which the total expense ratio of the Fund and the profitability of the Adviser and its affiliates may have been affected by such increases or decreases. Based upon the foregoing, the Board concluded that the Fund currently shares in the benefits from economies of scale, if any, when they are realized by the Adviser. The Board also concluded that the structure of the advisory fee, which includes breakpoints at several asset levels, will allow the Fund to continue to benefit from any economies of scale in the future.
Eaton Vance
Core Plus Bond Fund
September 30, 2019
Management and Organization
Fund Management. The Trustees of Eaton Vance Mutual Funds Trust (the Trust) are responsible for the overall management and supervision of the Trust’s affairs. The Trustees and officers of the Trust are listed below. Except as indicated, each individual has held the office shown or other offices in the same company for the last five years. Trustees and officers of the Trust hold indefinite terms of office. The “Noninterested Trustees” consist of those Trustees who are not “interested persons” of the Trust, as that term is defined under the 1940 Act. The business address of each Trustee and officer is Two International Place, Boston, Massachusetts 02110. As used below, “EVC” refers to Eaton Vance Corp., “EV” refers to Eaton Vance, Inc., “EVM” refers to Eaton Vance Management, “BMR” refers to Boston Management and Research and “EVD” refers to Eaton Vance Distributors, Inc. EVC and EV are the corporate parent and trustee, respectively, of EVM and BMR. EVD is the Fund’s principal underwriter and a wholly-owned subsidiary of EVC. Each officer affiliated with Eaton Vance may hold a position with other Eaton Vance affiliates that is comparable to his or her position with EVM listed below. Each Trustee oversees 162 portfolios in the Eaton Vance Complex (including all master and feeder funds in a master feeder structure). Each officer serves as an officer of certain other Eaton Vance funds. Each Trustee and officer serve until his or her successor is elected.
| | | | | | |
| Name and Year of Birth | | Trust
Position(s) | | Trustee Since(1) | | Principal Occupation(s) and Other Directorships
During Past Five Years and Other Relevant Experience |
|
| Interested Trustee |
| | | |
Thomas E. Faust Jr. 1958 | | Trustee | | 2007 | | Chairman, Chief Executive Officer and President of EVC, Director and President of EV, Chief Executive Officer and President of EVM and BMR, and Director of EVD. Trustee and/or officer of 162 registered investment companies. Mr. Faust is an interested person because of his positions with EVM, BMR, EVD, EVC and EV, which are affiliates of the Trust. Other Directorships in the Last Five Years. Director of EVC and Hexavest Inc. (investment management firm). |
|
| Noninterested Trustees |
| | | |
Mark R. Fetting 1954 | | Trustee | | 2016 | | Private investor. Formerly held various positions at Legg Mason, Inc. (investment management firm) (2000-2012), including President, Chief Executive Officer, Director and Chairman (2008-2012), Senior Executive Vice President (2004-2008) and Executive Vice President (2001-2004). Formerly, President of Legg Mason family of funds (2001-2008). Formerly, Division President and Senior Officer of Prudential Financial Group, Inc. and related companies (investment management firm)(1991-2000). Other Directorships in the Last Five Years. None. |
| | | |
Cynthia E. Frost 1961 | | Trustee | | 2014 | | Private investor. Formerly, Chief Investment Officer of Brown University (university endowment) (2000-2012). Formerly, Portfolio Strategist for Duke Management Company (university endowment manager) (1995-2000). Formerly, Managing Director, Cambridge Associates (investment consulting company) (1989-1995). Formerly, Consultant, Bain and Company (management consulting firm) (1987-1989). Formerly, Senior Equity Analyst, BA Investment Management Company (1983-1985). Other Directorships in the Last Five Years. None. |
| | | |
George J. Gorman 1952 | | Trustee | | 2014 | | Principal at George J. Gorman LLC (consulting firm). Formerly, Senior Partner at Ernst & Young LLP (a registered public accounting firm) (1974-2009). Other Directorships in the Last Five Years. Formerly, Trustee of the BofA Funds Series Trust (11 funds) (2011-2014) and of the Ashmore Funds (9 funds) (2010-2014). |
| | | |
Valerie A. Mosley 1960 | | Trustee | | 2014 | | Chairwoman and Chief Executive Officer of Valmo Ventures (a consulting and investment firm). Former Partner and Senior Vice President, Portfolio Manager and Investment Strategist at Wellington Management Company, LLP (investment management firm) (1992-2012). Former Chief Investment Officer, PG Corbin Asset Management (1990-1992). Formerly worked in institutional corporate bond sales at Kidder Peabody (1986-1990). Other Directorships in the Last Five Years. Director of Envestnet, Inc. (provider of intelligent systems for wealth management and financial wellness) (since 2018). Director of Dynex Capital, Inc. (mortgage REIT) (since 2013). |
| | | |
William H. Park 1947 | | Chairperson of the Board and Trustee | | 2016 (Chairperson) and 2003 (Trustee) | | Private investor. Formerly, Consultant (management and transactional) (2012-2014). Formerly, Chief Financial Officer, Aveon Group L.P. (investment management firm) (2010-2011). Formerly, Vice Chairman, Commercial Industrial Finance Corp. (specialty finance company) (2006-2010). Formerly, President and Chief Executive Officer, Prizm Capital Management, LLC (investment management firm) (2002-2005). Formerly, Executive Vice President and Chief Financial Officer, United Asset Management Corporation (investment management firm) (1982-2001). Formerly, Senior Manager, Price Waterhouse (now PricewaterhouseCoopers) (a registered public accounting firm) (1972-1981). Other Directorships in the Last Five Years. None. |
Eaton Vance
Core Plus Bond Fund
September 30, 2019
Management and Organization — continued
| | | | | | |
| Name and Year of Birth | | Trust
Position(s) | | Trustee Since(1) | | Principal Occupation(s) and Other Directorships
During Past Five Years and Other Relevant Experience |
|
| Noninterested Trustees (continued) |
| | | |
Helen Frame Peters 1948 | | Trustee | | 2008 | | Professor of Finance, Carroll School of Management, Boston College. Formerly, Dean, Carroll School of Management, Boston College (2000-2002). Formerly, Chief Investment Officer, Fixed Income, Scudder Kemper Investments (investment management firm) (1998-1999). Formerly, Chief Investment Officer, Equity and Fixed Income, Colonial Management Associates (investment management firm) (1991-1998). Other Directorships in the Last Five Years. None. |
| | | |
Keith Quinton 1958 | | Trustee | | 2018 | | Independent Investment Committee Member at New Hampshire Retirement System (since 2017). Advisory Committee member at Northfield Information Services, Inc. (risk management analytics provider) (since 2016). Formerly, Portfolio Manager and Senior Quantitative Analyst at Fidelity Investments (investment management firm)(2001-2014). Other Directorships in the Last Five Years. Director of New Hampshire Municipal Bond Bank (since 2016). |
| | | |
Marcus L. Smith 1966 | | Trustee | | 2018 | | Member of Posse Boston Advisory Board (foundation) (since 2015). Trustee at University of Mount Union (since 2008). Formerly, Portfolio Manager at MFS Investment Management (investment management firm) (1994-2017). Other Directorships in the Last Five Years. Director of MSCI Inc. (global provider of investment decision support tools) (since 2017). Formerly, Director of DCT Industrial Trust Inc. (logistics real estate company) (2017-2018). |
| | | |
Susan J. Sutherland 1957 | | Trustee | | 2015 | | Private investor. Formerly, Associate, Counsel and Partner at Skadden, Arps, Slate, Meagher & Flom LLP (law firm) (1982-2013). Other Directorships in the Last Five Years. Formerly, Director of Montpelier Re Holdings Ltd. (global provider of customized insurance and reinsurance products) (2013-2015). |
| | | |
Scott E. Wennerholm 1959 | | Trustee | | 2016 | | Formerly, Trustee at Wheelock College (postsecondary institution) (2012-2018). Formerly, Consultant at GF Parish Group (executive recruiting firm) (2016-2017). Formerly, Chief Operating Officer and Executive Vice President at BNY Mellon Asset Management (investment management firm) (2005-2011). Formerly, Chief Operating Officer and Chief Financial Officer at Natixis Global Asset Management (investment management firm) (1997-2004). Formerly, Vice President at Fidelity Investments Institutional Services (investment management firm) (1994-1997). Other Directorships in the Last Five Years. None. |
| | | | | | |
| Name and Year of Birth | | Trust
Position(s) | | Officer
Since(2) | | Principal Occupation(s) During Past Five Years |
|
| Principal Officers who are not Trustees |
| | | |
Payson F. Swaffield 1956 | | President | | 2003 | | Vice President and Chief Income Investment Officer of EVM and BMR. Also Vice President of Calvert Research and Management (“CRM”) since 2016. |
| | | |
Maureen A. Gemma 1960 | | Vice President, Secretary and Chief Legal Officer | | 2005 | | Vice President of EVM and BMR. Also Vice President of CRM since 2016. |
| | | |
James F. Kirchner 1967 | | Treasurer | | 2007 | | Vice President of EVM and BMR. Also Vice President of CRM since 2016. |
| | | |
Richard F. Froio 1968 | | Chief Compliance Officer | | 2017 | | Vice President of EVM and BMR since 2017. Formerly Deputy Chief Compliance Officer (Adviser/Funds) and Chief Compliance Officer (Distribution) at PIMCO (2012-2017) and Managing Director at BlackRock/Barclays Global Investors (2009-2012). |
| (1) | Year first appointed to serve as Trustee for a fund in the Eaton Vance family of funds. Each Trustee has served continuously since appointment unless indicated otherwise. |
| (2) | Year first elected to serve as officer of a fund in the Eaton Vance family of funds when the officer has served continuously. Otherwise, year of most recent election as an officer of a fund in the Eaton Vance family of funds. Titles may have changed since initial election. |
The SAI for the Fund includes additional information about the Trustees and officers of the Fund and can be obtained without charge on Eaton Vance’s website at www.eatonvance.com or by calling 1-800-262-1122.
Eaton Vance Funds
IMPORTANT NOTICES
Privacy. The Eaton Vance organization is committed to ensuring your financial privacy. Each of the financial institutions identified below has in effect the following policy (“Privacy Policy”) with respect to nonpublic personal information about its customers:
| • | | Only such information received from you, through application forms or otherwise, and information about your Eaton Vance fund transactions will be collected. This may include information such as name, address, social security number, tax status, account balances and transactions. |
| • | | None of such information about you (or former customers) will be disclosed to anyone, except as permitted by law (which includes disclosure to employees necessary to service your account). In the normal course of servicing a customer’s account, Eaton Vance may share information with unaffiliated third parties that perform various required services such as transfer agents, custodians and broker-dealers. |
| • | | Policies and procedures (including physical, electronic and procedural safeguards) are in place that are designed to protect the confidentiality of such information. |
| • | | We reserve the right to change our Privacy Policy at any time upon proper notification to you. Customers may want to review our Privacy Policy periodically for changes by accessing the link on our homepage: www.eatonvance.com. |
Our pledge of privacy applies to the following entities within the Eaton Vance organization: the Eaton Vance Family of Funds, Eaton Vance Management, Eaton Vance Investment Counsel, Eaton Vance Distributors, Inc., Eaton Vance Trust Company, Eaton Vance Management (International) Limited, Eaton Vance Advisers International Ltd., Eaton Vance Management’s Real Estate Investment Group and Boston Management and Research. In addition, our Privacy Policy applies only to those Eaton Vance customers who are individuals and who have a direct relationship with us. If a customer’s account (i.e., fund shares) is held in the name of a third-party financial advisor/broker-dealer, it is likely that only such advisor’s privacy policies apply to the customer. This notice supersedes all previously issued privacy disclosures. For more information about Eaton Vance’s Privacy Policy, please call 1-800-262-1122.
Delivery of Shareholder Documents. The Securities and Exchange Commission (SEC) permits funds to deliver only one copy of shareholder documents, including prospectuses, proxy statements and shareholder reports, to fund investors with multiple accounts at the same residential or post office box address. This practice is often called “householding” and it helps eliminate duplicate mailings to shareholders.Eaton Vance, or your financial intermediary, may household the mailing of your documents indefinitely unless you instruct Eaton Vance, or your financial intermediary, otherwise.If you would prefer that your Eaton Vance documents not be householded, please contact Eaton Vance at1-800-262-1122, or contact your financial intermediary. Your instructions that householding not apply to delivery of your Eaton Vance documents will typically be effective within 30 days of receipt by Eaton Vance or your financial intermediary.
Portfolio Holdings. Each Eaton Vance Fund and its underlying Portfolio(s) (if applicable) files a schedule of portfolio holdings on Part F toForm N-PORT with the SEC for the first and third quarters of each fiscal year. The Form N-PORT will be available on the Eaton Vance website at www.eatonvance.com, by calling Eaton Vance at 1-800-262-1122 or in the EDGAR database on the SEC’s website at www.sec.gov.
Proxy Voting. From time to time, funds are required to vote proxies related to the securities held by the funds. The Eaton Vance Funds or their underlying Portfolios (if applicable) vote proxies according to a set of policies and procedures approved by the Funds’ and Portfolios’ Boards. You may obtain a description of these policies and procedures and information on how the Funds or Portfolios voted proxies relating to portfolio securities during the most recent 12-month period ended June 30, without charge, upon request, by calling 1-800-262-1122 and by accessing the SEC’s website at www.sec.gov.
This Page Intentionally Left Blank
This Page Intentionally Left Blank
Investment Adviser
Boston Management and Research
Two International Place
Boston, MA 02110
Administrator
Eaton Vance Management
Two International Place
Boston, MA 02110
Principal Underwriter*
Eaton Vance Distributors, Inc.
Two International Place
Boston, MA 02110
(617) 482-8260
Custodian
State Street Bank and Trust Company
State Street Financial Center, One Lincoln Street
Boston, MA 02111
Transfer Agent
BNY Mellon Investment Servicing (US) Inc.
Attn: Eaton Vance Funds
P.O. Box 9653
Providence, RI 02940-9653
(800) 262-1122
Independent Registered Public Accounting Firm
Deloitte & Touche LLP
200 Berkeley Street
Boston, MA 02116-5022
Fund Offices
Two International Place
Boston, MA 02110
| * | FINRA BrokerCheck. Investors may check the background of their Investment Professional by contacting the Financial Industry Regulatory Authority (FINRA). FINRA BrokerCheck is a free tool to help investors check the professional background of current and former FINRA-registered securities firms and brokers. FINRA BrokerCheck is available by calling 1-800-289-9999 and at www.FINRA.org. The FINRA BrokerCheck brochure describing this program is available to investors at www.FINRA.org. |

4595 9.30.19

Eaton Vance
Municipal Income Funds
Annual Report
September 30, 2019
AMT-Free • National
Important Note. Beginning on January 1, 2021, as permitted by regulations adopted by the Securities and Exchange Commission, paper copies of each Fund’s annual and semi-annual shareholder reports will no longer be sent by mail unless you specifically request paper copies of the reports. Instead, the reports will be made available on the Funds’ website (eatonvance.com/funddocuments), and you will be notified by mail each time a report is posted and provided with a website address to access the report.
If you already elected to receive shareholder reports electronically, you will not be affected by this change and you need not take any action. If you are a direct investor, you may elect to receive shareholder reports and other communications from the Funds electronically by signing up for e-Delivery at eatonvance.com/edelivery. If you own your shares through a financial intermediary (such as a broker-dealer or bank), you must contact your financial intermediary to sign up.
You may elect to receive all future Fund shareholder reports in paper free of charge. If you are a direct investor, you can inform the Funds that you wish to continue receiving paper copies of your shareholder reports by calling 1-800-262-1122. If you own these shares through a financial intermediary, you must contact your financial intermediary or follow instructions included with this disclosure, if applicable, to elect to continue to receive paper copies of your shareholder reports. Your election to receive reports in paper will apply to all Eaton Vance funds held directly or to all funds held through your financial intermediary, as applicable.

Commodity Futures Trading Commission Registration. Effective December 31, 2012, the Commodity Futures Trading Commission (“CFTC”) adopted certain regulatory changes that subject registered investment companies and advisers to regulation by the CFTC if a fund invests more than a prescribed level of its assets in certain CFTC-regulated instruments (including futures, certain options and swap agreements) or markets itself as providing investment exposure to such instruments. Each Fund has claimed an exclusion from the definition of the term “commodity pool operator” under the Commodity Exchange Act. Accordingly, neither the Funds nor the adviser with respect to the operation of the Funds is subject to CFTC regulation. Because of its management of other strategies, each Fund’s adviser is registered with the CFTC as a commodity pool operator and a commodity trading advisor.
Fund shares are not insured by the FDIC and are not deposits or other obligations of, or guaranteed by, any depository institution. Shares are subject to investment risks, including possible loss of principal invested.
This report must be preceded or accompanied by a current summary prospectus or prospectus. Before investing, investors should consider carefully the investment objective, risks, and charges and expenses of a mutual fund. This and other important information is contained in the summary prospectus and prospectus, which can be obtained from a financial intermediary. Prospective investors should read the prospectus carefully before investing. For further information, please call 1-800-262-1122.
Annual ReportSeptember 30, 2019
Eaton Vance
Municipal Income Funds
Table of Contents
| | | | |
Management’s Discussion of Fund Performance | | | 2 | |
| |
Performance and Fund Profile | | | | |
| |
| | | | |
AMT-Free Municipal Income Fund | | | 3 | |
National Municipal Income Fund | | | 5 | |
| |
| | | | |
| |
Endnotes and Additional Disclosures | | | 7 | |
| |
Fund Expenses | | | 8 | |
| |
Financial Statements | | | 10 | |
| |
Report of Independent Registered Public Accounting Firm | | | 43 | |
| |
Federal Tax Information | | | 45 | |
| |
Board of Trustees’ Contract Approval | | | 46 | |
| |
Management and Organization | | | 50 | |
| |
Important Notices | | | 52 | |
Eaton Vance
Municipal Income Funds
September 30, 2019
Management’s Discussion of Fund Performance1
Economic and Market Conditions
For the 12-month period ended September 30, 2019, investors witnessed a dramatic turnaround in fixed-income markets. The rising interest-rate environment at the beginning of the period gave way to a falling interest-rate climate against the backdrop of multiple domestic and international uncertainties.
As a whole, the period was marked by strong performance across the municipal bond market with the Bloomberg Barclays Municipal Bond Index (the Index),2 a broad measure of the asset class, returning 8.55%. The municipal bond yield curve9 experienced a so-called “bull market flattening,” where rates declined across the curve but more so toward the long end of the curve. With investors searching for yield in a low-rate environment, lower-rated7 bonds generally outperformed higher-rated bonds, while longer-duration10 issues outperformed shorter-duration issues.
With U.S. economic data largely positive in calendar year 2018, the U.S. Federal Reserve Board (the Fed) raised its benchmark federal funds rate four times — from a low range of 1.50%-1.75% to 2.25%-2.50% — with the last quarter-point increase on December 19, 2018.
As 2018 came to a close, investors became increasingly concerned about a growing U.S.-China trade war and looming U.S. government shutdown. In connection with its December 2018 rate hike, the Fed lowered its number of projected interest-rate increases in 2019 from three to two, which some investors viewed as indicating weakness in the U.S. economy. The result was a “flight to quality” by investors seeking the relative safety of fixed-income investments over stocks. This bond rally pushed longer-term bond prices up and yields down in the final month of 2018.
The first two months of 2019 were relatively quiet for bonds. Downward pressure on interest rates and upward pressure on prices resumed in March 2019 and continued through the end of the period propelled by lower-than-desired inflation, Brexit concerns, low European interest rates, and on-again/off-again trade-conflict rhetoric. This combination of factors fueled investor concerns about both U.S. and global growth potential during the period.
After holding interest rates steady through the first half of 2019, the Fed cut its benchmark interest rate to 2.00%-2.25% on July 31 — its first reduction in over a decade — followed by a second interest-rate drop to 1.75%-2.00% on September 18. Lower rates are intended to help stimulate economic activity by making borrowing costs relatively more affordable.
Within the municipal bond market, technical factors amplified the price rally during the period. The 2017 tax law changes resulted in a combination of lower supply of new municipals and increased demand from high-income investors in high-tax states who had seen their tax bills rise under the new code. For the period as a whole, high-quality municipals generally underperformed Treasurys in the two-six-year area of the yield curve; performed in line with Treasurys in the middle of the
curve; and outperformed Treasurys in the 16-30-year area of the curve.
Fund Performance
For the 12-month period ended September 30, 2019, Eaton Vance AMT-Free Municipal Income Fund Class A shares at net asset value (NAV) underperformed the 8.55% return of its primary benchmark, the Index; while Eaton Vance National Municipal Income Fund Class A shares at NAV performed approximately in line with the Index.
The Funds’ overall strategy is to normally invest in bonds with maturities of 10 years or more, in order to capture their typically higher yields and a greater income stream compared with shorter-maturity issues.
The Funds may seek to enhance tax-exempt income through the use of leveraged investments by purchasing residual interest bonds.6 Leverage has the effect of magnifying the Funds’ exposure to their underlying investments in both up and down markets. During this period of falling rates and rising bond prices, residual interest bonds were a contributor to performance versus the Index — which does not employ leverage — for both Funds.
Management attempts to hedge the portfolios to various degrees against the potential risk of interest-rate volatility at the long end of the yield curve by using Treasury futures, interest-rate swaps, or both. As a risk management strategy, the hedge is intended to moderate performance in both up and down markets. So in a period when municipal and Treasury bonds generally rose in price, the Funds’ Treasury futures hedge mitigated a portion of that appreciation, and was a detractor from relative results versus the unhedged Index for both Funds. However, by period-end, the Treasury futures hedge was no longer present in either Fund.
Fund-Specific Results
Eaton Vance AMT-Free Municipal Income Fund returned 8.02% for Class A shares at NAV, underperforming the 8.55% return of the Index during the period. Detractors from results relative to the Index included the Fund’s hedging strategy; an overweight in prerefunded or escrowed bonds, relative to the Index; and security selection in AAA-rated bonds. In contrast, contributors to Fund performance versus the Index included leveraged investments, an overweight in Illinois bonds, and an overweight in zero-coupon bonds, which were the best-performing coupon structure in the Index during the period.
Eaton Vance National Municipal Income Fund returned 8.57% for Class A shares at NAV, performing approximately in line with the 8.55% return of the Index during the period. Contributors to performance relative to the Index included an overweight in alternative minimum tax bonds, security selection in New York bonds, and security selection in the transportation sector. Detractors from performance versus the Index included an overweight in prerefunded bonds, the Fund’s hedging strategy, and security selection in the health care sector, which was the best-performing sector in the Index during the period.
See Endnotes and Additional Disclosures in this report.
Past performance is no guarantee of future results. Returns are historical and are calculated by determining the percentage change in net asset value (NAV) or offering price (as applicable) with all distributions reinvested. Investment return and principal value will fluctuate so that shares, when redeemed, may be worth more or less than their original cost. Performance less than or equal to one year is cumulative. Performance is for the stated time period only; due to market volatility, the Fund’s current performance may be lower or higher than quoted. Returns are before taxes unless otherwise noted. For performance as of the most recent month-end, please refer to eatonvance.com.
Eaton Vance
AMT-Free Municipal Income Fund
September 30, 2019
Performance2,3
Portfolio Manager Cynthia J. Clemson
| | | | | | | | | | | | | | | | | | | | |
% Average Annual Total Returns | | Class
Inception Date | | | Performance
Inception Date | | | One Year | | | Five Years | | | Ten Years | |
Class A at NAV | | | 01/06/1998 | | | | 03/16/1978 | | | | 8.02 | % | | | 3.62 | % | | | 4.35 | % |
Class A with 4.75% Maximum Sales Charge | | | — | | | | — | | | | 2.91 | | | | 2.61 | | | | 3.84 | |
Class C at NAV | | | 05/02/2006 | | | | 03/16/1978 | | | | 7.24 | | | | 2.85 | | | | 3.58 | |
Class C with 1% Maximum Sales Charge | | | — | | | | — | | | | 6.24 | | | | 2.85 | | | | 3.58 | |
Class I at NAV | | | 03/16/1978 | | | | 03/16/1978 | | | | 8.34 | | | | 3.86 | | | | 4.61 | |
Bloomberg Barclays Municipal Bond Index | | | — | | | | — | | | | 8.55 | % | | | 3.66 | % | | | 4.16 | % |
Bloomberg Barclays Long (22+) Year Municipal Bond Index | | | — | | | | — | | | | 11.30 | | | | 5.14 | | | | 5.55 | |
| | | | | |
| | | | | | | | | | | | | | | | | | | | |
| % Total Annual Operating Expense Ratios4 | | | | | | | | Class A | | | Class C | | | Class I | |
| | | | | | | | | | | 1.05 | % | | | 1.80 | % | | | 0.80 | % |
| | | | | |
| | | | | | | | | | | | | | | | | | | | |
| % Distribution Rates/Yields5 | | | | | | | | Class A | | | Class C | | | Class I | |
Distribution Rate | | | | | | | | | | | 3.30 | % | | | 2.56 | % | | | 3.55 | % |
Taxable-Equivalent Distribution Rate | | | | | | | | | | | 5.57 | | | | 4.32 | | | | 6.00 | |
SEC 30-day Yield | | | | | | | | | | | 1.36 | | | | 0.69 | | | | 1.68 | |
Taxable-Equivalent SEC 30-day Yield | | | | | | | | | | | 2.31 | | | | 1.16 | | | | 2.84 | |
| | | | | |
| | | | | | | | | | | | | | | | | | | | |
| % Total Leverage6 | | | | | | | | | | | | | | | |
Residual Interest Bond (RIB) Financing | | | | | | | | | | | | | | | | | | | 8.60 | % |
Growth of $10,000
This graph shows the change in value of a hypothetical investment of $10,000 in Class A of the Fund for the period indicated. For comparison, the same investment is shown in the indicated index.
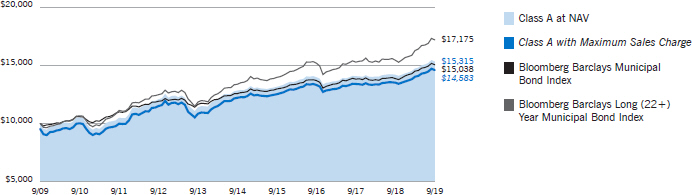
| | | | | | | | | | | | | | | | |
| Growth of Investment | | Amount Invested | | | Period Beginning | | | At NAV | | | With Maximum Sales Charge | |
Class C | | $ | 10,000 | | | | 09/30/2009 | | | $ | 14,217 | | | | N.A. | |
Class I | | $ | 250,000 | | | | 09/30/2009 | | | $ | 392,564 | | | | N.A. | |
See Endnotes and Additional Disclosures in this report.
Past performance is no guarantee of future results. Returns are historical and are calculated by determining the percentage change in net asset value (NAV) or offering price (as applicable) with all distributions reinvested. Investment return and principal value will fluctuate so that shares, when redeemed, may be worth more or less than their original cost. Performance less than or equal to one year is cumulative. Performance is for the stated time period only; due to market volatility, the Fund’s current performance may be lower or higher than quoted. Returns are before taxes unless otherwise noted. For performance as of the most recent month-end, please refer to eatonvance.com.
Eaton Vance
AMT-Free Municipal Income Fund
September 30, 2019
Fund Profile
Credit Quality (% of total investments)7,8
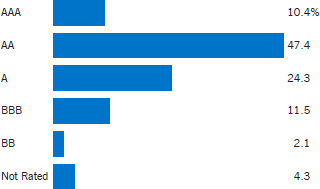
See Endnotes and Additional Disclosures in this report.
Eaton Vance
National Municipal Income Fund
September 30, 2019
Performance2,3
Portfolio Manager Craig R. Brandon, CFA
| | | | | | | | | | | | | | | | | | | | |
% Average Annual Total Returns | | Class
Inception Date | | | Performance
Inception Date | | | One Year | | | Five Years | | | Ten Years | |
Class A at NAV | | | 04/05/1994 | | | | 12/19/1985 | | | | 8.57 | % | | | 4.28 | % | | | 4.58 | % |
Class A with 4.75% Maximum Sales Charge | | | — | | | | — | | | | 3.42 | | | | 3.28 | | | | 4.08 | |
Class C at NAV | | | 12/03/1993 | | | | 12/19/1985 | | | | 7.77 | | | | 3.51 | | | | 3.80 | |
Class C with 1% Maximum Sales Charge | | | — | | | | — | | | | 6.77 | | | | 3.51 | | | | 3.80 | |
Class I at NAV | | | 07/01/1999 | | | | 12/19/1985 | | | | 8.83 | | | | 4.52 | | | | 4.84 | |
Bloomberg Barclays Municipal Bond Index | | | — | | | | — | | | | 8.55 | % | | | 3.66 | % | | | 4.16 | % |
Bloomberg Barclays Long (22+) Year Municipal Bond Index | | | — | | | | — | | | | 11.30 | | | | 5.14 | | | | 5.55 | |
| | | | | |
| | | | | | | | | | | | | | | | | | | | |
| % Total Annual Operating Expense Ratios4 | | | | | | | | Class A | | | Class C | | | Class I | |
| | | | | | | | | | | 0.88 | % | | | 1.63 | % | | | 0.63 | % |
| | | | | |
| | | | | | | | | | | | | | | | | | | | |
| % Distribution Rates/Yields5 | | | | | | | | Class A | | | Class C | | | Class I | |
Distribution Rate | | | | | | | | | | | 3.05 | % | | | 2.33 | % | | | 3.27 | % |
Taxable-Equivalent Distribution Rate | | | | | | | | | | | 5.15 | | | | 3.94 | | | | 5.52 | |
SEC 30-day Yield | | | | | | | | | | | 1.38 | | | | 0.71 | | | | 1.70 | |
Taxable-Equivalent SEC 30-day Yield | | | | | | | | | | | 2.33 | | | | 1.19 | | | | 2.87 | |
| | | | | |
| | | | | | | | | | | | | | | | | | | | |
| % Total Leverage6 | | | | | | | | | | | | | | | |
RIB Financing | | | | | | | | | | | | | | | | | | | 4.24 | % |
Growth of $10,000
This graph shows the change in value of a hypothetical investment of $10,000 in Class A of the Fund for the period indicated. For comparison, the same investment is shown in the indicated index.
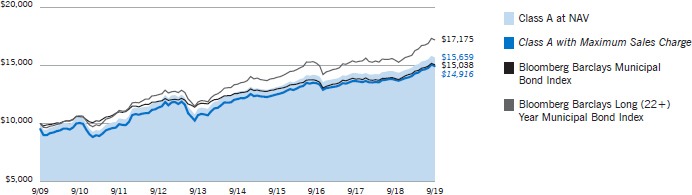
| | | | | | | | | | | | | | | | |
| Growth of Investment | | Amount Invested | | | Period Beginning | | | At NAV | | | With Maximum Sales Charge | |
Class C | | $ | 10,000 | | | | 09/30/2009 | | | $ | 14,524 | | | | N.A. | |
Class I | | $ | 250,000 | | | | 09/30/2009 | | | $ | 401,291 | | | | N.A. | |
See Endnotes and Additional Disclosures in this report.
Past performance is no guarantee of future results. Returns are historical and are calculated by determining the percentage change in net asset value (NAV) or offering price (as applicable) with all distributions reinvested. Investment return and principal value will fluctuate so that shares, when redeemed, may be worth more or less than their original cost. Performance less than or equal to one year is cumulative. Performance is for the stated time period only; due to market volatility, the Fund’s current performance may be lower or higher than quoted. Returns are before taxes unless otherwise noted. For performance as of the most recent month-end, please refer to eatonvance.com.
Eaton Vance
National Municipal Income Fund
September 30, 2019
Fund Profile
Credit Quality (% of total investments)7,8
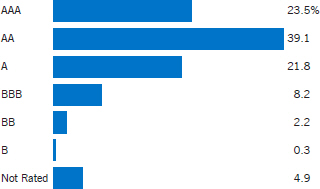
See Endnotes and Additional Disclosures in this report.
Eaton Vance
Municipal Income Funds
September 30, 2019
Endnotes and Additional Disclosures
| 1 | The views expressed in this report are those of the portfolio manager(s) and are current only through the date stated at the top of this page. These views are subject to change at any time based upon market or other conditions, and Eaton Vance and the Fund(s) disclaim any responsibility to update such views. These views may not be relied upon as investment advice and, because investment decisions are based on many factors, may not be relied upon as an indication of trading intent on behalf of any Eaton Vance fund. This commentary may contain statements that are not historical facts, referred to as “forward looking statements.” The Fund’s actual future results may differ significantly from those stated in any forward looking statement, depending on factors such as changes in securities or financial markets or general economic conditions, the volume of sales and purchases of Fund shares, the continuation of investment advisory, administrative and service contracts, and other risks discussed from time to time in the Fund’s filings with the Securities and Exchange Commission. |
| 2 | Bloomberg Barclays Municipal Bond Index is an unmanaged index of municipal bonds traded in the U.S. Bloomberg Barclays Long (22+) Year Municipal Bond Index is an unmanaged index of municipal bonds traded in the U.S. with maturities of 22 years or more. Unless otherwise stated, index returns do not reflect the effect of any applicable sales charges, commissions, expenses, taxes or leverage, as applicable. It is not possible to invest directly in an index. |
| 3 | Total Returns at NAV do not include applicable sales charges. If sales charges were deducted, the returns would be lower. Total Returns shown with maximum sales charge reflect the stated maximum sales charge. Unless otherwise stated, performance does not reflect the deduction of taxes on Fund distributions or redemptions of Fund shares. Performance since inception for an index, if presented, is the performance since the Fund’s or oldest share class’ inception, as applicable. |
| 4 | Source: Fund prospectus. The expense ratios for the current reporting period can be found in the Financial Highlights section of this report. |
| 5 | The Distribution Rate is based on the Fund’s last regular distribution per share in the period (annualized) divided by the Fund’s NAV at the end of the period. The Fund’s distributions may be comprised of amounts characterized for federal income tax purposes as tax-exempt income, qualified and non-qualified ordinary dividends, capital gains and nondividend distributions, also known as return of capital. The Fund will determine the federal income tax character of distributions paid to a shareholder after the end of the calendar year. This is reported on the IRS form 1099-DIV and provided to the shareholder shortly after each year-end. The Fund’s distributions are determined by the investment adviser based on its current assessment of the Fund’s long-term return potential. As portfolio and market conditions change, the rate of distributions paid by the Fund could change. |
| | Taxable-equivalent performance is based on the highest combined federal and state income tax rates, where applicable. Lower tax rates would result in lower tax-equivalent performance. Actual tax rates will vary depending on your income, exemptions and deductions. Rates do not include local taxes. The SEC Yield is a standardized measure based on the estimated yield to maturity of a fund’s investments over a 30-day period and is based on the maximum offer price at the date specified. The SEC Yield is not based on the distributions made by the Fund, which may differ. |
| 6 | Fund employs RIB financing. The leverage created by RIB investments provides an opportunity for increased income but, at the same time, creates special risks (including the likelihood of greater volatility of NAV). The cost of leverage rises and falls with changes in short-term interest rates. See “Floating Rate Notes Issued in Conjunction with Securities Held” in the notes to the financial statements for more information about RIB financing. RIB leverage represents the amount of Floating Rate Notes outstanding at period end as a percentage of Fund net assets plus Floating Rate Notes. |
| 7 | Ratings are based on Moody’s Investors Service, Inc. (“Moody’s”), S&P Global Ratings (“S&P”) or Fitch Ratings (“Fitch”), as applicable. If securities are rated differently by the ratings agencies, the highest rating is applied. Ratings, which are subject to change, apply to the creditworthiness of the issuers of the underlying securities and not to the Fund or its shares. Credit ratings measure the quality of a bond based on the issuer’s creditworthiness, with ratings ranging from AAA, being the highest, to D, being the lowest based on S&P’s measures. Ratings of BBB or higher by S&P or Fitch (Baa or higher by Moody’s) are considered to be investment-grade quality. Credit ratings are based largely on the ratings agency’s analysis at the time of rating. The rating assigned to any particular security is not necessarily a reflection of the issuer’s current financial condition and does not necessarily reflect its assessment of the volatility of a security’s market value or of the liquidity of an investment in the security. Holdings designated as “Not Rated” (if any) are not rated by the national ratings agencies stated above. |
| 8 | The chart includes the municipal bonds held by a trust that issues residual interest bonds, consistent with the Portfolio of Investments. |
| 9 | Yield curve is a graphical representation of the yields offered by bonds of various maturities. The yield curve flattens when long-term interest rates fall and/or short-term interest rates increase, and the yield curve steepens when long-term interest rates increase and/or short-term interest rates fall. |
| 10 | Duration is a measure of the expected change in price of a bond — in percentage terms — given a one percent change in interest rates, all else being constant. Securities with lower durations tend to be less sensitive to interest rate changes. |
| | Fund profiles subject to change due to active management. |
Eaton Vance
Municipal Income Funds
September 30, 2019
Fund Expenses
Example: As a Fund shareholder, you incur two types of costs: (1) transaction costs, including sales charges (loads) on purchases and redemption fees (if applicable); and (2) ongoing costs, including management fees; distribution and/or service fees; and other Fund expenses. This Example is intended to help you understand your ongoing costs (in dollars) of Fund investing and to compare these costs with the ongoing costs of investing in other mutual funds. The Example is based on an investment of $1,000 invested at the beginning of the period and held for the entire period (April 1, 2019 – September 30, 2019).
Actual Expenses: The first section of each table below provides information about actual account values and actual expenses. You may use the information in this section, together with the amount you invested, to estimate the expenses that you paid over the period. Simply divide your account value by $1,000 (for example, an $8,600 account value divided by $1,000 = 8.6), then multiply the result by the number in the first section under the heading entitled “Expenses Paid During Period” to estimate the expenses you paid on your account during this period.
Hypothetical Example for Comparison Purposes: The second section of each table below provides information about hypothetical account values and hypothetical expenses based on the actual Fund expense ratio and an assumed rate of return of 5% per year (before expenses), which is not the actual Fund return. The hypothetical account values and expenses may not be used to estimate the actual ending account balance or expenses you paid for the period. You may use this information to compare the ongoing costs of investing in your Fund and other funds. To do so, compare this 5% hypothetical example with the 5% hypothetical examples that appear in the shareholder reports of the other funds.
Please note that the expenses shown in each table are meant to highlight your ongoing costs only and do not reflect any transactional costs, such as sales charges (loads) or redemption fees (if applicable). Therefore, the second section of each table is useful in comparing ongoing costs only, and will not help you determine the relative total costs of owning different funds. In addition, if these transactional costs were included, your costs would be higher.
Eaton Vance AMT-Free Municipal Income Fund
| | | | | | | | | | | | | | | | |
| | | Beginning
Account Value
(4/1/19) | | | Ending
Account Value
(9/30/19) | | | Expenses Paid
During Period*
(4/1/19 – 9/30/19) | | | Annualized
Expense
Ratio | |
| | | | |
Actual | | | | | | | | | | | | | | | | |
Class A | | $ | 1,000.00 | | | $ | 1,040.80 | | | $ | 5.17 | | | | 1.01 | % |
Class C | | $ | 1,000.00 | | | $ | 1,037.00 | | | $ | 8.99 | | | | 1.76 | % |
Class I | | $ | 1,000.00 | | | $ | 1,042.10 | | | $ | 3.89 | | | | 0.76 | % |
| | | | | |
Hypothetical | | | | | | | | | | | | | | | | |
(5% return per year before expenses) | | | | | | | | | | | | | | | | |
Class A | | $ | 1,000.00 | | | $ | 1,020.00 | | | $ | 5.11 | | | | 1.01 | % |
Class C | | $ | 1,000.00 | | | $ | 1,016.20 | | | $ | 8.90 | | | | 1.76 | % |
Class I | | $ | 1,000.00 | | | $ | 1,021.30 | | | $ | 3.85 | | | | 0.76 | % |
| * | Expenses are equal to the Fund’s annualized expense ratio for the indicated Class, multiplied by the average account value over the period, multiplied by 183/365 (to reflect the one-half year period). The Example assumes that the $1,000 was invested at the net asset value per share determined at the close of business on March 31, 2019. |
Eaton Vance
Municipal Income Funds
September 30, 2019
Fund Expenses — continued
Eaton Vance National Municipal Income Fund
| | | | | | | | | | | | | | | | |
| | | Beginning
Account Value
(4/1/19) | | | Ending
Account Value
(9/30/19) | | | Expenses Paid
During Period*
(4/1/19 – 9/30/19) | | | Annualized Expense
Ratio | |
| | | | |
Actual | | | | | | | | | | | | | | | | |
Class A | | $ | 1,000.00 | | | $ | 1,043.30 | | | $ | 3.94 | | | | 0.77 | % |
Class C | | $ | 1,000.00 | | | $ | 1,039.50 | | | $ | 7.72 | | | | 1.51 | % |
Class I | | $ | 1,000.00 | | | $ | 1,044.50 | | | $ | 2.67 | | | | 0.52 | % |
| | | | | |
Hypothetical | | | | | | | | | | | | | | | | |
(5% return per year before expenses) | | | | | | | | | | | | | | | | |
Class A | | $ | 1,000.00 | | | $ | 1,021.20 | | | $ | 3.90 | | | | 0.77 | % |
Class C | | $ | 1,000.00 | | | $ | 1,017.50 | | | $ | 7.64 | | | | 1.51 | % |
Class I | | $ | 1,000.00 | | | $ | 1,022.50 | | | $ | 2.64 | | | | 0.52 | % |
| * | Expenses are equal to the Fund’s annualized expense ratio for the indicated Class, multiplied by the average account value over the period, multiplied by 183/365 (to reflect the one-half year period). The Example assumes that the $1,000 was invested at the net asset value per share determined at the close of business on March 31, 2019. |
Eaton Vance
AMT-Free Municipal Income Fund
September 30, 2019
Portfolio of Investments
| | | | | | | | |
| Tax-Exempt Municipal Securities — 108.2% | |
| Security | | Principal Amount (000’s omitted) | | | Value | |
|
| Bond Bank — 3.2% | |
| | |
New York State Environmental Facilities Corp., 5.00%, 10/15/35(1) | | $ | 9,900 | | | $ | 10,088,595 | |
| | |
| | | | | | | $ | 10,088,595 | |
|
| Education — 6.8% | |
| | |
Connecticut Health and Educational Facilities Authority, (Fairfield University), 5.00%, 7/1/46 | | $ | 5,000 | | | $ | 5,823,450 | |
| | |
Connecticut Health and Educational Facilities Authority, (Sacred Heart University),
5.00%, 7/1/42 | | | 2,125 | | | | 2,522,524 | |
| | |
North Carolina Capital Facilities Finance Agency, (Duke University), 5.00%, 10/1/41 | | | 1,480 | | | | 1,751,003 | |
| | |
Oregon Facilities Authority, (Lewis & Clark College), 5.625%, 10/1/36 | | | 1,050 | | | | 1,131,501 | |
| | |
Pennsylvania Higher Educational Facilities Authority, (Drexel University),
5.00%, 5/1/37 | | | 1,750 | | | | 2,091,757 | |
| | |
Pima County Community College District, AZ, 5.00%, 7/1/35 | | | 725 | | | | 900,762 | |
| | |
University of California, 5.25%, 5/15/35 | | | 3,555 | | | | 4,144,454 | |
| | |
West Virginia University, 5.00%, 10/1/31 | | | 3,000 | | | | 3,275,160 | |
| | |
| | | | | | | $ | 21,640,611 | |
|
| Electric Utilities — 3.8% | |
| | |
Apache County Industrial Development Authority, AZ, (Tucson Electric Power Co.),
4.50%, 3/1/30 | | $ | 1,605 | | | $ | 1,693,211 | |
| | |
Chula Vista, CA, (San Diego Gas and Electric), 5.875%, 2/15/34 | | | 3,520 | | | | 3,533,693 | |
| | |
Northern Municipal Power Agency, MN, 5.00%, 1/1/31 | | | 200 | | | | 241,754 | |
| | |
Northern Municipal Power Agency, MN, 5.00%, 1/1/35 | | | 170 | | | | 202,347 | |
| | |
Northern Municipal Power Agency, MN, 5.00%, 1/1/36 | | | 160 | | | | 190,006 | |
| | |
Pima County Industrial Development Authority, AZ, (Tucson Electric Power Co.),
5.25%, 10/1/40 | | | 1,410 | | | | 1,457,616 | |
| | |
Utility Debt Securitization Authority, NY, 5.00%, 12/15/33 | | | 2,895 | | | | 3,315,441 | |
| | |
Vernon, CA, Electric System Revenue, 5.125%, 8/1/21 | | | 1,345 | | | | 1,349,936 | |
| | |
| | | | | | | $ | 11,984,004 | |
|
| Escrowed / Prerefunded — 6.7% | |
| | |
Brooklyn Arena Local Development Corp., NY, (Barclays Center), Prerefunded to 1/15/20, 6.25%, 7/15/40 | | $ | 1,320 | | | $ | 1,338,757 | |
| | |
Henrico County Economic Development Authority, VA, (Bon Secours Health System, Inc.), Prerefunded to 11/1/22,
5.00%, 11/1/30 | | | 1,185 | | | | 1,315,824 | |
| | |
Massachusetts Development Finance Agency, (Tufts Medical Center), Prerefunded to 1/1/21, 6.75%, 1/1/36 | | | 315 | | | | 335,998 | |
| | |
Massachusetts Development Finance Agency, (Tufts Medical Center), Prerefunded to 1/1/21, 6.75%, 1/1/36 | | | 470 | | | | 501,636 | |
| | | | | | | | |
| Security | | Principal Amount (000’s omitted) | | | Value | |
|
| Escrowed / Prerefunded (continued) | |
| | |
New Jersey Turnpike Authority, Prerefunded to 7/1/22, 5.00%, 1/1/30 | | $ | 3,060 | | | $ | 3,371,508 | |
| | |
Oklahoma Development Finance Authority, (St. John Health System), Prerefunded to 2/15/22, 5.00%, 2/15/34 | | | 2,035 | | | | 2,209,094 | |
| | |
Savannah Economic Development Authority, GA, Escrowed to Maturity, 0.00%, 12/1/21 | | | 6,000 | | | | 5,812,800 | |
| | |
Washington, Prerefunded to 2/1/21, 5.25%, 2/1/36(1) | | | 6,000 | | | | 6,313,980 | |
| |
| | | | $ | 21,199,597 | |
| | |
| General Obligations — 18.5% | | | | | | |
| | |
California, 5.00%, 4/1/35 | | $ | 2,125 | | | $ | 2,448,489 | |
| | |
California, 5.25%, 10/1/29 | | | 560 | | | | 603,960 | |
| | |
California, 5.25%, 10/1/32 | | | 3,480 | | | | 3,748,169 | |
| | |
Chicago, IL, 5.00%, 1/1/39 | | | 1,400 | | | | 1,598,366 | |
| | |
Chicago, IL, 5.00%, 1/1/44 | | | 1,490 | | | | 1,684,400 | |
| | |
Chicago Board of Education, IL, 5.00%, 12/1/21 | | | 230 | | | | 243,899 | |
| | |
Chicago Board of Education, IL, 5.00%, 12/1/46 | | | 270 | | | | 288,914 | |
| | |
Chicago Board of Education, IL, 5.00%, 12/1/46 | | | 1,405 | | | | 1,590,952 | |
| | |
District of Columbia, 5.00%, 6/1/37(1) | | | 7,000 | | | | 8,552,880 | |
| | |
Fennville Public Schools, MI, 4.00%, 5/1/34 | | | 1,000 | | | | 1,160,390 | |
| | |
Foothill-De Anza Community College District, CA, 5.00%, 8/1/34 | | | 1,150 | | | | 1,343,671 | |
| | |
Foothill-De Anza Community College District, CA, 5.00%, 8/1/36 | | | 1,150 | | | | 1,339,347 | |
| | |
Gallatin County School District No. 44, MT, 4.00%, 6/1/35 | | | 520 | | | | 602,753 | |
| | |
Illinois, 4.00%, 6/1/33 | | | 2,000 | | | | 2,075,940 | |
| | |
Illinois, 5.00%, 1/1/26 | | | 5,000 | | | | 5,669,200 | |
| | |
Illinois, 5.00%, 5/1/35 | | | 2,000 | | | | 2,170,600 | |
| | |
Kane, Cook and DuPage Counties School District No. 46, IL, 5.00%, 1/1/31 | | | 4,470 | | | | 5,032,281 | |
| | |
New York, NY, 4.00%, 8/1/42(1) | | | 7,000 | | | | 7,984,270 | |
| | |
New York, NY, 5.00%, 4/1/30 | | | 2,500 | | | | 3,244,625 | |
| | |
Salem-Keizer School District No. 24J, OR, 0.00%, 6/15/24 | | | 1,220 | | | | 1,135,613 | |
| | |
San Francisco Bay Area Rapid Transit District, CA, (Election of 2016), Green Bonds,
5.00%, 8/1/31 | | | 1,230 | | | | 1,639,861 | |
| | |
Springfield School District No. 19, OR,
5.00%, 6/15/30 | | | 1,085 | | | | 1,291,193 | |
| | |
Stamford, CT, 4.00%, 6/1/33 | | | 2,025 | | | | 2,356,938 | |
| | |
University of Connecticut, 5.00%, 2/15/32 | | | 650 | | | | 734,025 | |
| |
| | | | $ | 58,540,736 | |
| | |
| Hospital — 15.0% | | | | | | |
| | |
California Health Facilities Financing Authority, (Catholic Healthcare West),
5.25%, 3/1/28 | | $ | 535 | | | $ | 563,494 | |
| | |
California Health Facilities Financing Authority, (Providence Health System),
5.50%, 10/1/39 | | | 5,175 | | | | 5,175,000 | |
| | | | |
| | 10 | | See Notes to Financial Statements. |
Eaton Vance
AMT-Free Municipal Income Fund
September 30, 2019
Portfolio of Investments — continued
| | | | | | | | |
| Security | | Principal Amount (000’s omitted) | | | Value | |
| | |
| Hospital (continued) | | | | | | |
| | |
California Health Facilities Financing Authority, (St. Joseph Health System), 5.00%, 7/1/33 | | $ | 1,720 | | | $ | 1,937,872 | |
| | |
California Health Facilities Financing Authority, (St. Joseph Health System), 5.00%, 7/1/37 | | | 2,300 | | | | 2,580,600 | |
| | |
California Health Facilities Financing Authority, (Sutter Health), 5.25%, 8/15/31 | | | 1,325 | | | | 1,420,559 | |
| | |
California Statewide Communities Development Authority, (Loma Linda University Medical Center), 5.25%, 12/1/34 | | | 3,000 | | | | 3,391,530 | |
| | |
Colorado Health Facilities Authority, (CommonSpirit Health), 4.00%, 8/1/39 | | | 1,250 | | | | 1,367,713 | |
| | |
Colorado Health Facilities Authority, (Vail Valley Medical Center), 4.00%, 1/15/45 | | | 2,155 | | | | 2,297,747 | |
| | |
Colorado Health Facilities Authority, (Vail Valley Medical Center), 5.00%, 1/15/35 | | | 2,000 | | | | 2,343,480 | |
| | |
Delaware Health Facilities Authority, (Beebe Medical Center), 5.00%, 6/1/36 | | | 3,730 | | | | 4,458,469 | |
| | |
Delaware Health Facilities Authority, (Beebe Medical Center), 5.00%, 6/1/37 | | | 1,000 | | | | 1,191,110 | |
| | |
Illinois Finance Authority, (Presence Health Network), 4.00%, 2/15/36 | | | 5,345 | | | | 5,957,003 | |
| | |
Massachusetts Development Finance Agency, (Children’s Hospital), 5.00%, 10/1/31 | | | 2,110 | | | | 2,464,775 | |
| | |
Missouri Health and Educational Facilities Authority, (Mercy Health), 5.00%, 11/15/47 | | | 3,000 | | | | 3,558,300 | |
| | |
Ohio, (University Hospitals Health Systems, Inc.), 5.00%, 1/15/36 | | | 2,500 | | | | 2,918,600 | |
| | |
Tarrant County Cultural Education Facilities Finance Corp., TX, (Cook Children’s Medical Center), 5.25%, 12/1/39(1) | | | 5,000 | | | | 5,666,400 | |
| |
| | | | $ | 47,292,652 | |
| | |
| Housing — 0.7% | | | | | | |
| | |
Phoenix Industrial Development Authority, AZ, (Downtown Phoenix Student Housing, LLC - Arizona State University), 5.00%, 7/1/37 | | $ | 500 | | | $ | 591,930 | |
| | |
Phoenix Industrial Development Authority, AZ, (Downtown Phoenix Student Housing, LLC - Arizona State University), 5.00%, 7/1/42 | | | 1,250 | | | | 1,461,500 | |
| | |
Texas Student Housing Corp., (University of North Texas), 9.375%, 7/1/06(2) | | | 285 | | | | 285,000 | |
| |
| | | | $ | 2,338,430 | |
| | |
| Industrial Development Revenue — 1.5% | | | | | | |
| | |
New York Liberty Development Corp., (Bank of America Tower at One Bryant Park), 2.45%, 9/15/69(3) | | $ | 1,960 | | | $ | 2,000,435 | |
| | |
Selma Industrial Development Board, AL, (International Paper Co.),
5.80%, 5/1/34 | | | 2,670 | | | | 2,735,415 | |
| |
| | | | $ | 4,735,850 | |
| | | | | | | | |
| Security | | Principal Amount (000’s omitted) | | | Value | |
| | |
| Insured – Education — 0.7% | | | | | | |
| | |
Virginia College Building Authority, (Washington and Lee University), (NPFG), 5.25%, 1/1/31 | | $ | 1,750 | | | $ | 2,289,823 | |
| |
| | | | $ | 2,289,823 | |
| | |
| Insured – Electric Utilities — 0.7% | | | | | | |
| | |
Ohio Municipal Electric Generation Agency, (NPFG), 0.00%, 2/15/29 | | $ | 2,865 | | | $ | 2,327,039 | |
| |
| | | | $ | 2,327,039 | |
| | |
| Insured – Escrowed / Prerefunded — 0.5% | | | | | | |
| | |
Texas Transportation Commission, (Central Texas Turnpike System), (AMBAC), Escrowed to Maturity, 0.00%, 8/15/21 | | $ | 1,560 | | | $ | 1,517,303 | |
| |
| | | | $ | 1,517,303 | |
| | |
| Insured – General Obligations — 1.2% | | | | | | |
| | |
Atlantic City, NJ, (AGM), 4.00%, 3/1/42 | | $ | 145 | | | $ | 159,248 | |
| | |
Chicago Board of Education, IL, (AGM),
5.00%, 12/1/24 | | | 505 | | | | 574,316 | |
| | |
McCook, IL, (AGM), 4.00%, 12/1/29 | | | 240 | | | | 275,352 | |
| | |
McCook, IL, (AGM), 4.00%, 12/1/30 | | | 200 | | | | 228,168 | |
| | |
McCook, IL, (AGM), 4.00%, 12/1/33 | | | 500 | | | | 555,650 | |
| | |
McCook, IL, (AGM), 4.00%, 12/1/34 | | | 440 | | | | 483,639 | |
| | |
Proviso Township High School District No. 209, IL, (AGM), 4.00%, 12/1/38 | | | 1,500 | | | | 1,637,985 | |
| |
| | | | $ | 3,914,358 | |
| |
| Insured – Lease Revenue / Certificates of Participation — 2.1% | | | | |
| | |
Anaheim Public Financing Authority, CA, (Anaheim Public Improvements), (AGM), 0.00%, 9/1/31 | | $ | 8,680 | | | $ | 6,547,324 | |
| |
| | | | $ | 6,547,324 | |
| | |
| Insured – Other Revenue — 2.1% | | | | | | |
| | |
Harris County-Houston Sports Authority, TX, (AGM), (NPFG), 0.00%, 11/15/34 | | $ | 10,600 | | | $ | 6,508,294 | |
| |
| | | | $ | 6,508,294 | |
| | |
| Insured – Special Tax Revenue — 5.6% | | | | | | |
| | |
Alabama Public School and College Authority, (AGM), 2.50%, 12/1/27 | | $ | 5,265 | | | $ | 5,268,264 | |
| | |
Massachusetts, Dedicated Tax Revenue, (NPFG), 5.50%, 1/1/27 | | | 6,000 | | | | 7,629,240 | |
| | |
Massachusetts, Dedicated Tax Revenue, (NPFG), 5.50%, 1/1/30 | | | 2,565 | | | | 3,460,775 | |
| | | | |
| | 11 | | See Notes to Financial Statements. |
Eaton Vance
AMT-Free Municipal Income Fund
September 30, 2019
Portfolio of Investments — continued
| | | | | | | | |
| Security | | Principal Amount (000’s omitted) | | | Value | |
| | |
| Insured – Special Tax Revenue (continued) | | | | | | |
| | |
Successor Agency to San Francisco City and County Redevelopment Agency, CA, (NPFG), 5.00%, 8/1/43 | | $ | 1,100 | | | $ | 1,288,298 | |
| |
| | | | $ | 17,646,577 | |
| | |
| Insured – Transportation — 9.6% | | | | | | |
| | |
Chicago, IL, (O’Hare International Airport), (AGM), 5.00%, 1/1/28 | | $ | 1,000 | | | $ | 1,112,060 | |
| | |
Chicago, IL, (O’Hare International Airport), (AGM), 5.125%, 1/1/31 | | | 1,000 | | | | 1,110,960 | |
| | |
Chicago, IL, (O’Hare International Airport), (AGM), 5.25%, 1/1/32 | | | 785 | | | | 873,611 | |
| | |
E-470 Public Highway Authority, CO, (NPFG), 0.00%, 9/1/39 | | | 7,120 | | | | 3,133,227 | |
| | |
Metropolitan Transportation Authority, NY, Green Bonds, (AGM), 4.00%, 11/15/46 | | | 1,275 | | | | 1,420,987 | |
| | |
Metropolitan Transportation Authority, NY, Green Bonds, (AGM), 5.00%, 11/15/44 | | | 2,470 | | | | 3,009,226 | |
| | |
Pennsylvania Turnpike Commission, (AGM), 6.375%, 12/1/38 | | | 11,000 | | | | 14,470,280 | |
| | |
Texas Transportation Commission, (Central Texas Turnpike System), (AMBAC),
0.00%, 8/15/21 | | | 5,285 | | | | 5,131,735 | |
| |
| | | | $ | 30,262,086 | |
| | |
| Insured – Water and Sewer — 2.4% | | | | | | |
| | |
Detroit, MI, Sewage Disposal System, (AGM), 5.00%, 7/1/39 | | $ | 4,825 | | | $ | 5,235,607 | |
| | |
Michigan Finance Authority, (Detroit Water and Sewerage Department), (AGM),
5.00%, 7/1/32 | | | 655 | | | | 753,525 | |
| | |
Michigan Finance Authority, (Detroit Water and Sewerage Department), (AGM),
5.00%, 7/1/33 | | | 565 | | | | 647,699 | |
| | |
Michigan Finance Authority, (Detroit Water and Sewerage Department), (AGM),
5.00%, 7/1/35 | | | 280 | | | | 319,231 | |
| | |
Michigan Finance Authority, (Detroit Water and Sewerage Department), (AGM),
5.00%, 7/1/37 | | | 565 | | | | 641,315 | |
| |
| | | | $ | 7,597,377 | |
| |
| Lease Revenue / Certificates of Participation — 3.2% | | | | |
| | |
Hudson Yards Infrastructure Corp., NY,
4.00%, 2/15/44 | | $ | 6,020 | | | $ | 6,706,521 | |
| | |
New Jersey Economic Development Authority, (School Facilities Construction),
5.00%, 6/15/37 | | | 3,000 | | | | 3,494,910 | |
| |
| | | | $ | 10,201,431 | |
| | |
| Other Revenue — 1.5% | | | | | | |
| | |
Austin Convention Enterprises, Inc., TX, (Convention Center Hotel), 5.00%, 1/1/22 | | $ | 400 | | | $ | 430,000 | |
| | |
Central Falls Detention Facility Corp., RI, 7.25%, 7/15/35(4) | | | 1,200 | | | | 216,000 | |
| | |
Cleveland-Cuyahoga County Port Authority, OH, (Playhouse Square Foundation), 5.25%, 12/1/38 | | | 970 | | | | 1,127,654 | |
| | | | | | | | |
| Security | | Principal Amount (000’s omitted) | | | Value | |
| | |
| Other Revenue (continued) | | | | | | |
| | |
Cleveland-Cuyahoga County Port Authority, OH, (Playhouse Square Foundation),
5.50%, 12/1/43 | | $ | 355 | | | $ | 415,393 | |
| | |
Mercer County Improvement Authority, NJ, 4.00%, 3/15/40 | | | 935 | | | | 1,081,271 | |
| | |
White Earth Band of Chippewa Indians, MN, 6.375%, 12/1/26(5) | | | 1,540 | | | | 1,541,047 | |
| |
| | | | $ | 4,811,365 | |
| | |
| Senior Living / Life Care — 3.9% | | | | | | |
| | |
National Finance Authority, NH, (The Vista), 5.25%, 7/1/39(5) | | $ | 265 | | | $ | 288,172 | |
| | |
National Finance Authority, NH, (The Vista), 5.625%, 7/1/46(5) | | | 360 | | | | 395,212 | |
| | |
National Finance Authority, NH, (The Vista), 5.75%, 7/1/54(5) | | | 595 | | | | 652,774 | |
| | |
Palm Beach County Health Facilities Authority, FL, (Sinai Residences of Boca Raton),
7.25%, 6/1/39 | | | 570 | | | | 639,255 | |
| | |
Palm Beach County Health Facilities Authority, FL, (Sinai Residences of Boca Raton),
7.50%, 6/1/49 | | | 2,690 | | | | 3,030,904 | |
| | |
Saint Louis County Industrial Development Authority, MO, (St. Andrew’s Resources for Seniors Obligated Group),
5.00%, 12/1/35 | | | 1,700 | | | | 1,875,882 | |
| | |
Tempe Industrial Development Authority, AZ, (Friendship Village of Tempe),
6.00%, 12/1/32 | | | 160 | | | | 169,182 | |
| | |
Tempe Industrial Development Authority, AZ, (Friendship Village of Tempe),
6.25%, 12/1/42 | | | 660 | | | | 698,742 | |
| | |
Washington Housing Finance Commission, (Horizon House), 5.00%, 1/1/32(5) | | | 1,575 | | | | 1,813,801 | |
| | |
Washington Housing Finance Commission, (Horizon House), 5.00%, 1/1/38(5) | | | 2,325 | | | | 2,641,851 | |
| | |
Washington Housing Finance Commission, (Transforming Age),
5.00%, 1/1/34(3)(5) | | | 245 | | | | 274,300 | |
| |
| | | | $ | 12,480,075 | |
| | |
| Special Tax Revenue — 4.2% | | | | | | |
| | |
Bridgeville, DE, (Heritage Shores Special Development District), 5.45%, 7/1/35 | | $ | 914 | | | $ | 914,366 | |
| | |
Jurupa Public Financing Authority, CA,
5.00%, 9/1/31 | | | 1,200 | | | | 1,393,152 | |
| | |
New York City Transitional Finance Authority, NY, Future Tax Revenue, 4.00%, 11/1/38 | | | 5,820 | | | | 6,704,523 | |
| | |
New York City Transitional Finance Authority, NY, Future Tax Revenue, 5.00%, 11/1/37 | | | 1,000 | | | | 1,184,260 | |
| | |
New York City Transitional Finance Authority, NY, Future Tax Revenue, (SPA: JPMorgan Chase Bank, N.A.), 1.75%, 2/1/45(6) | | | 2,000 | | | | 2,000,000 | |
| | |
New York Convention Center Development Corp., Hotel Unit Fee, 0.00%, 11/15/27 | | | 135 | | | | 114,615 | |
| | |
River Hall Community Development District, FL, (Capital Improvements),
5.45%, 5/1/36 | | | 965 | | | | 970,578 | |
| |
| | | | $ | 13,281,494 | |
| | | | |
| | 12 | | See Notes to Financial Statements. |
Eaton Vance
AMT-Free Municipal Income Fund
September 30, 2019
Portfolio of Investments — continued
| | | | | | | | |
| Security | | Principal Amount (000’s omitted) | | | Value | |
| | |
| Transportation — 10.1% | | | | | | |
| | |
Central Texas Regional Mobility Authority, Prerefunded to 1/1/21, 5.75%, 1/1/31 | | $ | 415 | | | $ | 437,393 | |
| | |
Dallas and Fort Worth, TX, (Dallas/Fort Worth International Airport),
5.25%, 11/1/30 | | | 1,100 | | | | 1,261,557 | |
| | |
Dallas and Fort Worth, TX, (Dallas/Fort Worth International Airport), 5.25%, 11/1/31 | | | 1,455 | | | | 1,664,971 | |
| | |
Delaware River Port Authority of Pennsylvania and New Jersey,
5.00%, 1/1/31 | | | 480 | | | | 550,954 | |
| | |
Denver City and County, CO, Airport System Revenue, 2.322%, (70% of 1 mo. USD LIBOR + 0.86%), 11/15/19 (Put Date), 11/15/31(7) | | | 880 | | | | 880,431 | |
| | |
Grand Parkway Transportation Corp., TX, 5.125%, 10/1/43 | | | 1,100 | | | | 1,219,240 | |
| | |
Metropolitan Transportation Authority, NY, 5.00%, 11/15/35 | | | 325 | | | | 390,280 | |
| | |
Metropolitan Transportation Authority, NY, Green Bonds, 5.00%, 11/15/39 | | | 1,970 | | | | 2,451,527 | |
| | |
Miami-Dade County, FL, Aviation Revenue, 5.00%, 10/1/33 | | | 6,150 | | | | 7,091,934 | |
| | |
New Jersey Turnpike Authority, 4.00%, 1/1/48 | | | 1,045 | | | | 1,169,157 | |
| | |
New Orleans Aviation Board, LA,
5.00%, 1/1/43 | | | 1,555 | | | | 1,828,540 | |
| | |
San Joaquin Hills Transportation Corridor Agency, CA, 5.00%, 1/15/34 | | | 5,235 | | | | 6,024,490 | |
| | |
Texas Private Activity Bond Surface Transportation Corp., (LBJ Express Managed Lanes Project), 7.00%, 6/30/34 | | | 3,500 | | | | 3,656,380 | |
| | |
Texas Private Activity Bond Surface Transportation Corp., (North Tarrant Express Managed Lanes Project), 6.875%, 12/31/39 | | | 2,980 | | | | 3,022,286 | |
| | |
Texas Transportation Commission,
0.00%, 8/1/40 | | | 1,000 | | | | 429,000 | |
| |
| | | | $ | 32,078,140 | |
| | |
| Water and Sewer — 4.2% | | | | | | |
| | |
Atlanta, GA, Water and Wastewater Revenue, 5.00%, 11/1/35(1) | | $ | 6,990 | | | $ | 8,652,432 | |
| | |
New York City Municipal Water Finance Authority, NY, (Water and Sewer System), 4.00%, 6/15/41 | | | 4,000 | | | | 4,565,960 | |
| |
| | | | $ | 13,218,392 | |
| |
Total Tax-Exempt Municipal Securities — 108.2%
(identified cost $312,945,992) | | | $ | 342,501,553 | |
| | |
| Trust Units — 0.1% | | | | | | | | |
| Security | | Notional
Amount
(000’s omitted) | | | Value | |
| | |
| Insured – Special Tax Revenue — 0.1% | | | | | | |
| | |
COFINA Series 2007A Senior Bonds Due 2046 National Custodial Trust (taxable), 8/1/46(8) | | $ | 774 | | | $ | 106,420 | |
| | | | | | | | |
| Security | | Notional
Amount
(000’s omitted) | | | Value | |
| | |
| Insured – Special Tax Revenue (continued) | | | | | | |
| | |
COFINA Series 2007A Senior Bonds Due 2046 National Custodial Trust (non-taxable), 8/1/46(8) | | $ | 2,350 | | | $ | 117,517 | |
| | |
Total Trust Units — 0.1%
(identified cost $197,046) | | | | | | $ | 223,937 | |
| | |
Total Investments — 108.3%
(identified cost $313,143,038) | | | | | | $ | 342,725,490 | |
| |
Other Assets, Less Liabilities — (8.3)% | | | $ | (26,369,876 | ) |
| |
Net Assets — 100.0% | | | $ | 316,355,614 | |
The percentage shown for each investment category in the Portfolio of Investments is based on net assets.
At September 30, 2019, the concentration of the Fund’s investments in the various states and territories, determined as a percentage of net assets, is as follows:
| | | | |
| |
| New York | | | 17.9% | |
| |
| California | | | 16.0% | |
| |
| Illinois | | | 10.5% | |
| |
| Others, representing less than 10% individually | | | 63.9% | |
The Fund invests primarily in debt securities issued by municipalities. The ability of the issuers of the debt securities to meet their obligations may be affected by economic developments in a specific industry or municipality. At September 30, 2019, 23.0% of total investments are backed by bond insurance of various financial institutions and financial guaranty assurance agencies. The aggregate percentage insured by an individual financial institution or financial guaranty assurance agency ranged from 1.9% to 15.1% of total investments.
| (1) | Security represents the municipal bond held by a trust that issues residual interest bonds (see Note 1H). |
| (2) | The issuer is in default on the payment of principal but continues to pay interest. |
| (3) | When-issued security. |
| (4) | Defaulted security. Issuer has defaulted on the payment of interest and/or principal or has filed for bankruptcy. |
| (5) | Security exempt from registration pursuant to Rule 144A under the Securities Act of 1933, as amended. These securities may be sold in certain transactions in reliance on an exemption from registration (normally to qualified institutional buyers). At September 30, 2019, the aggregate value of these securities is $7,607,157 or 2.4% of the Fund’s net assets. |
| (6) | Variable rate demand obligation that may be tendered at par on any day for payment the same or next business day. The stated interest rate, which generally resets daily, is determined by the remarketing agent and represents the rate in effect at September 30, 2019. |
| (7) | Floating rate security. The stated interest rate represents the rate in effect at September 30, 2019. |
| | | | |
| | 13 | | See Notes to Financial Statements. |
Eaton Vance
AMT-Free Municipal Income Fund
September 30, 2019
Portfolio of Investments — continued
| (8) | Security was received in connection with the restructuring of an insured zero-coupon bond issued by the Puerto Rico Sales Tax Financing Corporation (“COFINA”) (the “Original Bond”). The notional amount of the combined taxable and tax-exempt trust units reflects the accreted amount of the Original Bond from original issuance through the restructuring date. Each trust certificate represents an ownership interest in various coupon paying and zero-coupon COFINA bonds and potential insurance payments pursuant to an insurance policy with National Public Finance Guarantee Corporation. The trust units have no stated coupon interest rate but accrete income to maturity at the annual rate of approximately 5.04%, the same rate as the Original Bond. |
Abbreviations:
| | | | |
| | |
| AGM | | – | | Assured Guaranty Municipal Corp. |
| | |
| AMBAC | | – | | AMBAC Financial Group, Inc. |
| | |
| LIBOR | | – | | London Interbank Offered Rate |
| | |
| NPFG | | – | | National Public Finance Guarantee Corp. |
| | |
| SPA | | – | | Standby Bond Purchase Agreement |
Currency Abbreviations:
| | | | |
| USD | | – | | United States Dollar |
| | | | |
| | 14 | | See Notes to Financial Statements. |
Eaton Vance
National Municipal Income Fund
September 30, 2019
Portfolio of Investments
| | | | | | | | |
| Tax-Exempt Municipal Securities — 100.7% | |
| Security | | Principal Amount (000’s omitted) | | | Value | |
| | |
| Bond Bank — 1.5% | | | | | | |
| | |
Connecticut, (State Revolving Fund), Green Bonds, 5.00%, 3/1/28 | | $ | 10,000 | | | $ | 11,860,300 | |
| | |
Ohio Water Development Authority, Water Pollution Control Loan Fund, 5.00%, 6/1/29 | | | 10,000 | | | | 13,065,000 | |
| | |
Rickenbacker Port Authority, OH, (OASBO Expanded Asset Pooled Financing Program), 5.375%, 1/1/32 | | | 16,255 | | | | 20,536,730 | |
| |
| | | | $ | 45,462,030 | |
| | |
| Cogeneration — 0.1% | | | | | | |
| | |
Northampton County Industrial Development Authority, PA, (Northampton Generating), (AMT), 5.00%, 12/31/23(1) | | $ | 14,652 | | | $ | 3,663,079 | |
| |
| | | | $ | 3,663,079 | |
| | |
| Education — 7.8% | | | | | | |
| | |
Allegheny County Higher Education Building Authority, PA, (Carnegie Mellon University), 5.00%, 8/1/27 | | $ | 3,335 | | | $ | 4,243,787 | |
| | |
Connecticut Health and Educational Facilities Authority, (Yale University), 5.00%, 7/1/27 | | | 5,000 | | | | 6,358,800 | |
| | |
District of Columbia, (District of Columbia International School), 5.00%, 7/1/54 | | | 2,290 | | | | 2,703,368 | |
| | |
Florida Higher Educational Facilities Financing Authority, (Jacksonville University),
4.75%, 6/1/38(2) | | | 2,245 | | | | 2,458,342 | |
| | |
Massachusetts Development Finance Agency, (Harvard University),
5.00%, 7/15/34 | | | 18,855 | | | | 23,122,452 | |
| | |
Michigan State University, 5.00%, 2/15/31 | | | 1,200 | | | | 1,536,888 | |
| | |
Missouri Health and Educational Facilities Authority, (Washington University), (SPA: JPMorgan Chase Bank, N.A.),
1.75%, 9/1/30(3) | | | 9,000 | | | | 9,000,000 | |
| | |
New Hampshire Health and Education Facilities Authority, (University System of New Hampshire), (SPA: State Street Bank and Trust Company), 1.77%, 7/1/33(3) | | | 1,000 | | | | 1,000,000 | |
| | |
New Jersey Educational Facilities Authority, (Princeton University),
4.00%, 7/1/38 | | | 1,475 | | | | 1,718,036 | |
| | |
New Jersey Educational Facilities Authority, (Princeton University),
5.00%, 7/1/33 | | | 4,370 | | | | 5,495,188 | |
| | |
New York Dormitory Authority, (Columbia University), 5.00%, 10/1/38 | | | 19,340 | | | | 24,445,180 | |
| | |
New York Dormitory Authority, (Cornell University), Green Bonds,
5.00%, 7/1/22 | | | 1,305 | | | | 1,443,461 | |
| | |
New York Dormitory Authority, (Cornell University), Green Bonds,
5.00%, 7/1/23 | | | 2,955 | | | | 3,379,249 | |
| | |
New York Dormitory Authority, (Cornell University), Green Bonds, 5.00%,
7/1/24 | | | 2,350 | | | | 2,775,091 | |
| | |
Oregon Facilities Authority, (Lewis & Clark College), 5.625%, 10/1/36 | | | 9,930 | | | | 10,700,767 | |
| | | | | | | | |
| Security | | Principal Amount (000’s omitted) | | | Value | |
| | |
| Education (continued) | | | | | | |
| | |
Rutgers State University, NJ, 5.00%, 5/1/43(4) | | $ | 37,000 | | | $ | 41,035,960 | |
| | |
University of California, 5.25%, 5/15/36 | | | 7,080 | | | | 8,247,067 | |
| | |
University of California, 5.25%, 5/15/37 | | | 13,000 | | | | 15,130,310 | |
| | |
University of California, 5.25%, 5/15/38 | | | 7,700 | | | | 8,946,861 | |
| | |
University of Minnesota, 4.00%, 1/1/30 | | | 3,000 | | | | 3,303,510 | |
| | |
University of Minnesota, 4.00%, 2/1/30 | | | 1,815 | | | | 1,960,273 | |
| | |
University of Virginia, 5.00%, 4/1/38 | | | 13,205 | | | | 16,206,893 | |
| | |
University of Virginia, 5.00%, 4/1/39 | | | 40,970 | | | | 50,184,153 | |
| |
| | | | $ | 245,395,636 | |
| | |
| Electric Utilities — 3.9% | | | | | | |
| | |
Mesa, AZ, Utility Systems Revenue,
5.00%, 7/1/33 | | $ | 1,180 | | | $ | 1,525,811 | |
| | |
Omaha Public Power District, NE,
5.00%, 2/1/39 | | | 10,805 | | | | 12,562,433 | |
| | |
Public Power Generation Agency, NE, (Whelan Energy Center Unit 2), 5.00%, 1/1/28 | | | 6,025 | | | | 7,018,884 | |
| | |
San Antonio, TX, Electric and Gas Systems Revenue, 4.00%, 2/1/30 | | | 2,000 | | | | 2,439,300 | |
| | |
Unified Government of Wyandotte County/Kansas City, KS, Utility System Revenue, 5.00%, 9/1/32 | | | 10,000 | | | | 10,950,200 | |
| | |
Utility Debt Securitization Authority, NY,
5.00%, 12/15/30(4) | | | 22,500 | | | | 25,839,000 | |
| | |
Utility Debt Securitization Authority, NY,
5.00%, 12/15/31(4) | | | 27,500 | | | | 31,556,800 | |
| | |
Utility Debt Securitization Authority, NY,
5.00%, 12/15/40 | | | 13,260 | | | | 16,397,581 | |
| | |
Vernon, CA, Electric System Revenue,
5.125%, 8/1/21 | | | 12,530 | | | | 12,575,985 | |
| |
| | | | $ | 120,865,994 | |
| | |
| Escrowed / Prerefunded — 4.3% | | | | | | |
| | |
Bexar County Health Facilities Development Corp., TX, (St. Luke’s Lutheran Hospital), Escrowed to Maturity, 7.00%, 5/1/21 | | $ | 1,655 | | | $ | 1,756,352 | |
| | |
Brooklyn Arena Local Development Corp., NY, (Barclays Center), Prerefunded to 1/15/20, 6.00%, 7/15/30 | | | 9,530 | | | | 9,658,655 | |
| | |
Brooklyn Arena Local Development Corp., NY, (Barclays Center), Prerefunded to 1/15/20, 6.25%, 7/15/40 | | | 14,295 | | | | 14,498,132 | |
| | |
Massachusetts Development Finance Agency, (Tufts Medical Center), Prerefunded to 1/1/21, 6.75%, 1/1/36 | | | 4,505 | | | | 4,808,232 | |
| | |
Massachusetts Development Finance Agency, (Tufts Medical Center), Prerefunded to 1/1/21, 6.75%, 1/1/36 | | | 3,005 | | | | 3,205,313 | |
| | |
North Carolina, Capital Improvement Limited Obligation Bonds, Prerefunded to 5/1/20, 5.25%, 5/1/31 | | | 16,475 | | | | 16,857,714 | |
| | |
Pennsylvania Turnpike Commission, Prerefunded to 12/1/20, 5.35%, 12/1/30 | | | 4,515 | | | | 4,727,070 | |
| | |
Pennsylvania Turnpike Commission, Prerefunded to 12/1/20, 5.35%, 12/1/30 | | | 3,490 | | | | 3,653,925 | |
| | |
Pennsylvania Turnpike Commission, Prerefunded to 12/1/20, 5.45%, 12/1/35 | | | 12,125 | | | | 12,708,455 | |
| | |
Pennsylvania Turnpike Commission, Prerefunded to 12/1/20, 6.00%, 12/1/34 | | | 3,585 | | | | 3,779,773 | |
| | | | |
| | 15 | | See Notes to Financial Statements. |
Eaton Vance
National Municipal Income Fund
September 30, 2019
Portfolio of Investments — continued
| | | | | | | | |
| Security | | Principal Amount (000’s omitted) | | | Value | |
| | |
| Escrowed / Prerefunded (continued) | | | | | | |
| | |
Pennsylvania Turnpike Commission, Prerefunded to 12/1/20, 6.00%, 12/1/34 | | $ | 3,795 | | | $ | 4,001,182 | |
| | |
Pennsylvania Turnpike Commission, Prerefunded to 12/1/20, 6.00%, 12/1/34 | | | 17,620 | | | | 18,577,295 | |
| | |
Pennsylvania Turnpike Commission, Prerefunded to 12/1/20, 6.50%, 12/1/36 | | | 10,000 | | | | 10,599,700 | |
| | |
Southwestern Illinois Development Authority, (Memorial Group, Inc.), Prerefunded to 11/1/23, 7.25%, 11/1/33 | | | 9,170 | | | | 11,290,288 | |
| | |
Tarrant County Cultural Education Facilities Finance Corp., TX, (Scott & White Healthcare), Prerefunded to 8/15/20, 5.25%, 8/15/40 | | | 1,000 | | | | 1,033,850 | |
| | |
Tarrant County Cultural Education Facilities Finance Corp., TX, (Scott & White Healthcare), Prerefunded to 8/15/20, 5.25%, 8/15/40 | | | 12,500 | | | | 12,923,125 | |
| |
| | | | $ | 134,079,061 | |
| | |
| General Obligations — 21.2% | | | | | | |
| | |
Aiken County Consolidated School District, SC, 4.00%, 4/1/37 | | $ | 7,870 | | | $ | 9,129,751 | |
| | |
Belmont, MA, 4.00%, 3/15/30 | | | 2,800 | | | | 3,372,656 | |
| | |
Belmont, MA, 4.00%, 3/15/32 | | | 3,030 | | | | 3,596,004 | |
| | |
Boston, MA, 5.00%, 3/1/30 | | | 2,970 | | | | 3,906,619 | |
| | |
Boston, MA, 5.00%, 3/1/31 | | | 3,740 | | | | 4,895,997 | |
| | |
California, 2.01%, (SIFMA + 0.43%), 12/1/23 (Put Date), 12/1/29(5) | | | 15,000 | | | | 15,041,850 | |
| | |
California, 3.00%, 10/1/33 | | | 4,320 | | | | 4,621,363 | |
| | |
California, 3.00%, 10/1/37 | | | 3,970 | | | | 4,164,133 | |
| | |
California, 5.00%, 10/1/33 | | | 15,000 | | | | 17,290,500 | |
| | |
California Education Notes Program, Fiscal Year 2019-20 Note Participations,
5.00%, 6/30/20 | | | 5,245 | | | | 5,389,919 | |
| | |
Chicago, IL, 5.00%, 1/1/39 | | | 2,100 | | | | 2,397,549 | |
| | |
Chicago, IL, 5.00%, 1/1/40 | | | 1,500 | | | | 1,708,620 | |
| | |
Chicago Board of Education, IL,
5.00%, 12/1/21 | | | 1,980 | | | | 2,099,651 | |
| | |
Chicago Board of Education, IL,
5.00%, 12/1/46 | | | 15,110 | | | | 17,109,808 | |
| | |
Chicago Board of Education, IL,
5.00%, 12/1/46 | | | 2,855 | | | | 3,054,993 | |
| | |
Clackamas Community College District, OR, 5.00%, (0.00% until 6/15/20), 6/15/38 | | | 760 | | | | 890,363 | |
| | |
Clackamas Community College District, OR, 5.00%, (0.00% until 6/15/20), 6/15/39 | | | 1,000 | | | | 1,169,110 | |
| | |
Clackamas Community College District, OR, 5.00%, (0.00% until 6/15/20), 6/15/40 | | | 1,250 | | | | 1,458,400 | |
| | |
Delaware, 4.00%, 2/1/31 | | | 10,000 | | | | 12,036,800 | |
| | |
Desert Community College District, CA, 5.00%, 8/1/37 | | | 5,350 | | | | 6,409,889 | |
| | |
District of Columbia, 5.00%, 10/15/30 | | | 4,000 | | | | 5,198,360 | |
| | |
Florida Board of Education, 4.00%, 6/1/33 | | | 7,770 | | | | 9,227,885 | |
| | |
Hartford County Metropolitan District, CT, 5.00%, 7/15/23 | | | 1,000 | | | | 1,135,040 | |
| | | | | | | | |
| Security | | Principal Amount (000’s omitted) | | | Value | |
| | |
| General Obligations (continued) | | | | | | |
| | |
Hartford County Metropolitan District, CT,
Series A, 5.00%, 7/15/24 | | $ | 500 | | | $ | 584,025 | |
| | |
Hartford County Metropolitan District, CT,
Series B, 5.00%, 7/15/24 | | | 1,000 | | | | 1,168,050 | |
| | |
Hawaii, 5.00%, 1/1/34 | | | 13,700 | | | | 17,106,779 | |
| | |
Hennepin County Regional Railroad Authority, MN, 5.00%, 12/1/30 | | | 4,040 | | | | 5,235,396 | |
| | |
Illinois, 5.00%, 2/1/24 | | | 10,705 | | | | 11,742,957 | |
| | |
Illinois, 5.00%, 11/1/24 | | | 11,295 | | | | 12,563,541 | |
| | |
Illinois, 5.00%, 2/1/27 | | | 18,500 | | | | 20,258,055 | |
| | |
Illinois, 5.00%, 2/1/29 | | | 15,000 | | | | 17,119,500 | |
| | |
Illinois, 5.00%, 5/1/39 | | | 10,000 | | | | 10,785,500 | |
| | |
Illinois, 5.25%, 7/1/30 | | | 6,150 | | | | 6,686,342 | |
| | |
Johnson City, TN, 5.00%, 6/1/22 | | | 440 | | | | 482,975 | |
| | |
Johnson City, TN, 5.00%, 6/1/24 | | | 505 | | | | 588,795 | |
| | |
Judson Independent School District, TX, (PSF Guaranteed), 4.00%, 2/1/34 | | | 4,000 | | | | 4,480,400 | |
| | |
Judson Independent School District, TX, (PSF Guaranteed), 4.00%, 2/1/35 | | | 4,000 | | | | 4,470,080 | |
| | |
Kane, Cook and DuPage Counties School District No. 46, IL, 5.00%, 1/1/29 | | | 1,920 | | | | 2,166,278 | |
| | |
Kane, Cook and DuPage Counties School District No. 46, IL, 5.00%, 1/1/30 | | | 4,105 | | | | 4,632,493 | |
| | |
Klein Independent School District, TX, (PSF Guaranteed), 5.00%, 2/1/36 | | | 14,180 | | | | 14,824,906 | |
| | |
Los Altos School District, CA, (Election of 2014), 3.00%, 8/1/34(6) | | | 1,180 | | | | 1,250,387 | |
| | |
Los Altos School District, CA, (Election of 2014), 3.00%, 8/1/37(6) | | | 1,470 | | | | 1,531,549 | |
| | |
Louisiana, 5.00%, 3/1/28 | | | 6,590 | | | | 8,356,054 | |
| | |
Massachusetts, 5.00%, 7/1/35 | | | 10,000 | | | | 11,818,000 | |
| | |
Massachusetts, 5.00%, 3/1/37 | | | 10,900 | | | | 12,410,740 | |
| | |
Minneapolis-St. Paul Metropolitan Council, MN, 4.00%, 3/1/30 | | | 1,250 | | | | 1,490,613 | |
| | |
New York, NY, 4.00%, 3/1/36 | | | 8,000 | | | | 9,164,640 | |
| | |
New York, NY, 4.00%, 12/1/41 | | | 4,070 | | | | 4,616,316 | |
| | |
New York, NY, 4.00%, 8/1/42(4) | | | 28,000 | | | | 31,937,080 | |
| | |
New York, NY, 5.00%, 4/1/30 | | | 11,735 | | | | 15,230,270 | |
| | |
New York, NY, 5.00%, 8/1/33 | | | 10,000 | | | | 12,066,900 | |
| | |
Nixa Public Schools, MO, 4.00%, 3/1/35 | | | 750 | | | | 848,655 | |
| | |
Nixa Public Schools, MO, 4.00%, 3/1/36 | | | 1,000 | | | | 1,128,120 | |
| | |
Nixa Public Schools, MO, 4.00%, 3/1/37 | | | 1,000 | | | | 1,124,320 | |
| | |
Nixa Public Schools, MO, 4.00%, 3/1/38 | | | 1,125 | | | | 1,260,473 | |
| | |
Northside Independent School District, TX, (PSF Guaranteed),
4.00%, 8/15/33 | | | 2,540 | | | | 2,965,653 | |
| | |
Onondaga County, NY, 4.00%, 6/1/28 | | | 2,275 | | | | 2,678,176 | |
| | | | |
| | 16 | | See Notes to Financial Statements. |
Eaton Vance
National Municipal Income Fund
September 30, 2019
Portfolio of Investments — continued
| | | | | | | | |
| Security | | Principal Amount (000’s omitted) | | | Value | |
| | |
| General Obligations (continued) | | | | | | |
| | |
Onondaga County, NY, 4.00%, 6/1/30 | | $ | 2,495 | | | $ | 2,919,025 | |
| | |
Oxnard Union High School District, CA, (Election of 2018), 5.00%, 8/1/43 | | | 3,750 | | | | 4,473,000 | |
| | |
Park City, UT, 4.00%, 2/1/31 | | | 3,490 | | | | 4,200,843 | |
| | |
Randolph County, NC, Limited Obligation Bonds, 4.00%, 10/1/35 | | | 1,310 | | | | 1,529,739 | |
| | |
Randolph County, NC, Limited Obligation Bonds, 4.00%, 10/1/36 | | | 1,595 | | | | 1,857,122 | |
| | |
Randolph County, NC, Limited Obligation Bonds, 4.00%, 10/1/37 | | | 545 | | | | 632,309 | |
| | |
Randolph County, NC, Limited Obligation Bonds, 5.00%, 10/1/33 | | | 500 | | | | 643,780 | |
| | |
San Francisco Bay Area Rapid Transit District, CA, (Election of 2004), Green Bonds, 5.00%, 8/1/31 | | | 9,170 | | | | 12,225,627 | |
| | |
San Francisco Bay Area Rapid Transit District, CA, (Election of 2004), Green Bonds, 5.00%, 8/1/32 | | | 9,175 | | | | 12,186,143 | |
| | |
San Francisco Bay Area Rapid Transit District, CA, (Election of 2004), Green Bonds, 5.00%, 8/1/33 | | | 8,390 | | | | 11,115,575 | |
| | |
San Francisco Bay Area Rapid Transit District, CA, (Election of 2004), Green Bonds, 5.00%, 8/1/34 | | | 5,560 | | | | 7,342,258 | |
| | |
San Francisco Bay Area Rapid Transit District, CA, (Election of 2004), Green Bonds, 5.00%, 8/1/35 | | | 2,200 | | | | 2,896,102 | |
| | |
San Jose, CA, 5.00%, 9/1/32 | | | 10,015 | | | | 13,106,030 | |
| | |
San Jose, CA, 5.00%, 9/1/34 | | | 9,610 | | | | 12,467,437 | |
| | |
San Jose, CA, 5.00%, 9/1/38 | | | 6,300 | | | | 8,017,128 | |
| | |
San Jose, CA, 5.00%, 9/1/39 | | | 4,590 | | | | 5,822,599 | |
| | |
Santa Monica-Malibu Unified School District, CA, (School Facilities Improvement District No. 1), (Election of 2018), 3.00%, 8/1/32(6) | | | 1,560 | | | | 1,685,174 | |
| | |
Santa Monica-Malibu Unified School District, CA, (School Facilities Improvement District No. 1), (Election of 2018), 3.00%, 8/1/37(6) | | | 2,725 | | | | 2,875,556 | |
| | |
Santiam Canyon School District No. 129J, OR, 5.00%, 6/15/39 | | | 1,000 | | | | 1,260,510 | |
| | |
Santiam Canyon School District No. 129J, OR, 5.00%, 6/15/44 | | | 2,000 | | | | 2,488,260 | |
| | |
Stamford, CT, 4.00%, 12/1/30 | | | 1,210 | | | | 1,486,824 | |
| | |
Tempe, AZ, 4.00%, 7/1/36 | | | 3,400 | | | | 3,988,098 | |
| | |
Tennessee, 5.00%, 9/1/28(6) | | | 4,785 | | | | 6,087,142 | |
| | |
Texas, (Texas Transportation Commission), 5.00%, 10/1/44 | | | 10,000 | | | | 11,560,700 | |
| | |
Texas City Independent School District, TX, (PSF Guaranteed), 4.00%, 8/15/33 | | | 1,000 | | | | 1,164,040 | |
| | |
Virginia Beach, VA, 4.00%, 7/15/32 | | | 2,300 | | | | 2,779,504 | |
| | |
Washington, 5.00%, 2/1/33 | | | 13,140 | | | | 15,073,420 | |
| | |
Washington, 5.00%, 8/1/35 | | | 14,555 | | | | 17,951,700 | |
| | |
Washington, 5.00%, 2/1/36 | | | 8,600 | | | | 9,822,318 | |
| | |
Washington, 5.00%, 2/1/40 | | | 24,865 | | | | 30,007,331 | |
| | | | | | | | |
| Security | | Principal Amount (000’s omitted) | | | Value | |
| | |
| General Obligations (continued) | | | | | | |
| | |
Washington, 5.00%, 2/1/41 | | $ | 10,000 | | | $ | 12,476,100 | |
| | |
Washington County, OR, 4.00%, 3/1/30 | | | 1,000 | | | | 1,143,720 | |
| | |
Wauwatosa School District, WI, 4.00%, 3/1/31 | | | 6,765 | | | | 7,762,296 | |
| | |
Will County Community Unit School District No. 365-U, IL, (Valley View), 5.75%, 11/1/31 | | | 12,995 | | | | 14,136,221 | |
| | |
Wisconsin, 5.00%, 5/1/38 | | | 22,500 | | | | 26,615,925 | |
| |
| | | | $ | 661,878,834 | |
| | |
| Hospital — 7.6% | | | | | | |
| | |
Allegheny County Hospital Development Authority, PA, (UPMC Health System), 5.00%, 7/15/32 | | $ | 2,250 | | | $ | 2,844,765 | |
| | |
Brookhaven Development Authority, GA, (Children’s Healthcare of Atlanta),
5.00%, 7/1/31 | | | 755 | | | | 973,905 | |
| | |
California Health Facilities Financing Authority, (Catholic Healthcare West),
5.25%, 3/1/28 | | | 5,700 | | | | 6,003,582 | |
| | |
California Health Facilities Financing Authority, (Kaiser Permanente),
4.00%, 11/1/38 | | | 7,820 | | | | 8,838,633 | |
| | |
California Health Facilities Financing Authority, (Providence Health System),
5.50%, 10/1/39(4) | | | 36,700 | | | | 36,704,037 | |
| | |
California Health Facilities Financing Authority, (St. Joseph Health System), 5.00%, 7/1/33 | | | 17,530 | | | | 19,750,525 | |
| | |
California Health Facilities Financing Authority, (St. Joseph Health System), 5.00%, 7/1/37 | | | 25,465 | | | | 28,571,730 | |
| | |
California Health Facilities Financing Authority, (Sutter Health),
5.25%, 8/15/31 | | | 13,675 | | | | 14,661,241 | |
| | |
Colorado Health Facilities Authority, (CommonSpirit Health), 5.00%, 8/1/44 | | | 6,000 | | | | 7,164,600 | |
| | |
Colorado Health Facilities Authority, (SCL Health System), 4.00%, 1/1/36(6) | | | 2,000 | | | | 2,291,560 | |
| | |
Connecticut Health and Educational Facilities Authority, (Nuvance Health), 4.00%, 7/1/34 | | | 2,455 | | | | 2,778,569 | |
| | |
DeKalb Private Hospital Authority, GA, (Children’s Healthcare of Atlanta),
5.00%, 7/1/31 | | | 1,000 | | | | 1,289,940 | |
| | |
Illinois Finance Authority, (Edward-Elmhurst Healthcare), 2.33%, (SIFMA + 0.75%), 7/1/23 (Put Date), 1/1/46(5) | | | 9,500 | | | | 9,498,670 | |
| | |
Illinois Finance Authority, (Presence Health Network), 5.00%, 2/15/26 | | | 7,500 | | | | 9,143,550 | |
| | |
Illinois Finance Authority, (Presence Health Network), 5.00%, 2/15/33 | | | 1,500 | | | | 1,819,425 | |
| | |
Missouri Health and Educational Facilities Authority, (Mosaic Health System),
4.00%, 2/15/44 | | | 2,200 | | | | 2,445,322 | |
| | |
Missouri Health and Educational Facilities Authority, (SSM Health Care),
5.00%, 6/1/30 | | | 7,505 | | | | 8,604,783 | |
| | |
Montana Facility Finance Authority, (SCL Health System), 4.00%, 1/1/38(6) | | | 2,150 | | | | 2,447,452 | |
| | |
Ohio, (Cleveland Clinic Health System), (SPA: PNC Bank, N.A.), 1.72%, 1/1/52(3) | | | 3,050 | | | | 3,050,000 | |
| | | | |
| | 17 | | See Notes to Financial Statements. |
Eaton Vance
National Municipal Income Fund
September 30, 2019
Portfolio of Investments — continued
| | | | | | | | |
| Security | | Principal Amount (000’s omitted) | | | Value | |
| | |
| Hospital (continued) | | | | | | |
| | |
Oklahoma Development Finance Authority, (OU Medicine), 5.00%, 8/15/38 | | $ | 1,750 | | | $ | 2,075,728 | |
| | |
Oklahoma Development Finance Authority, (OU Medicine), 5.25%, 8/15/43 | | | 5,200 | | | | 6,225,908 | |
| | |
Oregon Facilities Authority, (Samaritan Health Services), 5.00%, 10/1/35 | | | 2,260 | | | | 2,630,324 | |
| | |
University of Kansas Hospital Authority, 5.00%, 9/1/45 | | | 25,500 | | | | 29,391,045 | |
| | |
Washington Health Care Facilities Authority, (Overlake Hospital Medical Center), 5.00%, 7/1/42 | | | 2,250 | | | | 2,665,912 | |
| | |
West Virginia Hospital Finance Authority, (West Virginia United Health System Obligated Group), 5.375%, 6/1/38 | | | 21,895 | | | | 24,321,404 | |
| |
| | | | $ | 236,192,610 | |
| | |
| Housing — 0.5% | | | | | | |
| | |
Massachusetts Housing Finance Agency, (Mill Road Apartments), 2.13%, (SIFMA + 0.55%), 11/1/23 (Put Date), 11/1/48(5) | | $ | 3,965 | | | $ | 3,965,000 | |
| | |
Texas Student Housing Corp., (University of Northern Texas), 6.85%, 7/1/31 | | | 10,640 | | | | 10,641,170 | |
| |
| | | | $ | 14,606,170 | |
| | |
| Industrial Development Revenue — 2.0% | | | | | | |
| | |
Metropolitan Nashville Airport Authority, TN, (Aero Nashville),
5.20%, 7/1/26 | | $ | 300 | | | $ | 306,894 | |
| | |
Miami-Dade County Industrial Development Authority, FL, (Waste Management, Inc.), (AMT), 2.38%, (SIFMA + 0.80%), 11/1/21 (Put Date), 11/1/48(5) | | | 5,000 | | | | 5,000,150 | |
| | |
Mission Economic Development Corp., TX, (Waste Management, Inc.), (AMT), 2.38%, (SIFMA + 0.80%), 11/1/21 (Put Date), 11/1/48(5) | | | 10,000 | | | | 10,000,300 | |
| | |
New Jersey Economic Development Authority, (New Jersey-American Water Co., Inc.), (AMT), 5.70%, 10/1/39 | | | 28,150 | | | | 28,246,554 | |
| | |
New York Liberty Development Corp., (Bank of America Tower at One Bryant Park), 2.45%, 9/15/69(6) | | | 10,360 | | | | 10,573,727 | |
| | |
New York Liberty Development Corp., (Bank of America Tower at One Bryant Park), 2.625%, 9/15/69(6) | | | 3,325 | | | | 3,380,361 | |
| | |
Tuscaloosa County Industrial Development Authority, AL, (Hunt Refining Co.),
5.25%, 5/1/44(2) | | | 3,685 | | | | 4,251,385 | |
| | |
Vermont Economic Development Authority, (Casella Waste Systems, Inc.), (AMT), 4.625% to 4/3/28 (Put Date), 4/1/36(2) | | | 475 | | | | 541,343 | |
| |
| | | | $ | 62,300,714 | |
| | |
| Insured – Education — 0.0%(7) | | | | | | |
| | |
Metropolitan Government of Nashville and Davidson County Health and Educational Facilities Board, TN, (Meharry Medical College), (AMBAC), 6.00%, 12/1/19 | | $ | 435 | | | $ | 437,223 | |
| |
| | | | $ | 437,223 | |
| | | | | | | | |
| Security | | Principal Amount (000’s omitted) | | | Value | |
| | |
| Insured – General Obligations — 0.1% | | | | | | |
| | |
Santa Rosa High School District, CA, (Election of 2014), (AGM), 5.00%, 8/1/43 | | $ | 3,930 | | | $ | 4,715,528 | |
| |
| | | | $ | 4,715,528 | |
| | |
| Insured – Hospital — 0.4% | | | | | | |
| | |
Medford Hospital Facilities Authority, OR, (Asante Health System), (AGM),
5.50%, 8/15/28 | | $ | 12,000 | | | $ | 12,401,160 | |
| |
| | | | $ | 12,401,160 | |
| | |
| Insured – Other Revenue — 1.1% | | | | | | |
| | |
Harris County-Houston Sports Authority, TX, (AGM), (NPFG), 0.00%, 11/15/34 | | $ | 58,155 | | | $ | 35,706,588 | |
| |
| | | | $ | 35,706,588 | |
| | |
| Insured – Special Tax Revenue — 0.6% | | | | | | |
| | |
Massachusetts, Dedicated Tax Revenue, (NPFG), 5.50%, 1/1/29 | | $ | 11,000 | | | $ | 14,600,740 | |
| | |
Massachusetts, Dedicated Tax Revenue, (NPFG), 5.50%, 1/1/30 | | | 3,080 | | | | 4,155,628 | |
| |
| | | | $ | 18,756,368 | |
| | |
| Insured – Transportation — 2.2% | | | | | | |
| | |
E-470 Public Highway Authority, CO, (NPFG), 0.00%, 9/1/37 | | $ | 13,335 | | | $ | 6,527,216 | |
| | |
Metropolitan Transportation Authority, NY, Green Bonds, (AGM), 4.00%, 11/15/46(4) | | | 10,000 | | | | 11,255,100 | |
| | |
Metropolitan Transportation Authority, NY, Green Bonds, (AGM), 4.00%, 11/15/46 | | | 6,380 | | | | 7,110,510 | |
| | |
North Texas Tollway Authority, (AGC),
6.20%, 1/1/42 | | | 37,070 | | | | 45,463,389 | |
| |
| | | | $ | 70,356,215 | |
| |
| Lease Revenue / Certificates of Participation — 3.1% | | | | |
| | |
Hillsborough County, FL, 4.00%, 8/1/31 | | $ | 4,840 | | | $ | 5,792,512 | |
| | |
Hillsborough County, FL, 4.00%, 8/1/34 | | | 5,445 | | | | 6,384,045 | |
| | |
Hudson Yards Infrastructure Corp., NY,
4.00%, 2/15/44 | | | 6,660 | | | | 7,419,506 | |
| | |
New Jersey Economic Development Authority, (School Facilities Construction),
5.00%, 6/15/34 | | | 8,460 | | | | 9,969,264 | |
| | |
New Jersey Economic Development Authority, (School Facilities Construction),
5.00%, 6/15/35 | | | 13,300 | | | | 15,614,732 | |
| | |
Texas, Tax and Revenue Anticipation Notes, 4.00%, 8/27/20 | | | 50,000 | | | | 51,202,000 | |
| |
| | | | $ | 96,382,059 | |
| | |
| Nursing Home — 0.2% | | | | | | |
| | |
Mississippi Business Finance Corp., (Magnolia Healthcare), 7.99%, 7/1/25 | | $ | 5,715 | | | $ | 5,769,121 | |
| |
| | | | $ | 5,769,121 | |
| | | | |
| | 18 | | See Notes to Financial Statements. |
Eaton Vance
National Municipal Income Fund
September 30, 2019
Portfolio of Investments — continued
| | | | | | | | |
| Security | | Principal Amount (000’s omitted) | | | Value | |
| | |
| Other Revenue — 3.0% | | | | | | |
| | |
Battery Park City Authority, NY, 5.00%, 11/1/40 | | $ | 2,955 | | | $ | 3,801,046 | |
| | |
Central Falls Detention Facility Corp., RI, 7.25%, 7/15/35(8) | | | 250 | | | | 45,000 | |
| | |
Kalispel Tribe of Indians, WA, Series A,
5.25%, 1/1/38(2) | | | 1,865 | | | | 2,074,346 | |
| | |
Kalispel Tribe of Indians, WA, Series B,
5.25%, 1/1/38(2) | | | 1,000 | | | | 1,112,250 | |
| | |
New York City Transitional Finance Authority, NY, (Building Aid), 5.00%, 7/15/33 | | | 10,000 | | | | 11,698,800 | |
| | |
New York City Transitional Finance Authority, NY, (Building Aid), 5.00%, 7/15/43 | | | 11,575 | | | | 13,602,824 | |
| | |
Texas Municipal Gas Acquisition and Supply Corp. I, Gas Supply Revenue,
6.25%, 12/15/26 | | | 19,645 | | | | 22,926,894 | |
| | |
Texas Municipal Gas Acquisition and Supply Corp. III, Gas Supply Revenue,
5.00%, 12/15/30 | | | 4,845 | | | | 5,290,498 | |
| | |
Texas Municipal Gas Acquisition and Supply Corp. III, Gas Supply Revenue, 5.00%, 12/15/32 | | | 29,755 | | | | 32,388,615 | |
| | |
Washington Health Care Facilities Authority, (Fred Hutchinson Cancer Research Center), 2.471%, (67% of 1 mo. USD LIBOR + 1.10%), 7/1/22 (Put Date),
1/1/42(5) | | | 1,000 | | | | 1,006,910 | |
| |
| | | | $ | 93,947,183 | |
| | |
| Senior Living / Life Care — 0.4% | | | | | | |
| | |
Delaware Economic Development Authority, (ACTS Retirement-Life Communities, Inc. Obligated Group), 5.00%, 11/15/48 | | $ | 2,500 | | | $ | 2,886,950 | |
| | |
Logan County, CO, (TLC Care Choices, Inc.), 6.875%, 12/1/23(9) | | | 409 | | | | 110,475 | |
| | |
New Hope Cultural Education Facilities Finance Corp., TX, (Longhorn Village),
5.00%, 1/1/47 | | | 7,500 | | | | 8,174,850 | |
| | |
Rockville, MD, (Ingleside at King Farm),
5.00%, 11/1/31 | | | 1,010 | | | | 1,151,743 | |
| | |
Rockville, MD, (Ingleside at King Farm),
5.00%, 11/1/32 | | | 525 | | | | 596,243 | |
| | |
Wisconsin Health and Educational Facilities Authority, (Saint John’s Communities, Inc.), 5.00%, 9/15/40 | | | 750 | | | | 791,745 | |
| |
| | | | $ | 13,712,006 | |
| | |
| Special Tax Revenue — 9.7% | | | | | | |
| | |
Illinois Sports Facilities Authority,
5.00%, 6/15/29 | | $ | 2,000 | | | $ | 2,413,180 | |
| | |
Illinois Sports Facilities Authority,
5.00%, 6/15/30 | | | 1,200 | | | | 1,436,520 | |
| | |
Los Angeles County Metropolitan Transportation Authority, CA, Sales Tax Revenue, 5.00%, 7/1/42 | | | 5,550 | | | | 6,795,198 | |
| | |
New River Community Development District, FL, (Capital Improvements),
5.00%, 5/1/13(8) | | | 230 | | | | 0 | |
| | |
New River Community Development District, FL, (Capital Improvements),
5.35%, 5/1/38(8) | | | 80 | | | | 0 | |
| | |
New River Community Development District, FL, (Capital Improvements), Series 2010A-2, 5.75%, 5/1/38 | | | 380 | | | | 379,973 | |
| | |
New York City Transitional Finance Authority, NY, Future Tax Revenue, 4.00%, 5/1/37 | | | 7,500 | | | | 8,474,775 | |
| | | | | | | | |
| Security | | Principal Amount (000’s omitted) | | | Value | |
| | |
| Special Tax Revenue (continued) | | | | | | |
| | |
New York City Transitional Finance Authority, NY, Future Tax Revenue, 4.00%, 8/1/37 | | $ | 1,480 | | | $ | 1,666,362 | |
| | |
New York City Transitional Finance Authority, NY, Future Tax Revenue, 4.00%, 11/1/37 | | | 10,000 | | | | 11,567,500 | |
| | |
New York City Transitional Finance Authority, NY, Future Tax Revenue, 4.00%, 8/1/38 | | | 5,000 | | | | 5,713,650 | |
| | |
New York City Transitional Finance Authority, NY, Future Tax Revenue, 4.00%, 11/1/38 | | | 8,500 | | | | 9,791,830 | |
| | |
New York City Transitional Finance Authority, NY, Future Tax Revenue, 4.00%, 8/1/39 | | | 7,500 | | | | 8,537,775 | |
| | |
New York City Transitional Finance Authority, NY, Future Tax Revenue, 4.00%, 5/1/42 | | | 5,695 | | | | 6,304,593 | |
| | |
New York City Transitional Finance Authority, NY, Future Tax Revenue, 5.00%, 2/1/35 | | | 10,375 | | | | 12,116,444 | |
| | |
New York City Transitional Finance Authority, NY, Future Tax Revenue, 5.00%, 5/1/35 | | | 24,725 | | | | 31,402,728 | |
| | |
New York City Transitional Finance Authority, NY, Future Tax Revenue, 5.00%, 8/1/35 | | | 10,485 | | | | 12,854,505 | |
| | |
New York City Transitional Finance Authority, NY, Future Tax Revenue, 5.00%, 5/1/36 | | | 4,050 | | | | 5,022,041 | |
| | |
New York City Transitional Finance Authority, NY, Future Tax Revenue, 5.00%, 8/1/36 | | | 10,000 | | | | 11,801,500 | |
| | |
New York City Transitional Finance Authority, NY, Future Tax Revenue, 5.00%, 5/1/39 | | | 9,240 | | | | 11,155,729 | |
| | |
New York City Transitional Finance Authority, NY, Future Tax Revenue, 5.00%, 5/1/40 | | | 5,970 | | | | 7,091,345 | |
| | |
New York City Transitional Finance Authority, NY, Future Tax Revenue, 5.00%, 8/1/40 | | | 5,000 | | | | 5,969,800 | |
| | |
New York City Transitional Finance Authority, NY, Future Tax Revenue, 2015 Series B, 5.00%, 8/1/39 | | | 4,585 | | | | 5,294,758 | |
| | |
New York City Transitional Finance Authority, NY, Future Tax Revenue, 2018 Series A, 5.00%, 8/1/39 | | | 11,845 | | | | 14,368,103 | |
| | |
New York Dormitory Authority, Personal Income Tax Revenue, 5.00%, 2/15/45 | | | 10,000 | | | | 11,491,000 | |
| | |
New York Dormitory Authority, Personal Income Tax Revenue, Series 2013A, 5.00%, 2/15/43 | | | 12,755 | | | | 14,243,636 | |
| | |
New York Dormitory Authority, Sales Tax Revenue, 5.00%, 3/15/29 | | | 9,670 | | | | 12,306,816 | |
| | |
New York Dormitory Authority, Sales Tax Revenue, 5.00%, 3/15/36 | | | 7,840 | | | | 9,441,790 | |
| | |
New York Dormitory Authority, Sales Tax Revenue, 5.00%, 3/15/40 | | | 10,000 | | | | 12,043,600 | |
| | |
New York Dormitory Authority, Sales Tax Revenue, (AMT), 5.00%, 3/15/27 | | | 1,620 | | | | 2,018,763 | |
| | |
New York Dormitory Authority, Sales Tax Revenue, (AMT), 5.00%, 3/15/28 | | | 1,705 | | | | 2,166,816 | |
| | |
New York Dormitory Authority, Sales Tax Revenue, (AMT), 5.00%, 3/15/29 | | | 1,790 | | | | 2,292,972 | |
| | | | |
| | 19 | | See Notes to Financial Statements. |
Eaton Vance
National Municipal Income Fund
September 30, 2019
Portfolio of Investments — continued
| | | | | | | | |
| Security | | Principal Amount (000’s omitted) | | | Value | |
| | |
| Special Tax Revenue (continued) | | | | | | |
| | |
New York Dormitory Authority, Sales Tax Revenue, (AMT), 5.00%, 3/15/31 | | $ | 970 | | | $ | 1,227,962 | |
| | |
New York Dormitory Authority, Sales Tax Revenue, (AMT), 5.00%, 3/15/32 | | | 2,070 | | | | 2,606,523 | |
| | |
New York State Urban Development Corp., Personal Income Tax Revenue,
4.00%, 3/15/47 | | | 6,515 | | | | 7,374,198 | |
| | |
New York State Urban Development Corp., Personal Income Tax Revenue,
5.00%, 3/15/35 | | | 10,000 | | | | 11,855,800 | |
| | |
New York State Urban Development Corp., Personal Income Tax Revenue,
5.00%, 3/15/41 | | | 10,000 | | | | 12,344,700 | |
| | |
Puerto Rico Sales Tax Financing Corp., 4.329%, 7/1/40 | | | 5,536 | | | | 5,632,769 | |
| | |
Puerto Rico Sales Tax Financing Corp., 4.784%, 7/1/58 | | | 2,219 | | | | 2,307,960 | |
| | |
Southern Hills Plantation I Community Development District, FL, Series A1, 5.80%, 5/1/35 | | | 455 | | | | 454,950 | |
| | |
Southern Hills Plantation I Community Development District, FL, Series A2, 5.80%, 5/1/35 | | | 330 | | | | 301,825 | |
| | |
Sterling Hill Community Development District, FL, 6.20%, 5/1/35 | | | 1,532 | | | | 980,254 | |
| | |
Texas Transportation Commission,
5.00%, 4/1/33(4) | | | 10,000 | | | | 11,519,500 | |
| |
| | | | $ | 302,770,143 | |
| | |
| Student Loan — 0.2% | | | | | | |
| | |
New Jersey Higher Education Student Assistance Authority, (AMT),
4.00%, 12/1/28 | | $ | 5,340 | | | $ | 5,847,353 | |
| |
| | | | $ | 5,847,353 | |
| | |
| Transportation — 23.8% | | | | | | |
| | |
Atlanta, GA, Airport Revenue, (AMT),
4.00%, 7/1/33 | | $ | 3,575 | | | $ | 4,112,644 | |
| | |
Atlanta, GA, Airport Revenue, (AMT),
4.00%, 7/1/34 | | | 3,480 | | | | 3,984,043 | |
| | |
Atlanta, GA, Airport Revenue, (AMT),
4.00%, 7/1/36 | | | 5,000 | | | | 5,684,700 | |
| | |
Austin, TX, Airport System Revenue, (AMT), 5.00%, 11/15/35 | | | 2,625 | | | | 3,282,326 | |
| | |
Charleston County Airport District, SC, (AMT), 5.50%, 7/1/38 | | | 10,000 | | | | 11,203,400 | |
| | |
Chicago, IL, (Midway International Airport), 5.00%, 1/1/33 | | | 4,735 | | | | 5,338,239 | |
| | |
Chicago, IL, (Midway International Airport), (AMT), 5.00%, 1/1/34 | | | 5,250 | | | | 5,855,115 | |
| | |
Chicago, IL, (O’Hare International Airport), 5.00%, 1/1/36 | | | 6,000 | | | | 7,060,800 | |
| | |
Chicago, IL, (O’Hare International Airport), (AMT), 5.00%, 1/1/23 | | | 1,125 | | | | 1,245,398 | |
| | |
Chicago, IL, (O’Hare International Airport), (AMT), 5.00%, 1/1/25 | | | 16,100 | | | | 17,806,922 | |
| | |
Chicago, IL, (O’Hare International Airport), (AMT), 5.00%, 1/1/33 | | | 7,300 | | | | 8,359,303 | |
| | |
Chicago, IL, (O’Hare International Airport), (AMT), 5.00%, 1/1/39 | | | 4,000 | | | | 4,845,040 | |
| | | | | | | | |
| Security | | Principal Amount (000’s omitted) | | | Value | |
| | |
| Transportation (continued) | | | | | | |
| | |
Dallas and Fort Worth, TX, (Dallas/Fort Worth International Airport), 5.25%, 11/1/31 | | $ | 10,395 | | | $ | 11,895,102 | |
| | |
Dallas and Fort Worth, TX, (Dallas/Fort Worth International Airport), (AMT),
5.25%, 11/1/30 | | | 11,015 | | | | 12,515,684 | |
| | |
Delaware River and Bay Authority of Delaware and New Jersey,
4.00%, 1/1/34 | | | 3,100 | | | | 3,595,814 | |
| | |
Delaware River and Bay Authority of Delaware and New Jersey,
4.00%, 1/1/39 | | | 3,225 | | | | 3,677,984 | |
| | |
Delaware River Port Authority of Pennsylvania and New Jersey,
5.00%, 1/1/31 | | | 3,850 | | | | 4,419,107 | |
| | |
Denver City and County, CO, Airport System Revenue, (AMT), 5.00%, 12/1/37 | | | 10,000 | | | | 12,172,300 | |
| | |
Hawaii, Airports System Revenue, (AMT), 5.00%, 7/1/41 | | | 2,935 | | | | 3,357,405 | |
| | |
Hawaii, Airports System Revenue, (AMT), 5.00%, 7/1/43 | | | 10,000 | | | | 12,016,400 | |
| | |
Houston, TX, (United Airlines, Inc.), (AMT), 5.00%, 7/1/29 | | | 7,670 | | | | 8,599,221 | |
| | |
Illinois Toll Highway Authority, 5.00%, 1/1/40 | | | 1,000 | | | | 1,159,090 | |
| | |
Kansas City Industrial Development Authority, MO, (Kansas City International Airport Terminal Modernization), (AMT),
5.00%, 3/1/46 | | | 31,930 | | | | 38,203,606 | |
| | |
Kansas Department of Transportation,
5.00%, 9/1/30 | | | 20,000 | | | | 23,446,200 | |
| | |
Los Angeles Department of Airports, CA, (Los Angeles International Airport),
5.00%, 5/15/35(4) | | | 7,200 | | | | 7,363,296 | |
| | |
Los Angeles Department of Airports, CA, (Los Angeles International Airport), (AMT),
5.00%, 5/15/24 | | | 1,200 | | | | 1,387,380 | |
| | |
Los Angeles Department of Airports, CA, (Los Angeles International Airport), (AMT),
5.00%, 5/15/26 | | | 1,335 | | | | 1,619,208 | |
| | |
Los Angeles Department of Airports, CA, (Los Angeles International Airport), (AMT),
5.00%, 5/15/30 | | | 5,325 | | | | 6,778,565 | |
| | |
Los Angeles Department of Airports, CA, (Los Angeles International Airport), (AMT),
5.00%, 5/15/31 | | | 2,250 | | | | 2,850,615 | |
| | |
Los Angeles Department of Airports, CA, (Los Angeles International Airport), (AMT),
5.00%, 5/15/32 | | | 6,100 | | | | 7,698,200 | |
| | |
Los Angeles Department of Airports, CA, (Los Angeles International Airport), (AMT),
5.00%, 5/15/33 | | | 10,000 | | | | 12,366,500 | |
| | |
Los Angeles Department of Airports, CA, (Los Angeles International Airport), (AMT),
5.00%, 5/15/40 | | | 6,000 | | | | 6,881,220 | |
| | |
Los Angeles Department of Airports, CA, (Los Angeles International Airport), (AMT),
5.00%, 5/15/41 | | | 9,000 | | | | 10,497,780 | |
| | |
Louisiana Offshore Terminal Authority, (LOOP LLC), 2.00% to 10/1/22 (Put Date), 10/1/40 | | | 2,000 | | | | 2,019,340 | |
| | |
Love Field Airport Modernization Corp., TX, (AMT), 5.00%, 11/1/24 | | | 1,500 | | | | 1,749,960 | |
| | |
Maryland Economic Development Corp., (Transportation Facilities), 5.00%, 6/1/35 | | | 1,050 | | | | 1,271,897 | |
| | |
Massachusetts Port Authority, 5.00%, 7/1/32 | | | 3,800 | | | | 4,918,454 | |
| | |
Massachusetts Port Authority, (AMT),
5.00%, 7/1/26 | | | 10,105 | | | | 12,279,293 | |
| | |
Massachusetts Port Authority, (AMT),
5.00%, 7/1/30 | | | 3,000 | | | | 3,835,560 | |
| | |
Massachusetts Port Authority, (AMT),
5.00%, 7/1/31 | | | 2,965 | | | | 3,769,849 | |
| | | | |
| | 20 | | See Notes to Financial Statements. |
Eaton Vance
National Municipal Income Fund
September 30, 2019
Portfolio of Investments — continued
| | | | | | | | |
| Security | | Principal Amount (000’s omitted) | | | Value | |
| | |
| Transportation (continued) | | | | | | |
| | |
Massachusetts Port Authority, (AMT), 5.00%, 7/1/32 | | $ | 4,200 | | | $ | 5,315,478 | |
| | |
Massachusetts Port Authority, (AMT), 5.00%, 7/1/33 | | | 4,410 | | | | 5,566,875 | |
| | |
Memphis-Shelby County Airport Authority, TN, (AMT), 5.00%, 7/1/35 | | | 3,440 | | | | 4,184,485 | |
| | |
Memphis-Shelby County Airport Authority, TN, (AMT), 5.00%, 7/1/36 | | | 3,200 | | | | 3,882,496 | |
| | |
Metropolitan Transportation Authority, NY, 5.25%, 11/15/33 | | | 4,250 | | | | 4,910,663 | |
| | |
Metropolitan Transportation Authority, NY, Green Bonds, 0.00%, 11/15/32 | | | 16,050 | | | | 11,580,556 | |
| | |
Metropolitan Transportation Authority, NY, Green Bonds, 5.00%, 11/15/39 | | | 18,240 | | | | 22,698,403 | |
| | |
Metropolitan Washington Airports Authority, D.C., (AMT), 5.00%, 10/1/28 | | | 4,500 | | | | 5,217,210 | |
| | |
Metropolitan Washington Airports Authority, D.C., (AMT), 5.00%, 10/1/30 | | | 5,840 | | | | 7,458,264 | |
| | |
Metropolitan Washington Airports Authority, D.C., (AMT), 5.00%, 10/1/31 | | | 6,130 | | | | 7,785,345 | |
| | |
Metropolitan Washington Airports Authority, D.C., (AMT), 5.00%, 10/1/42 | | | 2,000 | | | | 2,381,120 | |
| | |
Miami-Dade County, FL, Aviation Revenue, (AMT), 4.00%, 10/1/44 | | | 5,000 | | | | 5,530,700 | |
| | |
Miami-Dade County, FL, Aviation Revenue, (AMT), 5.00%, 10/1/33 | | | 23,250 | | | | 26,512,207 | |
| | |
Miami-Dade County, FL, Aviation Revenue, (AMT), 5.00%, 10/1/36 | | | 10,000 | | | | 11,347,100 | |
| | |
Miami-Dade County, FL, Aviation Revenue, (AMT), 5.00%, 10/1/38 | | | 2,560 | | | | 3,087,283 | |
| | |
Miami-Dade County, FL, Aviation Revenue, (AMT), 5.00%, 10/1/40 | | | 32,530 | | | | 38,501,207 | |
| | |
Miami-Dade County, FL, Aviation Revenue, (AMT), 5.00%, 10/1/41 | | | 2,470 | | | | 2,958,492 | |
| | |
Minneapolis-St. Paul Metropolitan Airports Commission, MN, (AMT), 5.00%, 1/1/32(6) | | | 3,710 | | | | 4,654,789 | |
| | |
New Jersey Transportation Trust Fund Authority, (Transportation Program), 2.78%, (SIFMA + 1.20%), 12/15/21 (Put Date), 6/15/34(5) | | | 2,275 | | | | 2,289,242 | |
| | |
New Jersey Turnpike Authority, 4.00%, 1/1/48 | | | 5,985 | | | | 6,696,078 | |
| | |
New Jersey Turnpike Authority, 5.00%, 1/1/37 | | | 10,000 | | | | 12,213,800 | |
| | |
New Jersey Turnpike Authority, Series 2014A, 5.00%, 1/1/31 | | | 10,000 | | | | 11,586,700 | |
| | |
New Jersey Turnpike Authority, Series 2015E, 5.00%, 1/1/31 | | | 2,680 | | | | 3,146,802 | |
| | |
New Jersey Turnpike Authority, Series 2017B, 5.00%, 1/1/31 | | | 3,560 | | | | 4,456,586 | |
| | |
New York Transportation Development Corp., (LaGuardia Airport Terminal B Redevelopment), (AMT), 5.00%, 7/1/41 | | | 14,090 | | | | 15,669,771 | |
| | |
North Texas Tollway Authority, 5.00%, 1/1/29 | | | 5,000 | | | | 6,011,500 | |
| | | | | | | | |
| Security | | Principal Amount (000’s omitted) | | | Value | |
| | |
| Transportation (continued) | | | | | | |
| | |
Oregon Department of Transportation, 5.00%, 11/15/38 | | $ | 250 | | | $ | 281,790 | |
| | |
Orlando-Orange County Expressway Authority, FL, Prerefunded to 7/1/20, 5.00%, 7/1/35 | | | 11,855 | | | | 12,182,554 | |
| | |
Orlando-Orange County Expressway Authority, FL, Prerefunded to 7/1/20, 5.00%, 7/1/35 | | | 3,145 | | | | 3,231,896 | |
| | |
Pennsylvania Turnpike Commission, Prerefunded to 12/1/20, 5.35%, 12/1/30 | | | 5,005 | | | | 5,240,085 | |
| | |
Port Authority of New York and New Jersey, 5.00%, 5/1/40 | | | 3,585 | | | | 4,192,478 | |
| | |
Port Authority of New York and New Jersey, (AMT), 4.00%, 9/1/34 | | | 10,800 | | | | 11,903,328 | |
| | |
Port Authority of New York and New Jersey, (AMT), 5.00%, 9/15/31 | | | 15,000 | | | | 18,677,400 | |
| | |
Port Authority of New York and New Jersey, (AMT), 5.00%, 10/1/35 | | | 5,000 | | | | 5,968,250 | |
| | |
Port Authority of New York and New Jersey, (AMT), 5.00%, 4/1/36 | | | 11,555 | | | | 13,778,298 | |
| | |
Port of Seattle, WA, (AMT), 5.00%, 4/1/23 | | | 2,000 | | | | 2,239,320 | |
| | |
Port of Seattle, WA, (AMT), 5.00%, 4/1/24 | | | 1,750 | | | | 2,012,290 | |
| | |
Port of Seattle, WA, (AMT), 5.00%, 4/1/25 | | | 1,500 | | | | 1,763,145 | |
| | |
Public Finance Authority, WI, (Denver International Airport Great Hall), (AMT), 5.00%, 9/30/26 | | | 490 | | | | 505,969 | |
| | |
Public Finance Authority, WI, (Denver International Airport Great Hall), (AMT), 5.00%, 9/30/27 | | | 710 | | | | 733,331 | |
| | |
Public Finance Authority, WI, (Denver International Airport Great Hall), (AMT), 5.00%, 9/30/37 | | | 2,405 | | | | 2,479,194 | |
| | |
Salt Lake City, UT, (Salt Lake City International Airport), (AMT), 5.00%, 7/1/38 | | | 7,165 | | | | 8,683,980 | |
| | |
San Francisco City and County Airport Commission, CA, (San Francisco International Airport), (AMT), 5.00%, 5/1/35 | | | 4,060 | | | | 5,055,877 | |
| | |
San Francisco City and County Airport Commission, CA, (San Francisco International Airport), (AMT), 5.00%, 5/1/41 | | | 25,630 | | | | 29,840,496 | |
| | |
San Francisco City and County Airport Commission, CA, (San Francisco International Airport), (AMT), 5.00%, 5/1/44 | | | 8,535 | | | | 9,618,860 | |
| | |
San Francisco City and County Airport Commission, CA, (San Francisco International Airport), (AMT), 5.00%, 5/1/46 | | | 5,000 | | | | 5,789,200 | |
| | |
Texas Private Activity Bond Surface Transportation Corp., (LBJ Express Managed Lanes Project), 7.00%, 6/30/34 | | | 29,200 | | | | 30,504,656 | |
| | |
Texas Private Activity Bond Surface Transportation Corp., (North Tarrant Express Managed Lanes Project), 6.875%, 12/31/39 | | | 24,110 | | | | 24,452,121 | |
| | |
Texas Private Activity Bond Surface Transportation Corp., (North Tarrant Express Segment 3C), (AMT), 5.00%, 6/30/58 | | | 5,820 | | | | 6,802,300 | |
| |
| | | | $ | 742,702,930 | |
| | | | |
| | 21 | | See Notes to Financial Statements. |
Eaton Vance
National Municipal Income Fund
September 30, 2019
Portfolio of Investments — continued
| | | | | | | | |
| Security | | Principal Amount (000’s omitted) | | | Value | |
|
| Water and Sewer — 7.0% | |
| | |
California Department of Water Resources, (Central Valley Project), 5.00%, 12/1/32 | | $ | 7,750 | | | $ | 10,243,330 | |
| | |
California Department of Water Resources, (Central Valley Project), 5.00%, 12/1/34 | | | 3,290 | | | | 4,312,960 | |
| | |
Detroit, MI, Sewage Disposal System, 5.25%, 7/1/39 | | | 22,500 | | | | 24,501,600 | |
| | |
Detroit, MI, Water Supply System, 5.00%, 7/1/41 | | | 2,185 | | | | 2,295,736 | |
| | |
Detroit, MI, Water Supply System, 5.25%, 7/1/41 | | | 56,420 | | | | 59,820,998 | |
| | |
East Bay Municipal Utility District, CA, Water System Revenue, 5.00%, 6/1/35 | | | 2,905 | | | | 3,622,767 | |
| | |
East Bay Municipal Utility District, CA, Water System Revenue, 5.00%, 6/1/37 | | | 7,280 | | | | 8,640,778 | |
| | |
East Bay Municipal Utility District, CA, Water System Revenue, Green Bonds, 5.00%, 6/1/35 | | | 1,000 | | | | 1,301,640 | |
| | |
East Bay Municipal Utility District, CA, Water System Revenue, Green Bonds, 5.00%, 6/1/37 | | | 4,200 | | | | 5,422,410 | |
| | |
Metropolitan Water District of Southern California, 5.00%, 7/1/32 | | | 1,615 | | | | 2,127,649 | |
| | |
Metropolitan Water District of Southern California, 5.00%, 7/1/34 | | | 5,000 | | | | 6,545,950 | |
| | |
Metropolitan Water District of Southern California, 5.00%, 7/1/35 | | | 12,500 | | | | 16,315,750 | |
| | |
Michigan Finance Authority, (Detroit Water and Sewerage Department), 5.00%, 7/1/33 | | | 8,095 | | | | 9,232,348 | |
| | |
Michigan Finance Authority, (Detroit Water and Sewerage Department), 5.00%, 7/1/44 | | | 8,095 | | | | 8,719,772 | |
| | |
Missoula, MT, Water System Revenue, 4.00%, 7/1/37 | | | 600 | | | | 681,786 | |
| | |
Missoula, MT, Water System Revenue, 5.00%, 7/1/33 | | | 565 | | | | 709,617 | |
| | |
Missoula, MT, Water System Revenue, 5.00%, 7/1/35 | | | 1,135 | | | | 1,417,399 | |
| | |
Missoula, MT, Water System Revenue, 5.00%, 7/1/36 | | | 800 | | | | 996,456 | |
| | |
New York City Municipal Water Finance Authority, NY, (Water and Sewer System), 5.00%, 6/15/35 | | | 6,680 | | | | 8,017,002 | |
| | |
New York City Municipal Water Finance Authority, NY, (Water and Sewer System), (SPA: Bank of Montreal), 1.75%, 6/15/49(3) | | | 9,365 | | | | 9,365,000 | |
| | |
New York City Municipal Water Finance Authority, NY, (Water and Sewer System), (SPA: PNC Bank, N.A.), 1.75%, 6/15/46(3) | | | 21,600 | | | | 21,600,000 | |
| | |
Tarrant Regional Water District, TX, 5.00%, 3/1/30 | | | 10,000 | | | | 11,544,500 | |
| | |
Virginia Beach, VA, Storm Water Utility Revenue, 4.00%, 11/15/30 | | | 1,140 | | | | 1,379,354 | |
| | |
Virginia Beach, VA, Storm Water Utility Revenue, 4.00%, 11/15/31 | | | 1,085 | | | | 1,296,890 | |
| |
| | | | $ | 220,111,692 | |
| |
Total Tax-Exempt Municipal Securities — 100.7%
(identified cost $2,958,206,181) | | | $ | 3,148,059,697 | |
| | | | | | | | |
| Taxable Municipal Securities — 2.8% | |
| Security | | Principal Amount (000’s omitted) | | | Value | |
| | |
| Cogeneration — 0.0%(7) | | | | | | |
| | |
Northampton County Industrial Development Authority, PA, (Northampton Generating), 5.00%, 12/31/23(1) | | $ | 3,543 | | | $ | 885,740 | |
| |
| | | | $ | 885,740 | |
| | |
| General Obligations — 0.1% | | | | | | |
| | |
Chicago, IL, 7.75%, 1/1/42 | | $ | 4,050 | | | $ | 4,666,167 | |
| |
| | | | $ | 4,666,167 | |
|
| Hospital — 1.2% | |
| | |
California Statewide Communities Development Authority, (Loma Linda University Medical Center), 6.00%, 12/1/24 | | $ | 34,250 | | | $ | 37,361,612 | |
| |
| | | | $ | 37,361,612 | |
| | |
| Insured – Transportation — 1.5% | | | | | | |
| | |
Alameda Corridor Transportation Authority, CA, (AMBAC), 0.00%, 10/1/26 | | $ | 22,500 | | | $ | 18,366,525 | |
| | |
Alameda Corridor Transportation Authority, CA, (AMBAC), 0.00%, 10/1/27 | | | 34,390 | | | | 27,000,277 | |
| |
| | | | $ | 45,366,802 | |
| | |
Total Taxable Municipal Securities — 2.8%
(identified cost $77,532,052) | | | | | | $ | 88,280,321 | |
| | |
| Trust Units — 0.1% | | | | | | | | |
| Security | | Notional
Amount
(000’s omitted) | | | Value | |
| | |
| Insured – Special Tax Revenue — 0.1% | | | | | | |
| | |
COFINA Series 2007A Senior Bonds Due 2045 National Custodial Trust (taxable), 8/1/45(10) | | $ | 10,207 | | | $ | 1,403,412 | |
| | |
COFINA Series 2007A Senior Bonds Due 2045 National Custodial Trust (non-taxable), 8/1/45(10) | | | 30,996 | | | | 1,549,791 | |
| | |
Total Trust Units — 0.1%
(identified cost $2,778,783) | | | | | | $ | 2,953,203 | |
| | | | |
| | 22 | | See Notes to Financial Statements. |
Eaton Vance
National Municipal Income Fund
September 30, 2019
Portfolio of Investments — continued
| | | | | | | | |
| Corporate Bonds & Notes — 0.2% | | | | | | | | |
| Security | | Principal Amount (000’s omitted) | | | Value | |
| | |
| Health Care — 0.2% | | | | | | |
| | |
Providence St. Joseph Health Obligated Group, 2.532%, 10/1/29(6) | | $ | 5,000 | | | $ | 4,994,739 | |
| | |
Total Corporate Bonds & Notes — 0.2%
(identified cost $5,000,000) | | | | | | $ | 4,994,739 | |
| | |
Total Investments — 103.8%
(identified cost $3,043,517,016) | | | | | | $ | 3,244,287,960 | |
| |
Other Assets, Less Liabilities — (3.8)% | | | $ | (117,900,906 | ) |
| |
Net Assets — 100.0% | | | $ | 3,126,387,054 | |
The percentage shown for each investment category in the Portfolio of Investments is based on net assets.
At September 30, 2019, the concentration of the Fund’s investments in the various states and territories, determined as a percentage of net assets, is as follows:
| | | | |
| |
| New York | | | 22.3% | |
| |
| California | | | 18.2% | |
| |
| Texas | | | 13.1% | |
| |
| Others, representing less than 10% individually | | | 50.2% | |
The Fund invests primarily in debt securities issued by municipalities. The ability of the issuers of the debt securities to meet their obligations may be affected by economic developments in a specific industry or municipality. At September 30, 2019, 5.9% of total investments are backed by bond insurance of various financial institutions and financial guaranty assurance agencies. The aggregate percentage insured by an individual financial institution or financial guaranty assurance agency ranged from 1.4% to 2.2% of total investments.
| | (1) | Represents a payment-in-kind security which may pay interest in additional principal at the issuer’s discretion. |
| | (2) | Security exempt from registration pursuant to Rule 144A under the Securities Act of 1933, as amended. These securities may be sold in certain transactions in reliance on an exemption from registration (normally to qualified institutional buyers). At September 30, 2019, the aggregate value of these securities is $10,437,666 or 0.3% of the Fund’s net assets. |
| | (3) | Variable rate demand obligation that may be tendered at par on any day for payment the same or next business day. The stated interest rate, which generally resets daily, is determined by the remarketing agent and represents the rate in effect at September 30, 2019. |
| | (4) | Security represents the municipal bond held by a trust that issues residual interest bonds (see Note 1H). |
| | (5) | Floating rate security. The stated interest rate represents the rate in effect at September 30, 2019. |
| | (6) | When-issued security. |
| | (7) | Amount is less than 0.05%. |
| | (8) | Defaulted security. Issuer has defaulted on the payment of interest and/or principal or has filed for bankruptcy. |
| | (9) | Security is in default and making only partial interest payments. |
| (10) | Security was received in connection with the restructuring of an insured zero-coupon bond issued by the Puerto Rico Sales Tax Financing Corporation (“COFINA”) (the “Original Bond”). The notional amount of the combined taxable and tax-exempt trust units reflects the accreted amount of the Original Bond from original issuance through the restructuring date. Each trust certificate represents an ownership interest in various coupon paying and zero-coupon COFINA bonds and potential insurance payments pursuant to an insurance policy with National Public Finance Guarantee Corporation. The trust units have no stated coupon interest rate but accrete income to maturity at the annual rate of approximately 5.04%, the same rate as the Original Bond. |
Abbreviations:
| | | | |
| AGC | | – | | Assured Guaranty Corp. |
| | |
| AGM | | – | | Assured Guaranty Municipal Corp. |
| | |
| AMBAC | | – | | AMBAC Financial Group, Inc. |
| | |
| AMT | | – | | Interest earned from these securities may be considered a tax preference item for purposes of the Federal Alternative Minimum Tax. |
| | |
| LIBOR | | – | | London Interbank Offered Rate |
| | |
| NPFG | | – | | National Public Finance Guarantee Corp. |
| | |
| PSF | | – | | Permanent School Fund |
| | |
| SIFMA | | – | | Securities Industry and Financial Markets Association Municipal Swap Index |
| | |
| SPA | | – | | Standby Bond Purchase Agreement |
Currency Abbreviations:
| | | | |
| USD | | – | | United States Dollar |
| | | | |
| | 23 | | See Notes to Financial Statements. |
Eaton Vance
Municipal Income Funds
September 30, 2019
Statements of Assets and Liabilities
| | | | | | | | |
| | | September 30, 2019 | |
| Assets | | AMT-Free Fund | | | National Fund | |
| | |
Investments — | | | | | | | | |
| | |
Identified cost | | $ | 313,143,038 | | | $ | 3,043,517,016 | |
| | |
Unrealized appreciation | | | 29,582,452 | | | | 200,770,944 | |
| | |
Investments, at value | | $ | 342,725,490 | | | $ | 3,244,287,960 | |
| | |
Cash | | $ | 1,422,772 | | | $ | 9,148,467 | |
| | |
Interest receivable | | | 4,268,551 | | | | 35,278,243 | |
| | |
Receivable for investments sold | | | 1,018,245 | | | | 22,502,805 | |
| | |
Receivable for Fund shares sold | | | 644,381 | | | | 5,733,125 | |
| | |
Total assets | | $ | 350,079,439 | | | $ | 3,316,950,600 | |
| | |
| Liabilities | | | | | | | | |
| | |
Payable for floating rate notes issued | | $ | 29,827,964 | | | $ | 138,724,161 | |
| | |
Payable for when-issued securities | | | 2,233,356 | | | | 41,574,545 | |
| | |
Payable for Fund shares redeemed | | | 987,786 | | | | 6,030,757 | |
| | |
Distributions payable | | | 170,796 | | | | 1,220,216 | |
| | |
Payable to affiliates: | | | | | | | | |
| | |
Investment adviser fee | | | 109,912 | | | | 826,123 | |
| | |
Distribution and service fees | | | 47,361 | | | | 474,546 | |
| | |
Interest expense and fees payable | | | 204,185 | | | | 1,011,880 | |
| | |
Accrued expenses | | | 142,465 | | | | 701,318 | |
| | |
Total liabilities | | $ | 33,723,825 | | | $ | 190,563,546 | |
| | |
Net Assets | | $ | 316,355,614 | | | $ | 3,126,387,054 | |
| |
| Sources of Net Assets | | | | | |
| | |
Paid-in capital | | $ | 312,671,851 | | | $ | 3,112,834,039 | |
| | |
Distributable earnings | | | 3,683,763 | | | | 13,553,015 | |
| | |
Net Assets | | $ | 316,355,614 | | | $ | 3,126,387,054 | |
| |
| Class A Shares | | | | | |
| | |
Net Assets | | $ | 150,852,531 | | | $ | 1,605,406,754 | |
| | |
Shares Outstanding | | | 16,307,314 | | | | 158,317,809 | |
| | |
Net Asset Value and Redemption Price Per Share | | | | | | | | |
| | |
(net assets ÷ shares of beneficial interest outstanding) | | $ | 9.25 | | | $ | 10.14 | |
| | |
Maximum Offering Price Per Share | | | | | | | | |
| | |
(100 ÷ 95.25 of net asset value per share) | | $ | 9.71 | | | $ | 10.65 | |
| |
| Class C Shares | | | | | |
| | |
Net Assets | | $ | 19,714,632 | | | $ | 172,416,834 | |
| | |
Shares Outstanding | | | 2,143,351 | | | | 17,001,022 | |
| | |
Net Asset Value and Offering Price Per Share* | | | | | | | | |
| | |
(net assets ÷ shares of beneficial interest outstanding) | | $ | 9.20 | | | $ | 10.14 | |
| |
| Class I Shares | | | | | |
| | |
Net Assets | | $ | 145,788,451 | | | $ | 1,348,563,466 | |
| | |
Shares Outstanding | | | 14,429,793 | | | | 132,991,790 | |
| | |
Net Asset Value, Offering Price and Redemption Price Per Share | | | | | | | | |
| | |
(net assets ÷ shares of beneficial interest outstanding) | | $ | 10.10 | | | $ | 10.14 | |
On sales of $50,000 or more, the offering price of Class A shares is reduced.
| * | Redemption price per share is equal to the net asset value less any applicable contingent deferred sales charge. |
| | | | |
| | 24 | | See Notes to Financial Statements. |
Eaton Vance
Municipal Income Funds
September 30, 2019
Statements of Operations
| | | | | | | | |
| | | Year Ended September 30, 2019 | |
| Investment Income | | AMT-Free Fund | | | National Fund | |
| | |
Interest | | $ | 13,845,302 | | | $ | 111,382,897 | |
| | |
Total investment income | | $ | 13,845,302 | | | $ | 111,382,897 | |
| | |
| Expenses | | | | | | | | |
| | |
Investment adviser fee | | $ | 1,309,576 | | | $ | 9,416,330 | |
| | |
Distribution and service fees | | | | | | | | |
| | |
Class A | | | 363,149 | | | | 3,762,482 | |
| | |
Class B | | | — | | | | 9,072 | |
| | |
Class C | | | 242,121 | | | | 2,411,371 | |
| | |
Trustees’ fees and expenses | | | 16,396 | | | | 108,500 | |
| | |
Custodian fee | | | 83,970 | | | | 481,628 | |
| | |
Transfer and dividend disbursing agent fees | | | 85,825 | | | | 1,034,395 | |
| | |
Legal and accounting services | | | 67,239 | | | | 160,317 | |
| | |
Printing and postage | | | 18,114 | | | | 158,600 | |
| | |
Registration fees | | | 77,399 | | | | 166,264 | |
| | |
Interest expense and fees | | | 690,868 | | | | 3,377,821 | |
| | |
Miscellaneous | | | 53,103 | | | | 217,159 | |
| | |
Total expenses | | $ | 3,007,760 | | | $ | 21,303,939 | |
| | |
Net investment income | | $ | 10,837,542 | | | $ | 90,078,958 | |
| | |
| Realized and Unrealized Gain (Loss) | | | | | | | | |
| | |
Net realized gain (loss) — | | | | | | | | |
| | |
Investment transactions | | $ | 2,352,744 | | | $ | 29,949,034 | |
| | |
Financial futures contracts | | | (1,856,298 | ) | | | (7,481,052 | ) |
| | |
Net realized gain | | $ | 496,446 | | | $ | 22,467,982 | |
| | |
Change in unrealized appreciation (depreciation) — | | | | | | | | |
| | |
Investments | | $ | 13,090,320 | | | $ | 120,188,264 | |
| | |
Financial futures contracts | | | (604,959 | ) | | | (5,031,282 | ) |
| | |
Net change in unrealized appreciation (depreciation) | | $ | 12,485,361 | | | $ | 115,156,982 | |
| | |
Net realized and unrealized gain | | $ | 12,981,807 | | | $ | 137,624,964 | |
| | |
Net increase in net assets from operations | | $ | 23,819,349 | | | $ | 227,703,922 | |
| | | | |
| | 25 | | See Notes to Financial Statements. |
Eaton Vance
Municipal Income Funds
September 30, 2019
Statements of Changes in Net Assets
| | | | | | | | |
| | | Year Ended September 30, 2019 | |
| Increase (Decrease) in Net Assets | | AMT-Free Fund | | | National Fund | |
| | |
From operations — | | | | | | | | |
| | |
Net investment income | | $ | 10,837,542 | | | $ | 90,078,958 | |
| | |
Net realized gain | | | 496,446 | | | | 22,467,982 | |
| | |
Net change in unrealized appreciation (depreciation) | | | 12,485,361 | | | | 115,156,982 | |
| | |
Net increase in net assets from operations | | $ | 23,819,349 | | | $ | 227,703,922 | |
| | |
Distributions to shareholders — | | | | | | | | |
| | |
Class A | | $ | (5,125,467 | ) | | $ | (49,279,956 | ) |
| | |
Class B | | | — | | | | (23,586 | ) |
| | |
Class C | | | (675,044 | ) | | | (6,179,246 | ) |
| | |
Class I | | | (5,080,058 | ) | | | (34,955,784 | ) |
| | |
Total distributions to shareholders | | $ | (10,880,569 | ) | | $ | (90,438,572 | ) |
| | |
Transactions in shares of beneficial interest — | | | | | | | | |
| | |
Proceeds from sale of shares | | | | | | | | |
| | |
Class A | | $ | 17,120,080 | | | $ | 132,818,482 | |
| | |
Class B | | | — | | | | 15,727 | |
| | |
Class C | | | 3,443,300 | | | | 28,224,568 | |
| | |
Class I | | | 37,835,385 | | | | 787,247,276 | |
| | |
Net asset value of shares issued to shareholders in payment of distributions declared | | | | | | | | |
| | |
Class A | | | 4,583,249 | | | | 41,711,115 | |
| | |
Class B | | | — | | | | 20,042 | |
| | |
Class C | | | 558,182 | | | | 5,138,875 | |
| | |
Class I | | | 3,665,870 | | | | 29,299,489 | |
| | |
Cost of shares redeemed | | | | | | | | |
| | |
Class A | | | (27,446,522 | ) | | | (234,832,240 | ) |
| | |
Class B | | | — | | | | (416,016 | ) |
| | |
Class C | | | (7,032,598 | ) | | | (64,286,308 | ) |
| | |
Class I | | | (33,790,772 | ) | | | (276,494,610 | ) |
| | |
Net asset value of shares converted(1) | | | | | | | | |
| | |
Class A | | | 10,699,119 | | | | 170,804,852 | |
| | |
Class B | | | — | | | | (1,625,188 | ) |
| | |
Class C | | | (10,699,119 | ) | | | (169,179,664 | ) |
| | |
Net increase (decrease) in net assets from Fund share transactions | | $ | (1,063,826 | ) | | $ | 448,446,400 | |
| | |
Net increase in net assets | | $ | 11,874,954 | | | $ | 585,711,750 | |
|
| Net Assets | |
| | |
At beginning of year | | $ | 304,480,660 | | | $ | 2,540,675,304 | |
| | |
At end of year | | $ | 316,355,614 | | | $ | 3,126,387,054 | |
| (1) | Includes the conversion of Class B to Class A shares at the close of business on August 15, 2019 upon the termination of Class B. |
| | | | |
| | 26 | | See Notes to Financial Statements. |
Eaton Vance
Municipal Income Funds
September 30, 2019
Statements of Changes in Net Assets — continued
| | | | | | | | |
| | | Year Ended September 30, 2018 | |
| Increase (Decrease) in Net Assets | | AMT-Free Fund | | | National Fund | |
| | |
From operations — | | | | | | | | |
| | |
Net investment income | | $ | 11,986,740 | | | $ | 94,324,596 | |
| | |
Net realized gain | | | 1,771,405 | | | | 28,043,084 | |
| | |
Net change in unrealized appreciation (depreciation) | | | (11,101,128 | ) | | | (102,739,215 | ) |
| | |
Net increase in net assets from operations | | $ | 2,657,017 | | | $ | 19,628,465 | |
| | |
Distributions to shareholders — | | | | | | | | |
| | |
Class A | | $ | (5,434,533 | ) | | $ | (54,168,530 | ) |
| | |
Class B | | | — | | | | (114,881 | ) |
| | |
Class C | | | (1,052,649 | ) | | | (11,822,767 | ) |
| | |
Class I | | | (5,445,839 | ) | | | (29,156,764 | ) |
| | |
Total distributions to shareholders | | $ | (11,933,021 | ) | | $ | (95,262,942 | ) |
| | |
Transactions in shares of beneficial interest — | | | | | | | | |
| | |
Proceeds from sale of shares | | | | | | | | |
| | |
Class A | | $ | 12,660,956 | | | $ | 82,515,984 | |
| | |
Class B | | | — | | | | 9,791 | |
| | |
Class C | | | 1,973,015 | | | | 15,416,908 | |
| | |
Class I | | | 24,004,715 | | | | 222,154,004 | |
| | |
Net asset value of shares issued to shareholders in payment of distributions declared | | | | | | | | |
| | |
Class A | | | 4,918,893 | | | | 45,334,073 | |
| | |
Class B | | | — | | | | 100,314 | |
| | |
Class C | | | 896,217 | | | | 10,049,803 | |
| | |
Class I | | | 4,020,654 | | | | 24,393,212 | |
| | |
Cost of shares redeemed | | | | | | | | |
| | |
Class A | | | (29,294,897 | ) | | | (270,017,892 | ) |
| | |
Class B | | | — | | | | (1,148,393 | ) |
| | |
Class C | | | (8,383,713 | ) | | | (112,912,789 | ) |
| | |
Class I | | | (45,904,121 | ) | | | (245,761,233 | ) |
| | |
Net asset value of shares converted | | | | | | | | |
| | |
Class A | | | — | | | | 3,587,952 | |
| | |
Class B | | | — | | | | (3,587,952 | ) |
| | |
Net decrease in net assets from Fund share transactions | | $ | (35,108,281 | ) | | $ | (229,866,218 | ) |
| | |
Net decrease in net assets | | $ | (44,384,285 | ) | | $ | (305,500,695 | ) |
|
| Net Assets | |
| | |
At beginning of year | | $ | 348,864,945 | | | $ | 2,846,175,999 | |
| | |
At end of year | | $ | 304,480,660 | | | $ | 2,540,675,304 | |
| | | | |
| | 27 | | See Notes to Financial Statements. |
Eaton Vance
Municipal Income Funds
September 30, 2019
Financial Highlights
| | | | | | | | | | | | | | | | | | | | |
| | | AMT-Free Fund — Class A | |
| |
| | | Year Ended September 30, | |
| | | 2019 | | | 2018 | | | 2017 | | | 2016 | | | 2015 | |
| | | | | |
Net asset value — Beginning of year | | $ | 8.870 | | | $ | 9.130 | | | $ | 9.430 | | | $ | 9.210 | | | $ | 9.350 | |
| | | | | |
| Income (Loss) From Operations | | | | | | | | | | | | | | | | | | | | |
| | | | | |
Net investment income(1) | | $ | 0.317 | | | $ | 0.336 | | | $ | 0.351 | | | $ | 0.358 | | | $ | 0.374 | |
| | | | | |
Net realized and unrealized gain (loss) | | | 0.381 | | | | (0.262 | ) | | | (0.298 | ) | | | 0.218 | | | | (0.142 | ) |
| | | | | |
Total income from operations | | $ | 0.698 | | | $ | 0.074 | | | $ | 0.053 | | | $ | 0.576 | | | $ | 0.232 | |
| | | | | |
| Less Distributions | | | | | | | | | | | | | | | | | | | | |
| | | | | |
From net investment income | | $ | (0.318 | ) | | $ | (0.334 | ) | | $ | (0.353 | ) | | $ | (0.356 | ) | | $ | (0.372 | ) |
| | | | | |
Total distributions | | $ | (0.318 | ) | | $ | (0.334 | ) | | $ | (0.353 | ) | | $ | (0.356 | ) | | $ | (0.372 | ) |
| | | | | |
Net asset value — End of year | | $ | 9.250 | | | $ | 8.870 | | | $ | 9.130 | | | $ | 9.430 | | | $ | 9.210 | |
| | | | | |
Total Return(2) | | | 8.02 | % | | | 0.83 | % | | | 0.64 | % | | | 6.33 | % | | | 2.52 | % |
| | | | | |
| Ratios/Supplemental Data | | | | | | | | | | | | | | | | | | | | |
| | | | | |
Net assets, end of year (000’s omitted) | | $ | 150,853 | | | $ | 139,623 | | | $ | 155,589 | | | $ | 198,762 | | | $ | 194,227 | |
| | | | | |
Ratios (as a percentage of average daily net assets): | | | | | | | | | | | | | | | | | | | | |
| | | | | |
Expenses excluding interest and fees(3) | | | 0.81 | % | | | 0.81 | % | | | 0.82 | % | | | 0.81 | % | | | 0.82 | % |
| | | | | |
Interest and fee expense(4) | | | 0.23 | % | | | 0.24 | % | | | 0.16 | % | | | 0.10 | % | | | 0.08 | % |
| | | | | |
Total expenses(3) | | | 1.04 | % | | | 1.05 | % | | | 0.98 | % | | | 0.91 | % | | | 0.90 | % |
| | | | | |
Net investment income | | | 3.51 | % | | | 3.74 | % | | | 3.86 | % | | | 3.81 | % | | | 4.02 | % |
| | | | | |
Portfolio Turnover | | | 33 | % | | | 18 | % | | | 33 | % | | | 21 | % | | | 17 | % |
| (1) | Computed using average shares outstanding. |
| (2) | Returns are historical and are calculated by determining the percentage change in net asset value with all distributions reinvested and do not reflect the effect of sales charges. |
| (3) | Excludes the effect of custody fee credits, if any, of less than 0.005%. Effective September 1, 2015, custody fee credits, which were earned on cash deposit balances, were discontinued by the custodian. |
| (4) | Interest and fee expense relates to the liability for floating rate notes issued in conjunction with residual interest bond transactions (see Note 1H). |
| | | | |
| | 28 | | See Notes to Financial Statements. |
Eaton Vance
Municipal Income Funds
September 30, 2019
Financial Highlights — continued
| | | | | | | | | | | | | | | | | | | | |
| | | AMT-Free Fund — Class C | |
| |
| | | Year Ended September 30, | |
| | | 2019 | | | 2018 | | | 2017 | | | 2016 | | | 2015 | |
| | | | | |
Net asset value — Beginning of year | | $ | 8.820 | | | $ | 9.080 | | | $ | 9.380 | | | $ | 9.160 | | | $ | 9.300 | |
| | | | | |
| Income (Loss) From Operations | | | | | | | | | | | | | | | | | | | | |
| | | | | |
Net investment income(1) | | $ | 0.249 | | | $ | 0.267 | | | $ | 0.281 | | | $ | 0.286 | | | $ | 0.302 | |
| | | | | |
Net realized and unrealized gain (loss) | | | 0.380 | | | | (0.262 | ) | | | (0.298 | ) | | | 0.218 | | | | (0.142 | ) |
| | | | | |
Total income (loss) from operations | | $ | 0.629 | | | $ | 0.005 | | | $ | (0.017 | ) | | $ | 0.504 | | | $ | 0.160 | |
| | | | | |
| Less Distributions | | | | | | | | | | | | | | | | | | | | |
| | | | | |
From net investment income | | $ | (0.249 | ) | | $ | (0.265 | ) | | $ | (0.283 | ) | | $ | (0.284 | ) | | $ | (0.300 | ) |
| | | | | |
Total distributions | | $ | (0.249 | ) | | $ | (0.265 | ) | | $ | (0.283 | ) | | $ | (0.284 | ) | | $ | (0.300 | ) |
| | | | | |
Net asset value — End of year | | $ | 9.200 | | | $ | 8.820 | | | $ | 9.080 | | | $ | 9.380 | | | $ | 9.160 | |
| | | | | |
Total Return(2) | | | 7.24 | % | | | 0.06 | % | | | (0.12 | )% | | | 5.56 | % | | | 1.75 | % |
| | | | | |
| Ratios/Supplemental Data | | | | | | | | | | | | | | | | | | | | |
| | | | | |
Net assets, end of year (000’s omitted) | | $ | 19,715 | | | $ | 32,545 | | | $ | 39,099 | | | $ | 45,606 | | | $ | 41,903 | |
| | | | | |
Ratios (as a percentage of average daily net assets): | | | | | | | | | | | | | | | | | | | | |
| | | | | |
Expenses excluding interest and fees(3) | | | 1.56 | % | | | 1.56 | % | | | 1.57 | % | | | 1.56 | % | | | 1.57 | % |
| | | | | |
Interest and fee expense(4) | | | 0.23 | % | | | 0.24 | % | | | 0.16 | % | | | 0.10 | % | | | 0.08 | % |
| | | | | |
Total expenses(3) | | | 1.79 | % | | | 1.80 | % | | | 1.73 | % | | | 1.66 | % | | | 1.65 | % |
| | | | | |
Net investment income | | | 2.78 | % | | | 2.99 | % | | | 3.11 | % | | | 3.06 | % | | | 3.27 | % |
| | | | | |
Portfolio Turnover | | | 33 | % | | | 18 | % | | | 33 | % | | | 21 | % | | | 17 | % |
| (1) | Computed using average shares outstanding. |
| (2) | Returns are historical and are calculated by determining the percentage change in net asset value with all distributions reinvested and do not reflect the effect of sales charges. |
| (3) | Excludes the effect of custody fee credits, if any, of less than 0.005%. Effective September 1, 2015, custody fee credits, which were earned on cash deposit balances, were discontinued by the custodian. |
| (4) | Interest and fee expense relates to the liability for floating rate notes issued in conjunction with residual interest bond transactions (see Note 1H). |
| | | | |
| | 29 | | See Notes to Financial Statements. |
Eaton Vance
Municipal Income Funds
September 30, 2019
Financial Highlights — continued
| | | | | | | | | | | | | | | | | | | | |
| | | AMT-Free Fund — Class I | |
| |
| | | Year Ended September 30, | |
| | | 2019 | | | 2018 | | | 2017 | | | 2016 | | | 2015 | |
| | | | | |
Net asset value — Beginning of year | | $ | 9.680 | | | $ | 9.970 | | | $ | 10.300 | | | $ | 10.060 | | | $ | 10.210 | |
| | | | | |
| Income (Loss) From Operations | | | | | | | | | | | | | | | | | | | | |
| | | | | |
Net investment income(1) | | $ | 0.370 | | | $ | 0.391 | | | $ | 0.407 | | | $ | 0.415 | | | $ | 0.434 | |
| | | | | |
Net realized and unrealized gain (loss) | | | 0.422 | | | | (0.292 | ) | | | (0.327 | ) | | | 0.240 | | | | (0.152 | ) |
| | | | | |
Total income from operations | | $ | 0.792 | | | $ | 0.099 | | | $ | 0.080 | | | $ | 0.655 | | | $ | 0.282 | |
| | | | | |
| Less Distributions | | | | | | | | | | | | | | | | | | | | |
| | | | | |
From net investment income | | $ | (0.372 | ) | | $ | (0.389 | ) | | $ | (0.410 | ) | | $ | (0.415 | ) | | $ | (0.432 | ) |
| | | | | |
Total distributions | | $ | (0.372 | ) | | $ | (0.389 | ) | | $ | (0.410 | ) | | $ | (0.415 | ) | | $ | (0.432 | ) |
| | | | | |
Net asset value — End of year | | $ | 10.100 | | | $ | 9.680 | | | $ | 9.970 | | | $ | 10.300 | | | $ | 10.060 | |
| | | | | |
Total Return(2) | | | 8.34 | % | | | 1.02 | % | | | 0.87 | % | | | 6.60 | % | | | 2.70 | % |
| | | | | |
| Ratios/Supplemental Data | | | | | | | | | | | | | | | | | | | | |
| | | | | |
Net assets, end of year (000’s omitted) | | $ | 145,788 | | | $ | 132,313 | | | $ | 154,177 | | | $ | 154,458 | | | $ | 109,937 | |
| | | | | |
Ratios (as a percentage of average daily net assets): | | | | | | | | | | | | | | | | | | | | |
| | | | | |
Expenses excluding interest and fees(3) | | | 0.56 | % | | | 0.56 | % | | | 0.57 | % | | | 0.56 | % | | | 0.57 | % |
| | | | | |
Interest and fee expense(4) | | | 0.23 | % | | | 0.24 | % | | | 0.16 | % | | | 0.10 | % | | | 0.08 | % |
| | | | | |
Total expenses(3) | | | 0.79 | % | | | 0.80 | % | | | 0.73 | % | | | 0.66 | % | | | 0.65 | % |
| | | | | |
Net investment income | | | 3.76 | % | | | 3.98 | % | | | 4.09 | % | | | 4.04 | % | | | 4.27 | % |
| | | | | |
Portfolio Turnover | | | 33 | % | | | 18 | % | | | 33 | % | | | 21 | % | | | 17 | % |
| (1) | Computed using average shares outstanding. |
| (2) | Returns are historical and are calculated by determining the percentage change in net asset value with all distributions reinvested. |
| (3) | Excludes the effect of custody fee credits, if any, of less than 0.005%. Effective September 1, 2015, custody fee credits, which were earned on cash deposit balances, were discontinued by the custodian. |
| (4) | Interest and fee expense relates to the liability for floating rate notes issued in conjunction with residual interest bond transactions (see Note 1H). |
| | | | |
| | 30 | | See Notes to Financial Statements. |
Eaton Vance
Municipal Income Funds
September 30, 2019
Financial Highlights — continued
| | | | | | | | | | | | | | | | | | | | |
| | | National Fund — Class A | |
| |
| | | Year Ended September 30, | |
| | | 2019 | | | 2018 | | | 2017 | | | 2016 | | | 2015 | |
| | | | | |
Net asset value — Beginning of year | | $ | 9.650 | | | $ | 9.930 | | | $ | 10.170 | | | $ | 9.810 | | | $ | 9.870 | |
| | | | | |
| Income (Loss) From Operations | | | | | | | | | | | | | | | | | | | | |
| | | | | |
Net investment income(1) | | $ | 0.322 | | | $ | 0.350 | | | $ | 0.366 | | | $ | 0.385 | | | $ | 0.389 | |
| | | | | |
Net realized and unrealized gain (loss) | | | 0.491 | | | | (0.277 | ) | | | (0.242 | ) | | | 0.357 | | | | (0.064 | ) |
| | | | | |
Total income from operations | | $ | 0.813 | | | $ | 0.073 | | | $ | 0.124 | | | $ | 0.742 | | | $ | 0.325 | |
| | | | | |
| Less Distributions | | | | | | | | | | | | | | | | | | | | |
| | | | | |
From net investment income | | $ | (0.323 | ) | | $ | (0.353 | ) | | $ | (0.364 | ) | | $ | (0.382 | ) | | $ | (0.385 | ) |
| | | | | |
Total distributions | | $ | (0.323 | ) | | $ | (0.353 | ) | | $ | (0.364 | ) | | $ | (0.382 | ) | | $ | (0.385 | ) |
| | | | | |
Net asset value — End of year | | $ | 10.140 | | | $ | 9.650 | | | $ | 9.930 | | | $ | 10.170 | | | $ | 9.810 | |
| | | | | |
Total Return(2) | | | 8.57 | % | | | 0.76 | % | | | 1.31 | % | | | 7.68 | % | | | 3.35 | % |
| | | | | |
| Ratios/Supplemental Data | | | | | | | | | | | | | | | | | | | | |
| | | | | |
Net assets, end of year (000’s omitted) | | $ | 1,605,407 | | | $ | 1,419,239 | | | $ | 1,600,127 | | | $ | 1,857,375 | | | $ | 1,899,324 | |
| | | | | |
Ratios (as a percentage of average daily net assets): | | | | | | | | | | | | | | | | | | | | |
| | | | | |
Expenses excluding interest and fees(3) | | | 0.68 | % | | | 0.69 | % | | | 0.68 | % | | | 0.67 | % | | | 0.67 | % |
| | | | | |
Interest and fee expense(4) | | | 0.12 | % | | | 0.19 | % | | | 0.16 | % | | | 0.12 | % | | | 0.09 | % |
| | | | | |
Total expenses(3) | | | 0.80 | % | | | 0.88 | % | | | 0.84 | % | | | 0.79 | % | | | 0.76 | % |
| | | | | |
Net investment income | | | 3.26 | % | | | 3.58 | % | | | 3.71 | % | | | 3.83 | % | | | 3.94 | % |
| | | | | |
Portfolio Turnover | | | 89 | % | | | 67 | % | | | 70 | % | | | 71 | % | | | 57 | % |
| (1) | Computed using average shares outstanding. |
| (2) | Returns are historical and are calculated by determining the percentage change in net asset value with all distributions reinvested and do not reflect the effect of sales charges. |
| (3) | Excludes the effect of custody fee credits, if any, of less than 0.005%. Effective September 1, 2015, custody fee credits, which were earned on cash deposit balances, were discontinued by the custodian. |
| (4) | Interest and fee expense relates to the liability for floating rate notes issued in conjunction with residual interest bond transactions (see Note 1H). |
| | | | |
| | 31 | | See Notes to Financial Statements. |
Eaton Vance
Municipal Income Funds
September 30, 2019
Financial Highlights — continued
| | | | | | | | | | | | | | | | | | | | |
| | | National Fund — Class C | |
| |
| | | Year Ended September 30, | |
| | | 2019 | | | 2018 | | | 2017 | | | 2016 | | | 2015 | |
| | | | | |
Net asset value — Beginning of year | | $ | 9.650 | | | $ | 9.930 | | | $ | 10.170 | | | $ | 9.810 | | | $ | 9.870 | |
| | | | | |
| Income (Loss) From Operations | | | | | | | | | | | | | | | | | | | | |
| | | | | |
Net investment income(1) | | $ | 0.252 | | | $ | 0.276 | | | $ | 0.292 | | | $ | 0.310 | | | $ | 0.315 | |
| | | | | |
Net realized and unrealized gain (loss) | | | 0.488 | | | | (0.276 | ) | | | (0.242 | ) | | | 0.357 | | | | (0.064 | ) |
| | | | | |
Total income from operations | | $ | 0.740 | | | $ | — | | | $ | 0.050 | | | $ | 0.667 | | | $ | 0.251 | |
| | | | | |
| Less Distributions | | | | | | | | | | | | | | | | | | | | |
| | | | | |
From net investment income | | $ | (0.250 | ) | | $ | (0.280 | ) | | $ | (0.290 | ) | | $ | (0.307 | ) | | $ | (0.311 | ) |
| | | | | |
Total distributions | | $ | (0.250 | ) | | $ | (0.280 | ) | | $ | (0.290 | ) | | $ | (0.307 | ) | | $ | (0.311 | ) |
| | | | | |
Net asset value — End of year | | $ | 10.140 | | | $ | 9.650 | | | $ | 9.930 | | | $ | 10.170 | | | $ | 9.810 | |
| | | | | |
Total Return(2) | | | 7.77 | % | | | 0.01 | % | | | 0.56 | % | | | 6.88 | % | | | 2.58 | % |
| | | | | |
| Ratios/Supplemental Data | | | | | | | | | | | | | | | | | | | | |
| | | | | |
Net assets, end of year (000’s omitted) | | $ | 172,417 | | | $ | 363,026 | | | $ | 462,269 | | | $ | 576,664 | | | $ | 585,346 | |
| | | | | |
Ratios (as a percentage of average daily net assets): | | | | | | | | | | | | | | | | | | | | |
| | | | | |
Expenses excluding interest and fees(3) | | | 1.43 | % | | | 1.44 | % | | | 1.43 | % | | | 1.42 | % | | | 1.42 | % |
| | | | | |
Interest and fee expense(4) | | | 0.12 | % | | | 0.19 | % | | | 0.16 | % | | | 0.12 | % | | | 0.09 | % |
| | | | | |
Total expenses(3) | | | 1.55 | % | | | 1.63 | % | | | 1.59 | % | | | 1.54 | % | | | 1.51 | % |
| | | | | |
Net investment income | | | 2.57 | % | | | 2.83 | % | | | 2.96 | % | | | 3.08 | % | | | 3.19 | % |
| | | | | |
Portfolio Turnover | | | 89 | % | | | 67 | % | | | 70 | % | | | 71 | % | | | 57 | % |
| (1) | Computed using average shares outstanding. |
| (2) | Returns are historical and are calculated by determining the percentage change in net asset value with all distributions reinvested and do not reflect the effect of sales charges. |
| (3) | Excludes the effect of custody fee credits, if any, of less than 0.005%. Effective September 1, 2015, custody fee credits, which were earned on cash deposit balances, were discontinued by the custodian. |
| (4) | Interest and fee expense relates to the liability for floating rate notes issued in conjunction with residual interest bond transactions (see Note 1H). |
| | | | |
| | 32 | | See Notes to Financial Statements. |
Eaton Vance
Municipal Income Funds
September 30, 2019
Financial Highlights — continued
| | | | | | | | | | | | | | | | | | | | |
| | | National Fund — Class I | |
| |
| | | Year Ended September 30, | |
| | | 2019 | | | 2018 | | | 2017 | | | 2016 | | | 2015 | |
| | | | | |
Net asset value — Beginning of year | | $ | 9.650 | | | $ | 9.930 | | | $ | 10.170 | | | $ | 9.810 | | | $ | 9.870 | |
| | | | | |
| Income (Loss) From Operations | | | | | | | | | | | | | | | | | | | | |
| | | | | |
Net investment income(1) | | $ | 0.341 | | | $ | 0.374 | | | $ | 0.390 | | | $ | 0.410 | | | $ | 0.413 | |
| | | | | |
Net realized and unrealized gain (loss) | | | 0.495 | | | | (0.277 | ) | | | (0.241 | ) | | | 0.357 | | | | (0.063 | ) |
| | | | | |
Total income from operations | | $ | 0.836 | | | $ | 0.097 | | | $ | 0.149 | | | $ | 0.767 | | | $ | 0.350 | |
| | | | | |
| Less Distributions | | | | | | | | | | | | | | | | | | | | |
| | | | | |
From net investment income | | $ | (0.346 | ) | | $ | (0.377 | ) | | $ | (0.389 | ) | | $ | (0.407 | ) | | $ | (0.410 | ) |
| | | | | |
Total distributions | | $ | (0.346 | ) | | $ | (0.377 | ) | | $ | (0.389 | ) | | $ | (0.407 | ) | | $ | (0.410 | ) |
| | | | | |
Net asset value — End of year | | $ | 10.140 | | | $ | 9.650 | | | $ | 9.930 | | | $ | 10.170 | | | $ | 9.810 | |
| | | | | |
Total Return(2) | | | 8.83 | % | | | 1.01 | % | | | 1.56 | % | | | 7.94 | % | | | 3.50 | % |
| | | | | |
| Ratios/Supplemental Data | | | | | | | | | | | | | | | | | | | | |
| | | | | |
Net assets, end of year (000’s omitted) | | $ | 1,348,563 | | | $ | 756,446 | | | $ | 777,063 | | | $ | 701,153 | | | $ | 674,696 | |
| | | | | |
Ratios (as a percentage of average daily net assets): | | | | | | | | | | | | | | | | | | | | |
| | | | | |
Expenses excluding interest and fees(3) | | | 0.43 | % | | | 0.44 | % | | | 0.43 | % | | | 0.42 | % | | | 0.42 | % |
| | | | | |
Interest and fee expense(4) | | | 0.12 | % | | | 0.19 | % | | | 0.16 | % | | | 0.12 | % | | | 0.09 | % |
| | | | | |
Total expenses(3) | | | 0.55 | % | | | 0.63 | % | | | 0.59 | % | | | 0.54 | % | | | 0.51 | % |
| | | | | |
Net investment income | | | 3.45 | % | | | 3.83 | % | | | 3.95 | % | | | 4.09 | % | | | 4.19 | % |
| | | | | |
Portfolio Turnover | | | 89 | % | | | 67 | % | | | 70 | % | | | 71 | % | | | 57 | % |
| (1) | Computed using average shares outstanding. |
| (2) | Returns are historical and are calculated by determining the percentage change in net asset value with all distributions reinvested. |
| (3) | Excludes the effect of custody fee credits, if any, of less than 0.005%. Effective September 1, 2015, custody fee credits, which were earned on cash deposit balances, were discontinued by the custodian. |
| (4) | Interest and fee expense relates to the liability for floating rate notes issued in conjunction with residual interest bond transactions (see Note 1H). |
| | | | |
| | 33 | | See Notes to Financial Statements. |
Eaton Vance
Municipal Income Funds
September 30, 2019
Notes to Financial Statements
1 Significant Accounting Policies
Eaton Vance AMT-Free Municipal Income Fund (AMT-Free Fund) and Eaton Vance National Municipal Income Fund (National Fund) (each individually referred to as the Fund, and collectively, the Funds) are a diversified series of Eaton Vance Mutual Funds Trust and Eaton Vance Municipals Trust, respectively (collectively, the Trusts). The Trusts are Massachusetts business trusts registered under the Investment Company Act of 1940, as amended (the 1940 Act), as open-end management investment companies. The Funds’ investment objective is to provide current income exempt from regular federal income tax. The Funds offer three classes of shares. Class A shares are generally sold subject to a sales charge imposed at time of purchase. Class C shares are sold at net asset value and are generally subject to a contingent deferred sales charge (see Note 5). Effective January 25, 2019, Class C shares generally automatically convert to Class A shares ten years after their purchase as described in the Funds’ prospectus. Class I shares are sold at net asset value and are not subject to a sales charge. The National Fund previously offered Class B shares, which beginning January 1, 2012, were only available for purchase upon exchange from another Eaton Vance fund or through reinvestment of distributions. Class B shares of National Fund automatically converted to Class A shares eight years after their purchase as described in National Fund’s prospectus. At the close of business on August 15, 2019, Class B shares of National Fund were converted into Class A shares and Class B was terminated. Each class represents a pro-rata interest in the Fund, but votes separately on class-specific matters and (as noted below) is subject to different expenses. Realized and unrealized gains and losses are allocated daily to each class of shares based on the relative net assets of each class to the total net assets of the Fund. Net investment income, other than class-specific expenses, is allocated daily to each class of shares based upon the ratio of the value of each class’s paid shares to the total value of all paid shares. Each class of shares differs in its distribution plan and certain other class-specific expenses.
The following is a summary of significant accounting policies of the Funds. The policies are in conformity with accounting principles generally accepted in the United States of America (U.S. GAAP). Each Fund is an investment company and follows accounting and reporting guidance in the Financial Accounting Standards Board (FASB) Accounting Standards Codification Topic 946.
A Investment Valuation — The following methodologies are used to determine the market value or fair value of investments.
Debt Obligations. Debt obligations are generally valued on the basis of valuations provided by third party pricing services, as derived from such services’ pricing models. Inputs to the models may include, but are not limited to, reported trades, executable bid and ask prices, broker/dealer quotations, prices or yields of securities with similar characteristics, interest rates, anticipated prepayments, benchmark curves or information pertaining to the issuer, as well as industry and economic events. The pricing services may use a matrix approach, which considers information regarding securities with similar characteristics to determine the valuation for a security. Short-term debt obligations purchased with a remaining maturity of sixty days or less for which a valuation from a third party pricing service is not readily available may be valued at amortized cost, which approximates fair value.
Derivatives. Financial futures contracts are valued at the closing settlement price established by the board of trade or exchange on which they are traded.
Fair Valuation. Investments for which valuations or market quotations are not readily available or are deemed unreliable are valued at fair value using methods determined in good faith by or at the direction of the Trustees of a Fund in a manner that most fairly reflects the security’s “fair value”, which is the amount that a Fund might reasonably expect to receive for the security upon its current sale in the ordinary course. Each such determination is based on a consideration of relevant factors, which are likely to vary from one pricing context to another. These factors may include, but are not limited to, the type of security, the existence of any contractual restrictions on the security’s disposition, the price and extent of public trading in similar securities of the issuer or of comparable companies or entities, quotations or relevant information obtained from broker/dealers or other market participants, information obtained from the issuer, analysts, and/or the appropriate stock exchange (for exchange-traded securities), an analysis of the company’s or entity’s financial statements, and an evaluation of the forces that influence the issuer and the market(s) in which the security is purchased and sold.
B Investment Transactions and Related Income — Investment transactions for financial statement purposes are accounted for on a trade date basis. Realized gains and losses on investments sold are determined on the basis of identified cost. Interest income is recorded on the basis of interest accrued, adjusted for amortization of premium or accretion of discount.
C Federal Taxes — Each Fund’s policy is to comply with the provisions of the Internal Revenue Code applicable to regulated investment companies and to distribute to shareholders each year substantially all of its taxable, if any, and tax-exempt net investment income, and all or substantially all of its net realized capital gains. Accordingly, no provision for federal income or excise tax is necessary. Each Fund intends to satisfy conditions which will enable it to designate distributions from the interest income generated by its investments in non-taxable municipal securities, which are exempt from regular federal income tax when received by each Fund, as exempt-interest dividends. For National Fund, the portion of such interest, if any, earned on private activity bonds issued after August 7, 1986, may be considered a tax preference item to shareholders.
As of September 30, 2019, the Funds had no uncertain tax positions that would require financial statement recognition, de-recognition, or disclosure. Each Fund files a U.S. federal income tax return annually after its fiscal year-end, which is subject to examination by the Internal Revenue Service for a period of three years from the date of filing.
D Expenses — The majority of expenses of the Trusts are directly identifiable to an individual fund. Expenses which are not readily identifiable to a specific fund are allocated taking into consideration, among other things, the nature and type of expense and the relative size of the funds.
Eaton Vance
Municipal Income Funds
September 30, 2019
Notes to Financial Statements — continued
E Legal Fees — Legal fees and other related expenses incurred as part of negotiations of the terms and requirement of capital infusions, or that are expected to result in the restructuring of, or a plan of reorganization for, an investment are recorded as realized losses. Ongoing expenditures to protect or enhance an investment are treated as operating expenses.
F Use of Estimates — The preparation of the financial statements in conformity with U.S. GAAP requires management to make estimates and assumptions that affect the reported amounts of assets and liabilities at the date of the financial statements and the reported amounts of income and expense during the reporting period. Actual results could differ from those estimates.
G Indemnifications — Under each Trust’s organizational documents, its officers and Trustees may be indemnified against certain liabilities and expenses arising out of the performance of their duties to the Funds. Under Massachusetts law, if certain conditions prevail, shareholders of a Massachusetts business trust (such as a Trust) could be deemed to have personal liability for the obligations of the Trust. However, each Trust’s Declaration of Trust contains an express disclaimer of liability on the part of Fund shareholders and the By-laws provide that the Trust shall assume, upon request by the shareholder, the defense on behalf of any Fund shareholders. Moreover, the By-laws also provide for indemnification out of Fund property of any shareholder held personally liable solely by reason of being or having been a shareholder for all loss or expense arising from such liability. Additionally, in the normal course of business, each Fund enters into agreements with service providers that may contain indemnification clauses. Each Fund’s maximum exposure under these arrangements is unknown as this would involve future claims that may be made against each Fund that have not yet occurred.
H Floating Rate Notes Issued in Conjunction with Securities Held — The Funds may invest in residual interest bonds, also referred to as inverse floating rate securities, whereby a Fund may sell a variable or fixed rate bond for cash to a Special-Purpose Vehicle (the SPV), (which is generally organized as a trust), while at the same time, buying a residual interest in the assets and cash flows of the SPV. The bond is deposited into the SPV with the same CUSIP number as the bond sold to the SPV by the Fund, and which may have been, but is not required to be, the bond purchased from the Fund (the Bond). The SPV also issues floating rate notes (Floating Rate Notes) which are sold to third-parties. The residual interest bond held by a Fund gives the Fund the right (1) to cause the holders of the Floating Rate Notes to generally tender their notes at par, and (2) to have the Bond held by the SPV transferred to the Fund, thereby terminating the SPV. Should the Fund exercise such right, it would generally pay the SPV the par amount due on the Floating Rate Notes and exchange the residual interest bond for the underlying Bond. Pursuant to generally accepted accounting principles for transfers and servicing of financial assets and extinguishment of liabilities, the Funds account for the transaction described above as a secured borrowing by including the Bond in their Portfolio of Investments and the Floating Rate Notes as a liability under the caption “Payable for floating rate notes issued” in their Statement of Assets and Liabilities. The Floating Rate Notes have interest rates that generally reset weekly and their holders have the option to tender their notes to the SPV for redemption at par at each reset date. Accordingly, the fair value of the payable for floating rate notes issued approximates its carrying value. If measured at fair value, the payable for floating rate notes would have been considered as Level 2 in the fair value hierarchy (see Note 10) at September 30, 2019. Interest expense related to a Fund’s liability with respect to Floating Rate Notes is recorded as incurred. The SPV may be terminated by the Fund, as noted above, or by the occurrence of certain termination events as defined in the trust agreement, such as a downgrade in the credit quality of the underlying Bond, bankruptcy of or payment failure by the issuer of the underlying Bond, the inability to remarket Floating Rate Notes that have been tendered due to insufficient buyers in the market, or the failure by the SPV to obtain renewal of the liquidity agreement under which liquidity support is provided for the Floating Rate Notes up to one year. At September 30, 2019, the amounts of the Funds’ Floating Rate Notes and related interest rates and collateral were as follows:
| | | | | | | | |
| | | AMT-Free Fund | | | National Fund | |
| | |
Floating Rate Notes Outstanding | | $ | 29,827,964 | | | $ | 138,724,161 | |
| | |
Interest Rate or Range of Interest Rates (%) | | | 1.61 - 1.63 | | | | 1.56 - 1.66 | |
| | |
Collateral for Floating Rate Notes Outstanding | | $ | 47,258,557 | | | $ | 197,210,773 | |
For the year ended September 30, 2019, the Funds’ average settled Floating Rate Notes outstanding and the average interest rate including fees were as follows:
| | | | | | | | |
| | | AMT-Free
Fund | | | National Fund | |
| | |
Average Floating Rate Notes Outstanding | | $ | 30,661,301 | | | $ | 151,521,918 | |
| | |
Average Interest Rate | | | 2.25 | % | | | 2.23 | % |
In certain circumstances, the Funds may enter into shortfall and forbearance agreements with brokers by which a Fund agrees to reimburse the broker for the difference between the liquidation value of the Bond held by the SPV and the liquidation value of the Floating Rate Notes, as well as any shortfalls in interest cash flows. The Funds had no shortfalls as of September 30, 2019.
Eaton Vance
Municipal Income Funds
September 30, 2019
Notes to Financial Statements — continued
The Funds may also purchase residual interest bonds in a secondary market transaction without first owning the underlying bond. Such transactions are not required to be treated as secured borrowings. Shortfall agreements, if any, related to residual interest bonds purchased in a secondary market transaction are disclosed in the Portfolio of Investments.
The Funds’ investment policies and restrictions expressly permit investments in residual interest bonds. Such bonds typically offer the potential for yields exceeding the yields available on fixed rate bonds with comparable credit quality and maturity. These securities tend to underperform the market for fixed rate bonds in a rising long-term interest rate environment, but tend to outperform the market for fixed rate bonds when long-term interest rates decline. The value and income of residual interest bonds are generally more volatile than that of a fixed rate bond. The Funds’ investment policies do not allow the Funds to borrow money except as permitted by the 1940 Act. Management believes that the Funds’ restrictions on borrowing money and issuing senior securities (other than as specifically permitted) do not apply to Floating Rate Notes issued by the SPV and included as a liability in the Funds’ Statement of Assets and Liabilities. As secured indebtedness issued by an SPV, Floating Rate Notes are distinct from the borrowings and senior securities to which the Funds’ restrictions apply. Residual interest bonds held by the Funds are securities exempt from registration under Rule 144A of the Securities Act of 1933.
I Financial Futures Contracts — Upon entering into a financial futures contract, a Fund is required to deposit with the broker, either in cash or securities, an amount equal to a certain percentage of the contract amount (initial margin). Subsequent payments, known as variation margin, are made or received by the Fund each business day, depending on the daily fluctuations in the value of the underlying security, and are recorded as unrealized gains or losses by the Fund. Gains (losses) are realized upon the expiration or closing of the financial futures contracts. Should market conditions change unexpectedly, the Fund may not achieve the anticipated benefits of the financial futures contracts and may realize a loss. Futures contracts have minimal counterparty risk as they are exchange traded and the clearinghouse for the exchange is substituted as the counterparty, guaranteeing counterparty performance.
J When-Issued Securities and Delayed Delivery Transactions — The Funds may purchase or sell securities on a delayed delivery or when-issued basis. Payment and delivery may take place after the customary settlement period for that security. At the time the transaction is negotiated, the price of the security that will be delivered is fixed. The Funds maintain cash and/or security positions for these commitments such that sufficient liquid assets will be available to make payments upon settlement. Securities purchased on a delayed delivery or when-issued basis are marked-to-market daily and begin earning interest on settlement date. Losses may arise due to changes in the market value of the underlying securities or if the counterparty does not perform under the contract.
2 Distributions to Shareholders and Income Tax Information
The net investment income of each Fund is determined daily and substantially all of the net investment income so determined is declared as a dividend to shareholders of record at the time of declaration. Distributions are declared separately for each class of shares. Distributions are paid monthly. Distributions of realized capital gains are made at least annually. Shareholders may reinvest income and capital gain distributions in additional shares of the same class of a Fund at the net asset value as of the reinvestment date or, at the election of the shareholder, receive distributions in cash. Distributions to shareholders are determined in accordance with income tax regulations, which may differ from U.S. GAAP. As required by U.S. GAAP, only distributions in excess of tax basis earnings and profits are reported in the financial statements as a return of capital. Permanent differences between book and tax accounting relating to distributions are reclassified to paid-in capital. For tax purposes, distributions from short-term capital gains are considered to be from ordinary income.
The tax character of distributions declared for the years ended September 30, 2019 and September 30, 2018 was as follows:
| | | | | | | | | | | | | | | | |
| | | AMT-Free Fund | | | National Fund | |
| | | Year Ended September 30, | | | Year Ended September 30, | |
| | | 2019 | | | 2018 | | | 2019 | | | 2018 | |
| | | | |
Tax-exempt income | | $ | 10,804,193 | | | $ | 11,929,426 | | | $ | 85,494,039 | | | $ | 88,289,992 | |
| | | | |
Ordinary income | | $ | 76,376 | | | $ | 3,595 | | | $ | 4,944,533 | | | $ | 6,972,950 | |
During the year ended September 30, 2019, the following amounts were reclassified due to expired capital loss carryforwards:
| | | | | | | | |
| | | AMT-Free
Fund | | | National Fund | |
| | |
Change in: | | | | | | | | |
| | |
Paid-in capital | | $ | — | | | $ | (56,374,583 | ) |
| | |
Distributable earnings | | $ | — | | | $ | 56,374,583 | |
These reclassifications had no effect on the net assets or net asset value per share of the Funds.
Eaton Vance
Municipal Income Funds
September 30, 2019
Notes to Financial Statements — continued
As of September 30, 2019, the components of distributable earnings (accumulated loss) on a tax basis were as follows:
| | | | | | | | |
| | | AMT-Free Fund | | | National Fund | |
| | |
Undistributed tax-exempt income | | $ | 1,697,354 | | | $ | 11,531,246 | |
| | |
Deferred capital losses | | $ | (27,887,563 | ) | | $ | (229,730,887 | ) |
| | |
Net unrealized appreciation | | $ | 30,044,768 | | | $ | 232,972,872 | |
| | |
Distributions payable | | $ | (170,796 | ) | | $ | (1,220,216 | ) |
At September 30, 2019, the following Funds, for federal income tax purposes, had deferred capital losses which would reduce the respective Fund’s taxable income arising from future net realized gains on investment transactions, if any, to the extent permitted by the Internal Revenue Code, and thus would reduce the amount of distributions to shareholders, which would otherwise be necessary to relieve the Funds of any liability for federal income or excise tax. The deferred capital losses are treated as arising on the first day of a Fund’s next taxable year, retaining the same short-term or long-term character as when originally deferred. The amounts of the deferred capital losses are as follows:
| | | | | | | | |
| | | AMT-Free Fund | | | National Fund | |
| | |
Deferred capital losses: | | | | | | | | |
| | |
Short-term | | $ | 14,481,444 | | | $ | 135,794,015 | |
| | |
Long-term | | $ | 13,406,119 | | | $ | 93,936,872 | |
The cost and unrealized appreciation (depreciation) of investments of each Fund at September 30, 2019, as determined on a federal income tax basis, were as follows:
| | | | | | | | |
| | | AMT-Free Fund | | | National Fund | |
| | |
Aggregate cost | | $ | 282,852,758 | | | $ | 2,872,590,927 | |
| | |
Gross unrealized appreciation | | $ | 31,061,569 | | | $ | 247,892,356 | |
| | |
Gross unrealized depreciation | | | (1,016,801 | ) | | | (14,919,484 | ) |
| | |
Net unrealized appreciation | | $ | 30,044,768 | | | $ | 232,972,872 | |
3 Investment Adviser Fee and Other Transactions with Affiliates
The investment adviser fee is earned by Eaton Vance Management (EVM) for AMT-Free Fund and Boston Management and Research (BMR), a subsidiary of EVM, for National Fund as compensation for management and investment advisory services rendered to each Fund. The fee is based upon a percentage of average daily net assets plus a percentage of gross income (i.e., income other than gains from the sale of securities) as presented in the following table and is payable monthly.
| | | | | | | | |
| Daily Net Assets | | Annual Asset
Rate | | | Daily Income
Rate | |
| | |
Up to $500 million | | | 0.300 | % | | | 3.00 | % |
| | |
$500 million up to $1 billion | | | 0.275 | | | | 2.75 | |
| | |
$1 billion up to $1.5 billion | | | 0.250 | | | | 2.50 | |
| | |
$1.5 billion up to $2 billion | | | 0.225 | | | | 2.25 | |
| | |
$2 billion up to $3 billion | | | 0.200 | | | | 2.00 | |
| | |
$3 billion and over | | | 0.175 | | | | 1.75 | |
Eaton Vance
Municipal Income Funds
September 30, 2019
Notes to Financial Statements — continued
For the year ended September 30, 2019, investment adviser fees incurred by the Funds and the effective annual rates, as a percentage of average daily net assets, were as follows:
| | | | | | | | |
| | | AMT-Free
Fund | | | National Fund | |
| | |
Investment Adviser Fee | | $ | 1,309,576 | | | $ | 9,416,330 | |
| | |
Effective Annual Rate | | | 0.43 | % | | | 0.34 | % |
EVM serves as the administrator of each Fund, but receives no compensation. EVM provides sub-transfer agency and related services to the Funds pursuant to a Sub-Transfer Agency Support Services Agreement. Eaton Vance Distributors, Inc. (EVD), an affiliate of EVM and the Funds’ principal underwriter, received a portion of the sales charge on sales of Class A shares of the Funds. EVD also received distribution and service fees from Class A, Class B and Class C shares (see Note 4) and contingent deferred sales charges (see Note 5). Sub-transfer agent fees earned by EVM, which are included in transfer and dividend disbursing agent fees on the Statements of Operations, and Class A sales charges that the Funds were informed were received by EVD for the year ended September 30, 2019 were as follows:
| | | | | | | | |
| | | AMT-Free Fund | | | National Fund | |
| | |
EVM’s Sub-Transfer Agent Fees | | $ | 12,148 | | | $ | 136,199 | |
| | |
EVD’s Class A Sales Charges | | $ | 12,729 | | | $ | 165,827 | |
Trustees and officers of the Funds who are members of EVM’s or BMR’s organizations receive remuneration for their services to the Funds out of the investment adviser fee. Trustees of the Funds who are not affiliated with the investment advisers may elect to defer receipt of all or a percentage of their annual fees in accordance with the terms of the Trustees Deferred Compensation Plan. For the year ended September 30, 2019, no significant amounts have been deferred. Certain officers and Trustees of the Funds are officers of the above organizations.
4 Distribution Plans
Each Fund has in effect a distribution plan for Class A shares (Class A Plan) pursuant to Rule 12b-1 under the 1940 Act. Pursuant to the Class A Plan, each Fund pays EVD a distribution and service fee of 0.25% per annum of its average daily net assets attributable to Class A shares for distribution services and facilities provided to each Fund by EVD, as well as for personal services and/or the maintenance of shareholder accounts. Distribution and service fees paid or accrued to EVD for the year ended September 30, 2019 for Class A shares amounted to the following:
| | | | | | | | |
| | | AMT-Free Fund | | | National Fund | |
| | |
Class A Distribution and Service Fees | | $ | 363,149 | | | $ | 3,762,482 | |
Each Fund also has in effect distribution plans for Class C shares (Class C Plan) and/or prior to August 16, 2019, Class B shares (Class B Plan) pursuant to Rule 12b-1 under the 1940 Act. Pursuant to the Class B and Class C Plans, each Fund paid/pays EVD amounts equal to 0.75% per annum of its average daily net assets attributable to Class B and Class C shares for providing ongoing distribution services and facilities to the respective Funds. For the year ended September 30, 2019, the Funds paid or accrued to EVD the following distribution fees:
| | | | | | | | |
| | | AMT-Free Fund | | | National Fund | |
| | |
Class B Distribution Fees | | $ | — | | | $ | 6,804 | |
| | |
Class C Distribution Fees | | $ | 181,591 | | | $ | 1,808,528 | |
Eaton Vance
Municipal Income Funds
September 30, 2019
Notes to Financial Statements — continued
Pursuant to the Class B and Class C Plans, each Fund also made/makes payments of service fees to EVD, financial intermediaries and other persons in amounts equal to 0.25% per annum of the average daily net assets attributable to that class. Service fees paid or accrued are for personal services and/or the maintenance of shareholder accounts. They are separate and distinct from the Class B and Class C sales commissions and distribution fees payable to EVD. Service fees paid or accrued for the year ended September 30, 2019 amounted to the following:
| | | | | | | | |
| | | AMT-Free Fund | | | National Fund | |
| | |
Class B Service Fees | | $ | — | | | $ | 2,268 | |
| | |
Class C Service Fees | | $ | 60,530 | | | $ | 602,843 | |
Distribution and service fees are subject to the limitations contained in the Financial Industry Regulatory Authority Rule 2341(d) and for Class B, were further limited to a 5% maximum sales charge as determined in accordance with such rule.
5 Contingent Deferred Sales Charges
A contingent deferred sales charge (CDSC) generally is imposed on redemptions of Class C shares made within one year of purchase and prior to August 16, 2019, on redemptions of Class B shares made within six years of purchase. Class A shares may be subject to a 1% CDSC if redeemed within 18 months of purchase (depending on the circumstances of purchase). Generally, the CDSC is based upon the lower of the net asset value at date of redemption or date of purchase. No charge is levied on shares acquired by reinvestment of dividends or capital gain distributions. The CDSC for Class B shares was imposed at declining rates that began at 5% in the case of redemptions in the first and second year after purchase, declining one percentage point each subsequent year. Class C shares are subject to a 1% CDSC if redeemed within one year of purchase. For the year ended September 30, 2019, the Funds were informed that EVD received approximately the following amounts of CDSCs paid by Class A, Class B and Class C shareholders:
| | | | | | | | |
| | | AMT-Free Fund | | | National Fund | |
| | |
Class A | | $ | 7,000 | | | $ | 26,000 | |
| | |
Class B | | $ | — | | | $ | — | |
| | |
Class C | | $ | 400 | | | $ | 1,000 | |
6 Purchases and Sales of Investments
Purchases and sales of investments, other than short-term obligations, for the year ended September 30, 2019 were as follows:
| | | | | | | | |
| | | AMT-Free Fund | | | National Fund | |
| | |
Purchases | | $ | 109,697,869 | | | $ | 3,004,203,631 | |
| | |
Sales | | $ | 115,120,883 | | | $ | 2,600,901,685 | |
Eaton Vance
Municipal Income Funds
September 30, 2019
Notes to Financial Statements — continued
7 Shares of Beneficial Interest
Each Fund’s Declaration of Trust permits the Trustees to issue an unlimited number of full and fractional shares of beneficial interest (without par value). Such shares may be issued in a number of different series (such as the Funds) and classes. Transactions in Fund shares were as follows:
| | | | | | | | | | | | |
AMT-Free Fund | | | | | | | | | |
| | | Year Ended September 30, 2019 | |
| | | Class A | | | Class C | | | Class I | |
| | | |
Sales | | | 1,899,582 | | | | 386,747 | | | | 3,849,738 | |
| | | |
Issued to shareholders electing to receive payments of distributions in Fund shares | | | 507,029 | | | | 62,385 | | | | 371,109 | |
| | | |
Redemptions | | | (3,048,646 | ) | | | (790,414 | ) | | | (3,453,702 | ) |
| | | |
Converted from Class C shares | | | 1,200,770 | | | | — | | | | — | |
| | | |
Converted to Class A shares | | | — | | | | (1,206,708 | ) | | | — | |
| | | |
Net increase (decrease) | | | 558,735 | | | | (1,547,990 | ) | | | 767,145 | |
| |
| | | Year Ended September 30, 2018 | |
| | | Class A | | | Class C | | | Class I | |
| | | |
Sales | | | 1,410,160 | | | | 219,922 | | | | 2,442,370 | |
| | | |
Issued to shareholders electing to receive payments of distributions in Fund shares | | | 548,382 | | | | 100,461 | | | | 410,172 | |
| | | |
Redemptions | | | (3,256,501 | ) | | | (936,704 | ) | | | (4,654,134 | ) |
| | | |
Net decrease | | | (1,297,959 | ) | | | (616,321 | ) | | | (1,801,592 | ) |
| | | | | | | | | | | | | | | | |
National Fund | | | | | | | | | | | | |
| | | Year Ended September 30, 2019 | |
| | | Class A | | | Class B(1) | | | Class C | | | Class I | |
| | | | |
Sales | | | 13,405,753 | | | | 1,628 | | | | 2,854,164 | | | | 79,852,684 | |
| | | | |
Issued to shareholders electing to receive payments of distributions in Fund shares | | | 4,222,148 | | | | 2,056 | | | | 524,297 | | | | 2,955,582 | |
| | | | |
Redemptions | | | (23,904,165 | ) | | | (42,058 | ) | | | (6,560,819 | ) | | | (28,172,127 | ) |
| | | | |
Converted from Class B shares | | | 165,069 | | | | — | | | | — | | | | — | |
| | | | |
Converted from Class C shares | | | 17,419,337 | | | | — | | | | — | | | | — | |
| | | | |
Converted to Class A shares | | | — | | | | (165,036 | ) | | | (17,422,262 | ) | | | — | |
| | | | |
Net increase (decrease) | | | 11,308,142 | | | | (203,410 | ) | | | (20,604,620 | ) | | | 54,636,139 | |
| |
| | | Year Ended September 30, 2018 | |
| | | Class A | | | Class B | | | Class C | | | Class I | |
| | | | |
Sales | | | 8,446,990 | | | | 998 | | | | 1,578,271 | | | | 22,766,344 | |
| | | | |
Issued to shareholders electing to receive payments of distributions in Fund shares | | | 4,651,612 | | | | 10,278 | | | | 1,031,149 | | | | 2,503,247 | |
| | | | |
Redemptions | | | (27,655,284 | ) | | | (117,456 | ) | | | (11,575,817 | ) | | | (25,198,655 | ) |
| | | | |
Converted from Class B shares | | | 367,236 | | | | — | | | | — | | | | — | |
| | | | |
Converted to Class A shares | | | — | | | | (367,220 | ) | | | — | | | | — | |
| | | | |
Net increase (decrease) | | | (14,189,446 | ) | | | (473,400 | ) | | | (8,966,397 | ) | | | 70,936 | |
| (1) | At the close of business on August 15, 2019, Class B shares of National Fund were converted into Class A and Class B was terminated. |
Eaton Vance
Municipal Income Funds
September 30, 2019
Notes to Financial Statements — continued
8 Line of Credit
The Funds participate with other portfolios and funds managed by EVM and its affiliates in a $625 million unsecured line of credit agreement with a group of banks, which is in effect through October 29, 2019. Borrowings are made by the Funds solely to facilitate the handling of unusual and/or unanticipated short-term cash requirements. Interest is charged to each Fund based on its borrowings at an amount above either the Eurodollar rate or Federal Funds rate. In addition, a fee computed at an annual rate of 0.15% on the daily unused portion of the line of credit is allocated among the participating portfolios and funds at the end of each quarter. Because the line of credit is not available exclusively to the Funds, a Fund may be unable to borrow some or all of its requested amounts at any particular time. The Funds did not have any significant borrowings or allocated fees during the year ended September 30, 2019.
Effective October 29, 2019, the Funds renewed their line of credit agreement, which expires October 27, 2020. In connection with the renewal, funds managed by Calvert Research and Management, an affiliate of EVM, were added as participating funds to the agreement and the borrowing limit was increased from $625 million to $800 million.
9 Financial Instruments
The Funds may trade in financial instruments with off-balance sheet risk in the normal course of their investing activities. These financial instruments may include financial futures contracts and may involve, to a varying degree, elements of risk in excess of the amounts recognized for financial statement purposes. The notional or contractual amounts of these instruments represent the investment a Fund has in particular classes of financial instruments and do not necessarily represent the amounts potentially subject to risk. The measurement of the risks associated with these instruments is meaningful only when all related and offsetting transactions are considered. At September 30, 2019, there were no obligations outstanding under these financial instruments.
Each Fund is subject to interest rate risk in the normal course of pursuing its investment objective. Because the Funds hold fixed-rate bonds, the value of these bonds may decrease if interest rates rise. During the year ended September 30, 2019, the Funds entered into U.S. Treasury futures contracts to hedge against changes in interest rates.
The effect of derivative instruments (not considered to be hedging instruments for accounting disclosure purposes) on the Statement of Operations and whose primary underlying risk exposure is interest rate risk for the year ended September 30, 2019 was as follows:
| | | | | | | | |
| | | AMT-Free Fund | | | National Fund | |
| | |
Realized Gain (Loss) on Derivatives Recognized in Income | | $ | (1,856,298 | )(1) | | $ | (7,481,052 | )(1) |
| | |
Change in Unrealized Appreciation (Depreciation) on Derivatives Recognized in Income | | $ | (604,959 | )(2) | | $ | (5,031,282 | )(2) |
| (1) | Statement of Operations location: Net realized gain (loss) – Financial futures contracts. |
| (2) | Statement of Operations location: Change in unrealized appreciation (depreciation) – Financial futures contracts. |
The average notional cost of futures contracts outstanding during the year ended September 30, 2019, which is indicative of the volume of this derivative type, was approximately as follows:
| | | | | | | | |
| | | AMT-Free Fund | | | National Fund | |
| | |
Average Notional Cost: | | | | | | | | |
| | |
Futures Contracts — Short | | $ | 20,231,000 | | | $ | 65,307,000 | |
10 Fair Value Measurements
Under generally accepted accounting principles for fair value measurements, a three-tier hierarchy to prioritize the assumptions, referred to as inputs, is used in valuation techniques to measure fair value. The three-tier hierarchy of inputs is summarized in the three broad levels listed below.
| • | | Level 1 – quoted prices in active markets for identical investments |
| • | | Level 2 – other significant observable inputs (including quoted prices for similar investments, interest rates, prepayment speeds, credit risk, etc.) |
| • | | Level 3 – significant unobservable inputs (including a fund’s own assumptions in determining the fair value of investments) |
Eaton Vance
Municipal Income Funds
September 30, 2019
Notes to Financial Statements — continued
In cases where the inputs used to measure fair value fall in different levels of the fair value hierarchy, the level disclosed is determined based on the lowest level input that is significant to the fair value measurement in its entirety. The inputs or methodology used for valuing securities are not necessarily an indication of the risk associated with investing in those securities.
At September 30, 2019, the hierarchy of inputs used in valuing the Funds’ investments, which are carried at value, were as follows:
| | | | | | | | | | | | | | | | |
AMT-Free Fund | | | | | | | | | | | | |
| Asset Description | | Level 1 | | | Level 2 | | | Level 3 | | | Total | |
| | | | |
Tax-Exempt Municipal Securities | | $ | — | | | $ | 342,501,553 | | | $ | — | | | $ | 342,501,553 | |
| | | | |
Trust Units | | | — | | | | 223,937 | | | | — | | | | 223,937 | |
| | | | |
Total Investments | | $ | — | | | $ | 342,725,490 | | | $ | — | | | $ | 342,725,490 | |
| | | | |
National Fund | | | | | | | | | | | | |
| Asset Description | | Level 1 | | | Level 2 | | | Level 3 | | | Total | |
| | | | |
Tax-Exempt Municipal Securities | | $ | — | | | $ | 3,148,059,697 | | | $ | — | | | $ | 3,148,059,697 | |
| | | | |
Taxable Municipal Securities | | | — | | | | 88,280,321 | | | | — | | | | 88,280,321 | |
| | | | |
Trust Units | �� | | — | | | | 2,953,203 | | | | — | | | | 2,953,203 | |
| | | | |
Corporate Bonds & Notes | | | — | | | | 4,994,739 | | | | — | | | | 4,994,739 | |
| | | | |
Total Investments | | $ | — | | | $ | 3,244,287,960 | | | $ | — | | | $ | 3,244,287,960 | |
Eaton Vance
AMT-Free Municipal Income Fund
September 30, 2019
Report of Independent Registered Public Accounting Firm
To the Trustees of Eaton Vance Mutual Funds Trust and Shareholders of Eaton Vance AMT-Free Municipal Income Fund:
Opinion on the Financial Statements and Financial Highlights
We have audited the accompanying statement of assets and liabilities of Eaton Vance AMT-Free Municipal Income Fund (the “Fund”) (one of the funds constituting Eaton Vance Mutual Funds Trust), including the portfolio of investments, as of September 30, 2019, the related statement of operations for the year then ended, the statements of changes in net assets for each of the two years in the period then ended, the financial highlights for each of the five years in the period then ended, and the related notes. In our opinion, the financial statements and financial highlights present fairly, in all material respects, the financial position of the Fund as of September 30, 2019, the results of its operations for the year then ended, the changes in its net assets for each of the two years in the period then ended, and the financial highlights for each of the five years in the period then ended, in conformity with accounting principles generally accepted in the United States of America.
Basis for Opinion
These financial statements and financial highlights are the responsibility of the Fund’s management. Our responsibility is to express an opinion on the Fund’s financial statements and financial highlights based on our audits. We are a public accounting firm registered with the Public Company Accounting Oversight Board (United States) (PCAOB) and are required to be independent with respect to the Fund in accordance with the U.S. federal securities laws and the applicable rules and regulations of the Securities and Exchange Commission and the PCAOB.
We conducted our audits in accordance with the standards of the PCAOB. Those standards require that we plan and perform the audit to obtain reasonable assurance about whether the financial statements and financial highlights are free of material misstatement, whether due to error or fraud. The Fund is not required to have, nor were we engaged to perform, an audit of its internal control over financial reporting. As part of our audits we are required to obtain an understanding of internal control over financial reporting but not for the purpose of expressing an opinion on the effectiveness of the Fund’s internal control over financial reporting. Accordingly, we express no such opinion.
Our audits included performing procedures to assess the risks of material misstatement of the financial statements and financial highlights, whether due to error or fraud, and performing procedures that respond to those risks. Such procedures included examining, on a test basis, evidence regarding the amounts and disclosures in the financial statements and financial highlights. Our audits also included evaluating the accounting principles used and significant estimates made by management, as well as evaluating the overall presentation of the financial statements and financial highlights. Our procedures included confirmation of securities owned as of September 30, 2019, by correspondence with the custodian and brokers; when replies were not received from brokers, we performed other auditing procedures. We believe that our audits provide a reasonable basis for our opinion.
/s/ Deloitte & Touche LLP
Boston, Massachusetts
November 18, 2019
We have served as the auditor of one or more Eaton Vance investment companies since 1959.
Eaton Vance
National Municipal Income Fund
September 30, 2019
Report of Independent Registered Public Accounting Firm
To the Trustees of Eaton Vance Municipals Trust and Shareholders of Eaton Vance National Municipal Income Fund:
Opinion on the Financial Statements and Financial Highlights
We have audited the accompanying statement of assets and liabilities of Eaton Vance National Municipal Income Fund (the “Fund”) (one of the funds constituting Eaton Vance Municipals Trust), including the portfolio of investments, as of September 30, 2019, the related statement of operations for the year then ended, the statements of changes in net assets for each of the two years in the period then ended, the financial highlights for each of the five years in the period then ended, and the related notes. In our opinion, the financial statements and financial highlights present fairly, in all material respects, the financial position of the Fund as of September 30, 2019, the results of its operations for the year then ended, the changes in its net assets for each of the two years in the period then ended, and the financial highlights for each of the five years in the period then ended, in conformity with accounting principles generally accepted in the United States of America.
Basis for Opinion
These financial statements and financial highlights are the responsibility of the Fund’s management. Our responsibility is to express an opinion on the Fund’s financial statements and financial highlights based on our audits. We are a public accounting firm registered with the Public Company Accounting Oversight Board (United States) (PCAOB) and are required to be independent with respect to the Fund in accordance with the U.S. federal securities laws and the applicable rules and regulations of the Securities and Exchange Commission and the PCAOB.
We conducted our audits in accordance with the standards of the PCAOB. Those standards require that we plan and perform the audit to obtain reasonable assurance about whether the financial statements and financial highlights are free of material misstatement, whether due to error or fraud. The Fund is not required to have, nor were we engaged to perform, an audit of its internal control over financial reporting. As part of our audits we are required to obtain an understanding of internal control over financial reporting but not for the purpose of expressing an opinion on the effectiveness of the Fund’s internal control over financial reporting. Accordingly, we express no such opinion.
Our audits included performing procedures to assess the risks of material misstatement of the financial statements and financial highlights, whether due to error or fraud, and performing procedures that respond to those risks. Such procedures included examining, on a test basis, evidence regarding the amounts and disclosures in the financial statements and financial highlights. Our audits also included evaluating the accounting principles used and significant estimates made by management, as well as evaluating the overall presentation of the financial statements and financial highlights. Our procedures included confirmation of securities owned as of September 30, 2019, by correspondence with the custodian and brokers; when replies were not received from brokers, we performed other auditing procedures. We believe that our audits provide a reasonable basis for our opinion.
/s/ Deloitte & Touche LLP
Boston, Massachusetts
November 18, 2019
We have served as the auditor of one or more Eaton Vance investment companies since 1959.
Eaton Vance
Municipal Income Funds
September 30, 2019
Federal Tax Information (Unaudited)
The Form 1099-DIV you receive in February 2020 will show the tax status of all distributions paid to your account in calendar year 2019. Shareholders are advised to consult their own tax adviser with respect to the tax consequences of their investment in the Funds. As required by the Internal Revenue Code and/or regulations, shareholders must be notified regarding exempt-interest dividends.
Exempt-Interest Dividends. For the fiscal year ended September 30, 2019, the Funds designate the following percentages of distributions from net investment income as exempt-interest dividends:
| | | | |
| |
AMT-Free Municipal Income Fund | | | 99.30 | % |
| |
National Municipal Income Fund | | | 94.53 | % |
Eaton Vance
Municipal Income Funds
September 30, 2019
Board of Trustees’ Contract Approval
Overview of the Contract Review Process
The Investment Company Act of 1940, as amended (the “1940 Act”), provides, in substance, that the investment advisory agreement between a fund and its investment adviser will continue in effect from year-to-year only if its continuation is approved on an annual basis by a vote of the fund’s board of trustees, including a majority of the trustees who are not “interested persons” of the fund (“independent trustees”), cast in person at a meeting called for the purpose of considering such approval.
At a meeting held on April 24, 2019, the Boards of Trustees/Directors (collectively, the “Board”) of the registered investment companies advised by Eaton Vance Management or its affiliate, Boston Management and Research (the “Eaton Vance Funds”), including a majority of the independent trustees (the “Independent Trustees”), voted to approve the continuation of existing investment advisory and sub-advisory agreements for each of the Eaton Vance Funds for an additional one-year period. In voting its approval, the Board relied upon the affirmative recommendation of its Contract Review Committee, which is a committee exclusively comprised of Independent Trustees. Prior to making its recommendation, the Contract Review Committee reviewed information furnished by the adviser andsub-adviser (where applicable) to each of the Eaton Vance Funds (including information specifically requested by the Board) for a series of meetings held between February and April 2019. Members of the Contract Review Committee also considered information received at prior meetings of the Board and its committees, to the extent such information was relevant to the Contract Review Committee’s annual evaluation of the investment advisory and sub-advisory agreements.
Among other things, the information the Board considered included the following (for funds that invest through one or more underlying portfolios, references to “each fund” in this section may include information that was considered at the portfolio-level):
Information about Fees, Performance and Expenses
| | • | | A report from an independent data provider comparing advisory and related fees paid by each fund to such fees paid by comparable funds, as identified by the independent data provider (“comparable funds”); |
| | • | | A report from an independent data provider comparing each fund’s total expense ratio (and its components) to those of comparable funds; |
| | • | | A report from an independent data provider comparing the investment performance of each fund (including, where relevant, yield data, Sharpe ratios and information ratios) to the investment performance of comparable funds over various time periods; |
| | • | | Data regarding investment performance relative to benchmark indices and, in certain instances, to customized groups of peer funds and blended indices identified by the adviser in consultation with the Portfolio Management Committee of the Board; |
| | • | | Comparative information concerning the fees charged and services provided by the adviser and sub-adviser (where applicable) to each fund in managing other accounts (including mutual funds, other collective investment funds and institutional accounts) using investment strategies and techniques similar to those used in managing such fund(s), if any; |
| | • | | Profitability analyses with respect to the adviser and sub-adviser (where applicable) to each of the funds; |
Information about Portfolio Management and Trading
| | • | | Descriptions of the investment management services provided to each fund, as well as each of the funds’ investment strategies and policies; |
| | • | | The procedures and processes used to determine the fair value of fund assets, when necessary, and actions taken to monitor and test the effectiveness of such procedures and processes; |
| | • | | Information about the policies and practices of each fund’s adviser and sub-adviser (where applicable and in the context of a sub-adviser with trading responsibilities) with respect to trading, including their processes for seeking best execution of portfolio transactions; |
| | • | | Information about the allocation of brokerage transactions and the benefits, if any, received by the adviser and sub-adviser (where applicable and in the context of a sub-adviser with trading responsibilities) to each fund as a result of brokerage allocation, including information concerning the acquisition of research through client commission arrangements and policies with respect to “soft dollars”; |
| | • | | Data relating to the portfolio turnover rate of each fund; |
Information about each Adviser and Sub-adviser
| | • | | Reports detailing the financial results and condition of the adviser and sub-adviser (where applicable) to each fund; |
| | • | | Information regarding the individual investment professionals whose responsibilities include portfolio management and investment research for the funds, and, for portfolio managers and certain other investment professionals, information relating to their responsibilities with respect to managing other mutual funds and investment accounts, if applicable; |
| | • | | The Code of Ethics of the adviser and its affiliates and the sub-adviser (where applicable) of each fund, together with information relating to compliance with, and the administration of, such codes; |
| | • | | Policies and procedures relating to proxy voting and the handling of corporate actions and class actions; |
| | • | | Information concerning the resources devoted to compliance efforts undertaken by the adviser and its affiliates and the sub-adviser (where applicable) of each fund, if any, including descriptions of their various compliance programs and their record of compliance; |
| | • | | Information concerning the business continuity and disaster recovery plans of the adviser and its affiliates and the sub-adviser (where applicable) of each fund, if any; |
Eaton Vance
Municipal Income Funds
September 30, 2019
Board of Trustees’ Contract Approval — continued
| | • | | A description of Eaton Vance Management’s and Boston Management and Research’s oversight of sub-advisers, including with respect to regulatory and compliance issues, investment management and other matters; |
Other Relevant Information
| | • | | Information concerning the nature, cost and character of the administrative and other non-investment advisory services provided by Eaton Vance Management and its affiliates; |
| | • | | Information concerning management of the relationship with the custodian, subcustodians and fund accountants by the adviser or administrator to each of the funds; and |
| | • | | The terms of each investment advisory agreement. |
During the various meetings of the Board and its committees throughout the twelve months ended April 2019, the Trustees received information from portfolio managers and other investment professionals of the advisers and sub-advisers (where applicable) of the funds regarding investment and performance matters, and considered various investment and trading strategies used in pursuing the funds’ investment objectives. The Trustees also received information regarding risk management techniques employed in connection with the management of the funds. The Board and its Committees evaluated issues pertaining to industry and regulatory developments, compliance procedures, fund governance and other issues with respect to the funds, and received and participated in reports and presentations provided by Eaton Vance Management, Boston Management and Research and fundsub-advisers (as applicable), with respect to such matters. In addition to the formal meetings of the Board and its committees, the Independent Trustees held regular teleconferences to discuss, among other topics, matters relating to the continuation of investment advisory and sub-advisory agreements.
The Contract Review Committee was advised throughout the contract review process by Goodwin Procter LLP, independent legal counsel for the Independent Trustees. The members of the Contract Review Committee, with the advice of such counsel, exercised their own business judgment in determining the material factors to be considered in evaluating each investment advisory and sub-advisory agreement and the weight to be given to each such factor. The conclusions reached with respect to each investment advisory and sub-advisory agreement were based on a comprehensive evaluation of all the information provided and not any single factor. Moreover, each member of the Contract Review Committee may have placed varying emphasis on particular factors in reaching conclusions with respect to each investment advisory and sub-advisory agreement. In evaluating each investment advisory and sub-advisory agreement, including the fee structures and other terms contained in such agreements, the members of the Contract Review Committee were also informed by multiple years of analysis and discussion with the adviser and sub-adviser (where applicable) to each of the Eaton Vance Funds.
Results of the Process
Based on its consideration of the foregoing, and such other information as it deemed relevant, including the factors and conclusions described below, the Contract Review Committee concluded that (i) the continuation of the investment advisory agreement between Eaton Vance AMT-Free Municipal Income Fund (the“AMT-Free Muni Income Fund”) and Eaton Vance Management (“EVM”) and (ii) the continuation of the investment advisory agreement between Eaton Vance National Municipal Income Fund (the “National Muni Income Fund”, together with the AMT-Free Muni Income Fund, the “Funds” and each, a “Fund”) and Boston Management and Research (“BMR”) (EVM, with respect to the AMT-Free Muni Income Fund, and BMR, with respect to the National Muni Income Fund, are each referred to herein as the “Adviser”), including their respective fee structures, are in the interests of shareholders and, therefore, recommended to the Board approval of each agreement. Based on the recommendation of the Contract Review Committee, the Board, including a majority of the Independent Trustees, voted to approve continuation of the investment advisory agreement for each Fund.
Nature, Extent and Quality of Services
In considering whether to approve the investment advisory agreement for each Fund, the Board evaluated the nature, extent and quality of services provided to the Funds by the applicable Adviser.
The Board considered each Adviser’s management capabilities and investment processes in light of the types of investments held by each Fund, respectively, including the education, experience and number of investment professionals and other personnel who provide portfolio management, investment research, and similar services to the Funds. In particular, the Board considered, where relevant, the abilities and experience of each Adviser’s investment professionals in analyzing factors such as credit risk, tax efficiency, and special considerations relevant to investing in municipal obligations. The Board considered each Adviser’s municipal bond team, which includes investment professionals and credit specialists who provide services to the applicable Fund. The Board also took into account the resources dedicated to portfolio management and other services, the compensation methods of each Adviser and other factors, including the reputation and resources of the Adviser to recruit and retain highly qualified research, advisory and supervisory investment professionals. In addition, the Board considered the time and attention devoted to the Eaton Vance Funds, including each Fund, by senior management, as well as the infrastructure, operational capabilities and support staff in place to assist in the portfolio management and operations of the Funds, including the provision of administrative services. The Board also considered the business-related and other risks to which the Advisers or its affiliates may be subject in managing the Funds.
The Board considered the compliance programs of each Adviser and relevant affiliates thereof. The Board considered compliance and reporting matters regarding, among other things, personal trading by investment professionals, disclosure of portfolio holdings, late trading, frequent trading, portfolio
Eaton Vance
Municipal Income Funds
September 30, 2019
Board of Trustees’ Contract Approval��— continued
valuation, business continuity and the allocation of investment opportunities. The Board also considered the responses of each Adviser and its affiliates to requests in recent years from regulatory authorities, such as the Securities and Exchange Commission and the Financial Industry Regulatory Authority.
The Board considered shareholder and other administrative services provided or managed by Eaton Vance Management and its affiliates, including transfer agency and accounting services. The Board evaluated the benefits to shareholders of investing in a fund that is a part of a large fund complex offering exposure to a variety of asset classes and investment disciplines, as well as the ability, in many cases, to exchange an investment among different funds without incurring additional sales charges.
After consideration of the foregoing factors, among others, the Board concluded that the nature, extent and quality of services provided by each Adviser, taken as a whole, are appropriate and consistent with the terms of the applicable investment advisory agreement.
Fund Performance
The Board compared each Fund’s investment performance to that of comparable funds and appropriate benchmark indices and assessed each Fund’s performance on the basis of total return and current income return. The Board’s review included comparative performance data with respect to each Fund for the one-, three-, five- and ten-year periods ended September 30, 2018.
In this regard, the Board noted each Fund’s performance relative to its peer group, primary benchmark index and secondary benchmark index for the three-year period, as follows:
| | | | | | |
| | | Performance Relative to: |
| Fund | | Median of
Peers | | Primary
Index | | Secondary
Index |
| | | |
Eaton Vance AMT-Free Municipal Income Fund | | Consistent with | | Higher | | Lower |
| | | |
Eaton Vance National Municipal Income Fund | | Higher | | Higher | | Lower |
The Board considered, among other things, each Adviser’s efforts to generate competitive levels of tax-exempt current income over time through investments that, relative to comparable funds, focus on higher quality municipal bonds with longer maturities. The Board concluded that the performance of each Fund was satisfactory.
Management Fees and Expenses
The Board considered contractual fee rates payable by each Fund for advisory and administrative services (referred to collectively as “management fees”). As part of its review, the Board considered each Fund’s management fees and total expense ratio for the one-year period ended September 30, 2018, as compared to those of comparable funds, before and after giving effect to any undertaking to waive fees or reimburse expenses. The Board also considered factors that had an impact on each Fund’s total expense ratio relative to comparable funds.
After considering the foregoing information, and in light of the nature, extent and quality of the services provided by each Adviser, the Board concluded that the management fees charged for advisory and related services are reasonable.
Profitability and “Fall-Out” Benefits
The Board considered the level of profits realized by each Adviser and relevant affiliates thereof in providing investment advisory and administrative services to each Fund and to all Eaton Vance Funds as a group. The Board considered the level of profits realized without regard to marketing support or other payments by each Adviser and its affiliates to third parties in respect of distribution services.
The Board concluded that, in light of the foregoing factors and the nature, extent and quality of the services rendered, the profits realized by each Adviser and its affiliates are deemed not to be excessive.
The Board also considered direct or indirect fall-out benefits received by each Adviser and its affiliates in connection with their respective relationships with the Funds, including the benefits of research services that may be available to each Adviser as a result of securities transactions effected for the Funds and other investment advisory clients.
Economies of Scale
In reviewing management fees and profitability, the Board also considered the extent to which the applicable Adviser and its affiliates, on the one hand, and each Fund, on the other hand, can expect to realize benefits from economies of scale as the assets of each Fund increase. The Board acknowledged the difficulty in accurately measuring the benefits resulting from economies of scale, if any, with respect to the management of any specific fund or group
Eaton Vance
Municipal Income Funds
September 30, 2019
Board of Trustees’ Contract Approval — continued
of funds. The Board reviewed data summarizing the increases and decreases in the assets of each Fund and of all Eaton Vance Funds as a group over various time periods, and evaluated the extent to which the total expense ratio of each Fund and the profitability of each Adviser and its affiliates may have been affected by such increases or decreases. Based upon the foregoing, the Board concluded that each Fund currently shares in the benefits from economies of scale, if any, when they are realized by the Adviser. The Board also concluded that the structure of each advisory fee, which includes breakpoints at several asset levels, will allow each Fund to continue to benefit from any economies of scale in the future.
Eaton Vance
Municipal Income Funds
September 30, 2019
Management and Organization
Fund Management. The Trustees of Eaton Vance Municipals Trust and Eaton Vance Mutual Funds Trust (collectively, the Trusts) are responsible for the overall management and supervision of the Trusts’ affairs. The Trustees and officers of the Trusts are listed below. Except as indicated, each individual has held the office shown or other offices in the same company for the last five years. Trustees and officers of the Trusts hold indefinite terms of office. The “Noninterested Trustees” consist of those Trustees who are not “interested persons” of the Trusts, as that term is defined under the 1940 Act. The business address of each Trustee and officer is Two International Place, Boston, Massachusetts 02110. As used below, “EVC” refers to Eaton Vance Corp., “EV” refers to Eaton Vance, Inc., “EVM” refers to Eaton Vance Management, “BMR” refers to Boston Management and Research and “EVD” refers to Eaton Vance Distributors, Inc. EVC and EV are the corporate parent and trustee, respectively, of EVM and BMR. EVD is the Funds’ principal underwriter and a wholly-owned subsidiary of EVC. Each officer affiliated with Eaton Vance may hold a position with other Eaton Vance affiliates that is comparable to his or her position with EVM listed below. Each Trustee oversees 162 portfolios in the Eaton Vance Complex (including all master and feeder funds in a master feeder structure). Each officer serves as an officer of certain other Eaton Vance funds. Each Trustee and officer serve until his or her successor is elected.
| | | | | | |
| Name and Year of Birth | | Trust
Position(s) | | Trustee Since(1) | | Principal Occupation(s) and Other Directorships During Past Five Years and Other Relevant Experience |
| | | |
| Interested Trustee | | | | | | |
| | | |
Thomas E. Faust Jr. 1958 | | Trustee | | 2007 | | Chairman, Chief Executive Officer and President of EVC, Director and President of EV, Chief Executive Officer and President of EVM and BMR, and Director of EVD. Trustee and/or officer of 162 registered investment companies. Mr. Faust is an interested person because of his positions with EVM, BMR, EVD, EVC and EV, which are affiliates of the Trusts. Other Directorships in the Last Five Years. Director of EVC and Hexavest Inc. (investment management firm). |
| | | |
| Noninterested Trustees | | | | | | |
| | | |
Mark R. Fetting 1954 | | Trustee | | 2016 | | Private investor. Formerly held various positions at Legg Mason, Inc. (investment management firm) (2000-2012), including President, Chief Executive Officer, Director and Chairman (2008-2012), Senior Executive Vice President (2004-2008) and Executive Vice President (2001-2004). Formerly, President of Legg Mason family of funds (2001-2008). Formerly, Division President and Senior Officer of Prudential Financial Group, Inc. and related companies (investment management firm)(1991-2000). Other Directorships in the Last Five Years. None. |
| | | |
Cynthia E. Frost 1961 | | Trustee | | 2014 | | Private investor. Formerly, Chief Investment Officer of Brown University (university endowment) (2000-2012). Formerly, Portfolio Strategist for Duke Management Company (university endowment manager) (1995-2000). Formerly, Managing Director, Cambridge Associates (investment consulting company) (1989-1995). Formerly, Consultant, Bain and Company (management consulting firm) (1987-1989). Formerly, Senior Equity Analyst, BA Investment Management Company (1983-1985). Other Directorships in the Last Five Years. None. |
| | | |
George J. Gorman 1952 | | Trustee | | 2014 | | Principal at George J. Gorman LLC (consulting firm). Formerly, Senior Partner at Ernst & Young LLP (a registered public accounting firm) (1974-2009). Other Directorships in the Last Five Years. Formerly, Trustee of the BofA Funds Series Trust (11 funds) (2011-2014) and of the Ashmore Funds (9 funds) (2010-2014). |
| | | |
Valerie A. Mosley 1960 | | Trustee | | 2014 | | Chairwoman and Chief Executive Officer of Valmo Ventures (a consulting and investment firm). Former Partner and Senior Vice President, Portfolio Manager and Investment Strategist at Wellington Management Company, LLP (investment management firm)(1992-2012). Former Chief Investment Officer, PG Corbin Asset Management (1990-1992). Formerly worked in institutional corporate bond sales at Kidder Peabody (1986-1990). Other Directorships in the Last Five Years. Director of Envestnet, Inc. (provider of intelligent systems for wealth management and financial wellness) (since 2018). Director of Dynex Capital, Inc. (mortgage REIT) (since 2013). |
| | | |
William H. Park 1947 | | Chairperson of the Board and Trustee | | 2016 (Chairperson) and 2003 (Trustee) | | Private investor. Formerly, Consultant (management and transactional) (2012-2014). Formerly, Chief Financial Officer, Aveon Group L.P. (investment management firm)(2010-2011). Formerly, Vice Chairman, Commercial Industrial Finance Corp. (specialty finance company) (2006-2010). Formerly, President and Chief Executive Officer, Prizm Capital Management, LLC (investment management firm) (2002-2005). Formerly, Executive Vice President and Chief Financial Officer, United Asset Management Corporation (investment management firm) (1982-2001). Formerly, Senior Manager, Price Waterhouse (now PricewaterhouseCoopers) (a registered public accounting firm) (1972-1981). Other Directorships in the Last Five Years. None. |
Eaton Vance
Municipal Income Funds
September 30, 2019
Management and Organization — continued
| | | | | | |
| Name and Year of Birth | | Trust
Position(s) | | Trustee Since(1) | | Principal Occupation(s) and Other Directorships During Past Five Years and Other Relevant Experience |
| | |
| Noninterested Trustees (continued) | | | | |
| | | |
Helen Frame Peters 1948 | | Trustee | | 2008 | | Professor of Finance, Carroll School of Management, Boston College. Formerly, Dean, Carroll School of Management, Boston College (2000-2002). Formerly, Chief Investment Officer, Fixed Income, Scudder Kemper Investments (investment management firm)(1998-1999). Formerly, Chief Investment Officer, Equity and Fixed Income, Colonial Management Associates (investment management firm) (1991-1998). Other Directorships in the Last Five Years. None. |
| | | |
Keith Quinton 1958 | | Trustee | | 2018 | | Independent Investment Committee Member at New Hampshire Retirement System (since 2017). Advisory Committee member at Northfield Information Services, Inc. (risk management analytics provider) (since 2016). Formerly, Portfolio Manager and Senior Quantitative Analyst at Fidelity Investments (investment management firm)(2001-2014). Other Directorships in the Last Five Years. Director of New Hampshire Municipal Bond Bank (since 2016). |
| | | |
Marcus L. Smith 1966 | | Trustee | | 2018 | | Member of Posse Boston Advisory Board (foundation) (since 2015). Trustee at University of Mount Union (since 2008). Formerly, Portfolio Manager at MFS Investment Management (investment management firm) (1994-2017). Other Directorships in the Last Five Years. Director of MSCI Inc. (global provider of investment decision support tools) (since 2017). Formerly, Director of DCT Industrial Trust Inc. (logistics real estate company) (2017-2018). |
| | | |
Susan J. Sutherland 1957 | | Trustee | | 2015 | | Private investor. Formerly, Associate, Counsel and Partner at Skadden, Arps, Slate, Meagher & Flom LLP (law firm) (1982-2013). Other Directorships in the Last Five Years. Formerly, Director of Montpelier Re Holdings Ltd. (global provider of customized insurance and reinsurance products) (2013-2015). |
| | | |
Scott E. Wennerholm 1959 | | Trustee | | 2016 | | Formerly, Trustee at Wheelock College (postsecondary institution) (2012-2018). Formerly, Consultant at GF Parish Group (executive recruiting firm) (2016-2017). Formerly, Chief Operating Officer and Executive Vice President at BNY Mellon Asset Management (investment management firm) (2005-2011). Formerly, Chief Operating Officer and Chief Financial Officer at Natixis Global Asset Management (investment management firm) (1997-2004). Formerly, Vice President at Fidelity Investments Institutional Services (investment management firm) (1994-1997). Other Directorships in the Last Five Years. None. |
| | | |
| | | | | | |
| Name and Year of Birth | | Trust
Position(s) | | Officer
Since(2) | | Principal Occupation(s) During Past Five Years |
|
| Principal Officers who are not Trustees |
| | | |
Payson F. Swaffield 1956 | | President | | 2003 | | Vice President and Chief Income Investment Officer of EVM and BMR. Also Vice President of Calvert Research and Management (“CRM”) since 2016. |
| | | |
Maureen A. Gemma 1960 | | Vice President, Secretary and Chief Legal Officer | | 2005 | | Vice President of EVM and BMR. Also Vice President of CRM since 2016. |
| | | |
James F. Kirchner 1967 | | Treasurer | | 2007 | | Vice President of EVM and BMR. Also Vice President of CRM since 2016. |
| | | |
Richard F. Froio 1968 | | Chief Compliance Officer | | 2017 | | Vice President of EVM and BMR since 2017. Formerly Deputy Chief Compliance Officer (Adviser/Funds) and Chief Compliance Officer (Distribution) at PIMCO (2012-2017) and Managing Director at BlackRock/Barclays Global Investors (2009-2012). |
| (1) | Year first appointed to serve as Trustee for a fund in the Eaton Vance family of funds. Each Trustee has served continuously since appointment unless indicated otherwise. |
| (2) | Year first elected to serve as officer of a fund in the Eaton Vance family of funds when the officer has served continuously. Otherwise, year of most recent election as an officer of a fund in the Eaton Vance family of funds. Titles may have changed since initial election. |
The SAI for the Funds includes additional information about the Trustees and officers of the Funds and can be obtained without charge on Eaton Vance’s website at www.eatonvance.com or by calling 1-800-262-1122.
Eaton Vance Funds
IMPORTANT NOTICES
Privacy. The Eaton Vance organization is committed to ensuring your financial privacy. Each of the financial institutions identified below has in effect the following policy (“Privacy Policy”) with respect to nonpublic personal information about its customers:
| • | | Only such information received from you, through application forms or otherwise, and information about your Eaton Vance fund transactions will be collected. This may include information such as name, address, social security number, tax status, account balances and transactions. |
| • | | None of such information about you (or former customers) will be disclosed to anyone, except as permitted by law (which includes disclosure to employees necessary to service your account). In the normal course of servicing a customer’s account, Eaton Vance may share information with unaffiliated third parties that perform various required services such as transfer agents, custodians and broker-dealers. |
| • | | Policies and procedures (including physical, electronic and procedural safeguards) are in place that are designed to protect the confidentiality of such information. |
| • | | We reserve the right to change our Privacy Policy at any time upon proper notification to you. Customers may want to review our Privacy Policy periodically for changes by accessing the link on our homepage: www.eatonvance.com. |
Our pledge of privacy applies to the following entities within the Eaton Vance organization: the Eaton Vance Family of Funds, Eaton Vance Management, Eaton Vance Investment Counsel, Eaton Vance Distributors, Inc., Eaton Vance Trust Company, Eaton Vance Management (International) Limited, Eaton Vance Advisers International Ltd., Eaton Vance Management’s Real Estate Investment Group and Boston Management and Research. In addition, our Privacy Policy applies only to those Eaton Vance customers who are individuals and who have a direct relationship with us. If a customer’s account (i.e., fund shares) is held in the name of a third-party financial advisor/broker-dealer, it is likely that only such advisor’s privacy policies apply to the customer. This notice supersedes all previously issued privacy disclosures. For more information about Eaton Vance’s Privacy Policy, please call 1-800-262-1122.
Delivery of Shareholder Documents. The Securities and Exchange Commission (SEC) permits funds to deliver only one copy of shareholder documents, including prospectuses, proxy statements and shareholder reports, to fund investors with multiple accounts at the same residential or post office box address. This practice is often called “householding” and it helps eliminate duplicate mailings to shareholders.Eaton Vance, or your financial intermediary, may household the mailing of your documents indefinitely unless you instruct Eaton Vance, or your financial intermediary, otherwise.If you would prefer that your Eaton Vance documents not be householded, please contact Eaton Vanceat 1-800-262-1122, or contact your financial intermediary. Your instructions that householding not apply to delivery of your Eaton Vance documents will typically be effective within 30 days of receipt by Eaton Vance or your financial intermediary.
Portfolio Holdings. Each Eaton Vance Fund and its underlying Portfolio(s) (if applicable) files a schedule of portfolio holdings on Part F toForm N-PORT with the SEC for the first and third quarters of each fiscal year. The Form N-PORT will be available on the Eaton Vance website at www.eatonvance.com, by calling Eaton Vance at 1-800-262-1122 or in the EDGAR database on the SEC’s website at www.sec.gov.
Proxy Voting. From time to time, funds are required to vote proxies related to the securities held by the funds. The Eaton Vance Funds or their underlying Portfolios (if applicable) vote proxies according to a set of policies and procedures approved by the Funds’ and Portfolios’ Boards. You may obtain a description of these policies and procedures and information on how the Funds or Portfolios voted proxies relating to portfolio securities during the most recent 12-month period ended June 30, without charge, upon request, by calling 1-800-262-1122 and by accessing the SEC’s website at www.sec.gov.
Investment Advisers
AMT-Free Municipal Income Fund
Eaton Vance Management
Two International Place
Boston, MA 02110
National Municipal Income Fund
Boston Management and Research
Two International Place
Boston, MA 02110
Administrator
Eaton Vance Management
Two International Place
Boston, MA 02110
Principal Underwriter*
Eaton Vance Distributors, Inc.
Two International Place
Boston, MA 02110
(617) 482-8260
Custodian
State Street Bank and Trust Company
State Street Financial Center, One Lincoln Street
Boston, MA 02111
Transfer Agent
BNY Mellon Investment Servicing (US) Inc.
Attn: Eaton Vance Funds
P.O. Box 9653
Providence, RI 02940-9653
(800) 262-1122
Independent Registered Public Accounting Firm
Deloitte & Touche LLP
200 Berkeley Street
Boston, MA 02116-5022
Fund Offices
Two International Place
Boston, MA 02110
| * | FINRA BrokerCheck. Investors may check the background of their Investment Professional by contacting the Financial Industry Regulatory Authority (FINRA). FINRA BrokerCheck is a free tool to help investors check the professional background of current and former FINRA-registered securities firms and brokers. FINRA BrokerCheck is available by calling 1-800-289-9999 and at www.FINRA.org. The FINRA BrokerCheck brochure describing this program is available to investors at www.FINRA.org. |

448 9.30.19
Item 2. Code of Ethics
The registrant has adopted a code of ethics applicable to its Principal Executive Officer, Principal Financial Officer and Principal Accounting Officer. The registrant undertakes to provide a copy of such code of ethics to any person upon request, without charge, by calling1-800-262-1122. The registrant has not amended the code of ethics as described in FormN-CSR during the period covered by this report. The registrant has not granted any waiver, including an implicit waiver, from a provision of the code of ethics as described in FormN-CSR during the period covered by this report.
Item 3. Audit Committee Financial Expert
The registrant’s Board has designated George J. Gorman and William H. Park, each an independent trustee, as audit committee financial experts. Mr. Gorman is a certified public accountant who is the Principal at George J. Gorman LLC (a consulting firm). Previously, Mr. Gorman served in various capacities at Ernst & Young LLP (a registered public accounting firm), including as Senior Partner. Mr. Gorman also has experience serving as an independent trustee and audit committee financial expert of other mutual fund complexes. Mr. Park is a certified public accountant who is a private investor. Previously, he served as a consultant, as the Chief Financial Officer of Aveon Group, L.P. (an investment management firm), as the Vice Chairman of Commercial Industrial Finance Corp. (specialty finance company), as President and Chief Executive Officer of Prizm Capital Management, LLC (investment management firm), as Executive Vice President and Chief Financial Officer of United Asset Management Corporation (an institutional investment management firm) and as a Senior Manager at Price Waterhouse (now PricewaterhouseCoopers) (a registered public accounting firm).
Item 4. Principal Accountant Fees and Services
Eaton VanceAMT-Free Municipal Income Fund and Eaton Vance Core Plus Bond Fund (the “Fund(s)”) are series of Eaton Vance Mutual Funds Trust (the “Trust”), a Massachusetts business trust, which, including the Funds, contains a total of 33 series (the “Series”). The Trust is registered under the Investment Company Act of 1940 as anopen-end management investment company. This FormN-CSR relates to the Funds’ annual reports.
(a)-(d)
The following tables present the aggregate fees billed to each Fund for the Funds’ fiscal years ended September 30, 2018 and September 30, 2019 by the Funds’ principal accountant, Deloitte and Touche LLP (“D&T”), for professional services rendered for the audit of the Funds’ annual financial statements and fees billed for other services rendered by D&T during those periods.
Eaton VanceAMT-Free Municipal Income Fund
| | | | | | | | |
Fiscal Years Ended | | 9/30/18 | | | 9/30/19 | |
Audit Fees | | $ | 49,880 | | | $ | 50,550 | |
Audit-Related Fees(1) | | $ | 0 | | | $ | 0 | |
Tax Fees(2) | | $ | 14,139 | | | $ | 13,751 | |
All Other Fees(3) | | $ | 0 | | | $ | 0 | |
| | | | | | | | |
Total | | $ | 64,019 | | | $ | 64,301 | |
| | | | | | | | |
Eaton Vance Core Plus Bond Fund
| | | | | | | | |
Fiscal Years Ended | | 9/30/18 | | | 9/30/19 | |
Audit Fees | | $ | 49,745 | | | $ | 47,750 | |
Audit-Related Fees(1) | | $ | 0 | | | $ | 0 | |
Tax Fees(2) | | $ | 14,467 | | | $ | 11,017 | |
All Other Fees(3) | | $ | 0 | | | $ | 0 | |
| | | | | | | | |
Total | | $ | 64,212 | | | $ | 58,767 | |
| | | | | | | | |
| (1) | Audit-related fees consist of the aggregate fees billed for assurance and related services that are reasonably related to the performance of the audit of the registrant’s financial statements and are not reported under the category of audit fees. |
| (2) | Tax fees consist of the aggregate fees billed for professional services rendered by the principal accountant relating to tax compliance, tax advice, and tax planning and specifically include fees for tax return preparation and other related tax compliance/planning matters. |
| (3) | All other fees consist of the aggregate fees billed for products and services provided by the principal accountant other than audit, audit-related, and tax services. |
The various Series comprising the Trust have differing fiscal year ends (January 31, February 28, July 31, September 30, October 31 or December 31). The following table presents the aggregate audit, audit-related, tax, and other fees billed to all of the Series in the Trust by D&T for the last two fiscal years of each Series.
| | | | | | | | | | | | | | | | | | | | | | | | | | | | | | | | | | | | | | | | | | | | |
Fiscal
Years
Ended* | | 10/31/17 | | | 12/31/17 | | | 1/31/18 | | | 2/28/18 | | | 9/30/18 | | | 10/31/18 | | | 12/31/18 | | | 1/31/19 | | | 2/28/19 | | | 7/31/19 | | | 9/30/19 | |
Audit Fees | | $ | 571,663 | | | $ | 105,320 | | | $ | 154,630 | | | $ | 25,850 | | | $ | 99,625 | | | $ | 621,075 | | | $ | 105,320 | | | $ | 191,680 | | | $ | 25,850 | | | $ | 37,050 | | | $ | 98,300 | |
Audit-Related Fees(1) | | $ | 0 | | | $ | 0 | | | $ | 0 | | | $ | 0 | | | $ | 0 | | | $ | 0 | | | $ | 0 | | | $ | 0 | | | $ | 0 | | | $ | 0 | | | $ | 0 | |
Tax Fees(2) | | $ | 351,829 | | | $ | 63,439 | | | $ | 52,884 | | | $ | 9,890 | | | $ | 28,606 | | | $ | 430,938 | | | $ | 65,089 | | | $ | 85,957 | | | $ | 11,190 | | | $ | 16,000 | | | $ | 24,768 | |
All Other Fees(3) | | $ | 0 | | | $ | 0 | | | $ | 0 | | | $ | 0 | | | $ | 0 | | | $ | 0 | | | $ | 0 | | | $ | 0 | | | $ | 0 | | | $ | 0 | | | $ | 0 | |
| | | | | | | | | | | | | | | | | | | | | | | | | | | | | | | | | | | | | | | | | | | | |
Total | | $ | 923,492 | | | $ | 168,759 | | | $ | 207,514 | | | $ | 35,740 | | | $ | 128,231 | | | $ | 1,052,013 | | | $ | 170,409 | | | $ | 277,637 | | | $ | 37,040 | | | $ | 53,050 | | | $ | 123,068 | |
| | | | | | | | | | | | | | | | | | | | | | | | | | | | | | | | | | | | | | | | | | | | |
| * | Information is not presented for fiscal years ended 7/31/18 and 8/31/18, as no Series in the Trust with such fiscal years end were in operation during such period. |
| (1) | Audit-related fees consist of the aggregate fees billed for assurance and related services that are reasonably related to the performance of the audit of the registrant’s financial statements and are not reported under the category of audit fees. |
| (2) | Tax fees consist of the aggregate fees billed for professional services rendered by the principal accountant relating to tax compliance, tax advice, and tax planning and specifically include fees for tax return preparation and other related tax compliance/planning matters. |
| (3) | All other fees consist of the aggregate fees billed for products and services provided by the principal accountant other than audit, audit-related, and tax services. |
(e)(1) The registrant’s audit committee has adopted policies and procedures relating to thepre-approval of services provided by the registrant’s principal accountant (the“Pre-Approval Policies”). ThePre-Approval Policies establish a framework intended to assist the audit committee in the proper discharge of itspre-approval responsibilities. As a general matter, thePre-Approval Policies (i) specify certain types of audit, audit-related, tax, and other services determined to bepre-approved by the audit committee; and (ii) delineate specific procedures governing the mechanics of thepre-approval process, including the approval and monitoring of audit andnon-audit service fees. Unless a service is specificallypre-approved under thePre-Approval Policies, it must be separatelypre-approved by the audit committee.
ThePre-Approval Policies and the types of audit andnon-audit servicespre-approved therein must be reviewed and ratified by the registrant’s audit committee at least annually. The registrant’s audit committee maintains full responsibility for the appointment, compensation, and oversight of the work of the registrant’s principal accountant.
(e)(2) No services described in paragraphs (b)-(d) above were approved by the registrant’s audit committee pursuant to the “de minimis exception” set forth in Rule2-01(c)(7)(i)(C) of RegulationS-X.
(f) Not applicable.
(g)The following table presents (i) the aggregatenon-audit fees (i.e., fees for audit-related, tax, and other services) billed for services rendered to all of the Series in the Trust by D&T for the last two fiscal years of each Series; and (ii) the aggregatenon-audit fees (i.e., fees for audit-related, tax, and other services) billed to the Eaton Vance organization by D&T for the last two fiscal years of each Series.
| | | | | | | | | | | | | | | | | | | | | | | | | | | | | | | | | | | | | | | | | | | | |
Fiscal Years Ended* | | 10/31/17 | | | 12/31/17 | | | 1/31/18 | | | 2/28/18 | | | 9/30/18 | | | 10/31/18 | | | 12/31/18 | | | 1/31/19 | | | 2/28/19 | | | 7/31/19 | | | 9/30/19 | |
Registrant(1) | | $ | 351,829 | | | $ | 63,439 | | | $ | 52,884 | | | $ | 9,890 | | | $ | 28,606 | | | $ | 430,938 | | | $ | 65,089 | | | $ | 85,957 | | | $ | 11,190 | | | $ | 16,000 | | | $ | 24,768 | |
Eaton Vance(2) | | $ | 148,018 | | | $ | 148,018 | | | $ | 148,018 | | | $ | 148,018 | | | $ | 126,485 | | | $ | 126,485 | | | $ | 126,485 | | | $ | 126,485 | | | $ | 126,485 | | | $ | 60,130 | | | $ | 59,903 | |
| * | Information is not presented for fiscal years ended 7/31/18 and 8/31/18, as no Series in the Trust with such fiscal years end were in operation during such period. |
| (1) | Includes all of the Series of the Trust. During the fiscal years reported above, certain of the Funds were “feeder” funds in a “master-feeder” fund structure or funds of funds. |
| (2) | Various subsidiaries of Eaton Vance Corp. act in either an investment advisory and/or service provider capacity with respect to the Series and/or their respective “master” funds (if applicable). |
(h) The registrant’s audit committee has considered whether the provision by the registrant’s principal accountant ofnon-audit services to the registrant’s investment adviser and any entity controlling, controlled by, or under common control with the adviser that provides ongoing services to the registrant that were notpre-approved pursuant to Rule2-01(c)(7)(ii) of RegulationS-X is compatible with maintaining the principal accountant’s independence.
Item 5. Audit Committee of Listed Registrants
Not applicable.
Item 6. Schedule of Investments
Please see schedule of investments contained in the Report to Stockholders included under Item 1 of this FormN-CSR.
Item 7. Disclosure of Proxy Voting Policies and Procedures forClosed-End Management Investment Companies
Not applicable.
Item 8. Portfolio Managers ofClosed-End Management Investment Companies
Not applicable.
Item 9. Purchases of Equity Securities byClosed-End Management Investment Company and Affiliated Purchasers
Not applicable.
Item 10. Submission of Matters to a Vote of Security Holders
No material changes.
Item 11. Controls and Procedures
(a) It is the conclusion of the registrant’s principal executive officer and principal financial officer that the effectiveness of the registrant’s current disclosure controls and procedures (such disclosure controls and procedures having been evaluated within 90 days of the date of this filing) provide reasonable assurance that the information required to be disclosed by the registrant has been recorded, processed, summarized and reported within the time period specified in the Commission’s rules and forms and that the information required to be disclosed by the registrant has been accumulated and communicated to the registrant’s principal executive officer and principal financial officer in order to allow timely decisions regarding required disclosure.
(b) There have been no changes in the registrant’s internal controls over financial reporting during the period covered by this report that has materially affected, or is reasonably likely to materially affect, the registrant’s internal control over financial reporting.
Item 12. Disclosure of Securities Lending Activities forClosed-End Management Investment Companies
Not applicable.
Item 13. Exhibits
| | |
| (a)(1) | | Registrant’s Code of Ethics – Not applicable (please see Item 2). |
| |
| (a)(2)(i) | | Treasurer’s Section 302 certification. |
| |
| (a)(2)(ii) | | President’s Section 302 certification. |
| |
| (b) | | Combined Section 906 certification. |
Signatures
Pursuant to the requirements of the Securities Exchange Act of 1934 and the Investment Company Act of 1940, the registrant has duly caused this report to be signed on its behalf by the undersigned, thereunto duly authorized.
Eaton Vance Mutual Funds Trust
| | |
| By: | | /s/ Payson F. Swaffield |
| | Payson F. Swaffield |
| | President |
| |
| Date: | | November 21, 2019 |
Pursuant to the requirements of the Securities Exchange Act of 1934 and the Investment Company Act of 1940, this report has been signed below by the following persons on behalf of the registrant and in the capacities and on the dates indicated.
| | |
| By: | | /s/ James F. Kirchner |
| | James F. Kirchner |
| | Treasurer |
| |
| Date: | | November 21, 2019 |
| |
| By: | | /s/ Payson F. Swaffield |
| | Payson F. Swaffield |
| | President |
| |
| Date: | | November 21, 2019 |