UNITED STATES
SECURITIES AND EXCHANGE COMMISSION
Washington, D.C. 20549
FormN-CSR
CERTIFIED SHAREHOLDER REPORT OF REGISTERED
MANAGEMENT INVESTMENT COMPANIES
Investment Company Act File Number:811-04015
Eaton Vance Mutual Funds Trust
(Exact Name of Registrant as Specified in Charter)
Two International Place, Boston, Massachusetts 02110
(Address of Principal Executive Offices)
Maureen A. Gemma
Two International Place, Boston, Massachusetts 02110
(Name and Address of Agent for Services)
(617)482-8260
(Registrant’s Telephone Number)
September 30
Date of Fiscal Year End
March 31, 2019
Date of Reporting Period
Item 1. Reports to Stockholders

Eaton Vance
Municipal Income Funds
Semiannual Report
March 31, 2019
AMT-Free • National
Important Note. Beginning on January 1, 2021, as permitted by regulations adopted by the Securities and Exchange Commission, paper copies of each Fund’s annual and semi-annual shareholder reports will no longer be sent by mail unless you specifically request paper copies of the reports. Instead, the reports will be made available on the Funds’ website (eatonvance.com/funddocuments), and you will be notified by mail each time a report is posted and provided with a website address to access the report.
If you already elected to receive shareholder reports electronically, you will not be affected by this change and you need not take any action. If you are a direct investor, you may elect to receive shareholder reports and other communications from the Funds electronically by signing up for e-Delivery at eatonvance.com/edelivery. If you own your shares through a financial intermediary (such as a broker-dealer or bank), you must contact your financial intermediary to sign up.
You may elect to receive all future Fund shareholder reports in paper free of charge. If you are a direct investor, you can inform the Funds that you wish to continue receiving paper copies of your shareholder reports by calling 1-800-262-1122. If you own these shares through a financial intermediary, you must contact your financial intermediary or follow instructions included with this disclosure, if applicable, to elect to continue to receive paper copies of your shareholder reports. Your election to receive reports in paper will apply to all Eaton Vance funds held directly or to all funds held through your financial intermediary, as applicable.

Commodity Futures Trading Commission Registration. Effective December 31, 2012, the Commodity Futures Trading Commission (“CFTC”) adopted certain regulatory changes that subject registered investment companies and advisers to regulation by the CFTC if a fund invests more than a prescribed level of its assets in certain CFTC-regulated instruments (including futures, certain options and swap agreements) or markets itself as providing investment exposure to such instruments. Each Fund has claimed an exclusion from the definition of the term “commodity pool operator” under the Commodity Exchange Act. Accordingly, neither the Funds nor the adviser with respect to the operation of the Funds is subject to CFTC regulation. Because of its management of other strategies, each Fund’s adviser is registered with the CFTC as a commodity pool operator and a commodity trading advisor.
Fund shares are not insured by the FDIC and are not deposits or other obligations of, or guaranteed by, any depository institution. Shares are subject to investment risks, including possible loss of principal invested.
This report must be preceded or accompanied by a current summary prospectus or prospectus. Before investing, investors should consider carefully the investment objective, risks, and charges and expenses of a mutual fund. This and other important information is contained in the summary prospectus and prospectus, which can be obtained from a financial advisor. Prospective investors should read the prospectus carefully before investing. For further information, please call 1-800-262-1122.
Semiannual ReportMarch 31, 2019
Eaton Vance
Municipal Income Funds
Table of Contents
| | | | |
Performance and Fund Profile | | | | |
| |
| | | | |
AMT-Free Municipal Income Fund | | | 2 | |
National Municipal Income Fund | | | 3 | |
| |
| | | | |
| |
Endnotes and Additional Disclosures | | | 4 | |
| |
Fund Expenses | | | 5 | |
| |
Financial Statements | | | 7 | |
| |
Officers and Trustees | | | 41 | |
| |
Important Notices | | | 42 | |
Eaton Vance
AMT-Free Municipal Income Fund
March 31, 2019
Performance1,2
Portfolio ManagerCynthia J. Clemson
| | | | | | | | | | | | | | | | | | | | | | | | |
| % Average Annual Total Returns | | Class
Inception Date | | | Performance
Inception Date | | | Six Months | | | One Year | | | Five Years | | | Ten Years | |
Class A at NAV | | | 01/06/1998 | | | | 03/16/1978 | | | | 3.78 | % | | | 4.89 | % | | | 4.04 | % | | | 6.09 | % |
Class A with 4.75% Maximum Sales Charge | | | — | | | | — | | | | –1.12 | | | | –0.13 | | | | 3.03 | | | | 5.58 | |
Class C at NAV | | | 05/02/2006 | | | | 03/16/1978 | | | | 3.41 | | | | 4.12 | | | | 3.27 | | | | 5.30 | |
Class C with 1% Maximum Sales Charge | | | — | | | | — | | | | 2.41 | | | | 3.12 | | | | 3.27 | | | | 5.30 | |
Class I at NAV | | | 03/16/1978 | | | | 03/16/1978 | | | | 3.96 | | | | 5.17 | | | | 4.31 | | | | 6.34 | |
Bloomberg Barclays Municipal Bond Index | | | — | | | | — | | | | 4.63 | % | | | 5.38 | % | | | 3.73 | % | | | 4.71 | % |
Bloomberg Barclays Long (22+) Year Municipal Bond Index | | | — | | | | — | | | | 5.40 | | | | 5.86 | | | | 5.32 | | | | 6.72 | |
| | | | | | |
| | | | | | | | | | | | | | | | | | | | | | | | |
| % Total Annual Operating Expense Ratios3 | | | | | | | | | | | Class A | | | Class C | | | Class I | |
| | | | | | | | | | | | | | | 1.05 | % | | | 1.80 | % | | | 0.80 | % |
| | | | | | |
| | | | | | | | | | | | | | | | | | | | | | | | |
| % Distribution Rates/Yields4 | | | | | | | | | | | Class A | | | Class C | | | Class I | |
Distribution Rate | | | | | | | | | | | | | | | 3.58 | % | | | 2.83 | % | | | 3.84 | % |
Taxable-Equivalent Distribution Rate | | | | | | | | | | | | | | | 6.05 | | | | 4.78 | | | | 6.49 | |
SEC30-day Yield | | | | | | | | | | | | | | | 1.98 | | | | 1.34 | | | | 2.32 | |
Taxable-Equivalent SEC30-day Yield | | | | | | | | | | | | | | | 3.34 | | | | 2.26 | | | | 3.92 | |
| | | | | | |
| | | | | | | | | | | | | | | | | | | | | | | | |
| % Total Leverage5 | | | | | | | | | | | | | | | | | | |
Residual Interest Bond (RIB) Financing | | | | | | | | | | | | | | | | | | | | | | | 9.02 | % |
Fund Profile
Credit Quality (% of total investments)6,7
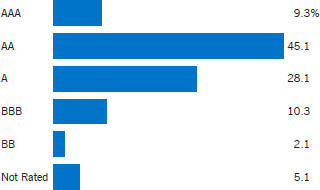
See Endnotes and Additional Disclosures in this report.
Past performance is no guarantee of future results. Returns are historical and are calculated by determining the percentage change in net asset value (NAV) or offering price (as applicable) with all distributions reinvested. Investment return and principal value will fluctuate so that shares, when redeemed, may be worth more or less than their original cost. Performance less than or equal to one year is cumulative. Performance is for the stated time period only; due to market volatility, the Fund’s current performance may be lower or higher than quoted. Returns are before taxes unless otherwise noted. For performance as of the most recentmonth-end, please refer to eatonvance.com.
Eaton Vance
National Municipal Income Fund
March 31, 2019
Performance1,2
Portfolio Manager Craig R. Brandon, CFA
| | | | | | | | | | | | | | | | | | | | | | | | |
| % Average Annual Total Returns | | Class
Inception Date | | | Performance
Inception Date | | | Six Months | | | One Year | | | Five Years | | | Ten Years | |
Class A at NAV | | | 04/05/1994 | | | | 12/19/1985 | | | | 4.06 | % | | | 5.45 | % | | | 4.74 | % | | | 6.64 | % |
Class A with 4.75% Maximum Sales Charge | | | — | | | | — | | | | –0.87 | | | | 0.47 | | | | 3.73 | | | | 6.12 | |
Class B at NAV | | | 12/19/1985 | | | | 12/19/1985 | | | | 3.67 | | | | 4.66 | | | | 3.96 | | | | 5.86 | |
Class B with 5% Maximum Sales Charge | | | — | | | | — | | | | –1.33 | | | | –0.34 | | | | 3.62 | | | | 5.86 | |
Class C at NAV | | | 12/03/1993 | | | | 12/19/1985 | | | | 3.67 | | | | 4.66 | | | | 3.96 | | | | 5.86 | |
Class C with 1% Maximum Sales Charge | | | — | | | | — | | | | 2.67 | | | | 3.66 | | | | 3.96 | | | | 5.86 | |
Class I at NAV | | | 07/01/1999 | | | | 12/19/1985 | | | | 4.18 | | | | 5.71 | | | | 5.00 | | | | 6.91 | |
Bloomberg Barclays Municipal Bond Index | | | — | | | | — | | | | 4.63 | % | | | 5.38 | % | | | 3.73 | % | | | 4.71 | % |
Bloomberg Barclays Long (22+) Year Municipal Bond Index | | | — | | | | — | | | | 5.40 | | | | 5.86 | | | | 5.32 | | | | 6.72 | |
| | | | | | |
| | | | | | | | | | | | | | | | | | | | | | | | |
| % Total Annual Operating Expense Ratios3 | | | | | | | | Class A | | | Class B | | | Class C | | | Class I | |
| | | | | | | | | | | 0.88 | % | | | 1.63 | % | | | 1.63 | % | | | 0.63 | % |
| | | | | | |
| | | | | | | | | | | | | | | | | | | | | | | | |
| % Distribution Rates/Yields4 | | | | | | | | Class A | | | Class B | | | Class C | | | Class I | |
Distribution Rate | | | | | | | | | | | 3.40 | % | | | 2.65 | % | | | 2.65 | % | | | 3.65 | % |
Taxable-Equivalent Distribution Rate | | | | | | | | | | | 5.74 | | | | 4.48 | | | | 4.48 | | | | 6.17 | |
SEC30-day Yield | | | | | | | | | | | 2.07 | | | | 1.43 | | | | 1.43 | | | | 2.42 | |
Taxable-Equivalent SEC30-day Yield | | | | | | | | | | | 3.50 | | | | 2.42 | | | | 2.42 | | | | 4.09 | |
| | | | | | |
| | | | | | | | | | | | | | | | | | | | | | | | |
| % Total Leverage5 | | | | | | | | | | | | | | | | | | |
RIB Financing | | | | | | | | | | | | | | | | | | | | | | | 5.34 | % |
Fund Profile
Credit Quality (% of total investments)6,7
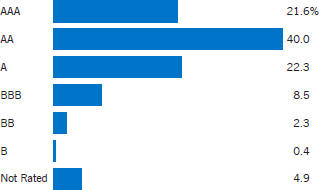
See Endnotes and Additional Disclosures in this report.
Past performance is no guarantee of future results. Returns are historical and are calculated by determining the percentage change in net asset value (NAV) or offering price (as applicable) with all distributions reinvested. Investment return and principal value will fluctuate so that shares, when redeemed, may be worth more or less than their original cost. Performance less than or equal to one year is cumulative. Performance is for the stated time period only; due to market volatility, the Fund’s current performance may be lower or higher than quoted. Returns are before taxes unless otherwise noted. For performance as of the most recentmonth-end, please refer to eatonvance.com.
Eaton Vance
Municipal Income Funds
March 31, 2019
Endnotes and Additional Disclosures
| 1 | Bloomberg Barclays Municipal Bond Index is an unmanaged index of municipal bonds traded in the U.S. Bloomberg Barclays Long (22+) Year Municipal Bond Index is an unmanaged index of municipal bonds traded in the U.S. with maturities of 22 years or more. Unless otherwise stated, index returns do not reflect the effect of any applicable sales charges, commissions, expenses, taxes or leverage, as applicable. It is not possible to invest directly in an index. |
| 2 | Total Returns at NAV do not include applicable sales charges. If sales charges were deducted, the returns would be lower. Total Returns shown with maximum sales charge reflect the stated maximum sales charge. Unless otherwise stated, performance does not reflect the deduction of taxes on Fund distributions or redemptions of Fund shares. Performance since inception for an index, if presented, is the performance since the Fund’s or oldest share class’ inception, as applicable. |
| 3 | Source: Fund prospectus. The expense ratios for the current reporting period can be found in the Financial Highlights section of this report. |
| 4 | The Distribution Rate is based on the Fund’s last regular distribution per share in the period (annualized) divided by the Fund’s NAV at the end of the period. The Fund’s distributions may be comprised of amounts characterized for federal income tax purposes astax-exempt income, qualified andnon-qualified ordinary dividends, capital gains and nondividend distributions, also known as return of capital. The Fund will determine the federal income tax character of distributions paid to a shareholder after the end of the calendar year. This is reported on the IRS form1099-DIV and provided to the shareholder shortly after eachyear-end. The Fund’s distributions are determined by the investment adviser based on its current assessment of the Fund’s long-term return potential. As portfolio and market conditions change, the rate of distributions paid by the Fund could change. Taxable-equivalent performance is based on the highest combined federal and state income tax rates, where applicable. Lower tax rates would result in lowertax-equivalent performance. Actual tax rates will vary depending on your income, exemptions and deductions. Rates do not include local taxes. The SEC Yield is a standardized measure based on the estimated yield to maturity of a fund’s investments over a30-day period and is based on the maximum offer price at the date specified. The SEC Yield is not based on the distributions made by the Fund, which may differ. |
| 5 | Fund employs RIB financing. The leverage created by RIB investments provides an opportunity for increased income but, at the same time, creates special risks (including the likelihood of greater volatility of NAV). The cost of leverage rises and falls with changes in short-term interest rates. See “Floating Rate Notes Issued in Conjunction with Securities Held” in the notes to the financial statements for more information about RIB financing. RIB leverage represents the amount of Floating Rate Notes outstanding at period end as a percentage of Fund net assets plus Floating Rate Notes. |
| 6 | Ratings are based on Moody’s Investors Service, Inc. (“Moody’s”), S&P Global Ratings (“S&P”) or Fitch Ratings (“Fitch”), as applicable. If securities are rated differently by the ratings agencies, the highest rating is applied. Ratings, which are subject to change, apply to the creditworthiness of the issuers of the underlying securities and not to the Fund or its shares. Credit ratings measure the quality of a bond based on the issuer’s creditworthiness, with ratings ranging from AAA, being the highest, to D, being the lowest based on S&P’s measures. Ratings of BBB or higher by S&P or Fitch (Baa or higher by Moody’s) are considered to be investment-grade quality. Credit ratings are based largely on the ratings agency’s analysis at the time of rating. The rating assigned to any particular security is not necessarily a reflection of the issuer’s current financial condition and does not necessarily reflect its assessment of the volatility of a security’s market value or of the liquidity of an investment in the security. Holdings designated as “Not Rated” (if any) are not rated by the national ratings agencies stated above. |
| 7 | The chart includes the municipal bonds held by a trust that issues residual interest bonds, consistent with the Portfolio of Investments. |
| | Fund profiles subject to change due to active management. |
Eaton Vance
Municipal Income Funds
March 31, 2019
Fund Expenses
Example: As a Fund shareholder, you incur two types of costs: (1) transaction costs, including sales charges (loads) on purchases and redemption fees (if applicable); and (2) ongoing costs, including management fees; distribution and/or service fees; and other Fund expenses. This Example is intended to help you understand your ongoing costs (in dollars) of Fund investing and to compare these costs with the ongoing costs of investing in other mutual funds. The Example is based on an investment of $1,000 invested at the beginning of the period and held for the entire period (October 1, 2018 – March 31, 2019).
Actual Expenses: The first section of each table below provides information about actual account values and actual expenses. You may use the information in this section, together with the amount you invested, to estimate the expenses that you paid over the period. Simply divide your account value by $1,000 (for example, an $8,600 account value divided by $1,000 = 8.6), then multiply the result by the number in the first section under the heading entitled “Expenses Paid During Period” to estimate the expenses you paid on your account during this period.
Hypothetical Example for Comparison Purposes: The second section of each table below provides information about hypothetical account values and hypothetical expenses based on the actual Fund expense ratio and an assumed rate of return of 5% per year (before expenses), which is not the actual Fund return. The hypothetical account values and expenses may not be used to estimate the actual ending account balance or expenses you paid for the period. You may use this information to compare the ongoing costs of investing in your Fund and other funds. To do so, compare this 5% hypothetical example with the 5% hypothetical examples that appear in the shareholder reports of the other funds.
Please note that the expenses shown in each table are meant to highlight your ongoing costs only and do not reflect any transactional costs, such as sales charges (loads) or redemption fees (if applicable). Therefore, the second section of each table is useful in comparing ongoing costs only, and will not help you determine the relative total costs of owning different funds. In addition, if these transactional costs were included, your costs would be higher.
Eaton Vance AMT-Free Municipal Income Fund
| | | | | | | | | | | | | | | | |
| | | Beginning
Account Value
(10/1/18) | | | Ending
Account Value
(3/31/19) | | | Expenses Paid
During Period*
(10/1/18 – 3/31/19) | | | Annualized
Expense
Ratio | |
| | | | |
Actual | | | | | | | | | | | | | | | | |
Class A | | $ | 1,000.00 | | | $ | 1,037.80 | | | $ | 5.44 | | | | 1.07 | % |
Class C | | $ | 1,000.00 | | | $ | 1,034.10 | | | $ | 9.23 | | | | 1.82 | % |
Class I | | $ | 1,000.00 | | | $ | 1,039.60 | | | $ | 4.17 | | | | 0.82 | % |
| | | | | |
Hypothetical | | | | | | | | | | | | | | | | |
(5% return per year before expenses) | | | | | | | | | | | | | | | | |
Class A | | $ | 1,000.00 | | | $ | 1,019.60 | | | $ | 5.39 | | | | 1.07 | % |
Class C | | $ | 1,000.00 | | | $ | 1,015.90 | | | $ | 9.15 | | | | 1.82 | % |
Class I | | $ | 1,000.00 | | | $ | 1,020.80 | | | $ | 4.13 | | | | 0.82 | % |
| * | Expenses are equal to the Fund’s annualized expense ratio for the indicated Class, multiplied by the average account value over the period, multiplied by 182/365 (to reflect the one-half year period). The Example assumes that the $1,000 was invested at the net asset value per share determined at the close of business on September 30, 2018. |
Eaton Vance
Municipal Income Funds
March 31, 2019
Fund Expenses — continued
Eaton Vance National Municipal Income Fund
| | | | | | | | | | | | | | | | |
| | | Beginning
Account Value
(10/1/18) | | | Ending
Account Value
(3/31/19) | | | Expenses Paid
During Period*
(10/1/18 – 3/31/19) | | | Annualized
Expense
Ratio | |
| | | | |
Actual | | | | | | | | | | | | | | | | |
Class A | | $ | 1,000.00 | | | $ | 1,040.60 | | | $ | 4.22 | | | | 0.83 | % |
Class B | | $ | 1,000.00 | | | $ | 1,036.70 | | | $ | 8.07 | | | | 1.59 | % |
Class C | | $ | 1,000.00 | | | $ | 1,036.70 | | | $ | 8.07 | | | | 1.59 | % |
Class I | | $ | 1,000.00 | | | $ | 1,041.80 | | | $ | 2.95 | | | | 0.58 | % |
| | | | | |
Hypothetical | | | | | | | | | | | | | | | | |
(5% return per year before expenses) | | | | | | | | | | | | | | | | |
Class A | | $ | 1,000.00 | | | $ | 1,020.80 | | | $ | 4.18 | | | | 0.83 | % |
Class B | | $ | 1,000.00 | | | $ | 1,017.00 | | | $ | 8.00 | | | | 1.59 | % |
Class C | | $ | 1,000.00 | | | $ | 1,017.00 | | | $ | 8.00 | | | | 1.59 | % |
Class I | | $ | 1,000.00 | | | $ | 1,022.00 | | | $ | 2.92 | | | | 0.58 | % |
| * | Expenses are equal to the Fund’s annualized expense ratio for the indicated Class, multiplied by the average account value over the period, multiplied by 182/365 (to reflect the one-half year period). The Example assumes that the $1,000 was invested at the net asset value per share determined at the close of business on September 30, 2018. |
Eaton Vance
AMT-Free Municipal Income Fund
March 31, 2019
Portfolio of Investments (Unaudited)
| | | | | | | | |
| Tax-Exempt Municipal Securities — 106.8% | |
| Security | | Principal
Amount
(000’s omitted) | | | Value | |
|
| Bond Bank — 3.4% | |
| | |
New York State Environmental Facilities Corp., 5.00%, 10/15/35(1) | | $ | 9,900 | | | $ | 10,236,105 | |
| | |
| | | | | | | $ | 10,236,105 | |
|
| Education — 7.2% | |
| | |
Connecticut Health and Educational Facilities Authority, (Fairfield University), 5.00%, 7/1/46 | | $ | 5,000 | | | $ | 5,596,050 | |
| | |
Connecticut Health and Educational Facilities Authority, (Sacred Heart University), 5.00%, 7/1/42 | | | 2,125 | | | | 2,407,922 | |
| | |
North Carolina Capital Facilities Finance Agency, (Duke University), 5.00%, 10/1/41 | | | 1,050 | | | | 1,197,515 | |
| | |
Oregon Facilities Authority, (Lewis & Clark College), 5.625%, 10/1/36 | | | 1,050 | | | | 1,143,545 | |
| | |
Pennsylvania Higher Educational Facilities Authority, (Drexel University), 5.00%, 5/1/37 | | | 1,750 | | | | 2,015,247 | |
| | |
Pima County Community College District, AZ, 5.00%, 7/1/35 | | | 725 | | | | 867,731 | |
| | |
University of California, 5.25%, 5/15/35 | | | 3,555 | | | | 4,098,453 | |
| | |
University of Nebraska, 5.00%, 5/15/35 | | | 1,000 | | | | 1,151,060 | |
| | |
West Virginia University, 5.00%, 10/1/31 | | | 3,000 | | | | 3,286,170 | |
| | |
| | | | | | | $ | 21,763,693 | |
|
| Electric Utilities — 4.5% | |
| | |
Apache County Industrial Development Authority, AZ, (Tucson Electric Power Co.), 4.50%, 3/1/30 | | $ | 1,605 | | | $ | 1,688,620 | |
| | |
Chula Vista, CA, (San Diego Gas and Electric), 5.875%, 2/15/34 | | | 3,520 | | | | 3,546,365 | |
| | |
Northern Municipal Power Agency, MN, 5.00%, 1/1/31 | | | 200 | | | | 235,366 | |
| | |
Northern Municipal Power Agency, MN, 5.00%, 1/1/32 | | | 210 | | | | 245,484 | |
| | |
Northern Municipal Power Agency, MN, 5.00%, 1/1/33 | | | 235 | | | | 272,955 | |
| | |
Northern Municipal Power Agency, MN, 5.00%, 1/1/34 | | | 210 | | | | 243,155 | |
| | |
Northern Municipal Power Agency, MN, 5.00%, 1/1/35 | | | 170 | | | | 196,403 | |
| | |
Northern Municipal Power Agency, MN, 5.00%, 1/1/36 | | | 160 | | | | 184,291 | |
| | |
Pima County Industrial Development Authority, AZ, (Tucson Electric Power Co.), 5.25%, 10/1/40 | | | 1,410 | | | | 1,471,504 | |
| | |
Utility Debt Securitization Authority, NY, 5.00%, 12/15/33 | | | 2,895 | | | | 3,290,833 | |
| | |
Vernon, CA, Electric System Revenue, 5.125%, 8/1/21 | | | 2,035 | | | | 2,056,693 | |
| | |
| | | | | | | $ | 13,431,669 | |
|
| Escrowed / Prerefunded — 9.4% | |
| | |
Brooklyn Arena Local Development Corp., NY, (Barclays Center), Prerefunded to 1/15/20, 6.00%, 7/15/30 | | $ | 880 | | | $ | 911,583 | |
| | |
Brooklyn Arena Local Development Corp., NY, (Barclays Center), Prerefunded to 1/15/20, 6.25%, 7/15/40 | | | 1,320 | | | | 1,369,949 | |
| | | | | | | | |
| Security | | Principal
Amount
(000’s omitted) | | | Value | |
|
| Escrowed / Prerefunded (continued) | |
| | |
Henrico County Economic Development Authority, VA, (Bon Secours Health System, Inc.), Prerefunded to 11/1/22, 5.00%, 11/1/30 | | $ | 1,185 | | | $ | 1,319,391 | |
| | |
Kansas Development Finance Authority, (Adventist Health System), Prerefunded to 11/15/19, 5.75%, 11/15/38 | | | 5,115 | | | | 5,248,450 | |
| | |
Massachusetts Development Finance Agency, (Tufts Medical Center), Prerefunded to 1/1/21, 6.75%, 1/1/36 | | | 470 | | | | 511,355 | |
| | |
Massachusetts Development Finance Agency, (Tufts Medical Center), Prerefunded to 1/1/21, 6.75%, 1/1/36 | | | 315 | | | | 342,717 | |
| | |
New Jersey Turnpike Authority, Prerefunded to 7/1/22, 5.00%, 1/1/30 | | | 3,060 | | | | 3,396,080 | |
| | |
Oklahoma Development Finance Authority, (St. John Health System), Prerefunded to 2/15/22, 5.00%, 2/15/34 | | | 2,035 | | | | 2,229,465 | |
| | |
Savannah Economic Development Authority, GA, Escrowed to Maturity, 0.00%, 12/1/21 | | | 6,000 | | | | 5,723,340 | |
| | |
Vernon, CA, Electric System Revenue, Prerefunded to 8/1/19, 5.125%, 8/1/21 | | | 930 | | | | 941,299 | |
| | |
Washington, Prerefunded to 2/1/21, 5.25%, 2/1/36(1) | | | 6,000 | | | | 6,409,140 | |
| | |
| | | | | | | $ | 28,402,769 | |
|
| General Obligations — 17.1% | |
| | |
Beaverton School District No. 48J, Washington and Multnomah Counties, OR, 5.00%, 6/15/36 | | $ | 1,000 | | | $ | 1,186,090 | |
| | |
California, 5.00%, 4/1/35 | | | 2,125 | | | | 2,407,306 | |
| | |
California, 5.25%, 10/1/29 | | | 560 | | | | 611,106 | |
| | |
California, 5.25%, 10/1/32 | | | 3,480 | | | | 3,778,793 | |
| | |
Chicago, IL, 5.00%, 1/1/39(2) | | | 1,400 | | | | 1,501,234 | |
| | |
Chicago Board of Education, IL, 5.00%, 12/1/21 | | | 230 | | | | 241,445 | |
| | |
Chicago Board of Education, IL, 5.00%, 12/1/46 | | | 1,405 | | | | 1,474,828 | |
| | |
Chicago Board of Education, IL, 5.00%, 12/1/46 | | | 270 | | | | 278,087 | |
| | |
Corvallis School District No. 509J, OR, 5.00%, (0.00% until 6/15/20), 6/15/38 | | | 1,680 | | | | 1,879,382 | |
| | |
District of Columbia, 5.00%, 6/1/37(1) | | | 7,000 | | | | 8,286,110 | |
| | |
Fennville Public Schools, MI, 4.00%, 5/1/34 | | | 1,000 | | | | 1,121,500 | |
| | |
Foothill-De Anza Community College District, CA, 5.00%, 8/1/34 | | | 1,150 | | | | 1,331,585 | |
| | |
Foothill-De Anza Community College District, CA, 5.00%, 8/1/36 | | | 1,150 | | | | 1,329,687 | |
| | |
Illinois, 5.00%, 11/1/21 | | | 2,000 | | | | 2,123,420 | |
| | |
Illinois, 5.00%, 1/1/26 | | | 5,000 | | | | 5,486,450 | |
| | |
Illinois, 5.00%, 5/1/35 | | | 2,000 | | | | 2,088,860 | |
| | |
Kane, Cook and DuPage Counties School District No. 46, IL, 5.00%, 1/1/31 | | | 4,470 | | | | 4,972,026 | |
| | |
Rockville Centre, NY, 4.00%, 11/15/41 | | | 435 | | | | 474,076 | |
| | |
Salem-Keizer School District No. 24J, OR, 0.00%, 6/15/24 | | | 1,220 | | | | 1,101,355 | |
| | |
Santa Clara County, CA, (Election of 2008), Prerefunded to 8/1/19, 5.00%, 8/1/39(1) | | | 7,700 | | | | 7,792,939 | |
| | | | |
| | 7 | | See Notes to Financial Statements. |
Eaton Vance
AMT-Free Municipal Income Fund
March 31, 2019
Portfolio of Investments (Unaudited) — continued
| | | | | | | | |
| Security | | Principal
Amount
(000’s omitted) | | | Value | |
|
| General Obligations (continued) | |
| | |
Springfield School District No. 19, OR, 5.00%, 6/15/30 | | $ | 1,085 | | | $ | 1,265,772 | |
| | |
University of Connecticut, 5.00%, 2/15/32 | | | 650 | | | | 718,413 | |
| | |
Wentzville R-IV School District, MO, 0.00%, 3/1/29 | | | 60 | | | | 44,979 | |
| | |
| | | | | | | $ | 51,495,443 | |
|
| Hospital — 15.7% | |
| | |
California Health Facilities Financing Authority, (Catholic Healthcare West), 5.25%, 3/1/28 | | $ | 535 | | | $ | 570,503 | |
| | |
California Health Facilities Financing Authority, (Providence Health System), 5.50%, 10/1/39 | | | 5,175 | | | | 5,274,567 | |
| | |
California Health Facilities Financing Authority, (St. Joseph Health System), 5.00%, 7/1/33 | | | 1,720 | | | | 1,933,968 | |
| | |
California Health Facilities Financing Authority, (St. Joseph Health System), 5.00%, 7/1/37 | | | 2,300 | | | | 2,562,246 | |
| | |
California Health Facilities Financing Authority, (Sutter Health), 5.25%, 8/15/31 | | | 1,325 | | | | 1,435,386 | |
| | |
California Statewide Communities Development Authority, (John Muir Health), Prerefunded to 7/1/19, 5.00%, 7/1/29 | | | 1,330 | | | | 1,341,677 | |
| | |
California Statewide Communities Development Authority, (Loma Linda University Medical Center), 5.25%, 12/1/34 | | | 3,000 | | | | 3,323,430 | |
| | |
Colorado Health Facilities Authority, (Vail Valley Medical Center), 4.00%, 1/15/45 | | | 2,155 | | | | 2,223,938 | |
| | |
Colorado Health Facilities Authority, (Vail Valley Medical Center), 5.00%, 1/15/35 | | | 2,000 | | | | 2,285,980 | |
| | |
Delaware Health Facilities Authority, (Beebe Medical Center), 5.00%, 6/1/36 | | | 3,730 | | | | 4,262,084 | |
| | |
Delaware Health Facilities Authority, (Beebe Medical Center), 5.00%, 6/1/37 | | | 1,000 | | | | 1,138,070 | |
| | |
Illinois Finance Authority, (Presence Health Network), 4.00%, 2/15/36 | | | 5,345 | | | | 5,728,130 | |
| | |
Massachusetts Development Finance Agency, (Children’s Hospital), 5.00%, 10/1/31 | | | 2,110 | | | | 2,441,270 | |
| | |
Missouri Health and Educational Facilities Authority, (Mercy Health), 5.00%, 11/15/47 | | | 3,000 | | | | 3,443,550 | |
| | |
Ohio, (University Hospitals Health Systems, Inc.), 5.00%, 1/15/36 | | | 2,500 | | | | 2,815,075 | |
| | |
Orange County Health Facilities Authority, FL, (Orlando Health, Inc.), 5.375%, 10/1/23 | | | 1,000 | | | | 1,019,120 | |
| | |
Tarrant County Cultural Education Facilities Finance Corp., TX, (Cook Children’s Medical Center), 5.25%, 12/1/39(1) | | | 5,000 | | | | 5,617,800 | |
| | |
| | | | | | | $ | 47,416,794 | |
|
| Housing — 0.7% | |
| | |
Phoenix Industrial Development Authority, AZ, (Downtown Phoenix Student Housing, LLC - Arizona State University), 5.00%, 7/1/37 | | $ | 500 | | | $ | 563,795 | |
| | |
Phoenix Industrial Development Authority, AZ, (Downtown Phoenix Student Housing, LLC - Arizona State University), 5.00%, 7/1/42 | | | 1,250 | | | | 1,393,488 | |
| | | | | | | | |
| Security | | Principal
Amount
(000’s omitted) | | | Value | |
|
| Housing (continued) | |
| | |
Texas Student Housing Corp., (University of North Texas), 9.375%, 7/1/06(3) | | $ | 285 | | | $ | 252,225 | |
| | |
| | | | | | | $ | 2,209,508 | |
|
| Industrial Development Revenue — 0.9% | |
| | |
Selma Industrial Development Board, AL, (International Paper Co.), 5.80%, 5/1/34 | | $ | 2,670 | | | $ | 2,774,931 | |
| | |
| | | | | | | $ | 2,774,931 | |
|
| Insured – Education — 0.7% | |
| | |
Virginia College Building Authority, (Washington and Lee University), (NPFG), 5.25%, 1/1/31 | | $ | 1,750 | | | $ | 2,166,623 | |
| | |
| | | | | | | $ | 2,166,623 | |
|
| Insured – Electric Utilities — 0.7% | |
| | |
Ohio Municipal Electric Generation Agency, (NPFG), 0.00%, 2/15/29 | | $ | 2,865 | | | $ | 2,189,376 | |
| | |
| | | | | | | $ | 2,189,376 | |
|
| Insured – Escrowed / Prerefunded — 0.5% | |
| | |
Texas Transportation Commission, (Central Texas Turnpike System), (AMBAC), Escrowed to Maturity, 0.00%, 8/15/21 | | $ | 1,560 | | | $ | 1,499,378 | |
| | |
| | | | | | | $ | 1,499,378 | |
|
| Insured – General Obligations — 0.8% | |
| | |
Atlantic City, NJ, (AGM), 4.00%, 3/1/42 | | $ | 145 | | | $ | 152,169 | |
| | |
Chicago Board of Education, IL, (AGM), 5.00%, 12/1/24 | | | 505 | | | | 569,801 | |
| | |
Proviso Township High School District No. 209, IL, (AGM), 4.00%, 12/1/38 | | | 1,500 | | | | 1,561,320 | |
| | |
| | | | | | | $ | 2,283,290 | |
|
| Insured – Lease Revenue / Certificates of Participation — 1.9% | |
| | |
Anaheim Public Financing Authority, CA, (Anaheim Public Improvements), (AGM), 0.00%, 9/1/31 | | $ | 8,680 | | | $ | 5,851,883 | |
| | |
| | | | | | | $ | 5,851,883 | |
|
| Insured – Other Revenue — 1.9% | |
| | |
Harris County-Houston Sports Authority, TX, (AGM), (NPFG), 0.00%, 11/15/34 | | $ | 10,600 | | | $ | 5,702,058 | |
| | |
| | | | | | | $ | 5,702,058 | |
|
| Insured – Special Tax Revenue — 5.8% | |
| | |
Alabama Public School and College Authority, (AGM), 2.50%, 12/1/27 | | $ | 5,265 | | | $ | 5,266,158 | |
| | | | |
| | 8 | | See Notes to Financial Statements. |
Eaton Vance
AMT-Free Municipal Income Fund
March 31, 2019
Portfolio of Investments (Unaudited) — continued
| | | | | | | | |
| Security | | Principal
Amount
(000’s omitted) | | | Value | |
|
| Insured – Special Tax Revenue (continued) | |
| | |
Massachusetts, Dedicated Tax Revenue, (NPFG), 5.50%, 1/1/27 | | $ | 6,000 | | | $ | 7,561,020 | |
| | |
Massachusetts, Dedicated Tax Revenue, (NPFG), 5.50%, 1/1/30 | | | 2,565 | | | | 3,369,307 | |
| | |
Successor Agency to San Francisco City and County Redevelopment Agency, CA, (NPFG), 5.00%, 8/1/43 | | | 1,100 | | | | 1,250,535 | |
| | |
| | | | | | | $ | 17,447,020 | |
|
| Insured – Transportation — 9.1% | |
| | |
Chicago, IL, (O’Hare International Airport), (AGM), 5.00%, 1/1/28 | | $ | 1,000 | | | $ | 1,112,780 | |
| | |
Chicago, IL, (O’Hare International Airport), (AGM), 5.125%, 1/1/31 | | | 1,000 | | | | 1,111,530 | |
| | |
Chicago, IL, (O’Hare International Airport), (AGM), 5.25%, 1/1/32 | | | 785 | | | | 873,367 | |
| | |
E-470 Public Highway Authority, CO, (NPFG), 0.00%, 9/1/39 | | | 7,120 | | | | 2,834,472 | |
| | |
Metropolitan Transportation Authority, NY, Green Bonds, (AGM), 4.00%, 11/15/46 | | | 1,635 | | | | 1,743,597 | |
| | |
Pennsylvania Turnpike Commission, (AGM), 6.375%, 12/1/38 | | | 11,500 | | | | 14,706,660 | |
| | |
Texas Transportation Commission, (Central Texas Turnpike System), (AMBAC), 0.00%, 8/15/21 | | | 5,285 | | | | 5,057,005 | |
| | |
| | | | | | | $ | 27,439,411 | |
|
| Insured – Water and Sewer — 2.5% | |
| | |
Detroit, MI, Sewage Disposal System, (AGM), 5.00%, 7/1/39 | | $ | 4,825 | | | $ | 5,173,896 | |
| | |
Michigan Finance Authority, (Detroit Water and Sewerage Department), (AGM), 5.00%, 7/1/32 | | | 655 | | | | 735,578 | |
| | |
Michigan Finance Authority, (Detroit Water and Sewerage Department), (AGM), 5.00%, 7/1/33 | | | 565 | | | | 632,241 | |
| | |
Michigan Finance Authority, (Detroit Water and Sewerage Department), (AGM), 5.00%, 7/1/35 | | | 280 | | | | 312,292 | |
| | |
Michigan Finance Authority, (Detroit Water and Sewerage Department), (AGM), 5.00%, 7/1/37 | | | 565 | | | | 627,246 | |
| | |
| | | | | | | $ | 7,481,253 | |
|
| Lease Revenue / Certificates of Participation — 1.7% | |
| | |
Hudson Yards Infrastructure Corp., NY, 4.00%, 2/15/44 | | $ | 1,830 | | | $ | 1,948,822 | |
| | |
New Jersey Economic Development Authority, (School Facilities Construction), 5.00%, 6/15/37 | | | 3,000 | | | | 3,305,220 | |
| | |
| | | | | | | $ | 5,254,042 | |
|
| Other Revenue — 1.7% | |
| | |
Austin Convention Enterprises, Inc., TX, (Convention Center Hotel), 5.00%, 1/1/22 | | $ | 400 | | | $ | 434,036 | |
| | |
Central Falls Detention Facility Corp., RI, 7.25%, 7/15/35(4) | | | 1,200 | | | | 216,000 | |
| | |
Cleveland-Cuyahoga County Port Authority, OH, (Playhouse Square Foundation), 5.25%, 12/1/38 | | | 970 | | | | 1,086,991 | |
| | | | | | | | |
| Security | | Principal
Amount
(000’s omitted) | | | Value | |
|
| Other Revenue (continued) | |
| | |
Cleveland-Cuyahoga County Port Authority, OH, (Playhouse Square Foundation), 5.50%, 12/1/43 | | $ | 355 | | | $ | 400,653 | |
| | |
Mercer County Improvement Authority, NJ, 4.00%, 3/15/40 | | | 1,375 | | | | 1,500,524 | |
| | |
White Earth Band of Chippewa Indians, MN, 6.375%, 12/1/26(5) | | | 1,540 | | | | 1,540,493 | |
| | |
| | | | | | | $ | 5,178,697 | |
|
| Senior Living / Life Care — 3.5% | |
| | |
Palm Beach County Health Facilities Authority, FL, (Sinai Residences of Boca Raton), 7.25%, 6/1/39 | | $ | 570 | | | $ | 640,190 | |
| | |
Palm Beach County Health Facilities Authority, FL, (Sinai Residences of Boca Raton), 7.50%, 6/1/49 | | | 2,690 | | | | 3,037,682 | |
| | |
Saint Louis County Industrial Development Authority, MO, (St. Andrew’s Resources for Seniors Obligated Group), 5.00%, 12/1/35 | | | 1,700 | | | | 1,785,306 | |
| | |
Tempe Industrial Development Authority, AZ, (Friendship Village of Tempe), 6.00%, 12/1/32 | | | 160 | | | | 169,078 | |
| | |
Tempe Industrial Development Authority, AZ, (Friendship Village of Tempe), 6.25%, 12/1/42 | | | 660 | | | | 698,498 | |
| | |
Washington Housing Finance Commission, (Horizon House), 5.00%, 1/1/32(5) | | | 1,575 | | | | 1,767,150 | |
| | |
Washington Housing Finance Commission, (Horizon House), 5.00%, 1/1/38(5) | | | 2,325 | | | | 2,564,987 | |
| | |
| | | | | | | $ | 10,662,891 | |
|
| Special Tax Revenue — 2.8% | |
| | |
Bridgeville, DE, (Heritage Shores Special Development District), 5.45%, 7/1/35 | | $ | 968 | | | $ | 967,990 | |
| | |
Jurupa Public Financing Authority, CA, 5.00%, 9/1/31 | | | 1,200 | | | | 1,367,208 | |
| | |
New York Convention Center Development Corp., Hotel Unit Fee, 0.00%, 11/15/27 | | | 585 | | | | 467,146 | |
| | |
New York Dormitory Authority, Personal Income Tax Revenue, 5.00%, 2/15/43 | | | 4,345 | | | | 4,790,667 | |
| | |
River Hall Community Development District, FL, (Capital Improvements), 5.45%, 5/1/36 | | | 965 | | | | 969,815 | |
| | |
| | | | | | | $ | 8,562,826 | |
|
| Transportation — 11.5% | |
| | |
Central Texas Regional Mobility Authority, Prerefunded to 1/1/21, 5.75%, 1/1/31 | | $ | 415 | | | $ | 444,100 | |
| | |
Chicago, IL, (Midway International Airport), 5.00%, 1/1/41 | | | 4,225 | | | | 4,749,534 | |
| | |
Dallas and Fort Worth, TX, (Dallas/Fort Worth International Airport), 5.25%, 11/1/30 | | | 1,100 | | | | 1,259,478 | |
| | |
Dallas and Fort Worth, TX, (Dallas/Fort Worth International Airport), 5.25%, 11/1/31 | | | 1,455 | | | | 1,662,512 | |
| | |
Delaware River Port Authority of Pennsylvania and New Jersey, 5.00%, 1/1/31 | | | 675 | | | | 756,918 | |
| | | | |
| | 9 | | See Notes to Financial Statements. |
Eaton Vance
AMT-Free Municipal Income Fund
March 31, 2019
Portfolio of Investments (Unaudited) — continued
| | | | | | | | |
| Security | | Principal
Amount
(000’s omitted) | | | Value | |
|
| Transportation (continued) | |
| | |
Denver City and County, CO, Airport System Revenue, 2.602%, (70% of 1 mo. USD LIBOR + 0.86%), 11/15/19 (Put Date), 11/15/31(6) | | $ | 880 | | | $ | 880,713 | |
| | |
Grand Parkway Transportation Corp., TX, 5.125%, 10/1/43 | | | 1,100 | | | | 1,202,014 | |
| | |
Metropolitan Transportation Authority, NY, 5.00%, 11/15/35 | | | 490 | | | | 564,240 | |
| | |
Miami-Dade County, FL, Aviation Revenue, 5.00%, 10/1/33 | | | 6,350 | | | | 7,208,710 | |
| | |
New Jersey Turnpike Authority, 4.00%, 1/1/48 | | | 1,055 | | | | 1,120,716 | |
| | |
New Orleans Aviation Board, LA, 5.00%, 1/1/43 | | | 1,555 | | | | 1,770,181 | |
| | |
San Joaquin Hills Transportation Corridor Agency, CA, 5.00%, 1/15/34 | | | 5,235 | | | | 5,846,919 | |
| | |
Texas Private Activity Bond Surface Transportation Corp., (LBJ Express Managed Lanes Project), 7.00%, 6/30/34 | | | 3,500 | | | | 3,715,215 | |
| | |
Texas Private Activity Bond Surface Transportation Corp., (North Tarrant Express Managed Lanes Project), 6.875%, 12/31/39 | | | 2,980 | | | | 3,086,863 | |
| | |
Texas Transportation Commission, 0.00%, 8/1/40 | | | 1,000 | | | | 390,650 | |
| | |
| | | | | | | $ | 34,658,763 | |
|
| Water and Sewer — 2.8% | |
| | |
Atlanta, GA, Water and Wastewater Revenue, 5.00%, 11/1/35(1) | | $ | 6,990 | | | $ | 8,387,161 | |
| | |
| | | | | | | $ | 8,387,161 | |
| |
Total Tax-Exempt Municipal Securities — 106.8%
(identified cost $300,018,044) | | | $ | 322,495,584 | |
|
| Trust Units — 0.9% | |
| Security | | Notional
Amount
(000’s omitted) | | | Value | |
| | |
| Insured – Special Tax Revenue — 0.9% | | | | | | |
| | |
COFINA Series 2007A Senior Bonds Due 2046 National Custodial Trust (taxable), 8/1/46(7) | | $ | 774 | | | $ | 637,550 | |
| | |
COFINA Series 2007A Senior Bonds Due 2046 National Custodial Trust (non-taxable), 8/1/46(7) | | | 2,350 | | | | 2,062,426 | |
| |
Total Trust Units — 0.9%
(identified cost $2,571,488) | | | $ | 2,699,976 | |
| |
Total Investments — 107.7%
(identified cost $302,589,532) | | | $ | 325,195,560 | |
| |
Other Assets, Less Liabilities — (7.7)% | | | $ | (23,216,201 | ) |
| |
Net Assets — 100.0% | | | $ | 301,979,359 | |
The percentage shown for each investment category in the Portfolio of Investments is based on net assets.
At March 31, 2019, the concentration of the Fund’s investments in the various states and territories, determined as a percentage of net assets, is as follows:
| | | | |
| |
| California | | | 19.4% | |
| |
| Illinois | | | 11.2% | |
| |
| Texas | | | 10.0% | |
| |
| Others, representing less than 10% individually | | | 67.1% | |
The Fund invests primarily in debt securities issued by municipalities. The ability of the issuers of the debt securities to meet their obligations may be affected by economic developments in a specific industry or municipality. In order to reduce the risk associated with such economic developments, at March 31, 2019, 23.0% of total investments are backed by bond insurance of various financial institutions and financial guaranty assurance agencies. The aggregate percentage insured by an individual financial institution or financial guaranty assurance agency ranged from 2.0% to 14.2% of total investments.
| (1) | Security represents the municipal bond held by a trust that issues residual interest bonds (see Note 1H). |
| (2) | When-issued security. |
| (3) | The issuer is in default on the payment of principal but continues to pay interest. |
| (4) | Defaulted security. Issuer has defaulted on the payment of interest and/or principal or has filed for bankruptcy. |
| (5) | Security exempt from registration pursuant to Rule 144A under the Securities Act of 1933, as amended. These securities may be sold in certain transactions in reliance on an exemption from registration (normally to qualified institutional buyers). At March 31, 2019, the aggregate value of these securities is $5,872,630 or 1.9% of the Fund’s net assets. |
| (6) | Floating rate security. The stated interest rate represents the rate in effect at March 31, 2019. |
| (7) | Security was received in connection with the restructuring of an insured zero-coupon bond issued by the Puerto Rico Sales Tax Financing Corporation (“COFINA”) (the “Original Bond”). The notional amount of the combined taxable and tax-exempt trust units reflects the accreted amount of the Original Bond from original issuance through the restructuring date. Each trust certificate represents an ownership interest in various coupon paying and zero-coupon COFINA bonds and potential insurance payments pursuant to an insurance policy with National Public Finance Guarantee Corporation. The trust units have no stated coupon interest rate but accrete income to maturity at the annual rate of approximately 5.04%, the same rate as the Original Bond. |
| | | | |
| | 10 | | See Notes to Financial Statements. |
Eaton Vance
AMT-Free Municipal Income Fund
March 31, 2019
Portfolio of Investments (Unaudited) — continued
| | | | | | | | | | | | | | | | | | | | |
| Futures Contracts | |
| Description | | Number of
Contracts | | | Position | | | Expiration
Date | | | Notional
Amount | | | Value/
Unrealized
Depreciation | |
| | | | | |
Interest Rate Futures | | | | | | | | | | | | | | | | | | | | |
| | | | | |
| U.S. 10-Year Treasury Note | | | 145 | | | | Short | | | | 6/19/19 | | | $ | (18,011,719 | ) | | $ | (250,998 | ) |
| | | | | |
| | | | | | | | | | | | | | | | | | | $ | (250,998 | ) |
Abbreviations:
| | | | |
| | |
| AGM | | – | | Assured Guaranty Municipal Corp. |
| | |
| AMBAC | | – | | AMBAC Financial Group, Inc. |
| | |
| LIBOR | | – | | London Interbank Offered Rate |
| | |
| NPFG | | – | | National Public Finance Guarantee Corp. |
Currency Abbreviations:
| | | | |
| | |
| USD | | – | | United States Dollar |
| | | | |
| | 11 | | See Notes to Financial Statements. |
Eaton Vance
National Municipal Income Fund
March 31, 2019
Portfolio of Investments (Unaudited)
| | | | | | | | |
| Tax-Exempt Municipal Securities — 102.8% | |
| Security | | Principal
Amount
(000’s omitted) | | | Value | |
|
| Bond Bank — 2.0% | |
| | |
Connecticut, (State Revolving Fund), Green Bonds, 5.00%, 3/1/28 | | $ | 10,000 | | | $ | 11,790,100 | |
| | |
Michigan Finance Authority, (Clean Water Revolving Fund), 4.00%, 10/1/32 | | | 5,000 | | | | 5,547,500 | |
| | |
Ohio Water Development Authority, Water Pollution Control Loan Fund, 5.00%, 6/1/29 | | | 13,500 | | | | 17,208,720 | |
| | |
Rickenbacker Port Authority, OH, (OASBO Expanded Asset Pooled Financing Program), 5.375%, 1/1/32 | | | 16,675 | | | | 20,040,182 | |
| | |
| | | | | | | $ | 54,586,502 | |
|
| Cogeneration — 0.2% | |
| | |
Northampton County Industrial Development Authority, PA, (Northampton Generating), (AMT), 5.00%, 12/31/23(1) | | $ | 14,652 | | | $ | 4,395,695 | |
| | |
| | | | | | | $ | 4,395,695 | |
|
| Education — 9.1% | |
| | |
Allegheny County Higher Education Building Authority, PA, (Carnegie Mellon University), 5.00%, 8/1/27 | | $ | 3,335 | | | $ | 4,162,680 | |
| | |
California Educational Facilities Authority, (Stanford University), 5.00%, 5/1/29(2) | | | 2,750 | | | | 3,604,150 | |
| | |
Connecticut Health and Educational Facilities Authority, (Yale University), 5.00%, 7/1/27 | | | 5,000 | | | | 6,240,100 | |
| | |
Florida Higher Educational Facilities Financing Authority, (Jacksonville University), 4.75%, 6/1/38(3) | | | 2,245 | | | | 2,365,961 | |
| | |
Georgia Private Colleges and Universities Authority, (Emory University), 5.00%, 10/1/38 | | | 1,625 | | | | 1,905,897 | |
| | |
Massachusetts Development Finance Agency, (Harvard University), 5.00%, 7/15/34 | | | 18,920 | | | | 22,609,022 | |
| | |
Michigan State University, 5.00%, 2/15/30 | | | 600 | | | | 742,974 | |
| | |
Michigan State University, 5.00%, 2/15/31 | | | 1,200 | | | | 1,472,892 | |
| | |
New Jersey Educational Facilities Authority, (Princeton University), 4.00%, 7/1/38 | | | 6,925 | | | | 7,688,412 | |
| | |
New Jersey Educational Facilities Authority, (Princeton University), 5.00%, 7/1/30 | | | 550 | | | | 682,770 | |
| | |
New Jersey Educational Facilities Authority, (Princeton University), 5.00%, 7/1/33 | | | 4,820 | | | | 5,913,899 | |
| | |
New York Dormitory Authority, (Columbia University), 5.00%, 10/1/38 | | | 25,335 | | | | 30,657,377 | |
| | |
New York Dormitory Authority, (New York University), 5.00%, 7/1/30 | | | 4,000 | | | | 5,084,440 | |
| | |
Oregon Facilities Authority, (Lewis & Clark College), 5.625%, 10/1/36 | | | 9,930 | | | | 10,814,664 | |
| | |
Rutgers State University, NJ, 5.00%, 5/1/43(4) | | | 37,000 | | | | 41,086,650 | |
| | |
University of California, 5.25%, 5/15/36 | | | 7,080 | | | | 8,151,841 | |
| | |
University of California, 5.25%, 5/15/37 | | | 13,000 | | | | 14,959,750 | |
| | | | | | | | |
| Security | | Principal
Amount
(000’s omitted) | | | Value | |
|
| Education (continued) | |
| | |
University of California, 5.25%, 5/15/38 | �� | $ | 7,700 | | | $ | 8,852,536 | |
| | |
University of Michigan, 5.00%, 4/1/30 | | | 2,250 | | | | 2,849,490 | |
| | |
University of Virginia, 5.00%, 4/1/38 | | | 13,205 | | | | 15,709,064 | |
| | |
University of Virginia, 5.00%, 4/1/39 | | | 40,970 | | | | 48,612,953 | |
| | |
| | | | | | | $ | 244,167,522 | |
|
| Electric Utilities — 4.9% | |
| | |
Hawaii Department of Budget and Finance, (Hawaiian Electric Co.), 6.50%, 7/1/39 | | $ | 8,600 | | | $ | 8,713,004 | |
| | |
Omaha Public Power District, NE, 5.00%, 2/1/39 | | | 11,245 | | | | 12,830,658 | |
| | |
Public Power Generation Agency, NE, (Whelan Energy Center Unit 2), 5.00%, 1/1/28 | | | 6,025 | | | | 6,922,424 | |
| | |
Unified Government of Wyandotte County/Kansas City, KS, Utility System Revenue, 5.00%, 9/1/32 | | | 10,000 | | | | 10,949,800 | |
| | |
Utility Debt Securitization Authority, NY, 5.00%, 12/15/30(4) | | | 22,500 | | | | 25,751,250 | |
| | |
Utility Debt Securitization Authority, NY, 5.00%, 12/15/31(4) | | | 27,500 | | | | 31,367,050 | |
| | |
Utility Debt Securitization Authority, NY, 5.00%, 12/15/40 | | | 13,260 | | | | 15,809,102 | |
| | |
Vernon, CA, Electric System Revenue, 5.125%, 8/1/21 | | | 18,955 | | | | 19,157,060 | |
| | |
| | | | | | | $ | 131,500,348 | |
|
| Escrowed / Prerefunded — 5.8% | |
| | |
Bexar County Health Facilities Development Corp., TX, (St. Luke’s Lutheran Hospital), Escrowed to Maturity, 7.00%, 5/1/21 | | $ | 2,400 | | | $ | 2,532,840 | |
| | |
Brooklyn Arena Local Development Corp., NY, (Barclays Center), Prerefunded to 1/15/20, 6.00%, 7/15/30 | | | 9,530 | | | | 9,872,032 | |
| | |
Brooklyn Arena Local Development Corp., NY, (Barclays Center), Prerefunded to 1/15/20, 6.25%, 7/15/40 | | | 14,295 | | | | 14,835,923 | |
| | |
Massachusetts Development Finance Agency, (Tufts Medical Center), Prerefunded to 1/1/21, 6.75%, 1/1/36 | | | 3,005 | | | | 3,269,410 | |
| | |
Massachusetts Development Finance Agency, (Tufts Medical Center), Prerefunded to 1/1/21, 6.75%, 1/1/36 | | | 4,505 | | | | 4,901,395 | |
| | |
North Carolina, Capital Improvement Limited Obligation Bonds, Prerefunded to 5/1/20, 5.25%, 5/1/31 | | | 16,475 | | | | 17,141,743 | |
| | |
Pennsylvania Turnpike Commission, Prerefunded to 6/1/19, 5.25%, 6/1/39 | | | 4,800 | | | | 4,829,280 | |
| | |
Pennsylvania Turnpike Commission, Prerefunded to 6/1/19, 5.25%, 6/1/39 | | | 3,900 | | | | 3,923,790 | |
| | |
Pennsylvania Turnpike Commission, Prerefunded to 6/1/19, 5.25%, 6/1/39 | | | 605 | | | | 608,690 | |
| | |
Pennsylvania Turnpike Commission, Prerefunded to 12/1/20, 5.35%, 12/1/30 | | | 4,515 | | | | 4,798,722 | |
| | |
Pennsylvania Turnpike Commission, Prerefunded to 12/1/20, 5.35%, 12/1/30 | | | 3,490 | | | | 3,709,312 | |
| | |
Pennsylvania Turnpike Commission, Prerefunded to 12/1/20, 5.45%, 12/1/35 | | | 12,125 | | | | 12,906,820 | |
| | | | |
| | 12 | | See Notes to Financial Statements. |
Eaton Vance
National Municipal Income Fund
March 31, 2019
Portfolio of Investments (Unaudited) — continued
| | | | | | | | |
| Security | | Principal
Amount
(000’s omitted) | | | Value | |
|
| Escrowed / Prerefunded (continued) | |
| | |
Pennsylvania Turnpike Commission, Prerefunded to 12/1/20, 6.00%, 12/1/34 | | $ | 3,585 | | | $ | 3,848,426 | |
| | |
Pennsylvania Turnpike Commission, Prerefunded to 12/1/20, 6.00%, 12/1/34 | | | 17,620 | | | | 18,914,717 | |
| | |
Pennsylvania Turnpike Commission, Prerefunded to 12/1/20, 6.00%, 12/1/34 | | | 3,795 | | | | 4,073,857 | |
| | |
Pennsylvania Turnpike Commission, Prerefunded to 12/1/20, 6.50%, 12/1/36 | | | 10,000 | | | | 10,814,900 | |
| | |
Southwestern Illinois Development Authority, (Memorial Group, Inc.), Prerefunded to 11/1/23, 7.25%, 11/1/33 | | | 9,170 | | | | 11,394,275 | |
| | |
Tarrant County Cultural Education Facilities Finance Corp., TX, (Scott & White Healthcare), Prerefunded to 8/15/20, 5.25%, 8/15/40 | | | 1,000 | | | | 1,049,790 | |
| | |
Tarrant County Cultural Education Facilities Finance Corp., TX, (Scott & White Healthcare), Prerefunded to 8/15/20, 5.25%, 8/15/40 | | | 12,500 | | | | 13,122,375 | |
| | |
Vernon, CA, Electric System Revenue, Prerefunded to 8/1/19, 5.125%, 8/1/21 | | | 8,705 | | | | 8,810,766 | |
| | |
| | | | | | | $ | 155,359,063 | |
|
| General Obligations — 23.6% | |
| | |
Alabama, 5.00%, 11/1/30 | | $ | 6,400 | | | $ | 7,989,056 | |
| | |
Albany County, NY, 4.00%, 4/1/29 | | | 3,715 | | | | 4,241,081 | |
| | |
Austin Independent School District, TX, (PSF Guaranteed), 4.00%, 8/1/33(2) | | | 3,400 | | | | 3,807,660 | |
| | |
Belmont, MA, 4.00%, 3/15/29 | | | 2,750 | | | | 3,220,745 | |
| | |
Belmont, MA, 4.00%, 3/15/30 | | | 2,800 | | | | 3,247,916 | |
| | |
Belmont, MA, 4.00%, 3/15/32 | | | 3,030 | | | | 3,447,140 | |
| | |
Boston, MA, 5.00%, 3/1/29 | | | 6,390 | | | | 8,214,089 | |
| | |
Boston, MA, 5.00%, 3/1/30 | | | 4,820 | | | | 6,138,174 | |
| | |
Boston, MA, 5.00%, 3/1/31 | | | 3,740 | | | | 4,720,703 | |
| | |
Brookhaven, NY, 4.00%, 9/15/30 | | | 3,395 | | | | 3,843,446 | |
| | |
California, 1.93%, (SIFMA + 0.43%), 12/1/23 (Put Date), 12/1/29(5) | | | 15,000 | | | | 15,049,950 | |
| | |
California, 5.00%, 4/1/32 | | | 20,000 | | | | 25,899,600 | |
| | |
California, 5.00%, 4/1/35 | | | 15,035 | | | | 17,032,400 | |
| | |
Chicago, IL, 5.00%, 1/1/39(2) | | | 2,100 | | | | 2,251,851 | |
| | |
Chicago, IL, 5.00%, 1/1/40(2) | | | 1,500 | | | | 1,603,815 | |
| | |
Chicago Board of Education, IL, 5.00%, 12/1/21 | | | 1,980 | | | | 2,078,525 | |
| | |
Chicago Board of Education, IL, 5.00%, 12/1/46 | | | 2,855 | | | | 2,940,507 | |
| | |
Chicago Board of Education, IL, 5.00%, 12/1/46 | | | 15,110 | | | | 15,860,967 | |
| | |
Clackamas Community College District, OR, 5.00%, (0.00% until 6/15/20), 6/15/38 | | | 760 | | | | 832,375 | |
| | |
Clackamas Community College District, OR, 5.00%, (0.00% until 6/15/20), 6/15/39 | | | 1,000 | | | | 1,093,810 | |
| | |
Clackamas Community College District, OR, 5.00%, (0.00% until 6/15/20), 6/15/40 | | | 1,250 | | | | 1,362,913 | |
| | | | | | | | |
| Security | | Principal
Amount
(000’s omitted) | | | Value | |
|
| General Obligations (continued) | |
| | |
Delaware, 4.00%, 2/1/31 | | $ | 10,000 | | | $ | 11,550,400 | |
| | |
Desert Community College District, CA, 5.00%, 8/1/37 | | | 5,350 | | | | 6,238,047 | |
| | |
Desert Sands Unified School District, CA, (Election of 2014), 5.00%, 8/1/40 | | | 7,680 | | | | 9,011,174 | |
| | |
District of Columbia, 5.00%, 10/15/30 | | | 4,000 | | | | 5,024,840 | |
| | |
Fairfax County, VA, 5.00%, 10/1/30 | | | 5,685 | | | | 7,220,689 | |
| | |
Franklin Special School District, TN, Limited Tax School Improvement Bonds, 5.00%, 6/1/30 | | | 250 | | | | 315,905 | |
| | |
Franklin Special School District, TN, Limited Tax School Improvement Bonds, 5.00%, 6/1/31 | | | 250 | | | | 312,458 | |
| | |
Georgetown Independent School District, TX, 2.50% to 8/1/19 (Put Date), 8/1/34 | | | 750 | | | | 752,250 | |
| | |
Hawaii, 5.00%, 1/1/34 | | | 14,200 | | | | 17,165,244 | |
| | |
Hennepin County Regional Railroad Authority, MN, 5.00%, 12/1/30 | | | 4,040 | | | | 5,072,058 | |
| | |
Illinois, 5.00%, 2/1/24 | | | 10,705 | | | | 11,606,682 | |
| | |
Illinois, 5.00%, 11/1/24 | | | 11,295 | | | | 12,358,198 | |
| | |
Illinois, 5.00%, 2/1/27 | | | 18,500 | | | | 19,704,535 | |
| | |
Illinois, 5.00%, 2/1/29 | | | 15,000 | | | | 16,421,250 | |
| | |
Illinois, 5.00%, 5/1/39 | | | 10,000 | | | | 10,365,400 | |
| | |
Illinois, 5.25%, 7/1/30 | | | 6,150 | | | | 6,505,654 | |
| | |
Kane, Cook and DuPage Counties School District No. 46, IL, 5.00%, 1/1/29 | | | 1,920 | | | | 2,146,963 | |
| | |
Kane, Cook and DuPage Counties School District No. 46, IL, 5.00%, 1/1/30 | | | 4,105 | | | | 4,583,684 | |
| | |
Klein Independent School District, TX, (PSF Guaranteed), 5.00%, 2/1/36 | | | 14,180 | | | | 14,969,684 | |
| | |
Louisiana, 5.00%, 3/1/24 | | | 6,525 | | | | 7,525,543 | |
| | |
Louisiana, 5.00%, 3/1/28 | | | 8,590 | | | | 10,641,979 | |
| | |
Massachusetts, 5.00%, 7/1/35 | | | 10,000 | | | | 11,542,600 | |
| | |
Massachusetts, 5.00%, 3/1/37 | | | 10,900 | | | | 12,305,010 | |
| | |
Mt. San Antonio Community College District, CA, (Election of 2018), 5.00%, 8/1/41(2) | | | 5,000 | | | | 6,085,000 | |
| | |
New York, 5.00%, 3/1/28 | | | 4,000 | | | | 5,120,440 | |
| | |
New York, NY, 4.00%, 3/1/36 | | | 8,000 | | | | 8,776,800 | |
| | |
New York, NY, 4.00%, 10/1/41 | | | 2,500 | | | | 2,685,350 | |
| | |
New York, NY, 4.00%, 12/1/41 | | | 5,970 | | | | 6,462,704 | |
| | |
New York, NY, 5.00%, 8/1/33 | | | 10,000 | | | | 11,771,000 | |
| | |
Oklahoma City, OK, 4.00%, 3/1/33(2) | | | 3,985 | | | | 4,383,221 | |
| | |
Oklahoma City, OK, 4.00%, 3/1/34(2) | | | 3,810 | | | | 4,171,188 | |
| | |
Oregon, 5.00%, 5/1/30 | | | 3,880 | | | | 4,898,345 | |
| | |
Oxnard Union High School District, CA, (Election of 2018), 5.00%, 8/1/43 | | | 3,750 | | | | 4,354,463 | |
| | |
Park City, UT, 4.00%, 2/1/31 | | | 3,490 | | | | 4,037,756 | |
| | |
Pflugerville Independent School District, TX, (PSF Guaranteed), 5.00%, 2/15/33(2) | | | 5,000 | | | | 6,053,750 | |
| | |
Portland Community College District, OR, 5.00%, 6/15/32 | | | 2,700 | | | | 3,202,497 | |
| | | | |
| | 13 | | See Notes to Financial Statements. |
Eaton Vance
National Municipal Income Fund
March 31, 2019
Portfolio of Investments (Unaudited) — continued
| | | | | | | | |
| Security | | Principal
Amount
(000’s omitted) | | | Value | |
|
| General Obligations (continued) | |
| | |
Portland Community College District, OR, 5.00%, 6/15/33 | | $ | 1,875 | | | $ | 2,216,194 | |
| | |
Richardson Independent School District, TX, (PSF Guaranteed), 5.00%, 2/15/42 | | | 5,000 | | | | 5,715,050 | |
| | |
San Diego Unified School District, CA, (Election of 2012), Green Bonds, 5.00%, 7/1/30 | | | 3,530 | | | | 4,360,821 | |
| | |
Santa Clara County, CA, (Election of 2008), Prerefunded to 8/1/19, 5.00%, 8/1/39(4) | | | 57,400 | | | | 58,092,818 | |
| | |
Santa Clara Unified School District, CA, (Election of 2018), 4.00%, 7/1/29(2) | | | 7,745 | | | | 8,872,285 | |
| | |
Texas, (Texas Transportation Commission), 5.00%, 10/1/44 | | | 10,000 | | | | 11,237,200 | |
| | |
Warrenton-Hammond School District No. 30, OR, 5.00%, 6/15/33 | | | 1,180 | | | | 1,457,489 | |
| | |
Washington, 5.00%, 2/1/33 | | | 14,350 | | | | 16,215,787 | |
| | |
Washington, 5.00%, 8/1/35 | | | 15,055 | | | | 17,987,262 | |
| | |
Washington, 5.00%, 2/1/40 | | | 25,915 | | | | 30,293,080 | |
| | |
Washington, 5.00%, 2/1/41 | | | 10,000 | | | | 11,956,400 | |
| | |
Washington County, OR, 4.00%, 3/1/30 | | | 1,000 | | | | 1,116,050 | |
| | |
Wauwatosa School District, WI, 4.00%, 3/1/31 | | | 6,815 | | | | 7,569,693 | |
| | |
Will County Community Unit School District No. 365-U, IL, (Valley View), 5.75%, 11/1/31 | | | 12,995 | | | | 14,186,901 | |
| | |
Wisconsin, 5.00%, 5/1/38 | | | 25,000 | | | | 28,618,750 | |
| | |
| | | | | | | $ | 630,115,264 | |
|
| Hospital — 8.7% | |
| | |
California Health Facilities Financing Authority, (Catholic Healthcare West), 5.25%, 3/1/28 | | $ | 5,700 | | | $ | 6,078,252 | |
| | |
California Health Facilities Financing Authority, (Providence Health System), 5.50%, 10/1/39(4) | | | 36,700 | | | | 37,406,108 | |
| | |
California Health Facilities Financing Authority, (St. Joseph Health System), 5.00%, 7/1/33 | | | 17,530 | | | | 19,710,732 | |
| | |
California Health Facilities Financing Authority, (St. Joseph Health System), 5.00%, 7/1/37 | | | 25,465 | | | | 28,368,519 | |
| | |
California Health Facilities Financing Authority, (Sutter Health), 5.25%, 8/15/31 | | | 13,675 | | | | 14,814,264 | |
| | |
Illinois Finance Authority, (Edward-Elmhurst Healthcare), 2.25%, (SIFMA + 0.75%), 7/1/23 (Put Date), 1/1/46(5) | | | 9,500 | | | | 9,500,000 | |
| | |
Illinois Finance Authority, (Presence Health Network), 5.00%, 2/15/26 | | | 7,500 | | | | 8,968,875 | |
| | |
Illinois Finance Authority, (Presence Health Network), 5.00%, 2/15/33 | | | 2,500 | | | | 2,927,725 | |
| | |
Massachusetts Development Finance Agency, (Partners HealthCare System), 5.00%, 7/1/44 | | | 8,570 | | | | 9,462,823 | |
| | |
Michigan Finance Authority, (Henry Ford Health System), 5.00%, 11/15/41 | | | 2,445 | | | | 2,740,772 | |
| | |
Missouri Health and Educational Facilities Authority, (SSM Health Care), 5.00%, 6/1/30 | | | 7,505 | | | | 8,484,628 | |
| | |
New Jersey Health Care Facilities Financing Authority, (Inspira Health Obligated Group), 5.00%, 7/1/37 | | | 1,000 | | | | 1,148,970 | |
| | | | | | | | |
| Security | | Principal
Amount
(000’s omitted) | | | Value | |
|
| Hospital (continued) | |
| | |
Oklahoma Development Finance Authority, (OU Medicine), 5.00%, 8/15/38 | | $ | 1,750 | | | $ | 1,967,595 | |
| | |
Oklahoma Development Finance Authority, (OU Medicine), 5.25%, 8/15/43 | | | 5,200 | | | | 5,942,456 | |
| | |
Oregon Facilities Authority, (Samaritan Health Services), 5.00%, 10/1/35 | | | 2,260 | | | | 2,515,968 | |
| | |
University of Kansas Hospital Authority, 5.00%, 9/1/45 | | | 25,500 | | | | 28,629,870 | |
| | |
Washington Health Care Facilities Authority, (Overlake Hospital Medical Center), 5.00%, 7/1/42 | | | 2,250 | | | | 2,543,333 | |
| | |
Washington Township Health Care District, CA, 6.25%, 7/1/39 | | | 16,675 | | | | 16,827,409 | |
| | |
West Virginia Hospital Finance Authority, (West Virginia United Health System Obligated Group), 5.375%, 6/1/38 | | | 21,895 | | | | 24,340,671 | |
| | |
| | | | | | | $ | 232,378,970 | |
|
| Housing — 0.9% | |
| | |
Massachusetts Housing Finance Agency, (Mill Road Apartments), 2.05%, (SIFMA + 0.55%), 11/1/23 (Put Date), 11/1/48(5) | | $ | 4,000 | | | $ | 4,000,000 | |
| | |
Minnesota Housing Finance Agency, (FHLMC), (FNMA), (GNMA), 2.05%, (SIFMA + 0.55%), 12/12/23 (Put Date), 7/1/41(5) | | | 10,000 | | | | 10,001,700 | |
| | |
Texas Student Housing Corp., (University of Northern Texas), 6.85%, 7/1/31 | | | 10,640 | | | | 10,367,935 | |
| | |
| | | | | | | $ | 24,369,635 | |
|
| Industrial Development Revenue — 1.7% | |
| | |
Metropolitan Nashville Airport Authority, TN, (Aero Nashville), 5.20%, 7/1/26 | | $ | 335 | | | $ | 345,764 | |
| | |
Miami-Dade County Industrial Development Authority, FL, (Waste Management, Inc.), (AMT), 2.30%, (SIFMA + 0.80%), 11/1/21 (Put Date), 11/1/48(5) | | | 5,000 | | | | 4,999,950 | |
| | |
Mission Economic Development Corp., TX, (Waste Management, Inc.), (AMT), 2.30%, (SIFMA + 0.80%), 11/1/21 (Put Date), 11/1/48(5) | | | 10,000 | | | | 9,999,900 | |
| | |
New Jersey Economic Development Authority, (New Jersey-American Water Co., Inc.), (AMT), 5.70%, 10/1/39 | | | 28,150 | | | | 28,655,855 | |
| | |
Vermont Economic Development Authority, (Casella Waste Systems, Inc.), (AMT), 4.625% to 4/3/28 (Put Date), 4/1/36(3) | | | 475 | | | | 485,711 | |
| | |
| | | | | | | $ | 44,487,180 | |
|
| Insured – Education — 0.0%(6) | |
| | |
Metropolitan Government of Nashville and Davidson County Health and Educational Facilities Board, TN, (Meharry Medical College), (AMBAC), 6.00%, 12/1/19 | | $ | 435 | | | $ | 443,004 | |
| | |
| | | | | | | $ | 443,004 | |
| | | | |
| | 14 | | See Notes to Financial Statements. |
Eaton Vance
National Municipal Income Fund
March 31, 2019
Portfolio of Investments (Unaudited) — continued
| | | | | | | | |
| Security | | Principal
Amount
(000’s omitted) | | | Value | |
|
| Insured – General Obligations — 0.4% | |
| | |
Santa Rosa High School District, CA, (Election of 2014), (AGM), 5.00%, 8/1/43 | | $ | 9,155 | | | $ | 10,677,293 | |
| | |
| | | | | | | $ | 10,677,293 | |
|
| Insured – Hospital — 0.5% | |
| | |
Medford Hospital Facilities Authority, OR, (Asante Health System), (AGM), 5.50%, 8/15/28 | | $ | 12,000 | | | $ | 12,586,920 | |
| | |
| | | | | | | $ | 12,586,920 | |
|
| Insured – Other Revenue — 1.2% | |
| | |
Harris County-Houston Sports Authority, TX, (AGM), (NPFG), 0.00%, 11/15/34 | | $ | 58,155 | | | $ | 31,283,319 | |
| | |
| | | | | | | $ | 31,283,319 | |
|
| Insured – Special Tax Revenue — 0.7% | |
| | |
Massachusetts, Dedicated Tax Revenue, (NPFG), 5.50%, 1/1/29 | | $ | 11,000 | | | $ | 14,322,660 | |
| | |
Massachusetts, Dedicated Tax Revenue, (NPFG), 5.50%, 1/1/30 | | | 3,080 | | | | 4,045,796 | |
| | |
| | | | | | | $ | 18,368,456 | |
|
| Insured – Transportation — 2.2% | |
| | |
E-470 Public Highway Authority, CO, (NPFG), 0.00%, 9/1/37 | | $ | 13,335 | | | $ | 5,913,939 | |
| | |
Metropolitan Transportation Authority, NY, Green Bonds, (AGM), 4.00%, 11/15/46 | | | 8,180 | | | | 8,723,316 | |
| | |
North Texas Tollway Authority, (AGC), 6.20%, 1/1/42 | | | 37,070 | | | | 44,896,589 | |
| | |
| | | | | | | $ | 59,533,844 | |
|
| Lease Revenue / Certificates of Participation — 1.3% | |
| | |
Hudson Yards Infrastructure Corp., NY, 4.00%, 2/15/44 | | $ | 9,645 | | | $ | 10,271,250 | |
| | |
New Jersey Economic Development Authority, (School Facilities Construction), 5.00%, 6/15/34 | | | 8,960 | | | | 9,966,745 | |
| | |
New Jersey Economic Development Authority, (School Facilities Construction), 5.00%, 6/15/35 | | | 13,300 | | | | 14,744,247 | |
| | |
| | | | | | | $ | 34,982,242 | |
|
| Nursing Home — 0.2% | |
| | |
Mississippi Business Finance Corp., (Magnolia Healthcare), 7.99%, 7/1/25 | | $ | 6,440 | | | $ | 6,497,574 | |
| | |
| | | | | | | $ | 6,497,574 | |
|
| Other Revenue — 3.3% | |
| | |
Central Falls Detention Facility Corp., RI, 7.25%, 7/15/35(7) | | $ | 250 | | | $ | 45,000 | |
| | |
Kalispel Tribe of Indians, WA, Series A, 5.25%, 1/1/38(3) | | | 1,865 | | | | 2,026,919 | |
| | | | | | | | |
| Security | | Principal
Amount
(000’s omitted) | | | Value | |
|
| Other Revenue (continued) | |
| | |
Kalispel Tribe of Indians, WA, Series B, 5.25%, 1/1/38(3) | | $ | 1,000 | | | $ | 1,086,820 | |
| | |
New York City Transitional Finance Authority, NY, (Building Aid), 5.00%, 7/15/33 | | | 10,000 | | | | 11,529,100 | |
| | |
New York City Transitional Finance Authority, NY, (Building Aid), 5.00%, 7/15/43 | | | 11,830 | | | | 13,551,857 | |
| | |
Texas Municipal Gas Acquisition and Supply Corp. I, Gas Supply Revenue, 6.25%, 12/15/26 | | | 19,645 | | | | 22,825,133 | |
| | |
Texas Municipal Gas Acquisition and Supply Corp. III, Gas Supply Revenue, 5.00%, 12/15/30 | | | 4,845 | | | | 5,259,344 | |
| | |
Texas Municipal Gas Acquisition and Supply Corp. III, Gas Supply Revenue, 5.00%, 12/15/32 | | | 29,755 | | | | 32,144,326 | |
| | |
Washington Health Care Facilities Authority, (Fred Hutchinson Cancer Research Center), 2.772%, (67% of 1 mo. USD LIBOR + 1.10%), 7/1/22 (Put Date), 1/1/42(5) | | | 1,000 | | | | 1,011,350 | |
| | |
| | | | | | | $ | 89,479,849 | |
|
| Senior Living / Life Care — 0.5% | |
| | |
Delaware Economic Development Authority, (ACTS Retirement-Life Communities, Inc. Obligated Group), 5.00%, 11/15/48 | | $ | 2,500 | | | $ | 2,779,175 | |
| | |
Logan County, CO, (TLC Care Choices, Inc.), 6.875%, 12/1/23(8) | | | 409 | | | | 110,475 | |
| | |
New Hope Cultural Education Facilities Finance Corp., TX, (Longhorn Village), 5.00%, 1/1/47 | | | 7,500 | | | | 7,663,725 | |
| | |
Rockville, MD, (Ingleside at King Farm), 5.00%, 11/1/31 | | | 1,010 | | | | 1,104,627 | |
| | |
Rockville, MD, (Ingleside at King Farm), 5.00%, 11/1/32 | | | 525 | | | | 571,951 | |
| | |
Wisconsin Health and Educational Facilities Authority, (Saint John’s Communities, Inc.), 5.00%, 9/15/40 | | | 750 | | | | 780,607 | |
| | |
| | | | | | | $ | 13,010,560 | |
|
| Special Tax Revenue — 9.4% | |
| | |
Lafayette Parish School Board, LA, Sales Tax Revenue, 4.00%, 4/1/35 | | $ | 500 | | | $ | 544,980 | |
| | |
New River Community Development District, FL, (Capital Improvements), 5.00%, 5/1/13(7) | | | 230 | | | | 0 | |
| | |
New River Community Development District, FL, (Capital Improvements), 5.35%, 5/1/38(7) | | | 80 | | | | 0 | |
| | |
New River Community Development District, FL, (Capital Improvements), Series 2010A-2, 5.75%, 5/1/38 | | | 380 | | | | 372,651 | |
| | |
New York City Transitional Finance Authority, NY, Future Tax Revenue, 4.00%, 5/1/37 | | | 7,500 | | | | 8,110,425 | |
| | |
New York City Transitional Finance Authority, NY, Future Tax Revenue, 4.00%, 8/1/37 | | | 3,435 | | | | 3,695,854 | |
| | |
New York City Transitional Finance Authority, NY, Future Tax Revenue, 4.00%, 11/1/37(2) | | | 10,000 | | | | 10,967,100 | |
| | |
New York City Transitional Finance Authority, NY, Future Tax Revenue, 4.00%, 11/1/38(2) | | | 8,500 | | | | 9,306,905 | |
| | | | |
| | 15 | | See Notes to Financial Statements. |
Eaton Vance
National Municipal Income Fund
March 31, 2019
Portfolio of Investments (Unaudited) — continued
| | | | | | | | |
| Security | | Principal
Amount
(000’s omitted) | | | Value | |
|
| Special Tax Revenue (continued) | |
| | |
New York City Transitional Finance Authority, NY, Future Tax Revenue, 4.00%, 8/1/39 | | $ | 7,500 | | | $ | 8,136,450 | |
| | |
New York City Transitional Finance Authority, NY, Future Tax Revenue, 4.00%, 5/1/42 | | | 5,695 | | | | 6,052,304 | |
| | |
New York City Transitional Finance Authority, NY, Future Tax Revenue, 5.00%, 2/1/35 | | | 11,000 | | | | 12,655,280 | |
| | |
New York City Transitional Finance Authority, NY, Future Tax Revenue, 5.00%, 8/1/35 | | | 10,485 | | | | 12,483,546 | |
| | |
New York City Transitional Finance Authority, NY, Future Tax Revenue, 5.00%, 5/1/36 | | | 4,200 | | | | 5,043,738 | |
| | |
New York City Transitional Finance Authority, NY, Future Tax Revenue, 5.00%, 8/1/36 | | | 10,000 | | | | 11,572,200 | |
| | |
New York City Transitional Finance Authority, NY, Future Tax Revenue, 5.00%, 5/1/39 | | | 9,240 | | | | 10,829,557 | |
| | |
New York City Transitional Finance Authority, NY, Future Tax Revenue, 5.00%, 5/1/40 | | | 5,970 | | | | 6,878,873 | |
| | |
New York City Transitional Finance Authority, NY, Future Tax Revenue, 2015 Series B, 5.00%, 8/1/39 | | | 7,495 | | | | 8,447,390 | |
| | |
New York City Transitional Finance Authority, NY, Future Tax Revenue, 2018 Series A, 5.00%, 8/1/39 | | | 11,845 | | | | 13,930,075 | |
| | |
New York Dormitory Authority, Personal Income Tax Revenue, 5.00%, 2/15/43 | | | 21,440 | | | | 23,639,104 | |
| | |
New York Dormitory Authority, Personal Income Tax Revenue, 5.00%, 2/15/45 | | | 10,000 | | | | 11,282,400 | |
| | |
New York Dormitory Authority, Sales Tax Revenue, 5.00%, 3/15/36 | | | 8,000 | | | | 9,384,720 | |
| | |
New York Dormitory Authority, Sales Tax Revenue, 5.00%, 3/15/40 | | | 10,000 | | | | 11,670,800 | |
| | |
New York Dormitory Authority, Sales Tax Revenue, 5.00%, 3/15/43 | | | 5,915 | | | | 6,536,193 | |
| | |
New York Dormitory Authority, Sales Tax Revenue, (AMT), 5.00%, 3/15/27 | | | 1,620 | | | | 1,967,798 | |
| | |
New York Dormitory Authority, Sales Tax Revenue, (AMT), 5.00%, 3/15/28 | | | 1,705 | | | | 2,097,900 | |
| | |
New York Dormitory Authority, Sales Tax Revenue, (AMT), 5.00%, 3/15/29 | | | 1,790 | | | | 2,203,508 | |
| | |
New York Dormitory Authority, Sales Tax Revenue, (AMT), 5.00%, 3/15/31 | | | 970 | | | | 1,175,281 | |
| | |
New York Dormitory Authority, Sales Tax Revenue, (AMT), 5.00%, 3/15/32 | | | 2,070 | | | | 2,495,447 | |
| | |
New York State Urban Development Corp., Personal Income Tax Revenue, 4.00%, 3/15/47 | | | 7,445 | | | | 8,011,043 | |
| | |
New York State Urban Development Corp., Personal Income Tax Revenue, 5.00%, 3/15/35 | | | 10,000 | | | | 11,572,900 | |
| | |
New York State Urban Development Corp., Personal Income Tax Revenue, 5.00%, 3/15/41 | | | 10,000 | | | | 11,887,700 | |
| | |
Sales Tax Asset Receivable Corp., NY, 4.00%, 10/15/32 | | | 5,265 | | | | 5,814,929 | |
| | |
Southern Hills Plantation I Community Development District, FL, Series A1, 5.80%, 5/1/35 | | | 455 | | | | 445,209 | |
| | | | | | | | |
| Security | | Principal
Amount
(000’s omitted) | | | Value | |
|
| Special Tax Revenue (continued) | |
| | |
Southern Hills Plantation I Community Development District, FL, Series A2, 5.80%, 5/1/35 | | $ | 330 | | | $ | 295,043 | |
| | |
Sterling Hill Community Development District, FL, 6.20%, 5/1/35 | | | 1,532 | | | | 980,254 | |
| | |
Texas Transportation Commission, 5.00%, 4/1/33(4) | | | 10,000 | | | | 11,443,300 | |
| | |
| | | | | | | $ | 251,930,857 | |
|
| Student Loan — 0.2% | |
| | |
Iowa Student Loan Liquidity Corp., 5.25%, 12/1/22 | | $ | 760 | | | $ | 773,763 | |
| | |
New Jersey Higher Education Student Assistance Authority, (AMT), 4.00%, 12/1/28 | | | 5,340 | | | | 5,723,786 | |
| | |
| | | | | | | $ | 6,497,549 | |
|
| Transportation — 20.3% | |
| | |
Charleston County Airport District, SC, (AMT), 5.50%, 7/1/38 | | $ | 10,000 | | | $ | 11,203,800 | |
| | |
Chicago, IL, (Midway International Airport), 5.00%, 1/1/33 | | | 6,025 | | | | 6,688,172 | |
| | |
Chicago, IL, (Midway International Airport), (AMT), 5.00%, 1/1/34 | | | 5,250 | | | | 5,753,948 | |
| | |
Chicago, IL, (O’Hare International Airport), 5.00%, 1/1/36 | | | 6,000 | | | | 6,831,780 | |
| | |
Chicago, IL, (O’Hare International Airport), (AMT), 5.00%, 1/1/23 | | | 1,125 | | | | 1,248,851 | |
| | |
Chicago, IL, (O’Hare International Airport), (AMT), 5.00%, 1/1/25 | | | 16,100 | | | | 17,854,095 | |
| | |
Chicago, IL, (O’Hare International Airport), (AMT), 5.00%, 1/1/33 | | | 7,300 | | | | 8,177,095 | |
| | |
Chicago, IL, (O’Hare International Airport), (AMT), 5.00%, 1/1/39 | | | 4,000 | | | | 4,645,680 | |
| | |
Dallas and Fort Worth, TX, (Dallas/Fort Worth International Airport), 5.25%, 11/1/31 | | | 10,395 | | | | 11,877,535 | |
| | |
Dallas and Fort Worth, TX, (Dallas/Fort Worth International Airport), (AMT), 5.25%, 11/1/30 | | | 11,015 | | | | 12,482,639 | |
| | |
Delaware River Port Authority of Pennsylvania and New Jersey, 5.00%, 1/1/31 | | | 5,405 | | | | 6,060,951 | |
| | |
Denver City and County, CO, Airport System Revenue, (AMT), 5.00%, 12/1/37 | | | 10,000 | | | | 11,778,600 | |
| | |
Hawaii, Airports System Revenue, (AMT), 5.00%, 7/1/41 | | | 2,935 | | | | 3,279,099 | |
| | |
Hawaii, Airports System Revenue, (AMT), 5.00%, 7/1/43 | | | 10,000 | | | | 11,549,800 | |
| | |
Houston, TX, (United Airlines, Inc.), (AMT), 5.00%, 7/1/29 | | | 7,670 | | | | 8,476,654 | |
| | |
Illinois Toll Highway Authority, 5.00%, 1/1/33 | | | 1,595 | | | | 1,789,319 | |
| | |
Illinois Toll Highway Authority, 5.00%, 1/1/40 | | | 1,000 | | | | 1,131,880 | |
| | |
Kansas Department of Transportation, 5.00%, 9/1/30 | | | 20,000 | | | | 23,011,000 | |
| | |
Kansas Turnpike Authority, 5.00%, 9/1/31(2) | | | 1,500 | | | | 1,882,155 | |
| | |
Los Angeles Department of Airports, CA, (Los Angeles International Airport), 5.00%, 5/15/35(4) | | | 7,200 | | | | 7,484,184 | |
| | | | |
| | 16 | | See Notes to Financial Statements. |
Eaton Vance
National Municipal Income Fund
March 31, 2019
Portfolio of Investments (Unaudited) — continued
| | | | | | | | |
| Security | | Principal
Amount
(000’s omitted) | | | Value | |
|
| Transportation (continued) | |
| | |
Los Angeles Department of Airports, CA, (Los Angeles International Airport), (AMT), 5.00%, 5/15/24 | | $ | 1,200 | | | $ | 1,388,160 | |
| | |
Los Angeles Department of Airports, CA, (Los Angeles International Airport), (AMT), 5.00%, 5/15/26 | | | 1,335 | | | | 1,606,926 | |
| | |
Los Angeles Department of Airports, CA, (Los Angeles International Airport), (AMT), 5.00%, 5/15/40 | | | 6,000 | | | | 6,760,440 | |
| | |
Los Angeles Department of Airports, CA, (Los Angeles International Airport), (AMT), 5.00%, 5/15/41 | | | 9,000 | | | | 10,241,370 | |
| | |
Louisiana Offshore Terminal Authority, (LOOP LLC), 2.00% to 10/1/22 (Put Date), 10/1/40 | | | 2,000 | | | | 1,998,000 | |
| | |
Louisville Regional Airport Authority, KY, (AMT), 5.00%, 7/1/23 | | | 2,250 | | | | 2,508,480 | |
| | |
Maryland Economic Development Corp., (Transportation Facilities), 5.00%, 6/1/35 | | | 1,050 | | | | 1,210,073 | |
| | |
Massachusetts Port Authority, (AMT), 5.00%, 7/1/26 | | | 10,205 | | | | 12,243,245 | |
| | |
Memphis-Shelby County Airport Authority, TN, (AMT), 5.00%, 7/1/35 | | | 3,440 | | | | 4,039,936 | |
| | |
Memphis-Shelby County Airport Authority, TN, (AMT), 5.00%, 7/1/36 | | | 3,615 | | | | 4,229,695 | |
| | |
Metropolitan Transportation Authority, NY, 2.318%, (67% of 1 mo. USD LIBOR + 0.65%), 7/1/21 (Put Date), 11/1/26(5) | | | 10,000 | | | | 10,013,400 | |
| | |
Metropolitan Transportation Authority, NY, 5.25%, 11/15/33 | | | 4,250 | | | | 4,808,450 | |
| | |
Metropolitan Transportation Authority, NY, Green Bonds, 0.00%, 11/15/32 | | | 16,710 | | | | 10,798,670 | |
| | |
Metropolitan Washington Airports Authority, D.C., (AMT), 5.00%, 10/1/28 | | | 4,500 | | | | 5,140,935 | |
| | |
Metropolitan Washington Airports Authority, D.C., (AMT), 5.00%, 10/1/42 | | | 2,000 | | | | 2,299,780 | |
| | |
Miami-Dade County, FL, Aviation Revenue, (AMT), 5.00%, 10/1/33 | | | 23,250 | | | | 26,075,572 | |
| | |
Miami-Dade County, FL, Aviation Revenue, (AMT), 5.00%, 10/1/36 | | | 10,000 | | | | 11,128,600 | |
| | |
Miami-Dade County, FL, Aviation Revenue, (AMT), 5.00%, 10/1/38 | | | 2,560 | | | | 2,994,022 | |
| | |
Miami-Dade County, FL, Aviation Revenue, (AMT), 5.00%, 10/1/40 | | | 10,000 | | | | 11,482,400 | |
| | |
Miami-Dade County, FL, Aviation Revenue, (AMT), 5.00%, 10/1/41 | | | 2,470 | | | | 2,867,892 | |
| | |
New Jersey Transportation Trust Fund Authority, (Transportation Program), 2.70%, (SIFMA + 1.20%), 12/15/21 (Put Date), 6/15/34(5) | | | 2,275 | | | | 2,293,200 | |
| | |
New Jersey Turnpike Authority, 4.00%, 1/1/43 | | | 3,795 | | | | 4,029,265 | |
| | |
New Jersey Turnpike Authority, 4.00%, 1/1/48 | | | 6,930 | | | | 7,361,670 | |
| | |
New Jersey Turnpike Authority, 5.00%, 1/1/32 | | | 4,725 | | | | 5,693,389 | |
| | |
New Jersey Turnpike Authority, Series 2014A, 5.00%, 1/1/31 | | | 10,000 | | | | 11,371,100 | |
| | |
New Jersey Turnpike Authority, Series 2015E, 5.00%, 1/1/31 | | | 2,980 | | | | 3,425,123 | |
| | | | | | | | |
| Security | | Principal
Amount
(000’s omitted) | | | Value | |
|
| Transportation (continued) | |
| | |
New Jersey Turnpike Authority, Series 2017B, 5.00%, 1/1/31 | | $ | 5,760 | | | $ | 6,977,088 | |
| | |
New York Transportation Development Corp., (LaGuardia Airport Terminal B Redevelopment), (AMT), 5.00%, 7/1/41 | | | 14,090 | | | | 15,313,435 | |
| | |
North Texas Tollway Authority, 5.00%, 1/1/29 | | | 5,000 | | | | 5,896,300 | |
| | |
Oregon Department of Transportation, 5.00%, 11/15/38 | | | 5,345 | | | | 6,016,546 | |
| | |
Orlando-Orange County Expressway Authority, FL, Prerefunded to 7/1/20, 5.00%, 7/1/35 | | | 3,145 | | | | 3,280,046 | |
| | |
Orlando-Orange County Expressway Authority, FL, Prerefunded to 7/1/20, 5.00%, 7/1/35 | | | 11,855 | | | | 12,356,467 | |
| | |
Pennsylvania Turnpike Commission, Prerefunded to 12/1/20, 5.35%, 12/1/30 | | | 5,005 | | | | 5,306,751 | |
| | |
Port Authority of New York and New Jersey, 5.00%, 5/1/40 | | | 8,500 | | | | 9,738,535 | |
| | |
Port Authority of New York and New Jersey, (AMT), 4.00%, 9/1/34 | | | 10,800 | | | | 11,366,244 | |
| | |
Port Authority of New York and New Jersey, (AMT), 5.00%, 9/15/31 | | | 15,000 | | | | 18,066,600 | |
| | |
Port Authority of New York and New Jersey, (AMT), 5.00%, 10/1/35 | | | 5,000 | | | | 5,800,300 | |
| | |
Public Finance Authority, WI, (Denver International Airport Great Hall), (AMT), 5.00%, 9/30/37 | | | 3,605 | | | | 4,066,764 | |
| | |
Salt Lake City, UT, (Salt Lake City International Airport), (AMT), 5.00%, 7/1/38 | | | 7,165 | | | | 8,357,614 | |
| | |
San Francisco City and County Airport Commission, CA, (San Francisco International Airport), (AMT), 5.00%, 5/1/41 | | | 25,630 | | | | 29,114,398 | |
| | |
San Francisco City and County Airport Commission, CA, (San Francisco International Airport), (AMT), 5.00%, 5/1/44 | | | 8,535 | | | | 9,474,191 | |
| | |
San Francisco City and County Airport Commission, CA, (San Francisco International Airport), (AMT), 5.00%, 5/1/46 | | | 5,000 | | | | 5,649,050 | |
| | |
Texas Private Activity Bond Surface Transportation Corp., (LBJ Express Managed Lanes Project), 7.00%, 6/30/34 | | | 29,200 | | | | 30,995,508 | |
| | |
Texas Private Activity Bond Surface Transportation Corp., (North Tarrant Express Managed Lanes Project), 6.875%, 12/31/39 | | | 24,110 | | | | 24,974,585 | |
| | |
| | | | | | | $ | 543,967,452 | |
|
| Water and Sewer — 5.7% | |
| | |
Detroit, MI, Sewage Disposal System, 5.25%, 7/1/39 | | $ | 22,500 | | | $ | 24,300,900 | |
| | |
Detroit, MI, Water Supply System, 5.00%, 7/1/41 | | | 2,185 | | | | 2,288,482 | |
| | |
Detroit, MI, Water Supply System, 5.25%, 7/1/41 | | | 56,420 | | | | 60,057,397 | |
| | |
East Bay Municipal Utility District, CA, Water System Revenue, 5.00%, 6/1/35 | | | 6,335 | | | | 7,639,186 | |
| | |
East Bay Municipal Utility District, CA, Water System Revenue, 5.00%, 6/1/37 | | | 7,280 | | | | 8,395,369 | |
| | | | |
| | 17 | | See Notes to Financial Statements. |
Eaton Vance
National Municipal Income Fund
March 31, 2019
Portfolio of Investments (Unaudited) — continued
| | | | | | | | |
| Security | | Principal
Amount
(000’s omitted) | | | Value | |
|
| Water and Sewer (continued) | |
| | |
Michigan Finance Authority, (Detroit Water and Sewerage Department), 5.00%, 7/1/33 | | $ | 8,095 | | | $ | 9,041,548 | |
| | |
Michigan Finance Authority, (Detroit Water and Sewerage Department), 5.00%, 7/1/44 | | | 8,095 | | | | 8,657,117 | |
| | |
Missoula, MT, Water System Revenue, 4.00%, 7/1/37(2) | | | 600 | | | | 651,594 | |
| | |
Missoula, MT, Water System Revenue, 5.00%, 7/1/33(2) | | | 565 | | | | 682,989 | |
| | |
Missoula, MT, Water System Revenue, 5.00%, 7/1/35(2) | | | 1,135 | | | | 1,363,623 | |
| | |
Missoula, MT, Water System Revenue, 5.00%, 7/1/36(2) | | | 800 | | | | 956,832 | |
| | |
New York City Municipal Water Finance Authority, NY, (Water and Sewer System), 4.00%, 6/15/40 | | | 10,000 | | | | 10,898,400 | |
| | |
New York City Municipal Water Finance Authority, NY, (Water and Sewer System), 5.00%, 6/15/35 | | | 8,680 | | | | 10,133,900 | |
| | |
Portland, OR, Water System Revenue, 4.00%, 4/1/32 | | | 2,255 | | | | 2,481,154 | |
| | |
Virginia Beach, VA, Storm Water Utility Revenue, 4.00%, 11/15/29 | | | 1,095 | | | | 1,291,596 | |
| | |
Virginia Beach, VA, Storm Water Utility Revenue, 4.00%, 11/15/30 | | | 1,140 | | | | 1,327,120 | |
| | |
Virginia Beach, VA, Storm Water Utility Revenue, 4.00%, 11/15/31 | | | 1,085 | | | | 1,246,112 | |
| | |
| | | | | | | $ | 151,413,319 | |
| |
Total Tax-Exempt Municipal Securities — 102.8%
(identified cost $2,611,961,935) | | | $ | 2,752,032,417 | |
|
| Taxable Municipal Securities — 3.1% | |
| Security | | Principal
Amount
(000’s omitted) | | | Value | |
| | |
| Cogeneration — 0.0%(6) | | | | | | |
| | |
Northampton County Industrial Development Authority, PA, (Northampton Generating), 5.00%, 12/31/23(1) | | $ | 3,099 | | | $ | 929,752 | |
| | |
| | | | | | | $ | 929,752 | |
|
| General Obligations — 0.1% | |
| | |
Chicago, IL, 7.75%, 1/1/42 | | $ | 2,113 | | | $ | 2,285,886 | |
| | |
| | | | | | | $ | 2,285,886 | |
|
| Hospital — 1.4% | |
| | |
California Statewide Communities Development Authority, (Loma Linda University Medical Center), 6.00%, 12/1/24 | | $ | 34,250 | | | $ | 36,334,112 | |
| | |
| | | | | | | $ | 36,334,112 | |
| | | | | | | | |
| Security | | Principal
Amount
(000’s omitted) | | | Value | |
|
| Insured – Transportation — 1.6% | |
| | |
Alameda Corridor Transportation Authority, CA, (AMBAC), 0.00%, 10/1/26 | | $ | 22,500 | | | $ | 16,959,600 | |
| | |
Alameda Corridor Transportation Authority, CA, (AMBAC), 0.00%, 10/1/27 | | | 34,390 | | | | 24,710,591 | |
| | |
| | | | | | | $ | 41,670,191 | |
| |
Total Taxable Municipal Securities — 3.1%
(identified cost $73,845,909) | | | $ | 81,219,941 | |
|
| Trust Units — 1.3% | |
| Security | | Notional
Amount
(000’s omitted) | | | Value | |
| | |
| Insured – Special Tax Revenue — 1.3% | | | | | | |
| | |
COFINA Series 2007A Senior Bonds Due 2045 National Custodial Trust (taxable), 8/1/45(9) | | $ | 10,207 | | | $ | 8,407,711 | |
| | |
COFINA Series 2007A Senior Bonds Due 2045 National Custodial Trust (non-taxable), 8/1/45(9) | | | 30,996 | | | | 27,198,841 | |
| |
Total Trust Units — 1.3%
(identified cost $33,307,501) | | | $ | 35,606,552 | |
| |
Total Investments — 107.2%
(identified cost $2,719,115,345) | | | $ | 2,868,858,910 | |
| |
Other Assets, Less Liabilities — (7.2)% | | | $ | (192,447,232 | ) |
| | |
Net Assets — 100.0% | | | | | | $ | 2,676,411,678 | |
The percentage shown for each investment category in the Portfolio of Investments is based on net assets.
At March 31, 2019, the concentration of the Fund’s investments in the various states and territories, determined as a percentage of net assets, is as follows:
| | | | |
| |
| New York | | | 21.1% | |
| |
| California | | | 19.4% | |
| |
| Texas | | | 12.3% | |
| |
| Others, representing less than 10% individually | | | 54.4% | |
The Fund invests primarily in debt securities issued by municipalities. The ability of the issuers of the debt securities to meet their obligations may be affected by economic developments in a specific industry or municipality. In order to reduce the risk associated with such economic developments, at March 31, 2019, 7.3% of total investments are backed by bond insurance of various financial institutions and financial guaranty assurance agencies. The aggregate percentage insured by an individual financial institution or financial guaranty assurance agency ranged from 1.5% to 3.2% of total investments.
| | | | |
| | 18 | | See Notes to Financial Statements. |
Eaton Vance
National Municipal Income Fund
March 31, 2019
Portfolio of Investments (Unaudited) — continued
| (1) | Represents a payment-in-kind security which may pay interest in additional principal at the issuer’s discretion. |
| (2) | When-issued/delayed delivery security. |
| (3) | Security exempt from registration pursuant to Rule 144A under the Securities Act of 1933, as amended. These securities may be sold in certain transactions in reliance on an exemption from registration (normally to qualified institutional buyers). At March 31, 2019, the aggregate value of these securities is $5,965,411 or 0.2% of the Fund’s net assets. |
| (4) | Security represents the municipal bond held by a trust that issues residual interest bonds (see Note 1H). |
| (5) | Floating rate security. The stated interest rate represents the rate in effect at March 31, 2019. |
| (6) | Amount is less than 0.05%. |
| (7) | Defaulted security. Issuer has defaulted on the payment of interest and/or principal or has filed for bankruptcy. |
| (8) | Security is in default and making only partial interest payments. |
| (9) | Security was received in connection with the restructuring of an insured zero-coupon bond issued by the Puerto Rico Sales Tax Financing Corporation (“COFINA”) (the “Original Bond”). The notional amount of the combined taxable and tax-exempt trust units reflects the accreted amount of the Original Bond from original issuance through the restructuring date. Each trust certificate represents an ownership interest in various coupon paying and zero-coupon COFINA bonds and potential insurance payments pursuant to an insurance policy with National Public Finance Guarantee Corporation. The trust units have no stated coupon interest rate but accrete income to maturity at the annual rate of approximately 5.04%, the same rate as the Original Bond. |
Abbreviations:
| | | | |
| | |
| AGC | | – | | Assured Guaranty Corp. |
| | |
| AGM | | – | | Assured Guaranty Municipal Corp. |
| | |
| AMBAC | | – | | AMBAC Financial Group, Inc. |
| | |
| AMT | | – | | Interest earned from these securities may be considered a tax preference item for purposes of the Federal Alternative Minimum Tax. |
| | |
| FHLMC | | – | | Federal Home Loan Mortgage Corp. |
| | |
| FNMA | | – | | Federal National Mortgage Association |
| | |
| GNMA | | – | | Government National Mortgage Association |
| | |
| LIBOR | | – | | London Interbank Offered Rate |
| | |
| NPFG | | – | | National Public Finance Guarantee Corp. |
| | |
| PSF | | – | | Permanent School Fund |
| | |
| SIFMA | | – | | Securities Industry and Financial Markets Association Municipal Swap Index |
Currency Abbreviations:
| | | | |
| | |
| USD | | – | | United States Dollar |
| | | | |
| | 19 | | See Notes to Financial Statements. |
Eaton Vance
Municipal Income Funds
March 31, 2019
Statements of Assets and Liabilities (Unaudited)
| | | | | | | | |
| | | March 31, 2019 | |
| Assets | | AMT-Free Fund | | | National Fund | |
| | |
Investments — | | | | | | | | |
| | |
Identified cost | | $ | 302,589,532 | | | $ | 2,719,115,345 | |
| | |
Unrealized appreciation | | | 22,606,028 | | | | 149,743,565 | |
| | |
Investments, at value | | $ | 325,195,560 | | | $ | 2,868,858,910 | |
| | |
Cash | | $ | 18,230 | | | $ | 14,634,039 | |
| | |
Deposits for derivatives collateral — financial futures contracts | | | 157,478 | | | | — | |
| | |
Interest receivable | | | 4,266,926 | | | | 32,361,850 | |
| | |
Receivable for investments sold | | | 5,450,000 | | | | 6,696,261 | |
| | |
Receivable for Fund shares sold | | | 117,407 | | | | 5,165,684 | |
| | |
Receivable for variation margin on open financial futures contracts | | | 40,775 | | | | — | |
| | |
Total assets | | $ | 335,246,376 | | | $ | 2,927,716,744 | |
| |
| Liabilities | | | | | |
| | |
Payable for floating rate notes issued | | $ | 29,981,339 | | | $ | 151,366,716 | |
| | |
Demand note payable | | | 700,000 | | | | — | |
| | |
Payable for investments purchased | | | — | | | | 16,228,730 | |
| | |
Payable for when-issued/delayed delivery securities | | | 1,485,142 | | | | 72,568,918 | |
| | |
Payable for Fund shares redeemed | | | 481,581 | | | | 7,068,637 | |
| | |
Distributions payable | | | 167,267 | | | | 1,233,900 | |
| | |
Payable to affiliates: | | | | | | | | |
| | |
Investment adviser fee | | | 111,312 | | | | 794,526 | |
| | |
Distribution and service fees | | | 49,507 | | | | 493,475 | |
| | |
Interest expense and fees payable | | | 213,233 | | | | 1,091,271 | |
| | |
Accrued expenses | | | 77,636 | | | | 458,893 | |
| | |
Total liabilities | | $ | 33,267,017 | | | $ | 251,305,066 | |
| | |
Net Assets | | $ | 301,979,359 | | | $ | 2,676,411,678 | |
| |
| Sources of Net Assets | | | | | |
| | |
Paid-in capital | | $ | 305,537,622 | | | $ | 2,797,956,449 | |
| | |
Accumulated loss | | | (3,558,263 | ) | | | (121,544,771 | ) |
| | |
Net Assets | | $ | 301,979,359 | | | $ | 2,676,411,678 | |
| | | | |
| | 20 | | See Notes to Financial Statements. |
Eaton Vance
Municipal Income Funds
March 31, 2019
Statements of Assets and Liabilities (Unaudited) — continued
| | | | | | | | |
| | | March 31, 2019 | |
| Class A Shares | | AMT-Free Fund | | | National Fund | |
| | |
Net Assets | | $ | 148,468,770 | | | $ | 1,544,376,531 | |
| | |
Shares Outstanding | | | 16,427,564 | | | | 156,408,382 | |
| | |
Net Asset Value and Redemption Price Per Share | | | | | | | | |
| | |
(net assets ÷ shares of beneficial interest outstanding) | | $ | 9.04 | | | $ | 9.87 | |
| | |
Maximum Offering Price Per Share | | | | | | | | |
| | |
(100 ÷ 95.25 of net asset value per share) | | $ | 9.49 | | | $ | 10.36 | |
| |
| Class B Shares | | | | | |
| | |
Net Assets | | $ | — | | | $ | 877,200 | |
| | |
Shares Outstanding | | | — | | | | 88,832 | |
| | |
Net Asset Value and Offering Price Per Share* | | | | | | | | |
| | |
(net assets ÷ shares of beneficial interest outstanding) | | $ | — | | | $ | 9.87 | |
| |
| Class C Shares | | | | | |
| | |
Net Assets | | $ | 21,567,307 | | | $ | 195,376,220 | |
| | |
Shares Outstanding | | | 2,399,984 | | | | 19,785,967 | |
| | |
Net Asset Value and Offering Price Per Share* | | | | | | | | |
| | |
(net assets ÷ shares of beneficial interest outstanding) | | $ | 8.99 | | | $ | 9.87 | |
| |
| Class I Shares | | | | | |
| | |
Net Assets | | $ | 131,943,282 | | | $ | 935,781,727 | |
| | |
Shares Outstanding | | | 13,365,421 | | | | 94,775,557 | |
| | |
Net Asset Value, Offering Price and Redemption Price Per Share | | | | | | | | |
| | |
(net assets ÷ shares of beneficial interest outstanding) | | $ | 9.87 | | | $ | 9.87 | |
On sales of $50,000 or more, the offering price of Class A shares is reduced.
| * | Redemption price per share is equal to the net asset value less any applicable contingent deferred sales charge. |
| | | | |
| | 21 | | See Notes to Financial Statements. |
Eaton Vance
Municipal Income Funds
March 31, 2019
Statements of Operations (Unaudited)
| | | | | | | | |
| | | Six Months Ended March 31, 2019 | |
| Investment Income | | AMT-Free Fund | | | National Fund | |
| | |
Interest | | $ | 7,051,858 | | | $ | 55,391,506 | |
| | |
Total investment income | | $ | 7,051,858 | | | $ | 55,391,506 | |
|
| Expenses | |
| | |
Investment adviser fee | | $ | 645,082 | | | $ | 4,511,789 | |
| | |
Distribution and service fees | | | | | | | | |
| | |
Class A | | | 175,957 | | | | 1,787,957 | |
| | |
Class B | | | — | | | | 6,373 | |
| | |
Class C | | | 138,032 | | | | 1,483,467 | |
| | |
Trustees’ fees and expenses | | | 8,488 | | | | 54,250 | |
| | |
Custodian fee | | | 46,222 | | | | 232,796 | |
| | |
Transfer and dividend disbursing agent fees | | | 43,970 | | | | 499,214 | |
| | |
Legal and accounting services | | | 33,589 | | | | 74,315 | |
| | |
Printing and postage | | | 8,688 | | | | 80,235 | |
| | |
Registration fees | | | 38,657 | | | | 72,060 | |
| | |
Interest expense and fees | | | 357,479 | | | | 1,761,173 | |
| | |
Miscellaneous | | | 31,616 | | | | 98,530 | |
| | |
Total expenses | | $ | 1,527,780 | | | $ | 10,662,159 | |
| | |
Net investment income | | $ | 5,524,078 | | | $ | 44,729,347 | |
|
| Realized and Unrealized Gain (Loss) | |
| | |
Net realized gain (loss) — | | | | | | | | |
| | |
Investment transactions | | $ | 1,043,730 | | | $ | 1,042,955 | |
| | |
Financial futures contracts | | | (674,829 | ) | | | (7,481,052 | ) |
| | |
Net realized gain (loss) | | $ | 368,901 | | | $ | (6,438,097 | ) |
| | |
Change in unrealized appreciation (depreciation) — | | | | | | | | |
| | |
Investments | | $ | 6,113,896 | | | $ | 69,160,885 | |
| | |
Financial futures contracts | | | (855,957 | ) | | | (5,031,282 | ) |
| | |
Net change in unrealized appreciation (depreciation) | | $ | 5,257,939 | | | $ | 64,129,603 | |
| | |
Net realized and unrealized gain | | $ | 5,626,840 | | | $ | 57,691,506 | |
| | |
Net increase in net assets from operations | | $ | 11,150,918 | | | $ | 102,420,853 | |
| | | | |
| | 22 | | See Notes to Financial Statements. |
Eaton Vance
Municipal Income Funds
March 31, 2019
Statements of Changes in Net Assets
| | | | | | | | |
| | | Six Months Ended March 31, 2019 (Unaudited) | |
| Increase (Decrease) in Net Assets | | AMT-Free Fund | | | National Fund | |
| | |
From operations — | | | | | | | | |
| | |
Net investment income | | $ | 5,524,078 | | | $ | 44,729,347 | |
| | |
Net realized gain (loss) | | | 368,901 | | | | (6,438,097 | ) |
| | |
Net change in unrealized appreciation (depreciation) | | | 5,257,939 | | | | 64,129,603 | |
| | |
Net increase in net assets from operations | | $ | 11,150,918 | | | $ | 102,420,853 | |
| | |
Distributions to shareholders — | | | | | | | | |
| | |
Class A | | $ | (2,575,341 | ) | | $ | (24,869,130 | ) |
| | |
Class B | | | — | | | | (17,152 | ) |
| | |
Class C | | | (398,928 | ) | | | (4,000,164 | ) |
| | |
Class I | | | (2,479,895 | ) | | | (14,992,260 | ) |
| | |
Total distributions to shareholders | | $ | (5,454,164 | ) | | $ | (43,878,706 | ) |
| | |
Transactions in shares of beneficial interest — | | | | | | | | |
| | |
Proceeds from sale of shares | | | | | | | | |
| | |
Class A | | $ | 8,782,679 | | | $ | 47,774,706 | |
| | |
Class B | | | — | | | | 15,480 | |
| | |
Class C | | | 2,395,999 | | | | 11,765,162 | |
| | |
Class I | | | 17,923,073 | | | | 311,278,682 | |
| | |
Net asset value of shares issued to shareholders in payment of distributions declared | | | | | | | | |
| | |
Class A | | | 2,312,917 | | | | 20,886,686 | |
| | |
Class B | | | — | | | | 14,968 | |
| | |
Class C | | | 336,763 | | | | 3,381,075 | |
| | |
Class I | | | 1,794,553 | | | | 12,433,070 | |
| | |
Cost of shares redeemed | | | | | | | | |
| | |
Class A | | | (14,430,177 | ) | | | (128,153,069 | ) |
| | |
Class B | | | — | | | | (146,426 | ) |
| | |
Class C | | | (4,746,247 | ) | | | (37,708,553 | ) |
| | |
Class I | | | (22,567,615 | ) | | | (164,347,554 | ) |
| | |
Net asset value of shares converted | | | | | | | | |
| | |
Class A | | | 9,371,934 | | | | 150,609,521 | |
| | |
Class B | | | — | | | | (986,997 | ) |
| | |
Class C | | | (9,371,934 | ) | | | (149,622,524 | ) |
| | |
Net increase (decrease) in net assets from Fund share transactions | | $ | (8,198,055 | ) | | $ | 77,194,227 | |
| | |
Net increase (decrease) in net assets | | $ | (2,501,301 | ) | | $ | 135,736,374 | |
|
| Net Assets | |
| | |
At beginning of period | | $ | 304,480,660 | | | $ | 2,540,675,304 | |
| | |
At end of period | | $ | 301,979,359 | | | $ | 2,676,411,678 | |
| | | | |
| | 23 | | See Notes to Financial Statements. |
Eaton Vance
Municipal Income Funds
March 31, 2019
Statements of Changes in Net Assets — continued
| | | | | | | | |
| | | Year Ended September 30, 2018 | |
| Increase (Decrease) in Net Assets | | AMT-Free Fund | | | National Fund | |
| | |
From operations — | | | | | | | | |
| | |
Net investment income | | $ | 11,986,740 | | | $ | 94,324,596 | |
| | |
Net realized gain | | | 1,771,405 | | | | 28,043,084 | |
| | |
Net change in unrealized appreciation (depreciation) | | | (11,101,128 | ) | | | (102,739,215 | ) |
| | |
Net increase in net assets from operations | | $ | 2,657,017 | | | $ | 19,628,465 | |
| | |
Distributions to shareholders — | | | | | | | | |
| | |
Class A | | $ | (5,434,533 | ) | | $ | (54,168,530 | ) |
| | |
Class B | | | — | | | | (114,881 | ) |
| | |
Class C | | | (1,052,649 | ) | | | (11,822,767 | ) |
| | |
Class I | | | (5,445,839 | ) | | | (29,156,764 | ) |
| | |
Total distributions to shareholders | | $ | (11,933,021 | ) | | $ | (95,262,942 | ) |
| | |
Transactions in shares of beneficial interest — | | | | | | | | |
| | |
Proceeds from sale of shares | | | | | | | | |
| | |
Class A | | $ | 12,660,956 | | | $ | 82,515,984 | |
| | |
Class B | | | — | | | | 9,791 | |
| | |
Class C | | | 1,973,015 | | | | 15,416,908 | |
| | |
Class I | | | 24,004,715 | | | | 222,154,004 | |
| | |
Net asset value of shares issued to shareholders in payment of distributions declared | | | | | | | | |
| | |
Class A | | | 4,918,893 | | | | 45,334,073 | |
| | |
Class B | | | — | | | | 100,314 | |
| | |
Class C | | | 896,217 | | | | 10,049,803 | |
| | |
Class I | | | 4,020,654 | | | | 24,393,212 | |
| | |
Cost of shares redeemed | | | | | | | | |
| | |
Class A | | | (29,294,897 | ) | | | (270,017,892 | ) |
| | |
Class B | | | — | | | | (1,148,393 | ) |
| | |
Class C | | | (8,383,713 | ) | | | (112,912,789 | ) |
| | |
Class I | | | (45,904,121 | ) | | | (245,761,233 | ) |
| | |
Net asset value of shares converted | | | | | | | | |
| | |
Class A | | | — | | | | 3,587,952 | |
| | |
Class B | | | — | | | | (3,587,952 | ) |
| | |
Net decrease in net assets from Fund share transactions | | $ | (35,108,281 | ) | | $ | (229,866,218 | ) |
| | |
Net decrease in net assets | | $ | (44,384,285 | ) | | $ | (305,500,695 | ) |
|
| Net Assets | |
| | |
At beginning of year | | $ | 348,864,945 | | | $ | 2,846,175,999 | |
| | |
At end of year | | $ | 304,480,660 | | | $ | 2,540,675,304 | |
| | | | |
| | 24 | | See Notes to Financial Statements. |
Eaton Vance
Municipal Income Funds
March 31, 2019
Financial Highlights
| | | | | | | | | | | | | | | | | | | | | | | | |
| | | AMT-Free Fund — Class A | |
| | |
| | | Six Months Ended
March 31, 2019
(Unaudited) | | | Year Ended September 30, | |
| | | 2018 | | | 2017 | | | 2016 | | | 2015 | | | 2014 | |
| | | | | | | |
Net asset value — Beginning of period | | $ | 8.870 | | | $ | 9.130 | | | $ | 9.430 | | | $ | 9.210 | | | $ | 9.350 | | | $ | 8.670 | |
| | | | | | |
| Income (Loss) From Operations | | | | | | | | | | | | | | | | | | | | | | | | |
| | | | | | |
Net investment income(1) | | $ | 0.164 | | | $ | 0.336 | | | $ | 0.351 | | | $ | 0.358 | | | $ | 0.374 | | | $ | 0.395 | |
| | | | | | |
Net realized and unrealized gain (loss) | | | 0.168 | | | | (0.262 | ) | | | (0.298 | ) | | | 0.218 | | | | (0.142 | ) | | | 0.677 | |
| | | | | | |
Total income from operations | | $ | 0.332 | | | $ | 0.074 | | | $ | 0.053 | | | $ | 0.576 | | | $ | 0.232 | | | $ | 1.072 | |
| | | | | | |
| Less Distributions | | | | | | | | | | | | | | | | | | | | | | | | |
| | | | | | |
From net investment income | | $ | (0.162 | ) | | $ | (0.334 | ) | | $ | (0.353 | ) | | $ | (0.356 | ) | | $ | (0.372 | ) | | $ | (0.392 | ) |
| | | | | | |
Total distributions | | $ | (0.162 | ) | | $ | (0.334 | ) | | $ | (0.353 | ) | | $ | (0.356 | ) | | $ | (0.372 | ) | | $ | (0.392 | ) |
| | | | | | |
Net asset value — End of period | | $ | 9.040 | | | $ | 8.870 | | | $ | 9.130 | | | $ | 9.430 | | | $ | 9.210 | | | $ | 9.350 | |
| | | | | | |
Total Return(2) | | | 3.78 | %(3) | | | 0.83 | % | | | 0.64 | % | | | 6.33 | % | | | 2.52 | % | | | 12.63 | % |
| | | | |
| Ratios/Supplemental Data | | | | | | | | | | | | | | | | | |
| | | | | | |
Net assets, end of period (000’s omitted) | | $ | 148,469 | | | $ | 139,623 | | | $ | 155,589 | | | $ | 198,762 | | | $ | 194,227 | | | $ | 200,408 | |
| | | | | | |
Ratios (as a percentage of average daily net assets): | | | | | | | | | | | | | | | | | | | | | | | | |
| | | | | | |
Expenses excluding interest and fees(4) | | | 0.83 | %(5) | | | 0.81 | % | | | 0.82 | % | | | 0.81 | % | | | 0.82 | % | | | 0.83 | % |
| | | | | | |
Interest and fee expense(6) | | | 0.24 | %(5) | | | 0.24 | % | | | 0.16 | % | | | 0.10 | % | | | 0.08 | % | | | 0.09 | % |
| | | | | | |
Total expenses(4) | | | 1.07 | %(5) | | | 1.05 | % | | | 0.98 | % | | | 0.91 | % | | | 0.90 | % | | | 0.92 | % |
| | | | | | |
Net investment income | | | 3.71 | %(5) | | | 3.74 | % | | | 3.86 | % | | | 3.81 | % | | | 4.02 | % | | | 4.40 | % |
| | | | | | |
Portfolio Turnover | | | 11 | %(3) | | | 18 | % | | | 33 | % | | | 21 | % | | | 17 | % | | | 24 | % |
| (1) | Computed using average shares outstanding. |
| (2) | Returns are historical and are calculated by determining the percentage change in net asset value with all distributions reinvested and do not reflect the effect of sales charges. |
| (4) | Excludes the effect of custody fee credits, if any, of less than 0.005%. Effective September 1, 2015, custody fee credits, which were earned on cash deposit balances, were discontinued by the custodian. |
| (6) | Interest and fee expense relates to the liability for floating rate notes issued in conjunction with residual interest bond transactions (see Note 1H). |
| | | | |
| | 25 | | See Notes to Financial Statements. |
Eaton Vance
Municipal Income Funds
March 31, 2019
Financial Highlights — continued
| | | | | | | | | | | | | | | | | | | | | | | | |
| | | AMT-Free Fund — Class C | |
| | |
| | | Six Months Ended
March 31, 2019
(Unaudited) | | | Year Ended September 30, | |
| | | 2018 | | | 2017 | | | 2016 | | | 2015 | | | 2014 | |
| | | | | | | |
Net asset value — Beginning of period | | $ | 8.820 | | | $ | 9.080 | | | $ | 9.380 | | | $ | 9.160 | | | $ | 9.300 | | | $ | 8.620 | |
| | | | | | |
| Income (Loss) From Operations | | | | | | | | | | | | | | | | | | | | | | | | |
| | | | | | |
Net investment income(1) | | $ | 0.129 | | | $ | 0.267 | | | $ | 0.281 | | | $ | 0.286 | | | $ | 0.302 | | | $ | 0.326 | |
| | | | | | |
Net realized and unrealized gain (loss) | | | 0.169 | | | | (0.262 | ) | | | (0.298 | ) | | | 0.218 | | | | (0.142 | ) | | | 0.677 | |
| | | | | | |
Total income (loss) from operations | | $ | 0.298 | | | $ | 0.005 | | | $ | (0.017 | ) | | $ | 0.504 | | | $ | 0.160 | | | $ | 1.003 | |
| | | | | | |
| Less Distributions | | | | | | | | | | | | | | | | | | | | | | | | |
| | | | | | |
From net investment income | | $ | (0.128 | ) | | $ | (0.265 | ) | | $ | (0.283 | ) | | $ | (0.284 | ) | | $ | (0.300 | ) | | $ | (0.323 | ) |
| | | | | | |
Total distributions | | $ | (0.128 | ) | | $ | (0.265 | ) | | $ | (0.283 | ) | | $ | (0.284 | ) | | $ | (0.300 | ) | | $ | (0.323 | ) |
| | | | | | |
Net asset value — End of period | | $ | 8.990 | | | $ | 8.820 | | | $ | 9.080 | | | $ | 9.380 | | | $ | 9.160 | | | $ | 9.300 | |
| | | | | | |
Total Return(2) | | | 3.41 | %(3) | | | 0.06 | % | | | (0.12 | )% | | | 5.56 | % | | | 1.75 | % | | | 11.84 | % |
| | | | |
| Ratios/Supplemental Data | | | | | | | | | | | | | | | | | |
| | | | | | |
Net assets, end of period (000’s omitted) | | $ | 21,567 | | | $ | 32,545 | | | $ | 39,099 | | | $ | 45,606 | | | $ | 41,903 | | | $ | 37,193 | |
| | | | | | |
Ratios (as a percentage of average daily net assets): | | | | | | | | | | | | | | | | | | | | | | | | |
| | | | | | |
Expenses excluding interest and fees(4) | | | 1.58 | %(5) | | | 1.56 | % | | | 1.57 | % | | | 1.56 | % | | | 1.57 | % | | | 1.58 | % |
| | | | | | |
Interest and fee expense(6) | | | 0.24 | %(5) | | | 0.24 | % | | | 0.16 | % | | | 0.10 | % | | | 0.08 | % | | | 0.09 | % |
| | | | | | |
Total expenses(4) | | | 1.82 | %(5) | | | 1.80 | % | | | 1.73 | % | | | 1.66 | % | | | 1.65 | % | | | 1.67 | % |
| | | | | | |
Net investment income | | | 2.93 | %(5) | | | 2.99 | % | | | 3.11 | % | | | 3.06 | % | | | 3.27 | % | | | 3.65 | % |
| | | | | | |
Portfolio Turnover | | | 11 | %(3) | | | 18 | % | | | 33 | % | | | 21 | % | | | 17 | % | | | 24 | % |
| (1) | Computed using average shares outstanding. |
| (2) | Returns are historical and are calculated by determining the percentage change in net asset value with all distributions reinvested and do not reflect the effect of sales charges. |
| (4) | Excludes the effect of custody fee credits, if any, of less than 0.005%. Effective September 1, 2015, custody fee credits, which were earned on cash deposit balances, were discontinued by the custodian. |
| (6) | Interest and fee expense relates to the liability for floating rate notes issued in conjunction with residual interest bond transactions (see Note 1H). |
| | | | |
| | 26 | | See Notes to Financial Statements. |
Eaton Vance
Municipal Income Funds
March 31, 2019
Financial Highlights — continued
| | | | | | | | | | | | | | | | | | | | | | | | |
| | | AMT-Free Fund — Class I | |
| | |
| | | Six Months Ended
March 31, 2019
(Unaudited) | | | Year Ended September 30, | |
| | | 2018 | | | 2017 | | | 2016 | | | 2015 | | | 2014 | |
| | | | | | | |
Net asset value — Beginning of period | | $ | 9.680 | | | $ | 9.970 | | | $ | 10.300 | | | $ | 10.060 | | | $ | 10.210 | | | $ | 9.470 | |
| | | | | | |
| Income (Loss) From Operations | | | | | | | | | | | | | | | | | | | | | | | | |
| | | | | | |
Net investment income(1) | | $ | 0.191 | | | $ | 0.391 | | | $ | 0.407 | | | $ | 0.415 | | | $ | 0.434 | | | $ | 0.455 | |
| | | | | | |
Net realized and unrealized gain (loss) | | | 0.188 | | | | (0.292 | ) | | | (0.327 | ) | | | 0.240 | | | | (0.152 | ) | | | 0.737 | |
| | | | | | |
Total income from operations | | $ | 0.379 | | | $ | 0.099 | | | $ | 0.080 | | | $ | 0.655 | | | $ | 0.282 | | | $ | 1.192 | |
| | | | | | |
| Less Distributions | | | | | | | | | | | | | | | | | | | | | | | | |
| | | | | | |
From net investment income | | $ | (0.189 | ) | | $ | (0.389 | ) | | $ | (0.410 | ) | | $ | (0.415 | ) | | $ | (0.432 | ) | | $ | (0.452 | ) |
| | | | | | |
Total distributions | | $ | (0.189 | ) | | $ | (0.389 | ) | | $ | (0.410 | ) | | $ | (0.415 | ) | | $ | (0.432 | ) | | $ | (0.452 | ) |
| | | | | | |
Net asset value — End of period | | $ | 9.870 | | | $ | 9.680 | | | $ | 9.970 | | | $ | 10.300 | | | $ | 10.060 | | | $ | 10.210 | |
| | | | | | |
Total Return(2) | | | 3.96 | %(3) | | | 1.02 | % | | | 0.87 | % | | | 6.60 | % | | | 2.70 | % | | | 12.99 | % |
| | | | |
| Ratios/Supplemental Data | | | | | | | | | | | | | | | | | |
| | | | | | |
Net assets, end of period (000’s omitted) | | $ | 131,943 | | | $ | 132,313 | | | $ | 154,177 | | | $ | 154,458 | | | $ | 109,937 | | | $ | 102,404 | |
| | | | | | |
Ratios (as a percentage of average daily net assets): | | | | | | | | | | | | | | | | | | | | | | | | |
| | | | | | |
Expenses excluding interest and fees(4) | | | 0.58 | %(5) | | | 0.56 | % | | | 0.57 | % | | | 0.56 | % | | | 0.57 | % | | | 0.58 | % |
| | | | | | |
Interest and fee expense(6) | | | 0.24 | %(5) | | | 0.24 | % | | | 0.16 | % | | | 0.10 | % | | | 0.08 | % | | | 0.09 | % |
| | | | | | |
Total expenses(4) | | | 0.82 | %(5) | | | 0.80 | % | | | 0.73 | % | | | 0.66 | % | | | 0.65 | % | | | 0.67 | % |
| | | | | | |
Net investment income | | | 3.95 | %(5) | | | 3.98 | % | | | 4.09 | % | | | 4.04 | % | | | 4.27 | % | | | 4.64 | % |
| | | | | | |
Portfolio Turnover | | | 11 | %(3) | | | 18 | % | | | 33 | % | | | 21 | % | | | 17 | % | | | 24 | % |
| (1) | Computed using average shares outstanding. |
| (2) | Returns are historical and are calculated by determining the percentage change in net asset value with all distributions reinvested. |
| (4) | Excludes the effect of custody fee credits, if any, of less than 0.005%. Effective September 1, 2015, custody fee credits, which were earned on cash deposit balances, were discontinued by the custodian. |
| (6) | Interest and fee expense relates to the liability for floating rate notes issued in conjunction with residual interest bond transactions (see Note 1H). |
| | | | |
| | 27 | | See Notes to Financial Statements. |
Eaton Vance
Municipal Income Funds
March 31, 2019
Financial Highlights — continued
| | | | | | | | | | | | | | | | | | | | | | | | |
| | | National Fund — Class A | |
| | |
| | | Six Months Ended
March 31, 2019
(Unaudited) | | | Year Ended September 30, | |
| | | 2018 | | | 2017 | | | 2016 | | | 2015 | | | 2014 | |
| | | | | | | |
Net asset value — Beginning of period | | $ | 9.650 | | | $ | 9.930 | | | $ | 10.170 | | | $ | 9.810 | | | $ | 9.870 | | | $ | 9.170 | |
| | | | | | |
| Income (Loss) From Operations | | | | | | | | | | | | | | | | | | | | | | | | |
| | | | | | |
Net investment income(1) | | $ | 0.171 | | | $ | 0.350 | | | $ | 0.366 | | | $ | 0.385 | | | $ | 0.389 | | | $ | 0.446 | |
| | | | | | |
Net realized and unrealized gain (loss) | | | 0.216 | | | | (0.277 | ) | | | (0.242 | ) | | | 0.357 | | | | (0.064 | ) | | | 0.707 | |
| | | | | | |
Total income from operations | | $ | 0.387 | | | $ | 0.073 | | | $ | 0.124 | | | $ | 0.742 | | | $ | 0.325 | | | $ | 1.153 | |
| | | | | | |
| Less Distributions | | | | | | | | | | | | | | | | | | | | | | | | |
| | | | | | |
From net investment income | | $ | (0.167 | ) | | $ | (0.353 | ) | | $ | (0.364 | ) | | $ | (0.382 | ) | | $ | (0.385 | ) | | $ | (0.453 | ) |
| | | | | | |
Total distributions | | $ | (0.167 | ) | | $ | (0.353 | ) | | $ | (0.364 | ) | | $ | (0.382 | ) | | $ | (0.385 | ) | | $ | (0.453 | ) |
| | | | | | |
Net asset value — End of period | | $ | 9.870 | | | $ | 9.650 | | | $ | 9.930 | | | $ | 10.170 | | | $ | 9.810 | | | $ | 9.870 | |
| | | | | | |
Total Return(2) | | | 4.06 | %(3) | | | 0.76 | % | | | 1.31 | % | | | 7.68 | % | | | 3.35 | % | | | 12.89 | % |
| | | | |
| Ratios/Supplemental Data | | | | | | | | | | | | | | | | | |
| | | | | | |
Net assets, end of period (000’s omitted) | | $ | 1,544,377 | | | $ | 1,419,239 | | | $ | 1,600,127 | | | $ | 1,857,375 | | | $ | 1,899,324 | | | $ | 2,126,465 | |
| | | | | | |
Ratios (as a percentage of average daily net assets): | | | | | | | | | | | | | | | | | | | | | | | | |
| | | | | | |
Expenses excluding interest and fees(4) | | | 0.69 | %(5) | | | 0.69 | % | | | 0.68 | % | | | 0.67 | % | | | 0.67 | % | | | 0.71 | % |
| | | | | | |
Interest and fee expense(6) | | | 0.14 | %(5) | | | 0.19 | % | | | 0.16 | % | | | 0.12 | % | | | 0.09 | % | | | 0.09 | % |
| | | | | | |
Total expenses(4) | | | 0.83 | %(5) | | | 0.88 | % | | | 0.84 | % | | | 0.79 | % | | | 0.76 | % | | | 0.80 | % |
| | | | | | |
Net investment income | | | 3.55 | %(5) | | | 3.58 | % | | | 3.71 | % | | | 3.83 | % | | | 3.94 | % | | | 4.71 | % |
| | | | | | |
Portfolio Turnover | | | 38 | %(3) | | | 67 | % | | | 70 | % | | | 71 | % | | | 57 | % | | | 47 | % |
| (1) | Computed using average shares outstanding. |
| (2) | Returns are historical and are calculated by determining the percentage change in net asset value with all distributions reinvested and do not reflect the effect of sales charges. |
| (4) | Excludes the effect of custody fee credits, if any, of less than 0.005%. Effective September 1, 2015, custody fee credits, which were earned on cash deposit balances, were discontinued by the custodian. |
| (6) | Interest and fee expense relates to the liability for floating rate notes issued in conjunction with residual interest bond transactions (see Note 1H). |
| | | | |
| | 28 | | See Notes to Financial Statements. |
Eaton Vance
Municipal Income Funds
March 31, 2019
Financial Highlights — continued
| | | | | | | | | | | | | | | | | | | | | | | | |
| | | National Fund — Class B | |
| | |
| | | Six Months Ended
March 31, 2019
(Unaudited) | | | Year Ended September 30, | |
| | | 2018 | | | 2017 | | | 2016 | | | 2015 | | | 2014 | |
| | | | | | | |
Net asset value — Beginning of period | | $ | 9.650 | | | $ | 9.930 | | | $ | 10.170 | | | $ | 9.810 | | | $ | 9.870 | | | $ | 9.170 | |
| | | | | | |
| Income (Loss) From Operations | | | | | | | | | | | | | | | | | | | | | | | | |
| | | | | | |
Net investment income(1) | | $ | 0.133 | | | $ | 0.275 | | | $ | 0.292 | | | $ | 0.311 | | | $ | 0.315 | | | $ | 0.379 | |
| | | | | | |
Net realized and unrealized gain (loss) | | | 0.218 | | | | (0.275 | ) | | | (0.242 | ) | | | 0.356 | | | | (0.064 | ) | | | 0.704 | |
| | | | | | |
Total income from operations | | $ | 0.351 | | | $ | — | | | $ | 0.050 | | | $ | 0.667 | | | $ | 0.251 | | | $ | 1.083 | |
| | | | | | |
| Less Distributions | | | | | | | | | | | | | | | | | | | | | | | | |
| | | | | | |
From net investment income | | $ | (0.131 | ) | | $ | (0.280 | ) | | $ | (0.290 | ) | | $ | (0.307 | ) | | $ | (0.311 | ) | | $ | (0.383 | ) |
| | | | | | |
Total distributions | | $ | (0.131 | ) | | $ | (0.280 | ) | | $ | (0.290 | ) | | $ | (0.307 | ) | | $ | (0.311 | ) | | $ | (0.383 | ) |
| | | | | | |
Net asset value — End of period | | $ | 9.870 | | | $ | 9.650 | | | $ | 9.930 | | | $ | 10.170 | | | $ | 9.810 | | | $ | 9.870 | |
| | | | | | |
Total Return(2) | | | 3.67 | %(3) | | | 0.01 | % | | | 0.55 | % | | | 6.88 | % | | | 2.58 | % | | | 12.06 | % |
| | | | |
| Ratios/Supplemental Data | | | | | | | | | | | | | | | | | |
| | | | | | |
Net assets, end of period (000’s omitted) | | $ | 877 | | | $ | 1,964 | | | $ | 6,718 | | | $ | 16,644 | | | $ | 25,732 | | | $ | 42,655 | |
| | | | | | |
Ratios (as a percentage of average daily net assets): | | | | | | | | | | | | | | | | | | | | | | | | |
| | | | | | |
Expenses excluding interest and fees(4) | | | 1.45 | %(5) | | | 1.44 | % | | | 1.43 | % | | | 1.42 | % | | | 1.42 | % | | | 1.46 | % |
| | | | | | |
Interest and fee expense(6) | | | 0.14 | %(5) | | | 0.19 | % | | | 0.16 | % | | | 0.12 | % | | | 0.09 | % | | | 0.09 | % |
| | | | | | |
Total expenses(4) | | | 1.59 | %(5) | | | 1.63 | % | | | 1.59 | % | | | 1.54 | % | | | 1.51 | % | | | 1.55 | % |
| | | | | | |
Net investment income | | | 2.76 | %(5) | | | 2.81 | % | | | 2.96 | % | | | 3.10 | % | | | 3.20 | % | | | 4.01 | % |
| | | | | | |
Portfolio Turnover | | | 38 | %(3) | | | 67 | % | | | 70 | % | | | 71 | % | | | 57 | % | | | 47 | % |
| (1) | Computed using average shares outstanding. |
| (2) | Returns are historical and are calculated by determining the percentage change in net asset value with all distributions reinvested and do not reflect the effect of sales charges. |
| (4) | Excludes the effect of custody fee credits, if any, of less than 0.005%. Effective September 1, 2015, custody fee credits, which were earned on cash deposit balances, were discontinued by the custodian. |
| (6) | Interest and fee expense relates to the liability for floating rate notes issued in conjunction with residual interest bond transactions (see Note 1H). |
| | | | |
| | 29 | | See Notes to Financial Statements. |
Eaton Vance
Municipal Income Funds
March 31, 2019
Financial Highlights — continued
| | | | | | | | | | | | | | | | | | | | | | | | |
| | | National Fund — Class C | |
| | |
| | | Six Months Ended
March 31, 2019
(Unaudited) | | | Year Ended September 30, | |
| | | 2018 | | | 2017 | | | 2016 | | | 2015 | | | 2014 | |
| | | | | | | |
Net asset value — Beginning of period | | $ | 9.650 | | | $ | 9.930 | | | $ | 10.170 | | | $ | 9.810 | | | $ | 9.870 | | | $ | 9.170 | |
| | | | | | |
| Income (Loss) From Operations | | | | | | | | | | | | | | | | | | | | | | | | |
| | | | | | |
Net investment income(1) | | $ | 0.132 | | | $ | 0.276 | | | $ | 0.292 | | | $ | 0.310 | | | $ | 0.315 | | | $ | 0.376 | |
| | | | | | |
Net realized and unrealized gain (loss) | | | 0.219 | | | | (0.276 | ) | | | (0.242 | ) | | | 0.357 | | | | (0.064 | ) | | | 0.707 | |
| | | | | | |
Total income from operations | | $ | 0.351 | | | $ | — | | | $ | 0.050 | | | $ | 0.667 | | | $ | 0.251 | | | $ | 1.083 | |
| | | | | | |
| Less Distributions | | | | | | | | | | | | | | | | | | | | | | | | |
| | | | | | |
From net investment income | | $ | (0.131 | ) | | $ | (0.280 | ) | | $ | (0.290 | ) | | $ | (0.307 | ) | | $ | (0.311 | ) | | $ | (0.383 | ) |
| | | | | | |
Total distributions | | $ | (0.131 | ) | | $ | (0.280 | ) | | $ | (0.290 | ) | | $ | (0.307 | ) | | $ | (0.311 | ) | | $ | (0.383 | ) |
| | | | | | |
Net asset value — End of period | | $ | 9.870 | | | $ | 9.650 | | | $ | 9.930 | | | $ | 10.170 | | | $ | 9.810 | | | $ | 9.870 | |
| | | | | | |
Total Return(2) | | | 3.67 | %(3) | | | 0.01 | % | | | 0.56 | % | | | 6.88 | % | | | 2.58 | % | | | 12.06 | % |
| | | | |
| Ratios/Supplemental Data | | | | | | | | | | | | | | | | | |
| | | | | | |
Net assets, end of period (000’s omitted) | | $ | 195,376 | | | $ | 363,026 | | | $ | 462,269 | | | $ | 576,664 | | | $ | 585,346 | | | $ | 645,801 | |
| | | | | | |
Ratios (as a percentage of average daily net assets): | | | | | | | | | | | | | | | | | | | | | | | | |
| | | | | | |
Expenses excluding interest and fees(4) | | | 1.45 | %(5) | | | 1.44 | % | | | 1.43 | % | | | 1.42 | % | | | 1.42 | % | | | 1.46 | % |
| | | | | | |
Interest and fee expense(6) | | | 0.14 | %(5) | | | 0.19 | % | | | 0.16 | % | | | 0.12 | % | | | 0.09 | % | | | 0.09 | % |
| | | | | | |
Total expenses(4) | | | 1.59 | %(5) | | | 1.63 | % | | | 1.59 | % | | | 1.54 | % | | | 1.51 | % | | | 1.55 | % |
| | | | | | |
Net investment income | | | 2.75 | %(5) | | | 2.83 | % | | | 2.96 | % | | | 3.08 | % | | | 3.19 | % | | | 3.98 | % |
| | | | | | |
Portfolio Turnover | | | 38 | %(3) | | | 67 | % | | | 70 | % | | | 71 | % | | | 57 | % | | | 47 | % |
| (1) | Computed using average shares outstanding. |
| (2) | Returns are historical and are calculated by determining the percentage change in net asset value with all distributions reinvested and do not reflect the effect of sales charges. |
| (4) | Excludes the effect of custody fee credits, if any, of less than 0.005%. Effective September 1, 2015, custody fee credits, which were earned on cash deposit balances, were discontinued by the custodian. |
| (6) | Interest and fee expense relates to the liability for floating rate notes issued in conjunction with residual interest bond transactions (see Note 1H). |
| | | | |
| | 30 | | See Notes to Financial Statements. |
Eaton Vance
Municipal Income Funds
March 31, 2019
Financial Highlights — continued
| | | | | | | | | | | | | | | | | | | | | | | | |
| | | National Fund — Class I | |
| | |
| | | Six Months Ended
March 31, 2019
(Unaudited) | | | Year Ended September 30, | |
| | | 2018 | | | 2017 | | | 2016 | | | 2015 | | | 2014 | |
| | | | | | | |
Net asset value — Beginning of period | | $ | 9.650 | | | $ | 9.930 | | | $ | 10.170 | | | $ | 9.810 | | | $ | 9.870 | | | $ | 9.180 | |
| | | | | | |
| Income (Loss) From Operations | | | | | | | | | | | | | | | | | | | | | | | | |
| | | | | | |
Net investment income(1) | | $ | 0.182 | | | $ | 0.374 | | | $ | 0.390 | | | $ | 0.410 | | | $ | 0.413 | | | $ | 0.478 | |
| | | | | | |
Net realized and unrealized gain (loss) | | | 0.217 | | | | (0.277 | ) | | | (0.241 | ) | | | 0.357 | | | | (0.063 | ) | | | 0.690 | |
| | | | | | |
Total income from operations | | $ | 0.399 | | | $ | 0.097 | | | $ | 0.149 | | | $ | 0.767 | | | $ | 0.350 | | | $ | 1.168 | |
| | | | | | |
| Less Distributions | | | | | | | | | | | | | | | | | | | | | | | | |
| | | | | | |
From net investment income | | $ | (0.179 | ) | | $ | (0.377 | ) | | $ | (0.389 | ) | | $ | (0.407 | ) | | $ | (0.410 | ) | | $ | (0.478 | ) |
| | | | | | |
Total distributions | | $ | (0.179 | ) | | $ | (0.377 | ) | | $ | (0.389 | ) | | $ | (0.407 | ) | | $ | (0.410 | ) | | $ | (0.478 | ) |
| | | | | | |
Net asset value — End of period | | $ | 9.870 | | | $ | 9.650 | | | $ | 9.930 | | | $ | 10.170 | | | $ | 9.810 | | | $ | 9.870 | |
| | | | | | |
Total Return(2) | | | 4.18 | %(3) | | | 1.01 | % | | | 1.56 | % | | | 7.94 | % | | | 3.50 | % | | | 13.17 | % |
| | | | |
| Ratios/Supplemental Data | | | | | | | | | | | | | | | | | |
| | | | | | |
Net assets, end of period (000’s omitted) | | $ | 935,782 | | | $ | 756,446 | | | $ | 777,063 | | | $ | 701,153 | | | $ | 674,696 | | | $ | 686,514 | |
| | | | | | |
Ratios (as a percentage of average daily net assets): | | | | | | | | | | | | | | | | | | | | | | | | |
| | | | | | |
Expenses excluding interest and fees(4) | | | 0.44 | %(5) | | | 0.44 | % | | | 0.43 | % | | | 0.42 | % | | | 0.42 | % | | | 0.46 | % |
| | | | | | |
Interest and fee expense(6) | | | 0.14 | %(5) | | | 0.19 | % | | | 0.16 | % | | | 0.12 | % | | | 0.09 | % | | | 0.09 | % |
| | | | | | |
Total expenses(4) | | | 0.58 | %(5) | | | 0.63 | % | | | 0.59 | % | | | 0.54 | % | | | 0.51 | % | | | 0.55 | % |
| | | | | | |
Net investment income | | | 3.78 | %(5) | | | 3.83 | % | | | 3.95 | % | | | 4.09 | % | | | 4.19 | % | | | 5.07 | % |
| | | | | | |
Portfolio Turnover | | | 38 | %(3) | | | 67 | % | | | 70 | % | | | 71 | % | | | 57 | % | | | 47 | % |
| (1) | Computed using average shares outstanding. |
| (2) | Returns are historical and are calculated by determining the percentage change in net asset value with all distributions reinvested. |
| (4) | Excludes the effect of custody fee credits, if any, of less than 0.005%. Effective September 1, 2015, custody fee credits, which were earned on cash deposit balances, were discontinued by the custodian. |
| (6) | Interest and fee expense relates to the liability for floating rate notes issued in conjunction with residual interest bond transactions (see Note 1H). |
| | | | |
| | 31 | | See Notes to Financial Statements. |
Eaton Vance
Municipal Income Funds
March 31, 2019
Notes to Financial Statements (Unaudited)
1 Significant Accounting Policies
Eaton Vance AMT-Free Municipal Income Fund (AMT-Free Fund) and Eaton Vance National Municipal Income Fund (National Fund) (each individually referred to as the Fund, and collectively, the Funds) are a diversified series of Eaton Vance Mutual Funds Trust and Eaton Vance Municipals Trust, respectively (collectively, the Trusts). The Trusts are Massachusetts business trusts registered under the Investment Company Act of 1940, as amended (the 1940 Act), as open-end management investment companies. The Funds’ investment objective is to provide current income exempt from regular federal income tax. The AMT-Free Fund offers three classes of shares. The National Fund offers four classes of shares. Class A shares are generally sold subject to a sales charge imposed at time of purchase. Class B and Class C shares are sold at net asset value and are generally subject to a contingent deferred sales charge (see Note 5). Effective January 25, 2019, Class C shares generally automatically convert to Class A shares ten years after their purchase as described in the Funds’ prospectus. Class I shares are sold at net asset value and are not subject to a sales charge. Class B shares of National Fund automatically convert to Class A shares eight years after their purchase as described in National Fund’s prospectus. Beginning January 1, 2012, Class B shares are only available for purchase upon exchange from another Eaton Vance fund or through reinvestment of distributions. Each class represents a pro-rata interest in the Fund, but votes separately on class-specific matters and (as noted below) is subject to different expenses. Realized and unrealized gains and losses are allocated daily to each class of shares based on the relative net assets of each class to the total net assets of the Fund. Net investment income, other than class-specific expenses, is allocated daily to each class of shares based upon the ratio of the value of each class’s paid shares to the total value of all paid shares. Each class of shares differs in its distribution plan and certain other class-specific expenses.
The following is a summary of significant accounting policies of the Funds. The policies are in conformity with accounting principles generally accepted in the United States of America (U.S. GAAP). Each Fund is an investment company and follows accounting and reporting guidance in the Financial Accounting Standards Board (FASB) Accounting Standards Codification Topic 946.
A Investment Valuation — The following methodologies are used to determine the market value or fair value of investments.
Debt Obligations. Debt obligations are generally valued on the basis of valuations provided by third party pricing services, as derived from such services’ pricing models. Inputs to the models may include, but are not limited to, reported trades, executable bid and ask prices, broker/dealer quotations, prices or yields of securities with similar characteristics, interest rates, anticipated prepayments, benchmark curves or information pertaining to the issuer, as well as industry and economic events. The pricing services may use a matrix approach, which considers information regarding securities with similar characteristics to determine the valuation for a security. Short-term debt obligations purchased with a remaining maturity of sixty days or less for which a valuation from a third party pricing service is not readily available may be valued at amortized cost, which approximates fair value.
Derivatives. Financial futures contracts are valued at the closing settlement price established by the board of trade or exchange on which they are traded.
Fair Valuation. Investments for which valuations or market quotations are not readily available or are deemed unreliable are valued at fair value using methods determined in good faith by or at the direction of the Trustees of a Fund in a manner that fairly reflects the security’s value, or the amount that a Fund might reasonably expect to receive for the security upon its current sale in the ordinary course. Each such determination is based on a consideration of relevant factors, which are likely to vary from one pricing context to another. These factors may include, but are not limited to, the type of security, the existence of any contractual restrictions on the security’s disposition, the price and extent of public trading in similar securities of the issuer or of comparable entities, quotations or relevant information obtained from broker/dealers or other market participants, information obtained from the issuer, analysts, and/or the appropriate stock exchange (for exchange-traded securities), an analysis of the entity’s financial condition, and an evaluation of the forces that influence the issuer and the market(s) in which the security is purchased and sold.
B Investment Transactions and Related Income — Investment transactions for financial statement purposes are accounted for on a trade date basis. Realized gains and losses on investments sold are determined on the basis of identified cost. Interest income is recorded on the basis of interest accrued, adjusted for amortization of premium or accretion of discount.
C Federal Taxes — Each Fund’s policy is to comply with the provisions of the Internal Revenue Code applicable to regulated investment companies and to distribute to shareholders each year substantially all of its taxable, if any, and tax-exempt net investment income, and all or substantially all of its net realized capital gains. Accordingly, no provision for federal income or excise tax is necessary. Each Fund intends to satisfy conditions which will enable it to designate distributions from the interest income generated by its investments in non-taxable municipal securities, which are exempt from regular federal income tax when received by each Fund, as exempt-interest dividends. For National Fund, the portion of such interest, if any, earned on private activity bonds issued after August 7, 1986, may be considered a tax preference item to shareholders.
As of March 31, 2019, the Funds had no uncertain tax positions that would require financial statement recognition, de-recognition, or disclosure. Each Fund files a U.S. federal income tax return annually after its fiscal year-end, which is subject to examination by the Internal Revenue Service for a period of three years from the date of filing.
D Expenses — The majority of expenses of the Trusts are directly identifiable to an individual fund. Expenses which are not readily identifiable to a specific fund are allocated taking into consideration, among other things, the nature and type of expense and the relative size of the funds.
E Legal Fees — Legal fees and other related expenses incurred as part of negotiations of the terms and requirement of capital infusions, or that are expected to result in the restructuring of, or a plan of reorganization for, an investment are recorded as realized losses. Ongoing expenditures to protect or enhance an investment are treated as operating expenses.
Eaton Vance
Municipal Income Funds
March 31, 2019
Notes to Financial Statements (Unaudited) — continued
F Use of Estimates — The preparation of the financial statements in conformity with U.S. GAAP requires management to make estimates and assumptions that affect the reported amounts of assets and liabilities at the date of the financial statements and the reported amounts of income and expense during the reporting period. Actual results could differ from those estimates.
G Indemnifications — Under each Trust’s organizational documents, its officers and Trustees may be indemnified against certain liabilities and expenses arising out of the performance of their duties to the Funds. Under Massachusetts law, if certain conditions prevail, shareholders of a Massachusetts business trust (such as a Trust) could be deemed to have personal liability for the obligations of the Trust. However, each Trust’s Declaration of Trust contains an express disclaimer of liability on the part of Fund shareholders and the By-laws provide that the Trust shall assume the defense on behalf of any Fund shareholders. Moreover, the By-laws also provide for indemnification out of Fund property of any shareholder held personally liable solely by reason of being or having been a shareholder for all loss or expense arising from such liability. Additionally, in the normal course of business, each Fund enters into agreements with service providers that may contain indemnification clauses. Each Fund’s maximum exposure under these arrangements is unknown as this would involve future claims that may be made against each Fund that have not yet occurred.
H Floating Rate Notes Issued in Conjunction with Securities Held — The Funds may invest in residual interest bonds, also referred to as inverse floating rate securities, whereby a Fund may sell a variable or fixed rate bond for cash to a Special-Purpose Vehicle (the SPV), (which is generally organized as a trust), while at the same time, buying a residual interest in the assets and cash flows of the SPV. The bond is deposited into the SPV with the same CUSIP number as the bond sold to the SPV by the Fund, and which may have been, but is not required to be, the bond purchased from the Fund (the Bond). The SPV also issues floating rate notes (Floating Rate Notes) which are sold to third-parties. The residual interest bond held by a Fund gives the Fund the right (1) to cause the holders of the Floating Rate Notes to generally tender their notes at par, and (2) to have the Bond held by the SPV transferred to the Fund, thereby terminating the SPV. Should the Fund exercise such right, it would generally pay the SPV the par amount due on the Floating Rate Notes and exchange the residual interest bond for the underlying Bond. Pursuant to generally accepted accounting principles for transfers and servicing of financial assets and extinguishment of liabilities, the Funds account for the transaction described above as a secured borrowing by including the Bond in their Portfolio of Investments and the Floating Rate Notes as a liability under the caption “Payable for floating rate notes issued” in their Statement of Assets and Liabilities. The Floating Rate Notes have interest rates that generally reset weekly and their holders have the option to tender their notes to the SPV for redemption at par at each reset date. Accordingly, the fair value of the payable for floating rate notes issued approximates its carrying value. If measured at fair value, the payable for floating rate notes would have been considered as Level 2 in the fair value hierarchy (see Note 10) at March 31, 2019. Interest expense related to a Fund’s liability with respect to Floating Rate Notes is recorded as incurred. The SPV may be terminated by the Fund, as noted above, or by the occurrence of certain termination events as defined in the trust agreement, such as a downgrade in the credit quality of the underlying Bond, bankruptcy of or payment failure by the issuer of the underlying Bond, the inability to remarket Floating Rate Notes that have been tendered due to insufficient buyers in the market, or the failure by the SPV to obtain renewal of the liquidity agreement under which liquidity support is provided for the Floating Rate Notes up to one year. At March 31, 2019, the amounts of the Funds’ Floating Rate Notes and related interest rates and collateral were as follows:
| | | | | | | | |
| | | AMT-Free Fund | | | National Fund | |
| | |
Floating Rate Notes Outstanding | | $ | 29,981,339 | | | $ | 151,366,716 | |
| | |
Interest Rate or Range of Interest Rates (%) | | | 1.50 - 1.55 | | | | 1.48 - 1.53 | |
| | |
Collateral for Floating Rate Notes Outstanding | | $ | 46,729,255 | | | $ | 212,631,360 | |
For the six months ended March 31, 2019, the Funds’ average settled Floating Rate Notes outstanding and the average interest rate (annualized) including fees were as follows:
| | | | | | | | |
| | | AMT-Free Fund | | | National Fund | |
| | |
Average Floating Rate Notes Outstanding | | $ | 31,804,396 | | | $ | 158,303,434 | |
| | |
Average Interest Rate | | | 2.25 | % | | | 2.23 | % |
In certain circumstances, the Funds may enter into shortfall and forbearance agreements with brokers by which a Fund agrees to reimburse the broker for the difference between the liquidation value of the Bond held by the SPV and the liquidation value of the Floating Rate Notes, as well as any shortfalls in interest cash flows. The Funds had no shortfalls as of March 31, 2019.
The Funds may also purchase residual interest bonds in a secondary market transaction without first owning the underlying bond. Such transactions are not required to be treated as secured borrowings. Shortfall agreements, if any, related to residual interest bonds purchased in a secondary market transaction are disclosed in the Portfolio of Investments.
Eaton Vance
Municipal Income Funds
March 31, 2019
Notes to Financial Statements (Unaudited) — continued
The Funds’ investment policies and restrictions expressly permit investments in residual interest bonds. Such bonds typically offer the potential for yields exceeding the yields available on fixed rate bonds with comparable credit quality and maturity. These securities tend to underperform the market for fixed rate bonds in a rising long-term interest rate environment, but tend to outperform the market for fixed rate bonds when long-term interest rates decline. The value and income of residual interest bonds are generally more volatile than that of a fixed rate bond. The Funds’ investment policies do not allow the Funds to borrow money except as permitted by the 1940 Act. Management believes that the Funds’ restrictions on borrowing money and issuing senior securities (other than as specifically permitted) do not apply to Floating Rate Notes issued by the SPV and included as a liability in the Funds’ Statement of Assets and Liabilities. As secured indebtedness issued by an SPV, Floating Rate Notes are distinct from the borrowings and senior securities to which the Funds’ restrictions apply. Residual interest bonds held by the Funds are securities exempt from registration under Rule 144A of the Securities Act of 1933.
I Financial Futures Contracts — Upon entering into a financial futures contract, a Fund is required to deposit with the broker, either in cash or securities, an amount equal to a certain percentage of the contract amount (initial margin). Subsequent payments, known as variation margin, are made or received by the Fund each business day, depending on the daily fluctuations in the value of the underlying security, and are recorded as unrealized gains or losses by the Fund. Gains (losses) are realized upon the expiration or closing of the financial futures contracts. Should market conditions change unexpectedly, the Fund may not achieve the anticipated benefits of the financial futures contracts and may realize a loss. Futures contracts have minimal counterparty risk as they are exchange traded and the clearinghouse for the exchange is substituted as the counterparty, guaranteeing counterparty performance.
J When-Issued Securities and Delayed Delivery Transactions — The Funds may purchase or sell securities on a delayed delivery or when-issued basis. Payment and delivery may take place after the customary settlement period for that security. At the time the transaction is negotiated, the price of the security that will be delivered is fixed. The Funds maintain cash and/or security positions for these commitments such that sufficient liquid assets will be available to make payments upon settlement. Securities purchased on a delayed delivery or when-issued basis are marked-to-market daily and begin earning interest on settlement date. Losses may arise due to changes in the market value of the underlying securities or if the counterparty does not perform under the contract.
K Interim Financial Statements — The interim financial statements relating to March 31, 2019 and for the six months then ended have not been audited by an independent registered public accounting firm, but in the opinion of the Funds’ management, reflect all adjustments, consisting only of normal recurring adjustments, necessary for the fair presentation of the financial statements.
2 Distributions to Shareholders and Income Tax Information
The net investment income of each Fund is determined daily and substantially all of the net investment income so determined is declared as a dividend to shareholders of record at the time of declaration. Distributions are declared separately for each class of shares. Distributions are paid monthly. Distributions of realized capital gains (reduced by available capital loss carryforwards from prior years) are made at least annually. Shareholders may reinvest income and capital gain distributions in additional shares of the same class of a Fund at the net asset value as of the reinvestment date or, at the election of the shareholder, receive distributions in cash. Distributions to shareholders are determined in accordance with income tax regulations, which may differ from U.S. GAAP. As required by U.S. GAAP, only distributions in excess of tax basis earnings and profits are reported in the financial statements as a return of capital. Permanent differences between book and tax accounting relating to distributions are reclassified to paid-in capital. For tax purposes, distributions from short-term capital gains are considered to be from ordinary income.
At September 30, 2018, the following Funds, for federal income tax purposes, had capital loss carryforwards and deferred capital losses which would reduce the respective Fund’s taxable income arising from future net realized gains on investment transactions, if any, to the extent permitted by the Internal Revenue Code, and thus would reduce the amount of distributions to shareholders, which would otherwise be necessary to relieve the Funds of any liability for federal income or excise tax. Under tax regulations, capital losses incurred in taxable years beginning after December 2010 are considered deferred capital losses and are treated as arising on the first day of a Fund’s next taxable year, retaining the same short-term or long-term character as when originally deferred. Deferred capital losses are required to be used prior to capital loss carryforwards, which carry an expiration date. As a result of this ordering rule, capital loss carryforwards may be more likely to expire unused. The amounts and expiration dates of the capital loss carryforwards, whose character is short-term, and the amounts of the deferred capital losses are as follows:
| | | | | | | | |
| Expiration Date | | AMT-Free Fund | | | National Fund | |
| | |
September 30, 2019 | | $ | — | | | $ | 56,374,590 | |
| | |
Total capital loss carryforwards | | $ | — | | | $ | 56,374,590 | |
| | |
Deferred capital losses: | | | | | | | | |
| | |
Short-term | | $ | 13,995,870 | | | $ | 150,318,092 | |
| | |
Long-term | | $ | 13,569,189 | | | $ | 96,621,809 | |
Eaton Vance
Municipal Income Funds
March 31, 2019
Notes to Financial Statements (Unaudited) — continued
The cost and unrealized appreciation (depreciation) of investments, including open derivative contracts, of each Fund at March 31, 2019, as determined on a federal income tax basis, were as follows:
| | | | | | | | |
| | | AMT-Free Fund | | | National Fund | |
| | |
Aggregate cost | | $ | 272,067,061 | | | $ | 2,536,049,244 | |
| | |
Gross unrealized appreciation | | $ | 24,182,451 | | | $ | 193,939,935 | |
| | |
Gross unrealized depreciation | | | (1,286,289 | ) | | | (12,496,985 | ) |
| | |
Net unrealized appreciation | | $ | 22,896,162 | | | $ | 181,442,950 | |
3 Investment Adviser Fee and Other Transactions with Affiliates
The investment adviser fee is earned by Eaton Vance Management (EVM) for AMT-Free Fund and Boston Management and Research (BMR), a subsidiary of EVM, for National Fund as compensation for management and investment advisory services rendered to each Fund. The fee is based upon a percentage of average daily net assets plus a percentage of gross income (i.e., income other than gains from the sale of securities) as presented in the following table and is payable monthly.
| | | | | | | | |
| Daily Net Assets | | Annual Asset Rate | | | Daily Income Rate | |
| | |
Up to $500 million | | | 0.300 | % | | | 3.00 | % |
| | |
$500 million up to $1 billion | | | 0.275 | | | | 2.75 | |
| | |
$1 billion up to $1.5 billion | | | 0.250 | | | | 2.50 | |
| | |
$1.5 billion up to $2 billion | | | 0.225 | | | | 2.25 | |
| | |
$2 billion up to $3 billion | | | 0.200 | | | | 2.00 | |
| | |
$3 billion and over | | | 0.175 | | | | 1.75 | |
For the six months ended March 31, 2019, investment adviser fees incurred by the Funds and the effective annual rates, as a percentage of average daily net assets, were as follows:
| | | | | | | | |
| | | AMT-Free Fund | | | National Fund | |
| | |
Investment Adviser Fee | | $ | 645,082 | | | $ | 4,511,789 | |
| | |
Effective Annual Rate | | | 0.44 | % | | | 0.36 | % |
EVM serves as the administrator of each Fund, but receives no compensation. EVM provides sub-transfer agency and related services to the Funds pursuant to a Sub-Transfer Agency Support Services Agreement. Eaton Vance Distributors, Inc. (EVD), an affiliate of EVM and the Funds’ principal underwriter, received a portion of the sales charge on sales of Class A shares of the Funds. EVD also received distribution and service fees from Class A, Class B and Class C shares (see Note 4) and contingent deferred sales charges (see Note 5). Sub-transfer agent fees earned by EVM, which are included in transfer and dividend disbursing agent fees on the Statements of Operations, and Class A sales charges that the Funds were informed were received by EVD for the six months ended March 31, 2019 were as follows:
| | | | | | | | |
| | | AMT-Free
Fund | | | National
Fund | |
| | |
EVM’s Sub-Transfer Agent Fees | | $ | 6,033 | | | $ | 64,902 | |
| | |
EVD’s Class A Sales Charges | | $ | 5,828 | | | $ | 54,209 | |
Eaton Vance
Municipal Income Funds
March 31, 2019
Notes to Financial Statements (Unaudited) — continued
Trustees and officers of the Funds who are members of EVM’s or BMR’s organizations receive remuneration for their services to the Funds out of the investment adviser fee. Trustees of the Funds who are not affiliated with the investment advisers may elect to defer receipt of all or a percentage of their annual fees in accordance with the terms of the Trustees Deferred Compensation Plan. For the six months ended March 31, 2019, no significant amounts have been deferred. Certain officers and Trustees of the Funds are officers of the above organizations.
4 Distribution Plans
Each Fund has in effect a distribution plan for Class A shares (Class A Plan) pursuant to Rule 12b-1 under the 1940 Act. Pursuant to the Class A Plan, each Fund pays EVD a distribution and service fee of 0.25% per annum of its average daily net assets attributable to Class A shares for distribution services and facilities provided to each Fund by EVD, as well as for personal services and/or the maintenance of shareholder accounts. Distribution and service fees paid or accrued to EVD for the six months ended March 31, 2019 for Class A shares amounted to the following:
| | | | | | | | |
| | | AMT-Free
Fund | | | National
Fund | |
| | |
Class A Distribution and Service Fees | | $ | 175,957 | | | $ | 1,787,957 | |
Each Fund also has in effect distribution plans for Class B shares (Class B Plan) and/or Class C shares (Class C Plan) pursuant to Rule 12b-1 under the 1940 Act. Pursuant to the Class B and Class C Plans, each Fund pays EVD amounts equal to 0.75% per annum of its average daily net assets attributable to Class B and Class C shares for providing ongoing distribution services and facilities to the respective Funds. For the six months ended March 31, 2019, the Funds paid or accrued to EVD the following distribution fees:
| | | | | | | | |
| | | AMT-Free
Fund | | | National Fund | |
| | |
Class B Distribution Fees | | $ | — | | | $ | 4,780 | |
| | |
Class C Distribution Fees | | $ | 103,524 | | | $ | 1,112,600 | |
Pursuant to the Class B and Class C Plans, each Fund also makes payments of service fees to EVD, financial intermediaries and other persons in amounts equal to 0.25% per annum of the average daily net assets attributable to that class. Service fees paid or accrued are for personal services and/or the maintenance of shareholder accounts. They are separate and distinct from the Class B and Class C sales commissions and distribution fees payable to EVD. Service fees paid or accrued for the six months ended March 31, 2019 amounted to the following:
| | | | | | | | |
| | | AMT-Free
Fund | | | National
Fund | |
| | |
Class B Service Fees | | $ | — | | | $ | 1,593 | |
| | |
Class C Service Fees | | $ | 34,508 | | | $ | 370,867 | |
Distribution and service fees are subject to the limitations contained in the Financial Industry Regulatory Authority Rule 2341(d) and for Class B, are further limited to a 5% maximum sales charge as determined in accordance with such rule.
5 Contingent Deferred Sales Charges
A contingent deferred sales charge (CDSC) generally is imposed on redemptions of Class B shares made within six years of purchase and on redemptions of Class C shares made within one year of purchase. Class A shares may be subject to a 1% CDSC if redeemed within eighteen months of purchase (depending on the circumstances of purchase). Generally, the CDSC is based upon the lower of the net asset value at date of redemption or date of purchase. No charge is levied on shares acquired by reinvestment of dividends or capital gain distributions. The CDSC for Class B shares is imposed at
Eaton Vance
Municipal Income Funds
March 31, 2019
Notes to Financial Statements (Unaudited) — continued
declining rates that begin at 5% in the case of redemptions in the first and second year after purchase, declining one percentage point each subsequent year. Class C shares are subject to a 1% CDSC if redeemed within one year of purchase. For the six months ended March 31, 2019, the Funds were informed that EVD received approximately the following amounts of CDSCs paid by Class A, Class B and Class C shareholders:
| | | | | | | | |
| | | AMT-Free
Fund | | | National
Fund | |
| | |
Class A | | $ | 2,000 | | | $ | 15,000 | |
| | |
Class B | | $ | — | | | $ | — | |
| | |
Class C | | $ | — | | | $ | 400 | |
6 Purchases and Sales of Investments
Purchases and sales of investments, other than short-term obligations, for the six months ended March 31, 2019 were as follows:
| | | | | | | | |
| | | AMT-Free
Fund | | | National Fund | |
| | |
Purchases | | $ | 35,256,824 | | | $ | 1,139,693,147 | |
| | |
Sales | | $ | 49,947,429 | | | $ | 1,036,286,722 | |
7 Shares of Beneficial Interest
Each Fund’s Declaration of Trust permits the Trustees to issue an unlimited number of full and fractional shares of beneficial interest (without par value). Such shares may be issued in a number of different series (such as the Funds) and classes. Transactions in Fund shares were as follows:
| | | | | | | | | | | | |
AMT-Free Fund | | | | | | | | | |
| | | Six Months Ended March 31, 2019 (Unaudited) | |
| | | Class A | | | Class C | | | Class I | |
| | | |
Sales | | | 991,818 | | | | 272,281 | | | | 1,853,659 | |
| | | |
Issued to shareholders electing to receive payments of distributions in Fund shares | | | 260,240 | | | | 38,168 | | | | 184,904 | |
| | | |
Redemptions | | | (1,629,613 | ) | | | (540,160 | ) | | | (2,335,790 | ) |
| | | |
Converted from Class C shares | | | 1,056,540 | | | | — | | | | — | |
| | | |
Converted to Class A shares | | | — | | | | (1,061,646 | ) | | | — | |
| | | |
Net increase (decrease) | | | 678,985 | | | | (1,291,357 | ) | | | (297,227 | ) |
| |
| | | Year Ended September 30, 2018 | |
| | | Class A | | | Class C | | | Class I | |
| | | |
Sales | | | 1,410,160 | | | | 219,922 | | | | 2,442,370 | |
| | | |
Issued to shareholders electing to receive payments of distributions in Fund shares | | | 548,382 | | | | 100,461 | | | | 410,172 | |
| | | |
Redemptions | | | (3,256,501 | ) | | | (936,704 | ) | | | (4,654,134 | ) |
| | | |
Net decrease | | | (1,297,959 | ) | | | (616,321 | ) | | | (1,801,592 | ) |
Eaton Vance
Municipal Income Funds
March 31, 2019
Notes to Financial Statements (Unaudited) — continued
| | | | | | | | | | | | | | | | |
National Fund | | | | | | | | | | | | |
| | | Six Months Ended March 31, 2019 (Unaudited) | |
| | | Class A | | | Class B | | | Class C | | | Class I | |
| | | | |
Sales | | | 4,935,926 | | | | 1,604 | | | | 1,217,010 | | | | 32,160,811 | |
| | | | |
Issued to shareholders electing to receive payments of distributions in Fund shares | | | 2,154,064 | | | | 1,548 | | | | 349,596 | | | | 1,282,041 | |
| | | | |
Redemptions | | | (13,269,830 | ) | | | (15,244 | ) | | | (3,911,698 | ) | | | (17,022,946 | ) |
| | | | |
Converted from Class B shares | | | 102,496 | | | | — | | | | — | | | | — | |
| | | | |
Converted from Class C shares | | | 15,476,059 | | | | — | | | | — | | | | — | |
| | | | |
Converted to Class A shares | | | — | | | | (102,486 | ) | | | (15,474,583 | ) | | | — | |
| | | | |
Net increase (decrease) | | | 9,398,715 | | | | (114,578 | ) | | | (17,819,675 | ) | | | 16,419,906 | |
| |
| | | Year Ended September 30, 2018 | |
| | | Class A | | | Class B | | | Class C | | | Class I | |
| | | | |
Sales | | | 8,446,990 | | | | 998 | | | | 1,578,271 | | | | 22,766,344 | |
| | | | |
Issued to shareholders electing to receive payments of distributions in Fund shares | | | 4,651,612 | | | | 10,278 | | | | 1,031,149 | | | | 2,503,247 | |
| | | | |
Redemptions | | | (27,655,284 | ) | | | (117,456 | ) | | | (11,575,817 | ) | | | (25,198,655 | ) |
| | | | |
Converted from Class B shares | | | 367,236 | | | | — | | | | — | | | | — | |
| | | | |
Converted to Class A shares | | | — | | | | (367,220 | ) | | | — | | | | — | |
| | | | |
Net increase (decrease) | | | (14,189,446 | ) | | | (473,400 | ) | | | (8,966,397 | ) | | | 70,936 | |
8 Line of Credit
The Funds participate with other portfolios and funds managed by EVM and its affiliates in a $625 million unsecured line of credit agreement with a group of banks, which is in effect through October 29, 2019. Borrowings are made by the Funds solely to facilitate the handling of unusual and/or unanticipated short-term cash requirements. Interest is charged to each Fund based on its borrowings at an amount above either the Eurodollar rate or Federal Funds rate. In addition, a fee computed at an annual rate of 0.15% on the daily unused portion of the line of credit is allocated among the participating portfolios and funds at the end of each quarter. Because the line of credit is not available exclusively to the Funds, a Fund may be unable to borrow some or all of its requested amounts at any particular time. At March 31, 2019, the AMT-Free Fund had a balance outstanding pursuant to this line of credit of $700,000 at an interest rate of 3.41%. Based on the short-term nature of the borrowings under the line of credit and variable interest rate, the carrying value of the borrowings approximated its fair value at March 31, 2019. If measured at fair value, borrowings under the line of credit would have been considered as Level 2 in the fair value hierarchy (see Note 10) at March 31, 2019. The Funds’ average borrowings or allocated fees during the six months ended March 31, 2019 were not significant.
9 Financial Instruments
The Funds may trade in financial instruments with off-balance sheet risk in the normal course of their investing activities. These financial instruments may include financial futures contracts and may involve, to a varying degree, elements of risk in excess of the amounts recognized for financial statement purposes. The notional or contractual amounts of these instruments represent the investment a Fund has in particular classes of financial instruments and do not necessarily represent the amounts potentially subject to risk. The measurement of the risks associated with these instruments is meaningful only when all related and offsetting transactions are considered. A summary of obligations under these financial instruments at March 31, 2019 is included in the Portfolio of Investments. At March 31, 2019, the Funds had sufficient cash and/or securities to cover commitments under these contracts.
Each Fund is subject to interest rate risk in the normal course of pursuing its investment objective. Because the Funds hold fixed-rate bonds, the value of these bonds may decrease if interest rates rise. The Funds enter into U.S. Treasury futures contracts to hedge against changes in interest rates.
Eaton Vance
Municipal Income Funds
March 31, 2019
Notes to Financial Statements (Unaudited) — continued
The fair values of open derivative instruments (not considered to be hedging instruments for accounting disclosure purposes) and whose primary underlying risk exposure is interest rate risk at March 31, 2019 were as follows:
| | | | |
| | | AMT-Free
Fund | |
| |
Liability Derivative: | | | | |
| |
Futures Contracts | | $ | (250,998 | )(1) |
| |
Total | | $ | (250,998 | ) |
| (1) | Amount represents cumulative unrealized depreciation on futures contracts. Only the current day’s variation margin on open futures contracts is reported within the Statement of Assets and Liabilities as Receivable or Payable for variation margin on open financial futures contracts, as applicable. |
The effect of derivative instruments (not considered to be hedging instruments for accounting disclosure purposes) on the Statement of Operations and whose primary underlying risk exposure is interest rate risk for the six months ended March 31, 2019 was as follows:
| | | | | | | | |
| | | AMT-Free
Fund | | | National
Fund | |
| | |
Realized Gain (Loss) on Derivatives Recognized in Income | | $ | (674,829 | )(1) | | $ | (7,481,052 | )(1) |
| | |
Change in Unrealized Appreciation (Depreciation) on Derivatives Recognized in Income | | $ | (855,957 | )(2) | | $ | (5,031,282 | )(2) |
| (1) | Statement of Operations location: Net realized gain (loss) – Financial futures contracts. |
| (2) | Statement of Operations location: Change in unrealized appreciation (depreciation) – Financial futures contracts. |
The average notional cost of futures contracts outstanding during the six months ended March 31, 2019, which is indicative of the volume of this derivative type, was approximately as follows:
| | | | | | | | |
| | | AMT-Free
Fund | | | National Fund | |
| | |
Average Notional Cost: | | | | | | | | |
| | |
Futures Contracts — Short | | $ | 27,232,000 | | | $ | 121,285,000 | |
10 Fair Value Measurements
Under generally accepted accounting principles for fair value measurements, a three-tier hierarchy to prioritize the assumptions, referred to as inputs, is used in valuation techniques to measure fair value. The three-tier hierarchy of inputs is summarized in the three broad levels listed below.
| • | | Level 1 – quoted prices in active markets for identical investments |
| • | | Level 2 – other significant observable inputs (including quoted prices for similar investments, interest rates, prepayment speeds, credit risk, etc.) |
| • | | Level 3 – significant unobservable inputs (including a fund’s own assumptions in determining the fair value of investments) |
In cases where the inputs used to measure fair value fall in different levels of the fair value hierarchy, the level disclosed is determined based on the lowest level input that is significant to the fair value measurement in its entirety. The inputs or methodology used for valuing securities are not necessarily an indication of the risk associated with investing in those securities.
Eaton Vance
Municipal Income Funds
March 31, 2019
Notes to Financial Statements (Unaudited) — continued
At March 31, 2019, the hierarchy of inputs used in valuing the Funds’ investments and open derivative instruments, which are carried at value, were as follows:
| | | | | | | | | | | | | | | | |
AMT-Free Fund | |
| Asset Description | | Level 1 | | | Level 2 | | | Level 3 | | | Total | |
| | | | |
Tax-Exempt Municipal Securities | | $ | — | | | $ | 322,495,584 | | | $ | — | | | $ | 322,495,584 | |
| | | | |
Trust Units | | | — | | | | 2,699,976 | | | | — | | | | 2,699,976 | |
| | | | |
Total Investments | | $ | — | | | $ | 325,195,560 | | | $ | — | | | $ | 325,195,560 | |
| | | | |
Liability Description | | | | | | | | | | | | | | | | |
| | | | |
Futures Contracts | | $ | (250,998 | ) | | $ | — | | | $ | — | | | $ | (250,998 | ) |
| | | | |
Total | | $ | (250,998 | ) | | $ | — | | | $ | — | | | $ | (250,998 | ) |
|
National Fund | |
| Asset Description | | Level 1 | | | Level 2 | | | Level 3 | | | Total | |
| | | | |
Tax-Exempt Municipal Securities | | $ | — | | | $ | 2,752,032,417 | | | $ | — | | | $ | 2,752,032,417 | |
| | | | |
Taxable Municipal Securities | | | — | | | | 81,219,941 | | | | — | | | | 81,219,941 | |
| | | | |
Trust Units | | | — | | | | 35,606,552 | | | | — | | | | 35,606,552 | |
| | | | |
Total Investments | | $ | — | | | $ | 2,868,858,910 | | | $ | — | | | $ | 2,868,858,910 | |
Eaton Vance
Municipal Income Funds
March 31, 2019
Officers and Trustees
Officers of Eaton Vance Municipals Trust and Eaton Vance Mutual Funds Trust
Payson F. Swaffield
President
Maureen A. Gemma
Vice President, Secretary and Chief Legal Officer
James F. Kirchner
Treasurer
Richard F. Froio
Chief Compliance Officer
Trustees of Eaton Vance Municipals Trust and Eaton Vance Mutual Funds Trust
William H. Park
Chairperson
Thomas E. Faust Jr.*
Mark R. Fetting
Cynthia E. Frost
George J. Gorman
Valerie A. Mosley
Helen Frame Peters
Keith Quinton(1)
Marcus L. Smith(1)
Susan J. Sutherland
Scott E. Wennerholm
| (1) | Messrs. Quinton and Smith began serving as Trustees effective October 1, 2018. |
Eaton Vance Funds
IMPORTANT NOTICES
Privacy. The Eaton Vance organization is committed to ensuring your financial privacy. Each of the financial institutions identified below has in effect the following policy (“Privacy Policy”) with respect to nonpublic personal information about its customers:
| • | | Only such information received from you, through application forms or otherwise, and information about your Eaton Vance fund transactions will be collected. This may include information such as name, address, social security number, tax status, account balances and transactions. |
| • | | None of such information about you (or former customers) will be disclosed to anyone, except as permitted by law (which includes disclosure to employees necessary to service your account). In the normal course of servicing a customer’s account, Eaton Vance may share information with unaffiliated third parties that perform various required services such as transfer agents, custodians and broker-dealers. |
| • | | Policies and procedures (including physical, electronic and procedural safeguards) are in place that are designed to protect the confidentiality of such information. |
| • | | We reserve the right to change our Privacy Policy at any time upon proper notification to you. Customers may want to review our Privacy Policy periodically for changes by accessing the link on our homepage: www.eatonvance.com. |
Our pledge of privacy applies to the following entities within the Eaton Vance organization: the Eaton Vance Family of Funds, Eaton Vance Management, Eaton Vance Investment Counsel, Eaton Vance Distributors, Inc., Eaton Vance Trust Company, Eaton Vance Management (International) Limited, Eaton Vance Advisers International Ltd., Eaton Vance Management’s Real Estate Investment Group and Boston Management and Research. In addition, our Privacy Policy applies only to those Eaton Vance customers who are individuals and who have a direct relationship with us. If a customer’s account (i.e., fund shares) is held in the name of a third-party financial advisor/broker-dealer, it is likely that only such advisor’s privacy policies apply to the customer. This notice supersedes all previously issued privacy disclosures. For more information about Eaton Vance’s Privacy Policy, please call 1-800-262-1122.
Delivery of Shareholder Documents. The Securities and Exchange Commission (SEC) permits funds to deliver only one copy of shareholder documents, including prospectuses, proxy statements and shareholder reports, to fund investors with multiple accounts at the same residential or post office box address. This practice is often called “householding” and it helps eliminate duplicate mailings to shareholders.Eaton Vance, or your financial advisor, may household the mailing of your documents indefinitely unless you instruct Eaton Vance, or your financial advisor, otherwise.If you would prefer that your Eaton Vance documents not be householded, please contact Eaton Vance at 1-800-262-1122, or contact your financial advisor. Your instructions that householding not apply to delivery of your Eaton Vance documents will typically be effective within 30 days of receipt by Eaton Vance or your financial advisor.
Portfolio Holdings. Each Eaton Vance Fund and its underlying Portfolio(s) (if applicable) files a schedule of portfolio holdings on Part F toForm N-PORT with the SEC for the first and third quarters of each fiscal year. The Form N-PORT will be available on the Eaton Vance website at www.eatonvance.com, by calling Eaton Vance at 1-800-262-1122 or in the EDGAR database on the SEC’s website at www.sec.gov.
Proxy Voting. From time to time, funds are required to vote proxies related to the securities held by the funds. The Eaton Vance Funds or their underlying Portfolios (if applicable) vote proxies according to a set of policies and procedures approved by the Funds’ and Portfolios’ Boards. You may obtain a description of these policies and procedures and information on how the Funds or Portfolios voted proxies relating to portfolio securities during the most recent 12-month period ended June 30, without charge, upon request, by calling 1-800-262-1122 and by accessing the SEC’s website at www.sec.gov.
This Page Intentionally Left Blank
This Page Intentionally Left Blank
Investment Advisers
AMT-Free Municipal Income Fund
Eaton Vance Management
Two International Place
Boston, MA 02110
National Municipal Income Fund
Boston Management and Research
Two International Place
Boston, MA 02110
Administrator
Eaton Vance Management
Two International Place
Boston, MA 02110
Principal Underwriter*
Eaton Vance Distributors, Inc.
Two International Place
Boston, MA 02110
(617) 482-8260
Custodian
State Street Bank and Trust Company
State Street Financial Center, One Lincoln Street
Boston, MA 02111
Transfer Agent
BNY Mellon Investment Servicing (US) Inc.
Attn: Eaton Vance Funds
P.O. Box 9653
Providence, RI 02940-9653
(800) 262-1122
Fund Offices
Two International Place
Boston, MA 02110
| * | FINRA BrokerCheck. Investors may check the background of their Investment Professional by contacting the Financial Industry Regulatory Authority (FINRA). FINRA BrokerCheck is a free tool to help investors check the professional background of current and former FINRA-registered securities firms and brokers. FINRA BrokerCheck is available by calling 1-800-289-9999 and at www.FINRA.org. The FINRA BrokerCheck brochure describing this program is available to investors at www.FINRA.org. |

7714 3.31.19

Eaton Vance
Core Plus Bond Fund
Semiannual Report
March 31, 2019
Important Note. Beginning on January 1, 2021, as permitted by regulations adopted by the Securities and Exchange Commission, paper copies of the Fund’s annual and semi-annual shareholder reports will no longer be sent by mail unless you specifically request paper copies of the reports. Instead, the reports will be made available on the Fund’s website (eatonvance.com/funddocuments), and you will be notified by mail each time a report is posted and provided with a website address to access the report.
If you already elected to receive shareholder reports electronically, you will not be affected by this change and you need not take any action. If you are a direct investor, you may elect to receive shareholder reports and other communications from the Fund electronically by signing up fore-Delivery at eatonvance.com/edelivery. If you own your shares through a financial intermediary (such as a broker-dealer or bank), you must contact your financial intermediary to sign up.
You may elect to receive all future Fund shareholder reports in paper free of charge. If you are a direct investor, you can inform the Fund that you wish to continue receiving paper copies of your shareholder reports by calling1-800-262-1122. If you own these shares through a financial intermediary, you must contact your financial intermediary or follow instructions included with this disclosure, if applicable, to elect to continue to receive paper copies of your shareholder reports. Your election to receive reports in paper will apply to all Eaton Vance funds held directly or to all funds held through your financial intermediary, as applicable.

Commodity Futures Trading Commission Registration. Effective December 31, 2012, the Commodity Futures Trading Commission (“CFTC”) adopted certain regulatory changes that subject registered investment companies and advisers to regulation by the CFTC if a fund invests more than a prescribed level of its assets in certain CFTC-regulated instruments (including futures, certain options and swap agreements) or markets itself as providing investment exposure to such instruments. The Fund has claimed an exclusion from the definition of the term “commodity pool operator” under the Commodity Exchange Act. Accordingly, neither the Fund nor the adviser with respect to the operation of the Fund is subject to CFTC regulation. Because of its management of other strategies, the Fund’s adviser is registered with the CFTC as a commodity pool operator and a commodity trading advisor.
Fund shares are not insured by the FDIC and are not deposits or other obligations of, or guaranteed by, any depository institution. Shares are subject to investment risks, including possible loss of principal invested.
This report must be preceded or accompanied by a current summary prospectus or prospectus. Before investing, investors should consider carefully the investment objective, risks, and charges and expenses of a mutual fund. This and other important information is contained in the summary prospectus and prospectus, which can be obtained from a financial advisor. Prospective investors should read the prospectus carefully before investing. For further information, please call1-800-262-1122.
Semiannual ReportMarch 31, 2019
Eaton Vance
Core Plus Bond Fund
Table of Contents
| | | | |
Performance | | | 2 | |
| |
Fund Profile | | | 2 | |
| |
Endnotes and Additional Disclosures | | | 3 | |
| |
Fund Expenses | | | 4 | |
| |
Financial Statements | | | 5 | |
| |
Officers and Trustees | | | 22 | |
| |
Important Notices
| | | 23 | |
Eaton Vance
Core Plus Bond Fund
March 31, 2019
Performance1,2
Portfolio ManagersKathleen C. Gaffney, CFA, Henry Peabody, CFA and Matthew T. Buckley, CFA
| | | | | | | | | | | | | | | | | | | | | | | | |
| % Average Annual Total Returns | | Class
Inception Date | | | Performance
Inception Date | | | Six Months | | | One Year | | | Five Years | | | Since
Inception | |
Class A at NAV | | | 11/17/2009 | | | | 11/17/2009 | | | | 3.45 | % | | | 3.52 | % | | | 4.44 | % | | | 6.13 | % |
Class A with 4.75% Maximum Sales Charge | | | — | | | | — | | | | –1.49 | | | | –1.42 | | | | 3.42 | | | | 5.58 | |
Class C at NAV | | | 11/17/2009 | | | | 11/17/2009 | | | | 3.07 | | | | 2.66 | | | | 3.65 | | | | 5.35 | |
Class C with 1% Maximum Sales Charge | | | — | | | | — | | | | 2.07 | | | | 1.67 | | | | 3.65 | | | | 5.35 | |
Class I at NAV | | | 11/17/2009 | | | | 11/17/2009 | | | | 3.58 | | | | 3.77 | | | | 4.68 | | | | 6.38 | |
Bloomberg Barclays U.S. Aggregate Bond Index | | | — | | | | — | | | | 4.63 | % | | | 4.48 | % | | | 2.74 | % | | | 3.29 | % |
| | | | | | |
| | | | | | | | | | | | | | | | | | | | | | | | |
| % Total Annual Operating Expense Ratios3 | | | | | | | | | | | Class A | | | Class C | | | Class I | |
Gross | | | | | | | | | | | | | | | 0.96 | % | | | 1.71 | % | | | 0.71 | % |
Net | | | | | | | | | | | | | | | 0.74 | | | | 1.49 | | | | 0.49 | |
Fund Profile
Credit Quality (% of bond holdings)4
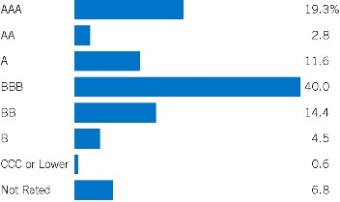
Asset Allocation (% of total investments)
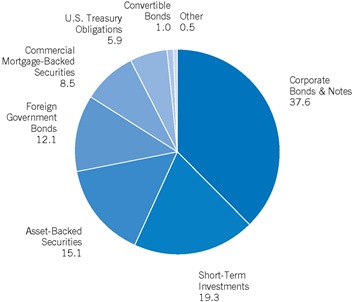
See Endnotes and Additional Disclosures in this report.
Past performance is no guarantee of future results. Returns are historical and are calculated by determining the percentage change in net asset value (NAV) or offering price (as applicable) with all distributions reinvested. Investment return and principal value will fluctuate so that shares, when redeemed, may be worth more or less than their original cost. Performance less than or equal to one year is cumulative. Performance is for the stated time period only; due to market volatility, the Fund’s current performance may be lower or higher than quoted. Returns are before taxes unless otherwise noted. For performance as of the most recentmonth-end, please refer to eatonvance.com.
Eaton Vance
Core Plus Bond Fund
March 31, 2019
Endnotes and Additional Disclosures
| 1 | Bloomberg Barclays U.S. Aggregate Bond Index is an unmanaged index of domestic investment-grade bonds, including corporate, government and mortgage-backed securities. Unless otherwise stated, index returns do not reflect the effect of any applicable sales charges, commissions, expenses, taxes or leverage, as applicable. It is not possible to invest directly in an index. |
| 2 | Total Returns at NAV do not include applicable sales charges. If sales charges were deducted, the returns would be lower. Total Returns shown with maximum sales charge reflect the stated maximum sales charge. Unless otherwise stated, performance does not reflect the deduction of taxes on Fund distributions or redemptions of Fund shares. Performance since inception for an index, if presented, is the performance since the Fund’s or oldest share class’ inception, as applicable. |
| | Effective May 1, 2015, the Fund changed its investment objective and policies. Prior to May 1, 2015, the Fund invested primarily in Build America Bonds. Performance prior to May 1, 2015 reflects the Fund’s performance under its former investment objective and policies. |
| 3 | Source: Fund prospectus. Net expense ratios reflect a contractual expense reimbursement that continues through 1/31/20. Without the reimbursement, performance would have been lower. The expense ratios for the current reporting period can be found in the Financial Highlights section of this report. |
| 4 | Ratings are based on Moody’s Investors Service, Inc. (“Moody’s”), S&P Global Ratings (“S&P”) or Fitch Ratings (“Fitch”), as applicable. If securities are rated differently by the ratings agencies, the highest rating is applied. Ratings, which are subject to change, apply to the creditworthiness of the issuers of the underlying securities and not to the Fund or its shares. Credit ratings measure the quality of a bond based on the issuer’s creditworthiness, with ratings ranging from AAA, being the highest, to D, being the lowest based on S&P’s measures. Ratings of BBB or higher by S&P or Fitch (Baa or higher by Moody’s) are considered to be investment-grade quality. Credit ratings are based largely on the ratings agency’s analysis at the time of rating. The rating assigned to any particular security is not necessarily a reflection of the issuer’s current financial condition and does not necessarily reflect its assessment of the volatility of a security’s market value or of the liquidity of an investment in the security. Holdings designated as “Not Rated” (if any) are not rated by the national ratings agencies stated above. |
| | Fund profile subject to change due to active management. |
Eaton Vance
Core Plus Bond Fund
March 31, 2019
Fund Expenses
Example: As a Fund shareholder, you incur two types of costs: (1) transaction costs, including sales charges (loads) on purchases and redemption fees (if applicable); and (2) ongoing costs, including management fees; distribution and/or service fees; and other Fund expenses. This Example is intended to help you understand your ongoing costs (in dollars) of Fund investing and to compare these costs with the ongoing costs of investing in other mutual funds. The Example is based on an investment of $1,000 invested at the beginning of the period and held for the entire period (October 1, 2018 – March 31, 2019).
Actual Expenses: The first section of the table below provides information about actual account values and actual expenses. You may use the information in this section, together with the amount you invested, to estimate the expenses that you paid over the period. Simply divide your account value by $1,000 (for example, an $8,600 account value divided by $1,000 = 8.6), then multiply the result by the number in the first section under the heading entitled “Expenses Paid During Period” to estimate the expenses you paid on your account during this period.
Hypothetical Example for Comparison Purposes: The second section of the table below provides information about hypothetical account values and hypothetical expenses based on the actual Fund expense ratio and an assumed rate of return of 5% per year (before expenses), which is not the actual Fund return. The hypothetical account values and expenses may not be used to estimate the actual ending account balance or expenses you paid for the period. You may use this information to compare the ongoing costs of investing in your Fund and other funds. To do so, compare this 5% hypothetical example with the 5% hypothetical examples that appear in the shareholder reports of the other funds.
Please note that the expenses shown in the table are meant to highlight your ongoing costs only and do not reflect any transactional costs, such as sales charges (loads) or redemption fees (if applicable). Therefore, the second section of the table is useful in comparing ongoing costs only, and will not help you determine the relative total costs of owning different funds. In addition, if these transactional costs were included, your costs would be higher.
| | | | | | | | | | | | | | | | |
| | | Beginning
Account Value
(10/1/18) | | | Ending
Account Value
(3/31/19) | | | Expenses Paid
During Period*
(10/1/18 – 3/31/19) | | | Annualized
Expense
Ratio | |
| | | | |
Actual | | | | | | | | | | | | | | | | |
Class A | | $ | 1,000.00 | | | $ | 1,034.50 | | | $ | 3.75 | ** | | | 0.74 | % |
Class C | | $ | 1,000.00 | | | $ | 1,030.70 | | | $ | 7.54 | ** | | | 1.49 | % |
Class I | | $ | 1,000.00 | | | $ | 1,035.80 | | | $ | 2.49 | ** | | | 0.49 | % |
| | | | | |
Hypothetical | | | | | | | | | | | | | | | | |
(5% return per year before expenses) | | | | | | | | | | | | | | | | |
Class A | | $ | 1,000.00 | | | $ | 1,021.20 | | | $ | 3.73 | ** | | | 0.74 | % |
Class C | | $ | 1,000.00 | | | $ | 1,017.50 | | | $ | 7.49 | ** | | | 1.49 | % |
Class I | | $ | 1,000.00 | | | $ | 1,022.50 | | | $ | 2.47 | ** | | | 0.49 | % |
| * | Expenses are equal to the Fund’s annualized expense ratio for the indicated Class, multiplied by the average account value over the period, multiplied by 182/365 (to reflect theone-half year period). The Example assumes that the $1,000 was invested at the net asset value per share determined at the close of business on September 30, 2018. |
| ** | Absent an allocation of certain expenses to an affiliate, expenses would be higher. |
Eaton Vance
Core Plus Bond Fund
March 31, 2019
Portfolio of Investments (Unaudited)
| | | | | | | | | | | | |
| Corporate Bonds & Notes — 36.9% | |
| Security | | Principal
Amount*
(000’s omitted) | | | Value | |
|
| Aerospace & Defense — 1.1% | |
| | | |
Azul Investments LLP, 5.875%, 10/26/24(1) | | | | | | | 4,165 | | | $ | 3,946,379 | |
| | | |
| | | | | | | | | | | $ | 3,946,379 | |
|
| Automotive — 0.1% | |
| | | |
Ford Motor Credit Co., LLC, 3.588%, 6/2/20 | | | AUD | | | | 490 | | | $ | 349,475 | |
| | | |
| | | | | | | | | | | $ | 349,475 | |
|
| Banks — 3.3% | |
| | | |
Banco Mercantil del Norte SA/Grand Cayman, 5.75% to 10/4/26, 10/4/31(1)(2) | | | | | | | 2,500 | | | $ | 2,384,375 | |
| | | |
Banco Santander SA, 3.80%, 2/23/28 | | | | | | | 2,400 | | | | 2,331,451 | |
| | | |
BBVA Bancomer SA, 5.125% to 1/18/28, 1/18/33(1)(2) | | | | | | | 2,555 | | | | 2,358,904 | |
| | | |
Royal Bank of Scotland Group PLC, 4.269% to 3/22/24, 3/22/25(2) | | | | | | | 3,400 | | | | 3,437,409 | |
| | | |
UniCredit SpA, 5.861% to 6/19/27, 6/19/32(1)(2) | | | | | | | 1,685 | | | | 1,554,950 | |
| | | |
| | | | | | | | | | | $ | 12,067,089 | |
|
| Building Materials — 0.5% | |
| | | |
Owens Corning, 3.40%, 8/15/26 | | | | | | | 1,750 | | | $ | 1,652,330 | |
| | | |
| | | | | | | | | | | $ | 1,652,330 | |
|
| Chemicals — 1.0% | |
| | | |
Cydsa SAB de CV, 6.25%, 10/4/27(1) | | | | | | | 500 | | | $ | 480,630 | |
| | | |
Yara International ASA, 4.75%, 6/1/28(1) | | | | | | | 3,000 | | | | 3,135,870 | |
| | | |
| | | | | | | | | | | $ | 3,616,500 | |
|
| Commercial Services — 0.4% | |
| | | |
Ashtead Capital, Inc., 4.125%, 8/15/25(1) | | | | | | | 1,300 | | | $ | 1,283,750 | |
| | | |
| | | | | | | | | | | $ | 1,283,750 | |
|
| Communications Services — 0.9% | |
| | | |
CommScope Technologies, LLC, 5.00%, 3/15/27(1) | | | | | | | 850 | | | $ | 755,803 | |
| | | |
WPP Finance 2010, 3.75%, 9/19/24 | | | | | | | 2,580 | | | | 2,547,396 | |
| | | |
| | | | | | | | | | | $ | 3,303,199 | |
|
| Diversified Financial Services — 5.8% | |
| | | |
AerCap Ireland Capital DAC/AerCap Global Aviation Trust, 3.65%, 7/21/27 | | | | | | | 2,700 | | | $ | 2,526,898 | |
| | | |
Banco BTG Pactual SA/Cayman Islands, 5.75%, 9/28/22(1) | | | | | | | 630 | | | | 635,985 | |
| | | |
Brookfield Finance, Inc., 3.90%, 1/25/28 | | | | | | | 2,565 | | | | 2,485,279 | |
| | | | | | | | | | | | |
| Security | | Principal
Amount*
(000’s omitted) | | | Value | |
|
| Diversified Financial Services (continued) | |
| | | |
Credito Real SAB de CV SOFOM ER, 9.50%, 2/7/26(1) | | | | | | | 2,875 | | | $ | 3,037,581 | |
| | | |
E*TRADE Financial Corp., 3.80%, 8/24/27 | | | | | | | 2,325 | | | | 2,261,566 | |
| | | |
Grupo KUO SAB de CV, 5.75%, 7/7/27(1) | | | | | | | 1,640 | | | | 1,586,700 | |
| | | |
Jefferies Group, LLC/Jefferies Group Capital Finance, Inc., 4.15%, 1/23/30 | | | | | | | 1,445 | | | | 1,325,740 | |
| | | |
Neuberger Berman Group, LLC/Neuberger Berman Finance Corp., 4.875%, 4/15/45(1) | | | | | | | 1,685 | | | | 1,532,282 | |
| | | |
Synchrony Financial, 3.95%, 12/1/27 | | | | | | | 3,495 | | | | 3,307,908 | |
| | | |
Synchrony Financial, 5.15%, 3/19/29 | | | | | | | 730 | | | | 742,402 | |
| | | |
Unifin Financiera SAB de CV SOFOM ENR, 7.375%, 2/12/26(1) | | | | | | | 1,770 | | | | 1,670,437 | |
| | | |
| | | | | | | | | | | $ | 21,112,778 | |
|
| Electric Utilities — 1.6% | |
| | | |
Edison International, 2.40%, 9/15/22 | | | | | | | 2,525 | | | $ | 2,340,934 | |
| | | |
Pacific Gas & Electric Co., 4.00%, 12/1/46(3) | | | | | | | 2,088 | | | | 1,680,435 | |
| | | |
Trinidad Generation Unlimited, 5.25%, 11/4/27(1) | | | | | | | 1,713 | | | | 1,717,283 | |
| | | |
| | | | | | | | | | | $ | 5,738,652 | |
|
| Electrical and Electronic Equipment — 0.7% | |
| | | |
Avnet, Inc., 4.625%, 4/15/26 | | | | | | | 445 | | | $ | 455,533 | |
| | | |
Ingram Micro, Inc., 5.45%, 12/15/24 | | | | | | | 1,995 | | | | 1,980,255 | |
| | | |
| | | | | | | | | | | $ | 2,435,788 | |
|
| Home Construction — 1.8% | |
| | | |
MDC Holdings, Inc., 6.00%, 1/15/43 | | | | | | | 4,000 | | | $ | 3,440,000 | |
| | | |
PulteGroup, Inc., 5.00%, 1/15/27 | | | | | | | 3,020 | | | | 3,023,775 | |
| | | |
| | | | | | | | | | | $ | 6,463,775 | |
|
| Industrial Conglomerates — 0.6% | |
| | | |
Fluor Corp., 4.25%, 9/15/28 | | | | | | | 2,040 | | | $ | 2,043,920 | |
| | | |
| | | | | | | | | | | $ | 2,043,920 | |
|
| Insurance — 0.9% | |
| | | |
Brown & Brown, Inc., 4.50%, 3/15/29 | | | | | | | 3,180 | | | $ | 3,223,365 | |
| | | |
| | | | | | | | | | | $ | 3,223,365 | |
|
| Internet Software & Services — 0.2% | |
| | | |
Symantec Corp., 5.00%, 4/15/25(1) | | | | | | | 865 | | | $ | 867,394 | |
| | | |
| | | | | | | | | | | $ | 867,394 | |
| | | | |
| | 5 | | See Notes to Financial Statements. |
Eaton Vance
Core Plus Bond Fund
March 31, 2019
Portfolio of Investments (Unaudited) — continued
| | | | | | | | | | | | |
| Security | | Principal
Amount*
(000’s omitted) | | | Value | |
|
| Machinery — 0.7% | |
| | | |
Wabtec Corp., 4.95%, 9/15/28 | | | | | | | 2,515 | | | $ | 2,553,801 | |
| | | |
| | | | | | | | | | | $ | 2,553,801 | |
|
| Media — 0.5% | |
| | | |
Charter Communications Operating, LLC/Charter Communications Operating Capital, 3.75%, 2/15/28 | | | | | | | 1,915 | | | $ | 1,852,279 | |
| | | |
| | | | | | | | | | | $ | 1,852,279 | |
|
| Mining — 1.2% | |
| | | |
Freeport-McMoRan, Inc., 5.40%, 11/14/34 | | | | | | | 1,915 | | | $ | 1,752,225 | |
| | | |
Yamana Gold, Inc., 4.625%, 12/15/27 | | | | | | | 2,830 | | | | 2,773,811 | |
| | | |
| | | | | | | | | | | $ | 4,526,036 | |
|
| Oil and Gas — 4.3% | |
| | | |
Eni SpA, 4.75%, 9/12/28(1) | | | | | | | 1,000 | | | $ | 1,039,789 | |
| | | |
Gran Tierra Energy International Holdings, Ltd., 6.25%, 2/15/25(1) | | | | | | | 1,130 | | | | 1,083,387 | |
| | | |
Oceaneering International, Inc., 4.65%, 11/15/24 | | | | | | | 1,700 | | | | 1,576,750 | |
| | | |
Oceaneering International, Inc., 6.00%, 2/1/28 | | | | | | | 2,375 | | | | 2,268,125 | |
| | | |
Patterson-UTI Energy, Inc., 3.95%, 2/1/28 | | | | | | | 3,005 | | | | 2,842,630 | |
| | | |
Petrobras Global Finance BV, 5.625%, 5/20/43 | | | | | | | 660 | | | | 592,350 | |
| | | |
Petrobras Global Finance BV, 5.75%, 2/1/29 | | | | | | | 1,150 | | | | 1,141,950 | |
| | | |
Petroleos Mexicanos, 6.75%, 9/21/47 | | | | | | | 1,870 | | | | 1,725,150 | |
| | | |
Rowan Cos., Inc., 4.75%, 1/15/24 | | | | | | | 490 | | | | 399,963 | |
| | | |
Rowan Cos., Inc., 5.40%, 12/1/42 | | | | | | | 1,338 | | | | 829,560 | |
| | | |
YPF S.A., 7.00%, 12/15/47(1) | | | | | | | 2,875 | | | | 2,294,250 | |
| | | |
| | | | | | | | | | | $ | 15,793,904 | |
|
| Pharmaceuticals — 0.3% | |
| | | |
Teva Pharmaceutical Finance Netherlands III B.V., 3.15%, 10/1/26 | | | | | | | 1,165 | | | $ | 953,623 | |
| | | |
| | | | | | | | | | | $ | 953,623 | |
|
| Pipelines — 0.5% | |
| | | |
Kinder Morgan Energy Partners, L.P., 4.70%, 11/1/42 | | | | | | | 1,945 | | | $ | 1,900,642 | |
| | | |
| | | | | | | | | | | $ | 1,900,642 | |
|
| Real Estate Investment Trusts (REITs) — 1.8% | |
| | | |
CBL & Associates, L.P., 4.60%, 10/15/24 | | | | | | | 950 | | | $ | 691,125 | |
| | | |
CBL & Associates, L.P., 5.95%, 12/15/26 | | | | | | | 2,200 | | | | 1,617,000 | |
| | | |
DDR Corp., 3.625%, 2/1/25 | | | | | | | 1,580 | | | | 1,553,137 | |
| | | |
EPR Properties, 4.50%, 6/1/27 | | | | | | | 1,355 | | | | 1,367,720 | |
| | | | | | | | | | | | |
| Security | | Principal
Amount*
(000’s omitted) | | | Value | |
|
| Real Estate Investment Trusts (REITs) (continued) | |
| | | |
VEREIT Operating Partnership, L.P., 3.95%, 8/15/27 | | | | | | | 1,410 | | | $ | 1,391,586 | |
| | | |
| | | | | | | | | | | $ | 6,620,568 | |
|
| Retail – Specialty and Apparel — 4.2% | |
| | | |
Best Buy Co., Inc., 4.45%, 10/1/28 | | | | | | | 2,550 | | | $ | 2,587,446 | |
| | | |
Macy’s Retail Holdings, Inc., 4.30%, 2/15/43 | | | | | | | 6,237 | | | | 4,737,099 | |
| | | |
Nordstrom, Inc., 5.00%, 1/15/44 | | | | | | | 3,685 | | | | 3,342,469 | |
| | | |
Signet UK Finance PLC, 4.70%, 6/15/24 | | | | | | | 2,323 | | | | 1,986,165 | |
| | | |
Tapestry, Inc., 4.125%, 7/15/27 | | | | | | | 2,596 | | | | 2,484,646 | |
| | | |
| | | | | | | | | | | $ | 15,137,825 | |
|
| Semiconductors — 0.4% | |
| | | |
Marvell Technology Group, Ltd., 4.875%, 6/22/28 | | | | | | | 1,355 | | | $ | 1,403,267 | |
| | | |
| | | | | | | | | | | $ | 1,403,267 | |
|
| Technology — 1.5% | |
| | | |
Seagate HDD Cayman, 4.875%, 6/1/27 | | | | | | | 938 | | | $ | 895,802 | |
| | | |
Seagate HDD Cayman, 5.75%, 12/1/34 | | | | | | | 4,305 | | | | 3,954,213 | |
| | | |
Western Digital Corp., 4.75%, 2/15/26 | | | | | | | 593 | | | | 567,056 | |
| | | |
| | | | | | | | | | | $ | 5,417,071 | |
|
| Telecommunications — 0.7% | |
| | | |
Nokia Oyj, 4.375%, 6/12/27 | | | | | | | 2,520 | | | $ | 2,501,100 | |
| | | |
| | | | | | | | | | | $ | 2,501,100 | |
|
| Toys, Games & Hobbies — 0.8% | |
| | | |
Mattel, Inc., 3.15%, 3/15/23 | | | | | | | 3,040 | | | $ | 2,736,000 | |
| | | |
Mattel, Inc., 5.45%, 11/1/41 | | | | | | | 230 | | | | 171,350 | |
| | | |
Mattel, Inc., 6.20%, 10/1/40 | | | | | | | 185 | | | | 148,925 | |
| | | |
| | | | | | | | | | | $ | 3,056,275 | |
|
| Transportation — 1.1% | |
| | | |
A.P. Moller - Maersk A/S, 3.875%, 9/28/25(1) | | | | | | | 1,631 | | | $ | 1,596,502 | |
| | | |
JSL Europe S.A., 7.75%, 7/26/24(1) | | | | | | | 2,405 | | | | 2,381,431 | |
| | | |
| | | | | | | | | | | $ | 3,977,933 | |
| |
Total Corporate Bonds & Notes
(identified cost $132,621,654) | | | $ | 133,798,718 | |
| | | | |
| | 6 | | See Notes to Financial Statements. |
Eaton Vance
Core Plus Bond Fund
March 31, 2019
Portfolio of Investments (Unaudited) — continued
| | | | | | | | | | |
| Commercial Mortgage-Backed Securities — 8.3% | |
| Security | | | | Principal
Amount
(000’s omitted) | | | Value | |
|
| CFCRE Commercial Mortgage Trust | |
| | | |
Series2016-C3, Class D,
3.052%, 1/10/48(1)(4) | | | | $ | 1,500 | | | $ | 1,231,843 | |
| | | |
Series2016-C7, Class D, 4.434%, 12/10/54(1)(4) | | | | | 1,725 | | | | 1,578,234 | |
|
| CGMS Commercial Mortgage Trust | |
| | | |
Series 2017-MDRB, Class C, 4.984%, (1 mo. USD LIBOR + 2.50%), 7/15/30(1)(5) | | | | | 1,000 | | | | 1,001,682 | |
| | | |
Series 2017-MDRC, Class D, 4.734%, (1 mo. USD LIBOR + 2.25%), 7/15/30(1)(5) | | | | | 1,600 | | | | 1,600,398 | |
|
| COMM Mortgage Trust | |
| | | |
Series 2015-CR22, Class D, 4.118%, 3/10/48(1)(4) | | | | | 2,100 | | | | 1,994,339 | |
|
| CSMC Trust | |
| | | |
Series 2016-NXSR, Class D, 4.362%, 12/15/49(1)(4) | | | | | 2,000 | | | | 1,799,316 | |
|
| GS Mortgage Securities Trust | |
| | | |
Series 2018-FBLU, Class A, 3.432%, (1 mo. USD LIBOR + 0.95%),
11/15/35(1)(5) | | | | | 1,900 | | | | 1,898,682 | |
|
| JPMBB Commercial Mortgage Securities Trust | |
| | | |
Series2014-C22, Class C, 4.561%, 9/15/47(4) | | | | | 700 | | | | 699,289 | |
| | | |
Series2014-C22, Class D, 4.561%, 9/15/47(1)(4) | | | | | 1,220 | | | | 1,074,521 | |
| | | |
Series2014-C25, Class D, 3.945%, 11/15/47(1)(4) | | | | | 1,075 | | | | 937,842 | |
| | | |
Series2015-C29, Class D, 3.672%, 5/15/48(4) | | | | | 500 | | | | 415,167 | |
|
| JPMorgan Chase Commercial Mortgage Securities Trust | |
| | | |
Series 2006-LDP9, Class AM, 5.372%, 5/15/47 | | | | | 47 | | | | 47,234 | |
| | | |
Series2011-C5, Class D,
5.383%, 8/15/46(1)(4) | | | | | 1,925 | | | | 1,926,800 | |
| | | |
Series2013-C16, Class D, 5.028%, 12/15/46(1)(4) | | | | | 1,500 | | | | 1,501,560 | |
| | | |
Series 2014-DSTY, Class B, 3.771%, 6/10/27(1) | | | | | 859 | | | | 858,257 | |
|
| Morgan Stanley Bank of America Merrill Lynch Trust | |
| | | |
Series2016-C32, Class D, 3.396%, 12/15/49(1)(4) | | | | | 2,750 | | | | 2,345,678 | |
|
| Morgan Stanley Capital I Trust | |
| | | |
Series 2016-UB12, Class D, 3.312%, 12/15/49(1) | | | | | 1,000 | | | | 820,700 | |
|
| Motel 6 Trust | |
| | | |
Series 2017-MTL6, Class C, 3.884%, (1 mo. USD LIBOR + 1.40%), 8/15/34(1)(5) | | | | | 902 | | | | 902,808 | |
| | | |
Series 2017-MTL6, Class E, 5.734%, (1 mo. USD LIBOR + 3.25%), 8/15/34(1)(5) | | | | | 746 | | | | 750,853 | |
|
| Natixis Commercial Mortgage Securities Trust | |
| | | |
Series2018-FL1, Class C, 4.689%, (1 mo. USD LIBOR + 2.20%),
6/15/35(1)(5) | | | | | 1,500 | | | | 1,477,315 | |
|
| RETL Trust | |
| | | |
Series2019-RVP, Class B, 4.034%, (1 mo. USD LIBOR + 1.55%), 3/15/36(1)(5) | | | | | 2,180 | | | | 2,180,000 | |
|
| UBS-Barclays Commercial Mortgage Trust | |
| | | |
Series2013-C6, Class D, 4.313%, 4/10/46(1)(4) | | | | | 1,500 | | | | 1,411,581 | |
| | | |
| Wells Fargo Commercial Mortgage Trust | | | | | | | | |
| | | |
Series2015-C26, Class D, 3.586%, 2/15/48(1) | | | | | 1,000 | | | | 899,179 | |
| | | |
Series2015-SG1, Class C, 4.469%, 9/15/48(4) | | | | | 23 | | | | 22,606 | |
| | | | | | | | | | |
| Security | | | | Principal
Amount
(000’s omitted) | | | Value | |
| | | |
| WF-RBS Commercial Mortgage Trust | | | | | | | | |
| | | |
Series 2014-C24, Class D, 3.692%, 11/15/47(1) | | | | $ | 940 | | | $ | 731,336 | |
| |
Total Commercial Mortgage-Backed Securities
(identified cost $29,038,963) | | | $ | 30,107,220 | |
|
| Asset-Backed Securities — 14.8% | |
| Security | | Principal
Amount
(000’s omitted) | | | Value | |
| | | |
| ARI Fleet Lease Trust | | �� | | | | | | |
| | | |
Series2018-B, Class A2, 3.22%, 8/16/27(1) | | | | $ | 900 | | | $ | 904,308 | |
| | | |
| Avant Loans Funding Trust | | | | | | | | |
| | | |
Series2019-A, Class A, 3.48%, 7/15/22(1) | | | | | 1,440 | | | | 1,444,542 | |
| | | |
| Avis Budget Rental Car Funding, LLC | | | | | | | | |
| | | |
Series2014-2A, Class A, 2.50%, 2/20/21(1) | | | | | 1,600 | | | | 1,595,617 | |
| | | |
| CIG Auto Receivables Trust | | | | | | | | |
| | | |
Series2019-1A, Class A, 3.30%, 8/15/24(1) | | | | | 2,167 | | | | 2,170,129 | |
| | | |
| Coinstar Funding, LLC | | | | | | | | |
| | | |
Series2017-1A, Class A2, 5.216%, 4/25/47(1) | | | | | 2,122 | | | | 2,165,054 | |
| | | |
| Conn’s Receivables Funding LLC | | | | | | | | |
| | | |
Series2017-B, Class B, 4.52%, 4/15/21(1) | | | | | 1,782 | | | | 1,788,317 | |
| | | |
Series2018-A, Class A, 3.25%, 1/15/23(1) | | | | | 201 | | | | 201,506 | |
| | | |
Series2018-A, Class B, 4.65%, 1/15/23(1) | | | | | 386 | | | | 388,336 | |
| | | |
| Consumer Loan Underlying Bond | | | | | | | | |
| | | |
Series2017-P2, Class A, 2.61%, 1/15/24(1) | | | | | 1,370 | | | | 1,364,464 | |
| | | |
| DB Master Finance, LLC | | | | | | | | |
| | | |
Series2015-1A, Class A2II, 3.98%, 2/20/45(1) | | | | | 2,400 | | | | 2,402,699 | |
| | | |
| First Investors Auto Owner Trust | | | | | | | | |
| | | |
Series2017-1A, Class A1,
1.69%, 4/15/21(1) | | | | | 1 | | | | 982 | |
| | | |
| FOCUS Brands Funding, LLC | | | | | | | | |
| | | |
Series2017-1A, Class A2I, 3.857%, 4/30/47(1) | | | | | 2,417 | | | | 2,461,451 | |
| | | |
| Foundation Finance Trust | | | | | | | | |
| | | |
Series2017-1A, Class A, 3.30%, 7/15/33(1) | | | | | 474 | | | | 474,129 | |
| | | |
| Horizon Aircraft Finance I, Ltd. | | | | | | | | |
| | | |
Series2018-1, Class A,
4.458%, 12/15/38(1) | | | | | 1,402 | | | | 1,431,256 | |
| | | |
| Marlette Funding Trust | | | | | | | | |
| | | |
Series2018-1A, Class A, 2.61%, 3/15/28(1) | | | | | 221 | | | | 220,273 | |
| | | |
| OneMain Financial Issuance Trust | | | | | | | | |
| | | |
Series2015-1A, Class A, 3.19%, 3/18/26(1) | | | | | 126 | | | | 126,296 | |
| | | |
| OSCAR US Funding X, LLC | | | | | | | | |
| | | |
Series2019-1A, Class A2,
3.10%, 4/11/22(1) | | | | | 1,150 | | | | 1,158,262 | |
| | | |
| Planet Fitness Master Issuer, LLC | | | | | | | | |
| | | |
Series2018-1A, Class A2I,
4.262%, 9/5/48(1) | | | | | 1,114 | | | | 1,135,009 | |
| | | |
| Progress Residential Trust | | | | | | | | |
| | | |
Series 2015-SFR3, Class E, 5.66%, 11/12/32(1) | | | | | 2,360 | | | | 2,383,729 | |
| | | |
Series 2016-SFR2, Class E, 6.032%, (1 mo. USD LIBOR + 3.55%), 1/17/34(1)(5) | | | | | 2,235 | | | | 2,244,698 | |
| | | | |
| | 7 | | See Notes to Financial Statements. |
Eaton Vance
Core Plus Bond Fund
March 31, 2019
Portfolio of Investments (Unaudited) — continued
| | | | | | | | | | | | |
| Security | | Principal
Amount
(000’s omitted) | | | Value | |
| | | |
| Prosper Marketplace Issuance Trust | | | | | | | | | |
| | | |
Series2017-1A, Class B, 3.65%, 6/15/23(1) | | | | | | $ | 128 | | | $ | 128,381 | |
| | | |
Series2017-2A, Class B, 3.48%, 9/15/23(1) | | | | | | | 801 | | | | 802,099 | |
| | | |
Series2017-3A, Class A,
2.36%, 11/15/23(1) | | | | | | | 91 | | | | 90,653 | |
| | | |
Series2017-3A, Class B,
3.36%, 11/15/23(1) | | | | | | | 2,125 | | | | 2,123,950 | |
| | | |
Series2018-2A, Class A,
3.35%, 10/15/24(1) | | | | | | | 1,576 | | | | 1,578,430 | |
| | | |
| Purchasing Power Funding, LLC | | | | | | | | | |
| | | |
Series2018-A, Class A, 3.34%, 8/15/22(1) | | | | | | | 1,100 | | | | 1,099,573 | |
| | | |
| Sierra Timeshare Receivables Funding, LLC | | | | | | | | | |
| | | |
Series2015-1A, Class B, 3.05%, 3/22/32(1) | | | | | | | 39 | | | | 38,504 | |
| | | |
| SpringCastle America Funding LLC | | | | | | | | | |
| | | |
Series2016-AA, Class A, 3.05%, 4/25/29(1) | | | | | | | 2,973 | | | | 2,973,110 | |
| | | |
| Springleaf Funding Trust | | | | | | | | | |
| | | |
Series2015-BA, Class A, 3.48%, 5/15/28(1) | | | | | | | 1,700 | | | | 1,711,739 | |
| | | |
| Stack Infrastructure Issuer, LLC | | | | | | | | | |
| | | |
Series2019-1A, Class A2,
4.54%, 2/25/44(1) | | | | | | | 3,412 | | | | 3,495,728 | |
| | | |
| Tesla Auto Lease Trust | | | | | | | | | |
| | | |
Series2018-B, Class A, 3.71%, 8/20/21(1) | | | | | | | 1,222 | | | | 1,235,991 | |
| | | |
| Thunderbolt Aircraft Lease, Ltd. | | | | | | | | | |
| | | |
Series2017-A, Class B, 5.75% to 4/15/24, 5/17/32(1)(6) | | | | | | | 746 | | | | 774,149 | |
| | | |
| Trafigura Securitisation Finance PLC | | | | | | | | | |
| | | |
Series2017-1A, Class A2,
2.47%, 12/15/20(1) | | | | | | | 1,950 | | | | 1,931,239 | |
| | | |
Series2017-1A, Class B, 4.184%, (1 mo. USD LIBOR + 1.70%), 12/15/20(1)(5) | | | | | | | 500 | | | | 500,421 | |
| | | |
| Tricon American Homes Trust | | | | | | | | | |
| | | |
Series 2016-SFR1, Class D, 3.886%, 11/17/33(1) | | | | | | | 200 | | | | 199,730 | |
| | | |
| Upgrade Receivables Trust | | | | | | | | | |
| | | |
Series2019-1A, Class A, 3.48%, 3/15/25(1) | | | | | | | 2,500 | | | | 2,506,719 | |
| | | |
| Veros Automobile Receivables Trust | | | | | | | | | |
| | | |
Series2018-1, Class A, 3.63%, 5/15/23(1) | | | | | | | 2,051 | | | | 2,054,773 | |
| | | |
| Wendy’s Funding, LLC | | | | | | | | | |
| | | |
Series2015-1A, Class A2II, 4.08%, 6/15/45(1) | | | | | | | 4,415 | | | | 4,470,802 | |
| |
Total Asset-Backed Securities
(identified cost $53,514,518) | | | $ | 53,777,048 | |
|
| Foreign Government Bonds — 11.9% | |
| Security | | Principal
Amount
(000’s omitted) | | | Value | |
|
| Argentina — 0.3% | |
| | | |
Republic of Argentina, 6.875%, 1/11/48 | | | USD | | | | 1,600 | | | $ | 1,182,000 | |
| | | |
| | | | | | | | | | | $ | 1,182,000 | |
| | | | | | | | | | | | |
| Security | | Principal
Amount
(000’s omitted) | | | Value | |
|
| Australia — 1.0% | |
| | | |
Queensland Treasury Corp., 5.50%, 6/21/21(7) | | | AUD | | | | 4,890 | | | $ | 3,761,470 | |
| | | |
| | | | | | | | | | | $ | 3,761,470 | |
|
| Brazil — 1.0% | |
| | | |
Nota do Tesouro Nacional, 10.00%, 1/1/25 | | | BRL | | | | 13,070 | | | $ | 3,546,444 | |
| | | |
| | | | | | | | | | | $ | 3,546,444 | |
|
| Canada — 1.7% | |
| | | |
Canada Housing Trust, 1.25%, 6/15/21(1) | | | CAD | | | | 2,865 | | | $ | 2,121,646 | |
| | | |
Canada Housing Trust, 1.50%, 12/15/21(1) | | | CAD | | | | 4,280 | | | | 3,184,114 | |
| | | |
Canada Housing Trust, 3.80%, 6/15/21(1) | | | CAD | | | | 55 | | | | 42,998 | |
| | | |
Canadian Government Bond, 0.75%, 3/1/21 | | | CAD | | | | 1,200 | | | | 884,840 | |
| | | |
| | | | | | | | | | | $ | 6,233,598 | |
|
| Malaysia — 0.6% | |
| | | |
Malaysia Government Bond, 3.441%, 2/15/21 | | | MYR | | | | 8,515 | | | $ | 2,087,559 | |
| | | |
| | | | | | | | | | | $ | 2,087,559 | |
|
| Mexico — 1.9% | |
| | | |
Mexican Bonos, 7.75%, 5/29/31 | | | MXN | | | | 137,055 | | | $ | 6,829,925 | |
| | | |
| | | | | | | | | | | $ | 6,829,925 | |
|
| Supranational — 5.2% | |
| | | |
European Bank for Reconstruction & Development, 9.25%, 12/2/20 | | | IDR | | | | 71,420,000 | | | $ | 5,136,573 | |
| | | |
European Investment Bank, 7.20%, 7/9/19(1) | | | IDR | | | | 43,300,000 | | | | 3,035,561 | |
| | | |
International Bank for Reconstruction & Development, 3.50%, 1/22/21 | | | NZD | | | | 2,480 | | | | 1,739,080 | |
| | | |
International Finance Corp., 6.30%, 11/25/24 | | | INR | | | | 315,460 | | | | 4,440,233 | |
| | | |
International Finance Corp., 7.45%, 11/8/21 | | | INR | | | | 200,500 | | | | 2,953,027 | |
| | | |
International Finance Corp., 7.80%, 6/3/19 | | | INR | | | | 40,700 | | | | 589,100 | |
| | | |
International Finance Corp., 8.25%, 6/10/21 | | | INR | | | | 74,390 | | | | 1,108,757 | |
| | | |
| | | | | | | | | | | $ | 19,002,331 | |
|
| Uruguay — 0.2% | |
| | | |
Republic of Uruguay, 8.50%, 3/15/28(1) | | | UYU | | | | 20,780 | | | $ | 543,028 | |
| | | |
| | | | | | | | | | | $ | 543,028 | |
| |
Total Foreign Government Bonds
(identified cost $43,912,450) | | | $ | 43,186,355 | |
| | | | |
| | 8 | | See Notes to Financial Statements. |
Eaton Vance
Core Plus Bond Fund
March 31, 2019
Portfolio of Investments (Unaudited) — continued
| | | | | | | | | | | | |
| Senior Floating-Rate Loans — 0.2%(8) | |
| Borrower/Tranche Description | | | | | Principal
Amount
(000’s omitted) | | | Value | |
|
| Health Care — 0.2% | |
| | | |
BioClinica, Inc., Term Loan, 7.00%, (3 mo. USD LIBOR + 4.25%), 10/20/23 | | | | | | $ | 742 | | | $ | 671,735 | |
| |
Total Senior Floating-Rate Loans
(identified cost $732,049) | | | $ | 671,735 | |
|
| Convertible Bonds — 1.0% | |
| Security | | | | | Principal
Amount
(000’s omitted) | | | Value | |
|
| Oil and Gas — 1.0% | |
| | | |
Nabors Industries, Inc., 0.75%, 1/15/24 | | | | | | $ | 4,925 | | | $ | 3,524,930 | |
| |
Total Convertible Bonds
(identified cost $3,752,883) | | | $ | 3,524,930 | |
|
| Convertible Preferred Stocks — 0.3% | |
| Security | | | | | Shares | | | Value | |
|
| Diversified Financial Services — 0.0%(9) | |
| | | |
AMG Capital Trust II, 5.15% | | | | | | | 3,250 | | | $ | 165,749 | |
| | | |
| | | | | | | | | | | $ | 165,749 | |
|
| Oil and Gas — 0.1% | |
| | | |
Chesapeake Energy Corp., 5.75% | | | | | | | 400 | | | $ | 228,818 | |
| | | |
| | | | | | | | | | | $ | 228,818 | |
|
| Real Estate Investment Trusts (REITs) — 0.2% | |
| | | |
CBL & Associates Properties, Inc.,
Series E, 6.625% | | | | | | | 79,393 | | | $ | 718,507 | |
| | | |
| | | | | | | | | | | $ | 718,507 | |
| |
Total Convertible Preferred Stocks
(identified cost $1,466,080) | | | $ | 1,113,074 | |
| | | | | | | | | | |
| Common Stocks — 0.0%(9) | |
| Security | | | | Shares | | | Value | |
|
| Oil and Gas — 0.0%(9) | |
| | | |
Frontera Energy Corp. | | | | | 5,460 | | | $ | 46,741 | |
| |
Total Common Stocks
(identified cost $394,575) | | | $ | 46,741 | |
|
| U.S. Treasury Obligations — 5.8% | |
| Security | | Principal
Amount
(000’s omitted) | | | Value | |
| | | |
U.S. Treasury Inflation-Protected Note, 0.25%, 1/15/25(10) | | | | $ | 10,159 | | | $ | 10,058,329 | |
| | | |
U.S. Treasury Inflation-Protected Note, 0.625%, 4/15/23(10) | | | | | 10,893 | | | | 10,974,651 | |
| |
Total U.S. Treasury Obligations
(identified cost $20,657,481) | | | $ | 21,032,980 | |
|
| Short-Term Investments— 18.9% | |
| Description | | | | Units | | | Value | |
| | | |
Eaton Vance Cash Reserves Fund, LLC, 2.59%(11) | | | | | 68,774,584 | | | $ | 68,774,584 | |
| |
Total Short-Term Investments
(identified cost $68,774,170) | | | $ | 68,774,584 | |
| |
Total Investments — 98.1%
(identified cost $354,864,823) | | | $ | 356,033,385 | |
| |
Other Assets, Less Liabilities — 1.9% | | | $ | 7,009,007 | |
| |
Net Assets — 100.0% | | | $ | 363,042,392 | |
The percentage shown for each investment category in the Portfolio of Investments is based on net assets.
| | * | In U.S. dollars unless otherwise indicated. |
| | (1) | Security exempt from registration pursuant to Rule 144A under the Securities Act of 1933, as amended. These securities may be sold in certain transactions in reliance on an exemption from registration (normally to qualified institutional buyers). At March 31, 2019, the aggregate value of these securities is $126,971,001 or 35.0% of the Fund’s net assets. |
| | (2) | Security converts to floating rate after the indicated fixed-rate coupon period. |
| | (3) | Issuer is in default with respect to interest and/or principal payments. For a variable rate security, interest rate has been adjusted to reflectnon-accrual status. |
| | (4) | Weighted average fixed-rate coupon that changes/updates monthly. Rate shown is the rate at March 31, 2019. |
| | | | |
| | 9 | | See Notes to Financial Statements. |
Eaton Vance
Core Plus Bond Fund
March 31, 2019
Portfolio of Investments (Unaudited) — continued
| | (5) | Variable rate security. The stated interest rate represents the rate in effect at March 31, 2019. |
| | (6) | Step coupon bond. Interest rate represents the rate in effect at March 31, 2019. |
| | (7) | Security exempt from registration under Regulation S of the Securities Act of 1933, which exempts from registration securities offered and sold outside the United States. Security may not be offered or sold in the United States except pursuant to an exemption from, or in a transaction not subject to, the registration requirements of the Securities Act of 1933. At March 31, 2019, the aggregate value of these securities is $3,761,470 or 1.0% of the Fund’s net assets. |
| | (8) | Senior floating-rate loans (Senior Loans) often require prepayments from excess cash flows or permit the borrowers to repay at their election. The degree to which borrowers repay, whether as a contractual requirement or at their election, cannot be predicted with accuracy. As a result, the actual remaining maturity may be substantially less than the stated maturities shown. However, Senior Loans will typically have an expected average life of approximately two to four years. Senior Loans typically have rates of interest which are redetermined periodically by reference to a base lending rate, plus a spread. These base lending rates are primarily the London Interbank Offered Rate (“LIBOR”) and secondarily, the prime rate offered by one or more major United States banks (the “Prime Rate”). Base lending rates may be subject to a floor, or minimum rate. |
| | (9) | Amount is less than 0.05%. |
| (10) | Inflation-linked security whose principal is adjusted for inflation based on changes in the U.S. Consumer Price Index. Interest is calculated based on the inflation-adjusted principal. |
| (11) | Affiliated investment company, available to Eaton Vance portfolios and funds, which invests in high quality, U.S. dollar denominated money market instruments. The rate shown is the annualizedseven-day yield as of March 31, 2019. |
| | | | | | | | |
| Country Concentration of Portfolio | |
| Country | | Percentage of
Total Investments | | | Value | |
| | |
United States | | | 71.3 | % | | $ | 254,005,747 | |
| | |
Mexico | | | 5.6 | | | | 20,073,702 | |
| | |
Supranational | | | 5.3 | | | | 19,002,331 | |
| | |
Brazil | | | 4.2 | | | | 15,018,350 | |
| | |
Canada | | | 2.8 | | | | 9,802,264 | |
| | |
United Kingdom | | | 2.0 | | | | 7,268,555 | |
| | |
Ireland | | | 1.4 | | | | 4,958,558 | |
| | |
Australia | | | 1.1 | | | | 3,761,470 | |
| | |
Argentina | | | 1.0 | | | | 3,476,250 | |
| | |
Norway | | | 0.9 | | | | 3,135,870 | |
| | |
Italy | | | 0.7 | | | | 2,594,739 | |
| | |
Finland | | | 0.7 | | | | 2,501,100 | |
| | |
Spain | | | 0.7 | | | | 2,331,451 | |
| | |
Malaysia | | | 0.6 | | | | 2,087,559 | |
| | |
Trinidad and Tobago | | | 0.5 | | | | 1,717,283 | |
| | |
Denmark | | | 0.4 | | | | 1,596,502 | |
| | |
Japan | | | 0.3 | | | | 1,158,262 | |
| | |
Israel | | | 0.3 | | | | 953,623 | |
| | |
Uruguay | | | 0.2 | | | | 543,028 | |
| | |
Colombia | | | 0.0 | (1) | | | 46,741 | |
| | |
Total Investments | | | 100.0 | % | | $ | 356,033,385 | |
| (1) | Amount is less than 0.05%. |
Abbreviations:
| | | | |
| | |
| LIBOR | | – | | London Interbank Offered Rate |
Currency Abbreviations:
| | | | |
| | |
| AUD | | – | | Australian Dollar |
| | |
| BRL | | – | | Brazilian Real |
| | |
| CAD | | – | | Canadian Dollar |
| | |
| IDR | | – | | Indonesian Rupiah |
| | |
| INR | | – | | Indian Rupee |
| | | | |
| | |
| MXN | | – | | Mexican Peso |
| | |
| MYR | | – | | Malaysian Ringgit |
| | |
| NZD | | – | | New Zealand Dollar |
| | |
| USD | | – | | United States Dollar |
| | |
| UYU | | – | | Uruguayan Peso |
| | | | |
| | 10 | | See Notes to Financial Statements. |
Eaton Vance
Core Plus Bond Fund
March 31, 2019
Statement of Assets and Liabilities (Unaudited)
| | | | |
| Assets | | March 31, 2019 | |
| |
Unaffiliated investments, at value (identified cost, $286,090,653) | | $ | 287,258,801 | |
| |
Affiliated investment, at value (identified cost, $68,774,170) | | | 68,774,584 | |
| |
Cash | | | 1,922 | |
| |
Interest and dividends receivable | | | 2,812,345 | |
| |
Dividends receivable from affiliated investment | | | 110,473 | |
| |
Receivable for Fund shares sold | | | 5,170,226 | |
| |
Tax reclaims receivable | | | 7,927 | |
| |
Receivable from affiliate | | | 52,121 | |
| |
Total assets | | $ | 364,188,399 | |
|
| Liabilities | |
| |
Payable for Fund shares redeemed | | $ | 847,909 | |
| |
Distributions payable | | | 21,631 | |
| |
Payable to affiliates: | | | | |
| |
Investment adviser fee | | | 128,729 | |
| |
Distribution and service fees | | | 32,831 | |
| |
Accrued foreign capital gains taxes | | | 1,801 | |
| |
Accrued expenses | | | 113,106 | |
| |
Total liabilities | | $ | 1,146,007 | |
| |
Net Assets | | $ | 363,042,392 | |
|
| Sources of Net Assets | |
| |
Paid-in capital | | $ | 361,956,501 | |
| |
Distributable earnings | | | 1,085,891 | |
| |
Net Assets | | $ | 363,042,392 | |
|
| Class A Shares | |
| |
Net Assets | | $ | 53,113,334 | |
| |
Shares Outstanding | | | 4,528,548 | |
| |
Net Asset Value and Redemption Price Per Share | | | | |
| |
(net assets ÷ shares of beneficial interest outstanding) | | $ | 11.73 | |
| |
Maximum Offering Price Per Share | | | | |
| |
(100 ÷ 95.25 of net asset value per share) | | $ | 12.31 | |
|
| Class C Shares | |
| |
Net Assets | | $ | 28,047,684 | |
| |
Shares Outstanding | | | 2,392,375 | |
| |
Net Asset Value and Offering Price Per Share* | | | | |
| |
(net assets ÷ shares of beneficial interest outstanding) | | $ | 11.72 | |
|
| Class I Shares | |
| |
Net Assets | | $ | 281,881,374 | |
| |
Shares Outstanding | | | 24,047,561 | |
| |
Net Asset Value, Offering Price and Redemption Price Per Share | | | | |
| |
(net assets ÷ shares of beneficial interest outstanding) | | $ | 11.72 | |
On sales of $50,000 or more, the offering price of Class A shares is reduced.
| * | Redemption price per share is equal to the net asset value less any applicable contingent deferred sales charge. |
| | | | |
| | 11 | | See Notes to Financial Statements. |
Eaton Vance
Core Plus Bond Fund
March 31, 2019
Statement of Operations (Unaudited)
| | | | |
| Investment Income | | Six Months Ended March 31, 2019 | |
| |
Interest (net of foreign taxes, $1,415) | | $ | 5,501,654 | |
| |
Dividends (net of foreign taxes, $199) | | | 64,176 | |
| |
Dividends from affiliated investment | | | 604,198 | |
| |
Total investment income | | $ | 6,170,028 | |
| |
| Expenses | | | | |
| |
Investment adviser fee | | $ | 598,076 | |
| |
Distribution and service fees | | | | |
| |
Class A | | | 55,705 | |
| |
Class C | | | 113,199 | |
| |
Trustees’ fees and expenses | | | 7,319 | |
| |
Custodian fee | | | 44,170 | |
| |
Transfer and dividend disbursing agent fees | | | 76,389 | |
| |
Legal and accounting services | | | 35,015 | |
| |
Printing and postage | | | 18,950 | |
| |
Registration fees | | | 65,852 | |
| |
Miscellaneous | | | 10,163 | |
| |
Total expenses | | $ | 1,024,838 | |
| |
Deduct — | | | | |
| |
Allocation of expenses to affiliate | | $ | 204,697 | |
| |
Total expense reductions | | $ | 204,697 | |
| |
Net expenses | | $ | 820,141 | |
| |
Net investment income | | $ | 5,349,887 | |
| |
| Realized and Unrealized Gain (Loss) | | | | |
| |
Net realized gain (loss) — | | | | |
| |
Investment transactions | | $ | (147,601 | ) |
| |
Investment transactions — affiliated investment | | | 287 | |
| |
Foreign currency transactions | | | (12,423 | ) |
| |
Net realized loss | | $ | (159,737 | ) |
| |
Change in unrealized appreciation (depreciation) — | | | | |
| |
Investments (including net decrease of $315 in accrued foreign capital gains taxes) | | $ | 5,839,419 | |
| |
Investments — affiliated investment | | | 1,209 | |
| |
Foreign currency | | | 12,792 | |
| |
Net change in unrealized appreciation (depreciation) | | $ | 5,853,420 | |
| |
Net realized and unrealized gain | | $ | 5,693,683 | |
| |
Net increase in net assets from operations | | $ | 11,043,570 | |
| | | | |
| | 12 | | See Notes to Financial Statements. |
Eaton Vance
Core Plus Bond Fund
March 31, 2019
Statements of Changes in Net Assets
| | | | | | | | |
| Increase (Decrease) in Net Assets | | Six Months Ended
March 31, 2019
(Unaudited) | | | Year Ended
September 30, 2018 | |
| | |
From operations — | | | | | | | | |
| | |
Net investment income | | $ | 5,349,887 | | | $ | 5,501,270 | |
| | |
Net realized gain (loss) | | | (159,737 | ) | | | 813,844 | |
| | |
Net change in unrealized appreciation (depreciation) | | | 5,853,420 | | | | (5,655,214 | ) |
| | |
Net increase in net assets from operations | | $ | 11,043,570 | | | $ | 659,900 | |
| | |
Distributions to shareholders — | | | | | | | | |
| | |
Class A | | $ | (904,058 | ) | | $ | (1,477,677 | ) |
| | |
Class C | | | (374,849 | ) | | | (583,378 | ) |
| | |
Class I | | | (4,280,328 | ) | | | (3,671,748 | ) |
| | |
Total distributions to shareholders | | $ | (5,559,235 | ) | | $ | (5,732,803 | ) |
| | |
Transactions in shares of beneficial interest — | | | | | | | | |
| | |
Proceeds from sale of shares | | | | | | | | |
| | |
Class A | | $ | 15,873,888 | | | $ | 27,400,537 | |
| | |
Class C | | | 10,496,077 | | | | 6,825,122 | |
| | |
Class I | | | 158,985,989 | | | | 142,333,086 | |
| | |
Net asset value of shares issued to shareholders in payment of distributions declared | | | | | | | | |
| | |
Class A | | | 843,948 | | | | 1,362,034 | |
| | |
Class C | | | 349,396 | | | | 539,859 | |
| | |
Class I | | | 4,214,529 | | | | 3,643,148 | |
| | |
Cost of shares redeemed | | | | | | | | |
| | |
Class A | | | (8,846,051 | ) | | | (17,879,234 | ) |
| | |
Class C | | | (3,128,343 | ) | | | (4,992,017 | ) |
| | |
Class I | | | (38,023,505 | ) | | | (32,054,112 | ) |
| | |
Net asset value of shares converted | | | | | | | | |
| | |
Class A | | | 1,000,735 | | | | — | |
| | |
Class C | | | (1,000,735 | ) | | | — | |
| | |
Net increase in net assets from Fund share transactions | | $ | 140,765,928 | | | $ | 127,178,423 | |
| | |
Net increase in net assets | | $ | 146,250,263 | | | $ | 122,105,520 | |
|
| Net Assets | |
| | |
At beginning of period | | $ | 216,792,129 | | | $ | 94,686,609 | |
| | |
At end of period | | $ | 363,042,392 | | | $ | 216,792,129 | |
| | | | |
| | 13 | | See Notes to Financial Statements. |
Eaton Vance
Core Plus Bond Fund
March 31, 2019
Financial Highlights
| | | | | | | | | | | | | | | | | | | | | | | | |
| | | Class A | |
| | |
| | | Six Months Ended
March 31, 2019
(Unaudited) | | | Year Ended September 30, | |
| | | 2018 | | | 2017 | | | 2016 | | | 2015 | | | 2014 | |
| | | | | | | |
Net asset value — Beginning of period | | $ | 11.570 | | | $ | 11.930 | | | $ | 11.630 | | | $ | 11.040 | | | $ | 11.780 | | | $ | 11.520 | |
| | | | | | |
| Income (Loss) From Operations | | | | | | | | | | | | | | | | | | | | | | | | |
| | | | | | |
Net investment income(1) | | $ | 0.223 | | | $ | 0.402 | | | $ | 0.367 | | | $ | 0.415 | | | $ | 0.358 | | | $ | 0.420 | |
| | | | | | |
Net realized and unrealized gain (loss) | | | 0.170 | | | | (0.344 | ) | | | 0.319 | | | | 0.774 | | | | (0.668 | ) | | | 0.372 | |
| | | | | | |
Total income (loss) from operations | | $ | 0.393 | | | $ | 0.058 | | | $ | 0.686 | | | $ | 1.189 | | | $ | (0.310 | ) | | $ | 0.792 | |
| | | | | | |
| Less Distributions | | | | | | | | | | | | | | | | | | | | | | | | |
| | | | | | |
From net investment income | | $ | (0.233 | ) | | $ | (0.409 | ) | | $ | (0.322 | ) | | $ | (0.450 | ) | | $ | (0.430 | ) | | $ | (0.532 | ) |
| | | | | | |
From net realized gain | | | — | | | | (0.009 | ) | | | — | | | | (0.149 | ) | | | — | | | | — | |
| | | | | | |
Tax return of capital | | | — | | | | — | | | | (0.064 | ) | | | — | | | | — | | | | — | |
| | | | | | |
Total distributions | | $ | (0.233 | ) | | $ | (0.418 | ) | | $ | (0.386 | ) | | $ | (0.599 | ) | | $ | (0.430 | ) | | $ | (0.532 | ) |
| | | | | | |
Net asset value — End of period | | $ | 11.730 | | | $ | 11.570 | | | $ | 11.930 | | | $ | 11.630 | | | $ | 11.040 | | | $ | 11.780 | |
| | | | | | |
Total Return(2)(3) | | | 3.45 | %(4) | | | 0.50 | % | | | 6.01 | % | | | 11.21 | % | | | (2.80 | )% | | | 7.06 | % |
|
| Ratios/Supplemental Data | |
| | | | | | |
Net assets, end of period (000’s omitted) | | $ | 53,113 | | | $ | 43,503 | | | $ | 33,927 | | | $ | 17,977 | | | $ | 15,588 | | | $ | 18,176 | |
| | | | | | |
Ratios (as a percentage of average daily net assets): | | | | | | | | | | | | | | | | | | | | | | | | |
| | | | | | |
Expenses(3)(5) | | | 0.74 | %(6) | | | 0.74 | % | | | 0.77 | % | | | 0.80 | % | | | 0.85 | % | | | 0.95 | % |
| | | | | | |
Net investment income | | | 3.89 | %(6) | | | 3.43 | % | | | 3.13 | % | | | 3.74 | % | | | 3.03 | % | | | 3.64 | % |
| | | | | | |
Portfolio Turnover | | | 27 | %(4) | | | 43 | % | | | 61 | % | | | 71 | % | | | 119 | % | | | 0 | %(7) |
| (1) | Computed using average shares outstanding. |
| (2) | Returns are historical and are calculated by determining the percentage change in net asset value with all distributions reinvested and do not reflect the effect of sales charges. |
| (3) | The investment adviser and administrator reimbursed certain operating expenses (equal to 0.15%, 0.22%, 0.36%, 0.53%, 0.34% and 0.23% of average daily net assets for the six months ended March 31, 2019 and the years ended September 30, 2018, 2017, 2016, 2015 and 2014, respectively). Absent this reimbursement, total return would be lower. |
| (5) | Excludes the effect of custody fee credits, if any, of less than 0.005%. Effective September 1, 2015, custody fee credits, which were earned on cash deposit balances, were discontinued by the custodian. |
| (7) | Amount is less than 1%. |
| | | | |
| | 14 | | See Notes to Financial Statements. |
Eaton Vance
Core Plus Bond Fund
March 31, 2019
Financial Highlights — continued
| | | | | | | | | | | | | | | | | | | | | | | | |
| | | Class C | |
| | |
| | | Six Months Ended
March 31, 2019
(Unaudited) | | | Year Ended September 30, | |
| | | 2018 | | | 2017 | | | 2016 | | | 2015 | | | 2014 | |
| | | | | | | |
Net asset value — Beginning of period | | $ | 11.560 | | | $ | 11.920 | | | $ | 11.620 | | | $ | 11.040 | | | $ | 11.770 | | | $ | 11.520 | |
| | | | | | |
| Income (Loss) From Operations | | | | | | | | | | | | | | | | | | | | | | | | |
| | | | | | |
Net investment income(1) | | $ | 0.180 | | | $ | 0.313 | | | $ | 0.282 | | | $ | 0.331 | | | $ | 0.266 | | | $ | 0.334 | |
| | | | | | |
Net realized and unrealized gain (loss) | | | 0.170 | | | | (0.343 | ) | | | 0.317 | | | | 0.765 | | | | (0.655 | ) | | | 0.362 | |
| | | | | | |
Total income (loss) from operations | | $ | 0.350 | | | $ | (0.030 | ) | | $ | 0.599 | | | $ | 1.096 | | | $ | (0.389 | ) | | $ | 0.696 | |
| | | | | | |
| Less Distributions | | | | | | | | | | | | | | | | | | | | | | | | |
| | | | | | |
From net investment income | | $ | (0.190 | ) | | $ | (0.321 | ) | | $ | (0.249 | ) | | $ | (0.367 | ) | | $ | (0.341 | ) | | $ | (0.446 | ) |
| | | | | | |
From net realized gain | | | — | | | | (0.009 | ) | | | — | | | | (0.149 | ) | | | — | | | | — | |
| | | | | | |
Tax return of capital | | | — | | | | — | | | | (0.050 | ) | | | — | | | | — | | | | — | |
| | | | | | |
Total distributions | | $ | (0.190 | ) | | $ | (0.330 | ) | | $ | (0.299 | ) | | $ | (0.516 | ) | | $ | (0.341 | ) | | $ | (0.446 | ) |
| | | | | | |
Net asset value — End of period | | $ | 11.720 | | | $ | 11.560 | | | $ | 11.920 | | | $ | 11.620 | | | $ | 11.040 | | | $ | 11.770 | |
| | | | | | |
Total Return(2)(3) | | | 3.07 | %(4) | | | (0.25 | )% | | | 5.23 | % | | | 10.30 | % | | | (3.44 | )% | | | 6.17 | % |
|
| Ratios/Supplemental Data | |
| | | | | | |
Net assets, end of period (000’s omitted) | | $ | 28,048 | | | $ | 20,926 | | | $ | 19,197 | | | $ | 12,574 | | | $ | 10,457 | | | $ | 10,594 | |
| | | | | | |
Ratios (as a percentage of average daily net assets): | | | | | | | | | | | | | | | | | | | | | | | | |
| | | | | | |
Expenses(3)(5) | | | 1.49 | %(6) | | | 1.49 | % | | | 1.52 | % | | | 1.55 | % | | | 1.60 | % | | | 1.70 | % |
| | | | | | |
Net investment income | | | 3.15 | %(6) | | | 2.67 | % | | | 2.41 | % | | | 2.98 | % | | | 2.25 | % | | | 2.90 | % |
| | | | | | |
Portfolio Turnover | | | 27 | %(4) | | | 43 | % | | | 61 | % | | | 71 | % | | | 119 | % | | | 0 | %(7) |
| (1) | Computed using average shares outstanding. |
| (2) | Returns are historical and are calculated by determining the percentage change in net asset value with all distributions reinvested and do not reflect the effect of sales charges. |
| (3) | The investment adviser and administrator reimbursed certain operating expenses (equal to 0.15%, 0.22%, 0.36%, 0.53%, 0.34% and 0.23% of average daily net assets for the six months ended March 31, 2019 and the years ended September 30, 2018, 2017, 2016, 2015 and 2014, respectively). Absent this reimbursement, total return would be lower. |
| (5) | Excludes the effect of custody fee credits, if any, of less than 0.005%. Effective September 1, 2015, custody fee credits, which were earned on cash deposit balances, were discontinued by the custodian. |
| (7) | Amount is less than 1%. |
| | | | |
| | 15 | | See Notes to Financial Statements. |
Eaton Vance
Core Plus Bond Fund
March 31, 2019
Financial Highlights — continued
| | | | | | | | | | | | | | | | | | | | | | | | |
| | | Class I | |
| | |
| | | Six Months Ended
March 31, 2019
(Unaudited) | | | Year Ended September 30, | |
| | | 2018 | | | 2017 | | | 2016 | | | 2015 | | | 2014 | |
| | | | | | | |
Net asset value — Beginning of period | | $ | 11.560 | | | $ | 11.920 | | | $ | 11.620 | | | $ | 11.040 | | | $ | 11.770 | | | $ | 11.520 | |
| | | | | | |
| Income (Loss) From Operations | | | | | | | | | | | | | | | | | | | | | | | | |
| | | | | | |
Net investment income(1) | | $ | 0.237 | | | $ | 0.440 | | | $ | 0.399 | | | $ | 0.442 | | | $ | 0.380 | | | $ | 0.447 | |
| | | | | | |
Net realized and unrealized gain (loss) | | | 0.170 | | | | (0.352 | ) | | | 0.316 | | | | 0.765 | | | | (0.651 | ) | | | 0.364 | |
| | | | | | |
Total income (loss) from operations | | $ | 0.407 | | | $ | 0.088 | | | $ | 0.715 | | | $ | 1.207 | | | $ | (0.271 | ) | | $ | 0.811 | |
| | | | | | |
| Less Distributions | | | | | | | | | | | | | | | | | | | | | | | | |
| | | | | | |
From net investment income | | $ | (0.247 | ) | | $ | (0.439 | ) | | $ | (0.346 | ) | | $ | (0.478 | ) | | $ | (0.459 | ) | | $ | (0.561 | ) |
| | | | | | |
From net realized gain | | | — | | | | (0.009 | ) | | | — | | | | (0.149 | ) | | | — | | | | — | |
| | | | | | |
Tax return of capital | | | — | | | | — | | | | (0.069 | ) | | | — | | | | — | | | | — | |
| | | | | | |
Total distributions | | $ | (0.247 | ) | | $ | (0.448 | ) | | $ | (0.415 | ) | | $ | (0.627 | ) | | $ | (0.459 | ) | | $ | (0.561 | ) |
| | | | | | |
Net asset value — End of period | | $ | 11.720 | | | $ | 11.560 | | | $ | 11.920 | | | $ | 11.620 | | | $ | 11.040 | | | $ | 11.770 | |
| | | | | | |
Total Return(2)(3) | | | 3.58 | %(4) | | | 0.74 | % | | | 6.28 | % | | | 11.40 | % | | | (2.47 | )% | | | 7.23 | % |
|
| Ratios/Supplemental Data | |
| | | | | | |
Net assets, end of period (000’s omitted) | | $ | 281,881 | | | $ | 152,363 | | | $ | 41,563 | | | $ | 6,700 | | | $ | 6,969 | | | $ | 18,648 | |
| | | | | | |
Ratios (as a percentage of average daily net assets): | | | | | | | | | | | | | | | | | | | | | | | | |
| | | | | | |
Expenses(3)(5) | | | 0.49 | %(6) | | | 0.49 | % | | | 0.52 | % | | | 0.55 | % | | | 0.60 | % | | | 0.70 | % |
| | | | | | |
Net investment income | | | 4.13 | %(6) | | | 3.77 | % | | | 3.40 | % | | | 4.00 | % | | | 3.21 | % | | | 3.87 | % |
| | | | | | |
Portfolio Turnover | | | 27 | %(4) | | | 43 | % | | | 61 | % | | | 71 | % | | | 119 | % | | | 0 | %(7) |
| (1) | Computed using average shares outstanding. |
| (2) | Returns are historical and are calculated by determining the percentage change in net asset value with all distributions reinvested. |
| (3) | The investment adviser and administrator reimbursed certain operating expenses (equal to 0.15%, 0.22%, 0.36%, 0.53%, 0.34% and 0.23% of average daily net assets for the six months ended March 31, 2019 and the years ended September 30, 2018, 2017, 2016, 2015 and 2014, respectively). Absent this reimbursement, total return would be lower. |
| (5) | Excludes the effect of custody fee credits, if any, of less than 0.005%. Effective September 1, 2015, custody fee credits, which were earned on cash deposit balances, were discontinued by the custodian. |
| (7) | Amount is less than 1%. |
| | | | |
| | 16 | | See Notes to Financial Statements. |
Eaton Vance
Core Plus Bond Fund
March 31, 2019
Notes to Financial Statements (Unaudited)
1 Significant Accounting Policies
Eaton Vance Core Plus Bond Fund (the Fund) is a diversified series of Eaton Vance Mutual Funds Trust (the Trust). The Trust is a Massachusetts business trust registered under the Investment Company Act of 1940, as amended (the 1940 Act), as anopen-end management investment company. The Fund’s investment objective is total return. The Fund offers three classes of shares. Class A shares are generally sold subject to a sales charge imposed at time of purchase. Class C shares are sold at net asset value and are generally subject to a contingent deferred sales charge (see Note 5). Effective January 25, 2019, Class C shares generally automatically convert to Class A shares ten years after their purchase as described in the Fund’s prospectus. Class I shares are sold at net asset value and are not subject to a sales charge. Each class represents apro-rata interest in the Fund, but votes separately on class-specific matters and (as noted below) is subject to different expenses. Realized and unrealized gains and losses are allocated daily to each class of shares based on the relative net assets of each class to the total net assets of the Fund. Net investment income, other than class-specific expenses, is allocated daily to each class of shares based upon the ratio of the value of each class’s paid shares to the total value of all paid shares. Each class of shares differs in its distribution plan and certain other class-specific expenses.
The following is a summary of significant accounting policies of the Fund. The policies are in conformity with accounting principles generally accepted in the United States of America (U.S. GAAP). The Fund is an investment company and follows accounting and reporting guidance in the Financial Accounting Standards Board (FASB) Accounting Standards Codification Topic 946.
A Investment Valuation — The following methodologies are used to determine the market value or fair value of investments.
Debt Obligations.Debt obligations are generally valued on the basis of valuations provided by third party pricing services, as derived from such services’ pricing models. Inputs to the models may include, but are not limited to, reported trades, executable bid and ask prices, broker/dealer quotations, prices or yields of securities with similar characteristics, interest rates, anticipated prepayments, benchmark curves or information pertaining to the issuer, as well as industry and economic events. The pricing services may use a matrix approach, which considers information regarding securities with similar characteristics to determine the valuation for a security.Short-term debt obligations purchased with a remaining maturity of sixty days or less for which a valuation from a third party pricing service is not readily available may be valued at amortized cost, which approximates fair value.
Equity Securities.Equity securities listed on a U.S. securities exchange generally are valued at the last sale or closing price on the day of valuation or, if no sales took place on such date, at the mean between the closing bid and ask prices on the exchange where such securities are principally traded. Equity securities listed on the NASDAQ Global or Global Select Market generally are valued at the NASDAQ official closing price. Unlisted or listed securities for which closing sales prices or closing quotations are not available are valued at the mean between the latest available bid and ask prices or, in the case of preferred equity securities that are not listed or traded in theover-the-counter market, by a third party pricing service that uses various techniques that consider factors including, but not limited to, prices or yields of securities with similar characteristics, benchmark yields, broker/dealer quotes, quotes of underlying common stock, issuer spreads, as well as industry and economic events.
Senior Floating-Rate Loans. Interests in senior floating-rate loans (Senior Loans) for which reliable market quotations are readily available are valued generally at the average mean of bid and ask quotations obtained from a third party pricing service.
Foreign Securities and Currencies.Foreign securities and currencies are valued in U.S. dollars, based on foreign currency exchange rate quotations supplied by a third party pricing service. The pricing service uses a proprietary model to determine the exchange rate. Inputs to the model include reported trades and implied bid/ask spreads.
Affiliated Fund.The Fund may invest in Eaton Vance Cash Reserves Fund, LLC (Cash Reserves Fund), an affiliated investment company managed by Eaton Vance Management (EVM). While Cash Reserves Fund is not a registered money market mutual fund, it conducts all of its investment activities in accordance with the requirements of Rule2a-7 under the 1940 Act. Investments in Cash Reserves Fund are valued at the closing net asset value per unit on the valuation day. Cash Reserves Fund generally values its investment securities based on available market quotations provided by a third party pricing service.
Fair Valuation.Investments for which valuations or market quotations are not readily available or are deemed unreliable are valued at fair value using methods determined in good faith by or at the direction of the Trustees of the Fund in a manner that fairly reflects the security’s value, or the amount that the Fund might reasonably expect to receive for the security upon its current sale in the ordinary course. Each such determination is based on a consideration of relevant factors, which are likely to vary from one pricing context to another. These factors may include, but are not limited to, the type of security, the existence of any contractual restrictions on the security’s disposition, the price and extent of public trading in similar securities of the issuer or of comparable companies or entities, quotations or relevant information obtained from broker/dealers or other market participants, information obtained from the issuer, analysts, and/or the appropriate stock exchange (for exchange-traded securities), an analysis of the company’s or entity’s financial condition, and an evaluation of the forces that influence the issuer and the market(s) in which the security is purchased and sold.
B Investment Transactions — Investment transactions for financial statement purposes are accounted for on a trade date basis. Realized gains and losses on investments sold are determined on the basis of identified cost.
C Income — Interest income is recorded on the basis of interest accrued, adjusted for amortization of premium or accretion of discount. Fees associated with loan amendments are recognized immediately. Dividend income is recorded on theex-dividend date for dividends received in cash and/or securities. Withholding taxes on foreign interest and dividends have been provided for in accordance with the Fund’s understanding of the applicable countries’ tax rules and rates. Inflation adjustments to the principal amount of inflation-adjusted bonds and notes are reflected as interest income. Deflation adjustments
Eaton Vance
Core Plus Bond Fund
March 31, 2019
Notes to Financial Statements (Unaudited) — continued
to the principal amount of an inflation-adjusted bond or note are reflected as reductions to interest income to the extent of interest income previously recorded on such bond or note.
D Federal Taxes — The Fund’s policy is to comply with the provisions of the Internal Revenue Code applicable to regulated investment companies and to distribute to shareholders each year substantially all of its net investment income, and all or substantially all of its net realized capital gains. Accordingly, no provision for federal income or excise tax is necessary.
In addition to the requirements of the Internal Revenue Code, the Fund may also be subject to local taxes on the recognition of capital gains in certain countries. In determining the daily net asset value, the Fund estimates the accrual for such taxes, if any, based on the unrealized appreciation on certain portfolio securities and the related tax rates. Taxes attributable to unrealized appreciation are included in the change in unrealized appreciation (depreciation) on investments. Capital gains taxes on securities sold are included in net realized gain (loss) on investments.
As of March 31, 2019, the Fund had no uncertain tax positions that would require financial statement recognition,de-recognition, or disclosure. The Fund files a U.S. federal income tax return annually after its fiscalyear-end, which is subject to examination by the Internal Revenue Service for a period of three years from the date of filing.
E Expenses — The majority of expenses of the Trust are directly identifiable to an individual fund. Expenses which are not readily identifiable to a specific fund are allocated taking into consideration, among other things, the nature and type of expense and the relative size of the funds.
F Foreign Currency Translation — Investment valuations, other assets, and liabilities initially expressed in foreign currencies are translated each business day into U.S. dollars based upon current exchange rates. Purchases and sales of foreign investment securities and income and expenses denominated in foreign currencies are translated into U.S. dollars based upon currency exchange rates in effect on the respective dates of such transactions. Recognized gains or losses on investment transactions attributable to changes in foreign currency exchange rates are recorded for financial statement purposes as net realized gains and losses on investments. That portion of unrealized gains and losses on investments that results from fluctuations in foreign currency exchange rates is not separately disclosed.
G Use of Estimates — The preparation of the financial statements in conformity with U.S. GAAP requires management to make estimates and assumptions that affect the reported amounts of assets and liabilities at the date of the financial statements and the reported amounts of income and expense during the reporting period. Actual results could differ from those estimates.
H Indemnifications — Under the Trust’s organizational documents, its officers and Trustees may be indemnified against certain liabilities and expenses arising out of the performance of their duties to the Fund. Under Massachusetts law, if certain conditions prevail, shareholders of a Massachusetts business trust (such as the Trust) could be deemed to have personal liability for the obligations of the Trust. However, the Trust’s Declaration of Trust contains an express disclaimer of liability on the part of Fund shareholders and theBy-laws provide that the Trust shall assume the defense on behalf of any Fund shareholders. Moreover, theBy-laws also provide for indemnification out of Fund property of any shareholder held personally liable solely by reason of being or having been a shareholder for all loss or expense arising from such liability. Additionally, in the normal course of business, the Fund enters into agreements with service providers that may contain indemnification clauses. The Fund’s maximum exposure under these arrangements is unknown as this would involve future claims that may be made against the Fund that have not yet occurred.
I Interim Financial Statements — The interim financial statements relating to March 31, 2019 and for the six months then ended have not been audited by an independent registered public accounting firm, but in the opinion of the Fund’s management, reflect all adjustments, consisting only of normal recurring adjustments, necessary for the fair presentation of the financial statements.
2 Distributions to Shareholders and Income Tax Information
The Fund declares dividends daily to shareholders of record at the time of declaration. Distributions are generally paid monthly. Distributions of realized capital gains are made at least annually. Distributions to shareholders are recorded on theex-dividend date. Distributions are declared separately for each class of shares. Shareholders may reinvest income and capital gain distributions in additional shares of the same class of the Fund at the net asset value as of theex-dividend date or, at the election of the shareholder, receive distributions in cash. Distributions to shareholders are determined in accordance with income tax regulations, which may differ from U.S. GAAP. As required by U.S. GAAP, only distributions in excess of tax basis earnings and profits are reported in the financial statements as a return of capital. Permanent differences between book and tax accounting relating to distributions are reclassified topaid-in capital. For tax purposes, distributions from short-term capital gains are considered to be from ordinary income.
At September 30, 2018, the Fund had a late year ordinary loss of $1,591 which it has elected to defer to the following taxable year pursuant to income tax regulations. Late year ordinary losses represent certain specified losses realized in that portion of a taxable year after October 31 that are treated as ordinary for tax purposes plus ordinary losses attributable to that portion of a taxable year after December 31.
Eaton Vance
Core Plus Bond Fund
March 31, 2019
Notes to Financial Statements (Unaudited) — continued
The cost and unrealized appreciation (depreciation) of investments of the Fund at March 31, 2019, as determined on a federal income tax basis, were as follows:
| | | | |
| |
Aggregate cost | | $ | 354,711,209 | |
| |
Gross unrealized appreciation | | $ | 5,699,676 | |
| |
Gross unrealized depreciation | | | (4,377,500 | ) |
| |
Net unrealized appreciation | | $ | 1,322,176 | |
3 Investment Adviser Fee and Other Transactions with Affiliates
The investment adviser fee is earned by Boston Management and Research (BMR), a subsidiary of EVM, as compensation for investment advisory services rendered to the Fund. Pursuant to the investment advisory agreement and subsequent fee reduction agreement between the Fund and BMR, the fee is computed at an annual rate of 0.45% of the Fund’s average daily net assets up to $1 billion and is payable monthly. On net assets of $1 billion and over, the annual fee is reduced. The fee reduction cannot be terminated without the consent of the Trustees and shareholders. For the six months ended March 31, 2019, the Fund’s investment adviser fee amounted to $598,076 or 0.45% (annualized) of the Fund’s average daily net assets. The Fund invests its cash in Cash Reserves Fund. EVM does not currently receive a fee for advisory services provided to Cash Reserves Fund.
BMR has agreed to reimburse the Fund’s expenses to the extent that total annual operating expenses (relating to ordinary operating expenses only) exceed 0.74%, 1.49% and 0.49% of the Fund’s average daily net assets for Class A, Class C and Class I, respectively. This agreement may be changed or terminated after January 31, 2020. Pursuant to this agreement, BMR was allocated $204,697 of the Fund’s operating expenses for the six months ended March 31, 2019.
EVM serves as the administrator of the Fund, but receives no compensation. EVM providessub-transfer agency and related services to the Fund pursuant to aSub-Transfer Agency Support Services Agreement. For the six months ended March 31, 2019, EVM earned $2,352 from the Fund pursuant to such agreement, which is included in transfer and dividend disbursing agent fees on the Statement of Operations. The Fund was informed that Eaton Vance Distributors, Inc. (EVD), an affiliate of EVM and the Fund’s principal underwriter, received $20,388 as its portion of the sales charge on sales of Class A shares for the six months ended March 31, 2019. EVD also received distribution and service fees from Class A and Class C shares (see Note 4) and contingent deferred sales charges (see Note 5).
Trustees and officers of the Fund who are members of EVM’s or BMR’s organizations receive remuneration for their services to the Fund out of the investment adviser fee. Trustees of the Fund who are not affiliated with the investment adviser may elect to defer receipt of all or a percentage of their annual fees in accordance with the terms of the Trustees Deferred Compensation Plan. For the six months ended March 31, 2019, no significant amounts have been deferred. Certain officers and Trustees of the Fund are officers of the above organizations.
4 Distribution Plans
The Fund has in effect a distribution plan for Class A shares (Class A Plan) pursuant to Rule12b-1 under the 1940 Act. Pursuant to the Class A Plan, the Fund pays EVD a distribution and service fee of 0.25% per annum of its average daily net assets attributable to Class A shares for distribution services and facilities provided to the Fund by EVD, as well as for personal services and/or the maintenance of shareholder accounts. Distribution and service fees paid or accrued to EVD for the six months ended March 31, 2019 amounted to $55,705 for Class A shares.
The Fund also has in effect a distribution plan for Class C shares (Class C Plan) pursuant to Rule12b-1 under the 1940 Act. Pursuant to the Class C Plan, the Fund pays EVD amounts equal to 0.75% per annum of its average daily net assets attributable to Class C shares for providing ongoing distribution services and facilities to the Fund. For the six months ended March 31, 2019, the Fund paid or accrued to EVD $84,899 for Class C shares.
Pursuant to the Class C Plan, the Fund also makes payments of service fees to EVD, financial intermediaries and other persons in amounts equal to 0.25% per annum of its average daily net assets attributable to that class. Service fees paid or accrued are for personal services and/or the maintenance of shareholder accounts. They are separate and distinct from the sales commissions and distribution fees payable to EVD. Service fees paid or accrued for the six months ended March 31, 2019 amounted to $28,300 for Class C shares.
Distribution and service fees are subject to the limitations contained in the Financial Industry Regulatory Authority Rule 2341(d).
5 Contingent Deferred Sales Charges
A contingent deferred sales charge (CDSC) of 1% generally is imposed on redemptions of Class C shares made within one year of purchase. Class A shares may be subject to a 1% CDSC if redeemed within 18 months of purchase (depending on the circumstances of purchase). Generally, the CDSC is based
Eaton Vance
Core Plus Bond Fund
March 31, 2019
Notes to Financial Statements (Unaudited) — continued
upon the lower of the net asset value at date of redemption or date of purchase. No charge is levied on shares acquired by reinvestment of dividends or capital gain distributions. For the six months ended March 31, 2019, the Fund was informed that EVD received less than $100 of CDSCs paid by Class A shareholders and approximately $1,000 of CDSCs paid by Class C shareholders.
6 Purchases and Sales of Investments
Purchases and sales of investments, other than short-term obligations and including maturities, paydowns and principal repayments on Senior Loans, for the six months ended March 31, 2019 were as follows:
| | | | | | | | |
| | | Purchases | | | Sales | |
| | |
Investments(non-U.S. Government) | | $ | 149,074,547 | | | $ | 48,520,952 | |
| | |
U.S. Government and Agency Securities | | | 16,505,598 | | | | 10,739,940 | |
| | |
| | | $ | 165,580,145 | | | $ | 59,260,892 | |
7 Shares of Beneficial Interest
The Fund’s Declaration of Trust permits the Trustees to issue an unlimited number of full and fractional shares of beneficial interest (without par value). Such shares may be issued in a number of different series (such as the Fund) and classes. Transactions in Fund shares were as follows:
| | | | | | | | |
| Class A | | Six Months Ended
March 31, 2019
(Unaudited) | | | Year Ended
September 30, 2018 | |
| | |
Sales | | | 1,375,639 | | | | 2,323,804 | |
| | |
Issued to shareholders electing to receive payments of distributions in Fund shares | | | 73,327 | | | | 116,194 | |
| | |
Redemptions | | | (768,909 | ) | | | (1,522,948 | ) |
| | |
Converted from Class C shares | | | 87,140 | | | | — | |
| | |
Net increase | | | 767,197 | | | | 917,050 | |
| | |
| Class C | | Six Months Ended
March 31, 2019
(Unaudited) | | | Year Ended
September 30, 2018 | |
| | |
Sales | | | 911,906 | | | | 579,842 | |
| | |
Issued to shareholders electing to receive payments of distributions in Fund shares | | | 30,369 | | | | 46,064 | |
| | |
Redemptions | | | (272,758 | ) | | | (425,935 | ) |
| | |
Converted to Class A shares | | | (87,130 | ) | | | — | |
| | |
Net increase | | | 582,387 | | | | 199,971 | |
| | |
| Class I | | Six Months Ended
March 31, 2019
(Unaudited) | | | Year Ended
September 30, 2018 | |
| | |
Sales | | | 13,811,713 | | | | 12,128,224 | |
| | |
Issued to shareholders electing to receive payments of distributions in Fund shares | | | 365,989 | | | | 311,985 | |
| | |
Redemptions | | | (3,310,979 | ) | | | (2,745,878 | ) |
| | |
Net increase | | | 10,866,723 | | | | 9,694,331 | |
Eaton Vance
Core Plus Bond Fund
March 31, 2019
Notes to Financial Statements (Unaudited) — continued
8 Line of Credit
The Fund participates with other portfolios and funds managed by EVM and its affiliates in a $625 million unsecured line of credit agreement with a group of banks, which is in effect through October 29, 2019. Borrowings are made by the Fund solely to facilitate the handling of unusual and/or unanticipated short-term cash requirements. Interest is charged to the Fund based on its borrowings at an amount above either the Eurodollar rate or Federal Funds rate. In addition, a fee computed at an annual rate of 0.15% on the daily unused portion of the line of credit is allocated among the participating portfolios and funds at the end of each quarter. Because the line of credit is not available exclusively to the Fund, it may be unable to borrow some or all of its requested amounts at any particular time. The Fund did not have any significant borrowings or allocated fees during the six months ended March 31, 2019.
9 Risks Associated with Foreign Investments
Investing in securities issued by companies whose principal business activities are outside the United States may involve significant risks not present in domestic investments. For example, there is generally less publicly available information about foreign companies, particularly those not subject to the disclosure and reporting requirements of the U.S. securities laws. Certain foreign issuers are generally not bound by uniform accounting, auditing, and financial reporting requirements and standards of practice comparable to those applicable to domestic issuers. Investments in foreign securities also involve the risk of possible adverse changes in investment or exchange control regulations, expropriation or confiscatory taxation, limitation on the removal of funds or other assets of the Fund, political or financial instability or diplomatic and other developments which could affect such investments. Foreign securities markets, while growing in volume and sophistication, are generally not as developed as those in the United States, and securities of some foreign issuers (particularly those located in developing countries) may be less liquid and more volatile than securities of comparable U.S. companies. In general, there is less overall governmental supervision and regulation of foreign securities markets, broker/dealers and issuers than in the United States.
10 Fair Value Measurements
Under generally accepted accounting principles for fair value measurements, a three-tier hierarchy to prioritize the assumptions, referred to as inputs, is used in valuation techniques to measure fair value. The three-tier hierarchy of inputs is summarized in the three broad levels listed below.
| • | | Level 1 – quoted prices in active markets for identical investments |
| • | | Level 2 – other significant observable inputs (including quoted prices for similar investments, interest rates, prepayment speeds, credit risk, etc.) |
| • | | Level 3 – significant unobservable inputs (including a fund’s own assumptions in determining the fair value of investments) |
In cases where the inputs used to measure fair value fall in different levels of the fair value hierarchy, the level disclosed is determined based on the lowest level input that is significant to the fair value measurement in its entirety. The inputs or methodology used for valuing securities are not necessarily an indication of the risk associated with investing in those securities.
At March 31, 2019, the hierarchy of inputs used in valuing the Fund’s investments, which are carried at value, were as follows:
| | | | | | | | | | | | | | | | |
| Asset Description | | Level 1 | | | Level 2 | | | Level 3 | | | Total | |
| | | | |
Corporate Bonds & Notes | | $ | — | | | $ | 133,798,718 | | | $ | — | | | $ | 133,798,718 | |
| | | | |
Commercial Mortgage-Backed Securities | | | — | | | | 30,107,220 | | | | — | | | | 30,107,220 | |
| | | | |
Asset-Backed Securities | | | — | | | | 53,777,048 | | | | — | | | | 53,777,048 | |
| | | | |
Foreign Government Bonds | | | — | | | | 43,186,355 | | | | — | | | | 43,186,355 | |
| | | | |
Senior Floating-Rate Loans | | | — | | | | 671,735 | | | | — | | | | 671,735 | |
| | | | |
Convertible Bonds | | | — | | | | 3,524,930 | | | | — | | | | 3,524,930 | |
| | | | |
Convertible Preferred Stocks | | | 718,507 | | | | 394,567 | | | | — | | | | 1,113,074 | |
| | | | |
Common Stocks | | | 46,741 | | | | — | | | | — | | | | 46,741 | |
| | | | |
U.S. Treasury Obligations | | | — | | | | 21,032,980 | | | | — | | | | 21,032,980 | |
| | | | |
Short-Term Investments | | | — | | | | 68,774,584 | | | | — | | | | 68,774,584 | |
| | | | |
Total Investments | | $ | 765,248 | | | $ | 355,268,137 | | | $ | — | | | $ | 356,033,385 | |
Eaton Vance
Core Plus Bond Fund
March 31, 2019
Officers and Trustees
Officers of Eaton Vance Core Plus Bond Fund
Payson F. Swaffield
President
Maureen A. Gemma
Vice President, Secretary and Chief Legal Officer
James F. Kirchner
Treasurer
Richard F. Froio
Chief Compliance Officer
Trustees of Eaton Vance Core Plus Bond Fund
William H. Park
Chairperson
Thomas E. Faust Jr.*
Mark R. Fetting
Cynthia E. Frost
George J. Gorman
Valerie A. Mosley
Helen Frame Peters
Keith Quinton(1)
Marcus L. Smith(1)
Susan J. Sutherland
Scott E. Wennerholm
| (1) | Messrs. Quinton and Smith began serving as Trustees effective October 1, 2018. |
Eaton Vance Funds
IMPORTANT NOTICES
Privacy. The Eaton Vance organization is committed to ensuring your financial privacy. Each of the financial institutions identified below has in effect the following policy (“Privacy Policy”) with respect to nonpublic personal information about its customers:
| • | | Only such information received from you, through application forms or otherwise, and information about your Eaton Vance fund transactions will be collected. This may include information such as name, address, social security number, tax status, account balances and transactions. |
| • | | None of such information about you (or former customers) will be disclosed to anyone, except as permitted by law (which includes disclosure to employees necessary to service your account). In the normal course of servicing a customer’s account, Eaton Vance may share information with unaffiliated third parties that perform various required services such as transfer agents, custodians and broker-dealers. |
| • | | Policies and procedures (including physical, electronic and procedural safeguards) are in place that are designed to protect the confidentiality of such information. |
| • | | We reserve the right to change our Privacy Policy at any time upon proper notification to you. Customers may want to review our Privacy Policy periodically for changes by accessing the link on our homepage: www.eatonvance.com. |
Our pledge of privacy applies to the following entities within the Eaton Vance organization: the Eaton Vance Family of Funds, Eaton Vance Management, Eaton Vance Investment Counsel, Eaton Vance Distributors, Inc., Eaton Vance Trust Company, Eaton Vance Management (International) Limited, Eaton Vance Advisers International Ltd., Eaton Vance Management’s Real Estate Investment Group and Boston Management and Research. In addition, our Privacy Policy applies only to those Eaton Vance customers who are individuals and who have a direct relationship with us. If a customer’s account (i.e., fund shares) is held in the name of a third-party financial advisor/broker-dealer, it is likely that only such advisor’s privacy policies apply to the customer. This notice supersedes all previously issued privacy disclosures. For more information about Eaton Vance’s Privacy Policy, please call1-800-262-1122.
Delivery of Shareholder Documents. The Securities and Exchange Commission (SEC) permits funds to deliver only one copy of shareholder documents, including prospectuses, proxy statements and shareholder reports, to fund investors with multiple accounts at the same residential or post office box address. This practice is often called “householding” and it helps eliminate duplicate mailings to shareholders.Eaton Vance, or your financial advisor, may household the mailing of your documents indefinitely unless you instruct Eaton Vance, or your financial advisor, otherwise.If you would prefer that your Eaton Vance documents not be householded, please contact Eaton Vance at1-800-262-1122, or contact your financial advisor. Your instructions that householding not apply to delivery of your Eaton Vance documents will typically be effective within 30 days of receipt by Eaton Vance or your financial advisor.
Portfolio Holdings. Each Eaton Vance Fund and its underlying Portfolio(s) (if applicable) files a schedule of portfolio holdings on Part F toForm N-PORT with the SEC for the first and third quarters of each fiscal year. The FormN-PORT will be available on the Eaton Vance website at www.eatonvance.com, by calling Eaton Vance at1-800-262-1122 or in the EDGAR database on the SEC’s website at www.sec.gov.
Proxy Voting. From time to time, funds are required to vote proxies related to the securities held by the funds. The Eaton Vance Funds or their underlying Portfolios (if applicable) vote proxies according to a set of policies and procedures approved by the Funds’ and Portfolios’ Boards. You may obtain a description of these policies and procedures and information on how the Funds or Portfolios voted proxies relating to portfolio securities during the most recent12-month period ended June 30, without charge, upon request, by calling1-800-262-1122 and by accessing the SEC’s website at www.sec.gov.
This Page Intentionally Left Blank
Investment Adviser
Boston Management and Research
Two International Place
Boston, MA 02110
Administrator
Eaton Vance Management
Two International Place
Boston, MA 02110
Principal Underwriter*
Eaton Vance Distributors, Inc.
Two International Place
Boston, MA 02110
(617)482-8260
Custodian
State Street Bank and Trust Company
State Street Financial Center, One Lincoln Street
Boston, MA 02111
Transfer Agent
BNY Mellon Investment Servicing (US) Inc.
Attn: Eaton Vance Funds
P.O. Box 9653
Providence, RI 02940-9653
(800)262-1122
Fund Offices
Two International Place
Boston, MA 02110
| * | FINRA BrokerCheck. Investors may check the background of their Investment Professional by contacting the Financial Industry Regulatory Authority (FINRA). FINRA BrokerCheck is a free tool to help investors check the professional background of current and former FINRA-registered securities firms and brokers. FINRA BrokerCheck is available by calling1-800-289-9999 and at www.FINRA.org. The FINRA BrokerCheck brochure describing this program is available to investors at www.FINRA.org. |

7768 3.31.19
Item 2. Code of Ethics
Not required in this filing.
Item 3. Audit Committee Financial Expert
Not required in this filing.
Item 4. Principal Accountant Fees and Services
Not required in this filing.
Item 5. Audit Committee of Listed Registrants
Not applicable.
Item 6. Schedule of Investments
Please see schedule of investments contained in the Report to Stockholders included under Item 1 of this FormN-CSR.
Item 7. Disclosure of Proxy Voting Policies and Procedures forClosed-End Management Investment Companies
Not applicable.
Item 8. Portfolio Managers ofClosed-End Management Investment Companies
Not applicable.
Item 9. Purchases of Equity Securities byClosed-End Management Investment Company and Affiliated Purchasers
Not applicable.
Item 10. Submission of Matters to a Vote of Security Holders
No material changes.
Item 11. Controls and Procedures
(a) It is the conclusion of the registrant’s principal executive officer and principal financial officer that the effectiveness of the registrant’s current disclosure controls and procedures (such disclosure controls and procedures having been evaluated within 90 days of the date of this filing) provide reasonable assurance that the information required to be disclosed by the registrant has been recorded, processed, summarized and reported within the time period specified in the Commission’s rules and forms and that the information required to be disclosed by the registrant has been accumulated and communicated to the registrant’s principal executive officer and principal financial officer in order to allow timely decisions regarding required disclosure.
(b) There have been no changes in the registrant’s internal controls over financial reporting during the second fiscal quarter of the period covered by this report that has materially affected, or is reasonably likely to materially affect, the registrant’s internal control over financial reporting.
Item 12. Disclosure of Securities Lending Activities forClosed-End Management Investment Companies
Not applicable.
Item 13. Exhibits
| | |
| (a)(1) | | Registrant’s Code of Ethics – Not applicable (please see Item 2). |
| |
| (a)(2)(i) | | Treasurer’s Section 302 certification. |
| |
| (a)(2)(ii) | | President’s Section 302 certification. |
| |
| (b) | | Combined Section 906 certification. |
Signatures
Pursuant to the requirements of the Securities Exchange Act of 1934 and the Investment Company Act of 1940, the registrant has duly caused this report to be signed on its behalf by the undersigned, thereunto duly authorized.
Eaton Vance Mutual Funds Trust
| | |
| By: | | /s/ Payson F. Swaffield |
| | Payson F. Swaffield |
| | President |
| |
| Date: | | May 24, 2019 |
Pursuant to the requirements of the Securities Exchange Act of 1934 and the Investment Company Act of 1940, this report has been signed below by the following persons on behalf of the registrant and in the capacities and on the dates indicated.
| | |
| By: | | /s/ James F. Kirchner |
| | James F. Kirchner |
| | Treasurer |
| |
| Date: | | May 24, 2019 |
| | |
| By: | | /s/ Payson F. Swaffield |
| | Payson F. Swaffield |
| | President |
| |
| Date: | | May 24, 2019 |