UNITED STATES
SECURITIES AND EXCHANGE COMMISSION
Washington, D.C. 20549
Form N-CSR
CERTIFIED SHAREHOLDER REPORT OF REGISTERED
MANAGEMENT INVESTMENT COMPANIES
Investment Company Act File Number: 811-04015
Eaton Vance Mutual Funds Trust
(Exact Name of Registrant as Specified in Charter)
Two International Place, Boston, Massachusetts 02110
(Address of Principal Executive Offices)
Deidre E. Walsh
Two International Place, Boston, Massachusetts 02110
(Name and Address of Agent for Services)
(617) 482-8260
(Registrant’s Telephone Number)
September 30
Date of Fiscal Year End
September 30, 2021
Date of Reporting Period
Item 1. Reports to Stockholders

Eaton Vance
Total Return Bond Fund
(formerly, Eaton Vance Core Plus Bond Fund)
Annual Report
September 30, 2021

Commodity Futures Trading Commission Registration. The Commodity Futures Trading Commission (“CFTC”) has adopted regulations that subject registered investment companies and advisers to regulation by the CFTC if a fund invests more than a prescribed level of its assets in certain CFTC-regulated instruments (including futures, certain options and swap agreements) or markets itself as providing investment exposure to such instruments. The investment adviser has claimed an exclusion from the definition of “commodity pool operator” under the Commodity Exchange Act with respect to its management of the Fund. Accordingly, neither the Fund nor the adviser with respect to the operation of the Fund is subject to CFTC regulation. Because of its management of other strategies, the Fund’s adviser is registered with the CFTC as a commodity pool operator. The adviser is also registered as a commodity trading advisor.
Fund shares are not insured by the FDIC and are not deposits or other obligations of, or guaranteed by, any depository institution. Shares are subject to investment risks, including possible loss of principal invested.
This report must be preceded or accompanied by a current summary prospectus or prospectus. Before investing, investors should consider carefully the investment objective, risks, and charges and expenses of a mutual fund. This and other important information is contained in the summary prospectus and prospectus, which can be obtained from a financial intermediary. Prospective investors should read the prospectus carefully before investing. For further information, please call 1-800-262-1122.
Annual Report September 30, 2021
Eaton Vance
Total Return Bond Fund
Eaton Vance
Total Return Bond Fund
September 30, 2021
Management’s Discussion of Fund Performance1
Economic and Market Conditions
After the U.S. Federal Reserve (the Fed) met in late September 2021, Fed Chair Jerome Powell noted that “The path of the economy continues to depend on the course of the [COVID-19] virus, and risks to the economic outlook remain.” For fixed-income investors, this reflected the dominant investment theme for the 12-month period ended September 30, 2021.
Throughout the period, performance of fixed-income asset classes ebbed and flowed as the virus advanced and retreated, with a second wave of COVID-19 washing over the U.S. and global economies in the winter of 2020-2021 and a third wave known as the Delta variant spreading around the world in the summer of 2021.
For the period as a whole, however, U.S. fixed-income investors appeared to focus on the reopening of the economy and its recovery from a near-shutdown in the early days of the pandemic. The asset classes that fared best during the period were those that stood to benefit from a U.S. and global economic revival. So-called “safe-haven” assets, in contrast, fared poorly as investors appeared to become more comfortable taking on increased risk during the period.
As a result, U.S. Treasurys were one of the worst-performing fixed-income asset classes during the period, with the Bloomberg U.S. Treasury Index returning -3.30% for the period. The Bloomberg U.S. Aggregate Bond Index, a broad measure of the U.S. fixed-income market, was also dragged down by its Treasury component, and returned -0.90% for the period.
Investment-grade corporate bonds fared better. The Bloomberg U.S. Corporate Bond Index returned 1.74% for the period, as factories and businesses reopened and consumers — a key driver of the U.S. economy — rushed to spend the money they had saved while confined at home earlier in the pandemic.
High yield bonds were a standout asset class during the period. Several industries prominent within the high yield space — including airlines, restaurants, retail, and travel & leisure — were among the hardest-hit businesses early in the pandemic and the biggest beneficiaries of the subsequent economic recovery. Reflecting investors’ increasing confidence in the recovery, as well as their search for yield in a historically low-yield environment, the Bloomberg U.S. Corporate High Yield Index returned 11.28% for the one-year period.
Fund Performance
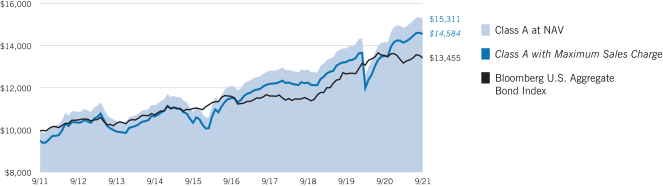
For the 12-month period ended September 30, 2021, Eaton Vance Total Return Bond Fund (the Fund) returned 7.72% for Class A shares at net asset value (NAV), outperforming its benchmark, the Bloomberg U.S. Aggregate Bond Index (the Index), which returned -0.90%.
The Fund’s outperformance versus the Index was driven largely by security selections in investment-grade corporate bonds, the Fund’s largest allocation; and security selections and overweight positions relative to the Index in non-agency commercial mortgage-backed securities (CMBS), asset-backed securities (ABS), and high yield corporate bonds.
Early in the period, the Fund was invested in investment-grade corporate bonds in some of the industries most affected by the global pandemic — notably the retail and travel & leisure industries — in anticipation of an economic recovery. When consumer spending in those industries snapped back during the first three quarters of 2021, the Fund’s investments outperformed the Index. The Fund’s holdings in investment-grade corporate bonds were lower in credit quality on average than those of the Index during a period when lower credit-quality bonds generally outperformed higher quality bonds.
The same pandemic-related slowdowns and subsequent business recovery also drove the Fund’s outperformance versus the Index with respect to non-agency CMBS. The Fund benefited from exposure to high-performing malls as the economy reopened and commercial tenants began paying rents again.
With regard to ABS, the Fund was positioned in lower credit-quality bonds than the Index, which held primarily AAA rated ABS. Here again, the Fund invested in consumer and commercial debt that management believed could benefit from an economic recovery. Those investments outperformed the Index as the recovery continued during the period.
The economic recovery theme drove the Fund’s outperformance versus the Index in the high yield corporate bond asset class as well. The Fund’s emphasis on airline and energy company debt contributed to performance versus the Index, as both industries recovered during the period from low demand and falling prices earlier in the pandemic. Although minimal, the Fund’s derivative holdings also had a positive effect on Fund performance versus the Index during the period.
In contrast, the Fund’s underweight position and security selections in agency MBS — bonds issued by mortgage providers Fannie Mae, Freddie Mac, and Ginnie Mae — detracted from performance versus the Index. While the asset class delivered negative returns during the period, it nonetheless outperformed the Index. Not owning municipal bonds also detracted modestly from Fund performance versus the Index during the period.
See Endnotes and Additional Disclosures in this report.
Past performance is no guarantee of future results. Returns are historical and are calculated by determining the percentage change in net asset value (NAV) or offering price (as applicable) with all distributions reinvested. Investment return and principal value will fluctuate so that shares, when redeemed, may be worth more or less than their original cost. Performance for periods less than or equal to one year is cumulative. Performance is for the stated time period only; due to market volatility, current Fund performance may be lower or higher than the quoted return. For performance as of the most recent month-end, please refer to eatonvance.com.
Eaton Vance
Total Return Bond Fund
September 30, 2021
Performance2,3
Portfolio Managers Matthew T. Buckley, CFA, John H. Croft, CFA and Vishal Khanduja, CFA
| | | | | | | | | | | | | | | | | | | | |
| % Average Annual Total Returns | | Class
Inception Date | | | Performance
Inception Date | | | One Year | | | Five Years | | | Ten Years | |
| | | | | |
Class A at NAV | | | 11/17/2009 | | | | 11/17/2009 | | | | 7.72 | % | | | 4.80 | % | | | 4.35 | % |
Class A with 4.75% Maximum Sales Charge | | | — | | | | — | | | | 2.60 | | | | 3.78 | | | | 3.84 | |
Class C at NAV | | | 11/17/2009 | | | | 11/17/2009 | | | | 6.83 | | | | 4.02 | | | | 3.56 | |
Class C with 1% Maximum Sales Charge | | | — | | | | — | | | | 5.83 | | | | 4.02 | | | | 3.56 | |
Class I at NAV | | | 11/17/2009 | | | | 11/17/2009 | | | | 8.00 | | | | 5.06 | | | | 4.59 | |
|
| |
| | | | | |
Bloomberg U.S. Aggregate Bond Index | | | — | | | | — | | | | –0.90 | % | | | 2.94 | % | | | 3.01 | % |
| | | | | |
| % Total Annual Operating Expense Ratios4 | | | | | | | | Class A | | | Class C | | | Class I | |
| | | | | |
Gross | | | | | | | | | | | 0.85 | % | | | 1.60 | % | | | 0.60 | % |
Net | | | | | | | | | | | 0.74 | | | | 1.49 | | | | 0.49 | |
Growth of $10,000
This graph shows the change in value of a hypothetical investment of $10,000 in Class A of the Fund for the period indicated. For comparison, the same investment is shown in the indicated index.
| | | | | | | | | | | | | | | | |
| Growth of Investment | | Amount Invested | | | Period Beginning | | | At NAV | | | With Maximum Sales Charge | |
| | | | |
Class C | | | $10,000 | | | | 09/30/2011 | | | | $14,198 | | | | N.A. | |
Class I | | | $250,000 | | | | 09/30/2011 | | | | $391,804 | | | | N.A. | |
See Endnotes and Additional Disclosures in this report.
Past performance is no guarantee of future results. Returns are historical and are calculated by determining the percentage change in net asset value (NAV) or offering price (as applicable) with all distributions reinvested. Investment return and principal value will fluctuate so that shares, when redeemed, may be worth more or less than their original cost. Performance for periods less than or equal to one year is cumulative. Performance is for the stated time period only; due to market volatility, current Fund performance may be lower or higher than the quoted return. For performance as of the most recent month-end, please refer to eatonvance.com.
Eaton Vance
Total Return Bond Fund
September 30, 2021
Fund Profile
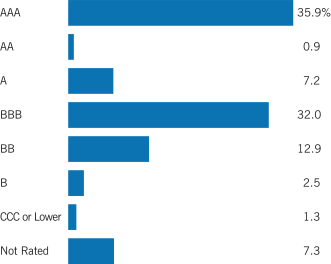
Credit Quality (% of bond holdings)5
Asset Allocation (% of total investments)6
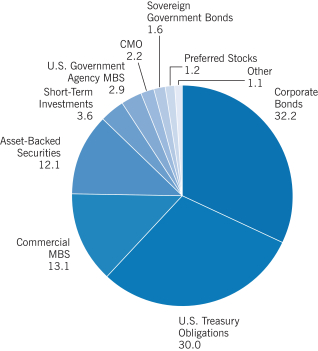
MBS refers to Mortgage-Backed Securities
CMO refers to Collateralized Mortgage Obligations
See Endnotes and Additional Disclosures in this report.
Eaton Vance
Total Return Bond Fund
September 30, 2021
Endnotes and Additional Disclosures
| 1 | The views expressed in this report are those of the portfolio manager(s) and are current only through the date stated at the top of this page. These views are subject to change at any time based upon market or other conditions, and Eaton Vance and the Fund(s) disclaim any responsibility to update such views. These views may not be relied upon as investment advice and, because investment decisions are based on many factors, may not be relied upon as an indication of trading intent on behalf of any Eaton Vance fund. This commentary may contain statements that are not historical facts, referred to as “forward-looking statements.” The Fund’s actual future results may differ significantly from those stated in any forward-looking statement, depending on factors such as changes in securities or financial markets or general economic conditions, the volume of sales and purchases of Fund shares, the continuation of investment advisory, administrative and service contracts, and other risks discussed from time to time in the Fund’s filings with the Securities and Exchange Commission. |
| 2 | Bloomberg U.S. Aggregate Bond Index is an unmanaged index of domestic investment-grade bonds, including corporate, government and mortgage-backed securities. Unless otherwise stated, index returns do not reflect the effect of any applicable sales charges, commissions, expenses, taxes or leverage, as applicable. It is not possible to invest directly in an index. |
| 3 | Total Returns at NAV do not include applicable sales charges. If sales charges were deducted, the returns would be lower. Total Returns shown with maximum sales charge reflect the stated maximum sales charge. Unless otherwise stated, performance does not reflect the deduction of taxes on Fund distributions or redemptions of Fund shares. |
Effective May 1, 2015, the Fund changed its investment objective and policies. Prior to May 1, 2015, the Fund invested primarily in Build America Bonds. Performance prior to May 1, 2015 reflects the Fund’s performance under its former investment objective and policies.
| 4 | Source: Fund prospectus. Net expense ratios reflect a contractual expense reimbursement that continues through 1/31/22. Without the reimbursement, performance would have been lower. The expense ratios for the current reporting period can be found in the Financial Highlights section of this report. |
| 5 | For purposes of the Fund’s rating restrictions, ratings are based on Moody’s Investors Service, Inc. (“Moody’s”), S&P Global Ratings (“S&P”) or Fitch Ratings (“Fitch”), as applicable. If securities are rated differently by the ratings agencies, the highest rating is applied. Ratings, which are subject to change, apply to the creditworthiness of the issuers of the underlying securities and not to the Fund or its shares. Credit ratings measure the quality of a bond based on the issuer’s creditworthiness, with ratings ranging from AAA, being the highest, to D, being the lowest based on S&P’s measures. Ratings of BBB or higher by S&P or Fitch (Baa or higher by Moody’s) are considered to be investment-grade quality. Credit ratings are based largely on the ratings agency’s analysis at the time of rating. The rating assigned to any particular security is not necessarily a reflection of the issuer’s current financial condition and does not necessarily reflect its assessment of the volatility of a security’s market value or of the liquidity of an investment in the security. Holdings designated as “Not Rated” (if any) are not rated by the national ratings agencies stated above. |
| 6 | Other, if any, represents any investment type less than 1% of total investments. |
Fund profile subject to change due to active management.
Additional Information
Bloomberg U.S. Treasury Index measures the performance of U.S. Treasuries with a maturity of one year or more. Bloomberg U.S. Corporate Bond Index measures the performance of investment-grade U.S. corporate securities with a maturity of one year or more. Bloomberg U.S. Corporate High Yield Index measures USD-denominated, non-investment grade corporate securities.
Important Notice to Shareholders
Effective November 15, 2021, the name of Eaton Vance Core Plus Bond Fund was changed to Eaton Vance Total Return Bond Fund.
Effective August 24, 2021, the Bloomberg Barclays fixed income indices were rebranded as Bloomberg indices.
Eaton Vance
Total Return Bond Fund
September 30, 2021
Fund Expenses
Example: As a Fund shareholder, you incur two types of costs: (1) transaction costs, including sales charges (loads) on purchases and redemption fees (if applicable); and (2) ongoing costs, including management fees; distribution and/or service fees; and other Fund expenses. This Example is intended to help you understand your ongoing costs (in dollars) of Fund investing and to compare these costs with the ongoing costs of investing in other mutual funds. The Example is based on an investment of $1,000 invested at the beginning of the period and held for the entire period (April 1, 2021 – September 30, 2021).
Actual Expenses: The first section of the table below provides information about actual account values and actual expenses. You may use the information in this section, together with the amount you invested, to estimate the expenses that you paid over the period. Simply divide your account value by $1,000 (for example, an $8,600 account value divided by $1,000 = 8.6), then multiply the result by the number in the first section under the heading entitled “Expenses Paid During Period” to estimate the expenses you paid on your account during this period.
Hypothetical Example for Comparison Purposes: The second section of the table below provides information about hypothetical account values and hypothetical expenses based on the actual Fund expense ratio and an assumed rate of return of 5% per year (before expenses), which is not the actual Fund return. The hypothetical account values and expenses may not be used to estimate the actual ending account balance or expenses you paid for the period. You may use this information to compare the ongoing costs of investing in your Fund and other funds. To do so, compare this 5% hypothetical example with the 5% hypothetical examples that appear in the shareholder reports of the other funds.
Please note that the expenses shown in the table are meant to highlight your ongoing costs only and do not reflect any transactional costs, such as sales charges (loads) or redemption fees (if applicable). Therefore, the second section of the table is useful in comparing ongoing costs only, and will not help you determine the relative total costs of owning different funds. In addition, if these transactional costs were included, your costs would be higher.
| | | | | | | | | | | | | | | | |
| | | Beginning
Account Value
(4/1/21) | | | Ending
Account Value
(9/30/21) | | | Expenses Paid
During Period*
(4/1/21 – 9/30/21) | | | Annualized
Expense
Ratio | |
| | | | |
Actual | | | | | | | | | | | | | | | | |
Class A | | $ | 1,000.00 | | | $ | 1,029.00 | | | $ | 3.76 | ** | | | 0.74 | % |
Class C | | $ | 1,000.00 | | | $ | 1,025.20 | | | $ | 7.56 | ** | | | 1.49 | % |
Class I | | $ | 1,000.00 | | | $ | 1,030.30 | | | $ | 2.49 | ** | | | 0.49 | % |
| | | | | |
Hypothetical | | | | | | | | | | | | | | | | |
(5% return per year before expenses) | | | | | | | | | | | | | | | | |
Class A | | $ | 1,000.00 | | | $ | 1,021.40 | | | $ | 3.75 | ** | | | 0.74 | % |
Class C | | $ | 1,000.00 | | | $ | 1,017.60 | | | $ | 7.54 | ** | | | 1.49 | % |
Class I | | $ | 1,000.00 | | | $ | 1,022.60 | | | $ | 2.48 | ** | | | 0.49 | % |
| * | Expenses are equal to the Fund’s annualized expense ratio for the indicated Class, multiplied by the average account value over the period, multiplied by 183/365 (to reflect the one-half year period). The Example assumes that the $1,000 was invested at the net asset value per share determined at the close of business on March 31, 2021. |
| ** | Absent an allocation of certain expenses to an affiliate, expenses would be higher. |
Eaton Vance
Total Return Bond Fund
September 30, 2021
Portfolio of Investments
| | | | | | | | | | |
| Asset-Backed Securities — 12.4% | |
| Security | | | | Principal
Amount
(000’s omitted) | | | Value | |
| | | |
Aaset Trust, Series 2019-2, Class B, 4.458%, 10/16/39(1) | | | | $ | 3,084 | | | $ | 2,647,665 | |
| | | |
ARI Fleet Lease Trust, Series 2018-B, Class A2, 3.22%, 8/16/27(1) | | | | | 113 | | | | 113,078 | |
| | | |
Avant Credit Card Master Trust, Series 2021-1A, Class A, 1.37%, 4/15/27(1) | | | | | 1,450 | | | | 1,448,331 | |
| | | |
Business Jet Securities, LLC,
Series 2020-1A, Class A, 2.981%, 11/15/35(1) | | | | | 1,073 | | | | 1,089,008 | |
| | | |
| Chase Auto Credit Linked Notes: | | | | | | | | |
| | | |
Series 2021-3, Class D, 1.009%, 2/26/29(1) | | | | | 1,266 | | | | 1,266,048 | |
| | | |
Series 2021-3, Class E, 2.102%, 2/26/29(1) | | | | | 744 | | | | 744,188 | |
| | | |
Coinstar Funding, LLC, Series 2017-1A, Class A2, 5.216%, 4/25/47(1) | | | | | 6,024 | | | | 6,040,488 | |
| | | |
| Conn’s Receivables Funding, LLC: | | | | | | | | |
| | | |
Series 2020-A, Class B, 4.27%, 6/16/25(1) | | | | | 1,637 | | | | 1,648,097 | |
| | | |
Series 2020-A, Class C, 4.20%, 6/16/25(1) | | | | | 1,842 | | | | 1,848,182 | |
| | | |
Diamond Infrastructure Funding, LLC, Series 2021-1A, Class C, 3.475%, 4/15/49(1) | | | | | 992 | | | | 994,708 | |
| | | |
Driven Brands Funding, LLC,
Series 2019-2A, Class A2, 3.981%, 10/20/49(1) | | | | | 3,232 | | | | 3,408,467 | |
| | | |
| ExteNet LLC: | | | | | | | | |
| | | |
Series 2019-1A, Class A2, 3.204%, 7/26/49(1) | | | | | 2,475 | | | | 2,542,319 | |
| | | |
Series 2019-1A, Class B, 4.14%, 7/26/49(1) | | | | | 2,730 | | | | 2,821,683 | |
| | | |
Series 2019-1A, Class C, 5.219%, 7/26/49(1) | | | | | 2,090 | | | | 2,174,772 | |
| | | |
| Falcon Aerospace, Ltd.: | | | | | | | | |
| | | |
Series 2019-1, Class B, 4.791%, 9/15/39(1) | | | | | 4,067 | | | | 3,850,055 | |
| | | |
Series 2019-1, Class C, 6.656%, 9/15/39(1) | | | | | 2,779 | | | | 2,489,729 | |
| | | |
FOCUS Brands Funding, LLC, Series 2017-1A, Class A2IB, 3.857%, 4/30/47(1) | | | | | 2,772 | | | | 2,851,968 | |
| | | |
Foundation Finance Trust, Series 2017-1A, Class A, 3.30%, 7/15/33(1) | | | | | 101 | | | | 101,945 | |
| | | |
Hertz Vehicle Financing, LLC,
Series 2021-1A, Class D, 3.98%, 12/26/25(1) | | | | | 5,000 | | | | 5,044,916 | |
| | | |
Horizon Aircraft Finance II, Ltd., Series 2019-1, Class A, 3.721%, 7/15/39(1) | | | | | 2,052 | | | | 2,061,665 | |
| | | |
Jack in the Box Funding, LLC, Series 2019-1A, Class A2I, 3.982%, 8/25/49(1) | | | | | 1,226 | | | | 1,255,459 | |
| | | |
LL ABS Trust, Series 2020-1A, Class A, 2.33%, 1/17/28(1) | | | | | 139 | | | | 139,732 | |
| | | |
| Lunar Aircraft, Ltd.: | | | | | | | | |
| | | |
Series 2020-1A, Class B, 4.335%, 2/15/45(1) | | | | | 674 | | | | 628,829 | |
| | | |
Series 2020-1A, Class C, 6.413%, 2/15/45(1) | | | | | 275 | | | | 229,781 | |
| | | |
Marlette Funding Trust, Series 2020-2A, Class B, 1.83%, 9/16/30(1) | | | | | 1,305 | | | | 1,311,608 | |
| | | |
| Mosaic Solar Loan Trust: | | | | | | | | |
| | | |
Series 2019-2A, Class B, 3.28%, 9/20/40(1) | | | | | 2,586 | | | | 2,682,195 | |
| | | |
Series 2020-1A, Class C, 4.47%, 4/20/46(1) | | | | | 1,083 | | | | 1,100,834 | |
| | | | | | | | | | |
| Security | | | | Principal
Amount
(000’s omitted) | | | Value | |
| | | |
MVW, LLC, Series 2020-1A, Class A, 1.74%, 10/20/37(1) | | | | $ | 421 | | | $ | 426,445 | |
| | | |
Neighborly Issuer, LLC, Series 2021-1A, Class A2, 3.584%, 4/30/51(1) | | | | | 2,499 | | | | 2,587,979 | |
| | | |
NRZ Excess Spread-Collateralized Note, Series 2021-FHT1, Class A, 3.104%, 7/25/26(1) | | | | | 621 | | | | 624,325 | |
| | | |
Oportun Issuance Trust, Series 2021-B, Class C, 3.65%, 5/8/31(1) | | | | | 496 | | | | 498,811 | |
| | | |
| Pagaya AI Debt Selection Trust: | | | | | | | | |
| | | |
Series 2021-2, 3.00%, 1/25/29(1) | | | | | 2,264 | | | | 2,282,910 | |
| | | |
Series 2021-3, Class C, 3.27%, 5/15/29(1) | | | | | 5,900 | | | | 5,920,246 | |
| | | |
| Planet Fitness Master Issuer, LLC: | | | | | | | | |
| | | |
Series 2018-1A, Class A2I, 4.262%, 9/5/48(1) | | | | | 3,589 | | | | 3,604,848 | |
| | | |
Series 2019-1A, Class A2, 3.858%, 12/5/49(1) | | | | | 2,397 | | | | 2,442,289 | |
| | | |
| ServiceMaster Funding, LLC: | | | | | | | | |
| | | |
Series 2020-1, Class A2I, 2.841%, 1/30/51(1) | | | | | 667 | | | | 681,946 | |
| | | |
Series 2020-1, Class A2II, 3.337%, 1/30/51(1) | | | | | 780 | | | | 811,688 | |
| | | |
SERVPRO Master Issuer, LLC, Series 2019-1A, Class A2, 3.882%, 10/25/49(1) | | | | | 3,812 | | | | 3,995,983 | |
| | | |
Small Business Lending Trust, Series 2020-A, Class A, 2.62%, 12/15/26(1) | | | | | 278 | | | | 278,995 | |
| | | |
Sonic Capital, LLC, Series 2020-1A, Class A2I, 3.845%, 1/20/50(1) | | | | | 3,872 | | | | 4,089,759 | |
| | | |
| Stack Infrastructure Issuer, LLC: | | | | | | | | |
| | | |
Series 2019-1A, Class A2, 4.54%, 2/25/44(1) | | | | | 2,957 | | | | 3,112,548 | |
| | | |
Series 2019-2A, Class A2, 3.08%, 10/25/44(1) | | | | | 1,135 | | | | 1,166,606 | |
| | | |
| Sunnova Helios II Issuer, LLC: | | | | | | | | |
| | | |
Series 2019-AA, Class C, 5.32%, 6/20/46(1) | | | | | 1,031 | | | | 1,079,078 | |
| | | |
Series 2021-A, Class B, 3.15%, 2/20/48(1) | | | | | 2,312 | | | | 2,301,684 | |
| | | |
| Theorem Funding Trust: | | | | | | | | |
| | | |
Series 2020-1A, Class A, 2.48%, 10/15/26(1) | | | | | 449 | | | | 451,230 | |
| | | |
Series 2021-1A, Class B, 1.84%, 12/15/27(1) | | | | | 2,461 | | | | 2,455,798 | |
| | | |
| Vantage Data Centers Issuer, LLC: | | | | | | | | |
| | | |
Series 2018-2A, Class A2, 4.196%, 11/16/43(1) | | | | | 972 | | | | 1,011,098 | |
| | | |
Series 2020-2A, Class A2, 1.992%, 9/15/45(1) | | | | | 2,935 | | | | 2,923,294 | |
| | | |
| Willis Engine Structured Trust: | | | | | | | | |
| | | |
Series 2020-A, Class B, 4.212%, 3/15/45(1) | | | | | 1,658 | | | | 1,577,446 | |
| | | |
Series 2020-A, Class C, 6.657%, 3/15/45(1) | | | | | 773 | | | | 566,473 | |
| |
Total Asset-Backed Securities
(identified cost $97,363,841) | | | $ | 97,427,229 | |
|
| Collateralized Mortgage Obligations — 2.2% | |
| Security | | | | Principal
Amount
(000’s omitted) | | | Value | |
| | | |
Federal Home Loan Mortgage Corp. Structured Agency
Credit Risk Debt Notes: | | | | | | | | |
| | | |
Series 2018-DNA1, Class M2, 1.886%, (1 mo. USD LIBOR + 1.80%),
7/25/30(2) | | | | $ | 3,727 | | | $ | 3,760,880 | |
| | | | |
| | 7 | | See Notes to Financial Statements. |
Eaton Vance
Total Return Bond Fund
September 30, 2021
Portfolio of Investments — continued
| | | | | | | | | | | | |
| Security | | | | | Principal
Amount
(000’s omitted) | | | Value | |
| | | |
Federal Home Loan Mortgage Corp. Structured Agency
Credit Risk Debt Notes: (continued) | | | | | | | | | |
| | | |
Series 2018-DNA1, Class M2AT, 1.136%, (1 mo. USD LIBOR + 1.05%),
7/25/30(2) | | | | | | $ | 1,807 | | | $ | 1,802,228 | |
| | | |
Series 2019-DNA3, Class M2, 2.136%, (1 mo. USD LIBOR + 2.05%),
7/25/49(1)(2) | | | | | | | 3,388 | | | | 3,433,205 | |
| | | |
Series 2019-DNA4, Class M2, 2.036%, (1 mo. USD LIBOR + 1.95%),
10/25/49(1)(2) | | | | | | | 940 | | | | 945,324 | |
| | | |
Series 2019-HQA1, Class M2, 2.436%, (1 mo. USD LIBOR + 2.35%),
2/25/49(1)(2) | | | | | | | 3,258 | | | | 3,287,125 | |
| | | |
| | | | | | | | | | | $ | 13,228,762 | |
| | | |
Federal National Mortgage Association Connecticut
Avenue Securities: | | | | | | | | | |
| | | |
Series 2018-C06, Class 1M2, 2.086%, (1 mo. USD LIBOR + 2.00%),
3/25/31(2) | | | | | | $ | 1,261 | | | $ | 1,273,921 | |
| | | |
Series 2018-R07, Class 1M2, 2.486%, (1 mo. USD LIBOR + 2.40%),
4/25/31(1)(2) | | | | | | | 1,050 | | | | 1,055,459 | |
| | | |
Series 2019-R02, Class 1M2, 2.386%, (1 mo. USD LIBOR + 2.30%),
8/25/31(1)(2) | | | | | | | 670 | | | | 675,602 | |
| | | |
Series 2019-R05, Class 1M2, 2.086%, (1 mo. USD LIBOR + 2.00%),
7/25/39(1)(2) | | | | | | | 274 | | | | 275,181 | |
| | | |
| | | | | | | | | | | $ | 3,280,163 | |
| | | |
Oaktown Re VI Ltd., Series 2021-1A, Class M1B, 2.10%, (30-day average SOFR + 2.05%), 10/25/33(1)(2) | | | | | | $ | 1,000 | | | | 1,017,686 | |
| | | |
| | | | | | | | | | | $ | 1,017,686 | |
| |
Total Collateralized Mortgage Obligations
(identified cost $17,126,511) | | | $ | 17,526,611 | |
|
| Commercial Mortgage-Backed Securities — 13.5% | |
| Security | | | | | Principal
Amount
(000’s omitted) | | | Value | |
| | | |
| BAMLL Commercial Mortgage Securities Trust: | | | | | | | | | |
| | | |
Series 2019-BPR, Class ENM, 3.843%, 11/5/32(1)(3) | | | | | | $ | 7,255 | | | $ | 6,993,296 | |
| | | |
Series 2019-BPR, Class FNM, 3.843%, 11/5/32(1)(3) | | | | | | | 7,215 | | | | 6,183,805 | |
| | | |
| BX Commercial Mortgage Trust: | | | | | | | | | |
| | | |
Series 2021-VOLT, Class C, 1.184%, (1 mo. USD LIBOR + 1.10%),
9/15/36(1)(2) | | | | | | | 1,469 | | | | 1,472,374 | |
| | | |
Series 2021-VOLT, Class D, 1.734%, (1 mo. USD LIBOR + 1.65%),
9/15/36(1)(2) | | | | | | | 5,474 | | | | 5,489,223 | |
| | | |
| CFCRE Commercial Mortgage Trust: | | | | | | | | | |
| | | |
Series 2016-C3, Class D, 3.052%, 1/10/48(1)(3) | | | | | | | 1,500 | | | | 1,170,778 | |
| | | |
Series 2016-C7, Class D, 4.555%, 12/10/54(1)(3) | | | | | | | 1,725 | | | | 1,569,314 | |
| | | |
CGMS Commercial Mortgage Trust, Series 2017-MDRB, Class C, 2.584%, (1 mo. USD LIBOR + 2.50%), 7/15/30(1)(2) | | | | | | | 1,000 | | | | 983,867 | |
| | | | | | | | | | |
| Security | | | | Principal
Amount
(000’s omitted) | | | Value | |
| | | |
| Citigroup Commercial Mortgage Trust: | | | | | | | | |
| | | |
Series 2017-MDRC, Class C, 1.384%, (1 mo. USD LIBOR + 1.30%), 7/15/30(1)(2) | | | | $ | 1,850 | | | $ | 1,821,558 | |
| | | |
Series 2017-MDRC, Class D, 2.334%, (1 mo. USD LIBOR + 2.25%), 7/15/30(1)(2) | | | | | 1,600 | | | | 1,558,937 | |
| | | |
| COMM Mortgage Trust: | | | | | | | | |
| | | |
Series 2013-CR11, Class D, 5.285%, 8/10/50(1)(3) | | | | | 3,603 | | | | 3,586,326 | |
| | | |
Series 2015-CR22, Class D, 4.244%, 3/10/48(1)(3) | | | | | 2,324 | | | | 2,351,261 | |
| | | |
Credit Suisse Mortgage Trust, Series 2016-NXSR, Class D, 4.50%, 12/15/49(1)(3) | | | | | 2,000 | | | | 1,636,176 | |
| | | |
| Extended Stay America Trust: | | | | | | | | |
| | | |
Series 2021-ESH, Class C, 1.784%, (1 mo. USD LIBOR + 1.70%), 7/15/38(1)(2) | | | | | 3,160 | | | | 3,187,707 | |
| | | |
Series 2021-ESH, Class D, 2.334%, (1 mo. USD LIBOR + 2.25%), 7/15/38(1)(2) | | | | | 2,635 | | | | 2,663,018 | |
| | | |
Federal National Mortgage Association Multifamily
Connecticut Avenue Securities Trust: | | | | | | | | |
| | | |
Series 2019-01, Class M7, 1.786%, (1 mo. USD LIBOR + 1.70%), 10/15/49(1)(2) | | | | | 674 | | | | 674,935 | |
| | | |
Series 2019-01, Class M10, 3.336%, (1 mo. USD LIBOR + 3.25%), 10/15/49(1)(2) | | | | | 905 | | | | 915,434 | |
| | | |
Series 2020-01, Class M10, 3.836%, (1 mo. USD LIBOR + 3.75%), 3/25/50(1)(2) | | | | | 3,245 | | | | 3,374,695 | |
| | | |
FMC GMSR Issuer Trust, Series 2021-GT1, Class A, 3.62%, 7/25/26(1)(3) | | | | | 2,285 | | | | 2,285,132 | |
| | | |
| JPMBB Commercial Mortgage Securities Trust: | | | | | | | | |
| | | |
Series 2014-C22, Class D, 4.705%, 9/15/47(1)(3) | | | | | 1,980 | | | | 1,538,526 | |
| | | |
Series 2014-C25, Class D, 4.089%, 11/15/47(1)(3) | | | | | 3,575 | | | | 2,889,957 | |
| | | |
Series 2015-C29, Class D, 3.838%, 5/15/48(3) | | | | | 500 | | | | 414,270 | |
| | | |
JPMorgan Chase Commercial Mortgage Securities
Trust: | | | | | | | | |
| | | |
Series 2011-C5, Class D, 5.752%, 8/15/46(1)(3) | | | | | 1,021 | | | | 1,014,636 | |
| | | |
Series 2013-C16, Class D, 5.189%, 12/15/46(1)(3) | | | | | 1,500 | | | | 1,547,752 | |
| | | |
Series 2014-DSTY, Class B, 3.771%, 6/10/27(1) | | | | | 1,384 | | | | 421,428 | |
| | | |
| Morgan Stanley Bank of America Merrill Lynch Trust: | | | | | | | | |
| | | |
Series 2016-C29, Class C, 4.891%, 5/15/49(3)(4) | | | | | 4,199 | | | | 4,420,922 | |
| | | |
Series 2016-C29, Class D, 3.00%, 5/15/49(1)(4) | | | | | 7,048 | | | | 6,171,758 | |
| | | |
Series 2016-C32, Class D, 3.396%,
12/15/49(1)(3)(4) | | | | | 5,000 | | | | 4,156,243 | |
| | | |
| Morgan Stanley Capital I Trust: | | | | | | | | |
| | | |
Series 2016-UBS12, Class D, 3.312%,
12/15/49(1)(4) | | | | | 7,150 | | | | 4,135,435 | |
| | | |
Series 2019-BPR, Class B, 2.184%, (1 mo. USD LIBOR + 2.10%),
5/15/36(1)(2)(4) | | | | | 3,960 | | | | 3,760,855 | |
| | | |
Series 2019-BPR, Class C, 3.134%, (1 mo. USD LIBOR + 3.05%),
5/15/36(1)(2)(4) | | | | | 1,540 | | | | 1,388,682 | |
| | | |
| Motel 6 Trust: | | | | | | | | |
| | | |
Series 2021-MTL6, Class B, 1.284%, (1 mo. USD LIBOR + 1.20%), 9/15/38(1)(2) | | | | | 1,260 | | | | 1,263,318 | |
| | | |
Series 2021-MTL6, Class D, 2.184%, (1 mo. USD LIBOR + 2.10%), 9/15/38(1)(2) | | | | | 457 | | | | 458,587 | |
| | | | |
| | 8 | | See Notes to Financial Statements. |
Eaton Vance
Total Return Bond Fund
September 30, 2021
Portfolio of Investments — continued
| | | | | | | | | | | | |
| Security | | | | | Principal
Amount
(000’s omitted) | | | Value | |
| | | |
Natixis Commercial Mortgage Securities Trust, Series 2018-FL1, Class C, 2.284%, (1 mo. USD LIBOR + 2.20%), 6/15/35(1)(2) | | | | | | $ | 3,219 | | | $ | 2,898,644 | |
| | | |
Toorak Mortgage Corp., Ltd., Series 2020-1, Class A1, 2.734% to 1/25/23, 3/25/23(1)(5) | | | | | | | 3,160 | | | | 3,177,686 | |
| | | |
UBS-Barclays Commercial Mortgage Trust, Series 2013-C6, Class D, 4.448%, 4/10/46(1)(3) | | | | | | | 2,000 | | | | 1,762,992 | |
| | | |
| Wells Fargo Commercial Mortgage Trust: | | | | | | | | | |
| | | |
Series 2015-C31, Class D, 3.852%, 11/15/48 | | | | | | | 5,598 | | | | 5,205,425 | |
| | | |
Series 2016-C35, Class D, 3.142%, 7/15/48(1) | | | | | | | 2,150 | | | | 1,845,329 | |
| | | |
Series 2016-C36, Class D, 2.942%, 11/15/59(1) | | | | | | | 6,000 | | | | 4,597,682 | |
| | | |
WF-RBS Commercial Mortgage Trust, Series 2014-C24, Class D, 3.692%, 11/15/47(1) | | | | | | | 4,150 | | | | 2,237,020 | |
| | | |
| ZH Trust: | | | | | | | | | |
| | | |
Series 2021-1, Class A, 2.253%, 2/18/27(1) | | | | | | | 1,560 | | | | 1,565,622 | |
| | | |
Series 2021-2, Class A, 2.349%, 10/17/27(1)(6) | | | | | | | 1,001 | | | | 1,005,697 | |
| |
Total Commercial Mortgage-Backed Securities
(identified cost $105,973,572) | | | $ | 105,796,302 | |
|
| Convertible Bonds — 0.5% | |
| Security | | | | | Principal
Amount
(000’s omitted) | | | Value | |
|
| Semiconductors — 0.5% | |
| | | |
ams AG, 0.875%, 9/28/22(7) | | | | | | $ | 4,400 | | | $ | 4,319,348 | |
| |
Total Convertible Bonds
(identified cost $4,294,607) | | | $ | 4,319,348 | |
|
| Corporate Bonds — 32.9% | |
| Security | | | | | Principal
Amount
(000’s omitted) | | | Value | |
|
| Aerospace & Defense — 1.0% | |
| | | |
| American Airlines, Inc./AAdvantage Loyalty IP, Ltd.: | | | | | | | | | |
| | | |
5.50%, 4/20/26(1) | | | | | | $ | 3,202 | | | $ | 3,370,105 | |
| | | |
5.75%, 4/20/29(1) | | | | | | | 812 | | | | 875,945 | |
| | | |
Delta Air Lines, Inc./SkyMiles IP, Ltd., 4.75%, 10/20/28(1) | | | | | | | 3,106 | | | | 3,465,109 | |
| | | |
| | | | | | | | | | | $ | 7,711,159 | |
|
| Automotive & Auto Parts — 0.3% | |
| | | |
Tupy Overseas S.A., 4.50%, 2/16/31(1) | | | | | | $ | 2,300 | | | $ | 2,235,715 | |
| |
| | | | $ | 2,235,715 | |
| | | | | | | | | | |
| Security | | | | Principal
Amount
(000’s omitted) | | | Value | |
|
| Banks — 6.1% | |
| | | |
Australia & New Zealand Banking Group, Ltd., 2.95% to 7/22/25, 7/22/30(1)(8) | | | | $ | 3,531 | | | $ | 3,671,897 | |
| | | |
Banco do Brasil S.A., 3.25%, 9/30/26(1) | | | | | 5,819 | | | | 5,823,364 | |
| | | |
| Banco Mercantil del Norte S.A./Grand Cayman: | | | | | | | | |
| | | |
5.75% to 10/4/26, 10/4/31(1)(8) | | | | | 6,225 | | | | 6,721,133 | |
| | | |
7.50% to 6/27/29(1)(8)(9) | | | | | 745 | | | | 831,718 | |
| | | |
Banco Santander S.A., 3.80%, 2/23/28 | | | | | 3,200 | | | | 3,509,932 | |
| | | |
BankUnited, Inc., 5.125%, 6/11/30 | | | | | 1,737 | | | | 2,008,686 | |
| | | |
BBVA Bancomer S.A., 5.125% to 1/18/28, 1/18/33(1)(8) | | | | | 4,920 | | | | 5,135,963 | |
| | | |
BNP Paribas S.A., 4.625% to
2/25/31(1)(8)(9) | | | | | 914 | | | | 935,708 | |
| | | |
Commonwealth Bank of Australia, 3.61% to 9/12/29, 9/12/34(1)(8) | | | | | 2,800 | | | | 2,971,145 | |
| | | |
Discover Bank, 4.682% to 8/9/23, 8/9/28(8) | | | | | 2,040 | | | | 2,170,813 | |
| | | |
Macquarie Bank, Ltd., 3.052% to 3/3/31, 3/3/36(1)(8) | | | | | 3,096 | | | | 3,068,005 | |
| | | |
Societe Generale S.A., 4.75% to
5/26/26(1)(8)(9) | | | | | 1,175 | | | | 1,203,647 | |
| | | |
Synovus Bank/Columbus, GA, 4.00% to 10/29/25, 10/29/30(8) | | | | | 1,721 | | | | 1,803,769 | |
| | | |
Texas Capital Bancshares, Inc., 4.00% to 5/6/26, 5/6/31(8) | | | | | 3,393 | | | | 3,532,009 | |
| | | |
UBS Group AG, 4.375% to 2/10/31(1)(8)(9) | | | | | 866 | | | | 876,998 | |
| | | |
Westpac Banking Corp., 2.668% to 11/15/30, 11/15/35(8) | | | | | 3,826 | | | | 3,749,073 | |
| |
| | | | $ | 48,013,860 | |
|
| Biotechnology — 0.3% | |
| | | |
Royalty Pharma PLC Co., 3.30%, 9/2/40 | | | | $ | 2,184 | | | $ | 2,180,663 | |
| |
| | | | $ | 2,180,663 | |
|
| Building Materials — 0.8% | |
| | | |
Builders FirstSource, Inc., 5.00%, 3/1/30(1) | | | | $ | 3,655 | | | $ | 3,899,446 | |
| | | |
Owens Corning, 3.95%, 8/15/29 | | | | | 2,300 | | | | 2,570,213 | |
| |
| | | | $ | 6,469,659 | |
|
| Chemicals — 0.5% | |
| | | |
| Alpek SAB de CV: | | | | | | | | |
| | | |
3.25%, 2/25/31(1) | | | | $ | 1,600 | | | $ | 1,618,968 | |
| | | |
4.25%, 9/18/29(1) | | | | | 2,490 | | | | 2,672,143 | |
| |
| | | | $ | 4,291,111 | |
|
| Commercial Services — 1.1% | |
| | | |
Ashtead Capital, Inc., 4.25%, 11/1/29(1) | | | | $ | 2,785 | | | $ | 3,059,993 | |
| | | |
Block Financial, LLC, 3.875%, 8/15/30 | | | | | 2,825 | | | | 3,074,256 | |
| | | |
Western Union Co. (The), 6.20%, 11/17/36 | | | | | 2,075 | | | | 2,649,145 | |
| |
| | | | $ | 8,783,394 | |
| | | | |
| | 9 | | See Notes to Financial Statements. |
Eaton Vance
Total Return Bond Fund
September 30, 2021
Portfolio of Investments — continued
| | | | | | | | | | |
| Security | | | | Principal
Amount
(000’s omitted) | | | Value | |
|
| Computers — 0.4% | |
| | | |
Seagate HDD Cayman, 5.75%, 12/1/34 | | | | $ | 2,589 | | | $ | 3,032,366 | |
| |
| | | | $ | 3,032,366 | |
|
| Consumer Products — 0.4% | |
| | | |
Natura Cosmeticos S.A., 4.125%, 5/3/28(1) | | | | $ | 3,007 | | | $ | 3,047,595 | |
| |
| | | | $ | 3,047,595 | |
|
| Diversified Financial Services — 4.0% | |
| | | |
AerCap Ireland Capital DAC/AerCap Global Aviation Trust, 6.50%, 7/15/25 | | | | $ | 1,096 | | | $ | 1,271,282 | |
| | | |
Affiliated Managers Group, Inc., 3.30%, 6/15/30 | | | | | 3,396 | | | | 3,636,482 | |
| | | |
Alliance Data Systems Corp., 4.75%, 12/15/24(1) | | | | | 1,992 | | | | 2,042,812 | |
| | | |
Alpha Holding S.A. de CV, 9.00%, 2/10/25(1)(10) | | | | | 3,125 | | | | 460,937 | |
| | | |
American AgCredit Corp., 5.25% to 6/15/26(1)(8)(9) | | | | | 1,431 | | | | 1,459,620 | |
| | | |
Banco BTG Pactual S.A./Cayman Islands, 4.50%, 1/10/25(1) | | | | | 3,500 | | | | 3,600,660 | |
| | | |
Brookfield Finance, Inc., 4.70%, 9/20/47 | | | | | 3,240 | | | | 3,929,914 | |
| | | |
| CI Financial Corp.: | | | | | | | | |
| | | |
3.20%, 12/17/30 | | | | | 912 | | | | 947,458 | |
| | | |
4.10%, 6/15/51 | | | | | 969 | | | | 1,043,616 | |
| | | |
Enact Holdings, Inc., 6.50%, 8/15/25(1) | | | | | 2,470 | | | | 2,699,759 | |
| | | |
Neuberger Berman Group, LLC/Neuberger Berman Finance Corp., 4.875%, 4/15/45(1) | | | | | 1,685 | | | | 1,947,406 | |
| | | |
Stifel Financial Corp., 4.00%, 5/15/30 | | | | | 4,769 | | | | 5,321,146 | |
| | | |
UniCredit SpA, 5.861% to 6/19/27, 6/19/32(1)(8) | | | | | 3,017 | | | | 3,357,765 | |
| |
| | | | $ | 31,718,857 | |
|
| Electric Utilities — 0.5% | |
| | | |
Engie Energia Chile S.A., 3.40%, 1/28/30(1) | | | | $ | 3,890 | | | $ | 4,001,837 | |
| |
| | | | $ | 4,001,837 | |
|
| Electrical and Electronic Equipment — 0.5% | |
| | | |
Imola Merger Corp., 4.75%, 5/15/29(1) | | | | $ | 1,845 | | | $ | 1,910,993 | |
| | | |
Jabil, Inc., 3.00%, 1/15/31 | | | | | 1,969 | | | | 2,021,765 | |
| |
| | | | $ | 3,932,758 | |
|
| Financial Services — 0.5% | |
| | | |
Carlyle Finance Subsidiary, LLC, 3.50%, 9/19/29(1) | | | | $ | 3,343 | | | $ | 3,598,620 | |
| |
| | | | $ | 3,598,620 | |
|
| Foods — 1.4% | |
| | | |
JBS USA LUX S.A./JBS USA Food Co./JBS USA
Finance, Inc.: | | | | | | | | |
| | | |
3.75%, 12/1/31(1) | | | | $ | 2,758 | | | $ | 2,873,229 | |
| | | |
5.50%, 1/15/30(1) | | | | | 3,015 | | | | 3,357,112 | |
| | | | | | | | | | |
| Security | | | | Principal
Amount
(000’s omitted) | | | Value | |
|
| Foods (continued) | |
| | | |
Smithfield Foods, Inc., 5.20%, 4/1/29(1) | | | | $ | 4,000 | | | $ | 4,597,369 | |
| |
| | | | $ | 10,827,710 | |
|
| Health Care — 0.6% | |
| | | |
| Centene Corp.: | | | | | | | | |
| | | |
2.50%, 3/1/31 | | | | $ | 1,889 | | | $ | 1,865,387 | |
| | | |
3.375%, 2/15/30 | | | | | 990 | | | | 1,026,185 | |
| | | |
4.25%, 12/15/27 | | | | | 1,705 | | | | 1,786,669 | |
| |
| | | | $ | 4,678,241 | |
|
| Home Construction — 0.4% | |
| | | |
MDC Holdings, Inc., 2.50%, 1/15/31 | | | | $ | 3,641 | | | $ | 3,552,961 | |
| |
| | | | $ | 3,552,961 | |
|
| Insurance — 1.7% | |
| | | |
| Athene Holding, Ltd.: | | | | | | | | |
| | | |
3.50%, 1/15/31 | | | | $ | 3,595 | | | $ | 3,852,792 | |
| | | |
3.95%, 5/25/51 | | | | | 1,746 | | | | 1,933,263 | |
| | | |
Liberty Mutual Group, Inc., 4.125% to 12/15/26, 12/15/51(1)(8) | | | | | 3,769 | | | | 3,875,521 | |
| | | |
Radian Group, Inc., 4.875%, 3/15/27 | | | | | 3,621 | | | | 3,953,499 | |
| |
| | | | $ | 13,615,075 | |
|
| Machinery — 1.4% | |
| | | |
Flowserve Corp., 3.50%, 10/1/30 | | | | $ | 1,366 | | | $ | 1,427,999 | |
| | | |
nVent Finance S.a.r.l., 4.55%, 4/15/28 | | | | | 6,210 | | | | 6,820,735 | |
| | | |
Valmont Industries, Inc., 5.25%, 10/1/54 | | | | | 2,184 | | | | 2,733,880 | |
| |
| | | | $ | 10,982,614 | |
|
| Media — 1.5% | |
| | | |
Charter Communications Operating, LLC/Charter Communications Operating Capital, 4.80%, 3/1/50 | | | | $ | 5,215 | | | $ | 5,862,778 | |
| | | |
Discovery Communications, LLC, 5.20%, 9/20/47 | | | | | 4,551 | | | | 5,680,384 | |
| |
| | | | $ | 11,543,162 | |
|
| Miscellaneous Manufacturing — 0.1% | |
| | | |
Hexcel Corp., 4.20%, 2/15/27 | | | | $ | 1,116 | | | $ | 1,220,114 | |
| |
| | | | $ | 1,220,114 | |
|
| Oil and Gas — 1.5% | |
| | | |
Helmerich & Payne, Inc., 2.90%, 9/29/31(1) | | | | $ | 953 | | | $ | 956,043 | |
| | | |
National Fuel Gas Co., 2.95%, 3/1/31 | | | | | 2,065 | | | | 2,093,491 | |
| | | | |
| | 10 | | See Notes to Financial Statements. |
Eaton Vance
Total Return Bond Fund
September 30, 2021
Portfolio of Investments — continued
| | | | | | | | | | |
| Security | | | | Principal
Amount
(000’s omitted) | | | Value | |
|
| Oil and Gas (continued) | |
| | | |
Neptune Energy Bondco PLC, 6.625%, 5/15/25(1) | | | | $ | 3,059 | | | $ | 3,153,110 | |
| | | |
Patterson-UTI Energy, Inc., 3.95%, 2/1/28 | | | | | 5,555 | | | | 5,585,574 | |
| |
| | | | $ | 11,788,218 | |
|
| Real Estate Investment Trusts (REITs) — 2.7% | |
| | | |
Broadstone Net Lease, LLC, 2.60%, 9/15/31 | | | | $ | 1,036 | | | $ | 1,024,498 | |
| | | |
EPR Properties, 3.75%, 8/15/29 | | | | | 2,672 | | | | 2,756,625 | |
| | | |
| Iron Mountain, Inc.: | | | | | | | | |
| | | |
4.50%, 2/15/31(1) | | | | | 3,801 | | | | 3,860,106 | |
| | | |
5.00%, 7/15/28(1) | | | | | 503 | | | | 524,906 | |
| | | |
Newmark Group, Inc., 6.125%, 11/15/23 | | | | | 5,219 | | | | 5,653,482 | |
| | | |
Sabra Health Care, L.P., 3.20%, 12/1/31 | | | | | 2,741 | | | | 2,687,863 | |
| | | |
Service Properties Trust, 4.75%, 10/1/26 | | | | | 2,410 | | | | 2,388,913 | |
| | | |
| Sun Communities Operating, L.P.: | | | | | | | | |
| | | |
2.30%, 11/1/28(6) | | | | | 843 | | | | 845,085 | |
| | | |
2.70%, 7/15/31 | | | | | 789 | | | | 798,111 | |
| | | |
Vornado Realty, L.P., 3.40%, 6/1/31 | | | | | 700 | | | | 725,223 | |
| |
| | | | $ | 21,264,812 | |
|
| Retail-Specialty and Apparel — 1.4% | |
| | | |
American Assets Trust, L.P., 3.375%, 2/1/31 | | | | $ | 3,290 | | | $ | 3,412,202 | |
| | | |
Macy’s Retail Holdings, LLC, 4.30%, 2/15/43 | | | | | 4,053 | | | | 3,533,790 | |
| | | |
Nordstrom, Inc., 4.25%, 8/1/31 | | | | | 4,000 | | | | 4,055,822 | |
| |
| | | | $ | 11,001,814 | |
|
| Technology — 0.5% | |
| | | |
Western Digital Corp., 4.75%, 2/15/26 | | | | $ | 3,450 | | | $ | 3,825,257 | |
| |
| | | | $ | 3,825,257 | |
|
| Telecommunications — 1.8% | |
|
| AT&T, Inc.: | |
| | | |
3.10%, 2/1/43 | | | | $ | 2,000 | | | $ | 1,920,988 | |
| | | |
3.50%, 9/15/53 | | | | | 2,188 | | | | 2,169,808 | |
| | | |
Nokia Oyj, 4.375%, 6/12/27 | | | | | 3,450 | | | | 3,790,687 | |
| | | |
SES GLOBAL Americas Holdings GP, 5.30%, 3/25/44(1) | | | | | 1,360 | | | | 1,558,310 | |
| | | |
SES S.A., 5.30%, 4/4/43(1) | | | | | 810 | | | | 927,845 | |
| | | |
T-Mobile USA, Inc., 3.60%, 11/15/60 | | | | | 3,746 | | | | 3,690,698 | |
| |
| | | | $ | 14,058,336 | |
|
| Thrifts & Mortgage Finance — 0.9% | |
| | | |
Nationwide Building Society, 4.125% to 10/18/27, 10/18/32(1)(8) | | | | $ | 6,160 | | | $ | 6,735,534 | |
| |
| | | | $ | 6,735,534 | |
| | | | | | | | | | |
| Security | | | | Principal
Amount
(000’s omitted) | | | Value | |
|
| Transportation — 0.6% | |
| | | |
A.P. Moller - Maersk A/S, 4.50%, 6/20/29(1) | | | | $ | 4,090 | | | $ | 4,748,221 | |
| |
| | | | $ | 4,748,221 | |
| |
Total Corporate Bonds
(identified cost $247,865,280) | | | $ | 258,859,663 | |
|
| Preferred Stocks — 1.2% | |
| Security | | | | Shares | | | Value | |
|
| Real Estate Management & Development — 0.8% | |
| | | |
| Brookfield Property Partners, L.P.: | | | | | | | | |
| | | |
Series A, 5.75% | | | | | 190,000 | | | $ | 4,459,300 | |
| | | |
Series A2, 6.375% | | | | | 89,772 | | | | 2,265,845 | |
| |
| | | | $ | 6,725,145 | |
|
| Wireless Telecommunication Services — 0.4% | |
| | | |
United States Cellular Corp., 5.50% | | | | | 108,000 | | | $ | 2,855,520 | |
| |
| | | | $ | 2,855,520 | |
| |
Total Preferred Stocks
(identified cost $9,694,300) | | | $ | 9,580,665 | |
|
| Senior Floating-Rate Loans — 0.6%(11) | |
| Borrower/Description | | | | Principal
Amount
(000’s omitted) | | | Value | |
|
| Cable and Satellite Television — 0.3% | |
| | | |
CSC Holdings, LLC, Term Loan, 2.334%, (1 mo. USD LIBOR + 2.25%), 1/15/26 | | | | $ | 2,382 | | | $ | 2,354,142 | |
| |
| | | | $ | 2,354,142 | |
|
| Health Care — 0.3% | |
| | | |
Select Medical Corporation, Term Loan, 2.34%, (1 mo. USD LIBOR + 2.25%), 3/6/25 | | | | $ | 2,400 | | | $ | 2,389,500 | |
| |
| | | | $ | 2,389,500 | |
| |
Total Senior Floating-Rate Loans
(identified cost $4,756,479) | | | $ | 4,743,642 | |
| | | | |
| | 11 | | See Notes to Financial Statements. |
Eaton Vance
Total Return Bond Fund
September 30, 2021
Portfolio of Investments — continued
| | | | | | | | | | |
| Sovereign Government Bonds — 1.7% | |
| Security | | | | Principal
Amount
(000’s omitted) | | | Value | |
|
| Mexico — 0.6% | |
| | | |
Mexican Bonos, 7.75%, 5/29/31 | | MXN | | | 89,055 | | | $ | 4,426,626 | |
| |
| | | | $ | 4,426,626 | |
|
| Norway — 0.3% | |
| | | |
Norway Government Bond, 1.375%, 8/19/30(1)(7) | | NOK | | | 19,446 | | | $ | 2,190,585 | |
| |
| | | | $ | 2,190,585 | |
|
| Supranational — 0.8% | |
| | | |
European Bank for Reconstruction & Development, 6.45%, 12/13/22 | | IDR | | | 89,482,200 | | | $ | 6,402,393 | |
| |
| | | | $ | 6,402,393 | |
| |
Total Sovereign Government Bonds
(identified cost $12,864,323) | | | $ | 13,019,604 | |
|
| U.S. Government Agency Mortgage-Backed Securities — 2.9% | |
| Security | | | | Principal
Amount
(000’s omitted) | | | Value | |
|
| Federal National Mortgage Association: | |
| | | |
2.00%, 30-Year, TBA(12) | | | | $ | 8,200 | | | $ | 8,222,294 | |
| | | |
2.50%, 30-Year, TBA(12) | | | | | 13,104 | | | | 13,514,013 | |
| | | |
Pool #FM6803, 2.00%, 4/1/51 | | | | | 1,407 | | | | 1,428,076 | |
| |
Total U.S. Government Agency Mortgage-Backed Securities
(identified cost $23,319,586) | | | $ | 23,164,383 | |
|
| U.S. Treasury Obligations — 30.7% | |
| Security | | | | Principal
Amount
(000’s omitted) | | | Value | |
|
| U.S. Treasury Bond: | |
| | | |
1.125%, 8/15/40 | | | | $ | 7,760 | | | $ | 6,680,269 | |
| | | |
1.375%, 11/15/40 | | | | | 779 | | | | 700,005 | |
| | | |
1.375%, 8/15/50 | | | | | 37,414 | | | | 31,582,677 | |
| | | |
1.625%, 11/15/50 | | | | | 12,266 | | | | 11,023,588 | |
| | | |
1.875%, 2/15/41 | | | | | 1,767 | | | | 1,729,037 | |
| | | |
1.875%, 2/15/51 | | | | | 3,178 | | | | 3,031,514 | |
| | | |
2.25%, 5/15/41 | | | | | 11,415 | | | | 11,873,384 | |
| | | |
| U.S. Treasury Inflation-Protected Note: | | | | | | | | |
| | | |
0.125%, 4/15/25(13) | | | | | 3,523 | | | | 3,780,948 | |
| | | |
0.25%, 1/15/25(13) | | | | | 3,521 | | | | 3,783,671 | |
| | | | | | | | | | |
| Security | | | | Principal
Amount
(000’s omitted) | | | Value | |
| | | |
| U.S. Treasury Note: | | | | | | | | |
| | | |
0.125%, 9/30/22 | | | | $ | 7,500 | | | $ | 7,502,718 | |
| | | |
0.125%, 10/31/22 | | | | | 7,500 | | | | 7,502,344 | |
| | | |
0.125%, 11/30/22 | | | | | 7,500 | | | | 7,500,293 | |
| | | |
0.125%, 12/31/22 | | | | | 10,302 | | | | 10,300,793 | |
| | | |
0.125%, 2/28/23 | | | | | 10,306 | | | | 10,300,364 | |
| | | |
0.125%, 6/30/23 | | | | | 8,727 | | | | 8,712,682 | |
| | | |
0.125%, 12/15/23 | | | | | 4,121 | | | | 4,102,488 | |
| | | |
0.25%, 9/30/25 | | | | | 11,445 | | | | 11,202,241 | |
| | | |
0.375%, 12/31/25 | | | | | 5,401 | | | | 5,293,402 | |
| | | |
0.375%, 9/30/27 | | | | | 3,938 | | | | 3,758,559 | |
| | | |
0.625%, 5/15/30 | | | | | 10,345 | | | | 9,658,229 | |
| | | |
0.625%, 8/15/30 | | | | | 6,222 | | | | 5,789,741 | |
| | | |
0.875%, 11/15/30 | | | | | 15,086 | | | | 14,320,209 | |
| | | |
1.125%, 2/28/22 | | | | | 10,197 | | | | 10,241,824 | |
| | | |
1.125%, 2/29/28 | | | | | 3,509 | | | | 3,487,754 | |
| | | |
1.125%, 2/15/31 | | | | | 12,226 | | | | 11,843,937 | |
| | | |
1.25%, 3/31/28 | | | | | 3,434 | | | | 3,434,939 | |
| | | |
1.50%, 1/31/22 | | | | | 10,159 | | | | 10,208,060 | |
| | | |
1.625%, 5/15/31 | | | | | 20,349 | | | | 20,590,644 | |
| | | |
2.00%, 8/15/51 | | | | | 1,370 | | | | 1,346,025 | |
| |
Total U.S. Treasury Obligations
(identified cost $247,335,628) | | | $ | 241,282,339 | |
|
| Short-Term Investments — 3.7% | |
| Description | | | | Units | | | Value | |
| | | |
Eaton Vance Cash Reserves Fund, LLC, 0.05%(14) | | | | | 28,815,045 | | | $ | 28,815,045 | |
| |
Total Short-Term Investments
(identified cost $28,815,045) | | | $ | 28,815,045 | |
| |
Total Investments — 102.3%
(identified cost $799,409,172) | | | $ | 804,534,831 | |
| |
Other Assets, Less Liabilities — (2.3)% | | | $ | (18,328,842 | ) |
| |
Net Assets — 100.0% | | | $ | 786,205,989 | |
The percentage shown for each investment category in the Portfolio of Investments is based on net assets.
| | (1) | Security exempt from registration under Rule 144A of the Securities Act of 1933, as amended. These securities may be sold in certain transactions in reliance on an exemption from registration (normally to qualified institutional buyers). At September 30, 2021, the aggregate value of these securities is $323,795,393 or 41.2% of the Fund’s net assets. |
| | (2) | Variable rate security. The stated interest rate represents the rate in effect at September 30, 2021. |
| | | | |
| | 12 | | See Notes to Financial Statements. |
Eaton Vance
Total Return Bond Fund
September 30, 2021
Portfolio of Investments — continued
| | (3) | Weighted average fixed-rate coupon that changes/updates monthly. Rate shown is the rate at September 30, 2021. |
| | (4) | Represents an investment in an issuer that may be deemed to be an affiliate effective March 1, 2021 (see Note 11). |
| | (5) | Step coupon security. Interest rate represents the rate in effect at September 30, 2021. |
| | (6) | When-issued security. |
| | (7) | Security exempt from registration under Regulation S of the Securities Act of 1933, as amended, which exempts from registration securities offered and sold outside the United States. Security may not be offered or sold in the United States except pursuant to an exemption from, or in a transaction not subject to, the registration requirements of the Securities Act of 1933, as amended. At September 30, 2021, the aggregate value of these securities is $6,509,933 or 0.8% of the Fund’s net assets. |
| | (8) | Security converts to variable rate after the indicated fixed-rate coupon period. |
| | (9) | Perpetual security with no stated maturity date but may be subject to calls by the issuer. |
| (10) | Issuer is in default with respect to interest and/or principal payments. |
| (11) | Senior floating-rate loans (Senior Loans) often require prepayments from excess cash flows or permit the borrowers to repay at their election. The degree to which borrowers repay, whether as a contractual requirement or at their election, cannot be predicted with accuracy. As a result, the actual remaining maturity may be substantially less than the stated maturities shown. However, Senior Loans will typically have an expected average life of approximately two to four years. Senior Loans typically have rates of interest which are redetermined periodically by reference to a base lending rate, plus a spread. These base lending rates are primarily the London Interbank Offered Rate (“LIBOR”) and secondarily, the prime rate offered by one or more major United States banks (the “Prime Rate”). Base lending rates may be subject to a floor, or minimum rate. Senior Loans are generally subject to contractual restrictions that must be satisfied before they can be bought or sold. |
| (12) | TBA (To Be Announced) securities are purchased on a forward commitment basis with an approximate principal amount and maturity date. The actual principal amount and maturity date are determined upon settlement. |
| (13) | Inflation-linked security whose principal is adjusted for inflation based on changes in the U.S. Consumer Price Index. Interest is calculated based on the inflation-adjusted principal. |
| (14) | Affiliated investment company, available to Eaton Vance portfolios and funds, which invests in high quality, U.S. dollar denominated money market instruments. The rate shown is the annualized seven-day yield as of September 30, 2021. |
| | | | | | | | |
| Country Concentration of Portfolio | |
| Country | | Percentage of
Total Investments | | | Value | |
| | |
United States | | | 84.8 | % | | $ | 682,357,501 | |
| | |
Mexico | | | 2.7 | | | | 21,867,488 | |
| | |
United Kingdom | | | 2.5 | | | | 19,769,372 | |
| | |
Brazil | | | 1.8 | | | | 14,707,334 | |
| | |
Australia | | | 1.7 | | | | 13,460,120 | |
| | |
Supranational | | | 0.8 | | | | 6,402,393 | |
| | |
Cayman Islands | | | 0.8 | | | | 6,339,784 | |
| | |
Canada | | | 0.7 | | | | 5,920,988 | |
| | |
Denmark | | | 0.6 | | | | 4,748,221 | |
| | |
Austria | | | 0.5 | | | | 4,319,348 | |
| | |
Chile | | | 0.5 | | | | 4,001,837 | |
| | |
Finland | | | 0.5 | | | | 3,790,687 | |
| | |
Spain | | | 0.4 | | | | 3,509,932 | |
| | |
Italy | | | 0.4 | | | | 3,357,765 | |
| | |
Luxembourg | | | 0.3 | | | | 2,486,155 | |
| | |
Norway | | | 0.3 | | | | 2,190,585 | |
| | |
France | | | 0.3 | | | | 2,139,355 | |
| | |
Ireland | | | 0.2 | | | | 1,271,282 | |
| | |
Bermuda | | | 0.1 | | | | 1,017,686 | |
| | |
Switzerland | | | 0.1 | | | | 876,998 | |
| | |
Total Investments | | | 100.0 | % | | $ | 804,534,831 | |
| | | | | | | | | | | | | | | | | | | | | | | | |
| Futures Contracts | |
| | | | | | |
| Description | | Number of
Contracts | | | Position | | | Expiration
Date | | | | | | Notional
Amount | | | Value/Unrealized
Appreciation | |
| | | | | | |
Interest Rate Futures | | | | | | | | | | | | | | | | | | | | | | | | |
| | | | | | |
| U.S. 5-Year Treasury Note | | | (22 | ) | | | Short | | | | 12/31/21 | | | | | | | $ | (2,700,328 | ) | | $ | 11,651 | |
| | | | | | |
| U.S. 10-Year Treasury Note | | | (7 | ) | | | Short | | | | 12/21/21 | | | | | | | | (921,265 | ) | | | 8,847 | |
| | | | | | |
| U.S. 10-Year Ultra-Long Treasury Note | | | (580 | ) | | | Short | | | | 12/21/21 | | | | | | | | (84,245,000 | ) | | | 1,174,505 | |
| | | | | | |
| U.S. Ultra-Long Treasury Bond | | | (65 | ) | | | Short | | | | 12/21/21 | | | | | | | | (12,419,063 | ) | | | 386,167 | |
| | | | | | |
| | | | | | | | | | | | | | | | | | | | | | | $ | 1,581,170 | |
Abbreviations:
| | | | |
| | |
| LIBOR | | – | | London Interbank Offered Rate |
| | |
| SOFR | | – | | Secured Overnight Financing Rate |
| | |
| TBA | | – | | To Be Announced |
| | | | |
| | 13 | | See Notes to Financial Statements. |
Eaton Vance
Total Return Bond Fund
September 30, 2021
Portfolio of Investments — continued
Currency Abbreviations:
| | | | |
| | |
| IDR | | – | | Indonesian Rupiah |
| | |
| MXN | | – | | Mexican Peso |
| | |
| NOK | | – | | Norwegian Krone |
| | |
| USD | | – | | United States Dollar |
| | | | |
| | 14 | | See Notes to Financial Statements. |
Eaton Vance
Total Return Bond Fund
September 30, 2021
Statement of Assets and Liabilities
| | | | |
| Assets | | September 30, 2021 | |
| |
Unaffiliated investments, at value (identified cost, $745,177,935) | | $ | 751,685,891 | |
| |
Affiliated investments, at value (identified cost, $54,231,237) | | | 52,848,940 | |
| |
Deposits for derivatives collateral — financial futures contracts | | | 1,724,250 | |
| |
Interest receivable | | | 4,100,440 | |
| |
Interest and dividends receivable from affiliated investment | | | 77,306 | |
| |
Receivable for investments sold | | | 623,841 | |
| |
Receivable for Fund shares sold | | | 2,500,625 | |
| |
Receivable from affiliate | | | 17,929 | |
| |
Total assets | | $ | 813,579,222 | |
|
| Liabilities | |
| |
Payable for when-issued/forward commitment securities | | $ | 23,751,507 | |
| |
Payable for Fund shares redeemed | | | 1,113,561 | |
| |
Payable for variation margin on open financial futures contracts | | | 92,452 | |
| |
Distributions payable | | | 7,279 | |
| |
Due to custodian | | | 1,700,811 | |
| |
Payable to affiliates: | | | | |
| |
Investment adviser fee | | | 288,376 | |
| |
Distribution and service fees | | | 61,908 | |
| |
Accrued foreign capital gains taxes | | | 64,922 | |
| |
Accrued expenses | | | 292,417 | |
| |
Total liabilities | | $ | 27,373,233 | |
| |
Net Assets | | $ | 786,205,989 | |
|
| Sources of Net Assets | |
| |
Paid-in capital | | $ | 777,768,833 | |
| |
Distributable earnings | | | 8,437,156 | |
| |
Net Assets | | $ | 786,205,989 | |
|
| Class A Shares | |
| |
Net Assets | | $ | 107,379,910 | |
| |
Shares Outstanding | | | 8,701,793 | |
| |
Net Asset Value and Redemption Price Per Share | | | | |
| |
(net assets ÷ shares of beneficial interest outstanding) | | $ | 12.34 | |
| |
Maximum Offering Price Per Share | | | | |
| |
(100 ÷ 95.25 of net asset value per share) | | $ | 12.96 | |
|
| Class C Shares | |
| |
Net Assets | | $ | 48,423,232 | |
| |
Shares Outstanding | | | 3,926,357 | |
| |
Net Asset Value and Offering Price Per Share* | | | | |
| |
(net assets ÷ shares of beneficial interest outstanding) | | $ | 12.33 | |
|
| Class I Shares | |
| |
Net Assets | | $ | 630,402,847 | |
| |
Shares Outstanding | | | 51,128,980 | |
| |
Net Asset Value, Offering Price and Redemption Price Per Share | | | | |
| |
(net assets ÷ shares of beneficial interest outstanding) | | $ | 12.33 | |
On sales of $50,000 or more, the offering price of Class A shares is reduced.
| * | Redemption price per share is equal to the net asset value less any applicable contingent deferred sales charge. |
| | | | |
| | 15 | | See Notes to Financial Statements. |
Eaton Vance
Total Return Bond Fund
September 30, 2021
Statement of Operations
| | | | |
| Investment Income | | Year Ended
September 30, 2021 | |
| |
Dividends (net of foreign taxes, $6,665) | | $ | 577,749 | |
| |
Dividends from affiliated investment | | | 38,229 | |
| |
Interest | | | 22,522,231 | |
| |
Interest from affiliated investments | | | 641,077 | |
| |
Total investment income | | $ | 23,779,286 | |
| |
| Expenses | | | | |
| |
Investment adviser fee | | $ | 3,132,936 | |
| |
Distribution and service fees | | | | |
| |
Class A | | | 263,485 | |
| |
Class C | | | 500,368 | |
| |
Trustees’ fees and expenses | | | 33,794 | |
| |
Custodian fee | | | 176,204 | |
| |
Transfer and dividend disbursing agent fees | | | 415,300 | |
| |
Legal and accounting services | | | 69,152 | |
| |
Printing and postage | | | 57,632 | |
| |
Registration fees | | | 80,716 | |
| |
Miscellaneous | | | 4,668 | |
| |
Total expenses | | $ | 4,734,255 | |
| |
Deduct — | | | | |
| |
Allocation of expenses to affiliate | | $ | 558,337 | |
| |
Total expense reductions | | $ | 558,337 | |
| |
Net expenses | | $ | 4,175,918 | |
| |
Net investment income | | $ | 19,603,368 | |
| |
| Realized and Unrealized Gain (Loss) | | | | |
| |
Net realized gain (loss) — | | | | |
| |
Investment transactions | | $ | 7,959,407 | |
| |
Investment transactions — affiliated investment | | | 28 | |
| |
Financial futures contracts | | | 516,643 | |
| |
Foreign currency transactions | | | 37,358 | |
| |
Forward foreign currency exchange contracts | | | (99,579 | ) |
| |
Net realized gain | | $ | 8,413,857 | |
| |
Change in unrealized appreciation (depreciation) — | | | | |
| |
Investments (including net increase of $64,922 in accrued foreign capital gains taxes) | | $ | 21,031,801 | |
| |
Investments — affiliated investments | | | 491,760 | |
| |
Financial futures contracts | | | 1,832,275 | |
| |
Foreign currency | | | 9,616 | |
| |
Forward foreign currency exchange contracts | | | (33,816 | ) |
| |
Net change in unrealized appreciation (depreciation) | | $ | 23,331,636 | |
| |
Net realized and unrealized gain | | $ | 31,745,493 | |
| |
Net increase in net assets from operations | | $ | 51,348,861 | |
| | | | |
| | 16 | | See Notes to Financial Statements. |
Eaton Vance
Total Return Bond Fund
September 30, 2021
Statements of Changes in Net Assets
| | | | | | | | |
| | | Year Ended September 30, | |
| Increase (Decrease) in Net Assets | | 2021 | | | 2020 | |
| | |
From operations — | | | | | | | | |
| | |
Net investment income | | $ | 19,603,368 | | | $ | 30,325,927 | |
| | |
Net realized gain (loss) | | | 8,413,857 | | | | (2,253,411 | ) |
| | |
Net change in unrealized appreciation (depreciation) | | | 23,331,636 | | | | (27,720,493 | ) |
| | |
Net increase in net assets from operations | | $ | 51,348,861 | | | $ | 352,023 | |
| | |
Distributions to shareholders — | | | | | | | | |
| | |
Class A | | $ | (3,322,201 | ) | | $ | (5,568,953 | ) |
| | |
Class C | | | (1,205,585 | ) | | | (1,682,983 | ) |
| | |
Class I | | | (18,168,241 | ) | | | (25,149,896 | ) |
| | |
Total distributions to shareholders | | $ | (22,696,027 | ) | | $ | (32,401,832 | ) |
| | |
Transactions in shares of beneficial interest — | | | | | | | | |
| | |
Proceeds from sale of shares | | | | | | | | |
| | |
Class A | | $ | 21,649,585 | | | $ | 75,252,560 | |
| | |
Class C | | | 9,493,517 | | | | 25,929,494 | |
| | |
Class I | | | 267,564,797 | | | | 457,605,711 | |
| | |
Net asset value of shares issued to shareholders in payment of distributions declared | | | | | | | | |
| | |
Class A | | | 3,253,050 | | | | 5,504,624 | |
| | |
Class C | | | 1,203,189 | | | | 1,647,997 | |
| | |
Class I | | | 18,138,739 | | | | 25,102,517 | |
| | |
Cost of shares redeemed | | | | | | | | |
| | |
Class A | | | (62,232,559 | ) | | | (78,530,159 | ) |
| | |
Class C | | | (15,052,745 | ) | | | (21,860,405 | ) |
| | |
Class I | | | (208,532,292 | ) | | | (549,152,100 | ) |
| | |
Net asset value of shares converted | | | | | | | | |
| | |
Class A | | | 3,616,430 | | | | 1,954,252 | |
| | |
Class C | | | (3,616,430 | ) | | | (1,954,252 | ) |
| | |
Net increase (decrease) in net assets from Fund share transactions | | $ | 35,485,281 | | | $ | (58,499,761 | ) |
| | |
Net increase (decrease) in net assets | | $ | 64,138,115 | | | $ | (90,549,570 | ) |
|
| Net Assets | |
| | |
At beginning of year | | $ | 722,067,874 | | | $ | 812,617,444 | |
| | |
At end of year | | $ | 786,205,989 | | | $ | 722,067,874 | |
| | | | |
| | 17 | | See Notes to Financial Statements. |
Eaton Vance
Total Return Bond Fund
September 30, 2021
Financial Highlights
| | | | | | | | | | | | | | | | | | | | |
| | | Class A | |
| |
| | | Year Ended September 30, | |
| | | 2021 | | | 2020 | | | 2019 | | | 2018 | | | 2017 | |
| | | | | |
Net asset value — Beginning of year | | $ | 11.820 | | | $ | 11.990 | | | $ | 11.570 | | | $ | 11.930 | | | $ | 11.630 | |
| | | | | |
| Income (Loss) From Operations | | | | | | | | | | | | | | | | | | | | |
| | | | | |
Net investment income(1) | | $ | 0.330 | | | $ | 0.395 | | | $ | 0.427 | | | $ | 0.402 | | | $ | 0.367 | |
| | | | | |
Net realized and unrealized gain (loss) | | | 0.573 | | | | (0.143 | ) | | | 0.451 | | | | (0.344 | ) | | | 0.319 | |
| | | | | |
Total income from operations | | $ | 0.903 | | | $ | 0.252 | | | $ | 0.878 | | | $ | 0.058 | | | $ | 0.686 | |
| | | | | |
| Less Distributions | | | | | | | | | | | | | | | | | | | | |
| | | | | |
From net investment income | | $ | (0.323 | ) | | $ | (0.413 | ) | | $ | (0.458 | ) | | $ | (0.409 | ) | | $ | (0.322 | ) |
| | | | | |
From net realized gain | | | (0.060 | ) | | | (0.009 | ) | | | — | | | | (0.009 | ) | | | — | |
| | | | | |
Tax return of capital | | | — | | | | — | | | | — | | | | — | | | | (0.064 | ) |
| | | | | |
Total distributions | | $ | (0.383 | ) | | $ | (0.422 | ) | | $ | (0.458 | ) | | $ | (0.418 | ) | | $ | (0.386 | ) |
| | | | | |
Net asset value — End of year | | $ | 12.340 | | | $ | 11.820 | | | $ | 11.990 | | | $ | 11.570 | | | $ | 11.930 | |
| | | | | |
Total Return(2)(3) | | | 7.72 | % | | | 2.21 | % | | | 7.76 | % | | | 0.50 | % | | | 6.01 | % |
|
| Ratios/Supplemental Data | |
| | | | | |
Net assets, end of year (000’s omitted) | | $ | 107,380 | | | $ | 136,688 | | | $ | 137,889 | | | $ | 43,503 | | | $ | 33,927 | |
| | | | | |
Ratios (as a percentage of average daily net assets): | | | | | | | | | | | | | | | | | | | | |
| | | | | |
Expenses(3) | | | 0.74 | % | | | 0.74 | % | | | 0.74 | % | | | 0.74 | % | | | 0.77 | % |
| | | | | |
Net investment income | | | 2.70 | % | | | 3.38 | % | | | 3.62 | % | | | 3.43 | % | | | 3.13 | % |
| | | | | |
Portfolio Turnover | | | 85 | %(4) | | | 89 | % | | | 75 | % | | | 43 | % | | | 61 | % |
| (1) | Computed using average shares outstanding. |
| (2) | Returns are historical and are calculated by determining the percentage change in net asset value with all distributions reinvested and do not reflect the effect of sales charges. |
| (3) | The investment adviser and administrator reimbursed certain operating expenses (equal to 0.08%, 0.11%, 0.11%, 0.22% and 0.36% of average daily net assets for the years ended September 30, 2021, 2020, 2019, 2018 and 2017, respectively). Absent this reimbursement, total return would be lower. |
| (4) | Includes the effect of To-Be-Announced (TBA) transactions. |
| | | | |
| | 18 | | See Notes to Financial Statements. |
Eaton Vance
Total Return Bond Fund
September 30, 2021
Financial Highlights — continued
| | | | | | | | | | | | | | | | | | | | |
| | | Class C | |
| |
| | | Year Ended September 30, | |
| | | 2021 | | | 2020 | | | 2019 | | | 2018 | | | 2017 | |
| | | | | |
Net asset value — Beginning of year | | $ | 11.820 | | | $ | 11.990 | | | $ | 11.560 | | | $ | 11.920 | | | $ | 11.620 | |
| | | | | |
| Income (Loss) From Operations | | | | | | | | | | | | | | | | | | | | |
| | | | | |
Net investment income(1) | | $ | 0.238 | | | $ | 0.307 | | | $ | 0.344 | | | $ | 0.313 | | | $ | 0.282 | |
| | | | | |
Net realized and unrealized gain (loss) | | | 0.564 | | | | (0.142 | ) | | | 0.456 | | | | (0.343 | ) | | | 0.317 | |
| | | | | |
Total income (loss) from operations | | $ | 0.802 | | | $ | 0.165 | | | $ | 0.800 | | | $ | (0.030 | ) | | $ | 0.599 | |
| | | | | |
| Less Distributions | | | | | | | | | | | | | | | | | | | | |
| | | | | |
From net investment income | | $ | (0.232 | ) | | $ | (0.326 | ) | | $ | (0.370 | ) | | $ | (0.321 | ) | | $ | (0.249 | ) |
| | | | | |
From net realized gain | | | (0.060 | ) | | | (0.009 | ) | | | — | | | | (0.009 | ) | | | — | |
| | | | | |
Tax return of capital | | | — | | | | — | | | | — | | | | — | | | | (0.050 | ) |
| | | | | |
Total distributions | | $ | (0.292 | ) | | $ | (0.335 | ) | | $ | (0.370 | ) | | $ | (0.330 | ) | | $ | (0.299 | ) |
| | | | | |
Net asset value — End of year | | $ | 12.330 | | | $ | 11.820 | | | $ | 11.990 | | | $ | 11.560 | | | $ | 11.920 | |
| | | | | |
Total Return(2)(3) | | | 6.83 | % | | | 1.45 | % | | | 7.05 | % | | | (0.25 | )% | | | 5.23 | % |
|
| Ratios/Supplemental Data | |
| | | | | |
Net assets, end of year (000’s omitted) | | $ | 48,423 | | | $ | 54,189 | | | $ | 52,001 | | | $ | 20,926 | | | $ | 19,197 | |
| | | | | |
Ratios (as a percentage of average daily net assets): | | | | | | | | | | | | | | | | | | | | |
| | | | | |
Expenses(3) | | | 1.49 | % | | | 1.49 | % | | | 1.49 | % | | | 1.49 | % | | | 1.52 | % |
| | | | | |
Net investment income | | | 1.95 | % | | | 2.63 | % | | | 2.93 | % | | | 2.67 | % | | | 2.41 | % |
| | | | | |
Portfolio Turnover | | | 85 | %(4) | | | 89 | % | | | 75 | % | | | 43 | % | | | 61 | % |
| (1) | Computed using average shares outstanding. |
| (2) | Returns are historical and are calculated by determining the percentage change in net asset value with all distributions reinvested and do not reflect the effect of sales charges. |
| (3) | The investment adviser and administrator reimbursed certain operating expenses (equal to 0.08%, 0.11%, 0.11%, 0.22% and 0.36% of average daily net assets for the years ended September 30, 2021, 2020, 2019, 2018 and 2017, respectively). Absent this reimbursement, total return would be lower. |
| (4) | Includes the effect of To-Be-Announced (TBA) transactions. |
| | | | |
| | 19 | | See Notes to Financial Statements. |
Eaton Vance
Total Return Bond Fund
September 30, 2021
Financial Highlights — continued
| | | | | | | | | | | | | | | | | | | | |
| | | Class I | |
| |
| | | Year Ended September 30, | |
| | | 2021 | | | 2020 | | | 2019 | | | 2018 | | | 2017 | |
| | | | | |
Net asset value — Beginning of year | | $ | 11.810 | | | $ | 11.990 | | | $ | 11.560 | | | $ | 11.920 | | | $ | 11.620 | |
| | | | | |
| Income (Loss) From Operations | | | | | | | | | | | | | | | | | | | | |
| | | | | |
Net investment income(1) | | $ | 0.356 | | | $ | 0.423 | | | $ | 0.457 | | | $ | 0.440 | | | $ | 0.399 | |
| | | | | |
Net realized and unrealized gain (loss) | | | 0.578 | | | | (0.152 | ) | | | 0.460 | | | | (0.352 | ) | | | 0.316 | |
| | | | | |
Total income from operations | | $ | 0.934 | | | $ | 0.271 | | | $ | 0.917 | | | $ | 0.088 | | | $ | 0.715 | |
| | | | | |
| Less Distributions | | | | | | | | | | | | | | | | | | | | |
| | | | | |
From net investment income | | $ | (0.354 | ) | | $ | (0.442 | ) | | $ | (0.487 | ) | | $ | (0.439 | ) | | $ | (0.346 | ) |
| | | | | |
From net realized gain | | | (0.060 | ) | | | (0.009 | ) | | | — | | | | (0.009 | ) | | | — | |
| | | | | |
Tax return of capital | | | — | | | | — | | | | — | | | | — | | | | (0.069 | ) |
| | | | | |
Total distributions | | $ | (0.414 | ) | | $ | (0.451 | ) | | $ | (0.487 | ) | | $ | (0.448 | ) | | $ | (0.415 | ) |
| | | | | |
Net asset value — End of year | | $ | 12.330 | | | $ | 11.810 | | | $ | 11.990 | | | $ | 11.560 | | | $ | 11.920 | |
| | | | | |
Total Return(2)(3) | | | 8.00 | % | | | 2.37 | % | | | 8.12 | % | | | 0.74 | % | | | 6.28 | % |
|
| Ratios/Supplemental Data | |
| | | | | |
Net assets, end of year (000’s omitted) | | $ | 630,403 | | | $ | 531,191 | | | $ | 622,727 | | | $ | 152,363 | | | $ | 41,563 | |
| | | | | |
Ratios (as a percentage of average daily net assets): | | | | | | | | | | | | | | | | | | | | |
| | | | | |
Expenses(3) | | | 0.49 | % | | | 0.49 | % | | | 0.49 | % | | | 0.49 | % | | | 0.52 | % |
| | | | | |
Net investment income | | | 2.92 | % | | | 3.62 | % | | | 3.89 | % | | | 3.77 | % | | | 3.40 | % |
| | | | | |
Portfolio Turnover | | | 85 | %(4) | | | 89 | % | | | 75 | % | | | 43 | % | | | 61 | % |
| (1) | Computed using average shares outstanding. |
| (2) | Returns are historical and are calculated by determining the percentage change in net asset value with all distributions reinvested. |
| (3) | The investment adviser and administrator reimbursed certain operating expenses (equal to 0.08%, 0.11%, 0.11%, 0.22% and 0.36% of average daily net assets for the years ended September 30, 2021, 2020, 2019, 2018 and 2017, respectively). Absent this reimbursement, total return would be lower. |
| (4) | Includes the effect of To-Be-Announced (TBA) transactions. |
| | | | |
| | 20 | | See Notes to Financial Statements. |
Eaton Vance
Total Return Bond Fund
September 30, 2021
Notes to Financial Statements
1 Significant Accounting Policies
Eaton Vance Total Return Bond Fund (formerly, Eaton Vance Core Plus Bond Fund) (the Fund) is a diversified series of Eaton Vance Mutual Funds Trust (the Trust). The Trust is a Massachusetts business trust registered under the Investment Company Act of 1940, as amended (the 1940 Act), as an open-end management investment company. The Fund’s investment objective is total return. The Fund offers three classes of shares. Class A shares are generally sold subject to a sales charge imposed at time of purchase. Class C shares are sold at net asset value and are generally subject to a contingent deferred sales charge (see Note 5). Effective January 25, 2019, Class C shares generally automatically convert to Class A shares ten years after their purchase and, effective November 5, 2020, automatically convert to Class A shares eight years after their purchase as described in the Fund’s prospectus. Class I shares are sold at net asset value and are not subject to a sales charge. Each class represents a pro-rata interest in the Fund, but votes separately on class-specific matters and (as noted below) is subject to different expenses. Realized and unrealized gains and losses are allocated daily to each class of shares based on the relative net assets of each class to the total net assets of the Fund. Net investment income, other than class-specific expenses, is allocated daily to each class of shares based upon the ratio of the value of each class’s paid shares to the total value of all paid shares. Each class of shares differs in its distribution plan and certain other class-specific expenses.
The following is a summary of significant accounting policies of the Fund. The policies are in conformity with accounting principles generally accepted in the United States of America (U.S. GAAP). The Fund is an investment company and follows accounting and reporting guidance in the Financial Accounting Standards Board (FASB) Accounting Standards Codification Topic 946.
A Investment Valuation — The following methodologies are used to determine the market value or fair value of investments.
Debt Obligations. Debt obligations are generally valued on the basis of valuations provided by third party pricing services, as derived from such services’ pricing models. Inputs to the models may include, but are not limited to, reported trades, executable bid and ask prices, broker/dealer quotations, prices or yields of securities with similar characteristics, interest rates, anticipated prepayments, benchmark curves or information pertaining to the issuer, as well as industry and economic events. The pricing services may use a matrix approach, which considers information regarding securities with similar characteristics to determine the valuation for a security. Short-term debt obligations purchased with a remaining maturity of sixty days or less for which a valuation from a third party pricing service is not readily available may be valued at amortized cost, which approximates fair value.
Equity Securities. Equity securities listed on a U.S. securities exchange generally are valued at the last sale or closing price on the day of valuation or, if no sales took place on such date, at the mean between the closing bid and ask prices on the exchange where such securities are principally traded. Equity securities listed on the NASDAQ National Market System generally are valued at the NASDAQ official closing price. Unlisted or listed securities for which closing sales prices or closing quotations are not available are valued at the mean between the latest available bid and ask prices or, in the case of preferred equity securities that are not listed or traded in the over-the-counter market, by a third party pricing service that uses various techniques that consider factors including, but not limited to, prices or yields of securities with similar characteristics, benchmark yields, broker/dealer quotes, quotes of underlying common stock, issuer spreads, as well as industry and economic events.
Senior Floating-Rate Loans. Interests in senior floating-rate loans (Senior Loans) for which reliable market quotations are readily available are valued generally at the average mean of bid and ask quotations obtained from a third party pricing service.
Derivatives. Financial futures contracts are valued at the closing settlement price established by the board of trade or exchange on which they are traded. Forward foreign currency exchange contracts are generally valued at the mean of the average bid and average ask prices that are reported by currency dealers to a third party pricing service at the valuation time. Such third party pricing service valuations are supplied for specific settlement periods and the Fund’s forward foreign currency exchange contracts are valued at an interpolated rate between the closest preceding and subsequent settlement period reported by the third party pricing service.
Foreign Securities and Currencies. Foreign securities and currencies are valued in U.S. dollars, based on foreign currency exchange rate quotations supplied by a third party pricing service. The pricing service uses a proprietary model to determine the exchange rate. Inputs to the model include reported trades and implied bid/ask spreads.
Affiliated Fund. The Fund may invest in Eaton Vance Cash Reserves Fund, LLC (Cash Reserves Fund), an affiliated investment company managed by Eaton Vance Management (EVM). While Cash Reserves Fund is not a registered money market mutual fund, it conducts all of its investment activities in accordance with the requirements of Rule 2a-7 under the 1940 Act. Investments in Cash Reserves Fund are valued at the closing net asset value per unit on the valuation day. Cash Reserves Fund generally values its investment securities based on available market quotations provided by a third party pricing service.
Fair Valuation. Investments for which valuations or market quotations are not readily available or are deemed unreliable are valued at fair value using methods determined in good faith by or at the direction of the Trustees of the Fund in a manner that most fairly reflects the security’s “fair value”, which is the amount that the Fund might reasonably expect to receive for the security upon its current sale in the ordinary course. Each such determination is based on a consideration of relevant factors, which are likely to vary from one pricing context to another. These factors may include, but are not limited to, the type of security, the existence of any contractual restrictions on the security’s disposition, the price and extent of public trading in similar securities of the issuer or of comparable companies or entities, quotations or relevant information obtained from broker/dealers or other market participants, information obtained from the issuer, analysts, and/or the appropriate stock exchange (for exchange-traded securities), an analysis of the company’s or entity’s financial statements, and an evaluation of the forces that influence the issuer and the market(s) in which the security is purchased and sold.
B Investment Transactions — Investment transactions for financial statement purposes are accounted for on a trade date basis. Realized gains and losses on investments sold are determined on the basis of identified cost.
Eaton Vance
Total Return Bond Fund
September 30, 2021
Notes to Financial Statements — continued
C Income — Interest income is recorded on the basis of interest accrued, adjusted for amortization of premium or accretion of discount. Fees associated with loan amendments are recognized immediately. Dividend income is recorded on the ex-dividend date for dividends received in cash and/or securities. Withholding taxes on foreign interest and dividends have been provided for in accordance with the Fund’s understanding of the applicable countries’ tax rules and rates. Inflation adjustments to the principal amount of inflation-adjusted bonds and notes are reflected as interest income. Deflation adjustments to the principal amount of an inflation-adjusted bond or note are reflected as reductions to interest income to the extent of interest income previously recorded on such bond or note.
D Federal Taxes — The Fund’s policy is to comply with the provisions of the Internal Revenue Code applicable to regulated investment companies and to distribute to shareholders each year substantially all of its net investment income, and all or substantially all of its net realized capital gains. Accordingly, no provision for federal income or excise tax is necessary.
In addition to the requirements of the Internal Revenue Code, the Fund may also be subject to local taxes on the recognition of capital gains in certain countries. In determining the daily net asset value, the Fund estimates the accrual for such taxes, if any, based on the unrealized appreciation on certain portfolio securities and the related tax rates. Taxes attributable to unrealized appreciation are included in the change in unrealized appreciation (depreciation) on investments. Capital gains taxes on securities sold are included in net realized gain (loss) on investments.
As of September 30, 2021, the Fund had no uncertain tax positions that would require financial statement recognition, de-recognition, or disclosure. The Fund files a U.S. federal income tax return annually after its fiscal year-end, which is subject to examination by the Internal Revenue Service for a period of three years from the date of filing.
E Expenses — The majority of expenses of the Trust are directly identifiable to an individual fund. Expenses which are not readily identifiable to a specific fund are allocated taking into consideration, among other things, the nature and type of expense and the relative size of the funds.
F Foreign Currency Translation — Investment valuations, other assets, and liabilities initially expressed in foreign currencies are translated each business day into U.S. dollars based upon current exchange rates. Purchases and sales of foreign investment securities and income and expenses denominated in foreign currencies are translated into U.S. dollars based upon currency exchange rates in effect on the respective dates of such transactions. Recognized gains or losses on investment transactions attributable to changes in foreign currency exchange rates are recorded for financial statement purposes as net realized gains and losses on investments. That portion of unrealized gains and losses on investments that results from fluctuations in foreign currency exchange rates is not separately disclosed.
G Use of Estimates — The preparation of the financial statements in conformity with U.S. GAAP requires management to make estimates and assumptions that affect the reported amounts of assets and liabilities at the date of the financial statements and the reported amounts of income and expense during the reporting period. Actual results could differ from those estimates.
H Indemnifications — Under the Trust’s organizational documents, its officers and Trustees may be indemnified against certain liabilities and expenses arising out of the performance of their duties to the Fund. Under Massachusetts law, if certain conditions prevail, shareholders of a Massachusetts business trust (such as the Trust) could be deemed to have personal liability for the obligations of the Trust. However, the Trust’s Declaration of Trust contains an express disclaimer of liability on the part of Fund shareholders and the By-laws provide that the Trust shall assume, upon request by the shareholder, the defense on behalf of any Fund shareholders. Moreover, the By-laws also provide for indemnification out of Fund property of any shareholder held personally liable solely by reason of being or having been a shareholder for all loss or expense arising from such liability. Additionally, in the normal course of business, the Fund enters into agreements with service providers that may contain indemnification clauses. The Fund’s maximum exposure under these arrangements is unknown as this would involve future claims that may be made against the Fund that have not yet occurred.
I Financial Futures Contracts — Upon entering into a financial futures contract, the Fund is required to deposit with the broker, either in cash or securities, an amount equal to a certain percentage of the contract amount (initial margin). Subsequent payments, known as variation margin, are made or received by the Fund each business day, depending on the daily fluctuations in the value of the underlying security, and are recorded as unrealized gains or losses by the Fund. Gains (losses) are realized upon the expiration or closing of the financial futures contracts. Should market conditions change unexpectedly, the Fund may not achieve the anticipated benefits of the financial futures contracts and may realize a loss. Futures contracts have minimal counterparty risk as they are exchange traded and the clearinghouse for the exchange is substituted as the counterparty, guaranteeing counterparty performance.
J Forward Foreign Currency Exchange Contracts — The Fund may enter into forward foreign currency exchange contracts for the purchase or sale of a specific foreign currency at a fixed price on a future date. The forward foreign currency exchange contracts are adjusted by the daily exchange rate of the underlying currency and any gains or losses are recorded as unrealized until such time as the contracts have been closed. Risks may arise upon entering these contracts from the potential inability of counterparties to meet the terms of their contracts and from movements in the value of a foreign currency relative to the U.S. dollar.
K When-Issued Securities and Delayed Delivery Transactions — The Fund may purchase securities on a delayed delivery, when-issued or forward commitment basis, including TBA (To Be Announced) securities. Payment and delivery may take place after the customary settlement period for that security. At the time the transaction is negotiated, the price of the security that will be delivered is fixed. The Fund maintains cash and/or security positions for these commitments such that sufficient liquid assets will be available to make payments upon settlement. Securities purchased on a delayed delivery, when-issued or forward commitment basis are marked-to-market daily and begin earning interest on settlement date. Such security purchases are subject
Eaton Vance
Total Return Bond Fund
September 30, 2021
Notes to Financial Statements — continued
to the risk that when delivered they will be worth less than the agreed upon payment price. Losses may also arise if the counterparty does not perform under the contract. A forward purchase commitment may also be closed by entering into an offsetting commitment. If an offsetting commitment is entered into, the Fund will realize a gain or loss on investments based on the price established when the Fund entered into the commitment.
2 Distributions to Shareholders and Income Tax Information
The Fund declares dividends daily to shareholders of record at the time of declaration. Distributions are generally paid monthly. Distributions of realized capital gains are made at least annually. Distributions to shareholders are recorded on the ex-dividend date. Distributions are declared separately for each class of shares. Shareholders may reinvest income and capital gain distributions in additional shares of the same class of the Fund at the net asset value as of the ex-dividend date or, at the election of the shareholder, receive distributions in cash. Distributions to shareholders are determined in accordance with income tax regulations, which may differ from U.S. GAAP. As required by U.S. GAAP, only distributions in excess of tax basis earnings and profits are reported in the financial statements as a return of capital. Permanent differences between book and tax accounting relating to distributions are reclassified to paid-in capital. For tax purposes, distributions from short-term capital gains are considered to be from ordinary income.
The tax character of distributions declared for the years ended September 30, 2021 and September 30, 2020 was as follows:
| | | | | | | | |
| | | Year Ended September 30, | |
| | | 2021 | | | 2020 | |
| | |
Ordinary income | | $ | 19,424,793 | | | $ | 32,401,832 | |
| | |
Long-term capital gains | | $ | 3,271,234 | | | $ | — | |
During the year ended September 30, 2021, distributable earnings was decreased by $576,989 and paid-in capital was increased by $576,989 due to the Fund’s use of equalization accounting. Tax equalization accounting allows the Fund to treat as a distribution that portion of redemption proceeds representing a redeeming shareholder’s portion of undistributed taxable income and net capital gains. These reclassifications had no effect on the net assets or net asset value per share of the Fund.
As of September 30, 2021, the components of distributable earnings (accumulated loss) on a tax basis were as follows:
| | | | |
| | |
Undistributed long-term capital gains | | $ | 5,208,841 | |
| |
Late year ordinary losses | | | (432,871 | ) |
| |
Net unrealized appreciation | | | 3,668,465 | |
| |
Distributions payable | | | (7,279 | ) |
| |
Distributable earnings | | $ | 8,437,156 | |
At September 30, 2021, the Fund had a late year ordinary loss of $432,871 which it has elected to defer to the following taxable year pursuant to income tax regulations. Late year ordinary losses represent certain specified losses realized in that portion of a taxable year after October 31 that are treated as ordinary for tax purposes plus ordinary losses attributable to that portion of a taxable year after December 31.
The cost and unrealized appreciation (depreciation) of investments, including open derivative contracts, of the Fund at September 30, 2021, as determined on a federal income tax basis, were as follows:
| | | | |
| |
Aggregate cost | | $ | 800,797,740 | |
| |
Gross unrealized appreciation | | $ | 20,392,729 | |
| |
Gross unrealized depreciation | | | (16,655,638 | ) |
| |
Net unrealized appreciation | | $ | 3,737,091 | |
3 Investment Adviser Fee and Other Transactions with Affiliates
The investment adviser fee is earned by Boston Management and Research (BMR) as compensation for investment advisory services rendered to the Fund. On March 1, 2021, Morgan Stanley acquired Eaton Vance Corp. (the “Transaction”) and BMR became an indirect, wholly-owned subsidiary of Morgan Stanley. In
Eaton Vance
Total Return Bond Fund
September 30, 2021
Notes to Financial Statements — continued
connection with the Transaction, the Fund entered into a new investment advisory agreement (the “New Agreement”) with BMR, which took effect on March 1, 2021. The Fund’s prior fee reduction agreement was incorporated into the New Agreement. Pursuant to the New Agreement (and the Fund’s investment advisory agreement and related fee reduction agreement with BMR in effect prior to March 1, 2021), the fee is computed at an annual rate as a percentage of average daily net assets as follows and is payable monthly:
| | | | |
| Average Daily Net Assets | | Annual Fee Rate | |
| |
Up to $1 billion | | | 0.450 | % |
| |
$1 billion but less than $2.5 billion | | | 0.425 | % |
| |
$2.5 billion but less than $5 billion | | | 0.410 | % |
| |
Over $5 billion | | | 0.400 | % |
For the year ended September 30, 2021, the investment adviser fee amounted to $3,132,936 or 0.45% of the Fund’s average daily net assets. The Fund may invest its cash in Cash Reserves Fund. EVM does not currently receive a fee for advisory services provided to Cash Reserves Fund.
BMR has agreed to reimburse the Fund’s expenses to the extent that total annual operating expenses (relating to ordinary operating expenses only) exceed 0.74%, 1.49% and 0.49% of the Fund’s average daily net assets for Class A, Class C and Class I, respectively. This agreement may be changed or terminated after January 31, 2022. Pursuant to this agreement, BMR was allocated $558,337 of the Fund’s operating expenses for the year ended September 30, 2021.
EVM, an affiliate of BMR and, effective March 1, 2021, an indirect, wholly-owned subsidiary of Morgan Stanley, serves as the administrator of the Fund, but receives no compensation. EVM provides sub-transfer agency and related services to the Fund pursuant to a Sub-Transfer Agency Support Services Agreement. For the year ended September 30, 2021, EVM earned $7,992 from the Fund pursuant to such agreement, which is included in transfer and dividend disbursing agent fees on the Statement of Operations. The Fund was informed that Eaton Vance Distributors, Inc. (EVD), an affiliate of EVM and the Fund’s principal underwriter, received $22,014 as its portion of the sales charge on sales of Class A shares for the year ended September 30, 2021. EVD also received distribution and service fees from Class A and Class C shares (see Note 4) and contingent deferred sales charges (see Note 5).
Trustees and officers of the Fund who are members of EVM’s or BMR’s organizations receive remuneration for their services to the Fund out of the investment adviser fee. Trustees of the Fund who are not affiliated with the investment adviser may elect to defer receipt of all or a percentage of their annual fees in accordance with the terms of the Trustees Deferred Compensation Plan. For the year ended September 30, 2021, no significant amounts have been deferred. Certain officers and Trustees of the Fund are officers of the above organizations.
4 Distribution Plans
The Fund has in effect a distribution plan for Class A shares (Class A Plan) pursuant to Rule 12b-1 under the 1940 Act. Pursuant to the Class A Plan, the Fund pays EVD a distribution and service fee of 0.25% per annum of its average daily net assets attributable to Class A shares for distribution services and facilities provided to the Fund by EVD, as well as for personal services and/or the maintenance of shareholder accounts. Distribution and service fees paid or accrued to EVD for the year ended September 30, 2021 amounted to $263,485 for Class A shares.
The Fund also has in effect a distribution plan for Class C shares (Class C Plan) pursuant to Rule 12b-1 under the 1940 Act. Pursuant to the Class C Plan, the Fund pays EVD amounts equal to 0.75% per annum of its average daily net assets attributable to Class C shares for providing ongoing distribution services and facilities to the Fund. For the year ended September 30, 2021, the Fund paid or accrued to EVD $375,276 for Class C shares.
Pursuant to the Class C Plan, the Fund also makes payments of service fees to EVD, financial intermediaries and other persons in amounts equal to 0.25% per annum of its average daily net assets attributable to that class. Service fees paid or accrued are for personal services and/or the maintenance of shareholder accounts. They are separate and distinct from the sales commissions and distribution fees payable to EVD. Service fees paid or accrued for the year ended September 30, 2021 amounted to $125,092 for Class C shares.
Distribution and service fees are subject to the limitations contained in the Financial Industry Regulatory Authority Rule 2341(d).
5 Contingent Deferred Sales Charges
A contingent deferred sales charge (CDSC) of 1% generally is imposed on redemptions of Class C shares made within 12 months of purchase. Class A shares may be subject to a 1% CDSC if redeemed within 18 months of purchase (depending on the circumstances of purchase). Generally, the CDSC is based upon the lower of the net asset value at date of redemption or date of purchase. No charge is levied on shares acquired by reinvestment of dividends or capital gain distributions. For the year ended September 30, 2021, the Fund was informed that EVD received approximately $3,000 of CDSCs paid by Class C shareholders and no CDSCs paid by Class A shareholders.
Eaton Vance
Total Return Bond Fund
September 30, 2021
Notes to Financial Statements — continued
6 Purchases and Sales of Investments
Purchases and sales of investments, other than short-term obligations and including maturities, paydowns, TBA transactions, and principal repayments on Senior Loans, for the year ended September 30, 2021 were as follows:
| | | | | | | | |
| | | Purchases | | | Sales | |
| | |
Investments (non-U.S. Government) | | $ | 195,824,544 | | | $ | 308,794,303 | |
| | |
U.S. Government and Agency Securities | | | 439,547,453 | | | | 262,042,984 | |
| | |
| | | $ | 635,371,997 | | | $ | 570,837,287 | |
7 Shares of Beneficial Interest
The Fund’s Declaration of Trust permits the Trustees to issue an unlimited number of full and fractional shares of beneficial interest (without par value). Such shares may be issued in a number of different series (such as the Fund) and classes. Transactions in Fund shares were as follows:
| | | | | | | | |
| | | Year Ended September 30, | |
| Class A | | 2021 | | | 2020 | |
| | |
Sales | | | 1,767,058 | | | | 6,302,006 | |
| | |
Issued to shareholders electing to receive payments of distributions in Fund shares | | | 266,441 | | | | 472,350 | |
| | |
Redemptions | | | (5,191,095 | ) | | | (6,877,085 | ) |
| | |
Converted from Class C shares | | | 298,148 | | | | 168,107 | |
| | |
Net increase (decrease) | | | (2,859,448 | ) | | | 65,378 | |
| |
| | | Year Ended September 30, | |
| Class C | | 2021 | | | 2020 | |
| | |
Sales | | | 776,166 | | | | 2,176,977 | |
| | |
Issued to shareholders electing to receive payments of distributions in Fund shares | | | 98,682 | | | | 141,502 | |
| | |
Redemptions | | | (1,236,193 | ) | | | (1,901,835 | ) |
| | |
Converted to Class A shares | | | (298,222 | ) | | | (168,167 | ) |
| | |
Net increase (decrease) | | | (659,567 | ) | | | 248,477 | |
| |
| | | Year Ended September 30, | |
| Class I | | 2021 | | | 2020 | |
| | |
Sales | | | 21,841,638 | | | | 38,844,043 | |
| | |
Issued to shareholders electing to receive payments of distributions in Fund shares | | | 1,485,630 | | | | 2,151,884 | |
| | |
Redemptions | | | (17,164,251 | ) | | | (47,985,690 | ) |
| | |
Net increase (decrease) | | | 6,163,017 | | | | (6,989,763 | ) |
8 Financial Instruments
The Fund may trade in financial instruments with off-balance sheet risk in the normal course of its investing activities. These financial instruments may include financial futures contracts and forward foreign currency exchange contracts and may involve, to a varying degree, elements of risk in excess of the amounts recognized for financial statement purposes. The notional or contractual amounts of these instruments represent the investment the Fund has in particular classes of financial instruments and do not necessarily represent the amounts potentially subject to risk. The measurement of the risks associated with these instruments is
Eaton Vance
Total Return Bond Fund
September 30, 2021
Notes to Financial Statements — continued
meaningful only when all related and offsetting transactions are considered. A summary of obligations under these financial instruments at September 30, 2021 is included in the Portfolio of Investments. At September 30, 2021, the Fund had sufficient cash and/or securities to cover commitments under these contracts.
In the normal course of pursuing its investment objective, the Fund is subject to the following risks:
Interest Rate Risk: The Fund enters into interest rate futures contracts to seek to hedge against fluctuations in interest rates and/or to change the effective duration of its portfolio.
Foreign Exchange Risk: During the year ended September 30, 2021, the Fund engaged in forward foreign currency exchange contracts to enhance total return, to seek to hedge against fluctuations in currency exchange rates and/or as a substitute for the purchase or sale of securities or currencies.
The Fund enters into forward foreign currency exchange contracts that may contain provisions whereby the counterparty may terminate the contract under certain conditions, including but not limited to a decline in the Fund’s net assets below a certain level over a certain period of time, which would trigger a payment by the Fund for those derivatives in a liability position. At September 30, 2021, the Fund had no open derivatives with credit-related contingent features in a net liability position.
The over-the-counter (OTC) derivatives in which the Fund invests are subject to the risk that the counterparty to the contract fails to perform its obligations under the contract. To mitigate this risk, the Fund has entered into an International Swaps and Derivatives Association, Inc. Master Agreement (“ISDA Master Agreement”) or similar agreement with its derivative counterparties. An ISDA Master Agreement is a bilateral agreement between the Fund and a counterparty that governs certain OTC derivatives and typically contains, among other things, set-off provisions in the event of a default and/or termination event as defined under the relevant ISDA Master Agreement. Under an ISDA Master Agreement, the Fund may, under certain circumstances, offset with the counterparty certain derivative financial instruments’ payables and/or receivables with collateral held and/or posted and create one single net payment. The provisions of the ISDA Master Agreement typically permit a single net payment in the event of default including the bankruptcy or insolvency of the counterparty. However, bankruptcy or insolvency laws of a particular jurisdiction may impose restrictions on or prohibitions against the right of offset in bankruptcy or insolvency. Certain ISDA Master Agreements allow counterparties to OTC derivatives to terminate derivative contracts prior to maturity in the event the Fund’s net assets decline by a stated percentage or the Fund fails to meet the terms of its ISDA Master Agreements, which would cause the counterparty to accelerate payment by the Fund of any net liability owed to it.
The collateral requirements for derivatives traded under an ISDA Master Agreement are governed by a Credit Support Annex to the ISDA Master Agreement. Collateral requirements are determined at the close of business each day and are typically based on changes in market values for each transaction under an ISDA Master Agreement and netted into one amount for such agreement. Generally, the amount of collateral due from or to a counterparty is subject to a minimum transfer threshold amount before a transfer is required, which may vary by counterparty. Collateral pledged for the benefit of the Fund and/or counterparty is held in segregated accounts by the Fund’s custodian and cannot be sold, re-pledged, assigned or otherwise used while pledged. The portion of such collateral representing cash, if any, is reflected as deposits for derivatives collateral and, in the case of cash pledged by a counterparty for the benefit of the Fund, a corresponding liability on the Statement of Assets and Liabilities. Securities pledged by the Fund as collateral, if any, are identified as such in the Portfolio of Investments.
The fair value of open derivative instruments (not considered to be hedging instruments for accounting disclosure purposes) and whose primary underlying risk exposure is interest rate risk at September 30, 2021 was as follows:
| | | | | | | | |
| | | Fair Value | |
| Derivative | | Asset Derivative | | | Liability Derivative | |
| | |
Futures contracts | | $ | 1,581,170 | (1) | | $ | — | |
| (1) | Only the current day’s variation margin on open futures contracts is reported within the Statement of Assets and Liabilities as Receivable or Payable for variation margin on open financial futures contracts, as applicable. |
Eaton Vance
Total Return Bond Fund
September 30, 2021
Notes to Financial Statements — continued
The effect of derivative instruments (not considered to be hedging instruments for accounting disclosure purposes) on the Statement of Operations by risk exposure for the year ended September 30, 2021 was as follows:
| | | | | | | | | | |
| Risk | | Derivative | | Realized Gain (Loss)
on Derivatives Recognized
in Income(1) | | | Change in Unrealized
Appreciation (Depreciation) on
Derivatives Recognized in Income(2) | |
| | | |
Interest Rate | | Futures contracts | | $ | 516,643 | | | $ | 1,832,275 | |
| | | |
Foreign Exchange | | Forward foreign currency exchange contracts | | | (99,579 | ) | | | (33,816 | ) |
| | | |
Total | | | | $ | 417,064 | | | $ | 1,798,459 | |
| (1) | Statement of Operations location: Net realized gain (loss) – Financial futures contracts and Forward foreign currency exchange contracts, respectively. |
| (2) | Statement of Operations location: Change in unrealized appreciation (depreciation) – Financial futures contracts and Forward foreign currency exchange contracts, respectively. |
The average notional cost of futures contracts and average notional amounts of other derivative contracts outstanding during the year ended September 30, 2021, which are indicative of the volume of these derivative types, were approximately as follows:
| | | | | | | | | | |
Futures
Contracts — Long | | | Futures
Contracts — Short | | | Forward Foreign
Currency Exchange
Contracts* | |
| | |
| | $15,261,000 | | | $ | 85,960,000 | | | $ | 3,648,000 | |
| * | The average notional amount of forward foreign currency exchange contracts is based on the absolute value of notional amounts of currency purchased and currency sold. |
9 Line of Credit
The Fund participates with other portfolios and funds managed by EVM and its affiliates in an $800 million unsecured line of credit agreement with a group of banks, which is in effect through October 26, 2021. Borrowings are made by the Fund solely for temporary purposes related to redemptions and other short-term cash needs. Interest is charged to the Fund based on its borrowings at an amount above either the Eurodollar rate or Federal Funds rate. In addition, a fee computed at an annual rate of 0.15% on the daily unused portion of the line of credit is allocated among the participating portfolios and funds at the end of each quarter. In connection with the renewal of the agreement in October 2020, an upfront fee and arrangement fee totaling $950,000 was incurred that was allocated to the participating portfolios and funds. Because the line of credit is not available exclusively to the Fund, it may be unable to borrow some or all of its requested amounts at any particular time. The Fund did not have any significant borrowings or allocated fees during the year ended September 30, 2021. Effective October 26, 2021, the Fund renewed its line of credit agreement, which expires October 25, 2022, at substantially the same terms.
10 Overdraft Advances
Pursuant to the custodian agreement, State Street Bank and Trust Company (SSBT) may, in its discretion, advance funds to the Fund to make properly authorized payments. When such payments result in an overdraft, the Fund is obligated to repay SSBT at the current rate of interest charged by SSBT for secured loans (currently, the Federal Funds rate plus 2%). This obligation is payable on demand to SSBT. SSBT has a lien on the Fund’s assets to the extent of any overdraft. At September 30, 2021, the Fund had a payment due to SSBT pursuant to the foregoing arrangement of $1,700,811. Based on the short-term nature of these payments and the variable interest rate, the carrying value of the overdraft advances approximated its fair value at September 30, 2021. If measured at fair value, overdraft advances would have been considered as Level 2 in the fair value hierarchy (see Note 12) at September 30, 2021. The Fund’s average overdraft advances during the year ended September 30, 2021 were not significant.
Eaton Vance
Total Return Bond Fund
September 30, 2021
Notes to Financial Statements — continued
11 Investments in Affiliated Issuers and Funds
The Fund invested in issuers that may be deemed to be affiliated with Morgan Stanley. At September 30, 2021, the value of the Fund’s investment in affiliated issuers and funds was $52,848,940, which represents 6.7% of the Fund’s net assets. Transactions in affiliated issuers and funds by the Fund for the year ended September 30, 2021 were as follows:
| | | | | | | | | | | | | | | | | | | | | | | | | | | | | | | | |
| Name | | Value, beginning
of period | | | Purchases | | | Sales
proceeds | | | Net
realized
gain (loss) | | | Change in
unrealized
appreciation
(depreciation) | | | Value, end
of period | | | Interest/ Dividend
income | | | Principal amount/ Units, end
of period | |
|
Commercial Mortgage-Backed Securities | |
|
Morgan Stanley Bank of America Merrill Lynch Trust | |
| | | | | | | | |
Series 2016-C29, Class C, 4.891%, 5/15/49(1) | | $ | — | | | $ | — | | | $ | — | | | $ | — | | | $ | (17,982 | ) | | $ | 4,420,922 | | | $ | 118,828 | | | $ | 4,199,000 | |
| | | | | | | | |
Series 2016-C29, Class D, 3.00%, 5/15/49(1) | | | — | | | | — | | | | — | | | | — | | | | 118,685 | | | | 6,171,758 | | | | 145,549 | | | | 7,048,000 | |
| | | | | | | | |
Series 2016-C32, Class D, 3.396%, 12/15/49(1) | | | — | | | | — | | | | — | | | | — | | | | 226,546 | | | | 4,156,243 | | | | 118,102 | | | | 5,000,000 | |
|
Morgan Stanley Capital I Trust | |
| | | | | | | | |
Series 2016-UBS12, Class D,
3.312%, 12/15/49(1) | | | — | | | | — | | | | — | | | | — | | | | 3,890 | | | | 4,135,435 | | | | 171,040 | | | | 7,150,000 | |
| | | | | | | | |
Series 2019-BPR, Class B, 2.184%, (1 mo. USD LIBOR + 2.10%), 5/15/36(1) | | | — | | | | — | | | | — | | | | — | | | | 91,676 | | | | 3,760,855 | | | | 58,669 | | | | 3,960,000 | |
| | | | | | | | |
Series 2019-BPR, Class C, 3.134%, (1 mo. USD LIBOR + 3.05%), 5/15/36(1) | | | — | | | | — | | | | — | | | | — | | | | 68,945 | | | | 1,388,682 | | | | 28,889 | | | | 1,540,000 | |
|
Short-Term Investments | |
| | | | | | | | |
Eaton Vance Cash Reserves Fund, LLC | | | 18,277,199 | | | | 353,285,044 | | | | (342,747,226 | ) | | | 28 | | | | — | | | | 28,815,045 | | | | 38,229 | | | | 28,815,045 | |
| | | | | | | | |
| | | | | | | | | | | | | | | $ | 28 | | | $ | 491,760 | | | $ | 52,848,940 | | | $ | 679,306 | | | | | |
| (1) | May be deemed to be an affiliated issuer as of March 1, 2021 (see Note 3). |
12 Fair Value Measurements
Under generally accepted accounting principles for fair value measurements, a three-tier hierarchy to prioritize the assumptions, referred to as inputs, is used in valuation techniques to measure fair value. The three-tier hierarchy of inputs is summarized in the three broad levels listed below.
| • | | Level 1 – quoted prices in active markets for identical investments |
| • | | Level 2 – other significant observable inputs (including quoted prices for similar investments, interest rates, prepayment speeds, credit risk, etc.) |
| • | | Level 3 – significant unobservable inputs (including a fund’s own assumptions in determining the fair value of investments) |
In cases where the inputs used to measure fair value fall in different levels of the fair value hierarchy, the level disclosed is determined based on the lowest level input that is significant to the fair value measurement in its entirety. The inputs or methodology used for valuing securities are not necessarily an indication of the risk associated with investing in those securities.
Eaton Vance
Total Return Bond Fund
September 30, 2021
Notes to Financial Statements — continued
At September 30, 2021, the hierarchy of inputs used in valuing the Fund’s investments and open derivative instruments, which are carried at value, were as follows:
| | | | | | | | | | | | | | | | |
| Asset Description | | Level 1 | | | Level 2 | | | Level 3 | | | Total | |
| | | | |
Asset-Backed Securities | | $ | — | | | $ | 97,427,229 | | | $ | — | | | $ | 97,427,229 | |
| | | | |
Collateralized Mortgage Obligations | | | — | | | | 17,526,611 | | | | — | | | | 17,526,611 | |
| | | | |
Commercial Mortgage-Backed Securities | | | — | | | | 105,796,302 | | | | — | | | | 105,796,302 | |
| | | | |
Convertible Bonds | | | — | | | | 4,319,348 | | | | — | | | | 4,319,348 | |
| | | | |
Corporate Bonds | | | — | | | | 258,859,663 | | | | — | | | | 258,859,663 | |
| | | | |
Preferred Stocks | | | 9,580,665 | | | | — | | | | — | | | | 9,580,665 | |
| | | | |
Senior Floating-Rate Loans | | | — | | | | 4,743,642 | | | | — | | | | 4,743,642 | |
| | | | |
Sovereign Government Bonds | | | — | | | | 13,019,604 | | | | — | | | | 13,019,604 | |
| | | | |
U.S. Government Agency Mortgage-Backed Securities | | | — | | | | 23,164,383 | | | | — | | | | 23,164,383 | |
| | | | |
U.S. Treasury Obligations | | | — | | | | 241,282,339 | | | | — | | | | 241,282,339 | |
| | | | |
Short-Term Investments | | | — | | | | 28,815,045 | | | | — | | | | 28,815,045 | |
| | | | |
Total Investments | | $ | 9,580,665 | | | $ | 794,954,166 | | | $ | — | | | $ | 804,534,831 | |
| | | | |
Futures Contracts | | $ | 1,581,170 | | | $ | — | | | $ | — | | | $ | 1,581,170 | |
| | | | |
Total | | $ | 11,161,835 | | | $ | 794,954,166 | | | $ | — | | | $ | 806,116,001 | |
Level 3 investments at the beginning and/or end of the period in relation to net assets were not significant and accordingly, a reconciliation of Level 3 assets for the year ended September 30, 2021 is not presented.
13 Risks and Uncertainties
Risks Associated with Foreign Investments
Foreign investments can be adversely affected by political, economic and market developments abroad, including the imposition of economic and other sanctions by the United States or another country. There may be less publicly available information about foreign issuers because they may not be subject to reporting practices, requirements or regulations comparable to those to which United States companies are subject. Foreign markets may be smaller, less liquid and more volatile than the major markets in the United States. Trading in foreign markets typically involves higher expense than trading in the United States. The Fund may have difficulties enforcing its legal or contractual rights in a foreign country. Securities that trade or are denominated in currencies other than the U.S. dollar may be adversely affected by fluctuations in currency exchange rates.
Economic data as reported by sovereign entities may be delayed, inaccurate or fraudulent. In the event of a default by a sovereign entity, there are typically no assets to be seized or cash flows to be attached. Furthermore, the willingness or ability of a sovereign entity to restructure defaulted debt may be limited. Therefore, losses on sovereign defaults may far exceed the losses from the default of a similarly rated U.S. debt issuer.
Pandemic Risk
An outbreak of respiratory disease caused by a novel coronavirus was first detected in China in late 2019 and subsequently spread internationally. This coronavirus has resulted in closing borders, enhanced health screenings, changes to healthcare service preparation and delivery, quarantines, cancellations, disruptions to supply chains and customer activity, as well as general concern and uncertainty. Health crises caused by outbreaks, such as the coronavirus outbreak, may exacerbate other pre-existing political, social and economic risks and disrupt normal market conditions and operations. The impact of this outbreak has negatively affected the worldwide economy, the economies of individual countries, individual companies, and the market in general, and may continue to do so in significant and unforeseen ways, as may other epidemics and pandemics that may arise in the future. Any such impact could adversely affect the Fund’s performance, or the performance of the securities in which the Fund invests.
14 Name Change
Effective November 15, 2021, the name of Eaton Vance Total Return Bond Fund was changed from Eaton Vance Core Plus Bond Fund.
Eaton Vance
Total Return Bond Fund
September 30, 2021
Report of Independent Registered Public Accounting Firm
To the Trustees of Eaton Vance Mutual Funds Trust and Shareholders of Eaton Vance Total Return Bond Fund:
Opinion on the Financial Statements and Financial Highlights
We have audited the accompanying statement of assets and liabilities of Eaton Vance Total Return Bond Fund (formerly, Eaton Vance Core Plus Bond Fund) (the “Fund”) (one of the funds constituting Eaton Vance Mutual Funds Trust), including the portfolio of investments, as of September 30, 2021, the related statement of operations for the year then ended, the statements of changes in net assets for each of the two years in the period then ended, the financial highlights for each of the five years in the period then ended, and the related notes. In our opinion, the financial statements and financial highlights present fairly, in all material respects, the financial position of the Fund as of September 30, 2021, and the results of its operations for the year then ended, the changes in its net assets for each of the two years in the period then ended, and the financial highlights for each of the five years in the period then ended, in conformity with accounting principles generally accepted in the United States of America.
Basis for Opinion
These financial statements and financial highlights are the responsibility of the Fund’s management. Our responsibility is to express an opinion on the Fund’s financial statements and financial highlights based on our audits. We are a public accounting firm registered with the Public Company Accounting Oversight Board (United States) (PCAOB) and are required to be independent with respect to the Fund in accordance with the U.S. federal securities laws and the applicable rules and regulations of the Securities and Exchange Commission and the PCAOB.
We conducted our audits in accordance with the standards of the PCAOB. Those standards require that we plan and perform the audit to obtain reasonable assurance about whether the financial statements and financial highlights are free of material misstatement, whether due to error or fraud. The Fund is not required to have, nor were we engaged to perform, an audit of its internal control over financial reporting. As part of our audits we are required to obtain an understanding of internal control over financial reporting but not for the purpose of expressing an opinion on the effectiveness of the Fund’s internal control over financial reporting. Accordingly, we express no such opinion.
Our audits included performing procedures to assess the risks of material misstatement of the financial statements and financial highlights, whether due to error or fraud, and performing procedures that respond to those risks. Such procedures included examining, on a test basis, evidence regarding the amounts and disclosures in the financial statements and financial highlights. Our audits also included evaluating the accounting principles used and significant estimates made by management, as well as evaluating the overall presentation of the financial statements and financial highlights. Our procedures included confirmation of securities owned as of September 30, 2021, by correspondence with the custodian and brokers; when replies were not received from brokers, we performed other auditing procedures. We believe that our audits provide a reasonable basis for our opinion.
/s/ Deloitte & Touche LLP
Boston, Massachusetts
November 19, 2021
We have served as the auditor of one or more Eaton Vance investment companies since 1959.
Eaton Vance
Total Return Bond Fund
September 30, 2021
Federal Tax Information (Unaudited)
The Form 1099-DIV you receive in February 2022 will show the tax status of all distributions paid to your account in calendar year 2021. Shareholders are advised to consult their own tax adviser with respect to the tax consequences of their investment in the Fund. As required by the Internal Revenue Code and/or regulations, shareholders must be notified regarding the status of qualified dividend income for individuals, 163(j) interest dividends and capital gains dividends.
Qualified Dividend Income. For the fiscal year ended September 30, 2021, the Fund designates approximately $110,962, or up to the maximum amount of such dividends allowable pursuant to the Internal Revenue Code, as qualified dividend income eligible for the reduced tax rate of 15%.
163(j) Interest Dividends. For the fiscal year ended September 30, 2021, the Fund designates 100% of distributions from net investment income as a 163(j) interest dividend.
Capital Gains Dividends. The Fund hereby designates as a capital gain dividend with respect to the taxable year ended September 30, 2021, $7,091,302 or, if subsequently determined to be different, the net capital gain of such year.
Eaton Vance
Total Return Bond Fund
September 30, 2021
Liquidity Risk Management Program
The Fund has implemented a written liquidity risk management program (Program) and related procedures to manage its liquidity in accordance with Rule 22e-4 under the Investment Company Act of 1940, as amended (Liquidity Rule). The Liquidity Rule defines “liquidity risk” as the risk that a fund could not meet requests to redeem shares issued by the fund without significant dilution of the remaining investors’ interests in the fund. The Fund’s Board of Trustees/Directors has designated the investment adviser to serve as the administrator of the Program and the related procedures. The administrator has established a Liquidity Risk Management Oversight Committee (Committee) to perform the functions necessary to administer the Program. As part of the Program, the administrator is responsible for identifying illiquid investments and categorizing the relative liquidity of the Fund’s investments in accordance with the Liquidity Rule. Under the Program, the administrator assesses, manages, and periodically reviews the Fund’s liquidity risk, and is responsible for making certain reports to the Fund’s Board of Trustees/Directors and the Securities and Exchange Commission (SEC) regarding the liquidity of the Fund’s investments, and to notify the Board of Trustees/Directors and the SEC of certain liquidity events specified in the Liquidity Rule. The liquidity of the Fund’s portfolio investments is determined based on a number of factors including, but not limited to, relevant market, trading and investment-specific considerations under the Program.
At a meeting of the Fund’s Board of Trustees/Directors on June 8, 2021, the Committee provided a written report to the Fund’s Board of Trustees/Directors pertaining to the operation, adequacy, and effectiveness of implementation of the Program, as well as the operation of the highly liquid investment minimum (if applicable) for the period January 1, 2020 through December 31, 2020 (Review Period). The Program operated effectively during the Review Period, supporting the administrator’s ability to assess, manage and monitor Fund liquidity risk, including during periods of market volatility and net redemptions. During the Review Period, the Fund met redemption requests on a timely basis.
There can be no assurance that the Program will achieve its objectives in the future. Please refer to the Fund’s prospectus for more information regarding the Fund’s exposure to liquidity risk and other principal risks to which an investment in the Fund may be subject.
Eaton Vance
Total Return Bond Fund
September 30, 2021
Management and Organization
Fund Management. The Trustees of Eaton Vance Mutual Funds Trust (the Trust) are responsible for the overall management and supervision of the Trust’s affairs. The Trustees and officers of the Trust are listed below. Except as indicated, each individual has held the office shown or other offices in the same company for the last five years. Trustees and officers of the Trust hold indefinite terms of office. The “Noninterested Trustees” consist of those Trustees who are not “interested persons” of the Trust, as that term is defined under the 1940 Act. The business address of each Trustee and officer is Two International Place, Boston, Massachusetts 02110. As used below, “EVC” refers to Eaton Vance Corp., “EV” refers to EV LLC, “EVM” refers to Eaton Vance Management, “BMR” refers to Boston Management and Research and “EVD” refers to Eaton Vance Distributors, Inc. EV is the trustee of each of EVM and BMR. Effective March 1, 2021, each of EVM, BMR, EVD and EV are indirect, wholly owned subsidiaries of Morgan Stanley. Each officer affiliated with EVM may hold a position with other EVM affiliates that is comparable to his or her position with EVM listed below. Each Trustee oversees 138 portfolios (with the exception of Messrs. Faust and Wennerholm and Ms. Frost who oversee 137 portfolios) in the Eaton Vance Complex (including all master and feeder funds in a master feeder structure). Each officer serves as an officer of certain other Eaton Vance funds. Each Trustee and officer serves until his or her successor is elected.
| | | | | | |
| Name and Year of Birth | | Trust
Position(s) | | Trustee
Since(1) | | Principal Occupation(s) and Other Directorships During Past Five Years and Other Relevant Experience |
|
| Interested Trustee |
| | | |
Thomas E. Faust Jr. 1958 | | Trustee | | 2007 | | Chairman of Morgan Stanley Investment Management, Inc. (MSIM), member of the Board of Managers and President of EV, Chief Executive Officer of EVM and BMR, and Director of EVD. Formerly, Chairman, Chief Executive Officer and President of EVC. Trustee and/or officer of 137 registered investment companies. Mr. Faust is an interested person because of his positions with MSIM, BMR, EVM, EVD, and EV, which are affiliates of the Trust, and his former position with EVC, which was an affiliate of the Trust prior to March 1, 2021. Other Directorships in the Last Five Years. Formerly, Director of EVC (2007-2021) and Hexavest Inc. (investment management firm) (2012-2021). |
|
| Noninterested Trustees |
| | | |
Mark R. Fetting 1954 | | Trustee | | 2016 | | Private investor. Formerly held various positions at Legg Mason, Inc. (investment management firm) (2000-2012), including President, Chief Executive Officer, Director and Chairman (2008-2012), Senior Executive Vice President (2004-2008) and Executive Vice President (2001-2004). Formerly, President of Legg Mason family of funds (2001-2008). Formerly, Division President and Senior Officer of Prudential Financial Group, Inc. and related companies (investment management firm) (1991-2000). Other Directorships in the Last Five Years. None. |
| | | |
Cynthia E. Frost 1961 | | Trustee | | 2014 | | Private investor. Formerly, Chief Investment Officer of Brown University (university endowment) (2000-2012). Formerly, Portfolio Strategist for Duke Management Company (university endowment manager) (1995-2000). Formerly, Managing Director, Cambridge Associates (investment consulting company) (1989-1995). Formerly, Consultant, Bain and Company (management consulting firm) (1987-1989). Formerly, Senior Equity Analyst, BA Investment Management Company (1983-1985). Other Directorships in the Last Five Years. None. |
| | | |
George J. Gorman 1952 | | Chairperson of the Board and Trustee | | 2021 (Chairperson) and 2014 (Trustee) | | Principal at George J. Gorman LLC (consulting firm). Formerly, Senior Partner at Ernst & Young LLP (a registered public accounting firm) (1974-2009). Other Directorships in the Last Five Years. None. |
| | | |
Valerie A. Mosley 1960 | | Trustee | | 2014 | | Chairwoman and Chief Executive Officer of Valmo Ventures (a consulting and investment firm). Founder of Upward Wealth, Inc., dba BrightUP, a fintech platform. Formerly, Partner and Senior Vice President, Portfolio Manager and Investment Strategist at Wellington Management Company, LLP (investment management firm) (1992-2012). Formerly, Chief Investment Officer, PG Corbin Asset Management (1990-1992). Formerly worked in institutional corporate bond sales at Kidder Peabody (1986-1990). Other Directorships in the Last Five Years. Director of DraftKings, Inc. (digital sports entertainment and gaming company) (since September 2020). Director of Groupon, Inc. (e-commerce provider) (since April 2020). Director of Envestnet, Inc. (provider of intelligent systems for wealth management and financial wellness) (since 2018). Formerly, Director of Dynex Capital, Inc. (mortgage REIT) (2013-2020). |
Eaton Vance
Total Return Bond Fund
September 30, 2021
Management and Organization — continued
| | | | | | |
| Name and Year of Birth | | Trust
Position(s) | | Trustee
Since(1) | | Principal Occupation(s) and Other Directorships During Past Five Years and Other Relevant Experience |
|
| Noninterested Trustees (continued) |
| | | |
William H. Park 1947 | | Trustee | | 2003 | | Private investor. Formerly, Consultant (management and transactional) (2012-2014). Formerly, Chief Financial Officer, Aveon Group L.P. (investment management firm) (2010-2011). Formerly, Vice Chairman, Commercial Industrial Finance Corp. (specialty finance company) (2006-2010). Formerly, President and Chief Executive Officer, Prizm Capital Management, LLC (investment management firm) (2002-2005). Formerly, Executive Vice President and Chief Financial Officer, United Asset Management Corporation (investment management firm) (1982-2001). Formerly, Senior Manager, Price Waterhouse (now PricewaterhouseCoopers) (a registered public accounting firm) (1972-1981). Other Directorships in the Last Five Years. None. |
| | | |
Helen Frame Peters 1948 | | Trustee | | 2008 | | Professor of Finance, Carroll School of Management, Boston College. Formerly, Dean, Carroll School of Management, Boston College (2000-2002). Formerly, Chief Investment Officer, Fixed Income, Scudder Kemper Investments (investment management firm) (1998-1999). Formerly, Chief Investment Officer, Equity and Fixed Income, Colonial Management Associates (investment management firm) (1991-1998). Other Directorships in the Last Five Years. None. |
| | | |
Keith Quinton 1958 | | Trustee | | 2018 | | Private investor, researcher and lecturer. Formerly, Independent Investment Committee Member at New Hampshire Retirement System (2017-2021). Formerly, Portfolio Manager and Senior Quantitative Analyst at Fidelity Investments (investment management firm) (2001-2014). Other Directorships in the Last Five Years. Formerly, Director (2016-2021) and Chairman (2019-2021) of New Hampshire Municipal Bond Bank. |
| | | |
Marcus L. Smith 1966 | | Trustee | | 2018 | | Private investor. Formerly, Portfolio Manager at MFS Investment Management (investment management firm) (1994-2017). Other Directorships in the Last Five Years. Director of First Industrial Realty Trust, Inc. (an industrial REIT) (since 2021). Director of MSCI Inc. (global provider of investment decision support tools) (since 2017). Formerly, Director of DCT Industrial Trust Inc. (logistics real estate company) (2017-2018). |
| | | |
Susan J. Sutherland 1957 | | Trustee | | 2015 | | Private investor. Director of Ascot Group Limited and certain of its subsidiaries (insurance and reinsurance) (since 2017). Formerly, Director of Hagerty Holding Corp. (insurance) (2015-2018) and Montpelier Re Holdings Ltd. (insurance and reinsurance) (2013-2015). Formerly, Associate, Counsel and Partner at Skadden, Arps, Slate, Meagher & Flom LLP (law firm) (1982-2013). Other Directorships in the Last Five Years. Director of Kairos Acquisition Corp. (insurance/InsurTech acquisition company) (since 2021). |
| | | |
Scott E. Wennerholm 1959 | | Trustee | | 2016 | | Private investor. Formerly, Trustee at Wheelock College (postsecondary institution) (2012-2018). Formerly, Consultant at GF Parish Group (executive recruiting firm) (2016-2017). Formerly, Chief Operating Officer and Executive Vice President at BNY Mellon Asset Management (investment management firm) (2005-2011). Formerly, Chief Operating Officer and Chief Financial Officer at Natixis Global Asset Management (investment management firm) (1997-2004). Formerly, Vice President at Fidelity Investments Institutional Services (investment management firm) (1994-1997). Other Directorships in the Last Five Years. None. |
| | | | | | |
| Name and Year of Birth | | Trust
Position(s) | | Officer
Since(2) | | Principal Occupation(s) During Past Five Years |
|
| Principal Officers who are not Trustees |
| | | |
Eric A. Stein 1980 | | President | | 2020 | | Vice President and Chief Investment Officer, Fixed Income of EVM and BMR. Prior to November 1, 2020, Mr. Stein was a co-Director of Eaton Vance’s Global Income Investments. Also Vice President of Calvert Research and Management (“CRM”). |
| | | |
Deidre E. Walsh 1971 | | Vice President and Chief Legal Officer | | 2009 | | Vice President of EVM and BMR. Also Vice President of CRM. |
| | | |
James F. Kirchner 1967 | | Treasurer | | 2007 | | Vice President of EVM and BMR. Also Vice President of CRM. |
Eaton Vance
Total Return Bond Fund
September 30, 2021
Management and Organization — continued
| | | | | | |
| Name and Year of Birth | | Trust
Position(s) | | Officer
Since(2) | | Principal Occupation(s) During Past Five Years |
|
| Principal Officers who are not Trustees (continued) |
| | | |
Kimberly M. Roessiger 1985 | | Secretary | | 2021 | | Vice President of EVM and BMR. |
| | | |
Richard F. Froio 1968 | | Chief Compliance Officer | | 2017 | | Vice President of EVM and BMR since 2017. Formerly, Deputy Chief Compliance Officer (Adviser/Funds) and Chief Compliance Officer (Distribution) at PIMCO (2012-2017) and Managing Director at BlackRock/Barclays Global Investors (2009-2012). |
| (1) | Year first appointed to serve as Trustee for a fund in the Eaton Vance family of funds. Each Trustee has served continuously since appointment unless indicated otherwise. |
| (2) | Year first elected to serve as officer of a fund in the Eaton Vance family of funds when the officer has served continuously. Otherwise, year of most recent election as an officer of a fund in the Eaton Vance family of funds. Titles may have changed since initial election. |
The SAI for the Fund includes additional information about the Trustees and officers of the Fund and can be obtained without charge on Eaton Vance’s website at www.eatonvance.com or by calling 1-800-262-1122.
Eaton Vance Funds
| | |
| Privacy Notice | | April 2021 |
| | |
| |
| FACTS | | WHAT DOES EATON VANCE DO WITH YOUR
PERSONAL INFORMATION? |
| | | |
| |
| | |
| Why? | | Financial companies choose how they share your personal information. Federal law gives consumers the right to limit some but not all sharing. Federal law also requires us to tell you how we collect, share, and protect your personal information. Please read this notice carefully to understand what we do. |
| | |
| | | |
| What? | | The types of personal information we collect and share depend on the product or service you have with us. This information can include: ∎ Social Security number and income ∎ investment experience and risk tolerance ∎ checking account number and wire transfer instructions |
| | |
| | | |
| How? | | All financial companies need to share customers’ personal information to run their everyday business. In the section below, we list the reasons financial companies can share their customers’ personal information; the reasons Eaton Vance chooses to share; and whether you can limit this sharing. |
| | |
| | | |
| | | | |
Reasons we can share your
personal information | | Does Eaton Vance share? | | Can you limit this sharing? |
| For our everyday business purposes — such as to process your transactions, maintain your account(s), respond to court orders and legal investigations, or report to credit bureaus | | Yes | | No |
| For our marketing purposes — to offer our products and services to you | | Yes | | No |
| For joint marketing with other financial companies | | No | | We don’t share |
| For our investment management affiliates’ everyday business purposes — information about your transactions, experiences, and creditworthiness | | Yes | | Yes |
| For our affiliates’ everyday business purposes — information about your transactions and experiences | | Yes | | No |
| For our affiliates’ everyday business purposes — information about your creditworthiness | | No | | We don’t share |
| For our investment management affiliates to market to you | | Yes | | Yes |
| For our affiliates to market to you | | No | | We don’t share |
| For nonaffiliates to market to you | | No | | We don’t share |
| | |
| To limit our sharing | | Call toll-free 1-800-262-1122 or email: EVPrivacy@eatonvance.com Please note: If you are a new customer, we can begin sharing your information 30 days from the date we sent this notice. When you are no longer our customer, we continue to share your information as described in this notice. However, you can contact us at any time to limit our sharing. |
| | |
| | | |
| | |
| Questions? | | Call toll-free 1-800-262-1122 or email: EVPrivacy@eatonvance.com |
| | |
| | | |
Eaton Vance Funds
| | |
| Privacy Notice — continued | | April 2021 |
| | |
| Who we are |
| Who is providing this notice? | | Eaton Vance Management, Eaton Vance Distributors, Inc., Eaton Vance Trust Company, Eaton Vance Management (International) Limited, Eaton Vance Advisers International Ltd., Eaton Vance Global Advisors Limited, Eaton Vance Management’s Real Estate Investment Group, Boston Management and Research, Calvert Research and Management, Eaton Vance and Calvert Fund Families and our investment advisory affiliates (“Eaton Vance”) (see Investment Management Affiliates definition below) |
| What we do |
| How does Eaton Vance protect my personal information? | | To protect your personal information from unauthorized access and use, we use security measures that comply with federal law. These measures include computer safeguards and secured files and buildings. We have policies governing the proper handling of customer information by personnel and requiring third parties that provide support to adhere to appropriate security standards with respect to such information. |
| How does Eaton Vance collect my personal information? | | We collect your personal information, for example, when you ∎ open an account or make deposits or withdrawals from your account ∎ buy securities from us or make a wire transfer ∎ give us your contact information We also collect your personal information from others, such as credit bureaus, affiliates, or other companies. |
| Why can’t I limit all sharing? | | Federal law gives you the right to limit only ∎ sharing for affiliates’ everyday business purposes — information about your creditworthiness ∎ affiliates from using your information to market to you ∎ sharing for nonaffiliates to market to you State laws and individual companies may give you additional rights to limit sharing. See below for more on your rights under state law. |
| Definitions |
| Investment Management Affiliates | | Eaton Vance Investment Management Affiliates include registered investment advisers, registered broker-dealers, and registered and unregistered funds. Investment Management Affiliates does not include entities associated with Morgan Stanley Wealth Management, such as Morgan Stanley Smith Barney LLC and Morgan Stanley & Co. |
| Affiliates | | Companies related by common ownership or control. They can be financial and nonfinancial companies. ∎ Our affiliates include companies with a Morgan Stanley name and financial companies such as Morgan Stanley Smith Barney LLC and Morgan Stanley & Co. |
| Nonaffiliates | | Companies not related by common ownership or control. They can be financial and nonfinancial companies. ∎ Eaton Vance does not share with nonaffiliates so they can market to you. |
| Joint marketing | | A formal agreement between nonaffiliated financial companies that together market financial products or services to you. ∎ Eaton Vance doesn’t jointly market. |
| Other important information |
Vermont: Except as permitted by law, we will not share personal information we collect about Vermont residents with Nonaffiliates unless you provide us with your written consent to share such information. California: Except as permitted by law, we will not share personal information we collect about California residents with Nonaffiliates and we will limit sharing such personal information with our Affiliates to comply with California privacy laws that apply to us. |
Eaton Vance Funds
IMPORTANT NOTICES
Delivery of Shareholder Documents. The Securities and Exchange Commission (SEC) permits funds to deliver only one copy of shareholder documents, including prospectuses, proxy statements and shareholder reports, to fund investors with multiple accounts at the same residential or post office box address. This practice is often called “householding” and it helps eliminate duplicate mailings to shareholders. Eaton Vance, or your financial intermediary, may household the mailing of your documents indefinitely unless you instruct Eaton Vance, or your financial intermediary, otherwise. If you would prefer that your Eaton Vance documents not be householded, please contact Eaton Vance at 1-800-262-1122, or contact your financial intermediary. Your instructions that householding not apply to delivery of your Eaton Vance documents will typically be effective within 30 days of receipt by Eaton Vance or your financial intermediary.
Portfolio Holdings. Each Eaton Vance Fund and its underlying Portfolio(s) (if applicable) files a schedule of portfolio holdings on Part F to Form N-PORT with the SEC. Certain information filed on Form N-PORT may be viewed on the Eaton Vance website at www.eatonvance.com, by calling Eaton Vance at 1-800-262-1122 or in the EDGAR database on the SEC’s website at www.sec.gov.
Proxy Voting. From time to time, funds are required to vote proxies related to the securities held by the funds. The Eaton Vance Funds or their underlying Portfolios (if applicable) vote proxies according to a set of policies and procedures approved by the Funds’ and Portfolios’ Boards. You may obtain a description of these policies and procedures and information on how the Funds or Portfolios voted proxies relating to portfolio securities during the most recent 12-month period ended June 30, without charge, upon request, by calling 1-800-262-1122 and by accessing the SEC’s website at www.sec.gov.
This Page Intentionally Left Blank
This Page Intentionally Left Blank
Investment Adviser
Boston Management and Research
Two International Place
Boston, MA 02110
Administrator
Eaton Vance Management
Two International Place
Boston, MA 02110
Principal Underwriter*
Eaton Vance Distributors, Inc.
Two International Place
Boston, MA 02110
(617) 482-8260
Custodian
State Street Bank and Trust Company
State Street Financial Center, One Lincoln Street
Boston, MA 02111
Transfer Agent
BNY Mellon Investment Servicing (US) Inc.
Attn: Eaton Vance Funds
P.O. Box 9653
Providence, RI 02940-9653
(800) 262-1122
Independent Registered Public Accounting Firm
Deloitte & Touche LLP
200 Berkeley Street
Boston, MA 02116-5022
Fund Offices
Two International Place
Boston, MA 02110
| * | FINRA BrokerCheck. Investors may check the background of their Investment Professional by contacting the Financial Industry Regulatory Authority (FINRA). FINRA BrokerCheck is a free tool to help investors check the professional background of current and former FINRA-registered securities firms and brokers. FINRA BrokerCheck is available by calling 1-800-289-9999 and at www.FINRA.org. The FINRA BrokerCheck brochure describing this program is available to investors at www.FINRA.org. |

4595 9.30.21

Eaton Vance
Municipal Income Funds
Annual Report
September 30, 2021
AMT-Free • National

Commodity Futures Trading Commission Registration. The Commodity Futures Trading Commission (“CFTC”) has adopted regulations that subject registered investment companies and advisers to regulation by the CFTC if a fund invests more than a prescribed level of its assets in certain CFTC-regulated instruments (including futures, certain options and swap agreements) or markets itself as providing investment exposure to such instruments. Each investment adviser has claimed an exclusion from the definition of “commodity pool operator” under the Commodity Exchange Act with respect to its management of each Fund. Accordingly, neither the Funds nor the adviser with respect to the operation of the Funds is subject to CFTC regulation. Because of its management of other strategies, each Fund’s adviser is registered with the CFTC as a commodity pool operator. Each adviser is also registered as a commodity trading advisor.
Fund shares are not insured by the FDIC and are not deposits or other obligations of, or guaranteed by, any depository institution. Shares are subject to investment risks, including possible loss of principal invested.
This report must be preceded or accompanied by a current summary prospectus or prospectus. Before investing, investors should consider carefully the investment objective, risks, and charges and expenses of a mutual fund. This and other important information is contained in the summary prospectus and prospectus, which can be obtained from a financial intermediary. Prospective investors should read the prospectus carefully before investing. For further information, please call 1-800-262-1122.
Annual Report September 30, 2021
Eaton Vance
Municipal Income Funds
Eaton Vance
Municipal Income Funds
September 30, 2021
Management’s Discussion of Fund Performance1
Economic and Market Conditions
In the opening month of the 12-month period starting October 1, 2020, municipal bond prices fell and yields rose, driven in part by investor uncertainty ahead of the U.S. presidential election and Congress’ failure to pass a second COVID-19 pandemic stimulus bill — $400-$500 billion of which had been projected for state and local government assistance.
In November 2020, however, the municipal market reversed course, beginning a rally that would last through mid-February 2021. Joe Biden’s presidential victory eased the political uncertainties that had dogged investment markets through much of the fall. The announcement that two coronavirus vaccine candidates had proven more than 90% effective in late-stage trials buoyed the markets as well. In December, the beginning of the COVID-19 vaccination process and Congress’ passage of a fiscal stimulus bill added more fuel to the bond rally.
From mid-February through June 2021, however, bonds reversed course again. Municipal and Treasury yields rose and bond prices declined in anticipation of rising economic growth, driven by a new, larger federal stimulus bill and accelerating progress on vaccinating the U.S. population. In late spring and early summer, higher than expected year-over-year inflation numbers also raised investor concerns and put further upward pressure on interest rates.
By July, however, the emergence of a more contagious Delta variant of COVID-19 and breakthrough cases in vaccinated people threatened the U.S. economic rebound and diminished inflation concerns. Investors again turned to U.S. Treasurys and municipal bonds as safe-haven assets, leading bond prices to rise and interest rates to fall in July.
In the final months of the period, bond prices declined once again. A combination of wage inflation and anticipation that the U.S. Federal Reserve (the Fed) would begin tapering its monthly bond purchases — which had bolstered the economy and helped hold rates down through most of the pandemic — conspired to push municipal rates modestly higher. The Fed’s acknowledgement after its September meeting that tapering could begin as early as November put further upward pressure on municipal and Treasury interest rates as the period came to a close.
Nonetheless, demand for municipal bonds remained strong amid concerns over rising taxes for high-income earners under new legislation proposed by the Biden administration.
For the period as a whole, interest rates rose across the municipal bond yield curve, but less at the long — 30-year — end of the curve. As a result, the curve flattened. Throughout the curve, however, rates remained near historic lows. The Bloomberg Municipal Bond Index (the Index), a broad measure of the municipal bond market, returned 2.63% for the period. Municipal bonds outperformed U.S. Treasurys, as Treasury interest rates in every part of the curve rose significantly more than municipal rates. Reflecting investors’ general optimism about an economic rebound and their search for yield in a low-yield environment, high-yield municipal bonds outperformed investment-grade municipal bonds during the period.
Fund Performance
For the 12-month period ended September 30, 2021, Eaton Vance AMT-Free Municipal Income Fund Class A shares at net asset value (NAV) and Eaton Vance National Municipal Income Fund Class A shares at NAV both outperformed their common benchmark, the Index, which returned 2.63%.
In pursuing its objective, each Fund normally acquires municipal obligations with maturities of 10 years or more.
The Funds may seek to enhance tax-exempt income through the use of leveraged investments by purchasing residual interest bonds. Leveraged investments have the effect of magnifying the Funds’ exposure to their underlying investments in both up and down markets. Although municipal bond prices generally declined during the period due to rising interest rates, the use of leverage generated additional tax-exempt bond income for both Funds and, thus, enhanced their performance relative to the Index, which does not employ leverage.
Fund-Specific Results
Eaton Vance AMT-Free Municipal Income Fund returned 3.14% for Class A shares at NAV, outperforming the 2.63% return of the Index during the period.
Contributors to Fund performance versus the Index included security selections and an overweight position relative to the Index in the health care sector, which was the best-performing sector within the Index during the period. Fund performance was also supported by an overweight position in BBB rated bonds during a period when lower rated BBB bonds outperformed higher rated AAA and AA bonds. In addition, an overweight position in bonds with 12-22 years remaining to maturity helped returns during a period when longer maturity bonds generally outperformed shorter-maturity bonds.
In contrast, detractors from returns relative to the Index included an overweight position in prerefunded, or escrowed, bonds; security selections in zero-coupon bonds, which were the best-performing coupon structure within the Index during the period; and an underweight position in bonds with more than 22 years remaining to maturity.
See Endnotes and Additional Disclosures in this report.
Past performance is no guarantee of future results. Returns are historical and are calculated by determining the percentage change in net asset value (NAV) or offering price (as applicable) with all distributions reinvested. Investment return and principal value will fluctuate so that shares, when redeemed, may be worth more or less than their original cost. Performance for periods less than or equal to one year is cumulative. Performance is for the stated time period only; due to market volatility, current Fund performance may be lower or higher than the quoted return. For performance as of the most recent month-end, please refer to eatonvance.com.
Eaton Vance
Municipal Income Funds
September 30, 2021
Management’s Discussion of Fund Performance1 — continued
Eaton Vance National Municipal Income Fund returned 2.99% for Class A shares at NAV, outperforming the 2.63% return of the Index during the period.
Contributors to performance relative to the Index included an overweight position in the transportation sector, which was the second-best performing sector within the Index during the period; security selection and an overweight position in bonds rated BBB and below, including nonrated issues; and the Fund’s allocation to taxable municipal bonds, which were not represented within the Index.
Detractors from performance versus the Index included an underweight position in the health care sector, an overweight position in AAA rated bonds, and security selections in the education sector.
See Endnotes and Additional Disclosures in this report.
Past performance is no guarantee of future results. Returns are historical and are calculated by determining the percentage change in net asset value (NAV) or offering price (as applicable) with all distributions reinvested. Investment return and principal value will fluctuate so that shares, when redeemed, may be worth more or less than their original cost. Performance for periods less than or equal to one year is cumulative. Performance is for the stated time period only; due to market volatility, current Fund performance may be lower or higher than the quoted return. For performance as of the most recent month-end, please refer to eatonvance.com.
Eaton Vance
AMT-Free Municipal Income Fund
September 30, 2021
Performance2,3
Portfolio Manager Cynthia J. Clemson
| | | | | | | | | | | | | | | | | | | | |
| % Average Annual Total Returns | | Class Inception Date | | | Performance
Inception Date | | | One Year | | | Five Years | | | Ten Years | |
| | | | | |
Class A at NAV | | | 01/06/1998 | | | | 03/16/1978 | | | | 3.14 | % | | | 3.12 | % | | | 4.50 | % |
Class A with 4.75% Maximum Sales Charge | | | — | | | | — | | | | –1.74 | | | | 2.12 | | | | 4.00 | |
Class C at NAV | | | 05/02/2006 | | | | 03/16/1978 | | | | 2.38 | | | | 2.35 | | | | 3.73 | |
Class C with 1% Maximum Sales Charge | | | — | | | | — | | | | 1.38 | | | | 2.35 | | | | 3.73 | |
Class I at NAV | | | 03/16/1978 | | | | 03/16/1978 | | | | 3.36 | | | | 3.38 | | | | 4.77 | |
|
| |
| | | | | |
Bloomberg Municipal Bond Index | | | — | | | | — | | | | 2.63 | % | | | 3.26 | % | | | 3.86 | % |
| | | | | |
% Total Annual Operating Expense Ratios4 | | | | | | | | Class A | | | Class C | | | Class I | |
| | | | | |
| | | | | | | | | | | 0.92 | % | | | 1.67 | % | | | 0.67 | % |
| | | | | |
| % Distribution Rates/Yields5 | | | | | | | | Class A | | | Class C | | | Class I | |
| | | | | |
Distribution Rate | | | | | | | | | | | 2.59 | % | | | 1.83 | % | | | 2.84 | % |
Taxable-Equivalent Distribution Rate | | | | | | | | | | | 4.37 | | | | 3.09 | | | | 4.80 | |
SEC 30-day Yield | | | | | | | | | | | 0.64 | | | | –0.08 | | | | 0.92 | |
Taxable-Equivalent SEC 30-day Yield | | | | | | | | | | | 1.07 | | | | –0.14 | | | | 1.55 | |
| | | | | |
| % Total Leverage6 | | | | | | | | | | | | | | | |
| | | | | |
Residual Interest Bond (RIB) Financing | | | | | | | | | | | | | | | | | | | 5.05 | % |
Growth of $10,000
This graph shows the change in value of a hypothetical investment of $10,000 in Class A of the Fund for the period indicated. For comparison, the same investment is shown in the indicated index.
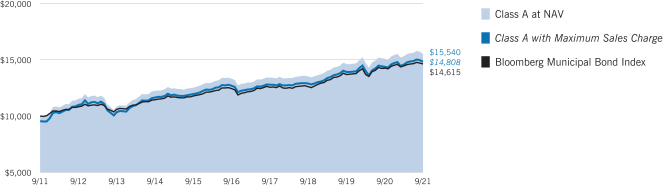
| | | | | | | | | | | | | | | | |
| Growth of Investment | | Amount Invested | | | Period Beginning | | | At NAV | | | With Maximum Sales Charge | |
| | | | |
Class C | | | $10,000 | | | | 09/30/2011 | | | | $14,428 | | | | N.A. | |
Class I | | | $250,000 | | | | 09/30/2011 | | | | $398,519 | | | | N.A. | |
See Endnotes and Additional Disclosures in this report.
Past performance is no guarantee of future results. Returns are historical and are calculated by determining the percentage change in net asset value (NAV) or offering price (as applicable) with all distributions reinvested. Investment return and principal value will fluctuate so that shares, when redeemed, may be worth more or less than their original cost. Performance for periods less than or equal to one year is cumulative. Performance is for the stated time period only; due to market volatility, current Fund performance may be lower or higher than the quoted return. For performance as of the most recent month-end, please refer to eatonvance.com.
Eaton Vance
AMT-Free Municipal Income Fund
September 30, 2021
Fund Profile
Credit Quality (% of total investments)7,8
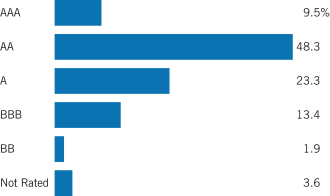
See Endnotes and Additional Disclosures in this report.
Eaton Vance
National Municipal Income Fund
September 30, 2021
Performance2,3
Portfolio Manager Craig R. Brandon, CFA
| | | | | | | | | | | | | | | | | | | | |
| % Average Annual Total Returns | | Class Inception Date | | | Performance
Inception Date | | | One Year | | | Five Years | | | Ten Years | |
| | | | | |
Class A at NAV | | | 04/05/1994 | | | | 12/19/1985 | | | | 2.99 | % | | | 3.45 | % | | | 4.84 | % |
Class A with 4.75% Maximum Sales Charge | | | — | | | | — | | | | –1.90 | | | | 2.45 | | | | 4.33 | |
Class C at NAV | | | 12/03/1993 | | | | 12/19/1985 | | | | 2.22 | | | | 2.69 | | | | 4.07 | |
Class C with 1% Maximum Sales Charge | | | — | | | | — | | | | 1.22 | | | | 2.69 | | | | 4.07 | |
Class I at NAV | | | 07/01/1999 | | | | 12/19/1985 | | | | 3.24 | | | | 3.71 | | | | 5.10 | |
|
| |
| | | | | |
Bloomberg Municipal Bond Index | | | — | | | | — | | | | 2.63 | % | | | 3.26 | % | | | 3.86 | % |
| | | | | |
% Total Annual Operating Expense Ratios4 | | | | | | | | Class A | | | Class C | | | Class I | |
| | | | | |
| | | | | | | | | | | 0.69 | % | | | 1.44 | % | | | 0.44 | % |
| | | | | |
| % Distribution Rates/Yields5 | | | | | | | | Class A | | | Class C | | | Class I | |
| | | | | |
Distribution Rate | | | | | | | | | | | 2.11 | % | | | 1.35 | % | | | 2.36 | % |
Taxable-Equivalent Distribution Rate | | | | | | | | | | | 3.56 | | | | 2.28 | | | | 3.98 | |
SEC 30-day Yield | | | | | | | | | | | 0.76 | | | | 0.05 | | | | 1.04 | |
Taxable-Equivalent SEC 30-day Yield | | | | | | | | | | | 1.28 | | | | 0.08 | | | | 1.76 | |
| | | | | |
| % Total Leverage6 | | | | | | | | | | | | | | | |
| | | | | |
RIB Financing | | | | | | | | | | | | | | | | | | | 2.54 | % |
Growth of $10,000
This graph shows the change in value of a hypothetical investment of $10,000 in Class A of the Fund for the period indicated. For comparison, the same investment is shown in the indicated index.
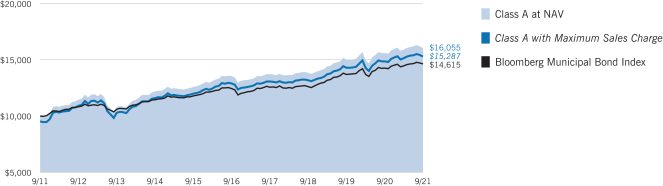
| | | | | | | | | | | | | | | | |
| Growth of Investment | | Amount Invested | | | Period Beginning | | | At NAV | | | With Maximum Sales Charge | |
| | | | |
Class C | | | $10,000 | | | | 09/30/2011 | | | | $14,902 | | | | N.A. | |
Class I | | | $250,000 | | | | 09/30/2011 | | | | $411,445 | | | | N.A. | |
See Endnotes and Additional Disclosures in this report.
Past performance is no guarantee of future results. Returns are historical and are calculated by determining the percentage change in net asset value (NAV) or offering price (as applicable) with all distributions reinvested. Investment return and principal value will fluctuate so that shares, when redeemed, may be worth more or less than their original cost. Performance for periods less than or equal to one year is cumulative. Performance is for the stated time period only; due to market volatility, current Fund performance may be lower or higher than the quoted return. For performance as of the most recent month-end, please refer to eatonvance.com.
Eaton Vance
National Municipal Income Fund
September 30, 2021
Fund Profile
Credit Quality (% of total investments)7,8
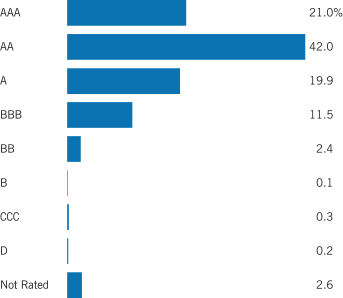
See Endnotes and Additional Disclosures in this report.
Eaton Vance
Municipal Income Funds
September 30, 2021
Endnotes and Additional Disclosures
| 1 | The views expressed in this report are those of the portfolio manager(s) and are current only through the date stated at the top of this page. These views are subject to change at any time based upon market or other conditions, and Eaton Vance and the Fund(s) disclaim any responsibility to update such views. These views may not be relied upon as investment advice and, because investment decisions are based on many factors, may not be relied upon as an indication of trading intent on behalf of any Eaton Vance fund. This commentary may contain statements that are not historical facts, referred to as “forward-looking statements.” The Fund’s actual future results may differ significantly from those stated in any forward-looking statement, depending on factors such as changes in securities or financial markets or general economic conditions, the volume of sales and purchases of Fund shares, the continuation of investment advisory, administrative and service contracts, and other risks discussed from time to time in the Fund’s filings with the Securities and Exchange Commission. |
| 2 | Bloomberg Municipal Bond Index is an unmanaged index of municipal bonds traded in the U.S. Unless otherwise stated, index returns do not reflect the effect of any applicable sales charges, commissions, expenses, taxes or leverage, as applicable. It is not possible to invest directly in an index. |
| 3 | Total Returns at NAV do not include applicable sales charges. If sales charges were deducted, the returns would be lower. Total Returns shown with maximum sales charge reflect the stated maximum sales charge. Unless otherwise stated, performance does not reflect the deduction of taxes on Fund distributions or redemptions of Fund shares. |
| 4 | Source: Fund prospectus. The expense ratios for the current reporting period can be found in the Financial Highlights section of this report. |
| 5 | The Distribution Rate is based on the Fund’s last regular distribution per share in the period (annualized) divided by the Fund’s NAV at the end of the period. The Fund’s distributions may be comprised of amounts characterized for federal income tax purposes as tax-exempt income, qualified and non-qualified ordinary dividends, capital gains and nondividend distributions, also known as return of capital. The Fund will determine the federal income tax character of distributions paid to a shareholder after the end of the calendar year. This is reported on the IRS form 1099-DIV and provided to the shareholder shortly after each year-end. The Fund’s distributions are determined by the investment adviser based on its current assessment of the Fund’s long-term return potential. As portfolio and market conditions change, the rate of distributions paid by the Fund could change. Taxable-equivalent performance is based on the highest combined federal and state income tax rates, where applicable. Lower tax rates would result in lower tax-equivalent performance. Actual tax rates will vary depending on your income, exemptions and deductions. Rates do not include local taxes. The SEC Yield is a standardized measure based on the estimated yield to maturity of a fund’s investments over a 30-day period and is based on the maximum offer price at the date specified. The SEC Yield is not based on the distributions made by the Fund, which may differ. |
| 6 | Fund employs RIB financing. The leverage created by RIB investments provides an opportunity for increased income but, at the same time, creates special risks (including the likelihood of greater volatility of NAV). The cost of leverage rises and falls with changes in short-term interest rates. See “Floating Rate Notes Issued in Conjunction with |
| | Securities Held” in the notes to the financial statements for more information about RIB financing. RIB leverage represents the amount of Floating Rate Notes outstanding at period end as a percentage of Fund net assets plus Floating Rate Notes. |
| 7 | For purposes of the Fund’s rating restrictions, ratings are based on Moody’s Investors Service, Inc. (“Moody’s”), S&P Global Ratings (“S&P”) or Fitch Ratings (“Fitch”), as applicable. If securities are rated differently by the ratings agencies, the highest rating is applied. Ratings, which are subject to change, apply to the creditworthiness of the issuers of the underlying securities and not to the Fund or its shares. Credit ratings measure the quality of a bond based on the issuer’s creditworthiness, with ratings ranging from AAA, being the highest, to D, being the lowest based on S&P’s measures. Ratings of BBB or higher by S&P or Fitch (Baa or higher by Moody’s) are considered to be investment-grade quality. Credit ratings are based largely on the ratings agency’s analysis at the time of rating. The rating assigned to any particular security is not necessarily a reflection of the issuer’s current financial condition and does not necessarily reflect its assessment of the volatility of a security’s market value or of the liquidity of an investment in the security. Holdings designated as “Not Rated” (if any) are not rated by the national ratings agencies stated above. |
| 8 | The chart includes the municipal bonds held by a trust that issues residual interest bonds, consistent with the Portfolio of Investments. |
Fund profiles subject to change due to active management.
Additional Information
Yield curve is a graphical representation of the yields offered by bonds of various maturities. The yield curve flattens when long-term interest rates fall and/or short-term interest rates increase, and the yield curve steepens when long-term interest rates increase and/or short-term interest rates fall.
Important Notice to Shareholders
Effective October 1, 2021, Cynthia J. Clemson and Julie P. Callahan are the portfolio managers of the AMT-Free Municipal Income Fund, and Craig R. Brandon and Christopher J. Eustance are the portfolio managers of the National Municipal Income Fund.
Effective August 24, 2021, the Bloomberg Barclays fixed income indices were rebranded as Bloomberg indices.
Eaton Vance
Municipal Income Funds
September 30, 2021
Fund Expenses
Example: As a Fund shareholder, you incur two types of costs: (1) transaction costs, including sales charges (loads) on purchases and redemption fees (if applicable); and (2) ongoing costs, including management fees; distribution and/or service fees; and other Fund expenses. This Example is intended to help you understand your ongoing costs (in dollars) of Fund investing and to compare these costs with the ongoing costs of investing in other mutual funds. The Example is based on an investment of $1,000 invested at the beginning of the period and held for the entire period (April 1, 2021 – September 30, 2021).
Actual Expenses: The first section of each table below provides information about actual account values and actual expenses. You may use the information in this section, together with the amount you invested, to estimate the expenses that you paid over the period. Simply divide your account value by $1,000 (for example, an $8,600 account value divided by $1,000 = 8.6), then multiply the result by the number in the first section under the heading entitled “Expenses Paid During Period” to estimate the expenses you paid on your account during this period.
Hypothetical Example for Comparison Purposes: The second section of each table below provides information about hypothetical account values and hypothetical expenses based on the actual Fund expense ratio and an assumed rate of return of 5% per year (before expenses), which is not the actual Fund return. The hypothetical account values and expenses may not be used to estimate the actual ending account balance or expenses you paid for the period. You may use this information to compare the ongoing costs of investing in your Fund and other funds. To do so, compare this 5% hypothetical example with the 5% hypothetical examples that appear in the shareholder reports of the other funds.
Please note that the expenses shown in each table are meant to highlight your ongoing costs only and do not reflect any transactional costs, such as sales charges (loads) or redemption fees (if applicable). Therefore, the second section of each table is useful in comparing ongoing costs only, and will not help you determine the relative total costs of owning different funds. In addition, if these transactional costs were included, your costs would be higher.
Eaton Vance AMT-Free Municipal Income Fund
| | | | | | | | | | | | | | | | |
| | | Beginning
Account Value
(4/1/21) | | | Ending
Account Value
(9/30/21) | | | Expenses Paid
During Period*
(4/1/21 – 9/30/21) | | | Annualized
Expense
Ratio | |
| | | | |
Actual | | | | | | | | | | | | | | | | |
Class A | | $ | 1,000.00 | | | $ | 1,015.80 | | | $ | 4.04 | | | | 0.80 | % |
Class C | | $ | 1,000.00 | | | $ | 1,012.00 | | | $ | 7.82 | | | | 1.55 | % |
Class I | | $ | 1,000.00 | | | $ | 1,017.80 | | | $ | 2.78 | | | | 0.55 | % |
| | | | | |
Hypothetical | | | | | | | | | | | | | | | | |
(5% return per year before expenses) | | | | | | | | | | | | | | | | |
Class A | | $ | 1,000.00 | | | $ | 1,021.10 | | | $ | 4.05 | | | | 0.80 | % |
Class C | | $ | 1,000.00 | | | $ | 1,017.30 | | | $ | 7.84 | | | | 1.55 | % |
Class I | | $ | 1,000.00 | | | $ | 1,022.30 | | | $ | 2.79 | | | | 0.55 | % |
| * | Expenses are equal to the Fund’s annualized expense ratio for the indicated Class, multiplied by the average account value over the period, multiplied by 183/365 (to reflect the one-half year period). The Example assumes that the $1,000 was invested at the net asset value per share determined at the close of business on March 31, 2021. |
Eaton Vance
Municipal Income Funds
September 30, 2021
Fund Expenses — continued
Eaton Vance National Municipal Income Fund
| | | | | | | | | | | | | | | | |
| | | Beginning
Account Value
(4/1/21) | | | Ending
Account Value
(9/30/21) | | | Expenses Paid
During Period*
(4/1/21 – 9/30/21) | | | Annualized
Expense
Ratio | |
| | | | |
Actual | | | | | | | | | | | | | | | | |
Class A | | $ | 1,000.00 | | | $ | 1,010.50 | | | $ | 3.12 | | | | 0.62 | % |
Class C | | $ | 1,000.00 | | | $ | 1,006.70 | | | $ | 6.89 | | | | 1.37 | % |
Class I | | $ | 1,000.00 | | | $ | 1,011.70 | | | $ | 1.87 | | | | 0.37 | % |
| | | | | |
Hypothetical | | | | | | | | | | | | | | | | |
(5% return per year before expenses) | | | | | | | | | | | | | | | | |
Class A | | $ | 1,000.00 | | | $ | 1,022.00 | | | $ | 3.14 | | | | 0.62 | % |
Class C | | $ | 1,000.00 | | | $ | 1,018.20 | | | $ | 6.93 | | | | 1.37 | % |
Class I | | $ | 1,000.00 | | | $ | 1,023.20 | | | $ | 1.88 | | | | 0.37 | % |
| * | Expenses are equal to the Fund’s annualized expense ratio for the indicated Class, multiplied by the average account value over the period, multiplied by 183/365 (to reflect the one-half year period). The Example assumes that the $1,000 was invested at the net asset value per share determined at the close of business on March 31, 2021. |
Eaton Vance
AMT-Free Municipal Income Fund
September 30, 2021
Portfolio of Investments
| | | | | | | | |
| Tax-Exempt Mortgage-Backed Securities — 0.3% | |
| Security | | Principal
Amount
(000’s omitted) | | | Value | |
|
| Housing — 0.3% | |
| | |
Washington Housing Finance Commission, Municipal Certificates, Series 2021-1, Class A, 3.50%, 12/20/35 | | $ | 1,085 | | | $ | 1,253,151 | |
| |
Total Tax-Exempt Mortgage-Backed Securities — 0.3%
(identified cost $1,227,735) | | | $ | 1,253,151 | |
|
| Tax-Exempt Municipal Obligations — 105.2% | |
| Security | | Principal
Amount
(000’s omitted) | | | Value | |
|
| Education — 5.4% | |
| | |
Build NYC Resource Corp., NY, (New World Preparatory Charter School), 4.00%, 6/15/41(1) | | $ | 245 | | | $ | 268,716 | |
| | |
Connecticut Health and Educational Facilities Authority,
(Choate Rosemary Hall): | | | | | | |
| | |
4.00%, 7/1/38 | | | 315 | | | | 373,297 | |
| | |
4.00%, 7/1/39 | | | 380 | | | | 449,160 | |
| | |
4.00%, 7/1/42 | | | 860 | | | | 1,008,720 | |
| | |
5.00%, 7/1/32 | | | 175 | | | | 227,064 | |
| | |
Connecticut Health and Educational Facilities Authority, (Fairfield University), 5.00%, 7/1/46 | | | 5,000 | | | | 5,836,000 | |
| | |
Connecticut Health and Educational Facilities Authority,
(Sacred Heart University): | | | | | | |
| | |
4.00%, 7/1/45 | | | 875 | | | | 993,598 | |
| | |
5.00%, 7/1/40 | | | 900 | | | | 1,127,421 | |
| | |
| District of Columbia, (KIPP DC): | | | | | | |
| | |
4.00%, 7/1/39 | | | 100 | | | | 113,082 | |
| | |
4.00%, 7/1/44 | | | 100 | | | | 111,639 | |
| | |
4.00%, 7/1/49 | | | 135 | | | | 149,637 | |
| | |
Erie Higher Education Building Authority, PA,
(Gannon University): | | | | | | |
| | |
5.00%, 5/1/22 | | | 100 | | | | 102,504 | |
| | |
5.00%, 5/1/24 | | | 120 | | | | 132,449 | |
| | |
5.00%, 5/1/26 | | | 125 | | | | 146,191 | |
| | |
5.00%, 5/1/30 | | | 390 | | | | 491,989 | |
| | |
Florida Development Finance Corp., (River City Science Academy), 4.00%, 7/1/45 | | | 200 | | | | 212,864 | |
| | |
Pennsylvania Higher Educational Facilities Authority, (Drexel University), 5.00%, 5/1/37 | | | 1,750 | | | | 2,131,762 | |
| | |
Pima County Community College District, AZ, 5.00%, 7/1/35 | | | 725 | | | | 894,186 | |
| | |
University of California, 5.25%, 5/15/35 | | | 3,555 | | | | 4,000,157 | |
| |
| | | | $ | 18,770,436 | |
| | | | | | | | |
| Security | | Principal
Amount
(000’s omitted) | | | Value | |
|
| Electric Utilities — 3.6% | |
| | |
| Delaware Municipal Electric Corp., (Beasley Power Station): | | | | | | |
| | |
4.00%, 7/1/35 | | $ | 310 | | | $ | 372,685 | |
| | |
5.00%, 7/1/32 | | | 470 | | | | 617,773 | |
| | |
5.00%, 7/1/33 | | | 400 | | | | 522,608 | |
| | |
5.00%, 7/1/34 | | | 440 | | | | 572,779 | |
| | |
Florida Municipal Power Agency, 3.00%, 10/1/33 | | | 1,750 | | | | 1,907,570 | |
| | |
Lower Colorado River Authority, TX, (LCRA Transmission Services Corp.), 5.00%, 5/15/40 | | | 1,000 | | | | 1,239,160 | |
| | |
| New York Power Authority: | | | | | | |
| | |
4.00%, 11/15/45 | | | 2,285 | | | | 2,670,388 | |
| | |
4.00%, 11/15/50 | | | 715 | | | | 830,480 | |
| | |
| Northern Municipal Power Agency, MN: | | | | | | |
| | |
5.00%, 1/1/31 | | | 200 | | | | 238,292 | |
| | |
5.00%, 1/1/35 | | | 170 | | | | 201,455 | |
| | |
5.00%, 1/1/36 | | | 160 | | | | 188,934 | |
| | |
Utility Debt Securitization Authority, NY, 5.00%, 12/15/33 | | | 2,895 | | | | 3,193,330 | |
| |
| | | | $ | 12,555,454 | |
|
| Escrowed / Prerefunded — 5.7% | |
| | |
| Foothill-De Anza Community College District, CA: | | | | | | |
| | |
Prerefunded to 8/1/24, 5.00%, 8/1/34 | | $ | 1,150 | | | $ | 1,304,019 | |
| | |
Prerefunded to 8/1/24, 5.00%, 8/1/36 | | | 1,150 | | | | 1,304,019 | |
| | |
Henrico County Economic Development Authority, VA, (Bon Secours Health System, Inc.), Prerefunded to 11/1/22, 5.00%, 11/1/30 | | | 1,185 | | | | 1,246,312 | |
| | |
New Jersey Turnpike Authority, Prerefunded to 7/1/22, 5.00%, 1/1/30 | | | 3,060 | | | | 3,170,650 | |
| | |
North Carolina Capital Facilities Finance Agency, (Duke University), Prerefunded to 10/1/25, 5.00%, 10/1/41 | | | 1,480 | | | | 1,748,028 | |
| | |
Oklahoma Development Finance Authority, (St. John Health System), Prerefunded to 2/15/22, 5.00%, 2/15/34 | | | 2,035 | | | | 2,070,796 | |
| | |
Savannah Economic Development Authority, GA, Escrowed to Maturity, 0.00%, 12/1/21 | | | 6,000 | | | | 5,998,560 | |
| | |
West Virginia University, Prerefunded to 10/1/22, 5.00%, 10/1/31 | | | 3,000 | | | | 3,145,020 | |
| |
| | | | $ | 19,987,404 | |
|
| General Obligations — 17.5% | |
|
| California: | |
| | |
4.00%, 10/1/37 | | $ | 1,000 | | | $ | 1,205,830 | |
| | |
5.00%, 4/1/35 | | | 2,125 | | | | 2,359,430 | |
| | |
5.25%, 10/1/29 | | | 560 | | | | 560,874 | |
| | |
5.25%, 10/1/32 | | | 3,480 | | | | 3,485,429 | |
| | |
Carrollton-Farmers Branch Independent School District, TX, (PSF Guaranteed), 3.00%, 2/15/41 | | | 1,000 | | | | 1,091,090 | |
| | | | |
| | 11 | | See Notes to Financial Statements. |
Eaton Vance
AMT-Free Municipal Income Fund
September 30, 2021
Portfolio of Investments — continued
| | | | | | | | |
| Security | | Principal
Amount
(000’s omitted) | | | Value | |
|
| General Obligations (continued) | |
| | |
| Chandler Unified School District No. 80, AZ: | | | | | | |
| | |
4.00%, 7/1/32 | | $ | 450 | | | $ | 551,502 | |
| | |
4.00%, 7/1/33 | | | 1,000 | | | | 1,221,420 | |
| | |
| Chicago Board of Education, IL: | | | | | | |
| | |
5.00%, 12/1/21 | | | 230 | | | | 231,691 | |
| | |
5.00%, 12/1/42 | | | 260 | | | | 270,067 | |
| | |
5.00%, 12/1/44 | | | 1,405 | | | | 1,657,422 | |
| | |
| Chicago, IL: | | | | | | |
| | |
5.00%, 1/1/39 | | | 1,400 | | | | 1,684,200 | |
| | |
5.00%, 1/1/44 | | | 1,490 | | | | 1,774,530 | |
| | |
District of Columbia, 5.00%, 6/1/37(2) | | | 7,000 | | | | 8,502,760 | |
| | |
Fennville Public Schools, MI, 4.00%, 5/1/34 | | | 1,000 | | | | 1,143,090 | |
| | |
Gallatin County School District No. 44, MT, 4.00%, 6/1/35 | | | 520 | | | | 602,992 | |
| | |
| Illinois: | | | | | | |
| | |
4.00%, 6/1/33 | | | 1,000 | | | | 1,102,900 | |
| | |
4.00%, 11/1/40 | | | 1,000 | | | | 1,124,610 | |
| | |
5.00%, 5/1/35 | | | 2,000 | | | | 2,183,480 | |
| | |
5.50%, 5/1/39 | | | 205 | | | | 259,376 | |
| | |
5.75%, 5/1/45 | | | 210 | | | | 265,967 | |
| | |
Kane, Cook and DuPage Counties School District No. 46, IL, 5.00%, 1/1/31 | | | 4,470 | | | | 4,921,470 | |
| | |
Lane Community College, OR, 4.00%, 6/15/37 | | | 5,345 | | | | 6,383,266 | |
| | |
Lodi Unified School District, CA, (Election of 2016), 4.00%, 8/1/33 | | | 1,250 | | | | 1,454,400 | |
| | |
New York, NY, 4.00%, 8/1/42(2) | | | 7,000 | | | | 8,103,550 | |
| | |
Prince George’s County, MD, 4.00%, 7/1/32 | | | 1,000 | | | | 1,252,940 | |
| | |
Salem-Keizer School District No. 24J, OR, 0.00%, 6/15/24 | | | 1,220 | | | | 1,207,410 | |
| | |
Springfield School District No. 19, OR, 5.00%, 6/15/30 | | | 1,085 | | | | 1,259,859 | |
| | |
Union R-XI School District, MO, 5.00%, 3/1/38 | | | 2,100 | | | | 2,392,677 | |
| | |
University of Connecticut, 5.00%, 2/15/32 | | | 650 | | | | 716,443 | |
| | |
Washington, 5.00%, 6/1/38 | | | 710 | | | | 906,989 | |
| | |
| Will County, IL, Green Bonds: | | | | | | |
| | |
4.00%, 11/15/32 | | | 750 | | | | 903,322 | |
| | |
4.00%, 11/15/33 | | | 535 | | | | 642,091 | |
| |
| | | | $ | 61,423,077 | |
|
| Hospital — 12.4% | |
| | |
Brookhaven Development Authority, GA, (Children’s Healthcare of Atlanta), 4.00%, 7/1/49 | | $ | 2,000 | | | $ | 2,294,260 | |
| | |
California Health Facilities Financing Authority, (St. Joseph
Health System): | | | | | | |
| | |
5.00%, 7/1/33 | | | 1,720 | | | | 1,860,558 | |
| | |
5.00%, 7/1/37 | | | 2,300 | | | | 2,486,277 | |
| | |
California Statewide Communities Development Authority, (Loma Linda University Medical Center), 5.25%, 12/1/34 | | | 3,000 | | | | 3,399,270 | |
| | | | | | | | |
| Security | | Principal
Amount
(000’s omitted) | | | Value | |
|
| Hospital (continued) | |
| | |
Chattanooga Health, Educational and Housing Facility Board, TN, (CommonSpirit Health), 4.00%, 8/1/37 | | $ | 1,250 | | | $ | 1,440,150 | |
| | |
Colorado Health Facilities Authority, (AdventHealth Obligated Group), 3.00%, 11/15/51 | | | 4,200 | | | | 4,431,672 | |
| | |
Colorado Health Facilities Authority, (Vail Valley Medical Center), 5.00%, 1/15/35 | | | 2,000 | | | | 2,304,020 | |
| | |
| Delaware Health Facilities Authority, (Beebe Medical Center): | | | | | | |
| | |
5.00%, 6/1/36 | | | 3,730 | | | | 4,509,123 | |
| | |
5.00%, 6/1/37 | | | 1,000 | | | | 1,205,910 | |
| | |
Escambia County Health Facilities Authority, FL, (Baptist Health Care Corp. Obligated Group), 4.00%, 8/15/50 | | | 520 | | | | 580,460 | |
| | |
Massachusetts Development Finance Agency, (Children’s Hospital), 5.00%, 10/1/31 | | | 2,110 | | | | 2,393,605 | |
| | |
Missouri Health and Educational Facilities Authority, (Mercy Health), 5.00%, 11/15/47 | | | 3,000 | | | | 3,570,450 | |
| | |
Mobile Infirmary Health System Special Care Facilities Financing Authority, AL, (Infirmary Health System, Inc.), 3.00%, 2/1/46 | | | 1,000 | | | | 1,030,280 | |
| | |
Montana Facility Finance Authority, (Bozeman Deaconess Health Services Obligated Group), 4.00%, 6/1/39 | | | 1,070 | | | | 1,260,610 | |
| | |
Ohio, (University Hospitals Health Systems, Inc.), 5.00%, 1/15/36 | | | 2,500 | | | | 2,901,850 | |
| | |
Pennsylvania Higher Educational Facilities Authority,
(University of Pennsylvania Health System): | | | | | | |
| | |
5.00%, 8/15/23(3) | | | 500 | | | | 527,570 | |
| | |
5.00%, 8/15/24(3) | | | 550 | | | | 602,256 | |
| | |
5.00%, 8/15/25(3) | | | 500 | | | | 565,655 | |
| | |
5.00%, 8/15/26(3) | | | 600 | | | | 698,256 | |
| | |
Tarrant County Cultural Education Facilities Finance Corp., TX, (Cook Children’s Medical Center), 5.25%, 12/1/39(2) | | | 5,000 | | | | 5,477,600 | |
| |
| | | | $ | 43,539,832 | |
|
| Housing — 1.0% | |
| | |
Cuyahoga Metropolitan Housing Authority, OH, 2.00%, 12/1/31 | | $ | 1,250 | | | $ | 1,257,387 | |
| | |
Phoenix Industrial Development Authority, AZ, (Downtown
Phoenix Student Housing, LLC - Arizona State University): | | | | | | |
| | |
5.00%, 7/1/37 | | | 500 | | | | 593,800 | |
| | |
5.00%, 7/1/42 | | | 1,250 | | | | 1,472,425 | |
| | |
Texas Student Housing Corp., (University of North Texas), 9.375%, 7/1/06(4) | | | 285 | | | | 285,000 | |
| |
| | | | $ | 3,608,612 | |
|
| Insured – Education — 1.0% | |
| | |
Northern Illinois University, IL, (BAM), 5.00%, 4/1/31 | | $ | 950 | | | $ | 1,208,685 | |
| | | | |
| | 12 | | See Notes to Financial Statements. |
Eaton Vance
AMT-Free Municipal Income Fund
September 30, 2021
Portfolio of Investments — continued
| | | | | | | | |
| Security | | Principal
Amount
(000’s omitted) | | | Value | |
|
| Insured – Education (continued) | |
| | |
Virginia College Building Authority, (Washington and Lee University), (NPFG), 5.25%, 1/1/31 | | $ | 1,750 | | | $ | 2,228,747 | |
| |
| | | | $ | 3,437,432 | |
|
| Insured – Electric Utilities — 1.8% | |
| | |
Ohio Municipal Electric Generation Agency, (NPFG), 0.00%, 2/15/29 | | $ | 2,865 | | | $ | 2,535,439 | |
| | |
Philadelphia, PA, Gas Works Revenue, (AGM), 4.00%, 8/1/45 | | | 1,000 | | | | 1,155,730 | |
| | |
Texas Municipal Power Agency, (AGM), 2.00%, 9/1/33 | | | 2,790 | | | | 2,761,235 | |
| |
| | | | $ | 6,452,404 | |
|
| Insured – Escrowed / Prerefunded — 1.4% | |
| | |
Detroit, MI, Sewage Disposal System, (AGM), Prerefunded to 7/1/22, 5.00%, 7/1/39 | | $ | 4,825 | | | $ | 4,999,472 | |
| |
| | | | $ | 4,999,472 | |
|
| Insured – General Obligations — 2.4% | |
| | |
Atlantic City, NJ, (AGM), 4.00%, 3/1/42 | | $ | 145 | | | $ | 161,223 | |
| | |
Chicago Board of Education, IL, (AGM), 5.00%, 12/1/24 | | | 505 | | | | 572,958 | |
| | |
| McCook, IL: | | | | | | |
| | |
(AGM), 4.00%, 12/1/29 | | | 240 | | | | 282,826 | |
| | |
(AGM), 4.00%, 12/1/30 | | | 200 | | | | 234,216 | |
| | |
(AGM), 4.00%, 12/1/33 | | | 500 | | | | 580,130 | |
| | |
(AGM), 4.00%, 12/1/34 | | | 190 | | | | 219,872 | |
| | |
Proviso Township High School District No. 209, IL, (AGM), 4.00%, 12/1/38 | | | 1,500 | | | | 1,698,990 | |
| | |
Santa Rosa Elementary School District, CA, (Election of 2014), (BAM), 4.00%, 8/1/39 | | | 1,005 | | | | 1,190,995 | |
| | |
Santa Rosa High School District, CA, (Election of 2014), (BAM), 4.00%, 8/1/39 | | | 1,135 | | | | 1,346,893 | |
| | |
| Yonkers, NY: | | | | | | |
| | |
(AGM), 4.00%, 2/15/35 | | | 800 | | | | 957,416 | |
| | |
(AGM), 5.00%, 2/15/31 | | | 810 | | | | 1,068,746 | |
| |
| | | | $ | 8,314,265 | |
|
| Insured – Housing — 0.1% | |
| | |
California Municipal Finance Authority, (CHF-Davis II,
LLC - Orchard Park Student Housing), Green Bonds: | | | | | | |
| | |
(BAM), 3.00%, 5/15/51 | | $ | 90 | | | $ | 93,957 | |
| | |
(BAM), 4.00%, 5/15/46 | | | 90 | | | | 104,326 | |
| |
| | | | $ | 198,283 | |
| | | | | | | | |
| Security | | Principal
Amount
(000’s omitted) | | | Value | |
|
| Insured – Lease Revenue / Certificates of Participation — 2.1% | |
| | |
Anaheim Public Financing Authority, CA, (Anaheim Public Improvements), (AGM), 0.00%, 9/1/31 | | $ | 8,680 | | | $ | 7,268,719 | |
| |
| | | | $ | 7,268,719 | |
|
| Insured – Other Revenue — 2.0% | |
| | |
Harris County-Houston Sports Authority, TX, (AGM), (NPFG), 0.00%, 11/15/34 | | $ | 10,600 | | | $ | 6,468,226 | |
| | |
New York City Industrial Development Agency, NY, (Yankee Stadium), (AGM), 3.00%, 3/1/38 | | | 555 | | | | 599,539 | |
| |
| | | | $ | 7,067,765 | |
|
| Insured – Special Tax Revenue — 3.4% | |
| | |
| Massachusetts, Dedicated Tax Revenue: | | | | | | |
| | |
(NPFG), 5.50%, 1/1/27 | | $ | 6,000 | | | $ | 7,390,620 | |
| | |
(NPFG), 5.50%, 1/1/30 | | | 2,565 | | | | 3,375,514 | |
| | |
Successor Agency to San Francisco City and County Redevelopment Agency, CA, (NPFG), 5.00%, 8/1/43 | | | 1,100 | | | | 1,283,205 | |
| |
| | | | $ | 12,049,339 | |
|
| Insured – Transportation — 7.4% | |
| | |
| Chicago, IL, (O’Hare International Airport): | | | | | | |
| | |
(AGM), 5.00%, 1/1/28 | | $ | 1,000 | | | $ | 1,056,790 | |
| | |
(AGM), 5.125%, 1/1/31 | | | 1,000 | | | | 1,058,340 | |
| | |
(AGM), 5.25%, 1/1/32 | | | 785 | | | | 832,014 | |
| | |
E-470 Public Highway Authority, CO, (NPFG), 0.00%, 9/1/39 | | | 7,120 | | | | 3,415,108 | |
| | |
| Metropolitan Transportation Authority, NY, Green Bonds: | | | | | | |
| | |
(AGM), 4.00%, 11/15/46 | | | 1,195 | | | | 1,370,641 | |
| | |
(AGM), 5.00%, 11/15/41 | | | 1,500 | | | | 1,868,475 | |
| | |
(AGM), 5.00%, 11/15/44 | | | 1,675 | | | | 2,041,456 | |
| | |
Pennsylvania Turnpike Commission, (AGM), 6.375%, 12/1/38 | | | 11,000 | | | | 14,391,080 | |
| |
| | | | $ | 26,033,904 | |
|
| Insured – Water and Sewer — 0.7% | |
| | |
Michigan Finance Authority, (Detroit Water and Sewerage
Department): | | | | | | |
| | |
(AGM), 5.00%, 7/1/32 | | $ | 655 | | | $ | 734,419 | |
| | |
(AGM), 5.00%, 7/1/33 | | | 565 | | | | 633,179 | |
| | |
(AGM), 5.00%, 7/1/35 | | | 280 | | | | 313,216 | |
| | |
(AGM), 5.00%, 7/1/37 | | | 565 | | | | 630,879 | |
| |
| | | | $ | 2,311,693 | |
|
| Lease Revenue / Certificates of Participation — 3.0% | |
| | |
Hudson Yards Infrastructure Corp., NY, 4.00%, 2/15/44 | | $ | 1,155 | | | $ | 1,297,770 | |
| | | | |
| | 13 | | See Notes to Financial Statements. |
Eaton Vance
AMT-Free Municipal Income Fund
September 30, 2021
Portfolio of Investments — continued
| | | | | | | | |
| Security | | Principal
Amount
(000’s omitted) | | | Value | |
|
| Lease Revenue / Certificates of Participation (continued) | |
| | |
New Jersey Economic Development Authority,
(School Facilities Construction): | | | | | | |
| | |
4.00%, 6/15/34 | | $ | 500 | | | $ | 591,750 | |
| | |
4.00%, 6/15/35 | | | 400 | | | | 472,348 | |
| | |
4.00%, 6/15/38 | | | 600 | | | | 700,944 | |
| | |
4.00%, 6/15/39 | | | 650 | | | | 757,568 | |
| | |
4.00%, 6/15/40 | | | 700 | | | | 814,597 | |
| | |
4.00%, 6/15/46 | | | 315 | | | | 361,390 | |
| | |
5.00%, 6/15/37 | | | 3,000 | | | | 3,704,940 | |
| | |
Palm Beach County, FL, Public Improvement Revenue, 4.00%, 12/1/38 | | | 1,430 | | | | 1,733,289 | |
| |
| | | | $ | 10,434,596 | |
|
| Other Revenue — 0.4% | |
| | |
Central Falls Detention Facility Corp., RI, 7.25%, 7/15/35(4) | | $ | 1,200 | | | $ | 216,000 | |
| | |
Mercer County Improvement Authority, NJ, 4.00%, 3/15/40 | | | 935 | | | | 1,085,189 | |
| |
| | | | $ | 1,301,189 | |
|
| Senior Living / Life Care — 5.0% | |
| | |
California Public Finance Authority, (Enso Village),
Green Bonds: | | | | | | |
| | |
2.375%, 11/15/28(1) | | $ | 140 | | | $ | 141,564 | |
| | |
5.00%, 11/15/36(1) | | | 140 | | | | 164,447 | |
| | |
Manhattan, KS, (Meadowlark Hills), 4.00%, 6/1/46 | | | 1,150 | | | | 1,248,958 | |
| | |
| National Finance Authority, NH, (The Vista): | | | | | | |
| | |
5.25%, 7/1/39(1) | | | 265 | | | | 277,839 | |
| | |
5.625%, 7/1/46(1) | | | 360 | | | | 380,509 | |
| | |
5.75%, 7/1/54(1) | | | 775 | | | | 821,027 | |
| | |
New Hope Cultural Education Facilities Finance Corp., TX,
(Westminster): | | | | | | |
| | |
4.00%, 11/1/49 | | | 535 | | | | 602,212 | |
| | |
4.00%, 11/1/55 | | | 750 | | | | 840,098 | |
| | |
North Carolina Medical Care Commission, (EveryAge), 4.00%, 9/1/41(3) | | | 840 | | | | 949,015 | |
| | |
Palm Beach County Health Facilities Authority, FL, (Sinai
Residences of Boca Raton): | | | | | | |
| | |
7.25%, 6/1/39 | | | 570 | | | | 600,039 | |
| | |
7.50%, 6/1/49 | | | 2,690 | | | | 2,833,727 | |
| | |
Saint Louis County Industrial Development Authority, MO, (St. Andrew’s Resources for Seniors Obligated Group), 5.00%, 12/1/35 | | | 1,700 | | | | 1,869,626 | |
| | |
Tempe Industrial Development Authority, AZ,
(Friendship Village of Tempe): | | | | | | |
| | |
4.00%, 12/1/38(3) | | | 445 | | | | 492,508 | |
| | |
4.00%, 12/1/46(3) | | | 415 | | | | 449,955 | |
| | | | | | | | |
| Security | | Principal
Amount
(000’s omitted) | | | Value | |
|
| Senior Living / Life Care (continued) | |
| | |
Tempe Industrial Development Authority, AZ,
(Friendship Village of Tempe): (continued) | | | | | | |
| | |
4.00%, 12/1/56(3) | | $ | 355 | | | $ | 379,126 | |
| | |
6.00%, 12/1/32 | | | 160 | | | | 161,462 | |
| | |
6.25%, 12/1/42 | | | 660 | | | | 666,290 | |
| | |
| Washington Housing Finance Commission, (Horizon House): | | | | | | |
| | |
5.00%, 1/1/32(1) | | | 1,575 | | | | 1,821,740 | |
| | |
5.00%, 1/1/38(1) | | | 2,325 | | | | 2,670,541 | |
| | |
Washington Housing Finance Commission, (Transforming Age), 5.00%, 1/1/34(1) | | | 245 | | | | 280,660 | |
| |
| | | | $ | 17,651,343 | |
|
| Special Tax Revenue — 5.7% | |
| | |
Connecticut, Special Tax Revenue, 4.00%, 5/1/36 | | $ | 3,500 | | | $ | 4,158,665 | |
| | |
Illinois, Sales Tax Revenue, 4.00%, 6/15/33 | | | 250 | | | | 297,998 | |
| | |
Jacksonville, FL, Special Revenue, 4.00%, 10/1/41 | | | 1,640 | | | | 1,950,304 | |
| | |
Jurupa Public Financing Authority, CA, 5.00%, 9/1/31 | | | 1,200 | | | | 1,343,892 | |
| | |
Maryland Economic Development Corp., (Port Covington), 4.00%, 9/1/40 | | | 115 | | | | 131,460 | |
| | |
New York City Transitional Finance Authority, NY, Future Tax
Revenue: | | | | | | |
| | |
4.00%, 11/1/38 | | | 2,490 | | | | 2,922,189 | |
| | |
4.00%, 5/1/41 | | | 3,325 | | | | 3,850,782 | |
| | |
New York Dormitory Authority, Personal Income Tax Revenue, 4.00%, 3/15/36 | | | 1,500 | | | | 1,788,180 | |
| | |
New York State Urban Development Corp., Personal Income Tax Revenue, 4.00%, 3/15/34 | | | 2,065 | | | | 2,462,802 | |
| | |
Washington Convention and Sports Authority, D.C., Dedicated Tax Revenue, 4.00%, 10/1/38 | | | 1,000 | | | | 1,181,760 | |
| |
| | | | $ | 20,088,032 | |
|
| Transportation — 16.3% | |
| | |
Central Texas Regional Mobility Authority, 5.00%, 1/1/45 | | $ | 1,550 | | | $ | 1,901,571 | |
| | |
| Charlotte, NC, (Charlotte Douglas International Airport): | | | | | | |
| | |
4.00%, 7/1/35 | | | 1,500 | | | | 1,822,800 | |
| | |
4.00%, 7/1/36 | | | 1,790 | | | | 2,165,560 | |
| | |
| Chicago, IL, (O’Hare International Airport): | | | | | | |
| | |
4.00%, 1/1/35 | | | 2,500 | | | | 2,946,075 | |
| | |
4.00%, 1/1/36 | | | 2,750 | | | | 3,225,557 | |
| | |
Dallas and Fort Worth, TX, (Dallas/Fort Worth International
Airport): | | | | | | |
| | |
5.25%, 11/1/30 | | | 1,100 | | | | 1,210,594 | |
| | |
5.25%, 11/1/31 | | | 1,455 | | | | 1,600,646 | |
| | |
Grand Parkway Transportation Corp., TX, 5.125%, 10/1/43 | | | 1,100 | | | | 1,186,834 | |
| | | | |
| | 14 | | See Notes to Financial Statements. |
Eaton Vance
AMT-Free Municipal Income Fund
September 30, 2021
Portfolio of Investments — continued
| | | | | | | | |
| Security | | Principal
Amount
(000’s omitted) | | | Value | |
|
| Transportation (continued) | |
| | |
| Memphis-Shelby County Airport Authority, TN: | | | | | | |
| | |
4.00%, 7/1/37 | | $ | 500 | | | $ | 590,880 | |
| | |
4.00%, 7/1/38 | | | 375 | | | | 442,065 | |
| | |
4.00%, 7/1/39 | | | 500 | | | | 587,900 | |
| | |
Miami-Dade County, FL, Aviation Revenue, 5.00%, 10/1/33 | | | 2,650 | | | | 3,000,250 | |
| | |
Miami-Dade County, FL, Seaport Revenue, 4.00%, 10/1/43 | | | 2,000 | | | | 2,343,580 | |
| | |
New Jersey Transportation Trust Fund Authority,
(Transportation Program): | | | | | | |
| | |
3.00%, 6/15/50 | | | 120 | | | | 123,304 | |
| | |
4.00%, 6/15/39 | | | 2,750 | | | | 3,205,097 | |
| | |
4.00%, 6/15/40 | | | 1,665 | | | | 1,937,577 | |
| | |
New Orleans Aviation Board, LA, 5.00%, 1/1/43 | | | 1,555 | | | | 1,854,617 | |
| | |
| New York Thruway Authority: | | | | | | |
| | |
5.00%, 1/1/38 | | | 2,000 | | | | 2,522,820 | |
| | |
5.00%, 1/1/46 | | | 875 | | | | 1,011,395 | |
| | |
New York Transportation Development Corp., (Terminal 4
John F. Kennedy International Airport): | | | | | | |
| | |
4.00%, 12/1/40 | | | 3,000 | | | | 3,433,620 | |
| | |
4.00%, 12/1/41 | | | 2,900 | | | | 3,284,279 | |
| | |
North Texas Tollway Authority, 4.00%, 1/1/39 | | | 2,530 | | | | 2,991,067 | |
| | |
Philadelphia, PA, Airport Revenue, 4.00%, 7/1/40 | | | 5,000 | | | | 5,861,700 | |
| | |
San Joaquin Hills Transportation Corridor Agency, CA, 5.00%, 1/15/34 | | | 5,235 | | | | 5,895,448 | |
| | |
Texas Private Activity Bond Surface Transportation Corp.,
(North Tarrant Express Managed Lanes Project): | | | | | | |
| | |
4.00%, 12/31/37 | | | 275 | | | | 318,665 | |
| | |
4.00%, 12/31/38 | | | 510 | | | | 589,596 | |
| | |
4.00%, 12/31/39 | | | 265 | | | | 305,609 | |
| | |
5.00%, 12/31/35 | | | 355 | | | | 445,035 | |
| | |
Texas Transportation Commission, 0.00%, 8/1/40 | | | 1,000 | | | | 482,970 | |
| |
| | | | $ | 57,287,111 | |
|
| Water and Sewer — 6.9% | |
| | |
Atlanta, GA, Water and Wastewater Revenue, 5.00%, 11/1/35(2) | | $ | 6,990 | | | $ | 8,618,320 | |
| | |
Carroll County Water Authority, GA, 4.00%, 7/1/31 | | | 345 | | | | 428,594 | |
| | |
Eastern Municipal Water District Financing Authority, CA, 5.00%, 7/1/36 | | | 1,000 | | | | 1,306,860 | |
| | |
Fulton County, GA, Water and Sewerage Revenue, 4.00%, 1/1/32 | | | 1,375 | | | | 1,669,676 | |
| | |
New York City Municipal Water Finance Authority, NY,
(Water and Sewer System): | | | | | | |
| | |
4.00%, 6/15/41 | | | 4,000 | | | | 4,670,240 | |
| | |
5.00%, 6/15/48 | | | 4,400 | | | | 5,277,580 | |
| | |
Phoenix Civic Improvement Corp., AZ, Water System Revenue, 4.00%, 7/1/42 | | | 1,000 | | | | 1,198,890 | |
| | | | | | | | |
| Security | | Principal
Amount
(000’s omitted) | | | Value | |
|
| Water and Sewer (continued) | |
| | |
San Diego Public Facilities Financing Authority, CA, Water Revenue, 4.00%, 8/1/40 | | $ | 1,000 | | | $ | 1,189,990 | |
| |
| | | | $ | 24,360,150 | |
| |
Total Tax-Exempt Municipal Obligations — 105.2%
(identified cost $343,801,486) | | | $ | 369,140,512 | |
| |
Total Investments — 105.5%
(identified cost $345,029,221) | | | $ | 370,393,663 | |
| |
Other Assets, Less Liabilities — (5.5)% | | | $ | (19,394,765 | ) |
| |
Net Assets — 100.0% | | | $ | 350,998,898 | |
The percentage shown for each investment category in the Portfolio of Investments is based on net assets.
At September 30, 2021, the concentration of the Fund’s investments in the various states, determined as a percentage of net assets, is as follows:
| | | | |
| |
| New York | | | 15.8% | |
| |
| California | | | 12.7% | |
| |
| Others, representing less than 10% individually | | | 77.0% | |
The Fund invests primarily in debt securities issued by municipalities. The ability of the issuers of the debt securities to meet their obligations may be affected by economic developments in a specific industry or municipality. At September 30, 2021, 21.1% of total investments are backed by bond insurance of various financial institutions and financial guaranty assurance agencies. The aggregate percentage insured by an individual financial institution or financial guaranty assurance agency ranged from 1.1% to 14.6% of total investments.
| (1) | Security exempt from registration under Rule 144A of the Securities Act of 1933, as amended. These securities may be sold in certain transactions in reliance on an exemption from registration (normally to qualified institutional buyers). At September 30, 2021, the aggregate value of these securities is $6,827,043 or 1.9% of the Fund’s net assets. |
| (2) | Security represents the municipal bond held by a trust that issues residual interest bonds (see Note 1H). |
| (3) | When-issued/delayed delivery security. |
| (4) | Defaulted security. Issuer has defaulted on the payment of interest and/or principal or has filed for bankruptcy. |
Abbreviations:
| | | | |
| | |
| AGM | | – | | Assured Guaranty Municipal Corp. |
| | |
| BAM | | – | | Build America Mutual Assurance Co. |
| | |
| NPFG | | – | | National Public Finance Guarantee Corp. |
| | |
| PSF | | – | | Permanent School Fund |
| | | | |
| | 15 | | See Notes to Financial Statements. |
Eaton Vance
National Municipal Income Fund
September 30, 2021
Portfolio of Investments
| | | | | | | | |
| Corporate Bonds — 0.6% | |
| Security | | Principal
Amount
(000’s omitted) | | | Value | |
|
| Education — 0.3% | |
| | |
| Chapman University: | | | | | | |
| | |
1.371%, 4/1/26 | | $ | 4,425 | | | $ | 4,399,448 | |
| | |
1.56%, 4/1/27 | | | 4,995 | | | | 4,955,163 | |
| | |
1.867%, 4/1/29 | | | 5,160 | | | | 5,110,113 | |
| |
| | | | $ | 14,464,724 | |
|
| Hospital — 0.2% | |
| | |
Tower Health, 4.451%, 2/1/50 | | $ | 8,870 | | | $ | 7,959,317 | |
| |
| | | | $ | 7,959,317 | |
|
| Other Revenue — 0.1% | |
| | |
YMCA of Greater New York, 2.303%, 8/1/26 | | $ | 2,590 | | | $ | 2,600,590 | |
| |
| | | | $ | 2,600,590 | |
| |
Total Corporate Bonds — 0.6%
(identified cost $25,068,668) | | | $ | 25,024,631 | |
|
| Tax-Exempt Municipal Obligations — 94.7% | |
| Security | | Principal
Amount
(000’s omitted) | | | Value | |
|
| Bond Bank — 2.7% | |
| | |
Connecticut, (State Revolving Fund), Green Bonds, 5.00%, 3/1/28 | | $ | 10,000 | | | $ | 11,539,800 | |
| | |
Illinois Finance Authority, (Revolving Fund), Green Bonds, 4.00%, 7/1/32 | | | 11,480 | | | | 14,085,730 | |
| | |
Iowa Finance Authority, (State Revolving Fund), 5.00%, 8/1/32 | | | 12,000 | | | | 13,031,280 | |
| | |
New York State Environmental Facilities Corp., (State Revolving Fund), Green Bonds, 5.00%, 8/15/44 | | | 11,890 | | | | 15,029,673 | |
| | |
Ohio Water Development Authority, Water Pollution Control Loan Fund, 5.00%, 6/1/29 | | | 30,000 | | | | 38,526,300 | |
| | |
Rickenbacker Port Authority, OH, (OASBO Expanded Asset Pooled Financing Program), 5.375%, 1/1/32 | | | 11,145 | | | | 14,403,687 | |
| | |
Texas Water Development Board, (State Revolving Fund), 4.00%, 8/1/36 | | | 3,000 | | | | 3,643,020 | |
| |
| | | | $ | 110,259,490 | |
|
| Cogeneration — 0.1% | |
| | |
Northampton County Industrial Development Authority, PA, (Northampton Generating), (AMT), 5.00%, 12/31/23(1) | | $ | 14,652 | | | $ | 3,663,079 | |
| |
| | | | $ | 3,663,079 | |
| | | | | | | | |
| Security | | Principal
Amount
(000’s omitted) | | | Value | |
|
| Education — 6.7% | |
| | |
Allegheny County Higher Education Building Authority, PA, (Carnegie Mellon University), 5.00%, 8/1/27 | | $ | 3,335 | | | $ | 4,126,696 | |
| | |
Arizona Industrial Development Authority, (Somerset Academy of Las Vegas), 4.00%, 12/15/41(2) | | | 600 | | | | 654,228 | |
| | |
Build NYC Resource Corp., NY, (New World Preparatory
Charter School): | | | | | | |
| | |
4.00%, 6/15/51 | | | 400 | | | | 431,676 | |
| | |
4.00%, 6/15/56 | | | 300 | | | | 322,452 | |
| | |
California State University, 3.00%, 11/1/38 | | | 600 | | | | 655,566 | |
| | |
Connecticut Health and Educational Facilities Authority,
(Trinity College): | | | | | | |
| | |
4.00%, 6/1/39 | | | 1,695 | | | | 2,023,135 | |
| | |
4.00%, 6/1/40 | | | 1,760 | | | | 2,095,491 | |
| | |
5.00%, 6/1/37 | | | 400 | | | | 522,296 | |
| | |
5.00%, 6/1/38 | | | 500 | | | | 651,090 | |
| | |
Connecticut Health and Educational Facilities Authority, (Yale University), 5.00%, 7/1/27 | | | 5,000 | | | | 6,205,800 | |
| | |
District of Columbia, (District of Columbia International School), 5.00%, 7/1/49 | | | 2,290 | | | | 2,705,910 | |
| | |
Douglas County, NE, (Creighton University), 4.00%, 7/1/46 | | | 6,500 | | | | 7,666,945 | |
| | |
Erie Higher Education Building Authority, PA, (Gannon University), 4.00%, 5/1/41 | | | 460 | | | | 525,122 | |
| | |
Florida Development Finance Corp., (River City Science Academy), 4.00%, 7/1/45 | | | 400 | | | | 425,728 | |
| | |
Florida Higher Educational Facilities Financing Authority, (Jacksonville University), 4.75%, 6/1/38(2) | | | 2,245 | | | | 2,637,201 | |
| | |
Georgia Private Colleges and Universities Authority, (Mercer
University): | | | | | | |
| | |
5.00%, 10/1/27 | | | 535 | | | | 656,996 | |
| | |
5.00%, 10/1/28 | | | 470 | | | | 590,010 | |
| | |
| Kentucky Bond Development Corp., (Centre College): | | | | | | |
| | |
3.00%, 6/1/39 | | | 285 | | | | 306,649 | |
| | |
3.00%, 6/1/41 | | | 380 | | | | 406,630 | |
| | |
4.00%, 6/1/40 | | | 210 | | | | 246,819 | |
| | |
Louisiana Public Facilities Authority, (Loyola University), 4.00%, 10/1/41 | | | 650 | | | | 749,340 | |
| | |
Maryland Health and Higher Educational Facilities Authority,
(Loyola University Maryland): | | | | | | |
| | |
5.00%, 10/1/22 | | | 500 | | | | 523,265 | |
| | |
5.00%, 10/1/23 | | | 500 | | | | 546,170 | |
| | |
5.00%, 10/1/24 | | | 500 | | | | 567,045 | |
| | |
Maryland Health and Higher Educational Facilities Authority,
(Stevenson University): | | | | | | |
| | |
4.00%, 6/1/36 | | | 400 | | | | 467,316 | |
| | |
4.00%, 6/1/38 | | | 500 | | | | 581,160 | |
| | |
4.00%, 6/1/40 | | | 500 | | | | 577,685 | |
| | |
4.00%, 6/1/46 | | | 1,000 | | | | 1,135,550 | |
| | |
5.00%, 6/1/28 | | | 200 | | | | 246,144 | |
| | |
5.00%, 6/1/30 | | | 350 | | | | 444,969 | |
| | | | |
| | 16 | | See Notes to Financial Statements. |
Eaton Vance
National Municipal Income Fund
September 30, 2021
Portfolio of Investments — continued
| | | | | | | | |
| Security | | Principal
Amount
(000’s omitted) | | | Value | |
|
| Education (continued) | |
| | |
Massachusetts Development Finance Agency, (Harvard University), 5.00%, 7/15/34 | | $ | 18,855 | | | $ | 22,524,749 | |
| | |
Michigan Building Authority, 4.00%, 10/15/40 | | | 6,900 | | | | 8,283,933 | |
| | |
Michigan State University, 5.00%, 2/15/31 | | | 1,200 | | | | 1,519,884 | |
| | |
New Jersey Educational Facilities Authority,
(Princeton University): | | | | | | |
| | |
5.00%, 3/1/31 | | | 5,765 | | | | 7,764,302 | |
| | |
5.00%, 3/1/32 | | | 6,730 | | | | 9,032,939 | |
| | |
5.00%, 7/1/33 | | | 4,370 | | | | 5,367,409 | |
| | |
New York Dormitory Authority, (Columbia University), 5.00%, 10/1/38 | | | 18,310 | | | | 22,718,499 | |
| | |
New York Dormitory Authority, (New York University), 4.00%, 7/1/40 | | | 7,000 | | | | 8,394,540 | |
| | |
| New York Dormitory Authority, (Rockefeller University): | | | | | | |
| | |
5.00%, 7/1/35 | | | 2,750 | | | | 3,537,957 | |
| | |
5.00%, 7/1/53 | | | 15,000 | | | | 19,042,650 | |
| | |
| Purdue University, IN: | | | | | | |
| | |
5.00%, 7/1/31 | | | 1,000 | | | | 1,317,490 | |
| | |
5.00%, 7/1/35 | | | 685 | | | | 891,493 | |
| | |
5.00%, 7/1/36 | | | 1,500 | | | | 1,945,905 | |
| | |
San Antonio Education Facilities Corp., TX, (University of the Incarnate Word), 4.00%, 4/1/51 | | | 3,500 | | | | 3,920,735 | |
| | |
Swarthmore Borough Authority, PA, (Swarthmore College), 4.00%, 9/15/49 | | | 6,000 | | | | 7,075,500 | |
| | |
Troy Capital Resource Corp., NY, (Rensselaer Polytechnic Institute), 5.00%, 9/1/39 | | | 6,000 | | | | 7,570,440 | |
| | |
| University of California: | | | | | | |
| | |
5.25%, 5/15/36 | | | 5,720 | | | | 6,429,852 | |
| | |
5.25%, 5/15/37 | | | 13,000 | | | | 14,602,380 | |
| | |
5.25%, 5/15/38 | | | 7,700 | | | | 8,640,555 | |
| | |
University of Nebraska Facilities Corp., 5.00%, 7/15/31 | | | 725 | | | | 979,221 | |
| | |
| University of Virginia: | | | | | | |
| | |
5.00%, 4/1/38 | | | 13,205 | | | | 15,948,867 | |
| | |
5.00%, 4/1/39 | | | 40,970 | | | | 49,399,987 | |
| | |
Waco Education Finance Corp., TX, (Baylor University), 4.00%, 3/1/36 | | | 1,000 | | | | 1,179,620 | |
| |
| | | | $ | 267,783,991 | |
|
| Electric Utilities — 4.6% | |
| | |
Energy Northwest, WA, 4.00%, 7/1/42 | | $ | 7,735 | | | $ | 9,235,203 | |
| | |
Los Angeles Department of Water & Power, CA, Power
System Revenue: | | | | | | |
| | |
5.00%, 7/1/38 | | | 6,130 | | | | 7,778,970 | |
| | |
5.00%, 7/1/42 | | | 1,870 | | | | 2,250,134 | |
| | |
Lower Colorado River Authority, TX, (LCRA Transmission Services Corp.), 5.00%, 5/15/45 | | | 1,500 | | | | 1,838,790 | |
| | | | | | | | |
| Security | | Principal
Amount
(000’s omitted) | | | Value | |
|
| Electric Utilities (continued) | |
| | |
| New Smyrna Beach Utilities Commission, FL: | | | | | | |
| | |
4.00%, 10/1/41 | | $ | 435 | | | $ | 513,391 | |
| | |
4.00%, 10/1/42 | | | 300 | | | | 352,833 | |
| | |
New York Power Authority, 4.00%, 11/15/55 | | | 21,475 | | | | 24,834,120 | |
| | |
Omaha Public Power District, NE, 5.00%, 2/1/39 | | | 10,805 | | | | 12,284,961 | |
| | |
Public Power Generation Agency, NE, (Whelan Energy Center Unit 2), 5.00%, 1/1/28 | | | 6,025 | | | | 6,836,748 | |
| | |
| Sacramento Municipal Utility District, CA: | | | | | | |
| | |
5.00%, 8/15/35 | | | 1,000 | | | | 1,311,980 | |
| | |
5.00%, 8/15/37 | | | 8,800 | | | | 11,493,064 | |
| | |
5.00%, 8/15/38 | | | 11,000 | | | | 14,331,240 | |
| | |
Green Bonds, 4.00%, 8/15/40 | | | 6,200 | | | | 7,427,910 | |
| | |
San Antonio, TX, Electric and Gas Systems Revenue, 4.00%, 2/1/30 | | | 2,000 | | | | 2,454,520 | |
| | |
| Utility Debt Securitization Authority, NY: | | | | | | |
| | |
5.00%, 12/15/30(3) | | | 22,500 | | | | 24,834,375 | |
| | |
5.00%, 12/15/31(3) | | | 27,500 | | | | 30,346,525 | |
| | |
5.00%, 12/15/33 | | | 10,000 | | | | 11,802,800 | |
| | |
5.00%, 12/15/40 | | | 13,260 | | | | 16,336,320 | |
| |
| | | | $ | 186,263,884 | |
|
| Escrowed / Prerefunded — 2.7% | |
| | |
Columbia, SC, Waterworks and Sewer System Revenue, Prerefunded to 2/1/29, 5.00%, 2/1/49 | | $ | 2,340 | | | $ | 3,009,006 | |
| | |
Detroit, MI, Sewage Disposal System, Prerefunded to 7/1/22, 5.25%, 7/1/39 | | | 22,500 | | | | 23,355,225 | |
| | |
Michigan Finance Authority, (Detroit Water and Sewerage Department), Prerefunded to 7/1/22, 5.00%, 7/1/44 | | | 8,090 | | | | 8,382,535 | |
| | |
New Jersey Turnpike Authority, Prerefunded to 7/1/24, 5.00%, 1/1/31 | | | 10,000 | | | | 11,291,100 | |
| | |
Rutgers State University, NJ, Prerefunded to 5/1/23, 5.00%, 5/1/43(3) | | | 37,000 | | | | 39,797,200 | |
| | |
Southwestern Illinois Development Authority, (Memorial Group, Inc.), Prerefunded to 11/1/23, 7.25%, 11/1/33 | | | 9,170 | | | | 10,483,144 | |
| | |
Unified Government of Wyandotte County/Kansas City, KS, Utility System Revenue, Prerefunded to 9/1/22, 5.00%, 9/1/32 | | | 10,000 | | | | 10,438,100 | |
| | |
University of California, Prerefunded to 5/15/24, 5.25%, 5/15/36 | | | 1,360 | | | | 1,535,902 | |
| |
| | | | $ | 108,292,212 | |
|
| General Obligations — 20.1% | |
| | |
| Anaheim Union High School District, CA, (Election of 2014): | | | | | | |
| | |
4.00%, 8/1/30 | | $ | 2,070 | | | $ | 2,413,516 | |
| | |
4.00%, 8/1/31 | | | 2,295 | | | | 2,661,948 | |
| | | | |
| | 17 | | See Notes to Financial Statements. |
Eaton Vance
National Municipal Income Fund
September 30, 2021
Portfolio of Investments — continued
| | | | | | | | |
| Security | | Principal
Amount
(000’s omitted) | | | Value | |
|
| General Obligations (continued) | |
| | |
Antelope Valley Community College District, CA, (Election of 2016), 4.00%, 8/1/45 | | $ | 2,500 | | | $ | 2,944,500 | |
| | |
Belmont, MA, 4.00%, 3/15/32 | | | 3,030 | | | | 3,589,217 | |
| | |
Cabrillo Unified School District, CA, (Election of 2018), 5.00%, 8/1/50 | | | 10,355 | | | | 12,717,493 | |
| | |
| California: | | | | | | |
| | |
0.48%, (SIFMA + 0.43%), 12/1/23 (Put Date), 12/1/29(4) | | | 15,000 | | | | 15,034,200 | |
| | |
4.00%, 3/1/38 | | | 8,425 | | | | 10,001,486 | |
| | |
4.00%, 10/1/41 | | | 5,000 | | | | 5,955,800 | |
| | |
5.00%, 9/1/27 | | | 500 | | | | 623,235 | |
| | |
5.00%, 9/1/28 | | | 1,500 | | | | 1,910,580 | |
| | |
5.00%, 9/1/29 | | | 1,500 | | | | 1,951,560 | |
| | |
5.00%, 3/1/35 | | | 23,410 | | | | 30,100,812 | |
| | |
5.00%, 3/1/35 | | | 5,000 | | | | 6,429,050 | |
| | |
Centennial School District No. 28Jt, OR, 5.00%, 6/15/45 | | | 10,000 | | | | 12,647,400 | |
| | |
| Chester County, PA: | | | | | | |
| | |
4.00%, 7/15/39 | | | 400 | | | | 468,848 | |
| | |
4.00%, 7/15/40 | | | 500 | | | | 584,965 | |
| | |
| Chicago Board of Education, IL: | | | | | | |
| | |
5.00%, 12/1/21 | | | 1,980 | | | | 1,994,553 | |
| | |
5.00%, 12/1/22 | | | 400 | | | | 420,872 | |
| | |
5.00%, 12/1/30 | | | 1,435 | | | | 1,830,615 | |
| | |
5.00%, 12/1/42 | | | 2,770 | | | | 2,877,254 | |
| | |
5.00%, 12/1/44 | | | 15,110 | | | | 17,824,663 | |
|
| Chicago, IL: | |
| | |
5.00%, 1/1/39 | | | 2,100 | | | | 2,526,300 | |
| | |
5.00%, 1/1/40 | | | 1,500 | | | | 1,801,215 | |
| | |
| Clackamas Community College District, OR: | | | | | | |
| | |
5.00%, 6/15/38 | | | 760 | | | | 919,433 | |
| | |
5.00%, 6/15/39 | | | 1,000 | | | | 1,207,670 | |
| | |
5.00%, 6/15/40 | | | 1,250 | | | | 1,507,362 | |
| | |
Collin County Community College District, TX, 4.00%, 8/15/37 | | | 1,000 | | | | 1,193,900 | |
| | |
Collin County, TX, 4.00%, 2/15/36 | | | 5,705 | | | | 6,705,086 | |
| | |
| Connecticut: | | | | | | |
| | |
3.00%, 1/15/33 | | | 7,000 | | | | 7,822,920 | |
| | |
4.00%, 1/15/37 | | | 15,000 | | | | 17,643,300 | |
| | |
Desert Community College District, CA, 5.00%, 8/1/37 | | | 5,350 | | | | 6,326,482 | |
| | |
| District of Columbia: | | | | | | |
| | |
5.00%, 10/15/30 | | | 4,000 | | | | 5,139,440 | |
| | |
5.00%, 10/15/32 | | | 10,000 | | | | 12,762,600 | |
| | |
Eagle Mountain-Saginaw Independent School District, TX,
(PSF Guaranteed): | | | | | | |
| | |
4.00%, 8/15/34 | | | 2,700 | | | | 3,275,316 | |
| | |
4.00%, 8/15/35 | | | 1,150 | | | | 1,391,213 | |
| | |
4.00%, 8/15/36 | | | 1,350 | | | | 1,626,831 | |
| | | | | | | | |
| Security | | Principal
Amount
(000’s omitted) | | | Value | |
|
| General Obligations (continued) | |
| | |
Forney Independent School District, TX, (PSF Guaranteed), 3.00%, 2/15/33 | | $ | 500 | | | $ | 561,090 | |
|
| Garden City Public Schools, MI: | |
| | |
4.00%, 5/1/43 | | | 1,560 | | | | 1,832,064 | |
| | |
5.00%, 5/1/35 | | | 1,060 | | | | 1,353,472 | |
| | |
5.00%, 5/1/46 | | | 3,505 | | | | 4,424,992 | |
| | |
Glendale Community College District, CA, (Election of 2016), 4.00%, 8/1/50 | | | 14,950 | | | | 17,324,359 | |
| | |
Hall County School District, GA, 4.00%, 2/1/38 | | | 1,500 | | | | 1,820,610 | |
| | |
Hawaii, 5.00%, 1/1/34 | | | 13,700 | | | | 16,901,827 | |
| | |
Hennepin County Regional Railroad Authority, MN, 5.00%, 12/1/30 | | | 4,040 | | | | 5,127,164 | |
| | |
| Hermiston School District No. 8R, OR: | | | | | | |
| | |
0.00%, 6/15/42 | | | 6,475 | | | | 3,583,524 | |
| | |
0.00%, 6/15/45 | | | 4,595 | | | | 2,250,907 | |
| | |
| Hillsboro School District No. 1J, OR: | | | | | | |
| | |
4.00%, 6/15/39 | | | 5,500 | | | | 6,550,060 | |
| | |
4.00%, 6/15/40 | | | 2,500 | | | | 2,970,800 | |
| | |
| Howard County, MD: | | | | | | |
| | |
4.00%, 8/15/35 | | | 2,065 | | | | 2,517,297 | |
| | |
4.00%, 8/15/36 | | | 6,610 | | | | 8,014,228 | |
| | |
4.00%, 8/15/37 | | | 5,000 | | | | 6,043,700 | |
| | |
4.00%, 8/15/38 | | | 1,245 | | | | 1,499,964 | |
| | |
| Hudsonville Public Schools, MI: | | | | | | |
| | |
4.00%, 5/1/37 | | | 1,500 | | | | 1,787,565 | |
| | |
4.00%, 5/1/39 | | | 1,060 | | | | 1,256,948 | |
| | |
4.00%, 5/1/44 | | | 1,975 | | | | 2,314,246 | |
| | |
| Illinois: | | | | | | |
| | |
5.00%, 2/1/24 | | | 10,705 | | | | 11,814,359 | |
| | |
5.00%, 11/1/24 | | | 11,295 | | | | 12,795,767 | |
| | |
5.00%, 2/1/27 | | | 18,500 | | | | 20,268,415 | |
| | |
5.00%, 2/1/29 | | | 15,000 | | | | 17,721,300 | |
| | |
5.00%, 5/1/39 | | | 10,000 | | | | 10,876,300 | |
| | |
5.25%, 7/1/30 | | | 6,150 | | | | 6,588,741 | |
| | |
5.50%, 5/1/39 | | | 870 | | | | 1,100,768 | |
| | |
5.75%, 5/1/45 | | | 890 | | | | 1,127,194 | |
| | |
Johnson County, KS, 3.00%, 9/1/30 | | | 1,620 | | | | 1,862,595 | |
| | |
| Kane, Cook and DuPage Counties School District No. 46, IL: | | | | | | |
| | |
5.00%, 1/1/29 | | | 1,920 | | | | 2,114,381 | |
| | |
5.00%, 1/1/30 | | | 4,105 | | | | 4,520,590 | |
| | |
Lake Washington School District No. 414, WA, 4.00%, 12/1/28 | | | 10,000 | | | | 12,126,900 | |
| | |
| Lodi Unified School District, CA, (Election of 2016): | | | | | | |
| | |
4.00%, 8/1/36 | | | 1,250 | | | | 1,445,675 | |
| | |
4.00%, 8/1/39 | | | 2,935 | | | | 3,375,338 | |
| | | | |
| | 18 | | See Notes to Financial Statements. |
Eaton Vance
National Municipal Income Fund
September 30, 2021
Portfolio of Investments — continued
| | | | | | | | |
| Security | | Principal
Amount
(000’s omitted) | | | Value | |
|
| General Obligations (continued) | |
| | |
| Massachusetts: | | | | | | |
| | |
5.00%, 7/1/35 | | $ | 10,000 | | | $ | 11,583,300 | |
| | |
5.00%, 3/1/37 | | | 10,900 | | | | 12,061,940 | |
| | |
Memphis, TN, 4.00%, 5/1/46 | | | 1,305 | | | | 1,545,420 | |
| | |
Minnesota, 4.00%, 9/1/39 | | | 15,000 | | | | 18,339,000 | |
| | |
Mississippi, 4.00%, 6/1/33 | | | 1,000 | | | | 1,225,280 | |
| | |
| New Jersey: | | | | | | |
| | |
3.00%, 6/1/32 | | | 12,500 | | | | 14,061,875 | |
| | |
5.00%, 6/1/25 | | | 5,000 | | | | 5,804,600 | |
| | |
5.00%, 6/1/27 | | | 4,000 | | | | 4,909,000 | |
| | |
5.00%, 6/1/29 | | | 3,000 | | | | 3,842,130 | |
| | |
New Orleans, LA, 5.00%, 12/1/46 | | | 10,000 | | | | 12,548,700 | |
| | |
| New York, NY: | | | | | | |
| | |
4.00%, 8/1/38 | | | 3,590 | | | | 4,206,475 | |
| | |
4.00%, 8/1/42(3) | | | 28,000 | | | | 32,414,200 | |
| | |
| Novi Community School District, MI: | | | | | | |
| | |
5.00%, 5/1/41 | | | 1,100 | | | | 1,405,558 | |
| | |
5.00%, 5/1/42 | | | 1,700 | | | | 2,175,762 | |
| | |
5.00%, 5/1/43 | | | 1,150 | | | | 1,467,802 | |
| | |
Ocean City, NJ, 2.25%, 9/15/32 | | | 1,760 | | | | 1,839,446 | |
| | |
| Oklahoma City, OK: | | | | | | |
| | |
4.00%, 3/1/30 | | | 160 | | | | 197,882 | |
| | |
4.00%, 3/1/31 | | | 315 | | | | 393,939 | |
| | |
Oxnard Union High School District, CA, (Election of 2018), 5.00%, 8/1/43 | | | 3,750 | | | | 4,403,100 | |
| | |
Park City, UT, 4.00%, 2/1/31 | | | 3,490 | | | | 4,180,531 | |
| | |
Pflugerville, TX, 4.00%, 8/1/34 | | | 495 | | | | 594,668 | |
| | |
| Piscataway Township, NJ: | | | | | | |
| | |
2.00%, 10/15/36 | | | 1,600 | | | | 1,577,744 | |
| | |
3.00%, 10/15/32 | | | 1,610 | | | | 1,826,577 | |
| | |
Port of Houston Authority, TX, 3.00%, 10/1/39 | | | 1,325 | | | | 1,462,734 | |
| | |
| Portland, OR: | | | | | | |
| | |
2021 Series A, 5.00%, 6/1/26 | | | 2,665 | | | | 3,211,858 | |
| | |
2021 Series B, 5.00%, 6/1/26 | | | 975 | | | | 1,175,070 | |
| | |
Prince George’s County, MD, 4.00%, 7/1/32 | | | 5,500 | | | | 6,891,170 | |
| | |
Prosper Independent School District, TX, (PSF Guaranteed), 3.00%, 2/15/36 | | | 500 | | | | 560,250 | |
| | |
| Puerto Rico: | | | | | | |
| | |
5.75%, 7/1/41(5) | | | 8,340 | | | | 7,735,350 | |
| | |
8.00%, 7/1/35(5) | | | 2,765 | | | | 2,391,725 | |
| | |
8.00%, 7/1/35(5) | | | 1,985 | | | | 1,694,694 | |
| | |
| Richmond Community Schools, MI: | | | | | | |
| | |
4.00%, 5/1/36 | | | 2,200 | | | | 2,582,360 | |
| | |
4.00%, 5/1/37 | | | 2,655 | | | | 3,108,155 | |
| | |
4.00%, 5/1/38 | | | 2,665 | | | | 3,113,066 | |
| | |
4.00%, 5/1/39 | | | 2,665 | | | | 3,105,951 | |
| | | | | | | | |
| Security | | Principal
Amount
(000’s omitted) | | | Value | |
|
| General Obligations (continued) | |
| | |
| Riverside Unified School District, CA, (Election of 2016): | | | | | | |
| | |
4.00%, 8/1/32 | | $ | 2,250 | | | $ | 2,615,850 | |
| | |
4.00%, 8/1/33 | | | 1,350 | | | | 1,569,091 | |
| | |
4.00%, 8/1/34 | | | 1,100 | | | | 1,275,472 | |
| | |
San Francisco Bay Area Rapid Transit District, CA, (Election of 2016), Green Bonds, 4.00%, 8/1/45 | | | 10,290 | | | | 12,232,032 | |
| | |
| San Francisco City and County, CA: | | | | | | |
| | |
4.00%, 6/15/42 | | | 6,000 | | | | 7,044,420 | |
| | |
4.00%, 6/15/43 | | | 9,515 | | | | 11,150,248 | |
| | |
St. Paul, MN, 5.00%, 3/1/22 | | | 3,705 | | | | 3,778,100 | |
| | |
Sumner County, TN, 3.00%, 6/1/32 | | | 2,460 | | | | 2,828,213 | |
| | |
Tennessee, 5.00%, 9/1/28 | | | 3,000 | | | | 3,724,950 | |
| | |
Texas, (AMT), 4.50%, 8/1/28 | | | 1,585 | | | | 1,940,294 | |
| | |
Texas, (Texas Transportation Commission), Prerefunded to 10/1/24, 5.00%, 10/1/44 | | | 10,000 | | | | 11,398,700 | |
| | |
Virginia Beach, VA, 4.00%, 7/15/32 | | | 2,300 | | | | 2,785,047 | |
| | |
| Walled Lake Consolidated School District, MI: | | | | | | |
| | |
5.00%, 5/1/41 | | | 700 | | | | 903,553 | |
| | |
5.00%, 5/1/42 | | | 1,000 | | | | 1,280,790 | |
| | |
5.00%, 5/1/45 | | | 1,365 | | | | 1,734,137 | |
| | |
5.00%, 5/1/50 | | | 2,500 | | | | 3,145,775 | |
| | |
| Washington: | | | | | | |
| | |
5.00%, 2/1/33 | | | 13,140 | | | | 14,520,357 | |
| | |
5.00%, 8/1/35 | | | 14,355 | | | | 17,590,043 | |
| | |
5.00%, 8/1/38 | | | 24,430 | | | | 31,329,765 | |
| | |
5.00%, 6/1/39 | | | 2,125 | | | | 2,707,802 | |
| | |
5.00%, 6/1/41 | | | 3,000 | | | | 3,804,720 | |
| | |
5.00%, 8/1/46 | | | 32,965 | | | | 42,330,027 | |
| | |
Washington County, OR, 4.00%, 3/1/30 | | | 1,000 | | | | 1,134,190 | |
| | |
Weld County School District No. 6, CO, 4.00%, 12/1/45 | | | 1,250 | | | | 1,485,375 | |
| | |
| West Linn-Wilsonville School District No. 3JT, OR: | | | | | | |
| | |
0.00%, 6/15/40 | | | 1,200 | | | | 754,200 | |
| | |
0.00%, 6/15/41 | | | 1,500 | | | | 910,575 | |
| | |
West Sonoma County Union High School District, CA,
(Election of 2018): | | | | | | |
| | |
5.00%, 8/1/46 | | | 1,000 | | | | 1,226,400 | |
| | |
5.00%, 8/1/49 | | | 3,430 | | | | 4,202,642 | |
| | |
| Wilmington, DE: | | | | | | |
| | |
5.00%, 1/1/33 | | | 1,000 | | | | 1,323,450 | |
| | |
5.00%, 1/1/35 | | | 1,330 | | | | 1,748,657 | |
| | |
Wisconsin, 5.00%, 5/1/38 | | | 22,500 | | | | 25,894,350 | |
| |
| | | | $ | 802,711,312 | |
| | | | |
| | 19 | | See Notes to Financial Statements. |
Eaton Vance
National Municipal Income Fund
September 30, 2021
Portfolio of Investments — continued
| | | | | | | | |
| Security | | Principal
Amount
(000’s omitted) | | | Value | |
|
| Hospital — 8.9% | |
| | |
Allegheny County Hospital Development Authority, PA, (Allegheny Health Network Obligated Group), 4.00%, 4/1/44 | | $ | 5,000 | | | $ | 5,620,000 | |
| | |
Allegheny County Hospital Development Authority, PA, (UPMC Health System), 5.00%, 7/15/32 | | | 2,250 | | | | 2,851,222 | |
| | |
Arlington County Industrial Development Authority, VA,
(Virginia Hospital Center): | | | | | | |
| | |
4.00%, 7/1/38 | | | 1,000 | | | | 1,180,620 | |
| | |
4.00%, 7/1/45 | | | 3,000 | | | | 3,481,380 | |
| | |
Berks County Industrial Development Authority, PA, (Tower Health), 5.00%, 11/1/47 | | | 510 | | | | 561,464 | |
| | |
Brookhaven Development Authority, GA,
(Children’s Healthcare of Atlanta): | | | | | | |
| | |
4.00%, 7/1/49 | | | 7,235 | | | | 8,299,486 | |
| | |
5.00%, 7/1/31 | | | 755 | | | | 971,730 | |
| | |
Bucks County Industrial Development Authority, PA, (Grand View Hospital), 4.00%, 7/1/46 | | | 4,000 | | | | 4,447,160 | |
| | |
California Health Facilities Financing Authority, (St. Joseph
Health System): | | | | | | |
| | |
5.00%, 7/1/33 | | | 17,530 | | | | 18,962,552 | |
| | |
5.00%, 7/1/37 | | | 25,465 | | | | 27,527,410 | |
| | |
Colorado Health Facilities Authority, (AdventHealth Obligated Group), 3.00%, 11/15/51 | | | 8,400 | | | | 8,863,344 | |
| | |
Colorado Health Facilities Authority, (SCL Health System), 4.00%, 1/1/36 | | | 2,000 | | | | 2,361,000 | |
| | |
Connecticut Health and Educational Facilities Authority, (Hartford HealthCare), 4.00%, 7/1/46 | | | 15,500 | | | | 17,761,760 | |
| | |
Connecticut Health and Educational Facilities Authority, (Nuvance Health), 4.00%, 7/1/34 | | | 2,455 | | | | 2,840,533 | |
| | |
DeKalb Private Hospital Authority, GA, (Children’s Healthcare of Atlanta), 5.00%, 7/1/31 | | | 1,000 | | | | 1,287,060 | |
| | |
Douglas County Hospital Authority No. 2, NE,
(Children’s Hospital Obligated Group): | | | | | | |
| | |
4.00%, 11/15/36 | | | 425 | | | | 503,714 | |
| | |
4.00%, 11/15/41 | | | 590 | | | | 689,421 | |
| | |
Duluth Economic Development Authority, MN, (St. Luke’s Hospital of Duluth Obligated Group), 4.00%, 6/15/35(6) | | | 1,260 | | | | 1,431,826 | |
| | |
Escambia County Health Facilities Authority, FL, (Baptist Health Care Corp. Obligated Group), 4.00%, 8/15/50 | | | 4,340 | | | | 4,844,612 | |
| | |
Florida Development Finance Corp., (Lakeland Regional
Health Systems): | | | | | | |
| | |
5.00%, 11/15/28 | | | 1,300 | | | | 1,654,354 | |
| | |
5.00%, 11/15/29 | | | 1,250 | | | | 1,621,838 | |
| | |
5.00%, 11/15/30 | | | 1,200 | | | | 1,586,448 | |
| | |
Fulton County Development Authority, GA, (Piedmont Healthcare, Inc.), 4.00%, 7/1/37 | | | 2,000 | | | | 2,342,040 | |
| | |
Hamilton County, OH, (UC Health), 5.00%, 9/15/50 | | | 8,000 | | | | 9,784,640 | |
| | | | | | | | |
| Security | | Principal
Amount
(000’s omitted) | | | Value | |
|
| Hospital (continued) | |
| | |
Illinois Finance Authority, (Edward-Elmhurst Healthcare), 0.80%, (SIFMA + 0.75%), 7/1/23 (Put Date), 1/1/46(4) | | $ | 9,500 | | | $ | 9,505,890 | |
| | |
| Illinois Finance Authority, (Presence Health Network): | | | | | | |
| | |
5.00%, 2/15/26 | | | 7,500 | | | | 8,925,075 | |
| | |
5.00%, 2/15/33 | | | 1,500 | | | | 1,806,150 | |
| | |
Kentucky Economic Development Finance Authority, (CommonSpirit Health), 5.00%, 8/1/44 | | | 6,000 | | | | 7,309,020 | |
| | |
Massachusetts Development Finance Agency, (CareGroup), 5.00%, 7/1/43 | | | 2,785 | | | | 3,356,900 | |
| | |
Medford Hospital Facilities Authority, OR, (Asante Health
System): | | | | | | |
| | |
4.00%, 8/15/50 | | | 2,000 | | | | 2,294,760 | |
| | |
5.00%, 8/15/45 | | | 3,000 | | | | 3,746,790 | |
| | |
Michigan Finance Authority, (Henry Ford Health System), 5.00%, 11/15/48 | | | 5,000 | | | | 6,189,100 | |
| | |
Minneapolis and St. Paul Housing and Redevelopment Authority, MN, (Allina Health System), 5.00%, 11/15/23 | | | 1,700 | | | | 1,868,827 | |
| | |
Missouri Health and Educational Facilities Authority, (Mosaic Health System), 4.00%, 2/15/44 | | | 2,200 | | | | 2,500,388 | |
| | |
Missouri Health and Educational Facilities Authority, (SSM Health Care), 5.00%, 6/1/30 | | | 7,505 | | | | 8,380,608 | |
| | |
Mobile Infirmary Health System Special Care Facilities
Financing Authority, AL, (Infirmary Health System, Inc.): | | | | | | |
| | |
3.00%, 2/1/46 | | | 6,000 | | | | 6,181,680 | |
| | |
4.00%, 2/1/46 | | | 10,000 | | | | 11,508,300 | |
| | |
Montana Facility Finance Authority, (SCL Health System), 4.00%, 1/1/38 | | | 2,150 | | | | 2,528,507 | |
| | |
New Jersey Health Care Facilities Financing Authority, (AtlantiCare Health System Obligated Group), 3.00%, 7/1/46 | | | 4,000 | | | | 4,179,760 | |
| | |
New Jersey Health Care Facilities Financing Authority, (RWJ Barnabas Health Obligated Group), 5.00%, 7/1/33 | | | 5,000 | | | | 5,966,000 | |
| | |
New York Dormitory Authority, (Memorial Sloan-Kettering Cancer Center), 4.00%, 7/1/38 | | | 3,400 | | | | 4,035,052 | |
| | |
New York Dormitory Authority, (NYU Langone Hospitals
Obligated Group): | | | | | | |
| | |
4.00%, 7/1/50 | | | 5,330 | | | | 6,133,178 | |
| | |
4.00%, 7/1/53 | | | 10,000 | | | | 11,481,600 | |
| | |
| North Carolina Medical Care Commission, (Rex Healthcare): | | | | | | |
| | |
4.00%, 7/1/40 | | | 1,400 | | | | 1,607,746 | |
| | |
4.00%, 7/1/49 | | | 2,635 | | | | 2,970,895 | |
| | |
| Oklahoma Development Finance Authority, (OU Medicine): | | | | | | |
| | |
5.00%, 8/15/38 | | | 1,750 | | | | 2,097,358 | |
| | |
5.25%, 8/15/43 | | | 5,200 | | | | 6,309,836 | |
| | |
Oregon Facilities Authority, (Samaritan Health Services), 5.00%, 10/1/35 | | | 2,260 | | | | 2,643,725 | |
| | |
Oregon Health and Science University, 4.00%, 7/1/44 | | | 1,685 | | | | 1,941,693 | |
| | | | |
| | 20 | | See Notes to Financial Statements. |
Eaton Vance
National Municipal Income Fund
September 30, 2021
Portfolio of Investments — continued
| | | | | | | | |
| Security | | Principal
Amount
(000’s omitted) | | | Value | |
|
| Hospital (continued) | |
| | |
Pennsylvania Economic Development Financing Authority,
(UPMC): | | | | | | |
| | |
4.00%, 4/15/45 | | $ | 3,250 | | | $ | 3,740,717 | |
| | |
4.00%, 10/15/51 | | | 5,000 | | | | 5,799,850 | |
| | |
Pennsylvania Higher Educational Facilities Authority,
(University of Pennsylvania Health System): | | | | | | |
| | |
4.00%, 8/15/49 | | | 2,235 | | | | 2,563,389 | |
| | |
5.00%, 8/15/23(6) | | | 500 | | | | 527,570 | |
| | |
5.00%, 8/15/24(6) | | | 550 | | | | 602,256 | |
| | |
5.00%, 8/15/25(6) | | | 500 | | | | 565,655 | |
| | |
5.00%, 8/15/26(6) | | | 600 | | | | 698,256 | |
| | |
Pima County Industrial Development Authority, AZ, (Tucson Medical Center), 4.00%, 4/1/46 | | | 4,500 | | | | 5,250,150 | |
| | |
| Public Finance Authority, WI, (Blue Ridge HealthCare): | | | | | | |
| | |
5.00%, 1/1/36 | | | 470 | | | | 588,036 | |
| | |
5.00%, 1/1/37 | | | 500 | | | | 623,830 | |
| | |
Tampa, FL, (BayCare Health System), 5.00%, 11/15/46 | | | 10,500 | | | | 12,214,860 | |
| | |
Tarrant County Cultural Education Facilities Finance Corp., TX, (Cook Children’s Medical Center), 4.00%, 12/1/34 | | | 2,685 | | | | 3,173,455 | |
| | |
University of Kansas Hospital Authority, 5.00%, 9/1/45 | | | 25,500 | | | | 29,359,170 | |
| | |
Virginia Small Business Financing Authority, (Sentara Healthcare), 4.00%, 11/1/38 | | | 5,000 | | | | 5,851,350 | |
| | |
Washington Health Care Facilities Authority, (Overlake Hospital Medical Center), 5.00%, 7/1/42 | | | 2,250 | | | | 2,695,500 | |
| | |
West Virginia Hospital Finance Authority, (West Virginia United Health System Obligated Group), Prerefunded to 6/1/23, 5.375%, 6/1/38 | | | 21,895 | | | | 23,754,542 | |
| |
| | | | $ | 354,953,038 | |
|
| Housing — 0.7% | |
| | |
California Community Housing Agency, (Summit at Sausalito Apartments), 3.00%, 2/1/57(2) | | $ | 6,000 | | | $ | 5,686,020 | |
| | |
CSCDA Community Improvement Authority, CA, Essential
Housing Revenue: | | | | | | |
| | |
2.80%, 3/1/47(2) | | | 1,800 | | | | 1,723,878 | |
| | |
3.00%, 12/1/56(2) | | | 3,580 | | | | 3,388,828 | |
| | |
Maryland Economic Development Corp., (Morgan State University), Student Housing Revenue, 5.00%, 7/1/56 | | | 1,750 | | | | 2,116,573 | |
| | |
Massachusetts Housing Finance Agency, (Mill Road Apartments), 0.60%, (SIFMA + 0.55%), 11/1/23 (Put Date), 11/1/48(4) | | | 3,920 | | | | 3,920,000 | |
| | |
Texas Student Housing Corp., (University of Northern Texas), 6.85%, 7/1/31 | | | 10,640 | | | | 10,638,723 | |
| |
| | | | $ | 27,474,022 | |
| | | | | | | | |
| Security | | Principal
Amount
(000’s omitted) | | | Value | |
|
| Industrial Development Revenue — 2.0% | |
| | |
Arkansas Development Finance Authority, (Big River Steel), (AMT), 4.50%, 9/1/49(2) | | $ | 1,000 | | | $ | 1,097,760 | |
| | |
George L. Smith II Georgia World Congress Center Authority, 4.00%, 1/1/54 | | | 3,690 | | | | 4,188,814 | |
| | |
Metropolitan Nashville Airport Authority, TN, (Aero Nashville), 5.20%, 7/1/26 | | | 230 | | | | 230,202 | |
| | |
New Jersey Economic Development Authority, (New Jersey-American Water Co., Inc.), (AMT), 2.20% to 12/3/29 (Put Date), 10/1/39 | | | 13,900 | | | | 14,605,842 | |
| | |
New York Transportation Development Corp., (Delta Air
Lines, Inc. - LaGuardia Airport Terminals C&D
Redevelopment): | | | | | | |
| | |
(AMT), 4.00%, 10/1/30 | | | 12,500 | | | | 14,626,500 | |
| | |
(AMT), 4.375%, 10/1/45 | | | 4,475 | | | | 5,193,640 | |
| | |
(AMT), 5.00%, 10/1/35 | | | 29,085 | | | | 36,380,682 | |
| | |
Tuscaloosa County Industrial Development Authority, AL, (Hunt Refining Co.), 5.25%, 5/1/44(2) | | | 3,685 | | | | 4,270,031 | |
| | |
Vermont Economic Development Authority, (Casella Waste Systems, Inc.), (AMT), 4.625% to 4/3/28 (Put Date), 4/1/36(2) | | | 475 | | | | 559,479 | |
| |
| | | | $ | 81,152,950 | |
|
| Insured – Education — 0.3% | |
|
| University of Wyoming: | |
| | |
(AGM), 4.00%, 6/1/40 | | $ | 5,560 | | | $ | 6,604,668 | |
| | |
(AGM), 4.00%, 6/1/51 | | | 5,000 | | | | 5,825,134 | |
| |
| | | | $ | 12,429,802 | |
|
| Insured – Electric Utilities — 0.1% | |
|
| Texas Municipal Power Agency: | |
| | |
(AGM), 3.00%, 9/1/29 | | $ | 1,000 | | | $ | 1,088,190 | |
| | |
(AGM), 3.00%, 9/1/32 | | | 750 | | | | 807,720 | |
| | |
West Memphis, AR, Public Utility System Revenue, (BAM), 3.00%, 12/1/41(6) | | | 1,750 | | | | 1,847,790 | |
| |
| | | | $ | 3,743,700 | |
|
| Insured – Escrowed / Prerefunded — 1.1% | |
| | |
North Texas Tollway Authority, (AGC), Prerefunded to 1/1/25, 6.20%, 1/1/42 | | $ | 37,070 | | | $ | 44,000,607 | |
| |
| | | | $ | 44,000,607 | |
|
| Insured – General Obligations — 1.6% | |
| | |
| Grandville Public Schools, MI: | | | | | | |
| | |
(AGM), 4.00%, 5/1/35 | | $ | 785 | | | $ | 930,500 | |
| | |
(AGM), 4.00%, 5/1/36 | | | 1,045 | | | | 1,232,504 | |
| | | | |
| | 21 | | See Notes to Financial Statements. |
Eaton Vance
National Municipal Income Fund
September 30, 2021
Portfolio of Investments — continued
| | | | | | | | |
| Security | | Principal
Amount
(000’s omitted) | | | Value | |
|
| Insured – General Obligations (continued) | |
| | |
| Grandville Public Schools, MI: (continued) | | | | | | |
| | |
(AGM), 4.00%, 5/1/38 | | $ | 1,000 | | | $ | 1,171,360 | |
| | |
(AGM), 4.00%, 5/1/39 | | | 1,000 | | | | 1,168,390 | |
| | |
(AGM), 4.00%, 5/1/40 | | | 650 | | | | 758,374 | |
| | |
Nassau County, NY, (AGM), 5.00%, 4/1/44 | | | 10,205 | | | | 12,705,225 | |
| | |
New Haven, CT, (AGM), 5.00%, 8/1/39 | | | 3,000 | | | | 3,711,090 | |
| | |
Oceanside Unified School District, CA, (Election of 2020), (AGM), 4.00%, 8/1/51 | | | 13,600 | | | | 15,984,760 | |
| | |
Pomona Unified School District, CA, (Election of 2016), (BAM), 3.00%, 8/1/48 | | | 5,000 | | | | 5,328,600 | |
| | |
Santa Rosa Elementary School District, CA, (Election of 2014), (BAM), 4.00%, 8/1/43 | | | 1,000 | | | | 1,174,530 | |
| | |
| Santa Rosa High School District, CA, (Election of 2014): | | | | | | |
| | |
(AGM), 5.00%, 8/1/43 | | | 3,930 | | | | 4,628,597 | |
| | |
(BAM), 4.00%, 8/1/40 | | | 180 | | | | 213,179 | |
| | |
(BAM), 4.00%, 8/1/41 | | | 1,000 | | | | 1,181,420 | |
| | |
(BAM), 4.00%, 8/1/42 | | | 1,200 | | | | 1,414,080 | |
| | |
(BAM), 4.00%, 8/1/43 | | | 1,000 | | | | 1,176,140 | |
| | |
| Ukiah Unified School District, CA, (Election of 2020): | | | | | | |
| | |
(AGM), 5.00%, 8/1/38 | | | 1,330 | | | | 1,651,222 | |
| | |
(AGM), 5.00%, 8/1/45 | | | 2,000 | | | | 2,452,360 | |
| | |
(AGM), 5.00%, 8/1/49 | | | 2,250 | | | | 2,750,287 | |
| | |
Upper Darby School District, PA, (BAM), 4.00%, 4/1/51 | | | 2,790 | | | | 3,242,092 | |
| |
| | | | $ | 62,874,710 | |
|
| Insured – Hospital — 0.0%(7) | |
| | |
Connecticut Health and Educational Facilities Authority, (Hartford HealthCare Obligated Group), (AGM), 4.00%, 7/1/36 | | $ | 1,700 | | | $ | 1,991,142 | |
| |
| | | | $ | 1,991,142 | |
|
| Insured – Housing — 0.1% | |
| | |
California Municipal Finance Authority, (CHF-Davis II,
LLC - Orchard Park Student Housing), Green Bonds: | | | | | | |
| | |
(BAM), 3.00%, 5/15/51 | | $ | 1,005 | | | $ | 1,049,190 | |
| | |
(BAM), 4.00%, 5/15/46 | | | 1,005 | | | | 1,164,966 | |
| |
| | | | $ | 2,214,156 | |
|
| Insured – Other Revenue — 1.0% | |
| | |
Harris County-Houston Sports Authority, TX, (AGM), (NPFG), 0.00%, 11/15/34 | | $ | 58,155 | | | $ | 35,486,763 | |
| | |
New York City Industrial Development Agency, NY,
(Yankee Stadium): | | | | | | |
| | |
(AGM), 3.00%, 3/1/39 | | | 2,680 | | | | 2,885,020 | |
| | |
(AGM), 3.00%, 3/1/40 | | | 395 | | | | 423,910 | |
| |
| | | | $ | 38,795,693 | |
| | | | | | | | |
| Security | | Principal
Amount
(000’s omitted) | | | Value | |
|
| Insured – Special Tax Revenue — 0.4% | |
| | |
| Massachusetts, Dedicated Tax Revenue: | | | | | | |
| | |
(NPFG), 5.50%, 1/1/29 | | $ | 11,000 | | | $ | 14,216,290 | |
| | |
(NPFG), 5.50%, 1/1/30 | | | 3,080 | | | | 4,053,249 | |
| |
| | | | $ | 18,269,539 | |
|
| Insured – Transportation — 1.2% | |
| | |
E-470 Public Highway Authority, CO, (NPFG), 0.00%, 9/1/37 | | $ | 13,335 | | | $ | 7,099,421 | |
| | |
Kansas City Industrial Development Authority, MO, (Kansas City International Airport Terminal Modernization), (AGM), (AMT), 5.00%, 3/1/49 | | | 14,800 | | | | 17,906,964 | |
| | |
| Metropolitan Transportation Authority, NY, Green Bonds: | | | | | | |
| | |
(AGM), 4.00%, 11/15/46 | | | 5,970 | | | | 6,847,470 | |
| | |
(AGM), 4.00%, 11/15/48(3) | | | 8,900 | | | | 10,276,296 | |
| | |
(AGM), 5.00%, 11/15/41 | | | 3,500 | | | | 4,359,775 | |
| | |
Philadelphia, PA, Airport Revenue, (AGM), (AMT), 4.00%, 7/1/46 | | | 910 | | | | 1,043,643 | |
| |
| | | | $ | 47,533,569 | |
|
| Insured – Water and Sewer — 0.1% | |
| | |
| Bloomington, IN, Sewage Works Revenue, Green Bonds: | | | | | | |
| | |
(BAM), 4.00%, 1/1/33 | | $ | 480 | | | $ | 580,978 | |
| | |
(BAM), 4.00%, 1/1/34 | | | 500 | | | | 602,540 | |
| | |
(BAM), 4.00%, 1/1/35 | | | 225 | | | | 269,867 | |
| | |
(BAM), 4.00%, 1/1/36 | | | 375 | | | | 448,166 | |
| | |
(BAM), 4.00%, 1/1/37 | | | 625 | | | | 744,588 | |
| | |
(BAM), 4.00%, 1/1/38 | | | 725 | | | | 861,488 | |
| | |
(BAM), 4.00%, 1/1/39 | | | 1,000 | | | | 1,184,110 | |
| | |
West Harris County Regional Water Authority, TX, (BAM), 4.00%, 12/15/39(6) | | | 1,300 | | | | 1,563,211 | |
| |
| | | | $ | 6,254,948 | |
|
| Lease Revenue / Certificates of Participation — 1.9% | |
| | |
| Florida Department of Transportation Financing Corp.: | | | | | | |
| | |
3.00%, 7/1/32 | | $ | 10,000 | | | $ | 11,263,000 | |
| | |
3.00%, 7/1/33 | | | 10,000 | | | | 11,223,900 | |
| | |
Hillsborough County, FL, 4.00%, 8/1/31 | | | 4,760 | | | | 5,762,932 | |
| | |
Hudson Yards Infrastructure Corp., NY, 4.00%, 2/15/44 | | | 1,530 | | | | 1,719,123 | |
| | |
New Jersey Economic Development Authority, (Juvenile Justice Commission Facilities), 5.00%, 6/15/47 | | | 3,605 | | | | 4,310,426 | |
| | |
New Jersey Economic Development Authority,
(School Facilities Construction): | | | | | | |
| | |
4.00%, 6/15/37 | | | 1,800 | | | | 2,109,978 | |
| | |
5.00%, 6/15/34 | | | 8,460 | | | | 10,484,309 | |
| | |
5.00%, 6/15/35 | | | 13,300 | | | | 16,458,085 | |
| | |
5.00%, 6/15/39 | | | 2,165 | | | | 2,695,490 | |
| | | | |
| | 22 | | See Notes to Financial Statements. |
Eaton Vance
National Municipal Income Fund
September 30, 2021
Portfolio of Investments — continued
| | | | | | | | |
| Security | | Principal
Amount
(000’s omitted) | | | Value | |
|
| Lease Revenue / Certificates of Participation (continued) | |
| | |
| Palm Beach County, FL, Public Improvement Revenue: | | | | | | |
| | |
4.00%, 12/1/39 | | $ | 3,570 | | | $ | 4,315,488 | |
| | |
4.00%, 12/1/40 | | | 3,715 | | | | 4,480,476 | |
| |
| | | | $ | 74,823,207 | |
|
| Nursing Home — 0.1% | |
| | |
Mississippi Business Finance Corp., (Magnolia Healthcare), 7.99%, 7/1/25 | | $ | 4,100 | | | $ | 4,139,770 | |
| |
| | | | $ | 4,139,770 | |
|
| Other Revenue — 2.1% | |
| | |
Central Falls Detention Facility Corp., RI, 7.25%, 7/15/35(5) | | $ | 250 | | | $ | 45,000 | |
| | |
Cleveland-Cuyahoga County Port Authority, OH, (Playhouse Square Foundation), 5.25%, 12/1/38 | | | 750 | | | | 882,772 | |
| | |
DuPage County, IL, (The Morton Arboretum), Green Bonds, 3.00%, 5/15/47 | | | 5,085 | | | | 5,193,260 | |
| | |
| Houston, TX, Hotel Occupancy Tax and Special Revenue: | | | | | | |
| | |
3.00%, 9/1/32 | | | 500 | | | | 547,890 | |
| | |
3.00%, 9/1/33 | | | 315 | | | | 344,125 | |
| | |
4.00%, 9/1/29 | | | 435 | | | | 519,142 | |
| | |
4.00%, 9/1/30 | | | 445 | | | | 535,638 | |
| | |
4.00%, 9/1/31 | | | 425 | | | | 515,992 | |
| | |
| Kalispel Tribe of Indians, WA: | | | | | | |
| | |
Series A, 5.25%, 1/1/38(2) | | | 1,865 | | | | 2,213,718 | |
| | |
Series B, 5.25%, 1/1/38(2) | | | 1,000 | | | | 1,186,980 | |
| | |
Metropolitan Pier and Exposition Authority, IL, (McCormick Place), 4.00%, 12/15/42(6) | | | 10,805 | | | | 12,280,531 | |
| | |
Missouri-Illinois Metropolitan District Bi-State Development Agency, 4.00%, 10/1/44 | | | 6,000 | | | | 6,995,580 | |
| | |
New York City Cultural Resources Trust, NY, (Whitney Museum of American Art), Green Bonds, 5.00%, 7/1/31 | | | 3,915 | | | | 5,266,654 | |
| | |
New York City Transitional Finance Authority, NY, (Building Aid), 5.00%, 7/15/43 | | | 22,350 | | | | 26,156,875 | |
| | |
Texas Municipal Gas Acquisition and Supply Corp. I, Gas Supply Revenue, 6.25%, 12/15/26 | | | 16,055 | | | | 18,667,309 | |
| | |
Washington Health Care Facilities Authority, (Fred Hutchinson Cancer Research Center), 1.156%, (67% of 1 mo. USD LIBOR + 1.10%), 7/1/22 (Put Date), 1/1/42(4) | | | 1,000 | | | | 1,001,430 | |
| |
| | | | $ | 82,352,896 | |
|
| Senior Living / Life Care — 1.2% | |
| | |
California Public Finance Authority, (Enso Village),
Green Bonds: | | | | | | |
| | |
2.125%, 11/15/27(2) | | $ | 1,155 | | | $ | 1,165,534 | |
| | |
2.375%, 11/15/28(2) | | | 970 | | | | 980,835 | |
| | | | | | | | |
| Security | | Principal
Amount
(000’s omitted) | | | Value | |
|
| Senior Living / Life Care (continued) | |
| | |
California Public Finance Authority, (Enso Village),
Green Bonds: (continued) | | | | | | |
| | |
5.00%, 11/15/46(2) | | $ | 540 | | | $ | 619,396 | |
| | |
5.00%, 11/15/56(2) | | | 360 | | | | 410,980 | |
| | |
Clackamas County Hospital Facility Authority, OR,
(Rose Villa): | | | | | | |
| | |
5.25%, 11/15/50 | | | 250 | | | | 275,620 | |
| | |
5.375%, 11/15/55 | | | 300 | | | | 331,569 | |
| | |
Florida Development Finance Corp., (Mayflower Retirement
Community): | | | | | | |
| | |
4.00%, 6/1/27(2) | | | 1,270 | | | | 1,436,433 | |
| | |
4.00%, 6/1/28(2) | | | 1,325 | | | | 1,511,573 | |
| | |
| Iowa Finance Authority, (Lifespace Communities, Inc.): | | | | | | |
| | |
4.00%, 5/15/28 | | | 2,355 | | | | 2,721,132 | |
| | |
5.00%, 5/15/48 | | | 8,000 | | | | 9,172,080 | |
| | |
Manhattan, KS, (Meadowlark Hills), 4.00%, 6/1/36 | | | 1,000 | | | | 1,112,250 | |
| | |
Multnomah County Hospital Facilities Authority, OR,
(Terwilliger Plaza): | | | | | | |
| | |
4.00%, 12/1/36 | | | 1,500 | | | | 1,709,085 | |
| | |
4.00%, 12/1/41 | | | 3,860 | | | | 4,337,714 | |
| | |
New Hope Cultural Education Facilities Finance Corp., TX, (Longhorn Village), 5.00%, 1/1/47 | | | 8,000 | | | | 8,590,320 | |
| | |
North Carolina Medical Care Commission, (The Forest at Duke), 4.00%, 9/1/46 | | | 715 | | | | 819,490 | |
| | |
Palm Beach County Health Facilities Authority, FL,
(Lifespace Communities, Inc.): | | | | | | |
| | |
4.00%, 5/15/28 | | | 1,280 | | | | 1,479,002 | |
| | |
4.00%, 5/15/29 | | | 1,440 | | | | 1,680,048 | |
|
| Rockville, MD, (Ingleside at King Farm): | |
| | |
5.00%, 11/1/31 | | | 1,010 | | | | 1,106,617 | |
| | |
5.00%, 11/1/32 | | | 525 | | | | 574,397 | |
| | |
St. Johns County Industrial Development Authority, FL,
(Vicar’s Landing): | | | | | | |
| | |
4.00%, 12/15/36 | | | 1,000 | | | | 1,108,850 | |
| | |
4.00%, 12/15/41 | | | 750 | | | | 823,418 | |
| | |
Tarrant County Cultural Education Facilities Finance Corp.,
TX, (MRC Stevenson Oaks): | | | | | | |
| | |
6.625%, 11/15/41 | | | 730 | | | | 862,458 | |
| | |
6.75%, 11/15/51 | | | 3,250 | | | | 3,824,372 | |
| | |
6.875%, 11/15/55 | | | 200 | | | | 236,214 | |
| | |
Wisconsin Health and Educational Facilities Authority, (Saint
John’s Communities, Inc.): | | | | | | |
| | |
5.00%, 9/15/37 | | | 495 | | | | 511,419 | |
| | |
5.00%, 9/15/40 | | | 750 | | | | 798,540 | |
| |
| | | | $ | 48,199,346 | |
| | | | |
| | 23 | | See Notes to Financial Statements. |
Eaton Vance
National Municipal Income Fund
September 30, 2021
Portfolio of Investments — continued
| | | | | | | | |
| Security | | Principal
Amount
(000’s omitted) | | | Value | |
|
| Special Tax Revenue — 9.0% | |
| | |
Connecticut, Special Tax Revenue, 4.00%, 5/1/39 | | $ | 2,650 | | | $ | 3,116,903 | |
| | |
Denver City and County, CO, Dedicated Tax Revenue, 4.00%, 8/1/51 | | | 2,640 | | | | 3,079,877 | |
| | |
| District of Columbia, Income Tax Revenue: | | | | | | |
| | |
4.00%, 5/1/45 | | | 6,500 | | | | 7,597,395 | |
| | |
5.00%, 3/1/39 | | | 5,060 | | | | 6,469,817 | |
| | |
Harris County Metropolitan Transit Authority, TX, Sales and Use Tax Revenue, 5.00%, 11/1/38 | | | 7,950 | | | | 10,168,845 | |
| | |
| Illinois Sports Facilities Authority: | | | | | | |
| | |
5.00%, 6/15/29 | | | 2,250 | | | | 2,759,963 | |
| | |
5.00%, 6/15/30 | | | 2,400 | | | | 2,929,512 | |
| | |
Illinois, Sales Tax Revenue, 5.00%, 6/15/32 | | | 2,500 | | | | 3,247,575 | |
| | |
| Jacksonville, FL, Special Revenue: | | | | | | |
| | |
4.00%, 10/1/37 | | | 4,600 | | | | 5,531,684 | |
| | |
4.00%, 10/1/38 | | | 4,665 | | | | 5,594,315 | |
| | |
4.00%, 10/1/39 | | | 3,075 | | | | 3,676,900 | |
| | |
4.00%, 10/1/40 | | | 2,450 | | | | 2,922,385 | |
| | |
Maryland Economic Development Corp., (Port Covington), 4.00%, 9/1/40 | | | 1,285 | | | | 1,468,922 | |
| | |
Metropolitan Atlanta Rapid Transit Authority, GA, Sales Tax Revenue, 4.00%, 7/1/32 | | | 4,260 | | | | 5,228,809 | |
| | |
Miami-Dade County, FL, Transit System Sales Surtax Revenue, 4.00%, 7/1/50 | | | 4,655 | | | | 5,360,465 | |
| | |
Michigan Trunk Line Fund, 4.00%, 11/15/41 | | | 10,000 | | | | 11,943,400 | |
| | |
New River Community Development District, FL,
(Capital Improvements): | | | | | | |
| | |
5.00%, 5/1/13(5) | | | 230 | | | | — | |
| | |
5.35%, 5/1/38(5) | | | 80 | | | | — | |
| | |
5.75%, 5/1/38 | | | 355 | | | | 358,315 | |
| | |
New York City Transitional Finance Authority, NY, Future Tax
Revenue: | | | | | | |
| | |
4.00%, 11/1/35 | | | 11,380 | | | | 13,547,435 | |
| | |
4.00%, 8/1/38 | | | 5,000 | | | | 5,803,950 | |
| | |
4.00%, 5/1/42 | | | 5,695 | | | | 6,248,497 | |
| | |
5.00%, 11/1/31 | | | 4,000 | | | | 5,430,440 | |
| | |
5.00%, 8/1/35 | | | 10,485 | | | | 12,794,741 | |
| | |
5.00%, 5/1/36 | | | 4,050 | | | | 5,020,623 | |
| | |
5.00%, 5/1/39 | | | 9,240 | | | | 11,157,947 | |
| | |
2015 Series B, 5.00%, 8/1/39 | | | 4,585 | | | | 5,115,576 | |
| | |
2018 Series A, 5.00%, 8/1/39 | | | 11,845 | | | | 14,410,272 | |
| | |
New York Dormitory Authority, Personal Income Tax
Revenue: | | | | | | |
| | |
4.00%, 3/15/36 | | | 18,500 | | | | 22,054,220 | |
| | |
5.00%, 2/15/45 | | | 9,995 | | | | 11,379,307 | |
| | |
5.00%, 2/15/48 | | | 7,890 | | | | 9,731,447 | |
| | | | | | | | |
| Security | | Principal
Amount
(000’s omitted) | | | Value | |
|
| Special Tax Revenue (continued) | |
| | |
| New York Dormitory Authority, Sales Tax Revenue: | | | | | | |
| | |
5.00%, 3/15/36 | | $ | 7,840 | | | $ | 9,373,190 | |
| | |
5.00%, 3/15/40 | | | 10,000 | | | | 12,053,600 | |
| | |
(AMT), 5.00%, 3/15/27 | | | 1,620 | | | | 1,972,771 | |
| | |
(AMT), 5.00%, 3/15/28 | | | 1,705 | | | | 2,133,705 | |
| | |
(AMT), 5.00%, 3/15/29 | | | 1,790 | | | | 2,271,403 | |
| | |
(AMT), 5.00%, 3/15/31 | | | 970 | | | | 1,220,085 | |
| | |
(AMT), 5.00%, 3/15/32 | | | 2,070 | | | | 2,598,533 | |
| | |
New York State Urban Development Corp., Personal Income
Tax Revenue: | | | | | | |
| | |
4.00%, 3/15/35 | | | 10,000 | | | | 11,778,600 | |
| | |
4.00%, 3/15/38 | | | 6,090 | | | | 7,136,932 | |
| | |
5.00%, 3/15/35 | | | 12,000 | | | | 13,972,440 | |
| | |
5.00%, 3/15/41 | | | 10,000 | | | | 12,315,100 | |
| | |
Pennsylvania Turnpike Commission, Oil Franchise Tax Revenue, 5.00%, 12/1/46 | | | 20,000 | | | | 25,559,000 | |
|
| Puerto Rico Sales Tax Financing Corp.: | |
| | |
4.329%, 7/1/40 | | | 5,536 | | | | 6,152,766 | |
| | |
4.784%, 7/1/58 | | | 2,219 | | | | 2,493,180 | |
| | |
Regional Transportation District, CO, Sales Tax Revenue, Green Bonds, 4.00%, 11/1/39 | | | 15,000 | | | | 17,940,300 | |
| | |
San Francisco Bay Area Rapid Transit District, CA, Sales Tax
Revenue: | | | | | | |
| | |
4.00%, 7/1/37 | | | 3,075 | | | | 3,540,493 | |
| | |
4.00%, 7/1/38 | | | 7,495 | | | | 8,614,828 | |
| | |
Southern Hills Plantation I Community Development
District, FL: | | | | | | |
| | |
Series A1, 5.80%, 5/1/35 | | | 440 | | | | 439,582 | |
| | |
Series A2, 5.80%, 5/1/35 | | | 310 | | | | 249,606 | |
| | |
Sterling Hill Community Development District, FL, 6.20%, 5/1/35 | | | 1,532 | | | | 918,988 | |
| | |
Texas Transportation Commission, Prerefunded to 4/1/24, 5.00%, 4/1/33(3) | | | 10,000 | | | | 11,173,800 | |
| | |
Washington Convention and Sports Authority, D.C.,
Dedicated Tax Revenue: | | | | | | |
| | |
4.00%, 10/1/37 | | | 1,000 | | | | 1,184,750 | |
| | |
4.00%, 10/1/39 | | | 1,000 | | | | 1,177,730 | |
| |
| | | | $ | 360,420,919 | |
|
| Student Loan — 0.1% | |
| | |
New Jersey Higher Education Student Assistance Authority, (AMT), 4.00%, 12/1/28 | | $ | 3,200 | | | $ | 3,372,160 | |
| | |
Pennsylvania Higher Education Assistance Agency, (AMT), 5.00%, 6/1/30 | | | 400 | | | | 502,656 | |
| |
| | | | $ | 3,874,816 | |
| | | | |
| | 24 | | See Notes to Financial Statements. |
Eaton Vance
National Municipal Income Fund
September 30, 2021
Portfolio of Investments — continued
| | | | | | | | |
| Security | | Principal
Amount
(000’s omitted) | | | Value | |
|
| Transportation — 22.3% | |
|
| Atlanta, GA, Airport Revenue: | |
| | |
(AMT), 4.00%, 7/1/34 | | $ | 3,480 | | | $ | 4,040,141 | |
| | |
(AMT), 4.00%, 7/1/36 | | | 5,000 | | | | 5,772,550 | |
| | |
(AMT), 4.00%, 7/1/38(6) | | | 1,000 | | | | 1,181,810 | |
| | |
(AMT), 4.00%, 7/1/39(6) | | | 1,000 | | | | 1,178,470 | |
| | |
(AMT), 4.00%, 7/1/40(6) | | | 1,000 | | | | 1,175,640 | |
| | |
(AMT), 4.00%, 7/1/41(6) | | | 1,000 | | | | 1,172,180 | |
| | |
(AMT), 4.00%, 7/1/42(6) | | | 1,000 | | | | 1,168,570 | |
| | |
Austin, TX, Airport System Revenue, (AMT), 5.00%, 11/15/35 | | | 2,625 | | | | 3,309,442 | |
| | |
Central Texas Regional Mobility Authority, 5.00%, 1/1/36 | | | 500 | | | | 642,105 | |
| | |
Charleston County Airport District, SC, (AMT), 5.50%, 7/1/38 | | | 10,000 | | | | 10,823,500 | |
| | |
| Chicago, IL, (Midway International Airport): | | | | | | |
| | |
5.00%, 1/1/33 | | | 3,830 | | | | 4,207,791 | |
| | |
(AMT), 5.00%, 1/1/34 | | | 5,250 | | | | 5,743,132 | |
| | |
| Chicago, IL, (O’Hare International Airport): | | | | | | |
| | |
4.00%, 1/1/36 | | | 7,000 | | | | 8,210,510 | |
| | |
5.00%, 1/1/32 | | | 15,160 | | | | 19,428,450 | |
| | |
5.00%, 1/1/36 | | | 6,000 | | | | 7,013,640 | |
| | |
(AMT), 5.00%, 1/1/23 | | | 1,125 | | | | 1,190,486 | |
| | |
(AMT), 5.00%, 1/1/25 | | | 16,100 | | | | 16,993,711 | |
| | |
(AMT), 5.00%, 1/1/33 | | | 7,300 | | | | 8,287,179 | |
| | |
(AMT), 5.00%, 1/1/39 | | | 4,000 | | | | 4,890,920 | |
| | |
Dallas and Fort Worth, TX, (Dallas/Fort Worth International
Airport): | | | | | | |
| | |
4.00%, 11/1/35 | | | 1,105 | | | | 1,318,530 | |
| | |
5.25%, 11/1/31 | | | 10,395 | | | | 11,435,539 | |
| | |
(AMT), 5.25%, 11/1/30 | | | 11,015 | | | | 12,069,356 | |
| | |
Denver City and County, CO, Airport System Revenue, (AMT), 5.00%, 12/1/37 | | | 10,000 | | | | 12,254,000 | |
| | |
Florida Department of Transportation, Turnpike System Revenue, 3.00%, 7/1/33 | | | 6,420 | | | | 7,205,744 | |
| | |
Florida Development Finance Corp., (Brightline Florida Passenger Rail), Green Bonds, (AMT), 7.375%, 1/1/49(2) | | | 15,685 | | | | 17,078,926 | |
| | |
| Harris County, TX, Toll Road Revenue: | | | | | | |
| | |
4.00%, 8/15/36 | | | 1,750 | | | | 2,107,245 | |
| | |
4.00%, 8/15/45 | | | 2,500 | | | | 2,921,775 | |
| | |
| Hawaii, Airports System Revenue: | | | | | | |
| | |
(AMT), 5.00%, 7/1/30 | | | 1,420 | | | | 1,828,946 | |
| | |
(AMT), 5.00%, 7/1/41 | | | 2,935 | | | | 3,362,365 | |
| | |
(AMT), 5.00%, 7/1/48 | | | 10,000 | | | | 12,093,000 | |
| | |
| Houston, TX, Airport System Revenue: | | | | | | |
| | |
(AMT), 4.00%, 7/1/35 | | | 1,500 | | | | 1,759,860 | |
| | |
(AMT), 4.00%, 7/1/36 | | | 2,000 | | | | 2,338,780 | |
| | | | | | | | |
| Security | | Principal
Amount
(000’s omitted) | | | Value | |
|
| Transportation (continued) | |
| | |
Kansas City Industrial Development Authority, MO, (Kansas City International Airport Terminal Modernization), (AMT), 5.00%, 3/1/46 | | $ | 17,130 | | | $ | 20,681,220 | |
| | |
Kansas Department of Transportation, 5.00%, 9/1/30 | | | 20,000 | | | | 22,592,800 | |
| | |
Los Angeles Department of Airports, CA, (Los Angeles
International Airport): | | | | | | |
| | |
(AMT), 5.00%, 5/15/24 | | | 1,200 | | | | 1,343,472 | |
| | |
(AMT), 5.00%, 5/15/26 | | | 1,335 | | | | 1,592,628 | |
| | |
(AMT), 5.00%, 5/15/33 | | | 5,000 | | | | 6,192,000 | |
| | |
(AMT), 5.00%, 5/15/40 | | | 6,000 | | | | 6,867,180 | |
| | |
(AMT), 5.00%, 5/15/41 | | | 9,000 | | | | 10,534,500 | |
| | |
Louisiana Offshore Terminal Authority, (LOOP, LLC), 2.00% to 10/1/22 (Put Date), 10/1/40 | | | 2,000 | | | | 2,011,220 | |
| | |
Love Field Airport Modernization Corp., TX, (AMT), 5.00%, 11/1/24 | | | 1,500 | | | | 1,705,080 | |
| | |
Maryland Economic Development Corp., (Transportation Facilities), 5.00%, 6/1/35 | | | 1,050 | | | | 1,264,106 | |
| | |
| Massachusetts Port Authority: | | | | | | |
| | |
5.00%, 7/1/32 | | | 3,800 | | | | 4,868,978 | |
| | |
(AMT), 5.00%, 7/1/26 | | | 10,105 | | | | 12,078,102 | |
| | |
(AMT), 5.00%, 7/1/30 | | | 3,000 | | | | 3,785,670 | |
| | |
(AMT), 5.00%, 7/1/31 | | | 2,965 | | | | 3,723,566 | |
| | |
(AMT), 5.00%, 7/1/32 | | | 4,200 | | | | 5,258,022 | |
| | |
(AMT), 5.00%, 7/1/33 | | | 3,855 | | | | 4,811,850 | |
| | |
| Memphis-Shelby County Airport Authority, TN: | | | | | | |
| | |
(AMT), 5.00%, 7/1/35 | | | 3,440 | | | | 4,185,861 | |
| | |
(AMT), 5.00%, 7/1/36 | | | 3,200 | | | | 3,883,840 | |
| | |
| Metropolitan Washington Airports Authority, D.C.: | | | | | | |
| | |
(AMT), 4.00%, 10/1/37 | | | 580 | | | | 689,875 | |
| | |
(AMT), 4.00%, 10/1/38 | | | 715 | | | | 847,389 | |
| | |
(AMT), 4.00%, 10/1/41 | | | 580 | | | | 679,951 | |
| | |
(AMT), 4.00%, 10/1/51 | | | 3,160 | | | | 3,654,572 | |
| | |
(AMT), 5.00%, 10/1/28 | | | 4,500 | | | | 5,074,695 | |
| | |
(AMT), 5.00%, 10/1/32 | | | 10,000 | | | | 11,928,600 | |
| | |
(AMT), 5.00%, 10/1/42 | | | 2,000 | | | | 2,412,640 | |
| | |
| Miami-Dade County, FL, Aviation Revenue: | | | | | | |
| | |
(AMT), 4.00%, 10/1/44 | | | 5,000 | | | | 5,634,150 | |
| | |
(AMT), 5.00%, 10/1/33 | | | 23,250 | | | | 26,145,555 | |
| | |
(AMT), 5.00%, 10/1/36 | | | 9,125 | | | | 10,255,679 | |
| | |
(AMT), 5.00%, 10/1/38 | | | 1,730 | | | | 2,103,403 | |
| | |
(AMT), 5.00%, 10/1/40 | | | 25,230 | | | | 30,200,310 | |
| | |
(AMT), 5.00%, 10/1/41 | | | 2,320 | | | | 2,803,836 | |
| | |
Miami-Dade County, FL, Seaport Revenue, (AMT), 4.00%, 10/1/46 | | | 10,000 | | | | 11,521,700 | |
| | |
Middlesex County Improvement Authority, NJ, (New Brunswick Parking Deck), 4.00%, 9/1/46 | | | 4,000 | | | | 4,776,200 | |
| | | | |
| | 25 | | See Notes to Financial Statements. |
Eaton Vance
National Municipal Income Fund
September 30, 2021
Portfolio of Investments — continued
| | | | | | | | |
| Security | | Principal
Amount
(000’s omitted) | | | Value | |
|
| Transportation (continued) | |
| | |
Minneapolis-St. Paul Metropolitan Airports Commission, MN, (AMT), 5.00%, 1/1/32 | | $ | 3,710 | | | $ | 4,678,978 | |
| | |
New Jersey Economic Development Authority, (Transit Transportation Project), 4.00%, 11/1/44 | | | 8,250 | | | | 9,412,425 | |
| | |
New Jersey Transportation Trust Fund Authority,
(Transportation Program): | | | | | | |
| | |
4.00%, 6/15/36 | | | 6,635 | | | | 7,599,132 | |
| | |
4.00%, 6/15/39 | | | 8,000 | | | | 9,323,920 | |
| | |
4.00%, 6/15/40 | | | 3,335 | | | | 3,880,973 | |
| | |
4.00%, 6/15/45 | | | 18,500 | | | | 21,251,875 | |
| | |
5.00%, 6/15/45 | | | 13,205 | | | | 16,454,354 | |
| | |
New Jersey Transportation Trust Fund Authority,
(Transportation System): | | | | | | |
| | |
4.00%, 6/15/39(6) | | | 3,000 | | | | 3,441,000 | |
| | |
4.00%, 6/15/40(6) | | | 3,000 | | | | 3,432,300 | |
| | |
4.00%, 6/15/42(6) | | | 2,750 | | | | 3,127,712 | |
| | |
| New Jersey Turnpike Authority: | | | | | | |
| | |
Series 2015E, 5.00%, 1/1/31 | | | 2,680 | | | | 3,057,264 | |
| | |
Series 2017B, 5.00%, 1/1/31 | | | 3,560 | | | | 4,427,323 | |
| | |
| New York Thruway Authority: | | | | | | |
| | |
4.00%, 1/1/41 | | | 9,775 | | | | 11,349,459 | |
| | |
4.00%, 1/1/42 | | | 10,000 | | | | 11,579,700 | |
| | |
4.00%, 1/1/43 | | | 10,000 | | | | 11,556,600 | |
| | |
5.00%, 1/1/36 | | | 12,200 | | | | 15,456,912 | |
| | |
5.00%, 1/1/39 | | | 1,845 | | | | 2,321,711 | |
| | |
5.00%, 1/1/40 | | | 17,155 | | | | 21,543,592 | |
| | |
New York Transportation Development Corp., (LaGuardia
Airport Terminal B Redevelopment): | | | | | | |
| | |
(AMT), 5.00%, 7/1/41 | | | 1,705 | | | | 1,893,334 | |
| | |
(AMT), 5.00%, 7/1/46 | | | 14,325 | | | | 15,896,309 | |
| | |
(AMT), 5.25%, 1/1/50 | | | 1,180 | | | | 1,315,830 | |
| | |
New York Transportation Development Corp., (Terminal 4
John F. Kennedy International Airport): | | | | | | |
| | |
5.00%, 12/1/25 | | | 800 | | | | 932,712 | |
| | |
5.00%, 12/1/26 | | | 1,000 | | | | 1,194,260 | |
| | |
5.00%, 12/1/34 | | | 2,965 | | | | 3,748,116 | |
| | |
5.00%, 12/1/35 | | | 3,725 | | | | 4,685,342 | |
| | |
(AMT), 5.00%, 12/1/25 | | | 1,100 | | | | 1,277,584 | |
| | |
(AMT), 5.00%, 12/1/30 | | | 1,710 | | | | 2,177,890 | |
| | |
(AMT), 5.00%, 12/1/34 | | | 2,150 | | | | 2,711,666 | |
|
| North Texas Tollway Authority: | |
| | |
4.00%, 1/1/40 | | | 2,000 | | | | 2,353,480 | |
| | |
5.00%, 1/1/29 | | | 5,000 | | | | 5,843,900 | |
| | |
Pennsylvania Turnpike Commission, 4.00%, 12/1/46 | | | 4,000 | | | | 4,633,360 | |
| | |
Philadelphia, PA, Airport Revenue, (AMT), 5.00%, 7/1/51 | | | 1,600 | | | | 1,987,232 | |
| | | | | | | | |
| Security | | Principal
Amount
(000’s omitted) | | | Value | |
|
| Transportation (continued) | |
| | |
| Port Authority of New York and New Jersey: | | | | | | |
| | |
4.00%, 11/1/41 | | $ | 6,600 | | | $ | 7,696,986 | |
| | |
5.00%, 9/1/37 | | | 6,000 | | | | 7,596,960 | |
| | |
(AMT), 3.00%, 10/1/27 | | | 27,470 | | | | 30,502,139 | |
| | |
(AMT), 3.00%, 10/1/28 | | | 8,845 | | | | 9,894,548 | |
| | |
(AMT), 4.00%, 9/1/34 | | | 8,310 | | | | 9,054,410 | |
| | |
(AMT), 5.00%, 9/15/31 | | | 15,000 | | | | 18,430,500 | |
| | |
(AMT), 5.00%, 10/1/35 | | | 5,000 | | | | 5,941,800 | |
| | |
(AMT), 5.00%, 4/1/36 | | | 10,230 | | | | 12,129,609 | |
| | |
(AMT), 5.00%, 10/15/41 | | | 2,500 | | | | 3,170,550 | |
| | |
Port Freeport, TX, (AMT), 4.00%, 6/1/46 | | | 1,000 | | | | 1,130,940 | |
| | |
Port of Seattle, WA, (AMT), 5.00%, 8/1/46 | | | 10,000 | | | | 12,534,200 | |
| | |
Raleigh-Durham Airport Authority, NC, (AMT), Series 2020A, 5.00%, 5/1/36 | | | 1,000 | | | | 1,256,960 | |
| | |
| Salt Lake City, UT, (Salt Lake City International Airport): | | | | | | |
| | |
(AMT), 5.00%, 7/1/38 | | | 7,165 | | | | 8,689,640 | |
| | |
(AMT), 5.00%, 7/1/46 | | | 25,000 | | | | 31,187,500 | |
| | |
San Francisco City and County Airport Commission, CA,
(San Francisco International Airport): | | | | | | |
| | |
(AMT), 5.00%, 5/1/41 | | | 25,630 | | | | 30,026,570 | |
| | |
(AMT), 5.00%, 5/1/44 | | | 8,535 | | | | 9,448,160 | |
| | |
(AMT), 5.00%, 5/1/46 | | | 5,000 | | | | 5,826,900 | |
| | |
Texas Private Activity Bond Surface Transportation Corp.,
(North Tarrant Express Managed Lanes Project): | | | | | | |
| | |
4.00%, 12/31/37 | | | 2,230 | | | | 2,584,079 | |
| | |
4.00%, 12/31/38 | | | 4,140 | | | | 4,786,130 | |
| | |
4.00%, 12/31/39 | | | 2,140 | | | | 2,467,934 | |
| | |
5.00%, 12/31/35 | | | 2,885 | | | | 3,616,694 | |
| | |
Texas Private Activity Bond Surface Transportation Corp., (North Tarrant Express Segment 3C), (AMT), 5.00%, 6/30/58 | | | 12,635 | | | | 15,129,402 | |
| | |
Wayne County Airport Authority, MI, (Detroit Metropolitan
Wayne County Airport): | | | | | | |
| | |
5.00%, 12/1/36 | | | 1,500 | | | | 1,976,640 | |
| | |
5.00%, 12/1/38 | | | 2,000 | | | | 2,619,560 | |
| | |
5.00%, 12/1/40 | | | 2,000 | | | | 2,603,580 | |
| | |
5.00%, 12/1/46 | | | 5,000 | | | | 6,400,300 | |
| |
| | | | $ | 891,561,879 | |
|
| Water and Sewer — 3.6% | |
|
| Baltimore, MD, (Water Projects): | |
| | |
4.00%, 7/1/40 | | $ | 470 | | | $ | 556,832 | |
| | |
4.00%, 7/1/45 | | | 1,005 | | | | 1,175,046 | |
| | |
| Central Valley Water Reclamation Facility, CA, Green Bonds: | | | | | | |
| | |
4.00%, 3/1/38 | | | 1,385 | | | | 1,672,720 | |
| | |
4.00%, 3/1/39 | | | 1,200 | | | | 1,445,292 | |
| | |
4.00%, 3/1/40 | | | 1,250 | | | | 1,502,000 | |
| | | | |
| | 26 | | See Notes to Financial Statements. |
Eaton Vance
National Municipal Income Fund
September 30, 2021
Portfolio of Investments — continued
| | | | | | | | |
| Security | | Principal
Amount
(000’s omitted) | | | Value | |
|
| Water and Sewer (continued) | |
| | |
Charlotte, NC, Water and Sewer System Revenue, 4.00%, 7/1/36 | | $ | 2,000 | | | $ | 2,430,360 | |
| | |
East Bay Municipal Utility District, CA, Water System
Revenue: | | | | | | |
| | |
5.00%, 6/1/35 | | | 2,905 | | | | 3,567,282 | |
| | |
5.00%, 6/1/37 | | | 7,280 | | | | 8,428,493 | |
| | |
Green Bonds, 5.00%, 6/1/37 | | | 4,200 | | | | 5,379,066 | |
| | |
Fairfax County, VA, Sewer Revenue, 4.00%, 7/15/39 | | | 1,840 | | | | 2,224,284 | |
| | |
Fulton County, GA, Water and Sewerage Revenue, 4.00%, 1/1/34 | | | 1,750 | | | | 2,108,505 | |
| | |
Grand Rapids, MI, Sanitary Sewer System Revenue, 5.00%, 1/1/45 | | | 1,245 | | | | 1,554,183 | |
| | |
| Horsham Water and Sewer Authority, PA: | | | | | | |
| | |
4.00%, 11/15/31 | | | 300 | | | | 365,394 | |
| | |
4.00%, 11/15/36 | | | 360 | | | | 429,012 | |
| | |
| Jordan Valley Water Conservancy District, UT: | | | | | | |
| | |
4.00%, 10/1/39 | | | 750 | | | | 914,385 | |
| | |
4.00%, 10/1/40 | | | 615 | | | | 747,945 | |
| | |
4.00%, 10/1/41 | | | 440 | | | | 533,500 | |
| | |
King County, WA, Sewer Revenue, 4.00%, 1/1/44 | | | 1,400 | | | | 1,631,798 | |
| | |
Lakehaven Water and Sewer District, WA, 4.00%, 10/1/46 | | | 2,725 | | | | 3,238,717 | |
| | |
Madison Water and Wastewater Board, AL, 4.00%, 12/1/38 | | | 435 | | | | 513,400 | |
| | |
| Metropolitan Water District of Southern California: | | | | | | |
| | |
0.19%, (SIFMA + 0.14%), 5/21/24 (Put Date), 7/1/37(4) | | | 3,335 | | | | 3,336,134 | |
| | |
5.00%, 7/1/38 | | | 4,270 | | | | 5,388,270 | |
| | |
| Miami-Dade County, FL, Water and Sewer System Revenue: | | | | | | |
| | |
5.00%, 10/1/27 | | | 3,700 | | | | 4,594,697 | |
| | |
5.00%, 10/1/28 | | | 3,085 | | | | 3,920,140 | |
| | |
Michigan Finance Authority, (Detroit Water and Sewerage
Department): | | | | | | |
| | |
5.00%, 7/1/33 | | | 8,095 | | | | 9,071,824 | |
| | |
5.00%, 7/1/44 | | | 5 | | | | 5,160 | |
| | |
| Missoula, MT, Water System Revenue: | | | | | | |
| | |
5.00%, 7/1/35 | | | 1,135 | | | | 1,401,509 | |
| | |
5.00%, 7/1/36 | | | 200 | | | | 246,328 | |
| | |
New York City Municipal Water Finance Authority, NY, (Water
and Sewer System): | | | | | | |
| | |
5.00%, 6/15/35 | | | 3,955 | | | | 4,642,854 | |
| | |
5.00%, 6/15/48 | | | 12,960 | | | | 15,544,872 | |
| | |
Omaha, NE, Sanitary Sewerage System Revenue, 4.00%, 4/1/34 | | | 650 | | | | 786,909 | |
| | |
Orange County, FL, Water and Wastewater Utility Revenue, 5.00%, 10/1/38 | | | 10,060 | | | | 13,108,482 | |
| | |
Phoenix Civic Improvement Corp., AZ, Water System Revenue, 4.00%, 7/1/42 | | | 2,000 | | | | 2,397,780 | |
| | | | | | | | |
| Security | | Principal
Amount
(000’s omitted) | | | Value | |
|
| Water and Sewer (continued) | |
| | |
| Port St. Lucie, FL, Stormwater Utility Revenue: | | | | | | |
| | |
4.00%, 5/1/37 | | $ | 500 | | | $ | 590,620 | |
| | |
4.00%, 5/1/38 | | | 250 | | | | 294,422 | |
| | |
Salt Lake City, UT, Public Utilities Revenue, 4.00%, 2/1/45 | | | 805 | | | | 928,954 | |
| | |
San Diego Public Facilities Financing Authority, CA, Water
Revenue: | | | | | | |
| | |
4.00%, 8/1/38 | | | 1,000 | | | | 1,197,560 | |
| | |
4.00%, 8/1/39 | | | 1,250 | | | | 1,493,050 | |
| | |
4.00%, 8/1/45 | | | 3,400 | | | | 3,995,442 | |
| | |
| Sarasota County, FL, Utility System Revenue: | | | | | | |
| | |
5.00%, 10/1/28 | | | 300 | | | | 383,775 | |
| | |
5.00%, 10/1/29 | | | 250 | | | | 327,155 | |
| | |
5.00%, 10/1/30 | | | 300 | | | | 399,525 | |
| | |
5.00%, 10/1/45 | | | 4,625 | | | | 5,826,436 | |
| | |
5.00%, 10/1/50 | | | 7,645 | | | | 9,549,905 | |
| | |
Tarrant Regional Water District, TX, Prerefunded to 3/1/24, 5.00%, 3/1/30 | | | 10,000 | | | | 11,134,600 | |
| | |
Trinity River Authority, TX, (Mountain Creek Regional Wastewater System), 4.00%, 8/1/36 | | | 695 | | | | 840,755 | |
| | |
Virginia Beach, VA, Storm Water Utility Revenue, 4.00%, 11/15/31 | | | 1,085 | | | | 1,299,787 | |
| |
| | | | $ | 143,125,159 | |
| |
Total Tax-Exempt Municipal Obligations — 94.7%
(identified cost $3,604,132,308) | | | $ | 3,789,159,836 | |
|
| Taxable Municipal Obligations — 5.8% | |
| Security | | Principal
Amount
(000’s omitted) | | | Value | |
|
| Cogeneration — 0.0%(7) | |
| | |
Northampton County Industrial Development Authority, PA, (Northampton Generating), 5.00%, 12/31/23(1) | | $ | 5,432 | | | $ | 1,357,964 | |
| |
| | | | $ | 1,357,964 | |
|
| Education — 0.1% | |
| | |
San Antonio Education Facilities Corp., TX, (University of the
Incarnate Word): | | | | | | |
| | |
2.65%, 4/1/30 | | $ | 1,100 | | | $ | 1,098,119 | |
| | |
2.73%, 4/1/31 | | | 840 | | | | 837,446 | |
| | |
3.15%, 4/1/37 | | | 1,750 | | | | 1,753,553 | |
| |
| | | | $ | 3,689,118 | |
| | | | |
| | 27 | | See Notes to Financial Statements. |
Eaton Vance
National Municipal Income Fund
September 30, 2021
Portfolio of Investments — continued
| | | | | | | | |
| Security | | Principal
Amount
(000’s omitted) | | | Value | |
|
| General Obligations — 1.5% | |
| | |
| Campbell Union High School District, CA: | | | | | | |
| | |
2.032%, 8/1/33 | | $ | 4,600 | | | $ | 4,543,926 | |
| | |
2.162%, 8/1/34 | | | 9,630 | | | | 9,530,137 | |
| | |
Cecil County, MD, 2.55%, 11/1/43 | | | 1,870 | | | | 1,843,016 | |
| | |
Chicago, IL, 7.75%, 1/1/42 | | | 4,050 | | | | 4,595,373 | |
| | |
Detroit, MI, 2.96%, 4/1/27 | | | 1,000 | | | | 998,040 | |
| | |
Douglas County School District No. 17, NE, 2.192%, 6/15/35 | | | 775 | | | | 767,451 | |
| | |
| Homewood, AL: | | | | | | |
| | |
2.00%, 9/1/30 | | | 630 | | | | 646,248 | |
| | |
2.00%, 9/1/31 | | | 415 | | | | 422,976 | |
| | |
| Lakeside School District No. 9, AR: | | | | | | |
| | |
1.55%, 4/1/35 | | | 925 | | | | 871,433 | |
| | |
1.65%, 4/1/36 | | | 1,365 | | | | 1,282,049 | |
| | |
1.80%, 4/1/37 | | | 1,415 | | | | 1,334,769 | |
| | |
1.85%, 4/1/38 | | | 610 | | | | 572,699 | |
| | |
1.90%, 4/1/39 | | | 1,605 | | | | 1,498,332 | |
| | |
Larkspur-Corte Madera School District, CA, (Election of 2011 and 2014), 2.302%, 8/1/36 | | | 1,405 | | | | 1,409,089 | |
| | |
Marin Community College District, CA, 2.01%, 8/1/33 | | | 1,865 | | | | 1,841,855 | |
| | |
Mattawan Consolidated School, MI, 2.096%, 5/1/33 | | | 1,120 | | | | 1,117,794 | |
| | |
Mesquite Independent School District, TX, (PSF Guaranteed), 2.30%, 8/15/37 | | | 1,080 | | | | 1,053,907 | |
| | |
| Naugatuck, CT: | | | | | | |
| | |
2.79%, 9/15/38 | | | 800 | | | | 800,592 | |
| | |
2.94%, 9/15/41 | | | 1,700 | | | | 1,701,037 | |
| | |
New York, 1.50%, 3/15/26 | | | 19,870 | | | | 20,191,695 | |
| | |
| Norwalk, CT: | | | | | | |
| | |
1.325%, 8/1/28 | | | 1,000 | | | | 988,350 | |
| | |
1.514%, 8/1/29 | | | 1,645 | | | | 1,627,925 | |
| | |
Tustin Unified School District, CA, 2.254%, 8/1/36 | | | 1,155 | | | | 1,169,819 | |
| |
| | | | $ | 60,808,512 | |
|
| Hospital — 1.0% | |
| | |
California Statewide Communities Development Authority, (Loma Linda University Medical Center), 6.00%, 12/1/24 | | $ | 34,250 | | | $ | 38,934,372 | |
| |
| | | | $ | 38,934,372 | |
|
| Insured – General Obligations — 0.2% | |
| | |
| Bureau County Township High School District No. 502, IL: | | | | | | |
| | |
(BAM), 1.899%, 12/1/30 | | $ | 1,000 | | | $ | 985,790 | |
| | |
(BAM), 2.429%, 12/1/34 | | | 745 | | | | 745,268 | |
| | |
(BAM), 2.529%, 12/1/35 | | | 1,165 | | | | 1,165,722 | |
| | |
| Elmwood Park, IL: | | | | | | |
| | |
(AGM), 1.319%, 12/1/27 | | | 1,685 | | | | 1,673,862 | |
| | |
(AGM), 1.574%, 12/1/28 | | | 1,710 | | | | 1,691,669 | |
| | |
(AGM), 1.694%, 12/1/29 | | | 1,000 | | | | 989,660 | |
| | | | | | | | |
| Security | | Principal
Amount
(000’s omitted) | | | Value | |
|
| Insured – General Obligations (continued) | |
| | |
| Westland Tax Increment Finance Authority, MI: | | | | | | |
| | |
(AGM), 2.31%, 4/1/33 | | $ | 1,165 | | | $ | 1,199,065 | |
| | |
(AGM), 2.41%, 4/1/34 | | | 195 | | | | 201,086 | |
| |
| | | | $ | 8,652,122 | |
|
| Insured – Special Tax Revenue — 0.1% | |
| | |
Bexar County, TX, Venue Project Revenue, (AGM), 2.534%, 8/15/34 | | $ | 2,805 | | | $ | 2,785,505 | |
| | |
Rio Elementary School District Community Facilities District No. 1, CA, (BAM), 2.557%, 9/1/33 | | | 1,055 | | | | 1,074,760 | |
| |
| | | | $ | 3,860,265 | |
|
| Insured – Transportation — 1.7% | |
| | |
| Alameda Corridor Transportation Authority, CA: | | | | | | |
| | |
(AMBAC), 0.00%, 10/1/26 | | $ | 22,500 | | | $ | 20,573,775 | |
| | |
(AMBAC), 0.00%, 10/1/27 | | | 34,390 | | | | 30,335,419 | |
| | |
| Miami-Dade County, FL, Seaport Revenue: | | | | | | |
| | |
(AGM), 1.522%, 10/1/27 | | | 12,425 | | | | 12,317,275 | |
| | |
(AGM), 1.692%, 10/1/28 | | | 3,000 | | | | 2,962,200 | |
| |
| | | | $ | 66,188,669 | |
|
| Lease Revenue / Certificates of Participation — 0.1% | |
| | |
Golden State Tobacco Securitization Corp., CA, 1.60%, 6/1/26(6) | | $ | 5,000 | | | $ | 5,031,043 | |
| |
| | | | $ | 5,031,043 | |
|
| Other Revenue — 0.1% | |
| | |
Santa Cruz County, CA, Pension Obligation Bonds, 2.291%, 6/1/33 | | $ | 3,000 | | | $ | 2,963,880 | |
| |
| | | | $ | 2,963,880 | |
|
| Senior Living / Life Care — 0.0%(7) | |
| | |
Montgomery County Industrial Development Authority, PA, (ACTS Retirement-Life Communities, Inc. Obligated Group), 2.45%, 11/15/23 | | $ | 1,250 | | | $ | 1,265,838 | |
| |
| | | | $ | 1,265,838 | |
|
| Special Tax Revenue — 0.6% | |
| | |
Illinois, Sales Tax Revenue, 1.999%, 6/15/28 | | $ | 3,000 | | | $ | 2,972,010 | |
| | |
Massachusetts School Building Authority, 1.85%, 2/15/30 | | | 9,170 | | | | 9,054,000 | |
| | |
New York Dormitory Authority, Personal Income Tax Revenue, 1.187%, 3/15/26 | | | 10,515 | | | | 10,501,961 | |
| |
| | | | $ | 22,527,971 | |
| | | | |
| | 28 | | See Notes to Financial Statements. |
Eaton Vance
National Municipal Income Fund
September 30, 2021
Portfolio of Investments — continued
| | | | | | | | |
| Security | | Principal
Amount
(000’s omitted) | | | Value | |
|
| Student Loan — 0.1% | |
| | |
Massachusetts Educational Financing Authority, 2.305%, 7/1/29 | | $ | 2,200 | | | $ | 2,193,158 | |
| |
| | | | $ | 2,193,158 | |
|
| Water and Sewer — 0.3% | |
| | |
| Henrico County, VA, Water and Sewer System Revenue: | | | | | | |
| | |
1.30%, 5/1/28 | | $ | 8,175 | | | $ | 8,127,667 | |
| | |
2.40%, 5/1/39 | | | 3,395 | | | | 3,346,927 | |
| | |
2.45%, 5/1/40 | | | 1,975 | | | | 1,962,360 | |
| |
| | | | $ | 13,436,954 | |
| |
Total Taxable Municipal Obligations — 5.8%
(identified cost $220,166,318) | | | $ | 230,909,866 | |
| |
Total Investments — 101.1%
(identified cost $3,849,367,294) | | | $ | 4,045,094,333 | |
| |
Other Assets, Less Liabilities — (1.1)% | | | $ | (44,648,377 | ) |
| |
Net Assets — 100.0% | | | $ | 4,000,445,956 | |
The percentage shown for each investment category in the Portfolio of Investments is based on net assets.
At September 30, 2021, the concentration of the Fund’s investments in the various states and territories, determined as a percentage of net assets, is as follows:
| | | | |
| |
| New York | | | 20.9% | |
| |
| California | | | 14.9% | |
| |
| Others, representing less than 10% individually | | | 65.3% | |
The Fund invests primarily in debt securities issued by municipalities. The ability of the issuers of the debt securities to meet their obligations may be affected by economic developments in a specific industry or municipality. At September 30, 2021, 7.8% of total investments are backed by bond insurance of various financial institutions and financial guaranty assurance agencies. The aggregate percentage insured by an individual financial institution or financial guaranty assurance agency ranged from 0.7% to 4.2% of total investments.
| (1) | Represents a payment-in-kind security which may pay interest in additional principal at the issuer’s discretion. |
| (2) | Security exempt from registration under Rule 144A of the Securities Act of 1933, as amended. These securities may be sold in certain transactions in reliance on an exemption from registration (normally to qualified institutional buyers). At September 30, 2021, the aggregate value of these securities is $46,621,800 or 1.2% of the Fund’s net assets. |
| (3) | Security represents the municipal bond held by a trust that issues residual interest bonds (see Note 1H). |
| (4) | Floating rate security. The stated interest rate represents the rate in effect at September 30, 2021. |
| (5) | Defaulted security. Issuer has defaulted on the payment of interest and/or principal or has filed for bankruptcy. |
| (6) | When-issued/delayed delivery security. |
| (7) | Amount is less than 0.05%. |
| | | | | | | | | | | | | | | | | | | | |
| Futures Contracts | |
| Description | | Number of
Contracts | | | Position | | | Expiration
Date | | | Notional
Amount | | | Value/Unrealized
Appreciation | |
| | | | | |
Interest Rate Futures | | | | | | | | | | | | | | | | | | | | |
| | | | | |
U.S. Long Treasury Bond | | | (925 | ) | | | Short | | | | 12/21/21 | | | $ | (147,277,344 | ) | | $ | 4,023,456 | |
| |
| | | | $ | 4,023,456 | |
Abbreviations:
| | | | |
| | |
| AGC | | – | | Assured Guaranty Corp. |
| | |
| AGM | | – | | Assured Guaranty Municipal Corp. |
| | |
| AMBAC | | – | | AMBAC Financial Group, Inc. |
| | |
| AMT | | – | | Interest earned from these securities may be considered a tax preference item for purposes of the Federal Alternative Minimum Tax. |
| | |
| BAM | | – | | Build America Mutual Assurance Co. |
| | |
| LIBOR | | – | | London Interbank Offered Rate |
| | |
| NPFG | | – | | National Public Finance Guarantee Corp. |
| | |
| PSF | | – | | Permanent School Fund |
| | |
| SIFMA | | – | | Securities Industry and Financial Markets Association Municipal Swap Index |
Currency Abbreviations:
| | | | |
| | |
| USD | | – | | United States Dollar |
| | | | |
| | 29 | | See Notes to Financial Statements. |
Eaton Vance
Municipal Income Funds
September 30, 2021
Statements of Assets and Liabilities
| | | | | | | | |
| | | September 30, 2021 | |
| Assets | | AMT-Free Fund | | | National Fund | |
| | |
Investments — | | | | | | | | |
| | |
Identified cost | | $ | 345,029,221 | | | $ | 3,849,367,294 | |
| | |
Unrealized appreciation | | | 25,364,442 | | | | 195,727,039 | |
| | |
Investments, at value | | $ | 370,393,663 | | | $ | 4,045,094,333 | |
| | |
Cash | | $ | 8,365 | | | $ | 27,947,830 | |
| | |
Deposits for derivatives collateral — financial futures contracts | | | — | | | | 3,237,550 | |
| | |
Interest receivable | | | 4,104,673 | | | | 39,727,172 | |
| | |
Receivable for investments sold | | | 1,050,000 | | | | 58,776,007 | |
| | |
Receivable for Fund shares sold | | | 342,674 | | | | 6,092,269 | |
| | |
Total assets | | $ | 375,899,375 | | | $ | 4,180,875,161 | |
|
| Liabilities | |
| | |
Payable for floating rate notes issued | | $ | 18,748,903 | | | $ | 104,475,184 | |
| | |
Demand note payable | | | 60,000 | | | | — | |
| | |
Payable for investments purchased | | | — | | | | 22,795,586 | |
| | |
Payable for when-issued/delayed delivery securities | | | 4,668,395 | | | | 40,496,426 | |
| | |
Payable for variation margin on open financial futures contracts | | | — | | | | 115,609 | |
| | |
Payable for Fund shares redeemed | | | 966,926 | | | | 8,814,875 | |
| | |
Distributions payable | | | 111,268 | | | | 1,282,145 | |
| | |
Payable to affiliates: | | | | | | | | |
| | |
Investment adviser fee | | | 116,086 | | | | 942,691 | |
| | |
Distribution and service fees | | | 40,415 | | | | 402,771 | |
| | |
Interest expense and fees payable | | | 39,734 | | | | 218,268 | |
| | |
Accrued expenses | | | 148,750 | | | | 885,650 | |
| | |
Total liabilities | | $ | 24,900,477 | | | $ | 180,429,205 | |
| | |
Net Assets | | $ | 350,998,898 | | | $ | 4,000,445,956 | |
|
| Sources of Net Assets | |
| | |
Paid-in capital | | $ | 351,400,880 | | | $ | 3,941,609,580 | |
| | |
Distributable earnings (accumulated loss) | | | (401,982 | ) | | | 58,836,376 | |
| | |
Net Assets | | $ | 350,998,898 | | | $ | 4,000,445,956 | |
| | |
| Class A Shares | | | | | | | | |
| | |
Net Assets | | $ | 157,980,683 | | | $ | 1,558,418,019 | |
| | |
Shares Outstanding | | | 17,005,837 | | | | 151,120,133 | |
| | |
Net Asset Value and Redemption Price Per Share | | | | | | | | |
| | |
(net assets ÷ shares of beneficial interest outstanding) | | $ | 9.29 | | | $ | 10.31 | |
| | |
Maximum Offering Price Per Share | | | | | | | | |
| | |
(100 ÷ 95.25 of net asset value per share) | | $ | 9.75 | | | $ | 10.82 | |
| |
| Class C Shares | | | | | |
| | |
Net Assets | | $ | 9,016,517 | | | $ | 94,850,568 | |
| | |
Shares Outstanding | | | 976,119 | | | | 9,198,623 | |
| | |
Net Asset Value and Offering Price Per Share* | | | | | | | | |
| | |
(net assets ÷ shares of beneficial interest outstanding) | | $ | 9.24 | | | $ | 10.31 | |
| |
| Class I Shares | | | | | |
| | |
Net Assets | | $ | 184,001,698 | | | $ | 2,347,177,369 | |
| | |
Shares Outstanding | | | 18,135,707 | | | | 227,623,182 | |
| | |
Net Asset Value, Offering Price and Redemption Price Per Share | | | | | | | | |
| | |
(net assets ÷ shares of beneficial interest outstanding) | | $ | 10.15 | | | $ | 10.31 | |
On sales of $50,000 or more, the offering price of Class A shares is reduced.
| * | Redemption price per share is equal to the net asset value less any applicable contingent deferred sales charge. |
| | | | |
| | 30 | | See Notes to Financial Statements. |
Eaton Vance
Municipal Income Funds
September 30, 2021
Statements of Operations
| | | | | | | | |
| | | Year Ended September 30, 2021 | |
| Investment Income | | AMT-Free Fund | | | National Fund | |
| | |
Interest | | $ | 11,671,056 | | | $ | 105,316,335 | |
| | |
Total investment income | | $ | 11,671,056 | | | $ | 105,316,335 | |
|
| Expenses | |
| | |
Investment adviser fee | | $ | 1,397,382 | | | $ | 11,045,036 | |
| | |
Distribution and service fees | | | | | | | | |
| | |
Class A | | | 403,666 | | | | 4,035,160 | |
| | |
Class C | | | 107,959 | | | | 1,043,973 | |
| | |
Trustees’ fees and expenses | | | 17,581 | | | | 108,500 | |
| | |
Custodian fee | | | 86,648 | | | | 682,943 | |
| | |
Transfer and dividend disbursing agent fees | | | 88,282 | | | | 1,165,648 | |
| | |
Legal and accounting services | | | 68,477 | | | | 163,443 | |
| | |
Printing and postage | | | 10,006 | | | | 82,342 | |
| | |
Registration fees | | | 70,060 | | | | 160,980 | |
| | |
Interest expense and fees | | | 152,640 | | | | 680,160 | |
| | |
Miscellaneous | | | 54,067 | | | | 237,557 | |
| | |
Total expenses | | $ | 2,456,768 | | | $ | 19,405,742 | |
| | |
Net investment income | | $ | 9,214,288 | | | $ | 85,910,593 | |
|
| Realized and Unrealized Gain (Loss) | |
| | |
Net realized gain (loss) — | | | | | | | | |
| | |
Investment transactions | | $ | 1,787,813 | | | $ | 23,243,063 | |
| | |
Financial futures contracts | | | — | | | | 359,352 | |
| | |
Net realized gain | | $ | 1,787,813 | | | $ | 23,602,415 | |
| | |
Change in unrealized appreciation (depreciation) — | | | | | | | | |
| | |
Investments | | $ | (339,343 | ) | | $ | (1,242,886 | ) |
| | |
Financial futures contracts | | | — | | | | 4,023,456 | |
| | |
Net change in unrealized appreciation (depreciation) | | $ | (339,343 | ) | | $ | 2,780,570 | |
| | |
Net realized and unrealized gain | | $ | 1,448,470 | | | $ | 26,382,985 | |
| | |
Net increase in net assets from operations | | $ | 10,662,758 | | | $ | 112,293,578 | |
| | | | |
| | 31 | | See Notes to Financial Statements. |
Eaton Vance
Municipal Income Funds
September 30, 2021
Statements of Changes in Net Assets
| | | | | | | | |
| | | Year Ended September 30, 2021 | |
| Increase (Decrease) in Net Assets | | AMT-Free Fund | | | National Fund | |
| | |
From operations — | | | | | | | | |
| | |
Net investment income | | $ | 9,214,288 | | | $ | 85,910,593 | |
| | |
Net realized gain | | | 1,787,813 | | | | 23,602,415 | |
| | |
Net change in unrealized appreciation (depreciation) | | | (339,343 | ) | | | 2,780,570 | |
| | |
Net increase in net assets from operations | | $ | 10,662,758 | | | $ | 112,293,578 | |
| | |
Distributions to shareholders — | | | | | | | | |
| | |
Class A | | $ | (4,300,571 | ) | | $ | (36,519,653 | ) |
| | |
Class C | | | (208,934 | ) | | | (1,594,901 | ) |
| | |
Class I | | | (5,185,414 | ) | | | (51,964,079 | ) |
| | |
Total distributions to shareholders | | $ | (9,694,919 | ) | | $ | (90,078,633 | ) |
| | |
Transactions in shares of beneficial interest — | | | | | | | | |
| | |
Proceeds from sale of shares | | | | | | | | |
| | |
Class A | | $ | 24,766,387 | | | $ | 114,627,273 | |
| | |
Class C | | | 1,235,057 | | | | 19,296,295 | |
| | |
Class I | | | 52,068,921 | | | | 938,155,202 | |
| | |
Net asset value of shares issued to shareholders in payment of distributions declared | | | | | | | | |
| | |
Class A | | | 3,658,118 | | | | 30,945,109 | |
| | |
Class C | | | 200,701 | | | | 1,423,778 | |
| | |
Class I | | | 4,431,087 | | | | 43,217,465 | |
| | |
Cost of shares redeemed | | | | | | | | |
| | |
Class A | | | (34,629,729 | ) | | | (254,580,665 | ) |
| | |
Class C | | | (2,541,459 | ) | | | (23,567,153 | ) |
| | |
Class I | | | (41,093,820 | ) | | | (440,159,489 | ) |
| | |
Net asset value of shares converted | | | | | | | | |
| | |
Class A | | | 5,049,181 | | | | 34,698,532 | |
| | |
Class C | | | (5,049,181 | ) | | | (34,698,532 | ) |
| | |
Net increase in net assets from Fund share transactions | | $ | 8,095,263 | | | $ | 429,357,815 | |
| | |
Net increase in net assets | | $ | 9,063,102 | | | $ | 451,572,760 | |
|
| Net Assets | |
| | |
At beginning of year | | $ | 341,935,796 | | | $ | 3,548,873,196 | |
| | |
At end of year | | $ | 350,998,898 | | | $ | 4,000,445,956 | |
| | | | |
| | 32 | | See Notes to Financial Statements. |
Eaton Vance
Municipal Income Funds
September 30, 2021
Statements of Changes in Net Assets — continued
| | | | | | | | |
| | | Year Ended September 30, 2020 | |
| Increase (Decrease) in Net Assets | | AMT-Free Fund | | | National Fund | |
| | |
From operations — | | | | | | | | |
| | |
Net investment income | | $ | 10,040,250 | | | $ | 87,611,878 | |
| | |
Net realized gain (loss) | | | (778,647 | ) | | | 32,976,127 | |
| | |
Net change in unrealized appreciation (depreciation) | | | (3,878,667 | ) | | | (3,801,019 | ) |
| | |
Net increase in net assets from operations | | $ | 5,382,936 | | | $ | 116,786,986 | |
| | |
Distributions to shareholders — | | | | | | | | |
| | |
Class A | | $ | (4,671,695 | ) | | $ | (44,576,688 | ) |
| | |
Class C | | | (421,058 | ) | | | (3,225,704 | ) |
| | |
Class I | | | (5,343,767 | ) | | | (45,916,178 | ) |
| | |
Total distributions to shareholders | | $ | (10,436,520 | ) | | $ | (93,718,570 | ) |
| | |
Transactions in shares of beneficial interest — | | | | | | | | |
| | |
Proceeds from sale of shares | | | | | | | | |
| | |
Class A | | $ | 23,022,478 | | | $ | 191,525,800 | |
| | |
Class C | | | 2,632,842 | | | | 28,102,719 | |
| | |
Class I | | | 148,037,705 | | | | 1,035,176,603 | |
| | |
Net asset value of shares issued to shareholders in payment of distributions declared | | | | | | | | |
| | |
Class A | | | 4,121,688 | | | | 37,938,752 | |
| | |
Class C | | | 351,377 | | | | 2,661,618 | |
| | |
Class I | | | 3,986,156 | | | | 38,645,320 | |
| | |
Cost of shares redeemed | | | | | | | | |
| | |
Class A | | | (20,744,572 | ) | | | (255,941,582 | ) |
| | |
Class C | | | (6,017,910 | ) | | | (46,493,384 | ) |
| | |
Class I | | | (124,755,998 | ) | | | (632,198,120 | ) |
| | |
Net asset value of shares converted | | | | | | | | |
| | |
Class A | | | 1,573,683 | | | | 26,478,940 | |
| | |
Class C | | | (1,573,683 | ) | | | (26,478,940 | ) |
| | |
Net increase in net assets from Fund share transactions | | $ | 30,633,766 | | | $ | 399,417,726 | |
| | |
Net increase in net assets | | $ | 25,580,182 | | | $ | 422,486,142 | |
|
| Net Assets | |
| | |
At beginning of year | | $ | 316,355,614 | | | $ | 3,126,387,054 | |
| | |
At end of year | | $ | 341,935,796 | | | $ | 3,548,873,196 | |
| | | | |
| | 33 | | See Notes to Financial Statements. |
Eaton Vance
Municipal Income Funds
September 30, 2021
Financial Highlights
| | | | | | | | | | | | | | | | | | | | |
| | | AMT-Free Fund — Class A | |
| |
| | | Year Ended September 30, | |
| | | 2021 | | | 2020 | | | 2019 | | | 2018 | | | 2017 | |
| | | | | |
Net asset value — Beginning of year | | $ | 9.250 | | | $ | 9.250 | | | $ | 8.870 | | | $ | 9.130 | | | $ | 9.430 | |
| | | | | |
| Income (Loss) From Operations | | | | | | | | | | | | | | | | | | | | |
| | | | | |
Net investment income(1) | | $ | 0.236 | | | $ | 0.274 | | | $ | 0.317 | | | $ | 0.336 | | | $ | 0.351 | |
| | | | | |
Net realized and unrealized gain (loss) | | | 0.053 | | | | 0.011 | (2) | | | 0.381 | | | | (0.262 | ) | | | (0.298 | ) |
| | | | | |
Total income from operations | | $ | 0.289 | | | $ | 0.285 | | | $ | 0.698 | | | $ | 0.074 | | | $ | 0.053 | |
| | | | | |
| Less Distributions | | | | | | | | | | | | | | | | | | | | |
| | | | | |
From net investment income | | $ | (0.249 | ) | | $ | (0.285 | ) | | $ | (0.318 | ) | | $ | (0.334 | ) | | $ | (0.353 | ) |
| | | | | |
Total distributions | | $ | (0.249 | ) | | $ | (0.285 | ) | | $ | (0.318 | ) | | $ | (0.334 | ) | | $ | (0.353 | ) |
| | | | | |
Net asset value — End of year | | $ | 9.290 | | | $ | 9.250 | | | $ | 9.250 | | | $ | 8.870 | | | $ | 9.130 | |
| | | | | |
Total Return(3) | | | 3.14 | % | | | 3.12 | % | | | 8.02 | % | | | 0.83 | % | | | 0.64 | % |
| | | | | |
| Ratios/Supplemental Data | | | | | | | | | | | | | | | | | | | | |
| | | | | |
Net assets, end of year (000’s omitted) | | $ | 157,981 | | | $ | 158,729 | | | $ | 150,853 | | | $ | 139,623 | | | $ | 155,589 | |
| | | | | |
Ratios (as a percentage of average daily net assets): | | | | | | | | | | | | | | | | | | | | |
| | | | | |
Expenses excluding interest and fees | | | 0.76 | % | | | 0.78 | % | | | 0.81 | % | | | 0.81 | % | | | 0.82 | % |
| | | | | |
Interest and fee expense(4) | | | 0.04 | % | | | 0.14 | % | | | 0.23 | % | | | 0.24 | % | | | 0.16 | % |
| | | | | |
Total expenses | | | 0.80 | % | | | 0.92 | % | | | 1.04 | % | | | 1.05 | % | | | 0.98 | % |
| | | | | |
Net investment income | | | 2.53 | % | | | 2.97 | % | | | 3.51 | % | | | 3.74 | % | | | 3.86 | % |
| | | | | |
Portfolio Turnover | | | 32 | % | | | 58 | % | | | 33 | % | | | 18 | % | | | 33 | % |
| (1) | Computed using average shares outstanding. |
| (2) | The per share amount is not in accord with the net realized and unrealized gain (loss) for the period because of the timing of Fund share transactions and the amount of the per share realized and unrealized gains and losses at such time. |
| (3) | Returns are historical and are calculated by determining the percentage change in net asset value with all distributions reinvested and do not reflect the effect of sales charges. |
| (4) | Interest and fee expense relates to the liability for floating rate notes issued in conjunction with residual interest bond transactions (see Note 1H). |
| | | | |
| | 34 | | See Notes to Financial Statements. |
Eaton Vance
Municipal Income Funds
September 30, 2021
Financial Highlights — continued
| | | | | | | | | | | | | | | | | | | | |
| | | AMT-Free Fund — Class C | |
| |
| | | Year Ended September 30, | |
| | | 2021 | | | 2020 | | | 2019 | | | 2018 | | | 2017 | |
| | | | | |
Net asset value — Beginning of year | | $ | 9.200 | | | $ | 9.200 | | | $ | 8.820 | | | $ | 9.080 | | | $ | 9.380 | |
| | | | | |
| Income (Loss) From Operations | | | | | | | | | | | | | | | | | | | | |
| | | | | |
Net investment income(1) | | $ | 0.167 | | | $ | 0.204 | | | $ | 0.249 | | | $ | 0.267 | | | $ | 0.281 | |
| | | | | |
Net realized and unrealized gain (loss) | | | 0.051 | | | | 0.011 | (2) | | | 0.380 | | | | (0.262 | ) | | | (0.298 | ) |
| | | | | |
Total income (loss) from operations | | $ | 0.218 | | | $ | 0.215 | | | $ | 0.629 | | | $ | 0.005 | | | $ | (0.017 | ) |
| | | | | |
| Less Distributions | | | | | | | | | | | | | | | | | | | | |
| | | | | |
From net investment income | | $ | (0.178 | ) | | $ | (0.215 | ) | | $ | (0.249 | ) | | $ | (0.265 | ) | | $ | (0.283 | ) |
| | | | | |
Total distributions | | $ | (0.178 | ) | | $ | (0.215 | ) | | $ | (0.249 | ) | | $ | (0.265 | ) | | $ | (0.283 | ) |
| | | | | |
Net asset value — End of year | | $ | 9.240 | | | $ | 9.200 | | | $ | 9.200 | | | $ | 8.820 | | | $ | 9.080 | |
| | | | | |
Total Return(3) | | | 2.38 | % | | | 2.36 | % | | | 7.24 | % | | | 0.06 | % | | | (0.12 | )% |
| | | | | |
| Ratios/Supplemental Data | | | | | | | | | | | | | | | | | | | | |
| | | | | |
Net assets, end of year (000’s omitted) | | $ | 9,017 | | | $ | 15,094 | | | $ | 19,715 | | | $ | 32,545 | | | $ | 39,099 | |
| | | | | |
Ratios (as a percentage of average daily net assets): | | | | | | | | | | | | | | | | | | | | |
| | | | | |
Expenses excluding interest and fees | | | 1.51 | % | | | 1.53 | % | | | 1.56 | % | | | 1.56 | % | | | 1.57 | % |
| | | | | |
Interest and fee expense(4) | | | 0.04 | % | | | 0.14 | % | | | 0.23 | % | | | 0.24 | % | | | 0.16 | % |
| | | | | |
Total expenses | | | 1.55 | % | | | 1.67 | % | | | 1.79 | % | | | 1.80 | % | | | 1.73 | % |
| | | | | |
Net investment income | | | 1.80 | % | | | 2.23 | % | | | 2.78 | % | | | 2.99 | % | | | 3.11 | % |
| | | | | |
Portfolio Turnover | | | 32 | % | | | 58 | % | | | 33 | % | | | 18 | % | | | 33 | % |
| (1) | Computed using average shares outstanding. |
| (2) | The per share amount is not in accord with the net realized and unrealized gain (loss) for the period because of the timing of Fund share transactions and the amount of the per share realized and unrealized gains and losses at such time. |
| (3) | Returns are historical and are calculated by determining the percentage change in net asset value with all distributions reinvested and do not reflect the effect of sales charges. |
| (4) | Interest and fee expense relates to the liability for floating rate notes issued in conjunction with residual interest bond transactions (see Note 1H). |
| | | | |
| | 35 | | See Notes to Financial Statements. |
Eaton Vance
Municipal Income Funds
September 30, 2021
Financial Highlights — continued
| | | | | | | | | | | | | | | | | | | | |
| | | AMT-Free Fund — Class I | |
| |
| | | Year Ended September 30, | |
| | | 2021 | | | 2020 | | | 2019 | | | 2018 | | | 2017 | |
| | | | | |
Net asset value — Beginning of year | | $ | 10.110 | | | $ | 10.100 | | | $ | 9.680 | | | $ | 9.970 | | | $ | 10.300 | |
| | | | | |
| Income (Loss) From Operations | | | | | | | | | | | | | | | | | | | | |
| | | | | |
Net investment income(1) | | $ | 0.283 | | | $ | 0.323 | | | $ | 0.370 | | | $ | 0.391 | | | $ | 0.407 | |
| | | | | |
Net realized and unrealized gain (loss) | | | 0.055 | | | | 0.023 | (2) | | | 0.422 | | | | (0.292 | ) | | | (0.327 | ) |
| | | | | |
Total income from operations | | $ | 0.338 | | | $ | 0.346 | | | $ | 0.792 | | | $ | 0.099 | | | $ | 0.080 | |
| | | | | |
| Less Distributions | | | | | | | | | | | | | | | | | | | | |
| | | | | |
From net investment income | | $ | (0.298 | ) | | $ | (0.336 | ) | | $ | (0.372 | ) | | $ | (0.389 | ) | | $ | (0.410 | ) |
| | | | | |
Total distributions | | $ | (0.298 | ) | | $ | (0.336 | ) | | $ | (0.372 | ) | | $ | (0.389 | ) | | $ | (0.410 | ) |
| | | | | |
Net asset value — End of year | | $ | 10.150 | | | $ | 10.110 | | | $ | 10.100 | | | $ | 9.680 | | | $ | 9.970 | |
| | | | | |
Total Return(3) | | | 3.36 | % | | | 3.48 | % | | | 8.34 | % | | | 1.02 | % | | | 0.87 | % |
| | | | | |
| Ratios/Supplemental Data | | | | | | | | | | | | | | | | | | | | |
| | | | | |
Net assets, end of year (000’s omitted) | | $ | 184,002 | | | $ | 168,113 | | | $ | 145,788 | | | $ | 132,313 | | | $ | 154,177 | |
| | | | | |
Ratios (as a percentage of average daily net assets): | | | | | | | | | | | | | | | | | | | | |
| | | | | |
Expenses excluding interest and fees | | | 0.51 | % | | | 0.53 | % | | | 0.56 | % | | | 0.56 | % | | | 0.57 | % |
| | | | | |
Interest and fee expense(4) | | | 0.04 | % | | | 0.14 | % | | | 0.23 | % | | | 0.24 | % | | | 0.16 | % |
| | | | | |
Total expenses | | | 0.55 | % | | | 0.67 | % | | | 0.79 | % | | | 0.80 | % | | | 0.73 | % |
| | | | | |
Net investment income | | | 2.77 | % | | | 3.21 | % | | | 3.76 | % | | | 3.98 | % | | | 4.09 | % |
| | | | | |
Portfolio Turnover | | | 32 | % | | | 58 | % | | | 33 | % | | | 18 | % | | | 33 | % |
| (1) | Computed using average shares outstanding. |
| (2) | The per share amount is not in accord with the net realized and unrealized gain (loss) for the period because of the timing of Fund share transactions and the amount of the per share realized and unrealized gains and losses at such time. |
| (3) | Returns are historical and are calculated by determining the percentage change in net asset value with all distributions reinvested. |
| (4) | Interest and fee expense relates to the liability for floating rate notes issued in conjunction with residual interest bond transactions (see Note 1H). |
| | | | |
| | 36 | | See Notes to Financial Statements. |
Eaton Vance
Municipal Income Funds
September 30, 2021
Financial Highlights — continued
| | | | | | | | | | | | | | | | | | | | |
| | | National Fund — Class A | |
| |
| | | Year Ended September 30, | |
| | | 2021 | | | 2020 | | | 2019 | | | 2018 | | | 2017 | |
| | | | | |
Net asset value — Beginning of year | | $ | 10.240 | | | $ | 10.140 | | | $ | 9.650 | | | $ | 9.930 | | | $ | 10.170 | |
| | | | | |
| Income (Loss) From Operations | | | | | | | | | | | | | | | | | | | | |
| | | | | |
Net investment income(1) | | $ | 0.223 | | | $ | 0.265 | | | $ | 0.322 | | | $ | 0.350 | | | $ | 0.366 | |
| | | | | |
Net realized and unrealized gain (loss) | | | 0.082 | | | | 0.119 | | | | 0.491 | | | | (0.277 | ) | | | (0.242 | ) |
| | | | | |
Total income from operations | | $ | 0.305 | | | $ | 0.384 | | | $ | 0.813 | | | $ | 0.073 | | | $ | 0.124 | |
| | | | | |
| Less Distributions | | | | | | | | | | | | | | | | | | | | |
| | | | | |
From net investment income | | $ | (0.235 | ) | | $ | (0.284 | ) | | $ | (0.323 | ) | | $ | (0.353 | ) | | $ | (0.364 | ) |
| | | | | |
Total distributions | | $ | (0.235 | ) | | $ | (0.284 | ) | | $ | (0.323 | ) | | $ | (0.353 | ) | | $ | (0.364 | ) |
| | | | | |
Net asset value — End of year | | $ | 10.310 | | | $ | 10.240 | | | $ | 10.140 | | | $ | 9.650 | | | $ | 9.930 | |
| | | | | |
Total Return(2) | | | 2.99 | % | | | 3.84 | % | | | 8.57 | % | | | 0.76 | % | | | 1.31 | % |
| | | | | |
| Ratios/Supplemental Data | | | | | | | | | | | | | | | | | | | | |
| | | | | |
Net assets, end of year (000’s omitted) | | $ | 1,558,418 | | | $ | 1,620,505 | | | $ | 1,605,407 | | | $ | 1,419,239 | | | $ | 1,600,127 | |
| | | | | |
Ratios (as a percentage of average daily net assets): | | | | | | | | | | | | | | | | | | | | |
| | | | | |
Expenses excluding interest and fees | | | 0.61 | % | | | 0.64 | % | | | 0.68 | % | | | 0.69 | % | | | 0.68 | % |
| | | | | |
Interest and fee expense(3) | | | 0.02 | % | | | 0.05 | % | | | 0.12 | % | | | 0.19 | % | | | 0.16 | % |
| | | | | |
Total expenses | | | 0.63 | % | | | 0.69 | % | | | 0.80 | % | | | 0.88 | % | | | 0.84 | % |
| | | | | |
Net investment income | | | 2.15 | % | | | 2.61 | % | | | 3.26 | % | | | 3.58 | % | | | 3.71 | % |
| | | | | |
Portfolio Turnover | | | 56 | % | | | 105 | % | | | 89 | % | | | 67 | % | | | 70 | % |
| (1) | Computed using average shares outstanding. |
| (2) | Returns are historical and are calculated by determining the percentage change in net asset value with all distributions reinvested and do not reflect the effect of sales charges. |
| (3) | Interest and fee expense relates to the liability for floating rate notes issued in conjunction with residual interest bond transactions (see Note 1H). |
| | | | |
| | 37 | | See Notes to Financial Statements. |
Eaton Vance
Municipal Income Funds
September 30, 2021
Financial Highlights — continued
| | | | | | | | | | | | | | | | | | | | |
| | | National Fund — Class C | |
| |
| | | Year Ended September 30, | |
| | | 2021 | | | 2020 | | | 2019 | | | 2018 | | | 2017 | |
| | | | | |
Net asset value — Beginning of year | | $ | 10.240 | | | $ | 10.140 | | | $ | 9.650 | | | $ | 9.930 | | | $ | 10.170 | |
| | | | | |
| Income (Loss) From Operations | | | | | | | | | | | | | | | | | | | | |
| | | | | |
Net investment income(1) | | $ | 0.146 | | | $ | 0.190 | | | $ | 0.252 | | | $ | 0.276 | | | $ | 0.292 | |
| | | | | |
Net realized and unrealized gain (loss) | | | 0.081 | | | | 0.119 | | | | 0.488 | | | | (0.276 | ) | | | (0.242 | ) |
| | | | | |
Total income from operations | | $ | 0.227 | | | $ | 0.309 | | | $ | 0.740 | | | $ | — | | | $ | 0.050 | |
| | | | | |
| Less Distributions | | | | | | | | | | | | | | | | | | | | |
| | | | | |
From net investment income | | $ | (0.157 | ) | | $ | (0.209 | ) | | $ | (0.250 | ) | | $ | (0.280 | ) | | $ | (0.290 | ) |
| | | | | |
Total distributions | | $ | (0.157 | ) | | $ | (0.209 | ) | | $ | (0.250 | ) | | $ | (0.280 | ) | | $ | (0.290 | ) |
| | | | | |
Net asset value — End of year | | $ | 10.310 | | | $ | 10.240 | | | $ | 10.140 | | | $ | 9.650 | | | $ | 9.930 | |
| | | | | |
Total Return(2) | | | 2.22 | % | | | 3.08 | % | | | 7.77 | % | | | 0.01 | % | | | 0.56 | % |
| | | | | |
| Ratios/Supplemental Data | | | | | | | | | | | | | | | | | | | | |
| | | | | |
Net assets, end of year (000’s omitted) | | $ | 94,851 | | | $ | 131,330 | | | $ | 172,417 | | | $ | 363,026 | | | $ | 462,269 | |
| | | | | |
Ratios (as a percentage of average daily net assets): | | | | | | | | | | | | | | | | | | | | |
| | | | | |
Expenses excluding interest and fees | | | 1.36 | % | | | 1.39 | % | | | 1.43 | % | | | 1.44 | % | | | 1.43 | % |
| | | | | |
Interest and fee expense(3) | | | 0.02 | % | | | 0.05 | % | | | 0.12 | % | | | 0.19 | % | | | 0.16 | % |
| | | | | |
Total expenses | | | 1.38 | % | | | 1.44 | % | | | 1.55 | % | | | 1.63 | % | | | 1.59 | % |
| | | | | |
Net investment income | | | 1.41 | % | | | 1.87 | % | | | 2.57 | % | | | 2.83 | % | | | 2.96 | % |
| | | | | |
Portfolio Turnover | | | 56 | % | | | 105 | % | | | 89 | % | | | 67 | % | | | 70 | % |
| (1) | Computed using average shares outstanding. |
| (2) | Returns are historical and are calculated by determining the percentage change in net asset value with all distributions reinvested and do not reflect the effect of sales charges. |
| (3) | Interest and fee expense relates to the liability for floating rate notes issued in conjunction with residual interest bond transactions (see Note 1H). |
| | | | |
| | 38 | | See Notes to Financial Statements. |
Eaton Vance
Municipal Income Funds
September 30, 2021
Financial Highlights — continued
| | | | | | | | | | | | | | | | | | | | |
| | | National Fund — Class I | |
| |
| | | Year Ended September 30, | |
| | | 2021 | | | 2020 | | | 2019 | | | 2018 | | | 2017 | |
| | | | | |
Net asset value — Beginning of year | | $ | 10.240 | | | $ | 10.140 | | | $ | 9.650 | | | $ | 9.930 | | | $ | 10.170 | |
| | | | | |
| Income (Loss) From Operations | | | | | | | | | | | | | | | | | | | | |
| | | | | |
Net investment income(1) | | $ | 0.248 | | | $ | 0.289 | | | $ | 0.341 | | | $ | 0.374 | | | $ | 0.390 | |
| | | | | |
Net realized and unrealized gain (loss) | | | 0.082 | | | | 0.120 | | | | 0.495 | | | | (0.277 | ) | | | (0.241 | ) |
| | | | | |
Total income from operations | | $ | 0.330 | | | $ | 0.409 | | | $ | 0.836 | | | $ | 0.097 | | | $ | 0.149 | |
| | | | | |
| Less Distributions | | | | | | | | | | | | | | | | | | | | |
| | | | | |
From net investment income | | $ | (0.260 | ) | | $ | (0.309 | ) | | $ | (0.346 | ) | | $ | (0.377 | ) | | $ | (0.389 | ) |
| | | | | |
Total distributions | | $ | (0.260 | ) | | $ | (0.309 | ) | | $ | (0.346 | ) | | $ | (0.377 | ) | | $ | (0.389 | ) |
| | | | | |
Net asset value — End of year | | $ | 10.310 | | | $ | 10.240 | | | $ | 10.140 | | | $ | 9.650 | | | $ | 9.930 | |
| | | | | |
Total Return(2) | | | 3.24 | % | | | 4.10 | % | | | 8.83 | % | | | 1.01 | % | | | 1.56 | % |
| | | | | |
| Ratios/Supplemental Data | | | | | | | | | | | | | | | | | | | | |
| | | | | |
Net assets, end of year (000’s omitted) | | $ | 2,347,177 | | | $ | 1,797,038 | | | $ | 1,348,563 | | | $ | 756,446 | | | $ | 777,063 | |
| | | | | |
Ratios (as a percentage of average daily net assets): | | | | | | | | | | | | | | | | | | | | |
| | | | | |
Expenses excluding interest and fees | | | 0.36 | % | | | 0.39 | % | | | 0.43 | % | | | 0.44 | % | | | 0.43 | % |
| | | | | |
Interest and fee expense(3) | | | 0.02 | % | | | 0.05 | % | | | 0.12 | % | | | 0.19 | % | | | 0.16 | % |
| | | | | |
Total expenses | | | 0.38 | % | | | 0.44 | % | | | 0.55 | % | | | 0.63 | % | | | 0.59 | % |
| | | | | |
Net investment income | | | 2.39 | % | | | 2.85 | % | | | 3.45 | % | | | 3.83 | % | | | 3.95 | % |
| | | | | |
Portfolio Turnover | | | 56 | % | | | 105 | % | | | 89 | % | | | 67 | % | | | 70 | % |
| (1) | Computed using average shares outstanding. |
| (2) | Returns are historical and are calculated by determining the percentage change in net asset value with all distributions reinvested. |
| (3) | Interest and fee expense relates to the liability for floating rate notes issued in conjunction with residual interest bond transactions (see Note 1H). |
| | | | |
| | 39 | | See Notes to Financial Statements. |
Eaton Vance
Municipal Income Funds
September 30, 2021
Notes to Financial Statements
1 Significant Accounting Policies
Eaton Vance AMT-Free Municipal Income Fund (AMT-Free Fund) and Eaton Vance National Municipal Income Fund (National Fund) (each individually referred to as the Fund, and collectively, the Funds) are a diversified series of Eaton Vance Mutual Funds Trust and Eaton Vance Municipals Trust, respectively (collectively, the Trusts). The Trusts are Massachusetts business trusts registered under the Investment Company Act of 1940, as amended (the 1940 Act), as open-end management investment companies. Each Fund’s investment objective is to provide current income exempt from regular federal income tax. The Funds offer three classes of shares. Class A shares are generally sold subject to a sales charge imposed at time of purchase. Class C shares are sold at net asset value and are generally subject to a contingent deferred sales charge (see Note 5). Effective January 25, 2019, Class C shares generally automatically convert to Class A shares ten years after their purchase and, effective November 5, 2020, automatically convert to Class A shares eight years after their purchase as described in the Funds’ prospectus. Class I shares are sold at net asset value and are not subject to a sales charge. Each class represents a pro-rata interest in the Fund, but votes separately on class-specific matters and (as noted below) is subject to different expenses. Realized and unrealized gains and losses are allocated daily to each class of shares based on the relative net assets of each class to the total net assets of the Fund. Net investment income, other than class-specific expenses, is allocated daily to each class of shares based upon the ratio of the value of each class’s paid shares to the total value of all paid shares. Each class of shares differs in its distribution plan and certain other class-specific expenses.
The following is a summary of significant accounting policies of the Funds. The policies are in conformity with accounting principles generally accepted in the United States of America (U.S. GAAP). Each Fund is an investment company and follows accounting and reporting guidance in the Financial Accounting Standards Board (FASB) Accounting Standards Codification Topic 946.
A Investment Valuation — The following methodologies are used to determine the market value or fair value of investments.
Debt Obligations. Debt obligations are generally valued on the basis of valuations provided by third party pricing services, as derived from such services’ pricing models. Inputs to the models may include, but are not limited to, reported trades, executable bid and ask prices, broker/dealer quotations, prices or yields of securities with similar characteristics, interest rates, anticipated prepayments, benchmark curves or information pertaining to the issuer, as well as industry and economic events. The pricing services may use a matrix approach, which considers information regarding securities with similar characteristics to determine the valuation for a security. Short-term debt obligations purchased with a remaining maturity of sixty days or less for which a valuation from a third party pricing service is not readily available may be valued at amortized cost, which approximates fair value.
Derivatives. Financial futures contracts are valued at the closing settlement price established by the board of trade or exchange on which they are traded.
Fair Valuation. Investments for which valuations or market quotations are not readily available or are deemed unreliable are valued at fair value using methods determined in good faith by or at the direction of the Trustees of a Fund in a manner that most fairly reflects the security’s “fair value”, which is the amount that a Fund might reasonably expect to receive for the security upon its current sale in the ordinary course. Each such determination is based on a consideration of relevant factors, which are likely to vary from one pricing context to another. These factors may include, but are not limited to, the type of security, the existence of any contractual restrictions on the security’s disposition, the price and extent of public trading in similar securities of the issuer or of comparable companies or entities, quotations or relevant information obtained from broker/dealers or other market participants, information obtained from the issuer, analysts, and/or the appropriate stock exchange (for exchange-traded securities), an analysis of the company’s or entity’s financial statements, and an evaluation of the forces that influence the issuer and the market(s) in which the security is purchased and sold.
B Investment Transactions and Related Income — Investment transactions for financial statement purposes are accounted for on a trade date basis. Realized gains and losses on investments sold are determined on the basis of identified cost. Interest income is recorded on the basis of interest accrued, adjusted for amortization of premium or accretion of discount.
C Federal Taxes — Each Fund’s policy is to comply with the provisions of the Internal Revenue Code applicable to regulated investment companies and to distribute to shareholders each year substantially all of its taxable, if any, and tax-exempt net investment income, and all or substantially all of its net realized capital gains. Accordingly, no provision for federal income or excise tax is necessary. Each Fund intends to satisfy conditions which will enable it to designate distributions from the interest income generated by its investments in non-taxable municipal securities, which are exempt from regular federal income tax when received by each Fund, as exempt-interest dividends. For National Fund, the portion of such interest, if any, earned on private activity bonds issued after August 7, 1986, may be considered a tax preference item to shareholders.
As of September 30, 2021, the Funds had no uncertain tax positions that would require financial statement recognition, de-recognition, or disclosure. Each Fund files a U.S. federal income tax return annually after its fiscal year-end, which is subject to examination by the Internal Revenue Service for a period of three years from the date of filing.
D Expenses — The majority of expenses of the Trusts are directly identifiable to an individual fund. Expenses which are not readily identifiable to a specific fund are allocated taking into consideration, among other things, the nature and type of expense and the relative size of the funds.
E Legal Fees — Legal fees and other related expenses incurred as part of negotiations of the terms and requirement of capital infusions, or that are expected to result in the restructuring of, or a plan of reorganization for, an investment are recorded as realized losses. Ongoing expenditures to protect or enhance an investment are treated as operating expenses.
Eaton Vance
Municipal Income Funds
September 30, 2021
Notes to Financial Statements — continued
F Use of Estimates — The preparation of the financial statements in conformity with U.S. GAAP requires management to make estimates and assumptions that affect the reported amounts of assets and liabilities at the date of the financial statements and the reported amounts of income and expense during the reporting period. Actual results could differ from those estimates.
G Indemnifications — Under each Trust’s organizational documents, its officers and Trustees may be indemnified against certain liabilities and expenses arising out of the performance of their duties to the Funds. Under Massachusetts law, if certain conditions prevail, shareholders of a Massachusetts business trust (such as a Trust) could be deemed to have personal liability for the obligations of the Trust. However, each Trust’s Declaration of Trust contains an express disclaimer of liability on the part of Fund shareholders and the By-laws provide that the Trust shall assume, upon request by the shareholder, the defense on behalf of any Fund shareholders. Moreover, the By-laws also provide for indemnification out of Fund property of any shareholder held personally liable solely by reason of being or having been a shareholder for all loss or expense arising from such liability. Additionally, in the normal course of business, each Fund enters into agreements with service providers that may contain indemnification clauses. Each Fund’s maximum exposure under these arrangements is unknown as this would involve future claims that may be made against each Fund that have not yet occurred.
H Floating Rate Notes Issued in Conjunction with Securities Held — The Funds may invest in residual interest bonds, also referred to as inverse floating rate securities, whereby a Fund may sell a variable or fixed rate bond for cash to a Special-Purpose Vehicle (the SPV), (which is generally organized as a trust), while at the same time, buying a residual interest in the assets and cash flows of the SPV. The bond is deposited into the SPV with the same CUSIP number as the bond sold to the SPV by the Fund, and which may have been, but is not required to be, the bond purchased from the Fund (the Bond). The SPV also issues floating rate notes (Floating Rate Notes) which are sold to third-parties. The residual interest bond held by a Fund gives the Fund the right (1) to cause the holders of the Floating Rate Notes to generally tender their notes at par, and (2) to have the Bond held by the SPV transferred to the Fund, thereby terminating the SPV. Should the Fund exercise such right, it would generally pay the SPV the par amount due on the Floating Rate Notes and exchange the residual interest bond for the underlying Bond. Pursuant to generally accepted accounting principles for transfers and servicing of financial assets and extinguishment of liabilities, the Funds account for the transaction described above as a secured borrowing by including the Bond in their Portfolio of Investments and the Floating Rate Notes as a liability under the caption “Payable for floating rate notes issued” in their Statement of Assets and Liabilities. The Floating Rate Notes have interest rates that generally reset weekly and their holders have the option to tender their notes to the SPV for redemption at par at each reset date. Accordingly, the fair value of the payable for floating rate notes issued approximates its carrying value. If measured at fair value, the payable for floating rate notes would have been considered as Level 2 in the fair value hierarchy (see Note 10) at September 30, 2021. Interest expense related to a Fund’s liability with respect to Floating Rate Notes is recorded as incurred. The SPV may be terminated by the Fund, as noted above, or by the occurrence of certain termination events as defined in the trust agreement, such as a downgrade in the credit quality of the underlying Bond, bankruptcy of or payment failure by the issuer of the underlying Bond, the inability to remarket Floating Rate Notes that have been tendered due to insufficient buyers in the market, or the failure by the SPV to obtain renewal of the liquidity agreement under which liquidity support is provided for the Floating Rate Notes up to one year. At September 30, 2021, the amounts of the Funds’ Floating Rate Notes and related interest rates and collateral were as follows:
| | | | | | | | |
| | | AMT-Free
Fund | | | National
Fund | |
| | |
Floating Rate Notes Outstanding | | $ | 18,748,903 | | | $ | 104,475,184 | |
| | |
Interest Rate or Range of Interest Rates (%) | | | 0.08 | | | | 0.07 - 0.10 | |
| | |
Collateral for Floating Rate Notes Outstanding | | $ | 30,702,230 | | | $ | 148,842,396 | |
For the year ended September 30, 2021, the Funds’ average settled Floating Rate Notes outstanding and the average interest rate including fees were as follows:
| | | | | | | | |
| | | AMT-Free
Fund | | | National
Fund | |
| | |
Average Floating Rate Notes Outstanding | | $ | 21,583,767 | | | $ | 104,175,000 | |
| | |
Average Interest Rate | | | 0.71 | % | | | 0.65 | % |
In certain circumstances, the Funds may enter into shortfall and forbearance agreements with brokers by which a Fund agrees to reimburse the broker for the difference between the liquidation value of the Bond held by the SPV and the liquidation value of the Floating Rate Notes, as well as any shortfalls in interest cash flows. The Funds had no shortfalls as of September 30, 2021.
The Funds may also purchase residual interest bonds in a secondary market transaction without first owning the underlying bond. Such transactions are not required to be treated as secured borrowings. Shortfall agreements, if any, related to residual interest bonds purchased in a secondary market transaction are disclosed in the Portfolio of Investments.
Eaton Vance
Municipal Income Funds
September 30, 2021
Notes to Financial Statements — continued
The Funds’ investment policies and restrictions expressly permit investments in residual interest bonds. Such bonds typically offer the potential for yields exceeding the yields available on fixed rate bonds with comparable credit quality and maturity. These securities tend to underperform the market for fixed rate bonds in a rising long-term interest rate environment, but tend to outperform the market for fixed rate bonds when long-term interest rates decline. The value and income of residual interest bonds are generally more volatile than that of a fixed rate bond. The Funds’ investment policies do not allow the Funds to borrow money except as permitted by the 1940 Act. Management believes that the Funds’ restrictions on borrowing money and issuing senior securities (other than as specifically permitted) do not apply to Floating Rate Notes issued by the SPV and included as a liability in the Funds’ Statement of Assets and Liabilities. As secured indebtedness issued by an SPV, Floating Rate Notes are distinct from the borrowings and senior securities to which the Funds’ restrictions apply. Residual interest bonds held by the Funds are securities exempt from registration under Rule 144A of the Securities Act of 1933.
I Financial Futures Contracts — Upon entering into a financial futures contract, a Fund is required to deposit with the broker, either in cash or securities, an amount equal to a certain percentage of the contract amount (initial margin). Subsequent payments, known as variation margin, are made or received by the Fund each business day, depending on the daily fluctuations in the value of the underlying security, and are recorded as unrealized gains or losses by the Fund. Gains (losses) are realized upon the expiration or closing of the financial futures contracts. Should market conditions change unexpectedly, the Fund may not achieve the anticipated benefits of the financial futures contracts and may realize a loss. Futures contracts have minimal counterparty risk as they are exchange traded and the clearinghouse for the exchange is substituted as the counterparty, guaranteeing counterparty performance.
J When-Issued Securities and Delayed Delivery Transactions — The Funds may purchase securities on a delayed delivery or when-issued basis. Payment and delivery may take place after the customary settlement period for that security. At the time the transaction is negotiated, the price of the security that will be delivered is fixed. The Funds maintain cash and/or security positions for these commitments such that sufficient liquid assets will be available to make payments upon settlement. Securities purchased on a delayed delivery or when-issued basis are marked-to-market daily and begin earning interest on settlement date. Such securities are subject to the risk that when delivered they will be worth less than the agreed upon payment price. Losses may also arise if the counterparty does not perform under the contract.
2 Distributions to Shareholders and Income Tax Information
The net investment income of each Fund is determined daily and substantially all of the net investment income so determined is declared as a dividend to shareholders of record at the time of declaration. Distributions are declared separately for each class of shares. Distributions are paid monthly. Distributions of realized capital gains are made at least annually. Shareholders may reinvest income and capital gain distributions in additional shares of the same class of a Fund at the net asset value as of the reinvestment date or, at the election of the shareholder, receive distributions in cash. Distributions to shareholders are determined in accordance with income tax regulations, which may differ from U.S. GAAP. As required by U.S. GAAP, only distributions in excess of tax basis earnings and profits are reported in the financial statements as a return of capital. Permanent differences between book and tax accounting relating to distributions are reclassified to paid-in capital. For tax purposes, distributions from short-term capital gains are considered to be from ordinary income.
The tax character of distributions declared for the years ended September 30, 2021 and September 30, 2020 was as follows:
| | | | | | | | | | | | | | | | |
| | | AMT-Free
Fund | | | National
Fund | |
| | | Year Ended September 30, | | | Year Ended September 30, | |
| | | 2021 | | | 2020 | | | 2021 | | | 2020 | |
| | | | |
Tax-exempt income | | $ | 9,682,218 | | | $ | 10,435,763 | | | $ | 83,800,571 | | | $ | 88,786,223 | |
| | | | |
Ordinary income | | $ | 12,701 | | | $ | 757 | | | $ | 6,278,062 | | | $ | 4,932,347 | |
As of September 30, 2021, the components of distributable earnings (accumulated loss) on a tax basis were as follows:
| | | | | | | | |
| | | AMT-Free
Fund | | | National
Fund | |
| | |
Undistributed tax-exempt income | | $ | 738,410 | | | $ | 1,499,517 | |
| | |
Deferred capital losses | | | (26,558,253 | ) | | | (138,416,525 | ) |
| | |
Net unrealized appreciation | | | 25,529,129 | | | | 197,035,529 | |
| | |
Distributions payable | | | (111,268 | ) | | | (1,282,145 | ) |
| | |
Distributable earnings (accumulated loss) | | $ | (401,982 | ) | | $ | 58,836,376 | |
Eaton Vance
Municipal Income Funds
September 30, 2021
Notes to Financial Statements — continued
At September 30, 2021, the following Funds, for federal income tax purposes, had deferred capital losses which would reduce the respective Fund’s taxable income arising from future net realized gains on investment transactions, if any, to the extent permitted by the Internal Revenue Code, and thus would reduce the amount of distributions to shareholders, which would otherwise be necessary to relieve the Funds of any liability for federal income or excise tax. The deferred capital losses are treated as arising on the first day of a Fund’s next taxable year and retain the same short-term or long-term character as when originally deferred. The amounts of the deferred capital losses are as follows:
| | | | | | | | |
| | | AMT-Free
Fund | | | National
Fund | |
| | |
Deferred capital losses: | | | | | | | | |
| | |
Short-term | | $ | 15,332,582 | | | $ | 103,411,907 | |
| | |
Long-term | | $ | 11,225,671 | | | $ | 35,004,618 | |
The cost and unrealized appreciation (depreciation) of investments, including open derivative contracts, of each Fund at September 30, 2021, as determined on a federal income tax basis, were as follows:
| | | | | | | | |
| | | AMT-Free
Fund | | | National
Fund | |
| | |
Aggregate cost | | $ | 326,115,631 | | | $ | 3,743,583,620 | |
| | |
Gross unrealized appreciation | | $ | 27,451,933 | | | $ | 227,797,827 | |
| | |
Gross unrealized depreciation | | | (1,922,804 | ) | | | (30,762,298 | ) |
| | |
Net unrealized appreciation | | $ | 25,529,129 | | | $ | 197,035,529 | |
3 Investment Adviser Fee and Other Transactions with Affiliates
The investment adviser fee is earned by Eaton Vance Management (EVM) for AMT-Free Fund and Boston Management and Research (BMR), an affiliate of EVM, for National Fund as compensation for management and investment advisory services rendered to each Fund. On March 1, 2021, Morgan Stanley acquired Eaton Vance Corp. (the “Transaction”) and EVM and BMR became indirect, wholly-owned subsidiaries of Morgan Stanley. In connection with the Transaction, AMT-Free Fund entered into a new investment advisory agreement with EVM and National Fund entered into a new investment advisory agreement with BMR (the “New Agreements”), which took effect on March 1, 2021. Pursuant to the New Agreements (and each Fund’s investment advisory agreement with EVM or BMR, as applicable, in effect prior to March 1, 2021), the fee is based upon a percentage of total daily net assets plus a percentage of total daily gross income (i.e., income other than gains from the sale of securities) as follows and is payable monthly:
| | | | | | | | |
| Total Daily Net Assets | | Annual Asset
Rate | | | Daily Income
Rate | |
| | |
Up to $500 million | | | 0.300 | % | | | 3.00 | % |
| | |
$500 million but less than $1 billion | | | 0.275 | | | | 2.75 | |
| | |
$1 billion but less than $1.5 billion | | | 0.250 | | | | 2.50 | |
| | |
$1.5 billion but less than $2 billion | | | 0.225 | | | | 2.25 | |
| | |
$2 billion but less than $3 billion | | | 0.200 | | | | 2.00 | |
| | |
$3 billion and over | | | 0.175 | | | | 1.75 | |
For the year ended September 30, 2021, investment adviser fees incurred by the Funds and the effective annual rates, as a percentage of average daily net assets, were as follows:
| | | | | | | | |
| | | AMT-Free
Fund | | | National
Fund | |
| | |
Investment Adviser Fee | | $ | 1,397,382 | | | $ | 11,045,036 | |
| | |
Effective Annual Rate | | | 0.40 | % | | | 0.29 | % |
Eaton Vance
Municipal Income Funds
September 30, 2021
Notes to Financial Statements — continued
EVM serves as the administrator of each Fund, but receives no compensation. EVM provides sub-transfer agency and related services to the Funds pursuant to a Sub-Transfer Agency Support Services Agreement. Eaton Vance Distributors, Inc. (EVD), an affiliate of EVM and the Funds’ principal underwriter, received a portion of the sales charge on sales of Class A shares of the Funds. Morgan Stanley affiliated broker-dealers, which may be deemed to be affiliates of BMR, EVM and EVD, also received a portion of the sales charge on the sales of Class A shares from March 1, 2021 through September 30, 2021. EVD also received distribution and service fees from Class A and Class C shares (see Note 4) and contingent deferred sales charges (see Note 5). Sub-transfer agent fees earned by EVM, which are included in transfer and dividend disbursing agent fees on the Statements of Operations, and Class A sales charges that the Funds were informed were received by EVD and Morgan Stanley affiliated broker-dealers for the year ended September 30, 2021 were as follows:
| | | | | | | | |
| | | AMT-Free
Fund | | | National
Fund | |
| | |
EVM’s Sub-Transfer Agent Fees | | $ | 2,642 | | | $ | 52,458 | |
| | |
EVD’s Class A Sales Charges | | $ | 9,321 | | | $ | 116,699 | |
| | |
Morgan Stanley affiliated broker-dealers’ Class A Sales Charges | | $ | 2,750 | | | $ | 28,184 | |
Trustees and officers of the Funds who are members of EVM’s or BMR’s organizations receive remuneration for their services to the Funds out of the investment adviser fee. Trustees of the Funds who are not affiliated with the investment advisers may elect to defer receipt of all or a percentage of their annual fees in accordance with the terms of the Trustees Deferred Compensation Plan. For the year ended September 30, 2021, no significant amounts have been deferred. Certain officers and Trustees of the Funds are officers of the above organizations.
4 Distribution Plans
Each Fund has in effect a distribution plan for Class A shares (Class A Plan) pursuant to Rule 12b-1 under the 1940 Act. Pursuant to the Class A Plan, each Fund pays EVD a distribution and service fee of 0.25% per annum of its average daily net assets attributable to Class A shares for distribution services and facilities provided to each Fund by EVD, as well as for personal services and/or the maintenance of shareholder accounts. Distribution and service fees paid or accrued to EVD for the year ended September 30, 2021 for Class A shares amounted to the following:
| | | | | | | | |
| | | AMT-Free
Fund | | | National
Fund | |
| | |
Class A Distribution and Service Fees | | $ | 403,666 | | | $ | 4,035,160 | |
Each Fund also has in effect a distribution plan for Class C shares (Class C Plan) pursuant to Rule 12b-1 under the 1940 Act. Pursuant to the Class C Plan, each Fund pays EVD amounts equal to 0.75% per annum of its average daily net assets attributable to Class C shares for providing ongoing distribution services and facilities to the respective Funds. For the year ended September 30, 2021, the Funds paid or accrued to EVD the following distribution fees:
| | | | | | | | |
| | | AMT-Free
Fund | | | National
Fund | |
| | |
Class C Distribution Fees | | $ | 80,969 | | | $ | 782,980 | |
The Class C Plan also authorizes each Fund to make payments of service fees to EVD, financial intermediaries and other persons in amounts equal to 0.25% per annum of the average daily net assets attributable to Class C shares. Service fees paid or accrued are for personal services and/or the maintenance of shareholder accounts. They are separate and distinct from the Class C sales commissions and distribution fees payable to EVD. Service fees paid or accrued for the year ended September 30, 2021 amounted to the following:
| | | | | | | | |
| | | AMT-Free
Fund | | | National
Fund | |
| | |
Class C Service Fees | | $ | 26,990 | | | $ | 260,993 | |
Distribution and service fees are subject to the limitations contained in the Financial Industry Regulatory Authority Rule 2341(d).
Eaton Vance
Municipal Income Funds
September 30, 2021
Notes to Financial Statements — continued
5 Contingent Deferred Sales Charges
A contingent deferred sales charge (CDSC) of 1% generally is imposed on redemptions of Class C shares made within 12 months of purchase. Class A shares may be subject to a 1% CDSC if redeemed within 18 months of purchase (depending on the circumstances of purchase). Generally, the CDSC is based upon the lower of the net asset value at date of redemption or date of purchase. No charge is levied on shares acquired by reinvestment of dividends or capital gain distributions. For the year ended September 30, 2021, the Funds were informed that EVD received approximately the following amounts of CDSCs paid by Class A and Class C shareholders:
| | | | | | | | |
| | | AMT-Free
Fund | | | National
Fund | |
| | |
Class A | | $ | 22,000 | | | $ | 55,000 | |
| | |
Class C | | $ | 100 | | | $ | 12,000 | |
6 Purchases and Sales of Investments
Purchases and sales of investments, other than short-term obligations, for the year ended September 30, 2021 were as follows:
| | | | | | | | |
| | | AMT-Free
Fund | | | National
Fund | |
| | |
Purchases | | $ | 117,428,648 | | | $ | 2,488,924,136 | |
| | |
Sales | | $ | 113,625,717 | | | $ | 2,099,655,159 | |
7 Shares of Beneficial Interest
Each Fund’s Declaration of Trust permits the Trustees to issue an unlimited number of full and fractional shares of beneficial interest (without par value). Such shares may be issued in a number of different series (such as the Funds) and classes. Transactions in Fund shares were as follows:
| | | | | | | | | | | | |
AMT-Free Fund | | | | | | | | | |
| | | Year Ended September 30, 2021 | |
| | | Class A | | | Class C | | | Class I | |
| | | |
Sales | | | 2,641,027 | | | | 132,529 | | | | 5,087,241 | |
| | | |
Issued to shareholders electing to receive payments of distributions in Fund shares | | | 391,532 | | | | 21,623 | | | | 434,152 | |
| | | |
Redemptions | | | (3,720,359 | ) | | | (274,046 | ) | | | (4,019,286 | ) |
| | | |
Converted from Class C shares | | | 541,353 | | | | — | | | | — | |
| | | |
Converted to Class A shares | | | — | | | | (544,356 | ) | | | — | |
| | | |
Net increase (decrease) | | | (146,447 | ) | | | (664,250 | ) | | | 1,502,107 | |
| |
| | | Year Ended September 30, 2020 | |
| | | Class A | | | Class C | | | Class I | |
| | | |
Sales | | | 2,489,112 | | | | 286,876 | | | | 14,620,548 | |
| | | |
Issued to shareholders electing to receive payments of distributions in Fund shares | | | 446,020 | | | | 38,242 | | | | 394,814 | |
| | | |
Redemptions | | | (2,260,135 | ) | | | (657,145 | ) | | | (12,811,555 | ) |
| | | |
Converted from Class C shares | | | 169,973 | | | | — | | | | — | |
| | | |
Converted to Class A shares | | | — | | | | (170,955 | ) | | | — | |
| | | |
Net increase (decrease) | | | 844,970 | | | | (502,982 | ) | | | 2,203,807 | |
Eaton Vance
Municipal Income Funds
September 30, 2021
Notes to Financial Statements — continued
| | | | | | | | | | | | |
National Fund | | | | | | | | | |
| | | Year Ended September 30, 2021 | |
| | | Class A | | | Class C | | | Class I | |
| | | |
Sales | | | 11,047,967 | | | | 1,859,069 | | | | 90,354,141 | |
| | | |
Issued to shareholders electing to receive payments of distributions in Fund shares | | | 2,984,855 | | | | 137,455 | | | | 4,167,096 | |
| | | |
Redemptions | | | (24,540,436 | ) | | | (2,272,863 | ) | | | (42,427,981 | ) |
| | | |
Converted from Class C shares | | | 3,351,755 | | | | — | | | | — | |
| | | |
Converted to Class A shares | | | — | | | | (3,351,767 | ) | | | — | |
| | | |
Net increase (decrease) | | | (7,155,859 | ) | | | (3,628,106 | ) | | | 52,093,256 | |
| |
| | | Year Ended September 30, 2020 | |
| | | Class A | | | Class C | | | Class I | |
| | | |
Sales | | | 18,938,747 | | | | 2,768,098 | | | | 102,367,062 | |
| | | |
Issued to shareholders electing to receive payments of distributions in Fund shares | | | 3,734,240 | | | | 262,024 | | | | 3,801,170 | |
| | | |
Redemptions | | | (25,343,714 | ) | | | (4,575,561 | ) | | | (63,630,096 | ) |
| | | |
Converted from Class C shares | | | 2,628,910 | | | | — | | | | — | |
| | | |
Converted to Class A shares | | | — | | | | (2,628,854 | ) | | | — | |
| | | |
Net increase (decrease) | | | (41,817 | ) | | | (4,174,293 | ) | | | 42,538,136 | |
8 Financial Instruments
The Funds may trade in financial instruments with off-balance sheet risk in the normal course of their investing activities. These financial instruments may include financial futures contracts and may involve, to a varying degree, elements of risk in excess of the amounts recognized for financial statement purposes. The notional or contractual amounts of these instruments represent the investment a Fund has in particular classes of financial instruments and do not necessarily represent the amounts potentially subject to risk. The measurement of the risks associated with these instruments is meaningful only when all related and offsetting transactions are considered. A summary of obligations under these financial instruments at September 30, 2021 is included in the Portfolio of Investments. At September 30, 2021, National Fund had sufficient cash and/or securities to cover commitments under these contracts.
Each Fund is subject to interest rate risk in the normal course of pursuing its investment objective. Because the Funds hold fixed-rate bonds, the value of these bonds may decrease if interest rates rise. During the year ended September 30, 2021, National Fund entered into U.S. Treasury futures contracts to hedge against changes in interest rates.
The fair value of open derivative instruments (not considered to be hedging instruments for accounting disclosure purposes) and whose primary underlying risk exposure is interest rate risk at September 30, 2021 were as follows:
| | | | |
| | | National
Fund | |
| |
Asset Derivative: | | | | |
| |
Futures Contracts | | $ | 4,023,456 | (1) |
| |
Total | | $ | 4,023,456 | |
| (1) | Only the current day’s variation margin on open futures contracts is reported within the Statement of Assets and Liabilities as Receivable or Payable for variation margin on open financial futures contracts, as applicable. |
Eaton Vance
Municipal Income Funds
September 30, 2021
Notes to Financial Statements — continued
The effect of derivative instruments (not considered to be hedging instruments for accounting disclosure purposes) on the Statement of Operations and whose primary underlying risk exposure is interest rate risk for the year ended September 30, 2021 was as follows:
| | | | |
| | | National
Fund | |
| |
Realized Gain (Loss) on Derivatives Recognized in Income | | $ | 359,352 | (1) |
| |
Change in Unrealized Appreciation (Depreciation) on Derivatives Recognized in Income | | $ | 4,023,456 | (2) |
| (1) | Statement of Operations location: Net realized gain (loss) – Financial futures contracts. |
| (2) | Statement of Operations location: Change in unrealized appreciation (depreciation) – Financial futures contracts. |
The average notional cost of futures contracts outstanding during the year ended September 30, 2021, which is indicative of the volume of this derivative type, was approximately as follows:
| | | | |
| | | National
Fund | |
| |
Average Notional Cost: | | | | |
| |
Futures Contracts — Short | | $ | 102,828,000 | |
9 Line of Credit
The Funds participate with other portfolios and funds managed by EVM and its affiliates in an $800 million unsecured line of credit agreement with a group of banks, which is in effect through October 26, 2021. Borrowings are made by the Funds solely for temporary purposes related to redemptions and other short-term cash needs. Interest is charged to each Fund based on its borrowings at an amount above either the Eurodollar rate or Federal Funds rate. In addition, a fee computed at an annual rate of 0.15% on the daily unused portion of the line of credit is allocated among the participating portfolios and funds at the end of each quarter. In connection with the renewal of the agreement in October 2020, an upfront fee and arrangement fee totaling $950,000 was incurred that was allocated to the participating portfolios and funds. Because the line of credit is not available exclusively to the Funds, a Fund may be unable to borrow some or all of its requested amounts at any particular time. At September 30, 2021, the AMT-Free Fund had a balance outstanding pursuant to this line of credit of $60,000 at an interest rate of 1.33%. Based on the short-term nature of the borrowings under the line of credit and variable interest rate, the carrying value of the borrowings approximated its fair value at September 30, 2021. If measured at fair value, borrowings under the line of credit would have been considered as Level 2 in the fair value hierarchy (see Note 10) at September 30, 2021. The Funds’ average borrowings or allocated fees during the year ended September 30, 2021 were not significant.
Effective October 26, 2021, the Funds renewed their line of credit agreement, which expires October 25, 2022, at substantially the same terms.
10 Fair Value Measurements
Under generally accepted accounting principles for fair value measurements, a three-tier hierarchy to prioritize the assumptions, referred to as inputs, is used in valuation techniques to measure fair value. The three-tier hierarchy of inputs is summarized in the three broad levels listed below.
| • | | Level 1 – quoted prices in active markets for identical investments |
| • | | Level 2 – other significant observable inputs (including quoted prices for similar investments, interest rates, prepayment speeds, credit risk, etc.) |
| • | | Level 3 – significant unobservable inputs (including a fund’s own assumptions in determining the fair value of investments) |
In cases where the inputs used to measure fair value fall in different levels of the fair value hierarchy, the level disclosed is determined based on the lowest level input that is significant to the fair value measurement in its entirety. The inputs or methodology used for valuing securities are not necessarily an indication of the risk associated with investing in those securities.
Eaton Vance
Municipal Income Funds
September 30, 2021
Notes to Financial Statements — continued
At September 30, 2021, the hierarchy of inputs used in valuing the Funds’ investments and open derivative instruments, which are carried at value, were as follows:
| | | | | | | | | | | | | | | | |
AMT-Free Fund | |
| Asset Description | | Level 1 | | | Level 2 | | | Level 3 | | | Total | |
| | | | |
Tax-Exempt Mortgage-Backed Securities | | $ | — | | | $ | 1,253,151 | | | $ | — | | | $ | 1,253,151 | |
| | | | |
Tax-Exempt Municipal Obligations | | | — | | | | 369,140,512 | | | | — | | | | 369,140,512 | |
| | | | |
Total Investments | | $ | — | | | $ | 370,393,663 | | | $ | — | | | $ | 370,393,663 | |
|
National Fund | |
| Asset Description | | Level 1 | | | Level 2 | | | Level 3 | | | Total | |
| | | | |
Corporate Bonds | | $ | — | | | $ | 25,024,631 | | | $ | — | | | $ | 25,024,631 | |
| | | | |
Tax-Exempt Municipal Obligations | | | — | | | | 3,789,159,836 | | | | — | | | | 3,789,159,836 | |
| | | | |
Taxable Municipal Obligations | | | — | | | | 230,909,866 | | | | — | | | | 230,909,866 | |
| | | | |
Total Investments | | $ | — | | | $ | 4,045,094,333 | | | $ | — | | | $ | 4,045,094,333 | |
| | | | |
Futures Contracts | | $ | 4,023,456 | | | $ | — | | | $ | — | | | $ | 4,023,456 | |
| | | | |
Total | | $ | 4,023,456 | | | $ | 4,045,094,333 | | | $ | — | | | $ | 4,049,117,789 | |
11 Risks and Uncertainties
Pandemic Risk
An outbreak of respiratory disease caused by a novel coronavirus was first detected in China in late 2019 and subsequently spread internationally. This coronavirus has resulted in closing borders, enhanced health screenings, changes to healthcare service preparation and delivery, quarantines, cancellations, disruptions to supply chains and customer activity, as well as general concern and uncertainty. Health crises caused by outbreaks, such as the coronavirus outbreak, may exacerbate other pre-existing political, social and economic risks and disrupt normal market conditions and operations. The impact of this outbreak has negatively affected the worldwide economy, the economies of individual countries, individual companies, and the market in general, and may continue to do so in significant and unforeseen ways, as may other epidemics and pandemics that may arise in the future. Any such impact could adversely affect the Funds’ performance, or the performance of the securities in which the Funds invest.
Eaton Vance
AMT-Free Municipal Income Fund
September 30, 2021
Report of Independent Registered Public Accounting Firm
To the Trustees of Eaton Vance Mutual Funds Trust and Shareholders of Eaton Vance AMT-Free Municipal Income Fund:
Opinion on the Financial Statements and Financial Highlights
We have audited the accompanying statement of assets and liabilities of Eaton Vance AMT-Free Municipal Income Fund (the “Fund”) (one of the funds constituting Eaton Vance Mutual Funds Trust), including the portfolio of investments, as of September 30, 2021, the related statement of operations for the year then ended, the statements of changes in net assets for each of the two years in the period then ended, the financial highlights for each of the five years in the period then ended, and the related notes. In our opinion, the financial statements and financial highlights present fairly, in all material respects, the financial position of the Fund as of September 30, 2021, and the results of its operations for the year then ended, the changes in its net assets for each of the two years in the period then ended, and the financial highlights for each of the five years in the period then ended, in conformity with accounting principles generally accepted in the United States of America.
Basis for Opinion
These financial statements and financial highlights are the responsibility of the Fund’s management. Our responsibility is to express an opinion on the Fund’s financial statements and financial highlights based on our audits. We are a public accounting firm registered with the Public Company Accounting Oversight Board (United States) (PCAOB) and are required to be independent with respect to the Fund in accordance with the U.S. federal securities laws and the applicable rules and regulations of the Securities and Exchange Commission and the PCAOB.
We conducted our audits in accordance with the standards of the PCAOB. Those standards require that we plan and perform the audit to obtain reasonable assurance about whether the financial statements and financial highlights are free of material misstatement, whether due to error or fraud. The Fund is not required to have, nor were we engaged to perform, an audit of its internal control over financial reporting. As part of our audits we are required to obtain an understanding of internal control over financial reporting but not for the purpose of expressing an opinion on the effectiveness of the Fund’s internal control over financial reporting. Accordingly, we express no such opinion.
Our audits included performing procedures to assess the risks of material misstatement of the financial statements and financial highlights, whether due to error or fraud, and performing procedures that respond to those risks. Such procedures included examining, on a test basis, evidence regarding the amounts and disclosures in the financial statements and financial highlights. Our audits also included evaluating the accounting principles used and significant estimates made by management, as well as evaluating the overall presentation of the financial statements and financial highlights. Our procedures included confirmation of securities owned as of September 30, 2021, by correspondence with the custodian and brokers; when replies were not received from brokers, we performed other auditing procedures. We believe that our audits provide a reasonable basis for our opinion.
/s/ Deloitte & Touche LLP
Boston, Massachusetts
November 19, 2021
We have served as the auditor of one or more Eaton Vance investment companies since 1959.
Eaton Vance
National Municipal Income Fund
September 30, 2021
Report of Independent Registered Public Accounting Firm
To the Trustees of Eaton Vance Municipals Trust and Shareholders of Eaton Vance National Municipal Income Fund:
Opinion on the Financial Statements and Financial Highlights
We have audited the accompanying statement of assets and liabilities of Eaton Vance National Municipal Income Fund (the “Fund”) (one of the funds constituting Eaton Vance Municipals Trust), including the portfolio of investments, as of September 30, 2021, the related statement of operations for the year then ended, the statements of changes in net assets for each of the two years in the period then ended, the financial highlights for each of the five years in the period then ended, and the related notes. In our opinion, the financial statements and financial highlights present fairly, in all material respects, the financial position of the Fund as of September 30, 2021, and the results of its operations for the year then ended, the changes in its net assets for each of the two years in the period then ended, and the financial highlights for each of the five years in the period then ended, in conformity with accounting principles generally accepted in the United States of America.
Basis for Opinion
These financial statements and financial highlights are the responsibility of the Fund’s management. Our responsibility is to express an opinion on the Fund’s financial statements and financial highlights based on our audits. We are a public accounting firm registered with the Public Company Accounting Oversight Board (United States) (PCAOB) and are required to be independent with respect to the Fund in accordance with the U.S. federal securities laws and the applicable rules and regulations of the Securities and Exchange Commission and the PCAOB.
We conducted our audits in accordance with the standards of the PCAOB. Those standards require that we plan and perform the audit to obtain reasonable assurance about whether the financial statements and financial highlights are free of material misstatement, whether due to error or fraud. The Fund is not required to have, nor were we engaged to perform, an audit of its internal control over financial reporting. As part of our audits we are required to obtain an understanding of internal control over financial reporting but not for the purpose of expressing an opinion on the effectiveness of the Fund’s internal control over financial reporting. Accordingly, we express no such opinion.
Our audits included performing procedures to assess the risks of material misstatement of the financial statements and financial highlights, whether due to error or fraud, and performing procedures that respond to those risks. Such procedures included examining, on a test basis, evidence regarding the amounts and disclosures in the financial statements and financial highlights. Our audits also included evaluating the accounting principles used and significant estimates made by management, as well as evaluating the overall presentation of the financial statements and financial highlights. Our procedures included confirmation of securities owned as of September 30, 2021, by correspondence with the custodian and brokers; when replies were not received from brokers, we performed other auditing procedures. We believe that our audits provide a reasonable basis for our opinion.
/s/ Deloitte & Touche LLP
Boston, Massachusetts
November 19, 2021
We have served as the auditor of one or more Eaton Vance investment companies since 1959.
Eaton Vance
Municipal Income Funds
September 30, 2021
Federal Tax Information (Unaudited)
The Form 1099-DIV you receive in February 2022 will show the tax status of all distributions paid to your account in calendar year 2021. Shareholders are advised to consult their own tax adviser with respect to the tax consequences of their investment in the Funds. As required by the Internal Revenue Code and/or regulations, shareholders must be notified regarding exempt-interest dividends.
Exempt-Interest Dividends. For the fiscal year ended September 30, 2021, the Funds designate the following percentages of distributions from net investment income as exempt-interest dividends:
| | | | |
| |
AMT-Free Municipal Income Fund | | | 99.87 | % |
| |
National Municipal Income Fund | | | 93.03 | % |
Eaton Vance
Municipal Income Funds
September 30, 2021
Liquidity Risk Management Program
Each Fund has implemented a written liquidity risk management program (Program) and related procedures to manage its liquidity in accordance with Rule 22e-4 under the Investment Company Act of 1940, as amended (Liquidity Rule). The Liquidity Rule defines “liquidity risk” as the risk that a fund could not meet requests to redeem shares issued by the fund without significant dilution of the remaining investors’ interests in the fund. Each Fund’s Board of Trustees/Directors has designated the investment adviser to serve as the administrator of the Program and the related procedures. The administrator has established a Liquidity Risk Management Oversight Committee (Committee) to perform the functions necessary to administer the Program. As part of the Program, the administrator is responsible for identifying illiquid investments and categorizing the relative liquidity of each Fund’s investments in accordance with the Liquidity Rule. Under the Program, the administrator assesses, manages, and periodically reviews each Fund’s liquidity risk, and is responsible for making certain reports to the Fund’s Board of Trustees/Directors and the Securities and Exchange Commission (SEC) regarding the liquidity of the Fund’s investments, and to notify the Board of Trustees/Directors and the SEC of certain liquidity events specified in the Liquidity Rule. The liquidity of each Fund’s portfolio investments is determined based on a number of factors including, but not limited to, relevant market, trading and investment-specific considerations under the Program.
At a meeting of each Fund’s Board of Trustees/Directors on June 8, 2021, the Committee provided a written report to the Fund’s Board of Trustees/Directors pertaining to the operation, adequacy, and effectiveness of implementation of the Program, as well as the operation of the highly liquid investment minimum (if applicable) for the period January 1, 2020 through December 31, 2020 (Review Period). The Program operated effectively during the Review Period, supporting the administrator’s ability to assess, manage and monitor Fund liquidity risk, including during periods of market volatility and net redemptions. During the Review Period, each Fund met redemption requests on a timely basis.
There can be no assurance that the Program will achieve its objectives in the future. Please refer to each Fund’s prospectus for more information regarding the Fund’s exposure to liquidity risk and other principal risks to which an investment in the Fund may be subject.
Eaton Vance
Municipal Income Funds
September 30, 2021
Management and Organization
Fund Management. The Trustees of Eaton Vance Municipals Trust and Eaton Vance Mutual Funds Trust (collectively, the Trusts) are responsible for the overall management and supervision of the Trusts’ affairs. The Trustees and officers of the Trusts are listed below. Except as indicated, each individual has held the office shown or other offices in the same company for the last five years. Trustees and officers of the Trusts hold indefinite terms of office. The “Noninterested Trustees” consist of those Trustees who are not “interested persons” of the Trusts, as that term is defined under the 1940 Act. The business address of each Trustee and officer is Two International Place, Boston, Massachusetts 02110. As used below, “EVC” refers to Eaton Vance Corp., “EV” refers to EV LLC, “EVM” refers to Eaton Vance Management, “BMR” refers to Boston Management and Research and “EVD” refers to Eaton Vance Distributors, Inc. EV is the trustee of each of EVM and BMR. Effective March 1, 2021, each of EVM, BMR, EVD and EV are indirect, wholly owned subsidiaries of Morgan Stanley. Each officer affiliated with EVM may hold a position with other EVM affiliates that is comparable to his or her position with EVM listed below. Each Trustee oversees 138 portfolios (with the exception of Messrs. Faust and Wennerholm and Ms. Frost who oversee 137 portfolios) in the Eaton Vance Complex (including all master and feeder funds in a master feeder structure). Each officer serves as an officer of certain other Eaton Vance funds. Each Trustee and officer serves until his or her successor is elected.
| | | | | | |
| Name and Year of Birth | | Trust
Position(s) | | Trustee Since(1) | | Principal Occupation(s) and Other Directorships During Past Five Years and Other Relevant Experience |
|
| Interested Trustee |
| | | |
Thomas E. Faust Jr. 1958 | | Trustee | | 2007 | | Chairman of Morgan Stanley Investment Management, Inc. (MSIM), member of the Board of Managers and President of EV, Chief Executive Officer of EVM and BMR, and Director of EVD. Formerly, Chairman, Chief Executive Officer and President of EVC. Trustee and/or officer of 137 registered investment companies. Mr. Faust is an interested person because of his positions with MSIM, BMR, EVM, EVD, and EV, which are affiliates of the Trust, and his former position with EVC, which was an affiliate of the Trust prior to March 1, 2021. Other Directorships in the Last Five Years. Formerly, Director of EVC (2007-2021) and Hexavest Inc. (investment management firm) (2012-2021). |
|
| Noninterested Trustees |
| | | |
Mark R. Fetting 1954 | | Trustee | | 2016 | | Private investor. Formerly held various positions at Legg Mason, Inc. (investment management firm) (2000-2012), including President, Chief Executive Officer, Director and Chairman (2008-2012), Senior Executive Vice President (2004-2008) and Executive Vice President (2001-2004). Formerly, President of Legg Mason family of funds (2001-2008). Formerly, Division President and Senior Officer of Prudential Financial Group, Inc. and related companies (investment management firm) (1991-2000). Other Directorships in the Last Five Years. None. |
| | | |
Cynthia E. Frost 1961 | | Trustee | | 2014 | | Private investor. Formerly, Chief Investment Officer of Brown University (university endowment) (2000-2012). Formerly, Portfolio Strategist for Duke Management Company (university endowment manager) (1995-2000). Formerly, Managing Director, Cambridge Associates (investment consulting company) (1989-1995). Formerly, Consultant, Bain and Company (management consulting firm) (1987-1989). Formerly, Senior Equity Analyst, BA Investment Management Company (1983-1985). Other Directorships in the Last Five Years. None. |
| | | |
George J. Gorman 1952 | | Chairperson of the Board and Trustee | | 2021 (Chairperson) and 2014 (Trustee) | | Principal at George J. Gorman LLC (consulting firm). Formerly, Senior Partner at Ernst & Young LLP (a registered public accounting firm) (1974-2009). Other Directorships in the Last Five Years. None. |
| | | |
Valerie A. Mosley 1960 | | Trustee | | 2014 | | Chairwoman and Chief Executive Officer of Valmo Ventures (a consulting and investment firm). Founder of Upward Wealth, Inc., dba BrightUP, a fintech platform. Formerly, Partner and Senior Vice President, Portfolio Manager and Investment Strategist at Wellington Management Company, LLP (investment management firm) (1992-2012). Formerly, Chief Investment Officer, PG Corbin Asset Management (1990-1992). Formerly worked in institutional corporate bond sales at Kidder Peabody (1986-1990). Other Directorships in the Last Five Years. Director of DraftKings, Inc. (digital sports entertainment and gaming company) (since September 2020). Director of Groupon, Inc. (e-commerce provider) (since April 2020). Director of Envestnet, Inc. (provider of intelligent systems for wealth management and financial wellness) (since 2018). Formerly, Director of Dynex Capital, Inc. (mortgage REIT) (2013-2020). |
Eaton Vance
Municipal Income Funds
September 30, 2021
Management and Organization — continued
| | | | | | |
| Name and Year of Birth | | Trust
Position(s) | | Trustee Since(1) | | Principal Occupation(s) and Other Directorships During Past Five Years and Other Relevant Experience |
|
| Noninterested Trustees (continued) |
| | | |
William H. Park 1947 | | Trustee | | 2003 | | Private investor. Formerly, Consultant (management and transactional) (2012-2014). Formerly, Chief Financial Officer, Aveon Group L.P. (investment management firm) (2010-2011). Formerly, Vice Chairman, Commercial Industrial Finance Corp. (specialty finance company) (2006-2010). Formerly, President and Chief Executive Officer, Prizm Capital Management, LLC (investment management firm) (2002-2005). Formerly, Executive Vice President and Chief Financial Officer, United Asset Management Corporation (investment management firm) (1982-2001). Formerly, Senior Manager, Price Waterhouse (now PricewaterhouseCoopers) (a registered public accounting firm) (1972-1981). Other Directorships in the Last Five Years. None. |
| | | |
Helen Frame Peters 1948 | | Trustee | | 2008 | | Professor of Finance, Carroll School of Management, Boston College. Formerly, Dean, Carroll School of Management, Boston College (2000-2002). Formerly, Chief Investment Officer, Fixed Income, Scudder Kemper Investments (investment management firm) (1998-1999). Formerly, Chief Investment Officer, Equity and Fixed Income, Colonial Management Associates (investment management firm) (1991-1998). Other Directorships in the Last Five Years. None. |
| | | |
Keith Quinton 1958 | | Trustee | | 2018 | | Private investor, researcher and lecturer. Formerly, Independent Investment Committee Member at New Hampshire Retirement System (2017-2021). Formerly, Portfolio Manager and Senior Quantitative Analyst at Fidelity Investments (investment management firm) (2001-2014). Other Directorships in the Last Five Years. Formerly, Director (2016-2021) and Chairman (2019-2021) of New Hampshire Municipal Bond Bank. |
| | | |
Marcus L. Smith 1966 | | Trustee | | 2018 | | Private investor. Formerly, Portfolio Manager at MFS Investment Management (investment management firm) (1994-2017). Other Directorships in the Last Five Years. Director of First Industrial Realty Trust, Inc. (an industrial REIT) (since 2021). Director of MSCI Inc. (global provider of investment decision support tools) (since 2017). Formerly, Director of DCT Industrial Trust Inc. (logistics real estate company) (2017-2018). |
| | | |
Susan J. Sutherland 1957 | | Trustee | | 2015 | | Private investor. Director of Ascot Group Limited and certain of its subsidiaries (insurance and reinsurance) (since 2017). Formerly, Director of Hagerty Holding Corp. (insurance) (2015-2018) and Montpelier Re Holdings Ltd. (insurance and reinsurance) (2013-2015). Formerly, Associate, Counsel and Partner at Skadden, Arps, Slate, Meagher & Flom LLP (law firm) (1982-2013). Other Directorships in the Last Five Years. Director of Kairos Acquisition Corp. (insurance/InsurTech acquisition company) (since 2021). |
| | | |
Scott E. Wennerholm 1959 | | Trustee | | 2016 | | Private investor. Formerly, Trustee at Wheelock College (postsecondary institution) (2012-2018). Formerly, Consultant at GF Parish Group (executive recruiting firm) (2016-2017). Formerly, Chief Operating Officer and Executive Vice President at BNY Mellon Asset Management (investment management firm) (2005-2011). Formerly, Chief Operating Officer and Chief Financial Officer at Natixis Global Asset Management (investment management firm) (1997-2004). Formerly, Vice President at Fidelity Investments Institutional Services (investment management firm) (1994-1997). Other Directorships in the Last Five Years. None. |
| | | | | | |
| Name and Year of Birth | | Trust
Position(s) | | Officer
Since(2) | | Principal Occupation(s) During Past Five Years |
|
| Principal Officers who are not Trustees |
| | | |
Eric A. Stein 1980 | | President | | 2020 | | Vice President and Chief Investment Officer, Fixed Income of EVM and BMR. Prior to November 1, 2020, Mr. Stein was a co-Director of Eaton Vance’s Global Income Investments. Also Vice President of Calvert Research and Management (“CRM”). |
| | | |
Deidre E. Walsh 1971 | | Vice President and Chief Legal Officer | | 2009 | | Vice President of EVM and BMR. Also Vice President of CRM. |
Eaton Vance
Municipal Income Funds
September 30, 2021
Management and Organization — continued
| | | | | | |
| Name and Year of Birth | | Trust
Position(s) | | Officer
Since(2) | | Principal Occupation(s) During Past Five Years |
|
| Principal Officers who are not Trustees (continued) |
| | | |
James F. Kirchner 1967 | | Treasurer | | 2007 | | Vice President of EVM and BMR. Also Vice President of CRM. |
| | | |
Kimberly M. Roessiger 1985 | | Secretary | | 2021 | | Vice President of EVM and BMR. |
| | | |
Richard F. Froio 1968 | | Chief Compliance Officer | | 2017 | | Vice President of EVM and BMR since 2017. Formerly Deputy Chief Compliance Officer (Adviser/Funds) and Chief Compliance Officer (Distribution) at PIMCO (2012-2017) and Managing Director at BlackRock/Barclays Global Investors (2009-2012). |
| (1) | Year first appointed to serve as Trustee for a fund in the Eaton Vance family of funds. Each Trustee has served continuously since appointment unless indicated otherwise. |
| (2) | Year first elected to serve as officer of a fund in the Eaton Vance family of funds when the officer has served continuously. Otherwise, year of most recent election as an officer of a fund in the Eaton Vance family of funds. Titles may have changed since initial election. |
The SAI for the Funds includes additional information about the Trustees and officers of the Funds and can be obtained without charge on Eaton Vance’s website at www.eatonvance.com or by calling 1-800-262-1122.
Eaton Vance Funds
| | |
| Privacy Notice | | April 2021 |
| | |
| |
| FACTS | | WHAT DOES EATON VANCE DO WITH YOUR
PERSONAL INFORMATION? |
| | | |
| |
| | |
| Why? | | Financial companies choose how they share your personal information. Federal law gives consumers the right to limit some but not all sharing. Federal law also requires us to tell you how we collect, share, and protect your personal information. Please read this notice carefully to understand what we do. |
| | |
| | | |
| What? | | The types of personal information we collect and share depend on the product or service you have with us. This information can include: ∎ Social Security number and income ∎ investment experience and risk tolerance ∎ checking account number and wire transfer instructions |
| | |
| | | |
| How? | | All financial companies need to share customers’ personal information to run their everyday business. In the section below, we list the reasons financial companies can share their customers’ personal information; the reasons Eaton Vance chooses to share; and whether you can limit this sharing. |
| | |
| | | |
| | | | |
Reasons we can share your
personal information | | Does Eaton Vance share? | | Can you limit this sharing? |
| For our everyday business purposes — such as to process your transactions, maintain your account(s), respond to court orders and legal investigations, or report to credit bureaus | | Yes | | No |
| For our marketing purposes — to offer our products and services to you | | Yes | | No |
| For joint marketing with other financial companies | | No | | We don’t share |
| For our investment management affiliates’ everyday business purposes — information about your transactions, experiences, and creditworthiness | | Yes | | Yes |
| For our affiliates’ everyday business purposes — information about your transactions and experiences | | Yes | | No |
| For our affiliates’ everyday business purposes — information about your creditworthiness | | No | | We don’t share |
| For our investment management affiliates to market to you | | Yes | | Yes |
| For our affiliates to market to you | | No | | We don’t share |
| For nonaffiliates to market to you | | No | | We don’t share |
| | |
| To limit our sharing | | Call toll-free 1-800-262-1122 or email: EVPrivacy@eatonvance.com Please note: If you are a new customer, we can begin sharing your information 30 days from the date we sent this notice. When you are no longer our customer, we continue to share your information as described in this notice. However, you can contact us at any time to limit our sharing. |
| | |
| | | |
| | |
| Questions? | | Call toll-free 1-800-262-1122 or email: EVPrivacy@eatonvance.com |
| | |
| | | |
Eaton Vance Funds
| | |
| Privacy Notice — continued | | April 2021 |
| | |
| Who we are |
| Who is providing this notice? | | Eaton Vance Management, Eaton Vance Distributors, Inc., Eaton Vance Trust Company, Eaton Vance Management (International) Limited, Eaton Vance Advisers International Ltd., Eaton Vance Global Advisors Limited, Eaton Vance Management’s Real Estate Investment Group, Boston Management and Research, Calvert Research and Management, Eaton Vance and Calvert Fund Families and our investment advisory affiliates (“Eaton Vance”) (see Investment Management Affiliates definition below) |
| What we do |
| How does Eaton Vance protect my personal information? | | To protect your personal information from unauthorized access and use, we use security measures that comply with federal law. These measures include computer safeguards and secured files and buildings. We have policies governing the proper handling of customer information by personnel and requiring third parties that provide support to adhere to appropriate security standards with respect to such information. |
| How does Eaton Vance collect my personal information? | | We collect your personal information, for example, when you ∎ open an account or make deposits or withdrawals from your account ∎ buy securities from us or make a wire transfer ∎ give us your contact information We also collect your personal information from others, such as credit bureaus, affiliates, or other companies. |
| Why can’t I limit all sharing? | | Federal law gives you the right to limit only ∎ sharing for affiliates’ everyday business purposes — information about your creditworthiness ∎ affiliates from using your information to market to you ∎ sharing for nonaffiliates to market to you State laws and individual companies may give you additional rights to limit sharing. See below for more on your rights under state law. |
| Definitions |
| Investment Management Affiliates | | Eaton Vance Investment Management Affiliates include registered investment advisers, registered broker-dealers, and registered and unregistered funds. Investment Management Affiliates does not include entities associated with Morgan Stanley Wealth Management, such as Morgan Stanley Smith Barney LLC and Morgan Stanley & Co. |
| Affiliates | | Companies related by common ownership or control. They can be financial and nonfinancial companies. ∎ Our affiliates include companies with a Morgan Stanley name and financial companies such as Morgan Stanley Smith Barney LLC and Morgan Stanley & Co. |
| Nonaffiliates | | Companies not related by common ownership or control. They can be financial and nonfinancial companies. ∎ Eaton Vance does not share with nonaffiliates so they can market to you. |
| Joint marketing | | A formal agreement between nonaffiliated financial companies that together market financial products or services to you. ∎ Eaton Vance doesn’t jointly market. |
| Other important information |
Vermont: Except as permitted by law, we will not share personal information we collect about Vermont residents with Nonaffiliates unless you provide us with your written consent to share such information. California: Except as permitted by law, we will not share personal information we collect about California residents with Nonaffiliates and we will limit sharing such personal information with our Affiliates to comply with California privacy laws that apply to us. |
Eaton Vance Funds
IMPORTANT NOTICES
Delivery of Shareholder Documents. The Securities and Exchange Commission (SEC) permits funds to deliver only one copy of shareholder documents, including prospectuses, proxy statements and shareholder reports, to fund investors with multiple accounts at the same residential or post office box address. This practice is often called “householding” and it helps eliminate duplicate mailings to shareholders. Eaton Vance, or your financial intermediary, may household the mailing of your documents indefinitely unless you instruct Eaton Vance, or your financial intermediary, otherwise. If you would prefer that your Eaton Vance documents not be householded, please contact Eaton Vance at 1-800-262-1122, or contact your financial intermediary. Your instructions that householding not apply to delivery of your Eaton Vance documents will typically be effective within 30 days of receipt by Eaton Vance or your financial intermediary.
Portfolio Holdings. Each Eaton Vance Fund and its underlying Portfolio(s) (if applicable) files a schedule of portfolio holdings on Part F to Form N-PORT with the SEC. Certain information filed on Form N-PORT may be viewed on the Eaton Vance website at www.eatonvance.com, by calling Eaton Vance at 1-800-262-1122 or in the EDGAR database on the SEC’s website at www.sec.gov.
Proxy Voting. From time to time, funds are required to vote proxies related to the securities held by the funds. The Eaton Vance Funds or their underlying Portfolios (if applicable) vote proxies according to a set of policies and procedures approved by the Funds’ and Portfolios’ Boards. You may obtain a description of these policies and procedures and information on how the Funds or Portfolios voted proxies relating to portfolio securities during the most recent 12-month period ended June 30, without charge, upon request, by calling 1-800-262-1122 and by accessing the SEC’s website at www.sec.gov.
This Page Intentionally Left Blank
This Page Intentionally Left Blank
Investment Advisers
AMT-Free Municipal Income Fund
Eaton Vance Management
Two International Place
Boston, MA 02110
National Municipal Income Fund
Boston Management and Research
Two International Place
Boston, MA 02110
Administrator
Eaton Vance Management
Two International Place
Boston, MA 02110
Principal Underwriter*
Eaton Vance Distributors, Inc.
Two International Place
Boston, MA 02110
(617) 482-8260
Custodian
State Street Bank and Trust Company
State Street Financial Center, One Lincoln Street
Boston, MA 02111
Transfer Agent
BNY Mellon Investment Servicing (US) Inc.
Attn: Eaton Vance Funds
P.O. Box 9653
Providence, RI 02940-9653
(800) 262-1122
Independent Registered Public Accounting Firm
Deloitte & Touche LLP
200 Berkeley Street
Boston, MA 02116-5022
Fund Offices
Two International Place
Boston, MA 02110
| * | FINRA BrokerCheck. Investors may check the background of their Investment Professional by contacting the Financial Industry Regulatory Authority (FINRA). FINRA BrokerCheck is a free tool to help investors check the professional background of current and former FINRA-registered securities firms and brokers. FINRA BrokerCheck is available by calling 1-800-289-9999 and at www.FINRA.org. The FINRA BrokerCheck brochure describing this program is available to investors at www.FINRA.org. |

448 9.30.21
Item 2. Code of Ethics
The registrant (sometimes referred to as the “Fund”) has adopted a code of ethics applicable to its Principal Executive Officer, Principal Financial Officer and Principal Accounting Officer. The registrant undertakes to provide a copy of such code of ethics to any person upon request, without charge, by calling 1-800-262-1122. The registrant has not amended the code of ethics as described in Form N-CSR during the period covered by this report. The registrant has not granted any waiver, including an implicit waiver, from a provision of the code of ethics as described in Form N-CSR during the period covered by this report.
Item 3. Audit Committee Financial Expert
The registrant’s Board of Trustees (the “Board”) has designated George J. Gorman and William H. Park, each an independent trustee, as audit committee financial experts. Mr. Gorman is a certified public accountant who is the Principal at George J. Gorman LLC (a consulting firm). Previously, Mr. Gorman served in various capacities at Ernst & Young LLP (a registered public accounting firm), including as Senior Partner.
Mr. Gorman also has experience serving as an independent trustee and audit committee financial expert of other mutual fund complexes. Mr. Park is a certified public accountant who is a private investor. Previously, he served as a consultant, as the Chief Financial Officer of Aveon Group, L.P. (an investment management firm), as the Vice Chairman of Commercial Industrial Finance Corp. (specialty finance company), as President and Chief Executive Officer of Prizm Capital Management, LLC (investment management firm), as Executive Vice President and Chief Financial Officer of United Asset Management Corporation (an institutional investment management firm) and as a Senior Manager at Price Waterhouse (now PricewaterhouseCoopers) (a registered public accounting firm).
Item 4. Principal Accountant Fees and Services
Eaton Vance AMT-Free Municipal Income Fund and Eaton Vance Total Return Bond Fund (formerly, Eaton Vance Core Plus Bond Fund) (the “Fund(s)”) are series of Eaton Vance Mutual Funds Trust (the “Trust”), a Massachusetts business trust, which, including the Funds, contains a total of 34 series (the “Series”). The Trust is registered under the Investment Company Act of 1940 as an open-end management investment company. This Form N-CSR relates to the Funds’ annual reports.
(a)-(d)
The following tables present the aggregate fees billed to each Fund for the Funds’ fiscal years ended September 30, 2020 and September 30, 2021 by the Funds’ principal accountant, Deloitte and Touche LLP (“D&T”), for professional services rendered for the audit of the Funds’ annual financial statements and fees billed for other services rendered by D&T during those periods.
Eaton Vance AMT-Free Municipal Income Fund
| | | | | | | | |
Fiscal Years Ended | | 9/30/20 | | | 9/30/21 | |
Audit Fees | | $ | 50,550 | | | $ | 50,550 | |
Audit-Related Fees(1) | | $ | 0 | | | $ | 0 | |
Tax Fees(2) | | $ | 12,441 | | | $ | 11,591 | |
All Other Fees(3) | | $ | 0 | | | $ | 0 | |
| | | | | | | | |
Total | | $ | 62,991 | | | $ | 62,141 | |
| | | | | | | | |
Eaton Vance Total Return Bond Fund (formerly, Eaton Vance Core Plus Bond Fund)
| | | | | | | | |
Fiscal Years Ended | | 9/30/20 | | | 9/30/21 | |
Audit Fees | | $ | 60,250 | | | $ | 41,050 | |
Audit-Related Fees(1) | | $ | 0 | | | $ | 0 | |
Tax Fees(2) | | $ | 12,507 | | | $ | 11,657 | |
All Other Fees(3) | | $ | 0 | | | $ | 0 | |
| | | | | | | | |
Total | | $ | 72,757 | | | $ | 52,707 | |
| | | | | | | | |
| (1) | Audit-related fees consist of the aggregate fees billed for assurance and related services that are reasonably related to the performance of the audit of the registrant’s financial statements and are not reported under the category of audit fees. |
| (2) | Tax fees consist of the aggregate fees billed for professional services rendered by the principal accountant relating to tax compliance, tax advice, and tax planning and specifically include fees for tax return preparation and other related tax compliance/planning matters. |
| (3) | All other fees consist of the aggregate fees billed for products and services provided by the principal accountant other than audit, audit-related, and tax services. |
The various Series comprising the Trust have differing fiscal year ends (January 31, February 28/29, September 30, October 31 or December 31). The following table presents the aggregate audit, audit-related, tax, and other fees billed to all of the Series in the Trust by D&T for the last two fiscal years of each Series.
| | | | | | | | | | | | | | | | | | | | | | | | | | | | | | | | | | | | | | | | |
Fiscal Years Ended | | 10/31/19 | | | 12/31/19 | | | 1/31/20 | | | 2/29/20 | | | 9/30/20 | | | 10/31/20 | | | 12/31/20 | | | 1/31/21 | | | 2/28/21 | | | 9/30/21 | |
Audit Fees | | $ | 661,708 | | | $ | 106,700 | | | $ | 156,850 | | | $ | 26,250 | | | $ | 110,800 | | | $ | 719,575 | | | $ | 106,700 | | | $ | 201,300 | | | $ | 26,250 | | | $ | 91,600 | |
Audit-Related Fees(1) | | $ | 0 | | | $ | 0 | | | $ | 0 | | | $ | 0 | | | $ | 0 | | | $ | 0 | | | $ | 0 | | | $ | 0 | | | $ | 0 | | | $ | 0 | |
Tax Fees(2) | | $ | 345,480 | | | $ | 63,478 | | | $ | 69,073 | | | $ | 11,413 | | | $ | 24,948 | | | $ | 260,719 | | | $ | 60,338 | | | $ | 73,973 | | | $ | 10,103 | | | $ | 23,248 | |
All Other Fees(3) | | $ | 0 | | | $ | 0 | | | $ | 0 | | | $ | 0 | | | $ | 0 | | | $ | 0 | | | $ | 0 | | | $ | 0 | | | $ | 0 | | | $ | 0 | |
| | | | | | | | | | | | | | | | | | | | | | | | | | | | | | | | | | | | | | | | |
Total | | $ | 1,007,188 | | | $ | 170,178 | | | $ | 225,923 | | | $ | 37,663 | | | $ | 135,748 | | | $ | 980,294 | | | $ | 167,038 | | | $ | 275,273 | | | $ | 36,353 | | | $ | 114,848 | |
| | | | | | | | | | | | | | | | | | | | | | | | | | | | | | | | | | | | | | | | |
| (1) | Audit-related fees consist of the aggregate fees billed for assurance and related services that are reasonably related to the performance of the audit of the registrant’s financial statements and are not reported under the category of audit fees. |
| (2) | Tax fees consist of the aggregate fees billed for professional services rendered by the principal accountant relating to tax compliance, tax advice, and tax planning and specifically include fees for tax return preparation and other related tax compliance/planning matters. |
| (3) | All other fees consist of the aggregate fees billed for products and services provided by the principal accountant other than audit, audit-related, and tax services. |
(e)(1) The registrant’s audit committee has adopted policies and procedures relating to the pre-approval of services provided by the registrant’s principal accountant (the “Pre-Approval Policies”). The Pre-Approval Policies establish a framework intended to assist the audit committee in the proper discharge of its pre-approval responsibilities. As a general matter, the Pre-Approval Policies (i) specify certain types of audit, audit-related, tax, and other services determined to be pre-approved by the audit committee; and (ii) delineate specific procedures governing the mechanics of the pre-approval process, including the approval and monitoring of audit and non-audit service fees. Unless a service is specifically pre-approved under the Pre-Approval Policies, it must be separately pre-approved by the audit committee.
The Pre-Approval Policies and the types of audit and non-audit services pre-approved therein must be reviewed and ratified by the registrant’s audit committee at least annually. The registrant’s audit committee maintains full responsibility for the appointment, compensation, and oversight of the work of the registrant’s principal accountant.
(e)(2) No services described in paragraphs (b)-(d) above were approved by the registrant’s audit committee pursuant to the “de minimis exception” set forth in Rule 2-01(c)(7)(i)(C) of Regulation S-X.
(f) Not applicable.
(g) The following table presents (i) the aggregate non-audit fees (i.e., fees for audit-related, tax, and other services) billed for services rendered to all of the Series in the Trust by D&T for the last two fiscal years of each Series; and (ii) the aggregate non-audit fees (i.e., fees for audit-related, tax, and other services) billed to the Eaton Vance organization by D&T for the last two fiscal years of each Series.
| | | | | | | | | | | | | | | | | | | | | | | | | | | | | | | | | | | | | | | | |
Fiscal Years Ended | | 10/31/19 | | | 12/31/19 | | | 1/31/20 | | | 2/29/20 | | | 9/30/20 | | | 10/31/20 | | | 12/31/20 | | | 1/31/21 | | | 2/28/21 | | | 9/30/21 | |
Registrant(1) | | $ | 430,938 | | | $ | 345,480 | | | $ | 63,478 | | | $ | 11,413 | | | $ | 24,948 | | | $ | 260,719 | | | $ | 60,338 | | | $ | 73,973 | | | $ | 10,103 | | | $ | 23,248 | |
Eaton Vance(2) | | $ | 126,485 | | | $ | 59,903 | | | $ | 59,903 | | | $ | 59,903 | | | $ | 51,800 | | | $ | 51,800 | | | $ | 150,300 | | | $ | 150,300 | | | $ | 150,300 | | | $ | 51,800 | |
| (1) | Includes all of the Series of the Trust. During the fiscal years reported above, certain of the Funds were “feeder” funds in a “master-feeder” fund structure or funds of funds. |
| (2) | Various subsidiaries of Morgan Stanley act in either an investment advisory and/or service provider capacity with respect to the Series and/or their respective “master” funds (if applicable). |
(h) The registrant’s audit committee has considered whether the provision by the registrant’s principal accountant of non-audit services to the registrant’s investment adviser and any entity controlling, controlled by, or under common control with the adviser that provides ongoing services to the registrant that were not pre-approved pursuant to Rule 2-01(c)(7)(ii) of Regulation S-X is compatible with maintaining the principal accountant’s independence.
Item 5. Audit Committee of Listed Registrants
Not applicable.
Item 6. Schedule of Investments
Please see schedule of investments contained in the Report to Stockholders included under Item 1 of this Form N-CSR.
Item 7. Disclosure of Proxy Voting Policies and Procedures for Closed-End Management Investment Companies
Not applicable.
Item 8. Portfolio Managers of Closed-End Management Investment Companies
Not applicable.
Item 9. Purchases of Equity Securities by Closed-End Management Investment Company and Affiliated Purchasers
Not applicable.
Item 10. Submission of Matters to a Vote of Security Holders
No material changes.
Item 11. Controls and Procedures
(a) It is the conclusion of the registrant’s principal executive officer and principal financial officer that the effectiveness of the registrant’s current disclosure controls and procedures (such disclosure controls and procedures having been evaluated within 90 days of the date of this filing) provide reasonable assurance that the information required to be disclosed by the registrant has been recorded, processed, summarized and reported within the time period specified in the Commission’s rules and forms and that the information required to be disclosed by the registrant has been accumulated and communicated to the registrant’s principal executive officer and principal financial officer in order to allow timely decisions regarding required disclosure.
(b) There have been no changes in the registrant’s internal controls over financial reporting during the period covered by this report that has materially affected, or is reasonably likely to materially affect, the registrant’s internal control over financial reporting.
Item 12. Disclosure of Securities Lending Activities for Closed-End Management Investment Companies
Not applicable.
Item 13. Exhibits
Signatures
Pursuant to the requirements of the Securities Exchange Act of 1934 and the Investment Company Act of 1940, the registrant has duly caused this report to be signed on its behalf by the undersigned, thereunto duly authorized.
| | |
| Eaton Vance Mutual Funds Trust |
| |
| By: | | /s/ Eric A. Stein |
| | Eric A. Stein |
| | President |
Date: November 22, 2021
Pursuant to the requirements of the Securities Exchange Act of 1934 and the Investment Company Act of 1940, this report has been signed below by the following persons on behalf of the registrant and in the capacities and on the dates indicated.
| | |
| By: | | /s/ James F. Kirchner |
| | James F. Kirchner |
| | Treasurer |
| |
| Date: | | November 22, 2021 |
| |
| By: | | /s/ Eric A. Stein |
| | Eric A. Stein |
| | President |
Date: November 22, 2021