UNITED STATES
SECURITIES AND EXCHANGE COMMISSION
Washington, D.C. 20549
Form N-CSR
CERTIFIED SHAREHOLDER REPORT OF REGISTERED
MANAGEMENT INVESTMENT COMPANIES
Investment Company Act File Number: 811-04015
Eaton Vance Mutual Funds Trust
(Exact Name of Registrant as Specified in Charter)
Two International Place, Boston, Massachusetts 02110
(Address of Principal Executive Offices)
Deidre E. Walsh
Two International Place, Boston, Massachusetts 02110
(Name and Address of Agent for Services)
(617) 482-8260
(Registrant’s Telephone Number)
December 31
Date of Fiscal Year End
December 31, 2021
Date of Reporting Period
Item 1. Reports to Stockholders

Eaton Vance
Stock Fund
Annual Report
December 31, 2021

Commodity Futures Trading Commission Registration. The Commodity Futures Trading Commission (“CFTC”) has adopted regulations that subject registered investment companies and advisers to regulation by the CFTC if a fund invests more than a prescribed level of its assets in certain CFTC-regulated instruments (including futures, certain options and swap agreements) or markets itself as providing investment exposure to such instruments. The investment adviser has claimed an exclusion from the definition of “commodity pool operator” under the Commodity Exchange Act with respect to its management of the Fund. Accordingly, neither the Fund nor the adviser with respect to the operation of the Fund is subject to CFTC regulation. Because of its management of other strategies, the Fund’s adviser is registered with the CFTC as a commodity pool operator. The adviser is also registered as a commodity trading advisor.
Fund shares are not insured by the FDIC and are not deposits or other obligations of, or guaranteed by, any depository institution. Shares are subject to investment risks, including possible loss of principal invested.
This report must be preceded or accompanied by a current summary prospectus or prospectus. Before investing, investors should consider carefully the investment objective, risks, and charges and expenses of a mutual fund. This and other important information is contained in the summary prospectus and prospectus, which can be obtained from a financial intermediary. Prospective investors should read the prospectus carefully before investing. For further information, please call 1-800-262-1122.
Annual Report December 31, 2021
Eaton Vance
Stock Fund
Eaton Vance
Stock Fund
December 31, 2021
Management’s Discussion of Fund Performance1
Economic and Market Conditions
The 12-month period starting January 1, 2021, was notable for a U.S. equity rally that lasted for most of the period and resulted in U.S. stocks outperforming most other stock markets in developed economies. Except for temporary retreats in September and November, broad-market indexes generally posted strong returns during the period. Investors cheered the reopening of businesses that had been affected by the pandemic and the rollout of several highly effective COVID-19 vaccines.
COVID-19, however, continued to have a firm grip on the U.S. economy. Disease rates advanced and declined with second, third, and fourth waves of infections. Worker shortages led to global supply-chain disruptions. From computer chips to shipping containers, scarcities of key items led to temporary factory shutdowns and empty store shelves. Those shortages — combined with high demand from consumers eager to spend money saved earlier in the pandemic — led to higher year-over-year inflation than the U.S. had seen in decades.
Still, investor optimism about a recovering economy drove stock prices up during most of the period. A significant pullback, however, occurred in September 2021 when virtually every major U.S. stock index reported negative returns. Unexpectedly weak job creation in August and the U.S. Federal Reserve’s (the Fed’s) announcement that it might soon begin tapering its monthly bond purchases — which had stimulated the economy earlier — combined to drive stocks into negative territory. Rising COVID-19 infections also weighed on equity performance in September.
In the final quarter of 2021, however, stock prices came roaring back. Even the late-November news of a new and more transmissible COVID-19 variant — Omicron — caused only a temporary market retreat. The Fed’s actions to tamp down inflation were applauded by investors, with stocks gaining ground after the central bank announced that tapering would be accelerated and that three possible interest rate hikes were forecast for 2022. Just two trading days before year-end, the S&P 500® Index closed at its 70th new all-time high for the period, and the Dow Jones Industrial Average® (DJIA) closed at an all-time high as well.
For the period as a whole, the broad-market S&P 500® Index returned 28.71%; the blue-chip DJIA was up 20.95%; and the technology-laden Nasdaq Composite Index rose 22.18%. Large-cap U.S. stocks, as measured by the Russell 1000® Index, outperformed their small-cap counterparts, as measured by the Russell 2000® Index. In the large-cap space, growth stocks modestly outperformed value stocks, but in the small-cap space, value stocks strongly outperformed growth stocks during the period.
Fund Performance
For the 12-month period ended December 31, 2021, Eaton Vance Stock Fund (the Fund) returned 22.78% for Class A shares at net asset value (NAV), underperforming its benchmark, the S&P 500® Index (the Index), which returned 28.71%.
Stock selections in the information technology (IT) and consumer discretionary sectors, along with stock selections and an underweight position relative to the Index in the energy sector — the best-performing sector in the Index during the period — detracted from Fund performance versus the Index.
In the IT sector, underweighting NVIDIA Corp. (NVIDIA) — a maker of computer graphics processing units used in gaming, data center, and self-driving vehicle applications — and not owning the stock until late in the period hurt returns relative to the Index. NVIDIA’s stock price more than doubled during the period, driven by long-term tailwinds — growth in the gaming, artificial intelligence, and autonomous vehicle industries — and by a sharp increase in gaming and data center demand during the pandemic. By period-end, NVIDIA was sold from the Fund.
Elsewhere in the IT sector, the Fund’s overweight position in Cognizant Technology Solutions Corp. (Cognizant), a business consultant, declined in price during the early part of the period. Competition from other IT service providers as well as in-house management turnover weighed on Cognizant’s stock performance. By period-end, Cognizant was sold from the Fund.
In the consumer discretionary sector, the Fund’s overweight position in e-commerce giant Amazon.com, Inc. (Amazon) detracted from returns relative to the Index during the period. Early in the COVID-19 pandemic, Amazon benefited from a shift toward online shopping during a period when consumers were largely confined to their homes. As the global economy reopened, however, growth in online shopping began to slow as consumers returned to brick-and-mortar retailers. As a result, Amazon’s stock underperformed the Index during the period.
In contrast, stock selections in the health care and communication services sectors contributed to performance versus the Index during the period. In health care, performance relative to the Index benefited from the Fund’s overweight position in Anthem, Inc. (Anthem), a large provider of medical insurance. Anthem’s relationship as an exclusive Blue Cross Blue Shield licensee in numerous states, as well as its recent acquisition of a top-tier Medicare/Medicaid insurer, helped the company deliver strong earnings growth and stock performance during the period. Higher membership figures and a premium rate increase boosted Anthem’s earnings as well.
In the communication services sector, the Fund’s overweight position in Alphabet, Inc. (Alphabet), parent company of search engine Google, performed strongly as positive e-commerce trends drove increased demand for search engine advertising and engagement. In addition, growth in viewership and ad sales on video sharing platform YouTube, an Alphabet subsidiary, exceeded analyst expectations during the period and provided an additional tailwind for Alphabet’s stock price.
See Endnotes and Additional Disclosures in this report.
Past performance is no guarantee of future results. Returns are historical and are calculated by determining the percentage change in net asset value (NAV) or offering price (as applicable) with all distributions reinvested. Investment return and principal value will fluctuate so that shares, when redeemed, may be worth more or less than their original cost. Performance for periods less than or equal to one year is cumulative. Performance is for the stated time period only; due to market volatility, current Fund performance may be lower or higher than the quoted return. For performance as of the most recent month-end, please refer to eatonvance.com.
Eaton Vance
Stock Fund
December 31, 2021
Performance2,3
Portfolio Manager(s) Charles B. Gaffney
| | | | | | | | | | | | | | | | | | | | |
| % Average Annual Total Returns | | Class
Inception Date | | | Performance
Inception Date | | | One Year | | | Five Years | | | Ten Years | |
| | | | | |
Class A at NAV | | | 11/01/2001 | | | | 11/01/2001 | | | | 22.78 | % | | | 17.19 | % | | | 15.54 | % |
Class A with 5.75% Maximum Sales Charge | | | — | | | | — | | | | 15.72 | | | | 15.81 | | | | 14.86 | |
Class C at NAV | | | 10/01/2009 | | | | 11/01/2001 | | | | 21.88 | | | | 16.32 | | | | 14.85 | |
Class C with 1% Maximum Sales Charge | | | — | | | | — | | | | 20.88 | | | | 16.32 | | | | 14.85 | |
Class I at NAV | | | 09/03/2008 | | | | 11/01/2001 | | | | 23.12 | | | | 17.48 | | | | 15.83 | |
|
| |
| | | | | |
S&P 500® Index | | | — | | | | — | | | | 28.71 | % | | | 18.46 | % | | | 16.54 | % |
| | | | | |
| % Total Annual Operating Expense Ratios4 | | | | | | | | Class A | | | Class C | | | Class I | |
| | | | | |
Gross | | | | | | | | | | | 1.08 | % | | | 1.83 | % | | | 0.83 | % |
Net | | | | | | | | | | | 0.98 | | | | 1.73 | | | | 0.73 | |
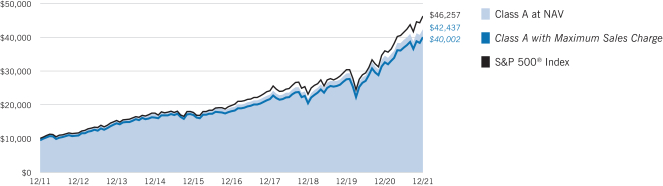
Growth of $10,000
This graph shows the change in value of a hypothetical investment of $10,000 in Class A of the Fund for the period indicated. For comparison, the same investment is shown in the indicated index.
| | | | | | | | | | | | | | | | |
| Growth of Investment | | Amount Invested | | | Period Beginning | | | At NAV | | | With Maximum Sales Charge | |
| | | | |
Class C | | | $10,000 | | | | 12/31/2011 | | | | $39,959 | | | | N.A. | |
Class I | | | $250,000 | | | | 12/31/2011 | | | | $1,087,706 | | | | N.A. | |
See Endnotes and Additional Disclosures in this report.
Past performance is no guarantee of future results. Returns are historical and are calculated by determining the percentage change in net asset value (NAV) or offering price (as applicable) with all distributions reinvested. Investment return and principal value will fluctuate so that shares, when redeemed, may be worth more or less than their original cost. Performance for periods less than or equal to one year is cumulative. Performance is for the stated time period only; due to market volatility, current Fund performance may be lower or higher than the quoted return. For performance as of the most recent month-end, please refer to eatonvance.com.
Eaton Vance
Stock Fund
December 31, 2021
Fund Profile5
Sector Allocation (% of net assets)6
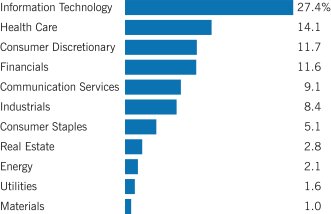
Top 10 Holdings (% of net assets)6
| | | | |
| |
Microsoft Corp. | | | 7.2 | % |
| |
Apple, Inc. | | | 6.0 | |
| |
Alphabet, Inc., Class C | | | 5.5 | |
| |
Amazon.com, Inc. | | | 5.4 | |
| |
Wells Fargo & Co. | | | 2.3 | |
| |
AbbVie, Inc. | | | 2.2 | |
| |
S&P Global, Inc. | | | 2.2 | |
| |
PNC Financial Services Group, Inc. (The) | | | 2.1 | |
| |
ConocoPhillips | | | 2.1 | |
| |
Visa, Inc., Class A | | | 2.0 | |
| |
Total | | | 37.0 | % |
See Endnotes and Additional Disclosures in this report.
Eaton Vance
Stock Fund
December 31, 2021
Endnotes and Additional Disclosures
| 1 | The views expressed in this report are those of the portfolio manager(s) and are current only through the date stated at the top of this page. These views are subject to change at any time based upon market or other conditions, and Eaton Vance and the Fund(s) disclaim any responsibility to update such views. These views may not be relied upon as investment advice and, because investment decisions are based on many factors, may not be relied upon as an indication of trading intent on behalf of any Eaton Vance fund. This commentary may contain statements that are not historical facts, referred to as “forward-looking statements.” The Fund’s actual future results may differ significantly from those stated in any forward-looking statement, depending on factors such as changes in securities or financial markets or general economic conditions, the volume of sales and purchases of Fund shares, the continuation of investment advisory, administrative and service contracts, and other risks discussed from time to time in the Fund’s filings with the Securities and Exchange Commission. |
| 2 | S&P 500® Index is an unmanaged index of large-cap stocks commonly used as a measure of U.S. stock market performance. S&P Dow Jones Indices are a product of S&P Dow Jones Indices LLC (“S&P DJI”) and have been licensed for use. S&P® and S&P 500® are registered trademarks of S&P DJI; Dow Jones® is a registered trademark of Dow Jones Trademark Holdings LLC (“Dow Jones”); S&P DJI, Dow Jones and their respective affiliates do not sponsor, endorse, sell or promote the Fund, will not have any liability with respect thereto and do not have any liability for any errors, omissions, or interruptions of the S&P Dow Jones Indices. Unless otherwise stated, index returns do not reflect the effect of any applicable sales charges, commissions, expenses, taxes or leverage, as applicable. It is not possible to invest directly in an index. |
| 3 | Total Returns at NAV do not include applicable sales charges. If sales charges were deducted, the returns would be lower. Total Returns shown with maximum sales charge reflect the stated maximum sales charge. Unless otherwise stated, performance does not reflect the deduction of taxes on Fund distributions or redemptions of Fund shares. |
Effective November 5, 2020, Class C shares automatically convert to Class A shares eight years after purchase. The average annual total returns listed for Class C reflect conversion to Class A shares after eight years. Prior to November 5, 2020, Class C shares automatically converted to Class A shares ten years after purchase.
| 4 | Source: Fund prospectus. Net expense ratios reflect a contractual expense reimbursement that continues through 4/30/22. The expense ratios for the current reporting period can be found in the Financial Highlights section of this report. Performance reflects expenses waived and/or reimbursed, if applicable. Without such waivers and/or reimbursements, performance would have been lower. |
| 5 | Fund invests in an affiliated investment company (Portfolio) with the same objective(s) and policies as the Fund. References to investments are to the Portfolio’s holdings. |
| 6 | Excludes cash and cash equivalents. |
Fund profile subject to change due to active management.
Additional Information
Dow Jones Industrial Average® is a price-weighted average of 30 blue-chip stocks that are generally the leaders in their industry. Nasdaq Composite Index is a market capitalization-weighted index of all domestic and international securities listed on Nasdaq. Source: Nasdaq, Inc. The information is provided by Nasdaq (with its affiliates, are referred to as the “Corporations”) and Nasdaq’s third party licensors on an “as is” basis and the Corporations make no guarantees and bear no liability of any kind with respect to the information or the Fund. Russell 1000® Index is an unmanaged index of 1,000 U.S. large-cap stocks. Russell 2000® Index is an unmanaged index of 2,000 U.S. small-cap stocks.
Eaton Vance
Stock Fund
December 31, 2021
Fund Expenses
Example: As a Fund shareholder, you incur two types of costs: (1) transaction costs, including sales charges (loads) on purchases and redemption fees (if applicable); and (2) ongoing costs, including management fees; distribution and/or service fees; and other Fund expenses. This Example is intended to help you understand your ongoing costs (in dollars) of Fund investing and to compare these costs with the ongoing costs of investing in other mutual funds. The Example is based on an investment of $1,000 invested at the beginning of the period and held for the entire period (July 1, 2021 – December 31, 2021).
Actual Expenses: The first section of the table below provides information about actual account values and actual expenses. You may use the information in this section, together with the amount you invested, to estimate the expenses that you paid over the period. Simply divide your account value by $1,000 (for example, an $8,600 account value divided by $1,000 = 8.6), then multiply the result by the number in the first section under the heading entitled “Expenses Paid During Period” to estimate the expenses you paid on your account during this period.
Hypothetical Example for Comparison Purposes: The second section of the table below provides information about hypothetical account values and hypothetical expenses based on the actual Fund expense ratio and an assumed rate of return of 5% per year (before expenses), which is not the actual Fund return. The hypothetical account values and expenses may not be used to estimate the actual ending account balance or expenses you paid for the period. You may use this information to compare the ongoing costs of investing in your Fund and other funds. To do so, compare this 5% hypothetical example with the 5% hypothetical examples that appear in the shareholder reports of the other funds.
Please note that the expenses shown in the table are meant to highlight your ongoing costs only and do not reflect any transactional costs, such as sales charges (loads) or redemption fees (if applicable). Therefore, the second section of the table is useful in comparing ongoing costs only, and will not help you determine the relative total costs of owning different funds. In addition, if these transactional costs were included, your costs would be higher.
| | | | | | | | | | | | | | | | |
| | | Beginning
Account Value
(7/1/21) | | | Ending
Account Value
(12/31/21) | | | Expenses Paid
During Period*
(7/1/21 – 12/31/21) | | | Annualized
Expense
Ratio | |
| | | | |
Actual | | | | | | | | | | | | | | | | |
Class A | | $ | 1,000.00 | | | $ | 1,082.50 | | | $ | 5.14 | ** | | | 0.98 | % |
Class C | | $ | 1,000.00 | | | $ | 1,078.60 | | | $ | 9.06 | ** | | | 1.73 | % |
Class I | | $ | 1,000.00 | | | $ | 1,083.80 | | | $ | 3.83 | ** | | | 0.73 | % |
| | | | | |
Hypothetical | | | | | | | | | | | | | | | | |
(5% return per year before expenses) | | | | | | | | | | | | | | | | |
Class A | | $ | 1,000.00 | | | $ | 1,020.27 | | | $ | 4.99 | ** | | | 0.98 | % |
Class C | | $ | 1,000.00 | | | $ | 1,016.48 | | | $ | 8.79 | ** | | | 1.73 | % |
Class I | | $ | 1,000.00 | | | $ | 1,021.53 | | | $ | 3.72 | ** | | | 0.73 | % |
| * | Expenses are equal to the Fund’s annualized expense ratio for the indicated Class, multiplied by the average account value over the period, multiplied by 184/365 (to reflect the one-half year period). The Example assumes that the $1,000 was invested at the net asset value per share determined at the close of business on June 30, 2021. The Example reflects the expenses of both the Fund and the Portfolio. |
| ** | Absent an allocation of certain expenses to an affiliate, expenses would be higher. |
Eaton Vance
Stock Fund
December 31, 2021
Statement of Assets and Liabilities
| | | | |
| Assets | | December 31, 2021 | |
| |
Investment in Stock Portfolio, at value (identified cost, $60,174,547) | | $ | 111,308,285 | |
| |
Receivable for Fund shares sold | | | 3,658 | |
| |
Total assets | | $ | 111,311,943 | |
|
| Liabilities | |
| |
Payable for Fund shares redeemed | | $ | 9,968,589 | |
| |
Payable to affiliates: | | | | |
| |
Distribution and service fees | | | 19,002 | |
| |
Trustees’ fees | | | 125 | |
| |
Other | | | 1,403 | |
| |
Accrued expenses | | | 42,607 | |
| |
Total liabilities | | $ | 10,031,726 | |
| |
Net Assets | | $ | 101,280,217 | |
|
| Sources of Net Assets | |
| |
Paid-in capital | | $ | 50,883,329 | |
| |
Distributable earnings | | | 50,396,888 | |
| |
Total | | $ | 101,280,217 | |
| |
| Class A Shares | | | | |
| |
Net Assets | | $ | 61,304,210 | |
| |
Shares Outstanding | | | 2,541,220 | |
| |
Net Asset Value and Redemption Price Per Share | | | | |
| |
(net assets ÷ shares of beneficial interest outstanding) | | $ | 24.12 | |
| |
Maximum Offering Price Per Share | | | | |
| |
(100 ÷ 94.25 of net asset value per share) | | $ | 25.59 | |
|
| Class C Shares | |
| |
Net Assets | | $ | 7,418,451 | |
| |
Shares Outstanding | | | 319,345 | |
| |
Net Asset Value and Offering Price Per Share* | | | | |
| |
(net assets ÷ shares of beneficial interest outstanding) | | $ | 23.23 | |
|
| Class I Shares | |
| |
Net Assets | | $ | 32,557,556 | |
| |
Shares Outstanding | | | 1,348,489 | |
| |
Net Asset Value, Offering Price and Redemption Price Per Share | | | | |
| |
(net assets ÷ shares of beneficial interest outstanding) | | $ | 24.14 | |
On sales of $50,000 or more, the offering price of Class A shares is reduced.
| * | Redemption price per share is equal to the net asset value less any applicable contingent deferred sales charge. |
| | | | |
| | 7 | | See Notes to Financial Statements. |
Eaton Vance
Stock Fund
December 31, 2021
Statement of Operations
| | | | |
| Investment Income | | Year Ended
December 31, 2021 | |
| |
Dividends allocated from Portfolio (net of foreign taxes, $20,278) | | $ | 1,304,137 | |
| |
Expenses allocated from Portfolio | | | (695,914 | ) |
| |
Total investment income from Portfolio | | $ | 608,223 | |
| |
| Expenses | | | | |
| |
Distribution and service fees | | | | |
| |
Class A | | $ | 153,629 | |
| |
Class C | | | 71,522 | |
| |
Trustees’ fees and expenses | | | 500 | |
| |
Custodian fee | | | 17,995 | |
| |
Transfer and dividend disbursing agent fees | | | 60,627 | |
| |
Legal and accounting services | | | 28,331 | |
| |
Printing and postage | | | 13,571 | |
| |
Registration fees | | | 53,359 | |
| |
Miscellaneous | | | 10,255 | |
| |
Total expenses | | $ | 409,789 | |
| |
Deduct — | | | | |
| |
Allocation of expenses to affiliate | | $ | 72,100 | |
| |
Total expense reductions | | $ | 72,100 | |
| |
Net expenses | | $ | 337,689 | |
| |
Net investment income | | $ | 270,534 | |
| |
| Realized and Unrealized Gain (Loss) from Portfolio | | | | |
| |
Net realized gain (loss) — | | | | |
| |
Investment transactions | | $ | 16,204,412 | (1) |
| |
Foreign currency transactions | | | (1,628 | ) |
| |
Net realized gain | | $ | 16,202,784 | |
| |
Change in unrealized appreciation (depreciation) — | | | | |
| |
Investments | | $ | 6,248,435 | |
| |
Foreign currency | | | (1,009 | ) |
| |
Net change in unrealized appreciation (depreciation) | | $ | 6,247,426 | |
| |
Net realized and unrealized gain | | $ | 22,450,210 | |
| |
Net increase in net assets from operations | | $ | 22,720,744 | |
| (1) | Includes $394,517 of net realized gains from redemptions in-kind. |
| | | | |
| | 8 | | See Notes to Financial Statements. |
Eaton Vance
Stock Fund
December 31, 2021
Statements of Changes in Net Assets
| | | | | | | | |
| | | Year Ended December 31, | |
| Increase (Decrease) in Net Assets | | 2021 | | | 2020 | |
| | |
From operations — | | | | | | | | |
| | |
Net investment income | | $ | 270,534 | | | $ | 519,303 | |
| | |
Net realized gain | | | 16,202,784 | (1) | | | 2,240,515 | |
| | |
Net change in unrealized appreciation (depreciation) | | | 6,247,426 | | | | 13,485,858 | |
| | |
Net increase in net assets from operations | | $ | 22,720,744 | | | $ | 16,245,676 | |
| | |
Distributions to shareholders — | | | | | | | | |
| | |
Class A | | $ | (6,966,059 | ) | | $ | (1,138,968 | ) |
| | |
Class C | | | (798,464 | ) | | | (209,512 | ) |
| | |
Class I | | | (4,902,730 | ) | | | (860,335 | ) |
| | |
Total distributions to shareholders | | $ | (12,667,253 | ) | | $ | (2,208,815 | ) |
| | |
Transactions in shares of beneficial interest — | | | | | | | | |
| | |
Proceeds from sale of shares | | | | | | | | |
| | |
Class A | | $ | 2,087,298 | | | $ | 5,471,439 | |
| | |
Class C | | | 778,431 | | | | 1,020,161 | |
| | |
Class I | | | 4,307,668 | | | | 13,482,298 | |
| | |
Net asset value of shares issued to shareholders in payment of distributions declared | | | | | | | | |
| | |
Class A | | | 6,762,071 | | | | 1,105,764 | |
| | |
Class C | | | 798,464 | | | | 208,098 | |
| | |
Class I | | | 4,902,730 | | | | 860,279 | |
| | |
Cost of shares redeemed | | | | | | | | |
| | |
Class A | | | (13,638,219 | ) | | | (11,491,645 | ) |
| | |
Class C | | | (1,173,818 | ) | | | (3,021,646 | ) |
| | |
Class I | | | (21,423,736 | ) | | | (15,796,778 | ) |
| | |
Net asset value of shares converted | | | | | | | | |
| | |
Class A | | | 323,952 | | | | 4,018,356 | |
| | |
Class C | | | (323,952 | ) | | | (4,018,356 | ) |
| | |
Net decrease in net assets from Fund share transactions | | $ | (16,599,111 | ) | | $ | (8,162,030 | ) |
| | |
Other capital — | | | | | | | | |
| | |
Portfolio transaction fee contributed to Portfolio | | $ | (68,869 | ) | | $ | (41,788 | ) |
| | |
Portfolio transaction fee allocated from Portfolio | | | 75,872 | | | | 40,066 | |
| | |
Net increase (decrease) in net assets from other capital | | $ | 7,003 | | | $ | (1,722 | ) |
| | |
Net increase (decrease) in net assets | | $ | (6,538,617 | ) | | $ | 5,873,109 | |
|
| Net Assets | |
| | |
At beginning of year | | $ | 107,818,834 | | | $ | 101,945,725 | |
| | |
At end of year | | $ | 101,280,217 | | | $ | 107,818,834 | |
| (1) | Includes $394,517 of net realized gains from redemptions in-kind. |
| | | | |
| | 9 | | See Notes to Financial Statements. |
Eaton Vance
Stock Fund
December 31, 2021
Financial Highlights
| | | | | | | | | | | | | | | | | | | | |
| | | Class A | |
| |
| | | Year Ended December 31, | |
| | | 2021 | | | 2020 | | | 2019 | | | 2018 | | | 2017 | |
| | | | | |
Net asset value — Beginning of year | | $ | 22.120 | | | $ | 19.110 | | | $ | 14.720 | | | $ | 17.490 | | | $ | 15.740 | |
| | | | | |
| Income (Loss) From Operations | | | | | | | | | | | | | | | | | | | | |
| | | | | |
Net investment income(1) | | $ | 0.049 | | | $ | 0.097 | | | $ | 0.114 | | | $ | 0.144 | | | $ | 0.178 | |
| | | | | |
Net realized and unrealized gain (loss) | | | 4.959 | | | | 3.346 | | | | 5.023 | | | | (1.133 | ) | | | 2.933 | |
| | | | | |
Total income (loss) from operations | | $ | 5.008 | | | $ | 3.443 | | | $ | 5.137 | | | $ | (0.989 | ) | | $ | 3.111 | |
| | | | | |
| Less Distributions | | | | | | | | | | | | | | | | | | | | |
| | | | | |
From net investment income | | $ | (0.097 | ) | | $ | (0.041 | ) | | $ | (0.096 | ) | | $ | (0.145 | ) | | $ | (0.168 | ) |
| | | | | |
From net realized gain | | | (2.913 | ) | | | (0.392 | ) | | | (0.653 | ) | | | (1.637 | ) | | | (1.191 | ) |
| | | | | |
Total distributions | | $ | (3.010 | ) | | $ | (0.433 | ) | | $ | (0.749 | ) | | $ | (1.782 | ) | | $ | (1.359 | ) |
| | | | | |
Portfolio transaction fee, net(1) | | $ | 0.002 | | | $ | — | (2) | | $ | 0.002 | | | $ | 0.001 | | | $ | (0.002 | ) |
| | | | | |
Net asset value — End of year | | $ | 24.120 | | | $ | 22.120 | | | $ | 19.110 | | | $ | 14.720 | | | $ | 17.490 | |
| | | | | |
Total Return(3)(4) | | | 22.78 | % | | | 18.22 | % | | | 35.01 | % | | | (5.89 | )% | | | 19.91 | % |
| | | | | |
| Ratios/Supplemental Data | | | | | | | | | | | | | | | | | | | | |
| | | | | |
Net assets, end of year (000’s omitted) | | $ | 61,304 | | | $ | 60,148 | | | $ | 53,153 | | | $ | 42,087 | | | $ | 51,999 | |
| | | | | |
Ratios (as a percentage of average daily net assets):(5) | | | | | | | | | | | | | | | | | | | | |
| | | | | |
Expenses(4) | | | 0.98 | % | | | 0.98 | % | | | 0.98 | % | | | 0.98 | % | | | 0.98 | % |
| | | | | |
Net investment income | | | 0.20 | % | | | 0.51 | % | | | 0.65 | % | | | 0.80 | % | | | 1.05 | % |
| | | | | |
Portfolio Turnover of the Portfolio | | | 44 | % | | | 70 | % | | | 55 | % | | | 90 | % | | | 101 | % |
| (1) | Computed using average shares outstanding. |
| (2) | Amount is less than $(0.0005). |
| (3) | Returns are historical and are calculated by determining the percentage change in net asset value with all distributions reinvested and do not reflect the effect of sales charges. |
| (4) | The administrator waived its fees and/or reimbursed certain operating expenses (equal to 0.07%, 0.10%, 0.12%, 0.12% and 0.13% of average daily net assets for the years ended December 31, 2021, 2020, 2019, 2018 and 2017, respectively). Absent the waivers and reimbursement, total return would be lower. |
| (5) | Includes the Fund’s share of the Portfolio’s allocated expenses. |
| | | | |
| | 10 | | See Notes to Financial Statements. |
Eaton Vance
Stock Fund
December 31, 2021
Financial Highlights — continued
| | | | | | | | | | | | | | | | | | | | |
| | | Class C | |
| |
| | | Year Ended December 31, | |
| | | 2021 | | | 2020 | | | 2019 | | | 2018 | | | 2017 | |
| | | | | |
Net asset value — Beginning of year | | $ | 21.400 | | | $ | 18.610 | | | $ | 14.380 | | | $ | 17.100 | | | $ | 15.420 | |
| | | | | |
| Income (Loss) From Operations | | | | | | | | | | | | | | | | | | | | |
| | | | | |
Net investment income (loss)(1) | | $ | (0.130 | ) | | $ | (0.040 | ) | | $ | (0.018 | ) | | $ | 0.008 | | | $ | 0.050 | |
| | | | | |
Net realized and unrealized gain (loss) | | | 4.784 | | | | 3.235 | | | | 4.899 | | | | (1.096 | ) | | | 2.851 | |
| | | | | |
Total income (loss) from operations | | $ | 4.654 | | | $ | 3.195 | | | $ | 4.881 | | | $ | (1.088 | ) | | $ | 2.901 | |
| | | | | |
| Less Distributions | | | | | | | | | | | | | | | | | | | | |
| | | | | |
From net investment income | | $ | — | | | $ | (0.013 | ) | | $ | — | | | $ | (0.010 | ) | | $ | (0.028 | ) |
| | | | | |
From net realized gain | | | (2.826 | ) | | | (0.392 | ) | | | (0.653 | ) | | | (1.623 | ) | | | (1.191 | ) |
| | | | | |
Total distributions | | $ | (2.826 | ) | | $ | (0.405 | ) | | $ | (0.653 | ) | | $ | (1.633 | ) | | $ | (1.219 | ) |
| | | | | |
Portfolio transaction fee, net(1) | | $ | 0.002 | | | $ | — | (2) | | $ | 0.002 | | | $ | 0.001 | | | $ | (0.002 | ) |
| | | | | |
Net asset value — End of year | | $ | 23.230 | | | $ | 21.400 | | | $ | 18.610 | | | $ | 14.380 | | | $ | 17.100 | |
| | | | | |
Total Return(3)(4) | | | 21.88 | % | | | 17.36 | % | | | 34.04 | % | | | (6.60 | )% | | | 18.94 | % |
| | | | | |
| Ratios/Supplemental Data | | | | | | | | | | | | | | | | | | | | |
| | | | | |
Net assets, end of year (000’s omitted) | | $ | 7,418 | | | $ | 6,728 | | | $ | 11,418 | | | $ | 11,627 | | | $ | 16,196 | |
| | | | | |
Ratios (as a percentage of average daily net assets):(5) | | | | | | | | | | | | | | | | | | | | |
| | | | | |
Expenses(4) | | | 1.73 | % | | | 1.73 | % | | | 1.73 | % | | | 1.73 | % | | | 1.73 | % |
| | | | | |
Net investment income (loss) | | | (0.55 | )% | | | (0.22 | )% | | | (0.11 | )% | | | 0.05 | % | | | 0.30 | % |
| | | | | |
Portfolio Turnover of the Portfolio | | | 44 | % | | | 70 | % | | | 55 | % | | | 90 | % | | | 101 | % |
| (1) | Computed using average shares outstanding. |
| (2) | Amount is less than $(0.0005). |
| (3) | Returns are historical and are calculated by determining the percentage change in net asset value with all distributions reinvested and do not reflect the effect of sales charges. |
| (4) | The administrator waived its fees and/or reimbursed certain operating expenses (equal to 0.07%, 0.10%, 0.12%, 0.12% and 0.13% of average daily net assets for the years ended December 31, 2021, 2020, 2019, 2018 and 2017, respectively). Absent the waivers and reimbursement, total return would be lower. |
| (5) | Includes the Fund’s share of the Portfolio’s allocated expenses. |
| | | | |
| | 11 | | See Notes to Financial Statements. |
Eaton Vance
Stock Fund
December 31, 2021
Financial Highlights — continued
| | | | | | | | | | | | | | | | | | | | |
| | | Class I | |
| |
| | | Year Ended December 31, | |
| | | 2021 | | | 2020 | | | 2019 | | | 2018 | | | 2017 | |
| | | | | |
Net asset value — Beginning of year | | $ | 22.130 | | | $ | 19.110 | | | $ | 14.720 | | | $ | 17.490 | | | $ | 15.750 | |
| | | | | |
| Income (Loss) From Operations | | | | | | | | | | | | | | | | | | | | |
| | | | | |
Net investment income(1) | | $ | 0.110 | | | $ | 0.146 | | | $ | 0.158 | | | $ | 0.190 | | | $ | 0.219 | |
| | | | | |
Net realized and unrealized gain (loss) | | | 4.974 | | | | 3.354 | | | | 5.023 | | | | (1.132 | ) | | | 2.931 | |
| | | | | |
Total income (loss) from operations | | $ | 5.084 | | | $ | 3.500 | | | $ | 5.181 | | | $ | (0.942 | ) | | $ | 3.150 | |
| | | | | |
| Less Distributions | | | | | | | | | | | | | | | | | | | | |
| | | | | |
From net investment income | | $ | (0.163 | ) | | $ | (0.088 | ) | | $ | (0.140 | ) | | $ | (0.192 | ) | | $ | (0.217 | ) |
| | | | | |
From net realized gain | | | (2.913 | ) | | | (0.392 | ) | | | (0.653 | ) | | | (1.637 | ) | | | (1.191 | ) |
| | | | | |
Total distributions | | $ | (3.076 | ) | | $ | (0.480 | ) | | $ | (0.793 | ) | | $ | (1.829 | ) | | $ | (1.408 | ) |
| | | | | |
Portfolio transaction fee, net(1) | | $ | 0.002 | | | $ | — | (2) | | $ | 0.002 | | | $ | 0.001 | | | $ | (0.002 | ) |
| | | | | |
Net asset value — End of year | | $ | 24.140 | | | $ | 22.130 | | | $ | 19.110 | | | $ | 14.720 | | | $ | 17.490 | |
| | | | | |
Total Return(3)(4) | | | 23.12 | % | | | 18.52 | % | | | 35.32 | % | | | (5.63 | )% | | | 20.14 | % |
| | | | | |
| Ratios/Supplemental Data | | | | | | | | | | | | | | | | | | | | |
| | | | | |
Net assets, end of year (000’s omitted) | | $ | 32,558 | | | $ | 40,943 | | | $ | 37,375 | | | $ | 29,455 | | | $ | 35,068 | |
| | | | | |
Ratios (as a percentage of average daily net assets):(5) | | | | | | | | | | | | | | | | | | | | |
| | | | | |
Expenses(4) | | | 0.73 | % | | | 0.73 | % | | | 0.73 | % | | | 0.73 | % | | | 0.73 | % |
| | | | | |
Net investment income | | | 0.45 | % | | | 0.76 | % | | | 0.89 | % | | | 1.06 | % | | | 1.28 | % |
| | | | | |
Portfolio Turnover of the Portfolio | | | 44 | % | | | 70 | % | | | 55 | % | | | 90 | % | | | 101 | % |
| (1) | Computed using average shares outstanding. |
| (2) | Amount is less than $(0.0005). |
| (3) | Returns are historical and are calculated by determining the percentage change in net asset value with all distributions reinvested. |
| (4) | The administrator waived its fees and/or reimbursed certain operating expenses (equal to 0.07%, 0.10%, 0.12%, 0.12% and 0.13% of average daily net assets for the years ended December 31, 2021, 2020, 2019, 2018 and 2017, respectively). Absent the waivers and reimbursement, total return would be lower. |
| (5) | Includes the Fund’s share of the Portfolio’s allocated expenses. |
| | | | |
| | 12 | | See Notes to Financial Statements. |
Eaton Vance
Stock Fund
December 31, 2021
Notes to Financial Statements
1 Significant Accounting Policies
Eaton Vance Stock Fund (the Fund) is a diversified series of Eaton Vance Mutual Funds Trust (the Trust). The Trust is a Massachusetts business trust registered under the Investment Company Act of 1940, as amended (the 1940 Act), as an open-end management investment company. The Fund offers three classes of shares. Class A shares are generally sold subject to a sales charge imposed at time of purchase. Class C shares are sold at net asset value and are generally subject to a contingent deferred sales charge (see Note 5). Effective January 25, 2019, Class C shares generally automatically convert to Class A shares ten years after their purchase and, effective November 5, 2020, automatically convert to Class A shares eight years after their purchase as described in the Fund’s prospectus. Class I shares are sold at net asset value and are not subject to a sales charge. Each class represents a pro-rata interest in the Fund, but votes separately on class-specific matters and (as noted below) is subject to different expenses. Realized and unrealized gains and losses and net investment income and losses, other than class-specific expenses, are allocated daily to each class of shares based on the relative net assets of each class to the total net assets of the Fund. Each class of shares differs in its distribution plan and certain other class-specific expenses. The Fund invests all of its investable assets in interests in Stock Portfolio (the Portfolio), a Massachusetts business trust, having the same investment objective and policies as the Fund. The value of the Fund’s investment in the Portfolio reflects the Fund’s proportionate interest in the net assets of the Portfolio (12.8% at December 31, 2021). The performance of the Fund is directly affected by the performance of the Portfolio. The financial statements of the Portfolio, including the portfolio of investments, are included elsewhere in this report and should be read in conjunction with the Fund’s financial statements.
The following is a summary of significant accounting policies of the Fund. The policies are in conformity with accounting principles generally accepted in the United States of America (U.S. GAAP). The Fund is an investment company and follows accounting and reporting guidance in the Financial Accounting Standards Board (FASB) Accounting Standards Codification Topic 946.
A Investment Valuation — Valuation of securities by the Portfolio is discussed in Note 1A of the Portfolio’s Notes to Financial Statements, which are included elsewhere in this report.
B Income — The Fund’s net investment income or loss consists of the Fund’s pro-rata share of the net investment income or loss of the Portfolio, less all actual and accrued expenses of the Fund.
C Federal Taxes — The Fund’s policy is to comply with the provisions of the Internal Revenue Code applicable to regulated investment companies and to distribute to shareholders each year substantially all of its net investment income, and all or substantially all of its net realized capital gains. Accordingly, no provision for federal income or excise tax is necessary.
As of December 31, 2021, the Fund had no uncertain tax positions that would require financial statement recognition, de-recognition, or disclosure. The Fund files a U.S. federal income tax return annually after its fiscal year-end, which is subject to examination by the Internal Revenue Service for a period of three years from the date of filing.
D Expenses — The majority of expenses of the Trust are directly identifiable to an individual fund. Expenses which are not readily identifiable to a specific fund are allocated taking into consideration, among other things, the nature and type of expense and the relative size of the funds.
E Use of Estimates — The preparation of the financial statements in conformity with U.S. GAAP requires management to make estimates and assumptions that affect the reported amounts of assets and liabilities at the date of the financial statements and the reported amounts of income and expense during the reporting period. Actual results could differ from those estimates.
F Indemnifications — Under the Trust’s organizational documents, its officers and Trustees may be indemnified against certain liabilities and expenses arising out of the performance of their duties to the Fund. Under Massachusetts law, if certain conditions prevail, shareholders of a Massachusetts business trust (such as the Trust) could be deemed to have personal liability for the obligations of the Trust. However, the Trust’s Declaration of Trust contains an express disclaimer of liability on the part of Fund shareholders and the By-laws provide that the Trust shall assume, upon request by the shareholder, the defense on behalf of any Fund shareholders. Moreover, the By-laws also provide for indemnification out of Fund property of any shareholder held personally liable solely by reason of being or having been a shareholder for all loss or expense arising from such liability. Additionally, in the normal course of business, the Fund enters into agreements with service providers that may contain indemnification clauses. The Fund’s maximum exposure under these arrangements is unknown as this would involve future claims that may be made against the Fund that have not yet occurred.
G Other — Investment transactions are accounted for on a trade date basis.
2 Distributions to Shareholders and Income Tax Information
It is the present policy of the Fund to make at least one distribution annually (normally in December) of all or substantially all of its net investment income and to distribute annually all or substantially all of its net realized capital gains. Distributions to shareholders are recorded on the ex-dividend date. Distributions are declared separately for each class of shares. Shareholders may reinvest income and capital gain distributions in additional shares of the same class of the Fund at the net asset value as of the ex-dividend date or, at the election of the shareholder, receive distributions in cash. Distributions to shareholders are determined in accordance with income tax regulations, which may differ from U.S. GAAP. As required by U.S. GAAP, only distributions in excess of tax basis earnings and profits are reported in the financial statements as a return of capital. Permanent differences between book and tax accounting relating to distributions are reclassified to paid-in capital. For tax purposes, distributions from short-term capital gains are considered to be from ordinary income.
Eaton Vance
Stock Fund
December 31, 2021
Notes to Financial Statements — continued
The tax character of distributions declared for the years ended December 31, 2021 and December 31, 2020 was as follows:
| | | | | | | | |
| | | Year Ended December 31, | |
| | | 2021 | | | 2020 | |
| | |
Ordinary income | | $ | 1,515,122 | | | $ | 290,052 | |
| | |
Long-term capital gains | | $ | 11,152,131 | | | $ | 1,918,763 | |
During the year ended December 31, 2021, distributable earnings was decreased by $1,900,612 and paid-in capital was increased by $1,900,612 due to the Fund’s use of equalization accounting and the Fund’s investment in the Portfolio. Tax equalization accounting allows the Fund to treat as a distribution that portion of redemption proceeds representing a redeeming shareholder’s portion of undistributed taxable income and net capital gains. These reclassifications had no effect on the net assets or net asset value per share of the Fund.
As of December 31, 2021, the components of distributable earnings (accumulated loss) on a tax basis were as follows:
| | | | |
| | |
Undistributed ordinary income | | $ | 261,918 | |
| |
Undistributed long-term capital gains | | | 5,462,340 | |
| |
Net unrealized appreciation | | | 44,672,630 | |
| |
Distributable earnings | | $ | 50,396,888 | |
3 Investment Adviser Fee and Other Transactions with Affiliates
Effective March 1, 2021, the Fund entered into an investment advisory agreement with Eaton Vance Management (EVM). Pursuant to the agreement, the Fund pays an investment adviser fee on its average daily net assets that are not invested in other investment companies for which EVM or its affiliates serve as investment adviser and receive an advisory fee, at a per annum rate as follows and is payable monthly:
| | | | |
| Average Daily Net Assets | | Annual Fee Rate | |
| |
Up to $500 million | | | 0.600 | % |
| |
$500 million but less than $1 billion | | | 0.575 | % |
| |
$1 billion but less than $2.5 billion | | | 0.550 | % |
| |
$2.5 billion but less than $5 billion | | | 0.530 | % |
| |
$5 billion and over | | | 0.515 | % |
For the year ended December 31, 2021, the Fund incurred no investment adviser fee on such assets. To the extent that the Fund’s assets are invested in the Portfolio, the Fund is allocated its share of the Portfolio’s investment adviser fee. The Portfolio has engaged Boston Management and Research (BMR) to render investment advisory services. See Note 2 of the Portfolio’s Notes to Financial Statements which are included elsewhere in this report. EVM also serves as the administrator of the Fund, but receives no compensation.
EVM has agreed to reimburse the Fund’s expenses to the extent that total annual operating expenses (relating to ordinary operating expenses only) exceed 0.98%, 1.73% and 0.73% of the Fund’s average daily net assets for Class A, Class C and Class I, respectively. This agreement may be changed or terminated after April 30, 2022. Pursuant to this agreement, EVM was allocated $72,100 of the Fund’s operating expenses for the year ended December 31, 2021.
EVM provides sub-transfer agency and related services to the Fund pursuant to a Sub-Transfer Agency Support Services Agreement. For the year ended December 31, 2021, EVM earned $10,858 from the Fund pursuant to such agreement, which is included in transfer and dividend disbursing agent fees on the Statement of Operations. The Fund was informed that Eaton Vance Distributors, Inc. (EVD), an affiliate of EVM and the Fund’s principal underwriter, received $3,099 as its portion of the sales charge on sales of Class A shares for the year ended December 31, 2021. EVD also received distribution and service fees from Class A and Class C shares (see Note 4) and contingent deferred sales charges (see Note 5).
Trustees and officers of the Fund who are members of EVM’s or BMR’s organizations receive remuneration for their services to the Fund out of the investment adviser fee. Certain officers and Trustees of the Fund and the Portfolio are officers of the above organizations.
Eaton Vance
Stock Fund
December 31, 2021
Notes to Financial Statements — continued
4 Distribution Plans
The Fund has in effect a distribution plan for Class A shares (Class A Plan) pursuant to Rule 12b-1 under the 1940 Act. Pursuant to the Class A Plan, the Fund pays EVD a distribution and service fee of 0.25% per annum of its average daily net assets attributable to Class A shares for distribution services and facilities provided to the Fund by EVD, as well as for personal services and/or the maintenance of shareholder accounts. Distribution and service fees paid or accrued to EVD for the year ended December 31, 2021 amounted to $153,629 for Class A shares.
The Fund also has in effect a distribution plan for Class C shares (Class C Plan) pursuant to Rule 12b-1 under the 1940 Act. Pursuant to the Class C Plan, the Fund pays EVD amounts equal to 0.75% per annum of its average daily net assets attributable to Class C shares for providing ongoing distribution services and facilities to the Fund. For the year ended December 31, 2021, the Fund paid or accrued to EVD $53,641 for Class C shares.
Pursuant to the Class C Plan, the Fund also makes payments of service fees to EVD, financial intermediaries and other persons in amounts equal to 0.25% per annum of its average daily net assets attributable to that class. Service fees paid or accrued are for personal services and/or the maintenance of shareholder accounts. They are separate and distinct from the sales commissions and distribution fees payable to EVD. Service fees paid or accrued for the year ended December 31, 2021 amounted to $17,881 for Class C shares.
Distribution and service fees are subject to the limitations contained in the Financial Industry Regulatory Authority Rule 2341(d).
5 Contingent Deferred Sales Charges
A contingent deferred sales charge (CDSC) of 1% generally is imposed on redemptions of Class C shares made within 12 months of purchase. Class A shares may be subject to a 1% CDSC if redeemed within 18 months of purchase (depending on the circumstances of purchase). Generally, the CDSC is based upon the lower of the net asset value at date of redemption or date of purchase. No charge is levied on shares acquired by reinvestment of dividends or capital gain distributions. For the year ended December 31, 2021, the Fund was informed that EVD received approximately $1,000 and $300 of CDSCs paid by Class A and Class C shareholders, respectively.
6 Investment Transactions
For the year ended December 31, 2021, increases and decreases in the Fund’s investment in the Portfolio aggregated $1,252,286 and $20,883,943, respectively. In addition, a Portfolio transaction fee is imposed by the Portfolio on the combined daily inflows or outflows of the Fund and the Portfolio’s other investors as more fully described at Note 1H of the Portfolio’s financial statements included herein. Such fee is allocated to the Fund based on its pro-rata interest in the Portfolio. The amount of the Portfolio transaction fee imposed on the Fund, if any, and the allocation of such fee are presented as Other capital on the Statements of Changes in Net Assets.
7 Shares of Beneficial Interest
The Fund’s Declaration of Trust permits the Trustees to issue an unlimited number of full and fractional shares of beneficial interest (without par value). Such shares may be issued in a number of different series (such as the Fund) and classes. Transactions in Fund shares were as follows:
| | | | | | | | |
| | | Year Ended December 31, | |
| Class A | | 2021 | | | 2020 | |
| | |
Sales | | | 87,276 | | | | 300,201 | |
| | |
Issued to shareholders electing to receive payments of distributions in Fund shares | | | 283,050 | | | | 54,382 | |
| | |
Redemptions | | | (561,982 | ) | | | (610,510 | ) |
| | |
Converted from Class C shares | | | 13,720 | | | | 193,561 | |
| | |
Net decrease | | | (177,936 | ) | | | (62,366 | ) |
Eaton Vance
Stock Fund
December 31, 2021
Notes to Financial Statements — continued
| | | | | | | | |
| | | Year Ended December 31, | |
| Class C | | 2021 | | | 2020 | |
| | |
Sales | | | 33,931 | | | | 57,033 | |
| | |
Issued to shareholders electing to receive payments of distributions in Fund shares | | | 34,686 | | | | 10,608 | |
| | |
Redemptions | | | (49,461 | ) | | | (166,542 | ) |
| | |
Converted to Class A shares | | | (14,216 | ) | | | (200,172 | ) |
| | |
Net increase (decrease) | | | 4,940 | | | | (299,073 | ) |
| |
| | | Year Ended December 31, | |
| Class I | | 2021 | | | 2020 | |
| | |
Sales | | | 177,151 | | | | 711,979 | |
| | |
Issued to shareholders electing to receive payments of distributions in Fund shares | | | 205,049 | | | | 42,001 | |
| | |
Redemptions | | | (883,434 | ) | | | (859,557 | ) |
| | |
Net decrease | | | (501,234 | ) | | | (105,577 | ) |
Eaton Vance
Stock Fund
December 31, 2021
Report of Independent Registered Public Accounting Firm
To the Trustees of Eaton Vance Mutual Funds Trust and Shareholders of Eaton Vance Stock Fund:
Opinion on the Financial Statements and Financial Highlights
We have audited the accompanying statement of assets and liabilities of Eaton Vance Stock Fund (the “Fund”) (one of the funds constituting Eaton Vance Mutual Funds Trust), as of December 31, 2021, the related statement of operations for the year then ended, the statements of changes in net assets for each of the two years in the period then ended, the financial highlights for each of the five years in the period then ended, and the related notes. In our opinion, the financial statements and financial highlights present fairly, in all material respects, the financial position of the Fund as of December 31, 2021, and the results of its operations for the year then ended, the changes in its net assets for each of the two years in the period then ended, and the financial highlights for each of the five years in the period then ended, in conformity with accounting principles generally accepted in the United States of America.
Basis for Opinion
These financial statements and financial highlights are the responsibility of the Fund’s management. Our responsibility is to express an opinion on the Fund’s financial statements and financial highlights based on our audits. We are a public accounting firm registered with the Public Company Accounting Oversight Board (United States) (PCAOB) and are required to be independent with respect to the Fund in accordance with the U.S. federal securities laws and the applicable rules and regulations of the Securities and Exchange Commission and the PCAOB.
We conducted our audits in accordance with the standards of the PCAOB. Those standards require that we plan and perform the audit to obtain reasonable assurance about whether the financial statements and financial highlights are free of material misstatement, whether due to error or fraud. The Fund is not required to have, nor were we engaged to perform, an audit of its internal control over financial reporting. As part of our audits, we are required to obtain an understanding of internal control over financial reporting but not for the purpose of expressing an opinion on the effectiveness of the Fund’s internal control over financial reporting. Accordingly, we express no such opinion.
Our audits included performing procedures to assess the risks of material misstatement of the financial statements and financial highlights, whether due to error or fraud, and performing procedures that respond to those risks. Such procedures included examining, on a test basis, evidence regarding the amounts and disclosures in the financial statements and financial highlights. Our audits also included evaluating the accounting principles used and significant estimates made by management, as well as evaluating the overall presentation of the financial statements and financial highlights. We believe that our audits provide a reasonable basis for our opinion.
/s/ Deloitte & Touche LLP
Boston, Massachusetts
February 23, 2022
We have served as the auditor of one or more Eaton Vance investment companies since 1959.
Eaton Vance
Stock Fund
December 31, 2021
Federal Tax Information (Unaudited)
The Form 1099-DIV you received in February 2022 showed the tax status of all distributions paid to your account in calendar year 2021. Shareholders are advised to consult their own tax adviser with respect to the tax consequences of their investment in the Fund. As required by the Internal Revenue Code and/or regulations, shareholders must be notified regarding the status of qualified business income, qualified dividend income for individuals, the dividends received deduction for corporations and capital gains dividends.
Qualified Business Income. For the fiscal year ended December 31, 2021, the Fund designates $16,775, or up to the maximum amount of such dividends allowable pursuant to the Internal Revenue Code, as qualified business income.
Qualified Dividend Income. For the fiscal year ended December 31, 2021, the Fund designates approximately $1,238,530, or up to the maximum amount of such dividends allowable pursuant to the Internal Revenue Code, as qualified dividend income eligible for the reduced tax rate of 15%.
Dividends Received Deduction. Corporate shareholders are generally entitled to take the dividends received deduction on the portion of the Fund’s dividend distribution that qualifies under tax law. For the Fund’s fiscal 2021 ordinary income dividends, 70.85% qualifies for the corporate dividends received deduction.
Capital Gains Dividends. The Fund hereby designates as a capital gain dividend with respect to the taxable year ended December 31, 2021, $15,752,124 or, if subsequently determined to be different, the net capital gain of such year.
Stock Portfolio
December 31, 2021
Portfolio of Investments
| | | | | | | | |
| Common Stocks — 94.9% | |
| Security | | Shares | | | Value | |
|
| Auto Components — 1.6% | |
| | |
Aptiv PLC(1) | | | 86,456 | | | $ | 14,260,917 | |
| |
| | | | $ | 14,260,917 | |
|
| Automobiles — 0.9% | |
| | |
Tesla, Inc.(1) | | | 7,200 | | | $ | 7,608,816 | |
| |
| | | | $ | 7,608,816 | |
|
| Banks — 4.4% | |
| | |
PNC Financial Services Group, Inc. (The) | | | 90,970 | | | $ | 18,241,304 | |
| | |
Wells Fargo & Co. | | | 417,210 | | | | 20,017,736 | |
| |
| | | | $ | 38,259,040 | |
|
| Beverages — 3.4% | |
| | |
Coca-Cola Co. (The) | | | 257,246 | | | $ | 15,231,536 | |
| | |
Coca-Cola Europacific Partners PLC | | | 250,060 | | | | 13,985,856 | |
| |
| | | | $ | 29,217,392 | |
|
| Biotechnology — 3.1% | |
| | |
AbbVie, Inc. | | | 144,416 | | | $ | 19,553,926 | |
| | |
Neurocrine Biosciences, Inc.(1) | | | 89,416 | | | | 7,615,561 | |
| |
| | | | $ | 27,169,487 | |
|
| Building Products — 1.1% | |
| | |
AZEK Co., Inc. (The)(1) | | | 200,950 | | | $ | 9,291,928 | |
| |
| | | | $ | 9,291,928 | |
|
| Capital Markets — 7.3% | |
| | |
Goldman Sachs Group, Inc. (The) | | | 31,190 | | | $ | 11,931,735 | |
| | |
Intercontinental Exchange, Inc. | | | 110,204 | | | | 15,072,601 | |
| | |
S&P Global, Inc. | | | 40,636 | | | | 19,177,347 | |
| | |
Tradeweb Markets, Inc., Class A | | | 171,429 | | | | 17,166,900 | |
| |
| | | | $ | 63,348,583 | |
|
| Commercial Services & Supplies — 1.2% | |
| | |
Waste Management, Inc. | | | 61,978 | | | $ | 10,344,128 | |
| |
| | | | $ | 10,344,128 | |
|
| Containers & Packaging — 1.0% | |
| | |
AptarGroup, Inc. | | | 72,454 | | | $ | 8,874,166 | |
| |
| | | | $ | 8,874,166 | |
| | | | | | | | |
| Security | | Shares | | | Value | |
|
| Electric Utilities — 1.6% | |
| | |
NextEra Energy, Inc. | | | 148,440 | | | $ | 13,858,358 | |
| |
| | | | $ | 13,858,358 | |
|
| Electrical Equipment — 1.2% | |
| | |
AMETEK, Inc. | | | 73,256 | | | $ | 10,771,562 | |
| |
| | | | $ | 10,771,562 | |
|
| Electronic Equipment, Instruments & Components — 1.4% | |
| | |
TE Connectivity, Ltd. | | | 76,400 | | | $ | 12,326,376 | |
| |
| | | | $ | 12,326,376 | |
|
| Entertainment — 1.2% | |
| | |
Walt Disney Co. (The)(1) | | | 66,982 | | | $ | 10,374,842 | |
| |
| | | | $ | 10,374,842 | |
|
| Equity Real Estate Investment Trusts (REITs) — 2.8% | |
| | |
EastGroup Properties, Inc. | | | 46,522 | | | $ | 10,600,038 | |
| | |
Lamar Advertising Co., Class A | | | 112,290 | | | | 13,620,777 | |
| |
| | | | $ | 24,220,815 | |
|
| Food & Staples Retailing — 1.7% | |
| | |
Sysco Corp. | | | 189,990 | | | $ | 14,923,715 | |
| |
| | | | $ | 14,923,715 | |
|
| Health Care Equipment & Supplies — 1.9% | |
| | |
Boston Scientific Corp.(1) | | | 254,436 | | | $ | 10,808,441 | |
| | |
Teleflex, Inc. | | | 18,500 | | | | 6,076,880 | |
| |
| | | | $ | 16,885,321 | |
|
| Health Care Providers & Services — 1.8% | |
| | |
Anthem, Inc. | | | 33,224 | | | $ | 15,400,653 | |
| |
| | | | $ | 15,400,653 | |
|
| Hotels, Restaurants & Leisure — 1.3% | |
| | |
Marriott International, Inc., Class A(1) | | | 69,128 | | | $ | 11,422,711 | |
| |
| | | | $ | 11,422,711 | |
|
| Interactive Media & Services — 6.7% | |
| | |
Alphabet, Inc., Class C(1) | | | 16,589 | | | $ | 48,001,764 | |
| | |
Meta Platforms, Inc., Class A(1) | | | 32,076 | | | | 10,788,763 | |
| |
| | | | $ | 58,790,527 | |
| | | | |
| | 19 | | See Notes to Financial Statements. |
Stock Portfolio
December 31, 2021
Portfolio of Investments — continued
| | | | | | | | |
| Security | | Shares | | | Value | |
|
| Internet & Direct Marketing Retail — 5.4% | |
| | |
Amazon.com, Inc.(1) | | | 13,996 | | | $ | 46,667,423 | |
| |
| | | | $ | 46,667,423 | |
|
| IT Services — 3.7% | |
| | |
Automatic Data Processing, Inc. | | | 60,796 | | | $ | 14,991,078 | |
| | |
Visa, Inc., Class A | | | 81,030 | | | | 17,560,011 | |
| |
| | | | $ | 32,551,089 | |
|
| Life Sciences Tools & Services — 3.9% | |
| | |
Danaher Corp. | | | 51,992 | | | $ | 17,105,888 | |
| | |
Thermo Fisher Scientific, Inc. | | | 25,034 | | | | 16,703,686 | |
| |
| | | | $ | 33,809,574 | |
|
| Machinery — 1.1% | |
| | |
Stanley Black & Decker, Inc. | | | 51,938 | | | $ | 9,796,546 | |
| |
| | | | $ | 9,796,546 | |
|
| Oil, Gas & Consumable Fuels — 2.1% | |
| | |
ConocoPhillips | | | 251,256 | | | $ | 18,135,658 | |
| |
| | | | $ | 18,135,658 | |
|
| Pharmaceuticals — 3.4% | |
| | |
Eli Lilly & Co. | | | 49,100 | | | $ | 13,562,402 | |
| | |
Pfizer, Inc. | | | 96,400 | | | | 5,692,420 | |
| | |
Zoetis, Inc. | | | 41,922 | | | | 10,230,226 | |
| |
| | | | $ | 29,485,048 | |
|
| Professional Services — 2.2% | |
| | |
Booz Allen Hamilton Holding Corp. | | | 113,090 | | | $ | 9,588,901 | |
| | |
Clarivate PLC(1) | | | 421,188 | | | | 9,906,342 | |
| |
| | | | $ | 19,495,243 | |
|
| Road & Rail — 1.5% | |
| | |
Union Pacific Corp. | | | 52,424 | | | $ | 13,207,178 | |
| |
| | | | $ | 13,207,178 | |
|
| Semiconductors & Semiconductor Equipment — 6.3% | |
| | |
Analog Devices, Inc. | | | 91,086 | | | $ | 16,010,186 | |
| | |
Lam Research Corp. | | | 16,200 | | | | 11,650,230 | |
| | |
NVIDIA Corp. | | | 25,500 | | | | 7,499,805 | |
| | |
Taiwan Semiconductor Manufacturing Co., Ltd. ADR | | | 69,039 | | | | 8,306,082 | |
| | |
Texas Instruments, Inc. | | | 62,347 | | | | 11,750,539 | |
| |
| | | | $ | 55,216,842 | |
| | | | | | | | |
| Security | | Shares | | | Value | |
|
| Software — 9.9% | |
| | |
Bill.com Holdings, Inc.(1) | | | 31,200 | | | $ | 7,773,480 | |
| | |
Intuit, Inc. | | | 24,254 | | | | 15,600,658 | |
| | |
Microsoft Corp. | | | 187,598 | | | | 63,092,959 | |
| |
| | | | $ | 86,467,097 | |
|
| Specialty Retail — 1.7% | |
| | |
TJX Cos., Inc. (The) | | | 198,134 | | | $ | 15,042,333 | |
| |
| | | | $ | 15,042,333 | |
|
| Technology Hardware, Storage & Peripherals — 6.0% | |
| | |
Apple, Inc. | | | 293,484 | | | $ | 52,113,954 | |
| |
| | | | $ | 52,113,954 | |
|
| Textiles, Apparel & Luxury Goods — 0.9% | |
| | |
Deckers Outdoor Corp.(1) | | | 20,518 | | | $ | 7,515,949 | |
| |
| | | | $ | 7,515,949 | |
|
| Wireless Telecommunication Services — 1.2% | |
| | |
T-Mobile US, Inc.(1) | | | 86,208 | | | $ | 9,998,404 | |
| |
| | | | $ | 9,998,404 | |
| |
Total Common Stocks
(identified cost $507,783,336) | | | $ | 826,851,675 | |
|
| Short-Term Investments — 0.3% | |
| Description | | Units | | | Value | |
| | |
Eaton Vance Cash Reserves Fund, LLC, 0.08%(2) | | | 2,248,701 | | | $ | 2,248,476 | |
| |
Total Short-Term Investments
(identified cost $2,248,476) | | | $ | 2,248,476 | |
| |
Total Investments — 95.2%
(identified cost $510,031,812) | | | $ | 829,100,151 | |
| |
Other Assets, Less Liabilities — 4.8% | | | $ | 42,209,395 | |
| |
Net Assets — 100.0% | | | $ | 871,309,546 | |
The percentage shown for each investment category in the Portfolio of Investments is based on net assets.
| (1) | Non-income producing security. |
| (2) | Affiliated investment company, available to Eaton Vance portfolios and funds, which invests in high quality, U.S. dollar denominated money market instruments. The rate shown is the annualized seven-day yield as of December 31, 2021. |
Abbreviations:
| | | | |
| | |
| ADR | | – | | American Depositary Receipt |
| | | | |
| | 20 | | See Notes to Financial Statements. |
Stock Portfolio
December 31, 2021
Statement of Assets and Liabilities
| | | | |
| Assets | | December 31, 2021 | |
| |
Unaffiliated investments, at value (identified cost, $507,783,336) | | $ | 826,851,675 | |
| |
Affiliated investment, at value (identified cost, $2,248,476) | | | 2,248,476 | |
| |
Dividends receivable | | | 244,593 | |
| |
Dividends receivable from affiliated investment | | | 93 | |
| |
Receivable for investments sold | | | 42,354,951 | |
| |
Tax reclaims receivable | | | 135,816 | |
| |
Total assets | | $ | 871,835,604 | |
| |
| Liabilities | | | | |
| |
Payable to affiliates: | | | | |
| |
Investment adviser fee | | $ | 429,926 | |
| |
Trustees’ fees | | | 10,295 | |
| |
Accrued expenses | | | 85,837 | |
| |
Total liabilities | | $ | 526,058 | |
| |
Net Assets applicable to investors’ interest in Portfolio | | $ | 871,309,546 | |
| | | | |
| | 21 | | See Notes to Financial Statements. |
Stock Portfolio
December 31, 2021
Statement of Operations
| | | | |
| Investment Income | | Year Ended
December 31, 2021 | |
| |
Dividends (net of foreign taxes, $154,516) | | $ | 9,906,044 | |
| |
Dividends from affiliated investment | | | 1,479 | |
| |
Total investment income | | $ | 9,907,523 | |
| |
| Expenses | | | | |
| |
Investment adviser fee | | $ | 4,970,765 | |
| |
Trustees’ fees and expenses | | | 41,836 | |
| |
Custodian fee | | | 204,317 | |
| |
Legal and accounting services | | | 52,438 | |
| |
Miscellaneous | | | 24,624 | |
| |
Total expenses | | $ | 5,293,980 | |
| |
Net investment income | | $ | 4,613,543 | |
| |
| Realized and Unrealized Gain (Loss) | | | | |
| |
Net realized gain (loss) — | | | | |
| |
Investment transactions | | $ | 123,850,522 | (1) |
| |
Investment transactions — affiliated investment | | | (1,372 | ) |
| |
Foreign currency transactions | | | (11,938 | ) |
| |
Net realized gain | | $ | 123,837,212 | |
| |
Change in unrealized appreciation (depreciation) — | | | | |
| |
Investments | | $ | 46,450,706 | |
| |
Foreign currency | | | (7,691 | ) |
| |
Net change in unrealized appreciation (depreciation) | | $ | 46,443,015 | |
| |
Net realized and unrealized gain | | $ | 170,280,227 | |
| |
Net increase in net assets from operations | | $ | 174,893,770 | |
| (1) | Includes $3,096,043 of net realized gains from redemptions in-kind. |
| | | | |
| | 22 | | See Notes to Financial Statements. |
Stock Portfolio
December 31, 2021
Statements of Changes in Net Assets
| | | | | | | | |
| | | Year Ended December 31, | |
| Increase (Decrease) in Net Assets | | 2021 | | | 2020 | |
| | |
From operations — | | | | | | | | |
| | |
Net investment income | | $ | 4,613,543 | | | $ | 5,837,934 | |
| | |
Net realized gain | | | 123,837,212 | (1) | | | 18,275,199 | |
| | |
Net change in unrealized appreciation (depreciation) | | | 46,443,015 | | | | 96,276,139 | |
| | |
Net increase in net assets from operations | | $ | 174,893,770 | | | $ | 120,389,272 | |
| | |
Capital transactions — | | | | | | | | |
| | |
Contributions | | $ | 23,356,815 | | | $ | 78,327,454 | |
| | |
Withdrawals | | | (131,961,931 | ) | | | (78,095,172 | ) |
| | |
Portfolio transaction fee | | | 574,923 | | | | 276,897 | |
| | |
Net increase (decrease) in net assets from capital transactions | | $ | (108,030,193 | ) | | $ | 509,179 | |
| | |
Net increase in net assets | | $ | 66,863,577 | | | $ | 120,898,451 | |
| | |
| Net Assets | | | | | | | | |
| | |
At beginning of year | | $ | 804,445,969 | | | $ | 683,547,518 | |
| | |
At end of year | | $ | 871,309,546 | | | $ | 804,445,969 | |
| (1) | Includes $3,096,043 of net realized gains from redemptions in-kind. |
| | | | |
| | 23 | | See Notes to Financial Statements. |
Stock Portfolio
December 31, 2021
Financial Highlights
| | | | | | | | | | | | | | | | | | | | |
| | | Year Ended December 31, | |
| Ratios/Supplemental Data | | 2021 | | | 2020 | | | 2019 | | | 2018 | | | 2017 | |
| | | | | |
Ratios (as a percentage of average daily net assets): | | | | | | | | | | | | | | | | | | | | |
| | | | | |
Expenses | | | 0.63 | % | | | 0.64 | % | | | 0.63 | % | | | 0.64 | % | | | 0.64 | % |
| | | | | |
Net investment income | | | 0.55 | % | | | 0.84 | % | | | 0.99 | % | | | 1.14 | % | | | 1.38 | % |
| | | | | |
Portfolio Turnover | | | 44 | % | | | 70 | % | | | 55 | % | | | 90 | % | | | 101 | % |
| | | | | |
Total Return | | | 23.21 | % | | | 18.61 | % | | | 35.47 | % | | | (5.57 | )% | | | 20.31 | % |
| | | | | |
Net assets, end of year (000’s omitted) | | $ | 871,310 | | | $ | 804,446 | | | $ | 683,548 | | | $ | 516,615 | | | $ | 647,405 | |
| | | | |
| | 24 | | See Notes to Financial Statements. |
Stock Portfolio
December 31, 2021
Notes to Financial Statements
1 Significant Accounting Policies
Stock Portfolio (the Portfolio) is a Massachusetts business trust registered under the Investment Company Act of 1940, as amended (the 1940 Act), as a diversified, open-end management investment company. The Portfolio’s investment objective is to achieve long-term capital appreciation by investing in a diversified portfolio of equity securities. The Declaration of Trust permits the Trustees to issue interests in the Portfolio. At December 31, 2021, Eaton Vance Stock Fund, Eaton Vance Stock NextShares and Eaton Vance Balanced Fund held an interest of 12.8%, 0.2% and 87.1%, respectively, in the Portfolio.
The following is a summary of significant accounting policies of the Portfolio. The policies are in conformity with accounting principles generally accepted in the United States of America (U.S. GAAP). The Portfolio is an investment company and follows accounting and reporting guidance in the Financial Accounting Standards Board (FASB) Accounting Standards Codification Topic 946.
A Investment Valuation — The following methodologies are used to determine the market value or fair value of investments.
Equity Securities. Equity securities listed on a U.S. securities exchange generally are valued at the last sale or closing price on the day of valuation or, if no sales took place on such date, at the mean between the closing bid and ask prices on the exchange where such securities are principally traded. Equity securities listed on the NASDAQ National Market System are valued at the NASDAQ official closing price. Unlisted or listed securities for which closing sales prices or closing quotations are not available are valued at the mean between the latest available bid and ask prices.
Foreign Securities and Currencies. Foreign securities and currencies are valued in U.S. dollars, based on foreign currency exchange rate quotations supplied by a third party pricing service. The pricing service uses a proprietary model to determine the exchange rate. Inputs to the model include reported trades and implied bid/ask spreads. The daily valuation of exchange-traded foreign securities generally is determined as of the close of trading on the principal exchange on which such securities trade. Events occurring after the close of trading on foreign exchanges may result in adjustments to the valuation of foreign securities to more accurately reflect their fair value as of the close of regular trading on the New York Stock Exchange. When valuing foreign equity securities that meet certain criteria, the Portfolio’s Trustees have approved the use of a fair value service that values such securities to reflect market trading that occurs after the close of the applicable foreign markets of comparable securities or other instruments that have a strong correlation to the fair-valued securities.
Affiliated Fund. The Portfolio may invest in Eaton Vance Cash Reserves Fund, LLC (Cash Reserves Fund), an affiliated investment company managed by Eaton Vance Management (EVM). While Cash Reserves Fund is not a registered money market mutual fund, it conducts all of its investment activities in accordance with the requirements of Rule 2a-7 under the 1940 Act. Investments in Cash Reserves Fund are valued at the closing net asset value per unit on the valuation day. Cash Reserves Fund generally values its investment securities based on available market quotations provided by a third party pricing service.
Fair Valuation. Investments for which valuations or market quotations are not readily available or are deemed unreliable are valued at fair value using methods determined in good faith by or at the direction of the Trustees of the Portfolio in a manner that most fairly reflects the security’s “fair value”, which is the amount that the Portfolio might reasonably expect to receive for the security upon its current sale in the ordinary course. Each such determination is based on a consideration of relevant factors, which are likely to vary from one pricing context to another. These factors may include, but are not limited to, the type of security, the existence of any contractual restrictions on the security’s disposition, the price and extent of public trading in similar securities of the issuer or of comparable companies or entities, quotations or relevant information obtained from broker/dealers or other market participants, information obtained from the issuer, analysts, and/or the appropriate stock exchange (for exchange-traded securities), an analysis of the company’s or entity’s financial statements, and an evaluation of the forces that influence the issuer and the market(s) in which the security is purchased and sold.
B Investment Transactions — Investment transactions for financial statement purposes are accounted for on a trade date basis. Realized gains and losses on investments sold are determined on the basis of identified cost.
C Income — Dividend income is recorded on the ex-dividend date for dividends received in cash and/or securities. However, if the ex-dividend date has passed, certain dividends from foreign securities are recorded as the Portfolio is informed of the ex-dividend date. Withholding taxes on foreign dividends and capital gains have been provided for in accordance with the Portfolio’s understanding of the applicable countries’ tax rules and rates.
D Federal Taxes — The Portfolio has elected to be treated as a partnership for federal tax purposes. No provision is made by the Portfolio for federal or state taxes on any taxable income of the Portfolio because each investor in the Portfolio is ultimately responsible for the payment of any taxes on its share of taxable income. Since at least one of the Portfolio’s investors is a regulated investment company that invests all or substantially all of its assets in the Portfolio, the Portfolio normally must satisfy the applicable source of income and diversification requirements (under the Internal Revenue Code) in order for its investors to satisfy them. The Portfolio will allocate, at least annually among its investors, each investor’s distributive share of the Portfolio’s net investment income, net realized capital gains and losses and any other items of income, gain, loss, deduction or credit.
As of December 31, 2021, the Portfolio had no uncertain tax positions that would require financial statement recognition, de-recognition, or disclosure. The Portfolio files a U.S. federal income tax return annually after its fiscal year-end, which is subject to examination by the Internal Revenue Service for a period of three years from the date of filing.
E Foreign Currency Translation — Investment valuations, other assets, and liabilities initially expressed in foreign currencies are translated each business day into U.S. dollars based upon current exchange rates. Purchases and sales of foreign investment securities and income and expenses denominated in
Stock Portfolio
December 31, 2021
Notes to Financial Statements — continued
foreign currencies are translated into U.S. dollars based upon currency exchange rates in effect on the respective dates of such transactions. Recognized gains or losses on investment transactions attributable to changes in foreign currency exchange rates are recorded for financial statement purposes as net realized gains and losses on investments. That portion of unrealized gains and losses on investments that results from fluctuations in foreign currency exchange rates is not separately disclosed.
F Use of Estimates — The preparation of the financial statements in conformity with U.S. GAAP requires management to make estimates and assumptions that affect the reported amounts of assets and liabilities at the date of the financial statements and the reported amounts of income and expense during the reporting period. Actual results could differ from those estimates.
G Indemnifications — Under the Portfolio’s organizational documents, its officers and Trustees may be indemnified against certain liabilities and expenses arising out of the performance of their duties to the Portfolio. Under Massachusetts law, if certain conditions prevail, interestholders in the Portfolio could be deemed to have personal liability for the obligations of the Portfolio. However, the Portfolio’s Declaration of Trust contains an express disclaimer of liability on the part of Portfolio interestholders. Additionally, in the normal course of business, the Portfolio enters into agreements with service providers that may contain indemnification clauses. The Portfolio’s maximum exposure under these arrangements is unknown as this would involve future claims that may be made against the Portfolio that have not yet occurred.
H Capital Transactions — To seek to protect the Portfolio (and, indirectly, other investors in the Portfolio) against the costs of accommodating investor inflows and outflows, the Portfolio imposes a fee (“Portfolio transaction fee”) on inflows and outflows by Portfolio investors. The Portfolio transaction fee is sized to cover the estimated cost to the Portfolio of, in connection with issuing interests, converting the cash and/or other instruments it receives to the desired composition and, in connection with redeeming its interests, converting Portfolio holdings to cash and/or other instruments to be distributed. Such fee, which may vary over time, is limited to amounts that have been authorized by the Board of Trustees and determined by EVM to be appropriate. The maximum Portfolio transaction fee is 2% of the amount of net contributions or withdrawals. The Portfolio transaction fee is recorded as a component of capital transactions on the Statements of Changes in Net Assets.
2 Investment Adviser Fee and Other Transactions with Affiliates
The investment adviser fee is earned by Boston Management and Research (BMR) as compensation for investment advisory services rendered to the Portfolio. On March 1, 2021, Morgan Stanley acquired Eaton Vance Corp. (the “Transaction”) and BMR became an indirect, wholly-owned subsidiary of Morgan Stanley. In connection with the Transaction, the Portfolio entered into a new investment advisory agreement (the “New Agreement”) with BMR, which took effect on March 1, 2021. The Portfolio’s prior fee reduction agreement was incorporated into the New Agreement. Pursuant to the New Agreement (and the Portfolio’s investment advisory agreement and related fee reduction agreement with BMR in effect prior to March 1, 2021), the fee is computed at an annual rate as a percentage of the Portfolio’s average daily net assets as follows and is payable monthly:
| | | | |
| Average Daily Net Assets | | Annual Fee Rate | |
| |
Up to $500 million | | | 0.600 | % |
| |
$500 million but less than $1 billion | | | 0.575 | % |
| |
$1 billion but less than $2.5 billion | | | 0.550 | % |
| |
$2.5 billion but less than $5 billion | | | 0.530 | % |
| |
$5 billion and over | | | 0.515 | % |
For the year ended December 31, 2021, the Portfolio’s investment adviser fee amounted to $4,970,765 or 0.59% of the Portfolio’s average daily net assets. The Portfolio may invest its cash in Cash Reserves Fund. EVM does not currently receive a fee for advisory services provided to Cash Reserves Fund.
Trustees and officers of the Portfolio who are members of EVM’s or BMR’s organizations receive remuneration for their services to the Portfolio out of the investment adviser fee. Trustees of the Portfolio who are not affiliated with the investment adviser may elect to defer receipt of all or a percentage of their annual fees in accordance with the terms of the Trustees Deferred Compensation Plan. For the year ended December 31, 2021, no significant amounts have been deferred. Certain officers and Trustees of the Portfolio are officers of the above organizations.
3 Purchases and Sales of Investments
Purchases and sales of investments, other than short-term obligations and in-kind transactions, aggregated $368,242,025 and $508,852,092, respectively, for the year ended December 31, 2021. In-kind contributions and withdrawals for the year ended December 31, 2021 aggregated none and $6,582,209, respectively.
Stock Portfolio
December 31, 2021
Notes to Financial Statements — continued
4 Federal Income Tax Basis of Investments
The cost and unrealized appreciation (depreciation) of investments of the Portfolio at December 31, 2021, as determined on a federal income tax basis, were as follows:
| | | | |
| |
Aggregate cost | | $ | 511,667,420 | |
| |
Gross unrealized appreciation | | $ | 323,672,440 | |
| |
Gross unrealized depreciation | | | (6,239,709 | ) |
| |
Net unrealized appreciation | | $ | 317,432,731 | |
5 Line of Credit
The Portfolio participates with other portfolios and funds managed by EVM and its affiliates in an $800 million unsecured line of credit agreement with a group of banks, which is in effect through October 25, 2022. Borrowings are made by the Portfolio solely for temporary purposes related to redemptions and other short-term cash needs. Interest is charged to the Portfolio based on its borrowings at an amount above either the Secured Overnight Financing Rate (SOFR) or Federal Funds rate. In addition, a fee computed at an annual rate of 0.15% on the daily unused portion of the line of credit is allocated among the participating portfolios and funds at the end of each quarter. In connection with the renewal of the agreement in October 2021, an arrangement fee totaling $150,000 was incurred that was allocated to the participating portfolios and funds. Because the line of credit is not available exclusively to the Portfolio, it may be unable to borrow some or all of its requested amounts at any particular time. The Portfolio did not have any significant borrowings or allocated fees during the year ended December 31, 2021.
6 Investments in Affiliated Funds
At December 31, 2021, the value of the Portfolio’s investment in affiliated funds was $2,248,476, which represents 0.3% of the Portfolio’s net assets. Transactions in affiliated funds by the Portfolio for the year ended December 31, 2021 were as follows:
| | | | | | | | | | | | | | | | | | | | | | | | | | | | | | | | |
| Name | | Value,
beginning
of period | | | Purchases | | | Sales
proceeds | | | Net
realized
gain (loss) | | | Change in
unrealized
appreciation
(depreciation) | | | Value, end
of period | | | Dividend
income | | | Units, end
of period | |
|
Short-Term Investments | |
| | | | | | | | |
Eaton Vance Cash Reserves Fund, LLC | | $ | 6,475,259 | | | $ | 122,109,454 | | | $ | (126,334,865 | ) | | $ | (1,372 | ) | | $ | — | | | $ | 2,248,476 | | | $ | 1,479 | | | | 2,248,701 | |
7 Fair Value Measurements
Under generally accepted accounting principles for fair value measurements, a three-tier hierarchy to prioritize the assumptions, referred to as inputs, is used in valuation techniques to measure fair value. The three-tier hierarchy of inputs is summarized in the three broad levels listed below.
| • | | Level 1 – quoted prices in active markets for identical investments |
| • | | Level 2 – other significant observable inputs (including quoted prices for similar investments, interest rates, prepayment speeds, credit risk, etc.) |
| • | | Level 3 – significant unobservable inputs (including a fund’s own assumptions in determining the fair value of investments) |
In cases where the inputs used to measure fair value fall in different levels of the fair value hierarchy, the level disclosed is determined based on the lowest level input that is significant to the fair value measurement in its entirety. The inputs or methodology used for valuing securities are not necessarily an indication of the risk associated with investing in those securities.
Stock Portfolio
December 31, 2021
Notes to Financial Statements — continued
At December 31, 2021, the hierarchy of inputs used in valuing the Portfolio’s investments, which are carried at value, were as follows:
| | | | | | | | | | | | | | | | |
| Asset Description | | Level 1 | | | Level 2 | | | Level 3 | | | Total | |
| | | | |
Common Stocks | | $ | 826,851,675 | * | | $ | — | | | $ | — | | | $ | 826,851,675 | |
| | | | |
Short-Term Investments | | | — | | | | 2,248,476 | | | | — | | | | 2,248,476 | |
| | | | |
Total Investments | | $ | 826,851,675 | | | $ | 2,248,476 | | | $ | — | | | $ | 829,100,151 | |
| * | The level classification by major category of investments is the same as the category presentation in the Portfolio of Investments. |
8 Risks and Uncertainties
Pandemic Risk
An outbreak of respiratory disease caused by a novel coronavirus was first detected in China in late 2019 and subsequently spread internationally. This coronavirus has resulted in closing borders, enhanced health screenings, changes to healthcare service preparation and delivery, quarantines, cancellations, disruptions to supply chains and customer activity, as well as general concern and uncertainty. Health crises caused by outbreaks, such as the coronavirus outbreak, may exacerbate other pre-existing political, social and economic risks and disrupt normal market conditions and operations. The impact of this outbreak has negatively affected the worldwide economy, the economies of individual countries, individual companies, and the market in general, and may continue to do so in significant and unforeseen ways, as may other epidemics and pandemics that may arise in the future. Any such impact could adversely affect the Portfolio’s performance, or the performance of the securities in which the Portfolio invests.
Eaton Vance
Stock Portfolio
December 31, 2021
Report of Independent Registered Public Accounting Firm
To the Trustees and Investors of Stock Portfolio:
Opinion on the Financial Statements and Financial Highlights
We have audited the accompanying statement of assets and liabilities of Stock Portfolio (the “Portfolio”), including the portfolio of investments, as of December 31, 2021, the related statement of operations for the year then ended, the statements of changes in net assets for each of the two years in the period then ended, the financial highlights for each of the five years in the period then ended, and the related notes. In our opinion, the financial statements and financial highlights present fairly, in all material respects, the financial position of the Portfolio as of December 31, 2021, and the results of its operations for the year then ended, the changes in its net assets for each of the two years in the period then ended, and the financial highlights for each of the five years in the period then ended, in conformity with accounting principles generally accepted in the United States of America.
Basis for Opinion
These financial statements and financial highlights are the responsibility of the Portfolio’s management. Our responsibility is to express an opinion on the Portfolio’s financial statements and financial highlights based on our audits. We are a public accounting firm registered with the Public Company Accounting Oversight Board (United States) (PCAOB) and are required to be independent with respect to the Portfolio in accordance with the U.S. federal securities laws and the applicable rules and regulations of the Securities and Exchange Commission and the PCAOB.
We conducted our audits in accordance with the standards of the PCAOB. Those standards require that we plan and perform the audit to obtain reasonable assurance about whether the financial statements and financial highlights are free of material misstatement, whether due to error or fraud. The Portfolio is not required to have, nor were we engaged to perform, an audit of its internal control over financial reporting. As part of our audits, we are required to obtain an understanding of internal control over financial reporting but not for the purpose of expressing an opinion on the effectiveness of the Portfolio’s internal control over financial reporting. Accordingly, we express no such opinion.
Our audits included performing procedures to assess the risks of material misstatement of the financial statements and financial highlights, whether due to error or fraud, and performing procedures that respond to those risks. Such procedures included examining, on a test basis, evidence regarding the amounts and disclosures in the financial statements and financial highlights. Our audits also included evaluating the accounting principles used and significant estimates made by management, as well as evaluating the overall presentation of the financial statements and financial highlights. Our procedures included confirmation of securities owned as of December 31, 2021, by correspondence with the custodian and brokers; when replies were not received from brokers, we performed other auditing procedures. We believe that our audits provide a reasonable basis for our opinion.
/s/ Deloitte & Touche LLP
Boston, Massachusetts
February 23, 2022
We have served as the auditor of one or more Eaton Vance investment companies since 1959.
Eaton Vance
Stock Fund
December 31, 2021
Management and Organization
Fund Management. The Trustees of Eaton Vance Mutual Funds Trust (the Trust) and Stock Portfolio (the Portfolio) are responsible for the overall management and supervision of the Trust and the Portfolio’s affairs. The Board members and officers of the Trust and the Portfolio are listed below. Except as indicated, each individual has held the office shown or other offices in the same company for the last five years. Board members hold indefinite terms of office. Each Trustee holds office until his or her successor is elected and qualified, subject to a prior death, resignation, retirement, disqualification or removal. Under the terms of the Fund’s and the Portfolio’s current Trustee retirement policy, an Independent Trustee must retire and resign as a Trustee on the earlier of: (i) the first day of July following his or her 74th birthday; or (ii), with limited exception, December 31st of the 20th year in which he or she has served as a Trustee. However, if such retirement and resignation would cause the Fund or Portfolio to be out of compliance with Section 16 of the 1940 Act or any other regulations or guidance of the SEC, then such retirement and resignation will not become effective until such time as action has been taken for the Fund or Portfolio to be in compliance therewith. The “noninterested Trustees” consist of those Trustees who are not “interested persons” of the Trust and the Portfolio, as that term is defined under the 1940 Act. The business address of each Board member and officer is Two International Place, Boston, Massachusetts 02110. As used below, “BMR” refers to Boston Management and Research, “EVC” refers to Eaton Vance Corp., “EV” refers to EV LLC, “EVM” refers to Eaton Vance Management and “EVD” refers to Eaton Vance Distributors, Inc. EV is the trustee of each of EVM and BMR. Effective March 1, 2021, each of EVM, BMR, EVD and EV are indirect, wholly owned subsidiaries of Morgan Stanley. Each officer affiliated with EVM may hold a position with other EVM affiliates that is comparable to his or her position with EVM listed below. Each Trustee oversees 138 funds (with the exception of Messrs. Faust and Wennerholm and Ms. Frost who oversee 137 funds) in the Eaton Vance fund complex (including both funds and portfolios in a hub and spoke structure).
| | | | | | |
| Name and Year of Birth | | Trust/Portfolio Position(s) | | Length of Service | | Principal Occupation(s) and Other Directorships
During Past Five Years and Other Relevant Experience |
|
| Interested Trustee |
| | | |
Thomas E. Faust Jr. 1958 | | Trustee | | Since 2007 | | Chairman of Morgan Stanley Investment Management, Inc. (MSIM), member of the Board of Managers and President of EV, Chief Executive Officer of EVM and BMR, and Director of EVD. Formerly, Chairman, Chief Executive Officer and President of EVC. Mr. Faust is an interested person because of his positions with MSIM, BMR, EVM, EVD, and EV, which are affiliates of the Trust and the Portfolio, and his former position with EVC, which was an affiliate of the Trust and the Portfolio prior to March 1, 2021. Other Directorships. Formerly, Director of EVC (2007-2021) and Hexavest Inc. (investment management firm) (2012-2021). |
|
| Noninterested Trustees |
| | | |
Mark R. Fetting 1954 | | Trustee | | Since 2016 | | Private investor. Formerly held various positions at Legg Mason, Inc. (investment management firm) (2000-2012), including President, Chief Executive Officer, Director and Chairman (2008-2012), Senior Executive Vice President (2004-2008) and Executive Vice President (2001-2004). Formerly, President of Legg Mason family of funds (2001-2008). Formerly, Division President and Senior Officer of Prudential Financial Group, Inc. and related companies (investment management firm) (1991-2000). Other Directorships. None. |
| | | |
Cynthia E. Frost 1961 | | Trustee | | Since 2014 | | Private investor. Formerly, Chief Investment Officer of Brown University (university endowment) (2000-2012). Formerly, Portfolio Strategist for Duke Management Company (university endowment manager) (1995-2000). Formerly, Managing Director, Cambridge Associates (investment consulting company) (1989-1995). Formerly, Consultant, Bain and Company (management consulting firm) (1987-1989). Formerly, Senior Equity Analyst, BA Investment Management Company (1983-1985). Other Directorships. None. |
| | | |
George J. Gorman 1952 | | Chairperson of the Board and Trustee | | Since 2021 (Chairperson) and 2014 (Trustee) | | Principal at George J. Gorman LLC (consulting firm). Formerly, Senior Partner at Ernst & Young LLP (a registered public accounting firm) (1974-2009). Other Directorships. None. |
| | | |
Valerie A. Mosley 1960 | | Trustee | | Since 2014 | | Chairwoman and Chief Executive Officer of Valmo Ventures (a consulting and investment firm). Founder of Upward Wealth, Inc., dba BrightUP, a fintech platform. Formerly, Partner and Senior Vice President, Portfolio Manager and Investment Strategist at Wellington Management Company, LLP (investment management firm) (1992-2012). Formerly, Chief Investment Officer, PG Corbin Asset Management (1990-1992). Formerly worked in institutional corporate bond sales at Kidder Peabody (1986-1990). Other Directorships. Director of DraftKings, Inc. (digital sports entertainment and gaming company) (since September 2020). Director of Groupon, Inc. (e-commerce provider) (since April 2020). Director of Envestnet, Inc. (provider of intelligent systems for wealth management and financial wellness) (since 2018). Formerly, Director of Dynex Capital, Inc. (mortgage REIT) (2013-2020). |
Eaton Vance
Stock Fund
December 31, 2021
Management and Organization — continued
| | | | | | |
| Name and Year of Birth | | Trust/Portfolio Position(s) | | Length of Service | | Principal Occupation(s) and Other Directorships
During Past Five Years and Other Relevant Experience |
|
| Noninterested Trustees (continued) |
| | | |
William H. Park 1947 | | Trustee | | Since 2003 | | Private investor. Formerly, Consultant (management and transactional) (2012-2014). Formerly, Chief Financial Officer, Aveon Group L.P. (investment management firm) (2010-2011). Formerly, Vice Chairman, Commercial Industrial Finance Corp. (specialty finance company) (2006-2010). Formerly, President and Chief Executive Officer, Prizm Capital Management, LLC (investment management firm) (2002-2005). Formerly, Executive Vice President and Chief Financial Officer, United Asset Management Corporation (investment management firm) (1982-2001). Formerly, Senior Manager, Price Waterhouse (now PricewaterhouseCoopers) (a registered public accounting firm) (1972-1981). Other Directorships. None. |
| | | |
Helen Frame Peters 1948 | | Trustee | | Since 2008 | | Professor of Finance, Carroll School of Management, Boston College. Formerly, Dean, Carroll School of Management, Boston College (2000-2002). Formerly, Chief Investment Officer, Fixed Income, Scudder Kemper Investments (investment management firm) (1998-1999). Formerly, Chief Investment Officer, Equity and Fixed Income, Colonial Management Associates (investment management firm) (1991-1998). Other Directorships. None. |
| | | |
Keith Quinton 1958 | | Trustee | | Since 2018 | | Private investor, researcher and lecturer. Formerly, Independent Investment Committee Member at New Hampshire Retirement System (2017-2021). Formerly, Portfolio Manager and Senior Quantitative Analyst at Fidelity Investments (investment management firm) (2001-2014). Other Directorships. Formerly, Director (2016-2021) and Chairman (2019-2021) of New Hampshire Municipal Bond Bank. |
| | | |
Marcus L. Smith 1966 | | Trustee | | Since 2018 | | Private investor. Formerly, Portfolio Manager at MFS Investment Management (investment management firm) (1994-2017). Other Directorships. Director of First Industrial Realty Trust, Inc. (an industrial REIT) (since 2021). Director of MSCI Inc. (global provider of investment decision support tools) (since 2017). Formerly, Director of DCT Industrial Trust Inc. (logistics real estate company) (2017-2018). |
| | | |
Susan J. Sutherland 1957 | | Trustee | | Since 2015 | | Private investor. Director of Ascot Group Limited and certain of its subsidiaries (insurance and reinsurance) (since 2017). Formerly, Director of Hagerty Holding Corp. (insurance) (2015-2018) and Montpelier Re Holdings Ltd. (insurance and reinsurance) (2013-2015). Formerly, Associate, Counsel and Partner at Skadden, Arps, Slate, Meagher & Flom LLP (law firm) (1982-2013). Other Directorships. Director of Kairos Acquisition Corp. (insurance/InsurTech acquisition company) (since 2021). |
| | | |
Scott E. Wennerholm 1959 | | Trustee | | Since 2016 | | Private investor. Formerly, Trustee at Wheelock College (postsecondary institution) (2012-2018). Formerly, Consultant at GF Parish Group (executive recruiting firm) (2016-2017). Formerly, Chief Operating Officer and Executive Vice President at BNY Mellon Asset Management (investment management firm) (2005-2011). Formerly, Chief Operating Officer and Chief Financial Officer at Natixis Global Asset Management (investment management firm) (1997-2004). Formerly, Vice President at Fidelity Investments Institutional Services (investment management firm) (1994-1997). Other Directorships. None. |
| | | | | | |
| Name and Year of Birth | | Trust/Portfolio Position(s) | | Length of Service | | Principal Occupation(s)
During Past Five Years |
|
| Principal Officers who are not Trustees |
| | | |
Eric A. Stein 1980 | | President of the Trust | | Since 2020 | | Vice President and Chief Investment Officer, Fixed Income of EVM and BMR. Prior to November 1, 2020, Mr. Stein was a co-Director of Eaton Vance’s Global Income Investments. Also Vice President of Calvert Research and Management (“CRM”). |
| | | |
Edward J. Perkin 1972 | | President of the Portfolio | | Since 2014 | | Chief Equity Investment Officer and Vice President of EVM and BMR since 2014. Also Vice President of CRM. |
Eaton Vance
Stock Fund
December 31, 2021
Management and Organization — continued
| | | | | | |
| Name and Year of Birth | | Trust/Portfolio Position(s) | | Length of Service | | Principal Occupation(s)
During Past Five Years |
|
| Principal Officers who are not Trustees (continued) |
| | | |
Deidre E. Walsh 1971 | | Vice President and Chief Legal Officer | | Since 2009 | | Vice President of EVM and BMR. Also Vice President of CRM. |
| | | |
James F. Kirchner 1967 | | Treasurer | | Since 2007 | | Vice President of EVM and BMR. Also Vice President of CRM. |
| | | |
Jill R. Damon 1984 | | Secretary | | Since 2022 | | Vice President of EVM and BMR since 2017. Formerly, associate at Dechert LLP (2009-2017). |
| | | |
Richard F. Froio 1968 | | Chief Compliance Officer | | Since 2017 | | Vice President of EVM and BMR since 2017. Formerly, Deputy Chief Compliance Officer (Adviser/Funds) and Chief Compliance Officer (Distribution) at PIMCO (2012-2017) and Managing Director at BlackRock/Barclays Global Investors (2009-2012). |
The SAI for the Fund includes additional information about the Trustees and officers of the Trust and the Portfolio and can be obtained without charge on Eaton Vance’s website at www.eatonvance.com or by calling 1-800-262-1122.
Eaton Vance Funds
| | |
| Privacy Notice | | April 2021 |
| | |
| |
| FACTS | | WHAT DOES EATON VANCE DO WITH YOUR
PERSONAL INFORMATION? |
| | | |
| |
| | |
| Why? | | Financial companies choose how they share your personal information. Federal law gives consumers the right to limit some but not all sharing. Federal law also requires us to tell you how we collect, share, and protect your personal information. Please read this notice carefully to understand what we do. |
| | |
| | | |
| What? | | The types of personal information we collect and share depend on the product or service you have with us. This information can include: ∎ Social Security number and income ∎ investment experience and risk tolerance ∎ checking account number and wire transfer instructions |
| | |
| | | |
| How? | | All financial companies need to share customers’ personal information to run their everyday business. In the section below, we list the reasons financial companies can share their customers’ personal information; the reasons Eaton Vance chooses to share; and whether you can limit this sharing. |
| | |
| | | |
| | | | |
Reasons we can share your
personal information | | Does Eaton Vance share? | | Can you limit this sharing? |
| For our everyday business purposes — such as to process your transactions, maintain your account(s), respond to court orders and legal investigations, or report to credit bureaus | | Yes | | No |
| For our marketing purposes — to offer our products and services to you | | Yes | | No |
| For joint marketing with other financial companies | | No | | We don’t share |
| For our investment management affiliates’ everyday business purposes — information about your transactions, experiences, and creditworthiness | | Yes | | Yes |
| For our affiliates’ everyday business purposes — information about your transactions and experiences | | Yes | | No |
| For our affiliates’ everyday business purposes — information about your creditworthiness | | No | | We don’t share |
| For our investment management affiliates to market to you | | Yes | | Yes |
| For our affiliates to market to you | | No | | We don’t share |
| For nonaffiliates to market to you | | No | | We don’t share |
| | |
| To limit our sharing | | Call toll-free 1-800-262-1122 or email: EVPrivacy@eatonvance.com Please note: If you are a new customer, we can begin sharing your information 30 days from the date we sent this notice. When you are no longer our customer, we continue to share your information as described in this notice. However, you can contact us at any time to limit our sharing. |
| | |
| | | |
| | |
| Questions? | | Call toll-free 1-800-262-1122 or email: EVPrivacy@eatonvance.com |
| | |
| | | |
Eaton Vance Funds
| | |
| Privacy Notice — continued | | April 2021 |
| | |
| Who we are |
| Who is providing this notice? | | Eaton Vance Management, Eaton Vance Distributors, Inc., Eaton Vance Trust Company, Eaton Vance Management (International) Limited, Eaton Vance Advisers International Ltd., Eaton Vance Global Advisors Limited, Eaton Vance Management’s Real Estate Investment Group, Boston Management and Research, Calvert Research and Management, Eaton Vance and Calvert Fund Families and our investment advisory affiliates (“Eaton Vance”) (see Investment Management Affiliates definition below) |
| What we do |
| How does Eaton Vance protect my personal information? | | To protect your personal information from unauthorized access and use, we use security measures that comply with federal law. These measures include computer safeguards and secured files and buildings. We have policies governing the proper handling of customer information by personnel and requiring third parties that provide support to adhere to appropriate security standards with respect to such information. |
| How does Eaton Vance collect my personal information? | | We collect your personal information, for example, when you ∎ open an account or make deposits or withdrawals from your account ∎ buy securities from us or make a wire transfer ∎ give us your contact information We also collect your personal information from others, such as credit bureaus, affiliates, or other companies. |
| Why can’t I limit all sharing? | | Federal law gives you the right to limit only ∎ sharing for affiliates’ everyday business purposes — information about your creditworthiness ∎ affiliates from using your information to market to you ∎ sharing for nonaffiliates to market to you State laws and individual companies may give you additional rights to limit sharing. See below for more on your rights under state law. |
| Definitions |
| Investment Management Affiliates | | Eaton Vance Investment Management Affiliates include registered investment advisers, registered broker-dealers, and registered and unregistered funds. Investment Management Affiliates does not include entities associated with Morgan Stanley Wealth Management, such as Morgan Stanley Smith Barney LLC and Morgan Stanley & Co. |
| Affiliates | | Companies related by common ownership or control. They can be financial and nonfinancial companies. ∎ Our affiliates include companies with a Morgan Stanley name and financial companies such as Morgan Stanley Smith Barney LLC and Morgan Stanley & Co. |
| Nonaffiliates | | Companies not related by common ownership or control. They can be financial and nonfinancial companies. ∎ Eaton Vance does not share with nonaffiliates so they can market to you. |
| Joint marketing | | A formal agreement between nonaffiliated financial companies that together market financial products or services to you. ∎ Eaton Vance doesn’t jointly market. |
| Other important information |
Vermont: Except as permitted by law, we will not share personal information we collect about Vermont residents with Nonaffiliates unless you provide us with your written consent to share such information. California: Except as permitted by law, we will not share personal information we collect about California residents with Nonaffiliates and we will limit sharing such personal information with our Affiliates to comply with California privacy laws that apply to us. |
Eaton Vance Funds
IMPORTANT NOTICES
Delivery of Shareholder Documents. The Securities and Exchange Commission (SEC) permits funds to deliver only one copy of shareholder documents, including prospectuses, proxy statements and shareholder reports, to fund investors with multiple accounts at the same residential or post office box address. This practice is often called “householding” and it helps eliminate duplicate mailings to shareholders. Eaton Vance, or your financial intermediary, may household the mailing of your documents indefinitely unless you instruct Eaton Vance, or your financial intermediary, otherwise. If you would prefer that your Eaton Vance documents not be householded, please contact Eaton Vance at 1-800-262-1122, or contact your financial intermediary. Your instructions that householding not apply to delivery of your Eaton Vance documents will typically be effective within 30 days of receipt by Eaton Vance or your financial intermediary.
Portfolio Holdings. Each Eaton Vance Fund and its underlying Portfolio(s) (if applicable) files a schedule of portfolio holdings on Part F to Form N-PORT with the SEC. Certain information filed on Form N-PORT may be viewed on the Eaton Vance website at www.eatonvance.com, by calling Eaton Vance at 1-800-262-1122 or in the EDGAR database on the SEC’s website at www.sec.gov.
Proxy Voting. From time to time, funds are required to vote proxies related to the securities held by the funds. The Eaton Vance Funds or their underlying Portfolios (if applicable) vote proxies according to a set of policies and procedures approved by the Funds’ and Portfolios’ Boards. You may obtain a description of these policies and procedures and information on how the Funds or Portfolios voted proxies relating to portfolio securities during the most recent 12-month period ended June 30, without charge, upon request, by calling 1-800-262-1122 and by accessing the SEC’s website at www.sec.gov.
This Page Intentionally Left Blank
Investment Adviser of Stock Portfolio
Boston Management and Research
Two International Place
Boston, MA 02110
Investment Adviser and Administrator of Eaton Vance Stock Fund
Eaton Vance Management
Two International Place
Boston, MA 02110
Principal Underwriter*
Eaton Vance Distributors, Inc.
Two International Place
Boston, MA 02110
(617) 482-8260
Custodian
State Street Bank and Trust Company
State Street Financial Center, One Lincoln Street
Boston, MA 02111
Transfer Agent
BNY Mellon Investment Servicing (US) Inc.
Attn: Eaton Vance Funds
P.O. Box 9653
Providence, RI 02940-9653
(800) 262-1122
Independent Registered Public Accounting Firm
Deloitte & Touche LLP
200 Berkeley Street
Boston, MA 02116-5022
Fund Offices
Two International Place
Boston, MA 02110
| * | FINRA BrokerCheck. Investors may check the background of their Investment Professional by contacting the Financial Industry Regulatory Authority (FINRA). FINRA BrokerCheck is a free tool to help investors check the professional background of current and former FINRA-registered securities firms and brokers. FINRA BrokerCheck is available by calling 1-800-289-9999 and at www.FINRA.org. The FINRA BrokerCheck brochure describing this program is available to investors at www.FINRA.org. |
1325 12.31.21

Eaton Vance
Tax-Managed Growth Funds 1.1 and 1.2
Annual Report
December 31, 2021

Commodity Futures Trading Commission Registration. The Commodity Futures Trading Commission (“CFTC”) has adopted regulations that subject registered investment companies and advisers to regulation by the CFTC if a fund invests more than a prescribed level of its assets in certain CFTC-regulated instruments (including futures, certain options and swap agreements) or markets itself as providing investment exposure to such instruments. The investment adviser has claimed an exclusion from the definition of “commodity pool operator” under the Commodity Exchange Act with respect to its management of each Fund. Accordingly, neither the Funds nor the adviser with respect to the operation of the Funds is subject to CFTC regulation. Because of its management of other strategies, the Funds’ adviser is registered with the CFTC as a commodity pool operator. The adviser is also registered as a commodity trading advisor.
Fund shares are not insured by the FDIC and are not deposits or other obligations of, or guaranteed by, any depository institution. Shares are subject to investment risks, including possible loss of principal invested.
This report must be preceded or accompanied by a current summary prospectus or prospectus. Before investing, investors should consider carefully the investment objective, risks, and charges and expenses of a mutual fund. This and other important information is contained in the summary prospectus and prospectus, which can be obtained from a financial intermediary. Prospective investors should read the prospectus carefully before investing. For further information, please call 1-800-262-1122.
Annual Report December 31, 2021
Eaton Vance
Tax-Managed Growth Funds 1.1 and 1.2
Eaton Vance
Tax-Managed Growth Funds 1.1 and 1.2
December 31, 2021
Management’s Discussion of Fund Performance1
Economic and Market Conditions
The 12-month period starting January 1, 2021, was notable for a U.S. equity rally that lasted for most of the period and resulted in U.S. stocks outperforming most other stock markets in developed economies. Except for temporary retreats in September and November, broad-market indexes generally posted strong returns during the period. Investors cheered the reopening of businesses that had been affected by the pandemic and the rollout of several highly effective COVID-19 vaccines.
COVID-19, however, continued to have a firm grip on the U.S. economy. Disease rates advanced and declined with second, third, and fourth waves of infections. Worker shortages led to global supply-chain disruptions. From computer chips to shipping containers, scarcities of key items ledto temporary factory shutdowns and empty store shelves. Those shortages — combined with high demand from consumers eager to spend money saved earlier in the pandemic — led to higher year-over-year inflation than the U.S. had seen in decades.
Still, investor optimism about a recovering economy drove stock prices up during most of the period. A significant pullback, however, occurred in September 2021 when virtually every major U.S. stock index reported negative returns. Unexpectedly weak job creation in August and the U.S. Federal Reserve’s (the Fed’s) announcement that it might soon begin tapering its monthly bond purchases — which had stimulated the economy earlier — combined to drive stocks into negative territory. Rising COVID-19 infections also weighed on equity performance in September.
In the final quarter of 2021, however, stock prices came roaring back. Even the late-November news of a new and more transmissible COVID-19 variant — Omicron — caused only a temporary market retreat. The Fed’s actions to tamp down inflation were applauded by investors, with stocks gaining ground after the central bank announced that tapering would be accelerated and that three possible interest rate hikes were forecast for 2022. Just two trading days before year-end, the S&P 500® Index closed at its 70th new all-time high for the period, and the Dow Jones Industrial Average® (DJIA) closed at an all-time high as well.
For the period as a whole, the broad-market S&P 500® Index returned 28.71%; the blue-chip DJIA was up 20.95%; and the technology- laden Nasdaq Composite Index rose 22.18%. Large-cap U.S. stocks, as measured by the Russell 1000® Index, outperformed their small-cap counterparts, as measured by the Russell 2000® Index. In the large-cap space, growth stocks modestly outperformed value stocks, but in the small- cap space, value stocks strongly outperformed growth stocks during the period.
Fund Performance
For the 12-month period ended December 31, 2021, Eaton Vance Tax-Managed Growth Fund 1.1 and Eaton Vance Tax-Managed Growth Fund 1.2 (collectively, the Funds) returned 24.68% and 24.48%, respectively, for Class A shares at net asset value (NAV), underperforming their benchmark, the S&P 500® Index (the Index), which returned 28.71%.
Stock selections in the information technology (IT), consumer discretionary, and industrials sectors detracted from the Funds’ performance versus the Index during the period. In the IT sector, the Funds’ out-of-Index position in DocuSign, Inc. (DocuSign), a leading vendor of electronic signature solutions for digital documents, hurt performance relative to the Index. Following robust demand and strong stock performance in 2020, DocuSign’s share price fell in 2021 as investors favored more cyclical areas of the market. An unexpected slowing of demand in the final quarter of 2021 also weighed on DocuSign’s stock price.
In the consumer discretionary sector, underweighting electric car maker Tesla, Inc. (Tesla) relative to the Index — due to inconsistency of earnings and the company’s high valuation — hurt performance versus the Index as vehicle deliveries and profits rose and Tesla’s stock performed strongly during the period. The stock received an additional boost in October 2021 when The Hertz Corp. announced it was purchasing 100,000 Tesla autos for its rental fleet.
In the industrials sector, relative performance was hurt when the Funds’ out-of-Index position in Uber Technologies, Inc. (Uber) declined in price. Uber, which connects consumers with providers of ride services, as well as food deliveries through Uber Eats, saw its profitability hurt by pandemic-related driver shortages. Unfavorable court rulings regarding Uber driver employment classifications placed an additional drag on the company’s stock price during the period.
In contrast, contributors to the Funds’ performance versus the Index included stock selections and an overweight position in the financials sector; stock selections in the communication services sector; and an underweight position in the utilities sector — the worst-performing sector within the Index during the period.
In the financials sector, the Funds’ performance relative to the Index was helped by an overweight position in Charles Schwab Corp. (The) (Schwab), a diversified financial services firm that serves retail customers and independent registered investment advisors. Schwab’s stock price rose during the period as consumers continued to migrate toward independent advisors and growth in the firm’s retail brokerage business exceeded the industry average. Investor expectations for rising interest rates were an additional driver of Schwab’s stock price.
In the communication services sector, the Funds’ overweight position in Alphabet, Inc. (Alphabet), parent company of search engine Google, performed strongly as positive e-commerce trends drove increased demand for search engine advertising and engagement. In addition, growth in viewership and ad sales on video sharing platform YouTube, an Alphabet subsidiary, exceeded analyst expectations during the period and provided an additional tailwind for Alphabet’s stock price.
See Endnotes and Additional Disclosures in this report.
Past performance is no guarantee of future results. Returns are historical and are calculated by determining the percentage change in net asset value (NAV) or offering price (as applicable) with all distributions reinvested. Investment return and principal value will fluctuate so that shares, when redeemed, may be worth more or less than their original cost. Performance for periods less than or equal to one year is cumulative. Performance is for the stated time period only; due to market volatility, current Fund performance may be lower or higher than the quoted return. For performance as of the most recent month-end, please refer to eatonvance.com.
Eaton Vance
Tax-Managed Growth Fund 1.1
December 31, 2021
Performance2,3
Portfolio Manager(s) Yana S. Barton, CFA and Kenneth D. Zinner, CFA
| | | | | | | | | | | | | | | | | | | | |
| % Average Annual Total Returns | | Class
Inception Date | | | Performance Inception Date | | | One Year | | | Five Years | | | Ten Years | |
| | | | | |
Class A at NAV | | | 03/28/1996 | | | | 03/29/1966 | | | | 24.68 | % | | | 18.11 | % | | | 15.83 | % |
Class A with 5.75% Maximum Sales Charge | | | — | | | | — | | | | 17.51 | | | | 16.72 | | | | 15.15 | |
Class C at NAV | | | 08/02/1996 | | | | 03/29/1966 | | | | 23.76 | | | | 17.22 | | | | 15.14 | |
Class C with 1% Maximum Sales Charge | | | — | | | | — | | | | 22.76 | | | | 17.22 | | | | 15.14 | |
Class I at NAV | | | 07/02/1999 | | | | 03/29/1966 | | | | 25.00 | | | | 18.40 | | | | 16.12 | |
|
| |
| | | | | |
S&P 500® Index | | | — | | | | — | | | | 28.71 | % | | | 18.46 | % | | | 16.54 | % |
| | | | | |
| % After-Tax Returns | | Class
Inception Date | | | Performance Inception Date | | | One Year | | | Five Years | | | Ten Years | |
| | | | | |
Class A After Taxes on Distributions | | | 03/28/1996 | | | | 03/29/1966 | | | | 17.42 | % | | | 16.55 | % | | | 14.92 | % |
Class A After Taxes on Distributions and Sale of Fund Shares | | | — | | | | — | | | | 10.45 | | | | 14.03 | | | | 13.16 | |
Class C After Taxes on Distributions | | | 08/02/1996 | | | | 03/29/1966 | | | | 22.76 | | | | 17.20 | | | | 15.04 | |
Class C After Taxes on Distributions and Sale of Fund Shares | | | — | | | | — | | | | 13.47 | | | | 14.52 | | | | 13.22 | |
Class I After Taxes on Distributions | | | 07/02/1999 | | | | 03/29/1966 | | | | 24.84 | | | | 18.14 | | | | 15.81 | |
Class I After Taxes on Distributions and Sale of Fund Shares | | | — | | | | — | | | | 14.96 | | | | 15.48 | | | | 14.02 | |
| | | | | |
| % Total Annual Operating Expense Ratios4 | | | | | | | | Class A | | | Class C | | | Class I | |
| | | | | |
| | | | | | | | | | | 0.76 | % | | | 1.51 | % | | | 0.51 | % |
Growth of $10,000
This graph shows the change in value of a hypothetical investment of $10,000 in Class A of the Fund for the period indicated. For comparison, the same investment is shown in the indicated index.
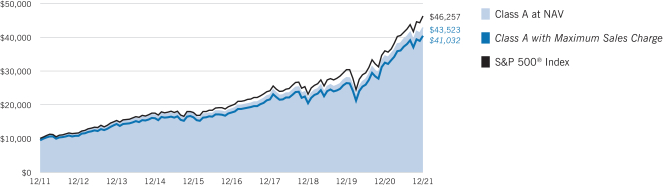
| | | | | | | | | | | | | | | | |
| Growth of Investment | | Amount Invested | | | Period Beginning | | | At NAV | | | With Maximum Sales Charge | |
| | | | |
Class C | | | $10,000 | | | | 12/31/2011 | | | | $40,989 | | | | N.A. | |
Class I | | | $250,000 | | | | 12/31/2011 | | | | $1,115,479 | | | | N.A. | |
See Endnotes and Additional Disclosures in this report.
Past performance is no guarantee of future results. Returns are historical and are calculated by determining the percentage change in net asset value (NAV) or offering price (as applicable) with all distributions reinvested. Investment return and principal value will fluctuate so that shares, when redeemed, may be worth more or less than their original cost. Performance for periods less than or equal to one year is cumulative. Performance is for the stated time period only; due to market volatility, current Fund performance may be lower or higher than the quoted return. For performance as of the most recent month-end, please refer to eatonvance.com.
Eaton Vance
Tax-Managed Growth Fund 1.2
December 31, 2021
Performance2,3
Portfolio Manager(s) Yana S. Barton, CFA and Kenneth D. Zinner, CFA
| | | | | | | | | | | | | | | | | | | | |
| % Average Annual Total Returns | | Class
Inception Date | | | Performance Inception Date | | | One Year | | | Five Years | | | Ten Years | |
| | | | | |
Class A at NAV | | | 02/28/2001 | | | | 03/29/1966 | | | | 24.48 | % | | | 17.93 | % | | | 15.65 | % |
Class A with 5.75% Maximum Sales Charge | | | — | | | | — | | | | 17.32 | | | | 16.54 | | | | 14.97 | |
Class C at NAV | | | 02/28/2001 | | | | 03/29/1966 | | | | 23.54 | | | | 17.05 | | | | 14.96 | |
Class C with 1% Maximum Sales Charge | | | — | | | | — | | | | 22.54 | | | | 17.05 | | | | 14.96 | |
Class I at NAV | | | 02/28/2001 | | | | 03/29/1966 | | | | 24.77 | | | | 18.22 | | | | 15.93 | |
|
| |
| | | | | |
S&P 500® Index | | | — | | | | — | | | | 28.71 | % | | | 18.46 | % | | | 16.54 | % |
| | | | | |
| % After-Tax Returns | | Class
Inception Date | | | Performance Inception Date | | | One Year | | | Five Years | | | Ten Years | |
| | | | | |
Class A After Taxes on Distributions | | | 02/28/2001 | | | | 03/29/1966 | | | | 17.29 | % | | | 16.41 | % | | | 14.78 | % |
Class A After Taxes on Distributions and Sale of Fund Shares | | | — | | | | — | | | | 10.30 | | | | 13.89 | | | | 13.01 | |
Class C After Taxes on Distributions | | | 02/28/2001 | | | | 03/29/1966 | | | | 22.54 | | | | 17.05 | | | | 14.91 | |
Class C After Taxes on Distributions and Sale of Fund Shares | | | — | | | | — | | | | 13.35 | | | | 14.38 | | | | 13.08 | |
Class I After Taxes on Distributions | | | 02/28/2001 | | | | 03/29/1966 | | | | 24.67 | | | | 18.02 | | | | 15.68 | |
Class I After Taxes on Distributions and Sale of Fund Shares | | | — | | | | — | | | | 14.76 | | | | 15.34 | | | | 13.87 | |
| | | | | |
| % Total Annual Operating Expense Ratios4 | | | | | | | | Class A | | | Class C | | | Class I | |
| | | | | |
| | | | | | | | | | | 0.92 | % | | | 1.67 | % | | | 0.67 | % |
Growth of $10,000
This graph shows the change in value of a hypothetical investment of $10,000 in Class A of the Fund for the period indicated. For comparison, the same investment is shown in the indicated index.

| | | | | | | | | | | | | | | | |
| Growth of Investment | | Amount Invested | | | Period Beginning | | | At NAV | | | With Maximum Sales Charge | |
| | | | |
Class C | | | $10,000 | | | | 12/31/2011 | | | | $40,360 | | | | N.A. | |
Class I | | | $250,000 | | | | 12/31/2011 | | | | $1,097,568 | | | | N.A. | |
See Endnotes and Additional Disclosures in this report.
Past performance is no guarantee of future results. Returns are historical and are calculated by determining the percentage change in net asset value (NAV) or offering price (as applicable) with all distributions reinvested. Investment return and principal value will fluctuate so that shares, when redeemed, may be worth more or less than their original cost. Performance for periods less than or equal to one year is cumulative. Performance is for the stated time period only; due to market volatility, current Fund performance may be lower or higher than the quoted return. For performance as of the most recent month-end, please refer to eatonvance.com.
Eaton Vance
Tax-Managed Growth Funds 1.1 and 1.2
December 31, 2021
Fund Profile5
Sector Allocation (% of net assets)6
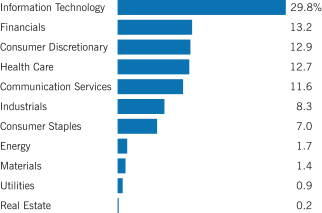
Top 10 Holdings (% of net assets)6
| | | | |
| |
Apple, Inc. | | | 6.1 | % |
| |
Microsoft Corp. | | | 4.1 | |
| |
Amazon.com, Inc. | | | 3.8 | |
| |
Alphabet, Inc., Class C | | | 3.3 | |
| |
Meta Platforms, Inc., Class A | | | 2.5 | |
| |
Alphabet, Inc., Class A | | | 2.5 | |
| |
NVIDIA Corp. | | | 2.0 | |
| |
QUALCOMM, Inc. | | | 2.0 | |
| |
JPMorgan Chase & Co. | | | 1.8 | |
| |
Eli Lilly & Co. | | | 1.6 | |
| |
Total | | | 29.7 | % |
See Endnotes and Additional Disclosures in this report.
Eaton Vance
Tax-Managed Growth Funds 1.1 and 1.2
December 31, 2021
Endnotes and Additional Disclosures
| 1 | The views expressed in this report are those of the portfolio manager(s) and are current only through the date stated at the top of this page. These views are subject to change at any time based upon market or other conditions, and Eaton Vance and the Fund(s) disclaim any responsibility to update such views. These views may not be relied upon as investment advice and, because investment decisions are based on many factors, may not be relied upon as an indication of trading intent on behalf of any Eaton Vance fund. This commentary may contain statements that are not historical facts, referred to as “forward-looking statements.” The Fund’s actual future results may differ significantly from those stated in any forward-looking statement, depending on factors such as changes in securities or financial markets or general economic conditions, the volume of sales and purchases of Fund shares, the continuation of investment advisory, administrative and service contracts, and other risks discussed from time to time in the Fund’s filings with the Securities and Exchange Commission. |
| 2 | S&P 500® Index is an unmanaged index of large-cap stocks commonly used as a measure of U.S. stock market performance. S&P Dow Jones Indices are a product of S&P Dow Jones Indices LLC (“S&P DJI”) and have been licensed for use. S&P® and S&P 500® are registered trademarks of S&P DJI; Dow Jones® is a registered trademark of Dow Jones Trademark Holdings LLC (“Dow Jones”); S&P DJI, Dow Jones and their respective affiliates do not sponsor, endorse, sell or promote the Fund, will not have any liability with respect thereto and do not have any liability for any errors, omissions, or interruptions of the S&P Dow Jones Indices. Unless otherwise stated, index returns do not reflect the effect of any applicable sales charges, commissions, expenses, taxes or leverage, as applicable. It is not possible to invest directly in an index. |
| 3 | Total Returns at NAV do not include applicable sales charges. If sales charges were deducted, the returns would be lower. Total Returns shown with maximum sales charge reflect the stated maximum sales charge. Unless otherwise stated, performance does not reflect the deduction of taxes on Fund distributions or redemptions of Fund shares. Performance since inception for an index, if presented, is the performance since the Fund’s or oldest share class’ inception, as applicable. After-tax returns are calculated using certain assumptions, including using the highest historical individual federal income tax rates, and do not reflect the impact of state/local taxes. Actual after-tax returns depend on a shareholder’s tax situation and the actual characterization of distributions and may differ from those shown. After-tax returns are not relevant to shareholders who hold shares in tax-deferred accounts or shares held by nontaxable entities. Return After Taxes on Distributions may be the same as Return Before Taxes for the same period because no taxable distributions were made during that period. Return After Taxes on Distributions and Sale of Fund Shares may be greater than or equal to Return After Taxes on Distributions for the same period because of losses realized on the sale of Fund shares. The Fund’s after-tax returns also may reflect foreign tax credits passed by the Fund to its shareholders. |
Effective November 5, 2020, Class C shares automatically convert to Class A shares eight years after purchase. The average annual total returns listed for Class C reflect conversion to Class A shares after eight years. Prior to November 5, 2020, Class C shares automatically converted to Class A shares ten years after purchase.
| 4 | Source: Fund prospectus. The expense ratios for the current reporting period can be found in the Financial Highlights section of this report. |
| 5 | Fund invests in an affiliated investment company (Portfolio) with the same objective(s) and policies as the Fund. References to investments are to the Portfolio’s holdings. |
| 6 | Excludes cash and cash equivalents. |
Fund profile subject to change due to active management.
Additional Information
Dow Jones Industrial Average® is a price-weighted average of 30 blue-chip stocks that are generally the leaders in their industry. Nasdaq Composite Index is a market capitalization-weighted index of all domestic and international securities listed on Nasdaq. Source: Nasdaq, Inc. The information is provided by Nasdaq (with its affiliates, are referred to as the “Corporations”) and Nasdaq’s third party licensors on an “as is” basis and the Corporations make no guarantees and bear no liability of any kind with respect to the information or the Fund. Russell 1000® Index is an unmanaged index of 1,000 U.S. large- cap stocks. Russell 2000® Index is an unmanaged index of 2,000 U.S. small-cap stocks.
Eaton Vance
Tax-Managed Growth Funds 1.1 and 1.2
December 31, 2021
Fund Expenses
Example: As a Fund shareholder, you incur two types of costs: (1) transaction costs, including sales charges (loads) on purchases and redemption fees (if applicable); and (2) ongoing costs, including management fees; distribution or service fees; and other Fund expenses. This Example is intended to help you understand your ongoing costs (in dollars) of Fund investing and to compare these costs with the ongoing costs of investing in other mutual funds. The Example is based on an investment of $1,000 invested at the beginning of the period and held for the entire period (July 1, 2021 – December 31, 2021).
Actual Expenses: The first section of the table below provides information about actual account values and actual expenses. You may use the information in this section, together with the amount you invested, to estimate the expenses that you paid over the period. Simply divide your account value by $1,000 (for example, an $8,600 account value divided by $1,000 = 8.6), then multiply the result by the number in the first section under the heading entitled “Expenses Paid During Period” to estimate the expenses you paid on your account during this period.
Hypothetical Example for Comparison Purposes: The second section of the table below provides information about hypothetical account values and hypothetical expenses based on the actual Fund expense ratio and an assumed rate of return of 5% per year (before expenses), which is not the actual Fund return. The hypothetical account values and expenses may not be used to estimate the actual ending account balance or expenses you paid for the period. You may use this information to compare the ongoing costs of investing in your Fund and other funds. To do so, compare this 5% hypothetical example with the 5% hypothetical examples that appear in the shareholder reports of the other funds.
Please note that the expenses shown in the table are meant to highlight your ongoing costs only and do not reflect any transactional costs, such as sales charges (loads) or redemption fees (if applicable). Therefore, the second section of the table is useful in comparing ongoing costs only, and will not help you determine the relative total costs of owning different funds. In addition, if these transactional costs were included, your costs would be higher.
Eaton Vance Tax-Managed Growth Fund 1.1
| | | | | | | | | | | | | | | | |
| | | Beginning
Account Value
(7/1/21) | | | Ending
Account Value
(12/31/21) | | | Expenses Paid
During Period*
(7/1/21 – 12/31/21) | | | Annualized
Expense
Ratio | |
| | | | |
Actual | | | | | | | | | | | | | | | | |
Class A | | $ | 1,000.00 | | | $ | 1,086.80 | | | $ | 3.84 | | | | 0.73 | % |
Class C | | $ | 1,000.00 | | | $ | 1,082.70 | | | $ | 7.77 | | | | 1.48 | % |
Class I | | $ | 1,000.00 | | | $ | 1,088.20 | | | $ | 2.53 | | | | 0.48 | % |
| | | | | |
Hypothetical | | | | | | | | | | | | | | | | |
(5% return per year before expenses) | | | | | | | | | | | | | | | | |
Class A | | $ | 1,000.00 | | | $ | 1,021.53 | | | $ | 3.72 | | | | 0.73 | % |
Class C | | $ | 1,000.00 | | | $ | 1,017.75 | | | $ | 7.53 | | | | 1.48 | % |
Class I | | $ | 1,000.00 | | | $ | 1,022.79 | | | $ | 2.45 | | | | 0.48 | % |
| * | Expenses are equal to the Fund’s annualized expense ratio for the indicated Class, multiplied by the average account value over the period, multiplied by 184/365 (to reflect the one-half year period). The Example assumes that the $1,000 was invested at the net asset value per share determined at the close of business on June 30, 2021. |
Eaton Vance
Tax-Managed Growth Funds 1.1 and 1.2
December 31, 2021
Fund Expenses — continued
Eaton Vance Tax-Managed Growth Fund 1.2
| | | | | | | | | | | | | | | | |
| | | Beginning
Account Value
(7/1/21) | | | Ending
Account Value
(12/31/21) | | | Expenses Paid
During Period*
(7/1/21 – 12/31/21) | | | Annualized
Expense
Ratio | |
| | | | |
Actual | | | | | | | | | | | | | | | | |
Class A | | $ | 1,000.00 | | | $ | 1,085.80 | | | $ | 4.63 | | | | 0.88 | % |
Class C | | $ | 1,000.00 | | | $ | 1,081.80 | | | $ | 8.55 | | | | 1.63 | % |
Class I | | $ | 1,000.00 | | | $ | 1,087.30 | | | $ | 3.31 | | | | 0.63 | % |
| | | | | |
Hypothetical | | | | | | | | | | | | | | | | |
(5% return per year before expenses) | | | | | | | | | | | | | | | | |
Class A | | $ | 1,000.00 | | | $ | 1,020.77 | | | $ | 4.48 | | | | 0.88 | % |
Class C | | $ | 1,000.00 | | | $ | 1,016.99 | | | $ | 8.29 | | | | 1.63 | % |
Class I | | $ | 1,000.00 | | | $ | 1,022.03 | | | $ | 3.21 | | | | 0.63 | % |
| * | Expenses are equal to the Fund’s annualized expense ratio for the indicated Class, multiplied by the average account value over the period, multiplied by 184/365 (to reflect the one-half year period). The Example assumes that the $1,000 was invested at the net asset value per share determined at the close of business on June 30, 2021. |
Eaton Vance
Tax-Managed Growth Funds 1.1 and 1.2
December 31, 2021
Statements of Assets and Liabilities
| | | | | | | | |
| | | December 31, 2021 | |
| Assets | | Tax-Managed
Growth Fund 1.1 | | | Tax-Managed
Growth Fund 1.2 | |
| | |
Investment in Tax-Managed Growth Portfolio, at value (identified cost, $289,506,962 and $312,811,550, respectively) | | $ | 2,415,868,156 | | | $ | 1,283,446,057 | |
| | |
Receivable for Fund shares sold | | | 1,059,541 | | | | 892,604 | |
| | |
Total assets | | $ | 2,416,927,697 | | | $ | 1,284,338,661 | |
|
| Liabilities | |
| | |
Payable for Fund shares redeemed | | $ | 1,553,503 | | | $ | 930,754 | |
| | |
Payable to affiliates: | | | | | | | | |
| | |
Administration fee | | | — | | | | 160,086 | |
| | |
Distribution and service fees | | | 447,942 | | | | 237,004 | |
| | |
Trustees’ fees | | | 125 | | | | 125 | |
| | |
Accrued expenses | | | 243,792 | | | | 131,683 | |
| | |
Total liabilities | | $ | 2,245,362 | | | $ | 1,459,652 | |
| | |
Net Assets | | $ | 2,414,682,335 | | | $ | 1,282,879,009 | |
|
| Sources of Net Assets | |
| | |
Paid-in capital | | $ | 1,175,164,231 | | | $ | 800,573,362 | |
| | |
Distributable earnings | | | 1,239,518,104 | | | | 482,305,647 | |
| | |
Total | | $ | 2,414,682,335 | | | $ | 1,282,879,009 | |
|
| Class A Shares | |
| | |
Net Assets | | $ | 2,108,252,870 | | | $ | 894,808,985 | |
| | |
Shares Outstanding | | | 22,474,158 | | | | 21,208,316 | |
| | |
Net Asset Value and Redemption Price Per Share | | | | | | | | |
| | |
(net assets ÷ shares of beneficial interest outstanding) | | $ | 93.81 | | | $ | 42.19 | |
| | |
Maximum Offering Price Per Share | | | | | | | | |
| | |
(100 ÷ 94.25 of net asset value per share) | | $ | 99.53 | | | $ | 44.76 | |
|
| Class C Shares | |
| | |
Net Assets | | $ | 8,801,174 | | | $ | 61,484,263 | |
| | |
Shares Outstanding | | | 104,882 | | | | 1,509,934 | |
| | |
Net Asset Value and Offering Price Per Share* | | | | | | | | |
| | |
(net assets ÷ shares of beneficial interest outstanding) | | $ | 83.92 | | | $ | 40.72 | |
|
| Class I Shares | |
| | |
Net Assets | | $ | 297,628,291 | | | $ | 326,585,761 | |
| | |
Shares Outstanding | | | 3,406,321 | | | | 7,721,778 | |
| | |
Net Asset Value, Offering Price and Redemption Price Per Share | | | | | | | | |
| | |
(net assets ÷ shares of beneficial interest outstanding) | | $ | 87.38 | | | $ | 42.29 | |
On sales of $50,000 or more, the offering price of Class A shares is reduced.
| * | Redemption price per share is equal to the net asset value less any applicable contingent deferred sales charge. |
| | | | |
| | 9 | | See Notes to Financial Statements. |
Eaton Vance
Tax-Managed Growth Funds 1.1 and 1.2
December 31, 2021
Statements of Operations
| | | | | | | | |
| | | Year Ended December 31, 2021 | |
| Investment Income | | Tax-Managed
Growth Fund 1.1 | | | Tax-Managed
Growth Fund 1.2 | |
| | |
Dividends allocated from Portfolio (net of foreign taxes, $251,853 and $131,645, respectively) | | $ | 25,178,787 | | | $ | 13,164,091 | |
| | |
Expenses allocated from Portfolio | | | (9,594,112 | ) | | | (5,017,206 | ) |
| | |
Total investment income from Portfolio | | $ | 15,584,675 | | | $ | 8,146,885 | |
|
| Expenses | |
| | |
Administration fee | | $ | — | | | $ | 1,754,185 | |
| | |
Distribution and service fees | | | | | | | | |
| | |
Class A | | | 4,906,580 | | | | 2,052,047 | |
| | |
Class C | | | 93,341 | | | | 579,164 | |
| | |
Trustees’ fees and expenses | | | 500 | | | | 500 | |
| | |
Custodian fee | | | 62,611 | | | | 63,015 | |
| | |
Transfer and dividend disbursing agent fees | | | 757,974 | | | | 359,828 | |
| | |
Professional fees | | | 56,150 | | | | 42,216 | |
| | |
Printing and postage | | | 36,651 | | | | 21,497 | |
| | |
Registration fees | | | 51,902 | | | | 56,551 | |
| | |
Miscellaneous | | | 187,302 | | | | 86,562 | |
| | |
Total expenses | | $ | 6,153,011 | | | $ | 5,015,565 | |
| | |
Net investment income | | $ | 9,431,664 | | | $ | 3,131,320 | |
| | |
| Realized and Unrealized Gain (Loss) from Portfolio | | | | | | | | |
| | |
Net realized gain (loss) — | | | | | | | | |
| | |
Investment transactions(1) | | $ | 46,672,140 | | | $ | 24,381,517 | |
| | |
Foreign currency transactions | | | (388 | ) | | | (203 | ) |
| | |
Net realized gain | | $ | 46,671,752 | | | $ | 24,381,314 | |
| | |
Change in unrealized appreciation (depreciation) — | | | | | | | | |
| | |
Investments | | $ | 433,132,331 | | | $ | 226,167,131 | |
| | |
Foreign currency | | | (5,555 | ) | | | (2,883 | ) |
| | |
Net change in unrealized appreciation (depreciation) | | $ | 433,126,776 | | | $ | 226,164,248 | |
| | |
Net realized and unrealized gain | | $ | 479,798,528 | | | $ | 250,545,562 | |
| | |
Net increase in net assets from operations | | $ | 489,230,192 | | | $ | 253,676,882 | |
| (1) | Includes $45,700,223 and $23,872,392, respectively, of net realized gains from redemptions in-kind. |
| | | | |
| | 10 | | See Notes to Financial Statements. |
Eaton Vance
Tax-Managed Growth Funds 1.1 and 1.2
December 31, 2021
Statements of Changes in Net Assets
| | | | | | | | |
| | | Year Ended December 31, 2021 | |
| Increase (Decrease) in Net Assets | | Tax-Managed
Growth Fund 1.1 | | | Tax-Managed
Growth Fund 1.2 | |
| | |
From operations — | | | | | | | | |
| | |
Net investment income | | $ | 9,431,664 | | | $ | 3,131,320 | |
| | |
Net realized gain | | | 46,671,752 | | | | 24,381,314 | |
| | |
Net change in unrealized appreciation (depreciation) | | | 433,126,776 | | | | 226,164,248 | |
| | |
Net increase in net assets from operations | | $ | 489,230,192 | | | $ | 253,676,882 | |
| | |
Distributions to shareholders — | | | | | | | | |
| | |
Class A | | $ | (7,411,870 | ) | | $ | (1,456,093 | ) |
| | |
Class I | | | (1,860,413 | ) | | | (1,274,812 | ) |
| | |
Total distributions to shareholders | | $ | (9,272,283 | ) | | $ | (2,730,905 | ) |
| | |
Transactions in shares of beneficial interest — | | | | | | | | |
| | |
Proceeds from sale of shares | | | | | | | | |
| | |
Class A | | $ | 9,089,612 | | | $ | 30,288,718 | |
| | |
Class C | | | 235,001 | | | | 8,513,688 | |
| | |
Class I | | | 109,752,215 | | | | 66,445,259 | |
| | |
Net asset value of shares issued to shareholders in payment of distributions declared | | | | | | | | |
| | |
Class A | | | 6,330,080 | | | | 1,295,778 | |
| | |
Class I | | | 1,566,582 | | | | 1,164,723 | |
| | |
Cost of shares redeemed | | | | | | | | |
| | |
Class A | | | (114,834,731 | ) | | | (54,225,772 | ) |
| | |
Class C | | | (1,279,187 | ) | | | (8,702,936 | ) |
| | |
Class I | | | (97,835,698 | ) | | | (60,581,328 | ) |
| | |
Net asset value of shares converted | | | | | | | | |
| | |
Class A | | | 1,649,109 | | | | 4,588,065 | |
| | |
Class C | | | (1,649,109 | ) | | | (4,588,065 | ) |
| | |
Net decrease in net assets from Fund share transactions | | $ | (86,976,126 | ) | | $ | (15,801,870 | ) |
| | |
Net increase in net assets | | $ | 392,981,783 | | | $ | 235,144,107 | |
|
| Net Assets | |
| | |
At beginning of year | | $ | 2,021,700,552 | | | $ | 1,047,734,902 | |
| | |
At end of year | | $ | 2,414,682,335 | | | $ | 1,282,879,009 | |
| | | | |
| | 11 | | See Notes to Financial Statements. |
Eaton Vance
Tax-Managed Growth Funds 1.1 and 1.2
December 31, 2021
Statements of Changes in Net Assets — continued
| | | | | | | | |
| | | Year Ended December 31, 2020 | |
| Increase (Decrease) in Net Assets | | Tax-Managed
Growth Fund 1.1 | | | Tax-Managed
Growth Fund 1.2 | |
| | |
From operations — | | | | | | | | |
| | |
Net investment income | | $ | 13,668,402 | | | $ | 5,529,843 | |
| | |
Net realized gain | | | 44,403,725 | | | | 22,849,775 | |
| | |
Net change in unrealized appreciation (depreciation) | | | 321,051,487 | | | | 164,961,766 | |
| | |
Net increase in net assets from operations | | $ | 379,123,614 | | | $ | 193,341,384 | |
| | |
Distributions to shareholders — | | | | | | | | |
| | |
Class A | | $ | (11,041,230 | ) | | $ | (3,510,456 | ) |
| | |
Class I | | | (2,050,655 | ) | | | (1,762,143 | ) |
| | |
Total distributions to shareholders | | $ | (13,091,885 | ) | | $ | (5,272,599 | ) |
| | |
Transactions in shares of beneficial interest — | | | | | | | | |
| | |
Proceeds from sale of shares | | | | | | | | |
| | |
Class A | | $ | 7,517,031 | | | $ | 21,867,314 | |
| | |
Class C | | | 387,441 | | | | 5,471,936 | |
| | |
Class I | | | 130,916,056 | | | | 89,296,181 | |
| | |
Net asset value of shares issued to shareholders in payment of distributions declared | | | | | | | | |
| | |
Class A | | | 9,427,329 | | | | 3,120,209 | |
| | |
Class I | | | 1,705,626 | | | | 1,599,069 | |
| | |
Cost of shares redeemed | | | | | | | | |
| | |
Class A | | | (125,737,102 | ) | | | (60,045,744 | ) |
| | |
Class C | | | (3,067,331 | ) | | | (13,312,766 | ) |
| | |
Class I | | | (128,707,418 | ) | | | (103,028,577 | ) |
| | |
Net asset value of shares converted | | | | | | | | |
| | |
Class A | | | 3,592,526 | | | | 10,121,805 | |
| | |
Class C | | | (3,592,526 | ) | | | (10,121,805 | ) |
| | |
Net decrease in net assets from Fund share transactions | | $ | (107,558,368 | ) | | $ | (55,032,378 | ) |
| | |
Net increase in net assets | | $ | 258,473,361 | | | $ | 133,036,407 | |
|
| Net Assets | |
| | |
At beginning of year | | $ | 1,763,227,191 | | | $ | 914,698,495 | |
| | |
At end of year | | $ | 2,021,700,552 | | | $ | 1,047,734,902 | |
| | | | |
| | 12 | | See Notes to Financial Statements. |
Eaton Vance
Tax-Managed Growth Funds 1.1 and 1.2
December 31, 2021
Financial Highlights
| | | | | | | | | | | | | | | | | | | | |
| | | Tax-Managed Growth Fund 1.1 — Class A | |
| |
| | | Year Ended December 31, | |
| | | 2021 | | | 2020 | | | 2019 | | | 2018 | | | 2017 | |
| | | | | |
Net asset value — Beginning of year | | $ | 75.510 | | | $ | 61.750 | | | $ | 48.150 | | | $ | 51.300 | | | $ | 42.300 | |
| | | | | |
| Income (Loss) From Operations | | | | | | | | | | | | | | | | | | | | |
| | | | | |
Net investment income(1) | | $ | 0.338 | | | $ | 0.481 | | | $ | 0.539 | | | $ | 0.491 | | | $ | 0.467 | |
| | | | | |
Net realized and unrealized gain (loss) | | | 18.292 | | | | 13.748 | | | | 13.572 | | | | (3.192 | ) | | | 8.982 | |
| | | | | |
Total income (loss) from operations | | $ | 18.630 | | | $ | 14.229 | | | $ | 14.111 | | | $ | (2.701 | ) | | $ | 9.449 | |
| | | | | |
| Less Distributions | | | | | | | | | | | | | | | | | | | | |
| | | | | |
From net investment income | | $ | (0.330 | ) | | $ | (0.469 | ) | | $ | (0.511 | ) | | $ | (0.449 | ) | | $ | (0.449 | ) |
| | | | | |
Total distributions | | $ | (0.330 | ) | | $ | (0.469 | ) | | $ | (0.511 | ) | | $ | (0.449 | ) | | $ | (0.449 | ) |
| | | | | |
Net asset value — End of year | | $ | 93.810 | | | $ | 75.510 | | | $ | 61.750 | | | $ | 48.150 | | | $ | 51.300 | |
| | | | | |
Total Return(2) | | | 24.68 | % | | | 23.05 | % | | | 29.45 | % | | | (5.36 | )% | | | 22.35 | % |
| | | | | |
| Ratios/Supplemental Data | | | | | | | | | | | | | | | | | | | | |
| | | | | |
Net assets, end of year (000’s omitted) | | $ | 2,108,253 | | | $ | 1,784,383 | | | $ | 1,565,795 | | | $ | 1,116,349 | | | $ | 1,257,823 | |
| | | | | |
Ratios (as a percentage of average daily net assets):(3) | | | | | | | | | | | | | | | | | | | | |
| | | | | |
Expenses | | | 0.73 | % | | | 0.76 | % | | | 0.78 | % | | | 0.79 | % | | | 0.79 | % |
| | | | | |
Net investment income | | | 0.40 | % | | | 0.77 | % | | | 0.96 | % | | | 0.92 | % | | | 1.00 | % |
| | | | | |
Portfolio Turnover of the Portfolio(4) | | | 1 | % | | | 1 | % | | | 1 | % | | | 1 | % | | | 0 | %(5) |
| (1) | Computed using average shares outstanding. |
| (2) | Returns are historical and are calculated by determining the percentage change in net asset value with all distributions reinvested and do not reflect the effect of sales charges. |
| (3) | Includes the Fund’s share of the Portfolio’s allocated expenses. |
| (4) | Excludes the value of portfolio securities contributed or distributed as a result of in-kind shareholder transactions. The portfolio turnover of the Portfolio including in-kind contributions and distributions of securities was 4%, 6%, 6%, 6% and 5% for the years ended December 31, 2021, 2020, 2019, 2018 and 2017, respectively. |
| (5) | Amount is less than 0.5%. |
| | | | |
| | 13 | | See Notes to Financial Statements. |
Eaton Vance
Tax-Managed Growth Funds 1.1 and 1.2
December 31, 2021
Financial Highlights — continued
| | | | | | | | | | | | | | | | | | | | |
| | | Tax-Managed Growth Fund 1.1 — Class C | |
| |
| | | Year Ended December 31, | |
| | | 2021 | | | 2020 | | | 2019 | | | 2018 | | | 2017 | |
| | | | | |
Net asset value — Beginning of year | | $ | 67.810 | | | $ | 55.530 | | | $ | 43.280 | | | $ | 46.100 | | | $ | 38.040 | |
| | | | | |
| Income (Loss) From Operations | | | | | | | | | | | | | | | | | | | | |
| | | | | |
Net investment income (loss)(1) | | $ | (0.268 | ) | | $ | 0.015 | | | $ | (0.018 | ) | | $ | 0.082 | | | $ | 0.114 | |
| | | | | |
Net realized and unrealized gain (loss) | | | 16.378 | | | | 12.265 | | | | 12.268 | | | | (2.832 | ) | | | 8.047 | |
| | | | | |
Total income (loss) from operations | | $ | 16.110 | | | $ | 12.280 | | | $ | 12.250 | | | $ | (2.750 | ) | | $ | 8.161 | |
| | | | | |
| Less Distributions | | | | | | | | | | | | | | | | | | | | |
| | | | | |
From net investment income | | $ | — | | | $ | — | | | $ | — | | | $ | (0.070 | ) | | $ | (0.101 | ) |
| | | | | |
Total distributions | | $ | — | | | $ | — | | | $ | — | | | $ | (0.070 | ) | | $ | (0.101 | ) |
| | | | | |
Net asset value — End of year | | $ | 83.920 | | | $ | 67.810 | | | $ | 55.530 | | | $ | 43.280 | | | $ | 46.100 | |
| | | | | |
Total Return(2) | | | 23.76 | % | | | 22.11 | % | | | 28.34 | % | | | (5.99 | )% | | | 21.46 | % |
| | | | | |
| Ratios/Supplemental Data | | | | | | | | | | | | | | | | | | | | |
| | | | | |
Net assets, end of year (000’s omitted) | | $ | 8,801 | | | $ | 9,517 | | | $ | 13,730 | | | $ | 202,974 | | | $ | 248,201 | |
| | | | | |
Ratios (as a percentage of average daily net assets):(3) | | | | | | | | | | | | | | | | | | | | |
| | | | | |
Expenses | | | 1.48 | % | | | 1.51 | % | | | 1.55 | % | | | 1.54 | % | | | 1.54 | % |
| | | | | |
Net investment income (loss) | | | (0.35 | )% | | | 0.03 | % | | | (0.04 | )% | | | 0.17 | % | | | 0.27 | % |
| | | | | |
Portfolio Turnover of the Portfolio(4) | | | 1 | % | | | 1 | % | | | 1 | % | | | 1 | % | | | 0 | %(5) |
| (1) | Computed using average shares outstanding. |
| (2) | Returns are historical and are calculated by determining the percentage change in net asset value with all distributions reinvested and do not reflect the effect of sales charges. |
| (3) | Includes the Fund’s share of the Portfolio’s allocated expenses. |
| (4) | Excludes the value of portfolio securities contributed or distributed as a result of in-kind shareholder transactions. The portfolio turnover of the Portfolio including in-kind contributions and distributions of securities was 4%, 6%, 6%, 6% and 5% for the years ended December 31, 2021, 2020, 2019, 2018 and 2017, respectively. |
| (5) | Amount is less than 0.5%. |
| | | | |
| | 14 | | See Notes to Financial Statements. |
Eaton Vance
Tax-Managed Growth Funds 1.1 and 1.2
December 31, 2021
Financial Highlights — continued
| | | | | | | | | | | | | | | | | | | | |
| | | Tax-Managed Growth Fund 1.1 — Class I | |
| |
| | | Year Ended December 31, | |
| | | 2021 | | | 2020 | | | 2019 | | | 2018 | | | 2017 | |
| | | | | |
Net asset value — Beginning of year | | $ | 70.350 | | | $ | 57.570 | | | $ | 44.920 | | | $ | 47.920 | | | $ | 39.530 | |
| | | | | |
| Income (Loss) From Operations | | | | | | | | | | | | | | | | | | | | |
| | | | | |
Net investment income(1) | | $ | 0.514 | | | $ | 0.594 | | | $ | 0.628 | | | $ | 0.584 | | | $ | 0.542 | |
| | | | | |
Net realized and unrealized gain (loss) | | | 17.064 | | | | 12.817 | | | | 12.675 | | | | (2.996 | ) | | | 8.414 | |
| | | | | |
Total income (loss) from operations | | $ | 17.578 | | | $ | 13.411 | | | $ | 13.303 | | | $ | (2.412 | ) | | $ | 8.956 | |
| | | | | |
| Less Distributions | | | | | | | | | | | | | | | | | | | | |
| | | | | |
From net investment income | | $ | (0.548 | ) | | $ | (0.631 | ) | | $ | (0.653 | ) | | $ | (0.588 | ) | | $ | (0.566 | ) |
| | | | | |
Total distributions | | $ | (0.548 | ) | | $ | (0.631 | ) | | $ | (0.653 | ) | | $ | (0.588 | ) | | $ | (0.566 | ) |
| | | | | |
Net asset value — End of year | | $ | 87.380 | | | $ | 70.350 | | | $ | 57.570 | | | $ | 44.920 | | | $ | 47.920 | |
| | | | | |
Total Return(2) | | | 25.00 | % | | | 23.31 | % | | | 29.74 | % | | | (5.11 | )% | | | 22.67 | % |
| | | | | |
| Ratios/Supplemental Data | | | | | | | | | | | | | | | | | | | | |
| | | | | |
Net assets, end of year (000’s omitted) | | $ | 297,628 | | | $ | 227,801 | | | $ | 183,702 | | | $ | 136,976 | | | $ | 114,276 | |
| | | | | |
Ratios (as a percentage of average daily net assets):(3) | | | | | | | | | | | | | | | | | | | | |
| | | | | |
Expenses | | | 0.48 | % | | | 0.51 | % | | | 0.53 | % | | | 0.54 | % | | | 0.54 | % |
| | | | | |
Net investment income | | | 0.64 | % | | | 1.01 | % | | | 1.20 | % | | | 1.17 | % | | | 1.24 | % |
| | | | | |
Portfolio Turnover of the Portfolio(4) | | | 1 | % | | | 1 | % | | | 1 | % | | | 1 | % | | | 0 | %(5) |
| (1) | Computed using average shares outstanding. |
| (2) | Returns are historical and are calculated by determining the percentage change in net asset value with all distributions reinvested. |
| (3) | Includes the Fund’s share of the Portfolio’s allocated expenses. |
| (4) | Excludes the value of portfolio securities contributed or distributed as a result of in-kind shareholder transactions. The portfolio turnover of the Portfolio including in-kind contributions and distributions of securities was 4%, 6%, 6%, 6% and 5% for the years ended December 31, 2021, 2020, 2019, 2018 and 2017, respectively. |
| (5) | Amount is less than 0.5%. |
| | | | |
| | 15 | | See Notes to Financial Statements. |
Eaton Vance
Tax-Managed Growth Funds 1.1 and 1.2
December 31, 2021
Financial Highlights — continued
| | | | | | | | | | | | | | | | | | | | |
| | | Tax-Managed Growth Fund 1.2 — Class A | |
| |
| | | Year Ended December 31, | |
| | | 2021 | | | 2020 | | | 2019 | | | 2018 | | | 2017 | |
| | | | | |
Net asset value — Beginning of year | | $ | 33.950 | | | $ | 27.770 | | | $ | 21.650 | | | $ | 23.060 | | | $ | 19.020 | |
| | | | | |
| Income (Loss) From Operations | | | | | | | | | | | | | | | | | | | | |
| | | | | |
Net investment income(1) | | $ | 0.093 | | | $ | 0.171 | | | $ | 0.205 | | | $ | 0.184 | | | $ | 0.177 | |
| | | | | |
Net realized and unrealized gain (loss) | | | 8.216 | | | | 6.171 | | | | 6.108 | | | | (1.432 | ) | | | 4.035 | |
| | | | | |
Total income (loss) from operations | | $ | 8.309 | | | $ | 6.342 | | | $ | 6.313 | | | $ | (1.248 | ) | | $ | 4.212 | |
| | | | | |
| Less Distributions | | | | | | | | | | | | | | | | | | | | |
| | | | | |
From net investment income | | $ | (0.069 | ) | | $ | (0.162 | ) | | $ | (0.193 | ) | | $ | (0.162 | ) | | $ | (0.172 | ) |
| | | | | |
Total distributions | | $ | (0.069 | ) | | $ | (0.162 | ) | | $ | (0.193 | ) | | $ | (0.162 | ) | | $ | (0.172 | ) |
| | | | | |
Net asset value — End of year | | $ | 42.190 | | | $ | 33.950 | | | $ | 27.770 | | | $ | 21.650 | | | $ | 23.060 | |
| | | | | |
Total Return(2) | | | 24.48 | % | | | 22.84 | % | | | 29.28 | % | | | (5.50 | )% | | | 22.15 | % |
| | | | | |
| Ratios/Supplemental Data | | | | | | | | | | | | | | | | | | | | |
| | | | | |
Net assets, end of year (000’s omitted) | | $ | 894,809 | | | $ | 736,814 | | | $ | 629,530 | | | $ | 427,333 | | | $ | 472,741 | |
| | | | | |
Ratios (as a percentage of average daily net assets):(3) | | | | | | | | | | | | | | | | | | | | |
| | | | | |
Expenses | | | 0.88 | % | | | 0.92 | % | | | 0.93 | % | | | 0.94 | % | | | 0.95 | % |
| | | | | |
Net investment income | | | 0.24 | % | | | 0.61 | % | | | 0.81 | % | | | 0.77 | % | | | 0.84 | % |
| | | | | |
Portfolio Turnover of the Fund(4) | | | — | | | | — | | | | — | | | | — | | | | 1 | % |
| | | | | |
Portfolio Turnover of the Portfolio(5) | | | 1 | % | | | 1 | % | | | 1 | % | | | 1 | % | | | 0 | %(6) |
| (1) | Computed using average shares outstanding. |
| (2) | Returns are historical and are calculated by determining the percentage change in net asset value with all distributions reinvested and do not reflect the effect of sales charges. |
| (3) | Includes the Fund’s share of the Portfolio’s allocated expenses. |
| (4) | Excludes the value of Fund securities contributed or distributed as a result of in-kind transactions. The portfolio turnover of the Fund including in-kind contributions and distributions of securities was 3% for the year ended December 31, 2017. |
| (5) | Excludes the value of portfolio securities contributed or distributed as a result of in-kind shareholder transactions. The portfolio turnover of the Portfolio including in-kind contributions and distributions of securities was 4%, 6%, 6%, 6% and 5% for the years ended December 31, 2021, 2020, 2019, 2018 and 2017, respectively. |
| (6) | Amount is less than 0.5%. |
| | | | |
| | 16 | | See Notes to Financial Statements. |
Eaton Vance
Tax-Managed Growth Funds 1.1 and 1.2
December 31, 2021
Financial Highlights — continued
| | | | | | | | | | | | | | | | | | | | |
| | | Tax-Managed Growth Fund 1.2 — Class C | |
| |
| | | Year Ended December 31, | |
| | | 2021 | | | 2020 | | | 2019 | | | 2018 | | | 2017 | |
| | | | | |
Net asset value — Beginning of year | | $ | 32.960 | | | $ | 27.030 | | | $ | 21.080 | | | $ | 22.460 | | | $ | 18.530 | |
| | | | | |
| Income (Loss) From Operations | | | | | | | | | | | | | | | | | | | | |
| | | | | |
Net investment income (loss)(1) | | $ | (0.188 | ) | | $ | (0.037 | ) | | $ | 0.003 | | | $ | 0.004 | | | $ | 0.022 | |
| | | | | |
Net realized and unrealized gain (loss) | | | 7.948 | | | | 5.967 | | | | 5.947 | | | | (1.384 | ) | | | 3.912 | |
| | | | | |
Total income (loss) from operations | | $ | 7.760 | | | $ | 5.930 | | | $ | 5.950 | | | $ | (1.380 | ) | | $ | 3.934 | |
| | | | | |
| Less Distributions | | | | | | | | | | | | | | | | | | | | |
| | | | | |
From net investment income | | $ | — | | | $ | — | | | $ | — | | | $ | — | | | $ | (0.004 | ) |
| | | | | |
Total distributions | | $ | — | | | $ | — | | | $ | — | | | $ | — | | | $ | (0.004 | ) |
| | | | | |
Net asset value — End of year | | $ | 40.720 | | | $ | 32.960 | | | $ | 27.030 | | | $ | 21.080 | | | $ | 22.460 | |
| | | | | |
Total Return(2) | | | 23.54 | % | | | 21.94 | % | | | 28.22 | % | | | (6.14 | )% | | | 21.23 | % |
| | | | | |
| Ratios/Supplemental Data | | | | | | | | | | | | | | | | | | | | |
| | | | | |
Net assets, end of year (000’s omitted) | | $ | 61,484 | | | $ | 54,119 | | | $ | 61,397 | | | $ | 142,020 | | | $ | 173,289 | |
| | | | | |
Ratios (as a percentage of average daily net assets):(3) | | | | | | | | | | | | | | | | | | | | |
| | | | | |
Expenses | | | 1.63 | % | | | 1.67 | % | | | 1.68 | % | | | 1.69 | % | | | 1.70 | % |
| | | | | |
Net investment income (loss) | | | (0.51 | )% | | | (0.14 | )% | | | 0.01 | % | | | 0.02 | % | | | 0.11 | % |
| | | | | |
Portfolio Turnover of the Fund(4) | | | — | | | | — | | | | — | | | | — | | | | 1 | % |
| | | | | |
Portfolio Turnover of the Portfolio(5) | | | 1 | % | | | 1 | % | | | 1 | % | | | 1 | % | | | 0 | %(6) |
| (1) | Computed using average shares outstanding. |
| (2) | Returns are historical and are calculated by determining the percentage change in net asset value with all distributions reinvested and do not reflect the effect of sales charges. |
| (3) | Includes the Fund’s share of the Portfolio’s allocated expenses. |
| (4) | Excludes the value of Fund securities contributed or distributed as a result of in-kind transactions. The portfolio turnover of the Fund including in-kind contributions and distributions of securities was 3% for the year ended December 31, 2017. |
| (5) | Excludes the value of portfolio securities contributed or distributed as a result of in-kind shareholder transactions. The portfolio turnover of the Portfolio including in-kind contributions and distributions of securities was 4%, 6%, 6%, 6% and 5% for the years ended December 31, 2021, 2020, 2019, 2018 and 2017, respectively. |
| (6) | Amount is less than 0.5%. |
| | | | |
| | 17 | | See Notes to Financial Statements. |
Eaton Vance
Tax-Managed Growth Funds 1.1 and 1.2
December 31, 2021
Financial Highlights — continued
| | | | | | | | | | | | | | | | | | | | |
| | | Tax-Managed Growth Fund 1.2 — Class I | |
| |
| | | Year Ended December 31, | |
| | | 2021 | | | 2020 | | | 2019 | | | 2018 | | | 2017 | |
| | | | | |
Net asset value — Beginning of year | | $ | 34.030 | | | $ | 27.830 | | | $ | 21.690 | | | $ | 23.110 | | | $ | 19.060 | |
| | | | | |
| Income (Loss) From Operations | | | | | | | | | | | | | | | | | | | | |
| | | | | |
Net investment income(1) | | $ | 0.190 | | | $ | 0.242 | | | $ | 0.266 | | | $ | 0.244 | | | $ | 0.229 | |
| | | | | |
Net realized and unrealized gain (loss) | | | 8.235 | | | | 6.192 | | | | 6.130 | | | | (1.439 | ) | | | 4.046 | |
| | | | | |
Total income (loss) from operations | | $ | 8.425 | | | $ | 6.434 | | | $ | 6.396 | | | $ | (1.195 | ) | | $ | 4.275 | |
| | | | | |
| Less Distributions | | | | | | | | | | | | | | | | | | | | |
| | | | | |
From net investment income | | $ | (0.165 | ) | | $ | (0.234 | ) | | $ | (0.256 | ) | | $ | (0.225 | ) | | $ | (0.225 | ) |
| | | | | |
Total distributions | | $ | (0.165 | ) | | $ | (0.234 | ) | | $ | (0.256 | ) | | $ | (0.225 | ) | | $ | (0.225 | ) |
| | | | | |
Net asset value — End of year | | $ | 42.290 | | | $ | 34.030 | | | $ | 27.830 | | | $ | 21.690 | | | $ | 23.110 | |
| | | | | |
Total Return(2) | | | 24.77 | % | | | 23.13 | % | | | 29.61 | % | | | (5.25 | )% | | | 22.44 | % |
| | | | | |
| Ratios/Supplemental Data | | | | | | | | | | | | | | | | | | | | |
| | | | | |
Net assets, end of year (000’s omitted) | | $ | 326,586 | | | $ | 256,802 | | | $ | 223,771 | | | $ | 154,772 | | | $ | 134,355 | |
| | | | | |
Ratios (as a percentage of average daily net assets):(3) | | | | | | | | | | | | | | | | | | | | |
| | | | | |
Expenses | | | 0.63 | % | | | 0.67 | % | | | 0.68 | % | | | 0.69 | % | | | 0.70 | % |
| | | | | |
Net investment income | | | 0.49 | % | | | 0.85 | % | | | 1.05 | % | | | 1.02 | % | | | 1.09 | % |
| | | | | |
Portfolio Turnover of the Fund(4) | | | — | | | | — | | | | — | | | | — | | | | 1 | % |
| | | | | |
Portfolio Turnover of the Portfolio(5) | | | 1 | % | | | 1 | % | | | 1 | % | | | 1 | % | | | 0 | %(6) |
| (1) | Computed using average shares outstanding. |
| (2) | Returns are historical and are calculated by determining the percentage change in net asset value with all distributions reinvested. |
| (3) | Includes the Fund’s share of the Portfolio’s allocated expenses. |
| (4) | Excludes the value of Fund securities contributed or distributed as a result of in-kind transactions. The portfolio turnover of the Fund including in-kind contributions and distributions of securities was 3% for the year ended December 31, 2017. |
| (5) | Excludes the value of portfolio securities contributed or distributed as a result of in-kind shareholder transactions. The portfolio turnover of the Portfolio including in-kind contributions and distributions of securities was 4%, 6%, 6%, 6% and 5% for the years ended December 31, 2021, 2020, 2019, 2018 and 2017, respectively. |
| (6) | Amount is less than 0.5%. |
| | | | |
| | 18 | | See Notes to Financial Statements. |
Eaton Vance
Tax-Managed Growth Funds 1.1 and 1.2
December 31, 2021
Notes to Financial Statements
1 Significant Accounting Policies
Eaton Vance Tax-Managed Growth Fund 1.1 (Tax-Managed Growth Fund 1.1) and Eaton Vance Tax-Managed Growth Fund 1.2 (Tax-Managed Growth Fund 1.2) (each a Fund, and collectively the Funds) are diversified series of the Eaton Vance Mutual Funds Trust (the Trust). The Trust is a Massachusetts business trust registered under the Investment Company Act of 1940, as amended (the 1940 Act), as an open-end management investment company. Each Fund currently offers Class A, Class C and Class I shares. Class A shares are generally sold subject to a sales charge imposed at time of purchase. Class C shares are sold at net asset value and are generally subject to a contingent deferred sales charge (see Note 5). Effective January 25, 2019, Class C shares generally automatically convert to Class A shares ten years after their purchase and, effective November 5, 2020, automatically convert to Class A shares eight years after their purchase as described in the Fund’s prospectus. Class I shares are sold at net asset value and are not subject to a sales charge. Tax-Managed Growth Fund 1.1 is closed to new investors. Each class represents a pro-rata interest in each Fund, but votes separately on class-specific matters and (as noted below) is subject to different expenses. Realized and unrealized gains and losses and net investment income and losses, other than class-specific expenses, are allocated daily to each class of shares based on the relative net assets of each class to the total net assets of the Fund. Each class of shares differs in its distribution plan and certain other class-specific expenses. Each Fund typically invests all of its investable assets in interests in Tax-Managed Growth Portfolio (the Portfolio), a Massachusetts business trust, having the same investment objective and policies as the Funds. The value of each Fund’s investment in the Portfolio reflects the Fund’s proportionate interest in the net assets of the Portfolio (6.5% and 3.4% for Tax-Managed Growth Fund 1.1 and Tax-Managed Growth Fund 1.2, respectively, at December 31, 2021). The performance of each Fund is directly affected by the performance of the Portfolio. The financial statements of the Portfolio, including the portfolio of investments, are included elsewhere in this report and should be read in conjunction with the Funds’ financial statements.
The following is a summary of significant accounting policies of the Funds. The policies are in conformity with accounting principles generally accepted in the United States of America (U.S. GAAP). Each Fund is an investment company and follows accounting and reporting guidance in the Financial Accounting Standards Board (FASB) Accounting Standards Codification Topic 946 “Financial Services-Investment Companies.”
A Investment Valuation — Valuation of securities by the Portfolio is discussed in Note 1A of the Portfolio’s Notes to Financial Statements, which are included elsewhere in this report.
B Income — Each Fund’s net investment income or loss consists of the Fund’s pro-rata share of the net investment income or loss of the Portfolio, less all actual and accrued expenses of the Fund.
C Federal Taxes — Each Fund’s policy is to comply with the provisions of the Internal Revenue Code applicable to regulated investment companies and to distribute to shareholders each year substantially all of its net investment income, and all or substantially all of its net realized capital gains. Accordingly, no provision for federal income or excise tax is necessary.
As of December 31, 2021, the Funds had no uncertain tax positions that would require financial statement recognition, de-recognition, or disclosure. Each Fund files a U.S. federal income tax return annually after its fiscal year-end, which is subject to examination by the Internal Revenue Service for a period of three years from the date of filing.
D Expenses — The majority of expenses of the Trust are directly identifiable to an individual fund. Expenses which are not readily identifiable to a specific fund are allocated taking into consideration, among other things, the nature and type of expense and the relative size of the funds.
E Use of Estimates — The preparation of the financial statements in conformity with U.S. GAAP requires management to make estimates and assumptions that affect the reported amounts of assets and liabilities at the date of the financial statements and the reported amounts of income and expense during the reporting period. Actual results could differ from those estimates.
F Indemnifications — Under the Trust’s organizational documents, its officers and Trustees may be indemnified against certain liabilities and expenses arising out of the performance of their duties to each Fund. Under Massachusetts law, if certain conditions prevail, shareholders of a Massachusetts business trust (such as the Trust) could be deemed to have personal liability for the obligations of the Trust. However, the Trust’s Declaration of Trust contains an express disclaimer of liability on the part of Fund shareholders and the By-laws provide that the Trust shall assume, upon request by the shareholder, the defense on behalf of any Fund shareholders. Moreover, the By-laws also provide for indemnification out of Fund property of any shareholder held personally liable solely by reason of being or having been a shareholder for all loss or expense arising from such liability. Additionally, in the normal course of business, each Fund enters into agreements with service providers that may contain indemnification clauses. Each Fund’s maximum exposure under these arrangements is unknown as this would involve future claims that may be made against each Fund that have not yet occurred.
G Other — Investment transactions are accounted for on a trade date basis. Realized gains and losses on investments sold are determined on the basis of identified cost.
2 Distributions to Shareholders and Income Tax Information
It is the present policy of each Fund to make at least one distribution annually (normally in December) of all or substantially all of its net investment income and to distribute annually all or substantially all of its net realized capital gains (reduced by available capital loss carryforwards from prior years). Distributions to shareholders are recorded on the ex-dividend date. Distributions are declared separately for each class of shares. Shareholders may reinvest
Eaton Vance
Tax-Managed Growth Funds 1.1 and 1.2
December 31, 2021
Notes to Financial Statements — continued
income and capital gain distributions in additional shares of the same class of a Fund at the net asset value as of the ex-dividend date or, at the election of the shareholder, receive distributions in cash. Distributions to shareholders are determined in accordance with income tax regulations, which may differ from U.S. GAAP. As required by U.S. GAAP, only distributions in excess of tax basis earnings and profits are reported in the financial statements as a return of capital. Permanent differences between book and tax accounting relating to distributions are reclassified to paid-in capital. For tax purposes, distributions from short-term capital gains are considered to be from ordinary income.
The tax character of distributions declared for the years ended December 31, 2021 and December 31, 2020 was as follows:
| | | | | | | | |
| | | Year Ended December 31, 2021 | |
| | | Tax-Managed
Growth Fund 1.1 | | | Tax-Managed
Growth Fund 1.2 | |
| | |
Distributions declared from: | | | | | | | | |
| | |
Ordinary income | | $ | 9,272,283 | | | $ | 2,730,905 | |
| |
| | | Year Ended December 31, 2020 | |
| | | Tax-Managed
Growth Fund 1.1 | | | Tax-Managed
Growth Fund 1.2 | |
| | |
Distributions declared from: | | | | | | | | |
| | |
Ordinary income | | $ | 13,091,885 | | | $ | 5,272,599 | |
During the year ended December 31, 2021, the following amounts were reclassified due to the Funds’ use of equalization accounting and differences between book and tax accounting for the Funds’ investment in the Portfolio. Tax equalization accounting allows the Funds to treat as a distribution that portion of redemption proceeds representing a redeeming shareholder’s portion of undistributed taxable income and net capital gains.
| | | | | | | | |
| | | Tax-Managed
Growth Fund 1.1 | | | Tax-Managed
Growth Fund 1.2 | |
| | | |
Change in: | | | | | | | | |
| | |
Paid-in capital | | $ | 77,109,675 | | | $ | 27,569,391 | |
| | |
Distributable earnings | | $ | (77,109,675 | ) | | $ | (27,569,391 | ) |
These reclassifications had no effect on the net assets or net asset value per share of the Funds.
As of December 31, 2021, the components of distributable earnings (accumulated loss) and unrealized appreciation (depreciation) on a tax basis were as follows:
| | | | | | | | |
| | | Tax-Managed
Growth Fund 1.1 | | | Tax-Managed
Growth Fund 1.2 | |
| | |
Undistributed ordinary income | | $ | — | | | $ | 295,835 | |
| | |
Deferred capital losses | | $ | (1,427,986 | ) | | $ | (7,133 | ) |
| | |
Net unrealized appreciation | | $ | 1,240,946,090 | | | $ | 482,016,945 | |
| | |
Distributable earnings | | $ | 1,239,518,104 | | | $ | 482,305,647 | |
At December 31, 2021, the Funds, for federal income tax purposes, had deferred capital losses which would reduce the respective Fund’s taxable income arising from future net realized gains on investment transactions, if any, to the extent permitted by the Internal Revenue Code, and thus would reduce the amount of distributions to shareholders, which would otherwise be necessary to relieve the Funds of any liability for federal income or excise tax. The
Eaton Vance
Tax-Managed Growth Funds 1.1 and 1.2
December 31, 2021
Notes to Financial Statements — continued
deferred capital losses are treated as arising on the first day of the respective Fund’s next taxable year and retain the same short-term or long-term character as when originally deferred. The amounts of the deferred capital losses are as follows:
| | | | | | | | |
| | | Tax-Managed
Growth Fund 1.1 | | | Tax-Managed
Growth Fund 1.2 | |
| | |
Deferred capital losses | | | | | | | | |
| | |
Short-term | | $ | 1,427,986 | | | $ | 7,133 | |
3 Transactions with Affiliates
Effective March 1, 2021, each of the Funds entered into an investment advisory agreement with Eaton Vance Management (EVM). Pursuant to the agreement, each Fund pays an investment adviser fee on its average daily net assets that are not invested in other investment companies for which EVM or its affiliates serve as investment adviser and receive an advisory fee, at a per annum rate that is the same as that payable by the Portfolio. For the year ended December 31, 2021, the Funds incurred no investment adviser fee on such assets. To the extent each Fund’s assets are invested in the Portfolio, each Fund is allocated its pro rata share of the Portfolio’s investment adviser fee. The Portfolio has engaged Boston Management and Research (BMR) to render investment advisory services. See Note 2 of the Portfolio’s Notes to Financial Statements which are included elsewhere in this report. EVM serves as
the administrator of the Funds. EVM receives no compensation from Tax-Managed Growth Fund 1.1 for such services and a fee computed at an annual rate of 0.15% of average daily net assets from Tax-Managed Growth Fund 1.2 for such services. For the year ended December 31, 2021, the administration fee for Tax-Managed Growth Fund 1.2 amounted to $1,754,185.
EVM provides sub-transfer agency and related services to the Funds pursuant to a Sub-Transfer Agency Support Services Agreement. Eaton Vance Distributors, Inc. (EVD), an affiliate of EVM and the Funds’ principal underwriter, received a portion of the sales charge on sales of Class A shares of the Funds. EVD also received distribution and service fees from Class A and Class C shares (see Note 4) and contingent deferred sales charges (see Note 5). Sub-transfer agent fees earned by EVM, which are included in transfer and dividend disbursing agent fees on the Statements of Operations, and Class A sales charges that the Funds were informed were received by EVD for the year ended December 31, 2021 were as follows:
| | | | | | | | |
| | | Tax-Managed
Growth Fund 1.1 | | | Tax-Managed
Growth Fund 1.2 | |
| | |
EVM’s Sub-Transfer Agent Fees | | $ | 202,638 | | | $ | 72,527 | |
| | |
EVD’s Class A Sales Charges | | $ | 19,262 | | | $ | 65,409 | |
The Funds were informed that Morgan Stanley affiliated broker-dealers, which may be deemed to be affiliates of BMR, EVM and EVD, also received a portion of the sales charge on sales of Class A shares from March 1, 2021 through December 31, 2021 in the amount of $2,142 and $4,048 for Tax-Managed Growth Fund 1.1 and Tax-Managed Growth Fund 1.2, respectively.
Trustees and officers of the Funds who are members of EVM’s or BMR’s organizations receive remuneration for their services to the Funds out of the investment adviser fee. Certain officers and Trustees of the Funds and the Portfolio are officers of the above organizations.
4 Distribution Plans
Each Fund has in effect a distribution plan for Class A shares (Class A Plan) pursuant to Rule 12b-1 under the 1940 Act. Pursuant to the Class A Plan, each Fund pays EVD a distribution and service fee of 0.25% per annum of its average daily net assets attributable to Class A shares for distribution services and facilities provided to each Fund by EVD, as well as for personal services and/or the maintenance of shareholder accounts. Distribution and service fees paid or accrued to EVD for the year ended December 31, 2021 for Class A shares amounted to the following:
| | | | | | | | |
| | | Tax-Managed
Growth Fund 1.1 | | | Tax-Managed
Growth Fund 1.2 | |
| | |
Class A Distribution and Service Fees | | $ | 4,906,580 | | | $ | 2,052,047 | |
Eaton Vance
Tax-Managed Growth Funds 1.1 and 1.2
December 31, 2021
Notes to Financial Statements — continued
Each Fund also has in effect distribution plans for Class C shares (Class C Plan) pursuant to Rule 12b-1 under the 1940 Act. Pursuant to the Class C Plan each Fund pays EVD amounts equal to 0.75% per annum of its average daily net assets attributable to Class C shares for providing ongoing distribution services and facilities to the respective Fund. For the year ended December 31, 2021, the Funds paid or accrued to EVD the following distribution fees:
| | | | | | | | |
| | | Tax-Managed
Growth Fund 1.1 | | | Tax-Managed
Growth Fund 1.2 | |
| | |
Class C Distribution Fees | | $ | 70,006 | | | $ | 434,373 | |
Pursuant to the Class C Plan, each Fund also makes payments of service fees to EVD, financial intermediaries and other persons in amounts equal to 0.25% per annum of its average daily net assets attributable to that class. Service fees paid or accrued are for personal services and/or the maintenance of shareholder accounts. They are separate and distinct from the sales commissions and distribution fees payable to EVD. Service fees paid or accrued for the year ended December 31, 2021 amounted to the following:
| | | | | | | | |
| | | Tax-Managed
Growth Fund 1.1 | | | Tax-Managed
Growth Fund 1.2 | |
| | |
Class C Service Fees | | $ | 23,335 | | | $ | 144,791 | |
Distribution and service fees are subject to the limitations contained in the Financial Industry Regulatory Authority Rule 2341(d).
5 Contingent Deferred Sales Charges
A contingent deferred sales charge (CDSC) generally is imposed on redemptions of Class C shares made within one year of purchase. Class A shares may be subject to a 1% CDSC if redeemed within 18 months of purchase (depending on the circumstances of purchase). Generally, the CDSC is based upon the lower of the net asset value at date of redemption or date of purchase. No charge is levied on shares acquired by reinvestment of dividends or capital gain distributions. Class C shares are subject to a 1% CDSC if redeemed within one year of purchase. For the year ended December 31, 2021, the Funds were informed that EVD received approximately the following amounts of CDSCs paid by Class A and Class C shareholders:
| | | | | | | | |
| | | Tax-Managed
Growth Fund 1.1 | | | Tax-Managed
Growth Fund 1.2 | |
| | |
Class A | | $ | — | | | $ | 300 | |
| | |
Class C | | $ | — | | | $ | 1,300 | |
6 Investment Transactions
For the year ended December 31, 2021, increases and decreases in each Fund’s investment in the Portfolio aggregated, as follows:
| | | | | | | | |
| Fund | | Increases | | | Decreases | |
| | |
Tax-Managed Growth Fund 1.1 | | $ | 1,050,502 | | | $ | 104,037,724 | |
| | |
Tax-Managed Growth Fund 1.2 | | $ | 16,499,962 | | | $ | 40,630,107 | |
Decreases in each Fund’s investment in the Portfolio include distributions of securities as the result of redemptions in-kind, as follows:
| | | | |
| Fund | | Redemptions in-kind | |
| |
Tax-Managed Growth Fund 1.1 | | $ | 78,572,868 | |
| |
Tax-Managed Growth Fund 1.2 | | $ | 27,991,559 | |
Eaton Vance
Tax-Managed Growth Funds 1.1 and 1.2
December 31, 2021
Notes to Financial Statements — continued
7 Shares of Beneficial Interest
Each Fund’s Declaration of Trust permits the Trustees to issue an unlimited number of full and fractional shares of beneficial interest (without par value). Such shares may be issued in a number of different series (such as the Funds) and classes. Sales and redemptions of Class I shares include shares purchased and redeemed in connection with the ReFlow liquidity program, a program designed to provide an alternative liquidity source for mutual funds experiencing net redemptions of their shares. Transactions in Fund shares were as follows:
| | | | | | | | | | | | |
Tax-Managed Growth Fund 1.1 | | | | | | | | | |
| | | Year Ended December 31, 2021 | |
| | | Class A | | | Class C | | | Class I | |
| | | |
Sales | | | 104,923 | | | | 3,103 | | | | 1,383,116 | |
| | | |
Issued to shareholders electing to receive payments of distributions in Fund shares | | | 68,850 | | | | — | | | | 18,295 | |
| | | |
Redemptions | | | (1,349,293 | ) | | | (16,890 | ) | | | (1,233,101 | ) |
| | | |
Converted from Class C shares | | | 19,389 | | | | — | | | | — | |
| | | |
Converted to Class A shares | | | — | | | | (21,672 | ) | | | — | |
| | | |
Net increase (decrease) | | | (1,156,131 | ) | | | (35,459 | ) | | | 168,310 | |
| |
| | | Year Ended December 31, 2020 | |
| | | Class A | | | Class C | | | Class I | |
| | | |
Sales | | | 116,260 | | | | 7,045 | | | | 2,263,887 | |
| | | |
Issued to shareholders electing to receive payments of distributions in Fund shares | | | 126,236 | | | | — | | | | 24,517 | |
| | | |
Redemptions | | | (2,021,959 | ) | | | (53,714 | ) | | | (2,241,216 | ) |
| | | |
Converted from Class C shares | | | 53,896 | | | | — | | | | — | |
| | | |
Converted to Class A shares | | | — | | | | (60,247 | ) | | | — | |
| | | |
Net increase (decrease) | | | (1,725,567 | ) | | | (106,916 | ) | | | 47,188 | |
| | | |
Tax-Managed Growth Fund 1.2 | | | | | | | | | |
| | | Year Ended December 31, 2021 | |
| | | Class A | | | Class C | | | Class I | |
| | | |
Sales | | | 773,549 | | | | 227,686 | | | | 1,738,618 | |
| | | |
Issued to shareholders electing to receive payments of distributions in Fund shares | | | 31,337 | | | | — | | | | 28,099 | |
| | | |
Redemptions | | | (1,420,350 | ) | | | (234,470 | ) | | | (1,592,099 | ) |
| | | |
Converted from Class C shares | | | 121,263 | | | | — | | | | — | |
| | | |
Converted to Class A shares | | | — | | | | (125,337 | ) | | | — | |
| | | |
Net increase (decrease) | | | (494,201 | ) | | | (132,121 | ) | | | 174,618 | |
| |
| | | Year Ended December 31, 2020 | |
| | | Class A | | | Class C | | | Class I | |
| | | |
Sales | | | 791,267 | | | | 207,023 | | | | 3,272,236 | |
| | | |
Issued to shareholders electing to receive payments of distributions in Fund shares | | | 92,919 | | | | — | | | | 47,521 | |
| | | |
Redemptions | | | (2,182,387 | ) | | | (495,055 | ) | | | (3,814,580 | ) |
| | | |
Converted from Class C shares | | | 330,502 | | | | — | | | | — | |
| | | |
Converted to Class A shares | | | — | | | | (341,400 | ) | | | — | |
| | | |
Net decrease | | | (967,699 | ) | | | (629,432 | ) | | | (494,823 | ) |
Eaton Vance
Tax-Managed Growth Funds 1.1 and 1.2
December 31, 2021
Notes to Financial Statements — continued
8 Risks and Uncertainties
Pandemic Risk
An outbreak of respiratory disease caused by a novel coronavirus was first detected in China in late 2019 and subsequently spread internationally. This coronavirus has resulted in closing borders, enhanced health screenings, changes to healthcare service preparation and delivery, quarantines, cancellations, disruptions to supply chains and customer activity, as well as general concern and uncertainty. Health crises caused by outbreaks, such as the coronavirus outbreak, may exacerbate other pre-existing political, social and economic risks and disrupt normal market conditions and operations. The impact of this outbreak has negatively affected the worldwide economy, the economies of individual countries, individual companies, and the market in general, and may continue to do so in significant and unforeseen ways, as may other epidemics and pandemics that may arise in the future. Any such impact could adversely affect the Funds’ performance, or the performance of the securities in which the Funds invest.
Eaton Vance
Tax-Managed Growth Funds 1.1 and 1.2
December 31, 2021
Report of Independent Registered Public Accounting Firm
To the Trustees of Eaton Vance Mutual Funds Trust and Shareholders of Eaton Vance Tax-Managed Growth Fund 1.1 and Eaton Vance Tax-Managed Growth Fund 1.2:
Opinion on the Financial Statements and Financial Highlights
We have audited the accompanying statements of assets and liabilities of Eaton Vance Tax-Managed Growth Fund 1.1 and Eaton Vance Tax-Managed Growth Fund 1.2 (collectively the “Funds”) (each a fund constituting Eaton Vance Mutual Funds Trust), as of December 31, 2021, the related statements of operations for the year then ended, the statements of changes in net assets for each of the two years in the period then ended, the financial highlights for each of the five years in the period then ended, and the related notes. In our opinion, the financial statements and financial highlights present fairly, in all material respects, the financial position of the Funds as of December 31, 2021, and the results of their operations for the year then ended, the changes in their net assets for each of the two years in the period then ended, and the financial highlights for each of the five years in the period then ended, in conformity with accounting principles generally accepted in the United States of America.
Basis for Opinion
These financial statements and financial highlights are the responsibility of the Funds’ management. Our responsibility is to express an opinion on the Funds’ financial statements and financial highlights based on our audits. We are a public accounting firm registered with the Public Company Accounting Oversight Board (United States) (PCAOB) and are required to be independent with respect to the Funds in accordance with the U.S. federal securities laws and the applicable rules and regulations of the Securities and Exchange Commission and the PCAOB.
We conducted our audits in accordance with the standards of the PCAOB. Those standards require that we plan and perform the audits to obtain reasonable assurance about whether the financial statements and financial highlights are free of material misstatement, whether due to error or fraud. The Funds are not required to have, nor were we engaged to perform, an audit of their internal control over financial reporting. As part of our audits, we are required to obtain an understanding of internal control over financial reporting but not for the purpose of expressing an opinion on the effectiveness of the Funds’ internal control over financial reporting. Accordingly, we express no such opinion.
Our audits included performing procedures to assess the risks of material misstatement of the financial statements and financial highlights, whether due to error or fraud, and performing procedures that respond to those risks. Such procedures included examining, on a test basis, evidence regarding the amounts and disclosures in the financial statements and financial highlights. Our audits also included evaluating the accounting principles used and significant estimates made by management, as well as evaluating the overall presentation of the financial statements and financial highlights. We believe that our audits provide a reasonable basis for our opinion.
/s/ Deloitte & Touche LLP
Boston, Massachusetts
February 23, 2022
We have served as the auditor of one or more Eaton Vance investment companies since 1959.
Eaton Vance
Tax-Managed Growth Funds 1.1 and 1.2
December 31, 2021
Federal Tax Information (Unaudited)
The Form 1099-DIV you received in February 2022 showed the tax status of all distributions paid to your account in calendar year 2021. Shareholders are advised to consult their own tax adviser with respect to the tax consequences of their investment in the Fund. As required by the Internal Revenue Code and/or regulations, shareholders must be notified regarding the status of qualified dividend income for individuals and the dividends received deduction for corporations.
Qualified Dividend Income. For the fiscal year ended December 31, 2021, the Funds designate approximately the following amounts, or up to the maximum amount of such dividends allowable pursuant to the Internal Revenue Code, as qualified dividend income eligible for the reduced tax rate of 15%.
| | | | |
| |
Tax-Managed Growth Fund 1.1 | | $ | 25,354,483 | |
| |
Tax-Managed Growth Fund 1.2 | | $ | 13,255,944 | |
Dividends Received Deduction. Corporate shareholders are generally entitled to take the dividends received deduction on the portion of the Funds’ dividend distribution that qualifies under tax law. For the Funds’ fiscal 2021 ordinary income dividends, the following amounts qualify for the corporate dividends received deduction.
| | | | |
| |
Tax-Managed Growth Fund 1.1 | | | 100 | % |
| |
Tax-Managed Growth Fund 1.2 | | | 100 | % |
Tax-Managed Growth Portfolio
December 31, 2021
Portfolio of Investments
| | | | | | | | |
| Common Stocks — 99.7% | |
| Security | | Shares | | | Value | |
|
| Aerospace & Defense — 1.0% | |
| | |
Boeing Co. (The)(1) | | | 883,547 | | | $ | 177,875,682 | |
| | |
General Dynamics Corp. | | | 117,303 | | | | 24,454,157 | |
| | |
Hexcel Corp.(1) | | | 103,987 | | | | 5,386,527 | |
| | |
Howmet Aerospace, Inc. | | | 4 | | | | 127 | |
| | |
Huntington Ingalls Industries, Inc. | | | 2,300 | | | | 429,502 | |
| | |
L3Harris Technologies, Inc. | | | 7,156 | | | | 1,525,946 | |
| | |
Lockheed Martin Corp. | | | 132,079 | | | | 46,942,197 | |
| | |
Northrop Grumman Corp. | | | 54,977 | | | | 21,279,947 | |
| | |
Raytheon Technologies Corp. | | | 1,031,183 | | | | 88,743,609 | |
| | |
Textron, Inc. | | | 9,462 | | | | 730,466 | |
| | |
TransDigm Group, Inc.(1) | | | 3,386 | | | | 2,154,444 | |
| | |
| | | | | | | $ | 369,522,604 | |
|
| Air Freight & Logistics — 1.2% | |
| | |
C.H. Robinson Worldwide, Inc. | | | 280,266 | | | $ | 30,165,030 | |
| | |
Expeditors International of Washington, Inc. | | | 12,997 | | | | 1,745,367 | |
| | |
FedEx Corp. | | | 359,477 | | | | 92,975,131 | |
| | |
GXO Logistics, Inc.(1) | | | 97,791 | | | | 8,882,356 | |
| | |
United Parcel Service, Inc., Class B | | | 1,431,529 | | | | 306,833,926 | |
| | |
| | | | | | | $ | 440,601,810 | |
|
| Airlines — 0.0%(2) | |
| | |
American Airlines Group, Inc.(1) | | | 66,989 | | | $ | 1,203,122 | |
| | |
Delta Air Lines, Inc.(1) | | | 61,964 | | | | 2,421,553 | |
| | |
Southwest Airlines Co.(1) | | | 28,371 | | | | 1,215,414 | |
| | |
| | | | | | | $ | 4,840,089 | |
|
| Auto Components — 0.6% | |
| | |
Adient PLC(1) | | | 8,500 | | | $ | 406,980 | |
| | |
Aptiv PLC(1) | | | 1,022,078 | | | | 168,591,766 | |
| | |
BorgWarner, Inc. | | | 800 | | | | 36,056 | |
| | |
Dorman Products, Inc.(1) | | | 20,730 | | | | 2,342,697 | |
| | |
Fox Factory Holding Corp.(1) | | | 800 | | | | 136,080 | |
| | |
Garrett Motion, Inc.(1) | | | 6,726 | | | | 54,010 | |
| | |
Gentex Corp. | | | 1,443,192 | | | | 50,295,241 | |
| | |
| | | | | | | $ | 221,862,830 | |
|
| Automobiles — 0.5% | |
| | |
Daimler AG | | | 18,000 | | | $ | 1,387,800 | |
| | |
Ford Motor Co. | | | 1,217,179 | | | | 25,280,808 | |
| | |
General Motors Co.(1) | | | 96,097 | | | | 5,634,167 | |
| | |
Harley-Davidson, Inc. | | | 800 | | | | 30,152 | |
| | |
Tesla, Inc.(1) | | | 155,177 | | | | 163,987,950 | |
| | | | | | | | |
| Security | | Shares | | | Value | |
|
| Automobiles (continued) | |
| | |
Toyota Motor Corp. ADR | | | 5,100 | | | $ | 945,030 | |
| | |
| | | | | | | $ | 197,265,907 | |
|
| Banks — 3.9% | |
| | |
Bank of America Corp. | | | 4,436,577 | | | $ | 197,383,311 | |
| | |
Bank of Hawaii Corp. | | | 557 | | | | 46,654 | |
| | |
Bank of Montreal | | | 4 | | | | 431 | |
| | |
CIT Group, Inc. | | | 1,490 | | | | 76,497 | |
| | |
Citigroup, Inc. | | | 890,874 | | | | 53,799,881 | |
| | |
Commerce Bancshares, Inc. | | | 79,477 | | | | 5,463,249 | |
| | |
CVB Financial Corp. | | | 608,432 | | | | 13,026,529 | |
| | |
Fifth Third Bancorp | | | 1,814,058 | | | | 79,002,226 | |
| | |
First Republic Bank | | | 2,010 | | | | 415,085 | |
| | |
HSBC Holdings PLC | | | 220,592 | | | | 1,329,842 | |
| | |
HSBC Holdings PLC ADR | | | 424 | | | | 12,784 | |
| | |
Huntington Bancshares, Inc. | | | 144,510 | | | | 2,228,344 | |
| | |
ING Groep NV ADR | | | 125 | | | | 1,740 | |
| | |
JPMorgan Chase & Co. | | | 4,220,994 | | | | 668,394,400 | |
| | |
KeyCorp | | | 72,748 | | | | 1,682,661 | |
| | |
Live Oak Bancshares, Inc. | | | 15,000 | | | | 1,309,350 | |
| | |
M&T Bank Corp. | | | 123,278 | | | | 18,933,035 | |
| | |
Pinnacle Financial Partners, Inc. | | | 34,686 | | | | 3,312,513 | |
| | |
PNC Financial Services Group, Inc. (The) | | | 126,756 | | | | 25,417,113 | |
| | |
Regions Financial Corp. | | | 772,628 | | | | 16,843,290 | |
| | |
Signature Bank | | | 3,359 | | | | 1,086,536 | |
| | |
Societe Generale S.A. | | | 405,793 | | | | 13,946,582 | |
| | |
Sterling Bancorp | | | 180,109 | | | | 4,645,011 | |
| | |
SVB Financial Group(1) | | | 31,586 | | | | 21,422,889 | |
| | |
Synovus Financial Corp. | | | 1,565 | | | | 74,917 | |
| | |
Toronto-Dominion Bank (The) | | | 569 | | | | 43,631 | |
| | |
Truist Financial Corp. | | | 1,679,497 | | | | 98,334,549 | |
| | |
U.S. Bancorp | | | 1,077,302 | | | | 60,512,053 | |
| | |
Wells Fargo & Co. | | | 3,734,552 | | | | 179,183,805 | |
| | |
Western Alliance Bancorp | | | 23,987 | | | | 2,582,200 | |
| | |
Zions Bancorp N.A. | | | 53,870 | | | | 3,402,429 | |
| | |
| | | | | | | $ | 1,473,913,537 | |
|
| Beverages — 1.9% | |
| | |
Anheuser-Busch InBev SA/NV ADR | | | 75,379 | | | $ | 4,564,198 | |
| | |
Boston Beer Co., Inc. (The), Class A(1) | | | 4,730 | | | | 2,389,123 | |
| | |
Brown-Forman Corp., Class A | | | 17,399 | | | | 1,179,478 | |
| | |
Brown-Forman Corp., Class B | | | 420,049 | | | | 30,604,770 | |
| | |
Coca-Cola Co. (The) | | | 3,937,864 | | | | 233,160,927 | |
| | |
Constellation Brands, Inc., Class A | | | 118,245 | | | | 29,675,948 | |
| | |
Diageo PLC ADR | | | 9,771 | | | | 2,150,988 | |
| | | | |
| | 27 | | See Notes to Financial Statements. |
Tax-Managed Growth Portfolio
December 31, 2021
Portfolio of Investments — continued
| | | | | | | | |
| Security | | Shares | | | Value | |
|
| Beverages (continued) | |
| | |
Keurig Dr Pepper, Inc. | | | 2,700 | | | $ | 99,522 | |
| | |
Molson Coors Beverage Co., Class B | | | 64,013 | | | | 2,967,003 | |
| | |
Monster Beverage Corp.(1) | | | 176,096 | | | | 16,912,260 | |
| | |
PepsiCo, Inc. | | | 2,127,282 | | | | 369,530,156 | |
| | |
| | | | | | | $ | 693,234,373 | |
|
| Biotechnology — 2.1% | |
| | |
2seventy bio, Inc.(1) | | | 166 | | | $ | 4,255 | |
| | |
AbbVie, Inc. | | | 1,131,418 | | | | 153,193,997 | |
| | |
Agios Pharmaceuticals, Inc.(1) | | | 74,972 | | | | 2,464,330 | |
| | |
Alkermes PLC(1) | | | 5,000 | | | | 116,300 | |
| | |
Alnylam Pharmaceuticals, Inc.(1) | | | 9,409 | | | | 1,595,578 | |
| | |
Amgen, Inc. | | | 685,242 | | | | 154,158,893 | |
| | |
Arena Pharmaceuticals, Inc.(1) | | | 15,471 | | | | 1,437,875 | |
| | |
argenx SE ADR(1) | | | 308,910 | | | | 108,177,193 | |
| | |
Biogen, Inc.(1) | | | 100,308 | | | | 24,065,895 | |
| | |
Bluebird Bio, Inc.(1) | | | 500 | | | | 4,995 | |
| | |
Blueprint Medicines Corp.(1) | | | 211,575 | | | | 22,661,798 | |
| | |
Exact Sciences Corp.(1) | | | 243,557 | | | | 18,956,041 | |
| | |
Exact Sciences Corp.(1)(3) | | | 8,313 | | | | 647,001 | |
| | |
Gilead Sciences, Inc. | | | 1,134,800 | | | | 82,397,828 | |
| | |
Incyte Corp.(1) | | | 103,220 | | | | 7,576,348 | |
| | |
Moderna, Inc.(1) | | | 343,592 | | | | 87,265,496 | |
| | |
Natera, Inc.(1) | | | 14,283 | | | | 1,333,889 | |
| | |
Neurocrine Biosciences, Inc.(1) | | | 219,845 | | | | 18,724,199 | |
| | |
Regeneron Pharmaceuticals, Inc.(1) | | | 25,022 | | | | 15,801,893 | |
| | |
Seagen, Inc.(1) | | | 5,662 | | | | 875,345 | |
| | |
Vertex Pharmaceuticals, Inc.(1) | | | 346,315 | | | | 76,050,774 | |
| | |
| | | | | | | $ | 777,509,923 | |
|
| Building Products — 0.5% | |
| | |
A.O. Smith Corp. | | | 31,693 | | | $ | 2,720,844 | |
| | |
Carlisle Cos., Inc. | | | 71,809 | | | | 17,817,249 | |
| | |
Carrier Global Corp. | | | 237,798 | | | | 12,898,164 | |
| | |
Fortune Brands Home & Security, Inc. | | | 27,542 | | | | 2,944,240 | |
| | |
Johnson Controls International PLC | | | 350,723 | | | | 28,517,287 | |
| | |
Lennox International, Inc. | | | 381,979 | | | | 123,898,708 | |
| | |
Masco Corp. | | | 38,156 | | | | 2,679,314 | |
| | |
Resideo Technologies, Inc.(1) | | | 11,209 | | | | 291,770 | |
| | |
Trane Technologies PLC | | | 41,918 | | | | 8,468,694 | |
| | |
Trex Co., Inc.(1) | | | 3,070 | | | | 414,542 | |
| | |
| | | | | | | $ | 200,650,812 | |
|
| Capital Markets — 4.8% | |
| | |
Affiliated Managers Group, Inc. | | | 58,916 | | | $ | 9,692,271 | |
| | |
Ameriprise Financial, Inc. | | | 134,689 | | | | 40,630,284 | |
| | | | | | | | |
| Security | | Shares | | | Value | |
|
| Capital Markets (continued) | |
| | |
Ares Management Corp., Class A | | | 44,772 | | | $ | 3,638,620 | |
| | |
Bank of New York Mellon Corp. (The) | | | 719,996 | | | | 41,817,368 | |
| | |
BlackRock, Inc. | | | 48,847 | | | | 44,722,359 | |
| | |
Blackstone, Inc. | | | 402,444 | | | | 52,072,229 | |
| | |
Brookfield Asset Management, Inc., Class A | | | 264,702 | | | | 15,982,707 | |
| | |
Carlyle Group, Inc. (The) | | | 457,373 | | | | 25,109,778 | |
| | |
Cboe Global Markets, Inc. | | | 197,786 | | | | 25,791,294 | |
| | |
Charles Schwab Corp. (The) | | | 3,930,082 | | | | 330,519,896 | |
| | |
CME Group, Inc. | | | 249,929 | | | | 57,098,779 | |
| | |
FactSet Research Systems, Inc. | | | 97,345 | | | | 47,310,644 | |
| | |
Federated Hermes, Inc., Class B | | | 37,249 | | | | 1,399,817 | |
| | |
Franklin Resources, Inc. | | | 211,191 | | | | 7,072,787 | |
| | |
Goldman Sachs Group, Inc. (The) | | | 1,160,752 | | | | 444,045,678 | |
| | |
Intercontinental Exchange, Inc. | | | 154,759 | | | | 21,166,388 | |
| | |
Invesco, Ltd. | | | 11,064 | | | | 254,693 | |
| | |
LPL Financial Holdings, Inc. | | | 160,206 | | | | 25,647,379 | |
| | |
Moody’s Corp. | | | 261,669 | | | | 102,202,678 | |
| | |
Morgan Stanley(4) | | | 2,122,833 | | | | 208,377,288 | |
| | |
Morningstar, Inc. | | | 4,694 | | | | 1,605,300 | |
| | |
Nasdaq, Inc. | | | 78,727 | | | | 16,533,457 | |
| | |
Northern Trust Corp. | | | 2,500 | | | | 299,025 | |
| | |
Raymond James Financial, Inc. | | | 110,958 | | | | 11,140,183 | |
| | |
S&P Global, Inc. | | | 310,603 | | | | 146,582,874 | |
| | |
SEI Investments Co. | | | 159,600 | | | | 9,726,024 | |
| | |
State Street Corp. | | | 215,676 | | | | 20,057,868 | |
| | |
Stifel Financial Corp. | | | 169,194 | | | �� | 11,914,642 | |
| | |
T. Rowe Price Group, Inc. | | | 403,743 | | | | 79,392,024 | |
| | |
UBS Group AG(1) | | | 9 | | | | 161 | |
| | |
| | | | | | | $ | 1,801,804,495 | |
|
| Chemicals — 1.1% | |
| | |
AdvanSix, Inc. | | | 968 | | | $ | 45,738 | |
| | |
Air Products and Chemicals, Inc. | | | 25,995 | | | | 7,909,239 | |
| | |
Albemarle Corp. | | | 132,751 | | | | 31,033,201 | |
| | |
Balchem Corp. | | | 24,992 | | | | 4,213,651 | |
| | |
Cabot Corp. | | | 16,510 | | | | 927,862 | |
| | |
Celanese Corp. | | | 23,540 | | | | 3,956,132 | |
| | |
Chemours Co. (The) | | | 1 | | | | 34 | |
| | |
Corteva, Inc. | | | 242,329 | | | | 11,457,315 | |
| | |
Dow, Inc. | | | 80,280 | | | | 4,553,482 | |
| | |
DuPont de Nemours, Inc. | | | 505,065 | | | | 40,799,151 | |
| | |
Eastman Chemical Co. | | | 1,062 | | | | 128,406 | |
| | |
Ecolab, Inc. | | | 605,535 | | | | 142,052,456 | |
| | |
FMC Corp. | | | 817 | | | | 89,780 | |
| | |
International Flavors & Fragrances, Inc. | | | 5,000 | | | | 753,250 | |
| | |
Linde PLC | | | 114,624 | | | | 39,709,192 | |
| | | | |
| | 28 | | See Notes to Financial Statements. |
Tax-Managed Growth Portfolio
December 31, 2021
Portfolio of Investments — continued
| | | | | | | | |
| Security | | Shares | | | Value | |
|
| Chemicals (continued) | |
| | |
LyondellBasell Industries NV, Class A | | | 4,274 | | | $ | 394,191 | |
| | |
NewMarket Corp. | | | 13,626 | | | | 4,669,903 | |
| | |
Nutrien, Ltd. | | | 10,927 | | | | 821,710 | |
| | |
PPG Industries, Inc. | | | 414,428 | | | | 71,463,964 | |
| | |
RPM International, Inc. | | | 3,433 | | | | 346,733 | |
| | |
Scotts Miracle-Gro Co. (The) | | | 136 | | | | 21,896 | |
| | |
Sherwin-Williams Co. (The) | | | 177,036 | | | | 62,344,998 | |
| | |
Westlake Chemical Corp. | | | 1,000 | | | | 97,130 | |
| | |
| | | | | | | $ | 427,789,414 | |
|
| Commercial Services & Supplies — 0.1% | |
| | |
Brady Corp., Class A | | | 258 | | | $ | 13,906 | |
| | |
Cintas Corp. | | | 398 | | | | 176,382 | |
| | |
Copart, Inc.(1) | | | 4,771 | | | | 723,379 | |
| | |
HNI Corp. | | | 108,151 | | | | 4,547,750 | |
| | |
Pitney Bowes, Inc. | | | 1,365 | | | | 9,050 | |
| | |
Republic Services, Inc. | | | 4,227 | | | | 589,455 | |
| | |
Rollins, Inc. | | | 60,814 | | | | 2,080,447 | |
| | |
Stericycle, Inc.(1) | | | 8,000 | | | | 477,120 | |
| | |
Waste Connections, Inc. | | | 115,655 | | | | 15,760,307 | |
| | |
Waste Management, Inc. | | | 191,146 | | | | 31,902,267 | |
| | |
| | | | | | | $ | 56,280,063 | |
|
| Communications Equipment — 2.3% | |
| | |
Arista Networks, Inc.(1) | | | 4,061,876 | | | $ | 583,894,675 | |
| | |
Arista Networks, Inc.(1)(3) | | | 290,000 | | | | 41,687,500 | |
| | |
Cisco Systems, Inc. | | | 3,529,555 | | | | 223,667,901 | |
| | |
Juniper Networks, Inc. | | | 285,300 | | | | 10,188,063 | |
| | |
Motorola Solutions, Inc. | | | 51,820 | | | | 14,079,494 | |
| | |
Nokia Oyj ADR(1) | | | 192 | | | | 1,194 | |
| | |
| | | | | | | $ | 873,518,827 | |
|
| Construction & Engineering — 0.0%(2) | |
| | |
Fluor Corp.(1) | | | 3,250 | | | $ | 80,503 | |
| | |
Quanta Services, Inc. | | | 2,649 | | | | 303,734 | |
| | |
| | | | | | | $ | 384,237 | |
|
| Construction Materials — 0.0%(2) | |
| | |
Vulcan Materials Co. | | | 62,993 | | | $ | 13,076,087 | |
| | |
| | | | | | | $ | 13,076,087 | |
|
| Consumer Finance — 0.9% | |
| | |
American Express Co. | | | 1,002,049 | | | $ | 163,935,216 | |
| | |
Capital One Financial Corp. | | | 85,168 | | | | 12,357,025 | |
| | | | | | | | |
| Security | | Shares | | | Value | |
|
| Consumer Finance (continued) | |
| | |
Discover Financial Services | | | 1,161,846 | | | $ | 134,262,924 | |
| | |
LendingClub Corp.(1) | | | 15,938 | | | | 385,381 | |
| | |
Synchrony Financial | | | 344,923 | | | | 16,000,978 | |
| | |
| | | | | | | $ | 326,941,524 | |
|
| Containers & Packaging — 0.1% | |
| | |
Amcor PLC | | | 940,774 | | | $ | 11,298,696 | |
| | |
AptarGroup, Inc. | | | 65,000 | | | | 7,961,200 | |
| | |
Avery Dennison Corp. | | | 5,508 | | | | 1,192,868 | |
| | |
Ball Corp. | | | 63,819 | | | | 6,143,855 | |
| | |
Crown Holdings, Inc. | | | 13,787 | | | | 1,525,118 | |
| | |
International Paper Co. | | | 35,524 | | | | 1,668,917 | |
| | |
Packaging Corp. of America | | | 12,273 | | | | 1,670,969 | |
| | |
Sealed Air Corp. | | | 27,104 | | | | 1,828,707 | |
| | |
Sonoco Products Co. | | | 2,297 | | | | 132,973 | |
| | |
WestRock Co. | | | 21,573 | | | | 956,978 | |
| | |
| | | | | | | $ | 34,380,281 | |
|
| Distributors — 0.0%(2) | |
| | |
Genuine Parts Co. | | | 22,932 | | | $ | 3,215,066 | |
| | |
LKQ Corp. | | | 81,118 | | | | 4,869,514 | |
| | |
| | | | | | | $ | 8,084,580 | |
|
| Diversified Consumer Services — 0.0%(2) | |
| | |
Bright Horizons Family Solutions, Inc.(1) | | | 6,150 | | | $ | 774,162 | |
| | |
H&R Block, Inc. | | | 3,429 | | | | 80,787 | |
| | |
Service Corp. International | | | 16,140 | | | | 1,145,779 | |
| | |
| | | | | | | $ | 2,000,728 | |
|
| Diversified Financial Services — 2.3% | |
| | |
Apollo Global Management, Inc. | | | 7,672 | | | $ | 555,683 | |
| | |
Berkshire Hathaway, Inc., Class A(1) | | | 590 | | | | 265,890,580 | |
| | |
Berkshire Hathaway, Inc., Class B(1) | | | 1,966,390 | | | | 587,950,610 | |
| | |
| | | | | | | $ | 854,396,873 | |
|
| Diversified Telecommunication Services — 0.2% | |
| | |
AT&T, Inc. | | | 541,525 | | | $ | 13,321,515 | |
| | |
Liberty Latin America, Ltd., Class A(1) | | | 1,546 | | | | 18,027 | |
| | |
Liberty Latin America, Ltd., Class C(1) | | | 4,825 | | | | 55,005 | |
| | |
Lumen Technologies, Inc. | | | 4,871 | | | | 61,131 | |
| | |
Verizon Communications, Inc. | | | 951,247 | | | | 49,426,794 | |
| | |
| | | | | | | $ | 62,882,472 | |
| | | | |
| | 29 | | See Notes to Financial Statements. |
Tax-Managed Growth Portfolio
December 31, 2021
Portfolio of Investments — continued
| | | | | | | | |
| Security | | Shares | | | Value | |
|
| Electric Utilities — 0.5% | |
| | |
Duke Energy Corp. | | | 228,504 | | | $ | 23,970,069 | |
| | |
Edison International | | | 1,960 | | | | 133,770 | |
| | |
Entergy Corp. | | | 2,640 | | | | 297,396 | |
| | |
Exelon Corp. | | | 31,288 | | | | 1,807,195 | |
| | |
IDACORP, Inc. | | | 140 | | | | 15,863 | |
| | |
NextEra Energy, Inc. | | | 1,603,491 | | | | 149,701,920 | |
| | |
NRG Energy, Inc. | | | 3,136 | | | | 135,099 | |
| | |
PPL Corp. | | | 2,700 | | | | 81,162 | |
| | |
Southern Co. (The) | | | 75,403 | | | | 5,171,138 | |
| | |
Xcel Energy, Inc. | | | 265,196 | | | | 17,953,769 | |
| | |
| | | | | | | $ | 199,267,381 | |
|
| Electrical Equipment — 0.8% | |
| | |
Acuity Brands, Inc. | | | 9,321 | | | $ | 1,973,442 | |
| | |
AMETEK, Inc. | | | 68,380 | | | | 10,054,595 | |
| | |
Eaton Corp. PLC | | | 92,287 | | | | 15,949,039 | |
| | |
Emerson Electric Co. | | | 2,183,226 | | | | 202,974,521 | |
| | |
Generac Holdings, Inc.(1) | | | 2,476 | | | | 871,354 | |
| | |
Hubbell, Inc. | | | 62,461 | | | | 13,008,753 | |
| | |
nVent Electric PLC | | | 4 | | | | 152 | |
| | |
Rockwell Automation, Inc. | | | 114,129 | | | | 39,813,902 | |
| | |
| | | | | | | $ | 284,645,758 | |
|
| Electronic Equipment, Instruments & Components — 0.5% | |
| | |
Amphenol Corp., Class A | | | 24,559 | | | $ | 2,147,930 | |
| | |
Badger Meter, Inc. | | | 3,000 | | | | 319,680 | |
| | |
CDW Corp. | | | 144,142 | | | | 29,517,399 | |
| | |
Corning, Inc. | | | 1,489,441 | | | | 55,451,889 | |
| | |
IPG Photonics Corp.(1) | | | 17,003 | | | | 2,926,896 | |
| | |
Keysight Technologies, Inc.(1) | | | 12,706 | | | | 2,623,916 | |
| | |
Knowles Corp.(1) | | | 1 | | | | 23 | |
| | |
Littelfuse, Inc. | | | 52,675 | | | | 16,575,769 | |
| | |
Littelfuse, Inc.(3) | | | 39,181 | | | | 12,329,477 | |
| | |
TE Connectivity, Ltd. | | | 60,400 | | | | 9,744,936 | |
| | |
Teledyne Technologies, Inc.(1) | | | 145 | | | | 63,349 | |
| | |
Trimble, Inc.(1) | | | 15,062 | | | | 1,313,256 | |
| | |
Trimble, Inc.(1)(3) | | | 183,372 | | | | 15,982,881 | |
| | |
Vontier Corp. | | | 3,985 | | | | 122,459 | |
| | |
Zebra Technologies Corp., Class A(1) | | | 50,775 | | | | 30,221,280 | |
| | |
| | | | | | | $ | 179,341,140 | |
|
| Energy Equipment & Services — 0.1% | |
| | |
ChampionX Corp.(1) | | | 10,853 | | | $ | 219,339 | |
| | |
Core Laboratories NV | | | 16,652 | | | | 371,506 | |
| | |
Expro Group Holdings N.V.(1) | | | 250,000 | | | | 3,587,500 | |
| | | | | | | | |
| Security | | Shares | | | Value | |
|
| Energy Equipment & Services (continued) | |
| | |
Halliburton Co. | | | 184,786 | | | $ | 4,226,056 | |
| | |
NOV, Inc. | | | 10,391 | | | | 140,798 | |
| | |
Schlumberger NV | | | 824,802 | | | | 24,702,820 | |
| | |
Transocean, Ltd.(1) | | | 3,548 | | | | 9,793 | |
| | |
| | | | | | | $ | 33,257,812 | |
|
| Entertainment — 2.2% | |
| | |
Activision Blizzard, Inc. | | | 248,871 | | | $ | 16,557,388 | |
| | |
Electronic Arts, Inc. | | | 150,119 | | | | 19,800,696 | |
| | |
Liberty Braves Group, Series A(1) | | | 1,236 | | | | 35,535 | |
| | |
Liberty Braves Group, Series C(1) | | | 2,473 | | | | 69,491 | |
| | |
Live Nation Entertainment, Inc.(1) | | | 20,744 | | | | 2,482,849 | |
| | |
NetEase, Inc. ADR | | | 510 | | | | 51,908 | |
| | |
Netflix, Inc.(1) | | | 234,410 | | | | 141,217,960 | |
| | |
ROBLOX Corp., Class A(1) | | | 905,777 | | | | 93,439,955 | |
| | |
Roku, Inc., Class A(1) | | | 26,288 | | | | 5,998,922 | |
| | |
Spotify Technology S.A.(1) | | | 92,198 | | | | 21,577,098 | |
| | |
Walt Disney Co. (The)(1) | | | 3,420,691 | | | | 529,830,829 | |
| | |
Zynga, Inc., Class A(1) | | | 193,100 | | | | 1,235,840 | |
| | |
| | | | | | | $ | 832,298,471 | |
|
| Equity Real Estate Investment Trusts (REITs) — 0.2% | |
| | |
American Homes 4 Rent, Class A | | | 166,000 | | | $ | 7,239,260 | |
| | |
American Tower Corp. | | | 61,668 | | | | 18,037,890 | |
| | |
American Tower Corp.(3) | | | 33,660 | | | | 9,842,842 | |
| | |
AvalonBay Communities, Inc. | | | 7,000 | | | | 1,768,130 | |
| | |
Boston Properties, Inc. | | | 60 | | | | 6,911 | |
| | |
Equinix, Inc. | | | 823 | | | | 696,126 | |
| | |
Extra Space Storage, Inc. | | | 1,800 | | | | 408,114 | |
| | |
Federal Realty Investment Trust | | | 1,300 | | | | 177,216 | |
| | |
Host Hotels & Resorts, Inc.(1) | | | 528,986 | | | | 9,199,067 | |
| | |
Mid-America Apartment Communities, Inc. | | | 457 | | | | 104,854 | |
| | |
Prologis, Inc. | | | 40,593 | | | | 6,834,237 | |
| | |
Public Storage | | | 8,114 | | | | 3,039,180 | |
| | |
Realty Income Corp. | | | 100,779 | | | | 7,214,769 | |
| | |
Regency Centers Corp. | | | 405 | | | | 30,517 | |
| | |
SBA Communications Corp. | | | 3,000 | | | | 1,167,060 | |
| | |
Simon Property Group, Inc. | | | 25,563 | | | | 4,084,200 | |
| | |
Sun Communities, Inc. | | | 10,148 | | | | 2,130,776 | |
| | |
| | | | | | | $ | 71,981,149 | |
|
| Food & Staples Retailing — 1.7% | |
| | |
Costco Wholesale Corp. | | | 950,204 | | | $ | 539,430,811 | |
| | |
Kroger Co. (The) | | | 154,886 | | | | 7,010,140 | |
| | |
Sprouts Farmers Market, Inc.(1) | | | 735,411 | | | | 21,826,999 | |
| | | | |
| | 30 | | See Notes to Financial Statements. |
Tax-Managed Growth Portfolio
December 31, 2021
Portfolio of Investments — continued
| | | | | | | | |
| Security | | Shares | | | Value | |
|
| Food & Staples Retailing (continued) | |
| | |
Sysco Corp. | | | 644,457 | | | $ | 50,622,097 | |
| | |
Walgreens Boots Alliance, Inc. | | | 439,211 | | | | 22,909,246 | |
| | |
Walmart, Inc. | | | 52,716 | | | | 7,627,478 | |
| | |
| | | | | | | $ | 649,426,771 | |
|
| Food Products — 1.2% | |
| | |
Archer-Daniels-Midland Co. | | | 137,778 | | | $ | 9,312,415 | |
| | |
Campbell Soup Co. | | | 748,065 | | | | 32,510,905 | |
| | |
Conagra Brands, Inc. | | | 665,690 | | | | 22,733,313 | |
| | |
Flowers Foods, Inc. | | | 586,273 | | | | 16,104,919 | |
| | |
General Mills, Inc. | | | 170,898 | | | | 11,515,107 | |
| | |
Hain Celestial Group, Inc. (The)(1) | | | 17,240 | | | | 734,596 | |
| | |
Hershey Co. (The) | | | 219,063 | | | | 42,382,119 | |
| | |
Hormel Foods Corp. | | | 366,066 | | | | 17,867,681 | |
| | |
J&J Snack Foods Corp. | | | 33,410 | | | | 5,277,444 | |
| | |
JM Smucker Co. (The) | | | 21,346 | | | | 2,899,214 | |
| | |
Kellogg Co. | | | 72,821 | | | | 4,691,129 | |
| | |
Kraft Heinz Co. (The) | | | 106,315 | | | | 3,816,709 | |
| | |
Lamb Weston Holdings, Inc. | | | 126,408 | | | | 8,011,739 | |
| | |
McCormick & Co., Inc., Non Voting Shares | | | 168,759 | | | | 16,303,807 | |
| | |
Mondelez International, Inc., Class A | | | 1,216,167 | | | | 80,644,034 | |
| | |
Nestle S.A. | | | 1,118,348 | | | | 156,140,715 | |
| | |
Tyson Foods, Inc., Class A | | | 27,528 | | | | 2,399,340 | |
| | |
| | | | | | | $ | 433,345,186 | |
|
| Health Care Equipment & Supplies — 3.0% | |
| | |
Abbott Laboratories | | | 1,994,942 | | | $ | 280,768,137 | |
| | |
ABIOMED, Inc.(1) | | | 109,299 | | | | 39,256,922 | |
| | |
Alcon, Inc. | | | 22,924 | | | | 1,997,139 | |
| | |
Align Technology, Inc.(1) | | | 18,703 | | | | 12,291,238 | |
| | |
Avanos Medical, Inc.(1) | | | 542 | | | | 18,791 | |
| | |
Baxter International, Inc. | | | 39,578 | | | | 3,397,376 | |
| | |
Becton, Dickinson and Co. | | | 148,704 | | | | 37,396,082 | |
| | |
Boston Scientific Corp.(1) | | | 480,643 | | | | 20,417,715 | |
| | |
DexCom, Inc.(1) | | | 129,517 | | | | 69,544,153 | |
| | |
Edwards Lifesciences Corp.(1) | | | 31,569 | | | | 4,089,764 | |
| | |
IDEXX Laboratories, Inc.(1) | | | 17,216 | | | | 11,336,047 | |
| | |
Inari Medical, Inc.(1) | | | 488,894 | | | | 44,621,355 | |
| | |
Inari Medical, Inc.(1)(3) | | | 22,222 | | | | 2,026,884 | |
| | |
Insulet Corp.(1) | | | 10,198 | | | | 2,713,382 | |
| | |
Integra LifeSciences Holdings Corp.(1) | | | 2,225,898 | | | | 149,112,907 | |
| | |
Integra LifeSciences Holdings Corp.(1)(3) | | | 730,000 | | | | 48,902,700 | |
| | |
Intuitive Surgical, Inc.(1) | | | 527,025 | | | | 189,360,082 | |
| | |
Medtronic PLC | | | 546,016 | | | | 56,485,355 | |
| | |
Penumbra, Inc.(1) | | | 93,193 | | | | 26,776,213 | |
| | | | | | | | |
| Security | | Shares | | | Value | |
|
| Health Care Equipment & Supplies (continued) | |
| | |
ResMed, Inc. | | | 21,670 | | | $ | 5,644,602 | |
| | |
Smith & Nephew PLC ADR | | | 5,500 | | | | 190,410 | |
| | |
Stryker Corp. | | | 342,034 | | | | 91,466,732 | |
| | |
Teleflex, Inc. | | | 14,475 | | | | 4,754,748 | |
| | |
Zimmer Biomet Holdings, Inc. | | | 152,838 | | | | 19,416,539 | |
| | |
| | | | | | | $ | 1,121,985,273 | |
|
| Health Care Providers & Services — 2.2% | |
| | |
Acadia Healthcare Co., Inc.(1) | | | 32,000 | | | $ | 1,942,400 | |
| | |
Anthem, Inc. | | | 145,784 | | | | 67,576,715 | |
| | |
Cardinal Health, Inc. | | | 29,103 | | | | 1,498,514 | |
| | |
Centene Corp.(1) | | | 171,673 | | | | 14,145,855 | |
| | |
Cigna Corp. | | | 48,359 | | | | 11,104,677 | |
| | |
Covetrus, Inc.(1) | | | 10,511 | | | | 209,905 | |
| | |
CVS Health Corp. | | | 1,324,592 | | | | 136,644,911 | |
| | |
DaVita, Inc.(1) | | | 157,055 | | | | 17,866,577 | |
| | |
Ensign Group, Inc. (The) | | | 51,487 | | | | 4,322,849 | |
| | |
Guardant Health, Inc.(1) | | | 145,805 | | | | 14,583,416 | |
| | |
HCA Healthcare, Inc. | | | 210,352 | | | | 54,043,636 | |
| | |
Henry Schein, Inc.(1) | | | 26,348 | | | | 2,042,760 | |
| | |
Humana, Inc. | | | 2,441 | | | | 1,132,282 | |
| | |
Laboratory Corp. of America Holdings(1) | | | 745 | | | | 234,086 | |
| | |
McKesson Corp. | | | 150,389 | | | | 37,382,194 | |
| | |
Molina Healthcare, Inc.(1) | | | 18,585 | | | | 5,911,517 | |
| | |
Oak Street Health, Inc.(1) | | | 744,379 | | | | 24,668,720 | |
| | |
Progyny, Inc.(1) | | | 15,525 | | | | 781,684 | |
| | |
Tenet Healthcare Corp.(1) | | | 2,363 | | | | 193,033 | |
| | |
UnitedHealth Group, Inc. | | | 823,006 | | | | 413,264,233 | |
| | |
| | | | | | | $ | 809,549,964 | |
|
| Health Care Technology — 0.1% | |
| | |
Cerner Corp. | | | 19,478 | | | $ | 1,808,922 | |
| | |
Teladoc Health, Inc.(1) | | | 100,320 | | | | 9,211,382 | |
| | |
Veeva Systems, Inc., Class A(1) | | | 32,508 | | | | 8,305,144 | |
| | |
| | | | | | | $ | 19,325,448 | |
|
| Hotels, Restaurants & Leisure — 3.4% | |
| | |
Airbnb, Inc., Class A(1) | | | 236,236 | | | $ | 39,330,932 | |
| | |
Aramark | | | 148,020 | | | | 5,454,537 | |
| | |
Booking Holdings, Inc.(1) | | | 52,611 | | | | 126,225,889 | |
| | |
Carnival Corp.(1) | | | 22,069 | | | | 444,028 | |
| | |
Chipotle Mexican Grill, Inc.(1) | | | 120,458 | | | | 210,590,698 | |
| | |
Choice Hotels International, Inc. | | | 49,631 | | | | 7,741,940 | |
| | |
Darden Restaurants, Inc. | | | 77,690 | | | | 11,703,222 | |
| | |
Domino’s Pizza, Inc. | | | 2,815 | | | | 1,588,589 | |
| | | | |
| | 31 | | See Notes to Financial Statements. |
Tax-Managed Growth Portfolio
December 31, 2021
Portfolio of Investments — continued
| | | | | | | | |
| Security | | Shares | | | Value | |
|
| Hotels, Restaurants & Leisure (continued) | |
| | |
DraftKings, Inc., Class A(1) | | | 550 | | | $ | 15,108 | |
| | |
Expedia Group, Inc.(1) | | | 88,204 | | | | 15,940,227 | |
| | |
Hilton Worldwide Holdings, Inc.(1) | | | 106,201 | | | | 16,566,294 | |
| | |
Hyatt Hotels Corp., Class A(1) | | | 1,353,442 | | | | 129,795,088 | |
| | |
Marriott International, Inc., Class A(1) | | | 1,444,527 | | | | 238,693,641 | |
| | |
McDonald’s Corp. | | | 114,782 | | | | 30,769,611 | |
| | |
MGM Resorts International | | | 892,202 | | | | 40,042,026 | |
| | |
Penn National Gaming, Inc.(1) | | | 30,956 | | | | 1,605,069 | |
| | |
Royal Caribbean Cruises, Ltd.(1) | | | 1,900 | | | | 146,110 | |
| | |
Starbucks Corp. | | | 2,552,969 | | | | 298,620,784 | |
| | |
Texas Roadhouse, Inc. | | | 417,127 | | | | 37,241,099 | |
| | |
Trip.com Group, Ltd. ADR(1) | | | 5,200 | | | | 128,024 | |
| | |
Yum China Holdings, Inc. | | | 368,379 | | | | 18,360,009 | |
| | |
Yum! Brands, Inc. | | | 150,394 | | | | 20,883,711 | |
| | |
| | | | | | | $ | 1,251,886,636 | |
|
| Household Durables — 0.2% | |
| | |
D.R. Horton, Inc. | | | 43,075 | | | $ | 4,671,484 | |
| | |
Helen of Troy, Ltd.(1) | | | 645 | | | | 157,683 | |
| | |
Leggett & Platt, Inc. | | | 94,579 | | | | 3,892,872 | |
| | |
Lennar Corp., Class A | | | 48,693 | | | | 5,656,179 | |
| | |
Lennar Corp., Class B | | | 21 | | | | 2,008 | |
| | |
Mohawk Industries, Inc.(1) | | | 20,864 | | | | 3,801,003 | |
| | |
Newell Brands, Inc. | | | 123,465 | | | | 2,696,476 | |
| | |
NVR, Inc.(1) | | | 1,822 | | | | 10,765,961 | |
| | |
PulteGroup, Inc. | | | 222,055 | | | | 12,692,664 | |
| | |
Tempur Sealy International, Inc. | | | 540,100 | | | | 25,400,903 | |
| | |
Toll Brothers, Inc. | | | 4,378 | | | | 316,923 | |
| | |
Whirlpool Corp. | | | 1,646 | | | | 386,250 | |
| | |
| | | | | | | $ | 70,440,406 | |
|
| Household Products — 1.7% | |
| | |
Church & Dwight Co., Inc. | | | 197,268 | | | $ | 20,219,970 | |
| | |
Clorox Co. (The) | | | 20,683 | | | | 3,606,288 | |
| | |
Colgate-Palmolive Co. | | | 2,828,981 | | | | 241,425,238 | |
| | |
Energizer Holdings, Inc. | | | 10,496 | | | | 420,890 | |
| | |
Kimberly-Clark Corp. | | | 108,792 | | | | 15,548,553 | |
| | |
Procter & Gamble Co. (The) | | | 2,215,920 | | | | 362,480,193 | |
| | |
| | | | | | | $ | 643,701,132 | |
|
| Independent Power and Renewable Electricity Producers — 0.0%(2) | |
| | |
AES Corp. (The) | | | 1,730 | | | $ | 42,039 | |
| | |
| | | | | | | $ | 42,039 | |
| | | | | | | | |
| Security | | Shares | | | Value | |
|
| Industrial Conglomerates — 0.8% | |
| | |
3M Co. | | | 778,183 | | | $ | 138,228,647 | |
| | |
General Electric Co. | | | 723,424 | | | | 68,341,865 | |
| | |
Honeywell International, Inc. | | | 380,467 | | | | 79,331,174 | |
| | |
Roper Technologies, Inc. | | | 27,342 | | | | 13,448,436 | |
| | |
| | | | | | | $ | 299,350,122 | |
|
| Insurance — 1.3% | |
| | |
Aegon NV ADR | | | 5 | | | $ | 25 | |
| | |
Aflac, Inc. | | | 884,450 | | | | 51,643,035 | |
| | |
Alleghany Corp.(1) | | | 3,985 | | | | 2,660,346 | |
| | |
Allstate Corp. (The) | | | 20,953 | | | | 2,465,120 | |
| | |
American International Group, Inc. | | | 139,041 | | | | 7,905,871 | |
| | |
Aon PLC, Class A | | | 177,916 | | | | 53,474,433 | |
| | |
Arch Capital Group, Ltd.(1) | | | 286,437 | | | | 12,732,125 | |
| | |
Arthur J. Gallagher & Co. | | | 534,111 | | | | 90,622,613 | |
| | |
Assurant, Inc. | | | 13,599 | | | | 2,119,540 | |
| | |
Athene Holding, Ltd., Class A(1) | | | 25,944 | | | | 2,161,914 | |
| | |
Brighthouse Financial, Inc.(1) | | | 936 | | | | 48,485 | |
| | |
Brookfield Asset Management Reinsurance Partners, Ltd., Class A | | | 1,615 | | | | 101,147 | |
| | |
Brown & Brown, Inc. | | | 407 | | | | 28,604 | |
| | |
Chubb, Ltd. | | | 51,587 | | | | 9,972,283 | |
| | |
Cincinnati Financial Corp. | | | 74,325 | | | | 8,467,847 | |
| | |
Fidelity National Financial, Inc. | | | 57,654 | | | | 3,008,386 | |
| | |
First American Financial Corp. | | | 1,227 | | | | 95,988 | |
| | |
Globe Life, Inc. | | | 50,917 | | | | 4,771,941 | |
| | |
Hartford Financial Services Group, Inc. | | | 218,598 | | | | 15,092,006 | |
| | |
Lincoln National Corp. | | | 8,488 | | | | 579,391 | |
| | |
Markel Corp.(1) | | | 23,895 | | | | 29,486,430 | |
| | |
Marsh & McLennan Cos., Inc. | | | 238,091 | | | | 41,384,978 | |
| | |
MetLife, Inc. | | | 18,779 | | | | 1,173,500 | |
| | |
Old Republic International Corp. | | | 57,300 | | | | 1,408,434 | |
| | |
Principal Financial Group, Inc. | | | 12,517 | | | | 905,355 | |
| | |
Progressive Corp. (The) | | | 983,264 | | | | 100,932,050 | |
| | |
Prudential Financial, Inc. | | | 22,159 | | | | 2,398,490 | |
| | |
Reinsurance Group of America, Inc. | | | 6,425 | | | | 703,473 | |
| | |
Travelers Cos., Inc. (The) | | | 147,497 | | | | 23,072,956 | |
| | |
Trisura Group, Ltd.(1) | | | 496 | | | | 18,645 | |
| | |
W.R. Berkley Corp. | | | 29,250 | | | | 2,409,907 | |
| | |
Willis Towers Watson PLC | | | 70 | | | | 16,624 | |
| | |
| | | | | | | $ | 471,861,942 | |
|
| Interactive Media & Services — 8.9% | |
| | |
Alphabet, Inc., Class A(1) | | | 316,180 | | | $ | 915,986,107 | |
| | |
Alphabet, Inc., Class C(1) | | | 423,094 | | | | 1,224,260,567 | |
| | |
Baidu, Inc. ADR(1) | | | 140,152 | | | | 20,853,216 | |
| | | | |
| | 32 | | See Notes to Financial Statements. |
Tax-Managed Growth Portfolio
December 31, 2021
Portfolio of Investments — continued
| | | | | | | | |
| Security | | Shares | | | Value | |
|
| Interactive Media & Services (continued) | |
| | |
CarGurus, Inc.(1) | | | 37,803 | | | $ | 1,271,693 | |
| | |
Cars.com, Inc.(1) | | | 400 | | | | 6,436 | |
| | |
IAC/InterActiveCorp.(1) | | | 13,536 | | | | 1,769,291 | |
| | |
Match Group, Inc.(1) | | | 527,012 | | | | 69,697,337 | |
| | |
Meta Platforms, Inc., Class A(1) | | | 2,785,827 | | | | 937,012,911 | |
| | |
Pinterest, Inc., Class A(1) | | | 2,540,426 | | | | 92,344,485 | |
| | |
Snap, Inc., Class A(1) | | | 159,924 | | | | 7,521,226 | |
| | |
Snap, Inc., Class A(1)(3) | | | 469,399 | | | | 22,075,835 | |
| | |
Twitter, Inc.(1) | | | 116,913 | | | | 5,052,980 | |
| | |
Vimeo, Inc.(1) | | | 97,055 | | | | 1,743,108 | |
| | |
Yelp, Inc.(1) | | | 149,508 | | | | 5,418,170 | |
| | |
ZipRecruiter, Inc., Class A(1) | | | 270,000 | | | | 6,733,800 | |
| | |
| | | | | | | $ | 3,311,747,162 | |
|
| Internet & Direct Marketing Retail — 4.1% | |
| | |
Alibaba Group Holding, Ltd. ADR(1) | | | 370,229 | | | $ | 43,979,503 | |
| | |
Altaba, Inc.(5) | | | 114,070 | | | | 679,287 | |
| | |
Amazon.com, Inc.(1) | | | 423,484 | | | | 1,412,039,641 | |
| | |
DoorDash, Inc., Class A(1) | | | 133,033 | | | | 19,808,614 | |
| | |
eBay, Inc. | | | 330,295 | | | | 21,964,617 | |
| | |
Etsy, Inc.(1) | | | 3,725 | | | | 815,551 | |
| | |
Qurate Retail, Inc., Series A | | | 99,802 | | | | 758,495 | |
| | |
Wayfair, Inc., Class A(1) | | | 66,699 | | | | 12,670,809 | |
| | |
| | | | | | | $ | 1,512,716,517 | |
|
| IT Services — 4.6% | |
| | |
Accenture PLC, Class A | | | 1,056,535 | | | $ | 437,986,584 | |
| | |
Affirm Holdings, Inc.(1) | | | 379,636 | | | | 38,176,196 | |
| | |
Akamai Technologies, Inc.(1) | | | 257,635 | | | | 30,153,600 | |
| | |
Alliance Data Systems Corp. | | | 686 | | | | 45,667 | |
| | |
Amdocs, Ltd. | | | 43,944 | | | | 3,288,769 | |
| | |
Automatic Data Processing, Inc. | | | 309,479 | | | | 76,311,332 | |
| | |
Block, Inc., Class A(1) | | | 434,159 | | | | 70,121,020 | |
| | |
Broadridge Financial Solutions, Inc. | | | 108,127 | | | | 19,767,778 | |
| | |
CGI, Inc.(1) | | | 200 | | | | 17,700 | |
| | |
Cognizant Technology Solutions Corp., Class A | | | 25,858 | | | | 2,294,122 | |
| | |
Fidelity National Information Services, Inc. | | | 18,757 | | | | 2,047,327 | |
| | |
Fiserv, Inc.(1) | | | 663,315 | | | | 68,845,464 | |
| | |
Gartner, Inc.(1) | | | 7,866 | | | | 2,629,761 | |
| | |
Global Payments, Inc. | | | 46,403 | | | | 6,272,758 | |
| | |
International Business Machines Corp. | | | 630,915 | | | | 84,328,099 | |
| | |
Jack Henry & Associates, Inc. | | | 20,956 | | | | 3,499,442 | |
| | |
Kyndryl Holdings, Inc.(1) | | | 96,088 | | | | 1,739,193 | |
| | |
Mastercard, Inc., Class A | | | 205,166 | | | | 73,720,247 | |
| | |
Okta, Inc.(1) | | | 319,829 | | | | 71,696,067 | |
| | | | | | | | |
| Security | | Shares | | | Value | |
|
| IT Services (continued) | |
| | |
Paychex, Inc. | | | 45,650 | | | $ | 6,231,225 | |
| | |
PayPal Holdings, Inc.(1) | | | 1,119,622 | | | | 211,138,317 | |
| | |
Sabre Corp.(1) | | | 157,290 | | | | 1,351,121 | |
| | |
Shopify, Inc., Class A(1) | | | 12,524 | | | | 17,250,432 | |
| | |
Snowflake, Inc., Class A(1) | | | 125,608 | | | | 42,549,710 | |
| | |
Twilio, Inc., Class A(1) | | | 555,411 | | | | 146,261,933 | |
| | |
VeriSign, Inc.(1) | | | 5,954 | | | | 1,511,244 | |
| | |
Visa, Inc., Class A | | | 1,405,256 | | | | 304,533,028 | |
| | |
Visa, Inc., Class A(3) | | | 29,956 | | | | 6,491,765 | |
| | |
Western Union Co. (The) | | | 21,882 | | | | 390,375 | |
| | |
| | | | | | | $ | 1,730,650,276 | |
|
| Leisure Products — 0.1% | |
| | |
Callaway Golf Co.(1) | | | 1,165,163 | | | $ | 31,972,073 | |
| | |
Hasbro, Inc. | | | 8,235 | | | | 838,158 | |
| | |
Mattel, Inc.(1) | | | 3,941 | | | | 84,968 | |
| | |
Polaris, Inc. | | | 79,672 | | | | 8,756,750 | |
| | |
| | | | | | | $ | 41,651,949 | |
|
| Life Sciences Tools & Services — 1.1% | |
| | |
10X Genomics, Inc., Class A(1) | | | 527,021 | | | $ | 78,505,048 | |
| | |
Agilent Technologies, Inc. | | | 681,845 | | | | 108,856,554 | |
| | |
Avantor, Inc.(1) | | | 120,000 | | | | 5,056,800 | |
| | |
Bio-Rad Laboratories, Inc., Class A(1) | | | 52 | | | | 39,290 | |
| | |
Charles River Laboratories International, Inc.(1) | | | 239 | | | | 90,050 | |
| | |
Danaher Corp. | | | 208,596 | | | | 68,630,170 | |
| | |
Illumina, Inc.(1) | | | 96,152 | | | | 36,580,067 | |
| | |
IQVIA Holdings, Inc.(1) | | | 66,687 | | | | 18,815,070 | |
| | |
Mettler-Toledo International, Inc.(1) | | | 1,000 | | | | 1,697,210 | |
| | |
NeoGenomics, Inc.(1) | | | 197,625 | | | | 6,742,965 | |
| | |
PerkinElmer, Inc. | | | 182,718 | | | | 36,737,281 | |
| | |
Thermo Fisher Scientific, Inc. | | | 60,591 | | | | 40,428,739 | |
| | |
Waters Corp.(1) | | | 730 | | | | 271,998 | |
| | |
West Pharmaceutical Services, Inc. | | | 11,186 | | | | 5,246,346 | |
| | |
| | | | | | | $ | 407,697,588 | |
|
| Machinery — 1.8% | |
| | |
Caterpillar, Inc. | | | 392,751 | | | $ | 81,197,342 | |
| | |
Caterpillar, Inc.(3) | | | 6,950 | | | | 1,436,843 | |
| | |
Cummins, Inc. | | | 1,688 | | | | 368,220 | |
| | |
Daimler Truck Holding AG ADR(1) | | | 18,000 | | | | 324,000 | |
| | |
Deere & Co. | | | 221,013 | | | | 75,783,148 | |
| | |
Donaldson Co., Inc. | | | 184,029 | | | | 10,905,559 | |
| | |
Dover Corp. | | | 385,587 | | | | 70,022,599 | |
| | |
Fortive Corp. | | | 33,376 | | | | 2,546,255 | |
| | | | |
| | 33 | | See Notes to Financial Statements. |
Tax-Managed Growth Portfolio
December 31, 2021
Portfolio of Investments — continued
| | | | | | | | |
| Security | | Shares | | | Value | |
|
| Machinery (continued) | |
| | |
Illinois Tool Works, Inc. | | | 1,283,606 | | | $ | 316,793,961 | |
| | |
Ingersoll Rand, Inc. | | | 171,492 | | | | 10,610,210 | |
| | |
Lincoln Electric Holdings, Inc. | | | 53,660 | | | | 7,483,960 | |
| | |
Manitowoc Co., Inc. (The)(1) | | | 11,435 | | | | 212,577 | |
| | |
Middleby Corp.(1) | | | 2,000 | | | | 393,520 | |
| | |
Otis Worldwide Corp. | | | 435,365 | | | | 37,907,231 | |
| | |
PACCAR, Inc. | | | 186,094 | | | | 16,424,656 | |
| | |
Parker-Hannifin Corp. | | | 25,759 | | | | 8,194,453 | |
| | |
Pentair PLC | | | 75 | | | | 5,477 | |
| | |
Snap-on, Inc. | | | 29,674 | | | | 6,391,186 | |
| | |
Stanley Black & Decker, Inc. | | | 288 | | | | 54,323 | |
| | |
Trinity Industries, Inc. | | | 11,100 | | | | 335,220 | |
| | |
Westinghouse Air Brake Technologies Corp. | | | 14,127 | | | | 1,301,238 | |
| | |
Xylem, Inc. | | | 112,897 | | | | 13,538,608 | |
| | |
| | | | | | | $ | 662,230,586 | |
|
| Media — 0.3% | |
| | |
Comcast Corp., Class A | | | 1,286,665 | | | $ | 64,757,850 | |
| | |
Discovery, Inc., Class A(1) | | | 97,615 | | | | 2,297,857 | |
| | |
Discovery, Inc., Class C(1) | | | 255,207 | | | | 5,844,240 | |
| | |
Fox Corp., Class A | | | 50,412 | | | | 1,860,203 | |
| | |
Interpublic Group of Cos., Inc. (The) | | | 976 | | | | 36,551 | |
| | |
Liberty Broadband Corp., Series A(1) | | | 1 | | | | 161 | |
| | |
Liberty Broadband Corp., Series C(1) | | | 1 | | | | 161 | |
| | |
Loyalty Ventures, Inc.(1) | | | 274 | | | | 8,239 | |
| | |
News Corp., Class A | | | 32,024 | | | | 714,455 | |
| | |
Omnicom Group, Inc. | | | 16,403 | | | | 1,201,848 | |
| | |
Sirius XM Holdings, Inc. | | | 53,280 | | | | 338,328 | |
| | |
TEGNA, Inc. | | | 1,201 | | | | 22,291 | |
| | |
ViacomCBS, Inc., Class B | | | 612,221 | | | | 18,476,830 | |
| | |
| | | | | | | $ | 95,559,014 | |
|
| Metals & Mining — 0.1% | |
| | |
Alcoa Corp. | | | 159 | | | $ | 9,473 | |
| | |
Arconic Corp.(1) | | | 1 | | | | 33 | |
| | |
Cleveland-Cliffs, Inc.(1) | | | 278,121 | | | | 6,054,694 | |
| | |
Freeport-McMoRan, Inc. | | | 97,788 | | | | 4,080,693 | |
| | |
Glencore PLC | | | 598,405 | | | | 3,049,040 | |
| | |
Newmont Corp. | | | 103 | | | | 6,388 | |
| | |
Nucor Corp. | | | 242,095 | | | | 27,635,144 | |
| | |
Steel Dynamics, Inc. | | | 232,124 | | | | 14,407,937 | |
| | |
| | | | | | | $ | 55,243,402 | |
|
| Multi-Utilities — 0.4% | |
| | |
Consolidated Edison, Inc. | | | 524,468 | | | $ | 44,747,610 | |
| | | | | | | | |
| Security | | Shares | | | Value | |
|
| Multi-Utilities (continued) | |
| | |
Dominion Energy, Inc. | | | 896,671 | | | $ | 70,442,474 | |
| | |
DTE Energy Co. | | | 77,124 | | | | 9,219,403 | |
| | |
NiSource, Inc. | | | 828 | | | | 22,861 | |
| | |
Public Service Enterprise Group, Inc. | | | 500 | | | | 33,365 | |
| | |
Sempra Energy | | | 66,344 | | | | 8,775,984 | |
| | |
WEC Energy Group, Inc. | | | 15,006 | | | | 1,456,632 | |
| | |
| | | | | | | $ | 134,698,329 | |
|
| Multiline Retail — 0.1% | |
| | |
Dollar General Corp. | | | 347 | | | $ | 81,833 | |
| | |
Dollar Tree, Inc.(1) | | | 147,240 | | | | 20,690,165 | |
| | |
Nordstrom, Inc.(1) | | | 3,192 | | | | 72,203 | |
| | |
Target Corp. | | | 44,039 | | | | 10,192,386 | |
| | |
| | | | | | | $ | 31,036,587 | |
|
| Oil, Gas & Consumable Fuels — 1.6% | |
| | |
Antero Resources Corp.(1) | | | 1,341,986 | | | $ | 23,484,755 | |
| | |
Cheniere Energy, Inc. | | | 632,186 | | | | 64,116,304 | |
| | |
Chevron Corp. | | | 1,038,706 | | | | 121,892,149 | |
| | |
ConocoPhillips | | | 385,186 | | | | 27,802,725 | |
| | |
Devon Energy Corp. | | | 33,163 | | | | 1,460,830 | |
| | |
Diamondback Energy, Inc. | | | 28,916 | | | | 3,118,591 | |
| | |
DT Midstream, Inc(1) | | | 38,562 | | | | 1,850,205 | |
| | |
Enbridge, Inc. | | | 4,983 | | | | 194,736 | |
| | |
EOG Resources, Inc. | | | 1,022,314 | | | | 90,812,153 | |
| | |
EQT Corp.(1) | | | 180,474 | | | | 3,936,138 | |
| | |
Equitrans Midstream Corp. | | | 144,379 | | | | 1,492,879 | |
| | |
Exxon Mobil Corp. | | | 3,497,980 | | | | 214,041,396 | |
| | |
Hess Corp. | | | 53,310 | | | | 3,946,539 | |
| | |
HollyFrontier Corp. | | | 9,171 | | | | 300,625 | |
| | |
Kinder Morgan, Inc. | | | 112,401 | | | | 1,782,680 | |
| | |
Magnolia Oil & Gas Corp., Class A | | | 245,547 | | | | 4,633,472 | |
| | |
Marathon Oil Corp. | | | 8,775 | | | | 144,086 | |
| | |
Marathon Petroleum Corp. | | | 193,112 | | | | 12,357,237 | |
| | |
Murphy Oil Corp. | | | 65,112 | | | | 1,700,074 | |
| | |
Occidental Petroleum Corp. | | | 39,361 | | | | 1,141,075 | |
| | |
Phillips 66 | | | 202,729 | | | | 14,689,743 | |
| | |
Pioneer Natural Resources Co. | | | 28,342 | | | | 5,154,843 | |
| | |
Range Resources Corp.(1) | | | 664,831 | | | | 11,853,937 | |
| | |
Royal Dutch Shell PLC, Class A ADR | | | 100 | | | | 4,340 | |
| | |
Southwestern Energy Co.(1) | | | 399 | | | | 1,859 | |
| | |
Valero Energy Corp. | | | 15,809 | | | | 1,187,414 | |
| | |
Williams Cos., Inc. (The) | | | 20,025 | | | | 521,451 | |
| | |
| | | | | | | $ | 613,622,236 | |
| | | | |
| | 34 | | See Notes to Financial Statements. |
Tax-Managed Growth Portfolio
December 31, 2021
Portfolio of Investments — continued
| | | | | | | | |
| Security | | Shares | | | Value | |
|
| Paper & Forest Products — 0.0%(2) | |
| | |
Sylvamo Corp.(1) | | | 3,229 | | | $ | 90,057 | |
| | |
| | | | | | | $ | 90,057 | |
|
| Personal Products — 0.1% | |
| | |
Estee Lauder Cos., Inc. (The), Class A | | | 116,273 | | | $ | 43,044,264 | |
| | |
Unilever PLC ADR | | | 70,897 | | | | 3,813,550 | |
| | |
| | | | | | | $ | 46,857,814 | |
|
| Pharmaceuticals — 4.3% | |
| | |
AstraZeneca PLC ADR | | | 1,319,364 | | | $ | 76,852,953 | |
| | |
Bausch Health Cos., Inc.(1) | | | 4,389 | | | | 121,180 | |
| | |
Bristol-Myers Squibb Co. | | | 2,388,750 | | | | 148,938,563 | |
| | |
Catalent, Inc.(1) | | | 45,943 | | | | 5,882,082 | |
| | |
Eli Lilly & Co. | | | 2,207,396 | | | | 609,726,923 | |
| | |
GlaxoSmithKline PLC ADR | | | 11,863 | | | | 523,158 | |
| | |
Johnson & Johnson | | | 2,632,391 | | | | 450,323,128 | |
| | |
Mallinckrodt PLC(1) | | | 6 | | | | 1 | |
| | |
Merck & Co., Inc. | | | 1,685,925 | | | | 129,209,292 | |
| | |
Novartis AG ADR | | | 145,139 | | | | 12,695,308 | |
| | |
Novo Nordisk A/S ADR | | | 56,211 | | | | 6,295,632 | |
| | |
Organon & Co. | | | 165,641 | | | | 5,043,768 | |
| | |
Pfizer, Inc. | | | 2,331,176 | | | | 137,655,943 | |
| | |
Reata Pharmaceuticals, Inc., Class A(1) | | | 4,694 | | | | 123,781 | |
| | |
Roche Holding AG ADR | | | 35,808 | | | | 1,850,916 | |
| | |
Sanofi ADR | | | 6,100 | | | | 305,610 | |
| | |
Takeda Pharmaceutical Co., Ltd. ADR | | | 31,905 | | | | 434,865 | |
| | |
Teva Pharmaceutical Industries, Ltd. ADR(1) | | | 5,106 | | | | 40,899 | |
| | |
Viatris, Inc. | | | 141,733 | | | | 1,917,648 | |
| | |
Zoetis, Inc. | | | 12,114 | | | | 2,956,179 | |
| | |
Zoetis, Inc.(3) | | | 54,359 | | | | 13,265,227 | |
| | |
| | | | | | | $ | 1,604,163,056 | |
|
| Professional Services — 0.3% | |
| | |
ASGN, Inc.(1) | | | 284,823 | | | $ | 35,147,158 | |
| | |
Booz Allen Hamilton Holding Corp., Class A | | | 102,820 | | | | 8,718,108 | |
| | |
CACI International, Inc., Class A(1) | | | 13,584 | | | | 3,656,949 | |
| | |
CACI International, Inc., Class A(1)(3) | | | 6,200 | | | | 1,669,102 | |
| | |
Equifax, Inc. | | | 8,854 | | | | 2,592,363 | |
| | |
IHS Markit, Ltd. | | | 423 | | | | 56,225 | |
| | |
Jacobs Engineering Group, Inc. | | | 85,615 | | | | 11,920,176 | |
| | |
Nielsen Holdings PLC | | | 48,977 | | | | 1,004,518 | |
| | |
Thomson Reuters Corp. | | | 181,943 | | | | 21,764,022 | |
| | |
Verisk Analytics, Inc. | | | 109,365 | | | | 25,015,057 | |
| | |
| | | | | | | $ | 111,543,678 | |
| | | | | | | | |
| Security | | Shares | | | Value | |
|
| Real Estate Management & Development — 0.0%(2) | |
| | |
Zillow Group, Inc., Class A(1) | | | 10,638 | | | $ | 661,896 | |
| | |
Zillow Group, Inc., Class C(1) | | | 21,276 | | | | 1,358,473 | |
| | |
| | | | | | | $ | 2,020,369 | |
|
| Road & Rail — 1.5% | |
| | |
Canadian National Railway Co. | | | 126,084 | | | $ | 15,490,680 | |
| | |
Canadian Pacific Railway, Ltd. | | | 23,341 | | | | 1,679,152 | |
| | |
CSX Corp. | | | 2,219,677 | | | | 83,459,855 | |
| | |
J.B. Hunt Transport Services, Inc. | | | 10,348 | | | | 2,115,131 | |
| | |
Lyft, Inc., Class A(1) | | | 160,326 | | | | 6,850,730 | |
| | |
Norfolk Southern Corp. | | | 355,378 | | | | 105,799,584 | |
| | |
Norfolk Southern Corp.(3) | | | 3,953 | | | | 1,176,553 | |
| | |
Uber Technologies, Inc.(1) | | | 3,699,519 | | | | 155,120,832 | |
| | |
Union Pacific Corp. | | | 666,789 | | | | 167,984,153 | |
| | |
XPO Logistics, Inc.(1) | | | 67,458 | | | | 5,223,273 | |
| | |
| | | | | | | $ | 544,899,943 | |
|
| Semiconductors & Semiconductor Equipment — 6.6% | |
| | |
Advanced Micro Devices, Inc.(1) | | | 28,340 | | | $ | 4,078,126 | |
| | |
Analog Devices, Inc. | | | 507,974 | | | | 89,286,590 | |
| | |
Applied Materials, Inc. | | | 281,446 | | | | 44,288,342 | |
| | |
ASML Holding NV - NY Shares | | | 12,572 | | | | 10,009,072 | |
| | |
Broadcom, Inc. | | | 118,151 | | | | 78,618,857 | |
| | |
Cirrus Logic, Inc.(1) | | | 50,300 | | | | 4,628,606 | |
| | |
Enphase Energy, Inc.(1) | | | 54,000 | | | | 9,878,760 | |
| | |
Intel Corp. | | | 6,527,892 | | | | 336,186,438 | |
| | |
KLA Corp. | | | 225 | | | | 96,775 | |
| | |
Lam Research Corp. | | | 82,758 | | | | 59,515,416 | |
| | |
Marvell Technology, Inc. | | | 95,691 | | | | 8,372,005 | |
| | |
Microchip Technology, Inc. | | | 1,114,568 | | | | 97,034,290 | |
| | |
Micron Technology, Inc. | | | 386,114 | | | | 35,966,519 | |
| | |
NVIDIA Corp. | | | 2,578,252 | | | | 758,289,696 | |
| | |
NXP Semiconductors NV | | | 14,754 | | | | 3,360,666 | |
| | |
Qorvo, Inc.(1) | | | 13,586 | | | | 2,124,714 | |
| | |
QUALCOMM, Inc. | | | 4,029,980 | | | | 736,962,443 | |
| | |
Silicon Laboratories, Inc.(1) | | | 67,435 | | | | 13,919,933 | |
| | |
Skyworks Solutions, Inc. | | | 1,000 | | | | 155,140 | |
| | |
Teradyne, Inc. | | | 1,200 | | | | 196,236 | |
| | |
Texas Instruments, Inc. | | | 956,878 | | | | 180,342,797 | |
| | |
Xilinx, Inc. | | | 15,758 | | | | 3,341,169 | |
| | |
| | | | | | | $ | 2,476,652,590 | |
|
| Software — 9.4% | |
| | |
Adobe, Inc.(1) | | | 418,351 | | | $ | 237,230,118 | |
| | |
ANSYS, Inc.(1) | | | 154,179 | | | | 61,844,281 | |
| | | | |
| | 35 | | See Notes to Financial Statements. |
Tax-Managed Growth Portfolio
December 31, 2021
Portfolio of Investments — continued
| | | | | | | | |
| Security | | Shares | | | Value | |
|
| Software (continued) | |
| | |
Autodesk, Inc.(1) | | | 32,168 | | | $ | 9,045,320 | |
| | |
Box, Inc., Class A(1) | | | 106,049 | | | | 2,777,423 | |
| | |
Cadence Design Systems, Inc.(1) | | | 770,051 | | | | 143,499,004 | |
| | |
CDK Global, Inc. | | | 3 | | | | 125 | |
| | |
Check Point Software Technologies, Ltd.(1) | | | 151,951 | | | | 17,711,409 | |
| | |
Citrix Systems, Inc. | | | 11,798 | | | | 1,115,973 | |
| | |
Coupa Software, Inc.(1) | | | 54,504 | | | | 8,614,357 | |
| | |
Crowdstrike Holdings, Inc., Class A(1) | | | 433,003 | | | | 88,657,364 | |
| | |
DocuSign, Inc.(1) | | | 1,154,180 | | | | 175,793,156 | |
| | |
Dropbox, Inc., Class A(1) | | | 3,191,403 | | | | 78,317,030 | |
| | |
Envestnet, Inc.(1) | | | 87,353 | | | | 6,930,587 | |
| | |
Fortinet, Inc.(1) | | | 27,508 | | | | 9,886,375 | |
| | |
Guidewire Software, Inc.(1) | | | 67,562 | | | | 7,670,314 | |
| | |
Intuit, Inc. | | | 122,656 | | | | 78,894,792 | |
| | |
Mandiant, Inc.(1) | | | 331,973 | | | | 5,822,806 | |
| | |
Manhattan Associates, Inc.(1) | | | 77,673 | | | | 12,077,375 | |
| | |
Microsoft Corp. | | | 4,582,928 | | | | 1,541,330,345 | |
| | |
Mimecast, Ltd.(1) | | | 34,653 | | | | 2,757,339 | |
| | |
nCino, Inc.(1) | | | 25,000 | | | | 1,371,500 | |
| | |
NCR Corp.(1) | | | 190 | | | | 7,638 | |
| | |
NortonLifeLock, Inc. | | | 121,379 | | | | 3,153,426 | |
| | |
Nuance Communications, Inc.(1) | | | 7,432 | | | | 411,138 | |
| | |
Nutanix, Inc., Class A(1) | | | 18,402 | | | | 586,288 | |
| | |
Olo, Inc., Class A(1) | | | 44,151 | | | | 918,782 | |
| | |
Oracle Corp. | | | 435,440 | | | | 37,974,722 | |
| | |
Palantir Technologies, Inc., Class A(1) | | | 3,121,678 | | | | 56,845,756 | |
| | |
Palo Alto Networks, Inc.(1) | | | 281,650 | | | | 156,811,454 | |
| | |
Paycom Software, Inc.(1) | | | 552,844 | | | | 229,535,300 | |
| | |
RingCentral, Inc., Class A(1) | | | 18,835 | | | | 3,528,737 | |
| | |
salesforce.com, inc.(1) | | | 330,987 | | | | 84,113,726 | |
| | |
SAP SE ADR | | | 2,796 | | | | 391,748 | |
| | |
ServiceNow, Inc.(1) | | | 213,695 | | | | 138,711,562 | |
| | |
Smartsheet, Inc., Class A(1) | | | 227,811 | | | | 17,643,962 | |
| | |
Splunk, Inc.(1) | | | 412,415 | | | | 47,724,664 | |
| | |
Synopsys, Inc.(1) | | | 34,898 | | | | 12,859,913 | |
| | |
Teradata Corp.(1) | | | 318 | | | | 13,506 | |
| | |
Tyler Technologies, Inc.(1) | | | 232,333 | | | | 124,983,537 | |
| | |
VMware, Inc., Class A | | | 9,304 | | | | 1,078,148 | |
| | |
Workday, Inc., Class A(1) | | | 241,399 | | | | 65,945,379 | |
| | |
Zscaler, Inc.(1) | | | 80,881 | | | | 25,989,492 | |
| | |
Zscaler, Inc.(1)(3) | | | 10,000 | | | | 3,213,300 | |
| | |
| | | | | | | $ | 3,503,789,171 | |
|
| Specialty Retail — 2.5% | |
| | |
Advance Auto Parts, Inc. | | | 16,346 | | | $ | 3,921,078 | |
| | |
AutoNation, Inc.(1) | | | 18,044 | | | | 2,108,441 | |
| | | | | | | | |
| Security | | Shares | | | Value | |
|
| Specialty Retail (continued) | |
| | |
AutoZone, Inc.(1) | | | 2,520 | | | $ | 5,282,903 | |
| | |
Bath & Body Works, Inc. | | | 265,335 | | | | 18,517,730 | |
| | |
Bed Bath & Beyond, Inc.(1) | | | 22,000 | | | | 320,760 | |
| | |
Best Buy Co., Inc. | | | 343,446 | | | | 34,894,114 | |
| | |
Burlington Stores, Inc.(1) | | | 22,163 | | | | 6,460,736 | |
| | |
CarMax, Inc.(1) | | | 25,710 | | | | 3,348,213 | |
| | |
Dick’s Sporting Goods, Inc. | | | 72,500 | | | | 8,336,775 | |
| | |
Gap, Inc. (The) | | | 75,000 | | | | 1,323,750 | |
| | |
Home Depot, Inc. (The) | | | 130,084 | | | | 53,986,161 | |
| | |
Lithia Motors, Inc., Class A | | | 80 | | | | 23,756 | |
| | |
Lowe’s Cos., Inc. | | | 1,151,783 | | | | 297,712,870 | |
| | |
O’Reilly Automotive, Inc.(1) | | | 191,239 | | | | 135,058,719 | |
| | |
O’Reilly Automotive, Inc.(1)(3) | | | 59,492 | | | | 42,015,035 | |
| | |
Ross Stores, Inc. | | | 602,153 | | | | 68,814,045 | |
| | |
Signet Jewelers, Ltd. | | | 65,986 | | | | 5,742,762 | |
| | |
TJX Cos., Inc. (The) | | | 1,697,061 | | | | 128,840,871 | |
| | |
Tractor Supply Co. | | | 248,742 | | | | 59,349,841 | |
| | |
Ulta Beauty, Inc.(1) | | | 96,964 | | | | 39,982,136 | |
| | |
Victoria’s Secret & Co.(1) | | | 88,445 | | | | 4,912,235 | |
| | |
| | | | | | | $ | 920,952,931 | |
|
| Technology Hardware, Storage & Peripherals — 6.3% | |
| | |
Apple, Inc. | | | 12,883,258 | | | $ | 2,287,680,123 | |
| | |
Dell Technologies, Inc., Class C(1) | | | 20,826 | | | | 1,169,796 | |
| | |
Hewlett Packard Enterprise Co. | | | 392,470 | | | | 6,189,252 | |
| | |
Logitech International S.A. | | | 2,406 | | | | 198,447 | |
| | |
NetApp, Inc. | | | 78,200 | | | | 7,193,618 | |
| | |
Pure Storage, Inc., Class A(1) | | | 1,300,000 | | | | 42,315,000 | |
| | |
| | | | | | | $ | 2,344,746,236 | |
|
| Textiles, Apparel & Luxury Goods — 1.4% | |
| | |
Columbia Sportswear Co.(3) | | | 19,096 | | | $ | 1,860,668 | |
| | |
Hanesbrands, Inc. | | | 221,909 | | | | 3,710,318 | |
| | |
Kontoor Brands, Inc. | | | 37,542 | | | | 1,924,028 | |
| | |
Levi Strauss & Co., Class A | | | 168,000 | | | | 4,205,040 | |
| | |
Lululemon Athletica, Inc.(1) | | | 4,378 | | | | 1,713,768 | |
| | |
NIKE, Inc., Class B | | | 2,950,365 | | | | 491,737,335 | |
| | |
PVH Corp. | | | 16 | | | | 1,706 | |
| | |
Skechers USA, Inc., Class A(1) | | | 100,000 | | | | 4,340,000 | |
| | |
Skechers USA, Inc., Class A(1)(3) | | | 45,345 | | | | 1,967,973 | |
| | |
Skechers USA, Inc., Class A(1)(3) | | | 50,000 | | | | 2,169,349 | |
| | |
Tapestry, Inc. | | | 522 | | | | 21,193 | |
| | |
Under Armour, Inc., Class C(1) | | | 500 | | | | 9,020 | |
| | |
VF Corp. | | | 312,353 | | | | 22,870,487 | |
| | |
| | | | | | | $ | 536,530,885 | |
| | | | |
| | 36 | | See Notes to Financial Statements. |
Tax-Managed Growth Portfolio
December 31, 2021
Portfolio of Investments — continued
| | | | | | | | |
| Security | | Shares | | | Value | |
|
| Thrifts & Mortgage Finance — 0.0%(2) | |
| | |
Essent Group, Ltd. | | | 96,312 | | | $ | 4,385,085 | |
| | |
| | | | | | | $ | 4,385,085 | |
|
| Tobacco — 0.4% | |
| | |
Altria Group, Inc. | | | 941,542 | | | $ | 44,619,676 | |
| | |
British American Tobacco PLC ADR | | | 3 | | | | 112 | |
| | |
Philip Morris International, Inc. | | | 1,197,162 | | | | 113,730,390 | |
| | |
| | | | | | | $ | 158,350,178 | |
|
| Trading Companies & Distributors — 0.4% | |
| | |
Fastenal Co. | | | 2,049,875 | | | $ | 131,314,993 | |
| | |
NOW, Inc.(1) | | | 944 | | | | 8,062 | |
| | |
United Rentals, Inc.(1) | | | 6,508 | | | | 2,162,543 | |
| | |
W.W. Grainger, Inc. | | | 9,830 | | | | 5,094,299 | |
| | |
| | | | | | | $ | 138,579,897 | |
|
| Water Utilities — 0.0%(2) | |
| | |
American Water Works Co., Inc. | | | 23,388 | | | $ | 4,417,058 | |
| | |
Essential Utilities, Inc. | | | 500 | | | | 26,845 | |
| | |
| | | | | | | $ | 4,443,903 | |
|
| Wireless Telecommunication Services — 0.0%(2) | |
| | |
America Movil SAB de CV, Series L ADR | | | 15,204 | | | $ | 320,956 | |
| | |
Rogers Communications, Inc., Class B | | | 750 | | | | 35,723 | |
| | |
Vodafone Group PLC ADR | | | 5 | | | | 75 | |
| | |
| | | | | | | $ | 356,754 | |
| |
Total Common Stocks
(identified cost $16,214,717,750) | | | $ | 37,207,864,289 | |
|
| Preferred Stocks — 0.0%(2) | |
| Security | | Shares | | | Value | |
|
| Internet & Direct Marketing Retail — 0.0%(2) | |
| | |
Qurate Retail, Inc., Series A, 8.00% | | | 2,994 | | | $ | 309,041 | |
| | |
| | | | | | | $ | 309,041 | |
| |
Total Preferred Stocks
(identified cost $168,592) | | | $ | 309,041 | |
| | | | | | | | |
| Warrants — 0.0%(2) | |
| Security | | Shares | | | Value | |
|
| Oil, Gas & Consumable Fuels — 0.0%(2) | |
| | |
Occidental Petroleum Corp., Exp. 8/3/27(1) | | | 2,853 | | | $ | 35,976 | |
| | |
| | | | | | | $ | 35,976 | |
| |
Total Warrants
(identified cost $14,122) | | | $ | 35,976 | |
|
| Short-Term Investments — 0.3% | |
| Description | | Units | | | Value | |
| | |
Eaton Vance Cash Reserves Fund, LLC, 0.08%(6) | | | 97,105,888 | | | $ | 97,096,177 | |
| |
Total Short-Term Investments
(identified cost $97,099,204) | | | $ | 97,096,177 | |
| |
Total Investments — 100.0%
(identified cost $16,311,999,668) | | | $ | 37,305,305,483 | |
| |
Other Assets, Less Liabilities — 0.0%(2) | | | $ | 7,304,976 | |
| |
Net Assets — 100.0% | | | $ | 37,312,610,459 | |
The percentage shown for each investment category in the Portfolio of Investments is based on net assets.
| | (1) | Non-income producing security. |
| | (2) | Amount is less than 0.05%. |
| | (3) | Restricted security (see Note 5). |
| | (4) | Represents an investment in an issuer that is deemed to be an affiliate (see Note 7). |
| | (5) | For fair value measurement disclosure purposes, security is categorized as Level 3 (see Note 8). |
| | (6) | Affiliated investment company, available to Eaton Vance portfolios and funds, which invests in high quality, U.S. dollar denominated money market instruments. The rate shown is the annualized seven-day yield as of December 31, 2021. |
Abbreviations:
| | | | |
| | |
| ADR | | – | | American Depositary Receipt |
| | | | |
| | 37 | | See Notes to Financial Statements. |
Tax-Managed Growth Portfolio
December 31, 2021
Statement of Assets and Liabilities
| | | | |
| Assets | | December 31, 2021 | |
| |
Unaffiliated investments, at value (identified cost, $16,133,535,650) | | $ | 36,999,832,018 | |
| |
Affiliated investment, at value (identified cost, $178,464,018) | | | 305,473,465 | |
| |
Foreign currency, at value (identified cost, $1,422) | | | 1,403 | |
| |
Dividends receivable | | | 14,967,508 | |
| |
Dividends receivable from affiliated investments | | | 6,161 | |
| |
Receivable for investments sold | | | 5,084,422 | |
| |
Tax reclaims receivable | | | 1,309,125 | |
| |
Total assets | | $ | 37,326,674,102 | |
|
| Liabilities | |
| |
Payable to affiliates: | | | | |
| |
Investment adviser fee | | $ | 12,598,032 | |
| |
Trustees’ fees | | | 27,125 | |
| |
Accrued expenses | | | 1,438,486 | |
| |
Total liabilities | | $ | 14,063,643 | |
| |
Commitments and contingencies (Note 9) | | | | |
| |
Net Assets applicable to investors’ interest in Portfolio | | $ | 37,312,610,459 | |
| | | | |
| | 38 | | See Notes to Financial Statements. |
Tax-Managed Growth Portfolio
December 31, 2021
Statement of Operations
| | | | |
| Investment Income | | Year Ended December 31, 2021 | |
| |
Dividends (net of foreign taxes, $3,651,489) | | $ | 360,567,868 | |
| |
Dividends from affiliated investments | | | 4,271,424 | |
| |
Total investment income | | $ | 364,839,292 | |
|
| Expenses | |
| |
Investment adviser fee | | $ | 133,920,753 | |
| |
Trustees’ fees and expenses | | | 108,500 | |
| |
Custodian fee | | | 3,994,356 | |
| |
Professional fees | | | 537,932 | |
| |
Miscellaneous | | | 809,819 | |
| |
Total expenses | | $ | 139,371,360 | |
| |
Net investment income | | $ | 225,467,932 | |
|
| Realized and Unrealized Gain (Loss) | |
|
Net realized gain (loss) — | |
| |
Investment transactions(1) | | $ | 644,094,910 | |
| |
Investment transactions — affiliated investments(1) | | | 30,461,341 | |
| |
Foreign currency transactions | | | (5,505 | ) |
| |
Net realized gain | | $ | 674,550,746 | |
|
Change in unrealized appreciation (depreciation) — | |
| |
Investments | | $ | 6,231,454,265 | |
| |
Investments — affiliated investments | | | 23,430,259 | |
| |
Foreign currency | | | (78,121 | ) |
| |
Net change in unrealized appreciation (depreciation) | | $ | 6,254,806,403 | |
| |
Net realized and unrealized gain | | $ | 6,929,357,149 | |
| |
Net increase in net assets from operations | | $ | 7,154,825,081 | |
| (1) | Aggregate amount includes $660,542,211 of net realized gains from redemptions in-kind. |
| | | | |
| | 39 | | See Notes to Financial Statements. |
Tax-Managed Growth Portfolio
December 31, 2021
Statements of Changes in Net Assets
| | | | | | | | |
| | | Year Ended December 31, | |
| Increase (Decrease) in Net Assets | | 2021 | | | 2020 | |
|
From operations — | |
| | |
Net investment income | | $ | 225,467,932 | | | $ | 242,011,047 | |
| | |
Net realized gain | | | 674,550,746 | | | | 582,853,151 | |
| | |
Net change in unrealized appreciation (depreciation) | | | 6,254,806,403 | | | | 4,456,295,637 | |
| | |
Net increase in net assets from operations | | $ | 7,154,825,081 | | | $ | 5,281,159,835 | |
|
Capital transactions — | |
| | |
Contributions | | $ | 3,616,316,912 | | | $ | 1,891,540,171 | |
| | |
Withdrawals | | | (1,445,245,658 | ) | | | (1,199,338,464 | ) |
| | |
Net increase in net assets from capital transactions | | $ | 2,171,071,254 | | | $ | 692,201,707 | |
| | |
Net increase in net assets | | $ | 9,325,896,335 | | | $ | 5,973,361,542 | |
| | |
| Net Assets | | | | | | | | |
| | |
At beginning of year | | $ | 27,986,714,124 | | | $ | 22,013,352,582 | |
| | |
At end of year | | $ | 37,312,610,459 | | | $ | 27,986,714,124 | |
| | | | |
| | 40 | | See Notes to Financial Statements. |
Tax-Managed Growth Portfolio
December 31, 2021
Financial Highlights
| | | | | | | | | | | | | | | | | | | | |
| | | Year Ended December 31, | |
| | | 2021 | | | 2020 | | | 2019 | | | 2018 | | | 2017 | |
| | | | | |
Ratios (as a percentage of average daily net assets): | | | | | | | | | | | | | | | | | | | | |
| | | | | |
Expenses | | | 0.43 | % | | | 0.44 | % | | | 0.45 | % | | | 0.46 | % | | | 0.46 | % |
| | | | | |
Net investment income | | | 0.69 | % | | | 1.07 | % | | | 1.28 | % | | | 1.25 | % | | | 1.33 | % |
| | | | | |
Portfolio Turnover(1) | | | 1 | % | | | 1 | % | | | 1 | % | | | 1 | % | | | 0 | %(2) |
| | | | | |
Total Return | | | 25.05 | % | | | 23.42 | % | | | 29.87 | % | | | (5.02 | )% | | | 22.76 | % |
| | | | | |
Net assets, end of year (000’s omitted) | | $ | 37,312,610 | | | $ | 27,986,714 | | | $ | 22,013,353 | | | $ | 16,016,046 | | | $ | 16,224,690 | |
| (1) | Excludes the value of portfolio securities contributed or distributed as a result of in-kind shareholder transactions. The portfolio turnover of the Portfolio including in-kind contributions and distributions of securities was 4%, 6%, 6%, 6% and 5% for the years ended December 31, 2021, 2020, 2019, 2018 and 2017, respectively. |
| (2) | Amount is less than 0.5%. |
| | | | |
| | 41 | | See Notes to Financial Statements. |
Eaton Vance
Tax-Managed Growth Portfolio
December 31, 2021
Notes to Financial Statements
1 Significant Accounting Policies
Tax-Managed Growth Portfolio (the Portfolio) is a Massachusetts business trust registered under the Investment Company Act of 1940, as amended (the 1940 Act), as a diversified, open-end management investment company. The Portfolio’s investment objective is to achieve long-term, after-tax returns for interestholders through investing in a diversified portfolio of equity securities. The Declaration of Trust permits the Trustees to issue interests in the Portfolio. At December 31, 2021, Eaton Vance Tax-Managed Growth Fund 1.0, Eaton Vance Tax-Managed Growth Fund 1.1, Eaton Vance Tax-Managed Growth Fund 1.2 and Eaton Vance Tax-Managed Equity Asset Allocation Fund held an interest of 3.9%, 6.5%, 3.4%, and 0.7% respectively, in the Portfolio. In addition, an unregistered fund managed by the adviser to the Portfolio held an aggregate interest of 85.5% in the Portfolio.
The following is a summary of significant accounting policies of the Portfolio. The policies are in conformity with accounting principles generally accepted in the United States of America (U.S. GAAP). The Portfolio is an investment company and follows accounting and reporting guidance in the Financial Accounting Standards Board (FASB) Accounting Standards Codification Topic 946 “Financial Services — Investment Companies.”
A Investment Valuation — The following methodologies are used to determine the market value or fair value of investments.
Equity Securities. Equity securities listed on a U.S. securities exchange generally are valued at the last sale or closing price on the day of valuation or, if no sales took place on such date, at the mean between the closing bid and ask prices on the exchange where such securities are principally traded. Equity securities listed on the NASDAQ National Market System are valued at the NASDAQ official closing price. Unlisted or listed securities for which closing sales prices or closing quotations are not available are valued at the mean between the latest available bid and ask prices.
Foreign Securities and Currencies. Foreign securities and currencies are valued in U.S. dollars, based on foreign currency exchange rate quotations supplied by a third party pricing service. The pricing service uses a proprietary model to determine the exchange rate. Inputs to the model include reported trades and implied bid/ask spreads. The daily valuation of exchange-traded foreign securities generally is determined as of the close of trading on the principal exchange on which such securities trade. Events occurring after the close of trading on foreign exchanges may result in adjustments to the valuation of foreign securities to more accurately reflect their fair value as of the close of regular trading on the New York Stock Exchange. When valuing foreign equity securities that meet certain criteria, the Portfolio’s Trustees have approved the use of a fair value service that values such securities to reflect market trading that occurs after the close of the applicable foreign markets of comparable securities or other instruments that have a strong correlation to the fair-valued securities.
Affiliated Fund. The Portfolio may invest in Eaton Vance Cash Reserves Fund, LLC (Cash Reserves Fund), an affiliated investment company managed by Eaton Vance Management (EVM). While Cash Reserves Fund is not a registered money market mutual fund, it conducts all of its investment activities in accordance with the requirements of Rule 2a-7 under the 1940 Act. Investments in Cash Reserves Fund are valued at the closing net asset value per unit on the valuation day. Cash Reserves Fund generally values its investment securities based on available market quotations provided by a third party pricing service.
Fair Valuation. Investments for which valuations or market quotations are not readily available or are deemed unreliable are valued at fair value using methods determined in good faith by or at the direction of the Trustees of the Portfolio in a manner that most fairly reflects the security’s “fair value”, which is the amount that the Portfolio might reasonably expect to receive for the security upon its current sale in the ordinary course. Each such determination is based on a consideration of relevant factors, which are likely to vary from one pricing context to another. These factors may include, but are not limited to, the type of security, the existence of any contractual restrictions on the security’s disposition, the price and extent of public trading in similar securities of the issuer or of comparable companies or entities, quotations or relevant information obtained from broker/dealers or other market participants, information obtained from the issuer, analysts, and/or the appropriate stock exchange (for exchange- traded securities), an analysis of the company’s or entity’s financial statements, and an evaluation of the forces that influence the issuer and the market(s) in which the security is purchased and sold.
B Investment Transactions — Investment transactions for financial statement purposes are accounted for on a trade date basis. Realized gains and losses on investments sold are determined on the basis of identified cost.
C Income — Dividend income is recorded on the ex-dividend date for dividends received in cash and/or securities. However, if the ex-dividend date has passed, certain dividends from foreign securities are recorded as the Portfolio is informed of the ex-dividend date. Withholding taxes on foreign dividends and capital gains have been provided for in accordance with the Portfolio’s understanding of the applicable countries’ tax rules and rates. In consideration of recent decisions rendered by European courts, the Portfolio has filed additional tax reclaims for previously withheld taxes on dividends earned in certain European Union countries. These filings are subject to various administrative and judicial proceedings within these countries. Due to the uncertainty as to the ultimate resolution of these proceedings, the likelihood of receipt of these reclaims, and the potential timing of payment, no amounts are reflected in the financial statements for such reclaims. Interest income is recorded on the basis of interest accrued, adjusted for amortization of premium or accretion of discount.
D Federal Taxes — The Portfolio has elected to be treated as a partnership for federal tax purposes. No provision is made by the Portfolio for federal or state taxes on any taxable income of the Portfolio because each investor in the Portfolio is ultimately responsible for the payment of any taxes on its share of taxable income. Since at least one of the Portfolio’s investors is a regulated investment company that invests all or substantially all of its assets in the Portfolio, the Portfolio normally must satisfy the applicable source of income and diversification requirements (under the Internal Revenue Code) in order for its investors to satisfy them. The Portfolio will allocate, at least annually among its investors, each investor’s distributive share of the Portfolio’s net investment income, net realized capital gains and losses and any other items of income, gain, loss, deduction or credit.
Eaton Vance
Tax-Managed Growth Portfolio
December 31, 2021
Notes to Financial Statements — continued
As of December 31, 2021, the Portfolio had no uncertain tax positions that would require financial statement recognition, de-recognition, or disclosure. The Portfolio files a U.S. federal income tax return annually after its fiscal year-end, which is subject to examination by the Internal Revenue Service for a period of three years from the date of filing.
E Foreign Currency Translation — Investment valuations, other assets, and liabilities initially expressed in foreign currencies are translated each business day into U.S. dollars based upon current exchange rates. Purchases and sales of foreign investment securities and income and expenses denominated in foreign currencies are translated into U.S. dollars based upon currency exchange rates in effect on the respective dates of such transactions. Recognized gains or losses on investment transactions attributable to changes in foreign currency exchange rates are recorded for financial statement purposes as net realized gains and losses on investments. That portion of unrealized gains and losses on investments that results from fluctuations in foreign currency exchange rates is not separately disclosed.
F Use of Estimates — The preparation of the financial statements in conformity with U.S. GAAP requires management to make estimates and assumptions that affect the reported amounts of assets and liabilities at the date of the financial statements and the reported amounts of income and expense during the reporting period. Actual results could differ from those estimates.
G Indemnifications — Under the Portfolio’s organizational documents, its officers and Trustees may be indemnified against certain liabilities and expenses arising out of the performance of their duties to the Portfolio. Under Massachusetts law, if certain conditions prevail, interestholders in the Portfolio could be deemed to have personal liability for the obligations of the Portfolio. However, the Portfolio’s Declaration of Trust contains an express disclaimer of liability on the part of Portfolio interestholders. Additionally, in the normal course of business, the Portfolio enters into agreements with service providers that may contain indemnification clauses. The Portfolio’s maximum exposure under these arrangements is unknown as this would involve future claims that may be made against the Portfolio that have not yet occurred.
2 Investment Adviser Fee and Other Transactions with Affiliates
The investment adviser fee is earned by Boston Management and Research (BMR) as compensation for investment advisory services rendered to the Portfolio. On March 1, 2021, Morgan Stanley acquired Eaton Vance Corp. (the “Transaction”) and BMR became an indirect, wholly-owned subsidiary of Morgan Stanley. In connection with the Transaction, the Portfolio entered into a new investment advisory agreement (the “New Agreement”) with BMR,
which took effect on March 1, 2021. Pursuant to the New Agreement (and the Portfolio’s investment advisory agreement with BMR in effect prior to March 1, 2021), the fee is computed at an annual rate of the Portfolio’s average daily net assets as follows and is payable monthly:
| | | | |
| Average Daily Net Assets | | Annual Fee
Rate | |
| |
Up to $500 million | | | 0.6250 | % |
| |
$500 million but less than $1 billion | | | 0.5625 | % |
| |
$1 billion but less than $1.5 billion | | | 0.5000 | % |
| |
$1.5 billion but less than $7 billion | | | 0.4375 | % |
| |
$7 billion but less than $10 billion | | | 0.4250 | % |
| |
$10 billion but less than $15 billion | | | 0.4125 | % |
| |
$15 billion but less than $20 billion | | | 0.4000 | % |
| |
$20 billion but less than $25 billion | | | 0.3900 | % |
| |
$25 billion and over | | | 0.3800 | % |
For the year ended December 31, 2021, the Portfolio’s investment adviser fee amounted to $133,920,753 or 0.41% of the Portfolio’s average daily net assets. The Portfolio invests its cash in Cash Reserves Fund. EVM does not currently receive a fee for advisory services provided to Cash Reserves Fund.
Officers and Trustees of the Portfolio who are members of EVM’s or BMR’s organizations receive remuneration for their services to the Portfolio out of the investment adviser fee. Trustees of the Portfolio who are not affiliated with the investment adviser may elect to defer receipt of all or a percentage of their annual fees in accordance with the terms of the Trustees Deferred Compensation Plan. For the year ended December 31, 2021, no significant amounts have been deferred. Certain officers and Trustees of the Portfolio are officers of the above organizations.
3 Purchases and Sales of Investments
Purchases and sales of investments, other than short-term obligations, aggregated $358,658,495 and $174,369,711, respectively, for the year ended December 31, 2021. In addition, investors contributed securities with an aggregate market value of $3,587,873,814 and investments having an aggregate market value of $1,248,236,341 were distributed in payment for capital withdrawals during the year ended December 31, 2021.
Eaton Vance
Tax-Managed Growth Portfolio
December 31, 2021
Notes to Financial Statements — continued
4 Federal Income Tax Basis of Investments
The cost and unrealized appreciation (depreciation) of investments of the Portfolio at December 31, 2021, as determined on a federal income tax basis, were as follows:
| | | | |
| |
Aggregate cost | | $ | 4,266,342,718 | |
| |
Gross unrealized appreciation | | $ | 33,075,111,768 | |
| |
Gross unrealized depreciation | | | (36,149,003 | ) |
| |
Net unrealized appreciation | | $ | 33,038,962,765 | |
5 Restricted Securities
At December 31, 2021, the Portfolio owned the following securities (representing 0.6% of net assets) which were restricted as to public resale and not registered under the Securities Act of 1933. The Portfolio has various registration rights (exercisable under a variety of circumstances) with respect to these securities. The value of these securities is determined based on valuations provided by brokers when available, or if not available, they are valued at fair value using methods determined in good faith by or at the direction of the Trustees.
| | | | | | | | | | | | | | | | | | | | |
| Common Stocks | | Date of
Acquisition | | | Eligible for
Resale | | | Shares | | | Cost | | | Value | |
| | | | | |
American Tower Corp. | | | 9/16/21 | | | | 9/16/22 | | | | 33,660 | | | $ | 10,000,268 | | | $ | 9,842,842 | |
| | | | | |
Arista Networks, Inc. | | | 3/18/21 | | | | 3/18/22 | | | | 290,000 | | | | 20,964,888 | | | | 41,687,500 | |
| | | | | |
CACI International, Inc., Class A | | | 6/17/21 | | | | 6/17/22 | | | | 6,200 | | | | 1,636,477 | | | | 1,669,102 | |
| | | | | |
Caterpillar, Inc. | | | 3/18/21 | | | | 3/18/22 | | | | 6,950 | | | | 1,622,835 | | | | 1,436,843 | |
| | | | | |
Columbia Sportswear Co. | | | 9/16/21 | | | | 9/16/22 | | | | 19,096 | | | | 1,935,474 | | | | 1,860,668 | |
| | | | | |
Exact Sciences Corp. | | | 6/17/21 | | | | 6/17/22 | | | | 8,313 | | | | 1,000,068 | | | | 647,001 | |
| | | | | |
Inari Medical, Inc. | | | 12/16/21 | | | | 12/16/22 | | | | 22,222 | | | | 1,779,491 | | | | 2,026,884 | |
| | | | | |
Integra LifeSciences Holdings Corp. | | | 3/18/21 | | | | 3/18/22 | | | | 730,000 | | | | 49,717,329 | | | | 48,902,700 | |
| | | | | |
Littelfuse, Inc. | | | 6/17/21 | | | | 6/17/22 | | | | 39,181 | | | | 10,000,149 | | | | 12,329,477 | |
| | | | | |
Norfolk Southern Corp. | | | 9/16/21 | | | | 9/16/22 | | | | 3,953 | | | | 982,303 | | | | 1,176,553 | |
| | | | | |
O’Reilly Automotive, Inc. | | | 6/17/21 | | | | 6/17/22 | | | | 59,492 | | | | 31,782,975 | | | | 42,015,035 | |
| | | | | |
Skechers USA, Inc., Class A | | | 6/17/21 | | | | 6/17/22 | | | | 45,345 | | | | 2,232,125 | | | | 1,967,973 | |
| | | | | |
Skechers USA, Inc., Class A | | | 9/16/21 | | | | 9/16/22 | | | | 50,000 | | | | 2,269,138 | | | | 2,169,349 | |
| | | | | |
Snap, Inc., Class A | | | 3/18/21 | | | | 3/18/22 | | | | 469,399 | | | | 30,000,055 | | | | 22,075,835 | |
| | | | | |
Trimble, Inc. | | | 9/16/21 | | | | 9/16/22 | | | | 183,372 | | | | 16,843,461 | | | | 15,982,881 | |
| | | | | |
Visa, Inc., Class A | | | 3/18/21 | | | | 3/18/22 | | | | 29,956 | | | | 6,676,445 | | | | 6,491,765 | |
| | | | | |
Zoetis, Inc. | | | 6/17/21 | | | | 6/17/22 | | | | 54,359 | | | | 10,000,029 | | | | 13,265,227 | |
| | | | | |
Zscaler, Inc. | | | 6/17/21 | | | | 6/17/22 | | | | 10,000 | | | | 2,121,320 | | | | 3,213,300 | |
| | | | | |
Total Restricted Securities | | | | | | | | | | | | | | $ | 201,564,830 | | | $ | 228,760,935 | |
6 Line of Credit
The Portfolio participates with other portfolios and funds managed by EVM and its affiliates in an $800 million unsecured line of credit agreement with a group of banks, which is in effect through October 25, 2022. Borrowings are made by the Portfolio solely for temporary purposes related to redemptions and other short-term cash needs. Interest is charged to the Portfolio based on its borrowings at an amount above either the Secured Overnight Financing Rate (SOFR) or Federal Funds rate. In addition, a fee computed at an annual rate of 0.15% on the daily unused portion of the line of credit is allocated among the participating portfolios and funds at the end of each quarter. In connection with the renewal of the agreement in October 2021, an upfront fee and arrangement fee totaling $150,000 was incurred that was allocated to the participating portfolios and funds. Because the line of credit is not available exclusively to the Portfolio, it may be unable to borrow some or all of its requested amounts at any particular time. The Portfolio did not have any significant borrowings or allocated fees during the year ended December 31, 2021.
Eaton Vance
Tax-Managed Growth Portfolio
December 31, 2021
Notes to Financial Statements — continued
7 Investments in Affiliated Issuers and Funds
At December 31, 2021, the value of the Portfolio’s investment in affiliated issuers and funds was $305,473,465 which represents 0.8% of the Portfolio’s net assets. Transactions in affiliated issuers and funds by the Portfolio for the year ended December 31, 2021 were as follows:
| | | | | | | | | | | | | | | | | | | | | | | | | | | | | | | | |
| Name | | Value,
beginning
of period | | | Purchases | | | Sales
proceeds | | | Net
realized
gain (loss) | | | Change in
unrealized
appreciation
(depreciation) | | | Value, end
of period | | | Dividend
income | | | Shares/ Units, end
of period | |
| | | | | | | | |
Common Stocks | | | | | | | | | | | | | | | | | | | | | | | | | | | | | | | | |
| | | | | | | | |
Morgan Stanley(1) | | $ | — | | | $ | — | | | $ | (51,281,956 | ) | | $ | 30,467,722 | | | $ | 23,433,286 | | | $ | 208,377,288 | | | $ | 4,133,964 | | | | 2,122,833 | |
| | | | | | | | |
Short-Term Investments | | | | | | | | | | | | | | | | | | | | | | | | | | | | | | | | |
| | | | | | | | |
Eaton Vance Cash Reserves Fund, LLC | | | 202,615,051 | | | | 499,455,510 | | | | (604,964,976 | ) | | | (6,381 | ) | | | (3,027 | ) | | | 97,096,177 | | | | 137,460 | | | | 97,105,888 | |
| | | | | | | | |
| | | | | | | | | | | | | | | $ | 30,461,341 | | | $ | 23,430,259 | | | $ | 305,473,465 | | | $ | 4,271,424 | | | | | |
| (1) | Affiliated issuer as of March 1, 2021. |
8 Fair Value Measurements
Under generally accepted accounting principles for fair value measurements, a three-tier hierarchy to prioritize the assumptions, referred to as inputs, is used in valuation techniques to measure fair value. The three-tier hierarchy of inputs is summarized in the three broad levels listed below.
| • | | Level 1 – quoted prices in active markets for identical investments |
| • | | Level 2 – other significant observable inputs (including quoted prices for similar investments, interest rates, prepayment speeds, credit risk, etc.) |
| • | | Level 3 – significant unobservable inputs (including a fund’s own assumptions in determining the fair value of investments) |
In cases where the inputs used to measure fair value fall in different levels of the fair value hierarchy, the level disclosed is determined based on the lowest level input that is significant to the fair value measurement in its entirety. The inputs or methodology used for valuing securities are not necessarily an indication of the risk associated with investing in those securities.
At December 31, 2021, the hierarchy of inputs used in valuing the Portfolio’s investments, which are carried at value, were as follows:
| | | | | | | | | | | | | | | | |
| Asset Description | | Level 1 | | | Level 2 | | | Level 3* | | | Total | |
| | | | |
Common Stocks | | | | | | | | | | | | | | | | |
| | | | |
Communication Services | | $ | 4,302,843,873 | | | $ | — | | | $ | — | | | $ | 4,302,843,873 | |
| | | | |
Consumer Discretionary | | | 4,789,720,652 | | | | 4,030,017 | | | | 679,287 | | | | 4,794,429,956 | |
| | | | |
Consumer Staples | | | 2,468,774,739 | | | | 156,140,715 | | | | — | | | | 2,624,915,454 | |
| | | | |
Energy | | | 646,880,048 | | | | — | | | | — | | | | 646,880,048 | |
| | | | |
Financials | | | 4,918,027,032 | | | | 15,276,424 | | | | — | | | | 4,933,303,456 | |
| | | | |
Health Care | | | 4,738,204,368 | | | | 2,026,884 | | | | — | | | | 4,740,231,252 | |
| | | | |
Industrials | | | 3,112,353,046 | | | | 1,176,553 | | | | — | | | | 3,113,529,599 | |
| | | | |
Information Technology | | | 11,092,715,359 | | | | 15,982,881 | | | | — | | | | 11,108,698,240 | |
| | | | |
Materials | | | 527,530,201 | | | | 3,049,040 | | | | — | | | | 530,579,241 | |
| | | | |
Real Estate | | | 64,158,676 | | | | 9,842,842 | | | | — | | | | 74,001,518 | |
| | | | |
Utilities | | | 338,451,652 | | | | — | | | | — | | | | 338,451,652 | |
| | | | |
Total Common Stocks | | $ | 36,999,659,646 | | | $ | 207,525,356 | ** | | $ | 679,287 | | | $ | 37,207,864,289 | |
| | | | |
Preferred Stocks | | $ | 309,041 | | | $ | — | | | $ | — | | | $ | 309,041 | |
| | | | |
Warrants | | | 35,976 | | | | — | | | | — | | | | 35,976 | |
| | | | |
Short-Term Investments | | | — | | | | 97,096,177 | | | | — | | | | 97,096,177 | |
| | | | |
Total Investments | | $ | 37,000,004,663 | | | $ | 304,621,533 | | | $ | 679,287 | | | $ | 37,305,305,483 | |
Eaton Vance
Tax-Managed Growth Portfolio
December 31, 2021
Notes to Financial Statements — continued
| * | None of the unobservable inputs for Level 3 assets, individually or collectively, had a material impact on the Portfolio. |
| ** | Includes foreign equity securities whose values were adjusted to reflect market trading of comparable securities or other correlated instruments that occurred after the close of trading in their applicable foreign markets. |
Level 3 investments at the beginning and/or end of the period in relation to net assets were not significant and accordingly, a reconciliation of Level 3 assets for the year ended December 31, 2021 is not presented.
9 Legal Proceedings
In November 2010, the Portfolio was named as defendant and a putative member of the proposed defendant class of shareholders in the case entitled Official Committee of Unsecured Creditors (UCC) of the Tribune Company v. FitzSimons, et al. (the “FitzSimons action”) as a result of its ownership of shares in the Tribune Company (Tribune) in 2007 when Tribune effected a leveraged buyout transaction (LBO) and was converted to a privately held company. The UCC, which was replaced by a Litigation Trustee pursuant to Tribune’s plan of reorganization, seeks to recover payments of the proceeds of the LBO. The FitzSimons action is part of a multi-district litigation proceeding in the Southern District of New York. The FitzSimons action was dismissed by the District Court in January 2017, and the Second Circuit Court of Appeals affirmed the dismissal of the FitzSimons action in August 2021. In January 2022, the Litigation Trustee conceded that the Second Circuit Court of Appeals dismissal as to the Portfolio stands.
In June 2011, a group of Tribune creditors also filed multiple actions against former Tribune shareholders involving state law constructive fraudulent conveyance claims arising out of the LBO (the “SLFC actions”). The Portfolio was named as a defendant in one of the SLFC actions filed in United States District Court — District of Massachusetts by Deutsche Bank Trust Co. Americas, which sought to recover the proceeds received in connection with the LBO from former shareholders. The SLFC actions were also part of the multi-district litigation proceeding in the Southern District of New York. The SLFC actions were dismissed by the District Court in September 2013, and the Second Circuit Court of Appeals affirmed the dismissal of the SLFC actions in December 2019. The Supreme Court of the United States denied the plaintiff-appellants Writ of Certiorari petition in April 2021.
The attorneys’ fees and costs related to the FitzSimons action and the SLFC actions have been expensed by the Portfolio as incurred.
10 Risks and Uncertainties
Pandemic Risk
An outbreak of respiratory disease caused by a novel coronavirus was first detected in China in late 2019 and subsequently spread internationally. This coronavirus has resulted in closing borders, enhanced health screenings, changes to healthcare service preparation and delivery, quarantines, cancellations, disruptions to supply chains and customer activity, as well as general concern and uncertainty. Health crises caused by outbreaks, such as the coronavirus outbreak, may exacerbate other pre-existing political, social and economic risks and disrupt normal market conditions and operations. The impact of this outbreak has negatively affected the worldwide economy, the economies of individual countries, individual companies, and the market in general, and may continue to do so in significant and unforeseen ways, as may other epidemics and pandemics that may arise in the future. Any such
impact could adversely affect the Portfolio’s performance, or the performance of the securities in which the Portfolio invests.
Tax-Managed Growth Portfolio
December 31, 2021
Report of Independent Registered Public Accounting Firm
To the Trustees and Investors of Tax-Managed Growth Portfolio:
Opinion on the Financial Statements and Financial Highlights
We have audited the accompanying statement of assets and liabilities of Tax-Managed Growth Portfolio (the “Portfolio”), including the portfolio of investments, as of December 31, 2021, the related statement of operations for the year then ended, the statements of changes in net assets for each of the two years in the period then ended, the financial highlights for each of the five years in the period then ended, and the related notes. In our opinion, the financial statements and financial highlights present fairly, in all material respects, the financial position of the Portfolio as of December 31, 2021, and the results of its operations for the year then ended, the changes in its net assets for each of the two years in the period then ended, and the financial highlights for each of the five years in the period then ended in conformity with accounting principles generally accepted in the United States of America.
Basis for Opinion
These financial statements and financial highlights are the responsibility of the Portfolio’s management. Our responsibility is to express an opinion on the Portfolio’s financial statements and financial highlights based on our audits. We are a public accounting firm registered with the Public Company Accounting Oversight Board (United States) (PCAOB) and are required to be independent with respect to the Portfolio in accordance with the U.S. federal securities laws and the applicable rules and regulations of the Securities and Exchange Commission and the PCAOB.
We conducted our audits in accordance with the standards of the PCAOB. Those standards require that we plan and perform the audit to obtain reasonable assurance about whether the financial statements and financial highlights are free of material misstatement, whether due to error or fraud. The Portfolio is not required to have, nor were we engaged to perform, an audit of its internal control over financial reporting. As part of our audits, we are required to obtain an understanding of internal control over financial reporting but not for the purpose of expressing an opinion on the effectiveness of the Portfolio’s internal control over financial reporting. Accordingly, we express no such opinion.
Our audits included performing procedures to assess the risks of material misstatement of the financial statements and financial highlights, whether due to error or fraud, and performing procedures that respond to those risks. Such procedures included examining, on a test basis, evidence regarding the amounts and disclosures in the financial statements and financial highlights. Our audits also included evaluating the accounting principles used and significant estimates made by management, as well as evaluating the overall presentation of the financial statements and financial highlights. Our procedures included confirmation of securities owned as of December 31, 2021, by correspondence with the custodian and brokers; when replies were not received from brokers, we performed other auditing procedures. We believe that our audits provide a reasonable basis for our opinion.
/s/ Deloitte & Touche LLP
Boston, Massachusetts
February 23, 2022
We have served as the auditor of one or more Eaton Vance investment companies since 1959.
Eaton Vance
Tax-Managed Growth Fund 1.1
December 31, 2021
Management and Organization
Fund Management. The Trustees of Eaton Vance Mutual Funds Trust (the Trust) and Tax-Managed Growth Portfolio (the Portfolio) are responsible for the overall management and supervision of the Trust and the Portfolio’s affairs. The Board members and officers of the Trust and the Portfolio are listed below. Except as indicated, each individual has held the office shown or other offices in the same company for the last five years. Board members hold indefinite terms of office. Each Trustee holds office until his or her successor is elected and qualified, subject to a prior death, resignation, retirement, disqualification or removal. Under the terms of the Fund’s and the Portfolio’s current Trustee retirement policy, an Independent Trustee must retire and resign as a Trustee on the earlier of: (i) the first day of July following his or her 74th birthday; or (ii), with limited exception, December 31st of the 20th year in which he or she has served as a Trustee. However, if such retirement and resignation would cause the Fund or Portfolio to be out of compliance with Section 16 of the 1940 Act or any other regulations or guidance of the SEC, then such retirement and resignation will not become effective until such time as action has been taken for the Fund or Portfolio to be in compliance therewith. The “noninterested Trustees” consist of those Trustees who are not “interested persons” of the Trust and the Portfolio, as that term is defined under the 1940 Act. The business address of each Board member and officer is Two International Place, Boston, Massachusetts 02110. As used below, “BMR” refers to Boston Management and Research, “EVC” refers to Eaton Vance Corp., “EV” refers to EV LLC, “EVM” refers to Eaton Vance Management and “EVD” refers to Eaton Vance Distributors, Inc. EV is the trustee of each of EVM and BMR. Effective March 1, 2021, each of EVM, BMR, EVD and EV are indirect, wholly owned subsidiaries of Morgan Stanley. Each officer affiliated with EVM may hold a position with other EVM affiliates that is comparable to his or her position with EVM listed below. Each Trustee oversees 138 funds (with the exception of Messrs. Faust and Wennerholm and Ms. Frost who oversee 137 funds) in the Eaton Vance fund complex (including both funds and portfolios in a hub and spoke structure).
| | | | | | |
| Name and Year of Birth | | Trust/Portfolio
Position(s) | | Length of Service | | Principal Occupation(s) and Other Directorships During Past Five Years and Other Relevant Experience |
|
| Interested Trustee |
| | | |
Thomas E. Faust Jr. 1958 | | Trustee | | Since 2007 | | Chairman of Morgan Stanley Investment Management, Inc. (MSIM), member of the Board of Managers and President of EV, Chief Executive Officer of EVM and BMR, and Director of EVD. Formerly, Chairman, Chief Executive Officer and President of EVC. Mr. Faust is an interested person because of his positions with MSIM, BMR, EVM, EVD, and EV, which are affiliates of the Trust and the Portfolio, and his former position with EVC, which was an affiliate of the Trust and the Portfolio prior to March 1, 2021. Other Directorships. Formerly, Director of EVC (2007-2021) and Hexavest Inc. (investment management firm) (2012-2021). |
|
| Noninterested Trustees |
| | | |
Mark R. Fetting 1954 | | Trustee | | Since 2016 | | Private investor. Formerly held various positions at Legg Mason, Inc. (investment management firm) (2000-2012), including President, Chief Executive Officer, Director and Chairman (2008-2012), Senior Executive Vice President (2004-2008) and Executive Vice President (2001-2004). Formerly, President of Legg Mason family of funds (2001-2008). Formerly, Division President and Senior Officer of Prudential Financial Group, Inc. and related companies (investment management firm) (1991-2000). Other Directorships. None. |
| | | |
Cynthia E. Frost 1961 | | Trustee | | Since 2014 | | Private investor. Formerly, Chief Investment Officer of Brown University (university endowment) (2000-2012). Formerly, Portfolio Strategist for Duke Management Company (university endowment manager) (1995-2000). Formerly, Managing Director, Cambridge Associates (investment consulting company) (1989-1995). Formerly, Consultant, Bain and Company (management consulting firm) (1987-1989). Formerly, Senior Equity Analyst, BA Investment Management Company (1983-1985). Other Directorships. None. |
| | | |
George J. Gorman 1952 | | Chairperson of the Board and Trustee | | Since 2021 (Chairperson) and 2014 (Trustee) | | Principal at George J. Gorman LLC (consulting firm). Formerly, Senior Partner at Ernst & Young LLP (a registered public accounting firm) (1974-2009). Other Directorships. None. |
| | | |
Valerie A. Mosley 1960 | | Trustee | | Since 2014 | | Chairwoman and Chief Executive Officer of Valmo Ventures (a consulting and investment firm). Founder of Upward Wealth, Inc., dba BrightUP, a fintech platform. Formerly, Partner and Senior Vice President, Portfolio Manager and Investment Strategist at Wellington Management Company, LLP (investment management firm) (1992-2012). Formerly, Chief Investment Officer, PG Corbin Asset Management (1990-1992). Formerly worked in institutional corporate bond sales at Kidder Peabody (1986-1990). Other Directorships. Director of DraftKings, Inc. (digital sports entertainment and gaming company) (since September 2020). Director of Groupon, Inc. (e-commerce provider) (since April 2020). Director of Envestnet, Inc. (provider of intelligent systems for wealth management and financial wellness) (since 2018). Formerly, Director of Dynex Capital, Inc. (mortgage REIT) (2013-2020). |
Eaton Vance
Tax-Managed Growth Fund 1.1
December 31, 2021
Management and Organization — continued
| | | | | | |
| Name and Year of Birth | | Trust/Portfolio
Position(s) | | Length of Service | | Principal Occupation(s) and Other Directorships During Past Five Years and Other Relevant Experience |
|
| Noninterested Trustees (continued) |
| | | |
William H. Park 1947 | | Trustee | | Since 2003 | | Private investor. Formerly, Consultant (management and transactional) (2012-2014). Formerly, Chief Financial Officer, Aveon Group L.P. (investment management firm) (2010-2011). Formerly, Vice Chairman, Commercial Industrial Finance Corp. (specialty finance company) (2006-2010). Formerly, President and Chief Executive Officer, Prizm Capital Management, LLC (investment management firm) (2002-2005). Formerly, Executive Vice President and Chief Financial Officer, United Asset Management Corporation (investment management firm) (1982-2001). Formerly, Senior Manager, Price Waterhouse (now PricewaterhouseCoopers) (a registered public accounting firm) (1972-1981). Other Directorships. None. |
| | | |
Helen Frame Peters 1948 | | Trustee | | Since 2008 | | Professor of Finance, Carroll School of Management, Boston College. Formerly, Dean, Carroll School of Management, Boston College (2000-2002). Formerly, Chief Investment Officer, Fixed Income, Scudder Kemper Investments (investment management firm) (1998-1999). Formerly, Chief Investment Officer, Equity and Fixed Income, Colonial Management Associates (investment management firm) (1991-1998). Other Directorships. None. |
| | | |
Keith Quinton 1958 | | Trustee | | Since 2018 | | Private investor, researcher and lecturer. Formerly, Independent Investment Committee Member at New Hampshire Retirement System (2017-2021). Formerly, Portfolio Manager and Senior Quantitative Analyst at Fidelity Investments (investment management firm) (2001-2014). Other Directorships. Formerly, Director (2016-2021) and Chairman (2019-2021) of New Hampshire Municipal Bond Bank. |
| | | |
Marcus L. Smith 1966 | | Trustee | | Since 2018 | | Private investor. Formerly, Portfolio Manager at MFS Investment Management (investment management firm) (1994-2017). Other Directorships. Director of First Industrial Realty Trust, Inc. (an industrial REIT) (since 2021). Director of MSCI Inc. (global provider of investment decision support tools) (since 2017). Formerly, Director of DCT Industrial Trust Inc. (logistics real estate company) (2017-2018). |
| | | |
Susan J. Sutherland 1957 | | Trustee | | Since 2015 | | Private investor. Director of Ascot Group Limited and certain of its subsidiaries (insurance and reinsurance) (since 2017). Formerly, Director of Hagerty Holding Corp. (insurance) (2015-2018) and Montpelier Re Holdings Ltd. (insurance and reinsurance) (2013-2015). Formerly, Associate, Counsel and Partner at Skadden, Arps, Slate, Meagher & Flom LLP (law firm) (1982-2013). Other Directorships. Director of Kairos Acquisition Corp. (insurance/InsurTech acquisition company) (since 2021). |
| | | |
Scott E. Wennerholm 1959 | | Trustee | | Since 2016 | | Private investor. Formerly, Trustee at Wheelock College (postsecondary institution) (2012-2018). Formerly, Consultant at GF Parish Group (executive recruiting firm) (2016-2017). Formerly, Chief Operating Officer and Executive Vice President at BNY Mellon Asset Management (investment management firm) (2005-2011). Formerly, Chief Operating Officer and Chief Financial Officer at Natixis Global Asset Management (investment management firm) (1997-2004). Formerly, Vice President at Fidelity Investments Institutional Services (investment management firm) (1994-1997). Other Directorships. None. |
| | | | | | |
| Name and Year of Birth | | Trust/Portfolio
Position(s) | | Length of Service | | Principal Occupation(s) During Past Five Years |
| |
| Principal Officers who are not Trustees | | |
| | | |
Eric A. Stein 1980 | | President of the Trust | | Since 2020 | | Vice President and Chief Investment Officer, Fixed Income of EVM and BMR. Prior to November 1, 2020, Mr. Stein was a co-Director of Eaton Vance’s Global Income Investments. Also Vice President of Calvert Research and Management (“CRM”). |
| | | |
Edward J. Perkin 1972 | | President of the Portfolio | | Since 2014 | | Chief Equity Investment Officer and Vice President of EVM and BMR since 2014. Also Vice President of CRM. |
Eaton Vance
Tax-Managed Growth Fund 1.1
December 31, 2021
Management and Organization — continued
| | | | | | |
| Name and Year of Birth | | Trust/Portfolio
Position(s) | | Length of Service | | Principal Occupation(s) During Past Five Years |
| |
| Principal Officers who are not Trustees (continued) | | |
| | | |
Deidre E. Walsh 1971 | | Vice President and Chief Legal Officer | | Since 2009 | | Vice President of EVM and BMR. Also Vice President of CRM. |
| | | |
James F. Kirchner 1967 | | Treasurer | | Since 2007 | | Vice President of EVM and BMR. Also Vice President of CRM. |
| | | |
Jill R. Damon 1984 | | Secretary | | Since 2022 | | Vice President of EVM and BMR since 2017. Formerly, associate at Dechert LLP (2009-2017). |
| | | |
Richard F. Froio 1968 | | Chief Compliance Officer | | Since 2017 | | Vice President of EVM and BMR since 2017. Formerly, Deputy Chief Compliance Officer (Adviser/Funds) and Chief Compliance Officer (Distribution) at PIMCO (2012-2017) and Managing Director at BlackRock/Barclays Global Investors (2009-2012). |
The SAI for the Fund includes additional information about the Trustees and officers of the Trust and the Portfolio and can be obtained without charge on Eaton Vance’s website at www.eatonvance.com or by calling 1-800-262-1122.
Eaton Vance
Tax-Managed Growth Fund 1.2
December 31, 2021
Management and Organization
Fund Management. The Trustees of Eaton Vance Mutual Funds Trust (the Trust) and Tax-Managed Growth Portfolio (the Portfolio) are responsible for the overall management and supervision of the Trust and the Portfolio’s affairs. The Board members and officers of the Trust and the Portfolio are listed below. Except as indicated, each individual has held the office shown or other offices in the same company for the last five years. Board members hold indefinite terms of office. Each Trustee holds office until his or her successor is elected and qualified, subject to a prior death, resignation, retirement, disqualification or removal. Under the terms of the Fund’s and the Portfolio’s current Trustee retirement policy, an Independent Trustee must retire and resign as a Trustee on the earlier of: (i) the first day of July following his or her 74th birthday; or (ii), with limited exception, December 31st of the 20th year in which he or she has served as a Trustee. However, if such retirement and resignation would cause the Fund or Portfolio to be out of compliance with Section 16 of the 1940 Act or any other regulations or guidance of the SEC, then such retirement and resignation will not become effective until such time as action has been taken for the Fund or Portfolio to be in compliance therewith. The “noninterested Trustees” consist of those Trustees who are not “interested persons” of the Trust and the Portfolio, as that term is defined under the 1940 Act. The business address of each Board member and officer is Two International Place, Boston, Massachusetts 02110. As used below, “BMR” refers to Boston Management and Research, “EVC” refers to Eaton Vance Corp., “EV” refers to EV LLC, “EVM” refers to Eaton Vance Management and “EVD” refers to Eaton Vance Distributors, Inc. EV is the trustee of each of EVM and BMR. Effective March 1, 2021, each of EVM, BMR, EVD and EV are indirect, wholly owned subsidiaries of Morgan Stanley. Each officer affiliated with EVM may hold a position with other EVM affiliates that is comparable to his or her position with EVM listed below. Each Trustee oversees 138 funds (with the exception of Messrs. Faust and Wennerholm and Ms. Frost who oversee 137 funds) in the Eaton Vance fund complex (including both funds and portfolios in a hub and spoke structure).
| | | | | | |
| Name and Year of Birth | | Trust/Portfolio
Position(s) | | Length of Service | | Principal Occupation(s) and Other Directorships During Past Five Years and Other Relevant Experience |
|
| Interested Trustee |
| | | |
Thomas E. Faust Jr. 1958 | | Trustee | | Since 2007 | | Chairman of Morgan Stanley Investment Management, Inc. (MSIM), member of the Board of Managers and President of EV, Chief Executive Officer of EVM and BMR, and Director of EVD. Formerly, Chairman, Chief Executive Officer and President of EVC. Mr. Faust is an interested person because of his positions with MSIM, BMR, EVM, EVD, and EV, which are affiliates of the Trust and the Portfolio, and his former position with EVC, which was an affiliate of the Trust and the Portfolio prior to March 1, 2021. Other Directorships. Formerly, Director of EVC (2007-2021) and Hexavest Inc. (investment management firm) (2012-2021). |
|
| Noninterested Trustees |
| | | |
Mark R. Fetting 1954 | | Trustee | | Since 2016 | | Private investor. Formerly held various positions at Legg Mason, Inc. (investment management firm) (2000-2012), including President, Chief Executive Officer, Director and Chairman (2008-2012), Senior Executive Vice President (2004-2008) and Executive Vice President (2001-2004). Formerly, President of Legg Mason family of funds (2001-2008). Formerly, Division President and Senior Officer of Prudential Financial Group, Inc. and related companies (investment management firm) (1991-2000). Other Directorships. None. |
| | | |
Cynthia E. Frost 1961 | | Trustee | | Since 2014 | | Private investor. Formerly, Chief Investment Officer of Brown University (university endowment) (2000-2012). Formerly, Portfolio Strategist for Duke Management Company (university endowment manager) (1995-2000). Formerly, Managing Director, Cambridge Associates (investment consulting company) (1989-1995). Formerly, Consultant, Bain and Company (management consulting firm) (1987-1989). Formerly, Senior Equity Analyst, BA Investment Management Company (1983-1985). Other Directorships. None. |
| | | |
George J. Gorman 1952 | | Chairperson of the Board and Trustee | | Since 2021 (Chairperson) and 2014 (Trustee) | | Principal at George J. Gorman LLC (consulting firm). Formerly, Senior Partner at Ernst & Young LLP (a registered public accounting firm) (1974-2009). Other Directorships. None. |
| | | |
Valerie A. Mosley 1960 | | Trustee | | Since 2014 | | Chairwoman and Chief Executive Officer of Valmo Ventures (a consulting and investment firm). Founder of Upward Wealth, Inc., dba BrightUP, a fintech platform. Formerly, Partner and Senior Vice President, Portfolio Manager and Investment Strategist at Wellington Management Company, LLP (investment management firm) (1992-2012). Formerly, Chief Investment Officer, PG Corbin Asset Management (1990-1992). Formerly worked in institutional corporate bond sales at Kidder Peabody (1986-1990). Other Directorships. Director of DraftKings, Inc. (digital sports entertainment and gaming company) (since September 2020). Director of Groupon, Inc. (e-commerce provider) (since April 2020). Director of Envestnet, Inc. (provider of intelligent systems for wealth management and financial wellness) (since 2018). Formerly, Director of Dynex Capital, Inc. (mortgage REIT) (2013-2020). |
Eaton Vance
Tax-Managed Growth Fund 1.2
December 31, 2021
Management and Organization — continued
| | | | | | |
| Name and Year of Birth | | Trust/Portfolio
Position(s) | | Length of Service | | Principal Occupation(s) and Other Directorships During Past Five Years and Other Relevant Experience |
|
| Noninterested Trustees (continued) |
| | | |
William H. Park 1947 | | Trustee | | Since 2003 | | Private investor. Formerly, Consultant (management and transactional) (2012-2014). Formerly, Chief Financial Officer, Aveon Group L.P. (investment management firm) (2010-2011). Formerly, Vice Chairman, Commercial Industrial Finance Corp. (specialty finance company) (2006-2010). Formerly, President and Chief Executive Officer, Prizm Capital Management, LLC (investment management firm) (2002-2005). Formerly, Executive Vice President and Chief Financial Officer, United Asset Management Corporation (investment management firm) (1982-2001). Formerly, Senior Manager, Price Waterhouse (now PricewaterhouseCoopers) (a registered public accounting firm) (1972-1981). Other Directorships. None. |
| | | |
Helen Frame Peters 1948 | | Trustee | | Since 2008 | | Professor of Finance, Carroll School of Management, Boston College. Formerly, Dean, Carroll School of Management, Boston College (2000-2002). Formerly, Chief Investment Officer, Fixed Income, Scudder Kemper Investments (investment management firm) (1998-1999). Formerly, Chief Investment Officer, Equity and Fixed Income, Colonial Management Associates (investment management firm) (1991-1998). Other Directorships. None. |
| | | |
Keith Quinton 1958 | | Trustee | | Since 2018 | | Private investor, researcher and lecturer. Formerly, Independent Investment Committee Member at New Hampshire Retirement System (2017-2021). Formerly, Portfolio Manager and Senior Quantitative Analyst at Fidelity Investments (investment management firm) (2001-2014). Other Directorships. Formerly, Director (2016-2021) and Chairman (2019-2021) of New Hampshire Municipal Bond Bank. |
| | | |
Marcus L. Smith 1966 | | Trustee | | Since 2018 | | Private investor. Formerly, Portfolio Manager at MFS Investment Management (investment management firm) (1994-2017). Other Directorships. Director of First Industrial Realty Trust, Inc. (an industrial REIT) (since 2021). Director of MSCI Inc. (global provider of investment decision support tools) (since 2017). Formerly, Director of DCT Industrial Trust Inc. (logistics real estate company) (2017-2018). |
| | | |
Susan J. Sutherland 1957 | | Trustee | | Since 2015 | | Private investor. Director of Ascot Group Limited and certain of its subsidiaries (insurance and reinsurance) (since 2017). Formerly, Director of Hagerty Holding Corp. (insurance) (2015-2018) and Montpelier Re Holdings Ltd. (insurance and reinsurance) (2013-2015). Formerly, Associate, Counsel and Partner at Skadden, Arps, Slate, Meagher & Flom LLP (law firm) (1982-2013). Other Directorships. Director of Kairos Acquisition Corp. (insurance/InsurTech acquisition company) (since 2021). |
| | | |
Scott E. Wennerholm 1959 | | Trustee | | Since 2016 | | Private investor. Formerly, Trustee at Wheelock College (postsecondary institution) (2012-2018). Formerly, Consultant at GF Parish Group (executive recruiting firm) (2016-2017). Formerly, Chief Operating Officer and Executive Vice President at BNY Mellon Asset Management (investment management firm) (2005-2011). Formerly, Chief Operating Officer and Chief Financial Officer at Natixis Global Asset Management (investment management firm) (1997-2004). Formerly, Vice President at Fidelity Investments Institutional Services (investment management firm) (1994-1997). Other Directorships. None. |
| | | | | | |
| Name and Year of Birth | | Trust/Portfolio
Position(s) | | Length of Service | | Principal Occupation(s) During Past Five Years |
| |
| Principal Officers who are not Trustees | | |
| | | |
Eric A. Stein 1980 | | President of the Trust | | Since 2020 | | Vice President and Chief Investment Officer, Fixed Income of EVM and BMR. Prior to November 1, 2020, Mr. Stein was a co-Director of Eaton Vance’s Global Income Investments. Also Vice President of Calvert Research and Management (“CRM”). |
| | | |
Edward J. Perkin 1972 | | President of the Portfolio | | Since 2014 | | Chief Equity Investment Officer and Vice President of EVM and BMR since 2014. Also Vice President of CRM. |
Eaton Vance
Tax-Managed Growth Fund 1.2
December 31, 2021
Management and Organization — continued
| | | | | | |
| Name and Year of Birth | | Trust/Portfolio
Position(s) | | Length of Service | | Principal Occupation(s) During Past Five Years |
| |
| Principal Officers who are not Trustees (continued) | | |
| | | |
Deidre E. Walsh 1971 | | Vice President and Chief Legal Officer | | Since 2009 | | Vice President of EVM and BMR. Also Vice President of CRM. |
| | | |
James F. Kirchner 1967 | | Treasurer | | Since 2007 | | Vice President of EVM and BMR. Also Vice President of CRM. |
| | | |
Jill R. Damon 1984 | | Secretary | | Since 2022 | | Vice President of EVM and BMR since 2017. Formerly, associate at Dechert LLP (2009-2017). |
| | | |
Richard F. Froio 1968 | | Chief Compliance Officer | | Since 2017 | | Vice President of EVM and BMR since 2017. Formerly, Deputy Chief Compliance Officer (Adviser/Funds) and Chief Compliance Officer (Distribution) at PIMCO (2012-2017) and Managing Director at BlackRock/Barclays Global Investors (2009-2012). |
The SAI for the Fund includes additional information about the Trustees and officers of the Trust and the Portfolio and can be obtained without charge on Eaton Vance’s website at www.eatonvance.com or by calling 1-800-262-1122.
Eaton Vance Funds
| | |
| Privacy Notice | | April 2021 |
| | |
| |
| FACTS | | WHAT DOES EATON VANCE DO WITH YOUR
PERSONAL INFORMATION? |
| | | |
| |
| | |
| Why? | | Financial companies choose how they share your personal information. Federal law gives consumers the right to limit some but not all sharing. Federal law also requires us to tell you how we collect, share, and protect your personal information. Please read this notice carefully to understand what we do. |
| | |
| | | |
| What? | | The types of personal information we collect and share depend on the product or service you have with us. This information can include: ∎ Social Security number and income ∎ investment experience and risk tolerance ∎ checking account number and wire transfer instructions |
| | |
| | | |
| How? | | All financial companies need to share customers’ personal information to run their everyday business. In the section below, we list the reasons financial companies can share their customers’ personal information; the reasons Eaton Vance chooses to share; and whether you can limit this sharing. |
| | |
| | | |
| | | | |
Reasons we can share your
personal information | | Does Eaton Vance share? | | Can you limit this sharing? |
| For our everyday business purposes — such as to process your transactions, maintain your account(s), respond to court orders and legal investigations, or report to credit bureaus | | Yes | | No |
| For our marketing purposes — to offer our products and services to you | | Yes | | No |
| For joint marketing with other financial companies | | No | | We don’t share |
| For our investment management affiliates’ everyday business purposes — information about your transactions, experiences, and creditworthiness | | Yes | | Yes |
| For our affiliates’ everyday business purposes — information about your transactions and experiences | | Yes | | No |
| For our affiliates’ everyday business purposes — information about your creditworthiness | | No | | We don’t share |
| For our investment management affiliates to market to you | | Yes | | Yes |
| For our affiliates to market to you | | No | | We don’t share |
| For nonaffiliates to market to you | | No | | We don’t share |
| | |
| To limit our sharing | | Call toll-free 1-800-262-1122 or email: EVPrivacy@eatonvance.com Please note: If you are a new customer, we can begin sharing your information 30 days from the date we sent this notice. When you are no longer our customer, we continue to share your information as described in this notice. However, you can contact us at any time to limit our sharing. |
| | |
| | | |
| | |
| Questions? | | Call toll-free 1-800-262-1122 or email: EVPrivacy@eatonvance.com |
| | |
| | | |
Eaton Vance Funds
| | |
| Privacy Notice — continued | | April 2021 |
| | |
| Who we are |
| Who is providing this notice? | | Eaton Vance Management, Eaton Vance Distributors, Inc., Eaton Vance Trust Company, Eaton Vance Management (International) Limited, Eaton Vance Advisers International Ltd., Eaton Vance Global Advisors Limited, Eaton Vance Management’s Real Estate Investment Group, Boston Management and Research, Calvert Research and Management, Eaton Vance and Calvert Fund Families and our investment advisory affiliates (“Eaton Vance”) (see Investment Management Affiliates definition below) |
| What we do |
| How does Eaton Vance protect my personal information? | | To protect your personal information from unauthorized access and use, we use security measures that comply with federal law. These measures include computer safeguards and secured files and buildings. We have policies governing the proper handling of customer information by personnel and requiring third parties that provide support to adhere to appropriate security standards with respect to such information. |
| How does Eaton Vance collect my personal information? | | We collect your personal information, for example, when you ∎ open an account or make deposits or withdrawals from your account ∎ buy securities from us or make a wire transfer ∎ give us your contact information We also collect your personal information from others, such as credit bureaus, affiliates, or other companies. |
| Why can’t I limit all sharing? | | Federal law gives you the right to limit only ∎ sharing for affiliates’ everyday business purposes — information about your creditworthiness ∎ affiliates from using your information to market to you ∎ sharing for nonaffiliates to market to you State laws and individual companies may give you additional rights to limit sharing. See below for more on your rights under state law. |
| Definitions |
| Investment Management Affiliates | | Eaton Vance Investment Management Affiliates include registered investment advisers, registered broker-dealers, and registered and unregistered funds. Investment Management Affiliates does not include entities associated with Morgan Stanley Wealth Management, such as Morgan Stanley Smith Barney LLC and Morgan Stanley & Co. |
| Affiliates | | Companies related by common ownership or control. They can be financial and nonfinancial companies. ∎ Our affiliates include companies with a Morgan Stanley name and financial companies such as Morgan Stanley Smith Barney LLC and Morgan Stanley & Co. |
| Nonaffiliates | | Companies not related by common ownership or control. They can be financial and nonfinancial companies. ∎ Eaton Vance does not share with nonaffiliates so they can market to you. |
| Joint marketing | | A formal agreement between nonaffiliated financial companies that together market financial products or services to you. ∎ Eaton Vance doesn’t jointly market. |
| Other important information |
Vermont: Except as permitted by law, we will not share personal information we collect about Vermont residents with Nonaffiliates unless you provide us with your written consent to share such information. California: Except as permitted by law, we will not share personal information we collect about California residents with Nonaffiliates and we will limit sharing such personal information with our Affiliates to comply with California privacy laws that apply to us. |
Eaton Vance Funds
IMPORTANT NOTICES
Delivery of Shareholder Documents. The Securities and Exchange Commission (SEC) permits funds to deliver only one copy of shareholder documents, including prospectuses, proxy statements and shareholder reports, to fund investors with multiple accounts at the same residential or post office box address. This practice is often called “householding” and it helps eliminate duplicate mailings to shareholders. Eaton Vance, or your financial intermediary, may household the mailing of your documents indefinitely unless you instruct Eaton Vance, or your financial intermediary, otherwise. If you would prefer that your Eaton Vance documents not be householded, please contact Eaton Vance at 1-800-262-1122, or contact your financial intermediary. Your instructions that householding not apply to delivery of your Eaton Vance documents will typically be effective within 30 days of receipt by Eaton Vance or your financial intermediary.
Portfolio Holdings. Each Eaton Vance Fund and its underlying Portfolio(s) (if applicable) files a schedule of portfolio holdings on Part F to Form N-PORT with the SEC. Certain information filed on Form N-PORT may be viewed on the Eaton Vance website at www.eatonvance.com, by calling Eaton Vance at 1-800-262-1122 or in the EDGAR database on the SEC’s website at www.sec.gov.
Proxy Voting. From time to time, funds are required to vote proxies related to the securities held by the funds. The Eaton Vance Funds or their underlying Portfolios (if applicable) vote proxies according to a set of policies and procedures approved by the Funds’ and Portfolios’ Boards. You may obtain a description of these policies and procedures and information on how the Funds or Portfolios voted proxies relating to portfolio securities during the most recent 12-month period ended June 30, without charge, upon request, by calling 1-800-262-1122 and by accessing the SEC’s website at www.sec.gov.
Investment Adviser of Tax-Managed Growth Portfolio
Boston Management and Research
Two International Place
Boston, MA 02110
Investment Adviser and Administrator of Eaton Vance Tax-Managed Growth Funds 1.1 and 1.2
Eaton Vance Management
Two International Place
Boston, MA 02110
Principal Underwriter*
Eaton Vance Distributors, Inc.
Two International Place
Boston, MA 02110
(617) 482-8260
Custodian
State Street Bank and Trust Company
State Street Financial Center, One Lincoln Street
Boston, MA 02111
Transfer Agent
BNY Mellon Investment Servicing (US) Inc.
Attn: Eaton Vance Funds
P.O. Box 9653
Providence, RI 02940-9653
(800) 262-1122
Independent Registered Public Accounting Firm
Deloitte & Touche LLP
200 Berkeley Street
Boston, MA 02116-5022
Fund Offices
Two International Place
Boston, MA 02110
| * | FINRA BrokerCheck. Investors may check the background of their Investment Professional by contacting the Financial Industry Regulatory Authority (FINRA). FINRA BrokerCheck is a free tool to help investors check the professional background of current and former FINRA-registered securities firms and brokers. FINRA BrokerCheck is available by calling 1-800-289-9999 and at www.FINRA.org. The FINRA BrokerCheck brochure describing this program is available to investors at www.FINRA.org. |
4966 12.31.21

Parametric
Commodity Strategy Fund
Annual Report
December 31, 2021

Commodity Futures Trading Commission Registration. The Commodity Futures Trading Commission (“CFTC”) has adopted regulations that subject registered investment companies and advisers to regulation by the CFTC if a fund invests more than a prescribed level of its assets in certain CFTC-regulated instruments (including futures, certain options and swap agreements) or markets itself as providing investment exposure to such instruments. The adviser and Parametric Portfolio Associates LLC (Parametric), the sub-adviser to the Fund, are registered with the CFTC as commodity pool operators and commodity trading advisors. As the “commodity pool operator” of the Fund, the adviser has claimed relief under the Commodity Exchange Act from certain reporting and recordkeeping requirements.
Fund shares are not insured by the FDIC and are not deposits or other obligations of, or guaranteed by, any depository institution. Shares are subject to investment risks, including possible loss of principal invested.
This report must be preceded or accompanied by a current summary prospectus or prospectus. Before investing, investors should consider carefully the investment objective, risks, and charges and expenses of a mutual fund. This and other important information is contained in the summary prospectus and prospectus, which can be obtained from a financial intermediary. Prospective investors should read the prospectus carefully before investing. For further information, please call 1-800-260-0761.
Annual Report December 31, 2021
Parametric
Commodity Strategy Fund
Parametric
Commodity Strategy Fund
December 31, 2021
Management’s Discussion of Fund Performance1
Economic and Market Conditions
The commodity asset class advanced in 2021 against a backdrop of global economic recovery from the COVID-19 pandemic and rising inflation. For the 12-month period ended December 31, 2021, the Bloomberg Commodity Index Total Return (the Index) returned 27.11%. Broad gains across energy, industrial metals, and agriculture commodities more than offset moderate weakness in the precious metals sector during the period.
The partial resumption of travel and the reopening of businesses in 2021 were powerful catalysts that fueled price growth within the energy complex. With Organization of the Petroleum Exporting Countries Plus (OPEC+) member nations only gradually returning supply of crude oil to the market, global inventories declined, which helped sustain a furious rally in prices. Natural gas prices also rose significantly, while exhibiting the highest volatility of any commodity during the period as supply shortages in Europe and Asia came up against a winter demand surge.
Similarly, industrial metals collectively advanced during the period. Copper, nickel, zinc, aluminum, and lead — all essential for the clean energy transition — burst through decade highs as demand from electric vehicle battery and renewable energy technology manufacturing provided a tailwind. On the other hand, precious metals struggled to advance amid a strengthening U.S. dollar. Gold, in particular, often touted as a hedge against rising prices, failed to capitalize despite rising inflation during the period.
Agriculture was a strong performer in light of rising freight costs, dwindling supplies, and an energy crunch that pushed food prices close to record highs. Wheat and corn provided double-digit returns during the period as drought conditions in key growing regions of the U.S. and Brazil drove prices higher. In addition, severe weather in Brazil, the world’s largest arabica bean supplier, decimated coffee plantations and contributed to a 64% surge in coffee prices during the period.
Fund Performance
For the 12-month period ended December 31, 2021, Parametric Commodity Strategy Fund (the Fund) returned 29.60% for Investor Class shares at net asset value (NAV), outperforming its benchmark, the Index, which returned 27.11%.
An underweight position in gold contributed to the Fund’s relative performance versus the Index during the period. Gold prices slid on a stronger U.S. dollar and the threat of a pullback in monetary stimulus by the world’s major central banks. The Fund’s overweight exposure to gasoline contributed to relative performance as strength in the crude oil market boosted downstream gasoline prices. The Fund’s inclusion of tin, an out-of-Index exposure, also contributed to performance relative to the Index during the period.
The main detractor from the Fund’s relative performance was its underweight position in crude oil. Crude oil prices continued to recover from the effects of the COVID-19 pandemic with loosened mobility restrictions and global economic growth driving petroleum demand higher during the period. An overweight exposure to silver also weighed on relative returns as prices followed a similar trajectory to gold. Additionally, the Fund’s inclusion of cocoa — an out-of-Index position — detracted from performance relative to the Index during the period.
See Endnotes and Additional Disclosures in this report.
Past performance is no guarantee of future results. Returns are historical and are calculated by determining the percentage change in net asset value (NAV) or offering price (as applicable) with all distributions reinvested. Investment return and principal value will fluctuate so that shares, when redeemed, may be worth more or less than their original cost. Performance for periods less than or equal to one year is cumulative. Performance is for the stated time period only; due to market volatility, current Fund performance may be lower or higher than the quoted return. For performance as of the most recent month-end, please refer to eatonvance.com.
Parametric
Commodity Strategy Fund
December 31, 2021
Performance2,3
Portfolio Manager(s) Thomas C. Seto and Gregory J. Liebl, CFA, each of Parametric Portfolio Associates LLC
| | | | | | | | | | | | | | | | | | | | |
| % Average Annual Total Returns | | Class
Inception Date | | | Performance
Inception Date | | | One Year | | | Five Years | | | Ten Years | |
| | | | | |
Investor Class at NAV | | | 01/03/2012 | | | | 05/25/2011 | | | | 29.60 | % | | | 8.01 | % | | | 0.09 | % |
Institutional Class at NAV | | | 05/25/2011 | | | | 05/25/2011 | | | | 29.80 | | | | 8.25 | | | | 0.31 | |
|
| |
| | | | | |
Bloomberg Commodity Index Total Return | | | — | | | | — | | | | 27.11 | % | | | 3.66 | % | | | –2.85 | % |
| | | | | |
| % Total Annual Operating Expense Ratios4 | | | | | | | | | | | Investor
Class | | | Institutional
Class | |
| | | | | |
| | | | | | | | | | | | | | | 0.94 | % | | | 0.69 | % |
Growth of $10,0003
This graph shows the change in value of a hypothetical investment of $10,000 in Investor Class of the Fund for the period indicated. For comparison, the same investment is shown in the indicated index.
| | | | | | | | | | | | | | | | |
| Growth of Investment | | Amount Invested | | | Period Beginning | | | At NAV | | | With Maximum Sales Charge | |
| | | | |
Institutional Class | | | $50,000 | | | | 12/31/2011 | | | | $51,596 | | | | N.A. | |
See Endnotes and Additional Disclosures in this report.
Past performance is no guarantee of future results. Returns are historical and are calculated by determining the percentage change in net asset value (NAV) or offering price (as applicable) with all distributions reinvested. Investment return and principal value will fluctuate so that shares, when redeemed, may be worth more or less than their original cost. Performance for periods less than or equal to one year is cumulative. Performance is for the stated time period only; due to market volatility, current Fund performance may be lower or higher than the quoted return. For performance as of the most recent month-end, please refer to eatonvance.com.
Parametric
Commodity Strategy Fund
December 31, 2021
Fund Profile
Commodity Exposure (% of net assets)5
| | | | |
Agriculture | | | 26.19 | % |
| |
Soybean Oil | | | 3.65 | |
| |
Corn | | | 3.61 | |
| |
Coffee | | | 3.60 | |
| |
Soybean | | | 3.60 | |
| |
Cotton | | | 1.86 | |
| |
Cocoa | | | 1.85 | |
| |
Soybean Meal | | | 1.80 | |
| |
Wheat | | | 1.79 | |
| |
Sugar | | | 1.76 | |
| |
Robusta Coffee | | | 0.91 | |
| |
White Sugar | | | 0.89 | |
| |
Kansas Wheat | | | 0.87 | |
| | | | |
Energy | | | 25.06 | % |
| |
RBOB Gasoline | | | 7.20 | |
| |
Natural Gas | | | 7.03 | |
| |
Gasoil | | | 3.61 | |
| |
Heating Oil | | | 3.58 | |
| |
WTI Crude Oil | | | 1.82 | |
| |
Brent Crude Oil | | | 1.82 | |
| | | | |
Industrial Metals | | | 24.53 | % |
| |
Aluminum | | | 7.23 | |
| |
Nickel | | | 3.68 | |
| |
Zinc | | | 3.66 | |
| |
New York Copper | | | 3.64 | |
| |
Copper | | | 3.62 | |
| |
Lead | | | 1.81 | |
| |
Tin | | | 0.89 | |
| | | | |
Precious Metals | | | 18.17 | % |
| |
Gold | | | 7.32 | |
| |
Silver | | | 7.28 | |
| |
Platinum | | | 1.82 | |
| |
Palladium | | | 1.75 | |
| | | | |
Livestock | | | 6.37 | % |
| |
Live Cattle | | | 3.65 | |
| |
Lean Hogs | | | 1.79 | |
| |
Feeder Cattle | | | 0.93 | |
Asset Allocation (% of net assets)6
| * | Short-Term Investments are held as collateral for the Fund’s futures contracts positions. |
See Endnotes and Additional Disclosures in this report.
Parametric
Commodity Strategy Fund
December 31, 2021
Endnotes and Additional Disclosures
| 1 | The views expressed in this report are those of the portfolio manager(s) and are current only through the date stated at the top of this page. These views are subject to change at any time based upon market or other conditions, and Eaton Vance and the Fund(s) disclaim any responsibility to update such views. These views may not be relied upon as investment advice and, because investment decisions are based on many factors, may not be relied upon as an indication of trading intent on behalf of any Eaton Vance fund. This commentary may contain statements that are not historical facts, referred to as “forward-looking statements.” The Fund’s actual future results may differ significantly from those stated in any forward-looking statement, depending on factors such as changes in securities or financial markets or general economic conditions, the volume of sales and purchases of Fund shares, the continuation of investment advisory, administrative and service contracts, and other risks discussed from time to time in the Fund’s filings with the Securities and Exchange Commission. |
| 2 | Bloomberg Commodity Index Total Return is designed to provide diversified commodity exposure, with weightings based on each underlying commodity’s liquidity and economic significance. Unless otherwise stated, index returns do not reflect the effect of any applicable sales charges, commissions, expenses, taxes or leverage, as applicable. It is not possible to invest directly in an index. |
| 3 | Returns are historical and are calculated by determining the percentage change in net asset value (NAV) with all distributions reinvested. Unless otherwise stated, performance does not reflect the deduction of taxes on Fund distributions or redemptions of Fund shares. |
Performance prior to the inception date of a class may be linked to the performance of an older class of the Fund. This linked performance is adjusted for any applicable sales charge, but is not adjusted for class expense differences. If adjusted for such differences, the performance would be different. The performance of Investor Class is linked to Institutional Class. Performance presented in the Financial Highlights included in the financial statements is not linked.
| 4 | Source: Fund prospectus. The expense ratios for the current reporting period can be found in the Financial Highlights section of this report. |
| 5 | Commodity Exposure reflects the Fund’s net exposure to commodities through its investment in commodity-linked derivative instruments. |
| 6 | Other Net Assets represents other assets less liabilities and includes any investment type that represents less than 1% of net assets. |
Fund profile subject to change due to active management.
Parametric
Commodity Strategy Fund
December 31, 2021
Fund Expenses
Example: As a Fund shareholder, you incur two types of costs: (1) transaction costs, including sales charges (loads) on purchases and redemption fees (if applicable); and (2) ongoing costs, including management fees; distribution and/or service fees; and other Fund expenses. This Example is intended to help you understand your ongoing costs (in dollars) of Fund investing and to compare these costs with the ongoing costs of investing in other mutual funds. The Example is based on an investment of $1,000 invested at the beginning of the period and held for the entire period (July 1, 2021 – December 31, 2021).
Actual Expenses: The first section of the table below provides information about actual account values and actual expenses. You may use the information in this section, together with the amount you invested, to estimate the expenses that you paid over the period. Simply divide your account value by $1,000 (for example, an $8,600 account value divided by $1,000 = 8.6), then multiply the result by the number in the first section under the heading entitled “Expenses Paid During Period” to estimate the expenses you paid on your account during this period.
Hypothetical Example for Comparison Purposes: The second section of the table below provides information about hypothetical account values and hypothetical expenses based on the actual Fund expense ratio and an assumed rate of return of 5% per year (before expenses), which is not the actual Fund return. The hypothetical account values and expenses may not be used to estimate the actual ending account balance or expenses you paid for the period. You may use this information to compare the ongoing costs of investing in your Fund and other funds. To do so, compare this 5% hypothetical example with the 5% hypothetical examples that appear in the shareholder reports of the other funds.
Please note that the expenses shown in the table are meant to highlight your ongoing costs only and do not reflect any transactional costs, such as sales charges (loads) or redemption fees (if applicable). Therefore, the second section of the table is useful in comparing ongoing costs only, and will not help you determine the relative total costs of owning different funds. In addition, if these transactional costs were included, your costs would be higher.
| | | | | | | | | | | | | | | | |
| | | Beginning
Account Value
(7/1/21) | | | Ending
Account Value
(12/31/21) | | | Expenses Paid
During Period*
(7/1/21 – 12/31/21) | | | Annualized
Expense
Ratio | |
| | | | |
Actual | | | | | | | | | | | | | | | | |
Investor Class | | $ | 1,000.00 | | | $ | 1,070.60 | | | $ | 4.75 | | | | 0.91 | % |
Institutional Class | | $ | 1,000.00 | | | $ | 1,070.50 | | | $ | 3.44 | | | | 0.66 | % |
| | | | | |
Hypothetical | | | | | | | | | | | | | | | | |
(5% return per year before expenses) | | | | | | | | | | | | | | | | |
Investor Class | | $ | 1,000.00 | | | $ | 1,020.62 | | | $ | 4.63 | | | | 0.91 | % |
Institutional Class | | $ | 1,000.00 | | | $ | 1,021.88 | | | $ | 3.36 | | | | 0.66 | % |
| * | Expenses are equal to the Fund’s annualized expense ratio for the indicated Class, multiplied by the average account value over the period, multiplied by 184/365 (to reflect the one-half year period). The Example assumes that the $1,000 was invested at the net asset value per share determined at the close of business on June 30, 2021. |
Parametric
Commodity Strategy Fund
December 31, 2021
Consolidated Portfolio of Investments
| | | | | | | | |
| Short-Term Investments — 100.9% | |
|
| U.S. Treasury Obligations — 89.6% | |
| Security | | Principal
Amount
(000’s omitted) | | | Value | |
| | |
| U.S. Treasury Bill: | | | | | | |
| | |
0.00%, 1/6/22 | | $ | 30,000 | | | $ | 30,000,002 | |
| | |
0.00%, 1/13/22 | | | 130,000 | | | | 129,999,639 | |
| | |
0.00%, 1/27/22 | | | 19,000 | | | | 18,999,715 | |
| | |
0.00%, 2/24/22 | | | 20,000 | | | | 19,999,350 | |
| | |
0.00%, 7/14/22(1) | | | 118,000 | | | | 117,889,762 | |
| | |
0.00%, 8/11/22(1) | | | 28,250 | | | | 28,216,767 | |
| | |
0.00%, 11/3/22(1) | | | 84,000 | | | | 83,816,046 | |
| | |
0.00%, 12/1/22 | | | 34,000 | | | | 33,912,518 | |
| | |
0.00%, 12/29/22 | | | 15,000 | | | | 14,943,158 | |
| | |
| U.S. Treasury Inflation-Protected Note: | | | | | | |
| | |
0.125%, 1/15/22(2) | | | 8,552 | | | | 8,569,682 | |
| | |
0.125%, 4/15/22(2) | | | 14,213 | | | | 14,420,673 | |
| | |
0.125%, 7/15/22(2) | | | 45,452 | | | | 46,575,596 | |
| | |
| U.S. Treasury Note: | | | | | | |
| | |
0.125%, 5/31/22 | | | 10,000 | | | | 9,998,641 | |
| | |
0.125%, 6/30/22 | | | 12,000 | | | | 11,995,607 | |
| | |
0.375%, 3/31/22 | | | 15,000 | | | | 15,010,356 | |
| | |
1.50%, 1/31/22 | | | 40,000 | | | | 40,044,119 | |
| | |
1.50%, 8/15/22 | | | 24,000 | | | | 24,185,432 | |
| | |
1.625%, 11/15/22 | | | 13,000 | | | | 13,139,706 | |
| | |
1.625%, 12/15/22 | | | 9,370 | | | | 9,480,984 | |
| | |
1.75%, 2/28/22 | | | 59,750 | | | | 59,907,092 | |
| | |
1.75%, 3/31/22(1) | | | 80,000 | | | | 80,318,031 | |
| | |
1.75%, 4/30/22 | | | 82,000 | | | | 82,433,866 | |
| | |
1.75%, 5/15/22 | | | 25,000 | | | | 25,146,944 | |
| | |
1.75%, 5/31/22 | | | 47,000 | | | | 47,307,564 | |
| | |
1.75%, 7/15/22 | | | 500 | | | | 504,017 | |
| | |
1.875%, 2/28/22 | | | 28,900 | | | | 28,981,570 | |
| | |
1.875%, 3/31/22(1) | | | 29,300 | | | | 29,425,229 | |
| | |
1.875%, 4/30/22 | | | 20,000 | | | | 20,113,897 | |
| | |
1.875%, 7/31/22 | | | 500 | | | | 504,702 | |
| | |
1.875%, 8/31/22 | | | 24,000 | | | | 24,252,042 | |
| | |
1.875%, 9/30/22 | | | 35,000 | | | | 35,404,625 | |
| | |
1.875%, 10/31/22 | | | 6,000 | | | | 6,075,015 | |
| | |
2.00%, 11/30/22 | | | 9,340 | | | | 9,475,784 | |
| | |
2.125%, 5/15/22(1) | | | 58,650 | | | | 59,074,917 | |
| | |
2.25%, 4/15/22 | | | 29,000 | | | | 29,173,478 | |
| | |
2.375%, 3/15/22 | | | 50,000 | | | | 50,226,062 | |
| | |
2.50%, 1/15/22 | | | 42,500 | | | | 42,534,015 | |
| |
Total U.S. Treasury Obligations
(identified cost $1,302,169,681) | | | $ | 1,302,056,603 | |
| | | | | | | | |
| Affiliated Fund — 11.3% | |
| Description | | Units | | | Value | |
| | |
Eaton Vance Cash Reserves Fund, LLC, 0.08%(3) | | | 163,593,532 | | | $ | 163,577,173 | |
| |
Total Affiliated Fund
(identified cost $163,577,173) | | | $ | 163,577,173 | |
| |
Total Short-Term Investments
(identified cost $1,465,746,854) | | | $ | 1,465,633,776 | |
| |
Total Investments — 100.9%
(identified cost $1,465,746,854) | | | $ | 1,465,633,776 | |
| |
Other Assets, Less Liabilities — (0.9)% | | | $ | (13,135,977 | ) |
| |
Net Assets — 100.0% | | | $ | 1,452,497,799 | |
The percentage shown for each investment category in the Consolidated Portfolio of Investments is based on net assets.
| (1) | Security (or a portion thereof) has been pledged as collateral for open futures contracts. |
| (2) | Inflation-linked security whose principal is adjusted for inflation based on changes in the U.S. Consumer Price Index. Interest is calculated based on the inflation-adjusted principal. |
| (3) | Affiliated investment company, available to Eaton Vance portfolios and funds, which invests in high quality, U.S. dollar denominated money market instruments. The rate shown is the annualized seven-day yield as of December 31, 2021. |
| | | | |
| | 7 | | See Notes to Consolidated Financial Statements. |
Parametric
Commodity Strategy Fund
December 31, 2021
Consolidated Portfolio of Investments — continued
| | | | | | | | | | | | | | | | | | | | |
| Futures Contracts | |
| | | | | |
| Description | | Number of
Contracts | | | Position | | | Expiration
Date | | | Notional
Amount | | | Value/Unrealized
Appreciation
(Depreciation) | |
| | | | | |
Commodity Futures | | | | | | | | | | | | | | | | | | | | |
| | | | | |
| Brent Crude Oil | | | 341 | | | | Long | | | | 2/28/22 | | | $ | 26,376,350 | | | $ | 2,776,424 | |
| | | | | |
| Cocoa | | | 1,068 | | | | Long | | | | 3/16/22 | | | | 26,913,600 | | | | (2,627,529 | ) |
| | | | | |
| Coffee | | | 617 | | | | Long | | | | 3/21/22 | | | | 52,313,888 | | | | 6,782,025 | |
| | | | | |
| Copper | | | 474 | | | | Long | | | | 3/29/22 | | | | 52,892,475 | | | | 3,330,047 | |
| | | | | |
| Corn | | | 1,767 | | | | Long | | | | 3/14/22 | | | | 52,413,638 | | | | 4,134,736 | |
| | | | | |
| Cotton No. 2 | | | 479 | | | | Long | | | | 3/9/22 | | | | 26,967,700 | | | | 1,376,286 | |
| | | | | |
| Feeder Cattle | | | 159 | | | | Long | | | | 3/31/22 | | | | 13,511,025 | | | | 775,966 | |
| | | | | |
| Gold | | | 581 | | | | Long | | | | 4/27/22 | | | | 106,381,100 | | | | 2,601,045 | |
| | | | | |
| Hard Red Winter Wheat | | | 316 | | | | Long | | | | 3/14/22 | | | | 12,663,700 | | | | 779,792 | |
| | | | | |
| Lean Hogs | | | 749 | | | | Long | | | | 4/14/22 | | | | 25,982,810 | | | | 290,947 | |
| | | | | |
| Live Cattle | | | 915 | | | | Long | | | | 4/29/22 | | | | 53,005,950 | | | | 993,070 | |
| | | | | |
| LME Copper | | | 221 | | | | Long | | | | 1/17/22 | | | | 53,854,938 | | | | 3,178,256 | |
| | | | | |
| LME Copper | | | 231 | | | | Long | | | | 2/14/22 | | | | 56,245,613 | | | | 1,653,094 | |
| | | | | |
| LME Copper | | | 216 | | | | Long | | | | 3/14/22 | | | | 52,550,100 | | | | 1,746,900 | |
| | | | | |
| LME Lead | | | 476 | | | | Long | | | | 1/17/22 | | | | 27,700,225 | | | | 2,079,525 | |
| | | | | |
| LME Lead | | | 463 | | | | Long | | | | 2/14/22 | | | | 26,848,213 | | | | (630,838 | ) |
| | | | | |
| LME Lead | | | 454 | | | | Long | | | | 3/14/22 | | | | 26,263,900 | | | | 1,169,050 | |
| | | | | |
| LME Nickel | | | 476 | | | | Long | | | | 1/17/22 | | | | 59,614,716 | | | | 7,881,132 | |
| | | | | |
| LME Nickel | | | 466 | | | | Long | | | | 2/14/22 | | | | 58,250,466 | | | | 4,704,270 | |
| | | | | |
| LME Nickel | | | 428 | | | | Long | | | | 3/14/22 | | | | 53,397,708 | | | | 1,973,508 | |
| | | | | |
| LME Primary Aluminum | | | 1,489 | | | | Long | | | | 1/17/22 | | | | 104,341,675 | | | | (3,820,088 | ) |
| | | | | |
| LME Primary Aluminum | | | 1,706 | | | | Long | | | | 2/14/22 | | | | 119,633,250 | | | | 6,493,989 | |
| | | | | |
| LME Primary Aluminum | | | 1,576 | | | | Long | | | | 3/14/22 | | | | 110,635,200 | | | | 7,229,900 | |
| | | | | |
| LME Tin | | | 74 | | | | Long | | | | 1/17/22 | | | | 14,565,050 | | | | 1,591,000 | |
| | | | | |
| LME Tin | | | 75 | | | | Long | | | | 2/14/22 | | | | 14,701,875 | | | | 798,375 | |
| | | | | |
| LME Tin | | | 66 | | | | Long | | | | 3/14/22 | | | | 12,873,300 | | | | (103,950 | ) |
| | | | | |
| LME Zinc | | | 679 | | | | Long | | | | 1/17/22 | | | | 60,770,500 | | | | 9,060,406 | |
| | | | | |
| LME Zinc | | | 688 | | | | Long | | | | 2/14/22 | | | | 61,275,000 | | | | 4,523,069 | |
| | | | | |
| LME Zinc | | | 652 | | | | Long | | | | 3/14/22 | | | | 57,832,400 | | | | 6,344,775 | |
| | | | | |
| Low Sulphur Gasoil | | | 791 | | | | Long | | | | 3/10/22 | | | | 52,443,300 | | | | 4,324,783 | |
| | | | | |
| Natural Gas | | | 2,497 | | | | Long | | | | 12/28/22 | | | | 102,127,300 | | | | (4,107,369 | ) |
| | | | | |
| NY Harbor ULSD | | | 537 | | | | Long | | | | 2/28/22 | | | | 52,063,654 | | | | 5,293,824 | |
| | | | | |
| Palladium | | | 133 | | | | Long | | | | 3/29/22 | | | | 25,430,930 | | | | (724,445 | ) |
| | | | | |
| Platinum | | | 546 | | | | Long | | | | 4/27/22 | | | | 26,377,260 | | | | 1,066,200 | |
| | | | | |
| RBOB Gasoline | | | 1,118 | | | | Long | | | | 2/28/22 | | | | 104,646,142 | | | | 13,338,245 | |
| | | | | |
| Robusta Coffee | | | 556 | | | | Long | | | | 3/25/22 | | | | 13,177,200 | | | | 403,580 | |
| | | | | |
| Silver | | | 906 | | | | Long | | | | 3/29/22 | | | | 105,784,560 | | | | 3,186,802 | |
| | | | | |
| Soybean | | | 781 | | | | Long | | | | 3/14/22 | | | | 52,297,713 | | | | 3,274,861 | |
| | | | | |
| Soybean Meal | | | 654 | | | | Long | | | | 3/14/22 | | | | 26,101,140 | | | | 4,079,688 | |
| | | | | |
| Soybean Oil | | | 1,562 | | | | Long | | | | 3/14/22 | | | | 52,979,916 | | | | (3,143,986 | ) |
| | | | | |
| Sugar No. 11 | | | 1,208 | | | | Long | | | | 2/28/22 | | | | 25,543,885 | | | | 75,312 | |
| | | | | |
| Wheat | | | 675 | | | | Long | | | | 3/14/22 | | | | 26,012,813 | | | | 448,900 | |
| | | | | |
| White Sugar | | | 518 | | | | Long | | | | 2/11/22 | | | | 12,874,890 | | | | (33,831 | ) |
| | | | |
| | 8 | | See Notes to Consolidated Financial Statements. |
Parametric
Commodity Strategy Fund
December 31, 2021
Consolidated Portfolio of Investments — continued
| | | | | | | | | | | | | | | | | | |
| Futures Contracts (continued) | |
| | | | | |
| Description | | Number of
Contracts | | | Position | | Expiration
Date | | | Notional
Amount | | | Value/Unrealized
Appreciation
(Depreciation) | |
| | | | | |
| WTI Crude Oil | | | 354 | | | Long | | | 2/22/22 | | | $ | 26,507,520 | | | $ | 3,160,124 | |
| | | | | |
| LME Copper | | | (221 | ) | | Short | | | 1/17/22 | | | | (53,854,938 | ) | | | (1,544,238 | ) |
| | | | | |
| LME Copper | | | (231 | ) | | Short | | | 2/14/22 | | | | (56,245,613 | ) | | | (1,806,131 | ) |
| | | | | |
| LME Lead | | | (476 | ) | | Short | | | 1/17/22 | | | | (27,700,225 | ) | | | 648,550 | |
| | | | | |
| LME Lead | | | (463 | ) | | Short | | | 2/14/22 | | | | (26,848,213 | ) | | | (1,235,631 | ) |
| | | | | |
| LME Nickel | | | (476 | ) | | Short | | | 1/17/22 | | | | (59,614,716 | ) | | | (4,845,204 | ) |
| | | | | |
| LME Nickel | | | (466 | ) | | Short | | | 2/14/22 | | | | (58,250,466 | ) | | | (2,137,542 | ) |
| | | | | |
| LME Primary Aluminum | | | (1,489 | ) | | Short | | | 1/17/22 | | | | (104,341,675 | ) | | | (5,499,994 | ) |
| | | | | |
| LME Primary Aluminum | | | (1,706 | ) | | Short | | | 2/14/22 | | | | (119,633,250 | ) | | | (7,836,938 | ) |
| | | | | |
| LME Primary Aluminum | | | (80 | ) | | Short | | | 3/14/22 | | | | (5,616,000 | ) | | | 37,500 | |
| | | | | |
| LME Tin | | | (74 | ) | | Short | | | 1/17/22 | | | | (14,565,050 | ) | | | (708,550 | ) |
| | | | | |
| LME Tin | | | (75 | ) | | Short | | | 2/14/22 | | | | (14,701,875 | ) | | | 99,465 | |
| | | | | |
| LME Zinc | | | (679 | ) | | Short | | | 1/17/22 | | | | (60,770,500 | ) | | | (4,502,619 | ) |
| | | | | |
| LME Zinc | | | (688 | ) | | Short | | | 2/14/22 | | | | (61,275,000 | ) | | | (6,837,000 | ) |
| | | | | |
| LME Zinc | | | (52 | ) | | Short | | | 3/14/22 | | | | (4,612,400 | ) | | | (10,075 | ) |
| |
| | | | $ | 71,549,463 | |
Abbreviations:
| | | | |
| | |
| LME | | – | | London Metal Exchange |
| | |
| RBOB | | – | | Reformulated Blendstock for Oxygenate Blending |
| | |
| ULSD | | – | | Ultra-Low Sulfur Diesel |
| | |
| WTI | | – | | West Texas Intermediate |
| | | | |
| | 9 | | See Notes to Consolidated Financial Statements. |
Parametric
Commodity Strategy Fund
December 31, 2021
Consolidated Statement of Assets and Liabilities
| | | | |
| Assets | | December 31, 2021 | |
| |
Unaffiliated investments, at value (identified cost, $1,302,169,681) | | $ | 1,302,056,603 | |
| |
Affiliated investment, at value (identified cost, $163,577,173) | | | 163,577,173 | |
| |
Interest receivable | | | 3,459,641 | |
| |
Dividends receivable from affiliated investment | | | 5,228 | |
| |
Receivable for Fund shares sold | | | 10,220,153 | |
| |
Receivable for variation margin on open futures contracts | | | 15,505,259 | |
| |
Total assets | | $ | 1,494,824,057 | |
| |
| Liabilities | | | | |
| |
Payable for investments purchased | | $ | 29,909,389 | |
| |
Payable for Fund shares redeemed | | | 11,385,054 | |
| |
Payable to affiliates: | | | | |
| |
Investment adviser and administration fee | | | 669,474 | |
| |
Distribution and service fees | | | 19,488 | |
| |
Trustees’ fees | | | 13,570 | |
| |
Accrued expenses | | | 329,283 | |
| |
Total liabilities | | $ | 42,326,258 | |
| |
Net Assets | | $ | 1,452,497,799 | |
| |
| Sources of Net Assets | | | | |
| |
Paid-in capital | | $ | 1,617,403,222 | |
| |
Accumulated loss | | | (164,905,423 | ) |
| |
Total | | $ | 1,452,497,799 | |
| |
| Investor Class Shares | | | | |
| |
Net Assets | | $ | 92,413,124 | |
| |
Shares Outstanding | | | 14,769,549 | |
| |
Net Asset Value, Offering Price and Redemption Price Per Share | | | | |
| |
(net assets ÷ shares of beneficial interest outstanding) | | $ | 6.26 | |
| |
| Institutional Class Shares | | | | |
| |
Net Assets | | $ | 1,360,084,675 | |
| |
Shares Outstanding | | | 215,447,488 | |
| |
Net Asset Value, Offering Price and Redemption Price Per Share | | | | |
| |
(net assets ÷ shares of beneficial interest outstanding) | | $ | 6.31 | |
| | | | |
| | 10 | | See Notes to Consolidated Financial Statements. |
Parametric
Commodity Strategy Fund
December 31, 2021
Consolidated Statement of Operations
| | | | |
| Investment Income | | Year Ended
December 31, 2021 | |
| |
Interest | | $ | 2,192,407 | |
| |
Dividends from affiliated investment | | | 42,756 | |
| |
Total investment income | | $ | 2,235,163 | |
|
| Expenses | |
| |
Investment adviser and administration fee | | $ | 5,854,596 | |
| |
Distribution and service fees | | | | |
| |
Investor Class | | | 176,377 | |
| |
Trustees’ fees and expenses | | | 48,423 | |
| |
Custodian fee | | | 317,145 | |
| |
Transfer and dividend disbursing agent fees | | | 542,942 | |
| |
Legal and accounting services | | | 112,755 | |
| |
Printing and postage | | | 75,499 | |
| |
Registration fees | | | 160,925 | |
| |
Miscellaneous | | | 40,770 | |
| |
Total expenses | | $ | 7,329,432 | |
| |
Net investment loss | | $ | (5,094,269 | ) |
|
| Realized and Unrealized Gain (Loss) | |
| |
Net realized gain (loss) — | | | | |
| |
Investment transactions | | $ | 11,889 | |
| |
Investment transactions — affiliated investment | | | (6,847 | ) |
| |
Futures contracts | | | 200,580,687 | |
| |
Net realized gain | | $ | 200,585,729 | |
| |
Change in unrealized appreciation (depreciation) — | | | | |
| |
Investments | | $ | (184,825 | ) |
| |
Futures contracts | | | 31,951,405 | |
| |
Net change in unrealized appreciation (depreciation) | | $ | 31,766,580 | |
| |
Net realized and unrealized gain | | $ | 232,352,309 | |
| |
Net increase in net assets from operations | | $ | 227,258,040 | |
| | | | |
| | 11 | | See Notes to Consolidated Financial Statements. |
Parametric
Commodity Strategy Fund
December 31, 2021
Consolidated Statements of Changes in Net Assets
| | | | | | | | |
| | | Year Ended December 31, | |
| Increase (Decrease) in Net Assets | | 2021 | | | 2020 | |
| | |
From operations — | | | | | | | | |
| | |
Net investment income (loss) | | $ | (5,094,269 | ) | | $ | 1,189,810 | |
| | |
Net realized gain | | | 200,585,729 | | | | 1,149,444 | |
| | |
Net change in unrealized appreciation (depreciation) | | | 31,766,580 | | | | 28,756,064 | |
| | |
Net increase in net assets from operations | | $ | 227,258,040 | | | $ | 31,095,318 | |
| | |
Distributions to shareholders — | | | | | | | | |
| | |
Investor Class | | $ | (11,440,100 | ) | | $ | (734,657 | ) |
| | |
Institutional Class | | | (171,461,858 | ) | | | (11,928,514 | ) |
| | |
Total distributions to shareholders | | $ | (182,901,958 | ) | | $ | (12,663,171 | ) |
| | |
Transactions in shares of beneficial interest — | | | | | | | | |
| | |
Proceeds from sale of shares | | | | | | | | |
| | |
Investor Class | | $ | 95,370,603 | | | $ | 25,200,743 | |
| | |
Institutional Class | | | 1,089,161,910 | | | | 202,428,071 | |
| | |
Net asset value of shares issued to shareholders in payment of distributions declared | | | | | | | | |
| | |
Investor Class | | | 11,425,911 | | | | 734,657 | |
| | |
Institutional Class | | | 158,431,221 | | | | 11,873,945 | |
| | |
Cost of shares redeemed | | | | | | | | |
| | |
Investor Class | | | (45,077,183 | ) | | | (9,234,175 | ) |
| | |
Institutional Class | | | (339,182,512 | ) | | | (153,363,151 | ) |
| | |
Net increase in net assets from Fund share transactions | | $ | 970,129,950 | | | $ | 77,640,090 | |
| | |
Net increase in net assets | | $ | 1,014,486,032 | | | $ | 96,072,237 | |
|
| Net Assets | |
| | |
At beginning of year | | $ | 438,011,767 | | | $ | 341,939,530 | |
| | |
At end of year | | $ | 1,452,497,799 | | | $ | 438,011,767 | |
| | | | |
| | 12 | | See Notes to Consolidated Financial Statements. |
Parametric
Commodity Strategy Fund
December 31, 2021
Consolidated Financial Highlights
| | | | | | | | | | | | | | | | | | | | |
| | | Investor Class | |
| |
| | | Year Ended December 31, | |
| | | 2021 | | | 2020 | | | 2019 | | | 2018 | | | 2017 | |
| | | | | |
Net asset value — Beginning of year | | $ | 5.510 | | | $ | 5.270 | | | $ | 4.880 | | | $ | 5.420 | | | $ | 5.340 | |
| | | | | |
| Income (Loss) From Operations | | | | | | | | | | | | | | | | | | | | |
| | | | | |
Net investment income (loss)(1) | | $ | (0.047 | ) | | $ | (0.002 | ) | | $ | 0.077 | | | $ | 0.043 | | | $ | (0.000 | )(2) |
| | | | | |
Net realized and unrealized gain (loss) | | | 1.657 | | | | 0.408 | | | | 0.372 | | | | (0.563 | ) | | | 0.350 | |
| | | | | |
Total income (loss) from operations | | $ | 1.610 | | | $ | 0.406 | | | $ | 0.449 | | | $ | (0.520 | ) | | $ | 0.350 | |
| | | | | |
| Less Distributions | | | | | | | | | | | | | | | | | | | | |
| | | | | |
From net investment income | | $ | (0.860 | ) | | $ | (0.161 | ) | | $ | (0.059 | ) | | $ | (0.020 | ) | | $ | (0.270 | ) |
| | | | | |
From net realized gain | | | — | | | | (0.005 | ) | | | — | | | | — | | | | — | |
| | | | | |
Total distributions | | $ | (0.860 | ) | | $ | (0.166 | ) | | $ | (0.059 | ) | | $ | (0.020 | ) | | $ | (0.270 | ) |
| | | | | |
Net asset value — End of year | | $ | 6.260 | | | $ | 5.510 | | | $ | 5.270 | | | $ | 4.880 | | | $ | 5.420 | |
| | | | | |
Total Return(3)(4) | | | 29.60 | % | | | 7.73 | % | | | 9.18 | % | | | (9.60 | )% | | | 6.70 | % |
| | | | | |
| Ratios/Supplemental Data | | | | | | | | | | | | | | | | | | | | |
| | | | | |
Net assets, end of year (000’s omitted) | | $ | 92,413 | | | $ | 27,473 | | | $ | 9,700 | | | $ | 19,709 | | | $ | 47,621 | |
| | | | | |
Ratios (as a percentage of average daily net assets): | | | | | | | | | | | | | | | | | | | | |
| | | | | |
Expenses(4) | | | 0.91 | % | | | 0.93 | % | | | 0.90 | % | | | 0.90 | % | | | 0.90 | % |
| | | | | |
Net investment income (loss) | | | (0.71 | )% | | | (0.03 | )% | | | 1.51 | % | | | 0.81 | % | | | (0.01 | )% |
| | | | | |
Portfolio Turnover | | | 0 | % | | | 0 | % | | | 0 | % | | | 0 | % | | | 0 | % |
| (1) | Computed using average shares outstanding. |
| (2) | Amount represents less than $(0.0005) per share. |
| (3) | Returns are historical and are calculated by determining the percentage change in net asset value with all distributions reinvested and do not reflect the effect of sales charges, if any. |
| (4) | The investment adviser and administrator and sub-adviser reimbursed certain operating expenses (equal to 0.01%, 0.06%, 0.08% and 0.09% of average daily net assets for the years ended December 31, 2020, 2019, 2018 and 2017, respectively). Absent this reimbursement, total return would be lower. |
| | | | |
| | 13 | | See Notes to Consolidated Financial Statements. |
Parametric
Commodity Strategy Fund
December 31, 2021
Consolidated Financial Highlights — continued
| | | | | | | | | | | | | | | | | | | | |
| | | Institutional Class | |
| |
| | | Year Ended December 31, | |
| | | 2021 | | | 2020 | | | 2019 | | | 2018 | | | 2017 | |
| | | | | |
Net asset value — Beginning of year | | $ | 5.550 | | | $ | 5.310 | | | $ | 4.930 | | | $ | 5.480 | | | $ | 5.390 | |
| | | | | |
| Income (Loss) From Operations | | | | | | | | | | | | | | | | | | | | |
| | | | | |
Net investment income (loss)(1) | | $ | (0.031 | ) | | $ | 0.018 | | | $ | 0.088 | | | $ | 0.064 | | | $ | 0.013 | |
| | | | | |
Net realized and unrealized gain (loss) | | | 1.664 | | | | 0.394 | | | | 0.374 | | | | (0.571 | ) | | | 0.359 | |
| | | | | |
Total income (loss) from operations | | $ | 1.633 | | | $ | 0.412 | | | $ | 0.462 | | | $ | (0.507 | ) | | $ | 0.372 | |
| | | | | |
| Less Distributions | | | | | | | | | | | | | | | | | | | | |
| | | | | |
From net investment income | | $ | (0.873 | ) | | $ | (0.167 | ) | | $ | (0.082 | ) | | $ | (0.043 | ) | | $ | (0.282 | ) |
| | | | | |
From net realized gain | | | — | | | | (0.005 | ) | | | — | | | | — | | | | — | |
| | | | | |
Total distributions | | $ | (0.873 | ) | | $ | (0.172 | ) | | $ | (0.082 | ) | | $ | (0.043 | ) | | $ | (0.282 | ) |
| | | | | |
Net asset value — End of year | | $ | 6.310 | | | $ | 5.550 | | | $ | 5.310 | | | $ | 4.930 | | | $ | 5.480 | |
| | | | | |
Total Return(2)(3) | | | 29.80 | % | | | 7.79 | % | | | 9.58 | % | | | (9.44 | )% | | | 7.06 | % |
| | | | | |
| Ratios/Supplemental Data | | | | | | | | | | | | | | | | | | | | |
| | | | | |
Net assets, end of year (000’s omitted) | | $ | 1,360,085 | | | $ | 410,539 | | | $ | 332,240 | | | $ | 269,200 | | | $ | 205,973 | |
| | | | | |
Ratios (as a percentage of average daily net assets): | | | | | | | | | | | | | | | | | | | | |
| | | | | |
Expenses(3) | | | 0.66 | % | | | 0.68 | % | | | 0.65 | % | | | 0.65 | % | | | 0.65 | % |
| | | | | |
Net investment income (loss) | | | (0.46 | )% | | | 0.37 | % | | | 1.70 | % | | | 1.20 | % | | | 0.24 | % |
| | | | | |
Portfolio Turnover | | | 0 | % | | | 0 | % | | | 0 | % | | | 0 | % | | | 0 | % |
| (1) | Computed using average shares outstanding. |
| (2) | Returns are historical and are calculated by determining the percentage change in net asset value with all distributions reinvested. |
| (3) | The investment adviser and administrator and sub-adviser reimbursed certain operating expenses (equal to 0.01%, 0.06%, 0.08% and 0.09% of average daily net assets for the years ended December 31, 2020, 2019, 2018 and 2017, respectively). Absent this reimbursement, total return would be lower. |
| | | | |
| | 14 | | See Notes to Consolidated Financial Statements. |
Parametric
Commodity Strategy Fund
December 31, 2021
Notes to Consolidated Financial Statements
1 Significant Accounting Policies
Parametric Commodity Strategy Fund (the Fund) is a diversified series of Eaton Vance Mutual Funds Trust (the Trust). The Trust is a Massachusetts business trust registered under the Investment Company Act of 1940, as amended (the 1940 Act), as an open-end management investment company. The Fund’s investment objective is to seek total return. The Fund offers Investor Class and Institutional Class shares, which are offered at net asset value and are not subject to a sales charge. Each class represents a pro-rata interest in the Fund, but votes separately on class-specific matters and (as noted below) is subject to different expenses. Realized and unrealized gains and losses and net investment income and losses, other than class-specific expenses, are allocated daily to each class of shares based on the relative net assets of each class to the total net assets of the Fund. Each class of shares differs in its distribution plan and certain other class-specific expenses.
The Fund seeks to gain exposure to the commodity markets, in whole or in part, through investments in PSC Commodity Subsidiary, Ltd. (the Subsidiary), a wholly-owned subsidiary of the Fund organized under the laws of the Cayman Islands with the same objective and investment policies and restrictions as the Fund. The Fund may invest up to 25% of its total assets in the Subsidiary. The net assets of the Subsidiary at December 31, 2021 were $275,257,559 or 19.0% of the Fund’s consolidated net assets. The accompanying consolidated financial statements include the accounts of the Subsidiary. Intercompany balances and transactions have been eliminated in consolidation.
The following is a summary of significant accounting policies of the Fund. The policies are in conformity with accounting principles generally accepted in the United States of America (U.S. GAAP). The Fund is an investment company and follows accounting and reporting guidance in the Financial Accounting Standards Board (FASB) Accounting Standards Codification Topic 946.
A Investment Valuation — The following methodologies are used to determine the market value or fair value of investments.
Debt Obligations. Debt obligations are generally valued on the basis of valuations provided by third party pricing services, as derived from such services’ pricing models. Inputs to the models may include, but are not limited to, reported trades, executable bid and ask prices, broker/dealer quotations, prices or yields of securities with similar characteristics, interest rates, anticipated prepayments, benchmark curves or information pertaining to the issuer, as well as industry and economic events. The pricing services may use a matrix approach, which considers information regarding securities with similar characteristics to determine the valuation for a security. Short-term debt obligations purchased with a remaining maturity of sixty days or less for which a valuation from a third party pricing service is not readily available may be valued at amortized cost, which approximates fair value.
Derivatives. Financial and commodities futures contracts are valued at the closing settlement price established by the board of trade or exchange on which they are traded.
Affiliated Fund. The Fund may invest in Eaton Vance Cash Reserves Fund, LLC (Cash Reserves Fund), an affiliated investment company managed by Eaton Vance Management (EVM). While Cash Reserves Fund is not a registered money market mutual fund, it conducts all of its investment activities in accordance with the requirements of Rule 2a-7 under the 1940 Act. Investments in Cash Reserves Fund are valued at the closing net asset value per unit on the valuation day. Cash Reserves Fund generally values its investment securities based on available market quotations provided by a third party pricing service.
Fair Valuation. Investments for which valuations or market quotations are not readily available or are deemed unreliable are valued at fair value using methods determined in good faith by or at the direction of the Trustees of the Fund in a manner that most fairly reflects the security’s “fair value”, which is the amount that the Fund might reasonably expect to receive for the security upon its current sale in the ordinary course. Each such determination is based on a consideration of relevant factors, which are likely to vary from one pricing context to another. These factors may include, but are not limited to, the type of security, the existence of any contractual restrictions on the security’s disposition, the price and extent of public trading in similar securities of the issuer or of comparable companies or entities, quotations or relevant information obtained from broker/dealers or other market participants, information obtained from the issuer, analysts, and/or the appropriate stock exchange (for exchange-traded securities), an analysis of the company’s or entity’s financial statements, and an evaluation of the forces that influence the issuer and the market(s) in which the security is purchased and sold.
B Investment Transactions — Investment transactions for financial statement purposes are accounted for on a trade date basis. Realized gains and losses on investments sold are determined on the basis of identified cost.
C Income — Interest income is recorded on the basis of interest accrued, adjusted for amortization of premium or accretion of discount. Inflation adjustments to the principal amount of inflation-adjusted bonds and notes are reflected as interest income. Deflation adjustments to the principal amount of an inflation-adjusted bond or note are reflected as reductions to interest income to the extent of interest income previously recorded on such bond or note. Dividend income is recorded on the ex-dividend date for dividends received in cash and/or securities.
D Federal Taxes — The Fund’s policy is to comply with the provisions of the Internal Revenue Code applicable to regulated investment companies and to distribute to shareholders each year substantially all of its net investment income, and all or substantially all of its net realized capital gains. Accordingly, no provision for federal income or excise tax is necessary.
The Subsidiary is treated as a controlled foreign corporation under the Internal Revenue Code and is not expected to be subject to U.S. federal income tax. The Fund is treated as a U.S. shareholder of the Subsidiary. As a result, the Fund is required to include in gross income for U.S. federal tax purposes all of the Subsidiary’s income, whether or not such income is distributed by the Subsidiary. If a net loss is realized by the Subsidiary, such loss is not generally available to offset the income earned by the Fund.
Parametric
Commodity Strategy Fund
December 31, 2021
Notes to Consolidated Financial Statements — continued
As of December 31, 2021, the Fund had no uncertain tax positions that would require financial statement recognition, de-recognition, or disclosure. The Fund files a U.S. federal income tax return annually after its fiscal year-end, which is subject to examination by the Internal Revenue Service for a period of three years from the date of filing.
E Expenses — The majority of expenses of the Trust are directly identifiable to an individual fund. Expenses which are not readily identifiable to a specific fund are allocated taking into consideration, among other things, the nature and type of expense and the relative size of the funds.
F Use of Estimates — The preparation of the consolidated financial statements in conformity with U.S. GAAP requires management to make estimates and assumptions that affect the reported amounts of assets and liabilities at the date of the consolidated financial statements and the reported amounts of income and expense during the reporting period. Actual results could differ from those estimates.
G Indemnifications — Under the Trust’s organizational documents, its officers and Trustees may be indemnified against certain liabilities and expenses arising out of the performance of their duties to the Fund. Under Massachusetts law, if certain conditions prevail, shareholders of a Massachusetts business trust (such as the Trust) could be deemed to have personal liability for the obligations of the Trust. However, the Trust’s Declaration of Trust contains an express disclaimer of liability on the part of Fund shareholders and the By-laws provide that the Trust shall assume, upon request by the shareholder, the defense on behalf of any Fund shareholders. Moreover, the By-laws also provide for indemnification out of Fund property of any shareholder held personally liable solely by reason of being or having been a shareholder for all loss or expense arising from such liability. Additionally, in the normal course of business, the Fund enters into agreements with service providers that may contain indemnification clauses. The Fund’s maximum exposure under these arrangements is unknown as this would involve future claims that may be made against the Fund that have not yet occurred.
H Financial and Commodities Futures Contracts — Upon entering into a financial or commodities futures contract, the Fund is required to deposit with the broker, either in cash or securities, an amount equal to a certain percentage of the contract amount (initial margin). Subsequent payments, known as variation margin, are made or received by the Fund each business day (except for futures contracts traded on the London Metal Exchange, which make payments at contract expiration), depending on the daily fluctuations in the value of the underlying security, commodity or currency, and are recorded as unrealized gains or losses by the Fund. Gains (losses) are realized upon the expiration or closing of the financial or commodities futures contracts. Should market conditions change unexpectedly, the Fund may not achieve the anticipated benefits of the financial or commodities futures contracts and may realize a loss. Futures contracts have minimal counterparty risk as they are exchange traded and the clearinghouse for the exchange is substituted as the counterparty, guaranteeing counterparty performance.
2 Distributions to Shareholders and Income Tax Information
It is the present policy of the Fund to make at least one distribution annually (normally in December) of all or substantially all of its net investment income and to distribute annually all or substantially all of its net realized capital gains. Distributions to shareholders are recorded on the ex-dividend date. Distributions are declared separately for each class of shares. Shareholders may reinvest income and capital gain distributions in additional shares of the same class of the Fund at the net asset value as of the ex-dividend date or, at the election of the shareholder, receive distributions in cash. Distributions to shareholders are determined in accordance with income tax regulations, which may differ from U.S. GAAP. As required by U.S. GAAP, only distributions in excess of tax basis earnings and profits are reported in the financial statements as a return of capital. Permanent differences between book and tax accounting relating to distributions are reclassified to paid-in capital. For tax purposes, distributions from short-term capital gains are considered to be from ordinary income.
The tax character of distributions declared for the years ended December 31, 2021 and December 31, 2020 was as follows:
| | | | | | | | |
| | | Year Ended December 31, | |
| | | 2021 | | | 2020 | |
| | |
Ordinary income | | $ | 182,901,958 | | | $ | 12,663,171 | |
During the year ended December 31, 2021, distributable earnings was decreased by $209,280,656 and paid-in capital was increased by $209,280,656 due to the Fund’s use of equalization accounting and differences between book and tax accounting for the Fund’s investment in the Subsidiary. Tax equalization accounting allows the Fund to treat as a distribution that portion of redemption proceeds representing a redeeming shareholder’s portion of undistributed taxable income and net capital gains. These reclassifications had no effect on the net assets or net asset value per share of the Fund.
Parametric
Commodity Strategy Fund
December 31, 2021
Notes to Consolidated Financial Statements — continued
As of December 31, 2021, the components of distributable earnings (accumulated loss) on a tax basis were as follows:
| | | | |
| | |
Deferred capital losses | | $ | (1,373,830 | ) |
| |
Net unrealized depreciation | | | (163,531,593 | ) |
| |
Accumulated loss | | $ | (164,905,423 | ) |
At December 31, 2021, the Fund, for federal income tax purposes, had deferred capital losses of $1,373,830 which would reduce its taxable income arising from future net realized gains on investment transactions, if any, to the extent permitted by the Internal Revenue Code, and thus would reduce the amount of distributions to shareholders, which would otherwise be necessary to relieve the Fund of any liability for federal income or excise tax. The deferred capital losses are treated as arising on the first day of the Fund’s next taxable year and retain the same short-term or long-term character as when originally deferred. Of the deferred capital losses at December 31, 2021, $1,373,830 are short-term.
The cost and unrealized appreciation (depreciation) of investments of the Fund, including open derivative contracts and the Fund’s investment in the Subsidiary, at December 31, 2021, as determined on a federal income tax basis, were as follows:
| | | | |
| |
Aggregate cost | | $ | 1,452,560,785 | |
| |
Gross unrealized appreciation | | $ | 4,042 | |
| |
Gross unrealized depreciation | | | (1,191,122 | ) |
| |
Net unrealized depreciation | | $ | (1,187,080 | ) |
3 Investment Adviser and Administration Fee and Other Transactions with Affiliates
The investment adviser and administration fee is earned by EVM as compensation for investment advisory and administrative services rendered to the Fund and the Subsidiary. On March 1, 2021, Morgan Stanley acquired Eaton Vance Corp. (the “Transaction”) and EVM became an indirect, wholly-owned subsidiary of Morgan Stanley. In connection with the Transaction, the Fund entered into a new investment advisory and administrative agreement (the “New Agreement”) with EVM, which took effect on March 1, 2021. The Fund’s prior fee reduction agreement was incorporated into the New Agreement. Pursuant to the New Agreement (and the Fund’s investment advisory and administrative agreement and related fee reduction agreement with EVM in effect prior to March 1, 2021), the investment adviser and adminstration fee is computed at an annual rate as a percentage of the Fund’s consolidated average daily net assets as follows and is payable monthly:
| | | | |
| Consolidated Average Daily Net Assets | | Annual Fee Rate | |
| |
Up to $1 billion | | | 0.550 | % |
| |
$1 billion but less than $2.5 billion | | | 0.525 | |
| |
$2.5 billion but less than $5 billion | | | 0.505 | |
| |
$5 billion and over | | | 0.490 | |
For the year ended December 31, 2021, the investment adviser and administration fee amounted to $5,854,596 or 0.54% of the Fund’s consolidated average daily net assets. Pursuant to an investment sub-advisory agreement, EVM has delegated the investment management of the Fund to Parametric Portfolio Associates LLC (Parametric), an affiliate of EVM and, effective March 1, 2021, an indirect, wholly-owned subsidiary of Morgan Stanley. In connection with the Transaction, EVM entered into a new sub-advisory agreement with Parametric, which took effect on March 1, 2021. EVM pays Parametric a portion of its investment adviser and administration fee for sub-advisory services provided to the Fund. The Fund may invest its cash in Cash Reserves Fund. EVM does not currently receive a fee for advisory services provided to Cash Reserves Fund.
EVM provides sub-transfer agency and related services to the Fund pursuant to a Sub-Transfer Agency Support Services Agreement. For the year ended December 31, 2021, EVM earned $6,028 from the Fund pursuant to such agreement, which is included in transfer and dividend disbursing agent fees on the Consolidated Statement of Operations. Eaton Vance Distributors, Inc. (EVD), an affiliate of EVM and the Fund’s principal underwriter, received distribution and service fees from Investor Class (see Note 4).
Parametric
Commodity Strategy Fund
December 31, 2021
Notes to Consolidated Financial Statements — continued
Trustees and officers of the Fund who are members of EVM’s organization receive remuneration for their services to the Fund out of the investment adviser and administration fee. Trustees of the Fund who are not affiliated with EVM may elect to defer receipt of all or a percentage of their annual fees in accordance with the terms of the Trustees Deferred Compensation Plan. For the year ended December 31, 2021, no significant amounts have been deferred. Certain officers and Trustees of the Fund are officers of the above organizations.
4 Distribution Plan
The Fund has in effect a distribution plan for Investor Class shares (Investor Class Plan) pursuant to Rule 12b-1 under the 1940 Act. Pursuant to the Investor Class Plan, the Fund pays EVD a distribution and service fee of 0.25% per annum of its average daily net assets attributable to Investor Class shares for distribution services and facilities provided to the Fund by EVD, as well as for personal services and/or the maintenance of shareholder accounts. Distribution and service fees paid or accrued to EVD for the year ended December 31, 2021 amounted to $176,377 for Investor Class shares.
Distribution and service fees are subject to the limitations contained in the Financial Industry Regulatory Authority Rule 2341(d).
5 Purchases and Sales of Investments
There were no purchases and sales of investments, other than short-term obligations, for the year ended December 31, 2021.
6 Shares of Beneficial Interest
The Fund’s Declaration of Trust permits the Trustees to issue an unlimited number of full and fractional shares of beneficial interest (without par value). Such shares may be issued in a number of different series (such as the Fund) and classes. Transactions in Fund shares were as follows:
| | | | | | | | |
| | | Year Ended December 31, | |
| Investor Class | | 2021 | | | 2020 | |
| | |
Sales | | | 14,672,374 | | | | 4,956,125 | |
| | |
Issued to shareholders electing to receive payments of distributions in Fund shares | | | 1,870,035 | | | | 134,800 | |
| | |
Redemptions | | | (6,757,341 | ) | | | (1,945,325 | ) |
| | |
Net increase | | | 9,785,068 | | | | 3,145,600 | |
| |
| | | Year Ended December 31, | |
| Institutional Class | | 2021 | | | 2020 | |
| | |
Sales | | | 167,248,330 | | | | 41,847,624 | |
| | |
Issued to shareholders electing to receive payments of distributions in Fund shares | | | 25,719,354 | | | | 2,162,831 | |
| | |
Redemptions | | | (51,477,726 | ) | | | (32,656,133 | ) |
| | |
Net increase | | | 141,489,958 | | | | 11,354,322 | |
7 Financial Instruments
The Fund may trade in financial instruments with off-balance sheet risk in the normal course of its investing activities. These financial instruments may include futures contracts and may involve, to a varying degree, elements of risk in excess of the amounts recognized for financial statement purposes. The notional or contractual amounts of these instruments represent the investment the Fund has in particular classes of financial instruments and do not necessarily represent the amounts potentially subject to risk. The measurement of the risks associated with these instruments is meaningful only when all related and offsetting transactions are considered. A summary of obligations under these financial instruments at December 31, 2021 is included in the Consolidated Portfolio of Investments. At December 31, 2021, the Fund had sufficient cash and/or securities to cover commitments under these contracts.
The Fund is subject to commodity risk in the normal course of pursuing its investment objective. Commodity risk is the risk that the value of a commodity or commodity index will fluctuate based on increases or decreases in the commodities market and factors specific to a particular industry or commodity. The Fund invests primarily in commodities-linked derivative investments, including commodity futures contracts that provide exposure to the investment returns of the commodities markets, without investing directly in physical commodities.
Parametric
Commodity Strategy Fund
December 31, 2021
Notes to Consolidated Financial Statements — continued
The fair value of open derivative instruments (not considered to be hedging instruments for accounting disclosure purposes) and whose primary underlying risk exposure is commodity risk at December 31, 2021 was as follows:
| | | | | | | | |
| | | Fair Value | |
| Derivative | | Asset Derivative | | | Liability Derivative | |
| | |
Futures contracts | | $ | 123,705,421 | (1) | | $ | (52,155,958 | )(1) |
| | |
Total | | $ | 123,705,421 | | | $ | (52,155,958 | ) |
| (1) | Amount represents cumulative unrealized appreciation or (depreciation) on futures contracts. The variation margin on open futures contracts is reported within the Consolidated Statement of Assets and Liabilities as Receivable or Payable for variation margin on open futures contracts, as applicable. |
The effect of derivative instruments (not considered to be hedging instruments for accounting disclosure purposes) on the Consolidated Statement of Operations and whose primary underlying risk exposure is commodity risk for the year ended December 31, 2021 was as follows:
| | | | | | | | |
| Derivative | | Realized Gain (Loss)
on Derivatives Recognized
in Income | | | Change in Unrealized
Appreciation (Depreciation) on
Derivatives Recognized in Income | |
| | |
Futures contracts | | $ | 200,580,687 | (1) | | $ | 31,951,405 | (2) |
| (1) | Consolidated Statement of Operations location: Net realized gain (loss) – Futures contracts. |
| (2) | Consolidated Statement of Operations location: Change in unrealized appreciation (depreciation) – Futures contracts. |
The average notional cost of futures contracts outstanding during the year ended December 31, 2021, which are indicative of the volume of these derivative types, were approximately as follows:
| | | | | | |
Futures
Contracts — Long | | | Futures
Contracts — Short | |
| |
| | $ 1,412,472,000 | | | $ | 391,462,000 | |
8 Line of Credit
The Fund participates with other portfolios and funds managed by EVM and its affiliates in an $800 million unsecured line of credit agreement with a group of banks, which is in effect through October 25, 2022. Borrowings are made by the Fund solely for temporary purposes related to redemptions and other short-term cash needs. Interest is charged to the Fund based on its borrowings at an amount above either the Secured Overnight Financing Rate (SOFR) or Federal Funds rate. In addition, a fee computed at an annual rate of 0.15% on the daily unused portion of the line of credit is allocated among the participating portfolios and funds at the end of each quarter. In connection with the renewal of the agreement in October 2021, an arrangement fee totaling $150,000 was incurred that was allocated to the participating portfolios and funds. Because the line of credit is not available exclusively to the Fund, it may be unable to borrow some or all of its requested amounts at any particular time. The Fund did not have any significant borrowings or allocated fees during the year ended December 31, 2021.
Parametric
Commodity Strategy Fund
December 31, 2021
Notes to Consolidated Financial Statements — continued
9 Investments in Affiliated Funds
At December 31, 2021, the value of the Fund’s investment in affiliated funds was $163,577,173, which represents 11.3% of the Fund’s net assets. Transactions in affiliated funds by the Fund for the year ended December 31, 2021 were as follows:
| | | | | | | | | | | | | | | | | | | | | | | | | | | | | | | | |
| Name | | Value,
beginning
of period | | | Purchases | | | Sales
proceeds | | | Net
realized
gain (loss) | | | Change in
unrealized
appreciation
(depreciation) | | | Value, end
of period | | | Dividend
income | | | Units, end
of period | |
|
Short-Term Investments | |
| | | | | | | | |
Eaton Vance Cash
Reserves Fund,
LLC | | $ | 77,222,587 | | | $ | 1,831,565,036 | | | $ | (1,745,203,603 | ) | | $ | (6,847 | ) | | $ | — | | | $ | 163,577,173 | | | $ | 42,756 | | | | 163,593,532 | |
10 Fair Value Measurements
Under generally accepted accounting principles for fair value measurements, a three-tier hierarchy to prioritize the assumptions, referred to as inputs, is used in valuation techniques to measure fair value. The three-tier hierarchy of inputs is summarized in the three broad levels listed below.
| • | | Level 1 – quoted prices in active markets for identical investments |
| • | | Level 2 – other significant observable inputs (including quoted prices for similar investments, interest rates, prepayment speeds, credit risk, etc.) |
| • | | Level 3 – significant unobservable inputs (including a fund’s own assumptions in determining the fair value of investments) |
In cases where the inputs used to measure fair value fall in different levels of the fair value hierarchy, the level disclosed is determined based on the lowest level input that is significant to the fair value measurement in its entirety. The inputs or methodology used for valuing securities are not necessarily an indication of the risk associated with investing in those securities.
At December 31, 2021, the hierarchy of inputs used in valuing the Fund’s investments and open derivative instruments, which are carried at value, were as follows:
| | | | | | | | | | | | | | | | |
| Asset Description | | Level 1 | | | Level 2 | | | Level 3 | | | Total | |
| | | | |
Short-Term Investments — | | | | | | | | | | | | | | | | |
| | | | |
U.S. Treasury Obligations | | $ | — | | | $ | 1,302,056,603 | | | $ | — | | | $ | 1,302,056,603 | |
| | | | |
Affiliated Fund | | | — | | | | 163,577,173 | | | | — | | | | 163,577,173 | |
| | | | |
Total Investments | | $ | — | | | $ | 1,465,633,776 | | | $ | — | | | $ | 1,465,633,776 | |
| | | | |
Futures Contracts | | $ | 123,705,421 | | | $ | — | | | $ | — | | | $ | 123,705,421 | |
| | | | |
Total | | $ | 123,705,421 | | | $ | 1,465,633,776 | | | $ | — | | | $ | 1,589,339,197 | |
| | | | |
Liability Description | | | | | �� | | | | | | | | | | | |
| | | | |
Futures Contracts | | $ | (52,155,958 | ) | | $ | — | | | $ | — | | | $ | (52,155,958 | ) |
| | | | |
Total | | $ | (52,155,958 | ) | | $ | — | | | $ | — | | | $ | (52,155,958 | ) |
11 Risks and Uncertainties
Risks Associated with Commodities
The commodities which underlie commodity-linked derivatives in which the Fund invests may be subject to additional economic and non-economic variables, such as drought, floods, weather, livestock disease, embargoes, tariffs, and international economic, political and regulatory developments. These factors may have a larger impact on commodity prices and commodity-linked instruments than on traditional securities. Certain commodities are also subject to limited pricing flexibility because of supply and demand factors. Others are subject to broad price fluctuations as a result of the volatility of the
Parametric
Commodity Strategy Fund
December 31, 2021
Notes to Consolidated Financial Statements — continued
prices for certain raw materials and the instability of supplies of other materials. These additional variables may create additional investment risks which subject the Fund’s investments to greater volatility than investments in traditional securities.
Pandemic Risk
An outbreak of respiratory disease caused by a novel coronavirus was first detected in China in late 2019 and subsequently spread internationally. This coronavirus has resulted in closing borders, enhanced health screenings, changes to healthcare service preparation and delivery, quarantines, cancellations, disruptions to supply chains and customer activity, as well as general concern and uncertainty. Health crises caused by outbreaks, such as the coronavirus outbreak, may exacerbate other pre-existing political, social and economic risks and disrupt normal market conditions and operations. The impact of this outbreak has negatively affected the worldwide economy, the economies of individual countries, individual companies, and the market in general, and may continue to do so in significant and unforeseen ways, as may other epidemics and pandemics that may arise in the future. Any such impact could adversely affect the Fund’s performance, or the performance of the securities in which the Fund invests.
Parametric
Commodity Strategy Fund
December 31, 2021
Report of Independent Registered Public Accounting Firm
To the Trustees of Eaton Vance Mutual Funds Trust and Shareholders of Parametric Commodity Strategy Fund:
Opinion on the Financial Statements and Financial Highlights
We have audited the accompanying consolidated statement of assets and liabilities of Parametric Commodity Strategy Fund and subsidiary (the “Fund”) (one of the funds constituting Eaton Vance Mutual Funds Trust), including the consolidated portfolio of investments, as of December 31, 2021, the related consolidated statement of operations for the year then ended, the consolidated statements of changes in net assets for each of the two years in the period then ended, the consolidated financial highlights for each of the five years in the period then ended, and the related notes (collectively referred to as the “financial statements and financial highlights”). In our opinion, the financial statements and financial highlights present fairly, in all material respects, the financial position of the Fund as of December 31, 2021, and the results of its operations for the year then ended, the changes in its net assets for each of the two years in the period then ended, and the financial highlights for each of the five years in the period then ended, in conformity with accounting principles generally accepted in the United States of America.
Basis for Opinion
These financial statements and financial highlights are the responsibility of the Fund’s management. Our responsibility is to express an opinion on the Fund’s financial statements and financial highlights based on our audits. We are a public accounting firm registered with the Public Company Accounting Oversight Board (United States) (PCAOB) and are required to be independent with respect to the Fund in accordance with the U.S. federal securities laws and the applicable rules and regulations of the Securities and Exchange Commission and the PCAOB.
We conducted our audits in accordance with the standards of the PCAOB. Those standards require that we plan and perform the audit to obtain reasonable assurance about whether the financial statements and financial highlights are free of material misstatement, whether due to error or fraud. The Fund is not required to have, nor were we engaged to perform, an audit of its internal control over financial reporting. As part of our audits, we are required to obtain an understanding of internal control over financial reporting but not for the purpose of expressing an opinion on the effectiveness of the Fund’s internal control over financial reporting. Accordingly, we express no such opinion.
Our audits included performing procedures to assess the risks of material misstatement of the financial statements and financial highlights, whether due to error or fraud, and performing procedures that respond to those risks. Such procedures included examining, on a test basis, evidence regarding the amounts and disclosures in the financial statements and financial highlights. Our audits also included evaluating the accounting principles used and significant estimates made by management, as well as evaluating the overall presentation of the financial statements and financial highlights. Our procedures included confirmation of securities owned as of December 31, 2021, by correspondence with the custodian and brokers; when replies were not received from brokers, we performed other auditing procedures. We believe that our audits provide a reasonable basis for our opinion.
/s/ Deloitte & Touche LLP
Boston, Massachusetts
February 23, 2022
We have served as the auditor of one or more Eaton Vance investment companies since 1959.
Parametric
Commodity Strategy Fund
December 31, 2021
Federal Tax Information (Unaudited)
The Form 1099-DIV you received in February 2022 showed the tax status of all distributions paid to your account in calendar year 2021. Shareholders are advised to consult their own tax adviser with respect to the tax consequences of their investment in the Fund. As required by the Internal Revenue Code and/or regulations, shareholders must be notified regarding the status of 163(j) interest dividends.
163(j) Interest Dividends. For the fiscal year ended December 31, 2021, the Fund designates 6.27% of distributions from net investment income as a 163(j) interest dividend.
Parametric
Commodity Strategy Fund
December 31, 2021
Management and Organization
Fund Management. The Trustees of Eaton Vance Mutual Funds Trust (the Trust) are responsible for the overall management and supervision of the Trust’s affairs. The Board members and officers of the Trust are listed below. Except as indicated, each individual has held the office shown or other offices in the same company for the last five years. Board members hold indefinite terms of office. Each Trustee holds office until his or her successor is elected and qualified, subject to a prior death, resignation, retirement, disqualification or removal. Under the terms of the Fund’s current Trustee retirement policy, an Independent Trustee must retire and resign as a Trustee on the earlier of: (i) the first day of July following his or her 74th birthday; or (ii), with limited exception, December 31st of the 20th year in which he or she has served as a Trustee. However, if such retirement and resignation would cause the Fund to be out of compliance with Section 16 of the 1940 Act or any other regulations or guidance of the SEC, then such retirement and resignation will not become effective until such time as action has been taken for the Fund to be in compliance therewith. The “noninterested Trustees” consist of those Trustees who are not “interested persons” of the Trust, as that term is defined under the 1940 Act. The business address of each Board member and officer is Two International Place, Boston, Massachusetts 02110. As used below, “BMR” refers to Boston Management and Research, “EVC” refers to Eaton Vance Corp., “EV” refers to EV LLC, “EVM” refers to Eaton Vance Management and “EVD” refers to Eaton Vance Distributors, Inc. EV is the trustee of each of EVM and BMR. Effective March 1, 2021, each of EVM, BMR, EVD and EV are indirect, wholly owned subsidiaries of Morgan Stanley. Each officer affiliated with EVM may hold a position with other EVM affiliates that is comparable to his or her position with EVM listed below. Each Trustee oversees 138 funds (with the exception of Messrs. Faust and Wennerholm and Ms. Frost who oversee 137 funds) in the Eaton Vance fund complex (including both funds and portfolios in a hub and spoke structure).
| | | | | | |
| Name and Year of Birth | | Trust
Position(s) | | Length of Service | | Principal Occupation(s) and Other Directorships During Past Five Years and Other Relevant Experience |
|
| Interested Trustee |
| | | |
Thomas E. Faust Jr. 1958 | | Trustee | | Since 2007 | | Chairman of Morgan Stanley Investment Management, Inc. (MSIM), member of the Board of Managers and President of EV, Chief Executive Officer of EVM and BMR, and Director of EVD. Formerly, Chairman, Chief Executive Officer and President of EVC. Mr. Faust is an interested person because of his positions with MSIM, BMR, EVM, EVD, and EV, which are affiliates of the Trust, and his former position with EVC, which was an affiliate of the Trust prior to March 1, 2021. Other Directorships. Formerly, Director of EVC (2007-2021) and Hexavest Inc. (investment management firm) (2012-2021). |
|
| Noninterested Trustees |
| | | |
Mark R. Fetting 1954 | | Trustee | | Since 2016 | | Private investor. Formerly held various positions at Legg Mason, Inc. (investment management firm) (2000-2012), including President, Chief Executive Officer, Director and Chairman (2008-2012), Senior Executive Vice President (2004-2008) and Executive Vice President (2001-2004). Formerly, President of Legg Mason family of funds (2001-2008). Formerly, Division President and Senior Officer of Prudential Financial Group, Inc. and related companies (investment management firm) (1991-2000). Other Directorships. None. |
| | | |
Cynthia E. Frost 1961 | | Trustee | | Since 2014 | | Private investor. Formerly, Chief Investment Officer of Brown University (university endowment) (2000-2012). Formerly, Portfolio Strategist for Duke Management Company (university endowment manager) (1995-2000). Formerly, Managing Director, Cambridge Associates (investment consulting company) (1989-1995). Formerly, Consultant, Bain and Company (management consulting firm) (1987-1989). Formerly, Senior Equity Analyst, BA Investment Management Company (1983-1985). Other Directorships. None. |
| | | |
George J. Gorman 1952 | | Chairperson of the Board and Trustee | | Since 2021 (Chairperson) and 2014 (Trustee) | | Principal at George J. Gorman LLC (consulting firm). Formerly, Senior Partner at Ernst & Young LLP (a registered public accounting firm) (1974-2009). Other Directorships. None. |
| | | |
Valerie A. Mosley 1960 | | Trustee | | Since 2014 | | Chairwoman and Chief Executive Officer of Valmo Ventures (a consulting and investment firm). Founder of Upward Wealth, Inc., dba BrightUP, a fintech platform. Formerly, Partner and Senior Vice President, Portfolio Manager and Investment Strategist at Wellington Management Company, LLP (investment management firm) (1992-2012). Formerly, Chief Investment Officer, PG Corbin Asset Management (1990-1992). Formerly worked in institutional corporate bond sales at Kidder Peabody (1986-1990). Other Directorships. Director of DraftKings, Inc. (digital sports entertainment and gaming company) (since September 2020). Director of Groupon, Inc. (e-commerce provider) (since April 2020). Director of Envestnet, Inc. (provider of intelligent systems for wealth management and financial wellness) (since 2018). Formerly, Director of Dynex Capital, Inc. (mortgage REIT) (2013-2020). |
Parametric
Commodity Strategy Fund
December 31, 2021
Management and Organization — continued
| | | | | | |
| Name and Year of Birth | | Trust
Position(s) | | Length of Service | | Principal Occupation(s) and Other Directorships During Past Five Years and Other Relevant Experience |
|
| Noninterested Trustees (continued) |
| | | |
William H. Park 1947 | | Trustee | | Since 2003 | | Private investor. Formerly, Consultant (management and transactional) (2012-2014). Formerly, Chief Financial Officer, Aveon Group L.P. (investment management firm) (2010-2011). Formerly, Vice Chairman, Commercial Industrial Finance Corp. (specialty finance company) (2006-2010). Formerly, President and Chief Executive Officer, Prizm Capital Management, LLC (investment management firm) (2002-2005). Formerly, Executive Vice President and Chief Financial Officer, United Asset Management Corporation (investment management firm) (1982-2001). Formerly, Senior Manager, Price Waterhouse (now PricewaterhouseCoopers) (a registered public accounting firm) (1972-1981). Other Directorships. None. |
| | | |
Helen Frame Peters 1948 | | Trustee | | Since 2008 | | Professor of Finance, Carroll School of Management, Boston College. Formerly, Dean, Carroll School of Management, Boston College (2000-2002). Formerly, Chief Investment Officer, Fixed Income, Scudder Kemper Investments (investment management firm) (1998-1999). Formerly, Chief Investment Officer, Equity and Fixed Income, Colonial Management Associates (investment management firm) (1991-1998). Other Directorships. None. |
| | | |
Keith Quinton 1958 | | Trustee | | Since 2018 | | Private investor, researcher and lecturer. Formerly, Independent Investment Committee Member at New Hampshire Retirement System (2017-2021). Formerly, Portfolio Manager and Senior Quantitative Analyst at Fidelity Investments (investment management firm) (2001-2014). Other Directorships. Formerly, Director (2016-2021) and Chairman (2019-2021) of New Hampshire Municipal Bond Bank. |
| | | |
Marcus L. Smith 1966 | | Trustee | | Since 2018 | | Private investor. Formerly, Portfolio Manager at MFS Investment Management (investment management firm) (1994-2017). Other Directorships. Director of First Industrial Realty Trust, Inc. (an industrial REIT) (since 2021). Director of MSCI Inc. (global provider of investment decision support tools) (since 2017). Formerly, Director of DCT Industrial Trust Inc. (logistics real estate company) (2017-2018). |
| | | |
Susan J. Sutherland 1957 | | Trustee | | Since 2015 | | Private investor. Director of Ascot Group Limited and certain of its subsidiaries (insurance and reinsurance) (since 2017). Formerly, Director of Hagerty Holding Corp. (insurance) (2015-2018) and Montpelier Re Holdings Ltd. (insurance and reinsurance) (2013-2015). Formerly, Associate, Counsel and Partner at Skadden, Arps, Slate, Meagher & Flom LLP (law firm) (1982-2013). Other Directorships. Director of Kairos Acquisition Corp. (insurance/InsurTech acquisition company) (since 2021). |
| | | |
Scott E. Wennerholm 1959 | | Trustee | | Since 2016 | | Private investor. Formerly, Trustee at Wheelock College (postsecondary institution) (2012-2018). Formerly, Consultant at GF Parish Group (executive recruiting firm) (2016-2017). Formerly, Chief Operating Officer and Executive Vice President at BNY Mellon Asset Management (investment management firm) (2005-2011). Formerly, Chief Operating Officer and Chief Financial Officer at Natixis Global Asset Management (investment management firm) (1997-2004). Formerly, Vice President at Fidelity Investments Institutional Services (investment management firm) (1994-1997). Other Directorships. None. |
| | | | | | |
| Name and Year of Birth | | Trust
Position(s) | | Length of Service | | Principal Occupation(s) During Past Five Years |
|
| Principal Officers who are not Trustees |
| | | |
Eric A. Stein 1980 | | President | | Since 2020 | | Vice President and Chief Investment Officer, Fixed Income of EVM and BMR. Prior to November 1, 2020, Mr. Stein was a co-Director of Eaton Vance’s Global Income Investments. Also Vice President of Calvert Research and Management (“CRM”). |
| | | |
Deidre E. Walsh 1971 | | Vice President and Chief Legal Officer | | Since 2009 | | Vice President of EVM and BMR. Also Vice President of CRM. |
Parametric
Commodity Strategy Fund
December 31, 2021
Management and Organization — continued
| | | | | | |
| Name and Year of Birth | | Trust
Position(s) | | Length of Service | | Principal Occupation(s) During Past Five Years |
|
| Principal Officers who are not Trustees (continued) |
| | | |
James F. Kirchner 1967 | | Treasurer | | Since 2007 | | Vice President of EVM and BMR. Also Vice President of CRM. |
| | | |
Jill R. Damon 1984 | | Secretary | | Since 2022 | | Vice President of EVM and BMR since 2017. Formerly, associate at Dechert LLP (2009-2017). |
| | | |
Richard F. Froio 1968 | | Chief Compliance Officer | | Since 2017 | | Vice President of EVM and BMR since 2017. Formerly, Deputy Chief Compliance Officer (Adviser/Funds) and Chief Compliance Officer (Distribution) at PIMCO (2012-2017) and Managing Director at BlackRock/Barclays Global Investors (2009-2012). |
The SAI for the Fund includes additional information about the Trustees and officers of the Trust and can be obtained without charge on Eaton Vance’s website at www.eatonvance.com or by calling 1-800-262-1122.
Eaton Vance Funds
| | |
| Privacy Notice | | April 2021 |
| | |
| |
| FACTS | | WHAT DOES EATON VANCE DO WITH YOUR
PERSONAL INFORMATION? |
| | | |
| |
| | |
| Why? | | Financial companies choose how they share your personal information. Federal law gives consumers the right to limit some but not all sharing. Federal law also requires us to tell you how we collect, share, and protect your personal information. Please read this notice carefully to understand what we do. |
| | |
| | | |
| What? | | The types of personal information we collect and share depend on the product or service you have with us. This information can include: ∎ Social Security number and income ∎ investment experience and risk tolerance ∎ checking account number and wire transfer instructions |
| | |
| | | |
| How? | | All financial companies need to share customers’ personal information to run their everyday business. In the section below, we list the reasons financial companies can share their customers’ personal information; the reasons Eaton Vance chooses to share; and whether you can limit this sharing. |
| | |
| | | |
| | | | |
Reasons we can share your
personal information | | Does Eaton Vance share? | | Can you limit this sharing? |
| For our everyday business purposes — such as to process your transactions, maintain your account(s), respond to court orders and legal investigations, or report to credit bureaus | | Yes | | No |
| For our marketing purposes — to offer our products and services to you | | Yes | | No |
| For joint marketing with other financial companies | | No | | We don’t share |
| For our investment management affiliates’ everyday business purposes — information about your transactions, experiences, and creditworthiness | | Yes | | Yes |
| For our affiliates’ everyday business purposes — information about your transactions and experiences | | Yes | | No |
| For our affiliates’ everyday business purposes — information about your creditworthiness | | No | | We don’t share |
| For our investment management affiliates to market to you | | Yes | | Yes |
| For our affiliates to market to you | | No | | We don’t share |
| For nonaffiliates to market to you | | No | | We don’t share |
| | |
| To limit our sharing | | Call toll-free 1-800-262-1122 or email: EVPrivacy@eatonvance.com Please note: If you are a new customer, we can begin sharing your information 30 days from the date we sent this notice. When you are no longer our customer, we continue to share your information as described in this notice. However, you can contact us at any time to limit our sharing. |
| | |
| | | |
| | |
| Questions? | | Call toll-free 1-800-262-1122 or email: EVPrivacy@eatonvance.com |
| | |
| | | |
Eaton Vance Funds
| | |
| Privacy Notice — continued | | April 2021 |
| | |
| Who we are |
| Who is providing this notice? | | Eaton Vance Management, Eaton Vance Distributors, Inc., Eaton Vance Trust Company, Eaton Vance Management (International) Limited, Eaton Vance Advisers International Ltd., Eaton Vance Global Advisors Limited, Eaton Vance Management’s Real Estate Investment Group, Boston Management and Research, Calvert Research and Management, Eaton Vance and Calvert Fund Families and our investment advisory affiliates (“Eaton Vance”) (see Investment Management Affiliates definition below) |
| What we do |
| How does Eaton Vance protect my personal information? | | To protect your personal information from unauthorized access and use, we use security measures that comply with federal law. These measures include computer safeguards and secured files and buildings. We have policies governing the proper handling of customer information by personnel and requiring third parties that provide support to adhere to appropriate security standards with respect to such information. |
| How does Eaton Vance collect my personal information? | | We collect your personal information, for example, when you ∎ open an account or make deposits or withdrawals from your account ∎ buy securities from us or make a wire transfer ∎ give us your contact information We also collect your personal information from others, such as credit bureaus, affiliates, or other companies. |
| Why can’t I limit all sharing? | | Federal law gives you the right to limit only ∎ sharing for affiliates’ everyday business purposes — information about your creditworthiness ∎ affiliates from using your information to market to you ∎ sharing for nonaffiliates to market to you State laws and individual companies may give you additional rights to limit sharing. See below for more on your rights under state law. |
| Definitions |
| Investment Management Affiliates | | Eaton Vance Investment Management Affiliates include registered investment advisers, registered broker-dealers, and registered and unregistered funds. Investment Management Affiliates does not include entities associated with Morgan Stanley Wealth Management, such as Morgan Stanley Smith Barney LLC and Morgan Stanley & Co. |
| Affiliates | | Companies related by common ownership or control. They can be financial and nonfinancial companies. ∎ Our affiliates include companies with a Morgan Stanley name and financial companies such as Morgan Stanley Smith Barney LLC and Morgan Stanley & Co. |
| Nonaffiliates | | Companies not related by common ownership or control. They can be financial and nonfinancial companies. ∎ Eaton Vance does not share with nonaffiliates so they can market to you. |
| Joint marketing | | A formal agreement between nonaffiliated financial companies that together market financial products or services to you. ∎ Eaton Vance doesn’t jointly market. |
| Other important information |
Vermont: Except as permitted by law, we will not share personal information we collect about Vermont residents with Nonaffiliates unless you provide us with your written consent to share such information. California: Except as permitted by law, we will not share personal information we collect about California residents with Nonaffiliates and we will limit sharing such personal information with our Affiliates to comply with California privacy laws that apply to us. |
Eaton Vance Funds
IMPORTANT NOTICES
Delivery of Shareholder Documents. The Securities and Exchange Commission (SEC) permits funds to deliver only one copy of shareholder documents, including prospectuses, proxy statements and shareholder reports, to fund investors with multiple accounts at the same residential or post office box address. This practice is often called “householding” and it helps eliminate duplicate mailings to shareholders. Eaton Vance, or your financial intermediary, may household the mailing of your documents indefinitely unless you instruct Eaton Vance, or your financial intermediary, otherwise. If you would prefer that your Eaton Vance documents not be householded, please contact Eaton Vance at 1-800-260-0761, or contact your financial intermediary. Your instructions that householding not apply to delivery of your Eaton Vance documents will typically be effective within 30 days of receipt by Eaton Vance or your financial intermediary.
Portfolio Holdings. Each Eaton Vance Fund and its underlying Portfolio(s) (if applicable) files a schedule of portfolio holdings on Part F to Form N-PORT with the SEC. Certain information filed on Form N-PORT may be viewed on the Eaton Vance website at www.eatonvance.com, by calling Eaton Vance at 1-800-260-0761 or in the EDGAR database on the SEC’s website at www.sec.gov.
Proxy Voting. From time to time, funds are required to vote proxies related to the securities held by the funds. The Eaton Vance Funds or their underlying Portfolios (if applicable) vote proxies according to a set of policies and procedures approved by the Funds’ and Portfolios’ Boards. You may obtain a description of these policies and procedures and information on how the Funds or Portfolios voted proxies relating to portfolio securities during the most recent 12-month period ended June 30, without charge, upon request, by calling 1-800-260-0761 and by accessing the SEC’s website at www.sec.gov.
This Page Intentionally Left Blank
This Page Intentionally Left Blank
This Page Intentionally Left Blank
Investment Adviser and Administrator
Eaton Vance Management
Two International Place
Boston, MA 02110
Investment Sub-Adviser
Parametric Portfolio Associates LLC
800 Fifth Avenue, Suite 2800
Seattle, WA 98104
Principal Underwriter*
Eaton Vance Distributors, Inc.
Two International Place
Boston, MA 02110
(617) 482-8260
Custodian
State Street Bank and Trust Company
State Street Financial Center, One Lincoln Street
Boston, MA 02111
Transfer Agent
BNY Mellon Investment Servicing (US) Inc.
Attn: Eaton Vance Funds
P.O. Box 9653
Providence, RI 02940-9653
(800) 260-0761
Independent Registered Public Accounting Firm
Deloitte & Touche LLP
200 Berkeley Street
Boston, MA 02116-5022
Fund Offices
Two International Place
Boston, MA 02110
| * | FINRA BrokerCheck. Investors may check the background of their Investment Professional by contacting the Financial Industry Regulatory Authority (FINRA). FINRA BrokerCheck is a free tool to help investors check the professional background of current and former FINRA-registered securities firms and brokers. FINRA BrokerCheck is available by calling 1-800-289-9999 and at www.FINRA.org. The FINRA BrokerCheck brochure describing this program is available to investors at www.FINRA.org. |
5255 12.31.21
Item 2. Code of Ethics
The registrant (sometimes referred to as the “Fund”) has adopted a code of ethics applicable to its Principal Executive Officer, Principal Financial Officer and Principal Accounting Officer. The registrant undertakes to provide a copy of such code of ethics to any person upon request, without charge, by calling 1-800-262-1122. The registrant has not amended the code of ethics as described in Form N-CSR during the period covered by this report. The registrant has not granted any waiver, including an implicit waiver, from a provision of the code of ethics as described in Form N-CSR during the period covered by this report.
Item 3. Audit Committee Financial Expert
The registrant’s Board of Trustees (the “Board”) has designated George J. Gorman, William H. Park and Scott E. Wennerholm, each an independent trustee, as audit committee financial experts. Mr. Gorman is a certified public accountant who is the Principal at George J. Gorman LLC (a consulting firm). Previously, Mr. Gorman served in various capacities at Ernst & Young LLP (a registered public accounting firm), including as Senior Partner. Mr. Gorman also has experience serving as an independent trustee and audit committee financial
expert of other mutual fund complexes. Mr. Park is a certified public accountant who is a private investor. Previously, he served as a consultant, as the Chief Financial Officer of Aveon Group, L.P. (an investment management firm), as the Vice Chairman of Commercial Industrial Finance Corp. (specialty finance company), as President and Chief Executive Officer of Prizm Capital Management, LLC (investment management firm), as Executive Vice President and Chief Financial Officer of United Asset Management Corporation (an institutional investment management firm) and as a Senior Manager at Price Waterhouse (now PricewaterhouseCoopers) (a registered public accounting firm). Mr. Wennerholm is a private investor. Previously, Mr. Wennerholm served as a Trustee at Wheelock College (postsecondary institution), as a Consultant at GF Parish Group (executive recruiting firm), Chief Operating Officer and Executive Vice President at BNY Mellon Asset Management (investment management firm), Chief Operating Officer and Chief Financial Officer at Natixis Global Asset Management (investment management firm), and Vice President at Fidelity Investments Institutional Services (investment management firm).
Item 4. Principal Accountant Fees and Services
Parametric Commodity Strategy Fund, Eaton Vance Stock Fund, Eaton Vance Tax-Managed Growth Fund 1.1 and Eaton Vance Tax-Managed Growth Fund 1.2 (the “Fund(s)”) are series of Eaton Vance Mutual Funds Trust (the “Trust”), a Massachusetts business trust, which, including the Funds, contains a total of 34 series (the “Series”). The Trust is registered under the Investment Company Act of 1940 as an open-end management investment company. This Form N-CSR relates to the Funds’ annual reports.
(a)-(d)
The following tables present the aggregate fees billed to each Fund for the Fund’s fiscal years ended December 31, 2020 and December 31, 2021 by the registrant’s principal accountant, Deloitte & Touche LLP (“D&T”), for professional services rendered for the audit of the Fund’s annual financial statements and fees billed for other services rendered by D&T during such periods.
Parametric Commodity Strategy Fund
| | | | | | | | |
Fiscal Years Ended | | 12/31/20 | | | 12/31/21 | |
Audit Fees | | $ | 52,950 | | | $ | 57,950 | |
Audit-Related Fees(1) | | $ | 0 | | | $ | 0 | |
Tax Fees(2) | | $ | 37,129 | | | $ | 37,479 | |
All Other Fees(3) | | $ | 0 | | | $ | 0 | |
| | | | | | | | |
Total | | $ | 90,079 | | | $ | 95,429 | |
| | | | | | | | |
Eaton Vance Stock Fund
| | | | | | | | |
Fiscal Years Ended | | 12/31/20 | | | 12/31/21 | |
Audit Fees | | $ | 16,050 | | | $ | 16,050 | |
Audit-Related Fees(1) | | $ | 0 | | | $ | 0 | |
Tax Fees(2) | | $ | 8,355 | | | $ | 8,705 | |
All Other Fees(3) | | $ | 0 | | | $ | 0 | |
| | | | | | | | |
Total | | $ | 24,405 | | | $ | 24,755 | |
| | | | | | | | |
Eaton Vance Tax-Managed Growth Fund 1.1
| | | | | | | | |
Fiscal Years Ended | | 12/31/20 | | | 12/31/21 | |
Audit Fees | | $ | 18,850 | | | $ | 18,850 | |
Audit-Related Fees(1) | | $ | 0 | | | $ | 0 | |
Tax Fees(2) | | $ | 7,427 | | | $ | 7,777 | |
All Other Fees(3) | | $ | 0 | | | $ | 0 | |
| | | | | | | | |
Total | | $ | 26,277 | | | $ | 26,627 | |
| | | | | | | | |
Eaton Vance Tax-Managed Growth Fund 1.2
| | | | | | | | |
Fiscal Years Ended | | 12/31/20 | | | 12/31/21 | |
Audit Fees | | $ | 18,850 | | | $ | 18,850 | |
Audit-Related Fees(1) | | $ | 0 | | | $ | 0 | |
Tax Fees(2) | | $ | 7,427 | | | $ | 7,777 | |
All Other Fees(3) | | $ | 0 | | | $ | 0 | |
| | | | | | | | |
Total | | $ | 26,277 | | | $ | 26,627 | |
| | | | | | | | |
| (1) | Audit-related fees consist of the aggregate fees billed for assurance and related services that are reasonably related to the performance of the audit of financial statements and are not reported under the category of audit fees. |
| (2) | Tax fees consist of the aggregate fees billed for professional services rendered by the principal accountant relating to tax compliance, tax advice, and tax planning and specifically include fees for tax return preparation and other related tax compliance/planning matters. |
| (3) | All other fees consist of the aggregate fees billed for products and services provided by the principal accountant other than audit, audit-related, and tax services. |
The various Series comprising the Trust have differing fiscal year ends (January 31, February 28/29, September 30, October 31, November 30 or December 31). The following table presents the aggregate audit, audit-related, tax, and other fees billed to all of the Series in the Trust by D&T for the last two fiscal years of each Series.
| | | | | | | | | | | | | | | | | | | | | | | | | | | | | | | | | | | | | | | | | | | | |
Fiscal Years Ended* | | 1/31/20 | | | 2/29/20 | | | 9/30/20 | | | 10/31/20 | | | 12/31/20 | | | 1/31/21 | | | 2/28/21 | | | 9/30/21 | | | 10/31/21 | | | 11/30/21 | | | 12/31/21 | |
Audit Fees | | $ | 156,850 | | | $ | 26,250 | | | $ | 110,800 | | | $ | 719,575 | | | $ | 106,700 | | | $ | 201,300 | | | $ | 26,250 | | | $ | 91,600 | | | $ | 729,872 | | | $ | 37,050 | | | $ | 111,700 | |
Audit-Related Fees(1) | | $ | 0 | | | $ | 0 | | | $ | 0 | | | $ | 0 | | | $ | 0 | | | $ | 0 | | | $ | 0 | | | $ | 0 | | | $ | 0 | | | $ | 0 | | | $ | 0 | |
Tax Fees(2) | | $ | 69,073 | | | $ | 11,413 | | | $ | 24,948 | | | $ | 260,719 | | | $ | 60,338 | | | $ | 73,973 | | | $ | 10,103 | | | $ | 23,248 | | | $ | 271,569 | | | $ | 13,000 | | | $ | 61,738 | |
All Other Fees(3) | | $ | 0 | | | $ | 0 | | | $ | 0 | | | $ | 0 | | | $ | 0 | | | $ | 0 | | | $ | 0 | | | $ | 0 | | | $ | 0 | | | $ | 0 | | | $ | 0 | |
| | | | | | | | | | | | | | | | | | | | | | | | | | | | | | | | | | | | | | | | | | | | |
Total | | $ | 225,923 | | | $ | 37,663 | | | $ | 135,748 | | | $ | 980,294 | | | $ | 167,038 | | | $ | 275,273 | | | $ | 36,353 | | | $ | 114,848 | | | $ | 1,001,441 | | | $ | 50,050 | | | $ | 173,438 | |
| | | | | | | | | | | | | | | | | | | | | | | | | | | | | | | | | | | | | | | | | | | | |
| * | Information is not presented for the fiscal year ended 11/30/20, as no Series in the Trust with such fiscal year end was in operation during such period. |
| (1) | Audit-related fees consist of the aggregate fees billed for assurance and related services that are reasonably related to the performance of the audit of financial statements and are not reported under the category of audit fees. |
| (2) | Tax fees consist of the aggregate fees billed for professional services rendered by the principal accountant relating to tax compliance, tax advice, and tax planning and specifically include fees for tax return preparation and other related tax compliance/planning matters. |
| (3) | All other fees consist of the aggregate fees billed for products and services provided by the principal accountant other than audit, audit-related, and tax services. |
(e)(1) The registrant’s audit committee has adopted policies and procedures relating to the pre-approval of services provided by the registrant’s principal accountant (the “Pre-Approval Policies”). The Pre-Approval Policies establish a framework intended to assist the audit committee in the proper discharge of its pre-approval responsibilities. As a general matter, the Pre-Approval Policies (i) specify certain types of audit, audit-related, tax, and other services determined to be pre-approved by the audit committee; and (ii) delineate specific procedures governing the mechanics of the pre-approval process, including the approval and monitoring of audit and non-audit service fees. Unless a service is specifically pre-approved under the Pre-Approval Policies, it must be separately pre-approved by the audit committee.
The Pre-Approval Policies and the types of audit and non-audit services pre-approved therein must be reviewed and ratified by the registrant’s audit committee at least annually. The registrant’s audit committee maintains full responsibility for the appointment, compensation, and oversight of the work of the registrant’s principal accountant.
(e)(2) No services described in paragraphs (b)-(d) above were approved by the registrant’s audit committee pursuant to the “de minimis exception” set forth in Rule 2-01(c)(7)(i)(C) of Regulation S-X.
(f) Not applicable.
(g) The following table presents (i) the aggregate non-audit fees (i.e., fees for audit-related, tax, and other services) billed for services rendered to all of the Series in the Trust by D&T for the last two fiscal years of each Series; and (ii) the aggregate non-audit fees (i.e., fees for audit-related, tax, and other services) billed to the Eaton Vance organization by D&T for the last two fiscal years of each Series.
| | | | | | | | | | | | | | | | | | | | | | | | | | | | | | | | | | | | | | | | | | | | |
Fiscal Years Ended* | | 1/31/20 | | | 2/29/20 | | | 9/30/20 | | | 10/31/20 | | | 12/31/20 | | | 1/31/21 | | | 2/28/21 | | | 9/30/21 | | | 10/31/21 | | | 11/30/21 | | | 12/31/21 | |
Registrant(1) | | $ | 69,073 | | | $ | 11,413 | | | $ | 24,948 | | | $ | 260,719 | | | $ | 60,338 | | | $ | 73,973 | | | $ | 10,103 | | | $ | 23,248 | | | $ | 271,569 | | | $ | 13,000 | | | $ | 61,738 | |
Eaton Vance(2) | | $ | 59,903 | | | $ | 59,903 | | | $ | 51,800 | | | $ | 51,800 | | | $ | 150,300 | | | $ | 150,300 | | | $ | 150,300 | | | $ | 51,800 | | | $ | 51,800 | | | $ | 51,800 | | | $ | 51,800 | |
| * | Information is not presented for the fiscal year ended 11/30/20, as no Series in the Trust with such fiscal year end was in operation during such period. |
| (1) | Includes all of the Series of the Trust. During the fiscal years reported above, certain of the Funds were “feeder” funds in a “master-feeder” fund structure or funds of funds. |
| (2) | Various subsidiaries of Morgan Stanley act in either an investment advisory and/or service provider capacity with respect to the Series and/or their respective “master” funds (if applicable). |
(h) The registrant’s audit committee has considered whether the provision by the registrant’s principal accountant of non-audit services to the registrant’s investment adviser and any entity controlling, controlled by, or under common control with the adviser that provides ongoing services to the registrant that were not pre-approved pursuant to Rule 2-01(c)(7)(ii) of Regulation S-X is compatible with maintaining the principal accountant’s independence.
Item 5. Audit Committee of Listed Registrants
Not applicable.
Item 6. Schedule of Investments
Please see schedule of investments contained in the Report to Stockholders included under Item 1 of this Form N-CSR.
Item 7. Disclosure of Proxy Voting Policies and Procedures for Closed-End Management Investment Companies
Not applicable.
Item 8. Portfolio Managers of Closed-End Management Investment Companies
Not applicable.
Item 9. Purchases of Equity Securities by Closed-End Management Investment Company and Affiliated Purchasers
Not applicable.
Item 10. Submission of Matters to a Vote of Security Holders
No material changes.
Item 11. Controls and Procedures
(a) It is the conclusion of the registrant’s principal executive officer and principal financial officer that the effectiveness of the registrant’s current disclosure controls and procedures (such disclosure controls and procedures having been evaluated within 90 days of the date of this filing) provide reasonable assurance that the information required to be disclosed by the registrant has been recorded, processed, summarized and reported within the time period specified in the Commission’s rules and forms and that the information required to be disclosed by the registrant has been accumulated and communicated to the registrant’s principal executive officer and principal financial officer in order to allow timely decisions regarding required disclosure.
(b) There have been no changes in the registrant’s internal controls over financial reporting during the period covered by this report that has materially affected, or is reasonably likely to materially affect, the registrant’s internal control over financial reporting.
Item 12. Disclosure of Securities Lending Activities for Closed-End Management Investment Companies
Not applicable.
Item 13. Exhibits
Signatures
Pursuant to the requirements of the Securities Exchange Act of 1934 and the Investment Company Act of 1940, the registrant has duly caused this report to be signed on its behalf by the undersigned, thereunto duly authorized.
| | |
| Eaton Vance Mutual Funds Trust |
| |
| By: | | /s/ Eric A. Stein |
| | Eric A. Stein |
| | President |
| |
| Date: | | February 23, 2022 |
Pursuant to the requirements of the Securities Exchange Act of 1934 and the Investment Company Act of 1940, this report has been signed below by the following persons on behalf of the registrant and in the capacities and on the dates indicated.
| | |
| By: | | /s/ James F. Kirchner |
| | James F. Kirchner |
| | Treasurer |
| |
| Date: | | February 23, 2022 |
| |
| By: | | /s/ Eric A. Stein |
| | Eric A. Stein |
| | President |
| |
| Date: | | February 23, 2022 |