UNITED STATES
SECURITIES AND EXCHANGE COMMISSION
Washington, D.C. 20549
Form N-CSR
CERTIFIED SHAREHOLDER REPORT OF REGISTERED
MANAGEMENT INVESTMENT COMPANIES
Investment Company Act File Number: 811-04015
Eaton Vance Mutual Funds Trust
(Exact Name of Registrant as Specified in Charter)
Two International Place, Boston, Massachusetts 02110
(Address of Principal Executive Offices)
Deidre E. Walsh
Two International Place, Boston, Massachusetts 02110
(Name and Address of Agent for Services)
(617) 482-8260
(Registrant’s Telephone Number)
October 31
Date of Fiscal Year End
October 31, 2022
Date of Reporting Period
Item 1. Reports to Stockholders

Eaton Vance
Tax-Managed Equity Asset Allocation Fund
Annual Report
October 31, 2022

Commodity Futures Trading Commission Registration. The Commodity Futures Trading Commission (“CFTC”) has adopted regulations that subject registered investment companies and advisers to regulation by the CFTC if a fund invests more than a prescribed level of its assets in certain CFTC-regulated instruments (including futures, certain options and swap agreements) or markets itself as providing investment exposure to such instruments. The investment adviser has claimed an exclusion from the definition of “commodity pool operator” under the Commodity Exchange Act with respect to its management of the Fund. Accordingly, neither the Fund nor the adviser with respect to the operation of the Fund is subject to CFTC regulation. Because of its management of other strategies, the Fund’s adviser is registered with the CFTC as a commodity pool operator. The adviser is also registered as a commodity trading advisor.
Fund shares are not insured by the FDIC and are not deposits or other obligations of, or guaranteed by, any depository institution. Shares are subject to investment risks, including possible loss of principal invested.
This report must be preceded or accompanied by a current summary prospectus or prospectus. Before investing, investors should consider carefully the investment objective, risks, and charges and expenses of a mutual fund. This and other important information is contained in the summary prospectus and prospectus, which can be obtained from a financial intermediary. Prospective investors should read the prospectus carefully before investing. For further information, please call 1-800-262-1122.
Annual Report October 31, 2022
Eaton Vance
Tax-Managed Equity Asset Allocation Fund
Eaton Vance
Tax-Managed Equity Asset Allocation Fund
October 31, 2022
Management’s Discussion of Fund Performance†
Economic and Market Conditions
The 12-month period starting November 1, 2021, was dominated by the ongoing effects of one black swan event — the COVID-19 pandemic — and fallout from another — Russia’s invasion of Ukraine in February 2022.
In the opening months of the period, stock investors as well as consumers appeared to take a “glass is half full” approach. In both the U.S. and Europe, consumers rushed to spend money saved earlier in the pandemic. Major U.S. equity indexes closed at new all-time highs during the final months of 2021.
But as the new year began, investors appeared to reevaluate the twin threats of inflation and interest rate hikes, and stock performance turned negative. In February, Russia’s invasion of Ukraine sent shock waves through U.S. and global markets, exacerbating inflationary pressures on energy and food costs. Central banks around the world — including the U.S. Federal Reserve (the Fed), the Bank of England, and the European Central Bank (ECB) — initiated their first interest rate hikes in years. In Europe, looming energy shortages caused by the Russia-Ukraine conflict pushed inflation rates even higher and stock prices lower during the period.
In the U.S., investors began to expect the Fed would raise interest rates at every policy meeting in 2022 and, in turn, worried that aggressive rate hikes could tip the economy into recession. At its June, July, and September 2022 meetings, the Fed hiked the federal funds rate 0.75% each time — to a 3.00%-3.25% range — its first moves of that magnitude since 1994. Higher interest rates, inflation, and recessionary worries drove stock prices down around the globe.
As the period came to a close in October 2022, however, U.S. and European stocks delivered positive performance for the first time in months — driven by a combination of better-than-expected U.S. company earnings; improving investor sentiment that stocks had been oversold during the August-September market pullback; government measures to address Europe’s energy crisis; and hope that central bank rate hikes would help tame inflation.
Meanwhile in the world’s second-largest economy, China’s zero-COVID policy severely restricted economic output. The MSCI Golden Dragon Index, a measure of Chinese large-cap and mid-cap stocks, lost more ground in October and was one of the worst-performing major indexes during the period, declining 42.74%.
Major equity indexes elsewhere also suffered significant losses. For the period as a whole, the MSCI ACWI Index, a broad measure of global equities, returned -19.96%; the S&P 500® Index, a broad measure of U.S. stocks, returned -14.61%; and the technology-laden Nasdaq Composite Index returned -28.56%. The MSCI EAFE Index of developed-market international equities returned -23.00%, while the MSCI Emerging Markets Index, dragged down by its China allocation, returned -31.03% during the period.
Fund Performance
For the 12-month period ended October 31, 2022, Eaton Vance Tax-Managed Equity Asset Allocation Fund (the Fund) returned -16.91% for Class A shares at net asset value (NAV). The Fund underperformed its primary benchmark, the Russell 3000® Index (the Index), which returned -16.52%; and outperformed its secondary benchmark consisting of 80% the Index, 10% MSCI EAFE Index, and 10% ICE BofA Fixed Rate Preferred Securities Index (the Blended Index), which returned -17.08% during the period.
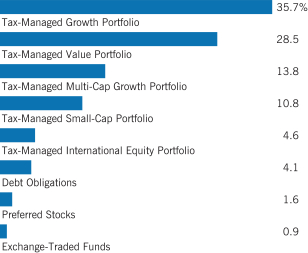
The Fund’s performance is a function of the returns of the underlying portfolios in which it invests and the Fund’s allocation among these portfolios, as well as the performance of the Fund’s direct investments. The Fund invests in tax-managed portfolios across equity market capitalizations and investment styles, as well as direct investments, which include preferred stocks and hybrid securities.
Most major equity asset classes delivered negative returns during the period. Amid the worldwide stock market decline, U.S. equities generally outperformed international markets. U.S. large-cap stocks modestly outperformed U.S. small-cap stocks during the period, while U.S. value stocks — both large-cap and small-cap — declined less than their growth stock counterparts. In this volatile market, the Fund’s international and U.S. multi-cap allocations were the largest drags on Fund performance relative to the U.S.-based, large-cap weighted Index.
The Fund’s allocations to Tax-Managed Growth Portfolio, Tax-Managed Multi-Cap Growth Portfolio, and Tax-Managed International Equity Portfolio all underperformed the Index and detracted from Fund performance versus the Index during the period. In contrast, the Fund’s allocations to Tax-Managed Value Portfolio and Tax-Managed Small-Cap Portfolio outperformed the Index and contributed to returns relative to the Index. The Fund’s direct investments in preferred stocks and other hybrid securities also outperformed the Index and contributed modestly to relative performance.
Fund management made no significant changes to the Fund’s allocation mix during the period. As of period-end, allocations to the Fund’s underlying components were as follows: Tax-Managed Multi-Cap Growth Portfolio (13.8%); Tax-Managed Growth Portfolio (35.7%); Tax-Managed Value Portfolio (28.5%); Tax-Managed International Equity Portfolio (4.6%); Tax-Managed Small-Cap Portfolio (10.8%); and direct investments in preferred stocks and other hybrid securities, including exchange-traded funds that invest in preferred securities and similar instruments (6.6%).
See Endnotes and Additional Disclosures in this report.
Past performance is no guarantee of future results. Returns are historical and are calculated by determining the percentage change in net asset value (NAV) or offering price (as applicable) with all distributions reinvested. Furthermore, returns do not reflect the deduction of taxes that shareholders may have to pay on Fund distributions or upon the redemption of Fund shares. Investment return and principal value will fluctuate so that shares, when redeemed, may be worth more or less than their original cost. Performance for periods less than or equal to one year is cumulative. Performance is for the stated time period only; due to market volatility, current Fund performance may be lower or higher than the quoted return. For performance as of the most recent month-end, please refer to eatonvance.com.
Eaton Vance
Tax-Managed Equity Asset Allocation Fund
October 31, 2022
Performance
Portfolio Manager(s) John H. Croft, CFA and Douglas R. Rogers, CFA, CMT
| | | | | | | | | | | | | | | | | | | | |
| % Average Annual Total Returns1,2 | | Class
Inception Date | | | Performance
Inception Date | | | One Year | | | Five Years | | | Ten Years | |
| | | | | |
Class A at NAV | | | 03/04/2002 | | | | 03/04/2002 | | | | (16.91 | )% | | | 7.32 | % | | | 9.68 | % |
Class A with 5.25% Maximum Sales Charge | | | — | | | | — | | | | (21.28 | ) | | | 6.17 | | | | 9.09 | |
Class C at NAV | | | 03/04/2002 | | | | 03/04/2002 | | | | (17.53 | ) | | | 6.52 | | | | 9.02 | |
Class C with 1% Maximum Deferred Sales Charge | | | — | | | | — | | | | (18.34 | ) | | | 6.52 | | | | 9.02 | |
Class I at NAV | | | 09/11/2015 | | | | 03/04/2002 | | | | (16.68 | ) | | | 7.59 | | | | 9.87 | |
|
| |
| | | | | |
Russell 3000® Index | | | — | | | | — | | | | (16.52 | )% | | | 9.86 | % | | | 12.45 | % |
MSCI EAFE Index | | | — | | | | — | | | | (23.00 | ) | | | (0.09 | ) | | | 4.12 | |
ICE BofA Fixed Rate Preferred Securities Index | | | — | | | | — | | | | (16.32 | ) | | | 0.60 | | | | 3.33 | |
Blended Index | | | — | | | | — | | | | (17.08 | ) | | | 7.99 | | | | 10.75 | |
| | | | | |
| % After-Tax Returns with Maximum Sales Charge2 | | Class
Inception Date | | | Performance
Inception Date | | | One Year | | | Five Years | | | Ten Years | |
| | | | | |
Class A After Taxes on Distributions | | | 03/04/2002 | | | | 03/04/2002 | | | | (21.68 | )% | | | 5.72 | % | | | 8.33 | % |
Class A After Taxes on Distributions and Sale of Fund Shares | | | — | | | | — | | | | (12.04 | ) | | | 4.98 | | | | 7.47 | |
| | | | | |
Class C After Taxes on Distributions | | | 03/04/2002 | | | | 03/04/2002 | | | | (18.70 | ) | | | 6.18 | | | | 8.35 | |
Class C After Taxes on Distributions and Sale of Fund Shares | | | — | | | | — | | | | (10.35 | ) | | | 5.30 | | | | 7.45 | |
| | | | | |
Class I After Taxes on Distributions | | | 09/11/2015 | | | | 03/04/2002 | | | | (17.15 | ) | | | 7.07 | | | | 9.06 | |
Class I After Taxes on Distributions and Sale of Fund Shares | | | — | | | | — | | | | (9.24 | ) | | | 6.16 | | | | 8.15 | |
| | | | | |
| % Total Annual Operating Expense Ratios3 | | | | | | | | Class A | | | Class C | | | Class I | |
| | | | | |
| | | | | | | | | | | 1.20 | % | | | 1.95 | % | | | 0.95 | % |
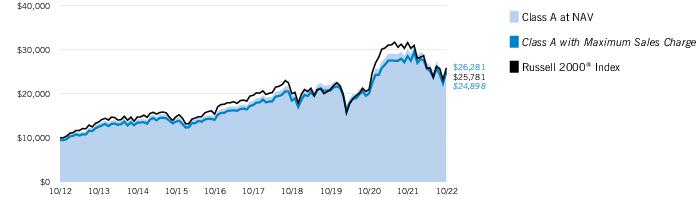
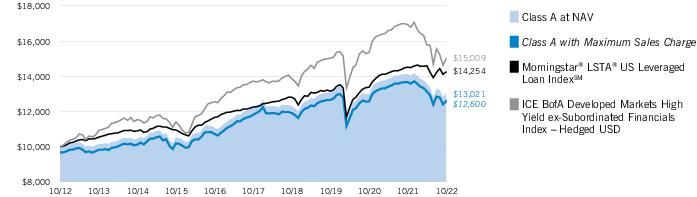
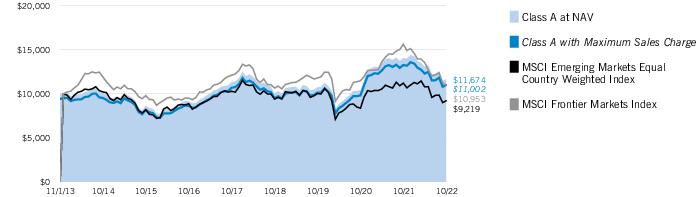
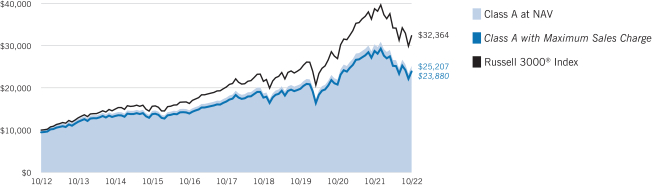
Growth of $10,000
This graph shows the change in value of a hypothetical investment of $10,000 in Class A of the Fund for the period indicated. For comparison, the same investment is shown in the indicated index.
| | | | | | | | | | | | | | | | |
| Growth of Investment2 | | Amount Invested | | | Period Beginning | | | At NAV | | | With Maximum Sales Charge | |
| | | | |
Class C | | | $10,000 | | | | 10/31/2012 | | | | $23,728 | | | | N.A. | |
Class I, at minimum investment | | | $1,000,000 | | | | 10/31/2012 | | | | $2,564,905 | | | | N.A. | |
See Endnotes and Additional Disclosures in this report.
Past performance is no guarantee of future results. Returns are historical and are calculated by determining the percentage change in net asset value (NAV) or offering price (as applicable) with all distributions reinvested. Furthermore, returns do not reflect the deduction of taxes that shareholders may have to pay on Fund distributions or upon the redemption of Fund shares. Investment return and principal value will fluctuate so that shares, when redeemed, may be worth more or less than their original cost. Performance for periods less than or equal to one year is cumulative. Performance is for the stated time period only; due to market volatility, current Fund performance may be lower or higher than the quoted return. For performance as of the most recent month-end, please refer to eatonvance.com.
Eaton Vance
Tax-Managed Equity Asset Allocation Fund
October 31, 2022
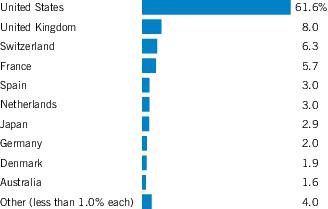
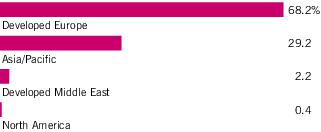
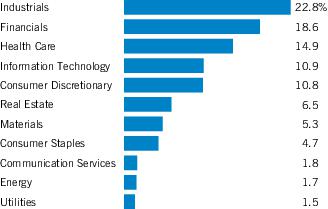
Fund Profile
Portfolio Allocation (% of total investments)1
Footnotes:
| 1 | Fund primarily invests in one or more affiliated investment companies (Portfolios) and may also invest directly. Unless otherwise noted, references to investments are to the aggregate holdings of the Fund, including its pro rata share of each Portfolio or Fund in which it invests. Debt obligations are hybrid instruments, as determined by the investment adviser. These instruments have characteristics of both equity and debt. |
Eaton Vance
Tax-Managed Equity Asset Allocation Fund
October 31, 2022
Endnotes and Additional Disclosures
| † | The views expressed in this report are those of the portfolio manager(s) and are current only through the date stated at the top of this page. These views are subject to change at any time based upon market or other conditions, and Eaton Vance and the Fund(s) disclaim any responsibility to update such views. These views may not be relied upon as investment advice and, because investment decisions are based on many factors, may not be relied upon as an indication of trading intent on behalf of any Eaton Vance fund. This commentary may contain statements that are not historical facts, referred to as “forward-looking statements.” The Fund’s actual future results may differ significantly from those stated in any forward-looking statement, depending on factors such as changes in securities or financial markets or general economic conditions, the volume of sales and purchases of Fund shares, the continuation of investment advisory, administrative and service contracts, and other risks discussed from time to time in the Fund’s filings with the Securities and Exchange Commission. |
| 1 | Russell 3000® Index is an unmanaged index of the 3,000 largest U.S. stocks. MSCI EAFE Index is an unmanaged index of equities in the developed markets, excluding the U.S. and Canada. MSCI indexes are net of foreign withholding taxes. Source: MSCI. MSCI data may not be reproduced or used for any other purpose. MSCI provides no warranties, has not prepared or approved this report, and has no liability hereunder. ICE BofA Fixed Rate Preferred Securities Index is an unmanaged index of fixed-rate, preferred securities issued in the U.S. ICE® BofA® indices are not for redistribution or other uses; provided “as is”, without warranties, and with no liability. Eaton Vance has prepared this report and ICE Data Indices, LLC does not endorse it, or guarantee, review, or endorse Eaton Vance’s products. BofA® is a licensed registered trademark of Bank of America Corporation in the United States and other countries. The Blended Index consists of 80% Russell 3000® Index, 10% MSCI EAFE Index and 10% ICE BofA Fixed Rate Preferred Securities Index, rebalanced monthly. Unless otherwise stated, index returns do not reflect the effect of any applicable sales charges, commissions, expenses, taxes or leverage, as applicable. It is not possible to invest directly in an index. |
| 2 | Total Returns at NAV do not include applicable sales charges. If sales charges were deducted, the returns would be lower. Total Returns shown with maximum sales charge reflect the stated maximum sales charge. Unless otherwise stated, performance does not reflect the deduction of taxes on Fund distributions or redemptions of Fund shares. After-tax returns are calculated using certain assumptions, including using the highest historical individual federal income tax rates, and do not reflect the impact of state/local taxes. Actual after-tax returns depend on a shareholder’s tax situation and the actual characterization of distributions and may differ from those shown. After-tax returns are not relevant to shareholders who hold shares in tax-deferred accounts or shares held by nontaxable entities. Return After Taxes on Distributions may be the same as Return Before Taxes for the same period because no taxable distributions were made during that period. Return After Taxes on Distributions and Sale of Fund Shares may be greater than or equal to Return After Taxes on Distributions for the same period because of losses realized on the sale of Fund shares. The Fund’s after-tax returns also may reflect foreign tax credits passed by the Fund to its shareholders. |
Performance prior to the inception date of a class may be linked to the performance of an older class of the Fund. This linked performance is
adjusted for any applicable sales charge, but is not adjusted for class expense differences. If adjusted for such differences, the performance would be different. The performance of Class I is linked to Class A. Performance presented in the Financial Highlights included in the financial statements is not linked.
Effective November 5, 2020, Class C shares automatically convert to Class A shares eight years after purchase. The average annual total returns listed for Class C reflect conversion to Class A shares after eight years. Prior to November 5, 2020, Class C shares automatically converted to Class A shares ten years after purchase.
| 3 | Source: Fund prospectus. The expense ratios for the current reporting period can be found in the Financial Highlights section of this report. Performance reflects expenses waived and/or reimbursed, if applicable. Without such waivers and/or reimbursements, performance would have been lower. |
Fund profile subject to change due to active management.
Important Notice to Shareholders
Effective November 18, 2022, the portfolio manager of the Fund is Douglas R. Rogers, CFA, CMT.
Additional Information
S&P 500® Index is an unmanaged index of large-cap stocks commonly used as a measure of U.S. stock market performance. S&P Dow Jones Indices are a product of S&P Dow Jones Indices LLC (“S&P DJI”) and have been licensed for use. S&P® and S&P 500® are registered trademarks of S&P DJI; Dow Jones® is a registered trademark of Dow Jones Trademark Holdings LLC (“Dow Jones”); S&P DJI, Dow Jones and their respective affiliates do not sponsor, endorse, sell or promote the Fund, will not have any liability with respect thereto and do not have any liability for any errors, omissions, or interruptions of the S&P Dow Jones Indices. Nasdaq Composite Index is a market capitalization-weighted index of all domestic and international securities listed on Nasdaq. Source: Nasdaq, Inc. The information is provided by Nasdaq (with its affiliates, are referred to as the “Corporations”) and Nasdaq’s third party licensors on an “as is” basis and the Corporations make no guarantees and bear no liability of any kind with respect to the information or the Fund. MSCI Golden Dragon Index is an unmanaged index of common stocks traded in China, Hong Kong and Taiwan. MSCI ACWI Index is an unmanaged free-float-adjusted, market-capitalization-weighted index designed to measure the equity market performance of developed and emerging markets. MSCI Emerging Markets Index is an unmanaged index of emerging markets common stocks.
Eaton Vance
Tax-Managed Equity Asset Allocation Fund
October 31, 2022
Fund Expenses
Example
As a Fund shareholder, you incur two types of costs: (1) transaction costs, including sales charges (loads) on purchases and redemption fees (if applicable); and (2) ongoing costs, including management fees; distribution and/or service fees; and other Fund expenses. This Example is intended to help you understand your ongoing costs (in dollars) of Fund investing and to compare these costs with the ongoing costs of investing in other mutual funds. The Example is based on an investment of $1,000 invested at the beginning of the period and held for the entire period (May 1, 2022 to October 31, 2022).
Actual Expenses
The first section of the table below provides information about actual account values and actual expenses. You may use the information in this section, together with the amount you invested, to estimate the expenses that you paid over the period. Simply divide your account value by $1,000 (for example, an $8,600 account value divided by $1,000 = 8.6), then multiply the result by the number in the first section under the heading entitled “Expenses Paid During Period” to estimate the expenses you paid on your account during this period.
Hypothetical Example for Comparison Purposes
The second section of the table below provides information about hypothetical account values and hypothetical expenses based on the actual Fund expense ratio and an assumed rate of return of 5% per year (before expenses), which is not the actual Fund return. The hypothetical account values and expenses may not be used to estimate the actual ending account balance or expenses you paid for the period. You may use this information to compare the ongoing costs of investing in your Fund and other funds. To do so, compare this 5% hypothetical example with the 5% hypothetical examples that appear in the shareholder reports of the other funds.
Please note that the expenses shown in the table are meant to highlight your ongoing costs only and do not reflect any transactional costs, such as sales charges (loads) or redemption fees (if applicable). Therefore, the second section of the table is useful in comparing ongoing costs only, and will not help you determine the relative total costs of owning different funds. In addition, if these transactional costs were included, your costs would be higher.
| | | | | | | | | | | | | | | | |
| | | Beginning
Account Value
(5/1/22) | | | Ending
Account Value
(10/31/22) | | | Expenses Paid
During Period*
(5/1/22 – 10/31/22) | | | Annualized
Expense
Ratio | |
| | | | |
Actual | | | | | | | | | | | | | | | | |
Class A | | $ | 1,000.00 | | | $ | 946.50 | | | $ | 6.13 | | | | 1.25 | % |
Class C | | $ | 1,000.00 | | | $ | 942.80 | | | $ | 9.79 | | | | 2.00 | % |
Class I | | $ | 1,000.00 | | | $ | 947.90 | | | $ | 4.91 | | | | 1.00 | % |
| | | | | |
Hypothetical | | | | | | | | | | | | | | | | |
(5% return per year before expenses) | | | | | | | | | | | | | | | | |
Class A | | $ | 1,000.00 | | | $ | 1,018.90 | | | $ | 6.36 | | | | 1.25 | % |
Class C | | $ | 1,000.00 | | | $ | 1,015.12 | | | $ | 10.16 | | | | 2.00 | % |
Class I | | $ | 1,000.00 | | | $ | 1,020.16 | | | $ | 5.09 | | | | 1.00 | % |
| * | Expenses are equal to the Fund’s annualized expense ratio for the indicated Class, multiplied by the average account value over the period, multiplied by 184/365 (to reflect the one-half year period). The Example assumes that the $1,000 was invested at the net asset value per share determined at the close of business on April 30, 2022. The Example reflects the expenses of both the Fund and the Portfolios. |
Eaton Vance
Tax-Managed Equity Asset Allocation Fund
October 31, 2022
Portfolio of Investments
| | | | | | | | |
| Investments in Affiliated Portfolios — 93.5% | |
| Description | | | | | Value | |
| | |
Tax-Managed Growth Portfolio
(identified cost, $72,982,061) | | | | | | $ | 201,886,366 | |
| | |
Tax-Managed International Equity Portfolio
(identified cost, $26,797,225) | | | | | | | 26,020,381 | |
| | |
Tax-Managed Multi-Cap Growth Portfolio
(identified cost, $33,790,952) | | | | | | | 78,228,784 | |
| | |
Tax-Managed Small-Cap Portfolio
(identified cost, $52,931,170) | | | | | | | 61,217,994 | |
| | |
Tax-Managed Value Portfolio
(identified cost, $94,750,801) | | | | | | | 161,144,461 | |
| |
Total Investments in Affiliated Portfolios
(identified cost $281,252,209) | | | $ | 528,497,986 | |
|
| Debt Obligations — 4.0%(1) | |
| Security | | Principal
Amount
(000’s omitted) | | | Value | |
|
| Banks — 2.4% | |
| | |
Banco Davivienda S.A., 6.65% to 4/22/31(2)(3)(4) | | $ | 200 | | | $ | 136,305 | |
| | |
Banco Mercantil del Norte S.A./Grand Cayman, 8.375% to 10/14/30(2)(3)(4) | | | 600 | | | | 522,639 | |
|
| Barclays PLC: | |
| | |
6.125% to 12/15/25(3)(4) | | | 471 | | | | 409,181 | |
| | |
8.00% to 3/15/29(3)(4) | | | 526 | | | | 472,534 | |
|
| BNP Paribas S.A.: | |
| | |
4.625% to 2/25/31(2)(3)(4) | | | 203 | | | | 140,831 | |
| | |
7.75% to 8/16/29(2)(3)(4) | | | 675 | | | | 638,101 | |
|
| Citigroup, Inc.: | |
| | |
Series M, 6.30% to 5/15/24(3)(4) | | | 704 | | | | 659,120 | |
| | |
Series W, 4.00% to 12/10/25(3)(4) | | | 238 | | | | 201,348 | |
|
| Credit Suisse Group AG: | |
| | |
5.25% to 2/11/27(2)(3)(4) | | | 230 | | | | 163,300 | |
| | |
9.75% to 6/23/27(2)(3)(4) | | | 800 | | | | 762,102 | |
| | |
Farm Credit Bank of Texas, Series 3, 6.20% to 6/15/28(2)(3)(4) | | | 473 | | | | 419,369 | |
| | |
HSBC Holdings PLC, 4.60% to 12/17/30(3)(4) | | | 721 | | | | 477,446 | |
| | |
Huntington Bancshares, Inc., Series F, 5.625% to 7/15/30(3)(4) | | | 395 | | | | 360,969 | |
| | |
ING Groep NV, 6.50% to 4/16/25(3)(4) | | | 243 | | | | 221,689 | |
| | |
JPMorgan Chase & Co., Series KK, 3.65% to 6/1/26(3)(4) | | | 881 | | | | 731,186 | |
| | |
KeyCorp, Series D, 5.00% to 9/15/26(3)(4) | | | 975 | | | | 856,394 | |
| | |
Lloyds Banking Group PLC, 7.50% to 6/27/24(3)(4) | | | 600 | | | | 573,458 | |
|
| Natwest Group PLC: | |
| | |
4.60% to 6/28/31(3)(4) | | | 200 | | | | 129,631 | |
| | |
6.00% to 12/29/25(3)(4) | | | 229 | | | | 204,360 | |
| | |
8.00% to 8/10/25(3)(4) | | | 778 | | | | 735,113 | |
| | | | | | | | |
| Security | | Principal
Amount
(000’s omitted) | | | Value | |
|
| Banks (continued) | |
|
| PNC Financial Services Group, Inc. (The): | |
| | |
Series S, 5.00% to 11/1/26(3)(4) | | $ | 485 | | | $ | 417,692 | |
| | |
Series U, 6.00% to 5/15/27(3)(4) | | | 800 | | | | 744,000 | |
| | |
Societe Generale S.A., 5.375% to 11/18/30(2)(3)(4) | | | 506 | | | | 367,787 | |
| | |
Standard Chartered PLC, 4.75% to 1/14/31(2)(3)(4) | | | 577 | | | | 385,359 | |
| | |
SVB Financial Group, Series C, 4.00% to 5/15/26(3)(4) | | | 600 | | | | 420,628 | |
| | |
Toronto-Dominion Bank (The), 8.125% to 10/31/27, 10/31/82(4) | | | 775 | | | | 785,656 | |
| | |
Truist Financial Corp., Series Q, 5.10% to 3/1/30(3)(4) | | | 134 | | | | 117,930 | |
|
| UBS Group AG: | |
| | |
4.375% to 2/10/31(2)(3)(4) | | | 419 | | | | 292,106 | |
| | |
6.875% to 8/7/25(3)(4)(5) | | | 348 | | | | 331,078 | |
| | |
Wells Fargo & Co., Series BB, 3.90% to 3/15/26(3)(4) | | | 784 | | | | 666,106 | |
| | |
| | | | | | | $ | 13,343,418 | |
|
| Capital Markets — 0.2% | |
| | |
AerCap Holdings NV, 5.875% to 10/10/24, 10/10/79(4) | | $ | 425 | | | $ | 382,993 | |
|
| Charles Schwab Corp. (The): | |
| | |
Series G, 5.375% to 6/1/25(3)(4) | | | 651 | | | | 638,794 | |
| | |
Series I, 4.00% to 6/1/26(3)(4) | | | 467 | | | | 384,528 | |
| | |
| | | | | | | $ | 1,406,315 | |
|
| Diversified Financial Services — 0.2% | |
| | |
American AgCredit Corp., Series QIB, 5.25% to 6/15/26(2)(3)(4) | | $ | 914 | | | $ | 839,737 | |
| | |
Goldman Sachs Group, Inc. (The), Series V, 4.125% to 11/10/26(3)(4) | | | 143 | | | | 112,434 | |
| | |
| | | | | | | $ | 952,171 | |
|
| Electric Utilities — 0.4% | |
| | |
Dominion Energy, Inc., Series C, 4.35% to 1/15/27(3)(4) | | $ | 583 | | | $ | 485,225 | |
| | |
Edison International, Series B, 5.00% to 12/15/26(3)(4) | | | 199 | | | | 161,688 | |
| | |
Emera, Inc., Series 16-A, 6.75% to 6/15/26, 6/15/76(4) | | | 450 | | | | 421,142 | |
| | |
Sempra Energy, 4.125% to 1/1/27, 4/1/52(4) | | | 581 | | | | 438,285 | |
| | |
Southern California Edison Co., Series E, 6.981%, (3 mo. USD LIBOR + 4.199%)(3)(6) | | | 249 | | | | 244,698 | |
| | |
Southern Co. (The), Series B, 6.923%, (3 mo. USD LIBOR + 3.63%), 3/15/57(6) | | | 366 | | | | 364,170 | |
| | |
| | | | | | | $ | 2,115,208 | |
|
| Food Products — 0.1% | |
| | |
Land O’ Lakes, Inc., 8.00%(2)(3) | | $ | 824 | | | $ | 817,997 | |
| | |
| | | | | | | $ | 817,997 | |
Eaton Vance
Tax-Managed Equity Asset Allocation Fund
October 31, 2022
Portfolio of Investments — continued
| | | | | | | | |
| Security | | Principal
Amount
(000’s omitted) | | | Value | |
|
| Gas Utilities — 0.1% | |
| | |
NiSource, Inc., 5.65% to 6/15/23(3)(4) | | $ | 645 | | | $ | 596,625 | |
| | |
| | | | | | | $ | 596,625 | |
|
| Independent Power and Renewable Electricity Producers — 0.1% | |
| | |
Algonquin Power & Utilities Corp., 4.75% to 1/18/27, 1/18/82(4) | | $ | 408 | | | $ | 329,460 | |
| | |
| | | | | | | $ | 329,460 | |
|
| Insurance — 0.2% | |
| | |
QBE Insurance Group, Ltd., 5.875% to 5/12/25(2)(3)(4) | | $ | 1,004 | | | $ | 916,504 | |
| | |
| | | | | | | $ | 916,504 | |
|
| Multi-Utilities — 0.1% | |
| | |
Centerpoint Energy, Inc., Series A, 6.125% to 9/1/23(3)(4) | | $ | 900 | | | $ | 845,828 | |
| | |
| | | | | | | $ | 845,828 | |
|
| Oil, Gas & Consumable Fuels — 0.2% | |
| | |
DCP Midstream, L.P., Series A, 7.375% to 12/15/22(3)(4) | | $ | 399 | | | $ | 394,035 | |
| | |
EnLink Midstream Partners, L.P., Series C, 6.00% to 12/15/22(3)(4) | | | 658 | | | | 507,055 | |
| | |
Odebrecht Oil & Gas Finance, Ltd., 0.00%(2)(3) | | | 550 | | | | 963 | |
| | |
Plains All American Pipeline, L.P., Series B, 6.125% to 12/5/22(3)(4) | | | 442 | | | | 371,501 | |
| | |
| | | | | | | $ | 1,273,554 | |
|
| Pipelines — 0.0%(7) | |
| | |
Energy Transfer, L.P., Series B, 6.625% to 2/15/28(3)(4) | | $ | 359 | | | $ | 258,480 | |
| | |
| | | | | | | $ | 258,480 | |
| |
Total Debt Obligations
(identified cost $26,169,090) | | | $ | 22,855,560 | |
|
| Exchange-Traded Funds — 0.9% | |
| Security | | Shares | | | Value | |
|
| Equity Funds — 0.9% | |
| | |
Global X U.S. Preferred ETF | | | 130,000 | | | $ | 2,551,900 | |
| | |
iShares Preferred & Income Securities ETF | | | 86,286 | | | | 2,632,586 | |
| |
Total Exchange-Traded Funds
(identified cost $6,710,738) | | | $ | 5,184,486 | |
| | | | | | | | |
| Preferred Stocks — 1.6% | |
| Security | | Shares | | | Value | |
|
| Banks — 0.6% | |
| | |
Bank of America Corp., 4.25% | | | 52,040 | | | $ | 868,027 | |
| | |
Citizens Financial Group, Inc., 5.00% | | | 28,000 | | | | 539,840 | |
| | |
| First Republic Bank: | | | | | | |
| | |
Series M, 4.00% | | | 27,012 | | | | 405,450 | |
| | |
Series N, 4.50% | | | 8,273 | | | | 139,317 | |
| | |
| JPMorgan Chase & Co.: | | | | | | |
| | |
Series JJ, 4.55% | | | 28,660 | | | | 521,899 | |
| | |
Series LL, 4.625% | | | 17,500 | | | | 324,450 | |
| | |
KeyCorp, 5.65% | | | 25,000 | | | | 528,500 | |
| | |
Truist Financial Corp., 5.25% | | | 5,773 | | | | 121,637 | |
| | |
Wells Fargo & Co., Series L, 7.50% (Convertible) | | | 116 | | | | 135,202 | |
| | |
| | | | | | | $ | 3,584,322 | |
|
| Capital Markets — 0.1% | |
| | |
Stifel Financial Corp., Series D, 4.50% | | | 36,350 | | | $ | 588,506 | |
| | |
| | | | | | | $ | 588,506 | |
|
| Electric Utilities — 0.2% | |
| | |
Brookfield BRP Holdings Canada, Inc., 4.625% | | | 24,000 | | | $ | 349,680 | |
| | |
SCE Trust III, Series H, 5.75% to 3/15/24(4) | | | 13,981 | | | | 270,392 | |
| | |
SCE Trust IV, Series J, 5.375% to 9/15/25(4) | | | 5,882 | | | | 105,523 | |
| | |
SCE Trust V, Series K, 5.45% to 3/15/26(4) | | | 5,504 | | | | 105,567 | |
| | |
SCE Trust VI, 5.00% | | | 1,041 | | | | 17,853 | |
| | |
| | | | | | | $ | 849,015 | |
|
| Equity Real Estate Investment Trusts (REITs) — 0.0%(7) | |
| | |
SITE Centers Corp., Series A, 6.375% | | | 11,958 | | | $ | 239,877 | |
| | |
| | | | | | | $ | 239,877 | |
|
| Insurance — 0.3% | |
| | |
American Equity Investment Life Holding Co., Series B, 6.625% to 9/1/25(4) | | | 22,403 | | | $ | 518,854 | |
| | |
Arch Capital Group, Ltd., Series G, 4.55% | | | 14,252 | | | | 250,265 | |
| | |
RenaissanceRe Holdings, Ltd., Series G, 4.20% | | | 43,000 | | | | 716,810 | |
| | |
| | | | | | | $ | 1,485,929 | |
|
| Oil, Gas & Consumable Fuels — 0.2% | |
| | |
NuStar Energy, L.P., Series B, 9.126% (3 mo. USD LIBOR + 5.643%)(6) | | | 53,257 | | | $ | 1,131,179 | |
| | |
| | | | | | | $ | 1,131,179 | |
Eaton Vance
Tax-Managed Equity Asset Allocation Fund
October 31, 2022
Portfolio of Investments — continued
| | | | | | | | |
| Security | | Shares | | | Value | |
|
| Pipelines — 0.1% | |
| | |
| Energy Transfer, L.P.: | | | | | | |
| | |
Series C, 7.375% to 5/15/23(4) | | | 15,000 | | | $ | 336,000 | |
| | |
Series E, 7.60% to 5/15/24(4) | | | 14,960 | | | | 344,529 | |
| | |
| | | | | | | $ | 680,529 | |
|
| Real Estate Management & Development — 0.1% | |
| | |
| Brookfield Property Partners, L.P.: | | | | | | |
| | |
Series A, 5.75% | | | 2,080 | | | $ | 31,470 | |
| | |
Series A-1, 6.50% | | | 14,575 | | | | 242,674 | |
| | |
Series A2, 6.375% | | | 19,390 | | | | 316,057 | |
| | |
| | | | | | | $ | 590,201 | |
| |
Total Preferred Stocks
(identified cost $11,254,708) | | | $ | 9,149,558 | |
| |
Total Investments — 100.0%
(identified cost $325,386,745) | | | $ | 565,687,590 | |
| |
Other Assets, Less Liabilities — (0.0)%(7) | | | $ | (151,778 | ) |
| |
Net Assets — 100.0% | | | $ | 565,535,812 | |
The percentage shown for each investment category in the Portfolio of Investments is based on net assets.
| (1) | Debt obligations are hybrid instruments, as determined by the investment adviser. These instruments have characteristics of both equity and debt. |
| (2) | Security exempt from registration under Rule 144A of the Securities Act of 1933, as amended. These securities may be sold in certain transactions in reliance on an exemption from registration (normally to qualified institutional buyers). At October 31, 2022, the aggregate value of these securities is $6,403,100 or 1.1% of the Fund’s net assets. |
| (3) | Perpetual security with no stated maturity date but may be subject to calls by the issuer. |
| (4) | Security converts to variable rate after the indicated fixed-rate coupon period. |
| (5) | Security exempt from registration under Regulation S of the Securities Act of 1933, as amended, which exempts from registration securities offered and sold outside the United States. Security may not be offered or sold in the United States except pursuant to an exemption from, or in a transaction not subject to, the registration requirements of the Securities Act of 1933, as amended. At October 31, 2022, the aggregate value of these securities is $331,078 or 0.1% of the Fund’s net assets. |
| (6) | Variable rate security. The stated interest rate represents the rate in effect at October 31, 2022. |
| (7) | Amount is less than 0.05% or (0.05)%, as applicable. |
Abbreviations:
| | | | |
| | |
| LIBOR | | – | | London Interbank Offered Rate |
Currency Abbreviations:
| | | | |
| | |
| USD | | – | | United States Dollar |
Eaton Vance
Tax-Managed Equity Asset Allocation Fund
October 31, 2022
Statement of Assets and Liabilities
| | | | |
| Assets | | October 31, 2022 | |
| |
Unaffiliated investments, at value (identified cost $44,134,536) | | $ | 37,189,604 | |
| |
Affiliated investments, at value (identified cost $281,252,209) | | | 528,497,986 | |
| |
Interest and dividends receivable | | | 378,966 | |
| |
Receivable for Fund shares sold | | | 103,417 | |
| |
Total assets | | $ | 566,169,973 | |
|
| Liabilities | |
| |
Payable for investments purchased | | $ | 6,629 | |
| |
Payable for Fund shares redeemed | | | 201,233 | |
| |
Payable to affiliates: | | | | |
| |
Investment adviser fee | | | 84,498 | |
| |
Administration fee | | | 69,225 | |
| |
Distribution and service fees | | | 111,181 | |
| |
Trustees’ fees | | | 42 | |
| |
Accrued expenses | | | 161,353 | |
| |
Total liabilities | | $ | 634,161 | |
| |
Net Assets | | $ | 565,535,812 | |
|
| Sources of Net Assets | |
| |
Paid-in capital | | $ | 211,897,866 | |
| |
Distributable earnings | | | 353,637,946 | |
| |
Net Assets | | $ | 565,535,812 | |
| |
| Class A Shares | | | | |
| |
Net Assets | | $ | 405,235,817 | |
| |
Shares Outstanding | | | 15,786,830 | |
| |
Net Asset Value and Redemption Price Per Share | | | | |
| |
(net assets ÷ shares of beneficial interest outstanding) | | $ | 25.67 | |
| |
Maximum Offering Price Per Share | | | | |
| |
(100 ÷ 94.75 of net asset value per share) | | $ | 27.09 | |
|
| Class C Shares | |
| |
Net Assets | | $ | 34,489,599 | |
| |
Shares Outstanding | | | 1,463,074 | |
| |
Net Asset Value and Offering Price Per Share* | | | | |
| |
(net assets ÷ shares of beneficial interest outstanding) | | $ | 23.57 | |
|
| Class I Shares | |
| |
Net Assets | | $ | 125,810,396 | |
| |
Shares Outstanding | | | 4,901,108 | |
| |
Net Asset Value, Offering Price and Redemption Price Per Share | | | | |
| |
(net assets ÷ shares of beneficial interest outstanding) | | $ | 25.67 | |
On sales of $50,000 or more, the offering price of Class A shares is reduced.
| * | Redemption price per share is equal to the net asset value less any applicable contingent deferred sales charge. |
| | | | |
| | 10 | | See Notes to Financial Statements. |
Eaton Vance
Tax-Managed Equity Asset Allocation Fund
October 31, 2022
Statement of Operations
| | | | |
| Investment Income | | Year Ended
October 31, 2022 | |
| |
Dividend income (net of foreign taxes withheld of $2,384) | | $ | 855,775 | |
| |
Dividend income allocated from affiliated Portfolios (net of foreign taxes withheld of $186,743) | | | 8,978,246 | |
| |
Interest income | | | 1,477,691 | |
| |
Securities lending income allocated from affiliated Portfolios, net | | | 23,346 | |
| |
Expenses allocated from affiliated Portfolios | | | (3,458,635 | ) |
| |
Total investment income | | $ | 7,876,423 | |
| |
| Expenses | | | | |
| |
Investment adviser fee | | $ | 1,343,186 | |
| |
Administration fee | | | 938,752 | |
| |
Distribution and service fees: | | | | |
| |
Class A | | | 1,129,175 | |
| |
Class C | | | 384,543 | |
| |
Trustees’ fees and expenses | | | 500 | |
| |
Custodian fee | | | 43,997 | |
| |
Transfer and dividend disbursing agent fees | | | 317,566 | |
| |
Legal and accounting services | | | 73,735 | |
| |
Printing and postage | | | 24,327 | |
| |
Registration fees | | | 53,970 | |
| |
Miscellaneous | | | 13,024 | |
| |
Total expenses | | $ | 4,322,775 | |
| |
Net investment income | | $ | 3,553,648 | |
|
| Realized and Unrealized Gain (Loss) | |
| |
Net realized gain (loss): | | | | |
| |
Investment transactions | | $ | (1,104,279 | ) |
| |
Foreign currency transactions | | | (62,278 | ) |
| |
Net realized gain (loss) allocated from affiliated Portfolios: | | | | |
| |
Investment transactions | | | 13,800,229 | (1) |
| |
Foreign currency transactions | | | (19,029 | ) |
| |
Net realized gain | | $ | 12,614,643 | |
| |
Change in unrealized appreciation (depreciation): | | | | |
| |
Investments | | $ | (8,326,388 | ) |
| |
Foreign currency | | | (11 | ) |
| |
Change in unrealized appreciation (depreciation) allocated from affiliated Portfolios: | | | | |
| |
Investments | | | (125,405,612 | ) |
| |
Foreign currency | | | (17,178 | ) |
| |
Net change in unrealized appreciation (depreciation) | | $ | (133,749,189 | ) |
| |
Net realized and unrealized loss | | $ | (121,134,546 | ) |
| |
Net decrease in net assets from operations | | $ | (117,580,898 | ) |
| (1) | Includes $12,229,272 of net realized gains from redemptions in-kind. |
| | | | |
| | 11 | | See Notes to Financial Statements. |
Eaton Vance
Tax-Managed Equity Asset Allocation Fund
October 31, 2022
Statements of Changes in Net Assets
| | | | | | | | |
| | | Year Ended October 31, | |
| Increase (Decrease) in Net Assets | | 2022 | | | 2021 | |
| | |
From operations: | | | | | | | | |
| | |
Net investment income | | $ | 3,553,648 | | | $ | 2,276,461 | |
| | |
Net realized gain | | | 12,614,643 | (1) | | | 28,051,800 | (2) |
| | |
Net change in unrealized appreciation (depreciation) | | | (133,749,189 | ) | | | 166,128,891 | |
| | |
Net increase (decrease) in net assets from operations | | $ | (117,580,898 | ) | | $ | 196,457,152 | |
| | |
Distributions to shareholders: | | | | | | | | |
| | |
Class A | | $ | (13,091,273 | ) | | $ | (2,498,854 | ) |
| | |
Class C | | | (955,498 | ) | | | — | |
| | |
Class I | | | (4,252,703 | ) | | | (910,066 | ) |
| | |
Total distributions to shareholders | | $ | (18,299,474 | ) | | $ | (3,408,920 | ) |
| | |
Transactions in shares of beneficial interest: | | | | | | | | |
| | |
Class A | | $ | (10,281,966 | ) | | $ | (761,966 | ) |
| | |
Class C | | | (818,985 | ) | | | (14,736,486 | ) |
| | |
Class I | | | 5,460,422 | | | | 14,040,656 | |
| | |
Net decrease in net assets from Fund share transactions | | $ | (5,640,529 | ) | | $ | (1,457,796 | ) |
| | |
Net increase (decrease) in net assets | | $ | (141,520,901 | ) | | $ | 191,590,436 | |
|
| Net Assets | |
| | |
At beginning of year | | $ | 707,056,713 | | | $ | 515,466,277 | |
| | |
At end of year | | $ | 565,535,812 | | | $ | 707,056,713 | |
| (1) | Includes $12,229,272 of net realized gains from redemptions in-kind. |
| (2) | Includes $10,062,663 of net realized gains from redemptions in-kind. |
| | | | |
| | 12 | | See Notes to Financial Statements. |
Eaton Vance
Tax-Managed Equity Asset Allocation Fund
October 31, 2022
Financial Highlights
| | | | | | | | | | | | | | | | | | | | |
| | | Class A | |
| |
| | | Year Ended October 31, | |
| | | 2022 | | | 2021 | | | 2020 | | | 2019 | | | 2018 | |
| | | | | |
Net asset value — Beginning of year | | $ | 31.710 | | | $ | 23.070 | | | $ | 22.370 | | | $ | 20.450 | | | $ | 19.970 | |
| | | | | |
| Income (Loss) From Operations | | | | | | | | | | | | | | | | | | | | |
| | | | | |
Net investment income(1) | | $ | 0.157 | | | $ | 0.102 | | | $ | 0.165 | | | $ | 0.193 | | | $ | 0.160 | |
| | | | | |
Net realized and unrealized gain (loss) | | | (5.384 | ) | | | 8.690 | | | | 0.969 | | | | 2.122 | | | | 0.951 | |
| | | | | |
Total income (loss) from operations | | $ | (5.227 | ) | | $ | 8.792 | | | $ | 1.134 | | | $ | 2.315 | | | $ | 1.111 | |
| | | | | |
| Less Distributions | | | | | | | | | | | | | | | | | | | | |
| | | | | |
From net investment income | | $ | (0.104 | ) | | $ | (0.152 | ) | | $ | (0.154 | ) | | $ | (0.163 | ) | | $ | (0.171 | ) |
| | | | | |
From net realized gain | | | (0.709 | ) | | | — | | | | (0.280 | ) | | | (0.232 | ) | | | (0.460 | ) |
| | | | | |
Total distributions | | $ | (0.813 | ) | | $ | (0.152 | ) | | $ | (0.434 | ) | | $ | (0.395 | ) | | $ | (0.631 | ) |
| | | | | |
Net asset value — End of year | | $ | 25.670 | | | $ | 31.710 | | | $ | 23.070 | | | $ | 22.370 | | | $ | 20.450 | |
| | | | | |
Total Return(2) | | | (16.91 | )% | | | 38.24 | % | | | 5.07 | % | | | 11.75 | % | | | 5.60 | % |
| | | | | |
| Ratios/Supplemental Data | | | | | | | | | | | | | | | | | | | | |
| | | | | |
Net assets, end of year (000’s omitted) | | $ | 405,236 | | | $ | 513,507 | | | $ | 373,289 | | | $ | 379,547 | | | $ | 272,567 | |
| | | | | |
Ratios (as a percentage of average daily net assets):(3) | | | | | | | | | | | | | | | | | | | | |
| | | | | |
Expenses | | | 1.25 | %(4) | | | 1.26 | % | | | 1.28 | % | | | 1.33 | % | | | 1.31 | % |
| | | | | |
Net investment income | | | 0.56 | % | | | 0.35 | % | | | 0.74 | % | | | 0.91 | % | | | 0.77 | % |
| | | | | |
Portfolio Turnover of the Fund(5) | | | 5 | % | | | 6 | % | | | 7 | % | | | 7 | % | | | 6 | % |
| (1) | Computed using average shares outstanding. |
| (2) | Returns are historical and are calculated by determining the percentage change in net asset value with all distributions reinvested and do not reflect the effect of sales charges. |
| (3) | Includes the Fund’s share of the Portfolios’ allocated expenses. |
| (4) | Includes a reduction by the investment adviser of a portion of the Portfolios’ adviser fees due to the Portfolios’ investments in the Liquidity Fund (equal to less than 0.005% of average daily net assets for the year ended October 31, 2022). |
| (5) | Percentage includes both the Fund’s contributions to and withdrawals from the Portfolios and purchases and sales of securities held directly by the Fund, if any. |
| | | | |
| | 13 | | See Notes to Financial Statements. |
Eaton Vance
Tax-Managed Equity Asset Allocation Fund
October 31, 2022
Financial Highlights — continued
| | | | | | | | | | | | | | | | | | | | |
| | | Class C | |
| |
| | | Year Ended October 31, | |
| | | 2022 | | | 2021 | | | 2020 | | | 2019 | | | 2018 | |
| | | | | |
Net asset value — Beginning of year | | $ | 29.230 | | | $ | 21.310 | | | $ | 20.700 | | | $ | 18.930 | | | $ | 18.520 | |
| | | | | |
| Income (Loss) From Operations | | | | | | | | | | | | | | | | | | | | |
| | | | | |
Net investment income (loss)(1) | | $ | (0.049 | ) | | $ | (0.102 | ) | | $ | 0.001 | | | $ | 0.043 | | | $ | 0.005 | |
| | | | | |
Net realized and unrealized gain (loss) | | | (4.963 | ) | | | 8.022 | | | | 0.889 | | | | 1.965 | | | | 0.892 | |
| | | | | |
Total income (loss) from operations | | $ | (5.012 | ) | | $ | 7.920 | | | $ | 0.890 | | | $ | 2.008 | | | $ | 0.897 | |
| | | | | |
| Less Distributions | | | | | | | | | | | | | | | | | | | | |
| | | | | |
From net investment income | | $ | — | | | $ | — | | | $ | — | | | $ | (0.006 | ) | | $ | (0.027 | ) |
| | | | | |
From net realized gain | | | (0.648 | ) | | | — | | | | (0.280 | ) | | | (0.232 | ) | | | (0.460 | ) |
| | | | | |
Total distributions | | $ | (0.648 | ) | | $ | — | | | $ | (0.280 | ) | | $ | (0.238 | ) | | $ | (0.487 | ) |
| | | | | |
Net asset value — End of year | | $ | 23.570 | | | $ | 29.230 | | | $ | 21.310 | | | $ | 20.700 | | | $ | 18.930 | |
| | | | | |
Total Return(2) | | | (17.53 | )% | | | 37.17 | % | | | 4.29 | % | | | 10.88 | % | | | 4.86 | % |
| | | | | |
| Ratios/Supplemental Data | | | | | | | | | | | | | | | | | | | | |
| | | | | |
Net assets, end of year (000’s omitted) | | $ | 34,490 | | | $ | 43,788 | | | $ | 44,822 | | | $ | 56,979 | | | $ | 147,004 | |
| | | | | |
Ratios (as a percentage of average daily net assets):(3) | | | | | | | | | | | | | | | | | | | | |
| | | | | |
Expenses | | | 2.00 | %(4) | | | 2.01 | % | | | 2.03 | % | | | 2.08 | % | | | 2.06 | % |
| | | | | |
Net investment income (loss) | | | (0.19 | )% | | | (0.38 | )% | | | 0.00 | %(5) | | | 0.23 | % | | | 0.03 | % |
| | | | | |
Portfolio Turnover of the Fund(6) | | | 5 | % | | | 6 | % | | | 7 | % | | | 7 | % | | | 6 | % |
| (1) | Computed using average shares outstanding. |
| (2) | Returns are historical and are calculated by determining the percentage change in net asset value with all distributions reinvested and do not reflect the effect of sales charges. |
| (3) | Includes the Fund’s share of the Portfolios’ allocated expenses. |
| (4) | Includes a reduction by the investment adviser of a portion of the Portfolios’ adviser fees due to the Portfolios’ investments in the Liquidity Fund (equal to less than 0.005% of average daily net assets for the year ended October 31, 2022). |
| (5) | Amount is less than 0.005%. |
| (6) | Percentage includes both the Fund’s contributions to and withdrawals from the Portfolios and purchases and sales of securities held directly by the Fund, if any. |
| | | | |
| | 14 | | See Notes to Financial Statements. |
Eaton Vance
Tax-Managed Equity Asset Allocation Fund
October 31, 2022
Financial Highlights — continued
| | | | | | | | | | | | | | | | | | | | |
| | | Class I | |
| |
| | | Year Ended October 31, | |
| | | 2022 | | | 2021 | | | 2020 | | | 2019 | | | 2018 | |
| | | | | |
Net asset value — Beginning of year | | $ | 31.700 | | | $ | 23.060 | | | $ | 22.360 | | | $ | 20.450 | | | $ | 19.970 | |
| | | | | |
| Income (Loss) From Operations | | | | | | | | | | | | | | | | | | | | |
| | | | | |
Net investment income(1) | | $ | 0.227 | | | $ | 0.172 | | | $ | 0.220 | | | $ | 0.244 | | | $ | 0.207 | |
| | | | | |
Net realized and unrealized gain (loss) | | | (5.369 | ) | | | 8.678 | | | | 0.968 | | | | 2.113 | | | | 0.952 | |
| | | | | |
Total income (loss) from operations | | $ | (5.142 | ) | | $ | 8.850 | | | $ | 1.188 | | | $ | 2.357 | | | $ | 1.159 | |
| | | | | |
| Less Distributions | | | | | | | | | | | | | | | | | | | | |
| | | | | |
From net investment income | | $ | (0.179 | ) | | $ | (0.210 | ) | | $ | (0.208 | ) | | $ | (0.215 | ) | | $ | (0.219 | ) |
| | | | | |
From net realized gain | | | (0.709 | ) | | | — | | | | (0.280 | ) | | | (0.232 | ) | | | (0.460 | ) |
| | | | | |
Total distributions | | $ | (0.888 | ) | | $ | (0.210 | ) | | $ | (0.488 | ) | | $ | (0.447 | ) | | $ | (0.679 | ) |
| | | | | |
Net asset value — End of year | | $ | 25.670 | | | $ | 31.700 | | | $ | 23.060 | | | $ | 22.360 | | | $ | 20.450 | |
| | | | | |
Total Return(2) | | | (16.68 | )% | | | 38.56 | % | | | 5.31 | % | | | 12.02 | % | | | 5.85 | % |
| | | | | |
| Ratios/Supplemental Data | | | | | | | | | | | | | | | | | | | | |
| | | | | |
Net assets, end of year (000’s omitted) | | $ | 125,810 | | | $ | 149,762 | | | $ | 97,355 | | | $ | 89,758 | | | $ | 65,649 | |
| | | | | |
Ratios (as a percentage of average daily net assets):(3) | | | | | | | | | | | | | | | | | | | | |
| | | | | |
Expenses | | | 1.00 | %(4) | | | 1.01 | % | | | 1.03 | % | | | 1.08 | % | | | 1.06 | % |
| | | | | |
Net investment income | | | 0.81 | % | | | 0.60 | % | | | 0.99 | % | | | 1.16 | % | | | 0.99 | % |
| | | | | |
Portfolio Turnover of the Fund(5) | | | 5 | % | | | 6 | % | | | 7 | % | | | 7 | % | | | 6 | % |
| (1) | Computed using average shares outstanding. |
| (2) | Returns are historical and are calculated by determining the percentage change in net asset value with all distributions reinvested. |
| (3) | Includes the Fund’s share of the Portfolios’ allocated expenses. |
| (4) | Includes a reduction by the investment adviser of a portion of the Portfolios’ adviser fees due to the Portfolios’ investments in the Liquidity Fund (equal to less than 0.005% of average daily net assets for the year ended October 31, 2022). |
| (5) | Percentage includes both the Fund’s contributions to and withdrawals from the Portfolios and purchases and sales of securities held directly by the Fund, if any. |
| | | | |
| | 15 | | See Notes to Financial Statements. |
Eaton Vance
Tax-Managed Equity Asset Allocation Fund
October 31, 2022
Notes to Financial Statements
1 Significant Accounting Policies
Eaton Vance Tax-Managed Equity Asset Allocation Fund (the Fund) is a diversified series of Eaton Vance Mutual Funds Trust (the Trust). The Trust is a Massachusetts business trust registered under the Investment Company Act of 1940, as amended (the 1940 Act), as an open-end management investment company. The Fund offers three classes of shares. Class A shares are generally sold subject to a sales charge imposed at time of purchase. Class C shares are sold at net asset value and are generally subject to a contingent deferred sales charge (see Note 5). Effective November 5, 2020, Class C shares automatically convert to Class A shares eight years after their purchase as described in the Fund’s prospectus. Class I shares are sold at net asset value and are not subject to a sales charge. Each class represents a pro-rata interest in the Fund, but votes separately on class-specific matters and (as noted below) is subject to different expenses. Realized and unrealized gains and losses and net investment income and losses, other than class-specific expenses, are allocated daily to each class of shares based on the relative net assets of each class to the total net assets of the Fund. Each class of shares differs in its distribution plan and certain other class-specific expenses. The Fund’s investment objective is to achieve long-term, after-tax returns for its shareholders. The Fund currently pursues its objective by investing directly in securities and in interests in five tax-managed equity portfolios managed by Eaton Vance Management (EVM) or its affiliates (the Portfolios), which are Massachusetts business trusts. The value of the Fund’s investments in the Portfolios reflects the Fund’s proportionate interest in their net assets. The Portfolios and the Fund’s proportionate interest in each of their net assets at October 31, 2022 were as follows: Tax-Managed Growth Portfolio (0.7%), Tax-Managed Value Portfolio (18.3%), Tax-Managed International Equity Portfolio (43.7%), Tax-Managed Multi-Cap Growth Portfolio (43.7%) and Tax-Managed Small-Cap Portfolio (34.1%). The performance of the Fund is directly affected by the performance of the Portfolios. A copy of each Portfolio’s financial statements is available by calling Eaton Vance at
1-800-262-1122 or in the EDGAR database on the Securities and Exchange Commission’s website at www.sec.gov.
The following is a summary of significant accounting policies of the Fund. The policies are in conformity with accounting principles generally accepted in the United States of America (U.S. GAAP). The Fund is an investment company and follows accounting and reporting guidance in the Financial Accounting Standards Board (FASB) Accounting Standards Codification Topic 946.
A Investment Valuation — The valuation policies common to the Portfolios are as follows:
Equity Securities. Equity securities (common stocks and exchange-traded funds) listed on a U.S. securities exchange generally are valued at the last sale or closing price on the day of valuation or, if no sales took place on such date, at the mean between the closing bid and ask prices on the exchange where such securities are principally traded. Equity securities listed on the NASDAQ National Market System are valued at the NASDAQ official closing price. Unlisted or listed securities for which closing sales prices or closing quotations are not available are valued at the mean between the latest available bid and ask prices.
Foreign Securities and Currencies. Foreign securities and currencies are valued in U.S. dollars, based on foreign currency exchange rate quotations supplied by a third party pricing service. The pricing service uses a proprietary model to determine the exchange rate. Inputs to the model include reported trades and implied bid/ask spreads. The daily valuation of exchange-traded foreign securities generally is determined as of the close of trading on the principal exchange on which such securities trade. Events occurring after the close of trading on foreign exchanges may result in adjustments to the valuation of foreign securities to more accurately reflect their fair value as of the close of regular trading on the New York Stock Exchange. When valuing foreign equity securities that meet certain criteria, the Fund’s Trustees have approved the use of a fair value service that values such securities to reflect market trading that occurs after the close of the applicable foreign markets of comparable securities or other instruments that have a strong correlation to the fair-valued securities.
Other. Investments in management investment companies (including money market funds) that do not trade on an exchange are valued at the net asset value as of the close of each business day.
Fair Valuation. In connection with Rule 2a-5 of the 1940 Act, which became effective September 8, 2022, the Trustees have designated the Portfolios’ investment adviser as its valuation designee. Investments for which valuations or market quotations are not readily available or are deemed unreliable are valued by the investment adviser, as valuation designee, at fair value using methods that most fairly reflect the security’s “fair value”, which is the amount that the Portfolios might reasonably expect to receive for the security upon its current sale in the ordinary course. Each such determination is based on a consideration of relevant factors, which are likely to vary from one pricing context to another. These factors may include, but are not limited to, the type of security, the existence of any contractual restrictions on the security’s disposition, the price and extent of public trading in similar securities of the issuer or of comparable companies or entities, quotations or relevant information obtained from broker/dealers or other market participants, information obtained from the issuer, analysts, and/or the appropriate stock exchange (for exchange-traded securities), an analysis of the company’s or entity’s financial statements, and an evaluation of the forces that influence the issuer and the market(s) in which the security is purchased and sold.
In addition to investing in the Portfolios, the Fund may invest directly in securities. The valuation policies of the Fund are consistent with the valuation policies of the Portfolios. Additional valuation policies of the Fund are as follows:
Debt Obligations. Debt obligations are generally valued on the basis of valuations provided by third party pricing services, as derived from such services’ pricing models. Inputs to the models may include, but are not limited to, reported trades, executable bid and ask prices, broker/dealer quotations, prices or yields of securities with similar characteristics, interest rates, anticipated prepayments, benchmark curves or information pertaining to the issuer, as well as
Eaton Vance
Tax-Managed Equity Asset Allocation Fund
October 31, 2022
Notes to Financial Statements — continued
industry and economic events. The pricing services may use a matrix approach, which considers information regarding securities with similar characteristics to determine the valuation for a security. Short-term debt obligations purchased with a remaining maturity of sixty days or less for which a valuation from a third party pricing service is not readily available may be valued at amortized cost, which approximates fair value.
Preferred Equity Securities. Preferred equity securities that are not listed or traded in the over-the-counter market are valued by a third party pricing service that uses various techniques that consider factors including, but not limited to, prices or yields of securities with similar characteristics, benchmark yields, broker/dealer quotes, quotes of underlying common stock, issuer spreads, as well as industry and economic events.
B Income — The Fund’s net investment income or loss includes the Fund’s pro-rata share of the net investment income or loss of the Portfolios, less all actual and accrued expenses of the Fund. Dividend income is recorded on the ex-dividend date for dividends received in cash and/or securities. However, if the ex-dividend date has passed, certain dividends from foreign securities are recorded as the Fund is informed of the ex-dividend date. Withholding taxes on foreign dividends and capital gains have been provided for in accordance with the Fund’s understanding of the applicable countries’ tax rules and rates. Distributions from investment companies are recorded as dividend income, capital gains or return of capital based on the nature of the distribution. Interest income is recorded on the basis of interest accrued, adjusted for amortization of premium or accretion of discount.
C Federal Taxes — The Fund’s policy is to comply with the provisions of the Internal Revenue Code applicable to regulated investment companies and to distribute to shareholders each year substantially all of its net investment income, and all or substantially all of its net realized capital gains. Accordingly, no provision for federal income or excise tax is necessary.
As of October 31, 2022, the Fund had no uncertain tax positions that would require financial statement recognition, de-recognition, or disclosure. The Fund files a U.S. federal income tax return annually after its fiscal year-end, which is subject to examination by the Internal Revenue Service for a period of three years from the date of filing.
D Foreign Currency Translation — Investment valuations, other assets, and liabilities initially expressed in foreign currencies are translated each business day into U.S. dollars based upon current exchange rates. Purchases and sales of foreign investment securities and income and expenses denominated in foreign currencies are translated into U.S. dollars based upon currency exchange rates in effect on the respective dates of such transactions. Recognized gains or losses on investment transactions attributable to changes in foreign currency exchange rates are recorded for financial statement purposes as net realized gains and losses on investments. That portion of unrealized gains and losses on investments that results from fluctuations in foreign currency exchange rates is not separately disclosed.
E Expenses — The majority of expenses of the Trust are directly identifiable to an individual fund. Expenses which are not readily identifiable to a specific fund are allocated taking into consideration, among other things, the nature and type of expense and the relative size of the funds.
F Use of Estimates — The preparation of the financial statements in conformity with U.S. GAAP requires management to make estimates and assumptions that affect the reported amounts of assets and liabilities at the date of the financial statements and the reported amounts of income and expense during the reporting period. Actual results could differ from those estimates.
G Indemnifications — Under the Trust’s organizational documents, its officers and Trustees may be indemnified against certain liabilities and expenses arising out of the performance of their duties to the Fund. Under Massachusetts law, if certain conditions prevail, shareholders of a Massachusetts business trust (such as the Trust) could be deemed to have personal liability for the obligations of the Trust. However, the Trust’s Declaration of Trust contains an express disclaimer of liability on the part of Fund shareholders and the By-laws provide that the Trust shall assume, upon request by the shareholder, the defense on behalf of any Fund shareholders. Moreover, the By-laws also provide for indemnification out of Fund property of any shareholder held personally liable solely by reason of being or having been a shareholder for all loss or expense arising from such liability. Additionally, in the normal course of business, the Fund enters into agreements with service providers that may contain indemnification clauses. The Fund’s maximum exposure under these arrangements is unknown as this would involve future claims that may be made against the Fund that have not yet occurred.
H Other — Investment transactions are accounted for on a trade date basis. Realized gains and losses on investments sold are determined on the basis of identified cost.
2 Distributions to Shareholders and Income Tax Information
It is the present policy of the Fund to make at least one distribution annually (normally in December) of all or substantially all of its net investment income and to distribute annually all or substantially all of its net realized capital gains. Distributions to shareholders are recorded on the ex-dividend date. Distributions are declared separately for each class of shares. Shareholders may reinvest income and capital gain distributions in additional shares of the same class of the Fund at the net asset value as of the ex-dividend date or, at the election of the shareholder, receive distributions in cash. Distributions to shareholders are determined in accordance with income tax regulations, which may differ from U.S. GAAP. As required by U.S. GAAP, only distributions in excess of tax basis earnings and profits are reported in the financial statements as a return of capital. Permanent differences between book and tax accounting relating to distributions are reclassified to paid-in capital. For tax purposes, distributions from short-term capital gains are considered to be from ordinary income.
Eaton Vance
Tax-Managed Equity Asset Allocation Fund
October 31, 2022
Notes to Financial Statements — continued
The tax character of distributions declared for the years ended October 31, 2022 and October 31, 2021 was as follows:
| | | | | | | | |
| | | Year Ended October 31, | |
| | | 2022 | | | 2021 | |
| | |
Ordinary income | | $ | 3,810,323 | | | $ | 3,408,920 | |
| | |
Long-term capital gains | | $ | 14,489,151 | | | $ | — | |
During the year ended October 31, 2022, distributable earnings was decreased by $346,153 and paid-in capital was increased by $346,153 due to the Fund’s use of equalization accounting. Tax equalization accounting allows the Fund to treat as a distribution that portion of redemption proceeds representing a redeeming shareholder’s portion of undistributed taxable income and net capital gains. These reclassifications had no effect on the net assets or net asset value per share of the Fund.
As of October 31, 2022, the components of distributable earnings (accumulated loss) on a tax basis were as follows:
| | | | |
| | |
Undistributed ordinary income | | $ | 2,251,108 | |
| |
Undistributed long-term capital gains | | | 1,278,229 | |
| |
Net unrealized appreciation | | | 350,108,609 | |
| |
Distributable earnings | | $ | 353,637,946 | |
The cost and unrealized appreciation (depreciation) of investments of the Fund, including the affiliated Portfolios, at October 31, 2022, as determined on a federal income tax basis, were as follows:
| | | | |
Aggregate cost | | $ | 215,586,328 | |
| |
Gross unrealized appreciation | | | 357,897,950 | |
| |
Gross unrealized depreciation | | | (7,796,688 | ) |
| |
Net unrealized appreciation | | $ | 350,101,262 | |
3 Investment Adviser Fee and Other Transactions with Affiliates
The investment adviser fee is earned by Eaton Vance Management (EVM), an indirect, wholly-owned subsidiary of Morgan Stanley, as compensation for investment advisory services rendered to the Fund. Pursuant to the investment advisory agreement between the Fund and EVM, and an amendment to the agreement that took effect on July 1, 2022, the investment adviser fee is computed at an annual rate as a percentage of the Fund’s average daily net assets as follows and is payable monthly:
| | | | | | | | |
| Average Daily Net Assets | | Annual Fee Rate (Prior to July 1, 2022) | | | Annual Fee Rate (Effective July 1, 2022) | |
| | |
Up to $500 million | | | 0.750 | % | | | 0.700 | % |
| | |
$500 million but less than $1 billion | | | 0.700 | % | | | 0.600 | % |
| | |
$1 billion but less than $1.5 billion | | | 0.675 | % | | | 0.575 | % |
| | |
$1.5 billion but less than $2.5 billion | | | 0.650 | % | | | 0.550 | % |
| | |
$2.5 billion and over | | | 0.625 | % | | | 0.525 | % |
The investment adviser fee payable by the Fund is reduced by the Fund’s allocable share of any fee paid pursuant to an investment advisory agreement by any investment company advised by EVM or its affiliates in which the Fund invests. Effective April 26, 2022, the Portfolios may invest in a money market fund, the Institutional Class of the Morgan Stanley Institutional Liquidity Funds - Government Portfolio (the “Liquidity Fund”), an open-end management investment company managed by Morgan Stanley Investment Management Inc., a wholly-owned subsidiary of Morgan Stanley. The investment adviser fee paid by the Portfolios is reduced by an amount equal to their pro-rata share of the advisory and administration fees paid by the Portfolios due to their
Eaton Vance
Tax-Managed Equity Asset Allocation Fund
October 31, 2022
Notes to Financial Statements — continued
investments in the Liquidity Fund. For the year ended October 31, 2022, the Fund’s allocated share of the reduction of the investment adviser fee paid by the Portfolios was $2,019 relating to the Portfolios’ investments in the Liquidity Fund. Prior to April 26, 2022, the Portfolios may have invested their cash in Eaton Vance Cash Reserves Fund, LLC (Cash Reserves Fund), an affiliated investment company managed by EVM. EVM did not receive a fee for advisory services provided to Cash Reserves Fund.
For the year ended October 31, 2022, the Fund’s investment adviser fee totaled $4,528,896, of which $3,185,710 was allocated from the Portfolios and $1,343,186 was paid or accrued directly by the Fund. For the year ended October 31, 2022, the Fund’s investment adviser fee, including the fees allocated from the Portfolios, was 0.72% of the Fund’s average daily net assets. The administration fee is earned by EVM as compensation for administering the business affairs of the Fund and is computed at an annual rate of 0.15% of the Fund’s average daily net assets. For the year ended October 31, 2022, the administration fee amounted to $938,752.
EVM provides sub-transfer agency and related services to the Fund pursuant to a Sub-Transfer Agency Support Services Agreement. For the year ended October 31, 2022, EVM earned $95,571 from the Fund pursuant to such agreement, which is included in transfer and dividend disbursing agent fees on the Statement of Operations. The Fund was informed that Eaton Vance Distributors, Inc. (EVD), an affiliate of EVM and the Fund’s principal underwriter, received $30,631 as its portion of the sales charge on sales of Class A shares for the year ended October 31, 2022. EVD also received distribution and service fees from Class A and Class C shares (see Note 4) and contingent deferred sales charges (see Note 5).
Trustees and officers of the Fund and the Portfolios who are members of EVM’s organization receive remuneration for their services to the Fund out of the investment adviser fee. Certain officers and Trustees of the Fund and the Portfolios are officers of EVM.
4 Distribution Plans
The Fund has in effect a distribution plan for Class A shares (Class A Plan) pursuant to Rule 12b-1 under the 1940 Act. Pursuant to the Class A Plan, the Fund pays EVD a distribution and service fee of 0.25% per annum of its average daily net assets attributable to Class A shares for distribution services and facilities provided to the Fund by EVD, as well as for personal services and/or the maintenance of shareholder accounts. Distribution and service fees paid or accrued to EVD for the year ended October 31, 2022 amounted to $1,129,175 for Class A shares.
The Fund also has in effect a distribution plan for Class C shares (Class C Plan) pursuant to Rule 12b-1 under the 1940 Act. Pursuant to the Class C Plan, the Fund pays EVD amounts equal to 0.75% per annum of its average daily net assets attributable to Class C shares for providing ongoing distribution services and facilities to the Fund. For the year ended October 31, 2022, the Fund paid or accrued to EVD $288,407 for Class C shares.
Pursuant to the Class C Plan, the Fund also makes payments of service fees to EVD, financial intermediaries and other persons in amounts equal to 0.25% per annum of its average daily net assets attributable to that class. Service fees paid or accrued are for personal services and/or the maintenance of shareholder accounts. They are separate and distinct from the sales commissions and distribution fees payable to EVD. Service fees paid or accrued for the year ended October 31, 2022 amounted to $96,136 for Class C shares.
Distribution and service fees are subject to the limitations contained in the Financial Industry Regulatory Authority Rule 2341(d).
5 Contingent Deferred Sales Charges
A contingent deferred sales charge (CDSC) of 1% generally is imposed on redemptions of Class C shares made within 12 months of purchase. Class A shares may be subject to a 1% CDSC if redeemed within 12 months (18 months prior to April 29, 2022) of purchase (depending on the circumstances of purchase). Generally, the CDSC is based upon the lower of the net asset value at date of redemption or date of purchase. No charge is levied on shares acquired by reinvestment of dividends or capital gain distributions. For the year ended October 31, 2022, the Fund was informed that EVD received approximately $400 and $2,000 of CDSCs paid by Class A and Class C shareholders, respectively.
6 Investment Transactions
For the year ended October 31, 2022, increases and decreases in the Fund’s investments in the Portfolios were as follows:
| | | | | | | | |
| Portfolio | | Contributions | | | Withdrawals | |
| | |
Tax-Managed Growth Portfolio | | $ | 4,037,761 | | | $ | 15,212,950 | |
| | |
Tax-Managed International Equity Portfolio | | | 1,101,161 | | | | 4,059,300 | |
| | |
Tax-Managed Multi-Cap Growth Portfolio | | | 1,594,969 | | | | 6,032,177 | |
| | |
Tax-Managed Small-Cap Portfolio | | | 1,476,823 | | | | 5,585,349 | |
| | |
Tax-Managed Value Portfolio | | | 3,662,522 | | | | 13,851,666 | |
Eaton Vance
Tax-Managed Equity Asset Allocation Fund
October 31, 2022
Notes to Financial Statements — continued
7 Purchases and Sales of Investments
Purchases and sales of investments, other than short-term obligations and investments in the Portfolios, aggregated $18,736,376 and $12,169,993, respectively, for the year ended October 31, 2022.
8 Shares of Beneficial Interest
The Fund’s Declaration of Trust permits the Trustees to issue an unlimited number of full and fractional shares of beneficial interest (without par value). Such shares may be issued in a number of different series (such as the Fund) and classes. Transactions in Fund shares, including direct exchanges pursuant to share class conversions for all periods presented, were as follows:
| | | | | | | | | | | | | | | | |
| | | Year Ended
October 31, 2022 | | | Year Ended
October 31, 2021 | |
| | | Shares | | | Amount | | | Shares | | | Amount | |
Class A | | | | | | | | | | | | | | | | |
| | | | |
Sales | | | 622,834 | | | $ | 17,651,843 | | | | 1,091,500 | | | $ | 30,128,272 | |
| | | | |
Issued to shareholders electing to receive payments of distributions in Fund shares | | | 391,331 | | | | 12,049,069 | | | | 87,075 | | | | 2,297,913 | |
| | | | |
Redemptions | | | (1,423,673 | ) | | | (39,982,878 | ) | | | (1,162,917 | ) | | | (33,188,151 | ) |
| | | | |
Net increase (decrease) | | | (409,508 | ) | | $ | (10,281,966 | ) | | | 15,658 | | | $ | (761,966 | ) |
Class C | | | | | | | | | | | | | | | | |
| | | | |
Sales | | | 303,090 | | | $ | 7,709,274 | | | | 186,874 | | | $ | 4,946,493 | |
| | | | |
Issued to shareholders electing to receive payments of distributions in Fund shares | | | 32,978 | | | | 938,540 | | | | — | | | | — | |
| | | | |
Redemptions | | | (370,961 | ) | | | (9,466,799 | ) | | | (792,620 | ) | | | (19,682,979 | ) |
| | | | |
Net decrease | | | (34,893 | ) | | $ | (818,985 | ) | | | (605,746 | ) | | $ | (14,736,486 | ) |
Class I | | | | | | | | | | | | | | | | |
| | | | |
Sales | | | 804,880 | | | $ | 22,384,882 | | | | 788,945 | | | $ | 22,307,460 | |
| | | | |
Issued to shareholders electing to receive payments of distributions in Fund shares | | | 131,671 | | | | 4,046,241 | | | | 32,538 | | | | 857,060 | |
| | | | |
Redemptions | | | (759,383 | ) | | | (20,970,701 | ) | | | (319,184 | ) | | | (9,123,864 | ) |
| | | | |
Net increase | | | 177,168 | | | $ | 5,460,422 | | | | 502,299 | | | $ | 14,040,656 | |
9 Fair Value Measurements
Under generally accepted accounting principles for fair value measurements, a three-tier hierarchy to prioritize the assumptions, referred to as inputs, is used in valuation techniques to measure fair value. The three-tier hierarchy of inputs is summarized in the three broad levels listed below.
| • | | Level 1 – quoted prices in active markets for identical investments |
| • | | Level 2 – other significant observable inputs (including quoted prices for similar investments, interest rates, prepayment speeds, credit risk, etc.) |
| • | | Level 3 – significant unobservable inputs (including a fund’s own assumptions in determining the fair value of investments) |
In cases where the inputs used to measure fair value fall in different levels of the fair value hierarchy, the level disclosed is determined based on the lowest level input that is significant to the fair value measurement in its entirety. The inputs or methodology used for valuing securities are not necessarily an indication of the risk associated with investing in those securities.
Eaton Vance
Tax-Managed Equity Asset Allocation Fund
October 31, 2022
Notes to Financial Statements — continued
At October 31, 2022, the hierarchy of inputs used in valuing the Fund’s investments in securities and investments in the Portfolios, which are carried at value, were as follows:
| | | | | | | | | | | | | | | | |
| Asset Description | | Level 1 | | | Level 2 | | | Level 3 | | | Total | |
| | | | |
Investments in Affiliated Portfolios | | $ | 528,497,986 | | | $ | — | | | $ | — | | | $ | 528,497,986 | |
| | | | |
Debt Obligations | | | — | | | | 22,855,560 | | | | — | | | | 22,855,560 | |
| | | | |
Exchange-Traded Funds | | | 5,184,486 | | | | — | | | | — | | | | 5,184,486 | |
| | | | |
Preferred Stocks | | | 9,149,558 | | | | — | | | | — | | | | 9,149,558 | |
| | | | |
Total Investments | | $ | 542,832,030 | | | $ | 22,855,560 | | | $ | — | | | $ | 565,687,590 | |
10 Risks and Uncertainties
Pandemic Risk
An outbreak of respiratory disease caused by a novel coronavirus was first detected in China in late 2019 and subsequently spread internationally. This coronavirus has resulted in closing borders, enhanced health screenings, changes to healthcare service preparation and delivery, quarantines, cancellations, disruptions to supply chains and customer activity, as well as general concern and uncertainty. Health crises caused by outbreaks of disease, such as the coronavirus outbreak, may exacerbate other pre-existing political, social and economic risks and disrupt normal market conditions and operations. The impact of this outbreak has negatively affected the worldwide economy, as well as the economies of individual countries and industries, and could continue to affect the market in significant and unforeseen ways. Other epidemics and pandemics that may arise in the future may have similar effects. Any such impact could adversely affect the Fund’s performance, or the performance of the securities in which the Fund invests.
Eaton Vance
Tax-Managed Equity Asset Allocation Fund
October 31, 2022
Report of Independent Registered Public Accounting Firm
To the Trustees of Eaton Vance Mutual Funds Trust and Shareholders of Eaton Vance Tax-Managed Equity Asset Allocation Fund:
Opinion on the Financial Statements and Financial Highlights
We have audited the accompanying statement of assets and liabilities of Eaton Vance Tax-Managed Equity Asset Allocation Fund (the “Fund”) (one of the funds constituting Eaton Vance Mutual Funds Trust), including the portfolio of investments, as of October 31, 2022, the related statement of operations for the year then ended, the statements of changes in net assets for each of the two years in the period then ended, the financial highlights for each of the five years in the period then ended, and the related notes. In our opinion, the financial statements and financial highlights present fairly, in all material respects, the financial position of the Fund as of October 31, 2022, and the results of its operations for the year then ended, the changes in its net assets for each of the two years in the period then ended, and the financial highlights for each of the five years in the period then ended, in conformity with accounting principles generally accepted in the United States of America.
Basis for Opinion
These financial statements and financial highlights are the responsibility of the Fund’s management. Our responsibility is to express an opinion on the Fund’s financial statements and financial highlights based on our audits. We are a public accounting firm registered with the Public Company Accounting Oversight Board (United States) (PCAOB) and are required to be independent with respect to the Fund in accordance with the U.S. federal securities laws and the applicable rules and regulations of the Securities and Exchange Commission and the PCAOB.
We conducted our audits in accordance with the standards of the PCAOB. Those standards require that we plan and perform the audit to obtain reasonable assurance about whether the financial statements and financial highlights are free of material misstatement, whether due to error or fraud. The Fund is not required to have, nor were we engaged to perform, an audit of its internal control over financial reporting. As part of our audits, we are required to obtain an understanding of internal control over financial reporting but not for the purpose of expressing an opinion on the effectiveness of the Fund’s internal control over financial reporting. Accordingly, we express no such opinion.
Our audits included performing procedures to assess the risks of material misstatement of the financial statements and financial highlights, whether due to error or fraud, and performing procedures that respond to those risks. Such procedures included examining, on a test basis, evidence regarding the amounts and disclosures in the financial statements and financial highlights. Our audits also included evaluating the accounting principles used and significant estimates made by management, as well as evaluating the overall presentation of the financial statements and financial highlights. Our procedures included confirmation of securities owned as of October 31, 2022, by correspondence with the custodian and brokers; when replies were not received from brokers, we performed other auditing procedures. We believe that our audits provide a reasonable basis for our opinion.
/s/ Deloitte & Touche LLP
Boston, Massachusetts
December 28, 2022
We have served as the auditor of one or more Eaton Vance investment companies since 1959.
Eaton Vance
Tax-Managed Equity Asset Allocation Fund
October 31, 2022
Federal Tax Information (Unaudited)
The Form 1099-DIV you receive in February 2023 will show the tax status of all distributions paid to your account in calendar year 2022. Shareholders are advised to consult their own tax adviser with respect to the tax consequences of their investment in the Fund. As required by the Internal Revenue Code and/or regulations, shareholders must be notified regarding the status of qualified dividend income for individuals, the dividends received deduction for corporations and capital gains dividends.
Qualified Dividend Income. For the fiscal year ended October 31, 2022, the Fund designates approximately $8,450,508, or up to the maximum amount of such dividends allowable pursuant to the Internal Revenue Code, as qualified dividend income eligible for the reduced tax rate of 15%.
Dividends Received Deduction. Corporate shareholders are generally entitled to take the dividends received deduction on the portion of the Fund’s dividend distribution that qualifies under tax law. For the Fund’s fiscal 2022 ordinary income dividends, 100% qualifies for the corporate dividends received deduction.
Capital Gains Dividends. The Fund hereby designates as a capital gain dividend with respect to the taxable year ended October 31, 2022, $1,403,814 or, if subsequently determined to be different, the net capital gain of such year.
Eaton Vance
Tax-Managed Equity Asset Allocation Fund
October 31, 2022
Board of Trustees’ Contract Approval
Overview of the Contract Review Process
The Investment Company Act of 1940, as amended (the “1940 Act”), provides, in substance, that the investment advisory agreement between a fund and its investment adviser will continue in effect from year-to-year only if its continuation is approved on an annual basis by a vote of the fund’s board of trustees, including a majority of the trustees who are not “interested persons” of the fund (“independent trustees”), cast in person at a meeting called for the purpose of considering such approval.
At a meeting held on June 8, 2022, the Boards of Trustees/Directors (collectively, the “Board”) that oversee the registered investment companies advised by Eaton Vance Management or its affiliate, Boston Management and Research (the “Eaton Vance Funds”), including a majority of the independent trustees (the “Independent Trustees”), voted to approve the continuation of existing investment advisory agreements and sub-advisory agreements1 for each of the Eaton Vance Funds for an additional one-year period. The Board relied upon the affirmative recommendation of its Contract Review Committee, which is a committee exclusively comprised of Independent Trustees. Prior to making its recommendation, the Contract Review Committee reviewed information furnished by the adviser and sub-adviser to each of the Eaton Vance Funds (including information specifically requested by the Board) for a series of formal meetings held between April and June 2022. Members of the Contract Review Committee also considered information received at prior meetings of the Board and its committees, to the extent such information was relevant to the Contract Review Committee’s annual evaluation of the investment advisory agreements and sub-advisory agreements.
In connection with its evaluation of the investment advisory agreements and sub-advisory agreements, the Board considered various information relating to the Eaton Vance Funds. This included information applicable to all or groups of Eaton Vance Funds, which is referenced immediately below, and information applicable to the particular Eaton Vance Fund covered by this report (additional fund-specific information is referenced below under “Results of the Contract Review Process”). (For funds that invest through one or more underlying portfolios, references to “each fund” in this section may include information that was considered at the portfolio-level.)
Information about Fees, Performance and Expenses
| | • | | A report from an independent data provider comparing advisory and other fees paid by each fund to such fees paid by comparable funds, as identified by the independent data provider (“comparable funds”); |
| | • | | A report from an independent data provider comparing each fund’s total expense ratio (and its components) to those of comparable funds; |
| | • | | A report from an independent data provider comparing the investment performance of each fund (including, as relevant, total return data, income data, Sharpe ratios and information ratios) to the investment performance of comparable funds and, as applicable, benchmark indices, over various time periods; |
| | • | | In certain instances, data regarding investment performance relative to customized groups of peer funds and blended indices identified by the adviser in consultation with the Portfolio Management Committee of the Board (a committee exclusively comprised of Independent Trustees); |
| | • | | Comparative information concerning the fees charged and services provided by the adviser and sub-adviser to each fund in managing other accounts (which may include other mutual funds, collective investment funds and institutional accounts) using investment strategies and techniques similar to those used in managing such fund(s), if any; |
| | • | | Profitability analyses with respect to the adviser and sub-adviser to each of the funds; |
Information about Portfolio Management and Trading
| | • | | Descriptions of the investment management services provided to each fund, as well as each of the funds’ investment strategies and policies; |
| | • | | The procedures and processes used to determine the value of fund assets, including, when necessary, the determination of “fair value” and actions taken to monitor and test the effectiveness of such procedures and processes; |
| | • | | Information about the policies and practices of each fund’s adviser and sub-adviser with respect to trading, including their processes for seeking best execution of portfolio transactions; |
| | • | | Information about the allocation of brokerage transactions and the benefits, if any, received by the adviser and sub-adviser to each fund as a result of brokerage allocation, including, as applicable, information concerning the acquisition of research through client commission arrangements and policies with respect to “soft dollars”; |
| | • | | Data relating to the portfolio turnover rate of each fund and related information regarding active management in the context of particular strategies; |
Information about each Adviser and Sub-adviser
| | • | | Reports detailing the financial results and condition of the adviser and sub-adviser to each fund; |
| 1 | Not all Eaton Vance Funds have entered into a sub-advisory agreement with a sub-adviser. Accordingly, references to "sub-adviser" or "sub-advisory agreement" in this "Overview" section may not be applicable to the particular Eaton Vance Fund covered by this report. Following the "Overview" section, further information regarding the Board’s evaluation of a fund’s contractual arrangements is included under the "Results of the Contract Review Process" section. |
Eaton Vance
Tax-Managed Equity Asset Allocation Fund
October 31, 2022
Board of Trustees’ Contract Approval — continued
| | • | | Information regarding the individual investment professionals whose responsibilities include portfolio management and investment research for the funds, and, for portfolio managers and certain other investment professionals, information relating to their responsibilities with respect to managing other mutual funds and investment accounts, as applicable; |
| | • | | Information regarding the adviser’s and its parent company’s (Morgan Stanley’s) efforts to retain and attract talented investment professionals, including in the context of a particularly competitive marketplace for talent, as well as the ongoing unique environment presented by hybrid, remote and other alternative work arrangements; |
| | • | | The Code of Ethics of the adviser and its affiliates and the sub-adviser of each fund, together with information relating to compliance with, and the administration of, such codes; |
| | • | | Policies and procedures relating to proxy voting, including regular reporting with respect to fund proxy voting activities; |
| | • | | Information regarding the handling of corporate actions and class actions, as well as information regarding litigation and other regulatory matters; |
| | • | | Information concerning the resources devoted to compliance efforts undertaken by the adviser and its affiliates and the sub-adviser of each fund, if any, including descriptions of their various compliance programs and their record of compliance; |
| | • | | Information concerning the business continuity and disaster recovery plans of the adviser and its affiliates and the sub-adviser of each fund, if any; |
| | • | | A description of Eaton Vance Management’s and Boston Management and Research’s oversight of sub-advisers, including with respect to regulatory and compliance issues, investment management and other matters; |
Other Relevant Information
| | • | | Information regarding ongoing initiatives to further integrate and harmonize, where applicable, the investment management and other departments of the adviser and its affiliates with the overall investment management infrastructure of Morgan Stanley, in light of Morgan Stanley’s acquisition of Eaton Vance on March 1, 2021; |
| | • | | Information concerning the nature, cost and character of the administrative and other non-investment advisory services provided by Eaton Vance Management and its affiliates; |
| | • | | Information concerning oversight of the relationship with the custodian, subcustodians, fund accountants, and other third-party service providers by the adviser and/or administrator to each of the funds; |
| | • | | Information concerning efforts to implement policies and procedures with respect to various new regulations applicable to the funds, including Rule 12d1-4 (the Fund-of-Funds Rule), Rule 18f-4 (the Derivatives Rule) and Rule 2a-5 (the Fair Valuation Rule); |
| | • | | For an Eaton Vance Fund structured as an exchange-listed closed-end fund, information concerning the benefits of the closed-end fund structure, as well as, where relevant, the closed-end fund’s market prices (including as compared to the closed-end fund’s net asset value (NAV)), trading volume data, continued use of auction preferred shares (where applicable), distribution rates and other relevant matters; |
| | • | | The risks which the adviser and/or its affiliates incur in connection with the management and operation of the funds, including, among others, litigation, regulatory, entrepreneurial, and other business risks (and the associated costs of such risks); and |
| | • | | The terms of each investment advisory agreement and sub-advisory agreement. |
During the various meetings of the Board and its committees over the course of the year leading up to the June 8, 2022 meeting, the Trustees received information from portfolio managers and other investment professionals of the advisers and sub-advisers of the funds regarding investment and performance matters, and considered various investment and trading strategies used in pursuing the funds’ investment objectives. The Trustees also received information regarding risk management techniques employed in connection with the management of the funds. The Board and its committees evaluated issues pertaining to industry and regulatory developments, compliance procedures, fund governance and other issues with respect to the funds, and received and participated in reports and presentations provided by Eaton Vance Management, Boston Management and Research and fund sub-advisers, with respect to such matters. In addition to the formal meetings of the Board and its committees, the Independent Trustees held regular teleconferences to discuss, among other topics, matters relating to the continuation of investment advisory agreements and sub-advisory agreements.
The Contract Review Committee was advised throughout the contract review process by Goodwin Procter LLP, independent legal counsel for the Independent Trustees. The members of the Contract Review Committee, with the advice of such counsel, exercised their own business judgment in determining the material factors to be considered in evaluating each investment advisory agreement and sub-advisory agreement and the weight to be given to each such factor. The conclusions reached with respect to each investment advisory agreement and sub-advisory agreement were based on a comprehensive evaluation of all the information provided and not any single factor. Moreover, each member of the Contract Review Committee may have placed varying emphasis on particular factors in reaching conclusions with respect to each investment advisory agreement and sub-advisory agreement. In evaluating each investment advisory agreement and sub-advisory agreement, including the fee structures and other terms contained in such agreements, the members of the Contract Review Committee were also informed by multiple years of analysis and discussion with the adviser and sub-adviser to each of the Eaton Vance Funds.
Results of the Contract Review Process
Based on its consideration of the foregoing, and such other information it deemed relevant, including the factors and conclusions described below, the Contract Review Committee concluded that the continuation of the investment advisory agreement between Eaton Vance Tax-Managed Equity Asset Allocation Fund (the “Fund”) and Eaton Vance Management (“EVM”), as well as the investment advisory agreements between each of Tax-Managed
Eaton Vance
Tax-Managed Equity Asset Allocation Fund
October 31, 2022
Board of Trustees’ Contract Approval — continued
Growth Portfolio, Tax-Managed International Equity Portfolio, Tax-Managed Multi-Cap Growth Portfolio, Tax-Managed Small-Cap Portfolio and Tax-Managed Value Portfolio (the “Portfolios”), which are portfolios in which the Fund is authorized to invest, and Boston Management and Research (“BMR”) (EVM, with respect to the Fund, and BMR, with respect to the Portfolios, are each referred to herein as the “Adviser”), including their respective fee structures, is in the interests of shareholders and, therefore, recommended to the Board approval of each agreement. Based on the recommendation of the Contract Review Committee, the Board, including a majority of the Independent Trustees, voted to approve continuation of the investment advisory agreements for the Fund and the Portfolios.
Nature, Extent and Quality of Services
In considering whether to approve the investment advisory agreements for the Fund and the Portfolios, the Board evaluated the nature, extent and quality of services provided to the Fund and to the Portfolios by the applicable Adviser. BMR manages the Portfolios, while EVM allocates the assets of the Fund among the Portfolios.
The Board considered each Adviser’s management capabilities and investment processes in light of the types of investments held by the Fund and the Portfolios, including the education, experience and number of investment professionals and other personnel who provide portfolio management, investment research, and similar services to the Fund and the Portfolios, including recent changes to such personnel, where relevant. The Board specifically noted that each Adviser has devoted extensive resources to in-house equity research and also draws upon independent research available from third-party sources. The Board considered each Adviser’s experience managing funds that seek to maximize after-tax returns. In particular, the Board considered the abilities and experience of each Adviser’s investment professionals in analyzing factors such as special considerations relevant to investing in preferred stocks. The Board also took into account the resources dedicated to portfolio management and other services, the compensation methods of each Adviser and other factors, including the reputation and resources each Adviser to recruit and retain highly qualified research, advisory and supervisory investment professionals. In addition, the Board considered the time and attention devoted to the Eaton Vance Funds, including the Fund and the Portfolios, by senior management, as well as the infrastructure, operational capabilities and support staff in place to assist in the portfolio management and operations of the Fund and the Portfolios, including the provision of administrative services. The Board also considered the business-related and other risks to which each Adviser or its affiliates may be subject in managing the Fund and the Portfolios.
The Board considered the compliance programs of each Adviser and relevant affiliates thereof. The Board considered compliance and reporting matters regarding, among other things, personal trading by investment professionals, disclosure of portfolio holdings, late trading, frequent trading, portfolio valuation, business continuity and the allocation of investment opportunities. The Board also considered the responses of each Adviser and its affiliates to requests in recent years from regulatory authorities, such as the Securities and Exchange Commission and the Financial Industry Regulatory Authority.
The Board considered other administrative services provided or overseen by Eaton Vance Management and its affiliates, including transfer agency and accounting services. The Board evaluated the benefits to shareholders of investing in a fund that is a part of a large fund complex offering exposure to a variety of asset classes and investment disciplines, as well as the ability, in many cases, to exchange an investment among different funds without incurring additional sales charges.
After consideration of the foregoing factors, among others, the Board concluded that the nature, extent and quality of services provided by each Adviser, taken as a whole, are appropriate and consistent with the terms of the applicable investment advisory agreement.
Fund Performance
The Board compared the Fund’s investment performance to that of comparable funds identified by an independent data provider (the peer group), as well as appropriate benchmark indices. The Board’s review included comparative performance data with respect to the Fund for the one-, three-, five- and ten-year periods ended December 31, 2021. In this regard, the Board noted that the performance of the Fund was higher than the median performance of the Fund’s peer group for the three-year period. The Board also noted that the performance of the Fund was lower than its primary and blended benchmark indexes for the three-year period. The Board also considered the performance of the underlying Portfolios. The Board concluded that the performance of the Fund was satisfactory.
Management Fees and Expenses
The Board considered contractual fee rates payable by the Portfolios and by the Fund for advisory and administrative services (referred to collectively as “management fees”). As part of its review, the Board considered the Fund’s management fees and total expense ratio for the one-year period ended December 31, 2021, as compared to those of comparable funds, before and after giving effect to any undertaking to waive fees or reimburse expenses. The Board also considered certain factors identified by management in response to inquiries from the Contract Review Committee regarding the Fund’s total expense ratio relative to comparable funds.
After considering the foregoing information, and in light of the nature, extent and quality of the services provided by each Adviser, the Board concluded that the management fees charged for advisory and related services are reasonable.
Eaton Vance
Tax-Managed Equity Asset Allocation Fund
October 31, 2022
Board of Trustees’ Contract Approval — continued
Profitability and “Fall-Out” Benefits
The Board considered the level of profits realized by each Adviser and relevant affiliates thereof in providing investment advisory and administrative services to the Fund, to the Portfolios and to all Eaton Vance Funds as a group. The Board considered the level of profits realized without regard to marketing support or other payments by each Adviser and its affiliates to third parties in respect of distribution or other services.
The Board concluded that, in light of the foregoing factors and the nature, extent and quality of the services rendered, the profits realized by each Adviser and its affiliates are deemed not to be excessive.
The Board also considered direct or indirect fall-out benefits received by each Adviser and its affiliates in connection with their respective relationships with the Fund and the Portfolios, including the benefits of research services that may be available to each Adviser as a result of securities transactions effected for the Fund and the Portfolios and other investment advisory clients.
Economies of Scale
In reviewing management fees and profitability, the Board also considered the extent to which the applicable Adviser and its affiliates, on the one hand, and the Fund and the Portfolios, on the other hand, can expect to realize benefits from economies of scale as the assets of the Fund and the Portfolios increase. The Board acknowledged the difficulty in accurately measuring the benefits resulting from economies of scale, if any, with respect to the management of any specific fund or group of funds. The Board reviewed data summarizing the increases and decreases in the assets of the Fund and of all Eaton Vance Funds as a group over various time periods, and evaluated the extent to which the total expense ratio of the Fund and the profitability of each Adviser and its affiliates may have been affected by such increases or decreases. Based upon the foregoing, the Board concluded that the Fund currently shares in the benefits from economies of scale, if any, when they are realized each Adviser. The Board also concluded that the structure of the advisory fees, which include breakpoints at several asset levels, will allow the Fund and the Portfolios to continue to benefit from any economies of scale in the future.
Eaton Vance
Tax-Managed Equity Asset Allocation Fund
October 31, 2022
Liquidity Risk Management Program
The Fund has implemented a written liquidity risk management program (Program) and related procedures to manage its liquidity in accordance with Rule 22e-4 under the Investment Company Act of 1940, as amended (Liquidity Rule). The Liquidity Rule defines “liquidity risk” as the risk that a fund could not meet requests to redeem shares issued by the fund without significant dilution of the remaining investors’ interests in the fund. The Fund’s Board of Trustees/Directors has designated the investment adviser to serve as the administrator of the Program and the related procedures. The administrator has established a Liquidity Risk Management Oversight Committee (Committee) to perform the functions necessary to administer the Program. As part of the Program, the administrator is responsible for identifying illiquid investments and categorizing the relative liquidity of the Fund’s investments in accordance with the Liquidity Rule. Under the Program, the administrator assesses, manages, and periodically reviews the Fund’s liquidity risk, and is responsible for making certain reports to the Fund’s Board of Trustees/Directors and the Securities and Exchange Commission (SEC) regarding the liquidity of the Fund’s investments, and to notify the Board of Trustees/Directors and the SEC of certain liquidity events specified in the Liquidity Rule. The liquidity of the Fund’s portfolio investments is determined based on a number of factors including, but not limited to, relevant market, trading and investment-specific considerations under the Program.
At a meeting of the Fund’s Board of Trustees/Directors on June 7, 2022, the Committee provided a written report to the Fund’s Board of Trustees/Directors pertaining to the operation, adequacy, and effectiveness of implementation of the Program, as well as the operation of the highly liquid investment minimum (if applicable) for the period January 1, 2021 through December 31, 2021 (Review Period). The Program operated effectively during the Review Period, supporting the administrator’s ability to assess, manage and monitor Fund liquidity risk, including during periods of market volatility and net redemptions. During the Review Period, the Fund met redemption requests on a timely basis.
There can be no assurance that the Program will achieve its objectives in the future. Please refer to the Fund’s prospectus for more information regarding the Fund’s exposure to liquidity risk and other principal risks to which an investment in the Fund may be subject.
Eaton Vance
Tax-Managed Equity Asset Allocation Fund
October 31, 2022
Management and Organization
Fund Management. The Trustees of Eaton Vance Mutual Funds Trust (the Trust) are responsible for the overall management and supervision of the Trust’s affairs. The Board members and officers of the Trust are listed below. Except as indicated, each individual has held the office shown or other offices in the same company for the last five years. Board members hold indefinite terms of office. Each Trustee holds office until his or her successor is elected and qualified, subject to a prior death, resignation, retirement, disqualification or removal. Under the terms of the Fund’s current Trustee retirement policy, an Independent Trustee must retire and resign as a Trustee on the earlier of: (i) the first day of July following his or her 74th birthday; or (ii), with limited exception, December 31st of the 20th year in which he or she has served as a Trustee. However, if such retirement and resignation would cause the Fund to be out of compliance with Section 16 of the 1940 Act or any other regulations or guidance of the SEC, then such retirement and resignation will not become effective until such time as action has been taken for the Fund to be in compliance therewith. The “noninterested Trustees” consist of those Trustees who are not “interested persons” of the Trust, as that term is defined under the 1940 Act. The business address of each Board member and officer is Two International Place, Boston, Massachusetts 02110. As used below, “BMR” refers to Boston Management and Research, “EVC” refers to Eaton Vance Corp., “EV” refers to EV LLC, “EVM” refers to Eaton Vance Management and “EVD” refers to Eaton Vance Distributors, Inc. EV is the trustee of each of EVM and BMR. Effective March 1, 2021, each of EVM, BMR, EVD and EV are indirect, wholly owned subsidiaries of Morgan Stanley. Each officer affiliated with EVM may hold a position with other EVM affiliates that is comparable to his or her position with EVM listed below. Each Trustee oversees 135 funds (with the exception of Mr. Bowser who oversees 110 funds) in the Eaton Vance fund complex (including both funds and portfolios in a hub and spoke structure).
| | | | | | |
| Name and Year of Birth | | Trust Position(s) | | Length of
Service | | Principal Occupation(s) and Other Directorships
During Past Five Years and Other Relevant Experience |
|
| Interested Trustee |
| | | |
| Thomas E. Faust Jr. 1958 | | Trustee | | Since 2007 | | Chairman of Morgan Stanley Investment Management, Inc. (MSIM), member of the Board of Managers and President of EV (since 2021), Chief Executive Officer of EVM and BMR. Formerly, Chairman, Chief Executive Officer (2007-2021) and President (2006-2021) of EVC and Director of EVD (2007-2022). Mr. Faust is an interested person because of his positions with MSIM, BMR, EVM and EV, which are affiliates of the Trust. Other Directorships. Formerly, Director of EVC (2007-2021) and Hexavest Inc. (investment management firm) (2012-2021). |
|
| Noninterested Trustees |
| | | |
Alan C. Bowser(1) 1962 | | Trustee | | Since 2022 | | Chief Diversity Officer, Partner and a member of the Operating Committee, and formerly served as Senior Advisor on Diversity and Inclusion for the firm’s chief executive officer, Co-Head of the Americas Region, and Senior Client Advisor of Bridgewater Associates, an asset management firm (2011-present). Other Directorships. None. |
| | | |
Mark R. Fetting 1954 | | Trustee | | Since 2016 | | Private investor. Formerly held various positions at Legg Mason, Inc. (investment management firm) (2000-2012), including President, Chief Executive Officer, Director and Chairman (2008-2012), Senior Executive Vice President (2004-2008) and Executive Vice President (2001-2004). Formerly, President of Legg Mason family of funds (2001-2008). Formerly, Division President and Senior Officer of Prudential Financial Group, Inc. and related companies (investment management firm) (1991-2000). Other Directorships. None. |
| | | |
Cynthia E. Frost 1961 | | Trustee | | Since 2014 | | Private investor. Formerly, Chief Investment Officer of Brown University (university endowment) (2000-2012). Formerly, Portfolio Strategist for Duke Management Company (university endowment manager) (1995-2000). Formerly, Managing Director, Cambridge Associates (investment consulting company) (1989-1995). Formerly, Consultant, Bain and Company (management consulting firm) (1987-1989). Formerly, Senior Equity Analyst, BA Investment Management Company (1983-1985). Other Directorships. None. |
| | | |
George J. Gorman 1952 | | Chairperson of the Board and Trustee | | Since 2021 (Chairperson) and 2014 (Trustee) | | Principal at George J. Gorman LLC (consulting firm). Formerly, Senior Partner at Ernst & Young LLP (a registered public accounting firm) (1974-2009). Other Directorships. None. |
Eaton Vance
Tax-Managed Equity Asset Allocation Fund
October 31, 2022
Management and Organization — continued
| | | | | | |
| Name and Year of Birth | | Trust Position(s) | | Length of
Service | | Principal Occupation(s) and Other Directorships
During Past Five Years and Other Relevant Experience |
|
| Noninterested Trustees (continued) |
| | | |
Valerie A. Mosley 1960 | | Trustee | | Since 2014 | | Chairwoman and Chief Executive Officer of Valmo Ventures (a consulting and investment firm). Founder of Upward Wealth, Inc., dba BrightUp, a fintech platform. Formerly, Partner and Senior Vice President, Portfolio Manager and Investment Strategist at Wellington Management Company, LLP (investment management firm) (1992-2012). Formerly, Chief Investment Officer, PG Corbin Asset Management (1990-1992). Formerly worked in institutional corporate bond sales at Kidder Peabody (1986-1990). Other Directorships. Director of DraftKings, Inc. (digital sports entertainment and gaming company) (since September 2020). Director of Envestnet, Inc. (provider of intelligent systems for wealth management and financial wellness) (since 2018). Formerly, Director of Dynex Capital, Inc. (mortgage REIT) (2013-2020) and Director of Groupon, Inc. (e-commerce provider) (2020-2022). |
| | | |
Keith Quinton 1958 | | Trustee | | Since 2018 | | Private investor, researcher and lecturer. Formerly, Independent Investment Committee Member at New Hampshire Retirement System (2017-2021). Formerly, Portfolio Manager and Senior Quantitative Analyst at Fidelity Investments (investment management firm) (2001-2014). Other Directorships. Formerly, Director (2016-2021) and Chairman (2019-2021) of New Hampshire Municipal Bond Bank. |
| | | |
Marcus L. Smith 1966 | | Trustee | | Since 2018 | | Private investor and independent corporate director. Formerly, Chief Investment Officer, Canada (2012-2017), Chief Investment Officer, Asia (2010-2012), Director of Asian Research (2004-2010) and portfolio manager (2001-2017) at MFS Investment Management (investment management firm). Other Directorships. Director of First Industrial Realty Trust, Inc. (an industrial REIT) (since 2021). Director of MSCI Inc. (global provider of investment decision support tools) (since 2017). Formerly, Director of DCT Industrial Trust Inc. (logistics real estate company) (2017-2018). |
| | | |
Susan J. Sutherland 1957 | | Trustee | | Since 2015 | | Private investor. Director of Ascot Group Limited and certain of its subsidiaries (insurance and reinsurance) (since 2017). Formerly, Director of Hagerty Holding Corp. (insurance) (2015-2018) and Montpelier Re Holdings Ltd. (insurance and reinsurance) (2013-2015). Formerly, Associate, Counsel and Partner at Skadden, Arps, Slate, Meagher & Flom LLP (law firm) (1982-2013). Other Directorships. Director of Kairos Acquisition Corp. (insurance/InsurTech acquisition company) (since 2021). |
| | | |
Scott E. Wennerholm 1959 | | Trustee | | Since 2016 | | Private investor. Formerly, Trustee at Wheelock College (postsecondary institution) (2012-2018). Formerly, Consultant at GF Parish Group (executive recruiting firm) (2016-2017). Formerly, Chief Operating Officer and Executive Vice President at BNY Mellon Asset Management (investment management firm) (2005-2011). Formerly, Chief Operating Officer and Chief Financial Officer at Natixis Global Asset Management (investment management firm) (1997-2004). Formerly, Vice President at Fidelity Investments Institutional Services (investment management firm) (1994-1997). Other Directorships. None. |
| | | |
Nancy A. Wiser(1) 1967 | | Trustee | | Since 2022 | | Formerly, Executive Vice President and the Global Head of Operations at Wells Fargo Asset Management (2011-2021). Other Directorships. None. |
| | | | | | |
| Name and Year of Birth | | Trust Position(s) | | Length of Service | | Principal Occupation(s) During Past Five Years |
|
| Principal Officers who are not Trustees |
| | | |
Eric A. Stein 1980 | | President | | Since 2020 | | Vice President and Chief Investment Officer, Fixed Income of EVM and BMR. Prior to November 1, 2020, Mr. Stein was a co-Director of Eaton Vance’s Global Income Investments. Also Vice President of Calvert Research and Management (“CRM”). |
| | | |
Deidre E. Walsh 1971 | | Vice President and Chief Legal Officer | | Since 2009 | | Vice President of EVM and BMR. Also Vice President of CRM. |
| | | |
James F. Kirchner 1967 | | Treasurer | | Since 2007 | | Vice President of EVM and BMR. Also Vice President of CRM. |
Eaton Vance
Tax-Managed Equity Asset Allocation Fund
October 31, 2022
Management and Organization — continued
| | | | | | |
| Name and Year of Birth | | Trust Position(s) | | Length of Service | | Principal Occupation(s) During Past Five Years |
|
| Principal Officers who are not Trustees (continued) |
| | | |
Nicholas Di Lorenzo 1987 | | Secretary | | Since 2022 | | Formerly, associate (2012-2021) and counsel (2022) at Dechert LLP. |
| | | |
Richard F. Froio 1968 | | Chief Compliance Officer | | Since 2017 | | Vice President of EVM and BMR since 2017. Formerly, Deputy Chief Compliance Officer (Adviser/Funds) and Chief Compliance Officer (Distribution) at PIMCO (2012-2017) and Managing Director at BlackRock/Barclays Global Investors (2009-2012). |
| (1) | Mr. Bowser and Ms. Wiser began serving as Trustees effective April 4, 2022. |
The SAI for the Fund includes additional information about the Trustees and officers of the Fund and can be obtained without charge on Eaton Vance’s website at www.eatonvance.com or by calling 1-800-262-1122.
Eaton Vance Funds
| | |
| Privacy Notice | | April 2021 |
| | |
| |
| FACTS | | WHAT DOES EATON VANCE DO WITH YOUR
PERSONAL INFORMATION? |
| | | |
| |
| | |
| Why? | | Financial companies choose how they share your personal information. Federal law gives consumers the right to limit some but not all sharing. Federal law also requires us to tell you how we collect, share, and protect your personal information. Please read this notice carefully to understand what we do. |
| | |
| | | |
| What? | | The types of personal information we collect and share depend on the product or service you have with us. This information can include: ∎ Social Security number and income ∎ investment experience and risk tolerance ∎ checking account number and wire transfer instructions |
| | |
| | | |
| How? | | All financial companies need to share customers’ personal information to run their everyday business. In the section below, we list the reasons financial companies can share their customers’ personal information; the reasons Eaton Vance chooses to share; and whether you can limit this sharing. |
| | |
| | | |
| | | | |
Reasons we can share your
personal information | | Does Eaton Vance share? | | Can you limit this sharing? |
| For our everyday business purposes — such as to process your transactions, maintain your account(s), respond to court orders and legal investigations, or report to credit bureaus | | Yes | | No |
| For our marketing purposes — to offer our products and services to you | | Yes | | No |
| For joint marketing with other financial companies | | No | | We don’t share |
| For our investment management affiliates’ everyday business purposes — information about your transactions, experiences, and creditworthiness | | Yes | | Yes |
| For our affiliates’ everyday business purposes — information about your transactions and experiences | | Yes | | No |
| For our affiliates’ everyday business purposes — information about your creditworthiness | | No | | We don’t share |
| For our investment management affiliates to market to you | | Yes | | Yes |
| For our affiliates to market to you | | No | | We don’t share |
| For nonaffiliates to market to you | | No | | We don’t share |
| | |
| To limit our sharing | | Call toll-free 1-800-262-1122 or email: EVPrivacy@eatonvance.com Please note: If you are a new customer, we can begin sharing your information 30 days from the date we sent this notice. When you are no longer our customer, we continue to share your information as described in this notice. However, you can contact us at any time to limit our sharing. |
| | |
| | | |
| | |
| Questions? | | Call toll-free 1-800-262-1122 or email: EVPrivacy@eatonvance.com |
| | |
| | | |
Eaton Vance Funds
| | |
| Privacy Notice — continued | | April 2021 |
| | |
| Who we are |
| Who is providing this notice? | | Eaton Vance Management, Eaton Vance Distributors, Inc., Eaton Vance Trust Company, Eaton Vance Management (International) Limited, Eaton Vance Advisers International Ltd., Eaton Vance Global Advisors Limited, Eaton Vance Management’s Real Estate Investment Group, Boston Management and Research, Calvert Research and Management, Eaton Vance and Calvert Fund Families and our investment advisory affiliates (“Eaton Vance”) (see Investment Management Affiliates definition below) |
| What we do |
| How does Eaton Vance protect my personal information? | | To protect your personal information from unauthorized access and use, we use security measures that comply with federal law. These measures include computer safeguards and secured files and buildings. We have policies governing the proper handling of customer information by personnel and requiring third parties that provide support to adhere to appropriate security standards with respect to such information. |
| How does Eaton Vance collect my personal information? | | We collect your personal information, for example, when you ∎ open an account or make deposits or withdrawals from your account ∎ buy securities from us or make a wire transfer ∎ give us your contact information We also collect your personal information from others, such as credit bureaus, affiliates, or other companies. |
| Why can’t I limit all sharing? | | Federal law gives you the right to limit only ∎ sharing for affiliates’ everyday business purposes — information about your creditworthiness ∎ affiliates from using your information to market to you ∎ sharing for nonaffiliates to market to you State laws and individual companies may give you additional rights to limit sharing. See below for more on your rights under state law. |
| Definitions |
| Investment Management Affiliates | | Eaton Vance Investment Management Affiliates include registered investment advisers, registered broker-dealers, and registered and unregistered funds. Investment Management Affiliates does not include entities associated with Morgan Stanley Wealth Management, such as Morgan Stanley Smith Barney LLC and Morgan Stanley & Co. |
| Affiliates | | Companies related by common ownership or control. They can be financial and nonfinancial companies. ∎ Our affiliates include companies with a Morgan Stanley name and financial companies such as Morgan Stanley Smith Barney LLC and Morgan Stanley & Co. |
| Nonaffiliates | | Companies not related by common ownership or control. They can be financial and nonfinancial companies. ∎ Eaton Vance does not share with nonaffiliates so they can market to you. |
| Joint marketing | | A formal agreement between nonaffiliated financial companies that together market financial products or services to you. ∎ Eaton Vance doesn’t jointly market. |
| Other important information |
Vermont: Except as permitted by law, we will not share personal information we collect about Vermont residents with Nonaffiliates unless you provide us with your written consent to share such information. California: Except as permitted by law, we will not share personal information we collect about California residents with Nonaffiliates and we will limit sharing such personal information with our Affiliates to comply with California privacy laws that apply to us. |
Eaton Vance Funds
IMPORTANT NOTICES
Delivery of Shareholder Documents. The Securities and Exchange Commission (SEC) permits funds to deliver only one copy of shareholder documents, including prospectuses, proxy statements and shareholder reports, to fund investors with multiple accounts at the same residential or post office box address. This practice is often called “householding” and it helps eliminate duplicate mailings to shareholders. Eaton Vance, or your financial intermediary, may household the mailing of your documents indefinitely unless you instruct Eaton Vance, or your financial intermediary, otherwise. If you would prefer that your Eaton Vance documents not be householded, please contact Eaton Vance at 1-800-262-1122, or contact your financial intermediary. Your instructions that householding not apply to delivery of your Eaton Vance documents will typically be effective within 30 days of receipt by Eaton Vance or your financial intermediary.
Portfolio Holdings. Each Eaton Vance Fund and its underlying Portfolio(s) (if applicable) files a schedule of portfolio holdings on Part F to Form N-PORT with the SEC. Certain information filed on Form N-PORT may be viewed on the Eaton Vance website at www.eatonvance.com, by calling Eaton Vance at 1-800-262-1122 or in the EDGAR database on the SEC’s website at www.sec.gov.
Proxy Voting. From time to time, funds are required to vote proxies related to the securities held by the funds. The Eaton Vance Funds or their underlying Portfolios (if applicable) vote proxies according to a set of policies and procedures approved by the Funds’ and Portfolios’ Boards. You may obtain a description of these policies and procedures and information on how the Funds or Portfolios voted proxies relating to portfolio securities during the most recent 12-month period ended June 30, without charge, upon request, by calling 1-800-262-1122 and by accessing the SEC’s website at www.sec.gov.
This Page Intentionally Left Blank
This Page Intentionally Left Blank
Investment Adviser and Administrator
Eaton Vance Management
Two International Place
Boston, MA 02110
Principal Underwriter*
Eaton Vance Distributors, Inc.
Two International Place
Boston, MA 02110
(617) 482-8260
Custodian
State Street Bank and Trust Company
State Street Financial Center, One Lincoln Street
Boston, MA 02111
Transfer Agent
BNY Mellon Investment Servicing (US) Inc.
Attn: Eaton Vance Funds
P.O. Box 9653
Providence, RI 02940-9653
(800) 262-1122
Independent Registered Public Accounting Firm
Deloitte & Touche LLP
200 Berkeley Street
Boston, MA 02116-5022
Fund Offices
Two International Place
Boston, MA 02110
| * | FINRA BrokerCheck. Investors may check the background of their Investment Professional by contacting the Financial Industry Regulatory Authority (FINRA). FINRA BrokerCheck is a free tool to help investors check the professional background of current and former FINRA-registered securities firms and brokers. FINRA BrokerCheck is available by calling 1-800-289-9999 and at www.FINRA.org. The FINRA BrokerCheck brochure describing this program is available to investors at www.FINRA.org. |
1299 10.31.22

Eaton Vance
Global Income Builder Fund
Annual Report
October 31, 2022

Commodity Futures Trading Commission Registration. The Commodity Futures Trading Commission (“CFTC”) has adopted regulations that subject registered investment companies and advisers to regulation by the CFTC if a fund invests more than a prescribed level of its assets in certain CFTC-regulated instruments (including futures, certain options and swap agreements) or markets itself as providing investment exposure to such instruments. The investment adviser has claimed an exclusion from the definition of “commodity pool operator” under the Commodity Exchange Act with respect to its management of the Fund. Accordingly, neither the Fund nor the adviser with respect to the operation of the Fund is subject to CFTC regulation. Because of its management of other strategies, the Fund’s adviser is registered with the CFTC as a commodity pool operator. The adviser is also registered as a commodity trading advisor.
Fund shares are not insured by the FDIC and are not deposits or other obligations of, or guaranteed by, any depository institution. Shares are subject to investment risks, including possible loss of principal invested.
This report must be preceded or accompanied by a current summary prospectus or prospectus. Before investing, investors should consider carefully the investment objective, risks, and charges and expenses of a mutual fund. This and other important information is contained in the summary prospectus and prospectus, which can be obtained from a financial intermediary. Prospective investors should read the prospectus carefully before investing. For further information, please call 1-800-262-1122.
Annual Report October 31, 2022
Eaton Vance
Global Income Builder Fund
Eaton Vance
Global Income Builder Fund
October 31, 2022
Management’s Discussion of Fund Performance†
Economic and Market Conditions
The 12-month period starting November 1, 2021, was dominated by the ongoing effects of one black swan event — the COVID-19 pandemic — and fallout from another — Russia’s invasion of Ukraine in February 2022.
In the opening months of the period, stock investors as well as consumers appeared to take a “glass is half full” approach. In both the U.S. and Europe, consumers rushed to spend money saved earlier in the pandemic. Major U.S. equity indexes closed at new all-time highs during the final months of 2021.
But as the new year began, investors appeared to reevaluate the twin threats of inflation and interest rate hikes, and stock performance turned negative. In February, Russia’s invasion of Ukraine sent shock waves through U.S. and global markets, exacerbating inflationary pressures on energy and food costs. Central banks around the world — including the U.S. Federal Reserve (the Fed), the Bank of England, and the European Central Bank (ECB) — initiated their first interest rate hikes in years. In Europe, looming energy shortages caused by the Russia-Ukraine conflict pushed inflation rates even higher and stock prices lower during the period.
In the U.S., investors began to expect the Fed would raise interest rates at every policy meeting in 2022 and, in turn, worried that aggressive rate hikes could tip the economy into recession. At its June, July, and September 2022 meetings, the Fed hiked the federal funds rate 0.75% each time — to a
3.00%-3.25% range — its first moves of that magnitude since 1994. Higher interest rates, inflation, and recessionary worries drove stock prices down around the globe.
As the period came to a close in October 2022, however, U.S. and European stocks delivered positive performance for the first time in months — driven by a combination of better-than-expected U.S. company earnings; improving investor sentiment that stocks had been oversold during the August-September market pullback; government measures to address Europe’s energy crisis; and hope that central bank rate hikes would help tame inflation.
Meanwhile in the world’s second-largest economy, China’s zero-COVID policy severely restricted economic output. The MSCI Golden Dragon Index, a measure of Chinese large-cap and mid-cap stocks, lost more ground in October and was one of the worst-performing major indexes during the period, declining 42.74%.
Major equity indexes elsewhere also suffered significant losses. For the period as a whole, the MSCI ACWI Index, a broad measure of global equities, returned -19.96%; the S&P 500® Index, a broad measure of U.S. stocks, returned -14.61%; and the technology-laden Nasdaq Composite Index returned -28.56%. The MSCI EAFE Index of developed-market international equities returned -23.00%, while the MSCI Emerging Markets Index, dragged down by its China allocation, returned -31.03% during the period.
Fund Performance
For the 12-month period ended October 31, 2022, Eaton Vance Global Income Builder Fund (the Fund) returned -17.86% for Class A shares at net asset value (NAV). The Fund outperformed its primary benchmark, the MSCI World Index (the Index), which returned -18.48%; and underperformed its blended benchmark consisting of 65% MSCI World Index and 35% ICE BofA Developed Markets High Yield Ex-Subordinated Financial Index (the ICE BofA Index), which returned -17.26% during the period.
The Fund’s out-of-Index allocations to high yield bonds, bank loans, and preferred securities contributed to performance versus the Index during the period. Stock selections in the energy, communication services, and financials sectors, along with stock selections and an underweight position in the consumer discretionary sector, also contributed to Fund performance versus the Index.
The Fund’s high yield bond allocation outperformed the Index and the broad high yield market, as measured by the ICE BofA Index. Within that allocation, the Fund had a shorter duration and a higher average credit quality than the ICE BofA Index. That asset mix helped relative performance as interest rates rose and BB-rated and B-rated bonds outperformed CCC-rated bonds during the period. The Fund reduced its exposure to lower rated bonds early in 2022.
Security selections within the health care sector also helped performance relative to the ICE BofA Index as the Fund avoided exposure to several companies that experienced sharp declines in bond prices.
The Fund’s small out-of-Index allocation to bank loans also contributed to performance relative to the Index as it delivered positive returns during a period of generally negative returns by most asset classes.
The Fund’s preferred securities allocation — preferred stocks, exchange-traded funds investing primarily in preferred stocks, and corporate bonds and other debt securities with preferred characteristics — outperformed the Index and contributed to Fund performance versus the Index. However, the preferred allocation underperformed the overall preferred market, as measured by the ICE BofA Fixed Rate Preferred Securities Index.
See Endnotes and Additional Disclosures in this report.
Past performance is no guarantee of future results. Returns are historical and are calculated by determining the percentage change in net asset value (NAV) or offering price (as applicable) with all distributions reinvested. Furthermore, returns do not reflect the deduction of taxes that shareholders may have to pay on Fund distributions or upon the redemption of Fund shares. Investment return and principal value will fluctuate so that shares, when redeemed, may be worth more or less than their original cost. Performance for periods less than or equal to one year is cumulative. Performance is for the stated time period only; due to market volatility, current Fund performance may be lower or higher than the quoted return. For performance as of the most recent month-end, please refer to eatonvance.com.
Eaton Vance
Global Income Builder Fund
October 31, 2022
Management’s Discussion of Fund Performance† — continued
The Fund’s use of equity index futures contracts, a type of derivative, detracted from performance relative to the Index. Within the Fund’s common stock portfolio, the Fund’s strategy of investing in dividend-paying stocks resulted in an overweight allocation to European equities and an underweight allocation to U.S. equities relative to the Index. The Fund hedged these overweight and underweight exposures by selling short European index futures contracts and buying U.S. index futures contracts. By period-end, these index futures contracts were no longer in effect.
The Fund’s common stock allocation underperformed the Index and detracted from performance relative to the Index as well. Within the Fund’s common stock allocation, detractors from performance relative to the Index included stock selections in the industrials, information technology, and utilities sectors.
See Endnotes and Additional Disclosures in this report.
Past performance is no guarantee of future results. Returns are historical and are calculated by determining the percentage change in net asset value (NAV) or offering price (as applicable) with all distributions reinvested. Furthermore, returns do not reflect the deduction of taxes that shareholders may have to pay on Fund distributions or upon the redemption of Fund shares. Investment return and principal value will fluctuate so that shares, when redeemed, may be worth more or less than their original cost. Performance for periods less than or equal to one year is cumulative. Performance is for the stated time period only; due to market volatility, current Fund performance may be lower or higher than the quoted return. For performance as of the most recent month-end, please refer to eatonvance.com.
Eaton Vance
Global Income Builder Fund
October 31, 2022
Performance
Portfolio Manager(s) Christopher M. Dyer, CFA and Jeffrey D. Mueller, of Eaton Vance Advisers International Ltd.; John H. Croft, CFA and Derek J.V. DiGregorio, of Boston Management and Research
| | | | | | | | | | | | | | | | | | | | |
| % Average Annual Total Returns1,2 | | Class
Inception Date | | | Performance
Inception Date | | | One Year | | | Five Years | | | Ten Years | |
| | | | | |
Class A at NAV | | | 11/30/2005 | | | | 11/30/2005 | | | | (17.86 | )% | | | 3.42 | % | | | 6.37 | % |
Class A with 5.25% Maximum Sales Charge | | | — | | | | — | | | | (22.18 | ) | | | 2.32 | | | | 5.80 | |
Class C at NAV | | | 11/30/2005 | | | | 11/30/2005 | | | | (18.46 | ) | | | 2.68 | | | | 5.72 | |
Class C with 1% Maximum Deferred Sales Charge | | | — | | | | — | | | | (19.24 | ) | | | 2.68 | | | | 5.72 | |
Class I at NAV | | | 01/31/2006 | | | | 11/30/2005 | | | | (17.60 | ) | | | 3.70 | | | | 6.64 | |
Class R at NAV | | | 01/31/2006 | | | | 11/30/2005 | | | | (18.02 | ) | | | 3.15 | | | | 6.10 | |
|
| |
| | | | | |
MSCI World Index | | | — | | | | — | | | | (18.48 | )% | | | 6.37 | % | | | 8.93 | % |
ICE BofA Developed Markets High Yield Ex-Subordinated Financial Index | | | — | | | | — | | | | (15.20 | ) | | | 0.56 | | | | 3.16 | |
Blended Index | | | | | | | | | | | (17.26 | ) | | | 4.43 | | | | 6.97 | |
| | | | | |
| % Total Annual Operating Expense Ratios3 | | | | | Class A | | | Class C | | | Class I | | | Class R | |
| | | | | |
| | | | | | | 1.17% | | | | 1.92 | % | | | 0.92 | % | | | 1.42 | % |
Growth of $10,000
This graph shows the change in value of a hypothetical investment of $10,000 in Class A of the Fund for the period indicated. For comparison, the same investment is shown in the indicated index.
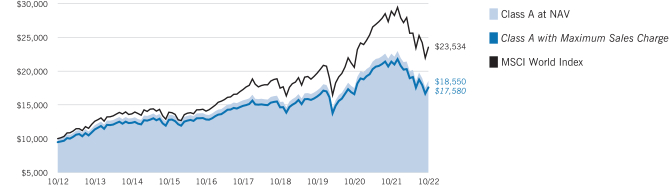
| | | | | | | | | | | | | | | | |
| Growth of Investment | | Amount Invested | | | Period Beginning | | | At NAV | | | With Maximum Sales Charge | |
| | | | |
Class C | | | $10,000 | | | | 10/31/2012 | | | | $17,440 | | | | N.A. | |
Class I, at minimum investment | | | $1,000,000 | | | | 10/31/2012 | | | | $1,903,114 | | | | N.A. | |
| | | | |
Class R | | | $10,000 | | | | 10/31/2012 | | | | $18,079 | | | | N.A. | |
See Endnotes and Additional Disclosures in this report.
Past performance is no guarantee of future results. Returns are historical and are calculated by determining the percentage change in net asset value (NAV) or offering price (as applicable) with all distributions reinvested. Furthermore, returns do not reflect the deduction of taxes that shareholders may have to pay on Fund distributions or upon the redemption of Fund shares. Investment return and principal value will fluctuate so that shares, when redeemed, may be worth more or less than their original cost. Performance for periods less than or equal to one year is cumulative. Performance is for the stated time period only; due to market volatility, current Fund performance may be lower or higher than the quoted return. For performance as of the most recent month-end, please refer to eatonvance.com.
Eaton Vance
Global Income Builder Fund
October 31, 2022
Fund Profile
Country Allocation (% of net assets)
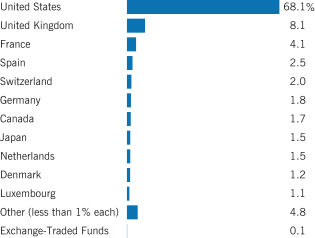
Asset Allocation (% of net assets)1
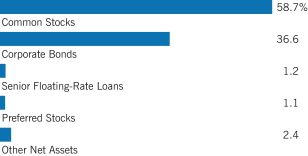
Top 10 Holdings (% of net assets)2
| | | | |
| |
Alphabet, Inc., Class C | | | 2.7 | % |
| |
Microsoft Corp. | | | 2.3 | |
| |
Apple, Inc. | | | 1.9 | |
| |
EOG Resources, Inc. | | | 1.9 | |
| |
Eli Lilly & Co. | | | 1.8 | |
| |
Amazon.com, Inc. | | | 1.5 | |
| |
Nestle S.A. | | | 1.4 | |
| |
Coca-Cola Co. (The) | | | 1.4 | |
| |
Walt Disney Co. (The) | | | 1.3 | |
| |
Novo Nordisk A/S, Class B | | | 1.2 | |
| |
Total | | | 17.4 | % |
Footnotes:
Fund invests in an affiliated investment company (Portfolio) with the same objective(s) and policies as the Fund. References to investments are to the Portfolio’s holdings.
1 Other Net Assets represents other assets less liabilities and includes any investment type that represents less than 1% of net assets.
2 Excludes cash and cash equivalents.
Eaton Vance
Global Income Builder Fund
October 31, 2022
Endnotes and Additional Disclosures
| † | The views expressed in this report are those of the portfolio manager(s) and are current only through the date stated at the top of this page. These views are subject to change at any time based upon market or other conditions, and Eaton Vance and the Fund(s) disclaim any responsibility to update such views. These views may not be relied upon as investment advice and, because investment decisions are based on many factors, may not be relied upon as an indication of trading intent on behalf of any Eaton Vance fund. This commentary may contain statements that are not historical facts, referred to as “forward-looking statements.” The Fund’s actual future results may differ significantly from those stated in any forward-looking statement, depending on factors such as changes in securities or financial markets or general economic conditions, the volume of sales and purchases of Fund shares, the continuation of investment advisory, administrative and service contracts, and other risks discussed from time to time in the Fund’s filings with the Securities and Exchange Commission. |
| 1 | MSCI World Index is an unmanaged index of equity securities in the developed markets. MSCI indexes are net of foreign withholding taxes. Source: MSCI. MSCI data may not be reproduced or used for any other purpose. MSCI provides no warranties, has not prepared or approved this report, and has no liability hereunder. ICE BofA Developed Markets High Yield Ex-Subordinated Financial Index is an unmanaged index of global developed market, below investment grade corporate bonds. ICE® BofA® indices are not for redistribution or other uses; provided “as is”, without warranties, and with no liability. Eaton Vance has prepared this report and ICE Data Indices, LLC does not endorse it, or guarantee, review, or endorse Eaton Vance’s products. BofA® is a licensed registered trademark of Bank of America Corporation in the United States and other countries. The Blended Index consists of 65% MSCI World Index and 35% ICE BofA Developed Markets High Yield Ex-Subordinated Financial Index, rebalanced monthly. Unless otherwise stated, index returns do not reflect the effect of any applicable sales charges, commissions, expenses, taxes or leverage, as applicable. It is not possible to invest directly in an index. |
| 2 | Total Returns at NAV do not include applicable sales charges. If sales charges were deducted, the returns would be lower. Total Returns shown with maximum sales charge reflect the stated maximum sales charge. Unless otherwise stated, performance does not reflect the deduction of taxes on Fund distributions or redemptions of Fund shares. |
Effective December 7, 2015, the Fund changed its name and principal investment strategies to invest in common stocks, preferred stocks and other hybrid securities and income instruments of U.S. and foreign issuers. As of such date, the Fund was no longer required to invest at least 80% of its net assets in dividend-paying common and preferred stocks. Performance prior to December 7, 2015 reflects the Fund’s performance under its former principal investment strategies.
Effective November 5, 2020, Class C shares automatically convert to Class A shares eight years after purchase. The average annual total returns listed for Class C reflect conversion to Class A shares after eight years. Prior to November 5, 2020, Class C shares automatically converted to Class A shares ten years after purchase.
| 3 | Source: Fund prospectus. The expense ratios for the current reporting period can be found in the Financial Highlights section of this report. Performance reflects expenses waived and/or reimbursed, if applicable. Without such waivers and/or reimbursements, performance would have been lower. |
Fund profile subject to change due to active management.
Additional Information
S&P 500® Index is an unmanaged index of large-cap stocks commonly used as a measure of U.S. stock market performance. S&P Dow Jones Indices are a product of S&P Dow Jones Indices LLC (“S&P DJI”) and have been licensed for use. S&P® and S&P 500® are registered trademarks of S&P DJI; Dow Jones® is a registered trademark of Dow Jones Trademark Holdings LLC (“Dow Jones”); S&P DJI, Dow Jones and their respective affiliates do not sponsor, endorse, sell or promote the Fund, will not have any liability with respect thereto and do not have any liability for any errors, omissions, or interruptions of the S&P Dow Jones Indices. Nasdaq Composite Index is a market capitalization-weighted index of all domestic and international securities listed on Nasdaq. Source: Nasdaq, Inc. The information is provided by Nasdaq (with its affiliates, are referred to as the “Corporations”) and Nasdaq’s third party licensors on an “as is” basis and the Corporations make no guarantees and bear no liability of any kind with respect to the information or the Fund. MSCI Golden Dragon Index is an unmanaged index of common stocks traded in China, Hong Kong and Taiwan. MSCI ACWI Index is an unmanaged free-float-adjusted, market-capitalization-weighted index designed to measure the equity market performance of developed and emerging markets. MSCI EAFE Index is an unmanaged index of equities in the developed markets, excluding the U.S. and Canada. MSCI Emerging Markets Index is an unmanaged index of emerging markets common stocks. ICE BofA Fixed Rate Preferred Securities Index is an unmanaged index of fixed-rate, preferred securities issued in the U.S.
Important Notice to Shareholders
Effective November 18, 2022, the Fund is managed by Christopher M. Dyer, CFA, Derek J.V. DiGregorio and Jeffrey D. Mueller.
Eaton Vance
Global Income Builder Fund
October 31, 2022
Fund Expenses
Example
As a Fund shareholder, you incur two types of costs: (1) transaction costs, including sales charges (loads) on purchases and redemption fees (if applicable); and (2) ongoing costs, including management fees; distribution and/or service fees; and other Fund expenses. This Example is intended to help you understand your ongoing costs (in dollars) of Fund investing and to compare these costs with the ongoing costs of investing in other mutual funds. The Example is based on an investment of $1,000 invested at the beginning of the period and held for the entire period (May 1, 2022 to October 31, 2022).
Actual Expenses
The first section of the table below provides information about actual account values and actual expenses. You may use the information in this section, together with the amount you invested, to estimate the expenses that you paid over the period. Simply divide your account value by $1,000 (for example, an $8,600 account value divided by $1,000 = 8.6), then multiply the result by the number in the first section under the heading entitled “Expenses Paid During Period” to estimate the expenses you paid on your account during this period.
Hypothetical Example for Comparison Purposes
The second section of the table below provides information about hypothetical account values and hypothetical expenses based on the actual Fund expense ratio and an assumed rate of return of 5% per year (before expenses), which is not the actual Fund return. The hypothetical account values and expenses may not be used to estimate the actual ending account balance or expenses you paid for the period. You may use this information to compare the ongoing costs of investing in your Fund and other funds. To do so, compare this 5% hypothetical example with the 5% hypothetical examples that appear in the shareholder reports of the other funds.
Please note that the expenses shown in the table are meant to highlight your ongoing costs only and do not reflect any transactional costs, such as sales charges (loads) or redemption fees (if applicable). Therefore, the second section of the table is useful in comparing ongoing costs only, and will not help you determine the relative total costs of owning different funds. In addition, if these transactional costs were included, your costs would be higher.
| | | | | | | | | | | | | | | | |
| | | Beginning
Account Value
(5/1/22) | | | Ending
Account Value
(10/31/22) | | | Expenses Paid
During Period*
(5/1/22 –10/31/22) | | | Annualized
Expense
Ratio | |
| | | | |
Actual | | | | | | | | | | | | | | | | |
Class A | | $ | 1,000.00 | | | $ | 927.40 | | | $ | 5.68 | ** | | | 1.17 | % |
Class C | | $ | 1,000.00 | | | $ | 923.60 | | | $ | 9.31 | ** | | | 1.92 | % |
Class I | | $ | 1,000.00 | | | $ | 928.50 | | | $ | 4.47 | ** | | | 0.92 | % |
Class R | | $ | 1,000.00 | | | $ | 926.20 | | | $ | 6.89 | ** | | | 1.42 | % |
| | | | | |
Hypothetical | | | | | | | | | | | | | | | | |
(5% return per year before expenses) | | | | | | | | | | | | | | | | |
Class A | | $ | 1,000.00 | | | $ | 1,019.31 | | | $ | 5.96 | ** | | | 1.17 | % |
Class C | | $ | 1,000.00 | | | $ | 1,015.53 | | | $ | 9.75 | ** | | | 1.92 | % |
Class I | | $ | 1,000.00 | | | $ | 1,020.57 | | | $ | 4.69 | ** | | | 0.92 | % |
Class R | | $ | 1,000.00 | | | $ | 1,018.05 | | | $ | 7.22 | ** | | | 1.42 | % |
| * | Expenses are equal to the Fund’s annualized expense ratio for the indicated Class, multiplied by the average account value over the period, multiplied by 184/365 (to reflect the one-half year period). The Example assumes that the $1,000 was invested at the net asset value per share determined at the close of business on April 30, 2022. The Example reflects the expenses of both the Fund and the Portfolio. |
| ** | Absent an allocation of certain expenses to affiliates, expenses would be higher. |
Eaton Vance
Global Income Builder Fund
October 31, 2022
Statement of Assets and Liabilities
| | | | |
| Assets | | October 31, 2022 | |
| |
Investment in Global Income Builder Portfolio, at value (identified cost $205,298,845) | | $ | 220,386,160 | |
| |
Receivable for Fund shares sold | | | 543,870 | |
| |
Receivable from affiliate | | | 6,716 | |
| |
Total assets | | $ | 220,936,746 | |
|
| Liabilities | |
| |
Payable for Fund shares redeemed | | $ | 544,638 | |
| |
Payable to affiliates: | | | | |
| |
Administration fee | | | 27,421 | |
| |
Distribution and service fees | | | 38,795 | |
| |
Trustees’ fees | | | 42 | |
| |
Accrued expenses | | | 85,472 | |
| |
Total liabilities | | $ | 696,368 | |
| |
Net Assets | | $ | 220,240,378 | |
|
| Sources of Net Assets | |
| |
Paid-in capital | | $ | 205,513,153 | |
| |
Distributable earnings | | | 14,727,225 | |
| |
Net Assets | | $ | 220,240,378 | |
| |
| Class A Shares | | | | |
| |
Net Assets | | $ | 123,588,939 | |
| |
Shares Outstanding | | | 13,849,548 | |
| |
Net Asset Value and Redemption Price Per Share | | | | |
| |
(net assets ÷ shares of beneficial interest outstanding) | | $ | 8.92 | |
| |
Maximum Offering Price Per Share | | | | |
| |
(100 ÷ 94.75 of net asset value per share) | | $ | 9.41 | |
|
| Class C Shares | |
| |
Net Assets | | $ | 15,092,639 | |
| |
Shares Outstanding | | | 1,712,504 | |
| |
Net Asset Value and Offering Price Per Share* | | | | |
| |
(net assets ÷ shares of beneficial interest outstanding) | | $ | 8.81 | |
|
| Class I Shares | |
| |
Net Assets | | $ | 80,627,058 | |
| |
Shares Outstanding | | | 9,046,330 | |
| |
Net Asset Value, Offering Price and Redemption Price Per Share | | | | |
| |
(net assets ÷ shares of beneficial interest outstanding) | | $ | 8.91 | |
|
| Class R Shares | |
| |
Net Assets | | $ | 931,742 | |
| |
Shares Outstanding | | | 104,810 | |
| |
Net Asset Value, Offering Price and Redemption Price Per Share | | | | |
| |
(net assets ÷ shares of beneficial interest outstanding) | | $ | 8.89 | |
On sales of $50,000 or more, the offering price of Class A shares is reduced.
| * | Redemption price per share is equal to the net asset value less any applicable contingent deferred sales charge. |
| | | | |
| | 8 | | See Notes to Financial Statements. |
Eaton Vance
Global Income Builder Fund
October 31, 2022
Statement of Operations
| | | | |
| Investment Income | | Year Ended
October 31, 2022 | |
| |
Dividend income allocated from Portfolio (net of foreign taxes withheld of $717,194) | | $ | 5,915,592 | |
| |
Interest and other income allocated from Portfolio (net of foreign taxes withheld of $6,335) | | | 6,086,611 | |
| |
Expenses allocated from Portfolio | | | (1,683,357 | ) |
| |
Total investment income from Portfolio | | $ | 10,318,846 | |
|
| Expenses | |
| |
Administration fee | | $ | 393,294 | |
| |
Distribution and service fees: | | | | |
| |
Class A | | | 362,670 | |
| |
Class C | | | 198,195 | |
| |
Class R | | | 4,329 | |
| |
Trustees’ fees and expenses | | | 500 | |
| |
Custodian fee | | | 25,774 | |
| |
Transfer and dividend disbursing agent fees | | | 166,655 | |
| |
Legal and accounting services | | | 37,700 | |
| |
Printing and postage | | | 35,904 | |
| |
Registration fees | | | 71,821 | |
| |
Miscellaneous | | | 32,003 | |
| |
Total expenses | | $ | 1,328,845 | |
| |
Deduct: | | | | |
| |
Waiver and/or reimbursement of expenses by affiliates | | $ | 41,418 | |
| |
Total expense reductions | | $ | 41,418 | |
| |
Net expenses | | $ | 1,287,427 | |
| |
Net investment income | | $ | 9,031,419 | |
|
| Realized and Unrealized Gain (Loss) from Portfolio | |
| |
Net realized gain (loss): | | | | |
| |
Investment transactions (net of foreign capital gains taxes of $3,110) | | $ | (3,253,127 | ) |
| |
Futures contracts | | | (1,109,625 | ) |
| |
Foreign currency transactions | | | (145,417 | ) |
| |
Forward foreign currency exchange contracts | | | 10,613 | |
| |
Net realized loss | | $ | (4,497,556 | ) |
| |
Change in unrealized appreciation (depreciation): | | | | |
| |
Investments (including net increase in accrued foreign capital gains taxes of $31,704) | | $ | (56,204,269 | ) |
| |
Foreign currency | | | (183,786 | ) |
| |
Forward foreign currency exchange contracts | | | (1,055 | ) |
| |
Net change in unrealized appreciation (depreciation) | | $ | (56,389,110 | ) |
| |
Net realized and unrealized loss | | $ | (60,886,666 | ) |
| |
Net decrease in net assets from operations | | $ | (51,855,247 | ) |
| | | | |
| | 9 | | See Notes to Financial Statements. |
Eaton Vance
Global Income Builder Fund
October 31, 2022
Statements of Changes in Net Assets
| | | | | | | | |
| | | Year Ended October 31, | |
| Increase (Decrease) in Net Assets | | 2022 | | | 2021 | |
| | |
From operations: | | | | | | | | |
| | |
Net investment income | | $ | 9,031,419 | | | $ | 7,486,338 | |
| | |
Net realized gain (loss) | | | (4,497,556 | ) | | | 14,670,016 | (1) |
| | |
Net change in unrealized appreciation (depreciation) | | | (56,389,110 | ) | | | 50,261,021 | |
| | |
Net increase (decrease) in net assets from operations | | $ | (51,855,247 | ) | | $ | 72,417,375 | |
| | |
Distributions to shareholders: | | | | | | | | |
| | |
Class A | | $ | (6,678,673 | ) | | $ | (4,679,856 | ) |
| | |
Class C | | | (805,593 | ) | | | (641,216 | ) |
| | |
Class I | | | (4,716,320 | ) | | | (3,565,558 | ) |
| | |
Class R | | | (36,989 | ) | | | (22,315 | ) |
| | |
Total distributions to shareholders | | $ | (12,237,575 | ) | | $ | (8,908,945 | ) |
| | |
Transactions in shares of beneficial interest: | | | | | | | | |
| | |
Class A | | $ | (5,748,298 | ) | | $ | 8,820,157 | |
| | |
Class C | | | (4,540,481 | ) | | | (20,459,289 | ) |
| | |
Class I | | | (9,706,068 | ) | | | (4,059,902 | ) |
| | |
Class R | | | 311,067 | | | | 54,321 | |
| | |
Net decrease in net assets from Fund share transactions | | $ | (19,683,780 | ) | | $ | (15,644,713 | ) |
| | |
Other capital: | | | | | | | | |
| | |
Portfolio transaction fee contributed to Portfolio | | $ | (115,958 | ) | | $ | (153,151 | ) |
| | |
Portfolio transaction fee allocated from Portfolio | | | 115,870 | | | | 151,338 | |
| | |
Net decrease in net assets from other capital | | $ | (88 | ) | | $ | (1,813 | ) |
| | |
Net increase (decrease) in net assets | | $ | (83,776,690 | ) | | $ | 47,861,904 | |
|
| Net Assets | |
| | |
At beginning of year | | $ | 304,017,068 | | | $ | 256,155,164 | |
| | |
At end of year | | $ | 220,240,378 | | | $ | 304,017,068 | |
| (1) | Includes $2,657,855 of net realized gains from redemptions in-kind. |
| | | | |
| | 10 | | See Notes to Financial Statements. |
Eaton Vance
Global Income Builder Fund
October 31, 2022
Financial Highlights
| | | | | | | | | | | | | | | | | | | | |
| | | Class A | |
| | | Year Ended October 31, | |
| | | 2022 | | | 2021 | | | 2020 | | | 2019 | | | 2018 | |
| | | | | |
Net asset value — Beginning of year | | $ | 11.360 | | | $ | 9.070 | | | $ | 9.210 | | | $ | 8.620 | | | $ | 9.060 | |
| | | | | |
| Income (Loss) From Operations | | | | | | | | | | | | | | | | | | | | |
| | | | | |
Net investment income(1) | | $ | 0.343 | | | $ | 0.272 | | | $ | 0.330 | | | $ | 0.372 | | | $ | 0.267 | |
| | | | | |
Net realized and unrealized gain (loss) | | | (2.321 | ) | | | 2.342 | | | | (0.146 | ) | | | 0.542 | | | | (0.383 | ) |
| | | | | |
Total income (loss) from operations | | $ | (1.978 | ) | | $ | 2.614 | | | $ | 0.184 | | | $ | 0.914 | | | $ | (0.116 | ) |
| | | | | |
| Less Distributions | | | | | | | | | | | | | | | | | | | | |
| | | | | |
From net investment income | | $ | (0.324 | ) | | $ | (0.324 | ) | | $ | (0.324 | ) | | $ | (0.324 | ) | | $ | (0.324 | ) |
| | | | | |
From net realized gain | | | (0.138 | ) | | | — | | | | — | | | | — | | | | — | |
| | | | | |
Total distributions | | $ | (0.462 | ) | | $ | (0.324 | ) | | $ | (0.324 | ) | | $ | (0.324 | ) | | $ | (0.324 | ) |
| | | | | |
Portfolio transaction fee, net(1) | | $ | (0.000 | )(2) | | $ | (0.000 | )(2) | | $ | (0.000 | )(2) | | $ | (0.000 | )(2) | | $ | (0.000 | )(2) |
| | | | | |
Net asset value — End of year | | $ | 8.920 | | | $ | 11.360 | | | $ | 9.070 | | | $ | 9.210 | | | $ | 8.620 | |
| | | | | |
Total Return(3)(4) | | | (17.86 | )% | | | 29.08 | % | | | 2.12 | % | | | 10.97 | % | | | (1.52 | )% |
| | | | | |
| Ratios/Supplemental Data | | | | | | | | | | | | | | | | | | | | |
| | | | | |
Net assets, end of year (000’s omitted) | | $ | 123,589 | | | $ | 164,778 | | | $ | 123,152 | | | $ | 131,104 | | | $ | 115,974 | |
| | | | | |
Ratios (as a percentage of average daily net assets):(5) | | | | | | | | | | | | | | | | | | | | |
| | | | | |
Expenses(4) | | | 1.17 | %(6) | | | 1.17 | % | | | 1.17 | % | | | 1.24 | % | | | 1.28 | % |
| | | | | |
Net investment income | | | 3.42 | % | | | 2.52 | % | | | 3.65 | % | | | 4.22 | % | | | 2.94 | % |
| | | | | |
Portfolio Turnover of the Portfolio | | | 59 | % | | | 60 | % | | | 118 | % | | | 86 | % | | | 102 | % |
| (1) | Computed using average shares outstanding. |
| (2) | Amount is less than $(0.0005). |
| (3) | Returns are historical and are calculated by determining the percentage change in net asset value with all distributions reinvested and do not reflect the effect of sales charges. |
| (4) | The investment adviser, sub-adviser and administrator reimbursed certain operating expenses (equal to 0.02%, 0.03% and 0.02% of average daily net assets for the years ended October 31, 2022, 2020 and 2019, respectively). Absent this reimbursement, total return would be lower. |
| (5) | Includes the Fund’s share of the Portfolio’s allocated expenses. |
| (6) | Includes a reduction by the investment adviser of a portion of the Portfolio’s adviser fee due to the Portfolio’s investment in the Liquidity Fund (equal to less than 0.005% of average daily net assets for the year ended October 31, 2022). |
| | | | |
| | 11 | | See Notes to Financial Statements. |
Eaton Vance
Global Income Builder Fund
October 31, 2022
Financial Highlights — continued
| | | | | | | | | | | | | | | | | | | | |
| | | Class C | |
| | | Year Ended October 31, | |
| | | 2022 | | | 2021 | | | 2020 | | | 2019 | | | 2018 | |
| | | | | |
Net asset value — Beginning of year | | $ | 11.230 | | | $ | 8.960 | | | $ | 9.110 | | | $ | 8.530 | | | $ | 8.960 | |
| | | | | |
| Income (Loss) From Operations | | | | | | | | | | | | | | | | | | | | |
| | | | | |
Net investment income(1) | | $ | 0.263 | | | $ | 0.187 | | | $ | 0.262 | | | $ | 0.292 | | | $ | 0.198 | |
| | | | | |
Net realized and unrealized gain (loss) | | | (2.290 | ) | | | 2.328 | | | | (0.153 | ) | | | 0.546 | | | | (0.371 | ) |
| | | | | |
Total income (loss) from operations | | $ | (2.027 | ) | | $ | 2.515 | | | $ | 0.109 | | | $ | 0.838 | | | $ | (0.173 | ) |
| | | | | |
| Less Distributions | | | | | | | | | | | | | | | | | | | | |
| | | | | |
From net investment income | | $ | (0.255 | ) | | $ | (0.245 | ) | | $ | (0.259 | ) | | $ | (0.258 | ) | | $ | (0.257 | ) |
| | | | | |
From net realized gain | | | (0.138 | ) | | | — | | | | — | | | | — | | | | — | |
| | | | | |
Total distributions | | $ | (0.393 | ) | | $ | (0.245 | ) | | $ | (0.259 | ) | | $ | (0.258 | ) | | $ | (0.257 | ) |
| | | | | |
Portfolio transaction fee, net(1) | | $ | (0.000 | )(2) | | $ | (0.000 | )(2) | | $ | (0.000 | )(2) | | $ | (0.000 | )(2) | | $ | (0.000 | )(2) |
| | | | | |
Net asset value — End of year | | $ | 8.810 | | | $ | 11.230 | | | $ | 8.960 | | | $ | 9.110 | | | $ | 8.530 | |
| | | | | |
Total Return(3)(4) | | | (18.46 | )% | | | 28.26 | % | | | 1.29 | % | | | 10.13 | % | | | (2.16 | )% |
| | | | | |
| Ratios/Supplemental Data | | | | | | | | | | | | | | | | | | | | |
| | | | | |
Net assets, end of year (000’s omitted) | | $ | 15,093 | | | $ | 24,505 | | | $ | 37,875 | | | $ | 56,314 | | | $ | 87,821 | |
| | | | | |
Ratios (as a percentage of average daily net assets):(5) | | | | | | | | | | | | | | | | | | | | |
| | | | | |
Expenses(4) | | | 1.92 | %(6) | | | 1.92 | % | | | 1.92 | % | | | 2.00 | % | | | 2.03 | % |
| | | | | |
Net investment income | | | 2.64 | % | | | 1.76 | % | | | 2.93 | % | | | 3.36 | % | | | 2.20 | % |
| | | | | |
Portfolio Turnover of the Portfolio | | | 59 | % | | | 60 | % | | | 118 | % | | | 86 | % | | | 102 | % |
| (1) | Computed using average shares outstanding. |
| (2) | Amount is less than $(0.0005). |
| (3) | Returns are historical and are calculated by determining the percentage change in net asset value with all distributions reinvested and do not reflect the effect of sales charges. |
| (4) | The investment adviser, sub-adviser and administrator reimbursed certain operating expenses (equal to 0.02%, 0.03% and 0.02% of average daily net assets for the years ended October 31, 2022, 2020 and 2019, respectively). Absent this reimbursement, total return would be lower. |
| (5) | Includes the Fund’s share of the Portfolio’s allocated expenses. |
| (6) | Includes a reduction by the investment adviser of a portion of the Portfolio’s adviser fee due to the Portfolio’s investment in the Liquidity Fund (equal to less than 0.005% of average daily net assets for the year ended October 31, 2022). |
| | | | |
| | 12 | | See Notes to Financial Statements. |
Eaton Vance
Global Income Builder Fund
October 31, 2022
Financial Highlights — continued
| | | | | | | | | | | | | | | | | | | | |
| | | Class I | |
| | | Year Ended October 31, | |
| | | 2022 | | | 2021 | | | 2020 | | | 2019 | | | 2018 | |
| | | | | |
Net asset value — Beginning of year | | $ | 11.340 | | | $ | 9.060 | | | $ | 9.190 | | | $ | 8.610 | | | $ | 9.040 | |
| | | | | |
| Income (Loss) From Operations | | | | | | | | | | | | | | | | | | | | |
| | | | | |
Net investment income(1) | | $ | 0.368 | | | $ | 0.297 | | | $ | 0.354 | | | $ | 0.386 | | | $ | 0.287 | |
| | | | | |
Net realized and unrealized gain (loss) | | | (2.311 | ) | | | 2.333 | | | | (0.136 | ) | | | 0.542 | | | | (0.369 | ) |
| | | | | |
Total income (loss) from operations | | $ | (1.943 | ) | | $ | 2.630 | | | $ | 0.218 | | | $ | 0.928 | | | $ | (0.082 | ) |
| | | | | |
| Less Distributions | | | | | | | | | | | | | | | | | | | | |
| | | | | |
From net investment income | | $ | (0.349 | ) | | $ | (0.350 | ) | | $ | (0.348 | ) | | $ | (0.348 | ) | | $ | (0.348 | ) |
| | | | | |
From net realized gain | | | (0.138 | ) | | | — | | | | — | | | | — | | | | — | |
| | | | | |
Total distributions | | $ | (0.487 | ) | | $ | (0.350 | ) | | $ | (0.348 | ) | | $ | (0.348 | ) | | $ | (0.348 | ) |
| | | | | |
Portfolio transaction fee, net(1) | | $ | (0.000 | )(2) | | $ | (0.000 | )(2) | | $ | (0.000 | )(2) | | $ | (0.000 | )(2) | | $ | (0.000 | )(2) |
| | | | | |
Net asset value — End of year | | $ | 8.910 | | | $ | 11.340 | | | $ | 9.060 | | | $ | 9.190 | | | $ | 8.610 | |
| | | | | |
Total Return(3)(4) | | | (17.60 | )% | | | 29.31 | % | | | 2.51 | % | | | 11.17 | % | | | (1.26 | )% |
| | | | | |
| Ratios/Supplemental Data | | | | | | | | | | | | | | | | | | | | |
| | | | | |
Net assets, end of year (000’s omitted) | | $ | 80,627 | | | $ | 113,907 | | | $ | 94,518 | | | $ | 107,290 | | | $ | 112,202 | |
| | | | | |
Ratios (as a percentage of average daily net assets):(5) | | | | | | | | | | | | | | | | | | | | |
| | | | | |
Expenses(4) | | | 0.92 | %(6) | | | 0.92 | % | | | 0.92 | % | | | 0.99 | % | | | 1.02 | % |
| | | | | |
Net investment income | | | 3.66 | % | | | 2.76 | % | | | 3.92 | % | | | 4.39 | % | | | 3.17 | % |
| | | | | |
Portfolio Turnover of the Portfolio | | | 59 | % | | | 60 | % | | | 118 | % | | | 86 | % | | | 102 | % |
| (1) | Computed using average shares outstanding. |
| (2) | Amount is less than $(0.0005). |
| (3) | Returns are historical and are calculated by determining the percentage change in net asset value with all distributions reinvested. |
| (4) | The investment adviser, sub-adviser and administrator reimbursed certain operating expenses (equal to 0.02%, 0.03% and 0.02% of average daily net assets for the years ended October 31, 2022, 2020 and 2019, respectively). Absent this reimbursement, total return would be lower. |
| (5) | Includes the Fund’s share of the Portfolio’s allocated expenses. |
| (6) | Includes a reduction by the investment adviser of a portion of the Portfolio’s adviser fee due to the Portfolio’s investment in the Liquidity Fund (equal to less than 0.005% of average daily net assets for the year ended October 31, 2022). |
| | | | |
| | 13 | | See Notes to Financial Statements. |
Eaton Vance
Global Income Builder Fund
October 31, 2022
Financial Highlights — continued
| | | | | | | | | | | | | | | | | | | | |
| | | Class R | |
| | | Year Ended October 31, | |
| | | 2022 | | | 2021 | | | 2020 | | | 2019 | | | 2018 | |
| | | | | |
Net asset value — Beginning of year | | $ | 11.320 | | | $ | 9.040 | | | $ | 9.180 | | | $ | 8.600 | | | $ | 9.030 | |
| | | | | |
| Income (Loss) From Operations | | | | | | | | | | | | | | | | | | | | |
| | | | | |
Net investment income(1) | | $ | 0.309 | | | $ | 0.247 | | | $ | 0.310 | | | $ | 0.345 | | | $ | 0.243 | |
| | | | | |
Net realized and unrealized gain (loss) | | | (2.300 | ) | | | 2.332 | | | | (0.149 | ) | | | 0.536 | | | | (0.373 | ) |
| | | | | |
Total income (loss) from operations | | $ | (1.991 | ) | | $ | 2.579 | | | $ | 0.161 | | | $ | 0.881 | | | $ | (0.130 | ) |
| | | | | |
| Less Distributions | | | | | | | | | | | | | | | | | | | | |
| | | | | |
From net investment income | | $ | (0.301 | ) | | $ | (0.299 | ) | | $ | (0.301 | ) | | $ | (0.301 | ) | | $ | (0.300 | ) |
| | | | | |
From net realized gain | | | (0.138 | ) | | | — | | | | — | | | | — | | | | — | |
| | | | | |
Total distributions | | $ | (0.439 | ) | | $ | (0.299 | ) | | $ | (0.301 | ) | | $ | (0.301 | ) | | $ | (0.300 | ) |
| | | | | |
Portfolio transaction fee, net(1) | | $ | (0.000 | )(2) | | $ | (0.000 | )(2) | | $ | (0.000 | )(2) | | $ | (0.000 | )(2) | | $ | (0.000 | )(2) |
| | | | | |
Net asset value — End of year | | $ | 8.890 | | | $ | 11.320 | | | $ | 9.040 | | | $ | 9.180 | | | $ | 8.600 | |
| | | | | |
Total Return(3)(4) | | | (18.02 | )% | | | 28.76 | % | | | 1.87 | % | | | 10.59 | % | | | (1.78 | )% |
| | | | | |
| Ratios/Supplemental Data | | | | | | | | | | | | | | | | | | | | |
| | | | | |
Net assets, end of year (000’s omitted) | | $ | 932 | | | $ | 827 | | | $ | 610 | | | $ | 629 | | | $ | 506 | |
| | | | | |
Ratios (as a percentage of average daily net assets):(5) | | | | | | | | | | | | | | | | | | | | |
| | | | | |
Expenses(4) | | | 1.42 | %(6) | | | 1.42 | % | | | 1.42 | % | | | 1.49 | % | | | 1.52 | % |
| | | | | |
Net investment income | | | 3.13 | % | | | 2.29 | % | | | 3.44 | % | | | 3.92 | % | | | 2.69 | % |
| | | | | |
Portfolio Turnover of the Portfolio | | | 59 | % | | | 60 | % | | | 118 | % | | | 86 | % | | | 102 | % |
| (1) | Computed using average shares outstanding. |
| (2) | Amount is less than $(0.0005). |
| (3) | Returns are historical and are calculated by determining the percentage change in net asset value with all distributions reinvested. |
| (4) | The investment adviser, sub-adviser and administrator reimbursed certain operating expenses (equal to 0.02%, 0.03% and 0.02% of average daily net assets for the years ended October 31, 2022, 2020 and 2019, respectively). Absent this reimbursement, total return would be lower. |
| (5) | Includes the Fund’s share of the Portfolio’s allocated expenses. |
| (6) | Includes a reduction by the investment adviser of a portion of the Portfolio’s adviser fee due to the Portfolio’s investment in the Liquidity Fund (equal to less than 0.005% of average daily net assets for the year ended October 31, 2022). |
| | | | |
| | 14 | | See Notes to Financial Statements. |
Eaton Vance
Global Income Builder Fund
October 31, 2022
Notes to Financial Statements
1 Significant Accounting Policies
Eaton Vance Global Income Builder Fund (the Fund) is a diversified series of Eaton Vance Mutual Funds Trust (the Trust). The Trust is a Massachusetts business trust registered under the Investment Company Act of 1940, as amended (the 1940 Act), as an open-end management investment company. The Fund offers four classes of shares. Class A shares are generally sold subject to a sales charge imposed at time of purchase. Class C shares are sold at net asset value and are generally subject to a contingent deferred sales charge (see Note 5). Effective November 5, 2020, Class C shares automatically convert to Class A shares eight years after their purchase as described in the Fund’s prospectus. Class I and Class R shares are sold at net asset value and are not subject to a sales charge. Each class represents a pro-rata interest in the Fund, but votes separately on class-specific matters and (as noted below) is subject to different expenses. Realized and unrealized gains and losses and net investment income and losses, other than class-specific expenses, are allocated daily to each class of shares based on the relative net assets of each class to the total net assets of the Fund. Each class of shares differs in its distribution plan and certain other class-specific expenses. The Fund invests all of its investable assets in interests in Global Income Builder Portfolio (the Portfolio), a Massachusetts business trust, having the same investment objective and policies as the Fund. The value of the Fund’s investment in the Portfolio reflects the Fund’s proportionate interest in the net assets of the Portfolio (99.5% at October 31, 2022). The performance of the Fund is directly affected by the performance of the Portfolio. The financial statements of the Portfolio, including the portfolio of investments, are included elsewhere in this report and should be read in conjunction with the Fund’s financial statements.
The following is a summary of significant accounting policies of the Fund. The policies are in conformity with accounting principles generally accepted in the United States of America (U.S. GAAP). The Fund is an investment company and follows accounting and reporting guidance in the Financial Accounting Standards Board (FASB) Accounting Standards Codification Topic 946.
A Investment Valuation — Valuation of securities by the Portfolio is discussed in Note 1A of the Portfolio’s Notes to Financial Statements, which are included elsewhere in this report.
B Income — The Fund’s net investment income or loss consists of the Fund’s pro-rata share of the net investment income or loss of the Portfolio, less all actual and accrued expenses of the Fund. In consideration of recent decisions rendered by European courts, the Fund has filed additional tax reclaims for previously withheld taxes on dividends earned in certain European Union countries. These filings are subject to various administrative and judicial proceedings within these countries. Due to the uncertainty as to the ultimate resolution of these proceedings, the likelihood of receipt of these reclaims, and the potential timing of payment, no amounts are reflected in the financial statements for such outstanding reclaims.
C Federal Taxes — The Fund’s policy is to comply with the provisions of the Internal Revenue Code applicable to regulated investment companies and to distribute to shareholders each year substantially all of its net investment income, and all or substantially all of its net realized capital gains. Accordingly, no provision for federal income or excise tax is necessary.
As of October 31, 2022, the Fund had no uncertain tax positions that would require financial statement recognition, de-recognition, or disclosure. The Fund files a U.S. federal income tax return annually after its fiscal year-end, which is subject to examination by the Internal Revenue Service for a period of three years from the date of filing.
D Expenses — The majority of expenses of the Trust are directly identifiable to an individual fund. Expenses which are not readily identifiable to a specific fund are allocated taking into consideration, among other things, the nature and type of expense and the relative size of the funds.
E Use of Estimates — The preparation of the financial statements in conformity with U.S. GAAP requires management to make estimates and assumptions that affect the reported amounts of assets and liabilities at the date of the financial statements and the reported amounts of income and expense during the reporting period. Actual results could differ from those estimates.
F Indemnifications — Under the Trust’s organizational documents, its officers and Trustees may be indemnified against certain liabilities and expenses arising out of the performance of their duties to the Fund. Under Massachusetts law, if certain conditions prevail, shareholders of a Massachusetts business trust (such as the Trust) could be deemed to have personal liability for the obligations of the Trust. However, the Trust’s Declaration of Trust contains an express disclaimer of liability on the part of Fund shareholders and the By-laws provide that the Trust shall assume, upon request by the shareholder, the defense on behalf of any Fund shareholders. Moreover, the By-laws also provide for indemnification out of Fund property of any shareholder held personally liable solely by reason of being or having been a shareholder for all loss or expense arising from such liability. Additionally, in the normal course of business, the Fund enters into agreements with service providers that may contain indemnification clauses. The Fund’s maximum exposure under these arrangements is unknown as this would involve future claims that may be made against the Fund that have not yet occurred.
G Other — Investment transactions are accounted for on a trade date basis.
Eaton Vance
Global Income Builder Fund
October 31, 2022
Notes to Financial Statements — continued
2 Distributions to Shareholders and Income Tax Information
It is the present policy of the Fund to make monthly distributions of all or substantially all of its net investment income and to distribute annually all or substantially all of its net realized capital gains. Distributions to shareholders are recorded on the ex-dividend date. Distributions are declared separately for each class of shares. Shareholders may reinvest income and capital gain distributions in additional shares of the same class of the Fund at the net asset value as of the ex-dividend date or, at the election of the shareholder, receive distributions in cash. Distributions to shareholders are determined in accordance with income tax regulations, which may differ from U.S. GAAP. As required by U.S. GAAP, only distributions in excess of tax basis earnings and profits are reported in the financial statements as a return of capital. Permanent differences between book and tax accounting relating to distributions are reclassified to paid-in capital. For tax purposes, distributions from short-term capital gains are considered to be from ordinary income.
The tax character of distributions declared for the years ended October 31, 2022 and October 31, 2021 was as follows:
| | | | | | | | |
| | | Year Ended October 31, | |
| | | 2022 | | | 2021 | |
| | |
Ordinary income | | $ | 8,539,399 | | | $ | 8,908,945 | |
| | |
Long-term capital gains | | $ | 3,698,176 | | | $ | — | |
As of October 31, 2022, the components of distributable earnings (accumulated loss) on a tax basis were as follows:
| | | | |
| | |
Undistributed ordinary income | | $ | 681,472 | |
| |
Deferred capital losses | | | (5,256,030 | ) |
| |
Net unrealized appreciation | | | 19,301,783 | |
Distributable earnings | | $ | 14,727,225 | |
At October 31, 2022, the Fund, for federal income tax purposes, had deferred capital losses of $5,256,030 which would reduce its taxable income arising from future net realized gains on investment transactions, if any, to the extent permitted by the Internal Revenue Code, and thus would reduce the amount of distributions to shareholders, which would otherwise be necessary to relieve the Fund of any liability for federal income or excise tax. The deferred capital losses are treated as arising on the first day of the Fund’s next taxable year and retain the same short-term or long-term character as when originally deferred. Of the deferred capital losses at October 31, 2022, $5,256,030 are short-term.
3 Investment Adviser Fee and Other Transactions with Affiliates
The investment adviser fee is earned by Boston Management and Research (BMR), an indirect, wholly-owned subsidiary of Morgan Stanley, as compensation for investment advisory services rendered to the Fund. The investment adviser fee is computed at an annual rate as a percentage of the Fund’s average daily net assets that are not invested in other investment companies for which BMR or its affiliates serve as investment adviser and receive an advisory fee as follows and is payable monthly:
| | | | |
| Average Daily Net Assets | | Annual Fee Rate | |
| |
Up to $500 million | | | 0.550 | % |
| |
$500 million but less than $1 billion | | | 0.525 | % |
| |
$1 billion but less than $2.5 billion | | | 0.500 | % |
| |
$2.5 billion and over | | | 0.475 | % |
For the year ended October 31, 2022, the Fund incurred no investment adviser fee on such assets. Pursuant to an investment sub-advisory agreement, BMR has delegated a portion of the investment management of the Fund to Eaton Vance Advisers International Ltd. (EVAIL), an affiliate of BMR and an indirect, wholly-owned subsidiary of Morgan Stanley. BMR pays EVAIL a portion of its investment adviser fee for sub-advisory services provided to the Fund. To the extent the Fund’s assets are invested in the Portfolio, the Fund is allocated its share of the Portfolio’s investment adviser fee. The Portfolio has engaged BMR to render investment advisory services. See Note 2 of the Portfolio’s Notes to Financial Statements which are included elsewhere in this report. The administration fee is earned by Eaton Vance Management (EVM), an affiliate of BMR and an indirect, wholly-owned subsidiary of Morgan Stanley, for administering the business affairs of the Fund and is computed at an annual rate of 0.15% of the Fund’s average daily net assets. For the year ended October 31, 2022, the administration fee amounted to $393,294. EVM and EVAIL have agreed to reimburse the Fund’s expenses to the extent that total annual operating expenses (relating to ordinary operating expenses only and excluding such expenses as borrowing costs, taxes or litigation expenses) exceed 1.17%, 1.92%, 0.92% and 1.42% of the Fund’s average daily net assets for Class A, Class C, Class I and Class R, respectively. This agreement
Eaton Vance
Global Income Builder Fund
October 31, 2022
Notes to Financial Statements — continued
may be changed or terminated after February 28, 2023. Pursuant to this agreement, EVM and EVAIL were allocated $41,418 of the Fund’s operating expenses for the year ended October 31, 2022.
EVM provides sub-transfer agency and related services to the Fund pursuant to a Sub-Transfer Agency Support Services Agreement. For the year ended October 31, 2022, EVM earned $15,683 from the Fund pursuant to such agreement, which is included in transfer and dividend disbursing agent fees on the Statement of Operations. The Fund was informed that Eaton Vance Distributors, Inc. (EVD), an affiliate of EVM and the Fund’s principal underwriter, received $8,971 as its portion of the sales charge on sales of Class A shares for the year ended October 31, 2022. EVD also received distribution and service fees from Class A, Class C and Class R shares (see Note 4) and contingent deferred sales charges (see Note 5).
Trustees and officers of the Fund who are members of EVM’s or BMR’s organizations receive remuneration for their services to the Fund out of the investment adviser fee. Certain officers and Trustees of the Fund are officers of the above organizations.
4 Distribution Plans
The Fund has in effect a distribution plan for Class A shares (Class A Plan) pursuant to Rule 12b-1 under the 1940 Act. Pursuant to the Class A Plan, the Fund pays EVD a distribution and service fee of 0.25% per annum of its average daily net assets attributable to Class A shares for distribution services and facilities provided to the Fund by EVD, as well as for personal services and/or the maintenance of shareholder accounts. Distribution and service fees paid or accrued to EVD for the year ended October 31, 2022 amounted to $362,670 for Class A shares.
The Fund also has in effect distribution plans for Class C shares (Class C Plan) and Class R shares (Class R Plan) pursuant to Rule 12b-1 under the 1940 Act. Pursuant to the Class C Plan, the Fund pays EVD amounts equal to 0.75% per annum of its average daily net assets attributable to Class C shares for providing ongoing distribution services and facilities to the Fund. For the year ended October 31, 2022, the Fund paid or accrued to EVD $148,646 for Class C shares.
The Class R Plan requires the Fund to pay EVD an amount up to 0.50% per annum of its average daily net assets attributable to Class R shares for providing ongoing distribution services and facilities to the Fund. The Trustees of the Trust have currently limited Class R distribution payments to 0.25% per annum of the average daily net assets attributable to Class R shares. For the year ended October 31, 2022, the Fund paid or accrued to EVD $2,165 for Class R shares.
Pursuant to the Class C and Class R Plans, the Fund also makes payments of service fees to EVD, financial intermediaries and other persons in amounts equal to 0.25% per annum of its average daily net assets attributable to that class. Service fees paid or accrued are for personal services and/or the maintenance of shareholder accounts. They are separate and distinct from the sales commissions and distribution fees payable to EVD. Service fees paid or accrued for the year ended October 31, 2022 amounted to $49,549 and $2,164 for Class C and Class R shares, respectively.
Distribution and service fees are subject to the limitations contained in the Financial Industry Regulatory Authority Rule 2341(d).
5 Contingent Deferred Sales Charges
A contingent deferred sales charge (CDSC) of 1% generally is imposed on redemptions of Class C shares made within 12 months of purchase. Class A shares may be subject to a 1% CDSC if redeemed within 12 months (18 months prior to April 29, 2022) of purchase (depending on the circumstances of purchase). Generally, the CDSC is based upon the lower of the net asset value at date of redemption or date of purchase. No charge is levied on shares acquired by reinvestment of dividends or capital gain distributions. For the year ended October 31, 2022, the Fund was informed that EVD received approximately $3,000 and $1,000 of CDSCs paid by Class A and Class C shareholders, respectively.
6 Investment Transactions
For the year ended October 31, 2022, increases and decreases in the Fund’s investment in the Portfolio aggregated $6,083,077 and $40,388,536, respectively. In addition, a Portfolio transaction fee is imposed by the Portfolio on the combined daily inflows or outflows of the Fund and the Portfolio’s other investors as more fully described at Note 1L of the Portfolio’s financial statements included herein. Such fee is allocated to the Fund based on its pro-rata interest in the Portfolio. The amount of the Portfolio transaction fee imposed on the Fund, if any, and the allocation of such fee are presented as Other capital on the Statements of Changes in Net Assets.
Eaton Vance
Global Income Builder Fund
October 31, 2022
Notes to Financial Statements — continued
7 Shares of Beneficial Interest
The Fund’s Declaration of Trust permits the Trustees to issue an unlimited number of full and fractional shares of beneficial interest (without par value). Such shares may be issued in a number of different series (such as the Fund) and classes. Transactions in Fund shares, including direct exchanges pursuant to share class conversions for all periods presented, were as follows:
| | | | | | | | | | | | | | | | |
| | | Year Ended
October 31, 2022 | | | Year Ended
October 31, 2021 | |
| | | Shares | | | Amount | | | Shares | | | Amount | |
| | | | |
Class A | | | | | | | | | | | | | | | | |
| | | | |
Sales | | | 1,227,451 | | | $ | 12,726,234 | | | | 2,791,363 | | | $ | 28,791,640 | |
| | | | |
Issued to shareholders electing to receive payments of distributions in Fund shares | | | 601,063 | | | | 6,160,367 | | | | 402,814 | | | | 4,325,494 | |
| | | | |
Redemptions | | | (2,485,542 | ) | | | (24,634,899 | ) | | | (2,268,917 | ) | | | (24,296,977 | ) |
| | | | |
Net increase (decrease) | | | (657,028 | ) | | $ | (5,748,298 | ) | | | 925,260 | | | $ | 8,820,157 | |
| | | | |
Class C | | | | | | | | | | | | | | | | |
| | | | |
Sales | | | 186,743 | | | $ | 1,957,980 | | | | 252,011 | | | $ | 2,724,113 | |
| | | | |
Issued to shareholders electing to receive payments of distributions in Fund shares | | | 76,915 | | | | 786,222 | | | | 59,010 | | | | 621,341 | |
| | | | |
Redemptions | | | (733,864 | ) | | | (7,284,683 | ) | | | (2,353,487 | ) | | | (23,804,743 | ) |
| | | | |
Net decrease | | | (470,206 | ) | | $ | (4,540,481 | ) | | | (2,042,466 | ) | | $ | (20,459,289 | ) |
| | | | |
Class I | | | | | | | | | | | | | | | | |
| | | | |
Sales | | | 1,597,829 | | | $ | 16,139,353 | | | | 1,840,359 | | | $ | 19,793,612 | |
| | | | |
Issued to shareholders electing to receive payments of distributions in Fund shares | | | 443,668 | | | | 4,531,038 | | | | 298,003 | | | | 3,197,990 | |
| | | | |
Redemptions | | | (3,035,715 | ) | | | (30,376,459 | ) | | | (2,534,633 | ) | | | (27,051,504 | ) |
| | | | |
Net decrease | | | (994,218 | ) | | $ | (9,706,068 | ) | | | (396,271 | ) | | $ | (4,059,902 | ) |
| | | | |
Class R | | | | | | | | | | | | | | | | |
| | | | |
Sales | | | 42,144 | | | $ | 425,735 | | | | 21,302 | | | $ | 222,145 | |
| | | | |
Issued to shareholders electing to receive payments of distributions in Fund shares | | | 3,670 | | | | 36,989 | | | | 2,081 | | | | 22,315 | |
| | | | |
Redemptions | | | (14,076 | ) | | | (151,657 | ) | | | (17,786 | ) | | | (190,139 | ) |
| | | | |
Net increase | | | 31,738 | | | $ | 311,067 | | | | 5,597 | | | $ | 54,321 | |
Eaton Vance
Global Income Builder Fund
October 31, 2022
Report of Independent Registered Public Accounting Firm
To the Trustees of Eaton Vance Mutual Funds Trust and Shareholders of Eaton Vance Global Income Builder Fund:
Opinion on the Financial Statements and Financial Highlights
We have audited the accompanying statement of assets and liabilities of Eaton Vance Global Income Builder Fund (the “Fund”) (one of the funds constituting Eaton Vance Mutual Funds Trust), as of October 31, 2022, the related statement of operations for the year then ended, the statements of changes in net assets for each of the two years in the period then ended, the financial highlights for each of the five years in the period then ended, and the related notes. In our opinion, the financial statements and financial highlights present fairly, in all material respects, the financial position of the Fund as of October 31, 2022, and the results of its operations for the year then ended, the changes in its net assets for each of the two years in the period then ended, and the financial highlights for each of the five years in the period then ended, in conformity with accounting principles generally accepted in the United States of America.
Basis for Opinion
These financial statements and financial highlights are the responsibility of the Fund’s management. Our responsibility is to express an opinion on the Fund’s financial statements and financial highlights based on our audits. We are a public accounting firm registered with the Public Company Accounting Oversight Board (United States) (PCAOB) and are required to be independent with respect to the Fund in accordance with the U.S. federal securities laws and the applicable rules and regulations of the Securities and Exchange Commission and the PCAOB.
We conducted our audits in accordance with the standards of the PCAOB. Those standards require that we plan and perform the audit to obtain reasonable assurance about whether the financial statements and financial highlights are free of material misstatement, whether due to error or fraud. The Fund is not required to have, nor were we engaged to perform, an audit of its internal control over financial reporting. As part of our audits, we are required to obtain an understanding of internal control over financial reporting but not for the purpose of expressing an opinion on the effectiveness of the Fund’s internal control over financial reporting. Accordingly, we express no such opinion.
Our audits included performing procedures to assess the risks of material misstatement of the financial statements and financial highlights, whether due to error or fraud, and performing procedures that respond to those risks. Such procedures included examining, on a test basis, evidence regarding the amounts and disclosures in the financial statements and financial highlights. Our audits also included evaluating the accounting principles used and significant estimates made by management, as well as evaluating the overall presentation of the financial statements and financial highlights. We believe that our audits provide a reasonable basis for our opinion.
/s/ Deloitte & Touche LLP
Boston, Massachusetts
December 22, 2022
We have served as the auditor of one or more Eaton Vance investment companies since 1959.
Eaton Vance
Global Income Builder Fund
October 31, 2022
Federal Tax Information (Unaudited)
The Form 1099-DIV you receive in February 2023 will show the tax status of all distributions paid to your account in calendar year 2022. Shareholders are advised to consult their own tax adviser with respect to the tax consequences of their investment in the Fund. As required by the Internal Revenue Code and/or regulations, shareholders must be notified regarding the status of qualified dividend income for individuals, the dividends received deduction for corporations, 163(j) interest dividends and the foreign tax credit.
Qualified Dividend Income. For the fiscal year ended October 31, 2022, the Fund designates approximately $6,335,655, or up to the maximum amount of such dividends allowable pursuant to the Internal Revenue Code, as qualified dividend income eligible for the reduced tax rate of 15%.
Dividends Received Deduction. Corporate shareholders are generally entitled to take the dividends received deduction on the portion of the Fund’s dividend distribution that qualifies under tax law. For the Fund’s fiscal 2022 ordinary income dividends, 29.22% qualifies for the corporate dividends received deduction.
163(j) Interest Dividends. For the fiscal year ended October 31, 2022, the Fund designates 46.18% of distributions from net investment income as a 163(j) interest dividend.
Foreign Tax Credit. For the fiscal year ended October 31, 2022, the Fund paid foreign taxes of $699,982.
Global Income Builder Portfolio
October 31, 2022
Portfolio of Investments
| | | | | | | | | | | | |
| Common Stocks — 58.7% | |
| Security | | | | | Shares | | | Value | |
| | | |
| Aerospace & Defense — 0.8% | | | | | | | | | |
| | | |
Safran S.A. | | | | | | | 15,665 | | | $ | 1,744,609 | |
| | | |
| | | | | | | | | | | $ | 1,744,609 | |
| | | |
| Air Freight & Logistics — 0.5% | | | | | | | | | |
| | | |
GXO Logistics, Inc.(1) | | | | | | | 27,738 | | | $ | 1,013,547 | |
| | | |
| | | | | | | | | | | $ | 1,013,547 | |
| | | |
| Automobiles — 0.4% | | | | | | | | | |
| | | |
Stellantis NV | | | | | | | 61,872 | | | $ | 834,750 | |
| | | |
| | | | | | | | | | | $ | 834,750 | |
| | | |
| Banks — 2.7% | | | | | | | | | |
| | | |
Banco Santander S.A. | | | | | | | 581,915 | | | $ | 1,509,182 | |
| | | |
Citigroup, Inc. | | | | | | | 19,891 | | | | 912,201 | |
| | | |
Citizens Financial Group, Inc. | | | | | | | 22,606 | | | | 924,586 | |
| | | |
HDFC Bank, Ltd. | | | | | | | 65,884 | | | | 1,195,053 | |
| | | |
ING Groep NV | | | | | | | 21,302 | | | | 209,603 | |
| | | |
M&T Bank Corp. | | | | | | | 3,936 | | | | 662,704 | |
| | | |
Standard Chartered PLC | | | | | | | 104,185 | | | | 622,478 | |
| | | |
| | | | | | | | | | | $ | 6,035,807 | |
| | | |
| Beverages — 2.3% | | | | | | | | | |
| | | |
Coca-Cola Co. (The) | | | | | | | 51,744 | | | $ | 3,096,878 | |
| | | |
Diageo PLC | | | | | | | 46,546 | | | | 1,915,483 | |
| | | |
| | | | | | | | | | | $ | 5,012,361 | |
| | | |
| Biotechnology — 0.5% | | | | | | | | | |
| | | |
CSL, Ltd. | | | | | | | 5,787 | | | $ | 1,035,962 | |
| | | |
| | | | | | | | | | | $ | 1,035,962 | |
| | | |
| Building Products — 0.4% | | | | | | | | | |
| | | |
Assa Abloy AB, Class B | | | | | | | 41,989 | | | $ | 847,845 | |
| | | |
| | | | | | | | | | | $ | 847,845 | |
| | | |
| Capital Markets — 1.4% | | | | | | | | | |
| | | |
Bank of New York Mellon Corp. (The) | | | | | | | 8,377 | | | $ | 352,756 | |
| | | |
State Street Corp. | | | | | | | 26,629 | | | | 1,970,546 | |
| | | |
Stifel Financial Corp. | | | | | | | 10,745 | | | | 664,793 | |
| | | |
| | | | | | | | | | | $ | 2,988,095 | |
| | | | | | | | | | |
| Security | | | | Shares | | | Value | |
| | | |
| Chemicals — 0.2% | | | | | | | | |
| | | |
Sika AG | | | | | 2,412 | | | $ | 543,847 | |
| | | |
| | | | | | | | | $ | 543,847 | |
| | | |
| Consumer Finance — 0.2% | | | | | | | | |
| | | |
Capital One Financial Corp. | | | | | 4,078 | | | $ | 432,350 | |
| | | |
| | | | | | | | | $ | 432,350 | |
| | | |
| Diversified Financial Services — 0.7% | | | | | | | | |
| | | |
Berkshire Hathaway, Inc., Class B(1) | | | | | 5,465 | | | $ | 1,612,667 | |
| | | |
| | | | | | | | | $ | 1,612,667 | |
| | | |
| Electric Utilities — 1.4% | | | | | | | | |
| | | |
Iberdrola S.A. | | | | | 158,553 | | | $ | 1,612,369 | |
| | | |
NextEra Energy, Inc. | | | | | 20,455 | | | | 1,585,262 | |
| | | |
| | | | | | | | | $ | 3,197,631 | |
| | | |
| Electrical Equipment — 1.4% | | | | | | | | |
| | | |
AMETEK, Inc. | | | | | 12,139 | | | $ | 1,573,943 | |
| | | |
Schneider Electric SE | | | | | 11,379 | | | | 1,438,946 | |
| | | |
| | | | | | | | | $ | 3,012,889 | |
| |
| Electronic Equipment, Instruments & Components — 2.7% | | | | |
| | | |
CDW Corp. | | | | | 12,312 | | | $ | 2,127,637 | |
| | | |
Halma PLC | | | | | 37,153 | | | | 900,933 | |
| | | |
Keyence Corp. | | | | | 1,870 | | | | 705,112 | |
| | | |
Keysight Technologies, Inc.(1) | | | | | 5,325 | | | | 927,349 | |
| | | |
Riverbed Technology, Inc.(2) | | | | | 3,977 | | | | 1,998 | |
| | | |
TE Connectivity, Ltd. | | | | | 10,606 | | | | 1,296,371 | |
| | | |
Zebra Technologies Corp., Class A(1) | | | | | 8 | | | | 2,266 | |
| | | |
| | | | | | | | | $ | 5,961,666 | |
| | | |
| Entertainment — 1.3% | | | | | | | | |
| | | |
Walt Disney Co. (The)(1) | | | | | 26,531 | | | $ | 2,826,613 | |
| | | |
| | | | | | | | | $ | 2,826,613 | |
| |
| Equity Real Estate Investment Trusts (REITs) — 0.5% | | | | |
| | | |
American Tower Corp. | | | | | 2,955 | | | $ | 612,246 | |
| | | |
Healthpeak Properties, Inc. | | | | | 19,485 | | | | 462,379 | |
| | | |
| | | | | | | | | $ | 1,074,625 | |
| | | |
| Food Products — 2.4% | | | | | | | | |
| | | |
Mondelez International, Inc., Class A | | | | | 36,703 | | | $ | 2,256,500 | |
| | | |
Nestle S.A. | | | | | 28,517 | | | | 3,104,327 | |
| | | |
| | | | | | | | | $ | 5,360,827 | |
| | | | |
| | 21 | | See Notes to Financial Statements. |
Global Income Builder Portfolio
October 31, 2022
Portfolio of Investments — continued
| | | | | | | | | | |
| Security | | | | Shares | | | Value | |
| | | |
| Health Care Equipment & Supplies — 2.1% | | | | | | | | |
| | | |
Alcon, Inc. | | | | | 9,732 | | | $ | 592,536 | |
| | | |
Boston Scientific Corp.(1) | | | | | 49,310 | | | | 2,125,754 | |
| | | |
Intuitive Surgical, Inc.(1) | | | | | 5,640 | | | | 1,390,091 | |
| | | |
Straumann Holding AG | | | | | 6,492 | | | | 617,852 | |
| | | |
| | | | | | | | | $ | 4,726,233 | |
| | | |
| Health Care Providers & Services — 1.0% | | | | | | | | |
| | | |
Elevance Health, Inc.(1) | | | | | 4,192 | | | $ | 2,292,060 | |
| | | |
| | | | | | | | | $ | 2,292,060 | |
| | | |
| Hotels, Restaurants & Leisure — 1.4% | | | | | | | | |
| | | |
Compass Group PLC | | | | | 110,338 | | | $ | 2,323,919 | |
| | | |
InterContinental Hotels Group PLC | | | | | 16,248 | | | | 873,016 | |
| | | |
| | | | | | | | | $ | 3,196,935 | |
| | | |
| Industrial Conglomerates — 0.7% | | | | | | | | |
| | | |
Siemens AG | | | | | 13,710 | | | $ | 1,497,255 | |
| | | |
| | | | | | | | | $ | 1,497,255 | |
| | | |
| Insurance — 1.4% | | | | | | | | |
| | | |
AIA Group, Ltd. | | | | | 124,092 | | | $ | 939,971 | |
| | | |
Allstate Corp. (The) | | | | | 3,512 | | | | 443,390 | |
| | | |
Aviva PLC | | | | | 2 | | | | 10 | |
| | | |
AXA S.A. | | | | | 35,341 | | | | 872,742 | |
| | | |
RenaissanceRe Holdings, Ltd. | | | | | 5,720 | | | | 884,769 | |
| | | |
| | | | | | | | | $ | 3,140,882 | |
| | | |
| Interactive Media & Services — 2.7% | | | | | | | | |
| | | |
Alphabet, Inc., Class C(1) | | | | | 63,380 | | | $ | 5,999,551 | |
| | | |
| | | | | | | | | $ | 5,999,551 | |
| | | |
| Internet & Direct Marketing Retail — 1.5% | | | | | | | | |
| | | |
Amazon.com, Inc.(1) | | | | | 32,242 | | | $ | 3,302,870 | |
| | | |
| | | | | | | | | $ | 3,302,870 | |
| | | |
| IT Services — 2.4% | | | | | | | | |
| | | |
Amadeus IT Group S.A.(1) | | | | | 15,592 | | | $ | 813,205 | |
| | | |
Fidelity National Information Services, Inc. | | | | | 22,304 | | | | 1,851,009 | |
| | | |
Global Payments, Inc. | | | | | 7,929 | | | | 905,968 | |
| | | |
Visa, Inc., Class A | | | | | 7,964 | | | | 1,649,822 | |
| | | |
| | | | | | | | | $ | 5,220,004 | |
| | | |
| Leisure Products — 0.5% | | | | | | | | |
| | | |
Yamaha Corp. | | | | | 31,333 | | | $ | 1,182,954 | |
| | | |
| | | | | | | | | $ | 1,182,954 | |
| | | | | | | | | | |
| Security | | | | Shares | | | Value | |
| | | |
| Life Sciences Tools & Services — 0.6% | | | | | | | | |
| | | |
Danaher Corp. | | | | | 2,894 | | | $ | 728,333 | |
| | | |
Lonza Group AG | | | | | 1,051 | | | | 541,038 | |
| | | |
| | | | | | | | | $ | 1,269,371 | |
| | | |
| Machinery — 1.0% | | | | | | | | |
| | | |
Graco, Inc. | | | | | 11,106 | | | $ | 772,755 | |
| | | |
Ingersoll Rand, Inc. | | | | | 28,004 | | | | 1,414,202 | |
| | | |
| | | | | | | | | $ | 2,186,957 | |
| | | |
| Metals & Mining — 0.3% | | | | | | | | |
| | | |
Alleima AB(1) | | | | | 1,121 | | | $ | 3,819 | |
| | | |
Rio Tinto, Ltd. | | | | | 13,256 | | | | 752,273 | |
| | | |
| | | | | | | | | $ | 756,092 | |
| | | |
| Multi-Utilities — 0.2% | | | | | | | | |
| | | |
CMS Energy Corp. | | | | | 8,069 | | | $ | 460,336 | |
| | | |
| | | | | | | | | $ | 460,336 | |
| | | |
| Oil, Gas & Consumable Fuels — 3.4% | | | | | | | | |
| | | |
Chevron Corp. | | | | | 13,558 | | | $ | 2,452,642 | |
| | | |
EOG Resources, Inc. | | | | | 30,347 | | | | 4,142,973 | |
| | | |
Phillips 66 | | | | | 2,171 | | | | 226,414 | |
| | | |
Pioneer Natural Resources Co. | | | | | 2,523 | | | | 646,922 | |
| | | |
| | | | | | | | | $ | 7,468,951 | |
| | | |
| Personal Products — 0.3% | | | | | | | | |
| | | |
Kose Corp. | | | | | 6,101 | | | $ | 609,005 | |
| | | |
| | | | | | | | | $ | 609,005 | |
| | | |
| Pharmaceuticals — 5.9% | | | | | | | | |
| | | |
AstraZeneca PLC | | | | | 12,755 | | | $ | 1,496,571 | |
| | | |
Eli Lilly & Co. | | | | | 10,732 | | | | 3,885,950 | |
| | | |
Novo Nordisk A/S, Class B | | | | | 24,134 | | | | 2,624,120 | |
| | | |
Roche Holding AG PC | | | | | 5,541 | | | | 1,838,493 | |
| | | |
Sanofi | | | | | 18,821 | | | | 1,619,694 | |
| | | |
Zoetis, Inc. | | | | | 9,931 | | | | 1,497,396 | |
| | | |
| | | | | | | | | $ | 12,962,224 | |
| | | |
| Professional Services — 1.6% | | | | | | | | |
| | | |
Recruit Holdings Co., Ltd. | | | | | 26,791 | | | $ | 824,391 | |
| | | |
RELX PLC | | | | | 61,295 | | | | 1,646,413 | |
| | | |
Verisk Analytics, Inc. | | | | | 5,788 | | | | 1,058,220 | |
| | | |
| | | | | | | | | $ | 3,529,024 | |
| | | | |
| | 22 | | See Notes to Financial Statements. |
Global Income Builder Portfolio
October 31, 2022
Portfolio of Investments — continued
| | | | | | | | | | | | |
| Security | | | | | Shares | | | Value | |
| |
| Semiconductors & Semiconductor Equipment — 2.5% | | | | |
| | | |
ASML Holding NV | | | | | | | 4,161 | | | $ | 1,951,869 | |
| | | |
Infineon Technologies AG | | | | | | | 47,793 | | | | 1,159,719 | |
| | | |
Micron Technology, Inc. | | | | | | | 24,254 | | | | 1,312,142 | |
| | | |
Taiwan Semiconductor Manufacturing Co., Ltd. ADR | | | | | | | 18,045 | | | | 1,110,670 | |
| | | |
| | | | | | | | | | | $ | 5,534,400 | |
| | | |
| Software — 4.0% | | | | | | | | | |
| | | |
Adobe, Inc.(1) | | | | | | | 5,104 | | | $ | 1,625,624 | |
| | | |
Dassault Systemes SE | | | | | | | 25,680 | | | | 860,762 | |
| | | |
Intuit, Inc. | | | | | | | 3,022 | | | | 1,291,905 | |
| | | |
Microsoft Corp. | | | | | | | 22,225 | | | | 5,159,089 | |
| | | |
| | | | | | | | | | | $ | 8,937,380 | |
| | | |
| Specialty Retail — 1.7% | | | | | | | | | |
| | | |
Lowe’s Cos., Inc. | | | | | | | 9,071 | | | $ | 1,768,391 | |
| | | |
TJX Cos., Inc. (The) | | | | | | | 28,068 | | | | 2,023,703 | |
| | | |
| | | | | | | | | | | $ | 3,792,094 | |
| |
| Technology Hardware, Storage & Peripherals — 1.9% | | | | |
| | | |
Apple, Inc. | | | | | | | 28,022 | | | $ | 4,296,893 | |
| | | |
| | | | | | | | | | | $ | 4,296,893 | |
| | | |
| Textiles, Apparel & Luxury Goods — 0.6% | | | | | | | | | |
| | | |
LVMH Moet Hennessy Louis Vuitton SE | | | | | | | 2,261 | | | $ | 1,426,679 | |
| | | |
| | | | | | | | | | | $ | 1,426,679 | |
| | | |
| Trading Companies & Distributors — 0.5% | | | | | | | | | |
| | | |
Ashtead Group PLC | | | | | | | 21,543 | | | $ | 1,122,240 | |
| | | |
| | | | | | | | | | | $ | 1,122,240 | |
| | | |
| Wireless Telecommunication Services — 0.7% | | | | | | | | | |
| | | |
Vodafone Group PLC | | | | | | | 1,242,622 | | | $ | 1,450,639 | |
| | | |
| | | | | | | | | | | $ | 1,450,639 | |
| | | |
Total Common Stocks
(identified cost $97,043,807) | | | | | | | | | | $ | 129,897,120 | |
| | | |
| Convertible Bonds — 0.1% | | | | | | | | | | | | |
| Security | | | | | Principal Amount (000’s omitted) | | | Value | |
| | | |
| Leisure Products — 0.1% | | | | | | | | | |
| | | |
Peloton Interactive, Inc., 0.00%, 2/15/26 | | | | | | $ | 310 | | | $ | 223,213 | |
| | | |
| | | | | | | | | | | $ | 223,213 | |
| | | | | | | | | | | | |
| Security | | | | | Principal Amount (000’s omitted) | | | Value | |
| | | |
| Software — 0.0%(3) | | | | | | | | | |
| | | |
1Life Healthcare, Inc., 3.00%, 6/15/25 | | | | | | $ | 81 | | | $ | 78,813 | |
| | | |
| | | | | | | | | | | $ | 78,813 | |
| | | |
Total Convertible Bonds
(identified cost $345,465) | | | | | | | | | | $ | 302,026 | |
| | | |
| Convertible Preferred Stocks — 0.1% | | | | | | | | | | | | |
| Security | | | | | Shares | | | Value | |
| | | |
| Health Care Equipment & Supplies — 0.1% | | | | | | | | | |
| | | |
Becton Dickinson and Co., Series B, 6.00% | | | | | | | 3,268 | | | $ | 159,282 | |
| | | |
| | | | | | | | | | | $ | 159,282 | |
| | | |
| Software — 0.0%(3) | | | | | | | | | |
| | | |
Riverbed Technology, Inc., Series A, 6.50%, (1.50% cash, 5.00% PIK)(1)(2) | | | | | | | 2,480 | | | $ | 2,480 | |
| | | |
| | | | | | | | | | | $ | 2,480 | |
| | | |
Total Convertible Preferred Stocks
(identified cost $244,405) | | | | | | | | | | $ | 161,762 | |
| | | |
| Corporate Bonds — 36.6% | | | | | | | | | | | | |
| Security | | Principal
Amount
(000’s omitted)* | | | Value | |
| | | |
| Aerospace & Defense — 0.8% | | | | | | | | | |
| | | |
Moog, Inc., 4.25%, 12/15/27(4) | | | | | | | 170 | | | $ | 152,397 | |
| | | |
Rolls-Royce PLC, 5.75%, 10/15/27(4) | | | | | | | 492 | | | | 445,919 | |
| | | |
TransDigm UK Holdings PLC, 6.875%, 5/15/26 | | | | | | | 200 | | | | 195,480 | |
| | | |
| TransDigm, Inc.: | | | | | | | | | |
| | | |
4.625%, 1/15/29 | | | | | | | 185 | | | | 157,833 | |
| | | |
5.50%, 11/15/27 | | | | | | | 106 | | | | 96,867 | |
| | | |
6.25%, 3/15/26(4) | | | | | | | 419 | | | | 414,029 | |
| | | |
7.50%, 3/15/27 | | | | | | | 327 | | | | 322,710 | |
| | | |
| | | | | | | | | | | $ | 1,785,235 | |
| | | |
| Airlines — 0.4% | | | | | | | | | |
| | | |
Air Canada, 3.875%, 8/15/26(4) | | | | | | | 101 | | | $ | 89,516 | |
| | | |
Air France-KLM, 1.875%, 1/16/25(5) | | | EUR | | | | 100 | | | | 88,429 | |
| | | |
| American Airlines, Inc./AAdvantage Loyalty IP, Ltd.: | | | | | | | | | |
| | | |
5.50%, 4/20/26(4) | | | | | | | 314 | | | | 299,534 | |
| | | |
5.75%, 4/20/29(4) | | | | | | | 144 | | | | 131,297 | |
| | | | |
| | 23 | | See Notes to Financial Statements. |
Global Income Builder Portfolio
October 31, 2022
Portfolio of Investments — continued
| | | | | | | | | | | | |
| Security | | Principal
Amount
(000’s omitted)* | | | Value | |
| | | |
| Airlines (continued) | | | | | | | | | |
| | | |
Deutsche Lufthansa AG, 2.875%, 2/11/25(5) | | | EUR | | | | 200 | | | $ | 184,792 | |
| | | |
United Airlines, Inc., 4.625%, 4/15/29(4) | | | | | | | 193 | | | | 165,406 | |
| | | |
| | | | | | | | | | | $ | 958,974 | |
| | | |
| Auto Components — 0.6% | | | | | | | | | |
| | | |
| Clarios Global, L.P./Clarios US Finance Co.: | | | | | | | | | |
| | | |
4.375%, 5/15/26(5) | | | EUR | | | | 681 | | | $ | 631,104 | |
| | | |
8.50%, 5/15/27(4) | | | | | | | 194 | | | | 190,449 | |
| | | |
IHO Verwaltungs GmbH, 6.375%, (6.375% cash or 7.125% PIK), 5/15/29(4)(6) | | | | | | | 200 | | | | 171,614 | |
| | | |
Real Hero Merger Sub 2, Inc., 6.25%, 2/1/29(4) | | | | | | | 54 | | | | 38,844 | |
| | | |
TI Automotive Finance PLC, 3.75%, 4/15/29(5) | | | EUR | | | | 200 | | | | 143,664 | |
| | | |
Wheel Pros, Inc., 6.50%, 5/15/29(4) | | | | | | | 213 | | | | 100,566 | |
| | | |
| | | | | | | | | | | $ | 1,276,241 | |
| | | |
| Automobiles — 0.7% | | | | | | | | | |
| | | |
Allison Transmission, Inc., 3.75%, 1/30/31(4) | | | | | | | 54 | | | $ | 43,213 | |
| | | |
| Ford Motor Co.: | | | | | | | | | |
| | | |
3.25%, 2/12/32 | | | | | | | 364 | | | | 273,919 | |
| | | |
4.75%, 1/15/43 | | | | | | | 197 | | | | 137,540 | |
| | | |
9.625%, 4/22/30 | | | | | | | 26 | | | | 29,059 | |
| | | |
| Ford Motor Credit Co., LLC: | | | | | | | | | |
| | | |
3.087%, 1/9/23 | | | | | | | 231 | | | | 230,188 | |
| | | |
3.37%, 11/17/23 | | | | | | | 200 | | | | 193,318 | |
| | | |
4.125%, 8/17/27 | | | | | | | 555 | | | | 494,055 | |
| | | |
5.125%, 6/16/25 | | | | | | | 200 | | | | 193,278 | |
| | | |
| | | | | | | | | | | $ | 1,594,570 | |
| | | |
| Automotives — 0.3% | | | | | | | | | |
| | | |
| Goodyear Tire & Rubber Co. (The): | | | | | | | | | |
| | | |
5.00%, 7/15/29 | | | | | | | 336 | | | $ | 292,243 | |
| | | |
5.25%, 7/15/31 | | | | | | | 270 | | | | 229,122 | |
| | | |
Jaguar Land Rover Automotive PLC, 2.20%, 1/15/24(5) | | | EUR | | | | 100 | | | | 93,021 | |
| | | |
| | | | | | | | | | | $ | 614,386 | |
| | | |
| Banks — 2.0% | | | | | | | | | |
| | | |
Banco Mercantil del Norte S.A./Grand Cayman, 7.625% to 1/10/28(4)(7)(8) | | | | | | | 200 | | | $ | 164,490 | |
| | | |
Bank of America Corp., Series TT, 6.125% to 4/27/27(7)(8) | | | | | | | 89 | | | | 84,328 | |
| | | |
Bank of Nova Scotia (The), 8.625% to 10/27/27, 10/27/82(8) | | | | | | | 200 | | | | 201,223 | |
| | | |
Barclays PLC, 8.00% to 3/15/29(7)(8) | | | | | | | 200 | | | | 179,671 | |
| | | |
BNP Paribas S.A., 7.75% to 8/16/29(4)(7)(8) | | | | | | | 200 | | | | 189,067 | |
| | | |
Citigroup, Inc., Series W, 4.00% to 12/10/25(7)(8) | | | | | | | 51 | | | | 43,146 | |
| | | |
Credit Suisse Group AG, 9.75% to 6/23/27(4)(7)(8) | | | | | | | 200 | | | | 190,525 | |
| | | | | | | | | | | | |
| Security | | Principal
Amount
(000’s omitted)* | | | Value | |
| | | |
| Banks (continued) | | | | | | | | | |
| | | |
Farm Credit Bank of Texas, Series 3, 6.20% to 6/15/28(4)(7)(8) | | | | | | | 220 | | | $ | 195,056 | |
| | | |
HSBC Holdings PLC, 4.60% to 12/17/30(7)(8) | | | | | | | 200 | | | | 132,440 | |
| | | |
Huntington Bancshares, Inc., Series F, 5.625% to 7/15/30(7)(8) | | | | | | | 125 | | | | 114,231 | |
| | | |
| JPMorgan Chase & Co.: | | | | | | | | | |
| | | |
Series KK, 3.65% to 6/1/26(7)(8) | | | | | | | 251 | | | | 208,317 | |
| | | |
Series S, 6.75%, to 2/1/24(7)(8) | | | | | | | 215 | | | | 215,134 | |
| | | |
Lloyds Banking Group PLC, 7.50% to 9/27/25(7)(8) | | | | | | | 200 | | | | 186,000 | |
| | | |
Natwest Group PLC, 4.60% to 6/28/31(7)(8) | | | | | | | 200 | | | | 129,630 | |
| | | |
PNC Financial Services Group, Inc. (The), Series V, 6.20% to 9/15/27(7)(8) | | | | | | | 100 | | | | 94,970 | |
| | | |
Societe Generale S.A., 5.375% to
11/18/30(4)(7)(8) | | | | | | | 200 | | | | 145,370 | |
| | | |
Standard Chartered PLC, 4.75% to
1/14/31(4)(7)(8) | | | | | | | 229 | | | | 152,942 | |
| | | |
| SVB Financial Group: | | | | | | | | | |
| | | |
4.10% to 2/15/31(7)(8) | | | | | | | 311 | | | | 192,737 | |
| | | |
Series C, 4.00% to 5/15/26(7)(8) | | | | | | | 58 | | | | 40,661 | |
| | | |
Toronto-Dominion Bank (The), 8.125% to 10/31/27, 10/31/82(8) | | | | | | | 200 | | | | 202,750 | |
| | | |
Truist Financial Corp., Series Q, 5.10% to 3/1/30(7)(8) | | | | | | | 77 | | | | 67,766 | |
| | | |
UBS Group AG, 4.375% to 2/10/31(4)(7)(8) | | | | | | | 200 | | | | 139,430 | |
| | | |
UniCredit SpA, 7.296% to 4/2/29, 4/2/34(4)(8) | | | | | | | 200 | | | | 169,851 | |
| | | |
Vivion Investments S.a.r.l., 3.00%, 8/8/24(5) | | | EUR | | | | 600 | | | | 510,571 | |
| | | |
Wells Fargo & Co., Series BB, 3.90% to 3/15/26(7)(8) | | | | | | | 167 | | | | 141,887 | |
| | | |
Zions Bancorp NA, 5.80% to 6/15/23(7)(8) | | | | | | | 268 | | | | 253,304 | |
| | | |
| | | | | | | | | | | $ | 4,345,497 | |
| | | |
| Biotechnology — 0.4% | | | | | | | | | |
| | | |
| Grifols Escrow Issuer S.A.: | | | | | | | | | |
| | | |
3.875%, 10/15/28(5) | | | EUR | | | | 925 | | | $ | 698,942 | |
| | | |
4.75%, 10/15/28(4) | | | | | | | 280 | | | | 219,121 | |
| | | |
| | | | | | | | | | | $ | 918,063 | |
| | | |
| Building Products — 1.2% | | | | | | | | | |
| | | |
| Builders FirstSource, Inc.: | | | | | | | | | |
| | | |
4.25%, 2/1/32(4) | | | | | | | 204 | | | $ | 163,584 | |
| | | |
5.00%, 3/1/30(4) | | | | | | | 90 | | | | 77,429 | |
| | | |
HT Troplast GmbH, 9.25%, 7/15/25(5) | | | EUR | | | | 650 | | | | 562,035 | |
| | | |
| KB Home: | | | | | | | | | |
| | | |
4.00%, 6/15/31 | | | | | | | 11 | | | | 8,348 | |
| | | |
4.80%, 11/15/29 | | | | | | | 71 | | | | 58,059 | |
| | | |
Oscar AcquisitionCo, LLC/Oscar Finance, Inc., 9.50%, 4/15/30(4) | | | | | | | 85 | | | | 72,177 | |
| | | |
| Standard Industries, Inc.: | | | | | | | | | |
| | | |
2.25%, 11/21/26(5) | | | EUR | | | | 400 | | | | 328,959 | |
| | | | |
| | 24 | | See Notes to Financial Statements. |
Global Income Builder Portfolio
October 31, 2022
Portfolio of Investments — continued
| | | | | | | | | | | | |
| Security | | Principal
Amount
(000’s omitted)* | | | Value | |
| | | |
| Building Products (continued) | | | | | | | | | |
| | | |
| Standard Industries, Inc.: (continued) | | | | | | | | | |
| | | |
4.375%, 7/15/30(4) | | | | | | | 275 | | | $ | 222,863 | |
| | | |
5.00%, 2/15/27(4) | | | | | | | 78 | | | | 70,700 | |
| | | |
Taylor Morrison Communities, Inc., 5.75%, 1/15/28(4) | | | | | | | 196 | | | | 179,906 | |
| | | |
Victoria PLC, 3.625%, 8/24/26(5) | | | EUR | | | | 806 | | | | 622,173 | |
| | | |
WASH Multifamily Acquisition, Inc., 5.75%, 4/15/26(4) | | | | | | | 346 | | | | 323,170 | |
| | | |
| | | | | | | | | | | $ | 2,689,403 | |
| | | |
| Capital Markets — 0.2% | | | | | | | | | |
| | | |
AerCap Holdings NV, 5.875% to 10/10/24, 10/10/79(8) | | | | | | | 150 | | | $ | 135,174 | |
| | | |
Charles Schwab Corp. (The), Series I, 4.00% to 6/1/26(7)(8) | | | | | | | 259 | | | | 213,261 | |
| | | |
| | | | | | | | | | | $ | 348,435 | |
| | | |
| Casino & Gaming — 0.1% | | | | | | | | | |
| | | |
| Cinemark USA, Inc.: | | | | | | | | | |
| | | |
5.875%, 3/15/26(4) | | | | | | | 67 | | | $ | 56,505 | |
| | | |
8.75%, 5/1/25(4) | | | | | | | 48 | | | | 48,201 | |
| | | |
Speedway Motorsports, LLC/Speedway Funding II, Inc., 4.875%, 11/1/27(4) | | | | | | | 250 | | | | 217,583 | |
| | | |
| | | | | | | | | | | $ | 322,289 | |
| | | |
| Chemicals — 0.5% | | | | | | | | | |
| | | |
ASP Unifrax Holdings, Inc., 5.25%, 9/30/28(4) | | | | | | | 88 | | | $ | 70,195 | |
| | | |
Avient Corp., 7.125%, 8/1/30(4) | | | | | | | 102 | | | | 97,675 | |
| | | |
Herens Holdco S.a.r.l., 4.75%, 5/15/28(4) | | | | | | | 201 | | | | 164,958 | |
| | | |
| NOVA Chemicals Corp.: | | | | | | | | | |
| | | |
4.25%, 5/15/29(4) | | | | | | | 203 | | | | 166,034 | |
| | | |
4.875%, 6/1/24(4) | | | | | | | 56 | | | | 54,586 | |
| | | |
Nufarm Australia, Ltd./Nufarm Americas, Inc., 5.00%, 1/27/30(4) | | | | | | | 172 | | | | 145,737 | |
| | | |
| Valvoline, Inc.: | | | | | | | | | |
| | | |
3.625%, 6/15/31(4) | | | | | | | 128 | | | | 101,172 | |
| | | |
4.25%, 2/15/30(4) | | | | | | | 224 | | | | 215,938 | |
| | | |
| | | | | | | | | | | $ | 1,016,295 | |
| | | |
| Commercial Services & Supplies — 1.9% | | | | | | | | | |
| | | |
Adtalem Global Education, Inc., 5.50%, 3/1/28(4) | | | | | | | 266 | | | $ | 243,121 | |
| | | |
APi Group DE, Inc., 4.75%, 10/15/29(4) | | | | | | | 55 | | | | 46,442 | |
| | | |
| Clean Harbors, Inc.: | | | | | | | | | |
| | | |
4.875%, 7/15/27(4) | | | | | | | 101 | | | | 95,197 | |
| | | |
5.125%, 7/15/29(4) | | | | | | | 61 | | | | 56,643 | |
| | | |
EC Finance PLC, 3.00%, 10/15/26(5) | | | EUR | | | | 274 | | | | 239,898 | |
| | | |
| Gartner, Inc.: | | | | | | | | | |
| | | |
3.75%, 10/1/30(4) | | | | | | | 187 | | | | 157,548 | |
| | | | | | | | | | | | |
| Security | | Principal
Amount
(000’s omitted)* | | | Value | |
| | | |
| Commercial Services & Supplies (continued) | | | | | | | | | |
| | | |
| Gartner, Inc.: (continued) | | | | | | | | | |
| | | |
4.50%, 7/1/28(4) | | | | | | | 151 | | | $ | 140,240 | |
| | | |
| GFL Environmental, Inc.: | | | | | | | | | |
| | | |
3.50%, 9/1/28(4) | | | | | | | 265 | | | | 225,368 | |
| | | |
3.75%, 8/1/25(4) | | | | | | | 130 | | | | 123,167 | |
| | | |
4.75%, 6/15/29(4) | | | | | | | 343 | | | | 299,726 | |
| | | |
HealthEquity, Inc., 4.50%, 10/1/29(4) | | | | | | | 153 | | | | 133,875 | |
| | | |
| Hertz Corp. (The): | | | | | | | | | |
| | | |
4.625%, 12/1/26(4) | | | | | | | 29 | | | | 24,766 | |
| | | |
5.00%, 12/1/29(4) | | | | | | | 230 | | | | 182,821 | |
| | | |
Korn Ferry, 4.625%, 12/15/27(4) | | | | | | | 233 | | | | 212,282 | |
| | | |
Madison IAQ, LLC, 5.875%, 6/30/29(4) | | | | | | | 323 | | | | 222,148 | |
| | | |
Metis Merger Sub, LLC, 6.50%, 5/15/29(4) | | | | | | | 167 | | | | 134,420 | |
| | | |
MoneyGram International, Inc., 5.375%, 8/1/26(4) | | | | | | | 249 | | | | 244,887 | |
| | | |
NESCO Holdings II, Inc., 5.50%, 4/15/29(4) | | | | | | | 206 | | | | 181,061 | |
| | | |
Paprec Holding S.A., 3.50%, 7/1/28(5) | | | EUR | | | | 352 | | | | 279,030 | |
| | | |
PROG Holdings, Inc., 6.00%, 11/15/29(4) | | | | | | | 139 | | | | 113,807 | |
| | | |
Team Health Holdings, Inc., 6.375%, 2/1/25(4) | | | | | | | 235 | | | | 177,940 | |
| | | |
Terminix Co., LLC (The), 7.45%, 8/15/27 | | | | | | | 536 | | | | 598,326 | |
| | | |
Tervita Corp., 11.00%, 12/1/25(4) | | | | | | | 123 | | | | 133,816 | |
| | | |
| | | | | | | | | | | $ | 4,266,529 | |
| | | |
| Construction & Engineering — 0.2% | | | | | | | | | |
| | | |
Cellnex Finance Co. S.A., 2.25%, 4/12/26(5) | | | EUR | | | | 200 | | | $ | 180,321 | |
| | | |
TopBuild Corp., 4.125%, 2/15/32(4) | | | | | | | 263 | | | | 206,299 | |
| | | |
| | | | | | | | | | | $ | 386,620 | |
| | | |
| Construction Materials — 0.2% | | | | | | | | | |
| | | |
Smyrna Ready Mix Concrete, LLC, 6.00%, 11/1/28(4) | | | | | | | 641 | | | $ | 540,248 | |
| | | |
| | | | | | | | | | | $ | 540,248 | |
| | | |
| Consumer Finance — 0.3% | | | | | | | | | |
| | | |
CPUK Finance, Ltd., 4.875%, 8/28/25(5) | | | GBP | | | | 278 | | | $ | 289,668 | |
| | | |
| PRA Group, Inc.: | | | | | | | | | |
| | | |
5.00%, 10/1/29(4) | | | | | | | 115 | | | | 92,399 | |
| | | |
7.375%, 9/1/25(4) | | | | | | | 261 | | | | 250,033 | |
| | | |
| | | | | | | | | | | $ | 632,100 | |
| | | |
| Containers & Packaging — 0.6% | | | | | | | | | |
| | | |
Ardagh Metal Packaging Finance USA, LLC/Ardagh Metal Packaging Finance PLC, 3.00%, 9/1/29(5) | | | EUR | | | | 200 | | | $ | 141,923 | |
| | | |
Canpack S.A./Canpack US, LLC, 3.875%, 11/15/29(4) | | | | | | | 312 | | | | 248,393 | |
| | | |
Kleopatra Finco S.a.r.l., 4.25%, 3/1/26(5) | | | EUR | | | | 479 | | | | 391,407 | |
| | | |
LABL, Inc., 5.875%, 11/1/28(4) | | | | | | | 66 | | | | 57,455 | |
| | | | |
| | 25 | | See Notes to Financial Statements. |
Global Income Builder Portfolio
October 31, 2022
Portfolio of Investments — continued
| | | | | | | | | | | | |
| Security | | Principal
Amount
(000’s omitted)* | | | Value | |
| | | |
| Containers & Packaging (continued) | | | | | | | | | |
| | | |
Mauser Packaging Solutions Holding Co., 7.25%, 4/15/25(4) | | | | | | | 82 | | | $ | 73,929 | |
| | | |
Schoeller Packaging B.V., 6.375%, 11/1/24(5) | | | EUR | | | | 450 | | | | 359,469 | |
| | | |
Verallia S.A., 1.875%, 11/10/31(5) | | | EUR | | | | 100 | | | | 73,234 | |
| | | |
| | | | | | | | | | | $ | 1,345,810 | |
| | | |
| Cosmetics/Personal Care — 0.1% | | | | | | | | | |
| | | |
| Edgewell Personal Care Co.: | | | | | | | | | |
| | | |
4.125%, 4/1/29(4) | | | | | | | 74 | | | $ | 63,307 | |
| | | |
5.50%, 6/1/28(4) | | | | | | | 180 | | | | 169,642 | |
| | | |
| | | | | | | | | | | $ | 232,949 | |
| | | |
| Distributors — 0.5% | | | | | | | | | |
| | | |
BCPE Empire Holdings, Inc., 7.625%, 5/1/27(4) | | | | | | | 451 | | | $ | 413,034 | |
| | | |
Parts Europe S.A., 5.456%, (3 mo. EURIBOR + 4.00%), 7/20/27(5)(9) | | | EUR | | | | 350 | | | | 337,275 | |
| | | |
| Performance Food Group, Inc.: | | | | | | | | | |
| | | |
4.25%, 8/1/29(4) | | | | | | | 315 | | | | 267,608 | |
| | | |
5.50%, 10/15/27(4) | | | | | | | 169 | | | | 160,188 | |
| | | |
| | | | | | | | | | | $ | 1,178,105 | |
| | | |
| Diversified Consumer Services — 0.3% | | | | | | | | | |
| | | |
GEMS MENASA Cayman, Ltd./GEMS Education Delaware, LLC, 7.125%, 7/31/26(5) | | | | | | | 750 | | | $ | 710,602 | |
| | | |
| | | | | | | | | | | $ | 710,602 | |
| | | |
| Diversified Financial Services — 1.8% | | | | | | | | | |
| | | |
AG TTMT Escrow Issuer, LLC, 8.625%, 9/30/27(4) | | | | | | | 145 | | | $ | 145,738 | |
| | | |
Allied Universal Holdco, LLC/Allied Universal Finance
Corp.: | | | | | | | | | |
| | | |
6.625%, 7/15/26(4) | | | | | | | 485 | | | | 464,094 | |
| | | |
9.75%, 7/15/27(4) | | | | | | | 203 | | | | 176,985 | |
| | | |
Ally Financial, Inc., Series B, 4.70% to 5/15/26(7)(8) | | | | | | | 270 | | | | 196,594 | |
| | | |
Alpha Holding S.A. de CV, 9.00%, 2/10/25(4)(10) | | | | | | | 190 | | | | 2,855 | |
| | | |
American AgCredit Corp., Series QIB, 5.25% to 6/15/26(4)(7)(8) | | | | | | | 250 | | | | 229,687 | |
| | | |
Bread Financial Holdings, Inc., 4.75%, 12/15/24(4) | | | | | | | 194 | | | | 169,820 | |
| | | |
Compass Group Diversified Holdings, LLC, 5.25%, 4/15/29(4) | | | | | | | 65 | | | | 56,065 | |
| | | |
| Encore Capital Group, Inc.: | | | | | | | | | |
| | | |
4.25%, (3 mo. EURIBOR + 4.25%), 1/15/28(5)(9) | | | EUR | | | | 479 | | | | 426,591 | |
| | | |
5.375%, 2/15/26(5) | | | GBP | | | | 180 | | | | 180,621 | |
| | | |
| Icahn Enterprises, L.P./Icahn Enterprises Finance Corp.: | | | | | | | | | |
| | | |
6.25%, 5/15/26 | | | | | | | 99 | | | | 95,222 | |
| | | |
6.375%, 12/15/25 | | | | | | | 120 | | | | 116,767 | |
| | | | | | | | | | | | |
| Security | | Principal
Amount
(000’s omitted)* | | | Value | |
| | | |
| Diversified Financial Services (continued) | | | | | | | | | |
| | | |
Jane Street Group/JSG Finance, Inc., 4.50%, 11/15/29(4) | | | | | | | 305 | | | $ | 270,274 | |
| | | |
Jefferson Capital Holdings, LLC, 6.00%, 8/15/26(4) | | | | | | | 343 | | | | 286,062 | |
| | | |
Louvre Bidco S.A.S., 6.50%, 9/30/24(5) | | | EUR | | | | 310 | | | | 287,546 | |
| | | |
Oxford Finance, LLC/Oxford Finance Co-Issuer II, Inc., 6.375%, 2/1/27(4) | | | | | | | 160 | | | | 146,667 | |
| | | |
| Rocket Mortgage, LLC/Rocket Mortgage Co.-Issuer, Inc.: | | | | | | | | | |
| | | |
2.875%, 10/15/26(4) | | | | | | | 156 | | | | 130,606 | |
| | | |
3.625%, 3/1/29(4) | | | | | | | 133 | | | | 103,422 | |
| | | |
4.00%, 10/15/33(4) | | | | | | | 30 | | | | 21,026 | |
| | | |
Sherwood Financing PLC, 6.00%, 11/15/26(5) | | | GBP | | | | 420 | | | | 352,090 | |
| | | |
VistaJet Malta Finance PLC/XO Management Holding, Inc., 6.375%, 2/1/30(4) | | | | | | | 256 | | | | 213,150 | |
| | | |
| | | | | | | | | | | $ | 4,071,882 | |
| | | |
| Diversified Telecommunication Services — 0.4% | | | | | | | | | |
| | | |
Level 3 Financing, Inc., 4.25%, 7/1/28(4) | | | | | | | 324 | | | $ | 268,185 | |
| | | |
Lorca Telecom Bondco S.A., 4.00%, 9/18/27(5) | | | EUR | | | | 650 | | | | 566,568 | |
| | | |
| | | | | | | | | | | $ | 834,753 | |
| | | |
| Electric Utilities — 1.4% | | | | | | | | | |
| | | |
Dominion Energy, Inc., Series C, 4.35% to 1/15/27(7)(8) | | | | | | | 93 | | | $ | 77,403 | |
| | | |
Enviva Partners, L.P./Enviva Partners Finance Corp., 6.50%, 1/15/26(4) | | | | | | | 435 | | | | 418,311 | |
| | | |
| FirstEnergy Corp.: | | | | | | | | | |
| | | |
2.65%, 3/1/30 | | | | | | | 53 | | | | 42,965 | |
| | | |
Series B, 4.40% to 1/15/23, 7/15/27(11) | | | | | | | 257 | | | | 241,778 | |
| | | |
Imola Merger Corp., 4.75%, 5/15/29(4) | | | | | | | 370 | | | | 319,660 | |
| | | |
| NextEra Energy Operating Partners, L.P.: | | | | | | | | | |
| | | |
4.25%, 9/15/24(4) | | | | | | | 9 | | | | 8,498 | |
| | | |
4.50%, 9/15/27(4) | | | | | | | 205 | | | | 190,952 | |
| | | |
| NRG Energy, Inc.: | | | | | | | | | |
| | | |
3.375%, 2/15/29(4) | | | | | | | 106 | | | | 88,449 | |
| | | |
3.625%, 2/15/31(4) | | | | | | | 177 | | | | 141,092 | |
| | | |
3.875%, 2/15/32(4) | | | | | | | 195 | | | | 154,157 | |
| | | |
5.25%, 6/15/29(4) | | | | | | | 122 | | | | 111,005 | |
| | | |
Pattern Energy Operations, L.P./Pattern Energy Operations, Inc., 4.50%, 8/15/28(4) | | | | | | | 199 | | | | 179,435 | |
| | | |
Sempra Energy, 4.125% to 1/1/27, 4/1/52(8) | | | | | | | 167 | | | | 125,979 | |
| | | |
Southern California Edison Co., Series E, 8.639%, (3 mo. USD LIBOR + 4.199%), 12/5/22(9) | | | | | | | 101 | | | | 99,255 | |
| | | |
| Southern Co. (The): | | | | | | | | | |
| | | |
Series 21-A, 3.75% to 6/15/26, 9/15/51(8) | | | | | | | 120 | | | | 95,412 | |
| | | |
Series B, 4.00% to 10/15/25, 1/15/51(8) | | | | | | | 56 | | | | 48,831 | |
| | | |
Series B, 6.923%, (3 mo. USD LIBOR + 3.63%), 3/15/57(9) | | | | | | | 192 | | | | 191,040 | |
| | | |
TerraForm Power Operating, LLC, 5.00%, 1/31/28(4) | | | | | | | 237 | | | | 220,095 | |
| | | | |
| | 26 | | See Notes to Financial Statements. |
Global Income Builder Portfolio
October 31, 2022
Portfolio of Investments — continued
| | | | | | | | | | | | |
| Security | | Principal
Amount
(000’s omitted)* | | | Value | |
| | | |
| Electric Utilities (continued) | | | | | | | | | |
| | | |
| Vistra Operations Co., LLC: | | | | | | | | | |
| | | |
4.375%, 5/1/29(4) | | | | | | | 173 | | | $ | 148,384 | |
| | | |
5.00%, 7/31/27(4) | | | | | | | 232 | | | | 214,425 | |
| | | |
| | | | | | | | | | | $ | 3,117,126 | |
| | |
| Electronic Equipment, Instruments & Components — 0.1% | | | | | | | |
| | | |
Coherent Corp., 5.00%, 12/15/29(4) | | | | | | | 138 | | | $ | 118,721 | |
| | | |
Sensata Technologies B.V., 5.00%, 10/1/25(4) | | | | | | | 57 | | | | 55,356 | |
| | | |
WESCO Distribution, Inc., 7.25%, 6/15/28(4) | | | | | | | 153 | | | | 155,434 | |
| | | |
| | | | | | | | | | | $ | 329,511 | |
| | | |
| Entertainment — 0.9% | | | | | | | | | |
| | | |
| Caesars Entertainment, Inc.: | | | | | | | | | |
| | | |
6.25%, 7/1/25(4) | | | | | | | 417 | | | $ | 407,512 | |
| | | |
8.125%, 7/1/27(4) | | | | | | | 56 | | | | 54,558 | |
| | | |
CDI Escrow Issuer, Inc., 5.75%, 4/1/30(4) | | | | | | | 233 | | | | 210,632 | |
| | | |
Cinemark USA, Inc., 5.25%, 7/15/28(4) | | | | | | | 206 | | | | 156,892 | |
| | | |
Jacobs Entertainment, Inc., 6.75%, 2/15/29(4) | | | | | | | 278 | | | | 245,567 | |
| | | |
LHMC Finco 2 S.a.r.l., 7.25%, (7.25% cash or 8.00% PIK), 10/2/25(5)(6) | | | EUR | | | | 542 | | | | 461,994 | |
| | | |
Lottomatica SpA, 6.25%, 7/15/25(5) | | | EUR | | | | 200 | | | | 188,121 | |
| | | |
Scientific Games International, Inc., 7.00%, 5/15/28(4) | | | | | | | 216 | | | | 209,501 | |
| | | |
SeaWorld Parks & Entertainment, Inc., 5.25%, 8/15/29(4) | | | | | | | 65 | | | | 55,998 | |
| | | |
| | | | | | | | | | | $ | 1,990,775 | |
| |
| Equity Real Estate Investment Trusts (REITs) — 0.2% | | | | |
| | | |
Brookfield Property REIT, Inc./BPR Cumulus, LLC/BPR Nimbus, LLC/GGSI Sellco, LLC, 4.50%, 4/1/27(4) | | | | | | | 307 | | | $ | 261,846 | |
| | | |
HAT Holdings I, LLC/HAT Holdings II, LLC, 3.375%, 6/15/26(4) | | | | | | | 200 | | | | 163,052 | |
| | | |
| | | | | | | | | | | $ | 424,898 | |
| | | |
| Food Products — 0.6% | | | | | | | | | |
| | | |
Albertsons Cos., Inc./Safeway, Inc./New Albertsons, L.P./
Albertsons, LLC: | | | | | | | | | |
| | | |
4.875%, 2/15/30(4) | | | | | | | 138 | | | $ | 122,807 | |
| | | |
5.875%, 2/15/28(4) | | | | | | | 181 | | | | 169,456 | |
| | | |
Darling Ingredients, Inc., 6.00%, 6/15/30(4) | | | | | | | 110 | | | | 106,024 | |
| | | |
| Kraft Heinz Foods Co.: | | | | | | | | | |
| | | |
4.375%, 6/1/46 | | | | | | | 44 | | | | 34,427 | |
| | | |
5.50%, 6/1/50 | | | | | | | 34 | | | | 31,209 | |
| | | |
Land O’ Lakes, Inc., 8.00%(4)(7) | | | | | | | 235 | | | | 233,288 | |
| | | |
Nomad Foods Bondco PLC, 2.50%, 6/24/28(5) | | | EUR | | | | 571 | | | | 454,903 | |
| | | |
Pilgrim’s Pride Corp., 3.50%, 3/1/32(4) | | | | | | | 316 | | | | 242,756 | |
| | | |
| | | | | | | | | | | $ | 1,394,870 | |
| | | | | | | | | | | | |
| Security | | Principal
Amount
(000’s omitted)* | | | Value | |
| | | |
| Gas Utilities — 0.1% | | | | | | | | | |
| | | |
NiSource, Inc., 5.65% to 6/15/23(7)(8) | | | | | | | 280 | | | $ | 259,000 | |
| | | |
| | | | | | | | | | | $ | 259,000 | |
| | | |
| Health Care Equipment & Supplies — 1.6% | | | | | | | | | |
| | | |
| Centene Corp.: | | | | | | | | | |
| | | |
2.50%, 3/1/31 | | | | | | | 311 | | | $ | 239,193 | |
| | | |
3.00%, 10/15/30 | | | | | | | 377 | | | | 304,100 | |
| | | |
3.375%, 2/15/30 | | | | | | | 308 | | | | 256,333 | |
| | | |
4.625%, 12/15/29 | | | | | | | 319 | | | | 289,218 | |
| | | |
Compass Minerals International, Inc., 6.75%, 12/1/27(4) | | | | | | | 399 | | | | 375,925 | |
| | | |
LifePoint Health, Inc., 5.375%, 1/15/29(4) | | | | | | | 110 | | | | 70,433 | |
| | | |
Medline Borrower, L.P., 5.25%, 10/1/29(4) | | | | | | | 531 | | | | 414,451 | |
| | | |
ModivCare Escrow Issuer, Inc., 5.00%, 10/1/29(4) | | | | | | | 101 | | | | 86,089 | |
| | | |
| Molina Healthcare, Inc.: | | | | | | | | | |
| | | |
3.875%, 11/15/30(4) | | | | | | | 245 | | | | 208,772 | |
| | | |
3.875%, 5/15/32(4) | | | | | | | 189 | | | | 158,125 | |
| | | |
RegionalCare Hospital Partners Holdings, Inc./LifePoint Health, Inc., 9.75%, 12/1/26(4) | | | | | | | 55 | | | | 43,965 | |
| | | |
| Tenet Healthcare Corp.: | | | | | | | | | |
| | | |
4.375%, 1/15/30(4) | | | | | | | 102 | | | | 85,757 | |
| | | |
6.125%, 10/1/28(4) | | | | | | | 289 | | | | 250,599 | |
| | | |
6.875%, 11/15/31 | | | | | | | 133 | | | | 113,070 | |
| | | |
US Acute Care Solutions, LLC, 6.375%, 3/1/26(4) | | | | | | | 400 | | | | 363,642 | |
| | | |
Varex Imaging Corp., 7.875%, 10/15/27(4) | | | | | | | 219 | | | | 214,069 | |
| | | |
| | | | | | | | | | | $ | 3,473,741 | |
| | | |
| Health Care Providers & Services — 0.6% | | | | | | | | | |
| | | |
| HCA, Inc.: | | | | | | | | | |
| | | |
5.375%, 9/1/26 | | | | | | | 270 | | | $ | 262,828 | |
| | | |
5.625%, 9/1/28 | | | | | | | 245 | | | | 235,596 | |
| | | |
Legacy LifePoint Health, LLC, 4.375%, 2/15/27(4) | | | | | | | 173 | | | | 136,813 | |
| | | |
ModivCare, Inc., 5.875%, 11/15/25(4) | | | | | | | 182 | | | | 173,158 | |
| | | |
| Tenet Healthcare Corp.: | | | | | | | | | |
| | | |
4.625%, 9/1/24(4) | | | | | | | 49 | | | | 47,415 | |
| | | |
4.875%, 1/1/26(4) | | | | | | | 290 | | | | 274,604 | |
| | | |
5.125%, 11/1/27(4) | | | | | | | 138 | | | | 127,447 | |
| | | |
| | | | | | | | | | | $ | 1,257,861 | |
| | | |
| Healthcare-Products — 0.1% | | | | | | | | | |
| | | |
Avantor Funding, Inc., 3.875%, 7/15/28(5) | | | EUR | | | | 150 | | | $ | 130,264 | |
| | | |
| | | | | | | | | | | $ | 130,264 | |
| | | | |
| | 27 | | See Notes to Financial Statements. |
Global Income Builder Portfolio
October 31, 2022
Portfolio of Investments — continued
| | | | | | | | | | | | |
| Security | | Principal
Amount
(000’s omitted)* | | | Value | |
| | | |
| Hotels, Restaurants & Leisure — 0.5% | | | | | | | | | |
| | | |
1011778 B.C. Unlimited Liability Company/New Red
Finance, Inc.: | | | | | | | | | |
| | | |
3.875%, 1/15/28(4) | | | | | | | 286 | | | $ | 251,915 | |
| | | |
4.375%, 1/15/28(4) | | | | | | | 182 | | | | 160,053 | |
| | | |
5.75%, 4/15/25(4) | | | | | | | 66 | | | | 65,841 | |
| | | |
Lithia Motors, Inc., 4.625%, 12/15/27(4) | | | | | | | 91 | | | | 81,108 | |
| | | |
MGM Resorts International, 4.75%, 10/15/28 | | | | | | | 184 | | | | 159,956 | |
| | | |
Viking Cruises, Ltd., 5.875%, 9/15/27(4) | | | | | | | 399 | | | | 316,268 | |
| | | |
| | | | | | | | | | | $ | 1,035,141 | |
| | | |
| Household Products — 0.2% | | | | | | | | | |
| | | |
Central Garden & Pet Co., 4.125%, 10/15/30 | | | | | | | 55 | | | $ | 45,539 | |
| | | |
Spectrum Brands, Inc., 5.50%, 7/15/30(4) | | | | | | | 56 | | | | 45,043 | |
| | | |
Tempur Sealy International, Inc., 3.875%, 10/15/31(4) | | | | | | | 397 | | | | 298,913 | |
| | | |
| | | | | | | | | | | $ | 389,495 | |
| | | |
| Housewares — 0.2% | | | | | | | | | |
| | | |
ProGroup AG, 3.00%, 3/31/26(5) | | | EUR | | | | 460 | | | $ | 401,008 | |
| | | |
| | | | | | | | | | | $ | 401,008 | |
| |
| Independent Power and Renewable Electricity Producers — 0.3% | | | | |
| | | |
Algonquin Power & Utilities Corp., 4.75% to 1/18/27, 1/18/82(8) | | | | | | | 113 | | | $ | 91,248 | |
| | | |
| Calpine Corp.: | | | | | | | | | |
| | | |
5.125%, 3/15/28(4) | | | | | | | 273 | | | | 242,642 | |
| | | |
5.25%, 6/1/26(4) | | | | | | | 50 | | | | 47,526 | |
| | | |
NRG Energy, Inc., 5.75%, 1/15/28 | | | | | | | 210 | | | | 200,795 | |
| | | |
| | | | | | | | | | | $ | 582,211 | |
| | | |
| Industrial Conglomerates — 0.2% | | | | | | | | | |
| | | |
Brundage-Bone Concrete Pumping Holdings, Inc., 6.00%, 2/1/26(4) | | | | | | | 162 | | | $ | 146,858 | |
| | | |
Gatwick Airport Finance PLC, 4.375%, 4/7/26(5) | | | GBP | | | | 245 | | | | 234,508 | |
| | | |
Paprec Holding S.A., 4.00%, 3/31/25(5) | | | EUR | | | | 115 | | | | 105,409 | |
| | | |
| | | | | | | | | | | $ | 486,775 | |
| | | |
| Insurance — 0.7% | | | | | | | | | |
| | | |
Alliant Holdings Intermediate, LLC/Alliant Holdings Co-Issuer, 6.75%, 10/15/27(4) | | | | | | | 458 | | | $ | 418,564 | |
| | | |
Corebridge Financial, Inc., 6.875% to 9/15/27, 12/15/52(4)(8) | | | | | | | 187 | | | | 168,934 | |
| | | |
Galaxy Finco, Ltd., 9.25%, 7/31/27(5) | | | GBP | | | | 525 | | | | 481,656 | |
| | | |
Liberty Mutual Group, Inc., 4.125% to 9/15/26, 12/15/51(4)(8) | | | | | | | 216 | | | | 162,291 | |
| | | | | | | | | | | | |
| Security | | Principal
Amount
(000’s omitted)* | | | Value | |
| | | |
| Insurance (continued) | | | | | | | | | |
| | | |
Prudential Financial, Inc., 5.125% to 11/28/31, 3/1/52(8) | | | | | | | 60 | | | $ | 51,293 | |
| | | |
QBE Insurance Group, Ltd., 5.875% to 5/12/25(4)(7)(8) | | | | | | | 222 | | | | 202,653 | |
| | | |
| | | | | | | | | | | $ | 1,485,391 | |
| | | |
| Internet & Direct Marketing Retail — 0.1% | | | | | | | | | |
| | | |
| Arches Buyer, Inc.: | | | | | | | | | |
| | | |
4.25%, 6/1/28(4) | | | | | | | 82 | | | $ | 67,460 | |
| | | |
6.125%, 12/1/28(4) | | | | | | | 83 | | | | 64,117 | |
| | | |
Match Group Holdings II, LLC, 3.625%, 10/1/31(4) | | | | | | | 210 | | | | 160,377 | |
| | | |
| | | | | | | | | | | $ | 291,954 | |
| | | |
| Leisure Products — 0.7% | | | | | | | | | |
| | | |
Carnival Corp., 5.75%, 3/1/27(4) | | | | | | | 207 | | | $ | 143,824 | |
| | | |
| Life Time, Inc.: | | | | | | | | | |
| | | |
5.75%, 1/15/26(4) | | | | | | | 199 | | | | 185,578 | |
| | | |
8.00%, 4/15/26(4) | | | | | | | 252 | | | | 220,095 | |
| | | |
Lindblad Expeditions, LLC, 6.75%, 2/15/27(4) | | | | | | | 154 | | | | 137,223 | |
| | | |
| NCL Corp., Ltd.: | | | | | | | | | |
| | | |
5.875%, 3/15/26(4) | | | | | | | 106 | | | | 87,009 | |
| | | |
5.875%, 2/15/27(4) | | | | | | | 67 | | | | 59,904 | |
| | | |
7.75%, 2/15/29(4) | | | | | | | 56 | | | | 44,741 | |
| | | |
NCL Finance, Ltd., 6.125%, 3/15/28(4) | | | | | | | 55 | | | | 42,845 | |
| | | |
Royal Caribbean Cruises, Ltd., 11.625%, 8/15/27(4) | | | | | | | 201 | | | | 193,105 | |
| | | |
Sabre GLBL, Inc., 9.25%, 4/15/25(4) | | | | | | | 259 | | | | 251,420 | |
| | | |
Viking Cruises, Ltd., 7.00%, 2/15/29(4) | | | | | | | 104 | | | | 82,663 | |
| | | |
Viking Ocean Cruises Ship VII, Ltd., 5.625%, 2/15/29(4) | | | | | | | 66 | | | | 51,547 | |
| | | |
| | | | | | | | | | | $ | 1,499,954 | |
| | | |
| Life Sciences Tools & Services — 0.1% | | | | | | | | | |
| | | |
W.R. Grace Holdings, LLC, 4.875%, 6/15/27(4) | | | | | | | 245 | | | $ | 214,681 | |
| | | |
| | | | | | | | | | | $ | 214,681 | |
| | | |
| Machinery — 0.1% | | | | | | | | | |
| | | |
IMA Industria Macchine Automatiche SpA, 3.75%, 1/15/28(5) | | | EUR | | | | 381 | | | $ | 310,551 | |
| | | |
| | | | | | | | | | | $ | 310,551 | |
| | | |
| Media — 2.0% | | | | | | | | | |
| | | |
Altice France S.A., 8.125%, 2/1/27(4) | | | | | | | 458 | | | $ | 419,986 | |
| | | |
Audacy Capital Corp., 6.75%, 3/31/29(4) | | | | | | | 261 | | | | 74,620 | |
| | | |
Beasley Mezzanine Holdings, LLC, 8.625%, 2/1/26(4) | | | | | | | 308 | | | | 222,145 | |
| | | |
| CCO Holdings, LLC/CCO Holdings Capital Corp.: | | | | | | | | | |
| | | |
4.25%, 2/1/31(4) | | | | | | | 338 | | | | 267,579 | |
| | | |
4.50%, 8/15/30(4) | | | | | | | 343 | | | | 278,955 | |
| | | | |
| | 28 | | See Notes to Financial Statements. |
Global Income Builder Portfolio
October 31, 2022
Portfolio of Investments — continued
| | | | | | | | | | | | |
| Security | | Principal
Amount
(000’s omitted)* | | | Value | |
| | | |
| Media (continued) | | | | | | | | | |
| |
| CCO Holdings, LLC/CCO Holdings Capital Corp.: (continued) | | | | |
| | | |
4.75%, 3/1/30(4) | | | | | | | 322 | | | $ | 271,177 | |
| | | |
4.75%, 2/1/32(4) | | | | | | | 139 | | | | 111,536 | |
| | | |
5.375%, 6/1/29(4) | | | | | | | 110 | | | | 98,450 | |
| | | |
6.375%, 9/1/29(4) | | | | | | | 253 | | | | 233,542 | |
| | | |
CMG Media Corp., 8.875%, 12/15/27(4) | | | | | | | 178 | | | | 151,331 | |
| | | |
CSC Holdings, LLC, 7.50%, 4/1/28(4) | | | | | | | 200 | | | | 173,647 | |
| | | |
LCPR Senior Secured Financing DAC, 5.125%, 7/15/29(4) | | | | | | | 205 | | | | 173,211 | |
| | | |
| McGraw-Hill Education, Inc.: | | | | | | | | | |
| | | |
5.75%, 8/1/28(4) | | | | | | | 84 | | | | 74,188 | |
| | | |
8.00%, 8/1/29(4) | | | | | | | 365 | | | | 311,590 | |
| | | |
| National CineMedia, LLC: | | | | | | | | | |
| | | |
5.75%, 8/15/26 | | | | | | | 189 | | | | 16,310 | |
| | | |
5.875%, 4/15/28(4) | | | | | | | 245 | | | | 98,832 | |
| | | |
Outfront Media Capital, LLC/Outfront Media Capital
Corp.: | | | | | | | | | |
| | | |
4.625%, 3/15/30(4) | | | | | | | 54 | | | | 44,745 | |
| | | |
6.25%, 6/15/25(4) | | | | | | | 137 | | | | 135,272 | |
| | | |
| Sirius XM Radio, Inc.: | | | | | | | | | |
| | | |
3.125%, 9/1/26(4) | | | | | | | 125 | | | | 111,968 | |
| | | |
3.875%, 9/1/31(4) | | | | | | | 126 | | | | 101,043 | |
| | | |
5.00%, 8/1/27(4) | | | | | | | 218 | | | | 200,997 | |
| | | |
Summer (BC) Holdco A S.a.r.l., 9.25%, 10/31/27(5) | | | EUR | | | | 129 | | | | 99,627 | |
| | | |
Summer (BC) Holdco B S.a.r.l., 5.75%, 10/31/26(5) | | | EUR | | | | 400 | | | | 343,843 | |
| | | |
Townsquare Media, Inc., 6.875%, 2/1/26(4) | | | | | | | 141 | | | | 133,388 | |
| | | |
Univision Communications, Inc., 7.375%, 6/30/30(4) | | | | | | | 142 | | | | 137,556 | |
| | | |
UPCB Finance VII, Ltd., 3.625%, 6/15/29(5) | | | EUR | | | | 116 | | | | 97,453 | |
| | | |
Virgin Media Vendor Financing Notes III DAC, 4.875%, 7/15/28(5) | | | GBP | | | | 100 | | | | 92,254 | |
| | | |
| | | | | | | | | | | $ | 4,475,245 | |
| | | |
| Metals & Mining — 1.9% | | | | | | | | | |
| | | |
Allegheny Ludlum, LLC, 6.95%, 12/15/25 | | | | | | | 598 | | | $ | 585,867 | |
| | | |
Arconic Corp., 6.125%, 2/15/28(4) | | | | | | | 101 | | | | 94,867 | |
| | | |
| BWX Technologies, Inc.: | | | | | | | | | |
| | | |
4.125%, 6/30/28(4) | | | | | | | 159 | | | | 139,357 | |
| | | |
4.125%, 4/15/29(4) | | | | | | | 118 | | | | 102,194 | |
| | | |
Centennial Resource Production, LLC, 5.375%, 1/15/26(4) | | | | | | | 225 | | | | 208,426 | |
| | | |
Cleveland-Cliffs, Inc., 6.75%, 3/15/26(4) | | | | | | | 460 | | | | 457,431 | |
| | | |
Eldorado Gold Corp., 6.25%, 9/1/29(4) | | | | | | | 251 | | | | 203,438 | |
| | | |
Freeport-McMoRan, Inc., 5.45%, 3/15/43 | | | | | | | 267 | | | | 219,737 | |
| | | |
| Hudbay Minerals, Inc.: | | | | | | | | | |
| | | |
4.50%, 4/1/26(4) | | | | | | | 204 | | | | 179,473 | |
| | | |
6.125%, 4/1/29(4) | | | | | | | 96 | | | | 79,711 | |
| | | | | | | | | | | | |
| Security | | Principal
Amount
(000’s omitted)* | | | Value | |
| | | |
| Metals & Mining (continued) | | | | | | | | | |
| | | |
Infrabuild Australia Pty, Ltd., 12.00%, 10/1/24(4) | | | | | | | 1,024 | | | $ | 952,535 | |
| | | |
New Gold, Inc., 7.50%, 7/15/27(4) | | | | | | | 491 | | | | 419,442 | |
| | | |
Novelis Corp., 3.25%, 11/15/26(4) | | | | | | | 89 | | | | 78,124 | |
| | | |
Novelis Sheet Ingot GmbH, 3.375%, 4/15/29(5) | | | EUR | | | | 200 | | | | 162,420 | |
| | | |
Roller Bearing Co. of America, Inc., 4.375%, 10/15/29(4) | | | | | | | 253 | | | | 222,319 | |
| | | |
TMS International Corp., 6.25%, 4/15/29(4) | | | | | | | 196 | | | | 137,752 | |
| | | |
| | | | | | | | | | | $ | 4,243,093 | |
| | | |
| Oil and Gas — 0.0%(3) | | | | | | | | | |
| | | |
Petroleos Mexicanos, 6.50%, 3/13/27 | | | | | | | 100 | | | $ | 87,878 | |
| | | |
| | | | | | | | | | | $ | 87,878 | |
| | | |
| Oil, Gas & Consumable Fuels — 2.5% | | | | | | | | | |
| | | |
Aethon United BR, L.P./Aethon United Finance Corp., 8.25%, 2/15/26(4) | | | | | | | 555 | | | $ | 564,922 | |
| | | |
| Colgate Energy Partners III, LLC: | | | | | | | | | |
| | | |
5.875%, 7/1/29(4) | | | | | | | 260 | | | | 243,040 | |
| | | |
7.75%, 2/15/26(4) | | | | | | | 190 | | | | 189,464 | |
| | | |
CrownRock, L.P./CrownRock Finance, Inc., 5.00%, 5/1/29(4) | | | | | | | 173 | | | | 157,405 | |
| | | |
CVR Energy, Inc., 5.75%, 2/15/28(4) | | | | | | | 439 | | | | 397,942 | |
| | | |
DCP Midstream, L.P., Series A, 7.375% to 12/15/22(7)(8) | | | | | | | 298 | | | | 294,292 | |
| | | |
EnLink Midstream Partners, L.P., Series C, 6.00% to 12/15/22(7)(8) | | | | | | | 145 | | | | 111,737 | |
| | | |
| EQT Corp.: | | | | | | | | | |
| | | |
5.00%, 1/15/29 | | | | | | | 53 | | | | 49,307 | |
| | | |
6.125%, 2/1/25 | | | | | | | 69 | | | | 69,245 | |
| | | |
7.00%, 2/1/30 | | | | | | | 102 | | | | 104,680 | |
| | | |
| Nabors Industries, Ltd.: | | | | | | | | | |
| | | |
7.50%, 1/15/28(4) | | | | | | | 118 | | | | 109,611 | |
| | | |
9.00%, 2/1/25(4) | | | | | | | 151 | | | | 153,333 | |
| | | |
Neptune Energy Bondco PLC, 6.625%, 5/15/25(4) | | | | | | | 200 | | | | 194,681 | |
| | | |
| Occidental Petroleum Corp.: | | | | | | | | | |
| | | |
6.20%, 3/15/40 | | | | | | | 81 | | | | 78,107 | |
| | | |
6.375%, 9/1/28 | | | | | | | 93 | | | | 94,607 | |
| | | |
6.45%, 9/15/36 | | | | | | | 93 | | | | 92,404 | |
| | | |
6.625%, 9/1/30 | | | | | | | 254 | | | | 264,635 | |
| | | |
Odebrecht Oil & Gas Finance, Ltd.,
0.00%(4)(7) | | | | | | | 862 | | | | 1,508 | |
| | | |
| Parkland Corp.: | | | | | | | | | |
| | | |
4.50%, 10/1/29(4) | | | | | | | 110 | | | | 92,847 | |
| | | |
4.625%, 5/1/30(4) | | | | | | | 202 | | | | 168,529 | |
| | | |
Plains All American Pipeline, L.P., Series B, 6.125% to 12/5/22(7)(8) | | | | | | | 97 | | | | 81,528 | |
| | | |
| Precision Drilling Corp.: | | | | | | | | | |
| | | |
6.875%, 1/15/29(4) | | | | | | | 152 | | | | 140,002 | |
| | | | |
| | 29 | | See Notes to Financial Statements. |
Global Income Builder Portfolio
October 31, 2022
Portfolio of Investments — continued
| | | | | | | | | | | | |
| Security | | Principal
Amount
(000’s omitted)* | | | Value | |
| | | |
| Oil, Gas & Consumable Fuels (continued) | | | | | | | | | |
| | | |
| Precision Drilling Corp.: (continued) | | | | | | | | | |
| | | |
7.125%, 1/15/26(4) | | | | | | | 99 | | | $ | 97,391 | |
| | | |
| Shelf Drilling Holdings, Ltd.: | | | | | | | | | |
| | | |
8.25%, 2/15/25(4) | | | | | | | 245 | | | | 206,956 | |
| | | |
8.875%, 11/15/24(4) | | | | | | | 71 | | | | 70,032 | |
| | | |
Southwestern Energy Co., 4.75%, 2/1/32 | | | | | | | 194 | | | | 167,748 | |
| | | |
| Sunoco, L.P./Sunoco Finance Corp.: | | | | | | | | | |
| | | |
4.50%, 5/15/29 | | | | | | | 209 | | | | 180,017 | |
| | | |
4.50%, 4/30/30 | | | | | | | 226 | | | | 192,768 | |
| | | |
Tap Rock Resources, LLC, 7.00%, 10/1/26(4) | | | | | | | 292 | | | | 273,095 | |
| | | |
Targa Resources Partners, L.P./Targa Resources Partners
Finance Corp.: | | | | | | | | | |
| | | |
4.00%, 1/15/32 | | | | | | | 169 | | | | 138,875 | |
| | | |
4.875%, 2/1/31 | | | | | | | 37 | | | | 32,692 | |
| | | |
5.50%, 3/1/30 | | | | | | | 36 | | �� | | 33,294 | |
| | | |
Transocean Poseidon, Ltd., 6.875%, 2/1/27(4) | | | | | | | 158 | | | | 151,887 | |
| | | |
Wintershall Dea Finance 2 B.V., 2.499% to 4/20/26(5)(7)(8) | | | EUR | | | | 500 | | | | 392,266 | |
| | | |
| | | | | | | | | | | $ | 5,590,847 | |
| | | |
| Paper and Forest Products — 0.0%(3) | | | | | | | | | |
| | | |
Glatfelter Corp., 4.75%, 11/15/29(4) | | | | | | | 31 | | | $ | 20,010 | |
| | | |
| | | | | | | | | | | $ | 20,010 | |
| | | |
| Pharmaceuticals — 0.9% | | | | | | | | | |
| | | |
| AdaptHealth, LLC: | | | | | | | | | |
| | | |
4.625%, 8/1/29(4) | | | | | | | 65 | | | $ | 54,916 | |
| | | |
5.125%, 3/1/30(4) | | | | | | | 133 | | | | 115,669 | |
| | | |
6.125%, 8/1/28(4) | | | | | | | 310 | | | | 287,137 | |
| | | |
BellRing Brands, Inc., 7.00%, 3/15/30(4) | | | | | | | 336 | | | | 318,036 | |
| | | |
Endo DAC/Endo Finance, LLC/Endo Finco, Inc., 5.875%, 10/15/24(4)(10) | | | | | | | 200 | | | | 159,038 | |
| | | |
Endo Luxembourg Finance Co. I S.a.r.l./Endo US, Inc., 6.125%, 4/1/29(4)(10) | | | | | | | 247 | | | | 187,177 | |
| | | |
Herbalife Nutrition, Ltd./HLF Financing, Inc., 7.875%, 9/1/25(4) | | | | | | | 420 | | | | 393,059 | |
| | | |
Option Care Health, Inc., 4.375%, 10/31/29(4) | | | | | | | 97 | | | | 83,898 | |
| | | |
P&L Development, LLC/PLD Finance Corp., 7.75%, 11/15/25(4) | | | | | | | 122 | | | | 94,345 | |
| | | |
Perrigo Finance Unlimited Co., 4.40% to 12/15/22, 6/15/30(11) | | | | | | | 400 | | | | 335,188 | |
| | | |
| | | | | | | | | | | $ | 2,028,463 | |
| | | |
| Pipelines — 1.2% | | | | | | | | | |
| | | |
Antero Midstream Partners, L.P./Antero Midstream
Finance Corp.: | | | | | | | | | |
| | | |
5.75%, 3/1/27(4) | | | | | | | 102 | | | $ | 97,365 | |
| | | | | | | | | | | | |
| Security | | Principal
Amount
(000’s omitted)* | | | Value | |
| | | |
| Pipelines (continued) | | | | | | | | | |
| | | |
Antero Midstream Partners, L.P./Antero Midstream
Finance Corp.: (continued) | | | | | | | | | |
| | | |
7.875%, 5/15/26(4) | | | | | | | 109 | | | $ | 111,321 | |
| | | |
Cheniere Energy Partners, L.P., 4.00%, 3/1/31 | | | | | | | 519 | | | | 438,231 | |
| | | |
Cheniere Energy, Inc., 4.625%, 10/15/28 | | | | | | | 239 | | | | 220,969 | |
| | | |
DT Midstream, Inc., 4.125%, 6/15/29(4) | | | | | | | 172 | | | | 149,121 | |
| | | |
Energy Transfer, L.P., Series B, 6.625% to 2/15/28(7)(8) | | | | | | | 147 | | | | 105,840 | |
| | | |
| EQM Midstream Partners, L.P.: | | | | | | | | | |
| | | |
4.50%, 1/15/29(4) | | | | | | | 364 | | | | 310,292 | |
| | | |
6.00%, 7/1/25(4) | | | | | | | 43 | | | | 41,701 | |
| | | |
6.50%, 7/1/27(4) | | | | | | | 116 | | | | 113,383 | |
| | | |
7.50%, 6/1/30(4) | | | | | | | 126 | | | | 122,705 | |
| | | |
Kinetik Holdings, L.P., 5.875%, 6/15/30(4) | | | | | | | 237 | | | | 222,624 | |
| | | |
New Fortress Energy, Inc., 6.50%, 9/30/26(4) | | | | | | | 382 | | | | 371,306 | |
| | | |
Venture Global Calcasieu Pass, LLC, 3.875%, 8/15/29(4) | | | | | | | 146 | | | | 125,588 | |
| | | |
| Western Midstream Operating, L.P.: | | | | | | | | | |
| | | |
4.30%, 2/1/30 | | | | | | | 207 | | | | 182,476 | |
| | | |
4.50%, 3/1/28 | | | | | | | 27 | | | | 24,810 | |
| | | |
4.75%, 8/15/28 | | | | | | | 24 | | | | 22,184 | |
| | | |
| | | | | | | | | | | $ | 2,659,916 | |
| | | |
| Real Estate Investment Trusts (REITs) — 0.6% | | | | | | | | | |
| | | |
ADLER Group S.A., 2.75%, 11/13/26(5) | | | EUR | | | | 200 | | | $ | 85,978 | |
| | | |
| HAT Holdings I, LLC/HAT Holdings II, LLC: | | | | | | | | | |
| | | |
3.75%, 9/15/30(4) | | | | | | | 151 | | | | 104,420 | |
| | | |
6.00%, 4/15/25(4) | | | | | | | 127 | | | | 121,247 | |
| | | |
Heimstaden Bostad AB, 3.00% to 10/29/27(5)(7)(8) | | | EUR | | | | 415 | | | | 224,732 | |
| | | |
| VICI Properties, L.P./VICI Note Co., Inc.: | | | | | | | | | |
| | | |
3.75%, 2/15/27(4) | | | | | | | 27 | | | | 23,717 | |
| | | |
4.125%, 8/15/30(4) | | | | | | | 198 | | | | 163,792 | |
| | | |
4.25%, 12/1/26(4) | | | | | | | 300 | | | | 273,642 | |
| | | |
4.50%, 9/1/26(4) | | | | | | | 100 | | | | 91,145 | |
| | | |
4.625%, 12/1/29(4) | | | | | | | 66 | | | | 57,544 | |
| | | |
5.625%, 5/1/24(4) | | | | | | | 200 | | | | 197,662 | |
| | | |
| | | | | | | | | | | $ | 1,343,879 | |
| |
| Semiconductors & Semiconductor Equipment — 0.1% | | | | |
| | | |
ON Semiconductor Corp., 3.875%, 9/1/28(4) | | | | | | | 258 | | | $ | 227,960 | |
| | | |
| | | | | | | | | | | $ | 227,960 | |
| | | |
| Software — 0.5% | | | | | | | | | |
| | | |
Black Knight InfoServ, LLC, 3.625%, 9/1/28(4) | | | | | | | 152 | | | $ | 132,050 | |
| | | |
Fair Isaac Corp., 4.00%, 6/15/28(4) | | | | | | | 165 | | | | 149,733 | |
| | | |
Minerva Merger Sub, Inc., 6.50%, 2/15/30(4) | | | | | | | 306 | | | | 239,222 | |
| | | |
Open Text Corp., 3.875%, 2/15/28(4) | | | | | | | 37 | | | | 31,745 | |
| | | | |
| | 30 | | See Notes to Financial Statements. |
Global Income Builder Portfolio
October 31, 2022
Portfolio of Investments — continued
| | | | | | | | | | | | |
| Security | | Principal
Amount
(000’s omitted)* | | | Value | |
| | | |
| Software (continued) | | | | | | | | | |
| | | |
Open Text Holdings, Inc., 4.125%, 2/15/30(4) | | | | | | | 37 | | | $ | 29,548 | |
| | | |
Playtika Holding Corp., 4.25%, 3/15/29(4) | | | | | | | 248 | | | | 207,011 | |
| | | |
SS&C Technologies, Inc., 5.50%, 9/30/27(4) | | | | | | | 296 | | | | 275,733 | |
| | | |
| | | | | | | | | | | $ | 1,065,042 | |
| | | |
| Specialty Retail — 2.3% | | | | | | | | | |
| | | |
Arko Corp., 5.125%, 11/15/29(4) | | | | | | | 271 | | | $ | 214,957 | |
| | | |
| Asbury Automotive Group, Inc.: | | | | | | | | | |
| | | |
4.625%, 11/15/29(4) | | | | | | | 27 | | | | 22,274 | |
| | | |
4.75%, 3/1/30 | | | | | | | 228 | | | | 187,156 | |
| | | |
5.00%, 2/15/32(4) | | | | | | | 28 | | | | 22,646 | |
| | | |
| Bath & Body Works, Inc.: | | | | | | | | | |
| | | |
6.625%, 10/1/30(4) | | | | | | | 144 | | | | 129,182 | |
| | | |
6.75%, 7/1/36 | | | | | | | 80 | | | | 66,296 | |
| | | |
6.875%, 11/1/35 | | | | | | | 233 | | | | 196,199 | |
| | | |
6.95%, 3/1/33 | | | | | | | 168 | | | | 138,566 | |
| | | |
7.60%, 7/15/37 | | | | | | | 75 | | | | 59,427 | |
| | | |
9.375%, 7/1/25(4) | | | | | | | 31 | | | | 32,202 | |
| | | |
Dave & Buster’s, Inc., 7.625%, 11/1/25(4) | | | | | | | 457 | | | | 456,408 | |
| | | |
Dufry One B.V., 3.375%, 4/15/28(5) | | | EUR | | | | 479 | | | | 391,547 | |
| | | |
eG Global Finance PLC, 6.25%, 10/30/25(5) | | | EUR | | | | 150 | | | | 128,789 | |
| | | |
Fertitta Entertainment, LLC/Fertitta Entertainment Finance Co., Inc., 4.625%, 1/15/29(4) | | | | | | | 100 | | | | 87,156 | |
| | | |
Group 1 Automotive, Inc., 4.00%, 8/15/28(4) | | | | | | | 203 | | | | 167,220 | |
| | | |
IRB Holding Corp., 7.00%, 6/15/25(4) | | | | | | | 98 | | | | 98,058 | |
| | | |
Ken Garff Automotive, LLC, 4.875%, 9/15/28(4) | | | | | | | 155 | | | | 128,915 | |
| | | |
LCM Investments Holdings II, LLC, 4.875%, 5/1/29(4) | | | | | | | 257 | | | | 217,457 | |
| | | |
Lithia Motors, Inc., 3.875%, 6/1/29(4) | | | | | | | 86 | | | | 69,529 | |
| | | |
Midco GB SASU, 7.75%, (7.75% cash or 8.50% PIK), 11/1/27(5)(6) | | | EUR | | | | 285 | | | | 266,555 | |
| | | |
Patrick Industries, Inc., 7.50%, 10/15/27(4) | | | | | | | 30 | | | | 27,631 | |
| | | |
| PetSmart, Inc./PetSmart Finance Corp.: | | | | | | | | | |
| | | |
4.75%, 2/15/28(4) | | | | | | | 250 | | | | 228,752 | |
| | | |
7.75%, 2/15/29(4) | | | | | | | 264 | | | | 248,453 | |
| | | |
Punch Finance PLC, 6.125%, 6/30/26(5) | | | GBP | | | | 340 | | | | 341,239 | |
| | | |
| Sonic Automotive, Inc.: | | | | | | | | | |
| | | |
4.625%, 11/15/29(4) | | | | | | | 172 | | | | 135,164 | |
| | | |
4.875%, 11/15/31(4) | | | | | | | 143 | | | | 108,169 | |
| | | |
SRS Distribution, Inc., 6.00%, 12/1/29(4) | | | | | | | 141 | | | | 115,296 | |
| | | |
Suburban Propane Partners, L.P./Suburban Energy | | | | | | | | | | | | |
| | | |
Finance Corp., 5.00%, 6/1/31(4) | | | | | | | 135 | | | | 113,804 | |
| | | |
Superior Plus, L.P./Superior General Partner, Inc., 4.50%, 3/15/29(4) | | | | | | | 254 | | | | 215,920 | |
| | | | | | | | | | | | |
| Security | | Principal
Amount
(000’s omitted)* | | | Value | |
| | | |
| Specialty Retail (continued) | | | | | | | | | |
| | | |
Victoria’s Secret & Co., 4.625%, 7/15/29(4) | | | | | | | 261 | | | $ | 208,260 | |
| | | |
Yum! Brands, Inc., 3.625%, 3/15/31 | | | | | | | 340 | | | | 273,547 | |
| | | |
| | | | | | | | | | | $ | 5,096,774 | |
| | |
| Technology Hardware, Storage & Peripherals — 0.6% | | | | | | | |
| | | |
Almaviva-The Italian Innovation Co. SpA, 4.875%, 10/30/26(5) | | | EUR | | | | 305 | | | $ | 271,746 | |
| | | |
| Booz Allen Hamilton, Inc.: | | | | | | | | | |
| | | |
3.875%, 9/1/28(4) | | | | | | | 410 | | | | 361,989 | |
| | | |
4.00%, 7/1/29(4) | | | | | | | 97 | | | | 84,920 | |
| | | |
| NCR Corp.: | | | | | | | | | |
| | | |
5.125%, 4/15/29(4) | | | | | | | 22 | | | | 18,512 | |
| | | |
5.25%, 10/1/30(4) | | | | | | | 17 | | | | 13,756 | |
| | | |
Presidio Holdings, Inc., 8.25%, 2/1/28(4) | | | | | | | 158 | | | | 140,843 | |
| | | |
Science Applications International Corp., 4.875%, 4/1/28(4) | | | | | | | 260 | | | | 237,107 | |
| | | |
| Seagate HDD Cayman: | | | | | | | | | |
| | | |
3.125%, 7/15/29 | | | | | | | 139 | | | | 102,980 | |
| | | |
3.375%, 7/15/31 | | | | | | | 56 | | | | 40,052 | |
| | | |
| | | | | | | | | | | $ | 1,271,905 | |
| | | |
| Telecommunications — 1.3% | | | | | | | | | |
| | | |
Altice France Holding S.A., 10.50%, 5/15/27(4) | | | | | | | 200 | | | $ | 156,286 | |
| | | |
Ciena Corp., 4.00%, 1/31/30(4) | | | | | | | 117 | | | | 99,054 | |
| | | |
Connect Finco S.a.r.l./Connect US Finco, LLC, 6.75%, 10/1/26(4) | | | | | | | 421 | | | | 396,435 | |
| | | |
Sprint Capital Corp., 6.875%, 11/15/28 | | | | | | | 305 | | | | 315,214 | |
| | | |
Sprint Corp., 7.875%, 9/15/23 | | | | | | | 375 | | | | 381,654 | |
| | | |
| Telecom Italia SpA: | | | | | | | | | |
| | | |
1.625%, 1/18/29(5) | | | EUR | | | | 170 | | | | 121,923 | |
| | | |
2.75%, 4/15/25(5) | | | EUR | | | | 140 | | | | 126,999 | |
| | | |
4.00%, 4/11/24(5) | | | EUR | | | | 200 | | | | 192,812 | |
| | | |
| T-Mobile USA, Inc.: | | | | | | | | | |
| | | |
2.25%, 2/15/26 | | | | | | | 132 | | | | 118,719 | |
| | | |
2.625%, 2/15/29 | | | | | | | 165 | | | | 136,661 | |
| | | |
2.875%, 2/15/31 | | | | | | | 99 | | | | 79,816 | |
| | | |
4.75%, 2/1/28 | | | | | | | 170 | | | | 161,160 | |
| | | |
Viasat, Inc., 5.625%, 4/15/27(4) | | | | | | | 61 | | | | 56,508 | |
| | | |
| Vodafone Group PLC: | | | | | | | | | |
| | | |
2.625% to 5/27/26, 8/27/80(5)(8) | | | EUR | | | | 220 | | | | 190,524 | |
| | | |
4.875% to 7/3/25, 10/3/78(5)(8) | | | GBP | | | | 215 | | | | 219,320 | |
| | | |
Wp/ap Telecom Holdings III B.V., 5.50%, 1/15/30(5) | | | EUR | | | | 259 | | | | 199,571 | |
| | | |
| | | | | | | | | | | $ | 2,952,656 | |
| | | | |
| | 31 | | See Notes to Financial Statements. |
Global Income Builder Portfolio
October 31, 2022
Portfolio of Investments — continued
| | | | | | | | | | | | |
| Security | | Principal
Amount
(000’s omitted)* | | | Value | |
| | | |
| Transportation — 0.2% | | | | | | | | | |
| | | |
Cargo Aircraft Management, Inc., 4.75%, 2/1/28(4) | | | | | | | 249 | | | $ | 222,687 | |
| | | |
Seaspan Corp., 5.50%, 8/1/29(4) | | | | | | | 213 | | | | 164,593 | |
| | | |
| | | | | | | | | | | $ | 387,280 | |
| | | |
| Wireless Telecommunication Services — 0.3% | | | | | | | | | |
| | | |
Altice France S.A., 5.50%, 10/15/29(4) | | | | | | | 200 | | | $ | 152,885 | |
| | | |
Iliad Holding SASU, 6.50%, 10/15/26(4) | | | | | | | 258 | | | | 239,344 | |
| | | |
Sprint Corp., 7.625%, 3/1/26 | | | | | | | 157 | | | | 164,125 | |
| | | |
| | | | | | | | | | | $ | 556,354 | |
| |
Total Corporate Bonds
(identified cost $96,436,330) | | | $ | 81,151,495 | |
| | | |
| Exchange-Traded Funds — 0.1% | | | | | | | | | | | | |
| Security | | | | | Shares | | | Value | |
| | | |
| Equity Funds — 0.1% | | | | | | | | | |
| | | |
Global X U.S. Preferred ETF | | | | | | | 3,235 | | | $ | 63,503 | |
| | | |
iShares Preferred & Income Securities ETF | | | | | | | 2,402 | | | | 73,285 | |
| | | |
Total Exchange-Traded Funds
(identified cost $167,497) | | | | | | | | | | $ | 136,788 | |
| | | |
| Preferred Stocks — 1.1% | | | | | | | | | | | | |
| Security | | | | | Shares | | | Value | |
| | | |
| Banks — 0.1% | | | | | | | | | |
| | | |
Farm Credit Bank of Texas, 6.75% to 9/15/23(4)(8) | | | | | | | 669 | | | $ | 66,733 | |
| | | |
| First Republic Bank: | | | | | | | | | |
| | | |
Series M, 4.00% | | | | | | | 6,280 | | | | 94,263 | |
| | | |
Series N, 4.50% | | | | | | | 2,083 | | | | 35,077 | |
| | | |
JPMorgan Chase & Co., Series LL, 4.625% | | | | | | | 4,150 | | | | 76,941 | |
| | | |
Wells Fargo & Co., Series L, 7.50% (Convertible) | | | | | | | 23 | | | | 26,807 | |
| | | |
| | | | | | | | | | | $ | 299,821 | |
| | | |
| Capital Markets — 0.1% | | | | | | | | | |
| | | |
Affiliated Managers Group, Inc., 4.75% | | | | | | | 5,486 | | | $ | 93,756 | |
| | | |
KKR Group Finance Co. IX, LLC, 4.625% | | | | | | | 7,175 | | | | 125,060 | |
| | | |
Stifel Financial Corp., Series D, 4.50% | | | | | | | 4,600 | | | | 74,474 | |
| | | |
| | | | | | | | | | | $ | 293,290 | |
| | | |
| Electric Utilities — 0.1% | | | | | | | | | |
| | | |
Brookfield BRP Holdings Canada, Inc., 4.625% | | | | | | | 7,000 | | | $ | 101,990 | |
| | | | | | | | | | |
| Security | | | | Shares | | | Value | |
| | | |
| Electric Utilities (continued) | | | | | | | | |
| | | |
SCE Trust III, Series H, 5.75% to 3/15/24(8) | | | | | 4,892 | | | $ | 94,611 | |
| | | |
SCE Trust IV, Series J, 5.375% to 9/15/25(8) | | | | | 1,911 | | | | 34,283 | |
| | | |
SCE Trust V, Series K, 5.45% to 3/15/26(8) | | | | | 3,551 | | | | 68,108 | |
| | | |
SCE Trust VI, 5.00% | | | | | 357 | | | | 6,123 | |
| | | |
| | | | | | | | | $ | 305,115 | |
| |
| Equity Real Estate Investment Trusts (REITs) — 0.0%(3) | | | | |
| | | |
SITE Centers Corp., Series A, 6.375% | | | | | 4,730 | | | $ | 94,884 | |
| | | |
| | | | | | | | | $ | 94,884 | |
| | | |
| Insurance — 0.1% | | | | | | | | |
| | | |
American Equity Investment Life Holding Co., Series B,
6.625% to 9/1/25(8) | | | | | 5,959 | | | $ | 138,011 | |
| | | |
Arch Capital Group, Ltd., Series G, 4.55% | | | | | 7,143 | | | | 125,431 | |
| | | |
| | | | | | | | | $ | 263,442 | |
| | | |
| Oil, Gas & Consumable Fuels — 0.2% | | | | | | | | |
| | | |
NuStar Energy, L.P., Series B, 9.126%, (3 mo. USD LIBOR + 5.643%)(9) | | | | | 15,478 | | | $ | 328,753 | |
| | | |
| | | | | | | | | $ | 328,753 | |
| | | |
| Pipelines — 0.1% | | | | | | | | |
| | | |
| Energy Transfer, L.P.: | | | | | | | | |
| | | |
Series C, 7.375% to 5/15/23(8) | | | | | 3,000 | | | $ | 67,200 | |
| | | |
Series E, 7.60% to 5/15/24(8) | | | | | 4,970 | | | | 114,459 | |
| | | |
| | | | | | | | | $ | 181,659 | |
| | | |
| Real Estate Management & Development — 0.1% | | | | | | | | |
| | | |
| Brookfield Property Partners, L.P.: | | | | | | | | |
| | | |
Series A, 5.75% | | | | | 6,429 | | | $ | 97,271 | |
| | | |
Series A2, 6.375% | | | | | 8,191 | | | | 133,513 | |
| | | |
| | | | | | | | | $ | 230,784 | |
| | | |
| Telecommunications — 0.1% | | | | | | | | |
| | | |
United States Cellular Corp., 5.50% | | | | | 11,360 | | | $ | 193,915 | |
| | | |
| | | | | | | | | $ | 193,915 | |
| | | |
| Trading Companies & Distributors — 0.2% | | | | | | | | |
| | | |
WESCO International, Inc., Series A, 10.625% to 6/22/25(8) | | | | | 12,788 | | | $ | 345,276 | |
| | | |
| | | | | | | | | $ | 345,276 | |
| |
Total Preferred Stocks
(identified cost $3,239,078) | | | $ | 2,536,939 | |
| | | | |
| | 32 | | See Notes to Financial Statements. |
Global Income Builder Portfolio
October 31, 2022
Portfolio of Investments — continued
| | | | | | | | | | |
| Senior Floating-Rate Loans — 1.2%(12) | |
| Borrower/Description | | | | Principal Amount (000’s omitted) | | | Value | |
| | | |
| Airlines — 0.3% | | | | | | | | |
| | | |
Air Canada, Term Loan, 6.421%, (3 mo. USD LIBOR + 3.50%), 8/11/28 | | | | $ | 203 | | | $ | 199,060 | |
| | | |
Mileage Plus Holdings, LLC, Term Loan, 8.777%, (3 mo. USD LIBOR + 5.25%), 6/21/27 | | | | | 405 | | | | 414,253 | |
| | | |
| | | | | | | | | $ | 613,313 | |
| | | |
| Health Care — 0.0%(3) | | | | | | | | |
| | | |
Pluto Acquisition I, Inc.Term Loan, 6.076%, (3 mo. USD LIBOR + 4.00%), 6/22/26 | | | | $ | 140 | | | $ | 121,937 | |
| | | |
| | | | | | | | | $ | 121,937 | |
| | | |
| Health Care Technology — 0.1% | | | | | | | | |
| | | |
Verscend Holding Corp., Term Loan, 7.754%, (1 mo. USD LIBOR + 4.00%), 8/27/25 | | | | $ | 247 | | | $ | 243,845 | |
| | | |
| | | | | | | | | $ | 243,845 | |
| | | |
| Hotels, Restaurants & Leisure — 0.1% | | | | | | | | |
| | | |
Spectacle Gary Holdings, LLC, Term Loan, 8.004%, (1 mo. USD LIBOR + 4.25%), 11/19/28 | | | | $ | 206 | | | $ | 198,540 | |
| | | |
| | | | | | | | | $ | 198,540 | |
| | | |
| IT Services — 0.1% | | | | | | | | |
| | | |
Travelport Finance (Luxembourg) S.a.r.l., Term Loan, 12.42%, (3 mo. USD LIBOR + 8.75%), 5.17% cash, 7.25% PIK, 2/28/25 | | | | $ | 231 | | | $ | 229,085 | |
| | | |
| | | | | | | | | $ | 229,085 | |
| | | |
| Leisure Products — 0.1% | | | | | | | | |
| | | |
Peloton Interactive, Inc.Term Loan, 8.346%, (SOFR + 6.50%), 5/25/27 | | | | $ | 140 | | | $ | 135,693 | |
| | | |
| | | | | | | | | $ | 135,693 | |
| | | |
| Pharmaceuticals — 0.2% | | | | | | | | |
| | | |
Jazz Financing Lux S.a.r.l., Term Loan, 7.254%, (1 mo. USD LIBOR + 3.50%), 5/5/28 | | | | $ | 373 | | | $ | 369,057 | |
| | | |
| | | | | | | | | $ | 369,057 | |
| | | |
| Software — 0.0%(3) | | | | | | | | |
| | | |
GoTo Group, Inc., Term Loan, 8.322%, (1 mo. USD LIBOR + 4.75%), 8/31/27(13) | | | | $ | 0 | | | $ | 63 | |
| | | | | | | | | | | | |
| Borrower/Description | | | | | Principal Amount (000’s omitted) | | | Value | |
| | | |
| Software (continued) | | | | | | | | | |
| | | |
Riverbed Technology, Inc., Term Loan, 11.20%, (1 mo. USD LIBOR + 8.00%), 9.20% cash, 2.00% PIK, 12/7/26 | | | | | | $ | 136 | | | $ | 52,863 | |
| | | |
| | | | | | | | | | | $ | 52,926 | |
| | | |
| Specialty Retail — 0.2% | | | | | | | | | |
| | | |
PetSmart, Inc., Term Loan, 7.50%, (1 mo. USD LIBOR + 3.75%), 2/11/28 | | | | | | $ | 382 | | | $ | 368,707 | |
| | | |
| | | | | | | | | | | $ | 368,707 | |
| | | |
| Trading Companies & Distributors — 0.1% | | | | | | | | | |
| | | |
Spin Holdco, Inc., Term Loan, 7.144%, (3 mo. USD LIBOR + 4.00%), 3/4/28 | | | | | | $ | 295 | | | $ | 261,316 | |
| | | |
| | | | | | | | | | | $ | 261,316 | |
| | | |
Total Senior Floating-Rate Loans
(identified cost $2,732,298) | | | | | | | | | | $ | 2,594,419 | |
| | | |
| Miscellaneous — 0.0%(3) | | | | | | | | | | | | |
| Security | | | | | Principal
Amount | | | Value | |
| | | |
| Diversified Financial Services — 0.0% | | | | | | | | | |
| | | |
Alpha Holding S.A., Escrow Certificates(1)(14) | | | | | | $ | 400,000 | | | $ | 0 | |
| | | |
| | | | | | | | | | | $ | 0 | |
| | | |
| Transportation — 0.0%(3) | | | | | | | | | |
| | | |
Hertz Corp., Escrow Certificates(1) | | | | | | $ | 58,000 | | | $ | 4,350 | |
| | | |
Hertz Corp., Escrow Certificates(1) | | | | | | | 110,000 | | | | 1,375 | |
| | | |
| | | | | | | | | | | $ | 5,725 | |
| | | |
Total Miscellaneous
(identified cost $44,604) | | | | | | | | | | $ | 5,725 | |
| | | | |
| | 33 | | See Notes to Financial Statements. |
Global Income Builder Portfolio
October 31, 2022
Portfolio of Investments — continued
| | | | | | | | | | | | |
| Short-Term Investments — 0.6% | | | | | | | | | | | | |
| Security | | | | | Shares | | | Value | |
| | | |
Morgan Stanley Institutional Liquidity Funds - Government Portfolio, Institutional Class, 2.88%(15) | | | | | | | 1,319,217 | | | $ | 1,319,217 | |
| |
Total Short-Term Investments
(identified cost $1,319,217) | | | $ | 1,319,217 | |
| | | |
Total Investments — 98.5%
(identified cost $201,572,701) | | | | | | | | | | $ | 218,105,491 | |
| |
Other Assets, Less Liabilities — 1.5% | | | $ | 3,284,236 | |
| |
Net Assets — 100.0% | | | $ | 221,389,727 | |
The percentage shown for each investment category in the Portfolio of Investments is based on net assets.
| | * | In U.S. dollars unless otherwise indicated. |
| | (1) | Non-income producing security. |
| | (2) | Security was acquired in connection with a restructuring of a Senior Loan and may be subject to restrictions on resale. |
| | (3) | Amount is less than 0.05%. |
| | (4) | Security exempt from registration under Rule 144A of the Securities Act of 1933, as amended. These securities may be sold in certain transactions in reliance on an exemption from registration (normally to qualified institutional buyers). At October 31, 2022, the aggregate value of these securities is $48,921,259 or 22.1% of the Portfolio’s net assets. |
| | (5) | Security exempt from registration under Regulation S of the Securities Act of 1933, as amended, which exempts from registration securities offered and sold outside the United States. Security may not be offered or sold in the United States except pursuant to an exemption from, or in a transaction not subject to, the registration requirements of the Securities Act of 1933, as amended. At October 31, 2022, the aggregate value of these securities is $15,397,945 or 7.0% of the Portfolio’s net assets. |
| | (6) | Represents a payment-in-kind security which may pay interest in additional principal at the issuer’s discretion. |
| | (7) | Perpetual security with no stated maturity date but may be subject to calls by the issuer. |
| | (8) | Security converts to variable rate after the indicated fixed-rate coupon period. |
| | (9) | Variable rate security. The stated interest rate represents the rate in effect at October 31, 2022. |
| (10) | Issuer is in default with respect to interest and/or principal payments. |
| (11) | Multi-step coupon security. Interest rate represents the rate in effect at October 31, 2022. |
| (12) | Senior floating-rate loans (Senior Loans) often require prepayments from excess cash flows or permit the borrowers to repay at their election. The degree to which borrowers repay, whether as a contractual requirement or at their election, cannot be predicted with accuracy. As a result, the actual remaining maturity may be substantially less than the stated maturities shown. However, Senior Loans will typically have an expected average life of approximately two to four years. Senior Loans typically have rates of interest which are redetermined periodically by reference to a base lending rate, plus a spread. These base lending rates are primarily the London Interbank Offered Rate (“LIBOR”) or the Secured Overnight Financing Rate (“SOFR”) and secondarily, the prime rate offered by one or more major United States banks (the “Prime Rate”).Base lending rates may be subject to a floor, or minimum rate. Rates for SOFR are generally 1 or 3-month tenors and may also be subject to a credit spread adjustment. Senior Loans are generally subject to contractual restrictions that must be satisfied before they can be bought or sold. |
| (13) | Principal amount is less than $500. |
| (14) | For fair value measurement disclosure purposes, security is categorized as Level 3 (see Note 8). |
| (15) | May be deemed to be an affiliated investment company. The rate shown is the annualized seven-day yield as of October 31, 2022. |
| | | | |
| | 34 | | See Notes to Financial Statements. |
Global Income Builder Portfolio
October 31, 2022
Portfolio of Investments — continued
| | | | | | | | |
| Country Concentration of Portfolio | |
| Country | | Percentage of
Total Investments | | | Value | |
| | |
United States | | | 69.1 | % | | $ | 150,789,755 | |
| | |
United Kingdom | | | 8.2 | | | | 17,909,463 | |
| | |
France | | | 4.2 | | | | 9,108,616 | |
| | |
Spain | | | 2.6 | | | | 5,599,708 | |
| | |
Switzerland | | | 2.1 | | | | 4,526,296 | |
| | |
Germany | | | 1.9 | | | | 4,062,401 | |
| | |
Canada | | | 1.7 | | | | 3,820,901 | |
| | |
Japan | | | 1.5 | | | | 3,321,462 | |
| | |
Netherlands | | | 1.5 | | | | 3,210,231 | |
| | |
Denmark | | | 1.2 | | | | 2,624,120 | |
| | |
Luxembourg | | | 1.1 | | | | 2,357,771 | |
| | |
Australia | | | 0.9 | | | | 2,053,198 | |
| | |
Italy | | | 0.6 | | | | 1,382,003 | |
| | |
India | | | 0.5 | | | | 1,195,053 | |
| | |
Taiwan | | | 0.5 | | | | 1,110,670 | |
| | |
Hong Kong | | | 0.5 | | | | 1,104,564 | |
| | |
Sweden | | | 0.5 | | | | 1,076,396 | |
| | |
United Arab Emirates | | | 0.5 | | | | 987,590 | |
| | |
Bermuda | | | 0.4 | | | | 884,769 | |
| | |
Mexico | | | 0.1 | | | | 255,223 | |
| | |
Poland | | | 0.1 | | | | 248,393 | |
| | |
Turkey | | | 0.1 | | | | 203,438 | |
| | |
Ireland | | | 0.1 | | | | 135,174 | |
| | |
Brazil | | | 0.0 | (1) | | | 1,508 | |
| | |
Exchange-Traded Funds | | | 0.1 | | | | 136,788 | |
| | |
Total Investments | | | 100.0 | % | | $ | 218,105,491 | |
| | |
(1) Amount is less than 0.05%. | | | | | | | | |
Abbreviations:
| | | | |
| | |
| ADR | | – | | American Depositary Receipt |
| | |
| EURIBOR | | – | | Euro Interbank Offered Rate |
| | |
| LIBOR | | – | | London Interbank Offered Rate |
| | |
| PC | | – | | Participation Certificate |
| | |
| PIK | | – | | Payment In Kind |
| | |
| SOFR | | – | | Secured Overnight Financing Rate |
Currency Abbreviations:
| | | | |
| | |
| EUR | | – | | Euro |
| | |
| GBP | | – | | British Pound Sterling |
| | |
| USD | | – | | United States Dollar |
| | | | |
| | 35 | | See Notes to Financial Statements. |
Global Income Builder Portfolio
October 31, 2022
Statement of Assets and Liabilities
| | | | |
| Assets | | October 31, 2022 | |
| |
Unaffiliated investments, at value (identified cost $200,253,484) | | $ | 216,786,274 | |
| |
Affiliated investment, at value (identified cost $1,319,217) | | | 1,319,217 | |
| |
Foreign currency, at value (identified cost $24,225) | | | 24,167 | |
| |
Interest and dividends receivable | | | 1,356,945 | |
| |
Dividends receivable from affiliated investment | | | 4,016 | |
| |
Receivable for investments sold | | | 1,377,062 | |
| |
Tax reclaims receivable | | | 999,680 | |
| |
Total assets | | $ | 221,867,361 | |
|
| Liabilities | |
| |
Payable for investments purchased | | $ | 139,664 | |
| |
Due to custodian | | | 69,156 | |
| |
Payable to affiliate: | | | | |
| |
Investment adviser fee | | | 97,620 | |
| |
Trustees’ fees | | | 1,490 | |
| |
Accrued foreign capital gains taxes | | | 31,836 | |
| |
Accrued expenses | | | 137,868 | |
| |
Total liabilities | | $ | 477,634 | |
| |
Net Assets applicable to investors’ interest in Portfolio | | $ | 221,389,727 | |
| | | | |
| | 36 | | See Notes to Financial Statements. |
Global Income Builder Portfolio
October 31, 2022
Statement of Operations
| | | | |
| Investment Income | | Year Ended
October 31, 2022 | |
| |
Dividend income (net of foreign taxes withheld of $720,176) | | $ | 5,920,030 | |
| |
Dividend income from affiliated investments | | | 20,231 | |
| |
Interest income (net of foreign taxes withheld of $6,360) | | | 5,756,552 | |
| |
Other income | | | 355,618 | |
| |
Total investment income | | $ | 12,052,431 | |
| |
| Expenses | | | | |
| |
Investment adviser fee | | $ | 1,442,542 | |
| |
Trustees’ fees and expenses | | | 16,949 | |
| |
Custodian fee | | | 141,327 | |
| |
Legal and accounting services | | | 72,659 | |
| |
Miscellaneous | | | 18,325 | |
| |
Total expenses | | $ | 1,691,802 | |
| |
Deduct: | | | | |
| |
Waiver and/or reimbursement of expenses by affiliate | | $ | 1,373 | |
| |
Total expense reductions | | $ | 1,373 | |
| |
Net expenses | | $ | 1,690,429 | |
| |
Net investment income | | $ | 10,362,002 | |
| |
| Realized and Unrealized Gain (Loss) | | | | |
| |
Net realized gain (loss): | | | | |
| |
Investment transactions (net of foreign capital gains taxes of $3,123) | | $ | (3,582,980 | ) |
| |
Investment transactions - affiliated investment | | | 315,268 | |
| |
Futures contracts | | | (1,114,142 | ) |
| |
Foreign currency transactions | | | (146,038 | ) |
| |
Forward foreign currency exchange contracts | | | 10,666 | |
| |
Net realized loss | | $ | (4,517,226 | ) |
| |
Change in unrealized appreciation (depreciation): | | | | |
| |
Investments (including net increase in accrued foreign capital gains taxes of $31,836) | | $ | (56,235,365 | ) |
| |
Investments - affiliated investment | | | (198,834 | ) |
| |
Foreign currency | | | (184,767 | ) |
| |
Forward foreign currency exchange contracts | | | (1,059 | ) |
| |
Net change in unrealized appreciation (depreciation) | | $ | (56,620,025 | ) |
| |
Net realized and unrealized loss | | $ | (61,137,251 | ) |
| |
Net decrease in net assets from operations | | $ | (50,775,249 | ) |
| | | | |
| | 37 | | See Notes to Financial Statements. |
Global Income Builder Portfolio
October 31, 2022
Statements of Changes in Net Assets
| | | | | | | | |
| | | Year Ended October 31, | |
| Increase (Decrease) in Net Assets | | 2022 | | | 2021 | |
| | |
From operations: | | | | | | | | |
| | |
Net investment income | | $ | 10,362,002 | | | $ | 9,077,852 | |
| | |
Net realized gain (loss) | | | (4,517,226 | ) | | | 14,965,170 | (1) |
| | |
Net change in unrealized appreciation (depreciation) | | | (56,620,025 | ) | | | 51,333,373 | |
| | |
Net increase (decrease) in net assets from operations | | $ | (50,775,249 | ) | | $ | 75,376,395 | |
| | |
Capital transactions: | | | | | | | | |
| | |
Contributions | | $ | 6,061,895 | | | $ | 13,442,582 | |
| | |
Withdrawals | | | (40,558,475 | ) | | | (45,523,591 | ) |
| | |
Portfolio transaction fee | | | 116,357 | | | | 154,785 | |
| | |
Net decrease in net assets from capital transactions | | $ | (34,380,223 | ) | | $ | (31,926,224 | ) |
| | |
Net increase (decrease) in net assets | | $ | (85,155,472 | ) | | $ | 43,450,171 | |
|
| Net Assets | |
| | |
At beginning of year | | $ | 306,545,199 | | | $ | 263,095,028 | |
| | |
At end of year | | $ | 221,389,727 | | | $ | 306,545,199 | |
| (1) | Includes $2,723,051 of net realized gains from redemptions in-kind. |
| | | | |
| | 38 | | See Notes to Financial Statements. |
Global Income Builder Portfolio
October 31, 2022
Financial Highlights
| | | | | | | | | | | | | | | | | | | | |
| | | Year Ended October 31, | |
| Ratios/Supplemental Data | | 2022 | | | 2021 | | | 2020 | | | 2019 | | | 2018 | |
| | | | | |
Ratios (as a percentage of average daily net assets): | | | | | | | | | | | | | | | | | | | | |
| | | | | |
Expenses | | | 0.64 | %(1) | | | 0.65 | % | | | 0.66 | % | | | 0.70 | % | | | 0.75 | % |
| | | | | |
Net investment income | | | 3.94 | % | | | 3.01 | % | | | 4.12 | % | | | 4.72 | % | | | 3.47 | % |
| | | | | |
Portfolio Turnover | | | 59 | % | | | 60 | % | | | 118 | % | | | 86 | % | | | 102 | % |
| | | | | |
Total Return | | | (17.42 | )% | | | 29.74 | % | | | 2.64 | % | | | 11.57 | % | | | (1.00 | )% |
| | | | | |
Net assets, end of year (000’s omitted) | | $ | 221,390 | | | $ | 306,545 | | | $ | 263,095 | | | $ | 302,020 | | | $ | 323,437 | |
| (1) | Includes a reduction by the investment adviser of a portion of its adviser fee due to the Portfolio’s investment in the Liquidity Fund (equal to less than 0.005% of average daily net assets for the year ended October 31, 2022). |
Global Income Builder Portfolio
October 31, 2022
Notes to Financial Statements
1 Significant Accounting Policies
Global Income Builder Portfolio (the Portfolio) is a Massachusetts business trust registered under the Investment Company Act of 1940, as amended (the 1940 Act), as a diversified, open-end management investment company. The Portfolio’s investment objective is to achieve total return. The Declaration of Trust permits the Trustees to issue interests in the Portfolio. At October 31, 2022, Eaton Vance Global Income Builder Fund and Eaton Vance Global Income Builder NextShares held an interest of 99.5% and 0.5%, respectively, in the Portfolio.
The following is a summary of significant accounting policies of the Portfolio. The policies are in conformity with accounting principles generally accepted in the United States of America (U.S. GAAP). The Portfolio is an investment company and follows accounting and reporting guidance in the Financial Accounting Standards Board (FASB) Accounting Standards Codification Topic 946.
A Investment Valuation — The following methodologies are used to determine the market value or fair value of investments.
Equity Securities. Equity securities listed on a U.S. securities exchange generally are valued at the last sale or closing price on the day of valuation or, if no sales took place on such date, at the mean between the closing bid and ask prices on the exchange where such securities are principally traded. Equity securities listed on the NASDAQ National Market System are valued at the NASDAQ official closing price. Unlisted or listed securities for which closing sales prices or closing quotations are not available are valued at the mean between the latest available bid and ask prices or, in the case of preferred equity securities that are not listed or traded in the over-the-counter market, by a third party pricing service that uses various techniques that consider factors including, but not limited to, prices or yields of securities with similar characteristics, benchmark yields, broker/dealer quotes, quotes of underlying common stock, issuer spreads, as well as industry and economic events.
Debt Obligations. Debt obligations are generally valued on the basis of valuations provided by third party pricing services, as derived from such services’ pricing models. Inputs to the models may include, but are not limited to, reported trades, executable bid and ask prices, broker/dealer quotations, prices or yields of securities with similar characteristics, interest rates, anticipated prepayments, benchmark curves or information pertaining to the issuer, as well as industry and economic events. The pricing services may use a matrix approach, which considers information regarding securities with similar characteristics to determine the valuation for a security. Short-term debt obligations purchased with a remaining maturity of sixty days or less for which a valuation from a third party pricing service is not readily available may be valued at amortized cost, which approximates fair value.
Senior Floating-Rate Loans. Interests in senior floating-rate loans (Senior Loans) are valued generally at the average mean of bid and ask quotations obtained from a third party pricing service.
Derivatives. Futures contracts are valued at the closing settlement price established by the board of trade or exchange on which they are traded, with adjustments for fair valuation for certain foreign futures contracts as described below. Forward foreign currency exchange contracts are generally valued at the mean of the average bid and average ask prices that are reported by currency dealers to a third party pricing service at the valuation time. Such third party pricing service valuations are supplied for specific settlement periods and the Portfolio’s forward foreign currency exchange contracts are valued at an interpolated rate between the closest preceding and subsequent settlement period reported by the third party pricing service.
Foreign Securities, Futures Contracts and Currencies. Foreign securities, futures contracts and currencies are valued in U.S. dollars, based on foreign currency exchange rate quotations supplied by a third party pricing service. The pricing service uses a proprietary model to determine the exchange rate. Inputs to the model include reported trades and implied bid/ask spreads. The daily valuation of exchange-traded foreign securities and certain exchange-traded foreign futures contracts generally is determined as of the close of trading on the principal exchange on which such securities and contracts trade. Events occurring after the close of trading on foreign exchanges may result in adjustments to the valuation of foreign securities and certain foreign futures contracts to more accurately reflect their fair value as of the close of regular trading on the New York Stock Exchange. When valuing foreign equity securities and foreign futures contracts that meet certain criteria, the Portfolio’s Trustees have approved the use of a fair value service that values such securities and foreign futures contracts to reflect market trading that occurs after the close of the applicable foreign markets of comparable securities or other instruments that have a strong correlation to the fair-valued securities and foreign futures contracts.
Other. Investments in management investment companies (including money market funds) that do not trade on an exchange are valued at the net asset value as of the close of each business day.
Fair Valuation. In connection with Rule 2a-5 of the 1940 Act, which became effective September 8, 2022, the Trustees have designated the Portfolio’s investment adviser as its valuation designee. Investments for which valuations or market quotations are not readily available or are deemed unreliable are valued by the investment adviser, as valuation designee, at fair value using methods that most fairly reflect the security’s “fair value”, which is the amount that the Portfolio might reasonably expect to receive for the security upon its current sale in the ordinary course. Each such determination is based on a consideration of relevant factors, which are likely to vary from one pricing context to another. These factors may include, but are not limited to, the type of security, the existence of any contractual restrictions on the security’s disposition, the price and extent of public trading in similar securities of the issuer or of comparable companies or entities, quotations or relevant information obtained from broker/dealers or other market participants, information obtained from the issuer, analysts, and/or the appropriate stock exchange (for exchange-traded securities), an analysis of the company’s or entity’s financial statements, and an evaluation of the forces that influence the issuer and the market(s) in which the security is purchased and sold.
B Investment Transactions — Investment transactions for financial statement purposes are accounted for on a trade date basis. Realized gains and losses on investments sold are determined on the basis of identified cost.
Global Income Builder Portfolio
October 31, 2022
Notes to Financial Statements — continued
C Income — Dividend income is recorded on the ex-dividend date for dividends received in cash and/or securities. However, if the ex-dividend date has passed, certain dividends from foreign securities are recorded as the Portfolio is informed of the ex-dividend date. Withholding taxes on foreign dividends, interest and capital gains have been provided for in accordance with the Portfolio’s understanding of the applicable countries’ tax rules and rates. In consideration of recent decisions rendered by European courts, the Portfolio has filed additional tax reclaims for previously withheld taxes on dividends earned in certain European Union countries. These filings are subject to various administrative and judicial proceedings within these countries. During the year ended October 31, 2022, the Portfolio received approximately $355,000 from Finland for previously withheld foreign taxes and interest thereon. Such amount is included in other income on the Statement of Operations. No other amounts for additional tax reclaims are reflected in the financial statements due to the uncertainty as to the ultimate resolution of proceedings, the likelihood of receipt of these reclaims, and the potential timing of payment. Interest income is recorded on the basis of interest accrued, adjusted for amortization of premium or accretion of discount. Distributions from investment companies are recorded as dividend income, capital gains or return of capital based on the nature of the distribution.
D Federal and Other Taxes — The Portfolio has elected to be treated as a partnership for federal tax purposes. No provision is made by the Portfolio for federal or state taxes on any taxable income of the Portfolio because each investor in the Portfolio is ultimately responsible for the payment of any taxes on its share of taxable income. Since at least one of the Portfolio’s investors is a regulated investment company that invests all or substantially all of its assets in the Portfolio, the Portfolio normally must satisfy the applicable source of income and diversification requirements (under the Internal Revenue Code) in order for its investors to satisfy them. The Portfolio will allocate, at least annually among its investors, each investor’s distributive share of the Portfolio’s net investment income, net realized capital gains and losses and any other items of income, gain, loss, deduction or credit.
In addition to the requirements of the Internal Revenue Code, the Portfolio may also be subject to local taxes on the recognition of capital gains in certain countries. In determining the daily net asset value, the Portfolio estimates the accrual for such taxes, if any, based on the unrealized appreciation on certain portfolio securities and the related tax rates. Taxes attributable to unrealized appreciation are included in the change in unrealized appreciation (depreciation) on investments. Capital gains taxes on securities sold are included in net realized gain (loss) on investments.
As of October 31, 2022, the Portfolio had no uncertain tax positions that would require financial statement recognition, de-recognition, or disclosure. The Portfolio files a U.S. federal income tax return annually after its fiscal year-end, which is subject to examination by the Internal Revenue Service for a period of three years from the date of filing.
E Foreign Currency Translation — Investment valuations, other assets, and liabilities initially expressed in foreign currencies are translated each business day into U.S. dollars based upon current exchange rates. Purchases and sales of foreign investment securities and income and expenses denominated in foreign currencies are translated into U.S. dollars based upon currency exchange rates in effect on the respective dates of such transactions. Recognized gains or losses on investment transactions attributable to changes in foreign currency exchange rates are recorded for financial statement purposes as net realized gains and losses on investments. That portion of unrealized gains and losses on investments that results from fluctuations in foreign currency exchange rates is not separately disclosed.
F Unfunded Loan Commitments — The Portfolio may enter into certain loan agreements all or a portion of which may be unfunded. The Portfolio is obligated to fund these commitments at the borrower’s discretion. These commitments, if any, are disclosed in the accompanying Portfolio of Investments.
G Use of Estimates — The preparation of the financial statements in conformity with U.S. GAAP requires management to make estimates and assumptions that affect the reported amounts of assets and liabilities at the date of the financial statements and the reported amounts of income and expense during the reporting period. Actual results could differ from those estimates.
H Indemnifications — Under the Portfolio’s organizational documents, its officers and Trustees may be indemnified against certain liabilities and expenses arising out of the performance of their duties to the Portfolio. Under Massachusetts law, if certain conditions prevail, interestholders in the Portfolio could be deemed to have personal liability for the obligations of the Portfolio. However, the Portfolio’s Declaration of Trust contains an express disclaimer of liability on the part of Portfolio interestholders. Additionally, in the normal course of business, the Portfolio enters into agreements with service providers that may contain indemnification clauses. The Portfolio’s maximum exposure under these arrangements is unknown as this would involve future claims that may be made against the Portfolio that have not yet occurred.
I Futures Contracts — Upon entering into a futures contract, the Portfolio is required to deposit with the broker, either in cash or securities, an amount equal to a certain percentage of the contract amount (initial margin). Subsequent payments, known as variation margin, are made or received by the Portfolio each business day, depending on the daily fluctuations in the value of the underlying security or index, and are recorded as unrealized gains or losses by the Portfolio. Gains (losses) are realized upon the expiration or closing of the futures contracts. Should market conditions change unexpectedly, the Portfolio may not achieve the anticipated benefits of the futures contracts and may realize a loss. Futures contracts have minimal counterparty risk as they are exchange traded and the clearinghouse for the exchange is substituted as the counterparty, guaranteeing counterparty performance.
J Forward Foreign Currency Exchange Contracts — The Portfolio may enter into forward foreign currency exchange contracts for the purchase or sale of a specific foreign currency at a fixed price on a future date. The forward foreign currency exchange contracts are adjusted by the daily exchange rate of the underlying currency and any gains or losses are recorded as unrealized until such time as the contracts have been closed. Risks may arise upon entering these contracts from the potential inability of counterparties to meet the terms of their contracts and from movements in the value of a foreign currency relative to the U.S. dollar.
Global Income Builder Portfolio
October 31, 2022
Notes to Financial Statements — continued
K When-Issued Securities and Delayed Delivery Transactions — The Portfolio may purchase securities on a delayed delivery or when-issued basis. Payment and delivery may take place after the customary settlement period for that security. At the time the transaction is negotiated, the price of the security that will be delivered is fixed. The Portfolio maintains cash and/or security positions for these commitments such that sufficient liquid assets will be available to make payments upon settlement. Securities purchased on a delayed delivery or when-issued basis are marked-to-market daily and begin earning interest on settlement date. Such security purchases are subject to the risk that when delivered they will be worth less than the agreed upon payment price. Losses may also arise if the counterparty does not perform under the contract.
L Capital Transactions — To seek to protect the Portfolio (and, indirectly, other investors in the Portfolio) against the costs of accommodating investor inflows and outflows, the Portfolio imposes a fee (“Portfolio transaction fee”) on inflows and outflows by Portfolio investors. The Portfolio transaction fee is sized to cover the estimated cost to the Portfolio of, in connection with issuing interests, converting the cash and/or other instruments it receives to the desired composition and, in connection with redeeming its interests, converting Portfolio holdings to cash and/or other instruments to be distributed. Such fee, which may vary over time, is limited to amounts that have been authorized by the Board of Trustees and determined by Eaton Vance Management (EVM) to be appropriate. The maximum Portfolio transaction fee is 2% of the amount of net contributions or withdrawals. The Portfolio transaction fee is recorded as a component of capital transactions on the Statements of Changes in Net Assets.
2 Investment Adviser Fee and Other Transactions with Affiliates
The investment adviser fee is earned by Boston Management and Research (BMR), an indirect, wholly-owned subsidiary of Morgan Stanley, as compensation for investment advisory services rendered to the Portfolio. The fee is computed at an annual rate as a percentage of average daily net assets as follows and is payable monthly:
| | | | |
| Average Daily Net Assets | | Annual Fee Rate | |
| |
Up to $500 million | | | 0.550 | % |
| |
$500 million but less than $1 billion | | | 0.525 | % |
| |
$1 billion but less than $2.5 billion | | | 0.500 | % |
| |
$2.5 billion and over | | | 0.475 | % |
For the year ended October 31, 2022, the Portfolio’s investment adviser fee amounted to $1,442,542 or 0.55% of the Portfolio’s average daily net assets.
Pursuant to an investment sub-advisory agreement, BMR has delegated a portion of the investment management of the Portfolio to Eaton Vance Advisers International Ltd. (EVAIL), an affiliate of BMR and an indirect, wholly-owned subsidiary of Morgan Stanley. BMR pays EVAIL a portion of its investment adviser fee for sub-advisory services provided to the Portfolio. Effective April 26, 2022, the Portfolio may invest in a money market fund, the Institutional Class of the Morgan Stanley Institutional Liquidity Funds - Government Portfolio (the “Liquidity Fund”), an open-end management investment company managed by Morgan Stanley Investment Management Inc., a wholly-owned subsidiary of Morgan Stanley. The investment adviser fee paid by the Portfolio is reduced by an amount equal to its pro-rata share of the advisory and administration fees paid by the Portfolio due to its investment in the Liquidity Fund. For the year ended October 31, 2022, the investment adviser fee paid was reduced by $1,373 relating to the Portfolio’s investment in the Liquidity Fund. Prior to April 26, 2022, the Portfolio may have invested its cash in Eaton Vance Cash Reserves Fund, LLC (Cash Reserves Fund), an affiliated investment company managed by EVM, an affiliate of BMR. EVM did not receive a fee for advisory services provided to Cash Reserves Fund.
Trustees and officers of the Portfolio who are members of EVM’s or BMR’s organizations receive remuneration for their services to the Portfolio out of the investment adviser fee. Trustees of the Portfolio who are not affiliated with the investment adviser may elect to defer receipt of all or a percentage of their annual fees in accordance with the terms of the Trustees Deferred Compensation Plan. For the year ended October 31, 2022, no significant amounts have been deferred. Certain officers and Trustees of the Portfolio are officers of the above organizations.
3 Purchases and Sales of Investments
Purchases and sales of investments, other than short-term obligations and including maturities and principal repayments on Senior Loans, aggregated $150,707,015 and $175,955,302, respectively, for the year ended October 31, 2022.
Global Income Builder Portfolio
October 31, 2022
Notes to Financial Statements — continued
4 Federal Income Tax Basis of Investments
The cost and unrealized appreciation (depreciation) of investments of the Portfolio at October 31, 2022, as determined on a federal income tax basis, were as follows:
| | | | |
| |
Aggregate cost | | $ | 203,265,441 | |
| |
Gross unrealized appreciation | | $ | 35,350,154 | |
| |
Gross unrealized depreciation | | | (20,510,104 | ) |
| |
Net unrealized appreciation | | $ | 14,840,050 | |
5 Financial Instruments
The Portfolio may trade in financial instruments with off-balance sheet risk in the normal course of its investing activities. These financial instruments may include forward foreign currency exchange contracts and futures contracts and may involve, to a varying degree, elements of risk in excess of the amounts recognized for financial statement purposes. The notional or contractual amounts of these instruments represent the investment the Portfolio has in particular classes of financial instruments and do not necessarily represent the amounts potentially subject to risk. The measurement of the risks associated with these instruments is meaningful only when all related and offsetting transactions are considered. At October 31, 2022, there were no obligations outstanding under these financial instruments.
In the normal course of pursuing its investment objectives, the Portfolio is subject to the following risks:
Equity Price Risk: During the year ended October 31, 2022, the Portfolio entered into equity futures contracts on securities indices to gain or limit exposure to certain markets, particularly in connection with engaging in the dividend capture trading strategy.
Foreign Exchange Risk: Because the Portfolio holds foreign currency denominated investments, the value of these investments and related receivables and payables may change due to future changes in foreign currency exchange rates. To hedge against this risk, during the year ended October 31, 2022, the Portfolio entered into forward foreign currency exchange contracts.
The Portfolio enters into forward foreign currency exchange contracts that may contain provisions whereby the counterparty may terminate the contract under certain conditions, including but not limited to a decline in the Portfolio’s net assets below a certain level over a certain period of time, which would trigger a payment by the Portfolio for those derivatives in a liability position. At October 31, 2022, the Portfolio had no open derivatives with credit-related contingent features in a net liability position.
The over-the-counter (OTC) derivatives in which the Portfolio invests are subject to the risk that the counterparty to the contract fails to perform its obligations under the contract. To mitigate this risk, the Portfolio has entered into an International Swaps and Derivatives Association, Inc. Master Agreement (“ISDA Master Agreement”) or similar agreement with substantially all its derivative counterparties. An ISDA Master Agreement is a bilateral agreement between the Portfolio and a counterparty that governs certain OTC derivatives and typically contains, among other things, set-off provisions in the event of a default and/or termination event as defined under the relevant ISDA Master Agreement. Under an ISDA Master Agreement, the Portfolio may, under certain circumstances, offset with the counterparty certain derivative financial instruments’ payables and/or receivables with collateral held and/or posted and create one single net payment. The provisions of the ISDA Master Agreement typically permit a single net payment in the event of default including the bankruptcy or insolvency of the counterparty. However, bankruptcy or insolvency laws of a particular jurisdiction may impose restrictions on or prohibitions against the right of offset in bankruptcy or insolvency. Certain ISDA Master Agreements allow counterparties to OTC derivatives to terminate derivative contracts prior to maturity in the event the Portfolio’s net assets decline by a stated percentage or the Portfolio fails to meet the terms of its ISDA Master Agreements, which would cause the counterparty to accelerate payment by the Portfolio of any net liability owed to it.
The collateral requirements for derivatives traded under an ISDA Master Agreement are governed by a Credit Support Annex to the ISDA Master Agreement. Collateral requirements are determined at the close of business each day and are typically based on changes in market values for each transaction under an ISDA Master Agreement and netted into one amount for such agreement. Generally, the amount of collateral due from or to a counterparty is subject to a minimum transfer threshold amount before a transfer is required, which may vary by counterparty. Collateral pledged for the benefit of the Portfolio and/or counterparty is held in segregated accounts by the Portfolio’s custodian and cannot be sold, re-pledged, assigned or otherwise used while pledged. The portion of such collateral representing cash, if any, is reflected as deposits for derivatives collateral and, in the case of cash pledged by a counterparty for the benefit of the Portfolio, a corresponding liability on the Statement of Assets and Liabilities. Securities pledged by the Portfolio as collateral, if any, are identified as such in the Portfolio of Investments.
Global Income Builder Portfolio
October 31, 2022
Notes to Financial Statements — continued
The effect of derivative instruments (not considered to be hedging instruments for accounting disclosure purposes) on the Statement of Operations by risk exposure for the year ended October 31, 2022 was as follows:
| | | | | | | | | | | | |
| Risk | | Derivative | | | Realized Gain (Loss)
on Derivatives Recognized
in Income(1) | | | Change in Unrealized
Appreciation (Depreciation) on
Derivatives Recognized in Income(2) | |
| | | |
Equity Price | | | Futures contracts | | | $ | (1,114,142 | ) | | $ | — | |
| | | |
Foreign Exchange | | | Forward foreign currency exchange contracts | | | | 10,666 | | | | (1,059 | ) |
| | | |
Total | | | | | | $ | (1,103,476 | ) | | $ | (1,059 | ) |
| (1) | Statement of Operations location: Net realized gain (loss): Futures contracts and Forward foreign currency exchange contracts, respectively. |
| (2) | Statement of Operations location: Change in unrealized appreciation (depreciation): Futures contracts and Forward foreign currency exchange contracts, respectively. |
The average notional cost of futures contracts and average notional amounts of other derivative contracts outstanding during the year ended October 31, 2022, which are indicative of the volume of these derivative types, were approximately as follows:
| | | | | | | | | | |
Futures
Contracts — Long | | | Futures
Contracts — Short | | | Forward
Foreign Currency
Exchange Contracts* | |
| | |
| | $5,900,000 | | | $ | 5,803,000 | | | $ | 128,000 | |
| * | The average notional amount for forward foreign currency exchange contracts is based on the absolute value of notional amounts of currency purchased and currency sold. |
6 Line of Credit
The Portfolio participates with other portfolios and funds managed by EVM and its affiliates in a $725 million unsecured line of credit agreement with a group of banks, which is in effect through October 24, 2023. In connection with the renewal of the agreement on October 25, 2022, the borrowing limit was decreased from $800 million. Borrowings are made by the Portfolio solely for temporary purposes related to redemptions and other short-term cash needs. Interest is charged to the Portfolio based on its borrowings at an amount above either the Secured Overnight Financing Rate (SOFR) or Federal Funds rate. In addition, a fee computed at an annual rate of 0.15% on the daily unused portion of the line of credit is allocated among the participating portfolios and funds at the end of each quarter. Also in connection with the renewal of the agreement, an arrangement fee totaling $150,000 was incurred that was allocated to the participating portfolios and funds. Because the line of credit is not available exclusively to the Portfolio, it may be unable to borrow some or all of its requested amounts at any particular time. The Portfolio did not have any significant borrowings or allocated fees during the year ended October 31, 2022.
Global Income Builder Portfolio
October 31, 2022
Notes to Financial Statements — continued
7 Investments in Affiliated Issuers and Funds
The Portfolio invested in issuers that may be deemed to be affiliated with Morgan Stanley. At October 31, 2022, the value of the Portfolio’s investment in affiliated issuers and funds was $1,319,217, which represents 0.6% of the Portfolio’s net assets. Transactions in affiliated issuers and funds by the Portfolio for the year ended October 31, 2022 were as follows:
| | | | | | | | | | | | | | | | | | | | | | | | | | | | | | | | |
| Name | | Value,
beginning
of period | | | Purchases | | | Sales
proceeds | | | Net
realized
gain (loss) | | | Change in
unrealized
appreciation
(depreciation) | | | Value, end
of period | | | Dividend
income | | | Units/Shares,
end of period | |
| | | | | | | | |
Common Stocks | | | | | | | | | | | | | | | | | | | | | | | | | | | | | | | | |
| | | | | | | | |
Mitsubishi UFJ Financial Group, Inc. | | $ | 1,471,139 | | | $ | — | | | $ | (1,587,520 | ) | | $ | 315,215 | | | $ | (198,834 | ) | | $ | — | | | $ | — | | | | — | |
| | | | | | | | |
Short-Term Investments | | | | | | | | | | | | | | | | | | | | | | | | | | | | | | | | |
| | | | | | | | |
Cash Reserves Fund | | | 1,432,849 | | | | 37,244,468 | | | | (38,677,370 | ) | | | 53 | | | | — | | | | — | | | | 1,407 | | | | — | |
| | | | | | | | |
Liquidity Fund | | | — | | | | 44,728,085 | | | | (43,408,868 | ) | | | — | | | | — | | | | 1,319,217 | | | | 18,824 | | | | 1,319,217 | |
| | | | | | | | |
Total | | | | | | | | | | | | | | $ | 315,268 | | | $ | (198,834 | ) | | $ | 1,319,217 | | | $ | 20,231 | | | | | |
8 Fair Value Measurements
Under generally accepted accounting principles for fair value measurements, a three-tier hierarchy to prioritize the assumptions, referred to as inputs, is used in valuation techniques to measure fair value. The three-tier hierarchy of inputs is summarized in the three broad levels listed below.
| • | | Level 1 – quoted prices in active markets for identical investments |
| • | | Level 2 – other significant observable inputs (including quoted prices for similar investments, interest rates, prepayment speeds, credit risk, etc.) |
| • | | Level 3 – significant unobservable inputs (including a fund’s own assumptions in determining the fair value of investments) |
In cases where the inputs used to measure fair value fall in different levels of the fair value hierarchy, the level disclosed is determined based on the lowest level input that is significant to the fair value measurement in its entirety. The inputs or methodology used for valuing securities are not necessarily an indication of the risk associated with investing in those securities.
At October 31, 2022, the hierarchy of inputs used in valuing the Portfolio’s investments, which are carried at value, were as follows:
| | | | | | | | | | | | | | | | |
| Asset Description | | Level 1 | | | Level 2 | | | Level 3* | | | Total | |
| | | | |
Common Stocks: | | | | | | | | | | | | | | | | |
| | | | |
Communication Services | | $ | 8,826,164 | | | $ | 1,450,639 | | | $ | — | | | $ | 10,276,803 | |
| | | | |
Consumer Discretionary | | | 7,094,964 | | | | 6,641,318 | | | | — | | | | 13,736,282 | |
| | | | |
Consumer Staples | | | 5,353,378 | | | | 5,628,815 | | | | — | | | | 10,982,193 | |
| | | | |
Energy | | | 7,468,951 | | | | — | | | | — | | | | 7,468,951 | |
| | | | |
Financials | | | 8,860,762 | | | | 5,349,039 | | | | — | | | | 14,209,801 | |
| | | | |
Health Care | | | 11,919,584 | | | | 10,366,266 | | | | — | | | | 22,285,850 | |
| | | | |
Industrials | | | 5,832,667 | | | | 9,121,699 | | | | — | | | | 14,954,366 | |
| | | | |
Information Technology | | | 23,556,745 | | | | 6,393,598 | | | | — | | | | 29,950,343 | |
| | | | |
Materials | | | 3,819 | | | | 1,296,120 | | | | — | | | | 1,299,939 | |
| | | | |
Real Estate | | | 1,074,625 | | | | — | | | | — | | | | 1,074,625 | |
| | | | |
Utilities | | | 2,045,598 | | | | 1,612,369 | | | | — | | | | 3,657,967 | |
| | | | |
Total Common Stocks | | $ | 82,037,257 | | | $ | 47,859,863 | ** | | $ | — | | | $ | 129,897,120 | |
| | | | |
Convertible Bonds | | $ | — | | | $ | 302,026 | | | $ | — | | | $ | 302,026 | |
| | | | |
Convertible Preferred Stocks | | | 159,282 | | | | 2,480 | | | | — | | | | 161,762 | |
| | | | |
Corporate Bonds | | | — | | | | 81,151,495 | | | | — | | | | 81,151,495 | |
Global Income Builder Portfolio
October 31, 2022
Notes to Financial Statements — continued
| | | | | | | | | | | | | | | | |
| Asset Description (continued) | | Level 1 | | | Level 2 | | | Level 3* | | | Total | |
| | | | |
Exchange-Traded Funds | | $ | 136,788 | | | $ | — | | | $ | — | | | $ | 136,788 | |
| | | | |
Preferred Stocks: | | | | | | | | | | | | | | | | |
| | | | |
Communication Services | | | 193,915 | | | | — | | | | — | | | | 193,915 | |
| | | | |
Energy | | | 510,412 | | | | — | | | | — | | | | 510,412 | |
| | | | |
Financials | | | 789,820 | | | | 66,733 | | | | — | | | | 856,553 | |
| | | | |
Industrials | | | 345,276 | | | | — | | | | — | | | | 345,276 | |
| | | | |
Real Estate | | | 325,668 | | | | — | | | | — | | | | 325,668 | |
| | | | |
Utilities | | | 305,115 | | | | — | | | | — | | | | 305,115 | |
| | | | |
Total Preferred Stocks | | $ | 2,470,206 | | | $ | 66,733 | | | $ | — | | | $ | 2,536,939 | |
| | | | |
Senior Floating-Rate Loans | | $ | — | | | $ | 2,594,419 | | | $ | — | | | $ | 2,594,419 | |
| | | | |
Miscellaneous | | | — | | | | 5,725 | | | | 0 | | | | 5,725 | |
| | | | |
Short-Term Investments | | | 1,319,217 | | | | — | | | | — | | | | 1,319,217 | |
| | | | |
Total Investments | | $ | 86,122,750 | | | $ | 131,982,741 | | | $ | 0 | | | $ | 218,105,491 | |
| * | None of the unobservable inputs for Level 3 assets, individually or collectively, had a material impact on the Portfolio. |
| ** | Includes foreign equity securities whose values were adjusted to reflect market trading of comparable securities or other correlated instruments that occurred after the close of trading in their applicable foreign markets. |
Level 3 investments at the beginning and/or end of the period in relation to net assets were not significant and accordingly, a reconciliation of Level 3 assets for the year ended October 31, 2022 is not presented.
9 Risks and Uncertainties
Risks Associated with Foreign Investments
Foreign investments can be adversely affected by political, economic and market developments abroad, including the imposition of economic and other sanctions by the United States or another country. There may be less publicly available information about foreign issuers because they may not be subject to reporting practices, requirements or regulations comparable to those to which United States companies are subject. Foreign markets may be smaller, less liquid and more volatile than the major markets in the United States. Trading in foreign markets typically involves higher expense than trading in the United States. The Portfolio may have difficulties enforcing its legal or contractual rights in a foreign country. Securities that trade or are denominated in currencies other than the U.S. dollar may be adversely affected by fluctuations in currency exchange rates.
Pandemic Risk
An outbreak of respiratory disease caused by a novel coronavirus was first detected in China in late 2019 and subsequently spread internationally. This coronavirus has resulted in closing borders, enhanced health screenings, changes to healthcare service preparation and delivery, quarantines, cancellations, disruptions to supply chains and customer activity, as well as general concern and uncertainty. Health crises caused by outbreaks of disease, such as the coronavirus outbreak, may exacerbate other pre-existing political, social and economic risks and disrupt normal market conditions and operations. The impact of this outbreak has negatively affected the worldwide economy, as well as the economies of individual countries and industries, and could continue to affect the market in significant and unforeseen ways. Other epidemics and pandemics that may arise in the future may have similar effects. Any such impact could adversely affect the Portfolio’s performance, or the performance of the securities in which the Portfolio invests.
Global Income Builder Portfolio
October 31, 2022
Report of Independent Registered Public Accounting Firm
To the Trustees and Investors of Global Income Builder Portfolio:
Opinion on the Financial Statements and Financial Highlights
We have audited the accompanying statement of assets and liabilities of Global Income Builder Portfolio (the “Portfolio”), including the portfolio of investments, as of October 31, 2022, the related statement of operations for the year then ended, the statements of changes in net assets for each of the two years in the period then ended, the financial highlights for each of the five years in the period then ended, and the related notes. In our opinion, the financial statements and financial highlights present fairly, in all material respects, the financial position of the Portfolio as of October 31, 2022, and the results of its operations for the year then ended, the changes in its net assets for each of the two years in the period then ended, and the financial highlights each of the five years in the period then ended, in conformity with accounting principles generally accepted in the United States of America.
Basis for Opinion
These financial statements and financial highlights are the responsibility of the Portfolio’s management. Our responsibility is to express an opinion on the Portfolio’s financial statements and financial highlights based on our audits. We are a public accounting firm registered with the Public Company Accounting Oversight Board (United States) (PCAOB) and are required to be independent with respect to the Portfolio in accordance with the U.S. federal securities laws and the applicable rules and regulations of the Securities and Exchange Commission and the PCAOB.
We conducted our audits in accordance with the standards of the PCAOB. Those standards require that we plan and perform the audit to obtain reasonable assurance about whether the financial statements and financial highlights are free of material misstatement, whether due to error or fraud. The Portfolio is not required to have, nor were we engaged to perform, an audit of its internal control over financial reporting. As part of our audits, we are required to obtain an understanding of internal control over financial reporting but not for the purpose of expressing an opinion on the effectiveness of the Portfolio’s internal control over financial reporting. Accordingly, we express no such opinion.
Our audits included performing procedures to assess the risks of material misstatement of the financial statements and financial highlights, whether due to error or fraud, and performing procedures that respond to those risks. Such procedures included examining, on a test basis, evidence regarding the amounts and disclosures in the financial statements and financial highlights. Our audits also included evaluating the accounting principles used and significant estimates made by management, as well as evaluating the overall presentation of the financial statements and financial highlights. Our procedures included confirmation of securities and senior loans owned as of October 31, 2022, by correspondence with the custodian, brokers and selling or agent banks; when replies were not received from brokers and selling or agent banks, we performed other auditing procedures. We believe that our audits provide a reasonable basis for our opinion.
/s/ Deloitte & Touche LLP
Boston, Massachusetts
December 22, 2022
We have served as the auditor of one or more Eaton Vance investment companies since 1959.
Eaton Vance
Global Income Builder Fund
October 31, 2022
Board of Trustees’ Contract Approval
Overview of the Contract Review Process
The Investment Company Act of 1940, as amended (the “1940 Act”), provides, in substance, that the investment advisory agreement between a fund and its investment adviser will continue in effect from year-to-year only if its continuation is approved on an annual basis by a vote of the fund’s board of trustees, including a majority of the trustees who are not “interested persons” of the fund (“independent trustees”), cast in person at a meeting called for the purpose of considering such approval.
At a meeting held on June 8, 2022, the Boards of Trustees/Directors (collectively, the “Board”) that oversee the registered investment companies advised by Eaton Vance Management or its affiliate, Boston Management and Research (the “Eaton Vance Funds”), including a majority of the independent trustees (the “Independent Trustees”), voted to approve the continuation of existing investment advisory agreements and sub-advisory agreements1 for each of the Eaton Vance Funds for an additional one-year period. The Board relied upon the affirmative recommendation of its Contract Review Committee, which is a committee exclusively comprised of Independent Trustees. Prior to making its recommendation, the Contract Review Committee reviewed information furnished by the adviser and sub-adviser to each of the Eaton Vance Funds (including information specifically requested by the Board) for a series of formal meetings held between April and June 2022. Members of the Contract Review Committee also considered information received at prior meetings of the Board and its committees, to the extent such information was relevant to the Contract Review Committee’s annual evaluation of the investment advisory agreements and sub-advisory agreements.
In connection with its evaluation of the investment advisory agreements and sub-advisory agreements, the Board considered various information relating to the Eaton Vance Funds. This included information applicable to all or groups of Eaton Vance Funds, which is referenced immediately below, and information applicable to the particular Eaton Vance Fund covered by this report (additional fund-specific information is referenced below under “Results of the Contract Review Process”). (For funds that invest through one or more underlying portfolios, references to “each fund” in this section may include information that was considered at the portfolio-level.)
Information about Fees, Performance and Expenses
| | • | | A report from an independent data provider comparing advisory and other fees paid by each fund to such fees paid by comparable funds, as identified by the independent data provider (“comparable funds”); |
| | • | | A report from an independent data provider comparing each fund’s total expense ratio (and its components) to those of comparable funds; |
| | • | | A report from an independent data provider comparing the investment performance of each fund (including, as relevant, total return data, income data, Sharpe ratios and information ratios) to the investment performance of comparable funds and, as applicable, benchmark indices, over various time periods; |
| | • | | In certain instances, data regarding investment performance relative to customized groups of peer funds and blended indices identified by the adviser in consultation with the Portfolio Management Committee of the Board (a committee exclusively comprised of Independent Trustees); |
| | • | | Comparative information concerning the fees charged and services provided by the adviser and sub-adviser to each fund in managing other accounts (which may include other mutual funds, collective investment funds and institutional accounts) using investment strategies and techniques similar to those used in managing such fund(s), if any; |
| | • | | Profitability analyses with respect to the adviser and sub-adviser to each of the funds; |
Information about Portfolio Management and Trading
| | • | | Descriptions of the investment management services provided to each fund, as well as each of the funds’ investment strategies and policies; |
| | • | | The procedures and processes used to determine the value of fund assets, including, when necessary, the determination of “fair value” and actions taken to monitor and test the effectiveness of such procedures and processes; |
| | • | | Information about the policies and practices of each fund’s adviser and sub-adviser with respect to trading, including their processes for seeking best execution of portfolio transactions; |
| | • | | Information about the allocation of brokerage transactions and the benefits, if any, received by the adviser and sub-adviser to each fund as a result of brokerage allocation, including, as applicable, information concerning the acquisition of research through client commission arrangements and policies with respect to “soft dollars”; |
| | • | | Data relating to the portfolio turnover rate of each fund and related information regarding active management in the context of particular strategies; |
Information about each Adviser and Sub-adviser
| | • | | Reports detailing the financial results and condition of the adviser and sub-adviser to each fund; |
| 1 | Not all Eaton Vance Funds have entered into a sub-advisory agreement with a sub-adviser. Accordingly, references to “sub-adviser” or “sub-advisory agreement” in this “Overview” section may not be applicable to the particular Eaton Vance Fund covered by this report. Following the “Overview” section, further information regarding the Board’s evaluation of a fund’s contractual arrangements is included under the “Results of the Contract Review Process” section. |
Eaton Vance
Global Income Builder Fund
October 31, 2022
Board of Trustees’ Contract Approval — continued
| • | | Information regarding the individual investment professionals whose responsibilities include portfolio management and investment research for the funds, and, for portfolio managers and certain other investment professionals, information relating to their responsibilities with respect to managing other mutual funds and investment accounts, as applicable; |
| • | | Information regarding the adviser’s and its parent company’s (Morgan Stanley’s) efforts to retain and attract talented investment professionals, including in the context of a particularly competitive marketplace for talent, as well as the ongoing unique environment presented by hybrid, remote and other alternative work arrangements; |
| • | | The Code of Ethics of the adviser and its affiliates and the sub-adviser of each fund, together with information relating to compliance with, and the administration of, such codes; |
| • | | Policies and procedures relating to proxy voting, including regular reporting with respect to fund proxy voting activities; |
| • | | Information regarding the handling of corporate actions and class actions, as well as information regarding litigation and other regulatory matters; |
| • | | Information concerning the resources devoted to compliance efforts undertaken by the adviser and its affiliates and the sub-adviser of each fund, if any, including descriptions of their various compliance programs and their record of compliance; |
| • | | Information concerning the business continuity and disaster recovery plans of the adviser and its affiliates and the sub-adviser of each fund, if any; |
| • | | A description of Eaton Vance Management’s and Boston Management and Research’s oversight of sub-advisers, including with respect to regulatory and compliance issues, investment management and other matters; |
Other Relevant Information
| • | | Information regarding ongoing initiatives to further integrate and harmonize, where applicable, the investment management and other departments of the adviser and its affiliates with the overall investment management infrastructure of Morgan Stanley, in light of Morgan Stanley’s acquisition of Eaton Vance on March 1, 2021; |
| • | | Information concerning the nature, cost and character of the administrative and other non-investment advisory services provided by Eaton Vance Management and its affiliates; |
| • | | Information concerning oversight of the relationship with the custodian, subcustodians, fund accountants, and other third-party service providers by the adviser and/or administrator to each of the funds; |
| • | | Information concerning efforts to implement policies and procedures with respect to various new regulations applicable to the funds, including Rule 12d1-4 (the Fund-of-Funds Rule), Rule 18f-4 (the Derivatives Rule) and Rule 2a-5 (the Fair Valuation Rule); |
| • | | For an Eaton Vance Fund structured as an exchange-listed closed-end fund, information concerning the benefits of the closed-end fund structure, as well as, where relevant, the closed-end fund’s market prices (including as compared to the closed-end fund’s net asset value (NAV)), trading volume data, continued use of auction preferred shares (where applicable), distribution rates and other relevant matters; |
| • | | The risks which the adviser and/or its affiliates incur in connection with the management and operation of the funds, including, among others, litigation, regulatory, entrepreneurial, and other business risks (and the associated costs of such risks); and |
| • | | The terms of each investment advisory agreement and sub-advisory agreement. |
During the various meetings of the Board and its committees over the course of the year leading up to the June 8, 2022 meeting, the Trustees received information from portfolio managers and other investment professionals of the advisers and sub-advisers of the funds regarding investment and performance matters, and considered various investment and trading strategies used in pursuing the funds’ investment objectives. The Trustees also received information regarding risk management techniques employed in connection with the management of the funds. The Board and its committees evaluated issues pertaining to industry and regulatory developments, compliance procedures, fund governance and other issues with respect to the funds, and received and participated in reports and presentations provided by Eaton Vance Management, Boston Management and Research and fund sub-advisers, with respect to such matters. In addition to the formal meetings of the Board and its committees, the Independent Trustees held regular teleconferences to discuss, among other topics, matters relating to the continuation of investment advisory agreements and sub-advisory agreements.
The Contract Review Committee was advised throughout the contract review process by Goodwin Procter LLP, independent legal counsel for the Independent Trustees. The members of the Contract Review Committee, with the advice of such counsel, exercised their own business judgment in determining the material factors to be considered in evaluating each investment advisory agreement and sub-advisory agreement and the weight to be given to each such factor. The conclusions reached with respect to each investment advisory agreement and sub-advisory agreement were based on a comprehensive evaluation of all the information provided and not any single factor. Moreover, each member of the Contract Review Committee may have placed varying emphasis on particular factors in reaching conclusions with respect to each investment advisory agreement and sub-advisory agreement. In evaluating each investment advisory agreement and sub-advisory agreement, including the fee structures and other terms contained in such agreements, the members of the Contract Review Committee were also informed by multiple years of analysis and discussion with the adviser and sub-adviser to each of the Eaton Vance Funds.
Results of the Contract Review Process
Based on its consideration of the foregoing, and such other information it deemed relevant, including the factors and conclusions described below, the Contract Review Committee concluded that the continuation of the investment advisory agreement between Eaton Vance Global Income Builder Fund (the “Fund”), as well as the investment advisory agreement between Global Income Builder Portfolio (the “Portfolio”), the portfolio in which the Fund invests, and Boston Management and Research (the “Adviser”), and the sub-advisory agreement between the Adviser and Eaton Vance Advisers International Ltd.
Eaton Vance
Global Income Builder Fund
October 31, 2022
Board of Trustees’ Contract Approval — continued
(the “Sub-adviser”), an affiliate of Eaton Vance Management, with respect to the Fund, as well as the sub-advisory agreement between the Adviser and the Sub-adviser with respect to the Portfolio, including their respective fee structures, are in the interests of shareholders and, therefore, recommended to the Board approval of each agreement. Based on the recommendation of the Contract Review Committee, the Board, including a majority of the Independent Trustees, voted to approve continuation of the investment advisory agreements and the sub-advisory agreements for the Fund and the Portfolio (collectively, the “investment advisory agreements”).
Nature, Extent and Quality of Services
In considering whether to approve the investment advisory agreements for the Fund and the Portfolio, the Board evaluated the nature, extent and quality of services provided to the Fund and the Portfolio by the Adviser and the Sub-adviser.
The Board considered the Adviser’s and the Sub-adviser’s management capabilities and investment processes in light of the types of investments held by the Fund and the Portfolio, including the education, experience and number of investment professionals and other personnel who provide portfolio management, investment research, and similar services to the Fund and the Portfolio, including recent changes to such personnel. Regarding the Adviser, the Board considered the Adviser’s responsibilities with respect to oversight of the Sub-adviser and coordinating activities in implementing the investment strategies of the Fund and the Portfolio. The Board also considered the Adviser’s in-house equity research capabilities and experience in managing funds that seek to maximize after-tax returns. With respect to the Sub-adviser, the Board considered the abilities and experience of the Sub-adviser’s investment professionals in investing in equity securities, including investing in both U.S. and foreign common stocks. In particular, the Board considered the abilities and experience of the Adviser’s and the Sub-adviser’s investment professionals in analyzing factors such as special considerations relevant to investing in dividend-paying common and preferred stocks and foreign markets. The Board considered the international investment capabilities of the Sub-adviser, which is based in London, and the benefits to the Fund of having portfolio management services involving investments in international equities provided by investment professionals located abroad. The Board also took into account the resources dedicated to portfolio management and other services, the compensation methods of the Adviser and other factors, including the reputation and resources of the Adviser to recruit and retain highly qualified research, advisory and supervisory investment professionals. In addition, the Board considered the time and attention devoted to the Eaton Vance Funds, including the Fund and the Portfolio, by senior management, as well as the infrastructure, operational capabilities and support staff in place to assist in the portfolio management and operations of the Fund and the Portfolio, including the provision of administrative services. The Board also considered the business-related and other risks to which the Adviser or its affiliates may be subject in managing the Fund and the Portfolio.
The Board noted that under the terms of the investment advisory agreement of the Fund, the Adviser may invest assets of the Fund directly in securities, for which it would receive a fee, or in the Portfolio, for which it receives no separate fee but for which the Adviser receives an advisory fee from the Portfolio.
The Board considered the compliance programs of the Adviser and relevant affiliates thereof, including the Sub-adviser. The Board considered compliance and reporting matters regarding, among other things, personal trading by investment professionals, disclosure of portfolio holdings, late trading, frequent trading, portfolio valuation, business continuity and the allocation of investment opportunities. The Board also considered the responses of the Adviser and its affiliates to requests in recent years from regulatory authorities, such as the Securities and Exchange Commission and the Financial Industry Regulatory Authority.
The Board considered other administrative services provided or overseen by Eaton Vance Management and its affiliates, including transfer agency and accounting services. The Board evaluated the benefits to shareholders of investing in a fund that is a part of a large fund complex offering exposure to a variety of asset classes and investment disciplines, as well as the ability, in many cases, to exchange an investment among different funds without incurring additional sales charges.
After consideration of the foregoing factors, among others, the Board concluded that the nature, extent and quality of services provided by the Adviser and the Sub-adviser, taken as a whole, are appropriate and consistent with the terms of the applicable investment advisory agreement.
Fund Performance
The Board compared the Fund’s investment performance to that of comparable funds identified by an independent data provider (the peer group), as well as appropriate benchmark indices and a customized peer group of similarly managed funds. The Board’s review included comparative performance data with respect to the Fund for the one-, three-, five- and ten-year periods ended December 31, 2021. In this regard, the Board noted that the performance of the Fund was higher than the median performance of the Fund’s peer group and custom peer group for the three-year period. The Board also noted that the performance of the Fund was lower than its primary benchmark and blended benchmark indexes for the three-year period. The Board concluded that the performance of the Fund was satisfactory.
Management Fees and Expenses
The Board considered contractual fee rates payable by the Portfolio and by the Fund for advisory and administrative services (referred to collectively as “management fees”). As part of its review, the Board considered the Fund’s management fees and total expense ratio for the one-year period ended December 31, 2021, as compared to those of comparable funds, before and after giving effect to any undertaking to waive fees or reimburse expenses. The Board also considered factors that had an impact on the Fund’s total expense ratio relative to comparable funds.
Eaton Vance
Global Income Builder Fund
October 31, 2022
Board of Trustees’ Contract Approval — continued
After considering the foregoing information, and in light of the nature, extent and quality of the services provided by the Adviser and the Sub-adviser, the Board concluded that the management fees charged for advisory and related services are reasonable.
Profitability and “Fall-Out” Benefits
The Board considered the level of profits realized by the Adviser and relevant affiliates thereof, including the Sub-adviser, in providing investment advisory and administrative services to the Fund, to the Portfolio and to all Eaton Vance Funds as a group. The Board considered the level of profits realized without regard to marketing support or other payments by the Adviser and its affiliates to third parties in respect of distribution or other services.
The Board concluded that, in light of the foregoing factors and the nature, extent and quality of the services rendered, the profits realized by the Adviser and its affiliates, including the Sub-adviser, are deemed not to be excessive.
The Board also considered direct or indirect fall-out benefits received by the Adviser and its affiliates, including the Sub-adviser, in connection with their respective relationships with the Fund and the Portfolio, including the benefits of research services that may be available to the Adviser or the Sub-adviser as a result of securities transactions effected for the Fund and the Portfolio and other investment advisory clients.
Economies of Scale
In reviewing management fees and profitability, the Board also considered the extent to which the Adviser and its affiliates, on the one hand, and the Fund and the Portfolio, on the other hand, can expect to realize benefits from economies of scale as the assets of the Fund and the Portfolio increase. The Board acknowledged the difficulty in accurately measuring the benefits resulting from economies of scale, if any, with respect to the management of any specific fund or group of funds. The Board reviewed data summarizing the increases and decreases in the assets of the Fund and of all Eaton Vance Funds as a group over various time periods, and evaluated the extent to which the total expense ratio of the Fund and the profitability of the Adviser and its affiliates may have been affected by such increases or decreases. Based upon the foregoing, the Board concluded that the Fund and the Portfolio currently share in the benefits from economies of scale, if any, when they are realized by the Adviser. The Board also concluded that the structure of the advisory fees, which include breakpoints at several asset levels, will allow the Fund and the Portfolio to continue to benefit from any economies of scale in the future.
Eaton Vance
Global Income Builder Fund
October 31, 2022
Liquidity Risk Management Program
The Fund has implemented a written liquidity risk management program (Program) and related procedures to manage its liquidity in accordance with Rule 22e-4 under the Investment Company Act of 1940, as amended (Liquidity Rule). The Liquidity Rule defines “liquidity risk” as the risk that a fund could not meet requests to redeem shares issued by the fund without significant dilution of the remaining investors’ interests in the fund. The Fund’s Board of Trustees/Directors has designated the investment adviser to serve as the administrator of the Program and the related procedures. The administrator has established a Liquidity Risk Management Oversight Committee (Committee) to perform the functions necessary to administer the Program. As part of the Program, the administrator is responsible for identifying illiquid investments and categorizing the relative liquidity of the Fund’s investments in accordance with the Liquidity Rule. Under the Program, the administrator assesses, manages, and periodically reviews the Fund’s liquidity risk, and is responsible for making certain reports to the Fund’s Board of Trustees/Directors and the Securities and Exchange Commission (SEC) regarding the liquidity of the Fund’s investments, and to notify the Board of Trustees/Directors and the SEC of certain liquidity events specified in the Liquidity Rule. The liquidity of the Fund’s portfolio investments is determined based on a number of factors including, but not limited to, relevant market, trading and investment-specific considerations under the Program.
At a meeting of the Fund’s Board of Trustees/Directors on June 7, 2022, the Committee provided a written report to the Fund’s Board of Trustees/Directors pertaining to the operation, adequacy, and effectiveness of implementation of the Program, as well as the operation of the highly liquid investment minimum (if applicable) for the period January 1, 2021 through December 31, 2021 (Review Period). The Program operated effectively during the Review Period, supporting the administrator’s ability to assess, manage and monitor Fund liquidity risk, including during periods of market volatility and net redemptions. During the Review Period, the Fund met redemption requests on a timely basis.
There can be no assurance that the Program will achieve its objectives in the future. Please refer to the Fund’s prospectus for more information regarding the Fund’s exposure to liquidity risk and other principal risks to which an investment in the Fund may be subject.
Eaton Vance
Global Income Builder Fund
October 31, 2022
Management and Organization
Fund Management. The Trustees of Eaton Vance Mutual Funds Trust (the Trust) and Global Income Builder Portfolio (the Portfolio) are responsible for the overall management and supervision of the Trust’s and the Portfolio’s affairs. The Board members and officers of the Trust and the Portfolio are listed below. Except as indicated, each individual has held the office shown or other offices in the same company for the last five years. Board members hold indefinite terms of office. Each Trustee holds office until his or her successor is elected and qualified, subject to a prior death, resignation, retirement, disqualification or removal. Under the terms of the Fund’s and the Portfolio’s current Trustee retirement policy, an Independent Trustee must retire and resign as a Trustee on the earlier of: (i) the first day of July following his or her 74th birthday; or (ii), with limited exception, December 31st of the 20th year in which he or she has served as a Trustee. However, if such retirement and resignation would cause the Fund and the Portfolio to be out of compliance with Section 16 of the 1940 Act or any other regulations or guidance of the SEC, then such retirement and resignation will not become effective until such time as action has been taken for the Fund and the Portfolio to be in compliance therewith. The “noninterested Trustees” consist of those Trustees who are not “interested persons” of the Trust and the Portfolio, as that term is defined under the 1940 Act. The business address of each Board member and officer is Two International Place, Boston, Massachusetts 02110. As used below, “BMR” refers to Boston Management and Research, “EVC” refers to Eaton Vance Corp., “EV” refers to EV LLC, “EVM” refers to Eaton Vance Management and “EVD” refers to Eaton Vance Distributors, Inc. EV is the trustee of each of EVM and BMR. Effective March 1, 2021, each of EVM, BMR, EVD and EV are indirect, wholly owned subsidiaries of Morgan Stanley. Each officer affiliated with EVM may hold a position with other EVM affiliates that is comparable to his or her position with EVM listed below. Each Trustee oversees 135 funds (with the exception of Mr. Bowser who oversees 110 funds) in the Eaton Vance Fund Complex (including both funds and portfolios in a hub and spoke structure).
| | | | | | |
| Name and Year of Birth | | Trust/Portfolio
Position(s) | | Length of Service | | Principal Occupation(s) and Other Directorships During Past Five Years and Other Relevant Experience |
| | | |
| Interested Trustee | | | | | | |
| | | |
Thomas E. Faust Jr. 1958 | | Trustee | | Since 2007 | | Chairman of Morgan Stanley Investment Management, Inc. (MSIM), member of the Board of Managers and President of EV (since 2021), Chief Executive Officer of EVM and BMR. Formerly, Chairman, Chief Executive Officer (2007-2021) and President (2006-2021) of EVC and Director of EVD (2007-2022). Mr. Faust is an interested person because of his positions with MSIM, BMR, EVM and EV, which are affiliates of the Trust and the Portfolio. Other Directorships. Formerly, Director of EVC (2007-2021) and Hexavest Inc. (investment management firm) (2012-2021). |
| | | |
| Noninterested Trustees | | | | | | |
| | | |
Alan C. Bowser(1) 1962 | | Trustee | | Since 2022 | | Chief Diversity Officer, Partner and a member of the Operating Committee, and formerly served as Senior Advisor on Diversity and Inclusion for the firm’s chief executive officer, Co-Head of the Americas Region, and Senior Client Advisor of Bridgewater Associates, an asset management firm (2011- present). Other Directorships. None. |
| | | |
Mark R. Fetting 1954 | | Trustee | | Since 2016 | | Private investor. Formerly held various positions at Legg Mason, Inc. (investment management firm) (2000-2012), including President, Chief Executive Officer, Director and Chairman (2008-2012), Senior Executive Vice President (2004-2008) and Executive Vice President (2001-2004). Formerly, President of Legg Mason family of funds (2001-2008). Formerly, Division President and Senior Officer of Prudential Financial Group, Inc. and related companies (investment management firm) (1991-2000). Other Directorships. None. |
| | | |
Cynthia E. Frost 1961 | | Trustee | | Since 2014 | | Private investor. Formerly, Chief Investment Officer of Brown University (university endowment) (2000-2012). Formerly, Portfolio Strategist for Duke Management Company (university endowment manager) (1995-2000). Formerly, Managing Director, Cambridge Associates (investment consulting company) (1989-1995). Formerly, Consultant, Bain and Company (management consulting firm) (1987-1989). Formerly, Senior Equity Analyst, BA Investment Management Company (1983-1985). Other Directorships. None. |
| | | |
George J. Gorman 1952 | | Chairperson
of the Board and Trustee | | Since 2021 (Chairperson) and 2014 (Trustee) | | Principal at George J. Gorman LLC (consulting firm). Formerly, Senior Partner at Ernst & Young LLP (a registered public accounting firm) (1974-2009). Other Directorships. None. |
Eaton Vance
Global Income Builder Fund
October 31, 2022
Management and Organization — continued
| | | | | | |
| Name and Year of Birth | | Trust/Portfolio
Position(s) | | Length of Service | | Principal Occupation(s) and Other Directorships During Past Five Years and Other Relevant Experience |
|
| Noninterested Trustees (continued) |
| | | |
Valerie A. Mosley 1960 | | Trustee | | Since 2014 | | Chairwoman and Chief Executive Officer of Valmo Ventures (a consulting and investment firm). Founder of Upward Wealth, Inc., dba BrightUp, a fintech platform. Formerly, Partner and Senior Vice President, Portfolio Manager and Investment Strategist at Wellington Management Company, LLP (investment management firm) (1992-2012). Formerly, Chief Investment Officer, PG Corbin Asset Management (1990-1992). Formerly worked in institutional corporate bond sales at Kidder Peabody (1986-1990). Other Directorships. Director of DraftKings, Inc. (digital sports entertainment and gaming company) (since September 2020). Director of Envestnet, Inc. (provider of intelligent systems for wealth management and financial wellness) (since 2018). Formerly, Director of Dynex Capital, Inc. (mortgage REIT) (2013-2020) and Director of Groupon, Inc. (e-commerce provider) (2020-2022). |
| | | |
Keith Quinton 1958 | | Trustee | | Since 2018 | | Private investor, researcher and lecturer. Formerly, Independent Investment Committee Member at New Hampshire Retirement System (2017-2021). Formerly, Portfolio Manager and Senior Quantitative Analyst at Fidelity Investments (investment management firm) (2001-2014). Other Directorships. Formerly, Director (2016-2021) and Chairman (2019-2021) of New Hampshire Municipal Bond Bank. |
| | | |
Marcus L. Smith 1966 | | Trustee | | Since 2018 | | Private investor and independent corporate director. Formerly, Chief Investment Officer, Canada (2012-2017), Chief Investment Officer, Asia (2010-2012), Director of Asian Research (2004-2010) and portfolio manager (2001-2017) at MFS Investment Management (investment management firm). Other Directorships. Director of First Industrial Realty Trust, Inc. (an industrial REIT) (since 2021). Director of MSCI Inc. (global provider of investment decision support tools) (since 2017). Formerly, Director of DCT Industrial Trust Inc. (logistics real estate company) (2017-2018). |
| | | |
Susan J. Sutherland 1957 | | Trustee | | Since 2015 | | Private investor. Director of Ascot Group Limited and certain of its subsidiaries (insurance and reinsurance) (since 2017). Formerly, Director of Hagerty Holding Corp. (insurance) (2015-2018) and Montpelier Re Holdings Ltd. (insurance and reinsurance) (2013-2015). Formerly, Associate, Counsel and Partner at Skadden, Arps, Slate, Meagher & Flom LLP (law firm) (1982-2013). Other Directorships. Director of Kairos Acquisition Corp. (insurance/InsurTech acquisition company) (since 2021). |
| | | |
Scott E. Wennerholm 1959 | | Trustee | | Since 2016 | | Private investor. Formerly, Trustee at Wheelock College (postsecondary institution) (2012-2018). Formerly, Consultant at GF Parish Group (executive recruiting firm) (2016-2017). Formerly, Chief Operating Officer and Executive Vice President at BNY Mellon Asset Management (investment management firm) (2005-2011). Formerly, Chief Operating Officer and Chief Financial Officer at Natixis Global Asset Management (investment management firm) (1997-2004). Formerly, Vice President at Fidelity Investments Institutional Services (investment management firm) (1994-1997). Other Directorships. None. |
| | | |
Nancy A. Wiser(1) 1967 | | Trustee | | Since 2022 | | Formerly, Executive Vice President and the Global Head of Operations at Wells Fargo Asset Management (2011-2021). Other Directorships. None. |
| | | | | | |
| Name and Year of Birth | | Trust/Portfolio
Position(s) | | Length of Service | | Principal Occupation(s) During Past Five Years |
|
| Principal Officers who are not Trustees |
| | | |
Eric A. Stein 1980 | | President of the Trust | | Since 2020 | | Vice President and Chief Investment Officer, Fixed Income of EVM and BMR. Prior to November 1, 2020, Mr. Stein was a co-Director of Eaton Vance’s Global Income Investments. Also Vice President of Calvert Research and Management (“CRM”). |
| | | |
Edward J. Perkin 1972 | | President of the Portfolio | | Since 2014 | | Chief Equity Investment Officer and Vice President of EVM and BMR since 2014. Also Vice President of CRM. |
| | | |
Deidre E. Walsh 1971 | | Vice President and Chief Legal Officer | | Since 2009 | | Vice President of EVM and BMR. Also Vice President of CRM. |
Eaton Vance
Global Income Builder Fund
October 31, 2022
Management and Organization — continued
| | | | | | |
| Name and Year of Birth | | Trust/Portfolio
Position(s) | | Length of Service | | Principal Occupation(s) During Past Five Years |
|
| Principal Officers who are not Trustees (continued) |
| | | |
James F. Kirchner 1967 | | Treasurer | | Since 2007 | | Vice President of EVM and BMR. Also Vice President of CRM. |
| | | |
Nicholas Di Lorenzo 1987 | | Secretary | | Since 2022 | | Formerly, associate (2012-2021) and counsel (2022) at Dechert LLP. |
| | | |
Richard F. Froio 1968 | | Chief Compliance Officer | | Since 2017 | | Vice President of EVM and BMR since 2017. Formerly, Deputy Chief Compliance Officer (Adviser/Funds) and Chief Compliance Officer (Distribution) at PIMCO (2012-2017) and Managing Director at BlackRock/Barclays Global Investors (2009-2012). |
| (1) | Mr. Bowser and Ms. Wiser began serving as Trustees effective April 4, 2022. |
The SAI for the Fund includes additional information about the Trustees and officers of the Fund and the Portfolio and can be obtained without charge on Eaton Vance’s website at www.eatonvance.com or by calling 1-800-262-1122.
Eaton Vance Funds
| | |
| Privacy Notice | | April 2021 |
| | |
| |
| FACTS | | WHAT DOES EATON VANCE DO WITH YOUR PERSONAL INFORMATION? |
| | | |
| |
| | |
| Why? | | Financial companies choose how they share your personal information. Federal law gives consumers the right to limit some but not all sharing. Federal law also requires us to tell you how we collect, share, and protect your personal information. Please read this notice carefully to understand what we do. |
| | |
| | | |
| What? | | The types of personal information we collect and share depend on the product or service you have with us. This information can include: ∎ Social Security number and income ∎ investment experience and risk tolerance ∎ checking account number and wire transfer instructions |
| | |
| | | |
| How? | | All financial companies need to share customers’ personal information to run their everyday business. In the section below, we list the reasons financial companies can share their customers’ personal information; the reasons Eaton Vance chooses to share; and whether you can limit this sharing. |
| | |
| | | |
| | | | |
Reasons we can share your
personal information | | Does Eaton Vance share? | | Can you limit this sharing? |
| For our everyday business purposes — such as to process your transactions, maintain your account(s), respond to court orders and legal investigations, or report to credit bureaus | | Yes | | No |
| For our marketing purposes — to offer our products and services to you | | Yes | | No |
| For joint marketing with other financial companies | | No | | We don’t share |
| For our investment management affiliates’ everyday business purposes — information about your transactions, experiences, and creditworthiness | | Yes | | Yes |
| For our affiliates’ everyday business purposes — information about your transactions and experiences | | Yes | | No |
| For our affiliates’ everyday business purposes — information about your creditworthiness | | No | | We don’t share |
| For our investment management affiliates to market to you | | Yes | | Yes |
| For our affiliates to market to you | | No | | We don’t share |
| For nonaffiliates to market to you | | No | | We don’t share |
| | |
| To limit our sharing | | Call toll-free 1-800-262-1122 or email: EVPrivacy@eatonvance.com Please note: If you are a new customer, we can begin sharing your information 30 days from the date we sent this notice. When you are no longer our customer, we continue to share your information as described in this notice. However, you can contact us at any time to limit our sharing. |
| | |
| | | |
| | |
| Questions? | | Call toll-free 1-800-262-1122 or email: EVPrivacy@eatonvance.com |
| | |
| | | |
Eaton Vance Funds
| | |
| Privacy Notice — continued | | April 2021 |
| | |
| Who we are |
| Who is providing this notice? | | Eaton Vance Management, Eaton Vance Distributors, Inc., Eaton Vance Trust Company, Eaton Vance Management (International) Limited, Eaton Vance Advisers International Ltd., Eaton Vance Global Advisors Limited, Eaton Vance Management’s Real Estate Investment Group, Boston Management and Research, Calvert Research and Management, Eaton Vance and Calvert Fund Families and our investment advisory affiliates (“Eaton Vance”) (see Investment Management Affiliates definition below) |
| What we do |
| How does Eaton Vance protect my personal information? | | To protect your personal information from unauthorized access and use, we use security measures that comply with federal law. These measures include computer safeguards and secured files and buildings. We have policies governing the proper handling of customer information by personnel and requiring third parties that provide support to adhere to appropriate security standards with respect to such information. |
| How does Eaton Vance collect my personal information? | | We collect your personal information, for example, when you ∎ open an account or make deposits or withdrawals from your account ∎ buy securities from us or make a wire transfer ∎ give us your contact information We also collect your personal information from others, such as credit bureaus, affiliates, or other companies. |
| Why can’t I limit all sharing? | | Federal law gives you the right to limit only ∎ sharing for affiliates’ everyday business purposes — information about your creditworthiness ∎ affiliates from using your information to market to you ∎ sharing for nonaffiliates to market to you State laws and individual companies may give you additional rights to limit sharing. See below for more on your rights under state law. |
| Definitions |
| Investment Management Affiliates | | Eaton Vance Investment Management Affiliates include registered investment advisers, registered broker- dealers, and registered and unregistered funds. Investment Management Affiliates does not include entities associated with Morgan Stanley Wealth Management, such as Morgan Stanley Smith Barney LLC and Morgan Stanley & Co. |
| Affiliates | | Companies related by common ownership or control. They can be financial and nonfinancial companies. ∎ Our affiliates include companies with a Morgan Stanley name and financial companies such as Morgan Stanley Smith Barney LLC and Morgan Stanley & Co. |
| Nonaffiliates | | Companies not related by common ownership or control. They can be financial and nonfinancial companies. ∎ Eaton Vance does not share with nonaffiliates so they can market to you. |
| Joint marketing | | A formal agreement between nonaffiliated financial companies that together market financial products or services to you. ∎ Eaton Vance doesn’t jointly market. |
| Other important information |
Vermont: Except as permitted by law, we will not share personal information we collect about Vermont residents with Nonaffiliates unless you provide us with your written consent to share such information. California: Except as permitted by law, we will not share personal information we collect about California residents with Nonaffiliates and we will limit sharing such personal information with our Affiliates to comply with California privacy laws that apply to us. |
Eaton Vance Funds
IMPORTANT NOTICES
Delivery of Shareholder Documents. The Securities and Exchange Commission (SEC) permits funds to deliver only one copy of shareholder documents, including prospectuses, proxy statements and shareholder reports, to fund investors with multiple accounts at the same residential or post office box address. This practice is often called “householding” and it helps eliminate duplicate mailings to shareholders. Eaton Vance, or your financial intermediary, may household the mailing of your documents indefinitely unless you instruct Eaton Vance, or your financial intermediary, otherwise. If you would prefer that your Eaton Vance documents not be householded, please contact Eaton Vance at 1-800-262-1122, or contact your financial intermediary. Your instructions that householding not apply to delivery of your Eaton Vance documents will typically be effective within 30 days of receipt by Eaton Vance or your financial intermediary.
Portfolio Holdings. Each Eaton Vance Fund and its underlying Portfolio(s) (if applicable) files a schedule of portfolio holdings on Part F to Form N-PORT with the SEC. Certain information filed on Form N-PORT may be viewed on the Eaton Vance website at www.eatonvance.com, by calling Eaton Vance at 1-800-262-1122 or in the EDGAR database on the SEC’s website at www.sec.gov.
Proxy Voting. From time to time, funds are required to vote proxies related to the securities held by the funds. The Eaton Vance Funds or their underlying Portfolios (if applicable) vote proxies according to a set of policies and procedures approved by the Funds’ and Portfolios’ Boards. You may obtain a description of these policies and procedures and information on how the Funds or Portfolios voted proxies relating to portfolio securities during the most recent 12-month period ended June 30, without charge, upon request, by calling 1-800-262-1122 and by accessing the SEC’s website at www.sec.gov.
This Page Intentionally Left Blank
This Page Intentionally Left Blank
Investment Adviser
Boston Management and Research
Two International Place
Boston, MA 02110
Administrator of Eaton Vance Global Income Builder Fund
Eaton Vance Management
Two International Place
Boston, MA 02110
Investment Sub-Adviser
Eaton Vance Advisers International Ltd.
125 Old Broad St.
London, EC2N 1AR
United Kingdom
Principal Underwriter*
Eaton Vance Distributors, Inc.
Two International Place
Boston, MA 02110
(617) 482-8260
Custodian
State Street Bank and Trust Company
State Street Financial Center, One Lincoln Street
Boston, MA 02111
Transfer Agent
BNY Mellon Investment Servicing (US) Inc.
Attn: Eaton Vance Funds
P.O. Box 9653
Providence, RI 02940-9653
(800) 262-1122
Independent Registered Public Accounting Firm
Deloitte & Touche LLP
200 Berkeley Street
Boston, MA 02116-5022
Fund Offices
Two International Place
Boston, MA 02110
| * | FINRA BrokerCheck. Investors may check the background of their Investment Professional by contacting the Financial Industry Regulatory Authority (FINRA). FINRA BrokerCheck is a free tool to help investors check the professional background of current and former FINRA-registered securities firms and brokers. FINRA BrokerCheck is available by calling 1-800-289-9999 and at www.FINRA.org. The FINRA BrokerCheck brochure describing this program is available to investors at www.FINRA.org. |
2634 10.31.22

Eaton Vance
Floating-Rate Fund
Annual Report
October 31, 2022

Commodity Futures Trading Commission Registration. The Commodity Futures Trading Commission (“CFTC”) has adopted regulations that subject registered investment companies and advisers to regulation by the CFTC if a fund invests more than a prescribed level of its assets in certain CFTC-regulated instruments (including futures, certain options and swap agreements) or markets itself as providing investment exposure to such instruments. The investment adviser has claimed an exclusion from the definition of “commodity pool operator” under the Commodity Exchange Act with respect to its management of the Fund. Accordingly, neither the Fund nor the adviser with respect to the operation of the Fund is subject to CFTC regulation. Because of its management of other strategies, the Fund’s adviser is registered with the CFTC as a commodity pool operator. The adviser is also registered as a commodity trading advisor.
Fund shares are not insured by the FDIC and are not deposits or other obligations of, or guaranteed by, any depository institution. Shares are subject to investment risks, including possible loss of principal invested.
This report must be preceded or accompanied by a current summary prospectus or prospectus. Before investing, investors should consider carefully the investment objective, risks, and charges and expenses of a mutual fund. This and other important information is contained in the summary prospectus and prospectus, which can be obtained from a financial intermediary. Prospective investors should read the prospectus carefully before investing. For further information, please call 1-800-262-1122.
Annual Report October 31, 2022
Eaton Vance
Floating-Rate Fund
Eaton Vance
Floating-Rate Fund
October 31, 2022
Management’s Discussion of Fund Performance†
Economic and Market Conditions
Amid increasing global concerns about inflation and rising interest rates, compounded by the economic fallout from Russia’s invasion of Ukraine, senior loans displayed their value as a portfolio diversifier by outperforming most U.S. fixed-income asset classes during the 12-month period ended October 31, 2022.
Although returns for the Morningstar® LSTA® US Leveraged Loan IndexSM (the Index), a broad measure of the asset class, were negative at -1.78% during the period, senior loans generally outperformed corporate bonds, corporate high yield bonds, municipal bonds, and U.S. government bonds -- and even outperformed the broad equity market S&P 500® Index.
In the opening month of the period, November 2021, a new COVID-19 variant caused equity and fixed-income prices to plummet worldwide. In contrast, senior loans rallied during the next two months. The ongoing rollout of vaccines, the reopening of U.S. businesses, and comparatively low yields in other fixed-income asset classes all provided tailwinds for the senior loan asset class.
In February 2022, however, the economic impact of Russia’s invasion of Ukraine became a tipping point for loan performance. While the U.S. Federal Reserve’s projection of multiple rate increases in 2022 was generally viewed as a positive sign for floating-rate loans, investors began to worry about the negative effects of supply-chain disruptions, higher commodity and labor expenses, rising debt service costs on loan issuers, and the potential for recession in both the U.S. and global economies.
Manifesting investor concerns, higher quality loans began to outperform lower quality loans. Loan prices, which had risen earlier in the period, declined each month from February through June 2022. After a brief summer rally amid hope that inflationary and recessionary fears were subsiding, loan prices resumed their downward slide in September before recovering modestly in October. While mutual fund inflows for floating-rate loans continued through April, flows turned negative in May and remained negative the rest of the period -- although demand for collateralized loan obligations from institutional investors stayed positive throughout the period. By period-end, loan prices had fallen to $92.20 from $98.55 at the start of the period.
Issuer fundamentals, however, remained a bright spot for senior loans during the period. While the trailing 12-month default rate inched higher -- from 0.20% at the beginning of the period to 0.83% at period-end -- it remained well below the market’s long-term average of 3.20%.
For the period as a whole, higher quality loans outperformed lower quality issues, with BBB-, BB-, B-, CCC- and D-rated (defaulted) loans within the Index returning 1.98%, 1.36%, -2.42%, -10.66%, and -37.83%, respectively.
Fund Performance
For the 12-month period ended October 31, 2022, Eaton Vance Floating-Rate Fund (the Fund) returned -3.78% for Class A shares at net asset value (NAV), underperforming its benchmark, the Morningstar® LSTA® US Leveraged Loan IndexSM (the Index), which returned -1.78%.
The Index is unmanaged, and returns do not reflect any applicable sales charges, commissions, or expenses.
The Fund’s out-of-Index allocation to secured high yield bonds was the principal detractor from performance versus the Index, as floating-rate loans outperformed their fixed-rate counterparts in the bond market during the period.
The Fund’s underweight position in BBB-rated loans -- the highest credit-rating category within the Index and best-performing category during the period -- hurt performance relative to the Index as well.
In contrast, contributors to Fund performance versus the Index included the Fund’s cash position during a period of negative loan performance, and an underweight position in CCC-rated loans, which underperformed the Index during the period.
See Endnotes and Additional Disclosures in this report.
Past performance is no guarantee of future results. Returns are historical and are calculated by determining the percentage change in net asset value (NAV) or offering price (as applicable) with all distributions reinvested. Furthermore, returns do not reflect the deduction of taxes that shareholders may have to pay on Fund distributions or upon the redemption of Fund shares. Investment return and principal value will fluctuate so that shares, when redeemed, may be worth more or less than their original cost. Performance for periods less than or equal to one year is cumulative. Performance is for the stated time period only; due to market volatility, current Fund performance may be lower or higher than the quoted return. For performance as of the most recent month-end, please refer to eatonvance.com.
Eaton Vance
Floating-Rate Fund
October 31, 2022
Performance
Portfolio Manager(s) Andrew N. Sveen, CFA, Ralph H. Hinckley, Jr., CFA and Jake T. Lemle, CFA
| | | | | | | | | | | | | | | | | | | | |
| % Average Annual Total Returns1,2 | | Class
Inception Date | | | Performance
Inception Date | | | One Year | | | Five Years | | | Ten Years | |
| | | | | |
Advisers Class at NAV | | | 02/07/2001 | | | | 02/07/2001 | | | | (3.70 | )% | | | 1.91 | % | | | 2.76 | % |
Class A at NAV | | | 05/05/2003 | | | | 02/07/2001 | | | | (3.78 | ) | | | 1.91 | | | | 2.76 | |
Class A with 3.25% Maximum Sales Charge | | | — | | | | — | | | | (6.94 | ) | | | 1.24 | | | | 2.41 | |
Class C at NAV | | | 02/01/2001 | | | | 02/07/2001 | | | | (4.43 | ) | | | 1.15 | | | | 2.15 | |
| | | | | |
Class C with 1% Maximum Deferred Sales Charge | | | — | | | | — | | | | (5.35 | ) | | | 1.15 | | | | 2.15 | |
Class I at NAV | | | 01/30/2001 | | | | 02/07/2001 | | | | (3.57 | ) | | | 2.16 | | | | 3.01 | |
Class R6 at NAV | | | 12/01/2016 | | | | 02/07/2001 | | | | (3.51 | ) | | | 2.22 | | | | 3.05 | |
|
| |
| | | | | |
Morningstar® LSTA® US Leveraged Loan IndexSM | | | — | | | | — | | | | (1.78 | )% | | | 3.07 | % | | | 3.61 | % |
| | | | | |
| % Total Annual Operating Expense Ratios3 | | Advisers Class | | | Class A | | | Class C | | | Class I | | | Class R6 | |
| | | | | |
| | | 1.03% | | | | 1.03% | | | | 1.79 | % | | | 0.78 | % | | | 0.73 | % |
Growth of $10,000
This graph shows the change in value of a hypothetical investment of $10,000 in Class A of of the Fund for the period indicated. For comparison, the same investment is shown in the indicated index.
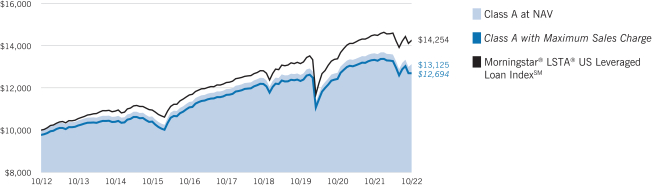
| | | | | | | | | | | | | | | | |
| Growth of Investment2 | | Amount Invested | | | Period Beginning | | | At NAV | | | With Maximum Sales Charge | |
| | | | |
Advisers Class | | | $10,000 | | | | 10/31/2012 | | | | $13,136 | | | | N.A. | |
Class C | | | $10,000 | | | | 10/31/2012 | | | | $12,375 | | | | N.A. | |
| | | | |
Class I, at minimum investment | | $ | 1,000,000 | | | | 10/31/2012 | | | $ | 1,345,390 | | | | N.A. | |
Class R6, at minimum investment | | $ | 5,000,000 | | | | 10/31/2012 | | | $ | 6,755,905 | | | | N.A. | |
See Endnotes and Additional Disclosures in this report.
Past performance is no guarantee of future results. Returns are historical and are calculated by determining the percentage change in net asset value (NAV) or offering price (as applicable) with all distributions reinvested. Furthermore, returns do not reflect the deduction of taxes that shareholders may have to pay on Fund distributions or upon the redemption of Fund shares. Investment return and principal value will fluctuate so that shares, when redeemed, may be worth more or less than their original cost. Performance for periods less than or equal to one year is cumulative. Performance is for the stated time period only; due to market volatility, current Fund performance may be lower or higher than the quoted return. For performance as of the most recent month-end, please refer to eatonvance.com.
Eaton Vance
Floating-Rate Fund
October 31, 2022
Fund Profile
Top 10 Issuers (% of total investments)1
| | | | |
Numericable Group SA | | | 0.9 | % |
| |
Finastra USA, Inc. | | | 0.9 | |
| |
Carnival Corporation | | | 0.9 | |
| |
Virgin Media SFA Finance Limited | | | 0.9 | |
| |
Ultimate Software Group Inc. (The) | | | 0.8 | |
| |
Uber Technologies, Inc. | | | 0.8 | |
| |
ICON Luxembourg S.a.r.l. | | | 0.8 | |
| |
Delta 2 (LUX) S.a.r.l. | | | 0.8 | |
| |
Hyland Software, Inc. | | | 0.8 | |
| |
American Airlines, Inc. | | | 0.8 | |
| |
Total | | | 8.4 | % |
Top 10 Sectors (% of total investments)1
| | | | |
Software | | | 15.3 | % |
| |
Health Care | | | 5.0 | |
| |
Diversified Telecommunication Services | | | 4.6 | |
| |
Hotels, Restaurants & Leisure | | | 4.3 | |
| |
Machinery | | | 3.8 | |
| |
Capital Markets | | | 3.6 | |
| |
Chemicals | | | 3.5 | |
| |
IT Services | | | 3.4 | |
| |
Trading Companies & Distributors | | | 2.6 | |
| |
Commercial Services & Supplies | | | 2.6 | |
| |
Total | | | 48.7 | % |
Credit Quality (% of bonds, loans and asset-backed securities)2

Footnotes:
Fund invests in an affiliated investment company (Portfolio) with the same objective(s) and policies as the Fund. References to investments are to the Portfolio’s holdings.
| 1 | Excludes cash and cash equivalents. |
| 2 | Credit ratings are categorized using S&P Global Ratings (“S&P”). Ratings, which are subject to change, apply to the creditworthiness of the issuers of the underlying securities and not to the Fund or its shares. Credit ratings measure the quality of a bond based on the issuer’s creditworthiness, with ratings ranging from AAA, being the highest, to D, being the lowest based on S&P’s measures. Ratings of BBB or higher by S&P are considered to be investment-grade quality. Credit ratings are based largely on the ratings agency’s analysis at the time of rating. The rating assigned to any particular security is not necessarily a reflection of the issuer’s current financial condition and does not necessarily reflect its assessment of the volatility of a security’s market value or of the liquidity of an investment in the security. Holdings designated as “Not Rated” (if any) are not rated by S&P. |
Eaton Vance
Floating-Rate Fund
October 31, 2022
Endnotes and Additional Disclosures
| † | The views expressed in this report are those of the portfolio manager(s) and are current only through the date stated at the top of this page. These views are subject to change at any time based upon market or other conditions, and Eaton Vance and the Fund(s) disclaim any responsibility to update such views. These views may not be relied upon as investment advice and, because investment decisions are based on many factors, may not be relied upon as an indication of trading intent on behalf of any Eaton Vance fund. This commentary may contain statements that are not historical facts, referred to as “forward-looking statements.” The Fund’s actual future results may differ significantly from those stated in any forward-looking statement, depending on factors such as changes in securities or financial markets or general economic conditions, the volume of sales and purchases of Fund shares, the continuation of investment advisory, administrative and service contracts, and other risks discussed from time to time in the Fund’s filings with the Securities and Exchange Commission. |
| 1 | Morningstar® LSTA® US Leveraged Loan IndexSM is an unmanaged index of the institutional leveraged loan market. Morningstar® LSTA® Leveraged Loan indices are a product of Morningstar, Inc. (“Morningstar”) and have been licensed for use. Morningstar® is a registered trademark of Morningstar licensed for certain use. Loan Syndications and Trading Association® and LSTA® are trademarks of the LSTA licensed for certain use by Morningstar, and further sublicensed by Morningstar for certain use. Neither Morningstar nor LSTA guarantees the accuracy and/or completeness of the Morningstar® LSTA® US Leveraged Loan IndexSM or any data included therein, and shall have no liability for any errors, omissions, or interruptions therein. Unless otherwise stated, index returns do not reflect the effect of any applicable sales charges, commissions, expenses, taxes or leverage, as applicable. It is not possible to invest directly in an index. Prior to August 29, 2022, the index name was S&P/LSTA Leveraged Loan Index. |
| 2 | Total Returns at NAV do not include applicable sales charges. If sales charges were deducted, the returns would be lower. Total Returns shown with maximum sales charge reflect the stated maximum sales charge. Unless otherwise stated, performance does not reflect the deduction of taxes on Fund distributions or redemptions of Fund shares. |
Effective November 5, 2020, Class C shares automatically convert to Class A shares eight years after purchase. The average annual total returns listed for Class C reflect conversion to Class A shares after eight years. Prior to November 5, 2020, Class C shares automatically converted to Class A shares ten years after purchase.
Performance prior to the inception date of a class may be linked to the performance of an older class of the Fund. This linked performance is adjusted for any applicable sales charge, but is not adjusted for class expense differences. If adjusted for such differences, the performance would be different. The performance of Class R6 is linked to Class I. Performance presented in the Financial Highlights included in the financial statements is not linked.
| 3 | Source: Fund prospectus. The expense ratios for the current reporting period can be found in the Financial Highlights section of this report. Performance reflects expenses waived and/or reimbursed, if applicable. Without such waivers and/or reimbursements, performance would have been lower. |
Fund profile subject to change due to active management.
Additional Information
S&P 500® Index is an unmanaged index of large-cap stocks commonly used as a measure of U.S. stock market performance. S&P Dow Jones Indices are a product of S&P Dow Jones Indices LLC (“S&P DJI”) and have been licensed for use. S&P® and S&P 500® are registered trademarks of S&P DJI; Dow Jones® is a registered trademark of Dow Jones Trademark Holdings LLC (“Dow Jones”); S&P DJI, Dow Jones and their respective affiliates do not sponsor, endorse, sell or promote the Fund, will not have any liability with respect thereto and do not have any liability for any errors, omissions, or interruptions of the S&P Dow Jones Indices.
Eaton Vance
Floating-Rate Fund
October 31, 2022
Fund Expenses
Example
As a Fund shareholder, you incur two types of costs: (1) transaction costs, including sales charges (loads) on purchases and redemption fees (if applicable); and (2) ongoing costs, including management fees; distribution and/or service fees; and other Fund expenses. This Example is intended to help you understand your ongoing costs (in dollars) of Fund investing and to compare these costs with the ongoing costs of investing in other mutual funds. The Example is based on an investment of $1,000 invested at the beginning of the period and held for the entire period (May 1, 2022 to October 31, 2022).
Actual Expenses
The first section of the table below provides information about actual account values and actual expenses. You may use the information in this section, together with the amount you invested, to estimate the expenses that you paid over the period. Simply divide your account value by $1,000 (for example, an $8,600 account value divided by $1,000 = 8.6), then multiply the result by the number in the first section under the heading entitled “Expenses Paid During Period” to estimate the expenses you paid on your account during this period.
Hypothetical Example for Comparison Purposes
The second section of the table below provides information about hypothetical account values and hypothetical expenses based on the actual Fund expense ratio and an assumed rate of return of 5% per year (before expenses), which is not the actual Fund return. The hypothetical account values and expenses may not be used to estimate the actual ending account balance or expenses you paid for the period. You may use this information to compare the ongoing costs of investing in your Fund and other funds. To do so, compare this 5% hypothetical example with the 5% hypothetical examples that appear in the shareholder reports of the other funds.
Please note that the expenses shown in the table are meant to highlight your ongoing costs only and do not reflect any transactional costs, such as sales charges (loads) or redemption fees (if applicable). Therefore, the second section of the table is useful in comparing ongoing costs only, and will not help you determine the relative total costs of owning different funds. In addition, if these transactional costs were included, your costs would be higher.
| | | | | | | | | | | | | | | | |
| | | Beginning
Account Value
(5/1/22) | | | Ending
Account Value
(10/31/22) | | | Expenses Paid
During Period*
(5/1/22 – 10/31/22) | | | Annualized
Expense
Ratio | |
| | | | |
Actual | | | | | | | | | | | | | | | | |
Advisers Class | | $ | 1,000.00 | | | $ | 966.80 | | | $ | 5.11 | | | | 1.03 | % |
Class A | | $ | 1,000.00 | | | $ | 966.50 | | | $ | 5.06 | | | | 1.02 | % |
Class C | | $ | 1,000.00 | | | $ | 963.10 | | | $ | 8.76 | | | | 1.77 | % |
Class I | | $ | 1,000.00 | | | $ | 968.00 | | | $ | 3.82 | | | | 0.77 | % |
Class R6 | | $ | 1,000.00 | | | $ | 968.40 | | | $ | 3.57 | | | | 0.72 | % |
| | | | | |
Hypothetical | | | | | | | | | | | | | | | | |
(5% return per year before expenses) | | | | | | | | | | | | | | | | |
Advisers Class | | $ | 1,000.00 | | | $ | 1,020.01 | | | $ | 5.24 | | | | 1.03 | % |
Class A | | $ | 1,000.00 | | | $ | 1,020.06 | | | $ | 5.19 | | | | 1.02 | % |
Class C | | $ | 1,000.00 | | | $ | 1,016.28 | | | $ | 9.00 | | | | 1.77 | % |
Class I | | $ | 1,000.00 | | | $ | 1,021.32 | | | $ | 3.92 | | | | 0.77 | % |
Class R6 | | $ | 1,000.00 | | | $ | 1,021.58 | | | $ | 3.67 | | | | 0.72 | % |
| * | Expenses are equal to the Fund’s annualized expense ratio for the indicated Class, multiplied by the average account value over the period, multiplied by 184/365 (to reflect the one-half year period). The Example assumes that the $1,000 was invested at the net asset value per share determined at the close of business on April 30, 2022. The Example reflects the expenses of both the Fund and the Portfolio. |
Eaton Vance
Floating-Rate Fund
October 31, 2022
Statement of Assets and Liabilities
| | | | |
| Assets | | October 31, 2022 | |
| |
Investment in Eaton Vance Floating Rate Portfolio, at value (identified cost $7,578,910,792) | | $ | 6,832,942,521 | |
| |
Receivable for Fund shares sold | | | 23,247,015 | |
| |
Total assets | | $ | 6,856,189,536 | |
|
| Liabilities | |
| |
Payable for Fund shares redeemed | | $ | 47,935,273 | |
| |
Distributions payable | | | 8,363,668 | |
| |
Payable to affiliates: | | | | |
| |
Administration fee | | | 884,089 | |
| |
Distribution and service fees | | | 267,168 | |
| |
Trustees’ fees | | | 42 | |
| |
Accrued expenses | | | 964,174 | |
| |
Total liabilities | | $ | 58,414,414 | |
| |
Net Assets | | $ | 6,797,775,122 | |
|
| Sources of Net Assets | |
| |
Paid-in capital | | $ | 8,085,598,393 | |
| |
Accumulated loss | | | (1,287,823,271 | ) |
| |
Net Assets | | $ | 6,797,775,122 | |
| |
| Advisers Class Shares | | | | |
| |
Net Assets | | $ | 77,083,802 | |
| |
Shares Outstanding | | | 9,461,375 | |
Net Asset Value, Offering Price and Redemption Price Per Share | | | | |
| |
(net assets ÷ shares of beneficial interest outstanding) | | $ | 8.15 | |
| |
| Class A Shares | | | | |
Net Assets | | $ | 707,665,671 | |
Shares Outstanding | | | 83,941,153 | |
Net Asset Value and Redemption Price Per Share | | | | |
| |
(net assets ÷ shares of beneficial interest outstanding) | | $ | 8.43 | |
Maximum Offering Price Per Share | | | | |
| |
(100 ÷ 96.75 of net asset value per share) | | $ | 8.71 | |
| |
| Class C Shares | | | | |
Net Assets | | $ | 117,293,551 | |
Shares Outstanding | | | 14,410,674 | |
Net Asset Value and Offering Price Per Share* | | | | |
| |
(net assets ÷ shares of beneficial interest outstanding) | | $ | 8.14 | |
| |
| Class I Shares | | | | |
Net Assets | | $ | 5,269,963,119 | |
Shares Outstanding | | | 646,343,525 | |
Net Asset Value, Offering Price and Redemption Price Per Share | | | | |
| |
(net assets ÷ shares of beneficial interest outstanding) | | $ | 8.15 | |
| | | | |
| | 7 | | See Notes to Financial Statements. |
Eaton Vance
Floating-Rate Fund
October 31, 2022
Statement of Assets and Liabilities — continued
| | | | |
| Class R6 Shares | | October 31, 2022 | |
| |
Net Assets | | $ | 625,768,979 | |
| |
Shares Outstanding | | | 76,680,434 | |
Net Asset Value, Offering Price and Redemption Price Per Share | | | | |
| |
(net assets ÷ shares of beneficial interest outstanding) | | $ | 8.16 | |
On sales of $100,000 or more, the offering price of Class A shares is reduced.
| * | Redemption price per share is equal to the net asset value less any applicable contingent deferred sales charge. |
| | | | |
| | 8 | | See Notes to Financial Statements. |
Eaton Vance
Floating-Rate Fund
October 31, 2022
Statement of Operations
| | | | |
| Investment Income | | Year Ended
October 31, 2022 | |
| |
Dividend income allocated from Portfolio | | $ | 5,000,383 | |
| |
Interest and other income allocated from Portfolio | | | 394,008,621 | |
| |
Expenses allocated from Portfolio | | | (43,621,987 | ) |
| |
Total investment income from Portfolio | | $ | 355,387,017 | |
| |
| Expenses | | | | |
| |
Administration fee | | $ | 12,133,800 | |
| |
Distribution and service fees: | | | | |
| |
Advisers Class | | | 319,127 | |
| |
Class A | | | 1,886,021 | |
| |
Class C | | | 1,296,893 | |
| |
Trustees’ fees and expenses | | | 500 | |
| |
Custodian fee | | | 62,000 | |
| |
Transfer and dividend disbursing agent fees | | | 4,229,535 | |
| |
Legal and accounting services | | | 153,633 | |
| |
Printing and postage | | | 335,347 | |
| |
Registration fees | | | 605,180 | |
| |
Miscellaneous | | | 64,125 | |
| |
Total expenses | | $ | 21,086,161 | |
| |
Net investment income | | $ | 334,300,856 | |
| |
| Realized and Unrealized Gain (Loss) from Portfolio | | | | |
| |
Net realized gain (loss): | | | | |
| |
Investment transactions | | $ | (100,746,454 | ) |
| |
Foreign currency transactions | | | 5,950,960 | |
| |
Forward foreign currency exchange contracts | | | 145,813,239 | |
| |
Net realized gain | | $ | 51,017,745 | |
| |
Change in unrealized appreciation (depreciation): | | | | |
| |
Investments | | $ | (695,659,431 | ) |
| |
Foreign currency | | | (1,776,533 | ) |
| |
Forward foreign currency exchange contracts | | | (8,441,270 | ) |
| |
Net change in unrealized appreciation (depreciation) | | $ | (705,877,234 | ) |
| |
Net realized and unrealized loss | | $ | (654,859,489 | ) |
| |
Net decrease in net assets from operations | | $ | (320,558,633 | ) |
| | | | |
| | 9 | | See Notes to Financial Statements. |
Eaton Vance
Floating-Rate Fund
October 31, 2022
Statements of Changes in Net Assets
| | | | | | | | |
| | | Year Ended October 31, | |
| Increase (Decrease) in Net Assets | | 2022 | | | 2021 | |
| | |
From operations: | | | | | | | | |
| | |
Net investment income | | $ | 334,300,856 | | | $ | 205,426,900 | |
| | |
Net realized gain | | | 51,017,745 | | | | 7,933,834 | |
| | |
Net change in unrealized appreciation (depreciation) | | | (705,877,234 | ) | | | 196,624,576 | |
| | |
Net increase (decrease) in net assets from operations | | $ | (320,558,633 | ) | | $ | 409,985,310 | |
| | |
Distributions to shareholders: | | | | | | | | |
| | |
Advisers Class | | $ | (4,757,274 | ) | | $ | (3,098,199 | ) |
| | |
Class A | | | (30,066,757 | ) | | | (22,475,238 | ) |
| | |
Class C | | | (4,158,164 | ) | | | (3,595,437 | ) |
| | |
Class I | | | (264,847,517 | ) | | | (160,896,994 | ) |
| | |
Class R6 | | | (32,476,524 | ) | | | (18,056,729 | ) |
| | |
Total distributions to shareholders | | $ | (336,306,236 | ) | | $ | (208,122,597 | ) |
| | |
Transactions in shares of beneficial interest: | | | | | | | | |
| | |
Advisers Class | | $ | (70,541,874 | ) | | $ | 59,719,360 | |
| | |
Class A | | | 15,620,342 | | | | 66,358,024 | |
| | |
Class C | | | (7,659,273 | ) | | | (60,673,387 | ) |
| | |
Class I | | | (205,000,386 | ) | | | 2,273,958,785 | |
| | |
Class R6 | | | (28,806,651 | ) | | | 315,209,426 | |
| | |
Net increase (decrease) in net assets from Fund share transactions | | $ | (296,387,842 | ) | | $ | 2,654,572,208 | |
Net increase (decrease) in net assets | | $ | (953,252,711 | ) | | $ | 2,856,434,921 | |
|
| Net Assets | |
| | |
At beginning of year | | $ | 7,751,027,833 | | | $ | 4,894,592,912 | |
| | |
At end of year | | $ | 6,797,775,122 | | | $ | 7,751,027,833 | |
| | | | |
| | 10 | | See Notes to Financial Statements. |
Eaton Vance
Floating-Rate Fund
October 31, 2022
Financial Highlights
| | | | | | | | | | | | | | | | | | | | |
| | | Advisers Class | |
| |
| | | Year Ended October 31, | |
| | | 2022 | | | 2021 | | | 2020 | | | 2019 | | | 2018 | |
| | | | | | |
Net asset value — Beginning of year | | $ | 8.810 | | | $ | 8.470 | | | $ | 8.740 | | | $ | 9.050 | | | $ | 9.010 | |
| | | | | |
| Income (Loss) From Operations | | | | | | | | | | | | | | | | | | | | |
| | | | | |
Net investment income(1) | | $ | 0.318 | | | $ | 0.268 | | | $ | 0.321 | | | $ | 0.411 | | | $ | 0.357 | |
| | | | | |
Net realized and unrealized gain (loss) | | | (0.639 | ) | | | 0.345 | | | | (0.267 | ) | | | (0.310 | ) | | | 0.036 | |
| | | | | |
Total income (loss) from operations | | $ | (0.321 | ) | | $ | 0.613 | | | $ | 0.054 | | | $ | 0.101 | | | $ | 0.393 | |
| | | | | |
| Less Distributions | | | | | | | | | | | | | | | | | | | | |
| | | | | |
From net investment income | | $ | (0.339 | ) | | $ | (0.273 | ) | | $ | (0.324 | ) | | $ | (0.411 | ) | | $ | (0.353 | ) |
| | | | | |
Total distributions | | $ | (0.339 | ) | | $ | (0.273 | ) | | $ | (0.324 | ) | | $ | (0.411 | ) | | $ | (0.353 | ) |
| | | | | |
Net asset value — End of year | | $ | 8.150 | | | $ | 8.810 | | | $ | 8.470 | | | $ | 8.740 | | | $ | 9.050 | |
| | | | | |
Total Return(2) | | | (3.70 | )% | | | 7.30 | % | | | 0.70 | % | | | 1.16 | % | | | 4.44 | % |
| | | | | |
| Ratios/Supplemental Data | | | | | | | | | | | | | | | | | | | | |
| | | | | |
Net assets, end of year (000’s omitted) | | $ | 77,084 | | | $ | 157,768 | | | $ | 94,411 | | | $ | 364,983 | | | $ | 556,125 | |
| | | | | |
Ratios (as a percentage of average daily net assets):(3) | | | | | | | | | | | | | | | | | | | | |
| | | | | |
Expenses | | | 1.01 | %(4) | | | 1.03 | % | | | 1.08 | % | | | 1.03 | % | | | 1.02 | % |
| | | | | |
Net investment income | | | 3.70 | % | | | 3.05 | % | | | 3.78 | % | | | 4.63 | % | | | 3.95 | % |
| | | | | |
Portfolio Turnover of the Portfolio | | | 27 | % | | | 26 | % | | | 28 | % | | | 16 | % | | | 30 | % |
| (1) | Computed using average shares outstanding. |
| (2) | Returns are historical and are calculated by determining the percentage change in net asset value with all distributions reinvested. |
| (3) | Includes the Fund’s share of the Portfolio’s allocated expenses. |
| (4) | Includes a reduction by the investment adviser of a portion of the Portfolio’s adviser fee due to the Portfolio’s investment in the Liquidity Fund (equal to less than 0.005% of average daily net assets for the year ended October 31, 2022). |
| | | | |
| | 11 | | See Notes to Financial Statements. |
Eaton Vance
Floating-Rate Fund
October 31, 2022
Financial Highlights — continued
| | | | | | | | | | | | | | | | | | | | |
| | | Class A | |
| |
| | | Year Ended October 31, | |
| | | 2022 | | | 2021 | | | 2020 | | | 2019 | | | 2018 | |
| | | | | | |
Net asset value — Beginning of year | | $ | 9.120 | | | $ | 8.770 | | | $ | 9.050 | | | $ | 9.360 | | | $ | 9.310 | |
| | | | | |
| Income (Loss) From Operations | | | | | | | | | | | | | | | | | | | | |
| | | | | |
Net investment income(1) | | $ | 0.349 | | | $ | 0.278 | | | $ | 0.322 | | | $ | 0.425 | | | $ | 0.365 | |
| | | | | |
Net realized and unrealized gain (loss) | | | (0.688 | ) | | | 0.354 | | | | (0.268 | ) | | | (0.310 | ) | | | 0.050 | |
| | | | | |
Total income (loss) from operations | | $ | (0.339 | ) | | $ | 0.632 | | | $ | 0.054 | | | $ | 0.115 | | | $ | 0.415 | |
| | | | | |
| Less Distributions | | | | | | | | | | | | | | | | | | | | |
| | | | | |
From net investment income | | $ | (0.351 | ) | | $ | (0.282 | ) | | $ | (0.334 | ) | | $ | (0.425 | ) | | $ | (0.365 | ) |
| | | | | |
Total distributions | | $ | (0.351 | ) | | $ | (0.282 | ) | | $ | (0.334 | ) | | $ | (0.425 | ) | | $ | (0.365 | ) |
| | | | | |
Net asset value — End of year | | $ | 8.430 | | | $ | 9.120 | | | $ | 8.770 | | | $ | 9.050 | | | $ | 9.360 | |
| | | | | |
Total Return(2) | | | (3.78 | )% | | | 7.27 | % | | | 0.79 | % | | | 1.17 | % | | | 4.42 | % |
| | | | | |
| Ratios/Supplemental Data | | | | | | | | | | | | | | | | | | | | |
| | | | | |
Net assets, end of year (000’s omitted) | | $ | 707,666 | | | $ | 751,136 | | | $ | 658,206 | | | $ | 788,125 | | | $ | 984,812 | |
| | | | | |
Ratios (as a percentage of average daily net assets):(3) | | | | | | | | | | | | | | | | | | | | |
| | | | | |
Expenses | | | 1.01 | %(4) | | | 1.03 | % | | | 1.07 | % | | | 1.02 | % | | | 1.02 | % |
| | | | | |
Net investment income | | | 3.96 | % | | | 3.06 | % | | | 3.68 | % | | | 4.63 | % | | | 3.90 | % |
| | | | | |
Portfolio Turnover of the Portfolio | | | 27 | % | | | 26 | % | | | 28 | % | | | 16 | % | | | 30 | % |
| (1) | Computed using average shares outstanding. |
| (2) | Returns are historical and are calculated by determining the percentage change in net asset value with all distributions reinvested and do not reflect the effect of sales charges. |
| (3) | Includes the Fund’s share of the Portfolio’s allocated expenses. |
| (4) | Includes a reduction by the investment adviser of a portion of the Portfolio’s adviser fee due to the Portfolio’s investment in the Liquidity Fund (equal to less than 0.005% of average daily net assets for the year ended October 31, 2022). |
| | | | |
| | 12 | | See Notes to Financial Statements. |
Eaton Vance
Floating-Rate Fund
October 31, 2022
Financial Highlights — continued
| | | | | | | | | | | | | | | | | | | | |
| | | Class C | |
| |
| | | Year Ended October 31, | |
| | | 2022 | | | 2021 | | | 2020 | | | 2019 | | | 2018 | |
| | | | | | |
Net asset value — Beginning of year | | $ | 8.800 | | | $ | 8.470 | | | $ | 8.730 | | | $ | 9.040 | | | $ | 8.990 | |
| | | | | |
| Income (Loss) From Operations | | | | | | | | | | | | | | | | | | | | |
| | | | | |
Net investment income(1) | | $ | 0.271 | | | $ | 0.203 | | | $ | 0.251 | | | $ | 0.343 | | | $ | 0.285 | |
| | | | | |
Net realized and unrealized gain (loss) | | | (0.656 | ) | | | 0.334 | | | | (0.251 | ) | | | (0.308 | ) | | | 0.050 | |
| | | | | |
Total income (loss) from operations | | $ | (0.385 | ) | | $ | 0.537 | | | $ | — | | | $ | 0.035 | | | $ | 0.335 | |
| | | | | |
| Less Distributions | | | | | | | | | | | | | | | | | | | | |
| | | | | |
From net investment income | | $ | (0.275 | ) | | $ | (0.207 | ) | | $ | (0.260 | ) | | $ | (0.345 | ) | | $ | (0.285 | ) |
| | | | | |
Total distributions | | $ | (0.275 | ) | | $ | (0.207 | ) | | $ | (0.260 | ) | | $ | (0.345 | ) | | $ | (0.285 | ) |
| | | | | |
Net asset value — End of year | | $ | 8.140 | | | $ | 8.800 | | | $ | 8.470 | | | $ | 8.730 | | | $ | 9.040 | |
| | | | | |
Total Return(2) | | | (4.43 | )% | | | 6.38 | % | | | 0.06 | % | | | 0.40 | % | | | 3.66 | % |
| | | | | |
| Ratios/Supplemental Data | | | | | | | | | | | | | | | | | | | | |
| | | | | |
Net assets, end of year (000’s omitted) | | $ | 117,294 | | | $ | 135,213 | | | $ | 189,138 | | | $ | 328,577 | | | $ | 585,693 | |
| | | | | |
Ratios (as a percentage of average daily net assets):(3) | | | | | | | | | | | | | | | | | | | | |
| | | | | |
Expenses | | | 1.76 | %(4) | | | 1.79 | % | | | 1.82 | % | | | 1.78 | % | | | 1.77 | % |
| | | | | |
Net investment income | | | 3.18 | % | | | 2.32 | % | | | 2.97 | % | | | 3.86 | % | | | 3.15 | % |
| | | | | |
Portfolio Turnover of the Portfolio | | | 27 | % | | | 26 | % | | | 28 | % | | | 16 | % | | | 30 | % |
| (1) | Computed using average shares outstanding. |
| (2) | Returns are historical and are calculated by determining the percentage change in net asset value with all distributions reinvested and do not reflect the effect of sales charges. |
| (3) | Includes the Fund’s share of the Portfolio’s allocated expenses. |
| (4) | Includes a reduction by the investment adviser of a portion of the Portfolio’s adviser fee due to the Portfolio’s investment in the Liquidity Fund (equal to less than 0.005% of average daily net assets for the year ended October 31, 2022). |
| | | | |
| | 13 | | See Notes to Financial Statements. |
Eaton Vance
Floating-Rate Fund
October 31, 2022
Financial Highlights — continued
| | | | | | | | | | | | | | | | | | | | |
| | | Class I | |
| |
| | | Year Ended October 31, | |
| | | 2022 | | | 2021 | | | 2020 | | | 2019 | | | 2018 | |
| | | | | | |
Net asset value — Beginning of year | | $ | 8.820 | | | $ | 8.480 | | | $ | 8.750 | | | $ | 9.060 | | | $ | 9.010 | |
| | | | | |
| Income (Loss) From Operations | | | | | | | | | | | | | | | | | | | | |
| | | | | |
Net investment income(1) | | $ | 0.356 | | | $ | 0.289 | | | $ | 0.335 | | | $ | 0.433 | | | $ | 0.377 | |
| | | | | |
Net realized and unrealized gain (loss) | | | (0.665 | ) | | | 0.346 | | | | (0.260 | ) | | | (0.309 | ) | | | 0.049 | |
| | | | | |
Total income (loss) from operations | | $ | (0.309 | ) | | $ | 0.635 | | | $ | 0.075 | | | $ | 0.124 | | | $ | 0.426 | |
| | | | | |
| Less Distributions | | | | | | | | | | | | | | | | | | | | |
| | | | | |
From net investment income | | $ | (0.361 | ) | | $ | (0.295 | ) | | $ | (0.345 | ) | | $ | (0.434 | ) | | $ | (0.376 | ) |
| | | | | |
Total distributions | | $ | (0.361 | ) | | $ | (0.295 | ) | | $ | (0.345 | ) | | $ | (0.434 | ) | | $ | (0.376 | ) |
| | | | | |
Net asset value — End of year | | $ | 8.150 | | | $ | 8.820 | | | $ | 8.480 | | | $ | 8.750 | | | $ | 9.060 | |
| | | | | |
Total Return(2) | | | (3.57 | )% | | | 7.56 | % | | | 0.95 | % | | | 1.41 | % | | | 4.81 | % |
| | | | | |
| Ratios/Supplemental Data | | | | | | | | | | | | | | | | | | | | |
| | | | | |
Net assets, end of year (000’s omitted) | | $ | 5,269,963 | | | $ | 5,988,270 | | | $ | 3,565,898 | | | $ | 4,985,629 | | | $ | 7,450,507 | |
| | | | | |
Ratios (as a percentage of average daily net assets):(3) | | | | | | | | | | | | | | | | | | | | |
| | | | | |
Expenses | | | 0.76 | %(4) | | | 0.78 | % | | | 0.82 | % | | | 0.77 | % | | | 0.77 | % |
| | | | | |
Net investment income | | | 4.18 | % | | | 3.29 | % | | | 3.95 | % | | | 4.88 | % | | | 4.17 | % |
| | | | | |
Portfolio Turnover of the Portfolio | | | 27 | % | | | 26 | % | | | 28 | % | | | 16 | % | | | 30 | % |
| (1) | Computed using average shares outstanding. |
| (2) | Returns are historical and are calculated by determining the percentage change in net asset value with all distributions reinvested. |
| (3) | Includes the Fund’s share of the Portfolio’s allocated expenses. |
| (4) | Includes a reduction by the investment adviser of a portion of the Portfolio’s adviser fee due to the Portfolio’s investment in the Liquidity Fund (equal to less than 0.005% of average daily net assets for the year ended October 31, 2022). |
| | | | |
| | 14 | | See Notes to Financial Statements. |
Eaton Vance
Floating-Rate Fund
October 31, 2022
Financial Highlights — continued
| | | | | | | | | | | | | | | | | | | | |
| | | Class R6 | |
| |
| | | Year Ended October 31, | |
| | | 2022 | | | 2021 | | | 2020 | | | 2019 | | | 2018 | |
| | | | | | |
Net asset value — Beginning of year | | $ | 8.830 | | | $ | 8.490 | | | $ | 8.760 | | | $ | 9.060 | | | $ | 9.020 | |
| | | | | |
| Income (Loss) From Operations | | | | | | | | | | | | | | | | | | | | |
| | | | | |
Net investment income(1) | | $ | 0.358 | | | $ | 0.293 | | | $ | 0.335 | | | $ | 0.437 | | | $ | 0.382 | |
| | | | | |
Net realized and unrealized gain (loss) | | | (0.662 | ) | | | 0.347 | | | | (0.254 | ) | | | (0.299 | ) | | | 0.039 | |
| | | | | |
Total income (loss) from operations | | $ | (0.304 | ) | | $ | 0.640 | | | $ | 0.081 | | | $ | 0.138 | | | $ | 0.421 | |
| | | | | |
| Less Distributions | | | | | | | | | | | | | | | | | | | | |
| | | | | |
From net investment income | | $ | (0.366 | ) | | $ | (0.300 | ) | | $ | (0.351 | ) | | $ | (0.438 | ) | | $ | (0.381 | ) |
| | | | | |
Total distributions | | $ | (0.366 | ) | | $ | (0.300 | ) | | $ | (0.351 | ) | | $ | (0.438 | ) | | $ | (0.381 | ) |
| | | | | |
Net asset value — End of year | | $ | 8.160 | | | $ | 8.830 | | | $ | 8.490 | | | $ | 8.760 | | | $ | 9.060 | |
| | | | | |
Total Return(2) | | | (3.51 | )% | | | 7.61 | % | | | 1.01 | % | | | 1.57 | % | | | 4.75 | % |
| | | | | |
| Ratios/Supplemental Data | | | | | | | | | | | | | | | | | | | | |
| | | | | |
Net assets, end of year (000’s omitted) | | $ | 625,769 | | | $ | 718,642 | | | $ | 386,940 | | | $ | 399,233 | | | $ | 251,945 | |
| | | | | |
Ratios (as a percentage of average daily net assets):(3) | | | | | | | | | | | | | | | | | | | | |
| | | | | |
Expenses | | | 0.71 | %(4) | | | 0.73 | % | | | 0.76 | % | | | 0.72 | % | | | 0.72 | % |
| | | | | |
Net investment income | | | 4.19 | % | | | 3.34 | % | | | 3.97 | % | | | 4.92 | % | | | 4.22 | % |
| | | | | |
Portfolio Turnover of the Portfolio | | | 27 | % | | | 26 | % | | | 28 | % | | | 16 | % | | | 30 | % |
| (1) | Computed using average shares outstanding. |
| (2) | Returns are historical and are calculated by determining the percentage change in net asset value with all distributions reinvested. |
| (3) | Includes the Fund’s share of the Portfolio’s allocated expenses. |
| (4) | Includes a reduction by the investment adviser of a portion of the Portfolio’s adviser fee due to the Portfolio’s investment in the Liquidity Fund (equal to less than 0.005% of average daily net assets for the year ended October 31, 2022). |
| | | | |
| | 15 | | See Notes to Financial Statements. |
Eaton Vance
Floating-Rate Fund
October 31, 2022
Notes to Financial Statements
1 Significant Accounting Policies
Eaton Vance Floating-Rate Fund (the Fund) is a diversified series of Eaton Vance Mutual Funds Trust (the Trust). The Trust is a Massachusetts business trust registered under the Investment Company Act of 1940, as amended (the 1940 Act), as an open-end management investment company. The Fund offers five classes of shares. Class A shares are generally sold subject to a sales charge imposed at time of purchase. Class C shares are sold at net asset value and are generally subject to a contingent deferred sales charge (see Note 5). Effective November 5, 2020, Class C shares automatically convert to Class A shares eight years after their purchase as described in the Fund’s prospectus. Advisers Class, Class I and Class R6 shares are sold at net asset value and are not subject to a sales charge. Each class represents a pro-rata interest in the Fund, but votes separately on class-specific matters and (as noted below) is subject to different expenses. Realized and unrealized gains and losses are allocated daily to each class of shares based on the relative net assets of each class to the total net assets of the Fund. Net investment income, other than class-specific expenses, is allocated daily to each class of shares based upon the ratio of the value of each class’s paid shares to the total value of all paid shares. Sub-accounting, recordkeeping and similar administrative fees payable to financial intermediaries, which are a component of transfer and dividend disbursing agent fees on the Statement of Operations, are not allocated to Class R6 shares. Each class of shares differs in its distribution plan and certain other class-specific expenses. The Fund invests all of its investable assets in interests in Eaton Vance Floating Rate Portfolio (the Portfolio), a Massachusetts business trust, having the same investment objective and policies as the Fund. The value of the Fund’s investment in the Portfolio reflects the Fund’s proportionate interest in the net assets of the Portfolio (84.3% at October 31, 2022). The performance of the Fund is directly affected by the performance of the Portfolio. The financial statements of the Portfolio, including the portfolio of investments, are included elsewhere in this report and should be read in conjunction with the Fund’s financial statements.
The following is a summary of significant accounting policies of the Fund. The policies are in conformity with accounting principles generally accepted in the United States of America (U.S. GAAP). The Fund is an investment company and follows accounting and reporting guidance in the Financial Accounting Standards Board (FASB) Accounting Standards Codification Topic 946.
A Investment Valuation — Valuation of securities by the Portfolio is discussed in Note 1A of the Portfolio’s Notes to Financial Statements, which are included elsewhere in this report.
B Income — The Fund’s net investment income or loss consists of the Fund’s pro-rata share of the net investment income or loss of the Portfolio, less all actual and accrued expenses of the Fund.
C Federal Taxes — The Fund’s policy is to comply with the provisions of the Internal Revenue Code applicable to regulated investment companies and to distribute to shareholders each year substantially all of its net investment income, and all or substantially all of its net realized capital gains. Accordingly, no provision for federal income or excise tax is necessary.
As of October 31, 2022, the Fund had no uncertain tax positions that would require financial statement recognition, de-recognition, or disclosure. The Fund files a U.S. federal income tax return annually after its fiscal year-end, which is subject to examination by the Internal Revenue Service for a period of three years from the date of filing.
D Expenses — The majority of expenses of the Trust are directly identifiable to an individual fund. Expenses which are not readily identifiable to a specific fund are allocated taking into consideration, among other things, the nature and type of expense and the relative size of the funds.
E Use of Estimates — The preparation of the financial statements in conformity with U.S. GAAP requires management to make estimates and assumptions that affect the reported amounts of assets and liabilities at the date of the financial statements and the reported amounts of income and expense during the reporting period. Actual results could differ from those estimates.
F Indemnifications — Under the Trust’s organizational documents, its officers and Trustees may be indemnified against certain liabilities and expenses arising out of the performance of their duties to the Fund. Under Massachusetts law, if certain conditions prevail, shareholders of a Massachusetts business trust (such as the Trust) could be deemed to have personal liability for the obligations of the Trust. However, the Trust’s Declaration of Trust contains an express disclaimer of liability on the part of Fund shareholders and the By-laws provide that the Trust shall assume, upon request by the shareholder, the defense on behalf of any Fund shareholders. Moreover, the By-laws also provide for indemnification out of Fund property of any shareholder held personally liable solely by reason of being or having been a shareholder for all loss or expense arising from such liability. Additionally, in the normal course of business, the Fund enters into agreements with service providers that may contain indemnification clauses. The Fund’s maximum exposure under these arrangements is unknown as this would involve future claims that may be made against the Fund that have not yet occurred.
G Other — Investment transactions are accounted for on a trade date basis.
Eaton Vance
Floating-Rate Fund
October 31, 2022
Notes to Financial Statements — continued
2 Distributions to Shareholders and Income Tax Information
The Fund declares dividends daily to shareholders of record at the time of declaration. Distributions are generally paid monthly. Distributions of realized capital gains are made at least annually. Distributions are declared separately for each class of shares. Shareholders may reinvest income and capital gain distributions in additional shares of the same class of the Fund at the net asset value as of the reinvestment date or, at the election of the shareholder, receive distributions in cash. Distributions to shareholders are determined in accordance with income tax regulations, which may differ from U.S. GAAP. As required by U.S. GAAP, only distributions in excess of tax basis earnings and profits are reported in the financial statements as a return of capital. Permanent differences between book and tax accounting relating to distributions are reclassified to paid-in capital. For tax purposes, distributions from short-term capital gains are considered to be from ordinary income.
The tax character of distributions declared for the years ended October 31, 2022 and October 31, 2021 was as follows:
| | | | | | | | |
| | | Year Ended October 31, | |
| | | 2022 | | | 2021 | |
| | |
Ordinary income | | $ | 336,306,236 | | | $ | 208,122,597 | |
During the year ended October 31, 2022, accumulated loss was increased by $13,335,940 and paid-in capital was increased by $13,335,940 due to the Fund’s use of equalization accounting. Tax equalization accounting allows the Fund to treat as a distribution that portion of redemption proceeds representing a redeeming shareholder’s portion of undistributed taxable income and net capital gains. These reclassifications had no effect on the net assets or net asset value per share of the Fund.
As of October 31, 2022, the components of distributable earnings (accumulated loss) on a tax basis were as follows:
| | | | |
| | |
Undistributed ordinary income | | $ | 6,403,552 | |
| |
Deferred capital losses | | | (544,665,987 | ) |
| |
Net unrealized depreciation | | | (741,197,168 | ) |
| |
Distributions payable | | | (8,363,668 | ) |
| |
Accumulated loss | | $ | (1,287,823,271 | ) |
At October 31, 2022, the Fund, for federal income tax purposes, had deferred capital losses of $544,665,987 which would reduce its taxable income arising from future net realized gains on investment transactions, if any, to the extent permitted by the Internal Revenue Code, and thus would reduce the amount of distributions to shareholders, which would otherwise be necessary to relieve the Fund of any liability for federal income or excise tax. The deferred capital losses are treated as arising on the first day of the Fund’s next taxable year and retain the same short-term or long-term character as when originally deferred. Of the deferred capital losses at October 31, 2022, $67,087,023 are short-term and $477,578,964 are long-term.
3 Investment Adviser Fee and Other Transactions with Affiliates
The investment adviser fee is earned by Eaton Vance Management (EVM), an indirect, wholly-owned subsidiary of Morgan Stanley, as compensation for investment advisory services rendered to the Fund. The fee is computed at an annual rate as a percentage of the Fund’s average daily net assets that are not invested in other investment companies for which EVM or its affiliates serve as investment adviser and receive an advisory fee as follows and is payable monthly:
| | | | |
| Average Daily Net Assets | | Annual Fee Rate | |
| |
Up to $1 billion | | | 0.5750 | % |
| |
$1 billion but less than $2 billion | | | 0.5250 | % |
| |
$2 billion but less than $5 billion | | | 0.4900 | % |
| |
$5 billion but less than $10 billion | | | 0.4600 | % |
| |
$10 billion but less than $15 billion | | | 0.4350 | % |
| |
$15 billion but less than $20 billion | | | 0.4150 | % |
| |
$20 billion but less than $25 billion | | | 0.4000 | % |
| |
$25 billion and over | | | 0.3900 | % |
Eaton Vance
Floating-Rate Fund
October 31, 2022
Notes to Financial Statements — continued
For the year ended October 31, 2022, the Fund incurred no investment adviser fee on such assets. To the extent that the Fund’s assets are invested in the Portfolio, the Fund is allocated its share of the Portfolio’s investment adviser fee. The Portfolio has engaged Boston Management and Research (BMR) to render investment advisory services. See Note 2 of the Portfolio’s Notes to Financial Statements which are included elsewhere in this report. The administration fee is earned by EVM as compensation for administrative services rendered to the Fund. The fee is computed at an annual rate of 0.15% of the Fund’s average daily net assets. For year ended October 31, 2022, the administration fee amounted to $12,133,800. EVM provides sub-transfer agency and related services to the Fund pursuant to a Sub-Transfer Agency Support Services Agreement. For the year ended October 31, 2022, EVM earned $260,107 from the Fund pursuant to such agreement, which is included in transfer and dividend disbursing agent fees on the Statement of Operations. The Fund was informed that Eaton Vance Distributors, Inc. (EVD), an affiliate of EVM and the Fund’s principal underwriter, received $31,174 as its portion of the sales charge on sales of Class A shares for the year ended October 31, 2022. The Fund was informed that Morgan Stanley affiliated broker-dealers, which may be deemed to be affiliates of EVM, BMR and EVD, also received a portion of the sales charge on sales of Class A shares for the year ended October 31, 2022 in the amount of $21,080. EVD also received distribution and service fees from Advisers Class, Class A and Class C shares (see Note 4) and contingent deferred sales charges (see Note 5).
Trustees and officers of the Fund who are members of EVM’s or BMR’s organizations receive remuneration for their services to the Fund out of the investment adviser fee. Certain officers and Trustees of the Fund and the Portfolio are officers of the above organizations.
4 Distribution Plans
The Fund has in effect distribution plans for Advisers Class shares and Class A shares (Advisers/Class A Plan) pursuant to Rule 12b-1 under the 1940 Act. Pursuant to the Advisers/Class A Plan, the Fund pays EVD a distribution and service fee of 0.25% per annum of its average daily net assets attributable to Advisers Class and Class A shares for distribution services and facilities provided to the Fund by EVD, as well as for personal services and/or the maintenance of shareholder accounts. Distribution and service fees paid or accrued to EVD for the year ended October 31, 2022 amounted to $319,127 for Advisers Class shares and $1,886,021 for Class A shares.
The Fund also has in effect a distribution plan for Class C shares (Class C Plan) pursuant to Rule 12b-1 under the 1940 Act. Pursuant to the Class C Plan, the Fund pays EVD amounts equal to 0.75% per annum of its average daily net assets attributable to Class C shares for providing ongoing distribution services and facilities to the Fund. For the year ended October 31, 2022, the Fund paid or accrued to EVD $972,670 for Class C shares.
Pursuant to the Class C Plan, the Fund also makes payments of service fees to EVD, financial intermediaries and other persons in amounts equal to 0.25% per annum of its average daily net assets attributable to Class C shares. Service fees paid or accrued are for personal services and/or the maintenance of shareholder accounts. They are separate and distinct from the sales commissions and distribution fees payable to EVD. Service fees paid or accrued for the year ended October 31, 2022 amounted to $324,223 for Class C shares.
Distribution and service fees are subject to the limitations contained in the Financial Industry Regulatory Authority Rule 2341(d).
5 Contingent Deferred Sales Charges
A contingent deferred sales charge (CDSC) of 1% generally is imposed on redemptions of Class C shares made within 12 months of purchase. Class A shares may be subject to a 0.75% (1% prior to April 29, 2022) CDSC if redeemed within 12 months (18 months prior to April 29, 2022) of purchase (depending on the circumstances of purchase). Generally, the CDSC is based upon the lower of the net asset value at date of redemption or date of purchase. No charge is levied on shares acquired by reinvestment of dividends or capital gain distributions. For the year ended October 31, 2022, the Fund was informed that EVD received approximately $187,000 and $22,000 of CDSCs paid by Class A and Class C shareholders, respectively.
6 Investment Transactions
For the year ended October 31, 2022, increases and decreases in the Fund’s investment in the Portfolio aggregated $1,658,368,424 and $2,280,876,910, respectively.
Eaton Vance
Floating-Rate Fund
October 31, 2022
Notes to Financial Statements — continued
7 Shares of Beneficial Interest
The Fund’s Declaration of Trust permits the Trustees to issue an unlimited number of full and fractional shares of beneficial interest (without par value). Such shares may be issued in a number of different series (such as the Fund) and classes. Transactions in Fund shares, including direct exchanges pursuant to share class conversions for all periods presented, were as follows:
| | | | | | | | | | | | | | | | |
| | | Year Ended
October 31, 2022 | | | Year Ended
October 31, 2021 | |
| | | Shares | | | Amount | | | Shares | | | Amount | |
Advisers Class | | | | | | | | | | | | | | | | |
| | | | |
Sales | | | 3,644,668 | | | $ | 31,551,820 | | | | 9,979,684 | | | $ | 87,888,506 | |
| | | | |
Issued to shareholders electing to receive payments of distributions in Fund shares | | | 554,744 | | | | 4,711,807 | | | | 346,535 | | | | 3,040,979 | |
| | | | |
Redemptions | | | (12,641,510 | ) | | | (106,805,501 | ) | | | (3,564,017 | ) | | | (31,210,125 | ) |
| | | | |
Net increase (decrease) | | | (8,442,098 | ) | | $ | (70,541,874 | ) | | | 6,762,202 | | | $ | 59,719,360 | |
Class A | | | | | | | | | | | | | | | | |
| | | | |
Sales | | | 25,542,048 | | | $ | 226,746,300 | | | | 28,484,095 | | | $ | 258,475,358 | |
| | | | |
Issued to shareholders electing to receive payments of distributions in Fund shares | | | 2,944,032 | | | | 25,655,161 | | | | 2,029,735 | | | | 18,433,463 | |
| | | | |
Redemptions | | | (26,921,633 | ) | | | (236,781,119 | ) | | | (23,202,459 | ) | | | (210,550,797 | ) |
| | | | |
Net increase | | | 1,564,447 | | | $ | 15,620,342 | | | | 7,311,371 | | | $ | 66,358,024 | |
Class C | | | | | | | | | | | | | | | | |
| | | | |
Sales | | | 4,108,247 | | | $ | 35,372,450 | | | | 3,205,694 | | | $ | 28,102,130 | |
| | | | |
Issued to shareholders electing to receive payments of distributions in Fund shares | | | 419,546 | | | | 3,528,094 | | | | 354,835 | | | | 3,108,113 | |
| | | | |
Redemptions | | | (5,477,117 | ) | | | (46,559,817 | ) | | | (10,542,675 | ) | | | (91,883,630 | ) |
| | | | |
Net decrease | | | (949,324 | ) | | $ | (7,659,273 | ) | | | (6,982,146 | ) | | $ | (60,673,387 | ) |
Class I | | | | | | | | | | | | | | | | |
| | | | |
Sales | | | 382,492,826 | | | $ | 3,292,754,189 | | | | 391,306,422 | | | $ | 3,438,504,240 | |
| | | | |
Issued to shareholders electing to receive payments of distributions in Fund shares | | | 24,345,368 | | | | 205,385,574 | | | | 14,079,304 | | | | 123,716,751 | |
| | | | |
Redemptions | | | (439,558,448 | ) | | | (3,703,140,149 | ) | | | (146,819,929 | ) | | | (1,288,262,206 | ) |
| | | | |
Net increase (decrease) | | | (32,720,254 | ) | | $ | (205,000,386 | ) | | | 258,565,797 | | | $ | 2,273,958,785 | |
Class R6 | | | | | | | | | | | | | | | | |
| | | | |
Sales | | | 53,221,812 | | | $ | 460,319,638 | | | | 48,919,110 | | | $ | 430,180,059 | |
| | | | |
Issued to shareholders electing to receive payments of distributions in Fund shares | | | 2,148,153 | | | | 18,135,563 | | | | 1,326,586 | | | | 11,666,525 | |
| | | | |
Redemptions | | | (60,111,113 | ) | | | (507,261,852 | ) | | | (14,412,574 | ) | | | (126,637,158 | ) |
| | | | |
Net increase (decrease) | | | (4,741,148 | ) | | $ | (28,806,651 | ) | | | 35,833,122 | | | $ | 315,209,426 | |
Eaton Vance
Floating-Rate Fund
October 31, 2022
Report of Independent Registered Public Accounting Firm
To the Trustees of Eaton Vance Mutual Funds Trust and Shareholders of Eaton Vance Floating-Rate Fund:
Opinion on the Financial Statements and Financial Highlights
We have audited the accompanying statement of assets and liabilities of Eaton Vance Floating-Rate Fund (the “Fund”) (one of the funds constituting Eaton Vance Mutual Funds Trust), as of October 31, 2022, the related statement of operations for the year then ended, the statements of changes in net assets for each of the two years in the period then ended, the financial highlights for each of the five years in the period then ended, and the related notes. In our opinion, the financial statements and financial highlights present fairly, in all material respects, the financial position of the Fund as of October 31, 2022, and the results of its operations for the year then ended, the changes in its net assets for each of the two years in the period then ended, and the financial highlights for each of the five years in the period then ended, in conformity with accounting principles generally accepted in the United States of America.
Basis for Opinion
These financial statements and financial highlights are the responsibility of the Fund’s management. Our responsibility is to express an opinion on the Fund’s financial statements and financial highlights based on our audits. We are a public accounting firm registered with the Public Company Accounting Oversight Board (United States) (PCAOB) and are required to be independent with respect to the Fund in accordance with the U.S. federal securities laws and the applicable rules and regulations of the Securities and Exchange Commission and the PCAOB.
We conducted our audits in accordance with the standards of the PCAOB. Those standards require that we plan and perform the audit to obtain reasonable assurance about whether the financial statements and financial highlights are free of material misstatement, whether due to error or fraud. The Fund is not required to have, nor were we engaged to perform, an audit of its internal control over financial reporting. As part of our audits, we are required to obtain an understanding of internal control over financial reporting but not for the purpose of expressing an opinion on the effectiveness of the Fund’s internal control over financial reporting. Accordingly, we express no such opinion.
Our audits included performing procedures to assess the risks of material misstatement of the financial statements and financial highlights, whether due to error or fraud, and performing procedures that respond to those risks. Such procedures included examining, on a test basis, evidence regarding the amounts and disclosures in the financial statements and financial highlights. Our audits also included evaluating the accounting principles used and significant estimates made by management, as well as evaluating the overall presentation of the financial statements and financial highlights. We believe that our audits provide a reasonable basis for our opinion.
/s/ Deloitte & Touche LLP
Boston, Massachusetts
December 20, 2022
We have served as the auditor of one or more Eaton Vance investment companies since 1959.
Eaton Vance
Floating-Rate Fund
October 31, 2022
Federal Tax Information (Unaudited)
The Form 1099-DIV you receive in February 2023 will show the tax status of all distributions paid to your account in calendar year 2022. Shareholders are advised to consult their own tax adviser with respect to the tax consequences of their investment in the Fund. As required by the Internal Revenue Code and/or regulations, shareholders must be notified regarding the status of qualified dividend income for individuals and 163(j) interest dividends.
Qualified Dividend Income. For the fiscal year ended October 31, 2022, the Fund designates approximately $926,562, or up to the maximum amount of such dividends allowable pursuant to the Internal Revenue Code, as qualified dividend income eligible for the reduced tax rate of 15%.
163(j) Interest Dividends. For the fiscal year ended October 31, 2022, the Fund designates 94.28% of distributions from net investment income as a 163(j) interest dividend.
Eaton Vance
Floating Rate Portfolio
October 31, 2022
Portfolio of Investments
| | | | | | | | | | | | |
| Asset-Backed Securities — 3.3% | |
| Security | | | | | Principal
Amount
(000’s omitted) | | | Value | |
| | | |
AGL CLO 17, Ltd., Series 2022-17A, Class E, 10.338%, (3 mo. SOFR + 6.35%), 1/21/35(1)(2) | | | | | | $ | 1,000 | | | $ | 832,224 | |
| | | |
Alinea CLO, Ltd.: | | | | | | | | | | | | |
| | | |
Series 2018-1A, Class D, 7.343%, (3 mo. USD LIBOR + 3.10%),
7/20/31(1)(2) | | | | | | | 2,500 | | | | 2,196,693 | |
| | | |
Series 2018-1A, Class E, 10.243%, (3 mo. USD LIBOR + 6.00%),
7/20/31(1)(2) | | | | | | | 3,000 | | | | 2,410,995 | |
| | | |
AMMC CLO 15, Ltd., Series 2014-15A, Class ERR, 10.989%, (3 mo. USD LIBOR + 6.91%), 1/15/32(1)(2) | | | | | | | 5,000 | | | | 3,919,760 | |
| | | |
AMMC CLO XII, Ltd., Series 2013-12A, Class ER, 9.092%, (3 mo. USD LIBOR + 6.18%), 11/10/30(1)(2) | | | | | | | 3,525 | | | | 2,743,021 | |
| | | |
Apidos CLO XX, Series 2015-20A, Class DR, 9.779%, (3 mo. USD LIBOR + 5.70%), 7/16/31(1)(2) | | | | | | | 2,375 | | | | 1,960,199 | |
| | | |
Ares LVlll CLO, Ltd., Series 2020-58A, Class ER, 10.564%, (3 mo. SOFR + 6.70%), 1/15/35(1)(2) | | | | | | | 3,000 | | | | 2,439,324 | |
| | | |
Ares XLIX CLO, Ltd.: | | | | | | | | | | | | |
| | | |
Series 2018-49A, Class D, 7.325%, (3 mo. USD LIBOR + 3.00%),
7/22/30(1)(2) | | | | | | | 2,500 | | | | 2,216,017 | |
| | | |
Series 2018-49A, Class E, 10.025%, (3 mo. USD LIBOR + 5.70%),
7/22/30(1)(2) | | | | | | | 3,500 | | | | 2,890,412 | |
| | | |
Ares XXXIIR CLO, Ltd., Series 2014-32RA, Class C, 5.805%, (3 mo. USD LIBOR + 2.90%), 5/15/30(1)(2) | | | | | | | 5,000 | | | | 4,323,625 | |
| | | |
Ares XXXVR CLO, Ltd., Series 2015-35RA, Class E, 9.779%, (3 mo. USD LIBOR + 5.70%), 7/15/30(1)(2) | | | | | | | 4,000 | | | | 3,249,960 | |
| | | |
Babson CLO, Ltd.: | | | | | | | | | | | | |
| | | |
Series 2015-1A, Class DR, 6.843%, (3 mo. USD LIBOR + 2.60%),
1/20/31(1)(2) | | | | | | | 2,500 | | | | 2,143,750 | |
| | | |
Series 2018-1A, Class C, 6.679%, (3 mo. USD LIBOR + 2.60%),
4/15/31(1)(2) | | | | | | | 3,500 | | | | 2,993,819 | |
| | | |
Bain Capital Credit CLO, Ltd.: | | | | | | | | | | | | |
| | | |
Series 2018-1A, Class D, 7.025%, (3 mo. USD LIBOR + 2.70%),
4/23/31(1)(2) | | | | | | | 5,000 | | | | 4,292,110 | |
| | | |
Series 2018-1A, Class E, 9.675%, (3 mo. USD LIBOR + 5.35%),
4/23/31(1)(2) | | | | | | | 3,000 | | | | 2,326,506 | |
| | | |
Battalion CLO XXII, Ltd., Series 2021-22A, Class E, 11.193%, (3 mo. USD LIBOR + 6.95%), 1/20/35(1)(2) | | | | | | | 1,750 | | | | 1,434,109 | |
| | | |
Battalion CLO XXIII, Ltd., Series 2022-23A, Class D, 6.083%, (3 mo. SOFR + 3.95%), 5/19/36(1)(2) | | | | | | | 3,500 | | | | 3,243,152 | |
| | | |
Benefit Street Partners CLO V-B, Ltd.: | | | | | | | | | | | | |
| | | |
Series 2018-5BA, Class C, 7.173%, (3 mo. USD LIBOR + 2.93%),
4/20/31(1)(2) | | | | | | | 5,000 | | | | 4,332,635 | |
| | | |
Series 2018-5BA, Class D, 10.193%, (3 mo. USD LIBOR + 5.95%),
4/20/31(1)(2) | | | | | | | 3,500 | | | | 2,867,620 | |
| | | |
Benefit Street Partners CLO VIII, Ltd., Series 2015-8A, Class DR, 9.843%, (3 mo. USD LIBOR + 5.60%), 1/20/31(1)(2) | | | | | | | 5,401 | | | | 4,273,152 | |
| | | | | | | | | | |
| Security | | | | Principal
Amount
(000’s omitted) | | | Value | |
| | | |
Benefit Street Partners CLO XIV, Ltd.,
Series 2018-14A, Class D, 6.843%, (3 mo. USD LIBOR + 2.60%), 4/20/31(1)(2) | | | | $ | 1,500 | | | $ | 1,288,166 | |
| | | |
Benefit Street Partners CLO XVI, Ltd.,
Series 2018-16A, Class E, 10.779%, (3 mo.
USD LIBOR + 6.70%), 1/17/32(1)(2) | | | | 2,250 | | | 1,902,560 | |
| | | |
Benefit Street Partners CLO XVII, Ltd.,
Series 2019-17A, Class ER, 10.429%, (3 mo.
USD LIBOR + 6.35%), 7/15/32(1)(2) | | | | 1,750 | | | 1,458,174 | |
| | | |
Benefit Street Partners CLO XXII, Ltd.,
Series 2020-22A, Class ER, 10.893%, (3 mo.
SOFR + 6.93%), 4/20/35(1)(2) | | | | 1,000 | | | 827,510 | |
| | | |
Benefit Street Partners CLO XXV, Ltd.,
Series 2021-25A, Class E, 10.929%, (3 mo.
USD LIBOR + 6.85%), 1/15/35(1)(2) | | | | 3,000 | | | 2,603,145 | |
| | | |
| Betony CLO 2, Ltd.: | | | | | | | | |
| | | |
Series 2018-1A, Class C, 7.315%, (3 mo. USD LIBOR + 2.90%), 4/30/31(1)(2) | | | | | 2,500 | | | | 2,181,535 | |
| | | |
Series 2018-1A, Class D, 10.065%, (3 mo. USD LIBOR + 5.65%), 4/30/31(1)(2) | | | | | 4,450 | | | | 3,533,932 | |
| | | |
BlueMountain CLO XXIV, Ltd., Series 2019-24A, Class ER, 11.083%, (3 mo. USD LIBOR + 6.84%), 4/20/34(1)(2) | | | | | 1,000 | | | | 813,847 | |
| | | |
BlueMountain CLO XXVI, Ltd., Series 2019-26A, Class ER, 11.373%, (3 mo. USD LIBOR + 7.13%), 10/20/34(1)(2) | | | | | 3,000 | | | | 2,501,094 | |
| | | |
BlueMountain CLO XXX, Ltd., Series 2020-30A, Class ER, 10.564%, (3 mo. SOFR + 6.70%), 4/15/35(1)(2) | | | | | 2,000 | | | | 1,583,188 | |
| | | |
BlueMountain CLO XXXV, Ltd., Series 2022-35A, Class E, 9.893%, (3 mo. SOFR + 7.75%), 7/22/35(1)(2) | | | | | 2,000 | | | | 1,735,462 | |
| | | |
| BlueMountain CLO, Ltd.: | | | | | | | | |
| | | |
Series 2016-3A, Class DR, 6.005%, (3 mo. USD LIBOR + 3.10%), 11/15/30(1)(2) | | | | | 1,500 | | | | 1,302,261 | |
| | | |
Series 2016-3A, Class ER, 8.855%, (3 mo. USD LIBOR + 5.95%), 11/15/30(1)(2) | | | | | 1,500 | | | | 1,164,126 | |
| | | |
Series 2018-1A, Class D, 7.465%, (3 mo. USD LIBOR + 3.05%), 7/30/30(1)(2) | | | | | 2,500 | | | | 2,126,600 | |
| | | |
Series 2018-1A, Class E, 10.365%, (3 mo. USD LIBOR + 5.95%), 7/30/30(1)(2) | | | | | 2,000 | | | | 1,528,400 | |
| | | |
Series 2021-33A, Class E, 9.814%, (3 mo. USD LIBOR + 6.83%), 11/20/34(1)(2) | | | | | 2,500 | | | | 2,090,870 | |
| | | |
| Canyon Capital CLO, Ltd.: | | | | | | | | |
| | | |
Series 2012-1RA, Class E, 9.779%, (3 mo. USD LIBOR + 5.70%), 7/15/30(1)(2) | | | | | 4,875 | | | | 3,809,369 | |
| | | |
Series 2016-1A, Class ER, 9.829%, (3 mo. USD LIBOR + 5.75%), 7/15/31(1)(2) | | | | | 4,000 | | | | 3,078,144 | |
| | | |
Series 2016-2A, Class ER, 10.079%, (3 mo. USD LIBOR + 6.00%), 10/15/31(1)(2) | | | | | 4,500 | | | | 3,478,288 | |
| | | |
Series 2017-1A, Class E, 10.329%, (3 mo. USD LIBOR + 6.25%), 7/15/30(1)(2) | | | | | 3,250 | | | | 2,569,083 | |
| | | | |
| | 22 | | See Notes to Financial Statements. |
Eaton Vance
Floating Rate Portfolio
October 31, 2022
Portfolio of Investments — continued
| | | | | | | | | | |
| Security | | | | Principal
Amount
(000’s omitted) | | | Value | |
| | | |
| Canyon Capital CLO, Ltd.: (continued) | | | | | | | | |
| | | |
Series 2018-1A, Class D, 6.979%, (3 mo. USD LIBOR + 2.90%), 7/15/31(1)(2) | | | | $ | 3,000 | | | $ | 2,598,006 | |
| | | |
Series 2018-1A, Class E, 9.829%, (3 mo. USD LIBOR + 5.75%), 7/15/31(1)(2) | | | | | 2,750 | | | | 2,168,977 | |
| | | |
Series 2019-2A, Class ER, 10.829%, (3 mo. USD LIBOR + 6.75%),
10/15/34(1)(2) | | | | | 1,500 | | | | 1,236,644 | |
| | | |
| Carlyle CLO C17, Ltd.: | | | | | | | | |
| | | |
Series C17A, Class CR, 7.215%, (3 mo. USD LIBOR + 2.80%), 4/30/31(1)(2) | | | | | 5,000 | | | | 4,414,415 | |
| | | |
Series C17A, Class DR, 10.415%, (3 mo. USD LIBOR + 6.00%), 4/30/31(1)(2) | | | | | 3,500 | | | | 2,837,838 | |
| | | |
| Carlyle Global Market Strategies CLO, Ltd.: | | | | | | | | |
| | | |
Series 2012-3A, Class CR2, 7.511%, (3 mo. USD LIBOR + 3.50%),
1/14/32(1)(2) | | | | | 2,500 | | | | 2,038,950 | |
| | | |
Series 2012-3A, Class DR2, 10.511%, (3 mo. USD LIBOR + 6.50%),
1/14/32(1)(2) | | | | | 1,500 | | | | 1,198,611 | |
| | | |
Series 2014-3RA, Class C, 7.308%, (3 mo. USD LIBOR + 2.95%),
7/27/31(1)(2) | | | | | 1,000 | | | | 859,225 | |
| | | |
Series 2014-3RA, Class D, 9.758%, (3 mo. USD LIBOR + 5.40%),
7/27/31(1)(2) | | | | | 2,150 | | | | 1,675,207 | |
| | | |
Series 2014-4RA, Class C, 6.979%, (3 mo. USD LIBOR + 2.90%),
7/15/30(1)(2) | | | | | 2,000 | | | | 1,714,230 | |
| | | |
Series 2014-4RA, Class D, 9.729%, (3 mo. USD LIBOR + 5.65%),
7/15/30(1)(2) | | | | | 3,500 | | | | 2,686,964 | |
| | | |
Carlyle US CLO, Ltd., Series 2019-4A, Class DR, 10.464%, (3 mo. SOFR + 6.60%), 4/15/35(1)(2) | | | | | 3,000 | | | | 2,341,932 | |
| | | |
CarVal CLO IV, Ltd., Series 2021-1A, Class E, 10.843%, (3 mo. USD LIBOR + 6.60%), 7/20/34(1)(2) | | | | | 1,000 | | | | 852,090 | |
| | | |
CIFC Funding, Ltd., Series 2022-4A, Class D, 6.074%, (3 mo. SOFR + 3.55%), 7/16/35(1)(2) | | | | | 1,750 | | | | 1,605,751 | |
| | | |
| Dryden CLO, Ltd.: | | | | | | | | |
| | | |
Series 2018-55A, Class D, 6.929%, (3 mo. USD LIBOR + 2.85%),
4/15/31(1)(2) | | | | | 1,500 | | | | 1,303,875 | |
| | | |
Series 2018-55A, Class E, 9.479%, (3 mo. USD LIBOR + 5.40%),
4/15/31(1)(2) | | | | | 2,000 | | | | 1,602,542 | |
| | | |
Series 2022-112A, Class E, 10.514%, (3 mo. SOFR + 7.78%), 8/15/34(1)(2) | | | | | 2,000 | | | | 1,834,140 | |
| | | |
| Dryden Senior Loan Fund: | | | | | | | | |
| | | |
Series 2015-41A, Class DR, 6.679%, (3 mo. USD LIBOR + 2.60%),
4/15/31(1)(2) | | | | | 5,000 | | | | 4,375,425 | |
| | | |
Series 2015-41A, Class ER, 9.379%, (3 mo. USD LIBOR + 5.30%),
4/15/31(1)(2) | | | | | 1,268 | | | | 1,015,382 | |
| | | |
Series 2016-42A, Class DR, 7.009%, (3 mo. USD LIBOR + 2.93%),
7/15/30(1)(2) | | | | | 2,500 | | | | 2,207,390 | |
| | | |
Series 2016-42A, Class ER, 9.629%, (3 mo. USD LIBOR + 5.55%),
7/15/30(1)(2) | | | | | 3,500 | | | | 2,874,553 | |
| | | |
Elmwood CLO 14, Ltd., Series 2022-1A, Class E, 10.313%, (3 mo. SOFR + 6.35%), 4/20/35(1)(2) | | | | | 1,950 | | | | 1,755,312 | |
| | | | | | | | | | |
| Security | | | | Principal
Amount
(000’s omitted) | | | Value | |
| | | |
Elmwood CLO 17, Ltd., Series 2022-4A, Class E, 9.244%, (3 mo. SOFR + 7.15%), 7/17/35(1)(2) | | | | $ | 2,250 | | | $ | 2,002,291 | |
| | | |
Galaxy XV CLO, Ltd., Series 2013-15A, Class ER, 10.724%, (3 mo. USD LIBOR + 6.65%), 10/15/30(1)(2) | | | | | 2,500 | | | | 2,023,443 | |
| | | |
| Galaxy XXV CLO, Ltd.: | | | | | | | | |
| | | |
Series 2018-25A, Class D, 7.458%, (3 mo. USD LIBOR + 3.10%), 10/25/31(1)(2) | | | | | 2,500 | | | | 2,211,837 | |
| | | |
Series 2018-25A, Class E, 10.308%, (3 mo. USD LIBOR + 5.95%), 10/25/31(1)(2) | | | | | 3,500 | | | | 2,826,271 | |
| | | |
Golub Capital Partners CLO 22B, Ltd.,
Series 2015-22A, Class ER, 10.243%, (3 mo.
USD LIBOR + 6.00%), 1/20/31(1)(2) | | | | 2,500 | | | 2,065,380 | |
| | | |
| Golub Capital Partners CLO 37B, Ltd.: | | | | | | | | |
| | | |
Series 2018-37A, Class D, 7.543%, (3 mo. USD LIBOR + 3.30%), 7/20/30(1)(2) | | | | | 4,000 | | | | 3,515,372 | |
| | | |
Series 2018-37A, Class E, 9.993%, (3 mo. USD LIBOR + 5.75%), 7/20/30(1)(2) | | | | | 4,750 | | | | 4,324,319 | |
| | | |
Golub Capital Partners CLO 53B, Ltd.,
Series 2021-53A, Class E, 10.943%, (3 mo.
USD LIBOR + 6.70%), 7/20/34(1)(2) | | | | 1,250 | | | 1,034,799 | |
| | | |
| Golub Capital Partners CLO 58B, Ltd., | | | | | | | | |
| | | |
Series 2021-58A, Class E, 11.168%, (3 mo. USD LIBOR + 6.81%), 1/25/35(1)(2) | | | | | 2,500 | | | | 2,057,463 | |
| | | |
Halseypoint CLO 5, Ltd., Series 2021-5A, Class E, 11.355%, (3 mo. USD LIBOR + 6.94%), 1/30/35(1)(2) | | | | | 2,000 | | | | 1,673,020 | |
| | | |
Harriman Park CLO, Ltd., Series 2020-1A, Class ER, 10.643%, (3 mo. USD LIBOR + 6.40%), 4/20/34(1)(2) | | | | | 1,000 | | | | 844,910 | |
| | | |
| ICG US CLO, Ltd.: | | | | | | | | |
| | | |
Series 2018-2A, Class D, 7.425%, (3 mo. USD LIBOR + 3.10%), 7/22/31(1)(2) | | | | | 2,000 | | | | 1,718,470 | |
| | | |
Series 2018-2A, Class E, 10.075%, (3 mo. USD LIBOR + 5.75%), 7/22/31(1)(2) | | | | | 3,000 | | | | 2,239,749 | |
| | | |
Madison Park Funding LIX, Ltd., Series 2021-59A, Class E, 10.794%, (3 mo. USD LIBOR + 6.60%), 1/18/34(1)(2) | | | | | 1,450 | | | | 1,239,750 | |
| | | |
Madison Park Funding XXV, Ltd., Series 2017-25A, Class D, 10.458%, (3 mo. USD LIBOR + 6.10%), 4/25/29(1)(2) | | | | | 1,500 | | | | 1,291,446 | |
| | | |
Madison Park Funding XXXVI, Ltd., Series 2019-36A, Class ER, 10.914%, (3 mo. SOFR + 7.05%), 4/15/35(1)(2) | | | | | 2,500 | | | | 2,159,505 | |
| | | |
Marble Point CLO XXIV, Ltd., Series 2022-1A, Class D1, 8.203%, (3 mo. SOFR + 4.24%), 4/20/35(1)(2) | | | | | 2,000 | | | | 1,823,490 | |
| | | |
| Neuberger Berman CLO XXII, Ltd.: | | | | | | | | |
| | | |
Series 2016-22A, Class DR, 7.179%, (3 mo. USD LIBOR + 3.10%), 10/17/30(1)(2) | | | | | 2,500 | | | | 2,232,140 | |
| | | |
Series 2016-22A, Class ER, 10.139%, (3 mo. USD LIBOR + 6.06%), 10/17/30(1)(2) | | | | | 3,000 | | | | 2,543,190 | |
| | | | |
| | 23 | | See Notes to Financial Statements. |
Eaton Vance
Floating Rate Portfolio
October 31, 2022
Portfolio of Investments — continued
| | | | | | | | | | |
| Security | | | | Principal
Amount
(000’s omitted) | | | Value | |
| | | |
Neuberger Berman Loan Advisers CLO 28, Ltd., Series 2018-28A, Class E, 9.843%, (3 mo. USD LIBOR + 5.60%),
4/20/30(1)(2) | | | | $ | 1,950 | | | $ | 1,622,985 | |
| | | |
| Neuberger Berman Loan Advisers CLO 30, Ltd.: | | | | | | | | |
| | | |
Series 2018-30A, Class DR, 7.093%, (3 mo. USD LIBOR + 2.85%),
1/20/31(1)(2) | | | | | 2,500 | | | | 2,214,132 | |
| | | |
Series 2018-30A, Class ER, 10.443%, (3 mo. USD LIBOR + 6.20%),
1/20/31(1)(2) | | | | | 1,000 | | | | 858,181 | |
| | | |
| Neuberger Berman Loan Advisers CLO 48, Ltd., | | | | | | | | |
| | | |
Series 2022-48A, Class E, 10.56%, (3 mo. SOFR + 6.50%), 4/25/36(1)(2) | | | | | 3,200 | | | | 2,735,840 | |
| | | |
| OCP CLO, Ltd.: | | | | | | | | |
| | | |
Series 2022-24A, Class D, 5.461%, (3 mo. SOFR + 3.80%), 7/20/35(1)(2) | | | | | 500 | | | | 454,612 | |
| | | |
Series 2022-24A, Class E, 9.081%, (3 mo. SOFR + 7.42%), 7/20/35(1)(2) | | | | | 1,000 | | | | 858,601 | |
| | | |
| Palmer Square CLO, Ltd.: | | | | | | | | |
| | | |
Series 2013-2A, Class DRR, 9.929%, (3 mo. USD LIBOR + 5.85%),
10/17/31(1)(2) | | | | | 3,000 | | | | 2,536,680 | |
| | | |
Series 2015-1A, Class DR4, 9.484%, (3 mo. USD LIBOR + 6.50%),
5/21/34(1)(2) | | | | | 2,000 | | | | 1,700,194 | |
| | | |
Series 2018-1A, Class C, 6.694%, (3 mo. USD LIBOR + 2.50%), 4/18/31(1)(2) | | | | | 3,000 | | | | 2,644,785 | |
| | | |
Series 2018-1A, Class D, 9.344%, (3 mo. USD LIBOR + 5.15%), 4/18/31(1)(2) | | | | | 2,000 | | | | 1,656,110 | |
| | | |
Series 2018-2A, Class D, 9.679%, (3 mo. USD LIBOR + 5.60%), 7/16/31(1)(2) | | | | | 2,000 | | | | 1,718,734 | |
| | | |
Series 2021-2A, Class E, 10.429%, (3 mo. USD LIBOR + 6.35%),
7/15/34(1)(2) | | | | | 1,000 | | | | 886,353 | |
| | | |
Series 2022-1A, Class E, 10.313%, (3 mo. SOFR + 6.35%), 4/20/35(1)(2) | | | | | 2,000 | | | | 1,725,646 | |
| | | |
Series 2022-3A, Class E, 11.274%, (3 mo. SOFR + 7.98%), 7/20/35(1)(2) | | | | | 2,250 | | | | 2,125,868 | |
| | | |
RAD CLO 5, Ltd., Series 2019-5A, Class E, 11.025%, (3 mo. USD LIBOR + 6.70%), 7/24/32(1)(2) | | | | | 1,750 | | | | 1,466,325 | |
| | | |
RAD CLO 14, Ltd., Series 2021-14A, Class E, 10.579%, (3 mo. USD LIBOR + 6.50%), 1/15/35(1)(2) | | | | | 950 | | | | 773,088 | |
| | | |
| Regatta XIII Funding, Ltd.: | | | | | | | | |
| | | |
Series 2018-2A, Class C, 7.179%, (3 mo. USD LIBOR + 3.10%), 7/15/31(1)(2) | | | | | 2,500 | | | | 2,203,268 | |
| | | |
Series 2018-2A, Class D, 10.029%, (3 mo. USD LIBOR + 5.95%),
7/15/31(1)(2) | | | | | 5,000 | | | | 4,032,770 | |
| | | |
| Regatta XIV Funding, Ltd.: | | | | | | | | |
| | | |
Series 2018-3A, Class D, 7.558%, (3 mo. USD LIBOR + 3.20%),
10/25/31(1)(2) | | | | | 2,500 | | | | 2,206,957 | |
| | | |
Series 2018-3A, Class E, 10.308%, (3 mo. USD LIBOR + 5.95%), 10/25/31(1)(2) | | | | | 4,500 | | | | 3,618,648 | |
| | | |
Regatta XV Funding, Ltd., Series 2018-4A, Class D, 10.858%, (3 mo. USD LIBOR + 6.50%), 10/25/31(1)(2) | | | | | 3,875 | | | | 3,111,687 | |
| | | |
| Upland CLO, Ltd.: | | | | | | | | |
| | | |
Series 2016-1A, Class CR, 7.143%, (3 mo. USD LIBOR + 2.90%),
4/20/31(1)(2) | | | | | 4,500 | | | | 3,899,839 | |
| | | | | | | | | | | | |
| Security | | | | | Principal
Amount
(000’s omitted) | | | Value | |
| | | |
| Upland CLO, Ltd.: (continued) | | | | | | | | | |
| | | |
Series 2016-1A, Class DR, 10.143%, (3 mo. USD LIBOR + 5.90%), 4/20/31(1)(2) | | | | | | $ | 4,625 | | | $ | 3,694,686 | |
| | | |
| Vibrant CLO IX, Ltd.: | | | | | | | | | |
| | | |
Series 2018-9A, Class C, 7.443%, (3 mo. USD LIBOR + 3.20%), 7/20/31(1)(2) | | | | | | | 2,500 | | | | 2,083,450 | |
| | | |
Series 2018-9A, Class D, 10.493%, (3 mo. USD LIBOR + 6.25%), 7/20/31(1)(2) | | | | | | | 3,500 | | | | 2,453,027 | |
| | | |
| Vibrant CLO X, Ltd.: | | | | | | | | | |
| | | |
Series 2018-10A, Class C, 7.493%, (3 mo. USD LIBOR + 3.25%), 10/20/31(1)(2) | | | | | | | 5,000 | | | | 4,156,205 | |
| | | |
Series 2018-10A, Class D, 10.433%, (3 mo. USD LIBOR + 6.19%), 10/20/31(1)(2) | | | | | | | 5,000 | | | | 3,645,185 | |
| | | |
| Voya CLO, Ltd.: | | | | | | | | | |
| | | |
Series 2015-3A, Class CR, 7.393%, (3 mo. USD LIBOR + 3.15%), 10/20/31(1)(2) | | | | | | | 2,500 | | | | 2,065,483 | |
| | | |
Series 2015-3A, Class DR, 10.443%, (3 mo. USD LIBOR + 6.20%), 10/20/31(1)(2) | | | | | | | 5,500 | | | | 3,974,866 | |
| | | |
Series 2016-3A, Class CR, 7.444%, (3 mo. USD LIBOR + 3.25%), 10/18/31(1)(2) | | | | | | | 2,000 | | | | 1,573,884 | |
| | | |
Series 2016-3A, Class DR, 10.274%, (3 mo. USD LIBOR + 6.08%), 10/18/31(1)(2) | | | | | | | 3,375 | | | | 2,472,660 | |
| | | |
Series 2018-1A, Class C, 6.827%, (3 mo. USD LIBOR + 2.60%), 4/19/31(1)(2) | | | | | | | 5,000 | | | | 4,254,190 | |
| | | |
Series 2018-2A, Class E, 9.329%, (3 mo. USD LIBOR + 5.25%), 7/15/31(1)(2) | | | | | | | 2,500 | | | | 1,930,378 | |
| | | |
| Webster Park CLO, Ltd.: | | | | | | | | | |
| | | |
Series 2015-1A, Class CR, 7.143%, (3 mo. USD LIBOR + 2.90%), 7/20/30(1)(2) | | | | | | | 2,000 | | | | 1,764,840 | |
| | | |
Series 2015-1A, Class DR, 9.743%, (3 mo. USD LIBOR + 5.50%), 7/20/30(1)(2) | | | | | | | 2,500 | | | | 2,049,573 | |
| | | |
| Wellfleet CLO, Ltd.: | | | | | | | | | |
| | | |
Series 2021-1A, Class D, 7.743%, (3 mo. USD LIBOR + 3.50%), 4/20/34(1)(2) | | | | | | | 1,200 | | | | 1,048,104 | |
| | | |
Series 2021-3A, Class E, 11.179%, (3 mo. USD LIBOR + 7.10%), 1/15/35(1)(2) | | | | | | | 950 | | | | 787,360 | |
| | | |
Series 2022-1A, Class D, 8.004%, (3 mo. SOFR + 4.14%), 4/15/34(1)(2) | | | | | | | 1,000 | | | | 901,800 | |
| | | |
Series 2022-1A, Class E, 11.724%, (3 mo. SOFR + 7.86%), 4/15/34(1)(2) | | | | | | | 2,000 | | | | 1,774,440 | |
| | | |
Total Asset-Backed Securities
(identified cost $323,247,901) | | | | | | | | | | $ | 269,370,575 | |
| | | |
| Common Stocks — 0.7% | | | | | | | | | | | | |
| Security | | | | | Shares | | | Value | |
| | | |
| Aerospace and Defense — 0.1% | | | | | | | | | |
| | | |
IAP Global Services, LLC(3)(4)(5)(6) | | | | | | | 950 | | | $ | 4,055,113 | |
| | | |
IAP Global Services, LLC(3)(4)(5) | | | | | | | 1,627 | | | | 4,630,051 | |
| | | |
| | | | | | | | | | | $ | 8,685,164 | |
| | | | |
| | 24 | | See Notes to Financial Statements. |
Eaton Vance
Floating Rate Portfolio
October 31, 2022
Portfolio of Investments — continued
| | | | | | | | | | | | |
| Security | | | | | Shares | | | Value | |
|
| Containers and Glass Products — 0.0%(7) | |
| | | |
LG Newco Holdco, Inc., Class A(5)(6) | | | | | | | 250,979 | | | $ | 3,220,889 | |
| | | |
| | | | | | | | | | | $ | 3,220,889 | |
|
| Electronics/Electrical — 0.0%(7) | |
| | | |
Skillsoft Corp.(5)(6) | | | | | | | 893,525 | | | $ | 1,599,410 | |
| | | |
| | | | | | | | | | | $ | 1,599,410 | |
|
| Health Care — 0.1% | |
| | | |
Akorn Holding Company, LLC, Class A(5)(6) | | | | | | | 705,631 | | | $ | 4,233,786 | |
| | | |
| | | | | | | | | | | $ | 4,233,786 | |
|
| Investment Companies — 0.1% | |
| | | |
Aegletes B.V.(5)(6) | | | | | | | 115,904 | | | $ | 4,288,448 | |
| | | |
| | | | | | | | | | | $ | 4,288,448 | |
|
| Nonferrous Metals/Minerals — 0.1% | |
| | | |
ACNR Holdings, Inc., Class A(5)(6) | | | | | | | 36,829 | | | $ | 3,793,387 | |
| | | |
| | | | | | | | | | | $ | 3,793,387 | |
|
| Oil and Gas — 0.1% | |
| | | |
AFG Holdings, Inc.(4)(5)(6) | | | | | | | 498,342 | | | $ | 1,480,076 | |
| | | |
McDermott International, Ltd.(5)(6) | | | | | | | 1,013,850 | | | | 542,410 | |
| | | |
QuarterNorth Energy, Inc.(6) | | | | | | | 66,091 | | | | 8,096,147 | |
| | | |
QuarterNorth Energy, Inc.(6) | | | | | | | 9,684 | | | | 1,186,290 | |
| | | |
| | | | | | | | | | | $ | 11,304,923 | |
|
| Radio and Television — 0.1% | |
| | | |
Clear Channel Outdoor Holdings, Inc.(5)(6) | | | | | | | 1,204,044 | | | $ | 1,721,783 | |
| | | |
Cumulus Media, Inc., Class A(5)(6) | | | | | | | 644,574 | | | | 4,750,510 | |
| | | |
iHeartMedia, Inc., Class A(5)(6) | | | | | | | 512,034 | | | | 4,239,642 | |
| | | |
| | | | | | | | | | | $ | 10,711,935 | |
|
| Retailers (Except Food and Drug) — 0.0%(7) | |
| | | |
David’s Bridal, LLC(4)(5)(6) | | | | | | | 272,023 | | | $ | 0 | |
| | | |
Phillips Pet Holding Corp.(4)(5)(6) | | | | | | | 2,590 | | | | 793,493 | |
| | | |
| | | | | | | | | | | $ | 793,493 | |
|
| Telecommunications — 0.1% | |
| | | |
GEE Acquisition Holdings Corp.(4)(5)(6) | | | | | | | 364,650 | | | $ | 3,281,850 | |
| | | |
| | | | | | | | | | | $ | 3,281,850 | |
| | | | | | | | | | | | |
| Security | | | | | Shares | | | Value | |
|
| Utilities — 0.0%(7) | |
| | | |
Longview Intermediate Holdings, LLC, Class A(5)(6) | | | | | | | 149,459 | | | $ | 2,055,061 | |
| | | |
| | | | | | | | | | | $ | 2,055,061 | |
| |
Total Common Stocks
(identified cost $87,489,231) | | | $ | 53,968,346 | |
|
| Convertible Preferred Stocks — 0.1% | |
| Security | | | | | Shares | | | Value | |
|
| Containers and Glass Products — 0.1% | |
| | | |
LG Newco Holdco, Inc., Series A, 13.00%(5)(6) | | | | | | | 38,060 | | | $ | 4,538,607 | |
| | | |
Total Convertible Preferred Stocks
(identified cost $1,998,129) | | | | | | | | | | $ | 4,538,607 | |
|
| Corporate Bonds — 7.0% | |
| Security | | | | | Principal
Amount* (000’s omitted) | | | Value | |
|
| Aerospace and Defense — 0.1% | |
| | | |
Spirit AeroSystems, Inc., 5.50%, 1/15/25(1) | | | | | | | 3,000 | | | $ | 2,899,125 | |
| | | |
| TransDigm, Inc.: | | | | | | | | | |
| | | |
6.25%, 3/15/26(1) | | | | | | | 1,500 | | | | 1,482,202 | |
| | | |
8.00%, 12/15/25(1) | | | | | | | 1,500 | | | | 1,528,095 | |
| | | |
| | | | | | | | | | | $ | 5,909,422 | |
|
| Air Transport — 0.7% | |
| | | |
Air Canada, 3.875%, 8/15/26(1) | | | | | | | 6,850 | | | $ | 6,071,121 | |
| | | |
American Airlines, Inc./AAdvantage Loyalty IP, Ltd.: | | | | | | | | | | | | |
| | | |
5.50%, 4/20/26(1) | | | | | | | 17,175 | | | | 16,383,777 | |
| | | |
5.75%, 4/20/29(1) | | | | | | | 12,875 | | | | 11,739,232 | |
| | | |
Delta Air Lines, Inc., 7.00%, 5/1/25(1) | | | | | | | 4,650 | | | | 4,715,956 | |
| | | |
Delta Air Lines, Inc./SkyMiles IP, Ltd., 4.75%, 10/20/28(1) | | | | | | | 6,425 | | | | 5,981,367 | |
| | | |
| United Airlines, Inc.: | | | | | | | | | |
| | | |
4.375%, 4/15/26(1) | | | | | | | 4,625 | | | | 4,229,645 | |
| | | |
4.625%, 4/15/29(1) | | | | | | | 4,625 | | | | 3,963,741 | |
| | | |
| | | | | | | | | | | $ | 53,084,839 | |
|
| Automotive — 0.2% | |
| | | |
Clarios Global, L.P., 6.75%, 5/15/25(1) | | | | | | | 1,890 | | | $ | 1,894,007 | |
| | | | |
| | 25 | | See Notes to Financial Statements. |
Eaton Vance
Floating Rate Portfolio
October 31, 2022
Portfolio of Investments — continued
| | | | | | | | | | | | |
| Security | | | | | Principal
Amount* (000’s omitted) | | | Value | |
|
| Automotive (continued) | |
| | | |
Clarios Global, L.P./Clarios U.S. Finance Co., 6.25%, 5/15/26(1) | | | | | | | 3,893 | | | $ | 3,775,665 | |
| | | |
| Tenneco, Inc.: | | | | | | | | | |
| | | |
5.125%, 4/15/29(1) | | | | | | | 9,050 | | | | 8,988,485 | |
| | | |
7.875%, 1/15/29(1) | | | | | | | 450 | | | | 446,573 | |
| | | |
| | | | | | | | | | | $ | 15,104,730 | |
|
| Building and Development — 0.0%(7) | |
| | | |
Cushman & Wakefield U.S. Borrower, LLC, 6.75%, 5/15/28(1) | | | | | | | 3,150 | | | $ | 3,002,785 | |
| | | |
Winnebago Industries, Inc., 6.25%, 7/15/28(1) | | | | | | | 900 | | | | 838,735 | |
| | | |
| | | | | | | | | | | $ | 3,841,520 | |
|
| Business Equipment and Services — 0.7% | |
| | | |
Allied Universal Holdco, LLC/Allied Universal Finance Corp., 6.625%, 7/15/26(1) | | | | | | | 2,075 | | | $ | 1,985,557 | |
| | | |
Allied Universal Holdco, LLC/Allied Universal Finance Corp./Atlas Luxco 4 S.a.r.l.: | | | | | | | | | | | | |
| | | |
4.625%, 6/1/28(1) | | | | | | | 17,475 | | | | 14,329,150 | |
| | | |
4.625%, 6/1/28(1) | | | | | | | 24,975 | | | | 20,941,648 | |
| | | |
Prime Security Services Borrower, LLC/Prime Finance, Inc.: | | | | | | | | | | | | |
| | | |
5.25%, 4/15/24(1) | | | | | | | 7,900 | | | | 7,876,379 | |
| | | |
5.75%, 4/15/26(1) | | | | | | | 15,225 | | | | 14,846,954 | |
| | | |
| | | | | | | | | | | $ | 59,979,688 | |
|
| Cable and Satellite Television — 0.6% | |
| | | |
| Altice France S.A.: | | | | | | | | | |
| | | |
5.125%, 1/15/29(1) | | | | | | | 1,300 | | | $ | 980,129 | |
| | | |
5.125%, 7/15/29(1) | | | | | | | 57,625 | | | | 43,506,875 | |
| | | |
5.50%, 10/15/29(1) | | | | | | | 6,455 | | | | 4,934,363 | |
| | | |
| | | | | | | | | | | $ | 49,421,367 | |
|
| Chemicals — 0.1% | |
| | | |
Cheever Escrow Issuer, LLC, 7.125%, 10/1/27(1) | | | | | | | 925 | | | $ | 850,440 | |
| | | |
INEOS Finance PLC, 3.375%, 3/31/26(1) | | | EUR | | | | 1,250 | | | | 1,112,895 | |
| | | |
INEOS Quattro Finance 2 PLC, 3.375%, 1/15/26(1) | | | | | | | 3,050 | | | | 2,584,494 | |
| | | |
Olympus Water US Holding Corp., 4.25%, 10/1/28(1) | | | | | | | 9,350 | | | | 7,614,108 | |
| | | |
| | | | | | | | | | | $ | 12,161,937 | |
|
| Commercial Services — 0.1% | |
| | | |
WASH Multifamily Acquisition, Inc., 5.75%, 4/15/26(1) | | | | | | | 8,225 | | | $ | 7,682,304 | |
| | | |
| | | | | | | | | | | $ | 7,682,304 | |
| | | | | | | | | | | | |
| Security | | | | | Principal
Amount* (000’s omitted) | | | Value | |
|
| Communications Equipment — 0.1% | |
| | | |
CommScope, Inc., 4.75%, 9/1/29(1) | | | | | | | 6,650 | | | $ | 5,633,343 | |
| | | |
| | | | | | | | | | | $ | 5,633,343 | |
|
| Containers & Packaging — 0.2% | |
| | | |
Clydesdale Acquisition Holdings, Inc., 6.625%, 4/15/29(1) | | | | | | | 2,300 | | | $ | 2,186,714 | |
| | | |
Pactiv Evergreen Group Issuer, Inc./Pactiv Evergreen Group Issuer, LLC: | | | | | | | | | | | | |
| | |
4.00%, 10/15/27(1) | | | | 5,150 | | | | 4,571,140 | |
| | | |
4.375%, 10/15/28(1) | | | | | | | 9,125 | | | | 7,997,013 | |
| | | |
| | | | | | | | | | | $ | 14,754,867 | |
|
| Diversified Financial Services — 0.2% | |
| | |
AG Issuer, LLC, 6.25%, 3/1/28(1) | | | | 8,075 | | | $ | 7,525,312 | |
| | |
AG TTMT Escrow Issuer, LLC, 8.625%, 9/30/27(1) | | | | 2,925 | | | | 2,939,888 | |
| | | |
NFP Corp., 7.50%, 10/1/30(1) | | | | | | | 2,925 | | | | 2,789,011 | |
| | | |
| | | | | | | | | | | $ | 13,254,211 | |
|
| Diversified Telecommunication Services — 0.1% | |
| | |
Virgin Media Secured Finance PLC, 4.50%, 8/15/30(1) | | | | 6,500 | | | $ | 5,386,675 | |
| | | |
Zayo Group Holdings, Inc., 4.00%, 3/1/27(1) | | | | | | | 4,000 | | | | 3,097,340 | |
| | | |
| | | | | | | | | | | $ | 8,484,015 | |
|
| Drugs — 0.1% | |
| | | |
Jazz Securities DAC, 4.375%, 1/15/29(1) | | | | | | | 9,150 | | | $ | 8,143,683 | |
| | | |
| | | | | | | | | | | $ | 8,143,683 | |
|
| Ecological Services and Equipment — 0.1% | |
| | | |
GFL Environmental, Inc., 4.25%, 6/1/25(1) | | | | | | | 5,300 | | | $ | 5,067,489 | |
| | | |
| | | | | | | | | | | $ | 5,067,489 | |
|
| Electronics/Electrical — 0.3% | |
| | |
GoTo Group, Inc., 5.50%, 9/1/27(1) | | | | 10,760 | | | $ | 6,267,915 | |
| | | |
Imola Merger Corp., 4.75%, 5/15/29(1) | | | | | | | 18,175 | | | | 15,702,200 | |
| | | |
| | | | | | | | | | | $ | 21,970,115 | |
|
| Entertainment — 0.1% | |
| | |
AMC Entertainment Holdings, Inc., 7.50%, 2/15/29(1) | | | | 8,700 | | | $ | 5,992,299 | |
| | |
Live Nation Entertainment, Inc., 3.75%, 1/15/28(1) | | | | 2,075 | | | | 1,810,974 | |
| | | |
Six Flags Theme Parks, Inc., 7.00%, 7/1/25(1) | | | | | | | 1,070 | | | | 1,081,984 | |
| | | |
| | | | | | | | | | | $ | 8,885,257 | |
|
| Health Care — 0.5% | |
| | |
Medline Borrower, L.P., 3.875%, 4/1/29(1) | | | | 22,800 | | | $ | 18,665,220 | |
| | | | |
| | 26 | | See Notes to Financial Statements. |
Eaton Vance
Floating Rate Portfolio
October 31, 2022
Portfolio of Investments — continued
| | | | | | | | | | | | |
| Security | | | | | Principal
Amount* (000’s omitted) | | | Value | |
|
| Health Care (continued) | |
| | | |
RP Escrow Issuer, LLC, 5.25%, 12/15/25(1) | | | | | | | 2,150 | | | $ | 1,612,972 | |
| | | |
Tenet Healthcare Corp., 4.25%, 6/1/29(1) | | | | | | | 22,950 | | | | 19,370,374 | |
| | | |
| | | | | | | | | | | $ | 39,648,566 | |
|
| Hotels, Restaurants & Leisure — 0.4% | |
| | | |
Carnival Corporation, 4.00%, 8/1/28(1) | | | | | | | 34,575 | | | $ | 27,919,312 | |
| | | |
SeaWorld Parks & Entertainment, Inc., 8.75%, 5/1/25(1) | | | | | | | 2,125 | | | | 2,179,475 | |
| | | |
| | | | | | | | | | | $ | 30,098,787 | |
|
| Household Products — 0.0%(7) | |
| | | |
Kronos Acquisition Holdings, Inc./KIK Custom | | | | | | | | | | | | |
| | | |
Products, Inc., 5.00%, 12/31/26(1) | | | | | | | 1,075 | | | $ | 975,933 | |
| | | |
| | | | | | | | | | | $ | 975,933 | |
|
| Insurance — 0.0%(7) | |
| | | |
Alliant Holdings Intermediate LLC/Alliant Holdings | | | | | | | | | | | | |
| | | |
Co., 4.25%, 10/15/27(1) | | | | | | | 700 | | | $ | 631,792 | |
| | | |
| | | | | | | | | | | $ | 631,792 | |
|
| Internet Software & Services — 0.2% | |
| | | |
Arches Buyer, Inc., 4.25%, 6/1/28(1) | | | | | | | 6,900 | | | $ | 5,676,492 | |
| | | |
Central Parent, Inc./CDK Global, Inc., 7.25%, 6/15/29(1) | | | | | | | 13,700 | | | | 13,125,422 | |
| | | |
| | | | | | | | | | | $ | 18,801,914 | |
|
| IT Services — 0.0%(7) | |
| | | |
Rackspace Technology Global, Inc., 3.50%, 2/15/28(1) | | | | | | | 6,185 | | | $ | 4,095,299 | |
| | | |
| | | | | | | | | | | $ | 4,095,299 | |
|
| Leisure Goods/Activities/Movies — 0.3% | |
| | | |
Lindblad Expeditions, LLC, 6.75%, 2/15/27(1) | | | | | | | 3,300 | | | $ | 2,940,503 | |
| | | |
NCL Corp., Ltd., 5.875%, 2/15/27(1) | | | | | | | 22,000 | | | | 19,670,090 | |
| | | |
| | | | | | | | | | | $ | 22,610,593 | |
|
| Machinery — 0.2% | |
| | | |
Madison IAQ, LLC, 4.125%, 6/30/28(1) | | | | | | | 13,400 | | | $ | 11,118,918 | |
| | | |
TK Elevator U.S. Newco, Inc., 5.25%, 7/15/27(1) | | | | | | | 4,150 | | | | 3,730,933 | |
| | | |
| | | | | | | | | | | $ | 14,849,851 | |
|
| Media — 0.4% | |
| | | |
Diamond Sports Group, LLC/Diamond Sports Finance Co., 5.375%, 8/15/26(1) | | | | | | | 6,753 | | | $ | 1,358,940 | |
| | | |
| iHeartCommunications, Inc.: | | | | | | | | | |
| | | |
4.75%, 1/15/28(1) | | | | | | | 2,550 | | | | 2,228,662 | |
| | | | | | | | | | | | |
| Security | | | | | Principal
Amount* (000’s omitted) | | | Value | |
|
| Media (continued) | |
| | | |
| iHeartCommunications, Inc.: (continued) | | | | | | | | | |
| | | |
5.25%, 8/15/27(1) | | | | | | | 2,125 | | | $ | 1,939,700 | |
| | | |
6.375%, 5/1/26 | | | | | | | 2,896 | | | | 2,766,068 | |
| | | |
8.375%, 5/1/27 | | | | | | | 5,248 | | | | 4,723,690 | |
| | | |
Univision Communications, Inc.: | | | | | | | | | | | | |
| | | |
4.50%, 5/1/29(1) | | | | | | | 9,125 | | | | 7,703,325 | |
| | | |
7.375%, 6/30/30(1) | | | | | | | 11,300 | | | | 10,946,366 | |
| | | |
| | | | | | | | | | | $ | 31,666,751 | |
|
| Oil, Gas & Consumable Fuels — 0.1% | |
| | | |
CITGO Petroleum Corporation: | | | | | | | | | | | | |
| | | |
6.375%, 6/15/26(1) | | | | | | | 1,750 | | | $ | 1,727,932 | |
| | | |
7.00%, 6/15/25(1) | | | | | | | 10,525 | | | | 10,376,387 | |
| | | |
| | | | | | | | | | | $ | 12,104,319 | |
|
| Pharmaceuticals — 0.1% | |
| | | |
Bausch Health Companies, Inc.: | | | | | | | | | | | | |
| | | |
4.875%, 6/1/28(1) | | | | | | | 8,675 | | | $ | 5,331,872 | |
| | | |
6.125%, 2/1/27(1) | | | | | | | 6,075 | | | | 4,004,461 | |
| | | |
| | | | | | | | | | | $ | 9,336,333 | |
|
| Professional Services — 0.0%(7) | |
| | | |
CoreLogic, Inc., 4.50%, 5/1/28(1) | | | | | | | 5,525 | | | $ | 3,727,648 | |
| | | |
| | | | | | | | | | | $ | 3,727,648 | |
|
| Real Estate Investment Trusts (REITs) — 0.1% | |
| | | |
Park Intermediate Holdings, LLC/PK Domestic Property, LLC/PK Finance Co-Issuer, 5.875%, 10/1/28(1) | | | | | | | 6,425 | | | $ | 5,844,951 | |
| | | |
| | | | | | | | | | | $ | 5,844,951 | |
|
| Retail — 0.2% | |
| | | |
Fertitta Entertainment, LLC/Fertitta Entertainment Finance Co., Inc., 4.625%, 1/15/29(1) | | | | | | | 15,580 | | | $ | 13,578,983 | |
| | | |
| | | | | | | | | | | $ | 13,578,983 | |
|
| Retailers (Except Food and Drug) — 0.0%(7) | |
| | | |
PetSmart, Inc./PetSmart Finance Corp., 4.75%, 2/15/28(1) | | | | | | | 1,300 | | | $ | 1,189,513 | |
| | | |
| | | | | | | | | | | $ | 1,189,513 | |
|
| Software — 0.2% | |
| | | |
Boxer Parent Co., Inc., 7.125%, 10/2/25(1) | | | | | | | 4,225 | | | $ | 4,160,780 | |
| | | |
| Sabre GLBL, Inc.: | | | | | | | | | |
| | | |
7.375%, 9/1/25(1) | | | | | | | 2,125 | | | | 1,999,668 | |
| | | | |
| | 27 | | See Notes to Financial Statements. |
Eaton Vance
Floating Rate Portfolio
October 31, 2022
Portfolio of Investments — continued
| | | | | | | | | | | | |
| Security | | | | | Principal
Amount* (000’s omitted) | | | Value | |
|
| Software (continued) | |
| | | |
| Sabre GLBL, Inc.: (continued) | | | | | | | | | |
| | | |
9.25%, 4/15/25(1) | | | | | | | 2,525 | | | $ | 2,451,106 | |
| | | |
Veritas US, Inc./Veritas Bermuda, Ltd., 7.50%, 9/1/25(1) | | | | | | | 10,350 | | | | 8,732,559 | |
| | | |
| | | | | | | | | | | $ | 17,344,113 | |
|
| Technology — 0.1% | |
| | | |
Clarivate Science Holdings Corp., 3.875%, 7/1/28(1) | | | | | | | 11,400 | | | $ | 9,803,709 | |
| | | |
| | | | | | | | | | | $ | 9,803,709 | |
|
| Telecommunications — 0.3% | |
| | | |
LCPR Senior Secured Financing DAC, 5.125%, 7/15/29(1) | | | | | | | 9,325 | | | $ | 7,878,972 | |
| | | |
Lumen Technologies, Inc., 4.00%, 2/15/27(1) | | | | | | | 11,277 | | | | 9,604,734 | |
| | | |
VMED O2 UK Financing I PLC, 4.25%, 1/31/31(1) | | | | | | | 8,550 | | | | 6,815,037 | |
| | | |
| | | | | | | | | | | $ | 24,298,743 | |
|
| Trading Companies & Distributors — 0.1% | |
| | | |
American Builders & Contractors Supply Co., Inc., 4.00%, 1/15/28(1) | | | | | | | 2,975 | | | $ | 2,630,927 | |
| | | |
SRS Distribution, Inc., 4.625%, 7/1/28(1) | | | | | | | 4,575 | | | | 4,027,235 | |
| | | |
| | | | | | | | | | | $ | 6,658,162 | |
|
| Utilities — 0.0%(7) | |
| | | |
Calpine Corp., 5.25%, 6/1/26(1) | | | | | | | 1,109 | | | $ | 1,054,137 | |
| | | |
| | | | | | | | | | | $ | 1,054,137 | |
|
| Wireless Telecommunication Services — 0.1% | |
| | | |
Digicel International Finance, Ltd./Digicel International Holdings, Ltd., 8.75%, 5/25/24(1) | | | | | | | 6,325 | | | $ | 5,411,955 | |
| | | |
| | | | | | | | | | | $ | 5,411,955 | |
| | | |
Total Corporate Bonds
(identified cost $665,096,030) | | | | | | | | | | $ | 567,110,839 | |
|
| Exchange-Traded Funds — 0.2% | |
| Security | | | | | Shares | | | Value | |
| | | |
SPDR Blackstone Senior Loan ETF | | | | | | | 426,000 | | | $ | 17,610,840 | |
| |
Total Exchange-Traded Funds
(identified cost $19,593,027) | | | $ | 17,610,840 | |
| | | | | | | | | | | | |
| Preferred Stocks — 0.1% | |
| Security | | | | | Shares | | | Value | |
|
| Financial Services — 0.0% | |
| | | |
DBI Investors, Inc., Series A-1(4)(5)(6) | | | | | | | 13,348 | | | $ | 0 | |
| | | |
| | | | | | | | | | | $ | 0 | |
|
| Nonferrous Metals/Minerals — 0.1% | |
| | | |
ACNR Holdings, Inc., 15.00% (PIK)(5)(6) | | | | | | | 17,394 | | | $ | 10,740,795 | |
| | | |
| | | | | | | | | | | $ | 10,740,795 | |
|
| Retailers (Except Food and Drug) — 0.0% | |
| | | |
David’s Bridal, LLC: | | | | | | | | | | | | |
| | | |
Series A 8.00% (PIK)(4)(5)(6) | | | | | | | 7,852 | | | $ | 0 | |
| | | |
Series B 10.00% (PIK)(4)(5)(6) | | | | | | | 31,998 | | | | 0 | |
| | | |
| | | | | | | | | | | $ | 0 | |
| |
Total Preferred Stocks
(identified cost $2,590,558) | | | $ | 10,740,795 | |
|
| Senior Floating-Rate Loans — 84.3%(8) | |
| Borrower/Description | | Principal Amount* (000’s omitted) | | | Value | |
|
| Aerospace and Defense — 1.9% | |
| | | |
Aernnova Aerospace S.A.U.: | | | | | | | | | | | | |
| | | |
Term Loan, 3.00%, (6 mo. EURIBOR + 3.00%), 2/26/27 | | | EUR | | | | 4,656 | | | $ | 3,938,040 | |
| | | |
Term Loan, 4.10%, (3 mo. EURIBOR + 3.00%), 2/22/27 | | | EUR | | | | 1,194 | | | | 1,009,754 | |
| | | |
AI Convoy (Luxembourg) S.a.r.l.: | | | | | | | | | | | | |
| | | |
Term Loan, 5.532%, (6 mo. EURIBOR + 3.50%), 1/18/27 | | | EUR | | | | 3,850 | | | | 3,538,428 | |
| | | |
Term Loan, 8.173%, (USD LIBOR + 3.50%), 1/18/27(9) | | | | | | | 3,003 | | | | 2,941,741 | |
| | | |
Dynasty Acquisition Co., Inc.: | | | | | | | | | | | | |
| | | |
Term Loan, 7.254%, (1 mo. USD LIBOR + 3.50%), 4/6/26 | | | | | | | 29,031 | | | | 27,346,879 | |
| | | |
Term Loan, 7.254%, (1 mo. USD LIBOR + 3.50%), 4/6/26 | | | | | | | 15,611 | | | | 14,705,201 | |
| | | |
IAP Worldwide Services, Inc., Term Loan - Second Lien, 10.174%, (3 mo. USD LIBOR + 6.50%), 7/18/23(4) | | | | | | | 6,770 | | | | 5,255,578 | |
| | | |
Spirit Aerosystems, Inc., Term Loan, 7.504%, (1 mo. USD LIBOR + 3.75%), 1/15/25 | | | | | | | 10,385 | | | | 10,310,943 | |
| | | |
| TransDigm, Inc.: | | | | | | | | | |
| | | |
Term Loan, 5.924%, (3 mo. USD LIBOR + 2.25%), 8/22/24 | | | | | | | 27,752 | | | | 27,343,269 | |
| | | |
Term Loan, 5.924%, (3 mo. USD LIBOR + 2.25%), 5/30/25 | | | | | | | 6,271 | | | | 6,140,590 | |
| | | | |
| | 28 | | See Notes to Financial Statements. |
Eaton Vance
Floating Rate Portfolio
October 31, 2022
Portfolio of Investments — continued
| | | | | | | | | | | | |
| Borrower/Description | | | | | Principal
Amount* (000’s omitted) | | | Value | |
|
| Aerospace and Defense (continued) | |
| | | |
| TransDigm, Inc.: (continued) | | | | | | | | | |
| | | |
Term Loan, 5.924%, (3 mo. USD LIBOR + 2.25%), 12/9/25 | | | | | | | 24,276 | | | $ | 23,739,174 | |
| | | |
WP CPP Holdings, LLC, Term Loan, 8.168%, (USD LIBOR + 3.75%), 4/30/25(9) | | | | | | | 27,375 | | | | 23,542,674 | |
| | | |
| | | | | | | | | | | $ | 149,812,271 | |
| | | |
| Airlines — 1.2% | | | | | | | | | |
| | | |
American Airlines, Inc.: | | | | | | | | | | | | |
| | | |
Term Loan, 5.346%, (1 mo. USD LIBOR + 1.75%), 6/27/25 | | | | | | | 6,083 | | | $ | 5,764,181 | |
| | | |
Term Loan, 8.993%, (3 mo. USD LIBOR + 4.75%), 4/20/28 | | | | | | | 27,625 | | | | 27,388,226 | |
| | | |
Mileage Plus Holdings, LLC, Term Loan, 8.777%, (3 mo. USD LIBOR + 5.25%), 6/21/27 | | | | | | | 15,603 | | | | 15,963,360 | |
| | | |
SkyMiles IP, Ltd., Term Loan, 7.993%, (3 mo. USD LIBOR + 3.75%), 10/20/27 | | | | | | | 31,975 | | | | 32,303,639 | |
| | | |
United Airlines, Inc., Term Loan, 8.108%, (3 mo. USD LIBOR + 3.75%), 4/21/28 | | | | | | | 17,604 | | | | 17,230,568 | |
| | | |
| | | | | | | | | | | $ | 98,649,974 | |
| | | |
| Apparel & Luxury Goods — 0.0%(7) | | | | | | | | | |
| | | |
Samsonite International S.A., Term Loan, 5.504%, (1 mo. USD LIBOR + 1.75%), 4/25/25 | | | | | | | 2,709 | | | $ | 2,593,470 | |
| | | |
| | | | | | | | | | | $ | 2,593,470 | |
| | | |
| Auto Components — 2.2% | | | | | | | | | |
| | | |
Adient US, LLC, Term Loan, 7.004%, (1 mo. USD LIBOR + 3.25%), 4/10/28 | | | | | | | 13,602 | | | $ | 13,177,042 | |
| | | |
American Axle and Manufacturing, Inc., Term Loan, 5.84%, (1 mo. USD LIBOR + 2.25%), 4/6/24 | | | | | | | 15,879 | | | | 15,704,072 | |
| | | |
Chassix, Inc., Term Loan, 8.272%, (USD LIBOR + 5.50%), 11/15/23(9) | | | | | | | 9,336 | | | | 8,562,114 | |
| | | |
Clarios Global, L.P.: | | | | | | | | | | | | |
| | | |
Term Loan, 4.383%, (1 mo. EURIBOR + 3.25%), 4/30/26 | | | EUR | | | | 24,804 | | | | 22,888,938 | |
| | | |
Term Loan, 7.004%, (1 mo. USD LIBOR + 3.25%), 4/30/26 | | | | | | | 6,152 | | | | 6,000,607 | |
| | | |
DexKo Global, Inc.: | | | | | | | | | | | | |
| | | |
Term Loan, 5.133%, (1 mo. EURIBOR + 4.00%), 10/4/28 | | | EUR | | | | 1,012 | | | | 882,832 | |
| | | |
Term Loan, 5.218%, (EURIBOR + 4.00%), 10/4/28(9) | | | EUR | | | | 6,291 | | | | 5,486,708 | |
| | | |
Term Loan, 5.578%, (3 mo. EURIBOR + 4.00%), 10/4/28 | | | EUR | | | | 3,272 | | | | 2,853,238 | |
| | | |
Term Loan, 7.476%, (USD LIBOR + 3.75%), 10/4/28(9) | | | | | | | 13,507 | | | | 12,270,386 | |
| | | | | | | | | | | | |
| Borrower/Description | | | | | Principal
Amount* (000’s omitted) | | | Value | |
| | | |
| Auto Components (continued) | | | | | | | | | |
| | | |
| Garrett LX I S.a.r.l.: | | | | | | | | | |
| | | |
Term Loan, 5.105%, (3 mo. EURIBOR + 3.50%), 4/30/28 | | | EUR | | | | 15,900 | | | $ | 14,731,097 | |
| | | |
Term Loan, 7.67%, (3 mo. USD LIBOR + 3.25%), 4/30/28 | | | | | | | 5,668 | | | | 5,526,056 | |
| | | |
LTI Holdings, Inc.: | | | | | | | | | | | | |
| | | |
Term Loan, 7.004%, (1 mo. USD LIBOR + 3.25%), 9/6/25 | | | | | | | 5,664 | | | | 5,298,672 | |
| | | |
Term Loan, 8.254%, (1 mo. USD LIBOR + 4.50%), 7/24/26 | | | | | | | 7,117 | | | | 6,689,864 | |
| | | |
Tenneco, Inc., Term Loan, 6.206%, (1 mo. USD LIBOR + 3.00%), 10/1/25 | | | | | | | 33,876 | | | | 33,774,725 | |
| | | |
TI Group Automotive Systems, LLC, Term Loan, 4.443%, (1 mo. EURIBOR + 3.25%), 12/16/26 | | | EUR | | | | 8,888 | | | | 8,147,007 | |
| | | |
Truck Hero, Inc., Term Loan, 7.254%, (1 mo. USD LIBOR + 3.50%), 1/31/28 | | | | | | | 15,351 | | | | 13,254,487 | |
| | | |
Wheel Pros, LLC, Term Loan, 8.825%, (3 mo. USD LIBOR + 4.50%), 5/11/28 | | | | | | | 1,837 | | | | 1,343,889 | |
| | | |
| | | | | | | | | | | $ | 176,591,734 | |
| | | |
| Automobiles — 0.7% | | | | | | | | | |
| | | |
Bombardier Recreational Products, Inc., Term Loan, 5.754%, (1 mo. USD LIBOR + 2.00%), 5/24/27 | | | | | | | 43,610 | | | $ | 42,001,500 | |
| | | |
MajorDrive Holdings IV, LLC, Term Loan, 7.125%, (3 mo. USD LIBOR + 4.00%), 6/1/28 | | | | | | | 15,524 | | | | 14,340,039 | |
| | | |
| | | | | | | | | | | $ | 56,341,539 | |
| | | |
| Beverages — 0.3% | | | | | | | | | |
| | | |
Arterra Wines Canada, Inc., Term Loan, 7.142%, (3 mo. USD LIBOR + 3.50%), 11/24/27 | | | | | | | 1,427 | | | $ | 1,306,199 | |
| | | |
City Brewing Company, LLC, Term Loan, 6.814%, (1 mo. USD LIBOR + 3.50%), 4/5/28 | | | | | | | 5,810 | | | | 4,016,356 | |
| | | |
Triton Water Holdings, Inc., Term Loan, 7.174%, (3 mo. USD LIBOR + 3.50%), 3/31/28 | | | | | | | 16,801 | | | | 15,041,802 | |
| | | |
| | | | | | | | | | | $ | 20,364,357 | |
| | | |
| Biotechnology — 0.5% | | | | | | | | | |
| | | |
Alkermes, Inc., Term Loan, 5.98%, (1 mo. USD LIBOR + 2.50%), 3/12/26 | | | | | | | 18,364 | | | $ | 17,675,288 | |
| | | |
Alltech, Inc., Term Loan, 7.754%, (1 mo. USD LIBOR + 4.00%), 10/13/28 | | | | | | | 7,518 | | | | 7,226,858 | |
| | | |
Grifols Worldwide Operations USA, Inc., Term Loan, 5.754%, (1 mo. USD LIBOR + 2.00%), 11/15/27 | | | | | | | 17,440 | | | | 16,771,627 | |
| | | |
| | | | | | | | | | | $ | 41,673,773 | |
| | | |
| Building Products — 0.9% | | | | | | | | | |
| | | |
ACProducts, Inc., Term Loan, 7.325%, (USD LIBOR + 4.25%), 5/17/28(9) | | | | | | | 18,763 | | | $ | 13,154,858 | |
| | | | |
| | 29 | | See Notes to Financial Statements. |
Eaton Vance
Floating Rate Portfolio
October 31, 2022
Portfolio of Investments — continued
| | | | | | | | | | | | |
| Borrower/Description | | | | | Principal Amount* (000’s omitted) | | | Value | |
| | | |
| Building Products (continued) | | | | | | | | | |
| | | |
Cornerstone Building Brands, Inc., Term Loan, 6.589%, (1 mo. USD LIBOR + 3.25%), 4/12/28 | | | | | | | 19,710 | | | $ | 16,624,496 | |
| | | |
CPG International, Inc., Term Loan, 6.269%, (SOFR + 2.50%), 4/28/29 | | | | | | | 13,775 | | | | 13,359,601 | |
| | | |
LHS Borrower, LLC, Term Loan, 8.579%, (SOFR + 4.75%), 2/16/29 | | | | | | | 13,044 | | | | 10,359,005 | |
| | | |
MI Windows and Doors, LLC, Term Loan, 7.329%, (SOFR + 3.50%), 12/18/27 | | | | | | | 6,611 | | | | 6,450,259 | |
| | | |
Standard Industries, Inc., Term Loan, 6.675%, (6 mo. USD LIBOR + 2.50%), 9/22/28 | | | | | | | 15,487 | | | | 15,198,955 | |
| | | |
| | | | | | | | | | | $ | 75,147,174 | |
|
| Capital Markets — 3.5% | |
| | | |
Advisor Group, Inc., Term Loan, 8.254%, (1 mo. USD LIBOR + 4.50%), 7/31/26 | | | | | | | 36,937 | | | $ | 35,574,908 | |
| | | |
AllSpring Buyer, LLC, Term Loan, 6.688%, (3 mo. USD LIBOR + 3.00%), 11/1/28 | | | | | | | 6,283 | | | | 6,212,261 | |
| | | |
Aretec Group, Inc., Term Loan, 8.079%, (SOFR + 4.25%), 10/1/25 | | | | | | | 18,467 | | | | 17,970,686 | |
| | | |
Axalta Coating Systems US Holdings, Inc., Term Loan, 5.424%, (3 mo. USD LIBOR + 1.75%), 6/1/24 | | | | | | | 20,974 | | | | 20,773,404 | |
| | | |
CeramTec AcquiCo GmbH, Term Loan, 4.332%, (3 mo. EURIBOR + 3.75%), 3/16/29 | | | EUR | | | | 12,779 | | | | 11,708,004 | |
| | | |
Clipper Acquisitions Corp., Term Loan, 4.924%, (1 mo. USD LIBOR + 1.75%), 3/3/28 | | | | | | | 11,211 | | | | 11,001,071 | |
| | | |
Edelman Financial Center, LLC, Term Loan, 7.254%, (1 mo. USD LIBOR + 3.50%), 4/7/28 | | | | | | | 29,001 | | | | 27,102,658 | |
| | | |
EIG Management Company, LLC, Term Loan, 7.504%, (1 mo. USD LIBOR + 3.75%), 2/22/25 | | | | | | | 2,889 | | | | 2,809,431 | |
| | | |
FinCo I, LLC, Term Loan, 6.254%, (1 mo. USD LIBOR + 2.50%), 6/27/25 | | | | | | | 18,666 | | | | 18,628,534 | |
| | | |
| Focus Financial Partners, LLC: | | | | | | | | | |
| | | |
Term Loan, 5.754%, (1 mo. USD LIBOR + 2.00%), 7/3/24 | | | | | | | 12,976 | | | | 12,812,528 | |
| | | |
Term Loan, 6.254%, (1 mo. USD LIBOR + 2.50%), 6/30/28 | | | | | | | 9,978 | | | | 9,775,755 | |
| | | |
Franklin Square Holdings, L.P., Term Loan, 6.063%, (1 mo. USD LIBOR + 2.25%), 8/1/25 | | | | | | | 6,264 | | | | 6,170,013 | |
| | | |
Guggenheim Partners, LLC, Term Loan, 6.504%, (1 mo. USD LIBOR + 2.75%), 7/21/23 | | | | | | | 19,376 | | | | 19,278,743 | |
| | | |
HighTower Holdings, LLC, Term Loan, 8.278%, (3 mo. USD LIBOR + 4.00%), 4/21/28 | | | | | | | 9,199 | | | | 8,577,641 | |
| | | |
Hudson River Trading, LLC, Term Loan, 6.164%, (SOFR + 3.00%), 3/20/28 | | | | | | | 25,834 | | | | 23,803,466 | |
| | | |
LPL Holdings, Inc., Term Loan, 4.878%, (1 mo. USD LIBOR + 1.75%), 11/12/26 | | | | | | | 15,949 | | | | 15,769,574 | |
| | | |
Mariner Wealth Advisors, LLC, Term Loan, 7.065%, (SOFR + 3.25%), 8/18/28 | | | | | | | 13,584 | | | | 13,091,240 | |
| | | | | | | | | | | | |
| Borrower/Description | | | | | Principal
Amount* (000’s omitted) | | | Value | |
|
| Capital Markets (continued) | |
| | | |
Victory Capital Holdings, Inc.: | | | | | | | | | | | | |
| | | |
Term Loan, 5.962%, (SOFR + 2.25%), 7/1/26 | | | | | | | 13,543 | | | $ | 13,285,020 | |
| | | |
Term Loan, 5.962%, (SOFR + 2.25%), 12/29/28 | | | | | | | 6,979 | | | | 6,832,637 | |
| | | |
| | | | | | | | | | | $ | 281,177,574 | |
|
| Chemicals — 3.3% | |
| | | |
Aruba Investments, Inc.: | | | | | | | | | | | | |
| | | |
Term Loan, 4.979%, (1 mo. EURIBOR + 4.00%), 11/24/27 | | | EUR | | | | 3,398 | | | $ | 3,089,654 | |
| | | |
Term Loan, 7.576%, (1 mo. USD LIBOR + 4.00%), 11/24/27 | | | | | | | 5,048 | | | | 4,758,099 | |
| | | |
Caldic B.V., Term Loan, 5.105%, (3 mo. EURIBOR + 3.50%), 2/3/29 | | | EUR | | | | 6,000 | | | | 5,418,079 | |
| | | |
Chemours Company (The), Term Loan, 3.20%, (3 mo. EURIBOR + 2.00%), 4/3/25 | | | EUR | | | | 2,790 | | | | 2,619,195 | |
| | | |
Colouroz Investment 1 GmbH: | | | | | | | | | | | | |
| | | |
Term Loan, 5.752%, (EURIBOR + 4.25%), 9/21/23(9) | | | EUR | | | | 2,514 | | | | 1,913,365 | |
| | | |
Term Loan, 5.751%, (3 mo. EURIBOR + 4.25%), 9/21/23 | | | EUR | | | | 27 | | | | 20,701 | |
| | | |
CPC Acquisition Corp., Term Loan, 7.424%, (3 mo. USD LIBOR + 3.75%), 12/29/27 | | | | | | | 16,671 | | | | 13,336,900 | |
| | | |
Flint Group GmbH: | | | | | | | | | | | | |
| | | |
Term Loan, 5.751%, (3 mo. EURIBOR + 4.25%), 9/21/23 | | | EUR | | | | 276 | | | | 209,996 | |
| | | |
Term Loan, 5.751%, (3 mo. EURIBOR + 4.25%), 9/21/23 | | | EUR | | | | 32 | | | | 24,257 | |
| | | |
Term Loan, 5.751%, (3 mo. EURIBOR + 4.25%), 9/21/23 | | | EUR | | | | 73 | | | | 55,234 | |
| | | |
Term Loan, 5.751%, (3 mo. EURIBOR + 4.25%), 9/21/23 | | | EUR | | | | 144 | | | | 109,443 | |
| | | |
Term Loan, 7.009%, (3 mo. USD LIBOR + 4.25%), 9/21/23 | | | | | | | 1,387 | | | | 1,048,547 | |
| | | |
Flint Group US LLC, Term Loan, 9.32%, (3 mo. USD LIBOR + 5.00%), 8.57% cash, 0.75% PIK, 9/21/23 | | | | | | | 8,387 | | | | 6,342,859 | |
| | | |
Gemini HDPE, LLC, Term Loan, 7.358%, (3 mo. USD LIBOR + 3.00%), 12/31/27 | | | | | | | 4,910 | | | | 4,733,803 | |
| | | |
GEON Performance Solutions, LLC, Term Loan, 8.174%, (1 mo. USD LIBOR + 4.50%), 8/18/28 | | | | | | | 5,718 | | | | 5,555,971 | |
| | | |
Groupe Solmax, Inc., Term Loan, 8.392%, (3 mo. USD LIBOR + 4.75%), 5/29/28 | | | | | | | 15,503 | | | | 13,565,154 | |
| | | |
INEOS Enterprises Holdings II Limited, Term Loan, 3.25%, (3 mo. EURIBOR + 3.25%), 8/31/26 | | | EUR | | | | 1,975 | | | | 1,789,144 | |
| | | |
INEOS Enterprises Holdings US Finco, LLC, Term Loan, 6.57%, (3 mo. USD LIBOR + 3.50%), 8/28/26 | | | | | | | 5,040 | | | | 4,586,006 | |
| | | |
| INEOS Finance PLC: | | | | | | | | | |
| | | |
Term Loan, 3.133%, (1 mo. EURIBOR + 2.00%), 4/1/24 | | | EUR | | | | 6,225 | | | | 6,048,410 | |
| | | | |
| | 30 | | See Notes to Financial Statements. |
Eaton Vance
Floating Rate Portfolio
October 31, 2022
Portfolio of Investments — continued
| | | | | | | | | | |
| Borrower/Description | | | | Principal Amount* (000’s omitted) | | | Value | |
|
| Chemicals (continued) | |
| | | |
| INEOS Finance PLC: (continued) | | | | | | | | |
| | | |
Term Loan, 3.883%, (1 mo. EURIBOR + 2.75%), 11/8/28 | | EUR | | | 8,900 | | | $ | 7,981,846 | |
| | | |
INEOS Quattro Holdings UK Ltd., Term Loan, 3.883%, (1 mo. EURIBOR + 2.75%), 1/29/26 | | EUR | | | 24,900 | | | | 22,249,215 | |
| | | |
INEOS Styrolution US Holding, LLC, Term Loan, 6.504%, (1 mo. USD LIBOR + 2.75%), 1/29/26 | | | | | 15,882 | | | | 14,991,886 | |
| | | |
INEOS US Finance, LLC, Term Loan, 6.254%, (1 mo. USD LIBOR + 2.50%), 11/8/28 | | | | | 6,214 | | | | 5,800,091 | |
| | | |
Kraton Corporation, Term Loan, 6.718%, (SOFR + 3.25%), 3/15/29 | | | | | 5,672 | | | | 5,494,266 | |
| | | |
Kraton Polymers Holdings B.V., Term Loan, 4.25%, (3 mo. EURIBOR + 3.25%), 3/15/29 | | EUR | | | 4,250 | | | | 3,874,557 | |
| | | |
| Lonza Group AG: | | | | | | | | |
| | | |
Term Loan, 5.193%, (3 mo. EURIBOR + 4.00%), 7/3/28 | | EUR | | | 7,125 | | | | 6,341,552 | |
| | | |
Term Loan, 5.193%, (3 mo. EURIBOR + 4.00%), 7/3/28 | | EUR | | | 8,475 | | | | 7,543,109 | |
| | | |
Term Loan, 7.674%, (3 mo. USD LIBOR + 4.00%), 7/3/28 | | | | | 21,910 | | | | 19,368,184 | |
| | | |
| LSF11 Skyscraper Holdco S.a.r.l.: | | | | | | | | |
| | | |
Term Loan, 4.693%, (3 mo. EURIBOR + 3.50%), 9/29/27 | | EUR | | | 11,350 | | | | 10,742,731 | |
| | | |
Term Loan, 7.174%, (3 mo. USD LIBOR + 3.50%), 9/29/27 | | | | | 4,778 | | | | 4,610,484 | |
| | | |
| Messer Industries GmbH: | | | | | | | | |
| | | |
Term Loan, 3.693%, (2 mo. EURIBOR + 2.50%), 3/2/26 | | EUR | | | 2,061 | | | | 1,947,997 | |
| | | |
Term Loan, 6.174%, (3 mo. USD LIBOR + 2.50%), 3/2/26 | | | | | 9,579 | | | | 9,430,253 | |
| | | |
| Olympus Water US Holding Corporation: | | | | | | | | |
| | | |
Term Loan, 7.438%, (3 mo. USD LIBOR + 3.75%), 11/9/28 | | | | | 4,987 | | | | 4,554,484 | |
| | | |
Term Loan, 8.153%, (SOFR + 4.50%), 11/9/28 | | | | | 5,398 | | | | 4,968,744 | |
| | | |
| Orion Engineered Carbons GmbH: | | | | | | | | |
| | | |
Term Loan, 3.693%, (3 mo. EURIBOR + 2.50%), 9/24/28 | | EUR | | | 1,250 | | | | 1,187,444 | |
| | | |
Term Loan, 5.924%, (3 mo. USD LIBOR + 2.25%), 9/24/28 | | | | | 4,480 | | | | 4,344,426 | |
| | | |
PQ Corporation, Term Loan, 6.915%, (3 mo. USD LIBOR + 2.50%), 6/9/28 | | | | | 8,757 | | | | 8,472,059 | |
| | | |
| Rohm Holding GmbH: | | | | | | | | |
| | | |
Term Loan, 4.881%, (6 mo. EURIBOR + 4.25%), 7/31/26 | | EUR | | | 2,150 | | | | 1,685,624 | |
| | | |
Term Loan, 8.121%, (3 mo. USD LIBOR + 4.75%), 7/31/26 | | | | | 16,003 | | | | 12,202,606 | |
| | | |
Spectrum Holdings III Corp., Term Loan, 7.004%, (1 mo. USD LIBOR + 3.25%), 1/31/25 | | | | | 5,530 | | | | 5,070,731 | |
| | | | | | | | | | | | |
| Borrower/Description | | | | | Principal
Amount* (000’s omitted) | | | Value | |
|
| Chemicals (continued) | |
| | | |
Starfruit Finco B.V., Term Loan, 7.165%, (3 mo. USD LIBOR + 2.75%), 10/1/25 | | | | | | | 3,602 | | | $ | 3,409,551 | |
| | | |
Trinseo Materials Operating S.C.A., Term Loan, 6.254%, (1 mo. USD LIBOR + 2.50%), 5/3/28 | | | | | | | 6,853 | | | | 5,969,951 | |
| | | |
| Tronox Finance, LLC: | | | | | | | | | |
| | | |
Term Loan, 5.938%, (USD LIBOR + 2.25%), 3/10/28(9) | | | | | | | 11,570 | | | | 10,940,772 | |
| | | |
Term Loan, 6.803%, (SOFR + 3.25%), 4/4/29 | | | | | | | 3,657 | | | | 3,510,360 | |
| | | |
W.R. Grace & Co.-Conn., Term Loan, 7.438%, (3 mo. USD LIBOR + 3.75%), 9/22/28 | | | | | | | 9,478 | | | | 9,135,627 | |
| | | |
| | | | | | | | | | | $ | 271,053,367 | |
|
| Commercial Services & Supplies — 1.7% | |
| | | |
Allied Universal Holdco, LLC, Term Loan, 4.883%, (1 mo. EURIBOR + 3.75%), 5/12/28 | | | EUR | | | | 8,508 | | | $ | 7,404,632 | |
| | | |
Asplundh Tree Expert, LLC, Term Loan, 5.504%, (1 mo. USD LIBOR + 1.75%), 9/7/27 | | | | | | | 8,281 | | | | 8,162,607 | |
| | | |
Belfor Holdings, Inc., Term Loan, 7.754%, (1 mo. USD LIBOR + 4.00%), 4/6/26 | | | | | | | 2,614 | | | | 2,589,932 | |
| | | |
Clean Harbors, Inc., Term Loan, 5.754%, (1 mo. USD LIBOR + 2.00%), 10/8/28 | | | | | | | 4,151 | | | | 4,136,566 | |
| | | |
| Covanta Holding Corporation: | | | | | | | | | |
| | | |
Term Loan, 6.229%, (1 mo. USD LIBOR + 2.50%), 11/30/28 | | | | | | | 1,828 | | | | 1,807,615 | |
| | | |
Term Loan, 6.229%, (1 mo. USD LIBOR + 2.50%), 11/30/28 | | | | | | | 138 | | | | 136,082 | |
| | | |
EnergySolutions, LLC, Term Loan, 7.424%, (3 mo. USD LIBOR + 3.75%), 5/9/25 | | | | | | | 17,191 | | | | 15,987,245 | |
| | | |
Garda World Security Corporation, Term Loan, 7.24%, (3 mo. USD LIBOR + 4.25%), 10/30/26 | | | | | | | 11,995 | | | | 11,465,343 | |
| | | |
GFL Environmental, Inc., Term Loan, 7.415%, (3 mo. USD LIBOR + 3.00%), 5/30/25 | | | | | | | 7,574 | | | | 7,547,159 | |
| | | |
Harsco Corporation, Term Loan, 6.063%, (1 mo. USD LIBOR + 2.25%), 3/10/28 | | | | | | | 3,407 | | | | 2,990,385 | |
| | | |
LABL, Inc., Term Loan, 8.754%, (1 mo. USD LIBOR + 5.00%), 10/29/28 | | | | | | | 8,660 | | | | 8,016,590 | |
| | | |
Monitronics International, Inc., Term Loan, 11.915%, (3 mo. USD LIBOR + 6.50%), 3/29/24 | | | | | | | 16,842 | | | | 11,143,936 | |
| | | |
PECF USS Intermediate Holding III Corporation, Term Loan, 8.004%, (1 mo. USD LIBOR + 4.25%), 12/15/28 | | | | | | | 9,916 | | | | 7,709,036 | |
| | | |
| Phoenix Services International, LLC: | | | | | | | | | |
| | | |
DIP Loan, 5.559%, (SOFR + 2.00%), 3/28/23 | | | | | | | 852 | | | | 852,152 | |
| | | |
Term Loan, 0.00%, 3/1/25(12) | | | | | | | 8,551 | | | | 1,913,339 | |
| | | |
Prime Security Services Borrower, LLC, Term Loan, 6.505%, (3 mo. USD LIBOR + 2.75%), 9/23/26 | | | | | | | 13,506 | | | | 13,328,306 | |
| | | |
SITEL Group, Term Loan, 4.883%, (1 mo. EURIBOR + 3.75%), 8/28/28 | | | EUR | | | | 6,425 | | | | 6,099,493 | |
| | | | |
| | 31 | | See Notes to Financial Statements. |
Eaton Vance
Floating Rate Portfolio
October 31, 2022
Portfolio of Investments — continued
| | | | | | | | | | | | |
| Borrower/Description | | | | | Principal
Amount* (000’s omitted) | | | Value | |
|
| Commercial Services & Supplies (continued) | |
| | | |
SITEL Worldwide Corporation, Term Loan, 7.51%, (1 mo. USD LIBOR + 3.75%), 8/28/28 | | | | | | | 17,108 | | | $ | 16,872,809 | |
| | | |
Tempo Acquisition, LLC, Term Loan, 6.729%, (SOFR + 3.00%), 8/31/28 | | | | | | | 2,487 | | | | 2,460,261 | |
| | | |
TruGreen Limited Partnership, Term Loan, 7.754%, (1 mo. USD LIBOR + 4.00%), 11/2/27 | | | | | | | 4,028 | | | | 3,741,237 | |
| | | |
Werner FinCo, L.P., Term Loan, 7.674%, (3 mo. USD LIBOR + 4.00%), 7/24/24 | | | | | | | 4,619 | | | | 4,203,202 | |
| | | |
| | | | | | | | | | | $ | 138,567,927 | |
|
| Communications Equipment — 0.3% | |
| | | |
CommScope, Inc., Term Loan, 7.004%, (1 mo. USD LIBOR + 3.25%), 4/6/26 | | | | | | | 15,296 | | | $ | 14,646,023 | |
| | | |
Digi International, Inc., Term Loan, 8.754%, (1 mo. USD LIBOR + 5.00%), 11/1/28 | | | | | | | 4,893 | | | | 4,813,348 | |
| | | |
Tiger Acquisition, LLC, Term Loan, 7.004%, (1 mo. USD LIBOR + 3.25%), 6/1/28 | | | | | | | 3,354 | | | | 3,140,957 | |
| | | |
| | | | | | | | | | | $ | 22,600,328 | |
|
| Construction Materials — 0.4% | |
| | | |
Oscar AcquisitionCo, LLC, Term Loan, 8.153%, (SOFR + 4.50%), 4/29/29 | | | | | | | 13,300 | | | $ | 12,083,050 | |
| | | |
Quikrete Holdings, Inc.: | | | | | | | | | | | | |
| | | |
Term Loan, 6.379%, (1 mo. USD LIBOR + 2.63%), 2/1/27 | | | | | | | 4,270 | | | | 4,159,524 | |
| | | |
Term Loan, 6.754%, (1 mo. USD LIBOR + 3.00%), 6/11/28 | | | | | | | 19,207 | | | | 18,760,606 | |
| | | |
| | | | | | | | | | | $ | 35,003,180 | |
|
| Containers & Packaging — 1.2% | |
| | | |
Berlin Packaging, LLC, Term Loan, 6.911%, (USD LIBOR + 3.75%), 3/11/28(9) | | | | | | | 5,431 | | | $ | 5,210,343 | |
| | | |
BWAY Holding Company, Term Loan, 6.378%, (1 mo. USD LIBOR + 3.25%), 4/3/24 | | | | | | | 10,996 | | | | 10,462,023 | |
| | | |
Clydesdale Acquisition Holdings, Inc., Term Loan, 8.004%, (SOFR + 4.18%), 4/13/29 | | | | | | | 8,803 | | | | 8,493,365 | |
| | | |
Kouti B.V., Term Loan, 3.757%, (3 mo. EURIBOR + 3.18%), 8/31/28 | | | EUR | | | | 29,250 | | | | 25,822,955 | |
| | | |
Pregis TopCo Corporation: | | | | | | | | | | | | |
| | | |
Term Loan, 7.754%, (1 mo. USD LIBOR + 4.00%), 7/31/26 | | | | | | | 1,361 | | | | 1,301,128 | |
| | | |
Term Loan, 7.843%, (1 mo. USD LIBOR + 4.00%), 7/31/26 | | | | | | | 1,985 | | | | 1,897,864 | |
| | | |
Pretium PKG Holdings, Inc.: | | | | | | | | | | | | |
| | | |
Term Loan, 7.60%, (USD LIBOR + 4.00%), 10/2/28(9) | | | | | | | 7,121 | | | | 6,260,713 | |
| | | |
Term Loan - Second Lien, 10.205%, (USD LIBOR + 6.75%), 10/1/29(9) | | | | | | | 6,675 | | | | 5,640,375 | |
| | | | | | | | | | | | |
| Borrower/Description | | | | | Principal
Amount* (000’s omitted) | | | Value | |
|
| Containers & Packaging (continued) | |
| | | |
Pro Mach Group, Inc., Term Loan, 7.754%, (1 mo. USD LIBOR + 4.00%), 8/31/28 | | | | | | | 2,827 | | | $ | 2,760,681 | |
| | | |
Proampac PG Borrower, LLC, Term Loan, 7.728%, (USD LIBOR + 3.75%), 11/3/25(9) | | | | | | | 22,806 | | | | 21,772,257 | |
| | | |
| Trident TPI Holdings, Inc.: | | | | | | | | | |
| | | |
Term Loan, 6.30%, (3 mo. USD LIBOR + 4.00%), 9/15/28(10) | | | | | | | 713 | | | | 678,276 | |
| | | |
Term Loan, 7.674%, (3 mo. USD LIBOR + 4.00%), 9/15/28 | | | | | | | 5,006 | | | | 4,761,159 | |
| | | |
| | | | | | | | | | | $ | 95,061,139 | |
|
| Distributors — 0.5% | |
| | | |
Autokiniton US Holdings, Inc., Term Loan, 7.80%, (1 mo. USD LIBOR + 4.50%), 4/6/28 | | | | | | | 20,788 | | | $ | 19,494,405 | |
| | | |
Phillips Feed Service, Inc., Term Loan, 10.48%, (1 mo. USD LIBOR + 7.00%), 11/13/24(4) | | | | | | | 475 | | | | 380,380 | |
| | | |
White Cap Buyer, LLC, Term Loan, 7.479%, (SOFR + 3.75%), 10/19/27 | | | | | | | 18,515 | | | | 17,579,512 | |
| | | |
| | | | | | | | | | | $ | 37,454,297 | |
|
| Diversified Consumer Services — 0.7% | |
| | | |
| Ascend Learning, LLC: | | | | | | | | | |
| | | |
Term Loan, 7.132%, (1 mo. USD LIBOR + 3.50%), 12/11/28 | | | | | | | 13,904 | | | $ | 12,803,189 | |
| | | |
Term Loan - Second Lien, 9.504%, (1 mo. USD LIBOR + 5.75%), 12/10/29 | | | | | | | 5,243 | | | | 4,469,931 | |
| | | |
Corporation Service Company, Term Loan, 8/31/29(11) | | | | | | | 5,100 | | | | 5,007,563 | |
| | | |
FrontDoor, Inc., Term Loan, 6.004%, (1 mo. USD LIBOR + 2.25%), 6/17/28 | | | | | | | 864 | | | | 837,421 | |
| | | |
| KUEHG Corp.: | | | | | | | | | |
| | | |
Term Loan, 7.504%, (1 mo. USD LIBOR + 3.75%), 2/21/25 | | | | | | | 28,637 | | | | 27,503,145 | |
| | | |
Term Loan - Second Lien, 12.004%, (1 mo. USD LIBOR + 8.25%), 8/22/25 | | | | | | | 4,425 | | | | 4,309,950 | |
| | | |
Sotheby’s, Term Loan, 8.579%, (3 mo. USD LIBOR + 4.50%), 1/15/27 | | | | | | | 4,025 | | | | 3,953,179 | |
| | | |
| | | | | | | | | | | $ | 58,884,378 | |
|
| Diversified Financial Services — 0.5% | |
| | | |
Concorde Midco Ltd., Term Loan, 5.16%, (3 mo. EURIBOR + 4.00%), 3/1/28 | | | EUR | | | | 8,730 | | | $ | 7,843,766 | |
| | | |
Sandy BidCo B.V., Term Loan, 6.038%, (6 mo. EURIBOR + 4.00%), 8/17/29 | | | EUR | | | | 19,258 | | | | 18,175,649 | |
| | | |
| Zephyr Bidco Limited: | | | | | | | | | |
| | | |
Term Loan, 4.693%, (1 mo. EURIBOR + 3.75%), 7/23/25 | | | EUR | | | | 4,975 | | | | 4,186,436 | |
| | | |
Term Loan, 6.934%, (SONIA + 4.75%), 7/23/25 | | | GBP | | | | 8,675 | | | | 7,784,690 | |
| | | |
| | | | | | | | | | | $ | 37,990,541 | |
| | | | |
| | 32 | | See Notes to Financial Statements. |
Eaton Vance
Floating Rate Portfolio
October 31, 2022
Portfolio of Investments — continued
| | | | | | | | | | |
| Borrower/Description | | | | Principal
Amount* (000’s omitted) | | | Value | |
|
| Diversified Telecommunication Services — 3.6% | |
| | | |
Altice France S.A.: | | | | | | | | | | |
| | | |
Term Loan, 6.905%, (3 mo. USD LIBOR + 4.00%), 8/14/26 | | | | | 7,265 | | | $ | 6,678,022 | |
| | | |
Term Loan, 7.767%, (3 mo. USD LIBOR + 3.69%), 1/31/26 | | | | | 4,403 | | | | 3,975,102 | |
| | | |
CenturyLink, Inc., Term Loan, 6.004%, (1 mo. USD LIBOR + 2.25%), 3/15/27 | | | | | 42,192 | | | | 39,440,939 | |
| | | |
GEE Holdings 2, LLC: | | | | | | | | | | |
| | | |
Term Loan, 11.604%, (3 mo. USD LIBOR + 8.00%), 3/24/25 | | | | | 9,639 | | | | 9,675,264 | |
| | | |
Term Loan - Second Lien, 11.854%, (3 mo. USD LIBOR + 8.25%), 5.104% cash, 6.75% PIK, 3/23/26 | | | | | 6,865 | | | | 5,263,294 | |
| | | |
LCPR Loan Financing, LLC, Term Loan, 7.162%, (1 mo. USD LIBOR + 3.75%), 10/16/28 | | | | | 1,650 | | | | 1,612,360 | |
| | | |
Level 3 Financing, Inc., Term Loan, 5.504%, (1 mo. USD LIBOR + 1.75%), 3/1/27 | | | | | 851 | | | | 810,050 | |
| | | |
Numericable Group S.A.: | | | | | | | | | | |
| | | |
Term Loan, 4.605%, (3 mo. EURIBOR + 3.00%), 7/31/25 | | EUR | | | 6,946 | | | | 6,340,630 | |
| | | |
Term Loan, 7.165%, (3 mo. USD LIBOR + 2.75%), 7/31/25 | | | | | 10,666 | | | | 9,717,957 | |
| | | |
Telenet Financing USD, LLC, Term Loan, 5.412%, (1 mo. USD LIBOR + 2.00%), 4/30/28 | | | | | 32,325 | | | | 31,378,330 | |
| | | |
Telenet International Finance S.a.r.l., Term Loan, 2.613%, (6 mo. EURIBOR + 2.25%), 4/30/29 | | EUR | | | 5,000 | | | | 4,654,656 | |
| | | |
UPC Broadband Holding B.V.: | | | | | | | | | | |
| | | |
Term Loan, 2.863%, (6 mo. EURIBOR + 2.50%), 4/30/29 | | EUR | | | 4,850 | | | | 4,487,457 | |
| | | |
Term Loan, 3.363%, (6 mo. EURIBOR + 3.00%), 1/31/29 | | EUR | | | 13,850 | | | | 12,925,905 | |
| | | |
Term Loan, 5.662%, (1 mo. USD LIBOR + 2.25%), 4/30/28 | | | | | 5,800 | | | | 5,667,081 | |
| | | |
UPC Financing Partnership, Term Loan, 6.337%, (1 mo. USD LIBOR + 2.93%), 1/31/29 | | | | | 28,800 | | | | 28,229,155 | |
| | | |
Virgin Media Bristol, LLC: | | | | | | | | | | |
| | | |
Term Loan, 5.912%, (1 mo. USD LIBOR + 2.50%), 1/31/28 | | | | | 38,775 | | | | 38,093,762 | |
| | | |
Term Loan, 6.662%, (1 mo. USD LIBOR + 3.25%), 1/31/29 | | | | | 500 | | | | 493,047 | |
| | | |
Virgin Media Ireland Limited, Term Loan, 3.863%, (6 mo. EURIBOR + 3.50%), 7/15/29 | | EUR | | | 8,500 | | | | 7,894,368 | |
| | | |
Virgin Media SFA Finance Limited: | | | | | | | | | | |
| | | |
Term Loan, 3.345%, (1 mo. EURIBOR + 2.50%), 1/31/29 | | EUR | | | 11,625 | | | | 10,727,296 | |
| | | |
Term Loan, 5.469%, (SONIA + 3.25%), 1/15/27 | | GBP | | | 8,175 | | | | 8,414,140 | |
| | | |
Term Loan, 5.469%, (SONIA + 3.25%), 11/15/27 | | GBP | | | 600 | | | | 618,842 | |
| | | |
Zayo Group Holdings, Inc., Term Loan, 4.383%, (1 mo. EURIBOR + 3.25%), 3/9/27 | | EUR | | | 4,141 | | | | 3,326,864 | |
| | | | | | | | | | | | |
| Borrower/Description | | | | | Principal
Amount* (000’s omitted) | | | Value | |
|
| Diversified Telecommunication Services (continued) | |
| | | |
Ziggo B.V., Term Loan, 3.764%, (6 mo. EURIBOR + 3.00%), 1/31/29 | | | EUR | | | | 28,150 | | | $ | 25,757,630 | |
| | | |
Ziggo Financing Partnership, Term Loan, 5.912%, (1 mo. USD LIBOR + 2.50%), 4/30/28 | | | | | | | 21,734 | | | | 21,202,388 | |
| | | |
| | | | | | | | | | | $ | 287,384,539 | |
|
| Electrical Equipment — 0.1% | |
| | | |
AZZ, Inc., Term Loan, 8.079%, (SOFR + 4.25%), 5/13/29 | | | | | | | 1,834 | | | $ | 1,820,101 | |
| | | |
Brookfield WEC Holdings, Inc., Term Loan, 6.504%, (1 mo. USD LIBOR + 2.75%), 8/1/25 | | | | | | | 1,537 | | | | 1,512,757 | |
| | | |
GrafTech Finance, Inc., Term Loan, 6.754%, (1 mo. USD LIBOR + 3.00%), 2/12/25 | | | | | | | 3,351 | | | | 3,196,095 | |
| | | |
II-VI Incorporated, Term Loan, 5.878%, (1 mo. USD LIBOR + 2.75%), 7/2/29 | | | | | | | 438 | | | | 425,906 | |
| | | |
| | | | | | | | | | | $ | 6,954,859 | |
|
| Electronic Equipment, Instruments & Components — 1.0% | |
| | | |
Chamberlain Group, Inc., Term Loan, 7.254%, (1 mo. USD LIBOR + 3.50%), 11/3/28 | | | | | | | 18,634 | | | $ | 16,999,820 | |
| | | |
Creation Technologies, Inc., Term Loan, 9.248%, (3 mo. USD LIBOR + 5.50%), 10/5/28 | | | | | | | 11,443 | | | | 9,497,275 | |
| | | |
Minimax Viking GmbH, Term Loan, 3.883%, (1 mo. EURIBOR + 2.75%), 7/31/25 | | | EUR | | | | 1,856 | | | | 1,782,308 | |
| | | |
Mirion Technologies, Inc., Term Loan, 5.627%, (6 mo. USD LIBOR + 2.75%), 10/20/28 | | | | | | | 7,292 | | | | 7,123,751 | |
| | | |
Robertshaw US Holding Corp., Term Loan, 7.313%, (1 mo. USD LIBOR + 3.50%), 2/28/25 | | | | | | | 16,985 | | | | 13,885,096 | |
| | | |
Verifone Systems, Inc., Term Loan, 6.997%, (3 mo. USD LIBOR + 4.00%), 8/20/25 | | | | | | | 13,766 | | | | 12,298,735 | |
| | | |
Verisure Holding AB: | | | | | | | | | | | | |
| | | |
Term Loan, 3.473%, (6 mo. EURIBOR + 3.25%), 3/27/28 | | | EUR | | | | 15,450 | | | | 14,342,808 | |
| | | |
Term Loan, 3.753%, (6 mo. EURIBOR + 3.25%), 7/20/26 | | | EUR | | | | 4,475 | | | | 4,176,973 | |
| | | |
| | | | | | | | | | | $ | 80,106,766 | |
|
| Energy Equipment & Services — 0.3% | |
| | | |
Ameriforge Group, Inc.: | | | | | | | | | | | | |
| | | |
Term Loan, 15.029%, (1 mo. USD LIBOR + 13.00%), 12/29/23(10) | | | | | | | 3,086 | | | $ | 1,531,602 | |
| | | |
Term Loan, 16.67%, (3 mo. USD LIBOR + 8.00%), 11.67% cash, 5.00% PIK, 12/31/23 | | | | | | | 24,185 | | | | 12,002,041 | |
| | | |
Lealand Finance Company B.V.: | | | | | | | | | | | | |
| | | |
Term Loan, 6/28/24(11) | | | | | | | 9,039 | | | | 7,412,283 | |
| | | |
Term Loan, 7.754%, (1 mo. USD LIBOR + 4.00%), 4.754% cash, 3.00% PIK, 6/30/25 | | | | | | | 2,443 | | | | 1,302,819 | |
| | | |
| | | | | | | | | | | $ | 22,248,745 | |
| | | | |
| | 33 | | See Notes to Financial Statements. |
Eaton Vance
Floating Rate Portfolio
October 31, 2022
Portfolio of Investments — continued
| | | | | | | | | | | | |
| Borrower/Description | | | | | Principal
Amount* (000’s omitted) | | | Value | |
|
| Engineering & Construction — 1.0% | |
| | | |
Aegion Corporation, Term Loan, 8.504%, (1 mo. USD LIBOR + 4.75%), 5/17/28 | | | | | | | 15,918 | | | $ | 14,756,954 | |
| | | |
| Amentum Government Services Holdings, LLC: | | | | | | | | | |
| | | |
Term Loan, 7.393%, (SOFR + 4.00%), 2/15/29(9) | | | | | | | 8,354 | | | | 8,124,326 | |
| | | |
Term Loan, 7.798%, (3 mo. USD LIBOR + 4.00%), 1/29/27 | | | | | | | 5,790 | | | | 5,630,476 | |
| | | |
American Residential Services, LLC, Term Loan, 7.174%, (3 mo. USD LIBOR + 3.50%), 10/15/27 | | | | | | | 7,525 | | | | 7,337,052 | |
| | | |
| APi Group DE, Inc.: | | | | | | | | | |
| | | |
Term Loan, 6.254%, (1 mo. USD LIBOR + 2.50%), 10/1/26 | | | | | | | 12,964 | | | | 12,803,257 | |
| | | |
Term Loan, 6.504%, (1 mo. USD LIBOR + 2.75%), 1/3/29 | | | | | | | 7,686 | | | | 7,590,879 | |
| | | |
Centuri Group, Inc., Term Loan, 5.57%, (3 mo. USD LIBOR + 2.50%), 8/27/28 | | | | | | | 8,390 | | | | 8,231,543 | |
| | | |
Northstar Group Services, Inc., Term Loan, 9.254%, (1 mo. USD LIBOR + 5.50%), 11/12/26 | | | | | | | 11,113 | | | | 10,973,895 | |
| | | |
USIC Holdings, Inc., Term Loan, 7.254%, (1 mo. USD LIBOR + 3.50%), 5/12/28 | | | | | | | 5,990 | | | | 5,707,808 | |
| | | |
| | | | | | | | | | | $ | 81,156,190 | |
|
| Entertainment — 2.0% | |
| | | |
Alchemy Copyrights, LLC, Term Loan, 6.128%, (1 mo. USD LIBOR + 3.00%), 3/10/28 | | | | | | | 3,553 | | | $ | 3,534,895 | |
| | | |
AMC Entertainment Holdings, Inc., Term Loan, 6.314%, (1 mo. USD LIBOR + 3.00%), 4/22/26 | | | | | | | 19,650 | | | | 14,049,945 | |
| | | |
City Football Group Limited, Term Loan, 6.484%, (3 mo. USD LIBOR + 3.50%), 7/21/28 | | | | | | | 11,821 | | | | 11,052,261 | |
| | | |
| Crown Finance US, Inc.: | | | | | | | | | |
| | | |
DIP Loan, 0.00%, 9/7/23(10) | | | | | | | 625 | | | | 628,100 | |
| | | |
DIP Loan, 13.612%, (SOFR + 10.00%), 9/7/23 | | | | | | | 7,441 | | | | 7,475,001 | |
| | | |
Delta 2 (LUX) S.a.r.l., Term Loan, 6.254%, (1 mo. USD LIBOR + 2.50%), 2/1/24 | | | | | | | 62,085 | | | | 62,097,608 | |
| | | |
Live Nation Entertainment, Inc., Term Loan, 5.313%, (1 mo. USD LIBOR + 1.75%), 10/17/26 | | | | | | | 5,629 | | | | 5,438,755 | |
| | | |
Playtika Holding Corp., Term Loan, 6.504%, (1 mo. USD LIBOR + 2.75%), 3/13/28 | | | | | | | 30,593 | | | | 29,833,926 | |
| | | |
| Renaissance Holding Corp.: | | | | | | | | | |
| | | |
Term Loan, 7.004%, (1 mo. USD LIBOR + 3.25%), 5/30/25 | | | | | | | 5,979 | | | | 5,796,350 | |
| | | |
Term Loan, 7.608%, (SOFR + 4.50%), 3/30/29 | | | | | | | 2,569 | | | | 2,491,506 | |
| | | |
Term Loan - Second Lien, 10.754%, (1 mo. USD LIBOR + 7.00%), 5/29/26 | | | | | | | 3,175 | | | | 3,034,770 | |
| | | |
UFC Holdings, LLC, Term Loan, 7.11%, (3 mo. USD LIBOR + 2.75%), 4/29/26 | | | | | | | 14,562 | | | | 14,273,995 | |
| | | |
| Vue International Bidco PLC: | | | | | | | | | |
| | | |
Term Loan, 5.66%, (2 mo. EURIBOR + 4.75%), 7/3/26 | | | EUR | | | | 3,878 | | | | 2,618,652 | |
| | | | | | | | | | | | |
| Borrower/Description | | | | | Principal
Amount* (000’s omitted) | | | Value | |
|
| Entertainment (continued) | |
| | | |
| Vue International Bidco PLC: (continued) | | | | | | | | | |
| | | |
Term Loan, 9.766%, (3 mo. EURIBOR + 8.00%), 6/30/27 | | | EUR | | | | 434 | | | $ | 404,895 | |
| | | |
| | | | | | | | | | | $ | 162,730,659 | |
|
| Equity Real Estate Investment Trusts (REITs) — 0.1% | |
| | | |
Iron Mountain, Inc., Term Loan, 5.504%, (1 mo. USD LIBOR + 1.75%), 1/2/26 | | | | | | | 8,699 | | | $ | 8,557,706 | |
| | | |
| | | | | | | | | | | $ | 8,557,706 | |
|
| Food Products — 0.8% | |
| | | |
8th Avenue Food & Provisions, Inc., Term Loan, 8.382%, (1 mo. USD LIBOR + 4.75%), 10/1/25 | | | | | | | 6,608 | | | $ | 5,798,739 | |
| | | |
Badger Buyer Corp., Term Loan, 7.254%, (1 mo. USD LIBOR + 3.50%), 9/30/24 | | | | | | | 4,826 | | | | 4,252,934 | |
| | | |
CHG PPC Parent, LLC: | | | | | | | | | | | | |
| | | |
Term Loan, 4.633%, (1 mo. EURIBOR + 3.50%), 3/31/25 | | | EUR | | | | 2,000 | | | | 1,876,850 | |
| | | |
Term Loan, 6.632%, (1 mo. USD LIBOR + 3.00%), 12/8/28 | | | | | | | 5,796 | | | | 5,621,999 | |
| | | |
Del Monte Foods, Inc., Term Loan, 7.827%, (SOFR + 4.35%), 5/16/29 | | | | | | | 6,325 | | | | 6,155,016 | |
| | | |
Froneri International, Ltd.: | | | | | | | | | | | | |
| | | |
Term Loan, 3.006%, (6 mo. EURIBOR + 2.38%), 1/29/27 | | | EUR | | | | 1,500 | | | | 1,355,446 | |
| | | |
Term Loan, 6.004%, (1 mo. USD LIBOR + 2.25%), 1/29/27 | | | | | | | 4,740 | | | | 4,585,480 | |
| | | |
Monogram Food Solutions, LLC, Term Loan, 7.813%, (1 mo. USD LIBOR + 4.00%), 8/28/28 | | | | | | | 5,980 | | | | 5,830,317 | |
| | | |
Nomad Foods Europe Midco Limited, Term Loan, 5.155%, (3 mo. USD LIBOR + 2.25%), 5/15/24 | | | | | | | 10,406 | | | | 10,346,417 | |
| | | |
Sovos Brands Intermediate, Inc., Term Loan, 7.915%, (3 mo. USD LIBOR + 3.50%), 6/8/28 | | | | | | | 5,259 | | | | 5,056,009 | |
| | | |
United Petfood Group B.V., Term Loan, 4.558%, (3 mo. EURIBOR + 3.00%), 4/23/28 | | | EUR | | | | 8,400 | | | | 7,574,934 | |
| | | |
Valeo F1 Company Limited (Ireland): | | | | | | | | | | | | |
| | | |
Term Loan, 5.193%, (3 mo. EURIBOR + 4.00%), 6/30/28 | | | EUR | | | | 8,550 | | | | 7,213,791 | |
| | | |
Term Loan, 7.188%, (SONIA + 5.00%), 6/28/28 | | | GBP | | | | 2,500 | | | | 2,365,274 | |
| | | |
| | | | | | | | | | | $ | 68,033,206 | |
|
| Gas Utilities — 0.3% | |
| | | |
CQP Holdco, L.P., Term Loan, 7.424%, (3 mo. USD LIBOR + 3.75%), 6/5/28 | | | | | | | 27,356 | | | $ | 27,058,464 | |
| | | |
| | | | | | | | | | | $ | 27,058,464 | |
| | | | |
| | 34 | | See Notes to Financial Statements. |
Eaton Vance
Floating Rate Portfolio
October 31, 2022
Portfolio of Investments — continued
| | | | | | | | | | | | |
| Borrower/Description | | | | | Principal Amount* (000’s omitted) | | | Value | |
|
| Health Care Equipment & Supplies — 0.9% | |
| | | |
Bayou Intermediate II, LLC, Term Loan, 7.302%, (3 mo. USD LIBOR + 4.50%), 8/2/28 | | | | | | | 8,188 | | | $ | 7,860,600 | |
| | | |
CryoLife, Inc., Term Loan, 7.174%, (3 mo. USD LIBOR + 3.50%), 6/1/27 | | | | | | | 6,713 | | | | 6,293,526 | |
| | | |
Gloves Buyer, Inc., Term Loan, 7.754%, (1 mo. USD LIBOR + 4.00%), 12/29/27 | | | | | | | 12,246 | | | | 11,144,004 | |
| | | |
ICU Medical, Inc., Term Loan, 5.961%, (SOFR + 2.25%), 1/8/29(9) | | | | | | | 7,438 | | | | 7,290,033 | |
| | | |
Journey Personal Care Corp., Term Loan, 7.924%, (3 mo. USD LIBOR + 4.25%), 3/1/28 | | | | | | | 25,771 | | | | 16,596,446 | |
| | | |
Medline Borrower, L.P., Term Loan, 7.004%, (1 mo. USD LIBOR + 3.25%), 10/23/28 | | | | | | | 28,457 | | | | 26,196,262 | |
| | | |
| | | | | | | | | | | $ | 75,380,871 | |
|
| Health Care Providers & Services — 4.8% | |
| | | |
AEA International Holdings (Lux) S.a.r.l., Term Loan, 7.438%, (3 mo. USD LIBOR + 3.75%), 9/7/28 | | | | | | | 16,327 | | | $ | 16,081,665 | |
| | | |
Biogroup-LCD, Term Loan, 4.742%, (3 mo. EURIBOR + 2.75%), 2/9/28 | | | EUR | | | | 10,650 | | | | 9,516,231 | |
| | | |
BW NHHC Holdco, Inc., Term Loan, 7.961%, (3 mo. USD LIBOR + 5.00%), 5/15/25 | | | | | | | 13,718 | | | | 8,671,083 | |
| | | |
CAB, Term Loan, 3.527%, (3 mo. EURIBOR + 3.25%), 2/9/28 | | | EUR | | | | 7,150 | | | | 6,633,194 | |
| | | |
Cano Health, LLC, Term Loan, 7.829%, (SOFR + 4.00%), 11/23/27 | | | | | | | 7,300 | | | | 6,264,524 | |
| | | |
CCRR Parent, Inc., Term Loan, 7.51%, (1 mo. USD LIBOR + 3.75%), 3/6/28 | | | | | | | 4,757 | | | | 4,620,434 | |
| | | |
| Cerba Healthcare S.A.S.: | | | | | | | | | |
| | | |
Term Loan, 4.383%, (1 mo. EURIBOR + 3.25%), 6/30/28 | | | EUR | | | | 18,925 | | | | 17,050,567 | |
| | | |
Term Loan, 5.133%, (1 mo. EURIBOR + 4.00%), 2/15/29 | | | EUR | | | | 8,225 | | | | 7,696,535 | |
| | | |
CHG Healthcare Services, Inc., Term Loan, 7.004%, (3 mo. USD LIBOR + 3.25%), 9/29/28 | | | | | | | 3,712 | | | | 3,611,602 | |
| | | |
Covis Finco S.a.r.l., Term Loan, 10.203%, (SOFR + 6.50%), 2/18/27 | | | | | | | 13,236 | | | | 8,934,047 | |
| | | |
Dedalus Finance GmbH, Term Loan, 5.782%, (6 mo. EURIBOR + 3.75%), 7/17/27 | | | EUR | | | | 16,850 | | | | 14,570,507 | |
| | | |
Electron BidCo, Inc., Term Loan, 6.754%, (1 mo. USD LIBOR + 3.00%), 11/1/28 | | | | | | | 5,923 | | | | 5,747,355 | |
| | | |
Elsan S.A.S., Term Loan, 4.314%, (EURIBOR + 3.35%), 6/16/28(9) | | | EUR | | | | 4,100 | | | | 3,794,784 | |
| | | |
Ensemble RCM, LLC, Term Loan, 7.944%, (SOFR + 3.75%), 8/3/26 | | | | | | | 14,731 | | | | 14,528,459 | |
| | | |
| Envision Healthcare Corporation: | | | | | | | | | |
| | | |
Term Loan, 11.603%, (SOFR + 7.88%), 3/31/27 | | | | | | | 5,463 | | | | 5,074,065 | |
| | | |
Term Loan - Second Lien, 6.825%, (SOFR + 4.25%), 3/31/27 | | | | | | | 38,737 | | | | 16,979,905 | |
| | | | | | | | | | |
| Borrower/Description | | | | Principal Amount* (000’s omitted) | | | Value | |
|
| Health Care Providers & Services (continued) | |
| | | |
| IVC Acquisition, Ltd.: | | | | | | | | |
| | | |
Term Loan, 4.141%, (3 mo. EURIBOR + 3.75%), 2/13/26 | | EUR | | | 8,710 | | | $ | 7,983,600 | |
| | | |
Term Loan, 4.391%, (3 mo. EURIBOR + 4.00%), 2/13/26 | | EUR | | | 19,100 | | | | 17,654,547 | |
| | | |
Term Loan, 6.309%, (SONIA + 4.50%), 2/13/26 | | GBP | | | 950 | | | | 984,871 | |
| | | |
MDVIP, Inc., Term Loan, 7.072%, (1 mo. USD LIBOR + 3.50%), 10/16/28 | | | | | 5,547 | | | | 5,370,310 | |
| | | |
| Medical Solutions Holdings, Inc.: | | | | | | | | |
| | | |
Term Loan, 3.50%, 11/1/28(10) | | | | | 1,924 | | | | 1,859,146 | |
| | | |
Term Loan, 6.377%, (3 mo. USD LIBOR + 3.50%), 11/1/28 | | | | | 11,959 | | | | 11,555,672 | |
| | | |
Term Loan - Second Lien, 9.877%, (3 mo. USD LIBOR + 7.00%), 11/1/29 | | | | | 9,500 | | | | 9,143,750 | |
| | | |
Mehilainen Yhtiot Oy, Term Loan, 4.718%, (3 mo. EURIBOR + 3.53%), 8/11/25 | | EUR | | | 7,525 | | | | 6,990,384 | |
| | | |
Midwest Physician Administrative Services, LLC, Term Loan, 6.924%, (3 mo. USD LIBOR + 3.25%), 3/12/28 | | | | | 1,424 | | | | 1,289,554 | |
| | | |
| National Mentor Holdings, Inc.: | | | | | | | | |
| | | |
Term Loan, 7.43%, (3 mo. USD LIBOR + 3.75%), 3/2/28 | | | | | 472 | | | | 340,669 | |
| | | |
Term Loan, 7.466%, (USD LIBOR + 3.75%), 3/2/28(9) | | | | | 17,264 | | | | 12,467,835 | |
| | | |
Term Loan - Second Lien, 10.93%, (3 mo. USD LIBOR + 7.25%), 3/2/29 | | | | | 5,525 | | | | 3,798,437 | |
| | | |
Option Care Health, Inc., Term Loan, 6.504%, (1 mo. USD LIBOR + 2.75%), 10/27/28 | | | | | 7,369 | | | | 7,244,955 | |
| | | |
Pearl Intermediate Parent, LLC, Term Loan - Second Lien, 10.004%, (1 mo. USD LIBOR + 6.25%), 2/13/26 | | | | | 2,350 | | | | 2,150,250 | |
| | | |
| Pediatric Associates Holding Company, LLC: | | | | | | | | |
| | | |
Term Loan, 5.122%, (1 mo. USD LIBOR + 3.25%), 12/29/28(10) | | | | | 148 | | | | 142,858 | |
| | | |
Term Loan, 7.004%, (1 mo. USD LIBOR + 3.25%), 12/29/28 | | | | | 972 | | | | 940,496 | |
| | | |
PetVet Care Centers, LLC, Term Loan, 7.254%, (1 mo. USD LIBOR + 3.50%), 2/14/25 | | | | | 5,897 | | | | 5,543,090 | |
| | | |
| Phoenix Guarantor, Inc.: | | | | | | | | |
| | | |
Term Loan, 7.004%, (1 mo. USD LIBOR + 3.25%), 3/5/26 | | | | | 21,429 | | | | 20,612,107 | |
| | | |
Term Loan, 7.254%, (1 mo. USD LIBOR + 3.50%), 3/5/26 | | | | | 6,419 | | | | 6,174,084 | |
| | | |
Radiology Partners, Inc., Term Loan, 7.825%, (1 mo. USD LIBOR + 4.25%), 7/9/25 | | | | | 25,462 | | | | 20,687,902 | |
| | | |
Radnet Management, Inc., Term Loan, 6.754%, (1 mo. USD LIBOR + 3.00%), 4/21/28 | | | | | 8,825 | | | | 8,589,377 | |
| | | | |
| | 35 | | See Notes to Financial Statements. |
Eaton Vance
Floating Rate Portfolio
October 31, 2022
Portfolio of Investments — continued
| | | | | | | | | | | | |
| Borrower/Description | | | | | Principal Amount* (000’s omitted) | | | Value | |
|
| Health Care Providers & Services (continued) | |
| | | |
Ramsay Generale de Sante S.A., Term Loan, 4.302%, (3 mo. EURIBOR + 2.80%), 4/22/27 | | | EUR | | | | 9,100 | | | $ | 8,509,695 | |
| | | |
Select Medical Corporation, Term Loan, 6.26%, (1 mo. USD LIBOR + 2.50%), 3/6/25 | | | | | | | 45,148 | | | | 44,025,942 | |
| | | |
Sound Inpatient Physicians: | | | | | | | | | | | | |
| | | |
Term Loan, 6/27/25(11) | | | | | | | 200 | | | | 158,800 | |
| | | |
Term Loan, 6.754%, (1 mo. USD LIBOR + 3.00%), 6/27/25 | | | | | | | 2,345 | | | | 1,864,523 | |
| | | |
Synlab Bondco PLC, Term Loan, 2.778%, (6 mo. EURIBOR + 2.50%), 7/1/27 | | | EUR | | | | 2,125 | | | | 2,009,030 | |
| | | |
TTF Holdings, LLC, Term Loan, 7.813%, (1 mo. USD LIBOR + 4.00%), 3/31/28 | | | | | | | 5,083 | | | | 4,993,648 | |
| | | |
U.S. Anesthesia Partners, Inc., Term Loan, 7.378%, (1 mo. USD LIBOR + 4.25%), 10/1/28 | | | | | | | 13,991 | | | | 13,264,061 | |
| | | |
WP CityMD Bidco, LLC, Term Loan, 6.924%, (3 mo. USD LIBOR + 3.25%), 12/22/28 | | | | | | | 10,660 | | | | 10,388,016 | |
| | | |
| | | | | | | | | | | $ | 386,512,566 | |
| | | |
| Health Care Technology — 1.8% | | | | | | | | | |
| | | |
athenahealth, Inc.: | | | | | | | | | | | | |
| | | |
Term Loan, 3.50%, 2/15/29(10) | | | | | | | 1,834 | | | $ | 1,674,236 | |
| | | |
Term Loan, 6.967%, (SOFR + 3.50%), 2/15/29 | | | | | | | 10,794 | | | | 9,853,295 | |
| | | |
Bracket Intermediate Holding Corp., Term Loan, 7.998%, (3 mo. USD LIBOR + 4.25%), 9/5/25 | | | | | | | 11,301 | | | | 10,852,078 | |
| | | |
Certara, L.P., Term Loan, 7.254%, (1 mo. USD LIBOR + 3.50%), 8/15/26 | | | | | | | 1,827 | | | | 1,785,770 | |
| | | |
eResearchTechnology, Inc., Term Loan, 8.254%, (1 mo. USD LIBOR + 4.50%), 2/4/27 | | | | | | | 4,105 | | | | 3,833,053 | |
| | | |
GHX Ultimate Parent Corporation, Term Loan, 6.127%, (6 mo. USD LIBOR + 3.25%), 6/28/24 | | | | | | | 3,412 | | | | 3,304,979 | |
| | | |
Imprivata, Inc.: | | | | | | | | | | | | |
| | | |
Term Loan, 7.504%, (1 mo. USD LIBOR + 3.75%), 12/1/27 | | | | | | | 21,355 | | | | 20,954,411 | |
| | | |
Term Loan, 7.979%, (SOFR + 4.25%), 12/1/27 | | | | | | | 3,292 | | | | 3,251,976 | |
| | | |
MedAssets Software Intermediate Holdings, Inc.: | | | | | | | | | | | | |
| | | |
Term Loan, 7.754%, (1 mo. USD LIBOR + 4.00%), 12/18/28 | | | | | | | 16,393 | | | | 15,572,994 | |
| | | |
Term Loan - Second Lien, 10.504%, (1 mo. USD LIBOR + 6.75%), 12/17/29 | | | | | | | 8,775 | | | | 7,553,809 | |
| | | |
Navicure, Inc., Term Loan, 7.754%, (1 mo. USD LIBOR + 4.00%), 10/22/26 | | | | | | | 12,833 | | | | 12,516,515 | |
| | | |
PointClickCare Technologies, Inc., Term Loan, 5.938%, (6 mo. USD LIBOR + 3.00%), 12/29/27 | | | | | | | 4,236 | | | | 4,152,556 | |
| | | |
Project Ruby Ultimate Parent Corp., Term Loan, 7.004%, (1 mo. USD LIBOR + 3.25%), 3/10/28 | | | | | | | 8,110 | | | | 7,654,846 | |
| | | | | | | | | | | | |
| Borrower/Description | | | | | Principal Amount* (000’s omitted) | | | Value | |
| | | |
| Health Care Technology (continued) | | | | | | | | | |
| | | |
Symplr Software, Inc., Term Loan, 8.694%, (SOFR + 4.50%), 12/22/27 | | | | | | | 12,914 | | | $ | 12,094,351 | |
| | | |
Verscend Holding Corp., Term Loan, 7.754%, (1 mo. USD LIBOR + 4.00%), 8/27/25 | | | | | | | 27,163 | | | | 26,832,027 | |
| | | |
| | | | | | | | | | | $ | 141,886,896 | |
| | | |
| Hotels, Restaurants & Leisure — 3.4% | | | | | | | | | |
| | | |
1011778 B.C. Unlimited Liability Company, Term Loan, 5.504%, (1 mo. USD LIBOR + 1.75%), 11/19/26 | | | | | | | 24,641 | | | $ | 24,014,220 | |
| | | |
Bally’s Corporation, Term Loan, 6.55%, (3 mo. USD LIBOR + 3.25%), 10/2/28 | | | | | | | 11,087 | | | | 10,336,758 | |
| | | |
Carnival Corporation: | | | | | | | | | | | | |
| | | |
Term Loan, 3.975%, (6 mo. EURIBOR + 3.75%), 6/30/25 | | | EUR | | | | 8,881 | | | | 8,381,334 | |
| | | |
Term Loan, 5.877%, (6 mo. USD LIBOR + 3.00%), 6/30/25 | | | | | | | 3,718 | | | | 3,501,068 | |
| | | |
Term Loan, 6.127%, (6 mo. USD LIBOR + 3.25%), 10/18/28 | | | | | | | 34,762 | | | | 31,937,875 | |
| | | |
Churchill Downs Incorporated, Term Loan, 5.76%, (1 mo. USD LIBOR + 2.00%), 12/27/24 | | | | | | | 3,334 | | | | 3,316,041 | |
| | | |
ClubCorp Holdings, Inc., Term Loan, 6.424%, (3 mo. USD LIBOR + 2.75%), 9/18/24 | | | | | | | 21,159 | | | | 19,056,570 | |
| | | |
Dave & Buster’s, Inc., Term Loan, 8.875%, (SOFR + 5.00%), 6/29/29 | | | | | | | 10,823 | | | | 10,617,695 | |
| | | |
Fertitta Entertainment, LLC, Term Loan, 7.729%, (SOFR + 4.00%), 1/27/29 | | | | | | | 17,910 | | | | 16,844,743 | |
| | | |
Great Canadian Gaming Corporation, Term Loan, 7.602%, (3 mo. USD LIBOR + 4.00%), 11/1/26 | | | | | | | 8,318 | | | | 8,103,847 | |
| | | |
GVC Holdings PLC, Term Loan, 3.633%, (1 mo. EURIBOR + 2.50%), 3/29/24 | | | EUR | | | | 21,225 | | | | 20,346,332 | |
| | | |
Hilton Grand Vacations Borrower, LLC, Term Loan, 6.754%, (1 mo. USD LIBOR + 3.00%), 8/2/28 | | | | | | | 9,034 | | | | 8,903,890 | |
| | | |
IRB Holding Corp.: | | | | | | | | | | | | |
| | | |
Term Loan, 6.208%, (SOFR + 3.00%), 12/15/27 | | | | | | | 4,929 | | | | 4,790,199 | |
| | | |
Term Loan, 6.504%, (1 mo. USD LIBOR + 2.75%), 2/5/25 | | | | | | | 2 | | | | 2,293 | |
| | | |
NCL Corporation Limited, Term Loan, 1/2/24(11) | | | | | | | 4,500 | | | | 4,252,500 | |
| | | |
Oravel Stays Singapore Pte, Ltd., Term Loan, 11.86%, (3 mo. USD LIBOR + 8.25%), 6/23/26 | | | | | | | 5,407 | | | | 4,730,742 | |
| | | |
Playa Resorts Holding B.V., Term Loan, 6.50%, (1 mo. USD LIBOR + 2.75%), 4/29/24 | | | | | | | 19,136 | | | | 18,689,697 | |
| | | |
Scientific Games Holdings, L.P., Term Loan, 7.097%, (SOFR + 3.50%), 4/4/29 | | | | | | | 10,000 | | | | 9,440,970 | |
| | | |
Scientific Games International, Inc., Term Loan, 6.402%, (SOFR + 3.00%), 4/14/29 | | | | | | | 7,481 | | | | 7,403,632 | |
| | | |
SeaWorld Parks & Entertainment, Inc., Term Loan, 6.813%, (1 mo. USD LIBOR + 3.00%), 8/25/28 | | | | | | | 9,974 | | | | 9,746,089 | |
| | | | |
| | 36 | | See Notes to Financial Statements. |
Eaton Vance
Floating Rate Portfolio
October 31, 2022
Portfolio of Investments — continued
| | | | | | | | | | | | |
| Borrower/Description | | | | | Principal Amount* (000’s omitted) | | | Value | |
| | | |
| Hotels, Restaurants & Leisure (continued) | | | | | | | | | |
| | | |
| Stars Group Holdings B.V. (The): | | | | | | | | | |
| | | |
Term Loan, 3.728%, (3 mo. EURIBOR + 2.50%), 7/21/26 | | | EUR | | | | 11,225 | | | $ | 10,464,490 | |
| | | |
Term Loan, 5.892%, (3 mo. USD LIBOR + 2.25%), 7/21/26 | | | | | | | 29,342 | | | | 28,868,634 | |
| | | |
Travel Leaders Group, LLC, Term Loan, 7.754%, (1 mo. USD LIBOR + 4.00%), 1/25/24 | | | | | | | 14,996 | | | | 13,318,312 | |
| | | |
| | | | | | | | | | | $ | 277,067,931 | |
| | | |
| Household Durables — 0.8% | | | | | | | | | |
| | | |
Libbey Glass, Inc., Term Loan, 11.941%, (3 mo. USD LIBOR + 8.00%), 11/13/25 | | | | | | | 6,407 | | | $ | 6,562,725 | |
| | | |
Serta Simmons Bedding, LLC: | | | | | | | | | | | | |
| | | |
Term Loan, 10.793%, (1 mo. USD LIBOR + 7.50%), 8/10/23 | | | | | | | 13,364 | | | | 13,004,879 | |
| | | |
Term Loan - Second Lien, 10.793%, (1 mo. USD LIBOR + 7.50%), 8/10/23 | | | | | | | 44,139 | | | | 22,321,592 | |
| | | |
Solis IV B.V.: | | | | | | | | | | | | |
| | | |
Term Loan, 4.468%, (3 mo. EURIBOR + 4.00%), 2/26/29 | | | EUR | | | | 5,693 | | | | 4,702,108 | |
| | | |
Term Loan, 6.34%, (SOFR + 3.50%), 2/26/29 | | | | | | | 13,857 | | | | 11,584,825 | |
| | | |
Spectrum Brands, Inc., Term Loan, 5.76%, (1 mo. USD LIBOR + 2.00%), 3/3/28 | | | | | | | 4,186 | | | | 4,029,266 | |
| | | |
| | | | | | | | | | | $ | 62,205,395 | |
| | | |
| Household Products — 0.5% | | | | | | | | | |
| | | |
Diamond (BC) B.V., Term Loan, 7.163%, (USD LIBOR + 2.75%), 9/29/28(9) | | | | | | | 8,536 | | | $ | 8,004,165 | |
| | | |
Energizer Holdings, Inc., Term Loan, 5.875%, (1 mo. USD LIBOR + 2.25%), 12/22/27 | | | | | | | 7,576 | | | | 7,354,951 | |
| | | |
Kronos Acquisition Holdings, Inc.: | | | | | | | | | | | | |
| | | |
Term Loan, 6.82%, (3 mo. USD LIBOR + 3.75%), 12/22/26 | | | | | | | 10,568 | | | | 10,017,961 | |
| | | |
Term Loan, 8.94%, (SOFR + 6.00%), 12/22/26 | | | | | | | 5,111 | | | | 4,906,920 | |
| | | |
Nobel Bidco B.V., Term Loan, 3.50%, (3 mo. EURIBOR + 3.50%), 9/1/28 | | | EUR | | | | 11,450 | | | | 7,729,873 | |
| | | |
| | | | | | | | | | | $ | 38,013,870 | |
|
| Independent Power and Renewable Electricity Producers — 0.1% | |
| | | |
| Calpine Corporation: | | | | | | | | | |
| | | |
Term Loan, 5.76%, (1 mo. USD LIBOR + 2.00%), 4/5/26 | | | | | | | 2,325 | | | $ | 2,284,586 | |
| | | |
Term Loan, 6.26%, (1 mo. USD LIBOR + 2.50%), 12/16/27 | | | | | | | 6,192 | | | | 6,132,364 | |
| | | |
Longview Power, LLC, Term Loan, 13.674%, (3 mo. USD LIBOR + 10.00%), 7/30/25 | | | | | | | 293 | | | | 288,544 | |
| | | |
| | | | | | | | | | | $ | 8,705,494 | |
| | | | | | | | | | | | |
| Borrower/Description | | | | | Principal Amount* (000’s omitted) | | | Value | |
| | | |
| Industrial Conglomerates — 0.4% | | | | | | | | | |
| | | |
Rain Carbon GmbH, Term Loan, 3.282%, (3 mo. EURIBOR + 3.00%), 1/16/25 | | | EUR | | | | 15,625 | | | $ | 14,540,658 | |
| | | |
SPX Flow, Inc., Term Loan, 8.329%, (SOFR + 4.50%), 4/5/29 | | | | | | | 19,650 | | | | 18,667,500 | |
| | | |
| | | | | | | | | | | $ | 33,208,158 | |
| | | |
| Insurance — 1.6% | | | | | | | | | |
| | | |
| Alliant Holdings Intermediate, LLC: | | | | | | | | | |
| | | |
Term Loan, 6.98%, (1 mo. USD LIBOR + 3.50%), 11/6/27 | | | | | | | 13,299 | | | $ | 12,862,275 | |
| | | |
Term Loan, 7.004%, (1 mo. USD LIBOR + 3.25%), 5/9/25 | | | | | | | 5,832 | | | | 5,672,713 | |
| | | |
Term Loan, 7.004%, (1 mo. USD LIBOR + 3.25%), 5/9/25 | | | | | | | 4,765 | | | | 4,634,326 | |
| | | |
AmWINS Group, Inc., Term Loan, 6.004%, (1 mo. USD LIBOR + 2.25%), 2/19/28 | | | | | | | 25,722 | | | | 25,198,176 | |
| | | |
AssuredPartners, Inc.: | | | | | | | | | | | | |
| | | |
Term Loan, 7.229%, (SOFR + 3.50%), 2/12/27 | | | | | | | 5,348 | | | | 5,109,128 | |
| | | |
Term Loan, 7.254%, (1 mo. USD LIBOR + 3.50%), 2/12/27 | | | | | | | 13,369 | | | | 12,781,755 | |
| | | |
Term Loan, 7.254%, (1 mo. USD LIBOR + 3.50%), 2/12/27 | | | | | | | 3,424 | | | | 3,273,319 | |
| | | |
Financiere CEP S.A.S., Term Loan, 4.225%, (6 mo. EURIBOR + 4.00%), 6/18/27 | | | EUR | | | | 4,125 | | | | 3,831,938 | |
| | | |
Hub International Limited: | | | | | | | | | | | | |
| | | |
Term Loan, 7.326%, (3 mo. USD LIBOR + 3.00%), 4/25/25 | | | | | | | 15,174 | | | | 14,900,671 | |
| | | |
Term Loan, 7.527%, (3 mo. USD LIBOR + 3.25%), 4/25/25 | | | | | | | 5,388 | | | | 5,300,841 | |
| | | |
NFP Corp., Term Loan, 7.004%, (1 mo. USD LIBOR + 3.25%), 2/15/27 | | | | | | | 25,465 | | | | 24,216,825 | |
| | | |
USI, Inc.: | | | | | | | | | | | | |
| | | |
Term Loan, 6.424%, (3 mo. USD LIBOR + 2.75%), 5/16/24 | | | | | | | 8,739 | | | | 8,641,423 | |
| | | |
Term Loan, 6.924%, (3 mo. USD LIBOR + 3.25%), 12/2/26 | | | | | | | 1,931 | | | | 1,895,917 | |
| | | |
| | | | | | | | | | | $ | 128,319,307 | |
| | | |
| Interactive Media & Services — 0.4% | | | | | | | | | |
| | | |
| Buzz Finco, LLC: | | | | | | | | | |
| | | |
Term Loan, 6.504%, (1 mo. USD LIBOR + 2.75%), 1/29/27 | | | | | | | 1,982 | | | $ | 1,932,161 | |
| | | |
Term Loan, 7.004%, (1 mo. USD LIBOR + 3.25%), 1/29/27 | | | | | | | 435 | | | | 428,531 | |
| | | |
Foundational Education Group, Inc., Term Loan, 7.565%, (SOFR + 3.75%), 8/31/28 | | | | | | | 5,188 | | | | 5,077,994 | |
| | | |
| Getty Images, Inc.: | | | | | | | | | |
| | | |
Term Loan, 5.563%, (3 mo. EURIBOR + 5.00%), 2/19/26 | | | EUR | | | | 3,724 | | | | 3,662,278 | |
| | | | |
| | 37 | | See Notes to Financial Statements. |
Eaton Vance
Floating Rate Portfolio
October 31, 2022
Portfolio of Investments — continued
| | | | | | | | | | |
| Borrower/Description | | | | Principal Amount* (000’s omitted) | | | Value | |
| | | |
| Interactive Media & Services (continued) | | | | | | | | |
| | | |
| Getty Images, Inc.: (continued) | | | | | | | | |
| | | |
Term Loan, 7.625%, (3 mo. USD LIBOR + 4.50%), 2/19/26 | | | | | 15,990 | | | $ | 15,922,268 | |
| | | |
Match Group, Inc., Term Loan, 4.692%, (3 mo. USD LIBOR + 1.75%), 2/13/27 | | | | | 6,450 | | | | 6,331,752 | |
| |
| | | | $ | 33,354,984 | |
|
| Internet & Direct Marketing Retail — 0.4% | |
| | | |
| Adevinta ASA: | | | | | | | | |
| | | |
Term Loan, 4.443%, (3 mo. EURIBOR + 3.25%), 6/26/28 | | EUR | | | 7,268 | | | $ | 6,941,950 | |
| | | |
Term Loan, 6.674%, (3 mo. USD LIBOR + 3.00%), 6/26/28 | | | | | 2,148 | | | | 2,102,506 | |
| | | |
CNT Holdings I Corp., Term Loan, 7.239%, (SOFR + 3.50%), 11/8/27 | | | | | 10,759 | | | | 10,500,587 | |
| | | |
Etraveli Holding AB, Term Loan, 5.193%, (3 mo. EURIBOR + 4.00%), 8/2/24 | | EUR | | | 7,844 | | | | 7,680,802 | |
| | | |
Hoya Midco, LLC, Term Loan, 6.979%, (SOFR + 3.25%), 2/3/29 | | | | | 5,166 | | | | 5,114,770 | |
| | | |
Speedster Bidco GmbH, Term Loan, 5.108%, (6 mo. EURIBOR + 3.25%), 3/31/27 | | EUR | | | 2,975 | | | | 2,584,789 | |
| |
| | | | $ | 34,925,404 | |
|
| IT Services — 3.3% | |
| | | |
| Asurion, LLC: | | | | | | | | |
| | | |
Term Loan, 6.754%, (1 mo. USD LIBOR + 3.00%), 11/3/24 | | | | | 2,154 | | | $ | 2,041,606 | |
| | | |
Term Loan, 7.004%, (1 mo. USD LIBOR + 3.25%), 12/23/26 | | | | | 3,439 | | | | 3,074,456 | |
| | | |
Term Loan, 7.004%, (1 mo. USD LIBOR + 3.25%), 7/31/27 | | | | | 11,722 | | | | 10,353,988 | |
| | | |
Term Loan, 7.653%, (SOFR + 4.00%), 8/19/28 | | | | | 14,175 | | | | 12,802,070 | |
| | | |
Term Loan - Second Lien, 9.004%, (1 mo. USD LIBOR + 5.25%), 1/31/28 | | | | | 14,540 | | | | 10,314,312 | |
| | | |
| Cyxtera DC Holdings, Inc.: | | | | | | | | |
| | | |
Term Loan, 7.36%, (3 mo. USD LIBOR + 3.00%), 5/1/24 | | | | | 27,291 | | | | 23,460,305 | |
| | | |
Term Loan, 8.36%, (3 mo. USD LIBOR + 4.00%), 5/1/24 | | | | | 9,762 | | | | 8,712,177 | |
| | | |
Endure Digital, Inc., Term Loan, 6.698%, (1 mo. USD LIBOR + 3.50%), 2/10/28 | | | | | 22,814 | | | | 19,548,361 | |
| | | |
Gainwell Acquisition Corp., Term Loan, 7.674%, (3 mo. USD LIBOR + 4.00%), 10/1/27 | | | | | 57,614 | | | | 54,973,542 | |
| | | |
Go Daddy Operating Company, LLC, Term Loan, 5.504%, (1 mo. USD LIBOR + 1.75%), 2/15/24 | | | | | 45,065 | | | | 44,952,819 | |
| | | |
| Indy US Bidco, LLC: | | | | | | | | |
| | | |
Term Loan, 4.883%, (1 mo. EURIBOR + 3.75%), 3/6/28 | | EUR | | | 5,678 | | | | 5,055,177 | |
| | | | | | | | | | |
| Borrower/Description | | | | Principal Amount* (000’s omitted) | | | Value | |
|
| IT Services (continued) | |
| | | |
| Indy US Bidco, LLC: (continued) | | | | | | | | |
| | | |
Term Loan, 7.504%, (1 mo. USD LIBOR + 3.75%), 3/5/28 | | | | | 4,171 | | | $ | 3,712,471 | |
| | | |
Informatica, LLC, Term Loan, 6.563%, (1 mo. USD LIBOR + 2.75%), 10/27/28 | | | | | 31,915 | | | | 31,148,674 | |
| | | |
NAB Holdings, LLC, Term Loan, 6.703%, (SOFR + 3.00%), 11/23/28 | | | | | 16,203 | | | | 15,581,470 | |
| | | |
Rackspace Technology Global, Inc., Term Loan, 5.617%, (3 mo. USD LIBOR + 2.75%), 2/15/28 | | | | | 16,430 | | | | 10,536,997 | |
| | | |
| team.blue Finco S.a.r.l.: | | | | | | | | |
| | | |
Term Loan, 4.893%, (3 mo. EURIBOR + 3.70%), 3/30/28 | | EUR | | | 10,547 | | | | 9,724,133 | |
| | | |
Term Loan, 4.943%, (3 mo. EURIBOR + 3.75%), 3/27/28 | | EUR | | | 603 | | | | 555,665 | |
| | | |
WEX, Inc., Term Loan, 6.004%, (1 mo. USD LIBOR + 2.25%), 3/31/28 | | | | | 3,940 | | | | 3,868,938 | |
| |
| | | | $ | 270,417,161 | |
|
| Leisure Products — 0.3% | |
| | | |
Amer Sports Oyj, Term Loan, 5.131%, (6 mo. EURIBOR + 4.50%), 3/30/26 | | EUR | | | 11,925 | | | $ | 10,429,617 | |
| | | |
Fender Musical Instruments Corporation, Term Loan, 7.368%, (SOFR + 4.00%), 12/1/28 | | | | | 3,938 | | | | 3,317,541 | |
| | | |
Hayward Industries, Inc., Term Loan, 6.254%, (1 mo. USD LIBOR + 2.50%), 5/30/28 | | | | | 9,147 | | | | 8,614,313 | |
| | | |
SRAM, LLC, Term Loan, 6.423%, (USD LIBOR + 2.75%), 5/18/28(9) | | | | | 2,189 | | | | 2,129,567 | |
| |
| | | | $ | 24,491,038 | |
|
| Life Sciences Tools & Services — 2.0% | |
| | | |
| Avantor Funding, Inc.: | | | | | | | | |
| | | |
Term Loan, 3.185%, (1 mo. EURIBOR + 2.50%), 6/12/28 | | EUR | | | 19,454 | | | $ | 18,810,630 | |
| | | |
Term Loan, 6.004%, (1 mo. USD LIBOR + 2.25%), 11/8/27 | | | | | 15,386 | | | | 15,087,876 | |
| | | |
Cambrex Corporation, Term Loan, 7.329%, (SOFR + 3.50%), 12/4/26 | | | | | 324 | | | | 312,791 | |
| | | |
Catalent Pharma Solutions, Inc., Term Loan, 5.625%, (1 mo. USD LIBOR + 2.00%), 2/22/28 | | | | | 1,034 | | | | 1,025,847 | |
| | | |
Curia Global, Inc., Term Loan, 8.163%, (USD LIBOR + 3.75%), 8/30/26(9) | | | | | 14,436 | | | | 13,274,842 | |
| | | |
ICON Luxembourg S.a.r.l., Term Loan, 5.938%, (3 mo. USD LIBOR + 2.25%), 7/3/28 | | | | | 51,015 | | | | 50,590,324 | |
| | | |
IQVIA, Inc., Term Loan, 5.504%, (1 mo. USD LIBOR + 1.75%), 1/17/25 | | | | | 12,472 | | | | 12,440,568 | |
| | | |
LGC Group Holdings, Ltd., Term Loan, 3.883%, (1 mo. EURIBOR + 2.75%), 4/21/27 | | EUR | | | 5,775 | | | | 5,164,963 | |
| | | |
Loire Finco Luxembourg S.a.r.l., Term Loan, 6.754%, (1 mo. USD LIBOR + 3.00%), 4/21/27 | | | | | 1,134 | | | | 1,057,190 | |
| | | | |
| | 38 | | See Notes to Financial Statements. |
Eaton Vance
Floating Rate Portfolio
October 31, 2022
Portfolio of Investments — continued
| | | | | | | | | | |
| Borrower/Description | | | | Principal Amount* (000’s omitted) | | | Value | |
|
| Life Sciences Tools & Services (continued) | |
| | | |
Packaging Coordinators Midco, Inc., Term Loan, 7.424%, (3 mo. USD LIBOR + 3.75%), 11/30/27 | | | | | 7,964 | | | $ | 7,717,640 | |
| | | |
Parexel International Corporation, Term Loan, 7.004%, (1 mo. USD LIBOR + 3.25%), 11/15/28 | | | | | 5,732 | | | | 5,536,096 | |
| | | |
PRA Health Sciences, Inc., Term Loan, 5.938%, (3 mo. USD LIBOR + 2.25%), 7/3/28 | | | | | 12,711 | | | | 12,604,799 | |
| | | |
Sotera Health Holdings, LLC, Term Loan, 7.165%, (3 mo. USD LIBOR + 2.75%), 12/11/26 | | | | | 17,828 | | | | 16,223,608 | |
| |
| | | | $ | 159,847,174 | |
|
| Machinery — 3.5% | |
| | | |
AI Alpine AT Bidco GmbH, Term Loan, 4.731%, (6 mo. EURIBOR + 3.00%), 10/31/25 | | EUR | | | 6,125 | | | $ | 5,515,823 | |
| | | |
AI Aqua Merger Sub, Inc., Term Loan, 6.858%, (SOFR + 3.75%), 7/31/28 | | | | | 11,650 | | | | 10,863,199 | |
| | | |
Albion Financing 3 S.a.r.l., Term Loan, 9.575%, (3 mo. USD LIBOR + 5.25%), 8/17/26 | | | | | 18,535 | | | | 17,561,853 | |
| | | |
Ali Group North America Corporation, Term Loan, 5.843%, (1 mo. USD LIBOR + 2.00%), 7/30/29 | | | | | 16,981 | | | | 16,694,391 | |
| | | |
Alliance Laundry Systems, LLC, Term Loan, 7.409%, (3 mo. USD LIBOR + 3.50%), 10/8/27 | | | | | 5,253 | | | | 5,084,746 | |
| | | |
American Trailer World Corp., Term Loan, 7.579%, (SOFR + 3.75%), 3/3/28 | | | | | 17,552 | | | | 15,985,224 | |
| | | |
Apex Tool Group, LLC, Term Loan, 8.624%, (SOFR + 5.25%), 2/8/29 | | | | | 26,131 | | | | 22,701,381 | |
| | | |
Clark Equipment Company, Term Loan, 6.153%, (SOFR + 2.50%), 4/20/29 | | | | | 11,542 | | | | 11,363,099 | |
| | | |
Conair Holdings, LLC, Term Loan, 7.424%, (3 mo. USD LIBOR + 3.75%), 5/17/28 | | | | | 24,453 | | | | 20,703,548 | |
| | | |
CPM Holdings, Inc., Term Loan, 6.628%, (1 mo. USD LIBOR + 3.50%), 11/17/25 | | | | | 4,713 | | | | 4,590,044 | |
| | | |
Delachaux Group S.A., Term Loan, 8.915%, (3 mo. USD LIBOR + 4.50%), 4/16/26 | | | | | 4,769 | | | | 4,315,493 | |
| | | |
| Engineered Machinery Holdings, Inc.: | | | | | | | | |
| | | |
Term Loan, 4.943%, (3 mo. EURIBOR + 3.75%), 5/21/28 | | EUR | | | 10,766 | | | | 9,646,704 | |
| | | |
Term Loan, 7.424%, (3 mo. USD LIBOR + 3.75%), 5/19/28 | | | | | 17,268 | | | | 16,742,453 | |
| | | |
Term Loan - Second Lien, 9.674%, (3 mo. USD LIBOR + 6.00%), 5/21/29 | | | | | 2,000 | | | | 1,891,250 | |
| | | |
EWT Holdings III Corp., Term Loan, 6.313%, (1 mo. USD LIBOR + 2.50%), 4/1/28 | | | | | 3,518 | | | | 3,475,916 | |
| | | |
| Filtration Group Corporation: | | | | | | | | |
| | | |
Term Loan, 4.633%, (3 mo. EURIBOR + 3.50%), 3/29/25 | | EUR | | | 2,946 | | | | 2,768,014 | |
| | | |
Term Loan, 6.754%, (1 mo. USD LIBOR + 3.00%), 3/29/25 | | | | | 2,913 | | | | 2,858,428 | |
| | | | | | | | | | |
| Borrower/Description | | | | Principal Amount* (000’s omitted) | | | Value | |
|
| Machinery (continued) | |
| | | |
| Gates Global, LLC: | | | | | | | | |
| | | |
Term Loan, 4.133%, (1 mo. EURIBOR + 3.00%), 4/1/24 | | EUR | | | 8,283 | | | $ | 7,776,826 | |
| | | |
Term Loan, 6.254%, (1 mo. USD LIBOR + 2.50%), 3/31/27 | | | | | 15,655 | | | | 15,270,154 | |
| | | |
| Icebox Holdco III, Inc.: | | | | | | | | |
| | | |
Term Loan, 7.424%, (3 mo. USD LIBOR + 3.75%), 12/22/28 | | | | | 11,789 | | | | 10,934,602 | |
| | | |
Term Loan, 7.58%, (3 mo. USD LIBOR + 3.75%), 12/22/28 | | | | | 2,451 | | | | 2,273,700 | |
| | | |
Madison IAQ, LLC, Term Loan, 6.815%, (3 mo. USD LIBOR + 3.25%), 6/21/28 | | | | | 35,259 | | | | 32,085,963 | |
| | | |
Penn Engineering & Manufacturing Corp., Term Loan, 6.424%, (3 mo. USD LIBOR + 2.75%), 6/27/24 | | | | | 1,876 | | | | 1,833,717 | |
| | | |
Titan Acquisition Limited, Term Loan, 5.877%, (6 mo. USD LIBOR + 3.00%), 3/28/25 | | | | | 22,828 | | | | 20,904,161 | |
| | | |
TK Elevator Topco GmbH, Term Loan, 4.256%, (1 mo. EURIBOR + 3.63%), 7/29/27 | | EUR | | | 9,725 | | | | 8,853,884 | |
| | | |
Vertical US Newco, Inc., Term Loan, 6.871%, (6 mo. USD LIBOR + 3.50%), 7/30/27 | | | | | 6 | | | | 5,934 | |
| | | |
Zephyr German BidCo GmbH, Term Loan, 4.216%, (3 mo. EURIBOR + 3.40%), 3/10/28 | | EUR | | | 11,775 | | | | 10,754,199 | |
| |
| | | | $ | 283,454,706 | |
|
| Media — 1.9% | |
| | | |
Axel Springer SE, Term Loan, 5.816%, (3 mo. EURIBOR + 4.75%), 12/18/26 | | EUR | | | 8,500 | | | $ | 8,043,117 | |
| | | |
Charter Communications Operating, LLC, Term Loan, 5.51%, (1 mo. USD LIBOR + 1.75%), 2/1/27 | | | | | 3,635 | | | | 3,574,079 | |
| | | |
| CSC Holdings, LLC: | | | | | | | | |
| | | |
Term Loan, 5.662%, (1 mo. USD LIBOR + 2.25%), 7/17/25 | | | | | 25,265 | | | | 24,538,230 | |
| | | |
Term Loan, 5.662%, (1 mo. USD LIBOR + 2.25%), 1/15/26 | | | | | 4 | | | | 4,007 | |
| | | |
Term Loan, 5.912%, (1 mo. USD LIBOR + 2.50%), 4/15/27 | | | | | 13,109 | | | | 12,491,421 | |
| | | |
| Diamond Sports Group, LLC: | | | | | | | | |
| | | |
Term Loan, 11.208%, (SOFR + 8.10%), 5/26/26 | | | | | 5,029 | | | | 4,847,859 | |
| | | |
Term Loan - Second Lien, 6.458%, (SOFR + 3.35%), 8/24/26 | | | | | 23,126 | | | | 4,627,593 | |
| | | |
Entravision Communications Corporation, Term Loan, 6.504%, (1 mo. USD LIBOR + 2.75%), 11/29/24 | | | | | 7,139 | | | | 6,996,184 | |
| | | |
Gray Television, Inc., Term Loan, 6.128%, (1 mo. USD LIBOR + 3.00%), 12/1/28 | | | | | 1,042 | | | | 1,029,658 | |
| | | |
Hubbard Radio, LLC, Term Loan, 8.01%, (1 mo. USD LIBOR + 4.25%), 3/28/25 | | | | | 6,333 | | | | 5,235,431 | |
| | | |
iHeartCommunications, Inc., Term Loan, 6.754%, (1 mo. USD LIBOR + 3.00%), 5/1/26 | | | | | 2,365 | | | | 2,240,716 | |
| | | | |
| | 39 | | See Notes to Financial Statements. |
Eaton Vance
Floating Rate Portfolio
October 31, 2022
Portfolio of Investments — continued
| | | | | | | | | | |
| Borrower/Description | | | | Principal Amount* (000’s omitted) | | | Value | |
|
| Media (continued) | |
| | | |
Magnite, Inc., Term Loan, 8.642%, (USD LIBOR + 5.00%), 4/28/28(9) | | | | | 6,370 | | | $ | 6,019,995 | |
| | | |
Mission Broadcasting, Inc., Term Loan, 5.628%, (1 mo. USD LIBOR + 2.50%), 6/2/28 | | | | | 3,654 | | | | 3,624,823 | |
| | | |
MJH Healthcare Holdings, LLC, Term Loan, 7.329%, (SOFR + 3.50%), 1/28/29 | | | | | 3,706 | | | | 3,521,056 | |
| | | |
Nexstar Broadcasting, Inc., Term Loan, 6.254%, (1 mo. USD LIBOR + 2.50%), 9/18/26 | | | | | 3,989 | | | | 3,955,356 | |
| | | |
Recorded Books, Inc., Term Loan, 7.578%, (SOFR + 4.00%), 8/29/25 | | | | | 12,877 | | | | 12,544,326 | |
| | | |
| Sinclair Television Group, Inc.: | | | | | | | | |
| | | |
Term Loan, 6.26%, (1 mo. USD LIBOR + 2.50%), 9/30/26 | | | | | 6,232 | | | | 5,903,499 | |
| | | |
Term Loan, 6.76%, (1 mo. USD LIBOR + 3.00%), 4/1/28 | | | | | 22,904 | | | | 21,334,824 | |
| | | |
| Univision Communications, Inc.: | | | | | | | | |
| | | |
Term Loan, 6.504%, (1 mo. USD LIBOR + 2.75%), 3/15/24 | | | | | 7,012 | | | | 6,996,325 | |
| | | |
Term Loan, 7.004%, (1 mo. USD LIBOR + 3.25%), 3/15/26 | | | | | 18,374 | | | | 17,855,378 | |
| |
| | | | $ | 155,383,877 | |
|
| Metals/Mining — 0.5% | |
| | | |
American Consolidated Natural Resources, Inc., Term Loan, 20.33%, (3 mo. USD LIBOR + 13.00%), 17.33% cash, 3.00% PIK, 9/16/25 | | | | | 429 | | | $ | 431,722 | |
| | | |
| Dynacast International, LLC: | | | | | | | | |
| | | |
Term Loan, 7.48%, (3 mo. USD LIBOR + 4.50%), 7/22/25 | | | | | 15,337 | | | | 13,074,881 | |
| | | |
Term Loan, 11.98%, (3 mo. USD LIBOR + 9.00%), 10/22/25 | | | | | 3,065 | | | | 2,605,181 | |
| | | |
WireCo WorldGroup, Inc., Term Loan, 7.188%, (3 mo. USD LIBOR + 4.25%), 11/13/28 | | | | | 8,975 | | | | 8,787,855 | |
| | | |
Zekelman Industries, Inc., Term Loan, 5.604%, (3 mo. USD LIBOR + 2.00%), 1/24/27 | | | | | 15,456 | | | | 15,044,185 | |
| |
| | | | $ | 39,943,824 | |
|
| Oil, Gas & Consumable Fuels — 1.5% | |
| | | |
Buckeye Partners, L.P., Term Loan, 5.365%, (1 mo. USD LIBOR + 2.25%), 11/1/26 | | | | | 8,273 | | | $ | 8,190,521 | |
| | | |
| Centurion Pipeline Company, LLC: | | | | | | | | |
| | | |
Term Loan, 7.004%, (1 mo. USD LIBOR + 3.25%), 9/29/25 | | | | | 3,120 | | | | 3,088,986 | |
| | | |
Term Loan, 7.754%, (1 mo. USD LIBOR + 4.00%), 9/28/25 | | | | | 1,629 | | | | 1,609,516 | |
| | | |
CITGO Petroleum Corporation, Term Loan, 10.004%, (1 mo. USD LIBOR + 6.25%), 3/28/24 | | | | | 17,681 | | | | 17,728,354 | |
| | | |
Delek US Holdings, Inc., Term Loan, 9.254%, (1 mo. USD LIBOR + 5.50%), 3/31/25 | | | | | 5,739 | | | | 5,692,119 | |
| | | | | | | | | | |
| Borrower/Description | | | | Principal Amount* (000’s omitted) | | | Value | |
|
| Oil, Gas & Consumable Fuels (continued) | |
| | | |
Freeport LNG Investments, LLLP, Term Loan, 7.743%, (3 mo. USD LIBOR + 3.50%), 12/21/28 | | | | | 16,874 | | | $ | 15,835,798 | |
| | | |
GIP II Blue Holding, L.P, Term Loan, 8.174%, (3 mo. USD LIBOR + 4.50%), 9/29/28 | | | | | 15,994 | | | | 15,889,483 | |
| | | |
Matador Bidco S.a.r.l., Term Loan, 8.254%, (1 mo. USD LIBOR + 4.50%), 10/15/26 | | | | | 32,570 | | | | 31,958,915 | |
| | | |
Oryx Midstream Services Permian Basin, LLC, Term Loan, 6.211%, (3 mo. USD LIBOR + 3.25%), 10/5/28 | | | | | 3,694 | | | | 3,647,425 | |
| | | |
Oxbow Carbon, LLC, Term Loan, 7.878%, (3 mo. USD LIBOR + 4.25%), 10/17/25 | | | | | 5,476 | | | | 5,459,530 | |
| | | |
QuarterNorth Energy Holding, Inc., Term Loan - Second Lien, 11.754%, (1 mo. USD LIBOR + 8.00%), 8/27/26 | | | | | 5,729 | | | | 5,714,831 | |
| | | |
UGI Energy Services, LLC, Term Loan, 7.254%, (1 mo. USD LIBOR + 3.50%), 8/13/26 | | | | | 8,946 | | | | 8,914,257 | |
| |
| | | | $ | 123,729,735 | |
|
| Personal Products — 0.4% | |
| | | |
HLF Financing S.a.r.l., Term Loan, 6.254%, (1 mo. USD LIBOR + 2.50%), 8/18/25 | | | | | 9,683 | | | $ | 9,355,114 | |
| | | |
Rainbow Finco S.a.r.l., Term Loan, 4.658%, (6 mo. EURIBOR + 3.75%), 2/24/29 | | EUR | | | 14,125 | | | | 13,185,460 | |
| | | |
Sunshine Luxembourg VII S.a.r.l., Term Loan, 7.424%, (3 mo. USD LIBOR + 3.75%), 10/1/26 | | | | | 6,448 | | | | 6,146,214 | |
| |
| | | | $ | 28,686,788 | |
|
| Pharmaceuticals — 1.6% | |
| | | |
Aenova Holding GmbH, Term Loan, 5.034%, (6 mo. EURIBOR + 4.50%), 3/6/26 | | EUR | | | 2,925 | | | $ | 2,514,849 | |
| | | |
AI Sirona (Luxembourg) Acquisition S.a.r.l., Term Loan, 4.383%, (1 mo. EURIBOR + 3.25%), 9/29/25 | | EUR | | | 13,000 | | | | 12,076,412 | |
| | | |
Akorn, Inc., Term Loan, 11.243%, (3 mo. USD LIBOR + 7.50%), 10/1/25 | | | | | 2,996 | | | | 2,845,986 | |
| | | |
Amneal Pharmaceuticals, LLC, Term Loan, 7.251%, (USD LIBOR + 3.50%), 5/4/25(9) | | | | | 13,385 | | | | 11,479,703 | |
| | | |
Bausch Health Companies, Inc., Term Loan, 8.624%, (SOFR + 5.25%), 2/1/27 | | | | | 18,823 | | | | 14,151,142 | |
| | | |
| Horizon Therapeutics USA, Inc.: | | | | | | | | |
| | | |
Term Loan, 5.375%, (1 mo. USD LIBOR + 1.75%), 3/15/28 | | | | | 16,696 | | | | 16,398,365 | |
| | | |
Term Loan, 5.625%, (1 mo. USD LIBOR + 2.00%), 5/22/26 | | | | | 7,802 | | | | 7,673,665 | |
| | | |
Jazz Financing Lux S.a.r.l., Term Loan, 7.254%, (1 mo. USD LIBOR + 3.50%), 5/5/28 | | | | | 7,075 | | | | 7,005,123 | |
| | | |
| Mallinckrodt International Finance S.A.: | | | | | | | | |
| | | |
Term Loan, 8.733%, (3 mo. USD LIBOR + 5.25%), 9/30/27 | | | | | 36,851 | | | | 30,010,621 | |
| | | | |
| | 40 | | See Notes to Financial Statements. |
Eaton Vance
Floating Rate Portfolio
October 31, 2022
Portfolio of Investments — continued
| | | | | | | | | | |
| Borrower/Description | | | | Principal Amount* (000’s omitted) | | | Value | |
|
| Pharmaceuticals (continued) | |
|
| Mallinckrodt International Finance S.A.: (continued) | |
| | | |
Term Loan, 8.983%, (3 mo. USD LIBOR + 5.50%), 9/30/27 | | | | | 10,080 | | | $ | 8,231,703 | |
| | | |
PharmaZell GmbH, Term Loan, 5.193%, (1 mo. EURIBOR + 4.00%), 5/12/27 | | EUR | | | 1,800 | | | | 1,698,801 | |
| | | |
Recipharm AB, Term Loan, 3.539%, (3 mo. EURIBOR + 3.20%), 2/17/28 | | EUR | | | 13,725 | | | | 12,275,173 | |
| |
| | | | $ | 126,361,543 | |
|
| Professional Services — 1.7% | |
| | | |
AlixPartners, LLP, Term Loan, 4.443%, (3 mo. EURIBOR + 3.25%), 2/4/28 | | EUR | | | 3,472 | | | $ | 3,251,182 | |
| | | |
APFS Staffing Holdings, Inc., Term Loan, 8.044%, (SOFR + 4.00%), 12/29/28(9) | | | | | 3,706 | | | | 3,595,184 | |
| | | |
Blitz 20-487 GmbH, Term Loan, 4.805%, (3 mo. EURIBOR + 3.20%), 4/28/28 | | EUR | | | 7,525 | | | | 6,999,680 | |
| | | |
| Brown Group Holding, LLC: | | | | | | | | |
| | | |
Term Loan, 6.254%, (1 mo. USD LIBOR + 2.50%), 6/7/28 | | | | | 12,656 | | | | 12,318,552 | |
| | | |
Term Loan, 7.419%, (SOFR + 3.75%), 7/2/29 | | | | | 3,575 | | | | 3,541,037 | |
| | | |
CoreLogic, Inc., Term Loan, 7.313%, (1 mo. USD LIBOR + 3.50%), 6/2/28 | | | | | 19,256 | | | | 14,189,067 | |
| | | |
Deerfield Dakota Holding, LLC, Term Loan, 7.479%, (SOFR + 3.75%), 4/9/27 | | | | | 17,511 | | | | 16,605,455 | |
| | | |
EAB Global, Inc., Term Loan, 7.254%, (1 mo. USD LIBOR + 3.50%), 8/16/28 | | | | | 14,540 | | | | 13,918,535 | |
| | | |
Employbridge, LLC, Term Loan, 8.424%, (3 mo. USD LIBOR + 4.75%), 7/19/28 | | | | | 20,810 | | | | 17,851,833 | |
| | | |
First Advantage Holdings, LLC, Term Loan, 6.504%, (1 mo. USD LIBOR + 2.75%), 1/31/27 | | | | | 5,857 | | | | 5,792,742 | |
| | | |
Rockwood Service Corporation, Term Loan, 8.004%, (1 mo. USD LIBOR + 4.25%), 1/23/27 | | | | | 5,471 | | | | 5,347,631 | |
| | | |
Trans Union, LLC, Term Loan, 6.004%, (1 mo. USD LIBOR + 2.25%), 12/1/28 | | | | | 32,247 | | | | 31,790,474 | |
| | | |
Vaco Holdings, LLC, Term Loan, 8.708%, (SOFR + 5.00%), 1/21/29(9) | | | | | 3,697 | | | | 3,613,878 | |
| |
| | | | $ | 138,815,250 | |
|
| Real Estate Management & Development — 0.5% | |
| | | |
Cushman & Wakefield U.S. Borrower, LLC, Term Loan, 6.504%, (1 mo. USD LIBOR + 2.75%), 8/21/25 | | | | | 29,388 | | | $ | 28,797,100 | |
| | | |
RE/MAX International, Inc., Term Loan, 6.313%, (1 mo. USD LIBOR + 2.50%), 7/21/28 | | | | | 16,417 | | | | 15,534,764 | |
| |
| | | | $ | 44,331,864 | |
|
| Road & Rail — 1.8% | |
| | | |
Avis Budget Car Rental, LLC, Term Loan, 5.51%, (1 mo. USD LIBOR + 1.75%), 8/6/27 | | | | | 6,995 | | | $ | 6,791,887 | |
| | | | | | | | | | |
| Borrower/Description | | | | Principal Amount* (000’s omitted) | | | Value | |
|
| Road & Rail (continued) | |
| | | |
Grab Holdings, Inc., Term Loan, 8.26%, (1 mo. USD LIBOR + 4.50%), 1/29/26 | | | | | 45,571 | | | $ | 43,071,775 | |
| | | |
| Hertz Corporation, (The): | | | | | | | | |
| | | |
Term Loan, 7.01%, (1 mo. USD LIBOR + 3.25%), 6/30/28 | | | | | 13,502 | | | | 13,046,525 | |
| | | |
Term Loan, 7.01%, (1 mo. USD LIBOR + 3.25%), 6/30/28 | | | | | 2,577 | | | | 2,489,892 | |
| | | |
Kenan Advantage Group, Inc., Term Loan, 7.504%, (1 mo. USD LIBOR + 3.75%), 3/24/26 | | | | | 14,855 | | | | 14,203,729 | |
| | | |
| Uber Technologies, Inc.: | | | | | | | | |
| | | |
Term Loan, 6.57%, (3 mo. USD LIBOR + 3.50%), 4/4/25 | | | | | 41,325 | | | | 41,084,166 | |
| | | |
Term Loan, 6.57%, (3 mo. USD LIBOR + 3.50%), 2/25/27 | | | | | 24,720 | | | | 24,497,867 | |
| | | |
XPO Logistics, Inc., Term Loan, 4.936%, (1 mo. USD LIBOR + 1.75%), 2/24/25 | | | | | 4,275 | | | | 4,219,224 | |
| |
| | | | $ | 149,405,065 | |
|
| Semiconductors & Semiconductor Equipment — 1.2% | |
| | | |
| Altar Bidco, Inc.: | | | | | | | | |
| | | |
Term Loan, 5.368%, (SOFR + 3.35%), 2/1/29(9) | | | | | 23,815 | | | $ | 22,341,740 | |
| | | |
Term Loan - Second Lien, 7.355%, (SOFR + 5.60%), 2/1/30 | | | | | 6,650 | | | | 5,741,164 | |
| | | |
Bright Bidco B.V., DIP Loan, 10.903%, (SOFR + 8.00%), 2/28/23 | | | | | 3,376 | | | | 3,021,834 | |
| | | |
Entegris, Inc., Term Loan, 5.708%, (SOFR + 3.00%), 7/6/29 | | | | | 2,500 | | | | 2,491,015 | |
| | | |
MACOM Technology Solutions Holdings, Inc., Term Loan, 6.004%, (1 mo. USD LIBOR + 2.25%), 5/17/24 | | | | | 555 | | | | 546,039 | |
| | | |
MaxLinear, Inc., Term Loan, 5.882%, (1 mo. USD LIBOR + 2.25%), 6/23/28 | | | | | 3,546 | | | | 3,484,366 | |
| | | |
| MKS Instruments, Inc.: | | | | | | | | |
| | | |
Term Loan, 3.913%, (1 mo. EURIBOR + 3.00%), 8/17/29 | | EUR | | | 5,625 | | | | 5,406,035 | |
| | | |
Term Loan, 6.317%, (SOFR + 2.75%), 8/17/29 | | | | | 47,750 | | | | 46,829,810 | |
| | | |
Synaptics Incorporated, Term Loan, 4.356%, (3 mo. USD LIBOR + 2.25%), 12/2/28 | | | | | 2,784 | | | | 2,756,470 | |
| | | |
Ultra Clean Holdings, Inc., Term Loan, 7.504%, (1 mo. USD LIBOR + 3.75%), 8/27/25 | | | | | 2,109 | | | | 2,088,013 | |
| |
| | | | $ | 94,706,486 | |
|
| Software — 14.9% | |
| | | |
| Applied Systems, Inc.: | | | | | | | | |
| | | |
Term Loan, 6.674%, (3 mo. USD LIBOR + 3.00%), 9/19/24 | | | | | 43,880 | | | $ | 43,394,209 | |
| | | |
Term Loan - Second Lien, 9.174%, (3 mo. USD LIBOR + 5.50%), 9/19/25 | | | | | 3,707 | | | | 3,663,414 | |
| | | | |
| | 41 | | See Notes to Financial Statements. |
Eaton Vance
Floating Rate Portfolio
October 31, 2022
Portfolio of Investments — continued
| | | | | | | | | | |
| Borrower/Description | | | | Principal Amount* (000’s omitted) | | | Value | |
|
| Software (continued) | |
| | | |
| AppLovin Corporation: | | | | | | | | |
| | | |
Term Loan, 6.674%, (3 mo. USD LIBOR + 3.00%), 10/25/28 | | | | | 17,811 | | | $ | 17,203,839 | |
| | | |
Term Loan, 7.004%, (1 mo. USD LIBOR + 3.25%), 8/15/25 | | | | | 43,004 | | | | 42,137,373 | |
| | | |
| Aptean, Inc.: | | | | | | | | |
| | | |
Term Loan, 7.32%, (3 mo. USD LIBOR + 4.25%), 4/23/26 | | | | | 26,142 | | | | 25,096,027 | |
| | | |
Term Loan - Second Lien, 10.07%, (3 mo. USD LIBOR + 7.00%), 4/23/27 | | | | | 6,550 | | | | 6,255,250 | |
| | | |
AQA Acquisition Holding, Inc., Term Loan, 7.32%, (3 mo. USD LIBOR + 4.25%), 3/3/28 | | | | | 2,736 | | | | 2,629,875 | |
| | | |
| Astra Acquisition Corp.: | | | | | | | | |
| | | |
Term Loan, 9.004%, (1 mo. USD LIBOR + 5.25%), 10/25/28 | | | | | 13,017 | | | | 11,346,099 | |
| | | |
Term Loan - Second Lien, 12.629%, (1 mo. USD LIBOR + 8.88%), 10/25/29 | | | | | 20,170 | | | | 18,455,687 | |
| | | |
| Banff Merger Sub, Inc.: | | | | | | | | |
| | | |
Term Loan, 5.133%, (3 mo. EURIBOR + 4.00%), 10/2/25 | | EUR | | | 1,927 | | | | 1,793,039 | |
| | | |
Term Loan, 7.504%, (1 mo. USD LIBOR + 3.75%), 10/2/25 | | | | | 18,882 | | | | 18,190,712 | |
| | | |
Term Loan - Second Lien, 9.254%, (1 mo. USD LIBOR + 5.50%), 2/27/26 | | | | | 13,521 | | | | 12,456,394 | |
| | | |
| Cast and Crew Payroll, LLC: | | | | | | | | |
| | | |
Term Loan, 7.254%, (1 mo. USD LIBOR + 3.50%), 2/9/26 | | | | | 8,482 | | | | 8,357,912 | |
| | | |
Term Loan, 7.478%, (SOFR + 3.75%), 12/29/28 | | | | | 6,154 | | | | 6,070,809 | |
| | | |
CDK Global, Inc., Term Loan, 8.112%, (SOFR + 4.50%), 7/6/29 | | | | | 33,975 | | | | 33,333,246 | |
| | | |
CentralSquare Technologies, LLC, Term Loan, 7.424%, (3 mo. USD LIBOR + 3.75%), 8/29/25 | | | | | 18,552 | | | | 16,158,979 | |
| | | |
Ceridian HCM Holding, Inc., Term Loan, 6.254%, (1 mo. USD LIBOR + 2.50%), 4/30/25 | | | | | 10,008 | | | | 9,708,751 | |
| | | |
| Cloudera, Inc.: | | | | | | | | |
| | | |
Term Loan, 7.504%, (1 mo. USD LIBOR + 3.75%), 10/8/28 | | | | | 30,916 | | | | 28,906,811 | |
| | | |
Term Loan - Second Lien, 9.754%, (1 mo. USD LIBOR + 6.00%), 10/8/29 | | | | | 8,550 | | | | 7,096,500 | |
| | | |
ConnectWise, LLC, Term Loan, 7.174%, (3 mo. USD LIBOR + 3.50%), 9/29/28 | | | | | 13,399 | | | | 12,702,015 | |
| | | |
Constant Contact, Inc., Term Loan, 7.909%, (3 mo. USD LIBOR + 4.00%), 2/10/28 | | | | | 12,096 | | | | 10,529,796 | |
| | | |
Cornerstone OnDemand, Inc., Term Loan, 7.504%, (1 mo. USD LIBOR + 3.75%), 10/16/28 | | | | | 15,622 | | | | 13,122,060 | |
| | | |
Delta TopCo, Inc., Term Loan, 5.836%, (3 mo. USD LIBOR + 3.75%), 12/1/27 | | | | | 13,528 | | | | 12,386,213 | |
| | | |
E2open, LLC, Term Loan, 6.644%, (3 mo. USD LIBOR + 3.50%), 2/4/28 | | | | | 16,340 | | | | 15,962,052 | |
| | | | | | | | | | |
| Borrower/Description | | | | Principal
Amount* (000’s omitted) | | | Value | |
|
| Software (continued) | |
| | | |
ECI Macola Max Holding, LLC, Term Loan, 7.424%, (3 mo. USD LIBOR + 3.75%), 11/9/27 | | | | | 26,923 | | | $ | 26,104,245 | |
| | | |
Epicor Software Corporation, Term Loan, 7.004%, (1 mo. USD LIBOR + 3.25%), 7/30/27 | | | | | 46,523 | | | | 44,272,743 | |
| | | |
| Finastra USA, Inc.: | | | | | | | | |
| | | |
Term Loan, 6.871%, (3 mo. USD LIBOR + 3.50%), 6/13/24 | | | | | 57,999 | | | | 52,677,932 | |
| | | |
Term Loan - Second Lien, 10.621%, (6 mo. USD LIBOR + 7.25%), 6/13/25 | | | | | 25,750 | | | | 19,248,125 | |
| | | |
Fiserv Investment Solutions, Inc., Term Loan, 6.961%, (3 mo. USD LIBOR + 4.00%), 2/18/27 | | | | | 5,867 | | | | 5,555,742 | |
| | | |
GoTo Group, Inc., Term Loan, 8.322%, (1 mo. USD LIBOR + 4.75%), 8/31/27 | | | | | 24,408 | | | | 15,743,117 | |
| | | |
Greeneden U.S. Holdings II, LLC, Term Loan, 5.855%, (3 mo. EURIBOR + 4.25%), 12/1/27 | | EUR | | | 1,228 | | | | 1,172,226 | |
| | | |
| Hyland Software, Inc.: | | | | | | | | |
| | | |
Term Loan, 7.254%, (1 mo. USD LIBOR + 3.50%), 7/1/24 | | | | | 61,331 | | | | 59,912,800 | |
| | | |
Term Loan - Second Lien, 10.004%, (1 mo. USD LIBOR + 6.25%), 7/7/25 | | | | | 1,750 | | | | 1,682,187 | |
| | | |
| IGT Holding IV AB: | | | | | | | | |
| | | |
Term Loan, 4.093%, (3 mo. EURIBOR + 2.90%), 3/31/28 | | EUR | | | 6,205 | | | | 5,689,679 | |
| | | |
Term Loan, 7.074%, (3 mo. USD LIBOR + 3.40%), 3/31/28 | | | | | 4,056 | | | | 3,944,720 | |
| | | |
| Ivanti Software, Inc.: | | | | | | | | |
| | | |
Term Loan, 7.332%, (3 mo. USD LIBOR + 4.25%), 12/1/27 | | | | | 13,948 | | | | 10,531,025 | |
| | | |
Term Loan - Second Lien, 10.332%, (3 mo. USD LIBOR + 7.25%), 12/1/28 | | | | | 9,750 | | | | 6,548,753 | |
| | | |
MA FinanceCo., LLC, Term Loan, 7.418%, (3 mo. USD LIBOR + 4.25%), 6/5/25 | | | | | 12,363 | | | | 12,301,566 | |
| | | |
| Magenta Buyer, LLC: | | | | | | | | |
| | | |
Term Loan, 9.17%, (3 mo. USD LIBOR + 4.75%), 7/27/28 | | | | | 51,109 | | | | 44,831,982 | |
| | | |
Term Loan - Second Lien, 12.67%, (3 mo. USD LIBOR + 8.25%), 7/27/29 | | | | | 16,175 | | | | 13,964,411 | |
| | | |
| Marcel LUX IV S.a.r.l.: | | | | | | | | |
| | | |
Term Loan, 4.693%, (3 mo. EURIBOR + 3.50%), 3/16/26 | | EUR | | | 8,650 | | | | 8,115,599 | |
| | | |
Term Loan, 6.979%, (SOFR + 3.25%), 3/15/26 | | | | | 11,597 | | | | 11,394,235 | |
| | | |
Term Loan, 7.125%, (SOFR + 4.00%), 12/31/27 | | | | | 731 | | | | 718,531 | |
| | | |
| Maverick Bidco, Inc.: | | | | | | | | |
| | | |
Term Loan, 8.165%, (3 mo. USD LIBOR + 3.75%), 5/18/28 | | | | | 11,070 | | | | 10,544,320 | |
| | | |
Term Loan - Second Lien, 11.165%, (3 mo. USD LIBOR + 6.75%), 5/18/29 | | | | | 3,175 | | | | 2,984,500 | |
| | | |
| McAfee, LLC: | | | | | | | | |
| | | |
Term Loan, 5.604%, (EURIBOR + 4.00%), 3/1/29(9) | | EUR | | | 16,608 | | | | 15,342,259 | |
| | | | |
| | 42 | | See Notes to Financial Statements. |
Eaton Vance
Floating Rate Portfolio
October 31, 2022
Portfolio of Investments — continued
| | | | | | | | | | |
| Borrower/Description | | | | Principal Amount* (000’s omitted) | | | Value | |
|
| Software (continued) | |
| | | |
| McAfee, LLC: (continued) | | | | | | | | |
| | | |
Term Loan, 6.87%, (SOFR + 3.75%), 3/1/29 | | | | | 38,578 | | | $ | 35,267,020 | |
| | | |
Mediaocean, LLC, Term Loan, 7.254%, (1 mo. USD LIBOR + 3.50%), 12/15/28 | | | | | 6,015 | | | | 5,668,914 | |
| | | |
MH Sub I, LLC, Term Loan, 7.504%, (1 mo. USD LIBOR + 3.75%), 9/13/24 | | | | | 4,850 | | | | 4,678,720 | |
| | | |
Mitnick Corporate Purchaser, Inc., Term Loan, 8.944%, (SOFR + 4.75%), 5/2/29 | | | | | 6,975 | | | | 6,662,869 | |
| | | |
N-Able International Holdings II, LLC, Term Loan, 6.07%, (3 mo. USD LIBOR + 3.00%), 7/19/28 | | | | | 1,277 | | | | 1,238,624 | |
| | | |
NortonLifeLock, Inc., Term Loan, 5.829%, (SOFR + 2.00%), 9/12/29 | | | | | 1,775 | | | | 1,736,330 | |
| | | |
Panther Commercial Holdings, L.P., Term Loan, 8.665%, (3 mo. USD LIBOR + 4.25%), 1/7/28 | | | | | 21,055 | | | | 19,067,938 | |
| | | |
| Polaris Newco, LLC: | | | | | | | | |
| | | |
Term Loan, 5.193%, (3 mo. EURIBOR + 4.00%), 6/2/28 | | EUR | | | 8,564 | | | | 7,884,583 | |
| | | |
Term Loan, 7.674%, (3 mo. USD LIBOR + 4.00%), 6/2/28 | | | | | 13,022 | | | | 11,942,605 | |
| | | |
Proofpoint, Inc., Term Loan, 6.32%, (3 mo. USD LIBOR + 3.25%), 8/31/28 | | | | | 46,914 | | | | 44,722,404 | |
| | | |
Quest Software US Holdings, Inc., Term Loan, 8.494%, (SOFR + 4.25%), 2/1/29 | | | | | 24,389 | | | | 18,132,446 | |
| | | |
RealPage, Inc., Term Loan, 6.754%, (1 mo. USD LIBOR + 3.00%), 4/24/28 | | | | | 25,368 | | | | 23,896,705 | |
| | | |
Red Planet Borrower, LLC, Term Loan, 7.504%, (1 mo. USD LIBOR + 3.75%), 10/2/28 | | | | | 15,345 | | | | 9,470,136 | |
| | | |
Redstone Holdco 2 L.P., Term Loan, 9.108%, (3 mo. USD LIBOR + 4.75%), 4/27/28 | | | | | 18,928 | | | | 13,748,875 | |
| | | |
| Sabre GLBL, Inc.: | | | | | | | | |
| | | |
Term Loan, 7.254%, (1 mo. USD LIBOR + 3.50%), 12/17/27 | | | | | 6,029 | | | | 5,410,859 | |
| | | |
Term Loan, 7.254%, (1 mo. USD LIBOR + 3.50%), 12/17/27 | | | | | 3,782 | | | | 3,394,390 | |
| | | |
Seattle Spinco, Inc., Term Loan, 6.504%, (1 mo. USD LIBOR + 2.75%), 6/21/24 | | | | | 10,389 | | | | 10,307,076 | |
| | | |
SkillSoft Corporation, Term Loan, 8.473%, (SOFR + 5.25%), 7/14/28 | | | | | 10,450 | | | | 8,689,197 | |
| | | |
SolarWinds Holdings, Inc., Term Loan, 6.504%, (1 mo. USD LIBOR + 2.75%), 2/5/24 | | | | | 19,531 | | | | 19,376,620 | |
| | | |
Sophia, L.P., Term Loan, 7.174%, (3 mo. USD LIBOR + 3.50%), 10/7/27 | | | | | 23,428 | | | | 22,636,883 | |
| | | |
Sovos Compliance, LLC, Term Loan, 8.254%, (1 mo. USD LIBOR + 4.50%), 8/11/28 | | | | | 10,434 | | | | 10,129,261 | |
| | | |
Sportradar Capital S.a.r.l., Term Loan, 4.443%, (1 mo. EURIBOR + 3.50%), 11/22/27 | | EUR | | | 7,804 | | | | 7,403,596 | |
| | | |
SS&C European Holdings S.a.r.l., Term Loan, 5.504%, (1 mo. USD LIBOR + 1.75%), 4/16/25 | | | | | 5,213 | | | | 5,112,226 | |
| | | | | | | | | | |
| Borrower/Description | | | | Principal Amount* (000’s omitted) | | | Value | |
|
| Software (continued) | |
| | | |
| SS&C Technologies, Inc.: | | | | | | | | |
| | | |
Term Loan, 5.504%, (1 mo. USD LIBOR + 1.75%), 4/16/25 | | | | | 6,422 | | | $ | 6,297,431 | |
| | | |
Term Loan, 6.079%, (SOFR + 2.25%), 3/22/29 | | | | | 3,428 | | | | 3,371,036 | |
| | | |
Term Loan, 6.079%, (SOFR + 2.25%), 3/22/29 | | | | | 5,166 | | | | 5,079,378 | |
| | | |
SurveyMonkey, Inc., Term Loan, 7.51%, (1 mo. USD LIBOR + 3.75%), 10/10/25 | | | | | 11,443 | | | | 11,099,712 | |
| | | |
Turing Midco, LLC, Term Loan, 6.504%, (1 mo. USD LIBOR + 2.75%), 3/23/28 | | | | | 635 | | | | 625,141 | |
| | | |
| Ultimate Software Group, Inc. (The): | | | | | | | | |
| | | |
Term Loan, 6.998%, (3 mo. USD LIBOR + 3.25%), 5/4/26 | | | | | 48,539 | | | | 46,950,182 | |
| | | |
Term Loan, 7.504%, (1 mo. USD LIBOR + 3.75%), 5/4/26 | | | | | 18,884 | | | | 18,394,932 | |
| | | |
Term Loan - Second Lien, 8.998%, (1 mo. USD LIBOR + 5.25%), 5/3/27 | | | | | 1,450 | | | | 1,342,458 | |
| | | |
Veritas US, Inc., Term Loan, 8.674%, (3 mo. USD LIBOR + 5.00%), 9/1/25 | | | | | 13,783 | | | | 11,037,913 | |
| | | |
Vision Solutions, Inc., Term Loan, 8.358%, (3 mo. USD LIBOR + 4.00%), 4/24/28 | | | | | 36,453 | | | | 31,075,984 | |
| | | |
VS Buyer, LLC, Term Loan, 6.754%, (1 mo. USD LIBOR + 3.00%), 2/28/27 | | | | | 21,464 | | | | 20,927,483 | |
| |
| | | | $ | 1,203,017,686 | |
|
| Specialty Retail — 2.1% | |
| | | |
Belron Finance US, LLC, Term Loan, 5.375%, (3 mo. USD LIBOR + 2.50%), 4/13/28 | | | | | 7,708 | | | $ | 7,598,031 | |
| | | |
Belron Luxembourg S.a.r.l., Term Loan, 2.769%, (3 mo. EURIBOR + 2.50%), 4/13/28 | | EUR | | | 3,575 | | | | 3,309,973 | |
| | | |
Boels Topholding B.V., Term Loan, 3.571%, (3 mo. EURIBOR + 3.25%), 2/6/27 | | EUR | | | 7,750 | | | | 7,270,244 | |
| | | |
| David’s Bridal, Inc.: | | | | | | | | |
| | | |
Term Loan, 9.42%, (3 mo. USD LIBOR + 5.00%), 4.42% cash, 5.00% PIK, 6/23/23 | | | | | 3,942 | | | | 3,798,692 | |
| | | |
Term Loan, 9.754%, (1 mo. USD LIBOR + 6.00%), 6/30/23 | | | | | 4,724 | | | | 4,421,866 | |
| | | |
Great Outdoors Group, LLC, Term Loan, 7.504%, (1 mo. USD LIBOR + 3.75%), 3/6/28 | | | | | 44,635 | | | | 42,161,042 | |
| | | |
Harbor Freight Tools USA, Inc., Term Loan, 6.504%, (1 mo. USD LIBOR + 2.75%), 10/19/27 | | | | | 32,996 | | | | 31,011,944 | |
| | | |
| L1R HB Finance Limited: | | | | | | | | |
| | | |
Term Loan, 6.016%, (6 mo. EURIBOR + 4.25%), 9/2/24 | | EUR | | | 4,674 | | | | 3,475,496 | |
| | | |
Term Loan, 7.217%, (SONIA + 5.25%), 9/2/24 | | GBP | | | 9,172 | | | | 7,941,484 | |
| | | |
Les Schwab Tire Centers, Term Loan, 6.58%, (3 mo. USD LIBOR + 3.25%), 11/2/27 | | | | | 27,454 | | | | 26,732,982 | |
| | | |
LIDS Holdings, Inc., Term Loan, 8.99%, (SOFR + 5.50%), 12/14/26 | | | | | 5,823 | | | | 4,921,891 | |
| | | | |
| | 43 | | See Notes to Financial Statements. |
Eaton Vance
Floating Rate Portfolio
October 31, 2022
Portfolio of Investments — continued
| | | | | | | | | | |
| Borrower/Description | | | | Principal Amount* (000’s omitted) | | | Value | |
|
| Specialty Retail (continued) | |
| | | |
Mattress Firm, Inc., Term Loan, 8.433%, (3 mo. USD LIBOR + 4.25%), 9/25/28 | | | | | 16,632 | | | $ | 14,287,919 | |
| | | |
PetSmart, Inc., Term Loan, 7.50%, (1 mo. USD LIBOR + 3.75%), 2/11/28 | | | | | 17,351 | | | | 16,740,325 | |
| |
| | | | $ | 173,671,889 | |
|
| Technology Hardware, Storage & Peripherals — 0.1% | |
| | | |
NCR Corporation, Term Loan, 6.92%, (3 mo. USD LIBOR + 2.50%), 8/28/26 | | | | | 8,997 | | | $ | 8,666,866 | |
| |
| | | | $ | 8,666,866 | |
|
| Thrifts & Mortgage Finance — 0.2% | |
| | | |
Ditech Holding Corporation, Term Loan, 0.00%, 6/30/23(12) | | | | | 22,620 | | | $ | 2,827,502 | |
| | | |
Walker & Dunlop, Inc., Term Loan, 6.079%, (SOFR + 2.25%), 12/16/28 | | | | | 12,952 | | | | 12,757,843 | |
| |
| | | | $ | 15,585,345 | |
|
| Trading Companies & Distributors — 2.5% | |
| | | |
American Builders & Contractors Supply Co., Inc., Term Loan, 5.754%, (1 mo. USD LIBOR + 2.00%), 1/15/27 | | | | | 21,461 | | | $ | 21,067,243 | |
| | | |
| Avolon TLB Borrower 1 (US), LLC: | | | | | | | | |
| | | |
Term Loan, 5.239%, (1 mo. USD LIBOR + 1.75%), 1/15/25 | | | | | 25,082 | | | | 24,661,358 | |
| | | |
Term Loan, 5.739%, (1 mo. USD LIBOR + 2.25%), 12/1/27 | | | | | 13,964 | | | | 13,728,508 | |
| | | |
Core & Main L.P., Term Loan, 6.528%, (USD LIBOR + 2.50%), 7/27/28(9) | | | | | 12,431 | | | | 12,155,481 | |
| | | |
DXP Enterprises, Inc., Term Loan, 8.504%, (1 mo. USD LIBOR + 4.75%), 12/16/27 | | | | | 4,225 | | | | 4,038,599 | |
| | | |
Electro Rent Corporation, Term Loan, 9.278%, (3 mo. USD LIBOR + 5.00%), 1/31/24 | | | | | 15,761 | | | | 14,880,759 | |
| | | |
| Hillman Group, Inc. (The): | | | | | | | | |
| | | |
Term Loan, 3.034%, (1 mo. USD LIBOR + 2.75%), 7/14/28(10) | | | | | 875 | | | | 838,043 | |
| | | |
Term Loan, 6.326%, (1 mo. USD LIBOR + 2.75%), 7/14/28 | | | | | 3,619 | | | | 3,466,614 | |
| | | |
Park River Holdings, Inc., Term Loan, 6.993%, (3 mo. USD LIBOR + 3.25%), 12/28/27 | | | | | 10,857 | | | | 9,251,931 | |
| | | |
| Patagonia Bidco Limited: | | | | | | | | |
| | | |
Term Loan, 6.94%, (SONIA + 5.25%), 3/5/29 | | GBP | | | 17,262 | | | | 16,430,285 | |
| | | |
Term Loan, 6.94%, (SONIA + 5.25%), 3/5/29 | | GBP | | | 3,138 | | | | 2,987,325 | |
| | | |
Quimper AB, Term Loan, 4.085%, (3 mo. EURIBOR + 2.93%), 2/16/26 | | EUR | | | 25,175 | | | | 22,971,774 | |
| | | | | | | | | | | | |
| Borrower/Description | | | | | Principal Amount* (000’s omitted) | | | Value | |
|
| Trading Companies & Distributors (continued) | |
| | | |
SiteOne Landscape Supply, LLC, Term Loan, 5.76%, (1 mo. USD LIBOR + 2.00%), 3/23/28 | | | | | | | 3,431 | | | $ | 3,402,666 | |
| | | |
Spin Holdco, Inc., Term Loan, 7.144%, (3 mo. USD LIBOR + 4.00%), 3/4/28 | | | | | | | 42,353 | | | | 37,498,715 | |
| | | |
| SRS Distribution, Inc.: | | | | | | | | | |
| | | |
Term Loan, 7.254%, (1 mo. USD LIBOR + 3.50%), 6/2/28 | | | | | | | 14,325 | | | | 13,343,013 | |
| | | |
Term Loan, 7.329%, (SOFR + 3.50%), 6/2/28 | | | | | | | 5,037 | | | | 4,690,648 | |
| | | |
TricorBraun Holdings, Inc., Term Loan, 7.004%, (1 mo. USD LIBOR + 3.25%), 3/3/28 | | | | | | | 829 | | | | 787,162 | |
| |
| | | | $ | 206,200,124 | |
|
| Wireless Telecommunication Services — 0.2% | |
| | | |
CCI Buyer, Inc., Term Loan, 7.553%, (SOFR + 4.00%), 12/17/27 | | | | | | | 7,914 | | | $ | 7,609,384 | |
| | | |
Digicel International Finance Limited, Term Loan, 7.004%, (1 mo. USD LIBOR + 3.25%), 5/28/24 | | | | | | | 14,057 | | | | 12,100,775 | |
| | | |
| | | | | | | | | | | $ | 19,710,159 | |
| | | |
Total Senior Floating-Rate Loans
(identified cost $7,543,162,144) | | | | | | | | | | $ | 6,829,205,613 | |
|
| Warrants — 0.0% | |
| Security | | | | | Shares | | | Value | |
|
| Leisure Goods/Activities/Movies — 0.0% | |
| | | |
Cineworld Group PLC, Exp. 11/23/25(5)(6) | | | | | | | 1,791,400 | | | $ | 0 | |
| | | |
| | | | | | | | | | | $ | 0 | |
|
| Retailers (Except Food and Drug) — 0.0% | |
| | | |
David’s Bridal, LLC, Exp.
11/26/22(4)(5)(6) | | | | | | | 51,888 | | | $ | 0 | |
| | | |
| | | | | | | | | | | $ | 0 | |
| | | |
Total Warrants
(identified cost $0) | | | | | | | | | | $ | 0 | |
| | | | |
| | 44 | | See Notes to Financial Statements. |
Eaton Vance
Floating Rate Portfolio
October 31, 2022
Portfolio of Investments — continued
| | | | | | | | | | | | |
| Short-Term Investments — 1.9% | | | | | | | | | | | | |
| Security | | | | | Shares | | | Value | |
| | | |
Morgan Stanley Institutional Liquidity Funds - Government Portfolio, Institutional Class, 2.88%(13) | | | | | | | 156,771,808 | | | $ | 156,771,808 | |
| | | |
Total Short-Term Investments
(identified cost $156,771,808) | | | | | | | | | | $ | 156,771,808 | |
| | | |
Total Investments — 97.6%
(identified cost $8,799,948,828) | | | | | | | | | | $ | 7,909,317,423 | |
| | | |
Less Unfunded Loan Commitments — (0.2)% | | | | | | | | | | $ | (15,840,797 | ) |
| | | |
Net Investments — 97.4%
(identified cost $8,784,108,031) | | | | | | | | | | $ | 7,893,476,626 | |
| | | |
Other Assets, Less Liabilities — 2.6% | | | | | | | | | | $ | 207,653,892 | |
| | | |
Net Assets — 100.0% | | | | | | | | | | $ | 8,101,130,518 | |
The percentage shown for each investment category in the Portfolio of Investments is based on net assets.
| | * | In U.S. dollars unless otherwise indicated. |
| | (1) | Security exempt from registration under Rule 144A of the Securities Act of 1933, as amended. These securities may be sold in certain transactions in reliance on an exemption from registration (normally to qualified institutional buyers). At October 31, 2022, the aggregate value of these securities is $828,991,656 or 10.2% of the Portfolio’s net assets. |
| | (2) | Variable rate security. The stated interest rate represents the rate in effect at October 31, 2022. |
| | (3) | Affiliated company (see Note 7). |
| | (4) | For fair value measurement disclosure purposes, security is categorized as Level 3 (see Note 8). |
| | (5) | Non-income producing security. |
| | (6) | Security was acquired in connection with a restructuring of a Senior Loan and may be subject to restrictions on resale. |
| | (7) | Amount is less than 0.05%. |
| | (8) | Senior floating-rate loans (Senior Loans) often require prepayments from excess cash flows or permit the borrowers to repay at their election. The degree to which borrowers repay, whether as a contractual requirement or at their election, cannot be predicted with accuracy. As a result, the actual remaining maturity may be substantially less than the stated maturities shown. However, Senior Loans will typically have an expected average life of approximately two to four years. Senior Loans typically have rates of interest which are redetermined periodically by reference to a base lending rate, plus a spread. These base lending rates are primarily the London Interbank Offered Rate (“LIBOR”) or the Secured Overnight Financing Rate (“SOFR”) and secondarily, the prime rate offered by one or more major United States banks (the “Prime Rate”). Base lending rates may be subject to a floor, or minimum rate. Rates for SOFR are generally 1 or 3-month tenors and may also be subject to a credit spread adjustment. Senior Loans are generally subject to contractual restrictions that must be satisfied before they can be bought or sold. |
| | (9) | The stated interest rate represents the weighted average interest rate at October 31, 2022 of contracts within the senior loan facility. Interest rates on contracts are primarily redetermined either weekly, monthly or quarterly by reference to the indicated base lending rate and spread and the reset period. |
| | (10) | Unfunded or partially unfunded loan commitments. The stated interest rate reflects the weighted average of the reference rate and spread for the funded portion, if any, and the commitment fees on the portion of the loan that is unfunded. At October 31, 2022, the total value of unfunded loan commitments is $13,795,189. See Note 1F for description. |
| | (11) | This Senior Loan will settle after October 31, 2022, at which time the interest rate will be determined. |
| | (12) | Issuer is in default with respect to interest and/or principal payments. For a variable rate security, interest rate has been adjusted to reflect non-accrual status. |
| | (13) | May be deemed to be an affiliated investment company. The rate shown is the annualized seven-day yield as of October 31, 2022. |
| | | | | | | | | | | | | | | | | | | | | | | | |
| Forward Foreign Currency Exchange Contracts (OTC) | | | | | | | | | |
| | | | | |
| Currency Purchased | | | Currency Sold | | | Counterparty | | Settlement
Date | | | Unrealized
Appreciation | | | Unrealized
(Depreciation) | |
| | | | | | | |
| USD | | | 275,596,332 | | | EUR | | | 280,766,698 | | | Standard Chartered Bank | | | 11/2/22 | | | $ | — | | | $ | (1,871,277 | ) |
| | | | | | | |
| USD | | | 278,080,923 | | | EUR | | | 280,766,698 | | | Standard Chartered Bank | | | 12/2/22 | | | | 22,582 | | | | — | |
| | | | | | | |
| USD | | | 4,960,610 | | | EUR | | | 5,000,000 | | | Bank of America, N.A. | | | 12/30/22 | | | | — | | | | (5,433 | ) |
| | | | | | | |
| USD | | | 42,087,033 | | | EUR | | | 43,125,827 | | | Bank of America, N.A. | | | 12/30/22 | | | | — | | | | (745,906 | ) |
| | | | | | | |
| USD | | | 42,096,620 | | | EUR | | | 43,125,827 | | | State Street Bank and Trust Company | | | 12/30/22 | | | | — | | | | (736,319 | ) |
| | | | | | | |
| USD | | | 52,870,587 | | | EUR | | | 54,170,212 | | | State Street Bank and Trust Company | | | 12/30/22 | | | | — | | | | (931,729 | ) |
| | | | | | | |
| USD | | | 41,868,950 | | | EUR | | | 43,125,827 | | | State Street Bank and Trust Company | | | 12/30/22 | | | | — | | | | (963,989 | ) |
| | | | | | | |
| USD | | | 63,152,939 | | | EUR | | | 64,688,740 | | | State Street Bank and Trust Company | | | 12/30/22 | | | | — | | | | (1,096,470 | ) |
| | | | | | | |
| USD | | | 34,826,781 | | | EUR | | | 34,639,475 | | | Bank of America, N.A. | | | 1/31/23 | | | | 338,110 | | | | — | |
| | | | |
| | 45 | | See Notes to Financial Statements. |
Eaton Vance
Floating Rate Portfolio
October 31, 2022
Portfolio of Investments — continued
| | | | | | | | | | | | | | | | | | | | | | | | |
| Forward Foreign Currency Exchange Contracts (OTC) (continued) | | | | | | | | | |
| | | | | |
| Currency Purchased | | | Currency Sold | | | Counterparty | | Settlement
Date | | | Unrealized
Appreciation | | | Unrealized
(Depreciation) | |
| | | | | | | |
| USD | | | 21,802,101 | | | EUR | | | 21,649,672 | | | Bank of America, N.A. | | | 1/31/23 | | | $ | 246,681 | | | $ | — | |
| | | | | | | |
| USD | | | 21,781,830 | | | EUR | | | 21,649,672 | | | Bank of America, N.A. | | | 1/31/23 | | | | 226,411 | | | | — | |
| | | | | | | |
| USD | | | 21,827,065 | | | EUR | | | 21,649,672 | | | Standard Chartered Bank | | | 1/31/23 | | | | 271,645 | | | | — | |
| | | | | | | |
| USD | | | 3,557,817 | | | EUR | | | 3,529,711 | | | Standard Chartered Bank | | | 1/31/23 | | | | 43,472 | | | | — | |
| | | | | | | |
| USD | | | 37,812,864 | | | EUR | | | 37,560,965 | | | State Street Bank and Trust Company | | | 1/31/23 | | | | 415,421 | | | | — | |
| | | | | | | |
| USD | | | 34,876,236 | | | EUR | | | 34,639,475 | | | State Street Bank and Trust Company | | | 1/31/23 | | | | 387,564 | | | | — | |
| | | | | | | |
| USD | | | 34,854,004 | | | EUR | | | 34,639,475 | | | State Street Bank and Trust Company | | | 1/31/23 | | | | 365,333 | | | | — | |
| | | | | | | |
| USD | | | 34,823,366 | | | EUR | | | 34,639,475 | | | State Street Bank and Trust Company | | | 1/31/23 | | | | 334,694 | | | | — | |
| | | | | | | |
| USD | | | 21,780,869 | | | EUR | | | 21,649,672 | | | State Street Bank and Trust Company | | | 1/31/23 | | | | 225,449 | | | | — | |
| | | | | | | |
| USD | | | 27,932,349 | | | GBP | | | 24,042,527 | | | State Street Bank and Trust Company | | | 1/31/23 | | | | 276,020 | | | | — | |
| | | | | | | |
| USD | | | 21,194,786 | | | GBP | | | 18,266,270 | | | State Street Bank and Trust Company | | | 1/31/23 | | | | 182,936 | | | | — | |
| | | | | | | |
| | | | | | | | | | | | | | | | | | | $ | 3,336,318 | | | $ | (6,351,123 | ) |
Abbreviations:
| | | | |
| | |
| DIP | | – | | Debtor In Possession |
| | |
| EURIBOR | | – | | Euro Interbank Offered Rate |
| | |
| LIBOR | | – | | London Interbank Offered Rate |
| | |
| OTC | | – | | Over-the-counter |
| | |
| PIK | | – | | Payment In Kind |
| | |
| SOFR | | – | | Secured Overnight Financing Rate |
| | |
| SONIA | | – | | Sterling Overnight Interbank Average |
Currency Abbreviations:
| | | | |
| | |
| EUR | | – | | Euro |
| | |
| GBP | | – | | British Pound Sterling |
| | |
| USD | | – | | United States Dollar |
| | | | |
| | 46 | | See Notes to Financial Statements. |
Eaton Vance
Floating Rate Portfolio
October 31, 2022
Statement of Assets and Liabilities
| | | | |
| Assets | | October 31, 2022 | |
| |
Unaffiliated investments, at value (identified cost $8,624,990,815) | | $ | 7,728,019,654 | |
| |
Affiliated investments, at value (identified cost $159,117,216) | | | 165,456,972 | |
| |
Cash | | | 60,602,545 | |
| |
Deposits for derivatives collateral — forward foreign currency exchange contracts | | | 9,460,000 | |
| |
Foreign currency, at value (identified cost $6,811,773) | | | 6,806,847 | |
| |
Interest receivable | | | 40,252,490 | |
| |
Dividends receivable from affiliated investments | | | 520,417 | |
| |
Receivable for investments sold | | | 107,467,802 | |
| |
Receivable for open forward foreign currency exchange contracts | | | 3,336,318 | |
| |
Prepaid upfront fees on notes payable | | | 419,817 | |
| |
Other receivables | | | 2,084,589 | |
| |
Prepaid expenses | | | 114,818 | |
| |
Total assets | | $ | 8,124,542,269 | |
|
| Liabilities | |
| |
Cash collateral due to brokers | | $ | 1,260,000 | |
| |
Payable for investments purchased | | | 10,975,850 | |
| |
Payable for open forward foreign currency exchange contracts | | | 6,351,123 | |
| |
Payable to affiliates: | | | | |
| |
Investment adviser fee | | | 3,427,703 | |
| |
Trustees’ fees | | | 9,042 | |
| |
Accrued expenses | | | 1,388,033 | |
| |
Total liabilities | | $ | 23,411,751 | |
| |
Net Assets applicable to investors’ interest in Portfolio | | $ | 8,101,130,518 | |
| | | | |
| | 47 | | See Notes to Financial Statements. |
Eaton Vance
Floating Rate Portfolio
October 31, 2022
Statement of Operations
| | | | |
| Investment Income | | Year Ended October 31, 2022 | |
| |
Dividend income | | $ | 3,256,926 | |
| |
Dividend income from affiliated investments | | | 2,629,727 | |
| |
Interest and other income | | | 464,039,211 | |
| |
Total investment income | | $ | 469,925,864 | |
| |
| Expenses | | | | |
| |
Investment adviser fee | | $ | 46,506,949 | |
| |
Trustees’ fees and expenses | | | 108,500 | |
| |
Custodian fee | | | 1,650,912 | |
| |
Legal and accounting services | | | 561,340 | |
| |
Interest expense and fees | | | 2,289,900 | |
| |
Miscellaneous | | | 436,279 | |
| |
Total expenses | | $ | 51,553,880 | |
| |
Deduct: | | | | |
| |
Waiver and/or reimbursement of expenses by affiliate | | $ | 250,289 | |
| |
Total expense reductions | | $ | 250,289 | |
| |
Net expenses | | $ | 51,303,591 | |
| |
Net investment income | | $ | 418,622,273 | |
| |
| Realized and Unrealized Gain (Loss) | | | | |
| |
Net realized gain (loss): | | | | |
| |
Investment transactions | | $ | (119,289,716 | ) |
| |
Investment transactions - affiliated investments | | | (82,915 | ) |
| |
Foreign currency transactions | | | 6,990,412 | |
| |
Forward foreign currency exchange contracts | | | 172,100,779 | |
| |
Net realized gain | | $ | 59,718,560 | |
| |
Change in unrealized appreciation (depreciation): | | | | |
| |
Investments | | $ | (818,037,102 | ) |
| |
Investments - affiliated investments | | | (1,388,424 | ) |
| |
Foreign currency | | | (2,145,936 | ) |
| |
Forward foreign currency exchange contracts | | | (10,320,397 | ) |
| |
Net change in unrealized appreciation (depreciation) | | $ | (831,891,859 | ) |
| |
Net realized and unrealized loss | | $ | (772,173,299 | ) |
| |
Net decrease in net assets from operations | | $ | (353,551,026 | ) |
| | | | |
| | 48 | | See Notes to Financial Statements. |
Eaton Vance
Floating Rate Portfolio
October 31, 2022
Statements of Changes in Net Assets
| | | | | | | | |
| | | Year Ended October 31, | |
| Increase (Decrease) in Net Assets | | 2022 | | | 2021 | |
| | |
From operations: | | | | | | | | |
| | |
Net investment income | | $ | 418,622,273 | | | $ | 256,806,743 | |
| | |
Net realized gain | | | 59,718,560 | | | | 9,155,076 | |
| | |
Net change in unrealized appreciation (depreciation) | | | (831,891,859 | ) | | | 224,746,482 | |
| | |
Net increase (decrease) in net assets from operations | | $ | (353,551,026 | ) | | $ | 490,708,301 | |
| | |
Capital transactions: | | | | | | | | |
| | |
Contributions | | $ | 2,094,290,768 | | | $ | 3,163,957,748 | |
| | |
Withdrawals | | | (2,626,390,995 | ) | | | (317,385,727 | ) |
| | |
Net increase (decrease) in net assets from capital transactions | | $ | (532,100,227 | ) | | $ | 2,846,572,021 | |
| | |
Net increase (decrease) in net assets | | $ | (885,651,253 | ) | | $ | 3,337,280,322 | |
|
| Net Assets | |
| | |
At beginning of year | | $ | 8,986,781,771 | | | $ | 5,649,501,449 | |
| | |
At end of year | | $ | 8,101,130,518 | | | $ | 8,986,781,771 | |
| | | | |
| | 49 | | See Notes to Financial Statements. |
Eaton Vance
Floating Rate Portfolio
October 31, 2022
Financial Highlights
| | | | | | | | | | | | | | | | | | | | |
| | | Year Ended October 31, | |
| Ratios/Supplemental Data | | 2022 | | | 2021 | | | 2020 | | | 2019 | | | 2018 | |
| | | | | |
Ratios (as a percentage of average daily net assets): | | | | | | | | | | | | | | | | | | | | |
| | | | | |
Expenses | | | 0.54 | %(1) | | | 0.56 | % | | | 0.59 | % | | | 0.55 | % | | | 0.54 | % |
| | | | | |
Net investment income | | | 4.39 | % | | | 3.51 | % | | | 4.17 | % | | | 5.09 | % | | | 4.38 | % |
| | | | | |
Portfolio Turnover | | | 27 | % | | | 26 | % | | | 28 | % | | | 16 | % | | | 30 | % |
| | | | | |
Total Return | | | (3.32 | )% | | | 7.80 | % | | | 1.18 | % | | | 1.64 | % | | | 5.05 | % |
| | | | | |
Net assets, end of year (000’s omitted) | | $ | 8,101,131 | | | $ | 8,986,782 | | | $ | 5,649,501 | | | $ | 7,966,641 | | | $ | 11,502,389 | |
| (1) | Includes a reduction by the investment adviser of a portion of its adviser fee due to the Portfolio’s investment in the Liquidity Fund (equal to less than 0.005% of average daily net assets for the year ended October 31, 2022). |
Eaton Vance
Floating Rate Portfolio
October 31, 2022
Notes to Financial Statements
1 Significant Accounting Policies
Eaton Vance Floating Rate Portfolio (the Portfolio) is a Massachusetts business trust registered under the Investment Company Act of 1940, as amended (the 1940 Act), as a diversified, open-end management investment company. The Portfolio’s investment objective is to provide a high level of current income. The Declaration of Trust permits the Trustees to issue interests in the Portfolio. At October 31, 2022, Eaton Vance Floating-Rate Fund and Eaton Vance Floating-Rate & High Income Fund held an interest of 84.3% and 15.7%, respectively, in the Portfolio.
The following is a summary of significant accounting policies of the Portfolio. The policies are in conformity with accounting principles generally accepted in the United States of America (U.S. GAAP). The Portfolio is an investment company and follows accounting and reporting guidance in the Financial Accounting Standards Board (FASB) Accounting Standards Codification Topic 946.
A Investment Valuation — The following methodologies are used to determine the market value or fair value of investments.
Senior Floating-Rate Loans. Interests in senior floating-rate loans (Senior Loans) are valued generally at the average mean of bid and ask quotations obtained from a third party pricing service. Senior Loans, for which a valuation is not available or deemed unreliable, are fair valued by the investment adviser utilizing one or more of the valuation techniques described below to assess the likelihood that the borrower will make a full repayment of the loan underlying such Senior Loan. If the investment adviser believes that there is a reasonable likelihood of full repayment, the investment adviser will determine fair value using a matrix pricing approach that considers the yield on the Senior Loan relative to yields on other Senior Loans issued by companies of comparable credit quality. If the investment adviser believes there is not a reasonable likelihood of full repayment, the investment adviser will determine fair value using analyses that include, but are not limited to: (i) a comparison of the value of the borrower’s outstanding equity and debt to that of comparable public companies; (ii) a discounted cash flow analysis; or (iii) when the investment adviser believes it is likely that a borrower will be liquidated or sold, an analysis of the terms of such liquidation or sale. In certain cases, the investment adviser will use a combination of analytical methods to determine fair value, such as when only a portion of a borrower’s assets are likely to be sold. In conducting its assessment and analyses for purposes of determining fair value of a Senior Loan, the investment adviser will use its discretion and judgment in considering and appraising relevant factors. Junior Loans (i.e., subordinated loans and second lien loans) are valued in the same manner as Senior Loans.
Debt Obligations. Debt obligations are generally valued on the basis of valuations provided by third party pricing services, as derived from such services’ pricing models. Inputs to the models may include, but are not limited to, reported trades, executable bid and ask prices, broker/dealer quotations, prices or yields of securities with similar characteristics, interest rates, anticipated prepayments, benchmark curves or information pertaining to the issuer, as well as industry and economic events. The pricing services may use a matrix approach, which considers information regarding securities with similar characteristics to determine the valuation for a security. Short-term debt obligations purchased with a remaining maturity of sixty days or less for which a valuation from a third party pricing service is not readily available may be valued at amortized cost, which approximates fair value.
Equity Securities. Equity securities listed on a U.S. securities exchange generally are valued at the last sale or closing price on the day of valuation or, if no sales took place on such date, at the mean between the closing bid and ask prices on the exchange where such securities are principally traded. Equity securities listed on the NASDAQ National Market System are valued at the NASDAQ official closing price. Unlisted or listed securities for which closing sales prices or closing quotations are not available are valued at the mean between the latest available bid and ask prices or, in the case of preferred equity securities that are not listed or traded in the over-the-counter market, by a third party pricing service that uses various techniques that consider factors including, but not limited to, prices or yields of securities with similar characteristics, benchmark yields, broker/dealer quotes, quotes of underlying common stock, issuer spreads, as well as industry and economic events.
Derivatives. Forward foreign currency exchange contracts are generally valued at the mean of the average bid and average asked prices that are reported by currency dealers to a third party pricing service at the valuation time. Such third party pricing service valuations are supplied for specific settlement periods and the Portfolio’s forward foreign currency exchange contracts are valued at an interpolated rate between the closest preceding and subsequent settlement period reported by the third party pricing service.
Foreign Securities and Currencies. Foreign securities and currencies are valued in U.S. dollars, based on foreign currency exchange rate quotations supplied by a third party pricing service. The pricing service uses a proprietary model to determine the exchange rate. Inputs to the model include reported trades and implied bid/ask spreads.
Other. Investments in management investment companies (including money market funds) that do not trade on an exchange are valued at the net asset value as of the close of each business day.
Fair Valuation. In connection with Rule 2a-5 of the 1940 Act, which became effective September 8, 2022, the Trustees have designated the Portfolio’s investment adviser as its valuation designee. Investments for which valuations or market quotations are not readily available or are deemed unreliable are valued by the investment adviser, as valuation designee, at fair value using methods that most fairly reflect the security’s “fair value”, which is the amount that the Portfolio might reasonably expect to receive for the security upon its current sale in the ordinary course. Each such determination is based on a consideration of relevant factors, which are likely to vary from one pricing context to another. These factors may include, but are not limited to, the type of security, the existence of any contractual restrictions on the security’s disposition, the price and extent of public trading in similar securities of the issuer or of comparable companies or entities, quotations or relevant information obtained from broker/dealers or other market participants, information obtained from the issuer, analysts, and/or the appropriate stock exchange (for exchange-traded securities), an analysis of the company’s or entity’s financial statements, and an evaluation of the forces that influence the issuer and the market(s) in which the security is purchased and sold.
Eaton Vance
Floating Rate Portfolio
October 31, 2022
Notes to Financial Statements — continued
B Investment Transactions — Investment transactions for financial statement purposes are accounted for on a trade date basis. Realized gains and losses on investments sold are determined on the basis of identified cost.
C Income — Interest income is recorded on the basis of interest accrued, adjusted for amortization of premium or accretion of discount. Fees associated with loan amendments are recognized immediately. Dividend income is recorded on the ex-dividend date for dividends received in cash and/or securities. Withholding taxes on foreign interest, dividends and capital gains have been provided for in accordance with the Portfolio’s understanding of the applicable countries’ tax rules and rates. Distributions from investment companies are recorded as dividend income, capital gains or return of capital based on the nature of the distribution.
D Federal Taxes — The Portfolio has elected to be treated as a partnership for federal tax purposes. No provision is made by the Portfolio for federal or state taxes on any taxable income of the Portfolio because each investor in the Portfolio is ultimately responsible for the payment of any taxes on its share of taxable income. Since at least one of the Portfolio’s investors is a regulated investment company that invests all or substantially all of its assets in the Portfolio, the Portfolio normally must satisfy the applicable source of income and diversification requirements (under the Internal Revenue Code) in order for its investors to satisfy them. The Portfolio will allocate, at least annually among its investors, each investor’s distributive share of the Portfolio’s net investment income, net realized capital gains and losses and any other items of income, gain, loss, deduction or credit.
As of October 31, 2022, the Portfolio had no uncertain tax positions that would require financial statement recognition, de-recognition, or disclosure. The Portfolio files a U.S. federal income tax return annually after its fiscal year-end, which is subject to examination by the Internal Revenue Service for a period of three years from the date of filing.
E Foreign Currency Translation — Investment valuations, other assets, and liabilities initially expressed in foreign currencies are translated each business day into U.S. dollars based upon current exchange rates. Purchases and sales of foreign investment securities and income and expenses denominated in foreign currencies are translated into U.S. dollars based upon currency exchange rates in effect on the respective dates of such transactions. Recognized gains or losses on investment transactions attributable to changes in foreign currency exchange rates are recorded for financial statement purposes as net realized gains and losses on investments. That portion of unrealized gains and losses on investments that results from fluctuations in foreign currency exchange rates is not separately disclosed.
F Unfunded Loan Commitments — The Portfolio may enter into certain loan agreements all or a portion of which may be unfunded. The Portfolio is obligated to fund these commitments at the borrower’s discretion. These commitments are disclosed in the accompanying Portfolio of Investments. At October 31, 2022, the Portfolio had sufficient cash and/or securities to cover these commitments.
G Use of Estimates — The preparation of the financial statements in conformity with U.S. GAAP requires management to make estimates and assumptions that affect the reported amounts of assets and liabilities at the date of the financial statements and the reported amounts of income and expense during the reporting period. Actual results could differ from those estimates.
H Indemnifications — Under the Portfolio’s organizational documents, its officers and Trustees may be indemnified against certain liabilities and expenses arising out of the performance of their duties to the Portfolio. Under Massachusetts law, if certain conditions prevail, interestholders in the Portfolio could be deemed to have personal liability for the obligations of the Portfolio. However, the Portfolio’s Declaration of Trust contains an express disclaimer of liability on the part of Portfolio interestholders. Additionally, in the normal course of business, the Portfolio enters into agreements with service providers that may contain indemnification clauses. The Portfolio’s maximum exposure under these arrangements is unknown as this would involve future claims that may be made against the Portfolio that have not yet occurred.
I Forward Foreign Currency Exchange Contracts — The Portfolio may enter into forward foreign currency exchange contracts for the purchase or sale of a specific foreign currency at a fixed price on a future date. The forward foreign currency exchange contracts are adjusted by the daily exchange rate of the underlying currency and any gains or losses are recorded as unrealized until such time as the contracts have been closed. Risks may arise upon entering these contracts from the potential inability of counterparties to meet the terms of their contracts and from movements in the value of a foreign currency relative to the U.S. dollar.
Eaton Vance
Floating Rate Portfolio
October 31, 2022
Notes to Financial Statements — continued
2 Investment Adviser Fee and Other Transactions with Affiliates
The investment adviser fee is earned by Boston Management and Research (BMR), an indirect, wholly-owned subsidiary of Morgan Stanley, as compensation for investment advisory services rendered to the Portfolio. The investment adviser fee is computed at an annual rate as a percentage of the Portfolio’s average daily net assets as follows and is payable monthly:
| | | | |
| Average Daily Net Assets | | Annual Fee Rate | |
| |
Up to $1 billion | | | 0.5750 | % |
| |
$1 billion but less than $2 billion | | | 0.5250 | % |
| |
$2 billion but less than $5 billion | | | 0.4900 | % |
| |
$5 billion but less than $10 billion | | | 0.4600 | % |
| |
$10 billion but less than $15 billion | | | 0.4350 | % |
| |
$15 billion but less than $20 billion | | | 0.4150 | % |
| |
$20 billion but less than $25 billion | | | 0.4000 | % |
| |
$25 billion and over | | | 0.3900 | % |
For the year ended October 31, 2022, the Portfolio’s investment adviser fee amounted to $46,506,949 or 0.49% of the Portfolio’s average daily net assets. Effective April 26, 2022, the Portfolio may invest in a money market fund, the Institutional Class of the Morgan Stanley Institutional Liquidity Funds - Government Portfolio (the "Liquidity Fund"), an open-end management investment company managed by Morgan Stanley Investment Management Inc., a wholly-owned subsidiary of Morgan Stanley. The investment adviser fee paid by the Portfolio is reduced by an amount equal to its pro-rata share of the advisory and administration fees paid by the Portfolio due to its investment in the Liquidity Fund. For the year ended October 31, 2022, the investment adviser fee paid was reduced by $250,289 relating to the Portfolio’s investment in the Liquidity Fund. Prior to April 26, 2022, the Fund may have invested its cash in Eaton Vance Cash Reserves Fund, LLC (Cash Reserves Fund), an affiliated investment company managed by Eaton Vance Management (EVM), an affiliate of BMR. EVM did not receive a fee for advisory services provided to Cash Reserves Fund.
Trustees and officers of the Portfolio who are members of EVM’s or BMR’s organizations receive remuneration for their services to the Portfolio out of the investment adviser fee. Trustees of the Portfolio who are not affiliated with the investment adviser may elect to defer receipt of all or a percentage of their annual fees in accordance with the terms of the Trustees Deferred Compensation Plan. For the year ended October 31, 2022, no significant amounts have been deferred. Certain officers and Trustees of the Portfolio are officers of the above organizations.
3 Purchases and Sales of Investments
Purchases and sales of investments, other than short-term obligations and including maturities, paydowns and principal repayments on Senior Loans, aggregated $2,490,453,168 and $2,607,264,764, respectively, for the year ended October 31, 2022.
4 Federal Income Tax Basis of Investments
The cost and unrealized appreciation (depreciation) of investments, including open derivative contracts, of the Portfolio at October 31, 2022, as determined on a federal income tax basis, were as follows:
| | | | |
| Aggregate cost | | $8,624,117,550 | |
| |
Gross unrealized appreciation | | $ | 40,569,938 | |
| |
Gross unrealized depreciation | | | (771,210,862 | ) |
| |
Net unrealized depreciation | | $ | (730,640,924 | ) |
5 Financial Instruments
The Portfolio may trade in financial instruments with off-balance sheet risk in the normal course of its investing activities. These financial instruments may include forward foreign currency exchange contracts and may involve, to a varying degree, elements of risk in excess of the amounts recognized for financial statement purposes. The notional or contractual amounts of these instruments represent the investment the Portfolio has in particular classes of financial instruments and do not necessarily represent the amounts potentially subject to risk. The measurement of the risks associated with these instruments is meaningful only when all related and offsetting transactions are considered. A summary of obligations under these financial instruments at October 31, 2022 is included in the Portfolio of Investments. At October 31, 2022, the Portfolio had sufficient cash and/or securities to cover commitments under these contracts.
Eaton Vance
Floating Rate Portfolio
October 31, 2022
Notes to Financial Statements — continued
The Portfolio is subject to foreign exchange risk in the normal course of pursuing its investment objective. Because the Portfolio holds foreign currency denominated investments, the value of these investments and related receivables and payables may change due to future changes in foreign currency exchange rates. To hedge against this risk, the Portfolio enters into forward foreign currency exchange contracts.
The Portfolio enters into forward foreign currency exchange contracts that may contain provisions whereby the counterparty may terminate the contract under certain conditions, including but not limited to a decline in the Portfolio’s net assets below a certain level over a certain period of time, which would trigger a payment by the Portfolio for those derivatives in a liability position. At October 31, 2022, the fair value of derivatives with credit related contingent features in a net liability position was $6,351,123. The aggregate fair value of assets pledged as collateral by the Portfolio for such liability was $8,200,000 at October 31, 2022.
The over-the-counter (OTC) derivatives in which the Portfolio invests are subject to the risk that the counterparty to the contract fails to perform its obligations under the contract. To mitigate this risk, the Portfolio has entered into an International Swaps and Derivatives Association, Inc. Master Agreement (“ISDA Master Agreement”) or similar agreement with substantially all its derivative counterparties. An ISDA Master Agreement is a bilateral agreement between the Portfolio and a counterparty that governs certain OTC derivatives and typically contains, among other things, set-off provisions in the event of a default and/or termination event as defined under the relevant ISDA Master Agreement. Under an ISDA Master Agreement, the Portfolio may, under certain circumstances, offset with the counterparty certain derivative financial instruments’ payables and/or receivables with collateral held and/or posted and create one single net payment. The provisions of the ISDA Master Agreement typically permit a single net payment in the event of default including the bankruptcy or insolvency of the counterparty. However, bankruptcy or insolvency laws of a particular jurisdiction may impose restrictions on or prohibitions against the right of offset in bankruptcy or insolvency. Certain ISDA Master Agreements allow counterparties to OTC derivatives to terminate derivative contracts prior to maturity in the event the Portfolio’s net assets decline by a stated percentage or the Portfolio fails to meet the terms of its ISDA Master Agreements, which would cause the counterparty to accelerate payment by the Portfolio of any net liability owed to it.
The collateral requirements for derivatives traded under an ISDA Master Agreement are governed by a Credit Support Annex to the ISDA Master Agreement. Collateral requirements are determined at the close of business each day and are typically based on changes in market values for each transaction under an ISDA Master Agreement and netted into one amount for such agreement. Generally, the amount of collateral due from or to a counterparty is subject to a minimum transfer threshold amount before a transfer is required, which may vary by counterparty. Collateral pledged for the benefit of the Portfolio and/or counterparty is held in segregated accounts by the Portfolio’s custodian and cannot be sold, re-pledged, assigned or otherwise used while pledged. The portion of such collateral representing cash, if any, is reflected as deposits for derivatives collateral and, in the case of cash pledged by a counterparty for the benefit of the Portfolio, a corresponding liability on the Statement of Assets and Liabilities. Securities pledged by the Portfolio as collateral, if any, are identified as such in the Portfolio of Investments.
The fair value of open derivative instruments (not considered to be hedging instruments for accounting disclosure purposes) and whose primary underlying risk exposure is foreign exchange risk at October 31, 2022 was as follows:
| | | | | | | | |
| | | Fair Value | |
| Derivative | | Asset Derivative | | | Liability Derivative | |
| | |
Forward foreign currency exchange contracts | | $ | 3,336,318 | (1) | | $ | (6,351,123 | )(2) |
| (1) | Statement of Assets and Liabilities location: Receivable for open forward foreign currency exchange contracts. |
| (2) | Statement of Assets and Liabilities location: Payable for open forward foreign currency exchange contracts. |
The Portfolio’s derivative assets and liabilities at fair value by risk, which are reported gross in the Statement of Assets and Liabilities, are presented in the table above. The following tables present the Portfolio’s derivative assets and liabilities by counterparty, net of amounts available for offset under a master netting agreement and net of the related collateral received by the Portfolio for such assets and pledged by the Portfolio for such liabilities as of October 31, 2022.
| | | | | | | | | | | | | | | | | | | | |
| Counterparty | | Derivative
Assets Subject to
Master Netting
Agreement | | | Derivatives
Available
for Offset | | | Non-cash
Collateral
Received(a) | | | Cash
Collateral
Received(a) | | | Net Amount
of Derivative
Assets(b) | |
| | | | | |
Bank of America, N.A. | | $ | 811,202 | | | $ | (751,339 | ) | | $ | — | | | $ | (59,863 | ) | | $ | — | |
| | | | | |
Standard Chartered Bank | | | 337,699 | | | | (337,699 | ) | | | — | | | | — | | | | — | |
| | | | | |
State Street Bank and Trust Company | | | 2,187,417 | | | | (2,187,417 | ) | | | — | | | | — | | | | — | |
| | | | | |
| | | $ | 3,336,318 | | | $ | (3,276,455 | ) | | $ | — | | | $ | (59,863 | ) | | $ | — | |
Eaton Vance
Floating Rate Portfolio
October 31, 2022
Notes to Financial Statements — continued
| | | | | | | | | | | | | | | | | | | | |
| Counterparty | | Derivative
Liabilities Subject to
Master Netting
Agreement | | | Derivatives
Available
for Offset | | | Non-cash
Collateral
Pledged(a) | | | Cash
Collateral
Pledged(a) | | | Net Amount
of Derivative
Liabilities(c) | |
| | | | | |
Bank of America, N.A. | | $ | (751,339 | ) | | $ | 751,339 | | | $ | — | | | $ | — | | | $ | — | |
| | | | | |
Standard Chartered Bank | | | (1,871,277 | ) | | | 337,699 | | | | — | | | | 1,533,578 | | | | — | |
| | | | | |
State Street Bank and Trust Company | | | (3,728,507 | ) | | | 2,187,417 | | | | — | | | | 1,541,090 | | | | — | |
| | | | | |
| | | $ | (6,351,123 | ) | | $ | 3,276,455 | | | $ | — | | | $ | 3,074,668 | | | $ | — | |
| (a) | In some instances, the total collateral received and/or pledged may be more than the amount shown due to overcollateralization. |
| (b) | Net amount represents the net amount due from the counterparty in the event of default. |
| (c) | Net amount represents the net amount payable to the counterparty in the event of default. |
The effect of derivative instruments (not considered to be hedging instruments for accounting disclosure purposes) on the Statement of Operations and whose primary underlying risk exposure is foreign exchange risk for the year ended October 31, 2022 was as follows:
| | | | | | | | |
| Derivative | | Realized Gain (Loss)
on Derivatives Recognized
in Income(1) | | | Change in Unrealized
Appreciation (Depreciation) on
Derivatives Recognized in Income(2) | |
| | |
Forward foreign currency exchange contracts | | $ | 172,100,779 | | | $ | (10,320,397 | ) |
| (1) | Statement of Operations location: Net realized gain (loss) - Forward foreign currency exchange contracts. |
| (2) | Statement of Operations location: Change in unrealized appreciation (depreciation) - Forward foreign currency exchange contracts. |
The average notional amount of forward foreign currency exchange contracts (based on the absolute value of notional amounts of currency purchased and currency sold) outstanding during the year ended October 31, 2022, which is indicative of the volume of this derivative type, was approximately $1,241,185,000.
6 Credit Facility
The Portfolio participates with another portfolio and fund managed by EVM and its affiliates in a $700 million ($725 million prior to June 30, 2022 and $650 million prior to March 7, 2022) unsecured credit facility agreement (Agreement) with a group of banks, which is in effect through March 6, 2023. Borrowings are made by the Portfolio solely to facilitate the handling of unusual and/or unanticipated short-term cash requirements. At the Portfolio’s option, any loan under the Credit Facility that is made to it will bear interest at a rate equal to (i) the Benchmark Rate (defined below) plus a margin or, (ii) the Base Rate, or (iii) the Overnight Rate plus a margin. Base Rate is the highest of (a) administrative agent’s prime rate, (b) 50 basis points above the Federal Funds rate, (c) the Benchmark Rate plus a margin and (d) 1.00%, in each case as in effect from time to time. The “Overnight Rate” is the greatest of the Benchmark Rate, the Federal Funds rate and 0.00%. “Benchmark Rate” means Term SOFR (defined as the forward-looking Secured Overnight Financing Rate term rate published two U.S. government securities business days prior to the commencement of the applicable interest period plus the Term SOFR Adjustment) for an interest period of one-month’s duration. To the extent that, at any time, the Benchmark Rate is less than 0.00%, the Benchmark Rate shall be deemed to be 0.00% for purposes of the Credit Facility. “Term SOFR Adjustment” means 0.10%. In addition, a fee computed at an annual rate of 0.15% on the daily unused portion of each lender’s commitment amount is allocated among the participating portfolios and fund at the end of each quarter. Also included in interest expense and fees on the Statement of Operations is approximately $1,241,000 of amortization of upfront fees paid by the Portfolio in connection with the annual renewal of the Agreement. The unamortized balance of upfront fees at October 31, 2022 is $419,817 and is included in prepaid expenses in the Statement of Assets and Liabilities. Because the credit facility is not available exclusively to the Portfolio and the maximum amount is capped, it may be unable to borrow some or all of a requested amount at any particular time. The Portfolio did not have any significant borrowings during the year ended October 31, 2022.
Eaton Vance
Floating Rate Portfolio
October 31, 2022
Notes to Financial Statements — continued
7 Investments in Affiliated Companies/Funds
An affiliated company is a company in which a fund has a direct or indirect ownership of, control of, or voting power of 5 percent or more of the outstanding voting shares, or a company that is under common ownership or control with a fund. At October 31, 2022, the value of the portfolio’s investment in affiliated companies and funds that may deemed to be affiliated was $165,456,972, which represents 2.0% of the Portfolio’s net assets. Transactions in affiliated companies and funds by the Portfolio for the year ended October 31, 2022 were as follows:
| | | | | | | | | | | | | | | | | | | | | | | | | | | | | | | | |
| Name | | Value,
beginning
of period | | | Purchases | | | Sales
proceeds | | | Net
realized
gain (loss) | | | Change in
unrealized
appreciation
(depreciation) | | | Value, end
of period | | | Dividend
income | | | Units/Shares,
end of period | |
| | | | | | | | |
Common Stocks* | | | | | | | | | | | | | | | | | | | | | | | | | | | | | | | | |
| | | | | | | | |
IAP Global Services,
LLC(1)(2)(3) | | $ | 10,073,588 | | | $ | — | | | $ | — | | | $ | — | | | $ | (1,388,424 | ) | | $ | 8,685,164 | | | $ | — | | | | 2,577 | |
| | | | | | | | |
Short-Term Investments | | | | | | | | | | | | | | | | | | | | | | | | | | | | | | | | |
| | | | | | | | |
Cash Reserves Fund | | | 667,360,691 | | | | 1,266,262,613 | | | | (1,933,540,389 | ) | | | (82,915 | ) | | | — | | | | — | | | | 381,908 | | | | — | |
| | | | | | | | |
Liquidity Fund | | | — | | | | 2,435,642,928 | | | | (2,278,871,120 | ) | | | — | | | | — | | | | 156,771,808 | | | | 2,247,819 | | | | 156,771,808 | |
| | | | | | | | |
Total | | | | | | | | | | | | | | $ | (82,915 | ) | | $ | (1,388,424 | ) | | $ | 165,456,972 | | | $ | 2,629,727 | | | | | |
| * | The related industry is the same as the presentation in the Portfolio of Investments. |
| (1) | For fair value measurement disclosure purposes, security is categorized as Level 3 (see Note 8). |
| (2) | Non-income producing security. |
| (3) | A portion of the shares were acquired in connection with a restructuring of a Senior Loan and may be subject to restrictions on resale. |
8 Fair Value Measurements
Under generally accepted accounting principles for fair value measurements, a three-tier hierarchy to prioritize the assumptions, referred to as inputs, is used in valuation techniques to measure fair value. The three-tier hierarchy of inputs is summarized in the three broad levels listed below.
| • | | Level 1 – quoted prices in active markets for identical investments |
| • | | Level 2 – other significant observable inputs (including quoted prices for similar investments, interest rates, prepayment speeds, credit risk, etc.) |
| • | | Level 3 – significant unobservable inputs (including a fund’s own assumptions in determining the fair value of investments) |
In cases where the inputs used to measure fair value fall in different levels of the fair value hierarchy, the level disclosed is determined based on the lowest level input that is significant to the fair value measurement in its entirety. The inputs or methodology used for valuing securities are not necessarily an indication of the risk associated with investing in those securities.
Eaton Vance
Floating Rate Portfolio
October 31, 2022
Notes to Financial Statements — continued
At October 31, 2022, the hierarchy of inputs used in valuing the Portfolio’s investments and open derivative instruments, which are carried at value, were as follows:
| | | | | | | | | | | | | | | | |
| Asset Description | | Level 1 | | | Level 2 | | | Level 3* | | | Total | |
| | | | |
Asset-Backed Securities | | $ | — | | | $ | 269,370,575 | | | $ | — | | | $ | 269,370,575 | |
| | | | |
Common Stocks | | | 12,311,345 | | | | 27,416,418 | | | | 14,240,583 | | | | 53,968,346 | |
| | | | |
Convertible Preferred Stocks | | | — | | | | 4,538,607 | | | | — | | | | 4,538,607 | |
| | | | |
Corporate Bonds | | | — | | | | 567,110,839 | | | | — | | | | 567,110,839 | |
| | | | |
Exchange-Traded Funds | | | 17,610,840 | | | | — | | | | — | | | | 17,610,840 | |
| | | | |
Preferred Stocks | | | — | | | | 10,740,795 | | | | 0 | | | | 10,740,795 | |
| | | | |
Senior Floating-Rate Loans (Less Unfunded Loan Commitments) | | | — | | | | 6,807,728,858 | | | | 5,635,958 | | | | 6,813,364,816 | |
| | | | |
Warrants | | | — | | | | 0 | | | | 0 | | | | 0 | |
| | | | |
Short-Term Investments | | | 156,771,808 | | | | — | | | | — | | | | 156,771,808 | |
| | | | |
Total Investments | | $ | 186,693,993 | | | $ | 7,686,906,092 | | | $ | 19,876,541 | | | $ | 7,893,476,626 | |
| | | | |
Forward Foreign Currency Exchange Contracts | | $ | — | | | $ | 3,336,318 | | | $ | — | | | $ | 3,336,318 | |
| | | | |
Total | | $ | 186,693,993 | | | $ | 7,690,242,410 | | | $ | 19,876,541 | | | $ | 7,896,812,944 | |
| | | | |
Liability Description | | | | | | | | | | | | | | | | |
| | | | |
Forward Foreign Currency Exchange Contracts | | $ | — | | | $ | (6,351,123 | ) | | $ | — | | | $ | (6,351,123 | ) |
| | | | |
Total | | $ | — | | | $ | (6,351,123 | ) | | $ | — | | | $ | (6,351,123 | ) |
| * | None of the unobservable inputs for Level 3 assets, individually or collectively, had a material impact on the Portfolio. |
Level 3 investments at the beginning and/or end of the period in relation to net assets were not significant and accordingly, a reconciliation of Level 3 assets for the year ended October 31, 2022 is not presented.
9 Risks and Uncertainties
Risks Associated with Foreign Investments
Foreign investments can be adversely affected by political, economic and market developments abroad, including the imposition of economic and other sanctions by the United States or another country. There may be less publicly available information about foreign issuers because they may not be subject to reporting practices, requirements or regulations comparable to those to which United States companies are subject. Foreign markets may be smaller, less liquid and more volatile than the major markets in the United States. Trading in foreign markets typically involves higher expense than trading in the United States. The Portfolio may have difficulties enforcing its legal or contractual rights in a foreign country. Securities that trade or are denominated in currencies other than the U.S. dollar may be adversely affected by fluctuations in currency exchange rates.
Credit Risk
The Portfolio invests primarily in below investment grade floating-rate loans, which are considered speculative because of the credit risk of their issuers. Changes in economic conditions or other circumstances are more likely to reduce the capacity of issuers of these securities to make principal and interest payments. Such companies are more likely to default on their payments of interest and principal owed than issuers of investment grade bonds. An economic downturn generally leads to a higher non-payment rate, and a loan or other debt obligation may lose significant value before a default occurs. Lower rated investments also may be subject to greater price volatility than higher rated investments. Moreover, the specific collateral used to secure a loan may decline in value or become illiquid, which would adversely affect the loan’s value.
LIBOR Transition Risk
Certain instruments held by the Portfolio may pay an interest rate based on the London Interbank Offered Rate (“LIBOR”), which is the average offered rate for various maturities of short-term loans between certain major international banks. LIBOR is used throughout global banking and financial industries to determine interest rates for a variety of financial instruments (such as debt instruments and derivatives) and borrowing arrangements. The ICE Benchmark Administration Limited, the administrator of LIBOR, ceased publishing certain LIBOR settings on December 31, 2021, and is expected to cease publishing the remaining LIBOR settings on June 30, 2023. Although the transition process away from LIBOR has become increasingly well-defined, the impact on certain debt securities, derivatives and other financial instruments that utilize LIBOR remains uncertain. The phase-out of LIBOR may result in, among other things, increased volatility or illiquidity in markets for instruments based on LIBOR and changes in the value of such instruments.
Eaton Vance
Floating Rate Portfolio
October 31, 2022
Notes to Financial Statements — continued
Pandemic Risk
An outbreak of respiratory disease caused by a novel coronavirus was first detected in China in late 2019 and subsequently spread internationally. This coronavirus has resulted in closing borders, enhanced health screenings, changes to healthcare service preparation and delivery, quarantines, cancellations, disruptions to supply chains and customer activity, as well as general concern and uncertainty. Health crises caused by outbreaks of disease, such as the coronavirus outbreak, may exacerbate other pre-existing political, social and economic risks and disrupt normal market conditions and operations. The impact of this outbreak has negatively affected the worldwide economy, as well as the economies of individual countries and industries, and could continue to affect the market in significant and unforeseen ways. Other epidemics and pandemics that may arise in the future may have similar effects. Any such impact could adversely affect the Portfolio’s performance, or the performance of the securities in which the Portfolio invests.
Eaton Vance
Floating Rate Portfolio
October 31, 2022
Report of Independent Registered Public Accounting Firm
To the Trustees and Investors of Eaton Vance Floating Rate Portfolio:
Opinion on the Financial Statements and Financial Highlights
We have audited the accompanying statement of assets and liabilities of Eaton Vance Floating Rate Portfolio (the “Portfolio”), including the portfolio of investments, as of October 31, 2022, the related statement of operations for the year then ended, the statements of changes in net assets for each of the two years in the period then ended, the financial highlights for each of the five years in the period then ended, and the related notes. In our opinion, the financial statements and financial highlights present fairly, in all material respects, the financial position of the Portfolio as of October 31, 2022, and the results of its operations for the year then ended, the changes in its net assets for each of the two years in the period then ended, and the financial highlights for each of the five years in the period then ended, in conformity with accounting principles generally accepted in the United States of America.
Basis for Opinion
These financial statements and financial highlights are the responsibility of the Portfolio’s management. Our responsibility is to express an opinion on the Portfolio’s financial statements and financial highlights based on our audits. We are a public accounting firm registered with the Public Company Accounting Oversight Board (United States) (PCAOB) and are required to be independent with respect to the Portfolio in accordance with the U.S. federal securities laws and the applicable rules and regulations of the Securities and Exchange Commission and the PCAOB.
We conducted our audits in accordance with the standards of the PCAOB. Those standards require that we plan and perform the audit to obtain reasonable assurance about whether the financial statements and financial highlights are free of material misstatement, whether due to error or fraud. The Portfolio is not required to have, nor were we engaged to perform, an audit of its internal control over financial reporting. As part of our audits, we are required to obtain an understanding of internal control over financial reporting but not for the purpose of expressing an opinion on the effectiveness of the Portfolio’s internal control over financial reporting. Accordingly, we express no such opinion.
Our audits included performing procedures to assess the risks of material misstatement of the financial statements and financial highlights, whether due to error or fraud, and performing procedures that respond to those risks. Such procedures included examining, on a test basis, evidence regarding the amounts and disclosures in the financial statements and financial highlights. Our audits also included evaluating the accounting principles used and significant estimates made by management, as well as evaluating the overall presentation of the financial statements and financial highlights. Our procedures included confirmation of securities and senior loans owned as of October 31, 2022, by correspondence with the custodian, brokers and selling or agent banks; when replies were not received from brokers and selling or agent banks, we performed other auditing procedures. We believe that our audits provide a reasonable basis for our opinion.
/s/ Deloitte & Touche LLP
Boston, Massachusetts
December 20, 2022
We have served as the auditor of one or more Eaton Vance investment companies since 1959.
Eaton Vance
Floating-Rate Fund
October 31, 2022
Board of Trustees’ Contract Approval
Overview of the Contract Review Process – Eaton Vance Funds
The Investment Company Act of 1940, as amended (the “1940 Act”), provides, in substance, that the investment advisory agreement between a fund and its investment adviser will continue in effect from year-to-year only if its continuation is approved on an annual basis by a vote of the fund’s board of trustees, including a majority of the trustees who are not “interested persons” of the fund (“independent trustees”), cast in person at a meeting called for the purpose of considering such approval.
At a meeting held on June 8, 2022, the Boards of Trustees/Directors (collectively, the “Board”) that oversee the registered investment companies advised by Eaton Vance Management or its affiliate, Boston Management and Research (the “Eaton Vance Funds”), including a majority of the independent trustees (the “Independent Trustees”), voted to approve the continuation of existing investment advisory agreements and sub-advisory agreements1 for each of the Eaton Vance Funds for an additional one-year period. The Board relied upon the affirmative recommendation of its Contract Review Committee, which is a committee exclusively comprised of Independent Trustees. Prior to making its recommendation, the Contract Review Committee reviewed information furnished by the adviser and sub-adviser to each of the Eaton Vance Funds (including information specifically requested by the Board) for a series of formal meetings held between April and June 2022. Members of the Contract Review Committee also considered information received at prior meetings of the Board and its committees, to the extent such information was relevant to the Contract Review Committee’s annual evaluation of the investment advisory agreements and sub-advisory agreements.
In connection with its evaluation of the investment advisory agreements and sub-advisory agreements, the Board considered various information relating to the Eaton Vance Funds. This included information applicable to all or groups of Eaton Vance Funds, which is referenced immediately below, and information applicable to the particular Eaton Vance Fund covered by this report (additional fund-specific information is referenced below under “Results of the Contract Review Process”). (For funds that invest through one or more underlying portfolios, references to “each fund” in this section may include information that was considered at the portfolio-level.)
Information about Fees, Performance and Expenses
| | • | | A report from an independent data provider comparing advisory and other fees paid by each fund to such fees paid by comparable funds, as identified by the independent data provider (“comparable funds”); |
| | • | | A report from an independent data provider comparing each fund’s total expense ratio (and its components) to those of comparable funds; |
| | • | | A report from an independent data provider comparing the investment performance of each fund (including, as relevant, total return data, income data, Sharpe ratios and information ratios) to the investment performance of comparable funds and, as applicable, benchmark indices, over various time periods; |
| | • | | In certain instances, data regarding investment performance relative to customized groups of peer funds and blended indices identified by the adviser in consultation with the Portfolio Management Committee of the Board (a committee exclusively comprised of Independent Trustees); |
| | • | | Comparative information concerning the fees charged and services provided by the adviser and sub-adviser to each fund in managing other accounts (which may include other mutual funds, collective investment funds and institutional accounts) using investment strategies and techniques similar to those used in managing such fund(s), if any; |
| | • | | Profitability analyses with respect to the adviser and sub-adviser to each of the funds; |
Information about Portfolio Management and Trading
| | • | | Descriptions of the investment management services provided to each fund, as well as each of the funds’ investment strategies and policies; |
| | • | | The procedures and processes used to determine the value of fund assets, including, when necessary, the determination of “fair value” and actions taken to monitor and test the effectiveness of such procedures and processes; |
| | • | | Information about the policies and practices of each fund’s adviser and sub-adviser with respect to trading, including their processes for seeking best execution of portfolio transactions; |
| | • | | Information about the allocation of brokerage transactions and the benefits, if any, received by the adviser and sub-adviser to each fund as a result of brokerage allocation, including, as applicable, information concerning the acquisition of research through client commission arrangements and policies with respect to “soft dollars”; |
| | • | | Data relating to the portfolio turnover rate of each fund and related information regarding active management in the context of particular strategies; |
Information about each Adviser and Sub-adviser
| | • | | Reports detailing the financial results and condition of the adviser and sub-adviser to each fund; |
| 1 | Not all Eaton Vance Funds have entered into a sub-advisory agreement with a sub-adviser. Accordingly, references to “sub-adviser” or “sub-advisory agreement” in this “Overview” section may not be applicable to the particular Eaton Vance Fund covered by this report. Following the “Overview” section, further information regarding the Board’s evaluation of a fund’s contractual arrangements is included under the “Results of the Contract Review Process” section. |
Eaton Vance
Floating-Rate Fund
October 31, 2022
Board of Trustees’ Contract Approval — continued
| | • | | Information regarding the individual investment professionals whose responsibilities include portfolio management and investment research for the funds, and, for portfolio managers and certain other investment professionals, information relating to their responsibilities with respect to managing other mutual funds and investment accounts, as applicable; |
| | • | | Information regarding the adviser’s and its parent company’s (Morgan Stanley’s) efforts to retain and attract talented investment professionals, including in the context of a particularly competitive marketplace for talent, as well as the ongoing unique environment presented by hybrid, remote and other alternative work arrangements; |
| | • | | The Code of Ethics of the adviser and its affiliates and the sub-adviser of each fund, together with information relating to compliance with, and the administration of, such codes; |
| | • | | Policies and procedures relating to proxy voting, including regular reporting with respect to fund proxy voting activities; |
| | • | | Information regarding the handling of corporate actions and class actions, as well as information regarding litigation and other regulatory matters; |
| | • | | Information concerning the resources devoted to compliance efforts undertaken by the adviser and its affiliates and the sub-adviser of each fund, if any, including descriptions of their various compliance programs and their record of compliance; |
| | • | | Information concerning the business continuity and disaster recovery plans of the adviser and its affiliates and the sub-adviser of each fund, if any; |
| | • | | A description of Eaton Vance Management’s and Boston Management and Research’s oversight of sub-advisers, including with respect to regulatory and compliance issues, investment management and other matters; |
Other Relevant Information
| | • | | Information regarding ongoing initiatives to further integrate and harmonize, where applicable, the investment management and other departments of the adviser and its affiliates with the overall investment management infrastructure of Morgan Stanley, in light of Morgan Stanley’s acquisition of Eaton Vance on March 1, 2021; |
| | • | | Information concerning the nature, cost and character of the administrative and other non-investment advisory services provided by Eaton Vance Management and its affiliates; |
| | • | | Information concerning oversight of the relationship with the custodian, subcustodians, fund accountants, and other third-party service providers by the adviser and/or administrator to each of the funds; |
| | • | | Information concerning efforts to implement policies and procedures with respect to various new regulations applicable to the funds, including Rule 12d1-4 (the Fund-of-Funds Rule), Rule 18f-4 (the Derivatives Rule) and Rule 2a-5 (the Fair Valuation Rule); |
| | • | | For an Eaton Vance Fund structured as an exchange-listed closed-end fund, information concerning the benefits of the closed-end fund structure, as well as, where relevant, the closed-end fund’s market prices (including as compared to the closed-end fund’s net asset value (NAV)), trading volume data, continued use of auction preferred shares (where applicable), distribution rates and other relevant matters; |
| | • | | The risks which the adviser and/or its affiliates incur in connection with the management and operation of the funds, including, among others, litigation, regulatory, entrepreneurial, and other business risks (and the associated costs of such risks); and |
| | • | | The terms of each investment advisory agreement and sub-advisory agreement. |
During the various meetings of the Board and its committees over the course of the year leading up to the June 8, 2022 meeting, the Trustees received information from portfolio managers and other investment professionals of the advisers and sub-advisers of the funds regarding investment and performance matters, and considered various investment and trading strategies used in pursuing the funds’ investment objectives. The Trustees also received information regarding risk management techniques employed in connection with the management of the funds. The Board and its committees evaluated issues pertaining to industry and regulatory developments, compliance procedures, fund governance and other issues with respect to the funds, and received and participated in reports and presentations provided by Eaton Vance Management, Boston Management and Research and fund sub-advisers, with respect to such matters. In addition to the formal meetings of the Board and its committees, the Independent Trustees held regular teleconferences to discuss, among other topics, matters relating to the continuation of investment advisory agreements and sub-advisory agreements.
The Contract Review Committee was advised throughout the contract review process by Goodwin Procter LLP, independent legal counsel for the Independent Trustees. The members of the Contract Review Committee, with the advice of such counsel, exercised their own business judgment in determining the material factors to be considered in evaluating each investment advisory agreement and sub-advisory agreement and the weight to be given to each such factor. The conclusions reached with respect to each investment advisory agreement and sub-advisory agreement were based on a comprehensive evaluation of all the information provided and not any single factor. Moreover, each member of the Contract Review Committee may have placed varying emphasis on particular factors in reaching conclusions with respect to each investment advisory agreement and sub-advisory agreement. In evaluating each investment advisory agreement and sub-advisory agreement, including the fee structures and other terms contained in such agreements, the members of the Contract Review Committee were also informed by multiple years of analysis and discussion with the adviser and sub-adviser to each of the Eaton Vance Funds.
Results of the Contract Review Process
Based on its consideration of the foregoing, and such other information it deemed relevant, including the factors and conclusions described below, the Contract Review Committee concluded that the continuation of the investment advisory agreement between Eaton Vance Floating-Rate Fund (the “Fund”)
Eaton Vance
Floating-Rate Fund
October 31, 2022
Board of Trustees’ Contract Approval — continued
and Eaton Vance Management (“EVM”), as well as the investment advisory agreement between Eaton Vance Floating Rate Portfolio (the “Portfolio”), the portfolio in which the Fund invests, and Boston Management and Research (“BMR”) (EVM, with respect to the Fund, and BMR, with respect to the Portfolio, are each referred to herein as the “Adviser”), including their respective fee structures, are in the interests of shareholders and, therefore, recommended to the Board approval of each agreement. Based on the recommendation of the Contract Review Committee, the Board, including a majority of the Independent Trustees, voted to approve continuation of the investment advisory agreements for the Fund and the Portfolio (together, the “investment advisory agreements”).
Nature, Extent and Quality of Services
In considering whether to approve the investment advisory agreements for the Fund and the Portfolio, the Board evaluated the nature, extent and quality of services provided to the Fund and to the Portfolio by the applicable Adviser.
The Board considered each Adviser’s management capabilities and investment processes in light of the types of investments held by the Fund and the Portfolio, including the education, experience and number of investment professionals and other personnel who provide portfolio management, investment research, and similar services to the Portfolio, including recent changes to such personnel. In particular, the Board considered the abilities and experience of each Adviser’s investment professionals in analyzing special considerations relevant to investing in senior floating rate loans. The Board considered each Adviser’s large group of bank loan investment professionals and other personnel who provide services to the Fund and to the Portfolio, including portfolio managers and analysts. The Board also took into account the resources dedicated to portfolio management and other services, the compensation methods of each Adviser and other factors, including the reputation and resources of each Adviser to recruit and retain highly qualified research, advisory and supervisory investment professionals. In addition, the Board considered the time and attention devoted to the Eaton Vance Funds, including the Fund and the Portfolio, by senior management, as well as the infrastructure, operational capabilities and support staff in place to assist in the portfolio management and operations of the Fund and the Portfolio, including the provision of administrative services. The Board also considered the business-related and other risks to which each Adviser or its affiliates may be subject in managing the Fund and the Portfolio.
The Board noted that, under the terms of the investment advisory agreement of the Fund, EVM may invest assets of the Fund directly in securities, for which it would receive a fee, or in the Portfolio, for which it receives no separate fee but for which BMR receives an advisory fee from the Portfolio.
The Board considered the compliance programs of each Adviser and relevant affiliates thereof. The Board considered compliance and reporting matters regarding, among other things, personal trading by investment professionals, disclosure of portfolio holdings, late trading, frequent trading, portfolio valuation, business continuity and the allocation of investment opportunities. The Board also considered the responses of each Adviser and its affiliates to requests in recent years from regulatory authorities, such as the Securities and Exchange Commission and the Financial Industry Regulatory Authority.
The Board considered other administrative services provided or overseen by EVM and its affiliates, including transfer agency and accounting services. The Board evaluated the benefits to shareholders of investing in a fund that is a part of a large fund complex offering exposure to a variety of asset classes and investment disciplines, as well as the ability, in many cases, to exchange an investment among different funds without incurring additional sales charges.
After consideration of the foregoing factors, among others, the Board concluded that the nature, extent and quality of services provided by each Adviser, taken as a whole, are appropriate and consistent with the terms of the applicable investment advisory agreement.
Fund Performance
The Board compared the Fund’s investment performance to that of comparable funds identified by an independent data provider (the peer group), as well as an appropriate benchmark index and a custom peer group of similarly managed funds. The Board’s review included comparative performance data with respect to the Fund for the one-, three-, five- and ten-year periods ended December 31, 2021. In this regard, the Board noted that the performance of the Fund was higher than the median performance of the Fund’s peer group and custom peer group for the three-year period. The Board also noted that the performance of the Fund was lower than its benchmark index for the three-year period. The Board concluded that the performance of the Fund was satisfactory.
Management Fees and Expenses
The Board considered contractual fee rates payable by the Portfolio and by the Fund for advisory and administrative services (referred to collectively as “management fees”). As part of its review, the Board considered the Fund’s management fees and total expense ratio for the one-year period ended December 31, 2021, as compared to those of comparable funds, before and after giving effect to any undertaking to waive fees or reimburse expenses. The Board also considered certain factors identified by management in response to inquiries from the Contract Review Committee regarding the Fund’s total expense ratio relative to comparable funds.
After considering the foregoing information, and in light of the nature, extent and quality of the services provided by each Adviser, the Board concluded that the management fees charged for advisory and related services are reasonable.
Eaton Vance
Floating-Rate Fund
October 31, 2022
Board of Trustees’ Contract Approval — continued
Profitability and “Fall-Out” Benefits
The Board considered the level of profits realized by each Adviser and relevant affiliates thereof in providing investment advisory and administrative services to the Fund, to the Portfolio and to all Eaton Vance Funds as a group. The Board considered the level of profits realized without regard to marketing support or other payments by each Adviser and its affiliates to third parties in respect of distribution or other services.
The Board concluded that, in light of the foregoing factors and the nature, extent and quality of the services rendered, the profits realized by each Adviser and its affiliates are deemed not to be excessive.
The Board also considered direct or indirect fall-out benefits received by each Adviser and its affiliates in connection with their respective relationships with the Fund and the Portfolio, including the benefits of research services that may be available to each Adviser as a result of securities transactions effected for the Fund and the Portfolio and other investment advisory clients.
Economies of Scale
In reviewing management fees and profitability, the Board also considered the extent to which the applicable Adviser and its affiliates, on the one hand, and the Fund and the Portfolio, on the other hand, can expect to realize benefits from economies of scale as the assets of the Fund and the Portfolio increase. The Board acknowledged the difficulty in accurately measuring the benefits resulting from economies of scale, if any, with respect to the management of any specific fund or group of funds. The Board reviewed data summarizing the increases and decreases in the assets of the Fund and of all Eaton Vance Funds as a group over various time periods, and evaluated the extent to which the total expense ratio of the Fund and the profitability of each Adviser and its affiliates may have been affected by such increases or decreases. Based upon the foregoing, the Board concluded that the Fund currently shares in the benefits from economies of scale, if any, when they are realized by each Adviser. The Board also concluded that the structure of the advisory fees, which include breakpoints at several asset levels, will allow the Fund and the Portfolio to continue to benefit from any economies of scale in the future.
Eaton Vance
Floating-Rate Fund
October 31, 2022
Liquidity Risk Management Program
The Fund has implemented a written liquidity risk management program (Program) and related procedures to manage its liquidity in accordance with Rule 22e-4 under the Investment Company Act of 1940, as amended (Liquidity Rule). The Liquidity Rule defines “liquidity risk” as the risk that a fund could not meet requests to redeem shares issued by the fund without significant dilution of the remaining investors’ interests in the fund. The Fund’s Board of Trustees/Directors has designated the investment adviser to serve as the administrator of the Program and the related procedures. The administrator has established a Liquidity Risk Management Oversight Committee (Committee) to perform the functions necessary to administer the Program. As part of the Program, the administrator is responsible for identifying illiquid investments and categorizing the relative liquidity of the Fund’s investments in accordance with the Liquidity Rule. Under the Program, the administrator assesses, manages, and periodically reviews the Fund’s liquidity risk, and is responsible for making certain reports to the Fund’s Board of Trustees/Directors and the Securities and Exchange Commission (SEC) regarding the liquidity of the Fund’s investments, and to notify the Board of Trustees/Directors and the SEC of certain liquidity events specified in the Liquidity Rule. The liquidity of the Fund’s portfolio investments is determined based on a number of factors including, but not limited to, relevant market, trading and investment-specific considerations under the Program.
At a meeting of the Fund’s Board of Trustees/Directors on June 7, 2022, the Committee provided a written report to the Fund’s Board of Trustees/Directors pertaining to the operation, adequacy, and effectiveness of implementation of the Program, as well as the operation of the highly liquid investment minimum (if applicable) for the period January 1, 2021 through December 31, 2021 (Review Period). The Program operated effectively during the Review Period, supporting the administrator’s ability to assess, manage and monitor Fund liquidity risk, including during periods of market volatility and net redemptions. During the Review Period, the Fund met redemption requests on a timely basis.
There can be no assurance that the Program will achieve its objectives in the future. Please refer to the Fund’s prospectus for more information regarding the Fund’s exposure to liquidity risk and other principal risks to which an investment in the Fund may be subject.
Eaton Vance
Floating-Rate Fund
October 31, 2022
Management and Organization
Fund Management. The Trustees of Eaton Vance Mutual Funds Trust (the Trust) and Eaton Vance Floating Rate Portfolio (the Portfolio) are responsible for the overall management and supervision of the Trust’s and the Portfolio’s affairs. The Board members and officers of the Trust and the Portfolio are listed below. Except as indicated, each individual has held the office shown or other offices in the same company for the last five years. Board members hold indefinite terms of office. Each Trustee holds office until his or her successor is elected and qualified, subject to a prior death, resignation, retirement, disqualification or removal. Under the terms of the Fund’s and the Portfolio’s current Trustee retirement policy, an Independent Trustee must retire and resign as a Trustee on the earlier of: (i) the first day of July following his or her 74th birthday; or (ii), with limited exception, December 31st of the 20th year in which he or she has served as a Trustee. However, if such retirement and resignation would cause the Fund and the Portfolio to be out of compliance with Section 16 of the 1940 Act or any other regulations or guidance of the SEC, then such retirement and resignation will not become effective until such time as action has been taken for the Fund and the Portfolio to be in compliance therewith. The “noninterested Trustees” consist of those Trustees who are not “interested persons” of the Trust and the Portfolio, as that term is defined under the 1940 Act. The business address of each Board member and officer is Two International Place, Boston, Massachusetts 02110. As used below, “BMR” refers to Boston Management and Research, “EVC” refers to Eaton Vance Corp., “EV” refers to EV LLC, “EVM” refers to Eaton Vance Management and “EVD” refers to Eaton Vance Distributors, Inc. EV is the trustee of each of EVM and BMR. Effective March 1, 2021, each of EVM, BMR, EVD and EV are indirect, wholly owned subsidiaries of Morgan Stanley. Each officer affiliated with EVM may hold a position with other EVM affiliates that is comparable to his or her position with EVM listed below. Each Trustee oversees 135 funds (with the exception of Mr. Bowser who oversees 110 funds) in the Eaton Vance fund complex (including both funds and portfolios in a hub and spoke structure).
| | | | | | |
| Name and Year of Birth | | Trust/Portfolio
Position(s) | | Length of Service | | Principal Occupation(s) and Other Directorships During Past Five Years and Other Relevant Experience |
| | | |
| Interested Trustee | | | | | | |
| | | |
Thomas E. Faust Jr. 1958 | | Trustee | | Since 2007 | | Chairman of Morgan Stanley Investment Management, Inc. (MSIM), member of the Board of Managers and President of EV (since 2021), Chief Executive Officer of EVM and BMR. Formerly, Chairman, Chief Executive Officer (2007-2021) and President (2006-2021) of EVC and Director of EVD (2007-2022). Mr. Faust is an interested person because of his positions with MSIM, BMR, EVM and EV, which are affiliates of the Trust and the Portfolio. Other Directorships. Formerly, Director of EVC (2007-2021) and Hexavest Inc. (investment management firm) (2012-2021). |
| | | |
| Noninterested Trustees | | | | | | |
| | | |
Alan C. Bowser(1) 1962 | | Trustee | | Since 2022 | | Chief Diversity Officer, Partner and a member of the Operating Committee, and formerly served as Senior Advisor on Diversity and Inclusion for the firm’s chief executive officer, Co-Head of the Americas Region, and Senior Client Advisor of Bridgewater Associates, an asset management firm (2011- present). Other Directorships. None. |
| | | |
Mark R. Fetting 1954 | | Trustee | | Since 2016 | | Private investor. Formerly held various positions at Legg Mason, Inc. (investment management firm) (2000-2012), including President, Chief Executive Officer, Director and Chairman (2008-2012), Senior Executive Vice President (2004-2008) and Executive Vice President (2001-2004). Formerly, President of Legg Mason family of funds (2001-2008). Formerly, Division President and Senior Officer of Prudential Financial Group, Inc. and related companies (investment management firm) (1991-2000). Other Directorships. None. |
| | | |
Cynthia E. Frost 1961 | | Trustee | | Since 2014 | | Private investor. Formerly, Chief Investment Officer of Brown University (university endowment) (2000-2012). Formerly, Portfolio Strategist for Duke Management Company (university endowment manager) (1995-2000). Formerly, Managing Director, Cambridge Associates (investment consulting company) (1989-1995). Formerly, Consultant, Bain and Company (management consulting firm) (1987-1989). Formerly, Senior Equity Analyst, BA Investment Management Company (1983-1985). Other Directorships. None. |
| | | |
George J. Gorman 1952 | | Chairperson
of the Board
and Trustee | | Since 2021 (Chairperson) and 2014 (Trustee) | | Principal at George J. Gorman LLC (consulting firm). Formerly, Senior Partner at Ernst & Young LLP (a registered public accounting firm) (1974-2009). Other Directorships. None. |
Eaton Vance
Floating-Rate Fund
October 31, 2022
Management and Organization — continued
| | | | | | |
| Name and Year of Birth | | Trust/Portfolio
Position(s) | | Length of Service | | Principal Occupation(s) and Other Directorships During Past Five Years and Other Relevant Experience |
| | |
| Noninterested Trustees (continued) | | | | |
| | | |
Valerie A. Mosley 1960 | | Trustee | | Since 2014 | | Chairwoman and Chief Executive Officer of Valmo Ventures (a consulting and investment firm). Founder of Upward Wealth, Inc., dba BrightUp, a fintech platform. Formerly, Partner and Senior Vice President, Portfolio Manager and Investment Strategist at Wellington Management Company, LLP (investment management firm) (1992-2012). Formerly, Chief Investment Officer, PG Corbin Asset Management (1990-1992). Formerly worked in institutional corporate bond sales at Kidder Peabody (1986-1990). Other Directorships. Director of DraftKings, Inc. (digital sports entertainment and gaming company) (since September 2020). Director of Envestnet, Inc. (provider of intelligent systems for wealth management and financial wellness) (since 2018). Formerly, Director of Dynex Capital, Inc. (mortgage REIT) (2013-2020) and Director of Groupon, Inc. (e-commerce provider) (2020-2022). |
| | | |
Keith Quinton 1958 | | Trustee | | Since 2018 | | Private investor, researcher and lecturer. Formerly, Independent Investment Committee Member at New Hampshire Retirement System (2017-2021). Formerly, Portfolio Manager and Senior Quantitative Analyst at Fidelity Investments (investment management firm) (2001-2014). Other Directorships. Formerly, Director (2016-2021) and Chairman (2019-2021) of New Hampshire Municipal Bond Bank. |
| | | |
Marcus L. Smith 1966 | | Trustee | | Since 2018 | | Private investor and independent corporate director. Formerly, Chief Investment Officer, Canada (2012-2017), Chief Investment Officer, Asia (2010-2012), Director of Asian Research (2004-2010) and portfolio manager (2001-2017) at MFS Investment Management (investment management firm). Other Directorships. Director of First Industrial Realty Trust, Inc. (an industrial REIT) (since 2021). Director of MSCI Inc. (global provider of investment decision support tools) (since 2017). Formerly, Director of DCT Industrial Trust Inc. (logistics real estate company) (2017-2018). |
| | | |
Susan J. Sutherland 1957 | | Trustee | | Since 2015 | | Private investor. Director of Ascot Group Limited and certain of its subsidiaries (insurance and reinsurance) (since 2017). Formerly, Director of Hagerty Holding Corp. (insurance) (2015-2018) and Montpelier Re Holdings Ltd. (insurance and reinsurance) (2013-2015). Formerly, Associate, Counsel and Partner at Skadden, Arps, Slate, Meagher & Flom LLP (law firm) (1982-2013). Other Directorships. Director of Kairos Acquisition Corp. (insurance/InsurTech acquisition company) (since 2021). |
| | | |
Scott E. Wennerholm 1959 | | Trustee | | Since 2016 | | Private investor. Formerly, Trustee at Wheelock College (postsecondary institution) (2012-2018). Formerly, Consultant at GF Parish Group (executive recruiting firm) (2016-2017). Formerly, Chief Operating Officer and Executive Vice President at BNY Mellon Asset Management (investment management firm) (2005-2011). Formerly, Chief Operating Officer and Chief Financial Officer at Natixis Global Asset Management (investment management firm) (1997-2004). Formerly, Vice President at Fidelity Investments Institutional Services (investment management firm) (1994-1997). Other Directorships. None. |
| | | |
Nancy A. Wiser(1) 1967 | | Trustee | | Since 2022 | | Formerly, Executive Vice President and the Global Head of Operations at Wells Fargo Asset Management (2011-2021). Other Directorships. None. |
| | | | | | |
| Name and Year of Birth | | Trust/Portfolio
Position(s) | | Length of Service | | Principal Occupation(s) During Past Five Years |
| | |
| Principal Officers who are not Trustees | | | | |
| | | |
Eric A. Stein 1980 | | President | | Since 2020 | | Vice President and Chief Investment Officer, Fixed Income of EVM and BMR. Prior to November 1, 2020, Mr. Stein was a co-Director of Eaton Vance’s Global Income Investments. Also Vice President of Calvert Research and Management (“CRM”). |
| | | |
Deidre E. Walsh 1971 | | Vice President and Chief Legal Officer | | Since 2009 | | Vice President of EVM and BMR. Also Vice President of CRM. |
| | | |
James F. Kirchner 1967 | | Treasurer | | Since 2007 | | Vice President of EVM and BMR. Also Vice President of CRM. |
Eaton Vance
Floating-Rate Fund
October 31, 2022
Management and Organization — continued
| | | | | | |
| Name and Year of Birth | | Trust/Portfolio
Position(s) | | Length of Service | | Principal Occupation(s) During Past Five Years |
| |
| Principal Officers who are not Trustees (continued) | | |
| | | |
Nicholas Di Lorenzo 1987 | | Secretary | | Since 2022 | | Formerly, associate (2012-2021) and counsel (2022) at Dechert LLP. |
| | | |
Richard F. Froio 1968 | | Chief Compliance Officer | | Since 2017 | | Vice President of EVM and BMR since 2017. Formerly, Deputy Chief Compliance Officer (Adviser/Funds) and Chief Compliance Officer (Distribution) at PIMCO (2012-2017) and Managing Director at BlackRock/Barclays Global Investors (2009-2012). |
| (1) | Mr. Bowser and Ms. Wiser began serving as Trustees effective April 4, 2022. |
The SAI for the Fund includes additional information about the Trustees and officers of the Fund and the Portfolio and can be obtained without charge on Eaton Vance’s website at www.eatonvance.com or by calling 1-800-262-1122.
Eaton Vance Funds
| | |
| Privacy Notice | | April 2021 |
| | |
| |
| FACTS | | WHAT DOES EATON VANCE DO WITH YOUR
PERSONAL INFORMATION? |
| | | |
| |
| | |
| Why? | | Financial companies choose how they share your personal information. Federal law gives consumers the right to limit some but not all sharing. Federal law also requires us to tell you how we collect, share, and protect your personal information. Please read this notice carefully to understand what we do. |
| | |
| | | |
| What? | | The types of personal information we collect and share depend on the product or service you have with us. This information can include: ∎ Social Security number and income ∎ investment experience and risk tolerance ∎ checking account number and wire transfer instructions |
| | |
| | | |
| How? | | All financial companies need to share customers’ personal information to run their everyday business. In the section below, we list the reasons financial companies can share their customers’ personal information; the reasons Eaton Vance chooses to share; and whether you can limit this sharing. |
| | |
| | | |
| | | | |
Reasons we can share your
personal information | | Does Eaton Vance share? | | Can you limit this sharing? |
| For our everyday business purposes — such as to process your transactions, maintain your account(s), respond to court orders and legal investigations, or report to credit bureaus | | Yes | | No |
| For our marketing purposes — to offer our products and services to you | | Yes | | No |
| For joint marketing with other financial companies | | No | | We don’t share |
| For our investment management affiliates’ everyday business purposes — information about your transactions, experiences, and creditworthiness | | Yes | | Yes |
| For our affiliates’ everyday business purposes — information about your transactions and experiences | | Yes | | No |
| For our affiliates’ everyday business purposes — information about your creditworthiness | | No | | We don’t share |
| For our investment management affiliates to market to you | | Yes | | Yes |
| For our affiliates to market to you | | No | | We don’t share |
| For nonaffiliates to market to you | | No | | We don’t share |
| | |
| To limit our sharing | | Call toll-free 1-800-262-1122 or email: EVPrivacy@eatonvance.com Please note: If you are a new customer, we can begin sharing your information 30 days from the date we sent this notice. When you are no longer our customer, we continue to share your information as described in this notice. However, you can contact us at any time to limit our sharing. |
| | |
| Questions? | | Call toll-free 1-800-262-1122 or email: EVPrivacy@eatonvance.com |
Eaton Vance Funds
| | |
| Privacy Notice — continued | | April 2021 |
| | |
| Who we are |
| Who is providing this notice? | | Eaton Vance Management, Eaton Vance Distributors, Inc., Eaton Vance Trust Company, Eaton Vance Management (International) Limited, Eaton Vance Advisers International Ltd., Eaton Vance Global Advisors Limited, Eaton Vance Management’s Real Estate Investment Group, Boston Management and Research, Calvert Research and Management, Eaton Vance and Calvert Fund Families and our investment advisory affiliates (“Eaton Vance”) (see Investment Management Affiliates definition below) |
| What we do |
| How does Eaton Vance protect my personal information? | | To protect your personal information from unauthorized access and use, we use security measures that comply with federal law. These measures include computer safeguards and secured files and buildings. We have policies governing the proper handling of customer information by personnel and requiring third parties that provide support to adhere to appropriate security standards with respect to such information. |
| How does Eaton Vance collect my personal information? | | We collect your personal information, for example, when you ∎ open an account or make deposits or withdrawals from your account ∎ buy securities from us or make a wire transfer ∎ give us your contact information We also collect your personal information from others, such as credit bureaus, affiliates, or other companies. |
| Why can’t I limit all sharing? | | Federal law gives you the right to limit only ∎ sharing for affiliates’ everyday business purposes — information about your creditworthiness ∎ affiliates from using your information to market to you ∎ sharing for nonaffiliates to market to you State laws and individual companies may give you additional rights to limit sharing. See below for more on your rights under state law. |
| Definitions |
| Investment Management Affiliates | | Eaton Vance Investment Management Affiliates include registered investment advisers, registered broker- dealers, and registered and unregistered funds. Investment Management Affiliates does not include entities associated with Morgan Stanley Wealth Management, such as Morgan Stanley Smith Barney LLC and Morgan Stanley & Co. |
| Affiliates | | Companies related by common ownership or control. They can be financial and nonfinancial companies. ∎ Our affiliates include companies with a Morgan Stanley name and financial companies such as Morgan Stanley Smith Barney LLC and Morgan Stanley & Co. |
| Nonaffiliates | | Companies not related by common ownership or control. They can be financial and nonfinancial companies. ∎ Eaton Vance does not share with nonaffiliates so they can market to you. |
| Joint marketing | | A formal agreement between nonaffiliated financial companies that together market financial products or services to you. ∎ Eaton Vance doesn’t jointly market. |
| Other important information |
Vermont: Except as permitted by law, we will not share personal information we collect about Vermont residents with Nonaffiliates unless you provide us with your written consent to share such information. California: Except as permitted by law, we will not share personal information we collect about California residents with Nonaffiliates and we will limit sharing such personal information with our Affiliates to comply with California privacy laws that apply to us. |
Eaton Vance Funds
IMPORTANT NOTICES
Delivery of Shareholder Documents. The Securities and Exchange Commission (SEC) permits funds to deliver only one copy of shareholder documents, including prospectuses, proxy statements and shareholder reports, to fund investors with multiple accounts at the same residential or post office box address. This practice is often called “householding” and it helps eliminate duplicate mailings to shareholders. Eaton Vance, or your financial intermediary, may household the mailing of your documents indefinitely unless you instruct Eaton Vance, or your financial intermediary, otherwise. If you would prefer that your Eaton Vance documents not be householded, please contact Eaton Vance at 1-800-262-1122, or contact your financial intermediary. Your instructions that householding not apply to delivery of your Eaton Vance documents will typically be effective within 30 days of receipt by Eaton Vance or your financial intermediary.
Portfolio Holdings. Each Eaton Vance Fund and its underlying Portfolio(s) (if applicable) files a schedule of portfolio holdings on Part F to Form N-PORT with the SEC. Certain information filed on Form N-PORT may be viewed on the Eaton Vance website at www.eatonvance.com, by calling Eaton Vance at 1-800-262-1122 or in the EDGAR database on the SEC’s website at www.sec.gov.
Proxy Voting. From time to time, funds are required to vote proxies related to the securities held by the funds. The Eaton Vance Funds or their underlying Portfolios (if applicable) vote proxies according to a set of policies and procedures approved by the Funds’ and Portfolios’ Boards. You may obtain a description of these policies and procedures and information on how the Funds or Portfolios voted proxies relating to portfolio securities during the most recent 12-month period ended June 30, without charge, upon request, by calling 1-800-262-1122 and by accessing the SEC’s website at www.sec.gov.
Investment Adviser of Eaton Vance Floating Rate Portfolio
Boston Management and Research
Two International Place
Boston, MA 02110
Investment Adviser and Administrator of Eaton Vance
Eaton Vance Floating-Rate Fund
Eaton Vance Management
Two International Place
Boston, MA 02110
Principal Underwriter*
Eaton Vance Distributors, Inc.
Two International Place
Boston, MA 02110
(617) 482-8260
Custodian
State Street Bank and Trust Company
State Street Financial Center, One Lincoln Street
Boston, MA 02111
Transfer Agent
BNY Mellon Investment Servicing (US) Inc.
Attn: Eaton Vance Funds
P.O. Box 9653
Providence, RI 02940-9653
(800) 262-1122
Independent Registered Public Accounting Firm
Deloitte & Touche LLP
200 Berkeley Street
Boston, MA 02116-5022
Fund Offices
Two International Place
Boston, MA 02110
| * | FINRA BrokerCheck. Investors may check the background of their Investment Professional by contacting the Financial Industry Regulatory Authority (FINRA). FINRA BrokerCheck is a free tool to help investors check the professional background of current and former FINRA-registered securities firms and brokers. FINRA BrokerCheck is available by calling 1-800-289-9999 and at www.FINRA.org. The FINRA BrokerCheck brochure describing this program is available to investors at www.FINRA.org. |
1044 10.31.22

Eaton Vance
Floating-Rate & High Income Fund
Annual Report
October 31, 2022

Commodity Futures Trading Commission Registration. The Commodity Futures Trading Commission (“CFTC”) has adopted regulations that subject registered investment companies and advisers to regulation by the CFTC if a fund invests more than a prescribed level of its assets in certain CFTC-regulated instruments (including futures, certain options and swap agreements) or markets itself as providing investment exposure to such instruments. The investment adviser has claimed an exclusion from the definition of “commodity pool operator” under the Commodity Exchange Act with respect to its management of the Fund. Accordingly, neither the Fund nor the adviser with respect to the operation of the Fund is subject to CFTC regulation. Because of its management of other strategies, the Fund’s adviser is registered with the CFTC as a commodity pool operator. The adviser is also registered as a commodity trading advisor.
Fund shares are not insured by the FDIC and are not deposits or other obligations of, or guaranteed by, any depository institution. Shares are subject to investment risks, including possible loss of principal invested.
This report must be preceded or accompanied by a current summary prospectus or prospectus. Before investing, investors should consider carefully the investment objective, risks, and charges and expenses of a mutual fund. This and other important information is contained in the summary prospectus and prospectus, which can be obtained from a financial intermediary. Prospective investors should read the prospectus carefully before investing. For further information, please call 1-800-262-1122.
Annual Report October 31, 2022
Eaton Vance
Floating-Rate & High Income Fund
Eaton Vance
Floating-Rate & High Income Fund
October 31, 2022
Management’s Discussion of Fund Performance†
Economic and Market Conditions
Amid increasing global concerns about inflation and rising interest rates, compounded by the economic fallout from Russia’s invasion of Ukraine, senior loans displayed their value as a portfolio diversifier by outperforming most U.S. fixed-income asset classes during the 12-month period ended October 31, 2022.
Although returns for the Morningstar® LSTA® US Leveraged Loan IndexSM (the Index), a broad measure of the asset class, were negative at –1.78% during the period, senior loans generally outperformed corporate bonds, corporate high yield bonds, municipal bonds, and U.S. government bonds — and even outperformed the broad equity market S&P 500® Index.
In the opening month of the period, November 2021, a new COVID-19 variant caused equity and fixed-income prices to plummet worldwide. In contrast, senior loans rallied during the next two months. The ongoing rollout of vaccines, the reopening of U.S. businesses, and comparatively low yields in other fixed-income asset classes all provided tailwinds for the senior loan asset class.
In February 2022, however, the economic impact of Russia’s invasion of Ukraine became a tipping point for loan performance. While the U.S. Federal Reserve’s projection of multiple rate increases in 2022 was generally viewed as a positive sign for floating-rate loans, investors began to worry about the negative effects of supply-chain disruptions, higher commodity and labor expenses, rising debt service costs on loan issuers, and the potential for recession in both the U.S. and global economies.
Manifesting investor concerns, higher quality loans began to outperform lower quality loans. Loan prices, which had risen earlier in the period, declined each month from February through June 2022. After a brief summer rally amid hope that inflationary and recessionary fears were subsiding, loan prices resumed their downward slide in September before recovering modestly in October. While mutual fund inflows for floating-rate loans continued through April, flows turned negative in May and remained negative the rest of the period — although demand for collateralized loan obligations from institutional investors stayed positive throughout the period. By period-end, loan prices had fallen to $92.20 from $98.55 at the start of the period.
Issuer fundamentals, however, remained a bright spot for senior loans during the period. While the trailing 12-month default rate inched higher — from 0.20% at the beginning of the period to 0.83% at period-end — it remained well below the market’s long-term average of 3.20%.
For the period as a whole, higher quality loans outperformed lower quality issues, with BBB-, BB-, B-, CCC- and D-rated (defaulted) loans within the Index returning 1.98%, 1.36%, –2.42%, –10.66%, and –37.83%, respectively.
Fund Performance
For the 12-month period ended October 31, 2022, Eaton Vance Floating-Rate & High Income Fund (the Fund) returned –4.60% for Class A shares at net asset value (NAV), underperforming its benchmark, the Morningstar® LSTA® US Leveraged Loan IndexSM (the Index), which returned –1.78%.
The Index is unmanaged, and returns do not reflect any applicable sales charges, commissions, or expenses.
The Fund’s out-of-Index allocation to secured high yield bonds was the principal detractor from performance versus the Index, as floating-rate loans outperformed their fixed-rate counterparts in the bond market during the period.
The Fund’s underweight position in BBB-rated loans — the highest credit-rating category within the Index and best-performing category during the period — hurt performance relative to the Index as well.
In contrast, contributors to Fund performance versus the Index included the Fund’s cash position during a period of negative loan performance, and an underweight position in CCC-rated loans, which underperformed the Index during the period.
See Endnotes and Additional Disclosures in this report.
Past performance is no guarantee of future results. Returns are historical and are calculated by determining the percentage change in net asset value (NAV) or offering price (as applicable) with all distributions reinvested. Furthermore, returns do not reflect the deduction of taxes that shareholders may have to pay on Fund distributions or upon the redemption of Fund shares. Investment return and principal value will fluctuate so that shares, when redeemed, may be worth more or less than their original cost. Performance for periods less than or equal to one year is cumulative. Performance is for the stated time period only; due to market volatility, current Fund performance may be lower or higher than the quoted return. For performance as of the most recent month-end, please refer to eatonvance.com.
Eaton Vance
Floating-Rate & High Income Fund
October 31, 2022
Performance
Portfolio Manager(s) Kelley Gerrity, Stephen C. Concannon, CFA, Andrew N. Sveen, CFA, Jeffrey D. Mueller, Ralph Hinckley, CFA and Jake Lemle, CFA
| | | | | | | | | | | | | | | | | | | | |
| % Average Annual Total Returns1,2 | | Class
Inception Date | | | Performance
Inception Date | | | One Year | | | Five Years | | | Ten Years | |
| | | | | |
Advisers Class at NAV | | | 09/07/2000 | | | | 09/07/2000 | | | | (4.56 | )% | | | 1.96 | % | | | 2.97 | % |
Class A at NAV | | | 05/07/2003 | | | | 09/07/2000 | | | | (4.60 | ) | | | 1.95 | | | | 2.97 | |
Class A with 3.25% Maximum Sales Charge | | | — | | | | — | | | | (7.68 | ) | | | 1.27 | | | | 2.63 | |
Class C at NAV | | | 09/05/2000 | | | | 09/05/2000 | | | | (5.40 | ) | | | 1.17 | | | | 2.36 | |
Class C with 1% Maximum Deferred Sales Charge | | | — | | | | — | | | | (6.32 | ) | | | 1.17 | | | | 2.36 | |
Class I at NAV | | | 09/15/2000 | | | | 09/15/2000 | | | | (4.43 | ) | | | 2.19 | | | | 3.22 | |
Class R6 at NAV | | | 06/27/2016 | | | | 09/15/2000 | | | | (4.38 | ) | | | 2.24 | | | | 3.25 | |
|
| |
| | | | | |
Morningstar® LSTA® US Leveraged Loan IndexSM | | | — | | | | — | | | | (1.78 | )% | | | 3.07 | % | | | 3.61 | % |
| | | | | |
| % Total Annual Operating Expense Ratios3 | | Advisers Class | | | Class A | | | Class C | | | Class I | | | Class R6 | |
| | | | | |
| | | 1.04% | | | | 1.04% | | | | 1.79 | % | | | 0.78 | % | | | 0.74 | % |
Growth of $10,000
This graph shows the change in value of a hypothetical investment of $10,000 in Class A of the Fund for the period indicated. For comparison, the same investment is shown in the indicated index.
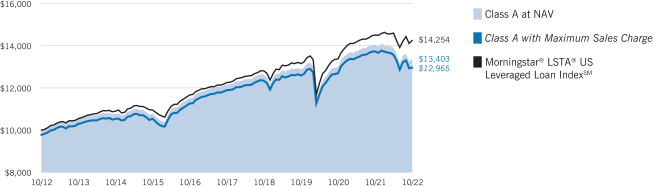
| | | | | | | | | | | | | | | | |
| Growth of Investment2 | | Amount Invested | | | Period Beginning | | | At NAV | | | With Maximum Sales Charge | |
| | | | |
Advisers Class | | | $10,000 | | | | 10/31/2012 | | | | $13,403 | | | | N.A. | |
Class C | | | $10,000 | | | | 10/31/2012 | | | | $12,626 | | | | N.A. | |
| | | | |
Class I, at minimum investment | | | $1,000,000 | | | | 10/31/2012 | | | | $1,372,597 | | | | N.A. | |
Class R6, at minimum investment | | | $5,000,000 | | | | 10/31/2012 | | | | $6,887,142 | | | | N.A. | |
See Endnotes and Additional Disclosures in this report.
Past performance is no guarantee of future results. Returns are historical and are calculated by determining the percentage change in net asset value (NAV) or offering price (as applicable) with all distributions reinvested. Furthermore, returns do not reflect the deduction of taxes that shareholders may have to pay on Fund distributions or upon the redemption of Fund shares. Investment return and principal value will fluctuate so that shares, when redeemed, may be worth more or less than their original cost. Performance for periods less than or equal to one year is cumulative. Performance is for the stated time period only; due to market volatility, current Fund performance may be lower or higher than the quoted return. For performance as of the most recent month-end, please refer to eatonvance.com.
Eaton Vance
Floating-Rate & High Income Fund
October 31, 2022
Fund Profile
Asset Allocation (% of net assets)1,2
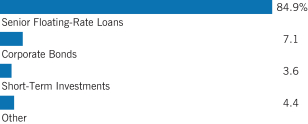
Credit Quality (% of bonds, loans and ABS and CMBS)3
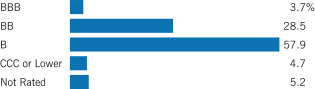
Footnotes:
Fund invests in one or more affiliated investment companies (Portfolios). Unless otherwise noted, references to investments are to the aggregate holdings of the Fund, including its pro rata share of each Portfolio or Fund in which it invests.
| 1 | Net of unfunded loan commitments. |
| 2 | Other represents other assets less liabilities and includes any investment type that represents less than 1% of net assets. |
| 3 | For Eaton Vance Floating Rate Portfolio’s investments, credit ratings are categorized using S&P Global Ratings (“S&P”). For High Income Opportunities Portfolio’s investments, ratings are based on Moody’s Investors Service, Inc. (“Moody’s”), S&P Global Ratings (“S&P”) or Fitch Ratings (“Fitch”), as applicable and for purposes of ratings restrictions, the average of Moody’s, S&P and Fitch is used. Ratings, which are subject to change, apply to the creditworthiness of the issuers of the underlying securities and not to the Fund or its shares. Credit ratings measure the quality of a bond based on the issuer’s creditworthiness, with ratings ranging from AAA, being the highest, to D, being the lowest based on S&P’s measures. Ratings of BBB or higher by S&P or Fitch (Baa or higher by Moody’s) are considered to be investment-grade quality. Credit ratings are based largely on the ratings agency’s analysis at the time of rating. The rating assigned to any particular security is not necessarily a reflection of the issuer’s current financial condition and does not necessarily reflect its assessment of the volatility of a security’s market value or of the liquidity of an investment in the security. Holdings designated as “Not Rated” (if any) are not rated by the national ratings agencies stated above. |
ABS – Asset-Backed Securities
CMBS – Commercial Mortgage-Backed Securities
Eaton Vance
Floating-Rate & High Income Fund
October 31, 2022
Endnotes and Additional Disclosures
| † | The views expressed in this report are those of the portfolio manager(s) and are current only through the date stated at the top of this page. These views are subject to change at any time based upon market or other conditions, and Eaton Vance and the Fund(s) disclaim any responsibility to update such views. These views may not be relied upon as investment advice and, because investment decisions are based on many factors, may not be relied upon as an indication of trading intent on behalf of any Eaton Vance fund. This commentary may contain statements that are not historical facts, referred to as “forward-looking statements.” The Fund’s actual future results may differ significantly from those stated in any forward-looking statement, depending on factors such as changes in securities or financial markets or general economic conditions, the volume of sales and purchases of Fund shares, the continuation of investment advisory, administrative and service contracts, and other risks discussed from time to time in the Fund’s filings with the Securities and Exchange Commission. |
| 1 | Morningstar® LSTA® US Leveraged Loan IndexSM is an unmanaged index of the institutional leveraged loan market. Morningstar® LSTA® Leveraged Loan indices are a product of Morningstar, Inc. (“Morningstar”) and have been licensed for use. Morningstar® is a registered trademark of Morningstar licensed for certain use. Loan Syndications and Trading Association® and LSTA® are trademarks of the LSTA licensed for certain use by Morningstar, and further sublicensed by Morningstar for certain use. Neither Morningstar nor LSTA guarantees the accuracy and/or completeness of the Morningstar® LSTA® US Leveraged Loan IndexSM or any data included therein, and shall have no liability for any errors, omissions, or interruptions therein. Unless otherwise stated, index returns do not reflect the effect of any applicable sales charges, commissions, expenses, taxes or leverage, as applicable. It is not possible to invest directly in an index. Prior to August 29, 2022, the index name was S&P/LSTA Leveraged Loan Index. |
| 2 | Total Returns at NAV do not include applicable sales charges. If sales charges were deducted, the returns would be lower. Total Returns shown with maximum sales charge reflect the stated maximum sales charge. Unless otherwise stated, performance does not reflect the deduction of taxes on Fund distributions or redemptions of Fund shares. |
Performance prior to the inception date of a class may be linked to the performance of an older class of the Fund. This linked performance is adjusted for any applicable sales charge, but is not adjusted for class expense differences. If adjusted for such differences, the performance would be different. The performance of Class R6 is linked to Class I. Performance presented in the Financial Highlights included in the financial statements is not linked.
Effective November 5, 2020, Class C shares automatically convert to Class A shares eight years after purchase. The average annual total returns listed for Class C reflect conversion to Class A shares after eight years. Prior to November 5, 2020, Class C shares automatically converted to Class A shares ten years after purchase.
| 3 | Source: Fund prospectus. The expense ratios for the current reporting period can be found in the Financial Highlights section of this report. Performance reflects expenses waived and/or reimbursed, if applicable. Without such waivers and/or reimbursements, performance would have been lower. |
Fund profile subject to change due to active management.
Additional Information
S&P 500® Index is an unmanaged index of large-cap stocks commonly used as a measure of U.S. stock market performance. S&P Dow Jones Indices are a product of S&P Dow Jones Indices LLC (“S&P DJI”) and have been licensed for use. S&P® and S&P 500® are registered trademarks of S&P DJI; Dow Jones® is a registered trademark of Dow Jones Trademark Holdings LLC (“Dow Jones”); S&P DJI, Dow Jones and their respective affiliates do not sponsor, endorse, sell or promote the Fund, will not have any liability with respect thereto and do not have any liability for any errors, omissions, or interruptions of the S&P Dow Jones Indices.
Eaton Vance
Floating-Rate & High Income Fund
October 31, 2022
Fund Expenses
Example
As a Fund shareholder, you incur two types of costs: (1) transaction costs, including sales charges (loads) on purchases and redemption fees (if applicable); and (2) ongoing costs, including management fees; distribution and/or service fees; and other Fund expenses. This Example is intended to help you understand your ongoing costs (in dollars) of Fund investing and to compare these costs with the ongoing costs of investing in other mutual funds. The Example is based on an investment of $1,000 invested at the beginning of the period and held for the entire period (May 1, 2022 to October 31, 2022).
Actual Expenses
The first section of the table below provides information about actual account values and actual expenses. You may use the information in this section, together with the amount you invested, to estimate the expenses that you paid over the period. Simply divide your account value by $1,000 (for example, an $8,600 account value divided by $1,000 = 8.6), then multiply the result by the number in the first section under the heading entitled “Expenses Paid During Period” to estimate the expenses you paid on your account during this period.
Hypothetical Example for Comparison Purposes
The second section of the table below provides information about hypothetical account values and hypothetical expenses based on the actual Fund expense ratio and an assumed rate of return of 5% per year (before expenses), which is not the actual Fund return. The hypothetical account values and expenses may not be used to estimate the actual ending account balance or expenses you paid for the period. You may use this information to compare the ongoing costs of investing in your Fund and other funds. To do so, compare this 5% hypothetical example with the 5% hypothetical examples that appear in the shareholder reports of the other funds.
Please note that the expenses shown in the table are meant to highlight your ongoing costs only and do not reflect any transactional costs, such as sales charges (loads) or redemption fees (if applicable). Therefore, the second section of the table is useful in comparing ongoing costs only, and will not help you determine the relative total costs of owning different funds. In addition, if these transactional costs were included, your costs would be higher.
| | | | | | | | | | | | | | | | |
| | | Beginning
Account Value
(5/1/22) | | | Ending
Account Value
(10/31/22) | | | Expenses Paid
During Period*
(5/1/22 –10/31/22) | | | Annualized
Expense
Ratio | |
| | | | |
Actual | | | | | | | | | | | | | | | | |
Advisers Class | | $ | 1,000.00 | | | $ | 965.70 | | | $ | 5.10 | | | | 1.03 | % |
Class A | | $ | 1,000.00 | | | $ | 965.80 | | | $ | 5.15 | | | | 1.04 | % |
Class C | | $ | 1,000.00 | | | $ | 961.90 | | | $ | 8.85 | | | | 1.79 | % |
Class I | | $ | 1,000.00 | | | $ | 965.80 | | | $ | 3.86 | | | | 0.78 | % |
Class R6 | | $ | 1,000.00 | | | $ | 966.10 | | | $ | 3.57 | | | | 0.72 | % |
| | | | | |
Hypothetical | | | | | | | | | | | | | | | | |
(5% return per year before expenses) | | | | | | | | | | | | | | | | |
Advisers Class | | $ | 1,000.00 | | | $ | 1,020.01 | | | $ | 5.24 | | | | 1.03 | % |
Class A | | $ | 1,000.00 | | | $ | 1,019.96 | | | $ | 5.30 | | | | 1.04 | % |
Class C | | $ | 1,000.00 | | | $ | 1,016.18 | | | $ | 9.10 | | | | 1.79 | % |
Class I | | $ | 1,000.00 | | | $ | 1,021.27 | | | $ | 3.97 | | | | 0.78 | % |
Class R6 | | $ | 1,000.00 | | | $ | 1,021.58 | | | $ | 3.67 | | | | 0.72 | % |
| * | Expenses are equal to the Fund’s annualized expense ratio for the indicated Class, multiplied by the average account value over the period, multiplied by 184/365 (to reflect the one-half year period). The Example assumes that the $1,000 was invested at the net asset value per share determined at the close of business on April 30, 2022. The Example reflects the expenses of both the Fund and the Portfolios. |
Eaton Vance
Floating-Rate & High Income Fund
October 31, 2022
Statement of Assets and Liabilities
| | | | |
| Assets | | October 31, 2022 | |
| |
Investment in Eaton Vance Floating Rate Portfolio, at value
(identified cost $1,432,146,731) | | $ | 1,268,178,194 | |
| |
Investment in High Income Opportunities Portfolio, at value
(identified cost, $287,680,513) | | | 244,292,812 | |
| |
Receivable for Fund shares sold | | | 6,290,621 | |
| |
Total assets | | $ | 1,518,761,627 | |
|
| Liabilities | |
| |
Payable for Fund shares redeemed | | $ | 10,617,213 | |
| |
Distributions payable | | | 390,937 | |
| |
Payable to affiliates: | | | | |
| |
Administration fee | | | 195,552 | |
| |
Distribution and service fees | | | 64,450 | |
| |
Trustees’ fees | | | 42 | |
| |
Accrued expenses | | | 305,210 | |
| |
Total liabilities | | $ | 11,573,404 | |
| |
Net Assets | | $ | 1,507,188,223 | |
|
| Sources of Net Assets | |
| |
Paid-in capital | | $ | 1,812,755,194 | |
| |
Accumulated loss | | | (305,566,971 | ) |
| |
Net Assets | | $ | 1,507,188,223 | |
|
| Advisers Class Shares | |
| |
Net Assets | | $ | 43,533,019 | |
| |
Shares Outstanding | | | 5,448,215 | |
| |
Net Asset Value, Offering Price and Redemption Price Per Share | | | | |
| |
(net assets ÷ shares of beneficial interest outstanding) | | $ | 7.99 | |
|
| Class A Shares | |
| |
Net Assets | | $ | 172,306,779 | |
| |
Shares Outstanding | | | 20,271,758 | |
| |
Net Asset Value and Redemption Price Per Share | | | | |
| |
(net assets ÷ shares of beneficial interest outstanding) | | $ | 8.50 | |
| |
Maximum Offering Price Per Share | | | | |
| |
(100 ÷ 96.75 of net asset value per share) | | $ | 8.79 | |
|
| Class C Shares | |
| |
Net Assets | | $ | 21,725,844 | |
| |
Shares Outstanding | | | 2,724,062 | |
| |
Net Asset Value and Offering Price Per Share* | | | | |
| |
(net assets ÷ shares of beneficial interest outstanding) | | $ | 7.98 | |
|
| Class I Shares | |
| |
Net Assets | | $ | 1,227,498,769 | |
| |
Shares Outstanding | | | 153,525,671 | |
| |
Net Asset Value, Offering Price and Redemption Price Per Share | | | | |
| |
(net assets ÷ shares of beneficial interest outstanding) | | $ | 8.00 | |
| | | | |
| | 7 | | See Notes to Financial Statements. |
Eaton Vance
Floating-Rate & High Income Fund
October 31, 2022
Statement of Assets and Liabilities — continued
| | | | |
| Class R6 Shares | | October 31, 2022 | |
| |
Net Assets | | $ | 42,123,812 | |
| |
Shares Outstanding | | | 5,268,290 | |
| |
Net Asset Value, Offering Price and Redemption Price Per Share | | | | |
| |
(net assets ÷ shares of beneficial interest outstanding) | | $ | 8.00 | |
On sales of $100,000 or more, the offering price of Class A shares is reduced.
| * | Redemption price per share is equal to the net asset value less any applicable contingent deferred sales charge. |
| | | | |
| | 8 | | See Notes to Financial Statements. |
Eaton Vance
Floating-Rate & High Income Fund
October 31, 2022
Statement of Operations
| | | | |
| Investment Income | | Year Ended October 31, 2022 | |
| |
Dividend income allocated from Portfolios (net of foreign taxes withheld of $2,302) | | $ | 1,204,991 | |
| |
Interest and other income allocated from Portfolios | | | 84,688,009 | |
| |
Expenses allocated from Portfolios | | | (9,053,638 | ) |
| |
Total investment income from Portfolios | | $ | 76,839,362 | |
| |
| Expenses | | | | |
| |
Administration fee | | $ | 2,556,524 | |
| |
Distribution and service fees: | | | | |
| |
Advisers Class | | | 116,523 | |
| |
Class A | | | 456,177 | |
| |
Class C | | | 244,985 | |
| |
Trustees’ fees and expenses | | | 500 | |
| |
Custodian fee | | | 61,990 | |
| |
Transfer and dividend disbursing agent fees | | | 992,741 | |
| |
Legal and accounting services | | | 70,549 | |
| |
Printing and postage | | | 120,303 | |
| |
Registration fees | | | 166,725 | |
| |
Miscellaneous | | | 24,395 | |
| |
Total expenses | | $ | 4,811,412 | |
| |
Net investment income | | $ | 72,027,950 | |
|
| Realized and Unrealized Gain (Loss) from Portfolios | |
| |
Net realized gain (loss): | | | | |
| |
Investment transactions | | $ | (20,854,255 | ) |
| |
Swap contracts | | | (35,574 | ) |
| |
Foreign currency transactions | | | 1,031,503 | |
| |
Forward foreign currency exchange contracts | | | 26,975,757 | |
| |
Net realized gain | | $ | 7,117,431 | |
| |
Change in unrealized appreciation (depreciation): | | | | |
| |
Investments | | $ | (161,340,645 | ) |
| |
Swap contracts | | | (755 | ) |
| |
Foreign currency | | | (351,915 | ) |
| |
Forward foreign currency exchange contracts | | | (1,859,264 | ) |
| |
Net change in unrealized appreciation (depreciation) | | $ | (163,552,579 | ) |
| |
Net realized and unrealized loss | | $ | (156,435,148 | ) |
| |
Net decrease in net assets from operations | | $ | (84,407,198 | ) |
| | | | |
| | 9 | | See Notes to Financial Statements. |
Eaton Vance
Floating-Rate & High Income Fund
October 31, 2022
Statements of Changes in Net Assets
| | | | | | | | |
| | | Year Ended October 31, | |
| Increase (Decrease) in Net Assets | | 2022 | | | 2021 | |
| | |
From operations: | | | | | | | | |
| | |
Net investment income | | $ | 72,027,950 | | | $ | 39,661,736 | |
| | |
Net realized gain | | | 7,117,431 | | | | 6,563,533 | |
| | |
Net change in unrealized appreciation (depreciation) | | | (163,552,579 | ) | | | 35,486,407 | |
| | |
Net increase (decrease) in net assets from operations | | $ | (84,407,198 | ) | | $ | 81,711,676 | |
| | |
Distributions to shareholders: | | | | | | | | |
| | |
Advisers Class | | $ | (1,879,317 | ) | | $ | (1,508,067 | ) |
| | |
Class A | | | (7,357,901 | ) | | | (5,914,908 | ) |
| | |
Class C | | | (798,333 | ) | | | (739,232 | ) |
| | |
Class I | | | (60,562,506 | ) | | | (30,164,249 | ) |
| | |
Class R6 | | | (1,910,333 | ) | | | (1,913,807 | ) |
| | |
Total distributions to shareholders | | $ | (72,508,390 | ) | | $ | (40,240,263 | ) |
| | |
Transactions in shares of beneficial interest: | | | | | | | | |
| | |
Advisers Class | | $ | (309,593 | ) | | $ | 3,173,164 | |
| | |
Class A | | | 921,645 | | | | (1,855,758 | ) |
| | |
Class C | | | (1,881,811 | ) | | | (13,439,278 | ) |
| | |
Class I | | | 171,096,234 | | | | 613,426,178 | |
| | |
Class R6 | | | 8,512,004 | | | | (42,876,743 | ) |
| | |
Net increase in net assets from Fund share transactions | | $ | 178,338,479 | | | $ | 558,427,563 | |
| | |
Net increase in net assets | | $ | 21,422,891 | | | $ | 599,898,976 | |
|
| Net Assets | |
| | |
At beginning of year | | $ | 1,485,765,332 | | | $ | 885,866,356 | |
| | |
At end of year | | $ | 1,507,188,223 | | | $ | 1,485,765,332 | |
| | | | |
| | 10 | | See Notes to Financial Statements. |
Eaton Vance
Floating-Rate & High Income Fund
October 31, 2022
Financial Highlights
| | | | | | | | | | | | | | | | | | | | |
| | | Advisers Class | |
| |
| | | Year Ended October 31, | |
| | | 2022 | | | 2021 | | | 2020 | | | 2019 | | | 2018 | |
| | | | | |
Net asset value — Beginning of year | | $ | 8.720 | | | $ | 8.330 | | | $ | 8.620 | | | $ | 8.850 | | | $ | 8.880 | |
| | | | | |
| Income (Loss) From Operations | | | | | | | | | | | | | | | | | | | | |
| | | | | |
Net investment income(1) | | $ | 0.336 | | | $ | 0.282 | | | $ | 0.324 | | | $ | 0.408 | | | $ | 0.364 | |
| | | | | |
Net realized and unrealized gain (loss) | | | (0.727 | ) | | | 0.395 | | | | (0.277 | ) | | | (0.228 | ) | | | (0.028 | ) |
| | | | | |
Total income (loss) from operations | | $ | (0.391 | ) | | $ | 0.677 | | | $ | 0.047 | | | $ | 0.180 | | | $ | 0.336 | |
| | | | | |
| Less Distributions | | | | | | | | | | | | | | | | | | | | |
| | | | | |
From net investment income | | $ | (0.339 | ) | | $ | (0.287 | ) | | $ | (0.337 | ) | | $ | (0.410 | ) | | $ | (0.366 | ) |
| | | | | |
Total distributions | | $ | (0.339 | ) | | $ | (0.287 | ) | | $ | (0.337 | ) | | $ | (0.410 | ) | | $ | (0.366 | ) |
| | | | | |
Net asset value — End of year | | $ | 7.990 | | | $ | 8.720 | | | $ | 8.330 | | | $ | 8.620 | | | $ | 8.850 | |
| | | | | |
Total Return(2) | | | (4.56 | )% | | | 8.20 | % | | | 0.75 | % | | | 1.98 | % | | | 3.85 | % |
| | | | | |
| Ratios/Supplemental Data | | | | | | | | | | | | | | | | | | | | |
| | | | | |
Net assets, end of year (000’s omitted) | | $ | 43,533 | | | $ | 47,953 | | | $ | 42,806 | | | $ | 84,179 | | | $ | 133,055 | |
| | | | | |
Ratios (as a percentage of average daily net assets):(3) | | | | | | | | | | | | | | | | | | | | |
| | | | | |
Expenses | | | 1.02 | %(4) | | | 1.04 | % | | | 1.08 | % | | | 1.04 | % | | | 1.01 | % |
| | | | | |
Net investment income | | | 4.01 | % | | | 3.25 | % | | | 3.89 | % | | | 4.68 | % | | | 4.10 | % |
| | | | | |
Portfolio Turnover of the Fund(5) | | | 24 | % | | | 9 | % | | | 8 | % | | | 5 | % | | | 12 | % |
| (1) | Computed using average shares outstanding. |
| (2) | Returns are historical and are calculated by determining the percentage change in net asset value with all distributions reinvested. |
| (3) | Includes the Fund’s share of the Portfolios’ allocated expenses. |
| (4) | Includes a reduction by the investment adviser of a portion of the Portfolios’ adviser fees due to the Portfolios’ investment in the Liquidity Fund (equal to less than 0.005% of average daily net assets for the year ended October 31, 2022). |
| (5) | Percentage is based on the Fund’s contributions to and withdrawals from the Portfolios and excludes the investment activity of the Portfolios. |
| | | | |
| | 11 | | See Notes to Financial Statements. |
Eaton Vance
Floating-Rate & High Income Fund
October 31, 2022
Financial Highlights — continued
| | | | | | | | | | | | | | | | | | | | |
| | | Class A | |
| |
| | | Year Ended October 31, | |
| | | 2022 | | | 2021 | | | 2020 | | | 2019 | | | 2018 | |
| | | | | |
Net asset value — Beginning of year | | $ | 9.280 | | | $ | 8.870 | | | $ | 9.160 | | | $ | 9.410 | | | $ | 9.450 | |
| | | | | |
| Income (Loss) From Operations | | | | | | | | | | | | | | | | | | | | |
| | | | | |
Net investment income(1) | | $ | 0.357 | | | $ | 0.300 | | | $ | 0.340 | | | $ | 0.434 | | | $ | 0.387 | |
| | | | | |
Net realized and unrealized gain (loss) | | | (0.777 | ) | | | 0.415 | | | | (0.272 | ) | | | (0.248 | ) | | | (0.037 | ) |
| | | | | |
Total income (loss) from operations | | $ | (0.420 | ) | | $ | 0.715 | | | $ | 0.068 | | | $ | 0.186 | | | $ | 0.350 | |
| | | | | |
| Less Distributions | | | | | | | | | | | | | | | | | | | | |
| | | | | |
From net investment income | | $ | (0.360 | ) | | $ | (0.305 | ) | | $ | (0.358 | ) | | $ | (0.436 | ) | | $ | (0.390 | ) |
| | | | | |
Total distributions | | $ | (0.360 | ) | | $ | (0.305 | ) | | $ | (0.358 | ) | | $ | (0.436 | ) | | $ | (0.390 | ) |
| | | | | |
Net asset value — End of year | | $ | 8.500 | | | $ | 9.280 | | | $ | 8.870 | | | $ | 9.160 | | | $ | 9.410 | |
| | | | | |
Total Return(2) | | | (4.60 | )% | | | 8.14 | % | | | 0.83 | % | | | 2.04 | % | | | 3.77 | % |
| | | | | |
| Ratios/Supplemental Data | | | | | | | | | | | | | | | | | | | | |
| | | | | |
Net assets, end of year (000’s omitted) | | $ | 172,307 | | | $ | 187,279 | | | $ | 181,561 | | | $ | 195,385 | | | $ | 186,987 | |
| | | | | |
Ratios (as a percentage of average daily net assets):(3) | | | | | | | | | | | | | | | | | | | | |
| | | | | |
Expenses | | | 1.02 | %(4) | | | 1.04 | % | | | 1.08 | % | | | 1.04 | % | | | 1.01 | % |
| | | | | |
Net investment income | | | 4.01 | % | | | 3.25 | % | | | 3.84 | % | | | 4.69 | % | | | 4.10 | % |
| | | | | |
Portfolio Turnover of the Fund(5) | | | 24 | % | | | 9 | % | | | 8 | % | | | 5 | % | | | 12 | % |
| (1) | Computed using average shares outstanding. |
| (2) | Returns are historical and are calculated by determining the percentage change in net asset value with all distributions reinvested and do not reflect the effect of sales charges. |
| (3) | Includes the Fund’s share of the Portfolios’ allocated expenses. |
| (4) | Includes a reduction by the investment adviser of a portion of the Portfolios’ adviser fees due to the Portfolios’ investment in the Liquidity Fund (equal to less than 0.005% of average daily net assets for the year ended October 31, 2022). |
| (5) | Percentage is based on the Fund’s contributions to and withdrawals from the Portfolios and excludes the investment activity of the Portfolios. |
| | | | |
| | 12 | | See Notes to Financial Statements. |
Eaton Vance
Floating-Rate & High Income Fund
October 31, 2022
Financial Highlights — continued
| | | | | | | | | | | | | | | | | | | | |
| | | Class C | |
| |
| | | Year Ended October 31, | |
| | | 2022 | | | 2021 | | | 2020 | | | 2019 | | | 2018 | |
| | | | | |
Net asset value — Beginning of year | | $ | 8.710 | | | $ | 8.320 | | | $ | 8.600 | | | $ | 8.830 | | | $ | 8.860 | |
| | | | | |
| Income (Loss) From Operations | | | | | | | | | | | | | | | | | | | | |
| | | | | |
Net investment income(1) | | $ | 0.271 | | | $ | 0.218 | | | $ | 0.259 | | | $ | 0.341 | | | $ | 0.296 | |
| | | | | |
Net realized and unrealized gain (loss) | | | (0.726 | ) | | | 0.394 | | | | (0.264 | ) | | | (0.227 | ) | | | (0.027 | ) |
| | | | | |
Total income (loss) from operations | | $ | (0.455 | ) | | $ | 0.612 | | | $ | (0.005 | ) | | $ | 0.114 | | | $ | 0.269 | |
| | | | | |
| Less Distributions | | | | | | | | | | | | | | | | | | | | |
| | | | | |
From net investment income | | $ | (0.275 | ) | | $ | (0.222 | ) | | $ | (0.275 | ) | | $ | (0.344 | ) | | $ | (0.299 | ) |
| | | | | |
Total distributions | | $ | (0.275 | ) | | $ | (0.222 | ) | | $ | (0.275 | ) | | $ | (0.344 | ) | | $ | (0.299 | ) |
| | | | | |
Net asset value — End of year | | $ | 7.980 | | | $ | 8.710 | | | $ | 8.320 | | | $ | 8.600 | | | $ | 8.830 | |
| | | | | |
Total Return(2) | | | (5.40 | )% | | | 7.40 | % | | | (0.00 | )%(3) | | | 1.33 | % | | | 2.96 | % |
| | | | | |
| Ratios/Supplemental Data | | | | | | | | | | | | | | | | | | | | |
| | | | | |
Net assets, end of year (000’s omitted) | | $ | 21,726 | | | $ | 25,764 | | | $ | 37,683 | | | $ | 59,716 | | | $ | 121,021 | |
| | | | | |
Ratios (as a percentage of average daily net assets):(4) | | | | | | | | | | | | | | | | | | | | |
| | | | | |
Expenses | | | 1.77 | %(5) | | | 1.79 | % | | | 1.83 | % | | | 1.79 | % | | | 1.76 | % |
| | | | | |
Net investment income | | | 3.23 | % | | | 2.52 | % | | | 3.12 | % | | | 3.93 | % | | | 3.35 | % |
| | | | | |
Portfolio Turnover of the Fund(6) | | | 24 | % | | | 9 | % | | | 8 | % | | | 5 | % | | | 12 | % |
| (1) | Computed using average shares outstanding. |
| (2) | Returns are historical and are calculated by determining the percentage change in net asset value with all distributions reinvested and do not reflect the effect of sales charges. |
| (3) | Amount is less than (0.005)%. |
| (4) | Includes the Fund’s share of the Portfolios’ allocated expenses. |
| (5) | Includes a reduction by the investment adviser of a portion of the Portfolios’ adviser fees due to the Portfolios’ investment in the Liquidity Fund (equal to less than 0.005% of average daily net assets for the year ended October 31, 2022). |
| (6) | Percentage is based on the Fund’s contributions to and withdrawals from the Portfolios and excludes the investment activity of the Portfolios. |
| | | | |
| | 13 | | See Notes to Financial Statements. |
Eaton Vance
Floating-Rate & High Income Fund
October 31, 2022
Financial Highlights — continued
| | | | | | | | | | | | | | | | | | | | |
| | | Class I | |
| |
| | | Year Ended October 31, | |
| | | 2022 | | | 2021 | | | 2020 | | | 2019 | | | 2018 | |
| | | | | |
Net asset value — Beginning of year | | $ | 8.730 | | | $ | 8.340 | | | $ | 8.620 | | | $ | 8.850 | | | $ | 8.890 | |
| | | | | |
| Income (Loss) From Operations | | | | | | | | | | | | | | | | | | | | |
| | | | | |
Net investment income(1) | | $ | 0.358 | | | $ | 0.301 | | | $ | 0.344 | | | $ | 0.430 | | | $ | 0.386 | |
| | | | | |
Net realized and unrealized gain (loss) | | | (0.728 | ) | | | 0.398 | | | | (0.265 | ) | | | (0.228 | ) | | | (0.037 | ) |
| | | | | |
Total income (loss) from operations | | $ | (0.370 | ) | | $ | 0.699 | | | $ | 0.079 | | | $ | 0.202 | | | $ | 0.349 | |
| | | | | |
| Less Distributions | | | | | | | | | | | | | | | | | | | | |
| | | | | |
From net investment income | | $ | (0.360 | ) | | $ | (0.309 | ) | | $ | (0.359 | ) | | $ | (0.432 | ) | | $ | (0.389 | ) |
| | | | | |
Total distributions | | $ | (0.360 | ) | | $ | (0.309 | ) | | $ | (0.359 | ) | | $ | (0.432 | ) | | $ | (0.389 | ) |
| | | | | |
Net asset value — End of year | | $ | 8.000 | | | $ | 8.730 | | | $ | 8.340 | | | $ | 8.620 | | | $ | 8.850 | |
| | | | | |
Total Return(2) | | | (4.43 | )% | | | 8.47 | % | | | 1.01 | % | | | 2.35 | % | | | 4.00 | % |
| | | | | |
| Ratios/Supplemental Data | | | | | | | | | | | | | | | | | | | | |
| | | | | |
Net assets, end of year (000’s omitted) | | $ | 1,227,499 | | | $ | 1,187,123 | | | $ | 546,479 | | | $ | 808,175 | | | $ | 1,369,866 | |
| | | | | |
Ratios (as a percentage of average daily net assets):(3) | | | | | | | | | | | | | | | | | | | | |
| | | | | |
Expenses | | | 0.77 | %(4) | | | 0.78 | % | | | 0.83 | % | | | 0.79 | % | | | 0.76 | % |
| | | | | |
Net investment income | | | 4.27 | % | | | 3.47 | % | | | 4.12 | % | | | 4.94 | % | | | 4.35 | % |
| | | | | |
Portfolio Turnover of the Fund(5) | | | 24 | % | | | 9 | % | | | 8 | % | | | 5 | % | | | 12 | % |
| (1) | Computed using average shares outstanding. |
| (2) | Returns are historical and are calculated by determining the percentage change in net asset value with all distributions reinvested. |
| (3) | Includes the Fund’s share of the Portfolios’ allocated expenses. |
| (4) | Includes a reduction by the investment adviser of a portion of the Portfolios’ adviser fees due to the Portfolios’ investment in the Liquidity Fund (equal to less than 0.005% of average daily net assets for the year ended October 31, 2022). |
| (5) | Percentage is based on the Fund’s contributions to and withdrawals from the Portfolios and excludes the investment activity of the Portfolios. |
| | | | |
| | 14 | | See Notes to Financial Statements. |
Eaton Vance
Floating-Rate & High Income Fund
October 31, 2022
Financial Highlights — continued
| | | | | | | | | | | | | | | | | | | | |
| | | Class R6 | |
| |
| | | Year Ended October 31, | |
| | | 2022 | | | 2021 | | | 2020 | | | 2019 | | | 2018 | |
| | | | | |
Net asset value — Beginning of year | | $ | 8.730 | | | $ | 8.340 | | | $ | 8.620 | | | $ | 8.850 | | | $ | 8.880 | |
| | | | | |
| Income (Loss) From Operations | | | | | | | | | | | | | | | | | | | | |
| | | | | |
Net investment income(1) | | $ | 0.364 | | | $ | 0.312 | | | $ | 0.349 | | | $ | 0.435 | | | $ | 0.399 | |
| | | | | |
Net realized and unrealized gain (loss) | | | (0.730 | ) | | | 0.393 | | | | (0.267 | ) | | | (0.228 | ) | | | (0.036 | ) |
| | | | | |
Total income (loss) from operations | | $ | (0.366 | ) | | $ | 0.705 | | | $ | 0.082 | | | $ | 0.207 | | | $ | 0.363 | |
| | | | | |
| Less Distributions | | | | | | | | | | | | | | | | | | | | |
| | | | | |
From net investment income | | $ | (0.364 | ) | | $ | (0.315 | ) | | $ | (0.362 | ) | | $ | (0.437 | ) | | $ | (0.393 | ) |
| | | | | |
Total distributions | | $ | (0.364 | ) | | $ | (0.315 | ) | | $ | (0.362 | ) | | $ | (0.437 | ) | | $ | (0.393 | ) |
| | | | | |
Net asset value — End of year | | $ | 8.000 | | | $ | 8.730 | | | $ | 8.340 | | | $ | 8.620 | | | $ | 8.850 | |
| | | | | |
Total Return(2) | | | (4.38 | )% | | | 8.54 | % | | | 1.05 | % | | | 2.41 | % | | | 4.05 | % |
| | | | | |
| Ratios/Supplemental Data | | | | | | | | | | | | | | | | | | | | |
| | | | | |
Net assets, end of year (000’s omitted) | | $ | 42,124 | | | $ | 37,646 | | | $ | 77,338 | | | $ | 130,492 | | | $ | 125,876 | |
| | | | | |
Ratios (as a percentage of average daily net assets):(3) | | | | | | | | | | | | | | | | | | | | |
| | | | | |
Expenses | | | 0.71 | %(4) | | | 0.74 | % | | | 0.79 | % | | | 0.73 | % | | | 0.72 | % |
| | | | | |
Net investment income | | | 4.35 | % | | | 3.61 | % | | | 4.19 | % | | | 4.99 | % | | | 4.49 | % |
| | | | | |
Portfolio Turnover of the Fund(5) | | | 24 | % | | | 9 | % | | | 8 | % | | | 5 | % | | | 12 | % |
| (1) | Computed using average shares outstanding. |
| (2) | Returns are historical and are calculated by determining the percentage change in net asset value with all distributions reinvested. |
| (3) | Includes the Fund’s share of the Portfolios’ allocated expenses. |
| (4) | Includes a reduction by the investment adviser of a portion of the Portfolios’ adviser fees due to the Portfolios’ investment in the Liquidity Fund (equal to less than 0.005% of average daily net assets for the year ended October 31, 2022). |
| (5) | Percentage is based on the Fund’s contributions to and withdrawals from the Portfolios and excludes the investment activity of the Portfolios. |
| | | | |
| | 15 | | See Notes to Financial Statements. |
Eaton Vance
Floating-Rate & High Income Fund
October 31, 2022
Notes to Financial Statements
1 Significant Accounting Policies
Eaton Vance Floating-Rate & High Income Fund (the Fund) is a diversified series of Eaton Vance Mutual Funds Trust (the Trust). The Trust is a Massachusetts business trust registered under the Investment Company Act of 1940, as amended (the 1940 Act), as an open-end management investment company. The Fund offers five classes of shares. Class A shares are generally sold subject to a sales charge imposed at time of purchase. Class C shares are sold at net asset value and are generally subject to a contingent deferred sales charge (see Note 5). Effective November 5, 2020, Class C shares automatically convert to Class A shares eight years after their purchase as described in the Fund’s prospectus. Advisers Class, Class I and Class R6 shares are sold at net asset value and are not subject to a sales charge. Each class represents a pro-rata interest in the Fund, but votes separately on class-specific matters and (as noted below) is subject to different expenses. Realized and unrealized gains and losses are allocated daily to each class of shares based on the relative net assets of each class to the total net assets of the Fund. Net investment income, other than class-specific expenses, is allocated daily to each class of shares based upon the ratio of the value of each class’s paid shares to the total value of all paid shares. Sub-accounting, recordkeeping and similar administrative fees payable to financial intermediaries, which are a component of transfer and dividend disbursing agent fees on the Statement of Operations, are not allocated to Class R6 shares. Each class of shares differs in its distribution plan and certain other class-specific expenses. The Fund’s investment objective is to provide a high level of current income. The Fund currently pursues its objective by investing all of its investable assets in interests in two portfolios managed by Eaton Vance Management (EVM) or its affiliates (the Portfolios), which are Massachusetts business trusts. The value of the Fund’s investments in the Portfolios reflects the Fund’s proportionate interest in their net assets. The Portfolios and the Fund’s proportionate interest in each of their net assets at October 31, 2022 were as follows: Eaton Vance Floating Rate Portfolio (15.7%) and High Income Opportunities Portfolio (23.9%). The performance of the Fund is directly affected by the performance of the Portfolios. The financial statements of Eaton Vance Floating Rate Portfolio, including the portfolio of investments, are included elsewhere in this report and should be read in conjunction with the Fund’s financial statements. A copy of High Income Opportunities Portfolio’s financial statements is available by calling Eaton Vance at 1-800-262-1122 or in the EDGAR database on the Securities and Exchange Commission’s website at www.sec.gov.
The following is a summary of significant accounting policies of the Fund. The policies are in conformity with accounting principles generally accepted in the United States of America (U.S. GAAP). The Fund is an investment company and follows accounting and reporting guidance in the Financial Accounting Standards Board (FASB) Accounting Standards Codification Topic 946.
A Investment Valuation — Valuation of securities by Eaton Vance Floating Rate Portfolio is discussed in Note 1A of the Portfolio’s Notes to Financial Statements, which are included elsewhere in this report. Such policies are consistent with those of High Income Opportunities Portfolio.
B Income — The Fund’s net investment income or loss consists of the Fund’s pro-rata share of the net investment income or loss of the Portfolios, less all actual and accrued expenses of the Fund.
C Federal Taxes — The Fund’s policy is to comply with the provisions of the Internal Revenue Code applicable to regulated investment companies and to distribute to shareholders each year substantially all of its net investment income, and all or substantially all of its net realized capital gains. Accordingly, no provision for federal income or excise tax is necessary.
As of October 31, 2022, the Fund had no uncertain tax positions that would require financial statement recognition, de-recognition, or disclosure. The Fund files a U.S. federal income tax return annually after its fiscal year-end, which is subject to examination by the Internal Revenue Service for a period of three years from the date of filing.
D Expenses — The majority of expenses of the Trust are directly identifiable to an individual fund. Expenses which are not readily identifiable to a specific fund are allocated taking into consideration, among other things, the nature and type of expense and the relative size of the funds.
E Use of Estimates — The preparation of the financial statements in conformity with U.S. GAAP requires management to make estimates and assumptions that affect the reported amounts of assets and liabilities at the date of the financial statements and the reported amounts of income and expense during the reporting period. Actual results could differ from those estimates.
F Indemnifications — Under the Trust’s organizational documents, its officers and Trustees may be indemnified against certain liabilities and expenses arising out of the performance of their duties to the Fund. Under Massachusetts law, if certain conditions prevail, shareholders of a Massachusetts business trust (such as the Trust) could be deemed to have personal liability for the obligations of the Trust. However, the Trust’s Declaration of Trust contains an express disclaimer of liability on the part of Fund shareholders and the By-laws provide that the Trust shall assume, upon request by the shareholder, the defense on behalf of any Fund shareholders. Moreover, the By-laws also provide for indemnification out of Fund property of any shareholder held personally liable solely by reason of being or having been a shareholder for all loss or expense arising from such liability. Additionally, in the normal course of business, the Fund enters into agreements with service providers that may contain indemnification clauses. The Fund’s maximum exposure under these arrangements is unknown as this would involve future claims that may be made against the Fund that have not yet occurred.
G Other — Investment transactions are accounted for on a trade date basis.
Eaton Vance
Floating-Rate & High Income Fund
October 31, 2022
Notes to Financial Statements — continued
2 Distributions to Shareholders and Income Tax Information
The Fund declares dividends daily to shareholders of record at the time of declaration. Distributions are generally paid monthly. Distributions of realized capital gains are made at least annually. Distributions are declared separately for each class of shares. Shareholders may reinvest income and capital gain distributions in additional shares of the same class of the Fund at the net asset value as of the reinvestment date or, at the election of the shareholder, receive distributions in cash. Distributions to shareholders are determined in accordance with income tax regulations, which may differ from U.S. GAAP. As required by U.S. GAAP, only distributions in excess of tax basis earnings and profits are reported in the financial statements as a return of capital.
Permanent differences between book and tax accounting relating to distributions are reclassified to paid-in capital. For tax purposes, distributions from short-term capital gains are considered to be from ordinary income.
The tax character of distributions declared for the years ended October 31, 2022 and October 31, 2021 was as follows:
| | | | | | | | |
| | | Year Ended October 31, | |
| | | 2022 | | | 2021 | |
| | |
Ordinary income | | $ | 72,508,390 | | | $ | 40,240,263 | |
During the year ended October 31, 2022, accumulated loss was increased by $2,257,022 and paid-in capital was increased by $2,257,022 due to the Fund’s use of equalization accounting. Tax equalization accounting allows the Fund to treat as a distribution that portion of redemption proceeds representing a redeeming shareholder’s portion of undistributed taxable income and net capital gains. These reclassifications had no effect on the net assets or net asset value per share of the Fund.
As of October 31, 2022, the components of distributable earnings (accumulated loss) on a tax basis were as follows:
| | | | |
| | |
Undistributed ordinary income | | $ | 142,702 | |
| |
Deferred capital losses | | | (146,178,030 | ) |
| |
Net unrealized depreciation | | | (159,140,706 | ) |
| |
Distributions payable | | | (390,937 | ) |
| |
| Accumulated loss | | $(305,566,971) | |
At October 31, 2022, the Fund, for federal income tax purposes, had deferred capital losses of $146,178,030 which would reduce its taxable income arising from future net realized gains on investment transactions, if any, to the extent permitted by the Internal Revenue Code, and thus would reduce the amount of distributions to shareholders, which would otherwise be necessary to relieve the Fund of any liability for federal income or excise tax. The deferred capital losses are treated as arising on the first day of the Fund’s next taxable year and retain the same short-term or long-term character as when originally deferred. Of the deferred capital losses at October 31, 2022, $15,340,310 are short-term and $130,837,720 are long-term.
3 Investment Adviser Fee and Other Transactions with Affiliates
The investment adviser fee is earned by EVM, an indirect, wholly-owned subsidiary of Morgan Stanley, as compensation for investment advisory services rendered to the Fund. For bank loans and bank loan related assets, the fee is computed based on the Fund’s daily net assets that are not invested in other investment companies for which EVM or its affiliates serve as investment adviser and receive an advisory fee at the following annual rates and is payable monthly:
| | | | |
| Average Daily Net Assets | | Annual Fee Rate | |
| |
Up to $1 billion | | | 0.575 | % |
| |
$1 billion but less than $2 billion | | | 0.525 | % |
| |
$2 billion but less than $5 billion | | | 0.490 | % |
| |
$5 billion but less than $10 billion | | | 0.460 | % |
| |
$10 billion but less than $15 billion | | | 0.435 | % |
| |
$15 billion but less than $20 billion | | | 0.415 | % |
| |
$20 billion but less than $25 billion | | | 0.400 | % |
| |
$25 billion and over | | | 0.390 | % |
Eaton Vance
Floating-Rate & High Income Fund
October 31, 2022
Notes to Financial Statements — continued
For high yield bonds and other instruments that are not bank loan related, the fee is an aggregate of a daily asset-based fee and a daily income-based fee at the following rates:
| | | | | | | | |
| Total Daily Net Assets | | Annual Asset
Rate | | | Daily Income
Rate | |
| | |
Up to $500 million | | | 0.300 | % | | | 3.00 | % |
| | |
$500 million but less than $1 billion | | | 0.275 | % | | | 2.75 | % |
| | |
$1 billion but less than $1.5 billion | | | 0.250 | % | | | 2.50 | % |
| | |
$1.5 billion but less than $2 billion | | | 0.225 | % | | | 2.25 | % |
| | |
$2 billion but less than $3 billion | | | 0.200 | % | | | 2.00 | % |
| | |
$3 billion and over | | | 0.175 | % | | | 1.75 | % |
For the year ended October 31, 2022, the Fund incurred no investment adviser fee on such assets. To the extent the Fund’s assets are invested in the Portfolios, the Fund is allocated its share of the Portfolios’ investment adviser fees. The Portfolios have engaged Boston Management and Research (BMR), an affiliate of EVM, to render investment advisory services. See Note 2 of the Portfolios’ Notes to Financial Statements. For the year ended October 31, 2022, the Fund’s allocated portion of investment adviser fees paid by the Portfolios amounted to $8,211,250 or 0.48% of the Fund’s average daily net assets. The administration fee is earned by EVM as compensation for administrative services rendered to the Fund. The fee is computed at an annual rate of 0.15% of the Fund’s average daily net assets. For the year ended October 31, 2022, the administration fee amounted to $2,556,524.
EVM provides sub-transfer agency and related services to the Fund pursuant to a Sub-Transfer Agency Support Services Agreement. For the year ended October 31, 2022, EVM earned $33,389 from the Fund pursuant to such agreement, which is included in transfer and dividend disbursing agent fees on the Statement of Operations. The Fund was informed that Eaton Vance Distributors, Inc. (EVD), an affiliate of EVM and the Fund’s principal underwriter, received $11,128 as its portion of the sales charge on sales of Class A shares for the year ended October 31, 2022. The Fund was informed that Morgan Stanley affiliated broker-dealers, which may be deemed to be affiliates of EVM, BMR and EVD, also received a portion of the sales charge on sales of Class A shares for the year ended October 31, 2022 in the amount of $2,669. EVD also received distribution and service fees from Class A and Class C shares (see Note 4) and contingent deferred sales charges (see Note 5).
Trustees and officers of the Fund who are members of EVM’s or BMR’s organizations receive remuneration for their services to the Fund out of the investment adviser fee. Certain officers and Trustees of the Fund and the Portfolios are officers of the above organizations.
4 Distribution Plans
The Fund has in effect distribution plans for the Advisers Class shares and Class A shares (Advisers/Class A Plan) pursuant to Rule 12b-1 under the 1940 Act. Pursuant to the Advisers/Class A Plan, the Fund pays EVD a distribution and service fee of 0.25% per annum of its average daily net assets attributable to Advisers Class shares and Class A shares for distribution services and facilities provided to the Fund by EVD, as well as for personal services and/or the maintenance of shareholder accounts. Distribution and service fees paid or accrued to EVD for the year ended October 31, 2022 amounted to $116,523 for Advisers Class shares and $456,177 for Class A shares. The Fund also has in effect a distribution plan for Class C shares (Class C Plan) pursuant to Rule 12b-1 under the 1940 Act. Pursuant to the Class C Plan, the Fund pays EVD amounts equal to 0.75% per annum of its average daily net assets attributable to Class C shares for providing ongoing distribution services and facilities to the Fund. For the year ended October 31, 2022, the Fund paid or accrued to EVD $183,739 for Class C shares.
Pursuant to the Class C Plan, the Fund also makes payments of service fees to EVD, financial intermediaries and other persons in amounts equal to 0.25% per annum of its average daily net assets attributable to Class C shares. Service fees paid or accrued are for personal services and/or the maintenance of shareholder accounts. They are separate and distinct from the sales commissions and distribution fees payable to EVD. Service fees paid or accrued for the year ended October 31, 2022 amounted to $61,246 for Class C shares.
Distribution and service fees are subject to the limitations contained in the Financial Industry Regulatory Authority Rule 2341(d).
5 Contingent Deferred Sales Charges
A contingent deferred sales charge (CDSC) of 1% generally is imposed on redemptions of Class C shares made within 12 months of purchase. Class A shares may be subject to a 0.75% (1% prior to April 29, 2022) CDSC if redeemed within 12 months (18 months prior to April 29, 2022) of purchase (depending on the circumstances of purchase). Generally, the CDSC is based upon the lower of the net asset value at date of redemption or date of purchase. No charge is levied on shares acquired by reinvestment of dividends or capital gain distributions. For the year ended October 31, 2022, the Fund was informed that EVD received approximately $62,000 and $3,000 of CDSCs paid by Class A and Class C shareholders, respectively.
Eaton Vance
Floating-Rate & High Income Fund
October 31, 2022
Notes to Financial Statements — continued
6 Investment Transactions
For the year ended October 31, 2022, increases and decreases in the Fund’s investment in the Portfolios were as follows:
| | | | | | | | |
| Portfolio | | Contributions | | | Withdrawals | |
| | |
Eaton Vance Floating Rate Portfolio | | $ | 435,922,345 | | | $ | 345,514,085 | |
| | |
High Income Opportunities Portfolio | | | 83,032,828 | | | | 65,812,207 | |
7 Shares of Beneficial Interest
The Fund’s Declaration of Trust permits the Trustees to issue an unlimited number of full and fractional shares of beneficial interest (without par value). Such shares may be issued in a number of different series (such as the Fund) and classes. Transactions in Fund shares, including direct exchanges pursuant to share class conversions for all periods presented, were as follows:
| | | | | | | | | | | | | | | | |
| | | Year Ended
October 31, 2022 | | | Year Ended
October 31, 2021 | |
| | | Shares | | | Amount | | | Shares | | | Amount | |
| | | | |
Advisers Class | | | | | | | | | | | | | | | | |
| | | | |
Sales | | | 861,467 | | | $ | 7,333,346 | | | | 1,249,799 | | | $ | 10,856,158 | |
| | | | |
Issued to shareholders electing to receive payments of distributions in Fund shares | | | 225,567 | | | | 1,870,304 | | | | 172,853 | | | | 1,499,052 | |
| | | | |
Redemptions | | | (1,136,776 | ) | | | (9,513,243 | ) | | | (1,060,548 | ) | | | (9,182,046 | ) |
| | | | |
Net increase (decrease) | | | (49,742 | ) | | $ | (309,593 | ) | | | 362,104 | | | $ | 3,173,164 | |
| | | | |
Class A | | | | | | | | | | | | | | | | |
| | | | |
Sales | | | 5,626,007 | | | $ | 50,747,562 | | | | 8,813,723 | | | $ | 81,274,452 | |
| | | | |
Issued to shareholders electing to receive payments of distributions in Fund shares | | | 754,617 | | | | 6,655,370 | | | | 577,092 | | | | 5,325,642 | |
| | | | |
Redemptions | | | (6,294,093 | ) | | | (56,481,287 | ) | | | (9,681,206 | ) | | | (88,455,852 | ) |
| | | | |
Net increase (decrease) | | | 86,531 | | | $ | 921,645 | | | | (290,391 | ) | | $ | (1,855,758 | ) |
| | | | |
Class C | | | | | | | | | | | | | | | | |
| | | | |
Sales | | | 545,540 | | | $ | 4,647,106 | | | | 565,472 | | | $ | 4,899,960 | |
| | | | |
Issued to shareholders electing to receive payments of distributions in Fund shares | | | 90,568 | | | | 748,915 | | | | 79,607 | | | | 688,546 | |
| | | | |
Redemptions | | | (871,319 | ) | | | (7,277,832 | ) | | | (2,215,363 | ) | | | (19,027,784 | ) |
| | | | |
Net decrease | | | (235,211 | ) | | $ | (1,881,811 | ) | | | (1,570,284 | ) | | $ | (13,439,278 | ) |
| | | | |
Class I | | | | | | | | | | | | | | | | |
| | | | |
Sales | | | 104,576,939 | | | $ | 890,758,907 | | | | 90,284,447 | | | $ | 784,873,745 | |
| | | | |
Issued to shareholders electing to receive payments of distributions in Fund shares | | | 6,909,643 | | | | 57,277,380 | | | | 3,148,371 | | | | 27,352,583 | |
| | | | |
Redemptions | | | (93,980,289 | ) | | | (776,940,053 | ) | | | (22,939,295 | ) | | | (198,800,150 | ) |
| | | | |
Net increase | | | 17,506,293 | | | $ | 171,096,234 | | | | 70,493,523 | | | $ | 613,426,178 | |
Eaton Vance
Floating-Rate & High Income Fund
October 31, 2022
Notes to Financial Statements — continued
| | | | | | | | | | | | | | | | |
| | | Year Ended
October 31, 2022 | | | Year Ended
October 31, 2021 | |
| | | Shares | | | Amount | | | Shares | | | Amount | |
| | | | |
Class R6 | | | | | | | | | | | | | | | | |
| | | | |
Sales | | | 3,056,181 | | | $ | 26,069,554 | | | | 1,482,143 | | | $ | 12,864,764 | |
| | | | |
Issued to shareholders electing to receive payments of distributions in Fund shares | | | 229,501 | | | | 1,901,527 | | | | 143,674 | | | | 1,246,431 | |
| | | | |
Redemptions | | | (2,330,840 | ) | | | (19,459,077 | ) | | | (6,586,341 | ) | | | (56,987,938 | ) |
| | | | |
Net increase (decrease) | | | 954,842 | | | $ | 8,512,004 | | | | (4,960,524 | ) | | $ | (42,876,743 | ) |
8 Fair Value Measurements
Under generally accepted accounting principles for fair value measurements, a three-tier hierarchy to prioritize the assumptions, referred to as inputs, is used in valuation techniques to measure fair value. The three-tier hierarchy of inputs is summarized in the three broad levels listed below.
| • | | Level 1 – quoted prices in active markets for identical investments |
| • | | Level 2 – other significant observable inputs (including quoted prices for similar investments, interest rates, prepayment speeds, credit risk, etc.) |
| • | | Level 3 – significant unobservable inputs (including a fund’s own assumptions in determining the fair value of investments) |
In cases where the inputs used to measure fair value fall in different levels of the fair value hierarchy, the level disclosed is determined based on the lowest level input that is significant to the fair value measurement in its entirety. The inputs or methodology used for valuing securities are not necessarily an indication of the risk associated with investing in those securities.
At October 31, 2022 and October 31, 2021, the Fund’s investment in High Income Opportunities Portfolio, whose financial statements are not included but are available elsewhere as discussed in Note 1, and in Eaton Vance Floating Rate Portfolio were valued based on Level 1 inputs.
9 Risks and Uncertainties
Pandemic Risk
An outbreak of respiratory disease caused by a novel coronavirus was first detected in China in late 2019 and subsequently spread internationally. This coronavirus has resulted in closing borders, enhanced health screenings, changes to healthcare service preparation and delivery, quarantines, cancellations, disruptions to supply chains and customer activity, as well as general concern and uncertainty. Health crises caused by outbreaks of disease, such as the coronavirus outbreak, may exacerbate other pre-existing political, social and economic risks and disrupt normal market conditions and operations. The impact of this outbreak has negatively affected the worldwide economy, as well as the economies of individual countries and industries, and could continue to affect the market in significant and unforeseen ways. Other epidemics and pandemics that may arise in the future may have similar effects. Any such impact could adversely affect the Fund’s performance, or the performance of the securities in which the Fund invests.
Eaton Vance
Floating-Rate & High Income Fund
October 31, 2022
Report of Independent Registered Public Accounting Firm
To the Trustees of Eaton Vance Mutual Funds Trust and Shareholders of Eaton Vance Floating-Rate & High Income Fund:
Opinion on the Financial Statements and Financial Highlights
We have audited the accompanying statement of assets and liabilities of Eaton Vance Floating-Rate & High Income Fund (the “Fund”) (one of the funds constituting Eaton Vance Mutual Funds Trust), as of October 31, 2022, the related statement of operations for the year then ended, the statements of changes in net assets for each of the two years in the period then ended, the financial highlights for each of the five years in the period then ended, and the related notes. In our opinion, the financial statements and financial highlights present fairly, in all material respects, the financial position of the Fund as of October 31, 2022, and the results of its operations for the year then ended, the changes in its net assets for each of the two years in the period then ended, and the financial highlights for each of the five years in the period then ended, in conformity with accounting principles generally accepted in the United States of America.
Basis for Opinion
These financial statements and financial highlights are the responsibility of the Fund’s management. Our responsibility is to express an opinion on the Fund’s financial statements and financial highlights based on our audits. We are a public accounting firm registered with the Public Company Accounting Oversight Board (United States) (PCAOB) and are required to be independent with respect to the Fund in accordance with the U.S. federal securities laws and the applicable rules and regulations of the Securities and Exchange Commission and the PCAOB.
We conducted our audits in accordance with the standards of the PCAOB. Those standards require that we plan and perform the audit to obtain reasonable assurance about whether the financial statements and financial highlights are free of material misstatement, whether due to error or fraud. The Fund is not required to have, nor were we engaged to perform, an audit of its internal control over financial reporting. As part of our audits, we are required to obtain an understanding of internal control over financial reporting but not for the purpose of expressing an opinion on the effectiveness of the Fund’s internal control over financial reporting. Accordingly, we express no such opinion.
Our audits included performing procedures to assess the risks of material misstatement of the financial statements and financial highlights, whether due to error or fraud, and performing procedures that respond to those risks. Such procedures included examining, on a test basis, evidence regarding the amounts and disclosures in the financial statements and financial highlights. Our audits also included evaluating the accounting principles used and significant estimates made by management, as well as evaluating the overall presentation of the financial statements and financial highlights. We believe that our audits provide a reasonable basis for our opinion.
/s/ Deloitte & Touche LLP
Boston, Massachusetts
December 22, 2022
We have served as the auditor of one or more Eaton Vance investment companies since 1959.
Eaton Vance
Floating-Rate & High Income Fund
October 31, 2022
Federal Tax Information (Unaudited)
The Form 1099-DIV you receive in February 2023 will show the tax status of all distributions paid to your account in calendar year 2022. Shareholders are advised to consult their own tax adviser with respect to the tax consequences of their investment in the Fund. As required by the Internal Revenue Code and/or regulations, shareholders must be notified regarding the status of qualified dividend income for individuals and 163(j) interest dividends.
Qualified Dividend Income. For the fiscal year ended October 31, 2022, the Fund designates approximately $185,780, or up to the maximum amount of such dividends allowable pursuant to the Internal Revenue Code, as qualified dividend income eligible for the reduced tax rate of 15%.
163(j) Interest Dividends. For the fiscal year ended October 31, 2022, the Fund designates 96.08% of distributions from net investment income as a 163(j) interest dividend.
Eaton Vance
Floating Rate Portfolio
October 31, 2022
Portfolio of Investments
| | | | | | | | | | | | |
| Asset-Backed Securities — 3.3% | |
| Security | | | | | Principal
Amount
(000’s omitted) | | | Value | |
| | | |
AGL CLO 17, Ltd., Series 2022-17A, Class E, 10.338%, (3 mo. SOFR + 6.35%), 1/21/35(1)(2) | | | | | | $ | 1,000 | | | $ | 832,224 | |
| | | |
Alinea CLO, Ltd.: | | | | | | | | | | | | |
| | | |
Series 2018-1A, Class D, 7.343%, (3 mo. USD LIBOR + 3.10%),
7/20/31(1)(2) | | | | | | | 2,500 | | | | 2,196,693 | |
| | | |
Series 2018-1A, Class E, 10.243%, (3 mo. USD LIBOR + 6.00%),
7/20/31(1)(2) | | | | | | | 3,000 | | | | 2,410,995 | |
| | | |
AMMC CLO 15, Ltd., Series 2014-15A, Class ERR, 10.989%, (3 mo. USD LIBOR + 6.91%), 1/15/32(1)(2) | | | | | | | 5,000 | | | | 3,919,760 | |
| | | |
AMMC CLO XII, Ltd., Series 2013-12A, Class ER, 9.092%, (3 mo. USD LIBOR + 6.18%), 11/10/30(1)(2) | | | | | | | 3,525 | | | | 2,743,021 | |
| | | |
Apidos CLO XX, Series 2015-20A, Class DR, 9.779%, (3 mo. USD LIBOR + 5.70%), 7/16/31(1)(2) | | | | | | | 2,375 | | | | 1,960,199 | |
| | | |
Ares LVlll CLO, Ltd., Series 2020-58A, Class ER, 10.564%, (3 mo. SOFR + 6.70%), 1/15/35(1)(2) | | | | | | | 3,000 | | | | 2,439,324 | |
| | | |
Ares XLIX CLO, Ltd.: | | | | | | | | | | | | |
| | | |
Series 2018-49A, Class D, 7.325%, (3 mo. USD LIBOR + 3.00%),
7/22/30(1)(2) | | | | | | | 2,500 | | | | 2,216,017 | |
| | | |
Series 2018-49A, Class E, 10.025%, (3 mo. USD LIBOR + 5.70%),
7/22/30(1)(2) | | | | | | | 3,500 | | | | 2,890,412 | |
| | | |
Ares XXXIIR CLO, Ltd., Series 2014-32RA, Class C, 5.805%, (3 mo. USD LIBOR + 2.90%), 5/15/30(1)(2) | | | | | | | 5,000 | | | | 4,323,625 | |
| | | |
Ares XXXVR CLO, Ltd., Series 2015-35RA, Class E, 9.779%, (3 mo. USD LIBOR + 5.70%), 7/15/30(1)(2) | | | | | | | 4,000 | | | | 3,249,960 | |
| | | |
Babson CLO, Ltd.: | | | | | | | | | | | | |
| | | |
Series 2015-1A, Class DR, 6.843%, (3 mo. USD LIBOR + 2.60%),
1/20/31(1)(2) | | | | | | | 2,500 | | | | 2,143,750 | |
| | | |
Series 2018-1A, Class C, 6.679%, (3 mo. USD LIBOR + 2.60%),
4/15/31(1)(2) | | | | | | | 3,500 | | | | 2,993,819 | |
| | | |
Bain Capital Credit CLO, Ltd.: | | | | | | | | | | | | |
| | | |
Series 2018-1A, Class D, 7.025%, (3 mo. USD LIBOR + 2.70%),
4/23/31(1)(2) | | | | | | | 5,000 | | | | 4,292,110 | |
| | | |
Series 2018-1A, Class E, 9.675%, (3 mo. USD LIBOR + 5.35%),
4/23/31(1)(2) | | | | | | | 3,000 | | | | 2,326,506 | |
| | | |
Battalion CLO XXII, Ltd., Series 2021-22A, Class E, 11.193%, (3 mo. USD LIBOR + 6.95%), 1/20/35(1)(2) | | | | | | | 1,750 | | | | 1,434,109 | |
| | | |
Battalion CLO XXIII, Ltd., Series 2022-23A, Class D, 6.083%, (3 mo. SOFR + 3.95%), 5/19/36(1)(2) | | | | | | | 3,500 | | | | 3,243,152 | |
| | | |
Benefit Street Partners CLO V-B, Ltd.: | | | | | | | | | | | | |
| | | |
Series 2018-5BA, Class C, 7.173%, (3 mo. USD LIBOR + 2.93%),
4/20/31(1)(2) | | | | | | | 5,000 | | | | 4,332,635 | |
| | | |
Series 2018-5BA, Class D, 10.193%, (3 mo. USD LIBOR + 5.95%),
4/20/31(1)(2) | | | | | | | 3,500 | | | | 2,867,620 | |
| | | |
Benefit Street Partners CLO VIII, Ltd., Series 2015-8A, Class DR, 9.843%, (3 mo. USD LIBOR + 5.60%), 1/20/31(1)(2) | | | | | | | 5,401 | | | | 4,273,152 | |
| | | | | | | | | | |
| Security | | | | Principal
Amount
(000’s omitted) | | | Value | |
| | | |
Benefit Street Partners CLO XIV, Ltd.,
Series 2018-14A, Class D, 6.843%, (3 mo. USD LIBOR + 2.60%), 4/20/31(1)(2) | | | | $ | 1,500 | | | $ | 1,288,166 | |
| | | |
Benefit Street Partners CLO XVI, Ltd.,
Series 2018-16A, Class E, 10.779%, (3 mo.
USD LIBOR + 6.70%), 1/17/32(1)(2) | | | | 2,250 | | | 1,902,560 | |
| | | |
Benefit Street Partners CLO XVII, Ltd.,
Series 2019-17A, Class ER, 10.429%, (3 mo.
USD LIBOR + 6.35%), 7/15/32(1)(2) | | | | 1,750 | | | 1,458,174 | |
| | | |
Benefit Street Partners CLO XXII, Ltd.,
Series 2020-22A, Class ER, 10.893%, (3 mo.
SOFR + 6.93%), 4/20/35(1)(2) | | | | 1,000 | | | 827,510 | |
| | | |
Benefit Street Partners CLO XXV, Ltd.,
Series 2021-25A, Class E, 10.929%, (3 mo.
USD LIBOR + 6.85%), 1/15/35(1)(2) | | | | 3,000 | | | 2,603,145 | |
| | | |
| Betony CLO 2, Ltd.: | | | | | | | | |
| | | |
Series 2018-1A, Class C, 7.315%, (3 mo. USD LIBOR + 2.90%), 4/30/31(1)(2) | | | | | 2,500 | | | | 2,181,535 | |
| | | |
Series 2018-1A, Class D, 10.065%, (3 mo. USD LIBOR + 5.65%), 4/30/31(1)(2) | | | | | 4,450 | | | | 3,533,932 | |
| | | |
BlueMountain CLO XXIV, Ltd., Series 2019-24A, Class ER, 11.083%, (3 mo. USD LIBOR + 6.84%), 4/20/34(1)(2) | | | | | 1,000 | | | | 813,847 | |
| | | |
BlueMountain CLO XXVI, Ltd., Series 2019-26A, Class ER, 11.373%, (3 mo. USD LIBOR + 7.13%), 10/20/34(1)(2) | | | | | 3,000 | | | | 2,501,094 | |
| | | |
BlueMountain CLO XXX, Ltd., Series 2020-30A, Class ER, 10.564%, (3 mo. SOFR + 6.70%), 4/15/35(1)(2) | | | | | 2,000 | | | | 1,583,188 | |
| | | |
BlueMountain CLO XXXV, Ltd., Series 2022-35A, Class E, 9.893%, (3 mo. SOFR + 7.75%), 7/22/35(1)(2) | | | | | 2,000 | | | | 1,735,462 | |
| | | |
| BlueMountain CLO, Ltd.: | | | | | | | | |
| | | |
Series 2016-3A, Class DR, 6.005%, (3 mo. USD LIBOR + 3.10%), 11/15/30(1)(2) | | | | | 1,500 | | | | 1,302,261 | |
| | | |
Series 2016-3A, Class ER, 8.855%, (3 mo. USD LIBOR + 5.95%), 11/15/30(1)(2) | | | | | 1,500 | | | | 1,164,126 | |
| | | |
Series 2018-1A, Class D, 7.465%, (3 mo. USD LIBOR + 3.05%), 7/30/30(1)(2) | | | | | 2,500 | | | | 2,126,600 | |
| | | |
Series 2018-1A, Class E, 10.365%, (3 mo. USD LIBOR + 5.95%), 7/30/30(1)(2) | | | | | 2,000 | | | | 1,528,400 | |
| | | |
Series 2021-33A, Class E, 9.814%, (3 mo. USD LIBOR + 6.83%), 11/20/34(1)(2) | | | | | 2,500 | | | | 2,090,870 | |
| | | |
| Canyon Capital CLO, Ltd.: | | | | | | | | |
| | | |
Series 2012-1RA, Class E, 9.779%, (3 mo. USD LIBOR + 5.70%), 7/15/30(1)(2) | | | | | 4,875 | | | | 3,809,369 | |
| | | |
Series 2016-1A, Class ER, 9.829%, (3 mo. USD LIBOR + 5.75%), 7/15/31(1)(2) | | | | | 4,000 | | | | 3,078,144 | |
| | | |
Series 2016-2A, Class ER, 10.079%, (3 mo. USD LIBOR + 6.00%), 10/15/31(1)(2) | | | | | 4,500 | | | | 3,478,288 | |
| | | |
Series 2017-1A, Class E, 10.329%, (3 mo. USD LIBOR + 6.25%), 7/15/30(1)(2) | | | | | 3,250 | | | | 2,569,083 | |
| | | | |
| | 23 | | See Notes to Financial Statements. |
Eaton Vance
Floating Rate Portfolio
October 31, 2022
Portfolio of Investments — continued
| | | | | | | | | | |
| Security | | | | Principal
Amount
(000’s omitted) | | | Value | |
| | | |
| Canyon Capital CLO, Ltd.: (continued) | | | | | | | | |
| | | |
Series 2018-1A, Class D, 6.979%, (3 mo. USD LIBOR + 2.90%), 7/15/31(1)(2) | | | | $ | 3,000 | | | $ | 2,598,006 | |
| | | |
Series 2018-1A, Class E, 9.829%, (3 mo. USD LIBOR + 5.75%), 7/15/31(1)(2) | | | | | 2,750 | | | | 2,168,977 | |
| | | |
Series 2019-2A, Class ER, 10.829%, (3 mo. USD LIBOR + 6.75%),
10/15/34(1)(2) | | | | | 1,500 | | | | 1,236,644 | |
| | | |
| Carlyle CLO C17, Ltd.: | | | | | | | | |
| | | |
Series C17A, Class CR, 7.215%, (3 mo. USD LIBOR + 2.80%), 4/30/31(1)(2) | | | | | 5,000 | | | | 4,414,415 | |
| | | |
Series C17A, Class DR, 10.415%, (3 mo. USD LIBOR + 6.00%), 4/30/31(1)(2) | | | | | 3,500 | | | | 2,837,838 | |
| | | |
| Carlyle Global Market Strategies CLO, Ltd.: | | | | | | | | |
| | | |
Series 2012-3A, Class CR2, 7.511%, (3 mo. USD LIBOR + 3.50%),
1/14/32(1)(2) | | | | | 2,500 | | | | 2,038,950 | |
| | | |
Series 2012-3A, Class DR2, 10.511%, (3 mo. USD LIBOR + 6.50%),
1/14/32(1)(2) | | | | | 1,500 | | | | 1,198,611 | |
| | | |
Series 2014-3RA, Class C, 7.308%, (3 mo. USD LIBOR + 2.95%),
7/27/31(1)(2) | | | | | 1,000 | | | | 859,225 | |
| | | |
Series 2014-3RA, Class D, 9.758%, (3 mo. USD LIBOR + 5.40%),
7/27/31(1)(2) | | | | | 2,150 | | | | 1,675,207 | |
| | | |
Series 2014-4RA, Class C, 6.979%, (3 mo. USD LIBOR + 2.90%),
7/15/30(1)(2) | | | | | 2,000 | | | | 1,714,230 | |
| | | |
Series 2014-4RA, Class D, 9.729%, (3 mo. USD LIBOR + 5.65%),
7/15/30(1)(2) | | | | | 3,500 | | | | 2,686,964 | |
| | | |
Carlyle US CLO, Ltd., Series 2019-4A, Class DR, 10.464%, (3 mo. SOFR + 6.60%), 4/15/35(1)(2) | | | | | 3,000 | | | | 2,341,932 | |
| | | |
CarVal CLO IV, Ltd., Series 2021-1A, Class E, 10.843%, (3 mo. USD LIBOR + 6.60%), 7/20/34(1)(2) | | | | | 1,000 | | | | 852,090 | |
| | | |
CIFC Funding, Ltd., Series 2022-4A, Class D, 6.074%, (3 mo. SOFR + 3.55%), 7/16/35(1)(2) | | | | | 1,750 | | | | 1,605,751 | |
| | | |
| Dryden CLO, Ltd.: | | | | | | | | |
| | | |
Series 2018-55A, Class D, 6.929%, (3 mo. USD LIBOR + 2.85%),
4/15/31(1)(2) | | | | | 1,500 | | | | 1,303,875 | |
| | | |
Series 2018-55A, Class E, 9.479%, (3 mo. USD LIBOR + 5.40%),
4/15/31(1)(2) | | | | | 2,000 | | | | 1,602,542 | |
| | | |
Series 2022-112A, Class E, 10.514%, (3 mo. SOFR + 7.78%), 8/15/34(1)(2) | | | | | 2,000 | | | | 1,834,140 | |
| | | |
| Dryden Senior Loan Fund: | | | | | | | | |
| | | |
Series 2015-41A, Class DR, 6.679%, (3 mo. USD LIBOR + 2.60%),
4/15/31(1)(2) | | | | | 5,000 | | | | 4,375,425 | |
| | | |
Series 2015-41A, Class ER, 9.379%, (3 mo. USD LIBOR + 5.30%),
4/15/31(1)(2) | | | | | 1,268 | | | | 1,015,382 | |
| | | |
Series 2016-42A, Class DR, 7.009%, (3 mo. USD LIBOR + 2.93%),
7/15/30(1)(2) | | | | | 2,500 | | | | 2,207,390 | |
| | | |
Series 2016-42A, Class ER, 9.629%, (3 mo. USD LIBOR + 5.55%),
7/15/30(1)(2) | | | | | 3,500 | | | | 2,874,553 | |
| | | |
Elmwood CLO 14, Ltd., Series 2022-1A, Class E, 10.313%, (3 mo. SOFR + 6.35%), 4/20/35(1)(2) | | | | | 1,950 | | | | 1,755,312 | |
| | | | | | | | | | |
| Security | | | | Principal
Amount
(000’s omitted) | | | Value | |
| | | |
Elmwood CLO 17, Ltd., Series 2022-4A, Class E, 9.244%, (3 mo. SOFR + 7.15%), 7/17/35(1)(2) | | | | $ | 2,250 | | | $ | 2,002,291 | |
| | | |
Galaxy XV CLO, Ltd., Series 2013-15A, Class ER, 10.724%, (3 mo. USD LIBOR + 6.65%), 10/15/30(1)(2) | | | | | 2,500 | | | | 2,023,443 | |
| | | |
| Galaxy XXV CLO, Ltd.: | | | | | | | | |
| | | |
Series 2018-25A, Class D, 7.458%, (3 mo. USD LIBOR + 3.10%), 10/25/31(1)(2) | | | | | 2,500 | | | | 2,211,837 | |
| | | |
Series 2018-25A, Class E, 10.308%, (3 mo. USD LIBOR + 5.95%), 10/25/31(1)(2) | | | | | 3,500 | | | | 2,826,271 | |
| | | |
Golub Capital Partners CLO 22B, Ltd.,
Series 2015-22A, Class ER, 10.243%, (3 mo.
USD LIBOR + 6.00%), 1/20/31(1)(2) | | | | 2,500 | | | 2,065,380 | |
| | | |
| Golub Capital Partners CLO 37B, Ltd.: | | | | | | | | |
| | | |
Series 2018-37A, Class D, 7.543%, (3 mo. USD LIBOR + 3.30%), 7/20/30(1)(2) | | | | | 4,000 | | | | 3,515,372 | |
| | | |
Series 2018-37A, Class E, 9.993%, (3 mo. USD LIBOR + 5.75%), 7/20/30(1)(2) | | | | | 4,750 | | | | 4,324,319 | |
| | | |
Golub Capital Partners CLO 53B, Ltd.,
Series 2021-53A, Class E, 10.943%, (3 mo.
USD LIBOR + 6.70%), 7/20/34(1)(2) | | | | 1,250 | | | 1,034,799 | |
| | | |
| Golub Capital Partners CLO 58B, Ltd., | | | | | | | | |
| | | |
Series 2021-58A, Class E, 11.168%, (3 mo. USD LIBOR + 6.81%), 1/25/35(1)(2) | | | | | 2,500 | | | | 2,057,463 | |
| | | |
Halseypoint CLO 5, Ltd., Series 2021-5A, Class E, 11.355%, (3 mo. USD LIBOR + 6.94%), 1/30/35(1)(2) | | | | | 2,000 | | | | 1,673,020 | |
| | | |
Harriman Park CLO, Ltd., Series 2020-1A, Class ER, 10.643%, (3 mo. USD LIBOR + 6.40%), 4/20/34(1)(2) | | | | | 1,000 | | | | 844,910 | |
| | | |
| ICG US CLO, Ltd.: | | | | | | | | |
| | | |
Series 2018-2A, Class D, 7.425%, (3 mo. USD LIBOR + 3.10%), 7/22/31(1)(2) | | | | | 2,000 | | | | 1,718,470 | |
| | | |
Series 2018-2A, Class E, 10.075%, (3 mo. USD LIBOR + 5.75%), 7/22/31(1)(2) | | | | | 3,000 | | | | 2,239,749 | |
| | | |
Madison Park Funding LIX, Ltd., Series 2021-59A, Class E, 10.794%, (3 mo. USD LIBOR + 6.60%), 1/18/34(1)(2) | | | | | 1,450 | | | | 1,239,750 | |
| | | |
Madison Park Funding XXV, Ltd., Series 2017-25A, Class D, 10.458%, (3 mo. USD LIBOR + 6.10%), 4/25/29(1)(2) | | | | | 1,500 | | | | 1,291,446 | |
| | | |
Madison Park Funding XXXVI, Ltd., Series 2019-36A, Class ER, 10.914%, (3 mo. SOFR + 7.05%), 4/15/35(1)(2) | | | | | 2,500 | | | | 2,159,505 | |
| | | |
Marble Point CLO XXIV, Ltd., Series 2022-1A, Class D1, 8.203%, (3 mo. SOFR + 4.24%), 4/20/35(1)(2) | | | | | 2,000 | | | | 1,823,490 | |
| | | |
| Neuberger Berman CLO XXII, Ltd.: | | | | | | | | |
| | | |
Series 2016-22A, Class DR, 7.179%, (3 mo. USD LIBOR + 3.10%), 10/17/30(1)(2) | | | | | 2,500 | | | | 2,232,140 | |
| | | |
Series 2016-22A, Class ER, 10.139%, (3 mo. USD LIBOR + 6.06%), 10/17/30(1)(2) | | | | | 3,000 | | | | 2,543,190 | |
| | | | |
| | 24 | | See Notes to Financial Statements. |
Eaton Vance
Floating Rate Portfolio
October 31, 2022
Portfolio of Investments — continued
| | | | | | | | | | |
| Security | | | | Principal
Amount
(000’s omitted) | | | Value | |
| | | |
Neuberger Berman Loan Advisers CLO 28, Ltd., Series 2018-28A, Class E, 9.843%, (3 mo. USD LIBOR + 5.60%),
4/20/30(1)(2) | | | | $ | 1,950 | | | $ | 1,622,985 | |
| | | |
| Neuberger Berman Loan Advisers CLO 30, Ltd.: | | | | | | | | |
| | | |
Series 2018-30A, Class DR, 7.093%, (3 mo. USD LIBOR + 2.85%),
1/20/31(1)(2) | | | | | 2,500 | | | | 2,214,132 | |
| | | |
Series 2018-30A, Class ER, 10.443%, (3 mo. USD LIBOR + 6.20%),
1/20/31(1)(2) | | | | | 1,000 | | | | 858,181 | |
| | | |
| Neuberger Berman Loan Advisers CLO 48, Ltd., | | | | | | | | |
| | | |
Series 2022-48A, Class E, 10.56%, (3 mo. SOFR + 6.50%), 4/25/36(1)(2) | | | | | 3,200 | | | | 2,735,840 | |
| | | |
| OCP CLO, Ltd.: | | | | | | | | |
| | | |
Series 2022-24A, Class D, 5.461%, (3 mo. SOFR + 3.80%), 7/20/35(1)(2) | | | | | 500 | | | | 454,612 | |
| | | |
Series 2022-24A, Class E, 9.081%, (3 mo. SOFR + 7.42%), 7/20/35(1)(2) | | | | | 1,000 | | | | 858,601 | |
| | | |
| Palmer Square CLO, Ltd.: | | | | | | | | |
| | | |
Series 2013-2A, Class DRR, 9.929%, (3 mo. USD LIBOR + 5.85%),
10/17/31(1)(2) | | | | | 3,000 | | | | 2,536,680 | |
| | | |
Series 2015-1A, Class DR4, 9.484%, (3 mo. USD LIBOR + 6.50%),
5/21/34(1)(2) | | | | | 2,000 | | | | 1,700,194 | |
| | | |
Series 2018-1A, Class C, 6.694%, (3 mo. USD LIBOR + 2.50%), 4/18/31(1)(2) | | | | | 3,000 | | | | 2,644,785 | |
| | | |
Series 2018-1A, Class D, 9.344%, (3 mo. USD LIBOR + 5.15%), 4/18/31(1)(2) | | | | | 2,000 | | | | 1,656,110 | |
| | | |
Series 2018-2A, Class D, 9.679%, (3 mo. USD LIBOR + 5.60%), 7/16/31(1)(2) | | | | | 2,000 | | | | 1,718,734 | |
| | | |
Series 2021-2A, Class E, 10.429%, (3 mo. USD LIBOR + 6.35%),
7/15/34(1)(2) | | | | | 1,000 | | | | 886,353 | |
| | | |
Series 2022-1A, Class E, 10.313%, (3 mo. SOFR + 6.35%), 4/20/35(1)(2) | | | | | 2,000 | | | | 1,725,646 | |
| | | |
Series 2022-3A, Class E, 11.274%, (3 mo. SOFR + 7.98%), 7/20/35(1)(2) | | | | | 2,250 | | | | 2,125,868 | |
| | | |
RAD CLO 5, Ltd., Series 2019-5A, Class E, 11.025%, (3 mo. USD LIBOR + 6.70%), 7/24/32(1)(2) | | | | | 1,750 | | | | 1,466,325 | |
| | | |
RAD CLO 14, Ltd., Series 2021-14A, Class E, 10.579%, (3 mo. USD LIBOR + 6.50%), 1/15/35(1)(2) | | | | | 950 | | | | 773,088 | |
| | | |
| Regatta XIII Funding, Ltd.: | | | | | | | | |
| | | |
Series 2018-2A, Class C, 7.179%, (3 mo. USD LIBOR + 3.10%), 7/15/31(1)(2) | | | | | 2,500 | | | | 2,203,268 | |
| | | |
Series 2018-2A, Class D, 10.029%, (3 mo. USD LIBOR + 5.95%),
7/15/31(1)(2) | | | | | 5,000 | | | | 4,032,770 | |
| | | |
| Regatta XIV Funding, Ltd.: | | | | | | | | |
| | | |
Series 2018-3A, Class D, 7.558%, (3 mo. USD LIBOR + 3.20%),
10/25/31(1)(2) | | | | | 2,500 | | | | 2,206,957 | |
| | | |
Series 2018-3A, Class E, 10.308%, (3 mo. USD LIBOR + 5.95%), 10/25/31(1)(2) | | | | | 4,500 | | | | 3,618,648 | |
| | | |
Regatta XV Funding, Ltd., Series 2018-4A, Class D, 10.858%, (3 mo. USD LIBOR + 6.50%), 10/25/31(1)(2) | | | | | 3,875 | | | | 3,111,687 | |
| | | |
| Upland CLO, Ltd.: | | | | | | | | |
| | | |
Series 2016-1A, Class CR, 7.143%, (3 mo. USD LIBOR + 2.90%),
4/20/31(1)(2) | | | | | 4,500 | | | | 3,899,839 | |
| | | | | | | | | | | | |
| Security | | | | | Principal
Amount
(000’s omitted) | | | Value | |
| | | |
| Upland CLO, Ltd.: (continued) | | | | | | | | | |
| | | |
Series 2016-1A, Class DR, 10.143%, (3 mo. USD LIBOR + 5.90%), 4/20/31(1)(2) | | | | | | $ | 4,625 | | | $ | 3,694,686 | |
| | | |
| Vibrant CLO IX, Ltd.: | | | | | | | | | |
| | | |
Series 2018-9A, Class C, 7.443%, (3 mo. USD LIBOR + 3.20%), 7/20/31(1)(2) | | | | | | | 2,500 | | | | 2,083,450 | |
| | | |
Series 2018-9A, Class D, 10.493%, (3 mo. USD LIBOR + 6.25%), 7/20/31(1)(2) | | | | | | | 3,500 | | | | 2,453,027 | |
| | | |
| Vibrant CLO X, Ltd.: | | | | | | | | | |
| | | |
Series 2018-10A, Class C, 7.493%, (3 mo. USD LIBOR + 3.25%), 10/20/31(1)(2) | | | | | | | 5,000 | | | | 4,156,205 | |
| | | |
Series 2018-10A, Class D, 10.433%, (3 mo. USD LIBOR + 6.19%), 10/20/31(1)(2) | | | | | | | 5,000 | | | | 3,645,185 | |
| | | |
| Voya CLO, Ltd.: | | | | | | | | | |
| | | |
Series 2015-3A, Class CR, 7.393%, (3 mo. USD LIBOR + 3.15%), 10/20/31(1)(2) | | | | | | | 2,500 | | | | 2,065,483 | |
| | | |
Series 2015-3A, Class DR, 10.443%, (3 mo. USD LIBOR + 6.20%), 10/20/31(1)(2) | | | | | | | 5,500 | | | | 3,974,866 | |
| | | |
Series 2016-3A, Class CR, 7.444%, (3 mo. USD LIBOR + 3.25%), 10/18/31(1)(2) | | | | | | | 2,000 | | | | 1,573,884 | |
| | | |
Series 2016-3A, Class DR, 10.274%, (3 mo. USD LIBOR + 6.08%), 10/18/31(1)(2) | | | | | | | 3,375 | | | | 2,472,660 | |
| | | |
Series 2018-1A, Class C, 6.827%, (3 mo. USD LIBOR + 2.60%), 4/19/31(1)(2) | | | | | | | 5,000 | | | | 4,254,190 | |
| | | |
Series 2018-2A, Class E, 9.329%, (3 mo. USD LIBOR + 5.25%), 7/15/31(1)(2) | | | | | | | 2,500 | | | | 1,930,378 | |
| | | |
| Webster Park CLO, Ltd.: | | | | | | | | | |
| | | |
Series 2015-1A, Class CR, 7.143%, (3 mo. USD LIBOR + 2.90%), 7/20/30(1)(2) | | | | | | | 2,000 | | | | 1,764,840 | |
| | | |
Series 2015-1A, Class DR, 9.743%, (3 mo. USD LIBOR + 5.50%), 7/20/30(1)(2) | | | | | | | 2,500 | | | | 2,049,573 | |
| | | |
| Wellfleet CLO, Ltd.: | | | | | | | | | |
| | | |
Series 2021-1A, Class D, 7.743%, (3 mo. USD LIBOR + 3.50%), 4/20/34(1)(2) | | | | | | | 1,200 | | | | 1,048,104 | |
| | | |
Series 2021-3A, Class E, 11.179%, (3 mo. USD LIBOR + 7.10%), 1/15/35(1)(2) | | | | | | | 950 | | | | 787,360 | |
| | | |
Series 2022-1A, Class D, 8.004%, (3 mo. SOFR + 4.14%), 4/15/34(1)(2) | | | | | | | 1,000 | | | | 901,800 | |
| | | |
Series 2022-1A, Class E, 11.724%, (3 mo. SOFR + 7.86%), 4/15/34(1)(2) | | | | | | | 2,000 | | | | 1,774,440 | |
| | | |
Total Asset-Backed Securities
(identified cost $323,247,901) | | | | | | | | | | $ | 269,370,575 | |
| | | |
| Common Stocks — 0.7% | | | | | | | | | | | | |
| Security | | | | | Shares | | | Value | |
| | | |
| Aerospace and Defense — 0.1% | | | | | | | | | |
| | | |
IAP Global Services, LLC(3)(4)(5)(6) | | | | | | | 950 | | | $ | 4,055,113 | |
| | | |
IAP Global Services, LLC(3)(4)(5) | | | | | | | 1,627 | | | | 4,630,051 | |
| | | |
| | | | | | | | | | | $ | 8,685,164 | |
| | | | |
| | 25 | | See Notes to Financial Statements. |
Eaton Vance
Floating Rate Portfolio
October 31, 2022
Portfolio of Investments — continued
| | | | | | | | | | | | |
| Security | | | | | Shares | | | Value | |
|
| Containers and Glass Products — 0.0%(7) | |
| | | |
LG Newco Holdco, Inc., Class A(5)(6) | | | | | | | 250,979 | | | $ | 3,220,889 | |
| | | |
| | | | | | | | | | | $ | 3,220,889 | |
|
| Electronics/Electrical — 0.0%(7) | |
| | | |
Skillsoft Corp.(5)(6) | | | | | | | 893,525 | | | $ | 1,599,410 | |
| | | |
| | | | | | | | | | | $ | 1,599,410 | |
|
| Health Care — 0.1% | |
| | | |
Akorn Holding Company, LLC, Class A(5)(6) | | | | | | | 705,631 | | | $ | 4,233,786 | |
| | | |
| | | | | | | | | | | $ | 4,233,786 | |
|
| Investment Companies — 0.1% | |
| | | |
Aegletes B.V.(5)(6) | | | | | | | 115,904 | | | $ | 4,288,448 | |
| | | |
| | | | | | | | | | | $ | 4,288,448 | |
|
| Nonferrous Metals/Minerals — 0.1% | |
| | | |
ACNR Holdings, Inc., Class A(5)(6) | | | | | | | 36,829 | | | $ | 3,793,387 | |
| | | |
| | | | | | | | | | | $ | 3,793,387 | |
|
| Oil and Gas — 0.1% | |
| | | |
AFG Holdings, Inc.(4)(5)(6) | | | | | | | 498,342 | | | $ | 1,480,076 | |
| | | |
McDermott International, Ltd.(5)(6) | | | | | | | 1,013,850 | | | | 542,410 | |
| | | |
QuarterNorth Energy, Inc.(6) | | | | | | | 66,091 | | | | 8,096,147 | |
| | | |
QuarterNorth Energy, Inc.(6) | | | | | | | 9,684 | | | | 1,186,290 | |
| | | |
| | | | | | | | | | | $ | 11,304,923 | |
|
| Radio and Television — 0.1% | |
| | | |
Clear Channel Outdoor Holdings, Inc.(5)(6) | | | | | | | 1,204,044 | | | $ | 1,721,783 | |
| | | |
Cumulus Media, Inc., Class A(5)(6) | | | | | | | 644,574 | | | | 4,750,510 | |
| | | |
iHeartMedia, Inc., Class A(5)(6) | | | | | | | 512,034 | | | | 4,239,642 | |
| | | |
| | | | | | | | | | | $ | 10,711,935 | |
|
| Retailers (Except Food and Drug) — 0.0%(7) | |
| | | |
David’s Bridal, LLC(4)(5)(6) | | | | | | | 272,023 | | | $ | 0 | |
| | | |
Phillips Pet Holding Corp.(4)(5)(6) | | | | | | | 2,590 | | | | 793,493 | |
| | | |
| | | | | | | | | | | $ | 793,493 | |
|
| Telecommunications — 0.1% | |
| | | |
GEE Acquisition Holdings Corp.(4)(5)(6) | | | | | | | 364,650 | | | $ | 3,281,850 | |
| | | |
| | | | | | | | | | | $ | 3,281,850 | |
| | | | | | | | | | | | |
| Security | | | | | Shares | | | Value | |
|
| Utilities — 0.0%(7) | |
| | | |
Longview Intermediate Holdings, LLC, Class A(5)(6) | | | | | | | 149,459 | | | $ | 2,055,061 | |
| | | |
| | | | | | | | | | | $ | 2,055,061 | |
| |
Total Common Stocks
(identified cost $87,489,231) | | | $ | 53,968,346 | |
|
| Convertible Preferred Stocks — 0.1% | |
| Security | | | | | Shares | | | Value | |
|
| Containers and Glass Products — 0.1% | |
| | | |
LG Newco Holdco, Inc., Series A, 13.00%(5)(6) | | | | | | | 38,060 | | | $ | 4,538,607 | |
| | | |
Total Convertible Preferred Stocks
(identified cost $1,998,129) | | | | | | | | | | $ | 4,538,607 | |
|
| Corporate Bonds — 7.0% | |
| Security | | | | | Principal
Amount* (000’s omitted) | | | Value | |
|
| Aerospace and Defense — 0.1% | |
| | | |
Spirit AeroSystems, Inc., 5.50%, 1/15/25(1) | | | | | | | 3,000 | | | $ | 2,899,125 | |
| | | |
| TransDigm, Inc.: | | | | | | | | | |
| | | |
6.25%, 3/15/26(1) | | | | | | | 1,500 | | | | 1,482,202 | |
| | | |
8.00%, 12/15/25(1) | | | | | | | 1,500 | | | | 1,528,095 | |
| | | |
| | | | | | | | | | | $ | 5,909,422 | |
|
| Air Transport — 0.7% | |
| | | |
Air Canada, 3.875%, 8/15/26(1) | | | | | | | 6,850 | | | $ | 6,071,121 | |
| | | |
American Airlines, Inc./AAdvantage Loyalty IP, Ltd.: | | | | | | | | | | | | |
| | | |
5.50%, 4/20/26(1) | | | | | | | 17,175 | | | | 16,383,777 | |
| | | |
5.75%, 4/20/29(1) | | | | | | | 12,875 | | | | 11,739,232 | |
| | | |
Delta Air Lines, Inc., 7.00%, 5/1/25(1) | | | | | | | 4,650 | | | | 4,715,956 | |
| | | |
Delta Air Lines, Inc./SkyMiles IP, Ltd., 4.75%, 10/20/28(1) | | | | | | | 6,425 | | | | 5,981,367 | |
| | | |
| United Airlines, Inc.: | | | | | | | | | |
| | | |
4.375%, 4/15/26(1) | | | | | | | 4,625 | | | | 4,229,645 | |
| | | |
4.625%, 4/15/29(1) | | | | | | | 4,625 | | | | 3,963,741 | |
| | | |
| | | | | | | | | | | $ | 53,084,839 | |
|
| Automotive — 0.2% | |
| | | |
Clarios Global, L.P., 6.75%, 5/15/25(1) | | | | | | | 1,890 | | | $ | 1,894,007 | |
| | | | |
| | 26 | | See Notes to Financial Statements. |
Eaton Vance
Floating Rate Portfolio
October 31, 2022
Portfolio of Investments — continued
| | | | | | | | | | | | |
| Security | | | | | Principal
Amount* (000’s omitted) | | | Value | |
|
| Automotive (continued) | |
| | | |
Clarios Global, L.P./Clarios U.S. Finance Co., 6.25%, 5/15/26(1) | | | | | | | 3,893 | | | $ | 3,775,665 | |
| | | |
| Tenneco, Inc.: | | | | | | | | | |
| | | |
5.125%, 4/15/29(1) | | | | | | | 9,050 | | | | 8,988,485 | |
| | | |
7.875%, 1/15/29(1) | | | | | | | 450 | | | | 446,573 | |
| | | |
| | | | | | | | | | | $ | 15,104,730 | |
|
| Building and Development — 0.0%(7) | |
| | | |
Cushman & Wakefield U.S. Borrower, LLC, 6.75%, 5/15/28(1) | | | | | | | 3,150 | | | $ | 3,002,785 | |
| | | |
Winnebago Industries, Inc., 6.25%, 7/15/28(1) | | | | | | | 900 | | | | 838,735 | |
| | | |
| | | | | | | | | | | $ | 3,841,520 | |
|
| Business Equipment and Services — 0.7% | |
| | | |
Allied Universal Holdco, LLC/Allied Universal Finance Corp., 6.625%, 7/15/26(1) | | | | | | | 2,075 | | | $ | 1,985,557 | |
| | | |
Allied Universal Holdco, LLC/Allied Universal Finance Corp./Atlas Luxco 4 S.a.r.l.: | | | | | | | | | | | | |
| | | |
4.625%, 6/1/28(1) | | | | | | | 17,475 | | | | 14,329,150 | |
| | | |
4.625%, 6/1/28(1) | | | | | | | 24,975 | | | | 20,941,648 | |
| | | |
Prime Security Services Borrower, LLC/Prime Finance, Inc.: | | | | | | | | | | | | |
| | | |
5.25%, 4/15/24(1) | | | | | | | 7,900 | | | | 7,876,379 | |
| | | |
5.75%, 4/15/26(1) | | | | | | | 15,225 | | | | 14,846,954 | |
| | | |
| | | | | | | | | | | $ | 59,979,688 | |
|
| Cable and Satellite Television — 0.6% | |
| | | |
| Altice France S.A.: | | | | | | | | | |
| | | |
5.125%, 1/15/29(1) | | | | | | | 1,300 | | | $ | 980,129 | |
| | | |
5.125%, 7/15/29(1) | | | | | | | 57,625 | | | | 43,506,875 | |
| | | |
5.50%, 10/15/29(1) | | | | | | | 6,455 | | | | 4,934,363 | |
| | | |
| | | | | | | | | | | $ | 49,421,367 | |
|
| Chemicals — 0.1% | |
| | | |
Cheever Escrow Issuer, LLC, 7.125%, 10/1/27(1) | | | | | | | 925 | | | $ | 850,440 | |
| | | |
INEOS Finance PLC, 3.375%, 3/31/26(1) | | | EUR | | | | 1,250 | | | | 1,112,895 | |
| | | |
INEOS Quattro Finance 2 PLC, 3.375%, 1/15/26(1) | | | | | | | 3,050 | | | | 2,584,494 | |
| | | |
Olympus Water US Holding Corp., 4.25%, 10/1/28(1) | | | | | | | 9,350 | | | | 7,614,108 | |
| | | |
| | | | | | | | | | | $ | 12,161,937 | |
|
| Commercial Services — 0.1% | |
| | | |
WASH Multifamily Acquisition, Inc., 5.75%, 4/15/26(1) | | | | | | | 8,225 | | | $ | 7,682,304 | |
| | | |
| | | | | | | | | | | $ | 7,682,304 | |
| | | | | | | | | | | | |
| Security | | | | | Principal
Amount* (000’s omitted) | | | Value | |
|
| Communications Equipment — 0.1% | |
| | | |
CommScope, Inc., 4.75%, 9/1/29(1) | | | | | | | 6,650 | | | $ | 5,633,343 | |
| | | |
| | | | | | | | | | | $ | 5,633,343 | |
|
| Containers & Packaging — 0.2% | |
| | | |
Clydesdale Acquisition Holdings, Inc., 6.625%, 4/15/29(1) | | | | | | | 2,300 | | | $ | 2,186,714 | |
| | | |
Pactiv Evergreen Group Issuer, Inc./Pactiv Evergreen Group Issuer, LLC: | | | | | | | | | | | | |
| | |
4.00%, 10/15/27(1) | | | | 5,150 | | | | 4,571,140 | |
| | | |
4.375%, 10/15/28(1) | | | | | | | 9,125 | | | | 7,997,013 | |
| | | |
| | | | | | | | | | | $ | 14,754,867 | |
|
| Diversified Financial Services — 0.2% | |
| | |
AG Issuer, LLC, 6.25%, 3/1/28(1) | | | | 8,075 | | | $ | 7,525,312 | |
| | |
AG TTMT Escrow Issuer, LLC, 8.625%, 9/30/27(1) | | | | 2,925 | | | | 2,939,888 | |
| | | |
NFP Corp., 7.50%, 10/1/30(1) | | | | | | | 2,925 | | | | 2,789,011 | |
| | | |
| | | | | | | | | | | $ | 13,254,211 | |
|
| Diversified Telecommunication Services — 0.1% | |
| | |
Virgin Media Secured Finance PLC, 4.50%, 8/15/30(1) | | | | 6,500 | | | $ | 5,386,675 | |
| | | |
Zayo Group Holdings, Inc., 4.00%, 3/1/27(1) | | | | | | | 4,000 | | | | 3,097,340 | |
| | | |
| | | | | | | | | | | $ | 8,484,015 | |
|
| Drugs — 0.1% | |
| | | |
Jazz Securities DAC, 4.375%, 1/15/29(1) | | | | | | | 9,150 | | | $ | 8,143,683 | |
| | | |
| | | | | | | | | | | $ | 8,143,683 | |
|
| Ecological Services and Equipment — 0.1% | |
| | | |
GFL Environmental, Inc., 4.25%, 6/1/25(1) | | | | | | | 5,300 | | | $ | 5,067,489 | |
| | | |
| | | | | | | | | | | $ | 5,067,489 | |
|
| Electronics/Electrical — 0.3% | |
| | |
GoTo Group, Inc., 5.50%, 9/1/27(1) | | | | 10,760 | | | $ | 6,267,915 | |
| | | |
Imola Merger Corp., 4.75%, 5/15/29(1) | | | | | | | 18,175 | | | | 15,702,200 | |
| | | |
| | | | | | | | | | | $ | 21,970,115 | |
|
| Entertainment — 0.1% | |
| | |
AMC Entertainment Holdings, Inc., 7.50%, 2/15/29(1) | | | | 8,700 | | | $ | 5,992,299 | |
| | |
Live Nation Entertainment, Inc., 3.75%, 1/15/28(1) | | | | 2,075 | | | | 1,810,974 | |
| | | |
Six Flags Theme Parks, Inc., 7.00%, 7/1/25(1) | | | | | | | 1,070 | | | | 1,081,984 | |
| | | |
| | | | | | | | | | | $ | 8,885,257 | |
|
| Health Care — 0.5% | |
| | |
Medline Borrower, L.P., 3.875%, 4/1/29(1) | | | | 22,800 | | | $ | 18,665,220 | |
| | | | |
| | 27 | | See Notes to Financial Statements. |
Eaton Vance
Floating Rate Portfolio
October 31, 2022
Portfolio of Investments — continued
| | | | | | | | | | | | |
| Security | | | | | Principal
Amount* (000’s omitted) | | | Value | |
|
| Health Care (continued) | |
| | | |
RP Escrow Issuer, LLC, 5.25%, 12/15/25(1) | | | | | | | 2,150 | | | $ | 1,612,972 | |
| | | |
Tenet Healthcare Corp., 4.25%, 6/1/29(1) | | | | | | | 22,950 | | | | 19,370,374 | |
| | | |
| | | | | | | | | | | $ | 39,648,566 | |
|
| Hotels, Restaurants & Leisure — 0.4% | |
| | | |
Carnival Corporation, 4.00%, 8/1/28(1) | | | | | | | 34,575 | | | $ | 27,919,312 | |
| | | |
SeaWorld Parks & Entertainment, Inc., 8.75%, 5/1/25(1) | | | | | | | 2,125 | | | | 2,179,475 | |
| | | |
| | | | | | | | | | | $ | 30,098,787 | |
|
| Household Products — 0.0%(7) | |
| | | |
Kronos Acquisition Holdings, Inc./KIK Custom | | | | | | | | | | | | |
| | | |
Products, Inc., 5.00%, 12/31/26(1) | | | | | | | 1,075 | | | $ | 975,933 | |
| | | |
| | | | | | | | | | | $ | 975,933 | |
|
| Insurance — 0.0%(7) | |
| | | |
Alliant Holdings Intermediate LLC/Alliant Holdings | | | | | | | | | | | | |
| | | |
Co., 4.25%, 10/15/27(1) | | | | | | | 700 | | | $ | 631,792 | |
| | | |
| | | | | | | | | | | $ | 631,792 | |
|
| Internet Software & Services — 0.2% | |
| | | |
Arches Buyer, Inc., 4.25%, 6/1/28(1) | | | | | | | 6,900 | | | $ | 5,676,492 | |
| | | |
Central Parent, Inc./CDK Global, Inc., 7.25%, 6/15/29(1) | | | | | | | 13,700 | | | | 13,125,422 | |
| | | |
| | | | | | | | | | | $ | 18,801,914 | |
|
| IT Services — 0.0%(7) | |
| | | |
Rackspace Technology Global, Inc., 3.50%, 2/15/28(1) | | | | | | | 6,185 | | | $ | 4,095,299 | |
| | | |
| | | | | | | | | | | $ | 4,095,299 | |
|
| Leisure Goods/Activities/Movies — 0.3% | |
| | | |
Lindblad Expeditions, LLC, 6.75%, 2/15/27(1) | | | | | | | 3,300 | | | $ | 2,940,503 | |
| | | |
NCL Corp., Ltd., 5.875%, 2/15/27(1) | | | | | | | 22,000 | | | | 19,670,090 | |
| | | |
| | | | | | | | | | | $ | 22,610,593 | |
|
| Machinery — 0.2% | |
| | | |
Madison IAQ, LLC, 4.125%, 6/30/28(1) | | | | | | | 13,400 | | | $ | 11,118,918 | |
| | | |
TK Elevator U.S. Newco, Inc., 5.25%, 7/15/27(1) | | | | | | | 4,150 | | | | 3,730,933 | |
| | | |
| | | | | | | | | | | $ | 14,849,851 | |
|
| Media — 0.4% | |
| | | |
Diamond Sports Group, LLC/Diamond Sports Finance Co., 5.375%, 8/15/26(1) | | | | | | | 6,753 | | | $ | 1,358,940 | |
| | | |
| iHeartCommunications, Inc.: | | | | | | | | | |
| | | |
4.75%, 1/15/28(1) | | | | | | | 2,550 | | | | 2,228,662 | |
| | | | | | | | | | | | |
| Security | | | | | Principal
Amount* (000’s omitted) | | | Value | |
|
| Media (continued) | |
| | | |
| iHeartCommunications, Inc.: (continued) | | | | | | | | | |
| | | |
5.25%, 8/15/27(1) | | | | | | | 2,125 | | | $ | 1,939,700 | |
| | | |
6.375%, 5/1/26 | | | | | | | 2,896 | | | | 2,766,068 | |
| | | |
8.375%, 5/1/27 | | | | | | | 5,248 | | | | 4,723,690 | |
| | | |
Univision Communications, Inc.: | | | | | | | | | | | | |
| | | |
4.50%, 5/1/29(1) | | | | | | | 9,125 | | | | 7,703,325 | |
| | | |
7.375%, 6/30/30(1) | | | | | | | 11,300 | | | | 10,946,366 | |
| | | |
| | | | | | | | | | | $ | 31,666,751 | |
|
| Oil, Gas & Consumable Fuels — 0.1% | |
| | | |
CITGO Petroleum Corporation: | | | | | | | | | | | | |
| | | |
6.375%, 6/15/26(1) | | | | | | | 1,750 | | | $ | 1,727,932 | |
| | | |
7.00%, 6/15/25(1) | | | | | | | 10,525 | | | | 10,376,387 | |
| | | |
| | | | | | | | | | | $ | 12,104,319 | |
|
| Pharmaceuticals — 0.1% | |
| | | |
Bausch Health Companies, Inc.: | | | | | | | | | | | | |
| | | |
4.875%, 6/1/28(1) | | | | | | | 8,675 | | | $ | 5,331,872 | |
| | | |
6.125%, 2/1/27(1) | | | | | | | 6,075 | | | | 4,004,461 | |
| | | |
| | | | | | | | | | | $ | 9,336,333 | |
|
| Professional Services — 0.0%(7) | |
| | | |
CoreLogic, Inc., 4.50%, 5/1/28(1) | | | | | | | 5,525 | | | $ | 3,727,648 | |
| | | |
| | | | | | | | | | | $ | 3,727,648 | |
|
| Real Estate Investment Trusts (REITs) — 0.1% | |
| | | |
Park Intermediate Holdings, LLC/PK Domestic Property, LLC/PK Finance Co-Issuer, 5.875%, 10/1/28(1) | | | | | | | 6,425 | | | $ | 5,844,951 | |
| | | |
| | | | | | | | | | | $ | 5,844,951 | |
|
| Retail — 0.2% | |
| | | |
Fertitta Entertainment, LLC/Fertitta Entertainment Finance Co., Inc., 4.625%, 1/15/29(1) | | | | | | | 15,580 | | | $ | 13,578,983 | |
| | | |
| | | | | | | | | | | $ | 13,578,983 | |
|
| Retailers (Except Food and Drug) — 0.0%(7) | |
| | | |
PetSmart, Inc./PetSmart Finance Corp., 4.75%, 2/15/28(1) | | | | | | | 1,300 | | | $ | 1,189,513 | |
| | | |
| | | | | | | | | | | $ | 1,189,513 | |
|
| Software — 0.2% | |
| | | |
Boxer Parent Co., Inc., 7.125%, 10/2/25(1) | | | | | | | 4,225 | | | $ | 4,160,780 | |
| | | |
| Sabre GLBL, Inc.: | | | | | | | | | |
| | | |
7.375%, 9/1/25(1) | | | | | | | 2,125 | | | | 1,999,668 | |
| | | | |
| | 28 | | See Notes to Financial Statements. |
Eaton Vance
Floating Rate Portfolio
October 31, 2022
Portfolio of Investments — continued
| | | | | | | | | | | | |
| Security | | | | | Principal
Amount* (000’s omitted) | | | Value | |
|
| Software (continued) | |
| | | |
| Sabre GLBL, Inc.: (continued) | | | | | | | | | |
| | | |
9.25%, 4/15/25(1) | | | | | | | 2,525 | | | $ | 2,451,106 | |
| | | |
Veritas US, Inc./Veritas Bermuda, Ltd., 7.50%, 9/1/25(1) | | | | | | | 10,350 | | | | 8,732,559 | |
| | | |
| | | | | | | | | | | $ | 17,344,113 | |
|
| Technology — 0.1% | |
| | | |
Clarivate Science Holdings Corp., 3.875%, 7/1/28(1) | | | | | | | 11,400 | | | $ | 9,803,709 | |
| | | |
| | | | | | | | | | | $ | 9,803,709 | |
|
| Telecommunications — 0.3% | |
| | | |
LCPR Senior Secured Financing DAC, 5.125%, 7/15/29(1) | | | | | | | 9,325 | | | $ | 7,878,972 | |
| | | |
Lumen Technologies, Inc., 4.00%, 2/15/27(1) | | | | | | | 11,277 | | | | 9,604,734 | |
| | | |
VMED O2 UK Financing I PLC, 4.25%, 1/31/31(1) | | | | | | | 8,550 | | | | 6,815,037 | |
| | | |
| | | | | | | | | | | $ | 24,298,743 | |
|
| Trading Companies & Distributors — 0.1% | |
| | | |
American Builders & Contractors Supply Co., Inc., 4.00%, 1/15/28(1) | | | | | | | 2,975 | | | $ | 2,630,927 | |
| | | |
SRS Distribution, Inc., 4.625%, 7/1/28(1) | | | | | | | 4,575 | | | | 4,027,235 | |
| | | |
| | | | | | | | | | | $ | 6,658,162 | |
|
| Utilities — 0.0%(7) | |
| | | |
Calpine Corp., 5.25%, 6/1/26(1) | | | | | | | 1,109 | | | $ | 1,054,137 | |
| | | |
| | | | | | | | | | | $ | 1,054,137 | |
|
| Wireless Telecommunication Services — 0.1% | |
| | | |
Digicel International Finance, Ltd./Digicel International Holdings, Ltd., 8.75%, 5/25/24(1) | | | | | | | 6,325 | | | $ | 5,411,955 | |
| | | |
| | | | | | | | | | | $ | 5,411,955 | |
| | | |
Total Corporate Bonds
(identified cost $665,096,030) | | | | | | | | | | $ | 567,110,839 | |
|
| Exchange-Traded Funds — 0.2% | |
| Security | | | | | Shares | | | Value | |
| | | |
SPDR Blackstone Senior Loan ETF | | | | | | | 426,000 | | | $ | 17,610,840 | |
| |
Total Exchange-Traded Funds
(identified cost $19,593,027) | | | $ | 17,610,840 | |
| | | | | | | | | | | | |
| Preferred Stocks — 0.1% | |
| Security | | | | | Shares | | | Value | |
|
| Financial Services — 0.0% | |
| | | |
DBI Investors, Inc., Series A-1(4)(5)(6) | | | | | | | 13,348 | | | $ | 0 | |
| | | |
| | | | | | | | | | | $ | 0 | |
|
| Nonferrous Metals/Minerals — 0.1% | |
| | | |
ACNR Holdings, Inc., 15.00% (PIK)(5)(6) | | | | | | | 17,394 | | | $ | 10,740,795 | |
| | | |
| | | | | | | | | | | $ | 10,740,795 | |
|
| Retailers (Except Food and Drug) — 0.0% | |
| | | |
David’s Bridal, LLC: | | | | | | | | | | | | |
| | | |
Series A 8.00% (PIK)(4)(5)(6) | | | | | | | 7,852 | | | $ | 0 | |
| | | |
Series B 10.00% (PIK)(4)(5)(6) | | | | | | | 31,998 | | | | 0 | |
| | | |
| | | | | | | | | | | $ | 0 | |
| |
Total Preferred Stocks
(identified cost $2,590,558) | | | $ | 10,740,795 | |
|
| Senior Floating-Rate Loans — 84.3%(8) | |
| Borrower/Description | | Principal Amount* (000’s omitted) | | | Value | |
|
| Aerospace and Defense — 1.9% | |
| | | |
Aernnova Aerospace S.A.U.: | | | | | | | | | | | | |
| | | |
Term Loan, 3.00%, (6 mo. EURIBOR + 3.00%), 2/26/27 | | | EUR | | | | 4,656 | | | $ | 3,938,040 | |
| | | |
Term Loan, 4.10%, (3 mo. EURIBOR + 3.00%), 2/22/27 | | | EUR | | | | 1,194 | | | | 1,009,754 | |
| | | |
AI Convoy (Luxembourg) S.a.r.l.: | | | | | | | | | | | | |
| | | |
Term Loan, 5.532%, (6 mo. EURIBOR + 3.50%), 1/18/27 | | | EUR | | | | 3,850 | | | | 3,538,428 | |
| | | |
Term Loan, 8.173%, (USD LIBOR + 3.50%), 1/18/27(9) | | | | | | | 3,003 | | | | 2,941,741 | |
| | | |
Dynasty Acquisition Co., Inc.: | | | | | | | | | | | | |
| | | |
Term Loan, 7.254%, (1 mo. USD LIBOR + 3.50%), 4/6/26 | | | | | | | 29,031 | | | | 27,346,879 | |
| | | |
Term Loan, 7.254%, (1 mo. USD LIBOR + 3.50%), 4/6/26 | | | | | | | 15,611 | | | | 14,705,201 | |
| | | |
IAP Worldwide Services, Inc., Term Loan - Second Lien, 10.174%, (3 mo. USD LIBOR + 6.50%), 7/18/23(4) | | | | | | | 6,770 | | | | 5,255,578 | |
| | | |
Spirit Aerosystems, Inc., Term Loan, 7.504%, (1 mo. USD LIBOR + 3.75%), 1/15/25 | | | | | | | 10,385 | | | | 10,310,943 | |
| | | |
| TransDigm, Inc.: | | | | | | | | | |
| | | |
Term Loan, 5.924%, (3 mo. USD LIBOR + 2.25%), 8/22/24 | | | | | | | 27,752 | | | | 27,343,269 | |
| | | |
Term Loan, 5.924%, (3 mo. USD LIBOR + 2.25%), 5/30/25 | | | | | | | 6,271 | | | | 6,140,590 | |
| | | | |
| | 29 | | See Notes to Financial Statements. |
Eaton Vance
Floating Rate Portfolio
October 31, 2022
Portfolio of Investments — continued
| | | | | | | | | | | | |
| Borrower/Description | | | | | Principal
Amount* (000’s omitted) | | | Value | |
|
| Aerospace and Defense (continued) | |
| | | |
| TransDigm, Inc.: (continued) | | | | | | | | | |
| | | |
Term Loan, 5.924%, (3 mo. USD LIBOR + 2.25%), 12/9/25 | | | | | | | 24,276 | | | $ | 23,739,174 | |
| | | |
WP CPP Holdings, LLC, Term Loan, 8.168%, (USD LIBOR + 3.75%), 4/30/25(9) | | | | | | | 27,375 | | | | 23,542,674 | |
| | | |
| | | | | | | | | | | $ | 149,812,271 | |
| | | |
| Airlines — 1.2% | | | | | | | | | |
| | | |
American Airlines, Inc.: | | | | | | | | | | | | |
| | | |
Term Loan, 5.346%, (1 mo. USD LIBOR + 1.75%), 6/27/25 | | | | | | | 6,083 | | | $ | 5,764,181 | |
| | | |
Term Loan, 8.993%, (3 mo. USD LIBOR + 4.75%), 4/20/28 | | | | | | | 27,625 | | | | 27,388,226 | |
| | | |
Mileage Plus Holdings, LLC, Term Loan, 8.777%, (3 mo. USD LIBOR + 5.25%), 6/21/27 | | | | | | | 15,603 | | | | 15,963,360 | |
| | | |
SkyMiles IP, Ltd., Term Loan, 7.993%, (3 mo. USD LIBOR + 3.75%), 10/20/27 | | | | | | | 31,975 | | | | 32,303,639 | |
| | | |
United Airlines, Inc., Term Loan, 8.108%, (3 mo. USD LIBOR + 3.75%), 4/21/28 | | | | | | | 17,604 | | | | 17,230,568 | |
| | | |
| | | | | | | | | | | $ | 98,649,974 | |
| | | |
| Apparel & Luxury Goods — 0.0%(7) | | | | | | | | | |
| | | |
Samsonite International S.A., Term Loan, 5.504%, (1 mo. USD LIBOR + 1.75%), 4/25/25 | | | | | | | 2,709 | | | $ | 2,593,470 | |
| | | |
| | | | | | | | | | | $ | 2,593,470 | |
| | | |
| Auto Components — 2.2% | | | | | | | | | |
| | | |
Adient US, LLC, Term Loan, 7.004%, (1 mo. USD LIBOR + 3.25%), 4/10/28 | | | | | | | 13,602 | | | $ | 13,177,042 | |
| | | |
American Axle and Manufacturing, Inc., Term Loan, 5.84%, (1 mo. USD LIBOR + 2.25%), 4/6/24 | | | | | | | 15,879 | | | | 15,704,072 | |
| | | |
Chassix, Inc., Term Loan, 8.272%, (USD LIBOR + 5.50%), 11/15/23(9) | | | | | | | 9,336 | | | | 8,562,114 | |
| | | |
Clarios Global, L.P.: | | | | | | | | | | | | |
| | | |
Term Loan, 4.383%, (1 mo. EURIBOR + 3.25%), 4/30/26 | | | EUR | | | | 24,804 | | | | 22,888,938 | |
| | | |
Term Loan, 7.004%, (1 mo. USD LIBOR + 3.25%), 4/30/26 | | | | | | | 6,152 | | | | 6,000,607 | |
| | | |
DexKo Global, Inc.: | | | | | | | | | | | | |
| | | |
Term Loan, 5.133%, (1 mo. EURIBOR + 4.00%), 10/4/28 | | | EUR | | | | 1,012 | | | | 882,832 | |
| | | |
Term Loan, 5.218%, (EURIBOR + 4.00%), 10/4/28(9) | | | EUR | | | | 6,291 | | | | 5,486,708 | |
| | | |
Term Loan, 5.578%, (3 mo. EURIBOR + 4.00%), 10/4/28 | | | EUR | | | | 3,272 | | | | 2,853,238 | |
| | | |
Term Loan, 7.476%, (USD LIBOR + 3.75%), 10/4/28(9) | | | | | | | 13,507 | | | | 12,270,386 | |
| | | | | | | | | | | | |
| Borrower/Description | | | | | Principal
Amount* (000’s omitted) | | | Value | |
| | | |
| Auto Components (continued) | | | | | | | | | |
| | | |
| Garrett LX I S.a.r.l.: | | | | | | | | | |
| | | |
Term Loan, 5.105%, (3 mo. EURIBOR + 3.50%), 4/30/28 | | | EUR | | | | 15,900 | | | $ | 14,731,097 | |
| | | |
Term Loan, 7.67%, (3 mo. USD LIBOR + 3.25%), 4/30/28 | | | | | | | 5,668 | | | | 5,526,056 | |
| | | |
LTI Holdings, Inc.: | | | | | | | | | | | | |
| | | |
Term Loan, 7.004%, (1 mo. USD LIBOR + 3.25%), 9/6/25 | | | | | | | 5,664 | | | | 5,298,672 | |
| | | |
Term Loan, 8.254%, (1 mo. USD LIBOR + 4.50%), 7/24/26 | | | | | | | 7,117 | | | | 6,689,864 | |
| | | |
Tenneco, Inc., Term Loan, 6.206%, (1 mo. USD LIBOR + 3.00%), 10/1/25 | | | | | | | 33,876 | | | | 33,774,725 | |
| | | |
TI Group Automotive Systems, LLC, Term Loan, 4.443%, (1 mo. EURIBOR + 3.25%), 12/16/26 | | | EUR | | | | 8,888 | | | | 8,147,007 | |
| | | |
Truck Hero, Inc., Term Loan, 7.254%, (1 mo. USD LIBOR + 3.50%), 1/31/28 | | | | | | | 15,351 | | | | 13,254,487 | |
| | | |
Wheel Pros, LLC, Term Loan, 8.825%, (3 mo. USD LIBOR + 4.50%), 5/11/28 | | | | | | | 1,837 | | | | 1,343,889 | |
| | | |
| | | | | | | | | | | $ | 176,591,734 | |
| | | |
| Automobiles — 0.7% | | | | | | | | | |
| | | |
Bombardier Recreational Products, Inc., Term Loan, 5.754%, (1 mo. USD LIBOR + 2.00%), 5/24/27 | | | | | | | 43,610 | | | $ | 42,001,500 | |
| | | |
MajorDrive Holdings IV, LLC, Term Loan, 7.125%, (3 mo. USD LIBOR + 4.00%), 6/1/28 | | | | | | | 15,524 | | | | 14,340,039 | |
| | | |
| | | | | | | | | | | $ | 56,341,539 | |
| | | |
| Beverages — 0.3% | | | | | | | | | |
| | | |
Arterra Wines Canada, Inc., Term Loan, 7.142%, (3 mo. USD LIBOR + 3.50%), 11/24/27 | | | | | | | 1,427 | | | $ | 1,306,199 | |
| | | |
City Brewing Company, LLC, Term Loan, 6.814%, (1 mo. USD LIBOR + 3.50%), 4/5/28 | | | | | | | 5,810 | | | | 4,016,356 | |
| | | |
Triton Water Holdings, Inc., Term Loan, 7.174%, (3 mo. USD LIBOR + 3.50%), 3/31/28 | | | | | | | 16,801 | | | | 15,041,802 | |
| | | |
| | | | | | | | | | | $ | 20,364,357 | |
| | | |
| Biotechnology — 0.5% | | | | | | | | | |
| | | |
Alkermes, Inc., Term Loan, 5.98%, (1 mo. USD LIBOR + 2.50%), 3/12/26 | | | | | | | 18,364 | | | $ | 17,675,288 | |
| | | |
Alltech, Inc., Term Loan, 7.754%, (1 mo. USD LIBOR + 4.00%), 10/13/28 | | | | | | | 7,518 | | | | 7,226,858 | |
| | | |
Grifols Worldwide Operations USA, Inc., Term Loan, 5.754%, (1 mo. USD LIBOR + 2.00%), 11/15/27 | | | | | | | 17,440 | | | | 16,771,627 | |
| | | |
| | | | | | | | | | | $ | 41,673,773 | |
| | | |
| Building Products — 0.9% | | | | | | | | | |
| | | |
ACProducts, Inc., Term Loan, 7.325%, (USD LIBOR + 4.25%), 5/17/28(9) | | | | | | | 18,763 | | | $ | 13,154,858 | |
| | | | |
| | 30 | | See Notes to Financial Statements. |
Eaton Vance
Floating Rate Portfolio
October 31, 2022
Portfolio of Investments — continued
| | | | | | | | | | | | |
| Borrower/Description | | | | | Principal Amount* (000’s omitted) | | | Value | |
| | | |
| Building Products (continued) | | | | | | | | | |
| | | |
Cornerstone Building Brands, Inc., Term Loan, 6.589%, (1 mo. USD LIBOR + 3.25%), 4/12/28 | | | | | | | 19,710 | | | $ | 16,624,496 | |
| | | |
CPG International, Inc., Term Loan, 6.269%, (SOFR + 2.50%), 4/28/29 | | | | | | | 13,775 | | | | 13,359,601 | |
| | | |
LHS Borrower, LLC, Term Loan, 8.579%, (SOFR + 4.75%), 2/16/29 | | | | | | | 13,044 | | | | 10,359,005 | |
| | | |
MI Windows and Doors, LLC, Term Loan, 7.329%, (SOFR + 3.50%), 12/18/27 | | | | | | | 6,611 | | | | 6,450,259 | |
| | | |
Standard Industries, Inc., Term Loan, 6.675%, (6 mo. USD LIBOR + 2.50%), 9/22/28 | | | | | | | 15,487 | | | | 15,198,955 | |
| | | |
| | | | | | | | | | | $ | 75,147,174 | |
|
| Capital Markets — 3.5% | |
| | | |
Advisor Group, Inc., Term Loan, 8.254%, (1 mo. USD LIBOR + 4.50%), 7/31/26 | | | | | | | 36,937 | | | $ | 35,574,908 | |
| | | |
AllSpring Buyer, LLC, Term Loan, 6.688%, (3 mo. USD LIBOR + 3.00%), 11/1/28 | | | | | | | 6,283 | | | | 6,212,261 | |
| | | |
Aretec Group, Inc., Term Loan, 8.079%, (SOFR + 4.25%), 10/1/25 | | | | | | | 18,467 | | | | 17,970,686 | |
| | | |
Axalta Coating Systems US Holdings, Inc., Term Loan, 5.424%, (3 mo. USD LIBOR + 1.75%), 6/1/24 | | | | | | | 20,974 | | | | 20,773,404 | |
| | | |
CeramTec AcquiCo GmbH, Term Loan, 4.332%, (3 mo. EURIBOR + 3.75%), 3/16/29 | | | EUR | | | | 12,779 | | | | 11,708,004 | |
| | | |
Clipper Acquisitions Corp., Term Loan, 4.924%, (1 mo. USD LIBOR + 1.75%), 3/3/28 | | | | | | | 11,211 | | | | 11,001,071 | |
| | | |
Edelman Financial Center, LLC, Term Loan, 7.254%, (1 mo. USD LIBOR + 3.50%), 4/7/28 | | | | | | | 29,001 | | | | 27,102,658 | |
| | | |
EIG Management Company, LLC, Term Loan, 7.504%, (1 mo. USD LIBOR + 3.75%), 2/22/25 | | | | | | | 2,889 | | | | 2,809,431 | |
| | | |
FinCo I, LLC, Term Loan, 6.254%, (1 mo. USD LIBOR + 2.50%), 6/27/25 | | | | | | | 18,666 | | | | 18,628,534 | |
| | | |
| Focus Financial Partners, LLC: | | | | | | | | | |
| | | |
Term Loan, 5.754%, (1 mo. USD LIBOR + 2.00%), 7/3/24 | | | | | | | 12,976 | | | | 12,812,528 | |
| | | |
Term Loan, 6.254%, (1 mo. USD LIBOR + 2.50%), 6/30/28 | | | | | | | 9,978 | | | | 9,775,755 | |
| | | |
Franklin Square Holdings, L.P., Term Loan, 6.063%, (1 mo. USD LIBOR + 2.25%), 8/1/25 | | | | | | | 6,264 | | | | 6,170,013 | |
| | | |
Guggenheim Partners, LLC, Term Loan, 6.504%, (1 mo. USD LIBOR + 2.75%), 7/21/23 | | | | | | | 19,376 | | | | 19,278,743 | |
| | | |
HighTower Holdings, LLC, Term Loan, 8.278%, (3 mo. USD LIBOR + 4.00%), 4/21/28 | | | | | | | 9,199 | | | | 8,577,641 | |
| | | |
Hudson River Trading, LLC, Term Loan, 6.164%, (SOFR + 3.00%), 3/20/28 | | | | | | | 25,834 | | | | 23,803,466 | |
| | | |
LPL Holdings, Inc., Term Loan, 4.878%, (1 mo. USD LIBOR + 1.75%), 11/12/26 | | | | | | | 15,949 | | | | 15,769,574 | |
| | | |
Mariner Wealth Advisors, LLC, Term Loan, 7.065%, (SOFR + 3.25%), 8/18/28 | | | | | | | 13,584 | | | | 13,091,240 | |
| | | | | | | | | | | | |
| Borrower/Description | | | | | Principal
Amount* (000’s omitted) | | | Value | |
|
| Capital Markets (continued) | |
| | | |
Victory Capital Holdings, Inc.: | | | | | | | | | | | | |
| | | |
Term Loan, 5.962%, (SOFR + 2.25%), 7/1/26 | | | | | | | 13,543 | | | $ | 13,285,020 | |
| | | |
Term Loan, 5.962%, (SOFR + 2.25%), 12/29/28 | | | | | | | 6,979 | | | | 6,832,637 | |
| | | |
| | | | | | | | | | | $ | 281,177,574 | |
|
| Chemicals — 3.3% | |
| | | |
Aruba Investments, Inc.: | | | | | | | | | | | | |
| | | |
Term Loan, 4.979%, (1 mo. EURIBOR + 4.00%), 11/24/27 | | | EUR | | | | 3,398 | | | $ | 3,089,654 | |
| | | |
Term Loan, 7.576%, (1 mo. USD LIBOR + 4.00%), 11/24/27 | | | | | | | 5,048 | | | | 4,758,099 | |
| | | |
Caldic B.V., Term Loan, 5.105%, (3 mo. EURIBOR + 3.50%), 2/3/29 | | | EUR | | | | 6,000 | | | | 5,418,079 | |
| | | |
Chemours Company (The), Term Loan, 3.20%, (3 mo. EURIBOR + 2.00%), 4/3/25 | | | EUR | | | | 2,790 | | | | 2,619,195 | |
| | | |
Colouroz Investment 1 GmbH: | | | | | | | | | | | | |
| | | |
Term Loan, 5.752%, (EURIBOR + 4.25%), 9/21/23(9) | | | EUR | | | | 2,514 | | | | 1,913,365 | |
| | | |
Term Loan, 5.751%, (3 mo. EURIBOR + 4.25%), 9/21/23 | | | EUR | | | | 27 | | | | 20,701 | |
| | | |
CPC Acquisition Corp., Term Loan, 7.424%, (3 mo. USD LIBOR + 3.75%), 12/29/27 | | | | | | | 16,671 | | | | 13,336,900 | |
| | | |
Flint Group GmbH: | | | | | | | | | | | | |
| | | |
Term Loan, 5.751%, (3 mo. EURIBOR + 4.25%), 9/21/23 | | | EUR | | | | 276 | | | | 209,996 | |
| | | |
Term Loan, 5.751%, (3 mo. EURIBOR + 4.25%), 9/21/23 | | | EUR | | | | 32 | | | | 24,257 | |
| | | |
Term Loan, 5.751%, (3 mo. EURIBOR + 4.25%), 9/21/23 | | | EUR | | | | 73 | | | | 55,234 | |
| | | |
Term Loan, 5.751%, (3 mo. EURIBOR + 4.25%), 9/21/23 | | | EUR | | | | 144 | | | | 109,443 | |
| | | |
Term Loan, 7.009%, (3 mo. USD LIBOR + 4.25%), 9/21/23 | | | | | | | 1,387 | | | | 1,048,547 | |
| | | |
Flint Group US LLC, Term Loan, 9.32%, (3 mo. USD LIBOR + 5.00%), 8.57% cash, 0.75% PIK, 9/21/23 | | | | | | | 8,387 | | | | 6,342,859 | |
| | | |
Gemini HDPE, LLC, Term Loan, 7.358%, (3 mo. USD LIBOR + 3.00%), 12/31/27 | | | | | | | 4,910 | | | | 4,733,803 | |
| | | |
GEON Performance Solutions, LLC, Term Loan, 8.174%, (1 mo. USD LIBOR + 4.50%), 8/18/28 | | | | | | | 5,718 | | | | 5,555,971 | |
| | | |
Groupe Solmax, Inc., Term Loan, 8.392%, (3 mo. USD LIBOR + 4.75%), 5/29/28 | | | | | | | 15,503 | | | | 13,565,154 | |
| | | |
INEOS Enterprises Holdings II Limited, Term Loan, 3.25%, (3 mo. EURIBOR + 3.25%), 8/31/26 | | | EUR | | | | 1,975 | | | | 1,789,144 | |
| | | |
INEOS Enterprises Holdings US Finco, LLC, Term Loan, 6.57%, (3 mo. USD LIBOR + 3.50%), 8/28/26 | | | | | | | 5,040 | | | | 4,586,006 | |
| | | |
| INEOS Finance PLC: | | | | | | | | | |
| | | |
Term Loan, 3.133%, (1 mo. EURIBOR + 2.00%), 4/1/24 | | | EUR | | | | 6,225 | | | | 6,048,410 | |
| | | | |
| | 31 | | See Notes to Financial Statements. |
Eaton Vance
Floating Rate Portfolio
October 31, 2022
Portfolio of Investments — continued
| | | | | | | | | | |
| Borrower/Description | | | | Principal Amount* (000’s omitted) | | | Value | |
|
| Chemicals (continued) | |
| | | |
| INEOS Finance PLC: (continued) | | | | | | | | |
| | | |
Term Loan, 3.883%, (1 mo. EURIBOR + 2.75%), 11/8/28 | | EUR | | | 8,900 | | | $ | 7,981,846 | |
| | | |
INEOS Quattro Holdings UK Ltd., Term Loan, 3.883%, (1 mo. EURIBOR + 2.75%), 1/29/26 | | EUR | | | 24,900 | | | | 22,249,215 | |
| | | |
INEOS Styrolution US Holding, LLC, Term Loan, 6.504%, (1 mo. USD LIBOR + 2.75%), 1/29/26 | | | | | 15,882 | | | | 14,991,886 | |
| | | |
INEOS US Finance, LLC, Term Loan, 6.254%, (1 mo. USD LIBOR + 2.50%), 11/8/28 | | | | | 6,214 | | | | 5,800,091 | |
| | | |
Kraton Corporation, Term Loan, 6.718%, (SOFR + 3.25%), 3/15/29 | | | | | 5,672 | | | | 5,494,266 | |
| | | |
Kraton Polymers Holdings B.V., Term Loan, 4.25%, (3 mo. EURIBOR + 3.25%), 3/15/29 | | EUR | | | 4,250 | | | | 3,874,557 | |
| | | |
| Lonza Group AG: | | | | | | | | |
| | | |
Term Loan, 5.193%, (3 mo. EURIBOR + 4.00%), 7/3/28 | | EUR | | | 7,125 | | | | 6,341,552 | |
| | | |
Term Loan, 5.193%, (3 mo. EURIBOR + 4.00%), 7/3/28 | | EUR | | | 8,475 | | | | 7,543,109 | |
| | | |
Term Loan, 7.674%, (3 mo. USD LIBOR + 4.00%), 7/3/28 | | | | | 21,910 | | | | 19,368,184 | |
| | | |
| LSF11 Skyscraper Holdco S.a.r.l.: | | | | | | | | |
| | | |
Term Loan, 4.693%, (3 mo. EURIBOR + 3.50%), 9/29/27 | | EUR | | | 11,350 | | | | 10,742,731 | |
| | | |
Term Loan, 7.174%, (3 mo. USD LIBOR + 3.50%), 9/29/27 | | | | | 4,778 | | | | 4,610,484 | |
| | | |
| Messer Industries GmbH: | | | | | | | | |
| | | |
Term Loan, 3.693%, (2 mo. EURIBOR + 2.50%), 3/2/26 | | EUR | | | 2,061 | | | | 1,947,997 | |
| | | |
Term Loan, 6.174%, (3 mo. USD LIBOR + 2.50%), 3/2/26 | | | | | 9,579 | | | | 9,430,253 | |
| | | |
| Olympus Water US Holding Corporation: | | | | | | | | |
| | | |
Term Loan, 7.438%, (3 mo. USD LIBOR + 3.75%), 11/9/28 | | | | | 4,987 | | | | 4,554,484 | |
| | | |
Term Loan, 8.153%, (SOFR + 4.50%), 11/9/28 | | | | | 5,398 | | | | 4,968,744 | |
| | | |
| Orion Engineered Carbons GmbH: | | | | | | | | |
| | | |
Term Loan, 3.693%, (3 mo. EURIBOR + 2.50%), 9/24/28 | | EUR | | | 1,250 | | | | 1,187,444 | |
| | | |
Term Loan, 5.924%, (3 mo. USD LIBOR + 2.25%), 9/24/28 | | | | | 4,480 | | | | 4,344,426 | |
| | | |
PQ Corporation, Term Loan, 6.915%, (3 mo. USD LIBOR + 2.50%), 6/9/28 | | | | | 8,757 | | | | 8,472,059 | |
| | | |
| Rohm Holding GmbH: | | | | | | | | |
| | | |
Term Loan, 4.881%, (6 mo. EURIBOR + 4.25%), 7/31/26 | | EUR | | | 2,150 | | | | 1,685,624 | |
| | | |
Term Loan, 8.121%, (3 mo. USD LIBOR + 4.75%), 7/31/26 | | | | | 16,003 | | | | 12,202,606 | |
| | | |
Spectrum Holdings III Corp., Term Loan, 7.004%, (1 mo. USD LIBOR + 3.25%), 1/31/25 | | | | | 5,530 | | | | 5,070,731 | |
| | | | | | | | | | | | |
| Borrower/Description | | | | | Principal
Amount* (000’s omitted) | | | Value | |
|
| Chemicals (continued) | |
| | | |
Starfruit Finco B.V., Term Loan, 7.165%, (3 mo. USD LIBOR + 2.75%), 10/1/25 | | | | | | | 3,602 | | | $ | 3,409,551 | |
| | | |
Trinseo Materials Operating S.C.A., Term Loan, 6.254%, (1 mo. USD LIBOR + 2.50%), 5/3/28 | | | | | | | 6,853 | | | | 5,969,951 | |
| | | |
| Tronox Finance, LLC: | | | | | | | | | |
| | | |
Term Loan, 5.938%, (USD LIBOR + 2.25%), 3/10/28(9) | | | | | | | 11,570 | | | | 10,940,772 | |
| | | |
Term Loan, 6.803%, (SOFR + 3.25%), 4/4/29 | | | | | | | 3,657 | | | | 3,510,360 | |
| | | |
W.R. Grace & Co.-Conn., Term Loan, 7.438%, (3 mo. USD LIBOR + 3.75%), 9/22/28 | | | | | | | 9,478 | | | | 9,135,627 | |
| | | |
| | | | | | | | | | | $ | 271,053,367 | |
|
| Commercial Services & Supplies — 1.7% | |
| | | |
Allied Universal Holdco, LLC, Term Loan, 4.883%, (1 mo. EURIBOR + 3.75%), 5/12/28 | | | EUR | | | | 8,508 | | | $ | 7,404,632 | |
| | | |
Asplundh Tree Expert, LLC, Term Loan, 5.504%, (1 mo. USD LIBOR + 1.75%), 9/7/27 | | | | | | | 8,281 | | | | 8,162,607 | |
| | | |
Belfor Holdings, Inc., Term Loan, 7.754%, (1 mo. USD LIBOR + 4.00%), 4/6/26 | | | | | | | 2,614 | | | | 2,589,932 | |
| | | |
Clean Harbors, Inc., Term Loan, 5.754%, (1 mo. USD LIBOR + 2.00%), 10/8/28 | | | | | | | 4,151 | | | | 4,136,566 | |
| | | |
| Covanta Holding Corporation: | | | | | | | | | |
| | | |
Term Loan, 6.229%, (1 mo. USD LIBOR + 2.50%), 11/30/28 | | | | | | | 1,828 | | | | 1,807,615 | |
| | | |
Term Loan, 6.229%, (1 mo. USD LIBOR + 2.50%), 11/30/28 | | | | | | | 138 | | | | 136,082 | |
| | | |
EnergySolutions, LLC, Term Loan, 7.424%, (3 mo. USD LIBOR + 3.75%), 5/9/25 | | | | | | | 17,191 | | | | 15,987,245 | |
| | | |
Garda World Security Corporation, Term Loan, 7.24%, (3 mo. USD LIBOR + 4.25%), 10/30/26 | | | | | | | 11,995 | | | | 11,465,343 | |
| | | |
GFL Environmental, Inc., Term Loan, 7.415%, (3 mo. USD LIBOR + 3.00%), 5/30/25 | | | | | | | 7,574 | | | | 7,547,159 | |
| | | |
Harsco Corporation, Term Loan, 6.063%, (1 mo. USD LIBOR + 2.25%), 3/10/28 | | | | | | | 3,407 | | | | 2,990,385 | |
| | | |
LABL, Inc., Term Loan, 8.754%, (1 mo. USD LIBOR + 5.00%), 10/29/28 | | | | | | | 8,660 | | | | 8,016,590 | |
| | | |
Monitronics International, Inc., Term Loan, 11.915%, (3 mo. USD LIBOR + 6.50%), 3/29/24 | | | | | | | 16,842 | | | | 11,143,936 | |
| | | |
PECF USS Intermediate Holding III Corporation, Term Loan, 8.004%, (1 mo. USD LIBOR + 4.25%), 12/15/28 | | | | | | | 9,916 | | | | 7,709,036 | |
| | | |
| Phoenix Services International, LLC: | | | | | | | | | |
| | | |
DIP Loan, 5.559%, (SOFR + 2.00%), 3/28/23 | | | | | | | 852 | | | | 852,152 | |
| | | |
Term Loan, 0.00%, 3/1/25(12) | | | | | | | 8,551 | | | | 1,913,339 | |
| | | |
Prime Security Services Borrower, LLC, Term Loan, 6.505%, (3 mo. USD LIBOR + 2.75%), 9/23/26 | | | | | | | 13,506 | | | | 13,328,306 | |
| | | |
SITEL Group, Term Loan, 4.883%, (1 mo. EURIBOR + 3.75%), 8/28/28 | | | EUR | | | | 6,425 | | | | 6,099,493 | |
| | | | |
| | 32 | | See Notes to Financial Statements. |
Eaton Vance
Floating Rate Portfolio
October 31, 2022
Portfolio of Investments — continued
| | | | | | | | | | | | |
| Borrower/Description | | | | | Principal
Amount* (000’s omitted) | | | Value | |
|
| Commercial Services & Supplies (continued) | |
| | | |
SITEL Worldwide Corporation, Term Loan, 7.51%, (1 mo. USD LIBOR + 3.75%), 8/28/28 | | | | | | | 17,108 | | | $ | 16,872,809 | |
| | | |
Tempo Acquisition, LLC, Term Loan, 6.729%, (SOFR + 3.00%), 8/31/28 | | | | | | | 2,487 | | | | 2,460,261 | |
| | | |
TruGreen Limited Partnership, Term Loan, 7.754%, (1 mo. USD LIBOR + 4.00%), 11/2/27 | | | | | | | 4,028 | | | | 3,741,237 | |
| | | |
Werner FinCo, L.P., Term Loan, 7.674%, (3 mo. USD LIBOR + 4.00%), 7/24/24 | | | | | | | 4,619 | | | | 4,203,202 | |
| | | |
| | | | | | | | | | | $ | 138,567,927 | |
|
| Communications Equipment — 0.3% | |
| | | |
CommScope, Inc., Term Loan, 7.004%, (1 mo. USD LIBOR + 3.25%), 4/6/26 | | | | | | | 15,296 | | | $ | 14,646,023 | |
| | | |
Digi International, Inc., Term Loan, 8.754%, (1 mo. USD LIBOR + 5.00%), 11/1/28 | | | | | | | 4,893 | | | | 4,813,348 | |
| | | |
Tiger Acquisition, LLC, Term Loan, 7.004%, (1 mo. USD LIBOR + 3.25%), 6/1/28 | | | | | | | 3,354 | | | | 3,140,957 | |
| | | |
| | | | | | | | | | | $ | 22,600,328 | |
|
| Construction Materials — 0.4% | |
| | | |
Oscar AcquisitionCo, LLC, Term Loan, 8.153%, (SOFR + 4.50%), 4/29/29 | | | | | | | 13,300 | | | $ | 12,083,050 | |
| | | |
Quikrete Holdings, Inc.: | | | | | | | | | | | | |
| | | |
Term Loan, 6.379%, (1 mo. USD LIBOR + 2.63%), 2/1/27 | | | | | | | 4,270 | | | | 4,159,524 | |
| | | |
Term Loan, 6.754%, (1 mo. USD LIBOR + 3.00%), 6/11/28 | | | | | | | 19,207 | | | | 18,760,606 | |
| | | |
| | | | | | | | | | | $ | 35,003,180 | |
|
| Containers & Packaging — 1.2% | |
| | | |
Berlin Packaging, LLC, Term Loan, 6.911%, (USD LIBOR + 3.75%), 3/11/28(9) | | | | | | | 5,431 | | | $ | 5,210,343 | |
| | | |
BWAY Holding Company, Term Loan, 6.378%, (1 mo. USD LIBOR + 3.25%), 4/3/24 | | | | | | | 10,996 | | | | 10,462,023 | |
| | | |
Clydesdale Acquisition Holdings, Inc., Term Loan, 8.004%, (SOFR + 4.18%), 4/13/29 | | | | | | | 8,803 | | | | 8,493,365 | |
| | | |
Kouti B.V., Term Loan, 3.757%, (3 mo. EURIBOR + 3.18%), 8/31/28 | | | EUR | | | | 29,250 | | | | 25,822,955 | |
| | | |
Pregis TopCo Corporation: | | | | | | | | | | | | |
| | | |
Term Loan, 7.754%, (1 mo. USD LIBOR + 4.00%), 7/31/26 | | | | | | | 1,361 | | | | 1,301,128 | |
| | | |
Term Loan, 7.843%, (1 mo. USD LIBOR + 4.00%), 7/31/26 | | | | | | | 1,985 | | | | 1,897,864 | |
| | | |
Pretium PKG Holdings, Inc.: | | | | | | | | | | | | |
| | | |
Term Loan, 7.60%, (USD LIBOR + 4.00%), 10/2/28(9) | | | | | | | 7,121 | | | | 6,260,713 | |
| | | |
Term Loan - Second Lien, 10.205%, (USD LIBOR + 6.75%), 10/1/29(9) | | | | | | | 6,675 | | | | 5,640,375 | |
| | | | | | | | | | | | |
| Borrower/Description | | | | | Principal
Amount* (000’s omitted) | | | Value | |
|
| Containers & Packaging (continued) | |
| | | |
Pro Mach Group, Inc., Term Loan, 7.754%, (1 mo. USD LIBOR + 4.00%), 8/31/28 | | | | | | | 2,827 | | | $ | 2,760,681 | |
| | | |
Proampac PG Borrower, LLC, Term Loan, 7.728%, (USD LIBOR + 3.75%), 11/3/25(9) | | | | | | | 22,806 | | | | 21,772,257 | |
| | | |
| Trident TPI Holdings, Inc.: | | | | | | | | | |
| | | |
Term Loan, 6.30%, (3 mo. USD LIBOR + 4.00%), 9/15/28(10) | | | | | | | 713 | | | | 678,276 | |
| | | |
Term Loan, 7.674%, (3 mo. USD LIBOR + 4.00%), 9/15/28 | | | | | | | 5,006 | | | | 4,761,159 | |
| | | |
| | | | | | | | | | | $ | 95,061,139 | |
|
| Distributors — 0.5% | |
| | | |
Autokiniton US Holdings, Inc., Term Loan, 7.80%, (1 mo. USD LIBOR + 4.50%), 4/6/28 | | | | | | | 20,788 | | | $ | 19,494,405 | |
| | | |
Phillips Feed Service, Inc., Term Loan, 10.48%, (1 mo. USD LIBOR + 7.00%), 11/13/24(4) | | | | | | | 475 | | | | 380,380 | |
| | | |
White Cap Buyer, LLC, Term Loan, 7.479%, (SOFR + 3.75%), 10/19/27 | | | | | | | 18,515 | | | | 17,579,512 | |
| | | |
| | | | | | | | | | | $ | 37,454,297 | |
|
| Diversified Consumer Services — 0.7% | |
| | | |
| Ascend Learning, LLC: | | | | | | | | | |
| | | |
Term Loan, 7.132%, (1 mo. USD LIBOR + 3.50%), 12/11/28 | | | | | | | 13,904 | | | $ | 12,803,189 | |
| | | |
Term Loan - Second Lien, 9.504%, (1 mo. USD LIBOR + 5.75%), 12/10/29 | | | | | | | 5,243 | | | | 4,469,931 | |
| | | |
Corporation Service Company, Term Loan, 8/31/29(11) | | | | | | | 5,100 | | | | 5,007,563 | |
| | | |
FrontDoor, Inc., Term Loan, 6.004%, (1 mo. USD LIBOR + 2.25%), 6/17/28 | | | | | | | 864 | | | | 837,421 | |
| | | |
| KUEHG Corp.: | | | | | | | | | |
| | | |
Term Loan, 7.504%, (1 mo. USD LIBOR + 3.75%), 2/21/25 | | | | | | | 28,637 | | | | 27,503,145 | |
| | | |
Term Loan - Second Lien, 12.004%, (1 mo. USD LIBOR + 8.25%), 8/22/25 | | | | | | | 4,425 | | | | 4,309,950 | |
| | | |
Sotheby’s, Term Loan, 8.579%, (3 mo. USD LIBOR + 4.50%), 1/15/27 | | | | | | | 4,025 | | | | 3,953,179 | |
| | | |
| | | | | | | | | | | $ | 58,884,378 | |
|
| Diversified Financial Services — 0.5% | |
| | | |
Concorde Midco Ltd., Term Loan, 5.16%, (3 mo. EURIBOR + 4.00%), 3/1/28 | | | EUR | | | | 8,730 | | | $ | 7,843,766 | |
| | | |
Sandy BidCo B.V., Term Loan, 6.038%, (6 mo. EURIBOR + 4.00%), 8/17/29 | | | EUR | | | | 19,258 | | | | 18,175,649 | |
| | | |
| Zephyr Bidco Limited: | | | | | | | | | |
| | | |
Term Loan, 4.693%, (1 mo. EURIBOR + 3.75%), 7/23/25 | | | EUR | | | | 4,975 | | | | 4,186,436 | |
| | | |
Term Loan, 6.934%, (SONIA + 4.75%), 7/23/25 | | | GBP | | | | 8,675 | | | | 7,784,690 | |
| | | |
| | | | | | | | | | | $ | 37,990,541 | |
| | | | |
| | 33 | | See Notes to Financial Statements. |
Eaton Vance
Floating Rate Portfolio
October 31, 2022
Portfolio of Investments — continued
| | | | | | | | | | |
| Borrower/Description | | | | Principal
Amount* (000’s omitted) | | | Value | |
|
| Diversified Telecommunication Services — 3.6% | |
| | | |
Altice France S.A.: | | | | | | | | | | |
| | | |
Term Loan, 6.905%, (3 mo. USD LIBOR + 4.00%), 8/14/26 | | | | | 7,265 | | | $ | 6,678,022 | |
| | | |
Term Loan, 7.767%, (3 mo. USD LIBOR + 3.69%), 1/31/26 | | | | | 4,403 | | | | 3,975,102 | |
| | | |
CenturyLink, Inc., Term Loan, 6.004%, (1 mo. USD LIBOR + 2.25%), 3/15/27 | | | | | 42,192 | | | | 39,440,939 | |
| | | |
GEE Holdings 2, LLC: | | | | | | | | | | |
| | | |
Term Loan, 11.604%, (3 mo. USD LIBOR + 8.00%), 3/24/25 | | | | | 9,639 | | | | 9,675,264 | |
| | | |
Term Loan - Second Lien, 11.854%, (3 mo. USD LIBOR + 8.25%), 5.104% cash, 6.75% PIK, 3/23/26 | | | | | 6,865 | | | | 5,263,294 | |
| | | |
LCPR Loan Financing, LLC, Term Loan, 7.162%, (1 mo. USD LIBOR + 3.75%), 10/16/28 | | | | | 1,650 | | | | 1,612,360 | |
| | | |
Level 3 Financing, Inc., Term Loan, 5.504%, (1 mo. USD LIBOR + 1.75%), 3/1/27 | | | | | 851 | | | | 810,050 | |
| | | |
Numericable Group S.A.: | | | | | | | | | | |
| | | |
Term Loan, 4.605%, (3 mo. EURIBOR + 3.00%), 7/31/25 | | EUR | | | 6,946 | | | | 6,340,630 | |
| | | |
Term Loan, 7.165%, (3 mo. USD LIBOR + 2.75%), 7/31/25 | | | | | 10,666 | | | | 9,717,957 | |
| | | |
Telenet Financing USD, LLC, Term Loan, 5.412%, (1 mo. USD LIBOR + 2.00%), 4/30/28 | | | | | 32,325 | | | | 31,378,330 | |
| | | |
Telenet International Finance S.a.r.l., Term Loan, 2.613%, (6 mo. EURIBOR + 2.25%), 4/30/29 | | EUR | | | 5,000 | | | | 4,654,656 | |
| | | |
UPC Broadband Holding B.V.: | | | | | | | | | | |
| | | |
Term Loan, 2.863%, (6 mo. EURIBOR + 2.50%), 4/30/29 | | EUR | | | 4,850 | | | | 4,487,457 | |
| | | |
Term Loan, 3.363%, (6 mo. EURIBOR + 3.00%), 1/31/29 | | EUR | | | 13,850 | | | | 12,925,905 | |
| | | |
Term Loan, 5.662%, (1 mo. USD LIBOR + 2.25%), 4/30/28 | | | | | 5,800 | | | | 5,667,081 | |
| | | |
UPC Financing Partnership, Term Loan, 6.337%, (1 mo. USD LIBOR + 2.93%), 1/31/29 | | | | | 28,800 | | | | 28,229,155 | |
| | | |
Virgin Media Bristol, LLC: | | | | | | | | | | |
| | | |
Term Loan, 5.912%, (1 mo. USD LIBOR + 2.50%), 1/31/28 | | | | | 38,775 | | | | 38,093,762 | |
| | | |
Term Loan, 6.662%, (1 mo. USD LIBOR + 3.25%), 1/31/29 | | | | | 500 | | | | 493,047 | |
| | | |
Virgin Media Ireland Limited, Term Loan, 3.863%, (6 mo. EURIBOR + 3.50%), 7/15/29 | | EUR | | | 8,500 | | | | 7,894,368 | |
| | | |
Virgin Media SFA Finance Limited: | | | | | | | | | | |
| | | |
Term Loan, 3.345%, (1 mo. EURIBOR + 2.50%), 1/31/29 | | EUR | | | 11,625 | | | | 10,727,296 | |
| | | |
Term Loan, 5.469%, (SONIA + 3.25%), 1/15/27 | | GBP | | | 8,175 | | | | 8,414,140 | |
| | | |
Term Loan, 5.469%, (SONIA + 3.25%), 11/15/27 | | GBP | | | 600 | | | | 618,842 | |
| | | |
Zayo Group Holdings, Inc., Term Loan, 4.383%, (1 mo. EURIBOR + 3.25%), 3/9/27 | | EUR | | | 4,141 | | | | 3,326,864 | |
| | | | | | | | | | | | |
| Borrower/Description | | | | | Principal
Amount* (000’s omitted) | | | Value | |
|
| Diversified Telecommunication Services (continued) | |
| | | |
Ziggo B.V., Term Loan, 3.764%, (6 mo. EURIBOR + 3.00%), 1/31/29 | | | EUR | | | | 28,150 | | | $ | 25,757,630 | |
| | | |
Ziggo Financing Partnership, Term Loan, 5.912%, (1 mo. USD LIBOR + 2.50%), 4/30/28 | | | | | | | 21,734 | | | | 21,202,388 | |
| | | |
| | | | | | | | | | | $ | 287,384,539 | |
|
| Electrical Equipment — 0.1% | |
| | | |
AZZ, Inc., Term Loan, 8.079%, (SOFR + 4.25%), 5/13/29 | | | | | | | 1,834 | | | $ | 1,820,101 | |
| | | |
Brookfield WEC Holdings, Inc., Term Loan, 6.504%, (1 mo. USD LIBOR + 2.75%), 8/1/25 | | | | | | | 1,537 | | | | 1,512,757 | |
| | | |
GrafTech Finance, Inc., Term Loan, 6.754%, (1 mo. USD LIBOR + 3.00%), 2/12/25 | | | | | | | 3,351 | | | | 3,196,095 | |
| | | |
II-VI Incorporated, Term Loan, 5.878%, (1 mo. USD LIBOR + 2.75%), 7/2/29 | | | | | | | 438 | | | | 425,906 | |
| | | |
| | | | | | | | | | | $ | 6,954,859 | |
|
| Electronic Equipment, Instruments & Components — 1.0% | |
| | | |
Chamberlain Group, Inc., Term Loan, 7.254%, (1 mo. USD LIBOR + 3.50%), 11/3/28 | | | | | | | 18,634 | | | $ | 16,999,820 | |
| | | |
Creation Technologies, Inc., Term Loan, 9.248%, (3 mo. USD LIBOR + 5.50%), 10/5/28 | | | | | | | 11,443 | | | | 9,497,275 | |
| | | |
Minimax Viking GmbH, Term Loan, 3.883%, (1 mo. EURIBOR + 2.75%), 7/31/25 | | | EUR | | | | 1,856 | | | | 1,782,308 | |
| | | |
Mirion Technologies, Inc., Term Loan, 5.627%, (6 mo. USD LIBOR + 2.75%), 10/20/28 | | | | | | | 7,292 | | | | 7,123,751 | |
| | | |
Robertshaw US Holding Corp., Term Loan, 7.313%, (1 mo. USD LIBOR + 3.50%), 2/28/25 | | | | | | | 16,985 | | | | 13,885,096 | |
| | | |
Verifone Systems, Inc., Term Loan, 6.997%, (3 mo. USD LIBOR + 4.00%), 8/20/25 | | | | | | | 13,766 | | | | 12,298,735 | |
| | | |
Verisure Holding AB: | | | | | | | | | | | | |
| | | |
Term Loan, 3.473%, (6 mo. EURIBOR + 3.25%), 3/27/28 | | | EUR | | | | 15,450 | | | | 14,342,808 | |
| | | |
Term Loan, 3.753%, (6 mo. EURIBOR + 3.25%), 7/20/26 | | | EUR | | | | 4,475 | | | | 4,176,973 | |
| | | |
| | | | | | | | | | | $ | 80,106,766 | |
|
| Energy Equipment & Services — 0.3% | |
| | | |
Ameriforge Group, Inc.: | | | | | | | | | | | | |
| | | |
Term Loan, 15.029%, (1 mo. USD LIBOR + 13.00%), 12/29/23(10) | | | | | | | 3,086 | | | $ | 1,531,602 | |
| | | |
Term Loan, 16.67%, (3 mo. USD LIBOR + 8.00%), 11.67% cash, 5.00% PIK, 12/31/23 | | | | | | | 24,185 | | | | 12,002,041 | |
| | | |
Lealand Finance Company B.V.: | | | | | | | | | | | | |
| | | |
Term Loan, 6/28/24(11) | | | | | | | 9,039 | | | | 7,412,283 | |
| | | |
Term Loan, 7.754%, (1 mo. USD LIBOR + 4.00%), 4.754% cash, 3.00% PIK, 6/30/25 | | | | | | | 2,443 | | | | 1,302,819 | |
| | | |
| | | | | | | | | | | $ | 22,248,745 | |
| | | | |
| | 34 | | See Notes to Financial Statements. |
Eaton Vance
Floating Rate Portfolio
October 31, 2022
Portfolio of Investments — continued
| | | | | | | | | | | | |
| Borrower/Description | | | | | Principal
Amount* (000’s omitted) | | | Value | |
|
| Engineering & Construction — 1.0% | |
| | | |
Aegion Corporation, Term Loan, 8.504%, (1 mo. USD LIBOR + 4.75%), 5/17/28 | | | | | | | 15,918 | | | $ | 14,756,954 | |
| | | |
| Amentum Government Services Holdings, LLC: | | | | | | | | | |
| | | |
Term Loan, 7.393%, (SOFR + 4.00%), 2/15/29(9) | | | | | | | 8,354 | | | | 8,124,326 | |
| | | |
Term Loan, 7.798%, (3 mo. USD LIBOR + 4.00%), 1/29/27 | | | | | | | 5,790 | | | | 5,630,476 | |
| | | |
American Residential Services, LLC, Term Loan, 7.174%, (3 mo. USD LIBOR + 3.50%), 10/15/27 | | | | | | | 7,525 | | | | 7,337,052 | |
| | | |
| APi Group DE, Inc.: | | | | | | | | | |
| | | |
Term Loan, 6.254%, (1 mo. USD LIBOR + 2.50%), 10/1/26 | | | | | | | 12,964 | | | | 12,803,257 | |
| | | |
Term Loan, 6.504%, (1 mo. USD LIBOR + 2.75%), 1/3/29 | | | | | | | 7,686 | | | | 7,590,879 | |
| | | |
Centuri Group, Inc., Term Loan, 5.57%, (3 mo. USD LIBOR + 2.50%), 8/27/28 | | | | | | | 8,390 | | | | 8,231,543 | |
| | | |
Northstar Group Services, Inc., Term Loan, 9.254%, (1 mo. USD LIBOR + 5.50%), 11/12/26 | | | | | | | 11,113 | | | | 10,973,895 | |
| | | |
USIC Holdings, Inc., Term Loan, 7.254%, (1 mo. USD LIBOR + 3.50%), 5/12/28 | | | | | | | 5,990 | | | | 5,707,808 | |
| | | |
| | | | | | | | | | | $ | 81,156,190 | |
|
| Entertainment — 2.0% | |
| | | |
Alchemy Copyrights, LLC, Term Loan, 6.128%, (1 mo. USD LIBOR + 3.00%), 3/10/28 | | | | | | | 3,553 | | | $ | 3,534,895 | |
| | | |
AMC Entertainment Holdings, Inc., Term Loan, 6.314%, (1 mo. USD LIBOR + 3.00%), 4/22/26 | | | | | | | 19,650 | | | | 14,049,945 | |
| | | |
City Football Group Limited, Term Loan, 6.484%, (3 mo. USD LIBOR + 3.50%), 7/21/28 | | | | | | | 11,821 | | | | 11,052,261 | |
| | | |
| Crown Finance US, Inc.: | | | | | | | | | |
| | | |
DIP Loan, 0.00%, 9/7/23(10) | | | | | | | 625 | | | | 628,100 | |
| | | |
DIP Loan, 13.612%, (SOFR + 10.00%), 9/7/23 | | | | | | | 7,441 | | | | 7,475,001 | |
| | | |
Delta 2 (LUX) S.a.r.l., Term Loan, 6.254%, (1 mo. USD LIBOR + 2.50%), 2/1/24 | | | | | | | 62,085 | | | | 62,097,608 | |
| | | |
Live Nation Entertainment, Inc., Term Loan, 5.313%, (1 mo. USD LIBOR + 1.75%), 10/17/26 | | | | | | | 5,629 | | | | 5,438,755 | |
| | | |
Playtika Holding Corp., Term Loan, 6.504%, (1 mo. USD LIBOR + 2.75%), 3/13/28 | | | | | | | 30,593 | | | | 29,833,926 | |
| | | |
| Renaissance Holding Corp.: | | | | | | | | | |
| | | |
Term Loan, 7.004%, (1 mo. USD LIBOR + 3.25%), 5/30/25 | | | | | | | 5,979 | | | | 5,796,350 | |
| | | |
Term Loan, 7.608%, (SOFR + 4.50%), 3/30/29 | | | | | | | 2,569 | | | | 2,491,506 | |
| | | |
Term Loan - Second Lien, 10.754%, (1 mo. USD LIBOR + 7.00%), 5/29/26 | | | | | | | 3,175 | | | | 3,034,770 | |
| | | |
UFC Holdings, LLC, Term Loan, 7.11%, (3 mo. USD LIBOR + 2.75%), 4/29/26 | | | | | | | 14,562 | | | | 14,273,995 | |
| | | |
| Vue International Bidco PLC: | | | | | | | | | |
| | | |
Term Loan, 5.66%, (2 mo. EURIBOR + 4.75%), 7/3/26 | | | EUR | | | | 3,878 | | | | 2,618,652 | |
| | | | | | | | | | | | |
| Borrower/Description | | | | | Principal
Amount* (000’s omitted) | | | Value | |
|
| Entertainment (continued) | |
| | | |
| Vue International Bidco PLC: (continued) | | | | | | | | | |
| | | |
Term Loan, 9.766%, (3 mo. EURIBOR + 8.00%), 6/30/27 | | | EUR | | | | 434 | | | $ | 404,895 | |
| | | |
| | | | | | | | | | | $ | 162,730,659 | |
|
| Equity Real Estate Investment Trusts (REITs) — 0.1% | |
| | | |
Iron Mountain, Inc., Term Loan, 5.504%, (1 mo. USD LIBOR + 1.75%), 1/2/26 | | | | | | | 8,699 | | | $ | 8,557,706 | |
| | | |
| | | | | | | | | | | $ | 8,557,706 | |
|
| Food Products — 0.8% | |
| | | |
8th Avenue Food & Provisions, Inc., Term Loan, 8.382%, (1 mo. USD LIBOR + 4.75%), 10/1/25 | | | | | | | 6,608 | | | $ | 5,798,739 | |
| | | |
Badger Buyer Corp., Term Loan, 7.254%, (1 mo. USD LIBOR + 3.50%), 9/30/24 | | | | | | | 4,826 | | | | 4,252,934 | |
| | | |
CHG PPC Parent, LLC: | | | | | | | | | | | | |
| | | |
Term Loan, 4.633%, (1 mo. EURIBOR + 3.50%), 3/31/25 | | | EUR | | | | 2,000 | | | | 1,876,850 | |
| | | |
Term Loan, 6.632%, (1 mo. USD LIBOR + 3.00%), 12/8/28 | | | | | | | 5,796 | | | | 5,621,999 | |
| | | |
Del Monte Foods, Inc., Term Loan, 7.827%, (SOFR + 4.35%), 5/16/29 | | | | | | | 6,325 | | | | 6,155,016 | |
| | | |
Froneri International, Ltd.: | | | | | | | | | | | | |
| | | |
Term Loan, 3.006%, (6 mo. EURIBOR + 2.38%), 1/29/27 | | | EUR | | | | 1,500 | | | | 1,355,446 | |
| | | |
Term Loan, 6.004%, (1 mo. USD LIBOR + 2.25%), 1/29/27 | | | | | | | 4,740 | | | | 4,585,480 | |
| | | |
Monogram Food Solutions, LLC, Term Loan, 7.813%, (1 mo. USD LIBOR + 4.00%), 8/28/28 | | | | | | | 5,980 | | | | 5,830,317 | |
| | | |
Nomad Foods Europe Midco Limited, Term Loan, 5.155%, (3 mo. USD LIBOR + 2.25%), 5/15/24 | | | | | | | 10,406 | | | | 10,346,417 | |
| | | |
Sovos Brands Intermediate, Inc., Term Loan, 7.915%, (3 mo. USD LIBOR + 3.50%), 6/8/28 | | | | | | | 5,259 | | | | 5,056,009 | |
| | | |
United Petfood Group B.V., Term Loan, 4.558%, (3 mo. EURIBOR + 3.00%), 4/23/28 | | | EUR | | | | 8,400 | | | | 7,574,934 | |
| | | |
Valeo F1 Company Limited (Ireland): | | | | | | | | | | | | |
| | | |
Term Loan, 5.193%, (3 mo. EURIBOR + 4.00%), 6/30/28 | | | EUR | | | | 8,550 | | | | 7,213,791 | |
| | | |
Term Loan, 7.188%, (SONIA + 5.00%), 6/28/28 | | | GBP | | | | 2,500 | | | | 2,365,274 | |
| | | |
| | | | | | | | | | | $ | 68,033,206 | |
|
| Gas Utilities — 0.3% | |
| | | |
CQP Holdco, L.P., Term Loan, 7.424%, (3 mo. USD LIBOR + 3.75%), 6/5/28 | | | | | | | 27,356 | | | $ | 27,058,464 | |
| | | |
| | | | | | | | | | | $ | 27,058,464 | |
| | | | |
| | 35 | | See Notes to Financial Statements. |
Eaton Vance
Floating Rate Portfolio
October 31, 2022
Portfolio of Investments — continued
| | | | | | | | | | | | |
| Borrower/Description | | | | | Principal Amount* (000’s omitted) | | | Value | |
|
| Health Care Equipment & Supplies — 0.9% | |
| | | |
Bayou Intermediate II, LLC, Term Loan, 7.302%, (3 mo. USD LIBOR + 4.50%), 8/2/28 | | | | | | | 8,188 | | | $ | 7,860,600 | |
| | | |
CryoLife, Inc., Term Loan, 7.174%, (3 mo. USD LIBOR + 3.50%), 6/1/27 | | | | | | | 6,713 | | | | 6,293,526 | |
| | | |
Gloves Buyer, Inc., Term Loan, 7.754%, (1 mo. USD LIBOR + 4.00%), 12/29/27 | | | | | | | 12,246 | | | | 11,144,004 | |
| | | |
ICU Medical, Inc., Term Loan, 5.961%, (SOFR + 2.25%), 1/8/29(9) | | | | | | | 7,438 | | | | 7,290,033 | |
| | | |
Journey Personal Care Corp., Term Loan, 7.924%, (3 mo. USD LIBOR + 4.25%), 3/1/28 | | | | | | | 25,771 | | | | 16,596,446 | |
| | | |
Medline Borrower, L.P., Term Loan, 7.004%, (1 mo. USD LIBOR + 3.25%), 10/23/28 | | | | | | | 28,457 | | | | 26,196,262 | |
| | | |
| | | | | | | | | | | $ | 75,380,871 | |
|
| Health Care Providers & Services — 4.8% | |
| | | |
AEA International Holdings (Lux) S.a.r.l., Term Loan, 7.438%, (3 mo. USD LIBOR + 3.75%), 9/7/28 | | | | | | | 16,327 | | | $ | 16,081,665 | |
| | | |
Biogroup-LCD, Term Loan, 4.742%, (3 mo. EURIBOR + 2.75%), 2/9/28 | | | EUR | | | | 10,650 | | | | 9,516,231 | |
| | | |
BW NHHC Holdco, Inc., Term Loan, 7.961%, (3 mo. USD LIBOR + 5.00%), 5/15/25 | | | | | | | 13,718 | | | | 8,671,083 | |
| | | |
CAB, Term Loan, 3.527%, (3 mo. EURIBOR + 3.25%), 2/9/28 | | | EUR | | | | 7,150 | | | | 6,633,194 | |
| | | |
Cano Health, LLC, Term Loan, 7.829%, (SOFR + 4.00%), 11/23/27 | | | | | | | 7,300 | | | | 6,264,524 | |
| | | |
CCRR Parent, Inc., Term Loan, 7.51%, (1 mo. USD LIBOR + 3.75%), 3/6/28 | | | | | | | 4,757 | | | | 4,620,434 | |
| | | |
| Cerba Healthcare S.A.S.: | | | | | | | | | |
| | | |
Term Loan, 4.383%, (1 mo. EURIBOR + 3.25%), 6/30/28 | | | EUR | | | | 18,925 | | | | 17,050,567 | |
| | | |
Term Loan, 5.133%, (1 mo. EURIBOR + 4.00%), 2/15/29 | | | EUR | | | | 8,225 | | | | 7,696,535 | |
| | | |
CHG Healthcare Services, Inc., Term Loan, 7.004%, (3 mo. USD LIBOR + 3.25%), 9/29/28 | | | | | | | 3,712 | | | | 3,611,602 | |
| | | |
Covis Finco S.a.r.l., Term Loan, 10.203%, (SOFR + 6.50%), 2/18/27 | | | | | | | 13,236 | | | | 8,934,047 | |
| | | |
Dedalus Finance GmbH, Term Loan, 5.782%, (6 mo. EURIBOR + 3.75%), 7/17/27 | | | EUR | | | | 16,850 | | | | 14,570,507 | |
| | | |
Electron BidCo, Inc., Term Loan, 6.754%, (1 mo. USD LIBOR + 3.00%), 11/1/28 | | | | | | | 5,923 | | | | 5,747,355 | |
| | | |
Elsan S.A.S., Term Loan, 4.314%, (EURIBOR + 3.35%), 6/16/28(9) | | | EUR | | | | 4,100 | | | | 3,794,784 | |
| | | |
Ensemble RCM, LLC, Term Loan, 7.944%, (SOFR + 3.75%), 8/3/26 | | | | | | | 14,731 | | | | 14,528,459 | |
| | | |
| Envision Healthcare Corporation: | | | | | | | | | |
| | | |
Term Loan, 11.603%, (SOFR + 7.88%), 3/31/27 | | | | | | | 5,463 | | | | 5,074,065 | |
| | | |
Term Loan - Second Lien, 6.825%, (SOFR + 4.25%), 3/31/27 | | | | | | | 38,737 | | | | 16,979,905 | |
| | | | | | | | | | |
| Borrower/Description | | | | Principal Amount* (000’s omitted) | | | Value | |
|
| Health Care Providers & Services (continued) | |
| | | |
| IVC Acquisition, Ltd.: | | | | | | | | |
| | | |
Term Loan, 4.141%, (3 mo. EURIBOR + 3.75%), 2/13/26 | | EUR | | | 8,710 | | | $ | 7,983,600 | |
| | | |
Term Loan, 4.391%, (3 mo. EURIBOR + 4.00%), 2/13/26 | | EUR | | | 19,100 | | | | 17,654,547 | |
| | | |
Term Loan, 6.309%, (SONIA + 4.50%), 2/13/26 | | GBP | | | 950 | | | | 984,871 | |
| | | |
MDVIP, Inc., Term Loan, 7.072%, (1 mo. USD LIBOR + 3.50%), 10/16/28 | | | | | 5,547 | | | | 5,370,310 | |
| | | |
| Medical Solutions Holdings, Inc.: | | | | | | | | |
| | | |
Term Loan, 3.50%, 11/1/28(10) | | | | | 1,924 | | | | 1,859,146 | |
| | | |
Term Loan, 6.377%, (3 mo. USD LIBOR + 3.50%), 11/1/28 | | | | | 11,959 | | | | 11,555,672 | |
| | | |
Term Loan - Second Lien, 9.877%, (3 mo. USD LIBOR + 7.00%), 11/1/29 | | | | | 9,500 | | | | 9,143,750 | |
| | | |
Mehilainen Yhtiot Oy, Term Loan, 4.718%, (3 mo. EURIBOR + 3.53%), 8/11/25 | | EUR | | | 7,525 | | | | 6,990,384 | |
| | | |
Midwest Physician Administrative Services, LLC, Term Loan, 6.924%, (3 mo. USD LIBOR + 3.25%), 3/12/28 | | | | | 1,424 | | | | 1,289,554 | |
| | | |
| National Mentor Holdings, Inc.: | | | | | | | | |
| | | |
Term Loan, 7.43%, (3 mo. USD LIBOR + 3.75%), 3/2/28 | | | | | 472 | | | | 340,669 | |
| | | |
Term Loan, 7.466%, (USD LIBOR + 3.75%), 3/2/28(9) | | | | | 17,264 | | | | 12,467,835 | |
| | | |
Term Loan - Second Lien, 10.93%, (3 mo. USD LIBOR + 7.25%), 3/2/29 | | | | | 5,525 | | | | 3,798,437 | |
| | | |
Option Care Health, Inc., Term Loan, 6.504%, (1 mo. USD LIBOR + 2.75%), 10/27/28 | | | | | 7,369 | | | | 7,244,955 | |
| | | |
Pearl Intermediate Parent, LLC, Term Loan - Second Lien, 10.004%, (1 mo. USD LIBOR + 6.25%), 2/13/26 | | | | | 2,350 | | | | 2,150,250 | |
| | | |
| Pediatric Associates Holding Company, LLC: | | | | | | | | |
| | | |
Term Loan, 5.122%, (1 mo. USD LIBOR + 3.25%), 12/29/28(10) | | | | | 148 | | | | 142,858 | |
| | | |
Term Loan, 7.004%, (1 mo. USD LIBOR + 3.25%), 12/29/28 | | | | | 972 | | | | 940,496 | |
| | | |
PetVet Care Centers, LLC, Term Loan, 7.254%, (1 mo. USD LIBOR + 3.50%), 2/14/25 | | | | | 5,897 | | | | 5,543,090 | |
| | | |
| Phoenix Guarantor, Inc.: | | | | | | | | |
| | | |
Term Loan, 7.004%, (1 mo. USD LIBOR + 3.25%), 3/5/26 | | | | | 21,429 | | | | 20,612,107 | |
| | | |
Term Loan, 7.254%, (1 mo. USD LIBOR + 3.50%), 3/5/26 | | | | | 6,419 | | | | 6,174,084 | |
| | | |
Radiology Partners, Inc., Term Loan, 7.825%, (1 mo. USD LIBOR + 4.25%), 7/9/25 | | | | | 25,462 | | | | 20,687,902 | |
| | | |
Radnet Management, Inc., Term Loan, 6.754%, (1 mo. USD LIBOR + 3.00%), 4/21/28 | | | | | 8,825 | | | | 8,589,377 | |
| | | | |
| | 36 | | See Notes to Financial Statements. |
Eaton Vance
Floating Rate Portfolio
October 31, 2022
Portfolio of Investments — continued
| | | | | | | | | | | | |
| Borrower/Description | | | | | Principal Amount* (000’s omitted) | | | Value | |
|
| Health Care Providers & Services (continued) | |
| | | |
Ramsay Generale de Sante S.A., Term Loan, 4.302%, (3 mo. EURIBOR + 2.80%), 4/22/27 | | | EUR | | | | 9,100 | | | $ | 8,509,695 | |
| | | |
Select Medical Corporation, Term Loan, 6.26%, (1 mo. USD LIBOR + 2.50%), 3/6/25 | | | | | | | 45,148 | | | | 44,025,942 | |
| | | |
Sound Inpatient Physicians: | | | | | | | | | | | | |
| | | |
Term Loan, 6/27/25(11) | | | | | | | 200 | | | | 158,800 | |
| | | |
Term Loan, 6.754%, (1 mo. USD LIBOR + 3.00%), 6/27/25 | | | | | | | 2,345 | | | | 1,864,523 | |
| | | |
Synlab Bondco PLC, Term Loan, 2.778%, (6 mo. EURIBOR + 2.50%), 7/1/27 | | | EUR | | | | 2,125 | | | | 2,009,030 | |
| | | |
TTF Holdings, LLC, Term Loan, 7.813%, (1 mo. USD LIBOR + 4.00%), 3/31/28 | | | | | | | 5,083 | | | | 4,993,648 | |
| | | |
U.S. Anesthesia Partners, Inc., Term Loan, 7.378%, (1 mo. USD LIBOR + 4.25%), 10/1/28 | | | | | | | 13,991 | | | | 13,264,061 | |
| | | |
WP CityMD Bidco, LLC, Term Loan, 6.924%, (3 mo. USD LIBOR + 3.25%), 12/22/28 | | | | | | | 10,660 | | | | 10,388,016 | |
| | | |
| | | | | | | | | | | $ | 386,512,566 | |
| | | |
| Health Care Technology — 1.8% | | | | | | | | | |
| | | |
athenahealth, Inc.: | | | | | | | | | | | | |
| | | |
Term Loan, 3.50%, 2/15/29(10) | | | | | | | 1,834 | | | $ | 1,674,236 | |
| | | |
Term Loan, 6.967%, (SOFR + 3.50%), 2/15/29 | | | | | | | 10,794 | | | | 9,853,295 | |
| | | |
Bracket Intermediate Holding Corp., Term Loan, 7.998%, (3 mo. USD LIBOR + 4.25%), 9/5/25 | | | | | | | 11,301 | | | | 10,852,078 | |
| | | |
Certara, L.P., Term Loan, 7.254%, (1 mo. USD LIBOR + 3.50%), 8/15/26 | | | | | | | 1,827 | | | | 1,785,770 | |
| | | |
eResearchTechnology, Inc., Term Loan, 8.254%, (1 mo. USD LIBOR + 4.50%), 2/4/27 | | | | | | | 4,105 | | | | 3,833,053 | |
| | | |
GHX Ultimate Parent Corporation, Term Loan, 6.127%, (6 mo. USD LIBOR + 3.25%), 6/28/24 | | | | | | | 3,412 | | | | 3,304,979 | |
| | | |
Imprivata, Inc.: | | | | | | | | | | | | |
| | | |
Term Loan, 7.504%, (1 mo. USD LIBOR + 3.75%), 12/1/27 | | | | | | | 21,355 | | | | 20,954,411 | |
| | | |
Term Loan, 7.979%, (SOFR + 4.25%), 12/1/27 | | | | | | | 3,292 | | | | 3,251,976 | |
| | | |
MedAssets Software Intermediate Holdings, Inc.: | | | | | | | | | | | | |
| | | |
Term Loan, 7.754%, (1 mo. USD LIBOR + 4.00%), 12/18/28 | | | | | | | 16,393 | | | | 15,572,994 | |
| | | |
Term Loan - Second Lien, 10.504%, (1 mo. USD LIBOR + 6.75%), 12/17/29 | | | | | | | 8,775 | | | | 7,553,809 | |
| | | |
Navicure, Inc., Term Loan, 7.754%, (1 mo. USD LIBOR + 4.00%), 10/22/26 | | | | | | | 12,833 | | | | 12,516,515 | |
| | | |
PointClickCare Technologies, Inc., Term Loan, 5.938%, (6 mo. USD LIBOR + 3.00%), 12/29/27 | | | | | | | 4,236 | | | | 4,152,556 | |
| | | |
Project Ruby Ultimate Parent Corp., Term Loan, 7.004%, (1 mo. USD LIBOR + 3.25%), 3/10/28 | | | | | | | 8,110 | | | | 7,654,846 | |
| | | | | | | | | | | | |
| Borrower/Description | | | | | Principal Amount* (000’s omitted) | | | Value | |
| | | |
| Health Care Technology (continued) | | | | | | | | | |
| | | |
Symplr Software, Inc., Term Loan, 8.694%, (SOFR + 4.50%), 12/22/27 | | | | | | | 12,914 | | | $ | 12,094,351 | |
| | | |
Verscend Holding Corp., Term Loan, 7.754%, (1 mo. USD LIBOR + 4.00%), 8/27/25 | | | | | | | 27,163 | | | | 26,832,027 | |
| | | |
| | | | | | | | | | | $ | 141,886,896 | |
| | | |
| Hotels, Restaurants & Leisure — 3.4% | | | | | | | | | |
| | | |
1011778 B.C. Unlimited Liability Company, Term Loan, 5.504%, (1 mo. USD LIBOR + 1.75%), 11/19/26 | | | | | | | 24,641 | | | $ | 24,014,220 | |
| | | |
Bally’s Corporation, Term Loan, 6.55%, (3 mo. USD LIBOR + 3.25%), 10/2/28 | | | | | | | 11,087 | | | | 10,336,758 | |
| | | |
Carnival Corporation: | | | | | | | | | | | | |
| | | |
Term Loan, 3.975%, (6 mo. EURIBOR + 3.75%), 6/30/25 | | | EUR | | | | 8,881 | | | | 8,381,334 | |
| | | |
Term Loan, 5.877%, (6 mo. USD LIBOR + 3.00%), 6/30/25 | | | | | | | 3,718 | | | | 3,501,068 | |
| | | |
Term Loan, 6.127%, (6 mo. USD LIBOR + 3.25%), 10/18/28 | | | | | | | 34,762 | | | | 31,937,875 | |
| | | |
Churchill Downs Incorporated, Term Loan, 5.76%, (1 mo. USD LIBOR + 2.00%), 12/27/24 | | | | | | | 3,334 | | | | 3,316,041 | |
| | | |
ClubCorp Holdings, Inc., Term Loan, 6.424%, (3 mo. USD LIBOR + 2.75%), 9/18/24 | | | | | | | 21,159 | | | | 19,056,570 | |
| | | |
Dave & Buster’s, Inc., Term Loan, 8.875%, (SOFR + 5.00%), 6/29/29 | | | | | | | 10,823 | | | | 10,617,695 | |
| | | |
Fertitta Entertainment, LLC, Term Loan, 7.729%, (SOFR + 4.00%), 1/27/29 | | | | | | | 17,910 | | | | 16,844,743 | |
| | | |
Great Canadian Gaming Corporation, Term Loan, 7.602%, (3 mo. USD LIBOR + 4.00%), 11/1/26 | | | | | | | 8,318 | | | | 8,103,847 | |
| | | |
GVC Holdings PLC, Term Loan, 3.633%, (1 mo. EURIBOR + 2.50%), 3/29/24 | | | EUR | | | | 21,225 | | | | 20,346,332 | |
| | | |
Hilton Grand Vacations Borrower, LLC, Term Loan, 6.754%, (1 mo. USD LIBOR + 3.00%), 8/2/28 | | | | | | | 9,034 | | | | 8,903,890 | |
| | | |
IRB Holding Corp.: | | | | | | | | | | | | |
| | | |
Term Loan, 6.208%, (SOFR + 3.00%), 12/15/27 | | | | | | | 4,929 | | | | 4,790,199 | |
| | | |
Term Loan, 6.504%, (1 mo. USD LIBOR + 2.75%), 2/5/25 | | | | | | | 2 | | | | 2,293 | |
| | | |
NCL Corporation Limited, Term Loan, 1/2/24(11) | | | | | | | 4,500 | | | | 4,252,500 | |
| | | |
Oravel Stays Singapore Pte, Ltd., Term Loan, 11.86%, (3 mo. USD LIBOR + 8.25%), 6/23/26 | | | | | | | 5,407 | | | | 4,730,742 | |
| | | |
Playa Resorts Holding B.V., Term Loan, 6.50%, (1 mo. USD LIBOR + 2.75%), 4/29/24 | | | | | | | 19,136 | | | | 18,689,697 | |
| | | |
Scientific Games Holdings, L.P., Term Loan, 7.097%, (SOFR + 3.50%), 4/4/29 | | | | | | | 10,000 | | | | 9,440,970 | |
| | | |
Scientific Games International, Inc., Term Loan, 6.402%, (SOFR + 3.00%), 4/14/29 | | | | | | | 7,481 | | | | 7,403,632 | |
| | | |
SeaWorld Parks & Entertainment, Inc., Term Loan, 6.813%, (1 mo. USD LIBOR + 3.00%), 8/25/28 | | | | | | | 9,974 | | | | 9,746,089 | |
| | | | |
| | 37 | | See Notes to Financial Statements. |
Eaton Vance
Floating Rate Portfolio
October 31, 2022
Portfolio of Investments — continued
| | | | | | | | | | | | |
| Borrower/Description | | | | | Principal Amount* (000’s omitted) | | | Value | |
| | | |
| Hotels, Restaurants & Leisure (continued) | | | | | | | | | |
| | | |
| Stars Group Holdings B.V. (The): | | | | | | | | | |
| | | |
Term Loan, 3.728%, (3 mo. EURIBOR + 2.50%), 7/21/26 | | | EUR | | | | 11,225 | | | $ | 10,464,490 | |
| | | |
Term Loan, 5.892%, (3 mo. USD LIBOR + 2.25%), 7/21/26 | | | | | | | 29,342 | | | | 28,868,634 | |
| | | |
Travel Leaders Group, LLC, Term Loan, 7.754%, (1 mo. USD LIBOR + 4.00%), 1/25/24 | | | | | | | 14,996 | | | | 13,318,312 | |
| | | |
| | | | | | | | | | | $ | 277,067,931 | |
| | | |
| Household Durables — 0.8% | | | | | | | | | |
| | | |
Libbey Glass, Inc., Term Loan, 11.941%, (3 mo. USD LIBOR + 8.00%), 11/13/25 | | | | | | | 6,407 | | | $ | 6,562,725 | |
| | | |
Serta Simmons Bedding, LLC: | | | | | | | | | | | | |
| | | |
Term Loan, 10.793%, (1 mo. USD LIBOR + 7.50%), 8/10/23 | | | | | | | 13,364 | | | | 13,004,879 | |
| | | |
Term Loan - Second Lien, 10.793%, (1 mo. USD LIBOR + 7.50%), 8/10/23 | | | | | | | 44,139 | | | | 22,321,592 | |
| | | |
Solis IV B.V.: | | | | | | | | | | | | |
| | | |
Term Loan, 4.468%, (3 mo. EURIBOR + 4.00%), 2/26/29 | | | EUR | | | | 5,693 | | | | 4,702,108 | |
| | | |
Term Loan, 6.34%, (SOFR + 3.50%), 2/26/29 | | | | | | | 13,857 | | | | 11,584,825 | |
| | | |
Spectrum Brands, Inc., Term Loan, 5.76%, (1 mo. USD LIBOR + 2.00%), 3/3/28 | | | | | | | 4,186 | | | | 4,029,266 | |
| | | |
| | | | | | | | | | | $ | 62,205,395 | |
| | | |
| Household Products — 0.5% | | | | | | | | | |
| | | |
Diamond (BC) B.V., Term Loan, 7.163%, (USD LIBOR + 2.75%), 9/29/28(9) | | | | | | | 8,536 | | | $ | 8,004,165 | |
| | | |
Energizer Holdings, Inc., Term Loan, 5.875%, (1 mo. USD LIBOR + 2.25%), 12/22/27 | | | | | | | 7,576 | | | | 7,354,951 | |
| | | |
Kronos Acquisition Holdings, Inc.: | | | | | | | | | | | | |
| | | |
Term Loan, 6.82%, (3 mo. USD LIBOR + 3.75%), 12/22/26 | | | | | | | 10,568 | | | | 10,017,961 | |
| | | |
Term Loan, 8.94%, (SOFR + 6.00%), 12/22/26 | | | | | | | 5,111 | | | | 4,906,920 | |
| | | |
Nobel Bidco B.V., Term Loan, 3.50%, (3 mo. EURIBOR + 3.50%), 9/1/28 | | | EUR | | | | 11,450 | | | | 7,729,873 | |
| | | |
| | | | | | | | | | | $ | 38,013,870 | |
|
| Independent Power and Renewable Electricity Producers — 0.1% | |
| | | |
| Calpine Corporation: | | | | | | | | | |
| | | |
Term Loan, 5.76%, (1 mo. USD LIBOR + 2.00%), 4/5/26 | | | | | | | 2,325 | | | $ | 2,284,586 | |
| | | |
Term Loan, 6.26%, (1 mo. USD LIBOR + 2.50%), 12/16/27 | | | | | | | 6,192 | | | | 6,132,364 | |
| | | |
Longview Power, LLC, Term Loan, 13.674%, (3 mo. USD LIBOR + 10.00%), 7/30/25 | | | | | | | 293 | | | | 288,544 | |
| | | |
| | | | | | | | | | | $ | 8,705,494 | |
| | | | | | | | | | | | |
| Borrower/Description | | | | | Principal Amount* (000’s omitted) | | | Value | |
| | | |
| Industrial Conglomerates — 0.4% | | | | | | | | | |
| | | |
Rain Carbon GmbH, Term Loan, 3.282%, (3 mo. EURIBOR + 3.00%), 1/16/25 | | | EUR | | | | 15,625 | | | $ | 14,540,658 | |
| | | |
SPX Flow, Inc., Term Loan, 8.329%, (SOFR + 4.50%), 4/5/29 | | | | | | | 19,650 | | | | 18,667,500 | |
| | | |
| | | | | | | | | | | $ | 33,208,158 | |
| | | |
| Insurance — 1.6% | | | | | | | | | |
| | | |
| Alliant Holdings Intermediate, LLC: | | | | | | | | | |
| | | |
Term Loan, 6.98%, (1 mo. USD LIBOR + 3.50%), 11/6/27 | | | | | | | 13,299 | | | $ | 12,862,275 | |
| | | |
Term Loan, 7.004%, (1 mo. USD LIBOR + 3.25%), 5/9/25 | | | | | | | 5,832 | | | | 5,672,713 | |
| | | |
Term Loan, 7.004%, (1 mo. USD LIBOR + 3.25%), 5/9/25 | | | | | | | 4,765 | | | | 4,634,326 | |
| | | |
AmWINS Group, Inc., Term Loan, 6.004%, (1 mo. USD LIBOR + 2.25%), 2/19/28 | | | | | | | 25,722 | | | | 25,198,176 | |
| | | |
AssuredPartners, Inc.: | | | | | | | | | | | | |
| | | |
Term Loan, 7.229%, (SOFR + 3.50%), 2/12/27 | | | | | | | 5,348 | | | | 5,109,128 | |
| | | |
Term Loan, 7.254%, (1 mo. USD LIBOR + 3.50%), 2/12/27 | | | | | | | 13,369 | | | | 12,781,755 | |
| | | |
Term Loan, 7.254%, (1 mo. USD LIBOR + 3.50%), 2/12/27 | | | | | | | 3,424 | | | | 3,273,319 | |
| | | |
Financiere CEP S.A.S., Term Loan, 4.225%, (6 mo. EURIBOR + 4.00%), 6/18/27 | | | EUR | | | | 4,125 | | | | 3,831,938 | |
| | | |
Hub International Limited: | | | | | | | | | | | | |
| | | |
Term Loan, 7.326%, (3 mo. USD LIBOR + 3.00%), 4/25/25 | | | | | | | 15,174 | | | | 14,900,671 | |
| | | |
Term Loan, 7.527%, (3 mo. USD LIBOR + 3.25%), 4/25/25 | | | | | | | 5,388 | | | | 5,300,841 | |
| | | |
NFP Corp., Term Loan, 7.004%, (1 mo. USD LIBOR + 3.25%), 2/15/27 | | | | | | | 25,465 | | | | 24,216,825 | |
| | | |
USI, Inc.: | | | | | | | | | | | | |
| | | |
Term Loan, 6.424%, (3 mo. USD LIBOR + 2.75%), 5/16/24 | | | | | | | 8,739 | | | | 8,641,423 | |
| | | |
Term Loan, 6.924%, (3 mo. USD LIBOR + 3.25%), 12/2/26 | | | | | | | 1,931 | | | | 1,895,917 | |
| | | |
| | | | | | | | | | | $ | 128,319,307 | |
| | | |
| Interactive Media & Services — 0.4% | | | | | | | | | |
| | | |
| Buzz Finco, LLC: | | | | | | | | | |
| | | |
Term Loan, 6.504%, (1 mo. USD LIBOR + 2.75%), 1/29/27 | | | | | | | 1,982 | | | $ | 1,932,161 | |
| | | |
Term Loan, 7.004%, (1 mo. USD LIBOR + 3.25%), 1/29/27 | | | | | | | 435 | | | | 428,531 | |
| | | |
Foundational Education Group, Inc., Term Loan, 7.565%, (SOFR + 3.75%), 8/31/28 | | | | | | | 5,188 | | | | 5,077,994 | |
| | | |
| Getty Images, Inc.: | | | | | | | | | |
| | | |
Term Loan, 5.563%, (3 mo. EURIBOR + 5.00%), 2/19/26 | | | EUR | | | | 3,724 | | | | 3,662,278 | |
| | | | |
| | 38 | | See Notes to Financial Statements. |
Eaton Vance
Floating Rate Portfolio
October 31, 2022
Portfolio of Investments — continued
| | | | | | | | | | |
| Borrower/Description | | | | Principal Amount* (000’s omitted) | | | Value | |
| | | |
| Interactive Media & Services (continued) | | | | | | | | |
| | | |
| Getty Images, Inc.: (continued) | | | | | | | | |
| | | |
Term Loan, 7.625%, (3 mo. USD LIBOR + 4.50%), 2/19/26 | | | | | 15,990 | | | $ | 15,922,268 | |
| | | |
Match Group, Inc., Term Loan, 4.692%, (3 mo. USD LIBOR + 1.75%), 2/13/27 | | | | | 6,450 | | | | 6,331,752 | |
| |
| | | | $ | 33,354,984 | |
|
| Internet & Direct Marketing Retail — 0.4% | |
| | | |
| Adevinta ASA: | | | | | | | | |
| | | |
Term Loan, 4.443%, (3 mo. EURIBOR + 3.25%), 6/26/28 | | EUR | | | 7,268 | | | $ | 6,941,950 | |
| | | |
Term Loan, 6.674%, (3 mo. USD LIBOR + 3.00%), 6/26/28 | | | | | 2,148 | | | | 2,102,506 | |
| | | |
CNT Holdings I Corp., Term Loan, 7.239%, (SOFR + 3.50%), 11/8/27 | | | | | 10,759 | | | | 10,500,587 | |
| | | |
Etraveli Holding AB, Term Loan, 5.193%, (3 mo. EURIBOR + 4.00%), 8/2/24 | | EUR | | | 7,844 | | | | 7,680,802 | |
| | | |
Hoya Midco, LLC, Term Loan, 6.979%, (SOFR + 3.25%), 2/3/29 | | | | | 5,166 | | | | 5,114,770 | |
| | | |
Speedster Bidco GmbH, Term Loan, 5.108%, (6 mo. EURIBOR + 3.25%), 3/31/27 | | EUR | | | 2,975 | | | | 2,584,789 | |
| |
| | | | $ | 34,925,404 | |
|
| IT Services — 3.3% | |
| | | |
| Asurion, LLC: | | | | | | | | |
| | | |
Term Loan, 6.754%, (1 mo. USD LIBOR + 3.00%), 11/3/24 | | | | | 2,154 | | | $ | 2,041,606 | |
| | | |
Term Loan, 7.004%, (1 mo. USD LIBOR + 3.25%), 12/23/26 | | | | | 3,439 | | | | 3,074,456 | |
| | | |
Term Loan, 7.004%, (1 mo. USD LIBOR + 3.25%), 7/31/27 | | | | | 11,722 | | | | 10,353,988 | |
| | | |
Term Loan, 7.653%, (SOFR + 4.00%), 8/19/28 | | | | | 14,175 | | | | 12,802,070 | |
| | | |
Term Loan - Second Lien, 9.004%, (1 mo. USD LIBOR + 5.25%), 1/31/28 | | | | | 14,540 | | | | 10,314,312 | |
| | | |
| Cyxtera DC Holdings, Inc.: | | | | | | | | |
| | | |
Term Loan, 7.36%, (3 mo. USD LIBOR + 3.00%), 5/1/24 | | | | | 27,291 | | | | 23,460,305 | |
| | | |
Term Loan, 8.36%, (3 mo. USD LIBOR + 4.00%), 5/1/24 | | | | | 9,762 | | | | 8,712,177 | |
| | | |
Endure Digital, Inc., Term Loan, 6.698%, (1 mo. USD LIBOR + 3.50%), 2/10/28 | | | | | 22,814 | | | | 19,548,361 | |
| | | |
Gainwell Acquisition Corp., Term Loan, 7.674%, (3 mo. USD LIBOR + 4.00%), 10/1/27 | | | | | 57,614 | | | | 54,973,542 | |
| | | |
Go Daddy Operating Company, LLC, Term Loan, 5.504%, (1 mo. USD LIBOR + 1.75%), 2/15/24 | | | | | 45,065 | | | | 44,952,819 | |
| | | |
| Indy US Bidco, LLC: | | | | | | | | |
| | | |
Term Loan, 4.883%, (1 mo. EURIBOR + 3.75%), 3/6/28 | | EUR | | | 5,678 | | | | 5,055,177 | |
| | | | | | | | | | |
| Borrower/Description | | | | Principal Amount* (000’s omitted) | | | Value | |
|
| IT Services (continued) | |
| | | |
| Indy US Bidco, LLC: (continued) | | | | | | | | |
| | | |
Term Loan, 7.504%, (1 mo. USD LIBOR + 3.75%), 3/5/28 | | | | | 4,171 | | | $ | 3,712,471 | |
| | | |
Informatica, LLC, Term Loan, 6.563%, (1 mo. USD LIBOR + 2.75%), 10/27/28 | | | | | 31,915 | | | | 31,148,674 | |
| | | |
NAB Holdings, LLC, Term Loan, 6.703%, (SOFR + 3.00%), 11/23/28 | | | | | 16,203 | | | | 15,581,470 | |
| | | |
Rackspace Technology Global, Inc., Term Loan, 5.617%, (3 mo. USD LIBOR + 2.75%), 2/15/28 | | | | | 16,430 | | | | 10,536,997 | |
| | | |
| team.blue Finco S.a.r.l.: | | | | | | | | |
| | | |
Term Loan, 4.893%, (3 mo. EURIBOR + 3.70%), 3/30/28 | | EUR | | | 10,547 | | | | 9,724,133 | |
| | | |
Term Loan, 4.943%, (3 mo. EURIBOR + 3.75%), 3/27/28 | | EUR | | | 603 | | | | 555,665 | |
| | | |
WEX, Inc., Term Loan, 6.004%, (1 mo. USD LIBOR + 2.25%), 3/31/28 | | | | | 3,940 | | | | 3,868,938 | |
| |
| | | | $ | 270,417,161 | |
|
| Leisure Products — 0.3% | |
| | | |
Amer Sports Oyj, Term Loan, 5.131%, (6 mo. EURIBOR + 4.50%), 3/30/26 | | EUR | | | 11,925 | | | $ | 10,429,617 | |
| | | |
Fender Musical Instruments Corporation, Term Loan, 7.368%, (SOFR + 4.00%), 12/1/28 | | | | | 3,938 | | | | 3,317,541 | |
| | | |
Hayward Industries, Inc., Term Loan, 6.254%, (1 mo. USD LIBOR + 2.50%), 5/30/28 | | | | | 9,147 | | | | 8,614,313 | |
| | | |
SRAM, LLC, Term Loan, 6.423%, (USD LIBOR + 2.75%), 5/18/28(9) | | | | | 2,189 | | | | 2,129,567 | |
| |
| | | | $ | 24,491,038 | |
|
| Life Sciences Tools & Services — 2.0% | |
| | | |
| Avantor Funding, Inc.: | | | | | | | | |
| | | |
Term Loan, 3.185%, (1 mo. EURIBOR + 2.50%), 6/12/28 | | EUR | | | 19,454 | | | $ | 18,810,630 | |
| | | |
Term Loan, 6.004%, (1 mo. USD LIBOR + 2.25%), 11/8/27 | | | | | 15,386 | | | | 15,087,876 | |
| | | |
Cambrex Corporation, Term Loan, 7.329%, (SOFR + 3.50%), 12/4/26 | | | | | 324 | | | | 312,791 | |
| | | |
Catalent Pharma Solutions, Inc., Term Loan, 5.625%, (1 mo. USD LIBOR + 2.00%), 2/22/28 | | | | | 1,034 | | | | 1,025,847 | |
| | | |
Curia Global, Inc., Term Loan, 8.163%, (USD LIBOR + 3.75%), 8/30/26(9) | | | | | 14,436 | | | | 13,274,842 | |
| | | |
ICON Luxembourg S.a.r.l., Term Loan, 5.938%, (3 mo. USD LIBOR + 2.25%), 7/3/28 | | | | | 51,015 | | | | 50,590,324 | |
| | | |
IQVIA, Inc., Term Loan, 5.504%, (1 mo. USD LIBOR + 1.75%), 1/17/25 | | | | | 12,472 | | | | 12,440,568 | |
| | | |
LGC Group Holdings, Ltd., Term Loan, 3.883%, (1 mo. EURIBOR + 2.75%), 4/21/27 | | EUR | | | 5,775 | | | | 5,164,963 | |
| | | |
Loire Finco Luxembourg S.a.r.l., Term Loan, 6.754%, (1 mo. USD LIBOR + 3.00%), 4/21/27 | | | | | 1,134 | | | | 1,057,190 | |
| | | | |
| | 39 | | See Notes to Financial Statements. |
Eaton Vance
Floating Rate Portfolio
October 31, 2022
Portfolio of Investments — continued
| | | | | | | | | | |
| Borrower/Description | | | | Principal Amount* (000’s omitted) | | | Value | |
|
| Life Sciences Tools & Services (continued) | |
| | | |
Packaging Coordinators Midco, Inc., Term Loan, 7.424%, (3 mo. USD LIBOR + 3.75%), 11/30/27 | | | | | 7,964 | | | $ | 7,717,640 | |
| | | |
Parexel International Corporation, Term Loan, 7.004%, (1 mo. USD LIBOR + 3.25%), 11/15/28 | | | | | 5,732 | | | | 5,536,096 | |
| | | |
PRA Health Sciences, Inc., Term Loan, 5.938%, (3 mo. USD LIBOR + 2.25%), 7/3/28 | | | | | 12,711 | | | | 12,604,799 | |
| | | |
Sotera Health Holdings, LLC, Term Loan, 7.165%, (3 mo. USD LIBOR + 2.75%), 12/11/26 | | | | | 17,828 | | | | 16,223,608 | |
| |
| | | | $ | 159,847,174 | |
|
| Machinery — 3.5% | |
| | | |
AI Alpine AT Bidco GmbH, Term Loan, 4.731%, (6 mo. EURIBOR + 3.00%), 10/31/25 | | EUR | | | 6,125 | | | $ | 5,515,823 | |
| | | |
AI Aqua Merger Sub, Inc., Term Loan, 6.858%, (SOFR + 3.75%), 7/31/28 | | | | | 11,650 | | | | 10,863,199 | |
| | | |
Albion Financing 3 S.a.r.l., Term Loan, 9.575%, (3 mo. USD LIBOR + 5.25%), 8/17/26 | | | | | 18,535 | | | | 17,561,853 | |
| | | |
Ali Group North America Corporation, Term Loan, 5.843%, (1 mo. USD LIBOR + 2.00%), 7/30/29 | | | | | 16,981 | | | | 16,694,391 | |
| | | |
Alliance Laundry Systems, LLC, Term Loan, 7.409%, (3 mo. USD LIBOR + 3.50%), 10/8/27 | | | | | 5,253 | | | | 5,084,746 | |
| | | |
American Trailer World Corp., Term Loan, 7.579%, (SOFR + 3.75%), 3/3/28 | | | | | 17,552 | | | | 15,985,224 | |
| | | |
Apex Tool Group, LLC, Term Loan, 8.624%, (SOFR + 5.25%), 2/8/29 | | | | | 26,131 | | | | 22,701,381 | |
| | | |
Clark Equipment Company, Term Loan, 6.153%, (SOFR + 2.50%), 4/20/29 | | | | | 11,542 | | | | 11,363,099 | |
| | | |
Conair Holdings, LLC, Term Loan, 7.424%, (3 mo. USD LIBOR + 3.75%), 5/17/28 | | | | | 24,453 | | | | 20,703,548 | |
| | | |
CPM Holdings, Inc., Term Loan, 6.628%, (1 mo. USD LIBOR + 3.50%), 11/17/25 | | | | | 4,713 | | | | 4,590,044 | |
| | | |
Delachaux Group S.A., Term Loan, 8.915%, (3 mo. USD LIBOR + 4.50%), 4/16/26 | | | | | 4,769 | | | | 4,315,493 | |
| | | |
| Engineered Machinery Holdings, Inc.: | | | | | | | | |
| | | |
Term Loan, 4.943%, (3 mo. EURIBOR + 3.75%), 5/21/28 | | EUR | | | 10,766 | | | | 9,646,704 | |
| | | |
Term Loan, 7.424%, (3 mo. USD LIBOR + 3.75%), 5/19/28 | | | | | 17,268 | | | | 16,742,453 | |
| | | |
Term Loan - Second Lien, 9.674%, (3 mo. USD LIBOR + 6.00%), 5/21/29 | | | | | 2,000 | | | | 1,891,250 | |
| | | |
EWT Holdings III Corp., Term Loan, 6.313%, (1 mo. USD LIBOR + 2.50%), 4/1/28 | | | | | 3,518 | | | | 3,475,916 | |
| | | |
| Filtration Group Corporation: | | | | | | | | |
| | | |
Term Loan, 4.633%, (3 mo. EURIBOR + 3.50%), 3/29/25 | | EUR | | | 2,946 | | | | 2,768,014 | |
| | | |
Term Loan, 6.754%, (1 mo. USD LIBOR + 3.00%), 3/29/25 | | | | | 2,913 | | | | 2,858,428 | |
| | | | | | | | | | |
| Borrower/Description | | | | Principal Amount* (000’s omitted) | | | Value | |
|
| Machinery (continued) | |
| | | |
| Gates Global, LLC: | | | | | | | | |
| | | |
Term Loan, 4.133%, (1 mo. EURIBOR + 3.00%), 4/1/24 | | EUR | | | 8,283 | | | $ | 7,776,826 | |
| | | |
Term Loan, 6.254%, (1 mo. USD LIBOR + 2.50%), 3/31/27 | | | | | 15,655 | | | | 15,270,154 | |
| | | |
| Icebox Holdco III, Inc.: | | | | | | | | |
| | | |
Term Loan, 7.424%, (3 mo. USD LIBOR + 3.75%), 12/22/28 | | | | | 11,789 | | | | 10,934,602 | |
| | | |
Term Loan, 7.58%, (3 mo. USD LIBOR + 3.75%), 12/22/28 | | | | | 2,451 | | | | 2,273,700 | |
| | | |
Madison IAQ, LLC, Term Loan, 6.815%, (3 mo. USD LIBOR + 3.25%), 6/21/28 | | | | | 35,259 | | | | 32,085,963 | |
| | | |
Penn Engineering & Manufacturing Corp., Term Loan, 6.424%, (3 mo. USD LIBOR + 2.75%), 6/27/24 | | | | | 1,876 | | | | 1,833,717 | |
| | | |
Titan Acquisition Limited, Term Loan, 5.877%, (6 mo. USD LIBOR + 3.00%), 3/28/25 | | | | | 22,828 | | | | 20,904,161 | |
| | | |
TK Elevator Topco GmbH, Term Loan, 4.256%, (1 mo. EURIBOR + 3.63%), 7/29/27 | | EUR | | | 9,725 | | | | 8,853,884 | |
| | | |
Vertical US Newco, Inc., Term Loan, 6.871%, (6 mo. USD LIBOR + 3.50%), 7/30/27 | | | | | 6 | | | | 5,934 | |
| | | |
Zephyr German BidCo GmbH, Term Loan, 4.216%, (3 mo. EURIBOR + 3.40%), 3/10/28 | | EUR | | | 11,775 | | | | 10,754,199 | |
| |
| | | | $ | 283,454,706 | |
|
| Media — 1.9% | |
| | | |
Axel Springer SE, Term Loan, 5.816%, (3 mo. EURIBOR + 4.75%), 12/18/26 | | EUR | | | 8,500 | | | $ | 8,043,117 | |
| | | |
Charter Communications Operating, LLC, Term Loan, 5.51%, (1 mo. USD LIBOR + 1.75%), 2/1/27 | | | | | 3,635 | | | | 3,574,079 | |
| | | |
| CSC Holdings, LLC: | | | | | | | | |
| | | |
Term Loan, 5.662%, (1 mo. USD LIBOR + 2.25%), 7/17/25 | | | | | 25,265 | | | | 24,538,230 | |
| | | |
Term Loan, 5.662%, (1 mo. USD LIBOR + 2.25%), 1/15/26 | | | | | 4 | | | | 4,007 | |
| | | |
Term Loan, 5.912%, (1 mo. USD LIBOR + 2.50%), 4/15/27 | | | | | 13,109 | | | | 12,491,421 | |
| | | |
| Diamond Sports Group, LLC: | | | | | | | | |
| | | |
Term Loan, 11.208%, (SOFR + 8.10%), 5/26/26 | | | | | 5,029 | | | | 4,847,859 | |
| | | |
Term Loan - Second Lien, 6.458%, (SOFR + 3.35%), 8/24/26 | | | | | 23,126 | | | | 4,627,593 | |
| | | |
Entravision Communications Corporation, Term Loan, 6.504%, (1 mo. USD LIBOR + 2.75%), 11/29/24 | | | | | 7,139 | | | | 6,996,184 | |
| | | |
Gray Television, Inc., Term Loan, 6.128%, (1 mo. USD LIBOR + 3.00%), 12/1/28 | | | | | 1,042 | | | | 1,029,658 | |
| | | |
Hubbard Radio, LLC, Term Loan, 8.01%, (1 mo. USD LIBOR + 4.25%), 3/28/25 | | | | | 6,333 | | | | 5,235,431 | |
| | | |
iHeartCommunications, Inc., Term Loan, 6.754%, (1 mo. USD LIBOR + 3.00%), 5/1/26 | | | | | 2,365 | | | | 2,240,716 | |
| | | | |
| | 40 | | See Notes to Financial Statements. |
Eaton Vance
Floating Rate Portfolio
October 31, 2022
Portfolio of Investments — continued
| | | | | | | | | | |
| Borrower/Description | | | | Principal Amount* (000’s omitted) | | | Value | |
|
| Media (continued) | |
| | | |
Magnite, Inc., Term Loan, 8.642%, (USD LIBOR + 5.00%), 4/28/28(9) | | | | | 6,370 | | | $ | 6,019,995 | |
| | | |
Mission Broadcasting, Inc., Term Loan, 5.628%, (1 mo. USD LIBOR + 2.50%), 6/2/28 | | | | | 3,654 | | | | 3,624,823 | |
| | | |
MJH Healthcare Holdings, LLC, Term Loan, 7.329%, (SOFR + 3.50%), 1/28/29 | | | | | 3,706 | | | | 3,521,056 | |
| | | |
Nexstar Broadcasting, Inc., Term Loan, 6.254%, (1 mo. USD LIBOR + 2.50%), 9/18/26 | | | | | 3,989 | | | | 3,955,356 | |
| | | |
Recorded Books, Inc., Term Loan, 7.578%, (SOFR + 4.00%), 8/29/25 | | | | | 12,877 | | | | 12,544,326 | |
| | | |
| Sinclair Television Group, Inc.: | | | | | | | | |
| | | |
Term Loan, 6.26%, (1 mo. USD LIBOR + 2.50%), 9/30/26 | | | | | 6,232 | | | | 5,903,499 | |
| | | |
Term Loan, 6.76%, (1 mo. USD LIBOR + 3.00%), 4/1/28 | | | | | 22,904 | | | | 21,334,824 | |
| | | |
| Univision Communications, Inc.: | | | | | | | | |
| | | |
Term Loan, 6.504%, (1 mo. USD LIBOR + 2.75%), 3/15/24 | | | | | 7,012 | | | | 6,996,325 | |
| | | |
Term Loan, 7.004%, (1 mo. USD LIBOR + 3.25%), 3/15/26 | | | | | 18,374 | | | | 17,855,378 | |
| |
| | | | $ | 155,383,877 | |
|
| Metals/Mining — 0.5% | |
| | | |
American Consolidated Natural Resources, Inc., Term Loan, 20.33%, (3 mo. USD LIBOR + 13.00%), 17.33% cash, 3.00% PIK, 9/16/25 | | | | | 429 | | | $ | 431,722 | |
| | | |
| Dynacast International, LLC: | | | | | | | | |
| | | |
Term Loan, 7.48%, (3 mo. USD LIBOR + 4.50%), 7/22/25 | | | | | 15,337 | | | | 13,074,881 | |
| | | |
Term Loan, 11.98%, (3 mo. USD LIBOR + 9.00%), 10/22/25 | | | | | 3,065 | | | | 2,605,181 | |
| | | |
WireCo WorldGroup, Inc., Term Loan, 7.188%, (3 mo. USD LIBOR + 4.25%), 11/13/28 | | | | | 8,975 | | | | 8,787,855 | |
| | | |
Zekelman Industries, Inc., Term Loan, 5.604%, (3 mo. USD LIBOR + 2.00%), 1/24/27 | | | | | 15,456 | | | | 15,044,185 | |
| |
| | | | $ | 39,943,824 | |
|
| Oil, Gas & Consumable Fuels — 1.5% | |
| | | |
Buckeye Partners, L.P., Term Loan, 5.365%, (1 mo. USD LIBOR + 2.25%), 11/1/26 | | | | | 8,273 | | | $ | 8,190,521 | |
| | | |
| Centurion Pipeline Company, LLC: | | | | | | | | |
| | | |
Term Loan, 7.004%, (1 mo. USD LIBOR + 3.25%), 9/29/25 | | | | | 3,120 | | | | 3,088,986 | |
| | | |
Term Loan, 7.754%, (1 mo. USD LIBOR + 4.00%), 9/28/25 | | | | | 1,629 | | | | 1,609,516 | |
| | | |
CITGO Petroleum Corporation, Term Loan, 10.004%, (1 mo. USD LIBOR + 6.25%), 3/28/24 | | | | | 17,681 | | | | 17,728,354 | |
| | | |
Delek US Holdings, Inc., Term Loan, 9.254%, (1 mo. USD LIBOR + 5.50%), 3/31/25 | | | | | 5,739 | | | | 5,692,119 | |
| | | | | | | | | | |
| Borrower/Description | | | | Principal Amount* (000’s omitted) | | | Value | |
|
| Oil, Gas & Consumable Fuels (continued) | |
| | | |
Freeport LNG Investments, LLLP, Term Loan, 7.743%, (3 mo. USD LIBOR + 3.50%), 12/21/28 | | | | | 16,874 | | | $ | 15,835,798 | |
| | | |
GIP II Blue Holding, L.P, Term Loan, 8.174%, (3 mo. USD LIBOR + 4.50%), 9/29/28 | | | | | 15,994 | | | | 15,889,483 | |
| | | |
Matador Bidco S.a.r.l., Term Loan, 8.254%, (1 mo. USD LIBOR + 4.50%), 10/15/26 | | | | | 32,570 | | | | 31,958,915 | |
| | | |
Oryx Midstream Services Permian Basin, LLC, Term Loan, 6.211%, (3 mo. USD LIBOR + 3.25%), 10/5/28 | | | | | 3,694 | | | | 3,647,425 | |
| | | |
Oxbow Carbon, LLC, Term Loan, 7.878%, (3 mo. USD LIBOR + 4.25%), 10/17/25 | | | | | 5,476 | | | | 5,459,530 | |
| | | |
QuarterNorth Energy Holding, Inc., Term Loan - Second Lien, 11.754%, (1 mo. USD LIBOR + 8.00%), 8/27/26 | | | | | 5,729 | | | | 5,714,831 | |
| | | |
UGI Energy Services, LLC, Term Loan, 7.254%, (1 mo. USD LIBOR + 3.50%), 8/13/26 | | | | | 8,946 | | | | 8,914,257 | |
| |
| | | | $ | 123,729,735 | |
|
| Personal Products — 0.4% | |
| | | |
HLF Financing S.a.r.l., Term Loan, 6.254%, (1 mo. USD LIBOR + 2.50%), 8/18/25 | | | | | 9,683 | | | $ | 9,355,114 | |
| | | |
Rainbow Finco S.a.r.l., Term Loan, 4.658%, (6 mo. EURIBOR + 3.75%), 2/24/29 | | EUR | | | 14,125 | | | | 13,185,460 | |
| | | |
Sunshine Luxembourg VII S.a.r.l., Term Loan, 7.424%, (3 mo. USD LIBOR + 3.75%), 10/1/26 | | | | | 6,448 | | | | 6,146,214 | |
| |
| | | | $ | 28,686,788 | |
|
| Pharmaceuticals — 1.6% | |
| | | |
Aenova Holding GmbH, Term Loan, 5.034%, (6 mo. EURIBOR + 4.50%), 3/6/26 | | EUR | | | 2,925 | | | $ | 2,514,849 | |
| | | |
AI Sirona (Luxembourg) Acquisition S.a.r.l., Term Loan, 4.383%, (1 mo. EURIBOR + 3.25%), 9/29/25 | | EUR | | | 13,000 | | | | 12,076,412 | |
| | | |
Akorn, Inc., Term Loan, 11.243%, (3 mo. USD LIBOR + 7.50%), 10/1/25 | | | | | 2,996 | | | | 2,845,986 | |
| | | |
Amneal Pharmaceuticals, LLC, Term Loan, 7.251%, (USD LIBOR + 3.50%), 5/4/25(9) | | | | | 13,385 | | | | 11,479,703 | |
| | | |
Bausch Health Companies, Inc., Term Loan, 8.624%, (SOFR + 5.25%), 2/1/27 | | | | | 18,823 | | | | 14,151,142 | |
| | | |
| Horizon Therapeutics USA, Inc.: | | | | | | | | |
| | | |
Term Loan, 5.375%, (1 mo. USD LIBOR + 1.75%), 3/15/28 | | | | | 16,696 | | | | 16,398,365 | |
| | | |
Term Loan, 5.625%, (1 mo. USD LIBOR + 2.00%), 5/22/26 | | | | | 7,802 | | | | 7,673,665 | |
| | | |
Jazz Financing Lux S.a.r.l., Term Loan, 7.254%, (1 mo. USD LIBOR + 3.50%), 5/5/28 | | | | | 7,075 | | | | 7,005,123 | |
| | | |
| Mallinckrodt International Finance S.A.: | | | | | | | | |
| | | |
Term Loan, 8.733%, (3 mo. USD LIBOR + 5.25%), 9/30/27 | | | | | 36,851 | | | | 30,010,621 | |
| | | | |
| | 41 | | See Notes to Financial Statements. |
Eaton Vance
Floating Rate Portfolio
October 31, 2022
Portfolio of Investments — continued
| | | | | | | | | | |
| Borrower/Description | | | | Principal Amount* (000’s omitted) | | | Value | |
|
| Pharmaceuticals (continued) | |
|
| Mallinckrodt International Finance S.A.: (continued) | |
| | | |
Term Loan, 8.983%, (3 mo. USD LIBOR + 5.50%), 9/30/27 | | | | | 10,080 | | | $ | 8,231,703 | |
| | | |
PharmaZell GmbH, Term Loan, 5.193%, (1 mo. EURIBOR + 4.00%), 5/12/27 | | EUR | | | 1,800 | | | | 1,698,801 | |
| | | |
Recipharm AB, Term Loan, 3.539%, (3 mo. EURIBOR + 3.20%), 2/17/28 | | EUR | | | 13,725 | | | | 12,275,173 | |
| |
| | | | $ | 126,361,543 | |
|
| Professional Services — 1.7% | |
| | | |
AlixPartners, LLP, Term Loan, 4.443%, (3 mo. EURIBOR + 3.25%), 2/4/28 | | EUR | | | 3,472 | | | $ | 3,251,182 | |
| | | |
APFS Staffing Holdings, Inc., Term Loan, 8.044%, (SOFR + 4.00%), 12/29/28(9) | | | | | 3,706 | | | | 3,595,184 | |
| | | |
Blitz 20-487 GmbH, Term Loan, 4.805%, (3 mo. EURIBOR + 3.20%), 4/28/28 | | EUR | | | 7,525 | | | | 6,999,680 | |
| | | |
| Brown Group Holding, LLC: | | | | | | | | |
| | | |
Term Loan, 6.254%, (1 mo. USD LIBOR + 2.50%), 6/7/28 | | | | | 12,656 | | | | 12,318,552 | |
| | | |
Term Loan, 7.419%, (SOFR + 3.75%), 7/2/29 | | | | | 3,575 | | | | 3,541,037 | |
| | | |
CoreLogic, Inc., Term Loan, 7.313%, (1 mo. USD LIBOR + 3.50%), 6/2/28 | | | | | 19,256 | | | | 14,189,067 | |
| | | |
Deerfield Dakota Holding, LLC, Term Loan, 7.479%, (SOFR + 3.75%), 4/9/27 | | | | | 17,511 | | | | 16,605,455 | |
| | | |
EAB Global, Inc., Term Loan, 7.254%, (1 mo. USD LIBOR + 3.50%), 8/16/28 | | | | | 14,540 | | | | 13,918,535 | |
| | | |
Employbridge, LLC, Term Loan, 8.424%, (3 mo. USD LIBOR + 4.75%), 7/19/28 | | | | | 20,810 | | | | 17,851,833 | |
| | | |
First Advantage Holdings, LLC, Term Loan, 6.504%, (1 mo. USD LIBOR + 2.75%), 1/31/27 | | | | | 5,857 | | | | 5,792,742 | |
| | | |
Rockwood Service Corporation, Term Loan, 8.004%, (1 mo. USD LIBOR + 4.25%), 1/23/27 | | | | | 5,471 | | | | 5,347,631 | |
| | | |
Trans Union, LLC, Term Loan, 6.004%, (1 mo. USD LIBOR + 2.25%), 12/1/28 | | | | | 32,247 | | | | 31,790,474 | |
| | | |
Vaco Holdings, LLC, Term Loan, 8.708%, (SOFR + 5.00%), 1/21/29(9) | | | | | 3,697 | | | | 3,613,878 | |
| |
| | | | $ | 138,815,250 | |
|
| Real Estate Management & Development — 0.5% | |
| | | |
Cushman & Wakefield U.S. Borrower, LLC, Term Loan, 6.504%, (1 mo. USD LIBOR + 2.75%), 8/21/25 | | | | | 29,388 | | | $ | 28,797,100 | |
| | | |
RE/MAX International, Inc., Term Loan, 6.313%, (1 mo. USD LIBOR + 2.50%), 7/21/28 | | | | | 16,417 | | | | 15,534,764 | |
| |
| | | | $ | 44,331,864 | |
|
| Road & Rail — 1.8% | |
| | | |
Avis Budget Car Rental, LLC, Term Loan, 5.51%, (1 mo. USD LIBOR + 1.75%), 8/6/27 | | | | | 6,995 | | | $ | 6,791,887 | |
| | | | | | | | | | |
| Borrower/Description | | | | Principal Amount* (000’s omitted) | | | Value | |
|
| Road & Rail (continued) | |
| | | |
Grab Holdings, Inc., Term Loan, 8.26%, (1 mo. USD LIBOR + 4.50%), 1/29/26 | | | | | 45,571 | | | $ | 43,071,775 | |
| | | |
| Hertz Corporation, (The): | | | | | | | | |
| | | |
Term Loan, 7.01%, (1 mo. USD LIBOR + 3.25%), 6/30/28 | | | | | 13,502 | | | | 13,046,525 | |
| | | |
Term Loan, 7.01%, (1 mo. USD LIBOR + 3.25%), 6/30/28 | | | | | 2,577 | | | | 2,489,892 | |
| | | |
Kenan Advantage Group, Inc., Term Loan, 7.504%, (1 mo. USD LIBOR + 3.75%), 3/24/26 | | | | | 14,855 | | | | 14,203,729 | |
| | | |
| Uber Technologies, Inc.: | | | | | | | | |
| | | |
Term Loan, 6.57%, (3 mo. USD LIBOR + 3.50%), 4/4/25 | | | | | 41,325 | | | | 41,084,166 | |
| | | |
Term Loan, 6.57%, (3 mo. USD LIBOR + 3.50%), 2/25/27 | | | | | 24,720 | | | | 24,497,867 | |
| | | |
XPO Logistics, Inc., Term Loan, 4.936%, (1 mo. USD LIBOR + 1.75%), 2/24/25 | | | | | 4,275 | | | | 4,219,224 | |
| |
| | | | $ | 149,405,065 | |
|
| Semiconductors & Semiconductor Equipment — 1.2% | |
| | | |
| Altar Bidco, Inc.: | | | | | | | | |
| | | |
Term Loan, 5.368%, (SOFR + 3.35%), 2/1/29(9) | | | | | 23,815 | | | $ | 22,341,740 | |
| | | |
Term Loan - Second Lien, 7.355%, (SOFR + 5.60%), 2/1/30 | | | | | 6,650 | | | | 5,741,164 | |
| | | |
Bright Bidco B.V., DIP Loan, 10.903%, (SOFR + 8.00%), 2/28/23 | | | | | 3,376 | | | | 3,021,834 | |
| | | |
Entegris, Inc., Term Loan, 5.708%, (SOFR + 3.00%), 7/6/29 | | | | | 2,500 | | | | 2,491,015 | |
| | | |
MACOM Technology Solutions Holdings, Inc., Term Loan, 6.004%, (1 mo. USD LIBOR + 2.25%), 5/17/24 | | | | | 555 | | | | 546,039 | |
| | | |
MaxLinear, Inc., Term Loan, 5.882%, (1 mo. USD LIBOR + 2.25%), 6/23/28 | | | | | 3,546 | | | | 3,484,366 | |
| | | |
| MKS Instruments, Inc.: | | | | | | | | |
| | | |
Term Loan, 3.913%, (1 mo. EURIBOR + 3.00%), 8/17/29 | | EUR | | | 5,625 | | | | 5,406,035 | |
| | | |
Term Loan, 6.317%, (SOFR + 2.75%), 8/17/29 | | | | | 47,750 | | | | 46,829,810 | |
| | | |
Synaptics Incorporated, Term Loan, 4.356%, (3 mo. USD LIBOR + 2.25%), 12/2/28 | | | | | 2,784 | | | | 2,756,470 | |
| | | |
Ultra Clean Holdings, Inc., Term Loan, 7.504%, (1 mo. USD LIBOR + 3.75%), 8/27/25 | | | | | 2,109 | | | | 2,088,013 | |
| |
| | | | $ | 94,706,486 | |
|
| Software — 14.9% | |
| | | |
| Applied Systems, Inc.: | | | | | | | | |
| | | |
Term Loan, 6.674%, (3 mo. USD LIBOR + 3.00%), 9/19/24 | | | | | 43,880 | | | $ | 43,394,209 | |
| | | |
Term Loan - Second Lien, 9.174%, (3 mo. USD LIBOR + 5.50%), 9/19/25 | | | | | 3,707 | | | | 3,663,414 | |
| | | | |
| | 42 | | See Notes to Financial Statements. |
Eaton Vance
Floating Rate Portfolio
October 31, 2022
Portfolio of Investments — continued
| | | | | | | | | | |
| Borrower/Description | | | | Principal Amount* (000’s omitted) | | | Value | |
|
| Software (continued) | |
| | | |
| AppLovin Corporation: | | | | | | | | |
| | | |
Term Loan, 6.674%, (3 mo. USD LIBOR + 3.00%), 10/25/28 | | | | | 17,811 | | | $ | 17,203,839 | |
| | | |
Term Loan, 7.004%, (1 mo. USD LIBOR + 3.25%), 8/15/25 | | | | | 43,004 | | | | 42,137,373 | |
| | | |
| Aptean, Inc.: | | | | | | | | |
| | | |
Term Loan, 7.32%, (3 mo. USD LIBOR + 4.25%), 4/23/26 | | | | | 26,142 | | | | 25,096,027 | |
| | | |
Term Loan - Second Lien, 10.07%, (3 mo. USD LIBOR + 7.00%), 4/23/27 | | | | | 6,550 | | | | 6,255,250 | |
| | | |
AQA Acquisition Holding, Inc., Term Loan, 7.32%, (3 mo. USD LIBOR + 4.25%), 3/3/28 | | | | | 2,736 | | | | 2,629,875 | |
| | | |
| Astra Acquisition Corp.: | | | | | | | | |
| | | |
Term Loan, 9.004%, (1 mo. USD LIBOR + 5.25%), 10/25/28 | | | | | 13,017 | | | | 11,346,099 | |
| | | |
Term Loan - Second Lien, 12.629%, (1 mo. USD LIBOR + 8.88%), 10/25/29 | | | | | 20,170 | | | | 18,455,687 | |
| | | |
| Banff Merger Sub, Inc.: | | | | | | | | |
| | | |
Term Loan, 5.133%, (3 mo. EURIBOR + 4.00%), 10/2/25 | | EUR | | | 1,927 | | | | 1,793,039 | |
| | | |
Term Loan, 7.504%, (1 mo. USD LIBOR + 3.75%), 10/2/25 | | | | | 18,882 | | | | 18,190,712 | |
| | | |
Term Loan - Second Lien, 9.254%, (1 mo. USD LIBOR + 5.50%), 2/27/26 | | | | | 13,521 | | | | 12,456,394 | |
| | | |
| Cast and Crew Payroll, LLC: | | | | | | | | |
| | | |
Term Loan, 7.254%, (1 mo. USD LIBOR + 3.50%), 2/9/26 | | | | | 8,482 | | | | 8,357,912 | |
| | | |
Term Loan, 7.478%, (SOFR + 3.75%), 12/29/28 | | | | | 6,154 | | | | 6,070,809 | |
| | | |
CDK Global, Inc., Term Loan, 8.112%, (SOFR + 4.50%), 7/6/29 | | | | | 33,975 | | | | 33,333,246 | |
| | | |
CentralSquare Technologies, LLC, Term Loan, 7.424%, (3 mo. USD LIBOR + 3.75%), 8/29/25 | | | | | 18,552 | | | | 16,158,979 | |
| | | |
Ceridian HCM Holding, Inc., Term Loan, 6.254%, (1 mo. USD LIBOR + 2.50%), 4/30/25 | | | | | 10,008 | | | | 9,708,751 | |
| | | |
| Cloudera, Inc.: | | | | | | | | |
| | | |
Term Loan, 7.504%, (1 mo. USD LIBOR + 3.75%), 10/8/28 | | | | | 30,916 | | | | 28,906,811 | |
| | | |
Term Loan - Second Lien, 9.754%, (1 mo. USD LIBOR + 6.00%), 10/8/29 | | | | | 8,550 | | | | 7,096,500 | |
| | | |
ConnectWise, LLC, Term Loan, 7.174%, (3 mo. USD LIBOR + 3.50%), 9/29/28 | | | | | 13,399 | | | | 12,702,015 | |
| | | |
Constant Contact, Inc., Term Loan, 7.909%, (3 mo. USD LIBOR + 4.00%), 2/10/28 | | | | | 12,096 | | | | 10,529,796 | |
| | | |
Cornerstone OnDemand, Inc., Term Loan, 7.504%, (1 mo. USD LIBOR + 3.75%), 10/16/28 | | | | | 15,622 | | | | 13,122,060 | |
| | | |
Delta TopCo, Inc., Term Loan, 5.836%, (3 mo. USD LIBOR + 3.75%), 12/1/27 | | | | | 13,528 | | | | 12,386,213 | |
| | | |
E2open, LLC, Term Loan, 6.644%, (3 mo. USD LIBOR + 3.50%), 2/4/28 | | | | | 16,340 | | | | 15,962,052 | |
| | | | | | | | | | |
| Borrower/Description | | | | Principal
Amount* (000’s omitted) | | | Value | |
|
| Software (continued) | |
| | | |
ECI Macola Max Holding, LLC, Term Loan, 7.424%, (3 mo. USD LIBOR + 3.75%), 11/9/27 | | | | | 26,923 | | | $ | 26,104,245 | |
| | | |
Epicor Software Corporation, Term Loan, 7.004%, (1 mo. USD LIBOR + 3.25%), 7/30/27 | | | | | 46,523 | | | | 44,272,743 | |
| | | |
| Finastra USA, Inc.: | | | | | | | | |
| | | |
Term Loan, 6.871%, (3 mo. USD LIBOR + 3.50%), 6/13/24 | | | | | 57,999 | | | | 52,677,932 | |
| | | |
Term Loan - Second Lien, 10.621%, (6 mo. USD LIBOR + 7.25%), 6/13/25 | | | | | 25,750 | | | | 19,248,125 | |
| | | |
Fiserv Investment Solutions, Inc., Term Loan, 6.961%, (3 mo. USD LIBOR + 4.00%), 2/18/27 | | | | | 5,867 | | | | 5,555,742 | |
| | | |
GoTo Group, Inc., Term Loan, 8.322%, (1 mo. USD LIBOR + 4.75%), 8/31/27 | | | | | 24,408 | | | | 15,743,117 | |
| | | |
Greeneden U.S. Holdings II, LLC, Term Loan, 5.855%, (3 mo. EURIBOR + 4.25%), 12/1/27 | | EUR | | | 1,228 | | | | 1,172,226 | |
| | | |
| Hyland Software, Inc.: | | | | | | | | |
| | | |
Term Loan, 7.254%, (1 mo. USD LIBOR + 3.50%), 7/1/24 | | | | | 61,331 | | | | 59,912,800 | |
| | | |
Term Loan - Second Lien, 10.004%, (1 mo. USD LIBOR + 6.25%), 7/7/25 | | | | | 1,750 | | | | 1,682,187 | |
| | | |
| IGT Holding IV AB: | | | | | | | | |
| | | |
Term Loan, 4.093%, (3 mo. EURIBOR + 2.90%), 3/31/28 | | EUR | | | 6,205 | | | | 5,689,679 | |
| | | |
Term Loan, 7.074%, (3 mo. USD LIBOR + 3.40%), 3/31/28 | | | | | 4,056 | | | | 3,944,720 | |
| | | |
| Ivanti Software, Inc.: | | | | | | | | |
| | | |
Term Loan, 7.332%, (3 mo. USD LIBOR + 4.25%), 12/1/27 | | | | | 13,948 | | | | 10,531,025 | |
| | | |
Term Loan - Second Lien, 10.332%, (3 mo. USD LIBOR + 7.25%), 12/1/28 | | | | | 9,750 | | | | 6,548,753 | |
| | | |
MA FinanceCo., LLC, Term Loan, 7.418%, (3 mo. USD LIBOR + 4.25%), 6/5/25 | | | | | 12,363 | | | | 12,301,566 | |
| | | |
| Magenta Buyer, LLC: | | | | | | | | |
| | | |
Term Loan, 9.17%, (3 mo. USD LIBOR + 4.75%), 7/27/28 | | | | | 51,109 | | | | 44,831,982 | |
| | | |
Term Loan - Second Lien, 12.67%, (3 mo. USD LIBOR + 8.25%), 7/27/29 | | | | | 16,175 | | | | 13,964,411 | |
| | | |
| Marcel LUX IV S.a.r.l.: | | | | | | | | |
| | | |
Term Loan, 4.693%, (3 mo. EURIBOR + 3.50%), 3/16/26 | | EUR | | | 8,650 | | | | 8,115,599 | |
| | | |
Term Loan, 6.979%, (SOFR + 3.25%), 3/15/26 | | | | | 11,597 | | | | 11,394,235 | |
| | | |
Term Loan, 7.125%, (SOFR + 4.00%), 12/31/27 | | | | | 731 | | | | 718,531 | |
| | | |
| Maverick Bidco, Inc.: | | | | | | | | |
| | | |
Term Loan, 8.165%, (3 mo. USD LIBOR + 3.75%), 5/18/28 | | | | | 11,070 | | | | 10,544,320 | |
| | | |
Term Loan - Second Lien, 11.165%, (3 mo. USD LIBOR + 6.75%), 5/18/29 | | | | | 3,175 | | | | 2,984,500 | |
| | | |
| McAfee, LLC: | | | | | | | | |
| | | |
Term Loan, 5.604%, (EURIBOR + 4.00%), 3/1/29(9) | | EUR | | | 16,608 | | | | 15,342,259 | |
| | | | |
| | 43 | | See Notes to Financial Statements. |
Eaton Vance
Floating Rate Portfolio
October 31, 2022
Portfolio of Investments — continued
| | | | | | | | | | |
| Borrower/Description | | | | Principal Amount* (000’s omitted) | | | Value | |
|
| Software (continued) | |
| | | |
| McAfee, LLC: (continued) | | | | | | | | |
| | | |
Term Loan, 6.87%, (SOFR + 3.75%), 3/1/29 | | | | | 38,578 | | | $ | 35,267,020 | |
| | | |
Mediaocean, LLC, Term Loan, 7.254%, (1 mo. USD LIBOR + 3.50%), 12/15/28 | | | | | 6,015 | | | | 5,668,914 | |
| | | |
MH Sub I, LLC, Term Loan, 7.504%, (1 mo. USD LIBOR + 3.75%), 9/13/24 | | | | | 4,850 | | | | 4,678,720 | |
| | | |
Mitnick Corporate Purchaser, Inc., Term Loan, 8.944%, (SOFR + 4.75%), 5/2/29 | | | | | 6,975 | | | | 6,662,869 | |
| | | |
N-Able International Holdings II, LLC, Term Loan, 6.07%, (3 mo. USD LIBOR + 3.00%), 7/19/28 | | | | | 1,277 | | | | 1,238,624 | |
| | | |
NortonLifeLock, Inc., Term Loan, 5.829%, (SOFR + 2.00%), 9/12/29 | | | | | 1,775 | | | | 1,736,330 | |
| | | |
Panther Commercial Holdings, L.P., Term Loan, 8.665%, (3 mo. USD LIBOR + 4.25%), 1/7/28 | | | | | 21,055 | | | | 19,067,938 | |
| | | |
| Polaris Newco, LLC: | | | | | | | | |
| | | |
Term Loan, 5.193%, (3 mo. EURIBOR + 4.00%), 6/2/28 | | EUR | | | 8,564 | | | | 7,884,583 | |
| | | |
Term Loan, 7.674%, (3 mo. USD LIBOR + 4.00%), 6/2/28 | | | | | 13,022 | | | | 11,942,605 | |
| | | |
Proofpoint, Inc., Term Loan, 6.32%, (3 mo. USD LIBOR + 3.25%), 8/31/28 | | | | | 46,914 | | | | 44,722,404 | |
| | | |
Quest Software US Holdings, Inc., Term Loan, 8.494%, (SOFR + 4.25%), 2/1/29 | | | | | 24,389 | | | | 18,132,446 | |
| | | |
RealPage, Inc., Term Loan, 6.754%, (1 mo. USD LIBOR + 3.00%), 4/24/28 | | | | | 25,368 | | | | 23,896,705 | |
| | | |
Red Planet Borrower, LLC, Term Loan, 7.504%, (1 mo. USD LIBOR + 3.75%), 10/2/28 | | | | | 15,345 | | | | 9,470,136 | |
| | | |
Redstone Holdco 2 L.P., Term Loan, 9.108%, (3 mo. USD LIBOR + 4.75%), 4/27/28 | | | | | 18,928 | | | | 13,748,875 | |
| | | |
| Sabre GLBL, Inc.: | | | | | | | | |
| | | |
Term Loan, 7.254%, (1 mo. USD LIBOR + 3.50%), 12/17/27 | | | | | 6,029 | | | | 5,410,859 | |
| | | |
Term Loan, 7.254%, (1 mo. USD LIBOR + 3.50%), 12/17/27 | | | | | 3,782 | | | | 3,394,390 | |
| | | |
Seattle Spinco, Inc., Term Loan, 6.504%, (1 mo. USD LIBOR + 2.75%), 6/21/24 | | | | | 10,389 | | | | 10,307,076 | |
| | | |
SkillSoft Corporation, Term Loan, 8.473%, (SOFR + 5.25%), 7/14/28 | | | | | 10,450 | | | | 8,689,197 | |
| | | |
SolarWinds Holdings, Inc., Term Loan, 6.504%, (1 mo. USD LIBOR + 2.75%), 2/5/24 | | | | | 19,531 | | | | 19,376,620 | |
| | | |
Sophia, L.P., Term Loan, 7.174%, (3 mo. USD LIBOR + 3.50%), 10/7/27 | | | | | 23,428 | | | | 22,636,883 | |
| | | |
Sovos Compliance, LLC, Term Loan, 8.254%, (1 mo. USD LIBOR + 4.50%), 8/11/28 | | | | | 10,434 | | | | 10,129,261 | |
| | | |
Sportradar Capital S.a.r.l., Term Loan, 4.443%, (1 mo. EURIBOR + 3.50%), 11/22/27 | | EUR | | | 7,804 | | | | 7,403,596 | |
| | | |
SS&C European Holdings S.a.r.l., Term Loan, 5.504%, (1 mo. USD LIBOR + 1.75%), 4/16/25 | | | | | 5,213 | | | | 5,112,226 | |
| | | | | | | | | | |
| Borrower/Description | | | | Principal Amount* (000’s omitted) | | | Value | |
|
| Software (continued) | |
| | | |
| SS&C Technologies, Inc.: | | | | | | | | |
| | | |
Term Loan, 5.504%, (1 mo. USD LIBOR + 1.75%), 4/16/25 | | | | | 6,422 | | | $ | 6,297,431 | |
| | | |
Term Loan, 6.079%, (SOFR + 2.25%), 3/22/29 | | | | | 3,428 | | | | 3,371,036 | |
| | | |
Term Loan, 6.079%, (SOFR + 2.25%), 3/22/29 | | | | | 5,166 | | | | 5,079,378 | |
| | | |
SurveyMonkey, Inc., Term Loan, 7.51%, (1 mo. USD LIBOR + 3.75%), 10/10/25 | | | | | 11,443 | | | | 11,099,712 | |
| | | |
Turing Midco, LLC, Term Loan, 6.504%, (1 mo. USD LIBOR + 2.75%), 3/23/28 | | | | | 635 | | | | 625,141 | |
| | | |
| Ultimate Software Group, Inc. (The): | | | | | | | | |
| | | |
Term Loan, 6.998%, (3 mo. USD LIBOR + 3.25%), 5/4/26 | | | | | 48,539 | | | | 46,950,182 | |
| | | |
Term Loan, 7.504%, (1 mo. USD LIBOR + 3.75%), 5/4/26 | | | | | 18,884 | | | | 18,394,932 | |
| | | |
Term Loan - Second Lien, 8.998%, (1 mo. USD LIBOR + 5.25%), 5/3/27 | | | | | 1,450 | | | | 1,342,458 | |
| | | |
Veritas US, Inc., Term Loan, 8.674%, (3 mo. USD LIBOR + 5.00%), 9/1/25 | | | | | 13,783 | | | | 11,037,913 | |
| | | |
Vision Solutions, Inc., Term Loan, 8.358%, (3 mo. USD LIBOR + 4.00%), 4/24/28 | | | | | 36,453 | | | | 31,075,984 | |
| | | |
VS Buyer, LLC, Term Loan, 6.754%, (1 mo. USD LIBOR + 3.00%), 2/28/27 | | | | | 21,464 | | | | 20,927,483 | |
| |
| | | | $ | 1,203,017,686 | |
|
| Specialty Retail — 2.1% | |
| | | |
Belron Finance US, LLC, Term Loan, 5.375%, (3 mo. USD LIBOR + 2.50%), 4/13/28 | | | | | 7,708 | | | $ | 7,598,031 | |
| | | |
Belron Luxembourg S.a.r.l., Term Loan, 2.769%, (3 mo. EURIBOR + 2.50%), 4/13/28 | | EUR | | | 3,575 | | | | 3,309,973 | |
| | | |
Boels Topholding B.V., Term Loan, 3.571%, (3 mo. EURIBOR + 3.25%), 2/6/27 | | EUR | | | 7,750 | | | | 7,270,244 | |
| | | |
| David’s Bridal, Inc.: | | | | | | | | |
| | | |
Term Loan, 9.42%, (3 mo. USD LIBOR + 5.00%), 4.42% cash, 5.00% PIK, 6/23/23 | | | | | 3,942 | | | | 3,798,692 | |
| | | |
Term Loan, 9.754%, (1 mo. USD LIBOR + 6.00%), 6/30/23 | | | | | 4,724 | | | | 4,421,866 | |
| | | |
Great Outdoors Group, LLC, Term Loan, 7.504%, (1 mo. USD LIBOR + 3.75%), 3/6/28 | | | | | 44,635 | | | | 42,161,042 | |
| | | |
Harbor Freight Tools USA, Inc., Term Loan, 6.504%, (1 mo. USD LIBOR + 2.75%), 10/19/27 | | | | | 32,996 | | | | 31,011,944 | |
| | | |
| L1R HB Finance Limited: | | | | | | | | |
| | | |
Term Loan, 6.016%, (6 mo. EURIBOR + 4.25%), 9/2/24 | | EUR | | | 4,674 | | | | 3,475,496 | |
| | | |
Term Loan, 7.217%, (SONIA + 5.25%), 9/2/24 | | GBP | | | 9,172 | | | | 7,941,484 | |
| | | |
Les Schwab Tire Centers, Term Loan, 6.58%, (3 mo. USD LIBOR + 3.25%), 11/2/27 | | | | | 27,454 | | | | 26,732,982 | |
| | | |
LIDS Holdings, Inc., Term Loan, 8.99%, (SOFR + 5.50%), 12/14/26 | | | | | 5,823 | | | | 4,921,891 | |
| | | | |
| | 44 | | See Notes to Financial Statements. |
Eaton Vance
Floating Rate Portfolio
October 31, 2022
Portfolio of Investments — continued
| | | | | | | | | | |
| Borrower/Description | | | | Principal Amount* (000’s omitted) | | | Value | |
|
| Specialty Retail (continued) | |
| | | |
Mattress Firm, Inc., Term Loan, 8.433%, (3 mo. USD LIBOR + 4.25%), 9/25/28 | | | | | 16,632 | | | $ | 14,287,919 | |
| | | |
PetSmart, Inc., Term Loan, 7.50%, (1 mo. USD LIBOR + 3.75%), 2/11/28 | | | | | 17,351 | | | | 16,740,325 | |
| |
| | | | $ | 173,671,889 | |
|
| Technology Hardware, Storage & Peripherals — 0.1% | |
| | | |
NCR Corporation, Term Loan, 6.92%, (3 mo. USD LIBOR + 2.50%), 8/28/26 | | | | | 8,997 | | | $ | 8,666,866 | |
| |
| | | | $ | 8,666,866 | |
|
| Thrifts & Mortgage Finance — 0.2% | |
| | | |
Ditech Holding Corporation, Term Loan, 0.00%, 6/30/23(12) | | | | | 22,620 | | | $ | 2,827,502 | |
| | | |
Walker & Dunlop, Inc., Term Loan, 6.079%, (SOFR + 2.25%), 12/16/28 | | | | | 12,952 | | | | 12,757,843 | |
| |
| | | | $ | 15,585,345 | |
|
| Trading Companies & Distributors — 2.5% | |
| | | |
American Builders & Contractors Supply Co., Inc., Term Loan, 5.754%, (1 mo. USD LIBOR + 2.00%), 1/15/27 | | | | | 21,461 | | | $ | 21,067,243 | |
| | | |
| Avolon TLB Borrower 1 (US), LLC: | | | | | | | | |
| | | |
Term Loan, 5.239%, (1 mo. USD LIBOR + 1.75%), 1/15/25 | | | | | 25,082 | | | | 24,661,358 | |
| | | |
Term Loan, 5.739%, (1 mo. USD LIBOR + 2.25%), 12/1/27 | | | | | 13,964 | | | | 13,728,508 | |
| | | |
Core & Main L.P., Term Loan, 6.528%, (USD LIBOR + 2.50%), 7/27/28(9) | | | | | 12,431 | | | | 12,155,481 | |
| | | |
DXP Enterprises, Inc., Term Loan, 8.504%, (1 mo. USD LIBOR + 4.75%), 12/16/27 | | | | | 4,225 | | | | 4,038,599 | |
| | | |
Electro Rent Corporation, Term Loan, 9.278%, (3 mo. USD LIBOR + 5.00%), 1/31/24 | | | | | 15,761 | | | | 14,880,759 | |
| | | |
| Hillman Group, Inc. (The): | | | | | | | | |
| | | |
Term Loan, 3.034%, (1 mo. USD LIBOR + 2.75%), 7/14/28(10) | | | | | 875 | | | | 838,043 | |
| | | |
Term Loan, 6.326%, (1 mo. USD LIBOR + 2.75%), 7/14/28 | | | | | 3,619 | | | | 3,466,614 | |
| | | |
Park River Holdings, Inc., Term Loan, 6.993%, (3 mo. USD LIBOR + 3.25%), 12/28/27 | | | | | 10,857 | | | | 9,251,931 | |
| | | |
| Patagonia Bidco Limited: | | | | | | | | |
| | | |
Term Loan, 6.94%, (SONIA + 5.25%), 3/5/29 | | GBP | | | 17,262 | | | | 16,430,285 | |
| | | |
Term Loan, 6.94%, (SONIA + 5.25%), 3/5/29 | | GBP | | | 3,138 | | | | 2,987,325 | |
| | | |
Quimper AB, Term Loan, 4.085%, (3 mo. EURIBOR + 2.93%), 2/16/26 | | EUR | | | 25,175 | | | | 22,971,774 | |
| | | | | | | | | | | | |
| Borrower/Description | | | | | Principal Amount* (000’s omitted) | | | Value | |
|
| Trading Companies & Distributors (continued) | |
| | | |
SiteOne Landscape Supply, LLC, Term Loan, 5.76%, (1 mo. USD LIBOR + 2.00%), 3/23/28 | | | | | | | 3,431 | | | $ | 3,402,666 | |
| | | |
Spin Holdco, Inc., Term Loan, 7.144%, (3 mo. USD LIBOR + 4.00%), 3/4/28 | | | | | | | 42,353 | | | | 37,498,715 | |
| | | |
| SRS Distribution, Inc.: | | | | | | | | | |
| | | |
Term Loan, 7.254%, (1 mo. USD LIBOR + 3.50%), 6/2/28 | | | | | | | 14,325 | | | | 13,343,013 | |
| | | |
Term Loan, 7.329%, (SOFR + 3.50%), 6/2/28 | | | | | | | 5,037 | | | | 4,690,648 | |
| | | |
TricorBraun Holdings, Inc., Term Loan, 7.004%, (1 mo. USD LIBOR + 3.25%), 3/3/28 | | | | | | | 829 | | | | 787,162 | |
| |
| | | | $ | 206,200,124 | |
|
| Wireless Telecommunication Services — 0.2% | |
| | | |
CCI Buyer, Inc., Term Loan, 7.553%, (SOFR + 4.00%), 12/17/27 | | | | | | | 7,914 | | | $ | 7,609,384 | |
| | | |
Digicel International Finance Limited, Term Loan, 7.004%, (1 mo. USD LIBOR + 3.25%), 5/28/24 | | | | | | | 14,057 | | | | 12,100,775 | |
| | | |
| | | | | | | | | | | $ | 19,710,159 | |
| | | |
Total Senior Floating-Rate Loans
(identified cost $7,543,162,144) | | | | | | | | | | $ | 6,829,205,613 | |
|
| Warrants — 0.0% | |
| Security | | | | | Shares | | | Value | |
|
| Leisure Goods/Activities/Movies — 0.0% | |
| | | |
Cineworld Group PLC, Exp. 11/23/25(5)(6) | | | | | | | 1,791,400 | | | $ | 0 | |
| | | |
| | | | | | | | | | | $ | 0 | |
|
| Retailers (Except Food and Drug) — 0.0% | |
| | | |
David’s Bridal, LLC, Exp.
11/26/22(4)(5)(6) | | | | | | | 51,888 | | | $ | 0 | |
| | | |
| | | | | | | | | | | $ | 0 | |
| | | |
Total Warrants
(identified cost $0) | | | | | | | | | | $ | 0 | |
| | | | |
| | 45 | | See Notes to Financial Statements. |
Eaton Vance
Floating Rate Portfolio
October 31, 2022
Portfolio of Investments — continued
| | | | | | | | | | | | |
| Short-Term Investments — 1.9% | | | | | | | | | | | | |
| Security | | | | | Shares | | | Value | |
| | | |
Morgan Stanley Institutional Liquidity Funds - Government Portfolio, Institutional Class, 2.88%(13) | | | | | | | 156,771,808 | | | $ | 156,771,808 | |
| | | |
Total Short-Term Investments
(identified cost $156,771,808) | | | | | | | | | | $ | 156,771,808 | |
| | | |
Total Investments — 97.6%
(identified cost $8,799,948,828) | | | | | | | | | | $ | 7,909,317,423 | |
| | | |
Less Unfunded Loan Commitments — (0.2)% | | | | | | | | | | $ | (15,840,797 | ) |
| | | |
Net Investments — 97.4%
(identified cost $8,784,108,031) | | | | | | | | | | $ | 7,893,476,626 | |
| | | |
Other Assets, Less Liabilities — 2.6% | | | | | | | | | | $ | 207,653,892 | |
| | | |
Net Assets — 100.0% | | | | | | | | | | $ | 8,101,130,518 | |
The percentage shown for each investment category in the Portfolio of Investments is based on net assets.
| | * | In U.S. dollars unless otherwise indicated. |
| | (1) | Security exempt from registration under Rule 144A of the Securities Act of 1933, as amended. These securities may be sold in certain transactions in reliance on an exemption from registration (normally to qualified institutional buyers). At October 31, 2022, the aggregate value of these securities is $828,991,656 or 10.2% of the Portfolio’s net assets. |
| | (2) | Variable rate security. The stated interest rate represents the rate in effect at October 31, 2022. |
| | (3) | Affiliated company (see Note 7). |
| | (4) | For fair value measurement disclosure purposes, security is categorized as Level 3 (see Note 8). |
| | (5) | Non-income producing security. |
| | (6) | Security was acquired in connection with a restructuring of a Senior Loan and may be subject to restrictions on resale. |
| | (7) | Amount is less than 0.05%. |
| | (8) | Senior floating-rate loans (Senior Loans) often require prepayments from excess cash flows or permit the borrowers to repay at their election. The degree to which borrowers repay, whether as a contractual requirement or at their election, cannot be predicted with accuracy. As a result, the actual remaining maturity may be substantially less than the stated maturities shown. However, Senior Loans will typically have an expected average life of approximately two to four years. Senior Loans typically have rates of interest which are redetermined periodically by reference to a base lending rate, plus a spread. These base lending rates are primarily the London Interbank Offered Rate (“LIBOR”) or the Secured Overnight Financing Rate (“SOFR”) and secondarily, the prime rate offered by one or more major United States banks (the “Prime Rate”). Base lending rates may be subject to a floor, or minimum rate. Rates for SOFR are generally 1 or 3-month tenors and may also be subject to a credit spread adjustment. Senior Loans are generally subject to contractual restrictions that must be satisfied before they can be bought or sold. |
| | (9) | The stated interest rate represents the weighted average interest rate at October 31, 2022 of contracts within the senior loan facility. Interest rates on contracts are primarily redetermined either weekly, monthly or quarterly by reference to the indicated base lending rate and spread and the reset period. |
| | (10) | Unfunded or partially unfunded loan commitments. The stated interest rate reflects the weighted average of the reference rate and spread for the funded portion, if any, and the commitment fees on the portion of the loan that is unfunded. At October 31, 2022, the total value of unfunded loan commitments is $13,795,189. See Note 1F for description. |
| | (11) | This Senior Loan will settle after October 31, 2022, at which time the interest rate will be determined. |
| | (12) | Issuer is in default with respect to interest and/or principal payments. For a variable rate security, interest rate has been adjusted to reflect non-accrual status. |
| | (13) | May be deemed to be an affiliated investment company. The rate shown is the annualized seven-day yield as of October 31, 2022. |
| | | | | | | | | | | | | | | | | | | | | | | | |
| Forward Foreign Currency Exchange Contracts (OTC) | | | | | | | | | |
| | | | | |
| Currency Purchased | | | Currency Sold | | | Counterparty | | Settlement
Date | | | Unrealized
Appreciation | | | Unrealized
(Depreciation) | |
| | | | | | | |
| USD | | | 275,596,332 | | | EUR | | | 280,766,698 | | | Standard Chartered Bank | | | 11/2/22 | | | $ | — | | | $ | (1,871,277 | ) |
| | | | | | | |
| USD | | | 278,080,923 | | | EUR | | | 280,766,698 | | | Standard Chartered Bank | | | 12/2/22 | | | | 22,582 | | | | — | |
| | | | | | | |
| USD | | | 4,960,610 | | | EUR | | | 5,000,000 | | | Bank of America, N.A. | | | 12/30/22 | | | | — | | | | (5,433 | ) |
| | | | | | | |
| USD | | | 42,087,033 | | | EUR | | | 43,125,827 | | | Bank of America, N.A. | | | 12/30/22 | | | | — | | | | (745,906 | ) |
| | | | | | | |
| USD | | | 42,096,620 | | | EUR | | | 43,125,827 | | | State Street Bank and Trust Company | | | 12/30/22 | | | | — | | | | (736,319 | ) |
| | | | | | | |
| USD | | | 52,870,587 | | | EUR | | | 54,170,212 | | | State Street Bank and Trust Company | | | 12/30/22 | | | | — | | | | (931,729 | ) |
| | | | | | | |
| USD | | | 41,868,950 | | | EUR | | | 43,125,827 | | | State Street Bank and Trust Company | | | 12/30/22 | | | | — | | | | (963,989 | ) |
| | | | | | | |
| USD | | | 63,152,939 | | | EUR | | | 64,688,740 | | | State Street Bank and Trust Company | | | 12/30/22 | | | | — | | | | (1,096,470 | ) |
| | | | | | | |
| USD | | | 34,826,781 | | | EUR | | | 34,639,475 | | | Bank of America, N.A. | | | 1/31/23 | | | | 338,110 | | | | — | |
| | | | |
| | 46 | | See Notes to Financial Statements. |
Eaton Vance
Floating Rate Portfolio
October 31, 2022
Portfolio of Investments — continued
| | | | | | | | | | | | | | | | | | | | | | | | |
| Forward Foreign Currency Exchange Contracts (OTC) (continued) | | | | | | | | | |
| | | | | |
| Currency Purchased | | | Currency Sold | | | Counterparty | | Settlement
Date | | | Unrealized
Appreciation | | | Unrealized
(Depreciation) | |
| | | | | | | |
| USD | | | 21,802,101 | | | EUR | | | 21,649,672 | | | Bank of America, N.A. | | | 1/31/23 | | | $ | 246,681 | | | $ | — | |
| | | | | | | |
| USD | | | 21,781,830 | | | EUR | | | 21,649,672 | | | Bank of America, N.A. | | | 1/31/23 | | | | 226,411 | | | | — | |
| | | | | | | |
| USD | | | 21,827,065 | | | EUR | | | 21,649,672 | | | Standard Chartered Bank | | | 1/31/23 | | | | 271,645 | | | | — | |
| | | | | | | |
| USD | | | 3,557,817 | | | EUR | | | 3,529,711 | | | Standard Chartered Bank | | | 1/31/23 | | | | 43,472 | | | | — | |
| | | | | | | |
| USD | | | 37,812,864 | | | EUR | | | 37,560,965 | | | State Street Bank and Trust Company | | | 1/31/23 | | | | 415,421 | | | | — | |
| | | | | | | |
| USD | | | 34,876,236 | | | EUR | | | 34,639,475 | | | State Street Bank and Trust Company | | | 1/31/23 | | | | 387,564 | | | | — | |
| | | | | | | |
| USD | | | 34,854,004 | | | EUR | | | 34,639,475 | | | State Street Bank and Trust Company | | | 1/31/23 | | | | 365,333 | | | | — | |
| | | | | | | |
| USD | | | 34,823,366 | | | EUR | | | 34,639,475 | | | State Street Bank and Trust Company | | | 1/31/23 | | | | 334,694 | | | | — | |
| | | | | | | |
| USD | | | 21,780,869 | | | EUR | | | 21,649,672 | | | State Street Bank and Trust Company | | | 1/31/23 | | | | 225,449 | | | | — | |
| | | | | | | |
| USD | | | 27,932,349 | | | GBP | | | 24,042,527 | | | State Street Bank and Trust Company | | | 1/31/23 | | | | 276,020 | | | | — | |
| | | | | | | |
| USD | | | 21,194,786 | | | GBP | | | 18,266,270 | | | State Street Bank and Trust Company | | | 1/31/23 | | | | 182,936 | | | | — | |
| | | | | | | |
| | | | | | | | | | | | | | | | | | | $ | 3,336,318 | | | $ | (6,351,123 | ) |
Abbreviations:
| | | | |
| | |
| DIP | | – | | Debtor In Possession |
| | |
| EURIBOR | | – | | Euro Interbank Offered Rate |
| | |
| LIBOR | | – | | London Interbank Offered Rate |
| | |
| OTC | | – | | Over-the-counter |
| | |
| PIK | | – | | Payment In Kind |
| | |
| SOFR | | – | | Secured Overnight Financing Rate |
| | |
| SONIA | | – | | Sterling Overnight Interbank Average |
Currency Abbreviations:
| | | | |
| | |
| EUR | | – | | Euro |
| | |
| GBP | | – | | British Pound Sterling |
| | |
| USD | | – | | United States Dollar |
| | | | |
| | 47 | | See Notes to Financial Statements. |
Eaton Vance
Floating Rate Portfolio
October 31, 2022
Statement of Assets and Liabilities
| | | | |
| Assets | | October 31, 2022 | |
| |
Unaffiliated investments, at value (identified cost $8,624,990,815) | | $ | 7,728,019,654 | |
| |
Affiliated investments, at value (identified cost $159,117,216) | | | 165,456,972 | |
| |
Cash | | | 60,602,545 | |
| |
Deposits for derivatives collateral — forward foreign currency exchange contracts | | | 9,460,000 | |
| |
Foreign currency, at value (identified cost $6,811,773) | | | 6,806,847 | |
| |
Interest receivable | | | 40,252,490 | |
| |
Dividends receivable from affiliated investments | | | 520,417 | |
| |
Receivable for investments sold | | | 107,467,802 | |
| |
Receivable for open forward foreign currency exchange contracts | | | 3,336,318 | |
| |
Prepaid upfront fees on notes payable | | | 419,817 | |
| |
Other receivables | | | 2,084,589 | |
| |
Prepaid expenses | | | 114,818 | |
| |
Total assets | | $ | 8,124,542,269 | |
|
| Liabilities | |
| |
Cash collateral due to brokers | | $ | 1,260,000 | |
| |
Payable for investments purchased | | | 10,975,850 | |
| |
Payable for open forward foreign currency exchange contracts | | | 6,351,123 | |
| |
Payable to affiliates: | | | | |
| |
Investment adviser fee | | | 3,427,703 | |
| |
Trustees’ fees | | | 9,042 | |
| |
Accrued expenses | | | 1,388,033 | |
| |
Total liabilities | | $ | 23,411,751 | |
| |
Net Assets applicable to investors’ interest in Portfolio | | $ | 8,101,130,518 | |
| | | | |
| | 48 | | See Notes to Financial Statements. |
Eaton Vance
Floating Rate Portfolio
October 31, 2022
Statement of Operations
| | | | |
| Investment Income | | Year Ended October 31, 2022 | |
| |
Dividend income | | $ | 3,256,926 | |
| |
Dividend income from affiliated investments | | | 2,629,727 | |
| |
Interest and other income | | | 464,039,211 | |
| |
Total investment income | | $ | 469,925,864 | |
| |
| Expenses | | | | |
| |
Investment adviser fee | | $ | 46,506,949 | |
| |
Trustees’ fees and expenses | | | 108,500 | |
| |
Custodian fee | | | 1,650,912 | |
| |
Legal and accounting services | | | 561,340 | |
| |
Interest expense and fees | | | 2,289,900 | |
| |
Miscellaneous | | | 436,279 | |
| |
Total expenses | | $ | 51,553,880 | |
| |
Deduct: | | | | |
| |
Waiver and/or reimbursement of expenses by affiliate | | $ | 250,289 | |
| |
Total expense reductions | | $ | 250,289 | |
| |
Net expenses | | $ | 51,303,591 | |
| |
Net investment income | | $ | 418,622,273 | |
| |
| Realized and Unrealized Gain (Loss) | | | | |
| |
Net realized gain (loss): | | | | |
| |
Investment transactions | | $ | (119,289,716 | ) |
| |
Investment transactions - affiliated investments | | | (82,915 | ) |
| |
Foreign currency transactions | | | 6,990,412 | |
| |
Forward foreign currency exchange contracts | | | 172,100,779 | |
| |
Net realized gain | | $ | 59,718,560 | |
| |
Change in unrealized appreciation (depreciation): | | | | |
| |
Investments | | $ | (818,037,102 | ) |
| |
Investments - affiliated investments | | | (1,388,424 | ) |
| |
Foreign currency | | | (2,145,936 | ) |
| |
Forward foreign currency exchange contracts | | | (10,320,397 | ) |
| |
Net change in unrealized appreciation (depreciation) | | $ | (831,891,859 | ) |
| |
Net realized and unrealized loss | | $ | (772,173,299 | ) |
| |
Net decrease in net assets from operations | | $ | (353,551,026 | ) |
| | | | |
| | 49 | | See Notes to Financial Statements. |
Eaton Vance
Floating Rate Portfolio
October 31, 2022
Statements of Changes in Net Assets
| | | | | | | | |
| | | Year Ended October 31, | |
| Increase (Decrease) in Net Assets | | 2022 | | | 2021 | |
| | |
From operations: | | | | | | | | |
| | |
Net investment income | | $ | 418,622,273 | | | $ | 256,806,743 | |
| | |
Net realized gain | | | 59,718,560 | | | | 9,155,076 | |
| | |
Net change in unrealized appreciation (depreciation) | | | (831,891,859 | ) | | | 224,746,482 | |
| | |
Net increase (decrease) in net assets from operations | | $ | (353,551,026 | ) | | $ | 490,708,301 | |
| | |
Capital transactions: | | | | | | | | |
| | |
Contributions | | $ | 2,094,290,768 | | | $ | 3,163,957,748 | |
| | |
Withdrawals | | | (2,626,390,995 | ) | | | (317,385,727 | ) |
| | |
Net increase (decrease) in net assets from capital transactions | | $ | (532,100,227 | ) | | $ | 2,846,572,021 | |
| | |
Net increase (decrease) in net assets | | $ | (885,651,253 | ) | | $ | 3,337,280,322 | |
|
| Net Assets | |
| | |
At beginning of year | | $ | 8,986,781,771 | | | $ | 5,649,501,449 | |
| | |
At end of year | | $ | 8,101,130,518 | | | $ | 8,986,781,771 | |
| | | | |
| | 50 | | See Notes to Financial Statements. |
Eaton Vance
Floating Rate Portfolio
October 31, 2022
Financial Highlights
| | | | | | | | | | | | | | | | | | | | |
| | | Year Ended October 31, | |
| Ratios/Supplemental Data | | 2022 | | | 2021 | | | 2020 | | | 2019 | | | 2018 | |
| | | | | |
Ratios (as a percentage of average daily net assets): | | | | | | | | | | | | | | | | | | | | |
| | | | | |
Expenses | | | 0.54 | %(1) | | | 0.56 | % | | | 0.59 | % | | | 0.55 | % | | | 0.54 | % |
| | | | | |
Net investment income | | | 4.39 | % | | | 3.51 | % | | | 4.17 | % | | | 5.09 | % | | | 4.38 | % |
| | | | | |
Portfolio Turnover | | | 27 | % | | | 26 | % | | | 28 | % | | | 16 | % | | | 30 | % |
| | | | | |
Total Return | | | (3.32 | )% | | | 7.80 | % | | | 1.18 | % | | | 1.64 | % | | | 5.05 | % |
| | | | | |
Net assets, end of year (000’s omitted) | | $ | 8,101,131 | | | $ | 8,986,782 | | | $ | 5,649,501 | | | $ | 7,966,641 | | | $ | 11,502,389 | |
| (1) | Includes a reduction by the investment adviser of a portion of its adviser fee due to the Portfolio’s investment in the Liquidity Fund (equal to less than 0.005% of average daily net assets for the year ended October 31, 2022). |
Eaton Vance
Floating Rate Portfolio
October 31, 2022
Notes to Financial Statements
1 Significant Accounting Policies
Eaton Vance Floating Rate Portfolio (the Portfolio) is a Massachusetts business trust registered under the Investment Company Act of 1940, as amended (the 1940 Act), as a diversified, open-end management investment company. The Portfolio’s investment objective is to provide a high level of current income. The Declaration of Trust permits the Trustees to issue interests in the Portfolio. At October 31, 2022, Eaton Vance Floating-Rate Fund and Eaton Vance Floating-Rate & High Income Fund held an interest of 84.3% and 15.7%, respectively, in the Portfolio.
The following is a summary of significant accounting policies of the Portfolio. The policies are in conformity with accounting principles generally accepted in the United States of America (U.S. GAAP). The Portfolio is an investment company and follows accounting and reporting guidance in the Financial Accounting Standards Board (FASB) Accounting Standards Codification Topic 946.
A Investment Valuation — The following methodologies are used to determine the market value or fair value of investments.
Senior Floating-Rate Loans. Interests in senior floating-rate loans (Senior Loans) are valued generally at the average mean of bid and ask quotations obtained from a third party pricing service. Senior Loans, for which a valuation is not available or deemed unreliable, are fair valued by the investment adviser utilizing one or more of the valuation techniques described below to assess the likelihood that the borrower will make a full repayment of the loan underlying such Senior Loan. If the investment adviser believes that there is a reasonable likelihood of full repayment, the investment adviser will determine fair value using a matrix pricing approach that considers the yield on the Senior Loan relative to yields on other Senior Loans issued by companies of comparable credit quality. If the investment adviser believes there is not a reasonable likelihood of full repayment, the investment adviser will determine fair value using analyses that include, but are not limited to: (i) a comparison of the value of the borrower’s outstanding equity and debt to that of comparable public companies; (ii) a discounted cash flow analysis; or (iii) when the investment adviser believes it is likely that a borrower will be liquidated or sold, an analysis of the terms of such liquidation or sale. In certain cases, the investment adviser will use a combination of analytical methods to determine fair value, such as when only a portion of a borrower’s assets are likely to be sold. In conducting its assessment and analyses for purposes of determining fair value of a Senior Loan, the investment adviser will use its discretion and judgment in considering and appraising relevant factors. Junior Loans (i.e., subordinated loans and second lien loans) are valued in the same manner as Senior Loans.
Debt Obligations. Debt obligations are generally valued on the basis of valuations provided by third party pricing services, as derived from such services’ pricing models. Inputs to the models may include, but are not limited to, reported trades, executable bid and ask prices, broker/dealer quotations, prices or yields of securities with similar characteristics, interest rates, anticipated prepayments, benchmark curves or information pertaining to the issuer, as well as industry and economic events. The pricing services may use a matrix approach, which considers information regarding securities with similar characteristics to determine the valuation for a security. Short-term debt obligations purchased with a remaining maturity of sixty days or less for which a valuation from a third party pricing service is not readily available may be valued at amortized cost, which approximates fair value.
Equity Securities. Equity securities listed on a U.S. securities exchange generally are valued at the last sale or closing price on the day of valuation or, if no sales took place on such date, at the mean between the closing bid and ask prices on the exchange where such securities are principally traded. Equity securities listed on the NASDAQ National Market System are valued at the NASDAQ official closing price. Unlisted or listed securities for which closing sales prices or closing quotations are not available are valued at the mean between the latest available bid and ask prices or, in the case of preferred equity securities that are not listed or traded in the over-the-counter market, by a third party pricing service that uses various techniques that consider factors including, but not limited to, prices or yields of securities with similar characteristics, benchmark yields, broker/dealer quotes, quotes of underlying common stock, issuer spreads, as well as industry and economic events.
Derivatives. Forward foreign currency exchange contracts are generally valued at the mean of the average bid and average asked prices that are reported by currency dealers to a third party pricing service at the valuation time. Such third party pricing service valuations are supplied for specific settlement periods and the Portfolio’s forward foreign currency exchange contracts are valued at an interpolated rate between the closest preceding and subsequent settlement period reported by the third party pricing service.
Foreign Securities and Currencies. Foreign securities and currencies are valued in U.S. dollars, based on foreign currency exchange rate quotations supplied by a third party pricing service. The pricing service uses a proprietary model to determine the exchange rate. Inputs to the model include reported trades and implied bid/ask spreads.
Other. Investments in management investment companies (including money market funds) that do not trade on an exchange are valued at the net asset value as of the close of each business day.
Fair Valuation. In connection with Rule 2a-5 of the 1940 Act, which became effective September 8, 2022, the Trustees have designated the Portfolio’s investment adviser as its valuation designee. Investments for which valuations or market quotations are not readily available or are deemed unreliable are valued by the investment adviser, as valuation designee, at fair value using methods that most fairly reflect the security’s “fair value”, which is the amount that the Portfolio might reasonably expect to receive for the security upon its current sale in the ordinary course. Each such determination is based on a consideration of relevant factors, which are likely to vary from one pricing context to another. These factors may include, but are not limited to, the type of security, the existence of any contractual restrictions on the security’s disposition, the price and extent of public trading in similar securities of the issuer or of comparable companies or entities, quotations or relevant information obtained from broker/dealers or other market participants, information obtained from the issuer, analysts, and/or the appropriate stock exchange (for exchange-traded securities), an analysis of the company’s or entity’s financial statements, and an evaluation of the forces that influence the issuer and the market(s) in which the security is purchased and sold.
Eaton Vance
Floating Rate Portfolio
October 31, 2022
Notes to Financial Statements — continued
B Investment Transactions — Investment transactions for financial statement purposes are accounted for on a trade date basis. Realized gains and losses on investments sold are determined on the basis of identified cost.
C Income — Interest income is recorded on the basis of interest accrued, adjusted for amortization of premium or accretion of discount. Fees associated with loan amendments are recognized immediately. Dividend income is recorded on the ex-dividend date for dividends received in cash and/or securities. Withholding taxes on foreign interest, dividends and capital gains have been provided for in accordance with the Portfolio’s understanding of the applicable countries’ tax rules and rates. Distributions from investment companies are recorded as dividend income, capital gains or return of capital based on the nature of the distribution.
D Federal Taxes — The Portfolio has elected to be treated as a partnership for federal tax purposes. No provision is made by the Portfolio for federal or state taxes on any taxable income of the Portfolio because each investor in the Portfolio is ultimately responsible for the payment of any taxes on its share of taxable income. Since at least one of the Portfolio’s investors is a regulated investment company that invests all or substantially all of its assets in the Portfolio, the Portfolio normally must satisfy the applicable source of income and diversification requirements (under the Internal Revenue Code) in order for its investors to satisfy them. The Portfolio will allocate, at least annually among its investors, each investor’s distributive share of the Portfolio’s net investment income, net realized capital gains and losses and any other items of income, gain, loss, deduction or credit.
As of October 31, 2022, the Portfolio had no uncertain tax positions that would require financial statement recognition, de-recognition, or disclosure. The Portfolio files a U.S. federal income tax return annually after its fiscal year-end, which is subject to examination by the Internal Revenue Service for a period of three years from the date of filing.
E Foreign Currency Translation — Investment valuations, other assets, and liabilities initially expressed in foreign currencies are translated each business day into U.S. dollars based upon current exchange rates. Purchases and sales of foreign investment securities and income and expenses denominated in foreign currencies are translated into U.S. dollars based upon currency exchange rates in effect on the respective dates of such transactions. Recognized gains or losses on investment transactions attributable to changes in foreign currency exchange rates are recorded for financial statement purposes as net realized gains and losses on investments. That portion of unrealized gains and losses on investments that results from fluctuations in foreign currency exchange rates is not separately disclosed.
F Unfunded Loan Commitments — The Portfolio may enter into certain loan agreements all or a portion of which may be unfunded. The Portfolio is obligated to fund these commitments at the borrower’s discretion. These commitments are disclosed in the accompanying Portfolio of Investments. At October 31, 2022, the Portfolio had sufficient cash and/or securities to cover these commitments.
G Use of Estimates — The preparation of the financial statements in conformity with U.S. GAAP requires management to make estimates and assumptions that affect the reported amounts of assets and liabilities at the date of the financial statements and the reported amounts of income and expense during the reporting period. Actual results could differ from those estimates.
H Indemnifications — Under the Portfolio’s organizational documents, its officers and Trustees may be indemnified against certain liabilities and expenses arising out of the performance of their duties to the Portfolio. Under Massachusetts law, if certain conditions prevail, interestholders in the Portfolio could be deemed to have personal liability for the obligations of the Portfolio. However, the Portfolio’s Declaration of Trust contains an express disclaimer of liability on the part of Portfolio interestholders. Additionally, in the normal course of business, the Portfolio enters into agreements with service providers that may contain indemnification clauses. The Portfolio’s maximum exposure under these arrangements is unknown as this would involve future claims that may be made against the Portfolio that have not yet occurred.
I Forward Foreign Currency Exchange Contracts — The Portfolio may enter into forward foreign currency exchange contracts for the purchase or sale of a specific foreign currency at a fixed price on a future date. The forward foreign currency exchange contracts are adjusted by the daily exchange rate of the underlying currency and any gains or losses are recorded as unrealized until such time as the contracts have been closed. Risks may arise upon entering these contracts from the potential inability of counterparties to meet the terms of their contracts and from movements in the value of a foreign currency relative to the U.S. dollar.
Eaton Vance
Floating Rate Portfolio
October 31, 2022
Notes to Financial Statements — continued
2 Investment Adviser Fee and Other Transactions with Affiliates
The investment adviser fee is earned by Boston Management and Research (BMR), an indirect, wholly-owned subsidiary of Morgan Stanley, as compensation for investment advisory services rendered to the Portfolio. The investment adviser fee is computed at an annual rate as a percentage of the Portfolio’s average daily net assets as follows and is payable monthly:
| | | | |
| Average Daily Net Assets | | Annual Fee Rate | |
| |
Up to $1 billion | | | 0.5750 | % |
| |
$1 billion but less than $2 billion | | | 0.5250 | % |
| |
$2 billion but less than $5 billion | | | 0.4900 | % |
| |
$5 billion but less than $10 billion | | | 0.4600 | % |
| |
$10 billion but less than $15 billion | | | 0.4350 | % |
| |
$15 billion but less than $20 billion | | | 0.4150 | % |
| |
$20 billion but less than $25 billion | | | 0.4000 | % |
| |
$25 billion and over | | | 0.3900 | % |
For the year ended October 31, 2022, the Portfolio’s investment adviser fee amounted to $46,506,949 or 0.49% of the Portfolio’s average daily net assets. Effective April 26, 2022, the Portfolio may invest in a money market fund, the Institutional Class of the Morgan Stanley Institutional Liquidity Funds - Government Portfolio (the "Liquidity Fund"), an open-end management investment company managed by Morgan Stanley Investment Management Inc., a wholly-owned subsidiary of Morgan Stanley. The investment adviser fee paid by the Portfolio is reduced by an amount equal to its pro-rata share of the advisory and administration fees paid by the Portfolio due to its investment in the Liquidity Fund. For the year ended October 31, 2022, the investment adviser fee paid was reduced by $250,289 relating to the Portfolio’s investment in the Liquidity Fund. Prior to April 26, 2022, the Fund may have invested its cash in Eaton Vance Cash Reserves Fund, LLC (Cash Reserves Fund), an affiliated investment company managed by Eaton Vance Management (EVM), an affiliate of BMR. EVM did not receive a fee for advisory services provided to Cash Reserves Fund.
Trustees and officers of the Portfolio who are members of EVM’s or BMR’s organizations receive remuneration for their services to the Portfolio out of the investment adviser fee. Trustees of the Portfolio who are not affiliated with the investment adviser may elect to defer receipt of all or a percentage of their annual fees in accordance with the terms of the Trustees Deferred Compensation Plan. For the year ended October 31, 2022, no significant amounts have been deferred. Certain officers and Trustees of the Portfolio are officers of the above organizations.
3 Purchases and Sales of Investments
Purchases and sales of investments, other than short-term obligations and including maturities, paydowns and principal repayments on Senior Loans, aggregated $2,490,453,168 and $2,607,264,764, respectively, for the year ended October 31, 2022.
4 Federal Income Tax Basis of Investments
The cost and unrealized appreciation (depreciation) of investments, including open derivative contracts, of the Portfolio at October 31, 2022, as determined on a federal income tax basis, were as follows:
| | | | |
| Aggregate cost | | $8,624,117,550 | |
| |
Gross unrealized appreciation | | $ | 40,569,938 | |
| |
Gross unrealized depreciation | | | (771,210,862 | ) |
| |
Net unrealized depreciation | | $ | (730,640,924 | ) |
5 Financial Instruments
The Portfolio may trade in financial instruments with off-balance sheet risk in the normal course of its investing activities. These financial instruments may include forward foreign currency exchange contracts and may involve, to a varying degree, elements of risk in excess of the amounts recognized for financial statement purposes. The notional or contractual amounts of these instruments represent the investment the Portfolio has in particular classes of financial instruments and do not necessarily represent the amounts potentially subject to risk. The measurement of the risks associated with these instruments is meaningful only when all related and offsetting transactions are considered. A summary of obligations under these financial instruments at October 31, 2022 is included in the Portfolio of Investments. At October 31, 2022, the Portfolio had sufficient cash and/or securities to cover commitments under these contracts.
Eaton Vance
Floating Rate Portfolio
October 31, 2022
Notes to Financial Statements — continued
The Portfolio is subject to foreign exchange risk in the normal course of pursuing its investment objective. Because the Portfolio holds foreign currency denominated investments, the value of these investments and related receivables and payables may change due to future changes in foreign currency exchange rates. To hedge against this risk, the Portfolio enters into forward foreign currency exchange contracts.
The Portfolio enters into forward foreign currency exchange contracts that may contain provisions whereby the counterparty may terminate the contract under certain conditions, including but not limited to a decline in the Portfolio’s net assets below a certain level over a certain period of time, which would trigger a payment by the Portfolio for those derivatives in a liability position. At October 31, 2022, the fair value of derivatives with credit related contingent features in a net liability position was $6,351,123. The aggregate fair value of assets pledged as collateral by the Portfolio for such liability was $8,200,000 at October 31, 2022.
The over-the-counter (OTC) derivatives in which the Portfolio invests are subject to the risk that the counterparty to the contract fails to perform its obligations under the contract. To mitigate this risk, the Portfolio has entered into an International Swaps and Derivatives Association, Inc. Master Agreement (“ISDA Master Agreement”) or similar agreement with substantially all its derivative counterparties. An ISDA Master Agreement is a bilateral agreement between the Portfolio and a counterparty that governs certain OTC derivatives and typically contains, among other things, set-off provisions in the event of a default and/or termination event as defined under the relevant ISDA Master Agreement. Under an ISDA Master Agreement, the Portfolio may, under certain circumstances, offset with the counterparty certain derivative financial instruments’ payables and/or receivables with collateral held and/or posted and create one single net payment. The provisions of the ISDA Master Agreement typically permit a single net payment in the event of default including the bankruptcy or insolvency of the counterparty. However, bankruptcy or insolvency laws of a particular jurisdiction may impose restrictions on or prohibitions against the right of offset in bankruptcy or insolvency. Certain ISDA Master Agreements allow counterparties to OTC derivatives to terminate derivative contracts prior to maturity in the event the Portfolio’s net assets decline by a stated percentage or the Portfolio fails to meet the terms of its ISDA Master Agreements, which would cause the counterparty to accelerate payment by the Portfolio of any net liability owed to it.
The collateral requirements for derivatives traded under an ISDA Master Agreement are governed by a Credit Support Annex to the ISDA Master Agreement. Collateral requirements are determined at the close of business each day and are typically based on changes in market values for each transaction under an ISDA Master Agreement and netted into one amount for such agreement. Generally, the amount of collateral due from or to a counterparty is subject to a minimum transfer threshold amount before a transfer is required, which may vary by counterparty. Collateral pledged for the benefit of the Portfolio and/or counterparty is held in segregated accounts by the Portfolio’s custodian and cannot be sold, re-pledged, assigned or otherwise used while pledged. The portion of such collateral representing cash, if any, is reflected as deposits for derivatives collateral and, in the case of cash pledged by a counterparty for the benefit of the Portfolio, a corresponding liability on the Statement of Assets and Liabilities. Securities pledged by the Portfolio as collateral, if any, are identified as such in the Portfolio of Investments.
The fair value of open derivative instruments (not considered to be hedging instruments for accounting disclosure purposes) and whose primary underlying risk exposure is foreign exchange risk at October 31, 2022 was as follows:
| | | | | | | | |
| | | Fair Value | |
| Derivative | | Asset Derivative | | | Liability Derivative | |
| | |
Forward foreign currency exchange contracts | | $ | 3,336,318 | (1) | | $ | (6,351,123 | )(2) |
| (1) | Statement of Assets and Liabilities location: Receivable for open forward foreign currency exchange contracts. |
| (2) | Statement of Assets and Liabilities location: Payable for open forward foreign currency exchange contracts. |
The Portfolio’s derivative assets and liabilities at fair value by risk, which are reported gross in the Statement of Assets and Liabilities, are presented in the table above. The following tables present the Portfolio’s derivative assets and liabilities by counterparty, net of amounts available for offset under a master netting agreement and net of the related collateral received by the Portfolio for such assets and pledged by the Portfolio for such liabilities as of October 31, 2022.
| | | | | | | | | | | | | | | | | | | | |
| Counterparty | | Derivative
Assets Subject to
Master Netting
Agreement | | | Derivatives
Available
for Offset | | | Non-cash
Collateral
Received(a) | | | Cash
Collateral
Received(a) | | | Net Amount
of Derivative
Assets(b) | |
| | | | | |
Bank of America, N.A. | | $ | 811,202 | | | $ | (751,339 | ) | | $ | — | | | $ | (59,863 | ) | | $ | — | |
| | | | | |
Standard Chartered Bank | | | 337,699 | | | | (337,699 | ) | | | — | | | | — | | | | — | |
| | | | | |
State Street Bank and Trust Company | | | 2,187,417 | | | | (2,187,417 | ) | | | — | | | | — | | | | — | |
| | | | | |
| | | $ | 3,336,318 | | | $ | (3,276,455 | ) | | $ | — | | | $ | (59,863 | ) | | $ | — | |
Eaton Vance
Floating Rate Portfolio
October 31, 2022
Notes to Financial Statements — continued
| | | | | | | | | | | | | | | | | | | | |
| Counterparty | | Derivative
Liabilities Subject to
Master Netting
Agreement | | | Derivatives
Available
for Offset | | | Non-cash
Collateral
Pledged(a) | | | Cash
Collateral
Pledged(a) | | | Net Amount
of Derivative
Liabilities(c) | |
| | | | | |
Bank of America, N.A. | | $ | (751,339 | ) | | $ | 751,339 | | | $ | — | | | $ | — | | | $ | — | |
| | | | | |
Standard Chartered Bank | | | (1,871,277 | ) | | | 337,699 | | | | — | | | | 1,533,578 | | | | — | |
| | | | | |
State Street Bank and Trust Company | | | (3,728,507 | ) | | | 2,187,417 | | | | — | | | | 1,541,090 | | | | — | |
| | | | | |
| | | $ | (6,351,123 | ) | | $ | 3,276,455 | | | $ | — | | | $ | 3,074,668 | | | $ | — | |
| (a) | In some instances, the total collateral received and/or pledged may be more than the amount shown due to overcollateralization. |
| (b) | Net amount represents the net amount due from the counterparty in the event of default. |
| (c) | Net amount represents the net amount payable to the counterparty in the event of default. |
The effect of derivative instruments (not considered to be hedging instruments for accounting disclosure purposes) on the Statement of Operations and whose primary underlying risk exposure is foreign exchange risk for the year ended October 31, 2022 was as follows:
| | | | | | | | |
| Derivative | | Realized Gain (Loss)
on Derivatives Recognized
in Income(1) | | | Change in Unrealized
Appreciation (Depreciation) on
Derivatives Recognized in Income(2) | |
| | |
Forward foreign currency exchange contracts | | $ | 172,100,779 | | | $ | (10,320,397 | ) |
| (1) | Statement of Operations location: Net realized gain (loss) - Forward foreign currency exchange contracts. |
| (2) | Statement of Operations location: Change in unrealized appreciation (depreciation) - Forward foreign currency exchange contracts. |
The average notional amount of forward foreign currency exchange contracts (based on the absolute value of notional amounts of currency purchased and currency sold) outstanding during the year ended October 31, 2022, which is indicative of the volume of this derivative type, was approximately $1,241,185,000.
6 Credit Facility
The Portfolio participates with another portfolio and fund managed by EVM and its affiliates in a $700 million ($725 million prior to June 30, 2022 and $650 million prior to March 7, 2022) unsecured credit facility agreement (Agreement) with a group of banks, which is in effect through March 6, 2023. Borrowings are made by the Portfolio solely to facilitate the handling of unusual and/or unanticipated short-term cash requirements. At the Portfolio’s option, any loan under the Credit Facility that is made to it will bear interest at a rate equal to (i) the Benchmark Rate (defined below) plus a margin or, (ii) the Base Rate, or (iii) the Overnight Rate plus a margin. Base Rate is the highest of (a) administrative agent’s prime rate, (b) 50 basis points above the Federal Funds rate, (c) the Benchmark Rate plus a margin and (d) 1.00%, in each case as in effect from time to time. The “Overnight Rate” is the greatest of the Benchmark Rate, the Federal Funds rate and 0.00%. “Benchmark Rate” means Term SOFR (defined as the forward-looking Secured Overnight Financing Rate term rate published two U.S. government securities business days prior to the commencement of the applicable interest period plus the Term SOFR Adjustment) for an interest period of one-month’s duration. To the extent that, at any time, the Benchmark Rate is less than 0.00%, the Benchmark Rate shall be deemed to be 0.00% for purposes of the Credit Facility. “Term SOFR Adjustment” means 0.10%. In addition, a fee computed at an annual rate of 0.15% on the daily unused portion of each lender’s commitment amount is allocated among the participating portfolios and fund at the end of each quarter. Also included in interest expense and fees on the Statement of Operations is approximately $1,241,000 of amortization of upfront fees paid by the Portfolio in connection with the annual renewal of the Agreement. The unamortized balance of upfront fees at October 31, 2022 is $419,817 and is included in prepaid expenses in the Statement of Assets and Liabilities. Because the credit facility is not available exclusively to the Portfolio and the maximum amount is capped, it may be unable to borrow some or all of a requested amount at any particular time. The Portfolio did not have any significant borrowings during the year ended October 31, 2022.
Eaton Vance
Floating Rate Portfolio
October 31, 2022
Notes to Financial Statements — continued
7 Investments in Affiliated Companies/Funds
An affiliated company is a company in which a fund has a direct or indirect ownership of, control of, or voting power of 5 percent or more of the outstanding voting shares, or a company that is under common ownership or control with a fund. At October 31, 2022, the value of the portfolio’s investment in affiliated companies and funds that may deemed to be affiliated was $165,456,972, which represents 2.0% of the Portfolio’s net assets. Transactions in affiliated companies and funds by the Portfolio for the year ended October 31, 2022 were as follows:
| | | | | | | | | | | | | | | | | | | | | | | | | | | | | | | | |
| Name | | Value,
beginning
of period | | | Purchases | | | Sales
proceeds | | | Net
realized
gain (loss) | | | Change in
unrealized
appreciation
(depreciation) | | | Value, end
of period | | | Dividend
income | | | Units/Shares,
end of period | |
| | | | | | | | |
Common Stocks* | | | | | | | | | | | | | | | | | | | | | | | | | | | | | | | | |
| | | | | | | | |
IAP Global Services,
LLC(1)(2)(3) | | $ | 10,073,588 | | | $ | — | | | $ | — | | | $ | — | | | $ | (1,388,424 | ) | | $ | 8,685,164 | | | $ | — | | | | 2,577 | |
| | | | | | | | |
Short-Term Investments | | | | | | | | | | | | | | | | | | | | | | | | | | | | | | | | |
| | | | | | | | |
Cash Reserves Fund | | | 667,360,691 | | | | 1,266,262,613 | | | | (1,933,540,389 | ) | | | (82,915 | ) | | | — | | | | — | | | | 381,908 | | | | — | |
| | | | | | | | |
Liquidity Fund | | | — | | | | 2,435,642,928 | | | | (2,278,871,120 | ) | | | — | | | | — | | | | 156,771,808 | | | | 2,247,819 | | | | 156,771,808 | |
| | | | | | | | |
Total | | | | | | | | | | | | | | $ | (82,915 | ) | | $ | (1,388,424 | ) | | $ | 165,456,972 | | | $ | 2,629,727 | | | | | |
| * | The related industry is the same as the presentation in the Portfolio of Investments. |
| (1) | For fair value measurement disclosure purposes, security is categorized as Level 3 (see Note 8). |
| (2) | Non-income producing security. |
| (3) | A portion of the shares were acquired in connection with a restructuring of a Senior Loan and may be subject to restrictions on resale. |
8 Fair Value Measurements
Under generally accepted accounting principles for fair value measurements, a three-tier hierarchy to prioritize the assumptions, referred to as inputs, is used in valuation techniques to measure fair value. The three-tier hierarchy of inputs is summarized in the three broad levels listed below.
| • | | Level 1 – quoted prices in active markets for identical investments |
| • | | Level 2 – other significant observable inputs (including quoted prices for similar investments, interest rates, prepayment speeds, credit risk, etc.) |
| • | | Level 3 – significant unobservable inputs (including a fund’s own assumptions in determining the fair value of investments) |
In cases where the inputs used to measure fair value fall in different levels of the fair value hierarchy, the level disclosed is determined based on the lowest level input that is significant to the fair value measurement in its entirety. The inputs or methodology used for valuing securities are not necessarily an indication of the risk associated with investing in those securities.
Eaton Vance
Floating Rate Portfolio
October 31, 2022
Notes to Financial Statements — continued
At October 31, 2022, the hierarchy of inputs used in valuing the Portfolio’s investments and open derivative instruments, which are carried at value, were as follows:
| | | | | | | | | | | | | | | | |
| Asset Description | | Level 1 | | | Level 2 | | | Level 3* | | | Total | |
| | | | |
Asset-Backed Securities | | $ | — | | | $ | 269,370,575 | | | $ | — | | | $ | 269,370,575 | |
| | | | |
Common Stocks | | | 12,311,345 | | | | 27,416,418 | | | | 14,240,583 | | | | 53,968,346 | |
| | | | |
Convertible Preferred Stocks | | | — | | | | 4,538,607 | | | | — | | | | 4,538,607 | |
| | | | |
Corporate Bonds | | | — | | | | 567,110,839 | | | | — | | | | 567,110,839 | |
| | | | |
Exchange-Traded Funds | | | 17,610,840 | | | | — | | | | — | | | | 17,610,840 | |
| | | | |
Preferred Stocks | | | — | | | | 10,740,795 | | | | 0 | | | | 10,740,795 | |
| | | | |
Senior Floating-Rate Loans (Less Unfunded Loan Commitments) | | | — | | | | 6,807,728,858 | | | | 5,635,958 | | | | 6,813,364,816 | |
| | | | |
Warrants | | | — | | | | 0 | | | | 0 | | | | 0 | |
| | | | |
Short-Term Investments | | | 156,771,808 | | | | — | | | | — | | | | 156,771,808 | |
| | | | |
Total Investments | | $ | 186,693,993 | | | $ | 7,686,906,092 | | | $ | 19,876,541 | | | $ | 7,893,476,626 | |
| | | | |
Forward Foreign Currency Exchange Contracts | | $ | — | | | $ | 3,336,318 | | | $ | — | | | $ | 3,336,318 | |
| | | | |
Total | | $ | 186,693,993 | | | $ | 7,690,242,410 | | | $ | 19,876,541 | | | $ | 7,896,812,944 | |
| | | | |
Liability Description | | | | | | | | | | | | | | | | |
| | | | |
Forward Foreign Currency Exchange Contracts | | $ | — | | | $ | (6,351,123 | ) | | $ | — | | | $ | (6,351,123 | ) |
| | | | |
Total | | $ | — | | | $ | (6,351,123 | ) | | $ | — | | | $ | (6,351,123 | ) |
| * | None of the unobservable inputs for Level 3 assets, individually or collectively, had a material impact on the Portfolio. |
Level 3 investments at the beginning and/or end of the period in relation to net assets were not significant and accordingly, a reconciliation of Level 3 assets for the year ended October 31, 2022 is not presented.
9 Risks and Uncertainties
Risks Associated with Foreign Investments
Foreign investments can be adversely affected by political, economic and market developments abroad, including the imposition of economic and other sanctions by the United States or another country. There may be less publicly available information about foreign issuers because they may not be subject to reporting practices, requirements or regulations comparable to those to which United States companies are subject. Foreign markets may be smaller, less liquid and more volatile than the major markets in the United States. Trading in foreign markets typically involves higher expense than trading in the United States. The Portfolio may have difficulties enforcing its legal or contractual rights in a foreign country. Securities that trade or are denominated in currencies other than the U.S. dollar may be adversely affected by fluctuations in currency exchange rates.
Credit Risk
The Portfolio invests primarily in below investment grade floating-rate loans, which are considered speculative because of the credit risk of their issuers. Changes in economic conditions or other circumstances are more likely to reduce the capacity of issuers of these securities to make principal and interest payments. Such companies are more likely to default on their payments of interest and principal owed than issuers of investment grade bonds. An economic downturn generally leads to a higher non-payment rate, and a loan or other debt obligation may lose significant value before a default occurs. Lower rated investments also may be subject to greater price volatility than higher rated investments. Moreover, the specific collateral used to secure a loan may decline in value or become illiquid, which would adversely affect the loan’s value.
LIBOR Transition Risk
Certain instruments held by the Portfolio may pay an interest rate based on the London Interbank Offered Rate (“LIBOR”), which is the average offered rate for various maturities of short-term loans between certain major international banks. LIBOR is used throughout global banking and financial industries to determine interest rates for a variety of financial instruments (such as debt instruments and derivatives) and borrowing arrangements. The ICE Benchmark Administration Limited, the administrator of LIBOR, ceased publishing certain LIBOR settings on December 31, 2021, and is expected to cease publishing the remaining LIBOR settings on June 30, 2023. Although the transition process away from LIBOR has become increasingly well-defined, the impact on certain debt securities, derivatives and other financial instruments that utilize LIBOR remains uncertain. The phase-out of LIBOR may result in, among other things, increased volatility or illiquidity in markets for instruments based on LIBOR and changes in the value of such instruments.
Eaton Vance
Floating Rate Portfolio
October 31, 2022
Notes to Financial Statements — continued
Pandemic Risk
An outbreak of respiratory disease caused by a novel coronavirus was first detected in China in late 2019 and subsequently spread internationally. This coronavirus has resulted in closing borders, enhanced health screenings, changes to healthcare service preparation and delivery, quarantines, cancellations, disruptions to supply chains and customer activity, as well as general concern and uncertainty. Health crises caused by outbreaks of disease, such as the coronavirus outbreak, may exacerbate other pre-existing political, social and economic risks and disrupt normal market conditions and operations. The impact of this outbreak has negatively affected the worldwide economy, as well as the economies of individual countries and industries, and could continue to affect the market in significant and unforeseen ways. Other epidemics and pandemics that may arise in the future may have similar effects. Any such impact could adversely affect the Portfolio’s performance, or the performance of the securities in which the Portfolio invests.
Eaton Vance
Floating Rate Portfolio
October 31, 2022
Report of Independent Registered Public Accounting Firm
To the Trustees and Investors of Eaton Vance Floating Rate Portfolio:
Opinion on the Financial Statements and Financial Highlights
We have audited the accompanying statement of assets and liabilities of Eaton Vance Floating Rate Portfolio (the “Portfolio”), including the portfolio of investments, as of October 31, 2022, the related statement of operations for the year then ended, the statements of changes in net assets for each of the two years in the period then ended, the financial highlights for each of the five years in the period then ended, and the related notes. In our opinion, the financial statements and financial highlights present fairly, in all material respects, the financial position of the Portfolio as of October 31, 2022, and the results of its operations for the year then ended, the changes in its net assets for each of the two years in the period then ended, and the financial highlights for each of the five years in the period then ended, in conformity with accounting principles generally accepted in the United States of America.
Basis for Opinion
These financial statements and financial highlights are the responsibility of the Portfolio’s management. Our responsibility is to express an opinion on the Portfolio’s financial statements and financial highlights based on our audits. We are a public accounting firm registered with the Public Company Accounting Oversight Board (United States) (PCAOB) and are required to be independent with respect to the Portfolio in accordance with the U.S. federal securities laws and the applicable rules and regulations of the Securities and Exchange Commission and the PCAOB.
We conducted our audits in accordance with the standards of the PCAOB. Those standards require that we plan and perform the audit to obtain reasonable assurance about whether the financial statements and financial highlights are free of material misstatement, whether due to error or fraud. The Portfolio is not required to have, nor were we engaged to perform, an audit of its internal control over financial reporting. As part of our audits, we are required to obtain an understanding of internal control over financial reporting but not for the purpose of expressing an opinion on the effectiveness of the Portfolio’s internal control over financial reporting. Accordingly, we express no such opinion.
Our audits included performing procedures to assess the risks of material misstatement of the financial statements and financial highlights, whether due to error or fraud, and performing procedures that respond to those risks. Such procedures included examining, on a test basis, evidence regarding the amounts and disclosures in the financial statements and financial highlights. Our audits also included evaluating the accounting principles used and significant estimates made by management, as well as evaluating the overall presentation of the financial statements and financial highlights. Our procedures included confirmation of securities and senior loans owned as of October 31, 2022, by correspondence with the custodian, brokers and selling or agent banks; when replies were not received from brokers and selling or agent banks, we performed other auditing procedures. We believe that our audits provide a reasonable basis for our opinion.
/s/ Deloitte & Touche LLP
Boston, Massachusetts
December 20, 2022
We have served as the auditor of one or more Eaton Vance investment companies since 1959.
Eaton Vance
Floating-Rate & High Income Fund
October 31, 2022
Board of Trustees’ Contract Approval
Overview of the Contract Review Process
The Investment Company Act of 1940, as amended (the “1940 Act”), provides, in substance, that the investment advisory agreement between a fund and its investment adviser will continue in effect from year-to-year only if its continuation is approved on an annual basis by a vote of the fund’s board of trustees, including a majority of the trustees who are not “interested persons” of the fund (“independent trustees”), cast in person at a meeting called for the purpose of considering such approval.
At a meeting held on June 8, 2022, the Boards of Trustees/Directors (collectively, the “Board”) that oversee the registered investment companies advised by Eaton Vance Management or its affiliate, Boston Management and Research (the “Eaton Vance Funds”), including a majority of the independent trustees (the “Independent Trustees”), voted to approve the continuation of existing investment advisory agreements and sub-advisory agreements1 for each of the Eaton Vance Funds for an additional one-year period. The Board relied upon the affirmative recommendation of its Contract Review Committee, which is a committee exclusively comprised of Independent Trustees. Prior to making its recommendation, the Contract Review Committee reviewed information furnished by the adviser and sub-adviser to each of the Eaton Vance Funds (including information specifically requested by the Board) for a series of formal meetings held between April and June 2022. Members of the Contract Review Committee also considered information received at prior meetings of the Board and its committees, to the extent such information was relevant to the Contract Review Committee’s annual evaluation of the investment advisory agreements and sub-advisory agreements.
In connection with its evaluation of the investment advisory agreements and sub-advisory agreements, the Board considered various information relating to the Eaton Vance Funds. This included information applicable to all or groups of Eaton Vance Funds, which is referenced immediately below, and information applicable to the particular Eaton Vance Fund covered by this report (additional fund-specific information is referenced below under “Results of the Contract Review Process”). (For funds that invest through one or more underlying portfolios, references to “each fund” in this section may include information that was considered at the portfolio-level.)
Information about Fees, Performance and Expenses
| | • | | A report from an independent data provider comparing advisory and other fees paid by each fund to such fees paid by comparable funds, as identified by the independent data provider (“comparable funds”); |
| | • | | A report from an independent data provider comparing each fund’s total expense ratio (and its components) to those of comparable funds; |
| | • | | A report from an independent data provider comparing the investment performance of each fund (including, as relevant, total return data, income data, Sharpe ratios and information ratios) to the investment performance of comparable funds and, as applicable, benchmark indices, over various time periods; |
| | • | | In certain instances, data regarding investment performance relative to customized groups of peer funds and blended indices identified by the adviser in consultation with the Portfolio Management Committee of the Board (a committee exclusively comprised of Independent Trustees); |
| | • | | Comparative information concerning the fees charged and services provided by the adviser and sub-adviser to each fund in managing other accounts (which may include other mutual funds, collective investment funds and institutional accounts) using investment strategies and techniques similar to those used in managing such fund(s), if any; |
| | • | | Profitability analyses with respect to the adviser and sub-adviser to each of the funds; |
Information about Portfolio Management and Trading
| | • | | Descriptions of the investment management services provided to each fund, as well as each of the funds’ investment strategies and policies; |
| | • | | The procedures and processes used to determine the value of fund assets, including, when necessary, the determination of “fair value” and actions taken to monitor and test the effectiveness of such procedures and processes; |
| | • | | Information about the policies and practices of each fund’s adviser and sub-adviser with respect to trading, including their processes for seeking best execution of portfolio transactions; |
| | • | | Information about the allocation of brokerage transactions and the benefits, if any, received by the adviser and sub-adviser to each fund as a result of brokerage allocation, including, as applicable, information concerning the acquisition of research through client commission arrangements and policies with respect to “soft dollars”; |
| | • | | Data relating to the portfolio turnover rate of each fund and related information regarding active management in the context of particular strategies; |
Information about each Adviser and Sub-adviser
| | • | | Reports detailing the financial results and condition of the adviser and sub-adviser to each fund; |
| 1 | Not all Eaton Vance Funds have entered into a sub-advisory agreement with a sub-adviser. Accordingly, references to “sub-adviser” or “sub-advisory agreement” in this “Overview” section may not be applicable to the particular Eaton Vance Fund covered by this report. Following the “Overview” section, further information regarding the Board’s evaluation of a fund’s contractual arrangements is included under the “Results of the Contract Review Process” section. |
Eaton Vance
Floating-Rate & High Income Fund
October 31, 2022
Board of Trustees’ Contract Approval — continued
| | • | | Information regarding the individual investment professionals whose responsibilities include portfolio management and investment research for the funds, and, for portfolio managers and certain other investment professionals, information relating to their responsibilities with respect to managing other mutual funds and investment accounts, as applicable; |
| | • | | Information regarding the adviser’s and its parent company’s (Morgan Stanley’s) efforts to retain and attract talented investment professionals, including in the context of a particularly competitive marketplace for talent, as well as the ongoing unique environment presented by hybrid, remote and other alternative work arrangements; |
| | • | | The Code of Ethics of the adviser and its affiliates and the sub-adviser of each fund, together with information relating to compliance with, and the administration of, such codes; |
| | • | | Policies and procedures relating to proxy voting, including regular reporting with respect to fund proxy voting activities; |
| | • | | Information regarding the handling of corporate actions and class actions, as well as information regarding litigation and other regulatory matters; |
| | • | | Information concerning the resources devoted to compliance efforts undertaken by the adviser and its affiliates and the sub-adviser of each fund, if any, including descriptions of their various compliance programs and their record of compliance; |
| | • | | Information concerning the business continuity and disaster recovery plans of the adviser and its affiliates and the sub-adviser of each fund, if any; |
| | • | | A description of Eaton Vance Management’s and Boston Management and Research’s oversight of sub-advisers, including with respect to regulatory and compliance issues, investment management and other matters; |
Other Relevant Information
| | • | | Information regarding ongoing initiatives to further integrate and harmonize, where applicable, the investment management and other departments of the adviser and its affiliates with the overall investment management infrastructure of Morgan Stanley, in light of Morgan Stanley’s acquisition of Eaton Vance on March 1, 2021; |
| | • | | Information concerning the nature, cost and character of the administrative and other non-investment advisory services provided by Eaton Vance Management and its affiliates; |
| | • | | Information concerning oversight of the relationship with the custodian, subcustodians, fund accountants, and other third-party service providers by the adviser and/or administrator to each of the funds; |
| | • | | Information concerning efforts to implement policies and procedures with respect to various new regulations applicable to the funds, including Rule 12d1-4 (the Fund-of-Funds Rule), Rule 18f-4 (the Derivatives Rule) and Rule 2a-5 (the Fair Valuation Rule); |
| | • | | For an Eaton Vance Fund structured as an exchange-listed closed-end fund, information concerning the benefits of the closed-end fund structure, as well as, where relevant, the closed-end fund’s market prices (including as compared to the closed-end fund’s net asset value (NAV)), trading volume data, continued use of auction preferred shares (where applicable), distribution rates and other relevant matters; |
| | • | | The risks which the adviser and/or its affiliates incur in connection with the management and operation of the funds, including, among others, litigation, regulatory, entrepreneurial, and other business risks (and the associated costs of such risks); and |
| | • | | The terms of each investment advisory agreement and sub-advisory agreement. |
During the various meetings of the Board and its committees over the course of the year leading up to the June 8, 2022 meeting, the Trustees received information from portfolio managers and other investment professionals of the advisers and sub-advisers of the funds regarding investment and performance matters, and considered various investment and trading strategies used in pursuing the funds’ investment objectives. The Trustees also received information regarding risk management techniques employed in connection with the management of the funds. The Board and its committees evaluated issues pertaining to industry and regulatory developments, compliance procedures, fund governance and other issues with respect to the funds, and received and participated in reports and presentations provided by Eaton Vance Management, Boston Management and Research and fund sub-advisers, with respect to such matters. In addition to the formal meetings of the Board and its committees, the Independent Trustees held regular teleconferences to discuss, among other topics, matters relating to the continuation of investment advisory agreements and sub-advisory agreements.
The Contract Review Committee was advised throughout the contract review process by Goodwin Procter LLP, independent legal counsel for the Independent Trustees. The members of the Contract Review Committee, with the advice of such counsel, exercised their own business judgment in determining the material factors to be considered in evaluating each investment advisory agreement and sub-advisory agreement and the weight to be given to each such factor. The conclusions reached with respect to each investment advisory agreement and sub-advisory agreement were based on a comprehensive evaluation of all the information provided and not any single factor. Moreover, each member of the Contract Review Committee may have placed varying emphasis on particular factors in reaching conclusions with respect to each investment advisory agreement and sub-advisory agreement. In evaluating each investment advisory agreement and sub-advisory agreement, including the fee structures and other terms contained in such agreements, the members of the Contract Review Committee were also informed by multiple years of analysis and discussion with the adviser and sub-adviser to each of the Eaton Vance Funds.
Results of the Contract Review Process
Based on its consideration of the foregoing, and such other information it deemed relevant, including the factors and conclusions described below, the Contract Review Committee concluded that the continuation of the investment advisory agreement between Eaton Vance Floating-Rate & High Income Fund (the “Fund”) and Eaton Vance Management (“EVM”), as well as the investment advisory agreements between each of Eaton Vance Floating Rate Portfolio
Eaton Vance
Floating-Rate & High Income Fund
October 31, 2022
Board of Trustees’ Contract Approval — continued
and High Income Opportunities Portfolio (the “Portfolios”), which are portfolios in which the Fund is authorized to invest, and Boston Management and Research (“BMR”) (EVM, with respect to the Fund, and BMR, with respect to the Portfolios, are each referred to herein as the “Adviser”), including their respective fee structures, are in the interests of shareholders and, therefore, recommended to the Board approval of each agreement. Based on the recommendation of the Contract Review Committee, the Board, including a majority of the Independent Trustees, voted to approve continuation of the investment advisory agreements for the Fund and the Portfolios.
Nature, Extent and Quality of Services
In considering whether to approve the investment advisory agreements for the Fund and the Portfolios, the Board evaluated the nature, extent and quality of services provided to the Fund and to the Portfolios by the applicable Adviser.
The Board considered each Adviser’s management capabilities and investment processes in light of the types of investments held by the Fund and the Portfolios, including the education, experience and number of investment professionals and other personnel who provide portfolio management, investment research, and similar services to the Fund and the Portfolios, including recent changes to such personnel. In particular, the Board considered the abilities and experience of each Adviser’s investment professionals in analyzing special considerations relevant to investing in senior floating rate loans and high yield debt. The Board considered the Adviser’s large group of bank loan investment professionals and other personnel, which includes portfolio managers and analysts, who provide services to the Portfolios. The Board also took into account the resources dedicated to portfolio management and other services, the compensation methods of each Adviser and other factors, including the reputation and resources of the Adviser to recruit and retain highly qualified research, advisory and supervisory investment professionals. In addition, the Board considered the time and attention devoted to the Eaton Vance Funds, including the Fund and the Portfolios, by senior management, as well as the infrastructure, operational capabilities and support staff in place to assist in the portfolio management and operations of the Fund and the Portfolios, including the provision of administrative services. The Board also considered the business-related and other risks to which each Adviser or its affiliates may be subject in managing the Fund and the Portfolios.
The Board considered the compliance programs of each Adviser and relevant affiliates thereof. The Board considered compliance and reporting matters regarding, among other things, personal trading by investment professionals, disclosure of portfolio holdings, late trading, frequent trading, portfolio valuation, business continuity and the allocation of investment opportunities. The Board also considered the responses of each Adviser and its affiliates to requests in recent years from regulatory authorities, such as the Securities and Exchange Commission and the Financial Industry Regulatory Authority.
The Board considered other administrative services provided or overseen by Eaton Vance Management and its affiliates, including transfer agency and accounting services. The Board evaluated the benefits to shareholders of investing in a fund that is a part of a large fund complex offering exposure to a variety of asset classes and investment disciplines, as well as the ability, in many cases, to exchange an investment among different funds without incurring additional sales charges.
After consideration of the foregoing factors, among others, the Board concluded that the nature, extent and quality of services provided by each Adviser, taken as a whole, are appropriate and consistent with the terms of the applicable investment advisory agreement.
Fund Performance
The Board compared the Fund’s investment performance to that of comparable funds identified by an independent data provider (the peer group), as well as an appropriate benchmark index and a custom peer group of similarly managed funds. The Board’s review included comparative performance data with respect to the Fund for the one-, three-, five- and ten-year periods ended December 31, 2021. In this regard, the Board noted that the performance of the Fund was higher than the median performance of the Fund’s peer group and custom peer group for the three-year period. The Board also noted that the performance of the Fund was lower than its benchmark index for the three-year period. The Board also considered the performance of the underlying Portfolios. The Board concluded that the performance of the Fund was satisfactory.
Management Fees and Expenses
The Board considered contractual fee rates payable by the Portfolios and by the Fund for advisory and administrative services (referred to collectively as “management fees”). As part of its review, the Board considered the Fund’s management fees and total expense ratio for the one-year period ended December 31, 2021, as compared to those of comparable funds, before and after giving effect to any undertaking to waive fees or reimburse expenses. The Board also considered certain factors identified by management in response to inquiries from the Contract Review Committee regarding the Fund’s total expense ratio relative to comparable funds.
After considering the foregoing information, and in light of the nature, extent and quality of the services provided by each Adviser, the Board concluded that the management fees charged for advisory and related services are reasonable.
Profitability and “Fall-Out” Benefits
The Board considered the level of profits realized by each Adviser and relevant affiliates thereof in providing investment advisory and administrative services to the Fund, to the Portfolios and to all Eaton Vance Funds as a group. The Board considered the level of profits realized without regard to marketing support or other payments by the Adviser and its affiliates to third parties in respect of distribution or other services.
Eaton Vance
Floating-Rate & High Income Fund
October 31, 2022
Board of Trustees’ Contract Approval — continued
The Board concluded that, in light of the foregoing factors and the nature, extent and quality of the services rendered, the profits realized by each Adviser and its affiliates are deemed not to be excessive.
The Board also considered direct or indirect fall-out benefits received by each Adviser and its affiliates in connection with their respective relationships with the Fund and the Portfolios, including the benefits of research services that may be available to each Adviser as a result of securities transactions effected for the Fund and the Portfolios and other investment advisory clients.
Economies of Scale
In reviewing management fees and profitability, the Board also considered the extent to which the applicable Adviser and its affiliates, on the one hand, and the Fund and the Portfolios, on the other hand, can expect to realize benefits from economies of scale as the assets of the Fund and the Portfolios increase. The Board acknowledged the difficulty in accurately measuring the benefits resulting from economies of scale, if any, with respect to the management of any specific fund or group of funds. The Board reviewed data summarizing the increases and decreases in the assets of the Fund and of all Eaton Vance Funds as a group over various time periods, and evaluated the extent to which the total expense ratio of the Fund and the profitability of each Adviser and its affiliates may have been affected by such increases or decreases. Based upon the foregoing, the Board concluded that the Fund currently shares in the benefits from economies of scale, if any, when they are realized by the Adviser. The Board also concluded that the structure of the advisory fees, which include breakpoints at several asset levels, will allow the Fund and the Portfolios to continue to benefit from any economies of scale in the future.
Eaton Vance
Floating-Rate & High Income Fund
October 31, 2022
Liquidity Risk Management Program
The Fund has implemented a written liquidity risk management program (Program) and related procedures to manage its liquidity in accordance with Rule 22e-4 under the Investment Company Act of 1940, as amended (Liquidity Rule). The Liquidity Rule defines “liquidity risk” as the risk that a fund could not meet requests to redeem shares issued by the fund without significant dilution of the remaining investors’ interests in the fund. The Fund’s Board of Trustees/Directors has designated the investment adviser to serve as the administrator of the Program and the related procedures. The administrator has established a Liquidity Risk Management Oversight Committee (Committee) to perform the functions necessary to administer the Program. As part of the Program, the administrator is responsible for identifying illiquid investments and categorizing the relative liquidity of the Fund’s investments in accordance with the Liquidity Rule. Under the Program, the administrator assesses, manages, and periodically reviews the Fund’s liquidity risk, and is responsible for making certain reports to the Fund’s Board of Trustees/Directors and the Securities and Exchange Commission (SEC) regarding the liquidity of the Fund’s investments, and to notify the Board of Trustees/Directors and the SEC of certain liquidity events specified in the Liquidity Rule. The liquidity of the Fund’s portfolio investments is determined based on a number of factors including, but not limited to, relevant market, trading and investment-specific considerations under the Program.
At a meeting of the Fund’s Board of Trustees/Directors on June 7, 2022, the Committee provided a written report to the Fund’s Board of Trustees/Directors pertaining to the operation, adequacy, and effectiveness of implementation of the Program, as well as the operation of the highly liquid investment minimum (if applicable) for the period January 1, 2021 through December 31, 2021 (Review Period). The Program operated effectively during the Review Period, supporting the administrator’s ability to assess, manage and monitor Fund liquidity risk, including during periods of market volatility and net redemptions. During the Review Period, the Fund met redemption requests on a timely basis.
There can be no assurance that the Program will achieve its objectives in the future. Please refer to the Fund’s prospectus for more information regarding the Fund’s exposure to liquidity risk and other principal risks to which an investment in the Fund may be subject.
Eaton Vance
Floating-Rate & High Income Fund
October 31, 2022
Management and Organization
Fund Management. The Trustees of Eaton Vance Mutual Funds Trust (the Trust), Eaton Vance Floating Rate Portfolio and High Income Opportunities Portfolio (collectively, the Portfolios) are responsible for the overall management and supervision of the Trust’s and the Portfolios’ affairs. The Board members and officers of the Trust and the Portfolios are listed below. Except as indicated, each individual has held the office shown or other offices in the same company for the last five years. Board members hold indefinite terms of office. Each Trustee holds office until his or her successor is elected and qualified, subject to a prior death, resignation, retirement, disqualification or removal. Under the terms of the Fund’s and the Portfolios’ current Trustee retirement policy, an Independent Trustee must retire and resign as a Trustee on the earlier of: (i) the first day of July following his or her 74th birthday; or (ii), with limited exception, December 31st of the 20th year in which he or she has served as a Trustee. However, if such retirement and resignation would cause the Fund and each Portfolio to be out of compliance with Section 16 of the 1940 Act or any other regulations or guidance of the SEC, then such retirement and resignation will not become effective until such time as action has been taken for the Fund and each Portfolio to be in compliance therewith. The “noninterested Trustees” consist of those Trustees who are not “interested persons” of the Trust and each Portfolio, as that term is defined under the 1940 Act. The business address of each Board member and officer is Two International Place, Boston, Massachusetts 02110. As used below, “BMR” refers to Boston Management and Research, “EVC” refers to Eaton Vance Corp., “EV” refers to EV LLC, “EVM” refers to Eaton Vance Management and “EVD” refers to Eaton Vance Distributors, Inc. EV is the trustee of each of EVM and BMR. Effective March 1, 2021, each of EVM, BMR, EVD and EV are indirect, wholly owned subsidiaries of Morgan Stanley. Each officer affiliated with EVM may hold a position with other EVM affiliates that is comparable to his or her position with EVM listed below. Each Trustee oversees 135 funds (with the exception of Mr. Bowser who oversees 110 funds) in the Eaton Vance fund complex (including both funds and portfolios in a hub and spoke structure).
| | | | | | |
| Name and Year of Birth | | Trust/Portfolio Position(s) | | Length of Service | | Principal Occupation(s) and Other Directorships During Past Five Years and Other Relevant Experience |
|
| Interested Trustee |
| | | |
Thomas E. Faust Jr. 1958 | | Trustee | | Since 2007 | | Chairman of Morgan Stanley Investment Management, Inc. (MSIM), member of the Board of Managers and President of EV (since 2021), Chief Executive Officer of EVM and BMR. Formerly, Chairman, Chief Executive Officer (2007-2021) and President (2006-2021) of EVC and Director of EVD (2007-2022). Mr. Faust is an interested person because of his positions with MSIM, BMR, EVM and EV, which are affiliates of the Trust. Other Directorships. Formerly, Director of EVC (2007-2021) and Hexavest Inc. (investment management firm) (2012-2021). |
|
| Noninterested Trustees |
| | | |
Alan C. Bowser(1) 1962 | | Trustee | | Since 2022 | | Chief Diversity Officer, Partner and a member of the Operating Committee, and formerly served as Senior Advisor on Diversity and Inclusion for the firm’s chief executive officer, Co-Head of the Americas Region, and Senior Client Advisor of Bridgewater Associates, an asset management firm (2011- present). Other Directorships. None. |
| | | |
Mark R. Fetting 1954 | | Trustee | | Since 2016 | | Private investor. Formerly held various positions at Legg Mason, Inc. (investment management firm) (2000-2012), including President, Chief Executive Officer, Director and Chairman (2008-2012), Senior Executive Vice President (2004-2008) and Executive Vice President (2001-2004). Formerly, President of Legg Mason family of funds (2001-2008). Formerly, Division President and Senior Officer of Prudential Financial Group, Inc. and related companies (investment management firm) (1991-2000). Other Directorships. None. |
| | | |
Cynthia E. Frost 1961 | | Trustee | | Since 2014 | | Private investor. Formerly, Chief Investment Officer of Brown University (university endowment) (2000-2012). Formerly, Portfolio Strategist for Duke Management Company (university endowment manager) (1995-2000). Formerly, Managing Director, Cambridge Associates (investment consulting company) (1989-1995). Formerly, Consultant, Bain and Company (management consulting firm) (1987-1989). Formerly, Senior Equity Analyst, BA Investment Management Company (1983-1985). Other Directorships. None. |
| | | |
George J. Gorman 1952 | | Chairperson of the Board and Trustee | | Since 2021 (Chairperson) and 2014 | | Principal at George J. Gorman LLC (consulting firm). Formerly, Senior Partner at Ernst & Young LLP (a registered public accounting firm) (1974-2009). Other Directorships. None. |
Eaton Vance
Floating-Rate & High Income Fund
October 31, 2022
Management and Organization — continued
| | | | | | |
| Name and Year of Birth | | Trust/Portfolio Position(s) | | Length of Service | | Principal Occupation(s) and Other Directorships During Past Five Years and Other Relevant Experience |
|
| Noninterested Trustees (continued) |
| | | |
Valerie A. Mosley 1960 | | Trustee | | Since 2014 | | Chairwoman and Chief Executive Officer of Valmo Ventures (a consulting and investment firm). Founder of Upward Wealth, Inc., dba BrightUp, a fintech platform. Formerly, Partner and Senior Vice President, Portfolio Manager and Investment Strategist at Wellington Management Company, LLP (investment management firm) (1992-2012). Formerly, Chief Investment Officer, PG Corbin Asset Management (1990-1992). Formerly worked in institutional corporate bond sales at Kidder Peabody (1986-1990). Other Directorships. Director of DraftKings, Inc. (digital sports entertainment and gaming company) (since September 2020). Director of Envestnet, Inc. (provider of intelligent systems for wealth management and financial wellness) (since 2018). Formerly, Director of Dynex Capital, Inc. (mortgage REIT) (2013-2020) and Director of Groupon, Inc. (e-commerce provider) (2020-2022). |
| | | |
Keith Quinton 1958 | | Trustee | | Since 2018 | | Private investor, researcher and lecturer. Formerly, Independent Investment Committee Member at New Hampshire Retirement System (2017-2021). Formerly, Portfolio Manager and Senior Quantitative Analyst at Fidelity Investments (investment management firm) (2001-2014). Other Directorships. Formerly, Director (2016-2021) and Chairman (2019-2021) of New Hampshire Municipal Bond Bank. |
| | | |
Marcus L. Smith 1966 | | Trustee | | Since 2018 | | Private investor and independent corporate director. Formerly, Chief Investment Officer, Canada (2012-2017), Chief Investment Officer, Asia (2010-2012), Director of Asian Research (2004-2010) and portfolio manager (2001-2017) at MFS Investment Management (investment management firm). Other Directorships. Director of First Industrial Realty Trust, Inc. (an industrial REIT) (since 2021). Director of MSCI Inc. (global provider of investment decision support tools) (since 2017). Formerly, Director of DCT Industrial Trust Inc. (logistics real estate company) (2017-2018). |
| | | |
Susan J. Sutherland 1957 | | Trustee | | Since 2015 | | Private investor. Director of Ascot Group Limited and certain of its subsidiaries (insurance and reinsurance) (since 2017). Formerly, Director of Hagerty Holding Corp. (insurance) (2015-2018) and Montpelier Re Holdings Ltd. (insurance and reinsurance) (2013-2015). Formerly, Associate, Counsel and Partner at Skadden, Arps, Slate, Meagher & Flom LLP (law firm) (1982-2013). Other Directorships. Director of Kairos Acquisition Corp. (insurance/InsurTech acquisition company) (since 2021). |
| | | |
| Scott E. Wennerholm 1959 | | Trustee | | Since 2016 | | Private Investor. Formerly, Trustee at Wheelock College (postsecondary institution) (2012-2018). Formerly, Consultant at GF Parish Group (executive recruiting firm) (2016-2017). Formerly, Chief Operating Officer and Executive Vice President at BNY Mellon Asset Management (investment management firm) (2005-2011). Formerly, Chief Operating Officer and Chief Financial Officer at Natixis Global Asset Management (investment management firm) (1997-2004). Formerly, Vice President at Fidelity Investments Institutional Services (investment management firm) (1994-1997). Other Directorships. None. |
| | | |
Nancy A. Wiser(1) 1967 | | Trustee | | Since 2022 | | Formerly, Executive Vice President and the Global Head of Operations at Wells Fargo Asset Management (2011-2021). Other Directorships. None. |
| | | | | | |
| Name and Year of Birth | | Trust/Portfolio
Position(s) | | Length of Service | | Principal Occupation(s) During Past Five Years |
|
| Principal Officers who are not Trustees |
| | | |
Eric A. Stein 1980 | | President | | Since 2020 | | Vice President and Chief Investment Officer, Fixed Income of EVM and BMR. Prior to November 1, 2020, Mr. Stein was a co-Director of Eaton Vance’s Global Income Investments. Also Vice President of Calvert Research and Management (“CRM”). |
| | | |
Deidre E. Walsh 1971 | | Vice President and Chief Legal Officer | | Since 2009 | | Vice President of EVM and BMR. Also Vice President of CRM. |
Eaton Vance
Floating-Rate & High Income Fund
October 31, 2022
Management and Organization — continued
| | | | | | |
| Name and Year of Birth | | Trust/Portfolio
Position(s) | | Length of Service | | Principal Occupation(s) During Past Five Years |
|
| Principal Officers who are not Trustees (continued) |
| | | |
James F. Kirchner 1967 | | Treasurer | | Since 2007 | | Vice President of EVM and BMR. Also Vice President of CRM. |
| | | |
Nicholas Di Lorenzo 1987 | | Secretary | | Since 2022 | | Formerly, associate (2012-2021) and counsel (2022) at Dechert LLP. |
| | | |
Richard F. Froio 1968 | | Chief Compliance Officer | | Since 2017 | | Vice President of EVM and BMR since 2017. Formerly Deputy Chief Compliance Officer (Adviser/Funds) and Chief Compliance Officer (Distribution) at PIMCO (2012-2017) and Managing Director at BlackRock/Barclays Global Investors (2009-2012). |
| (1) | Mr. Bowser and Ms. Wiser began serving as Trustees effective April 4, 2022. |
The SAI for the Fund includes additional information about the Trustees and officers of the Fund and the Portfolios and can be obtained without charge on Eaton Vance’s website at www.eatonvance.com or by calling 1-800-262-1122.
Eaton Vance Funds
| | |
| Privacy Notice | | April 2021 |
| | |
| |
| FACTS | | WHAT DOES EATON VANCE DO WITH YOUR
PERSONAL INFORMATION? |
| | | |
| |
| | |
| Why? | | Financial companies choose how they share your personal information. Federal law gives consumers the right to limit some but not all sharing. Federal law also requires us to tell you how we collect, share, and protect your personal information. Please read this notice carefully to understand what we do. |
| | |
| | | |
| What? | | The types of personal information we collect and share depend on the product or service you have with us. This information can include: ∎ Social Security number and income ∎ investment experience and risk tolerance ∎ checking account number and wire transfer instructions |
| | |
| | | |
| How? | | All financial companies need to share customers’ personal information to run their everyday business. In the section below, we list the reasons financial companies can share their customers’ personal information; the reasons Eaton Vance chooses to share; and whether you can limit this sharing. |
| | |
| | | |
| | | | |
Reasons we can share your
personal information | | Does Eaton Vance share? | | Can you limit this sharing? |
| For our everyday business purposes — such as to process your transactions, maintain your account(s), respond to court orders and legal investigations, or report to credit bureaus | | Yes | | No |
| For our marketing purposes — to offer our products and services to you | | Yes | | No |
| For joint marketing with other financial companies | | No | | We don’t share |
| For our investment management affiliates’ everyday business purposes — information about your transactions, experiences, and creditworthiness | | Yes | | Yes |
| For our affiliates’ everyday business purposes — information about your transactions and experiences | | Yes | | No |
| For our affiliates’ everyday business purposes — information about your creditworthiness | | No | | We don’t share |
| For our investment management affiliates to market to you | | Yes | | Yes |
| For our affiliates to market to you | | No | | We don’t share |
| For nonaffiliates to market to you | | No | | We don’t share |
| | |
| To limit our sharing | | Call toll-free 1-800-262-1122 or email: EVPrivacy@eatonvance.com Please note: If you are a new customer, we can begin sharing your information 30 days from the date we sent this notice. When you are no longer our customer, we continue to share your information as described in this notice. However, you can contact us at any time to limit our sharing. |
| | |
| | | |
| | |
| Questions? | | Call toll-free 1-800-262-1122 or email: EVPrivacy@eatonvance.com |
| | |
| | | |
Eaton Vance Funds
| | |
| Privacy Notice — continued | | April 2021 |
| | |
| Who we are |
| Who is providing this notice? | | Eaton Vance Management, Eaton Vance Distributors, Inc., Eaton Vance Trust Company, Eaton Vance Management (International) Limited, Eaton Vance Advisers International Ltd., Eaton Vance Global Advisors Limited, Eaton Vance Management’s Real Estate Investment Group, Boston Management and Research, Calvert Research and Management, Eaton Vance and Calvert Fund Families and our investment advisory affiliates (“Eaton Vance”) (see Investment Management Affiliates definition below) |
| What we do |
| How does Eaton Vance protect my personal information? | | To protect your personal information from unauthorized access and use, we use security measures that comply with federal law. These measures include computer safeguards and secured files and buildings. We have policies governing the proper handling of customer information by personnel and requiring third parties that provide support to adhere to appropriate security standards with respect to such information. |
| How does Eaton Vance collect my personal information? | | We collect your personal information, for example, when you ∎ open an account or make deposits or withdrawals from your account ∎ buy securities from us or make a wire transfer ∎ give us your contact information We also collect your personal information from others, such as credit bureaus, affiliates, or other companies. |
| Why can’t I limit all sharing? | | Federal law gives you the right to limit only ∎ sharing for affiliates’ everyday business purposes — information about your creditworthiness ∎ affiliates from using your information to market to you ∎ sharing for nonaffiliates to market to you State laws and individual companies may give you additional rights to limit sharing. See below for more on your rights under state law. |
| Definitions |
| Investment Management Affiliates | | Eaton Vance Investment Management Affiliates include registered investment advisers, registered broker- dealers, and registered and unregistered funds. Investment Management Affiliates does not include entities associated with Morgan Stanley Wealth Management, such as Morgan Stanley Smith Barney LLC and Morgan Stanley & Co. |
| Affiliates | | Companies related by common ownership or control. They can be financial and nonfinancial companies. ∎ Our affiliates include companies with a Morgan Stanley name and financial companies such as Morgan Stanley Smith Barney LLC and Morgan Stanley & Co. |
| Nonaffiliates | | Companies not related by common ownership or control. They can be financial and nonfinancial companies. ∎ Eaton Vance does not share with nonaffiliates so they can market to you. |
| Joint marketing | | A formal agreement between nonaffiliated financial companies that together market financial products or services to you. ∎ Eaton Vance doesn’t jointly market. |
| Other important information |
Vermont: Except as permitted by law, we will not share personal information we collect about Vermont residents with Nonaffiliates unless you provide us with your written consent to share such information. California: Except as permitted by law, we will not share personal information we collect about California residents with Nonaffiliates and we will limit sharing such personal information with our Affiliates to comply with California privacy laws that apply to us. |
Eaton Vance Funds
IMPORTANT NOTICES
Delivery of Shareholder Documents. The Securities and Exchange Commission (SEC) permits funds to deliver only one copy of shareholder documents, including prospectuses, proxy statements and shareholder reports, to fund investors with multiple accounts at the same residential or post office box address. This practice is often called “householding” and it helps eliminate duplicate mailings to shareholders. Eaton Vance, or your financial intermediary, may household the mailing of your documents indefinitely unless you instruct Eaton Vance, or your financial intermediary, otherwise. If you would prefer that your Eaton Vance documents not be householded, please contact Eaton Vance at 1-800-262-1122, or contact your financial intermediary. Your instructions that householding not apply to delivery of your Eaton Vance documents will typically be effective within 30 days of receipt by Eaton Vance or your financial intermediary.
Portfolio Holdings. Each Eaton Vance Fund and its underlying Portfolio(s) (if applicable) files a schedule of portfolio holdings on Part F to Form N-PORT with the SEC. Certain information filed on Form N-PORT may be viewed on the Eaton Vance website at www.eatonvance.com, by calling Eaton Vance at 1-800-262-1122 or in the EDGAR database on the SEC’s website at www.sec.gov.
Proxy Voting. From time to time, funds are required to vote proxies related to the securities held by the funds. The Eaton Vance Funds or their underlying Portfolios (if applicable) vote proxies according to a set of policies and procedures approved by the Funds’ and Portfolios’ Boards. You may obtain a description of these policies and procedures and information on how the Funds or Portfolios voted proxies relating to portfolio securities during the most recent 12-month period ended June 30, without charge, upon request, by calling 1-800-262-1122 and by accessing the SEC’s website at www.sec.gov.
This Page Intentionally Left Blank
Investment Adviser of Eaton Vance Floating Rate Portfolio
Boston Management and Research
Two International Place
Boston, MA 02110
Investment Adviser and Administrator of Eaton Vance
Floating-Rate & High Income Fund
Eaton Vance Management
Two International Place
Boston, MA 02110
Principal Underwriter*
Eaton Vance Distributors, Inc.
Two International Place
Boston, MA 02110
(617) 482-8260
Custodian
State Street Bank and Trust Company
State Street Financial Center, One Lincoln Street
Boston, MA 02111
Transfer Agent
BNY Mellon Investment Servicing (US) Inc.
Attn: Eaton Vance Funds
P.O. Box 9653
Providence, RI 02940-9653
(800) 262-1122
Independent Registered Public Accounting Firm
Deloitte & Touche LLP
200 Berkeley Street
Boston, MA 02116-5022
Fund Offices
Two International Place
Boston, MA 02110
| * | FINRA BrokerCheck. Investors may check the background of their Investment Professional by contacting the Financial Industry Regulatory Authority (FINRA). FINRA BrokerCheck is a free tool to help investors check the professional background of current and former FINRA-registered securities firms and brokers. FINRA BrokerCheck is available by calling 1-800-289-9999 and at www.FINRA.org. The FINRA BrokerCheck brochure describing this program is available to investors at www.FINRA.org. |
811 10.31.22
Eaton Vance
Government Opportunities Fund
Annual Report
October 31, 2022
Commodity Futures Trading Commission Registration. The Commodity Futures Trading Commission (“CFTC”) has adopted regulations that subject registered investment companies and advisers to regulation by the CFTC if a fund invests more than a prescribed level of its assets in certain CFTC-regulated instruments (including futures, certain options and swap agreements) or markets itself as providing investment exposure to such instruments. The investment adviser has claimed an exclusion from the definition of “commodity pool operator” under the Commodity Exchange Act with respect to its management of the Fund. Accordingly, neither the Fund nor the adviser with respect to the operation of the Fund is subject to CFTC regulation. Because of its management of other strategies, the Fund's adviser is registered with the CFTC as a commodity pool operator. The adviser is also registered as a commodity trading advisor.
Fund shares are not insured by the FDIC and are not deposits or other obligations of, or guaranteed by, any depository institution. Shares are subject to investment risks, including possible loss of principal invested.
This report must be preceded or accompanied by a current summary prospectus or prospectus. Before investing, investors should consider carefully the investment objective, risks, and charges and expenses of a mutual fund. This and other important information is contained in the summary prospectus and prospectus, which can be obtained from a financial intermediary. Prospective investors should read the prospectus carefully before investing. For further information, please call 1-800-262-1122.
Annual Report October 31, 2022
Eaton Vance
Government Opportunities Fund
Eaton Vance
Government Opportunities Fund
October 31, 2022
Management’s Discussion of Fund Performance†
Economic and Market Conditions
The 12-month period ended October 31, 2022, saw a reversal in U.S. monetary policy in response to surging inflation, a hot housing market, and strength in the U.S. labor market. At the same time, financial markets suffered as prices for equity and fixed-income assets around the globe experienced steep declines, while U.S. Treasury yields generally rose.
The period began with the U.S. Federal Reserve (the Fed) taking its first step toward tighter monetary policy by tapering its monthly asset purchases. As COVID-19 vaccinations increased and the U.S. economy began to recover, a jump in consumer and corporate spending raised the threat of out-of-control inflation.
Against the backdrop of rising inflation readings, the Fed’s hawkish response -- to intentionally slow economic growth by raising the cost of borrowing through higher interest rates -- caused short-term U.S. Treasury yields to shoot higher and longer term yields to fall. Reduced demand for agency mortgage-backed securities (MBS) also caused the yield spreads on these securities to widen toward the end of 2021.
During the first quarter of 2022, major central banks worldwide tightened their monetary policies to seek to rein in inflation, which forced bond yields even higher. In February, Russia’s invasion of Ukraine pushed energy costs further up and COVID-19 lockdowns in China exacerbated global supply-chain disruptions, adding to inflationary pressures. Short-term U.S. Treasury yields continued to grow while the Fed raised the federal funds rate 0.25% in March -- to a 0.25%-0.50% range -- and signaled several more increases by year-end. Mortgage rates skyrocketed during the period, resulting in a drop in refinancing activity.
Surging inflation, growing fears of recession, and a tight monetary policy weighed on investor sentiment during the second quarter of 2022. This led to declines in equity and fixed-income markets, and a further rise in U.S. Treasury yields. The agency MBS market remained under pressure due to heightened interest rate volatility and concerns about a potential increase in MBS sell-offs by the Fed.
At its June, July, and September meetings, the Fed hiked the federal funds rate 0.75% each time -- to a 3.00%-3.25% range -- its first moves of that magnitude since 1994, leading the MBS market to its worst quarterly return since 1981. Meanwhile, mortgage rates ended the period at their highest levels since 2008. Despite the Fed raising rates, inflation remained stubbornly high during the third quarter of 2022.
For the period as a whole, the 2-year U.S. Treasury yield rose by roughly 4%, and the average 30-year fixed-rate mortgage briefly rose above 7% -- its highest point in more than 20 years. Agency MBS spreads widened by more than 100 basis points during the period -- levels not seen since the Great Recession.
Fund Performance
For the 12-month period ended October 31, 2022, Eaton Vance Government Opportunities Fund (the Fund) returned -6.63% for Class A shares at net asset value (NAV), underperforming its benchmark, the ICE BofA 1-3 Year U.S. Treasury Index (the Index), which returned -4.67%.
In response to surging inflation, the U.S. Federal Reserve (the Fed) made a dramatic shift from a relatively accommodative monetary policy to a more restrictive one. The Fed raised the federal funds target rate five times during the period, while also embarking on quantitative tightening that involved reducing its holdings of U.S. Treasurys and agency mortgage-backed securities (MBS).
U.S. Treasury yields and mortgage rates spiked during the period, and many fixed-income markets around the world experienced their worst performance in decades. Higher mortgage rates caused refinance activity to plummet and home-purchase activity to cool during the period, which should have helped MBS performance. However, a decrease in MBS demand by the Fed and other buyers weighed on the MBS sector during the period.
The main detractor from Fund performance relative to the Index during the period was its exposure to lower coupon collateralized mortgage obligations (CMOs). Because CMOs generally carry longer durations, this bond asset class was negatively impacted by a sharp rise in interest rates during the period. The Fund’s allocation to fixed-rate agency MBS pools was also weakened by higher rates during the period.
Strong performance by the Fund’s interest-only securities helped offset some market headwinds as interest-only MBS prices reacted positively to rising rates. Exposure to floating-rate government-guaranteed loans also contributed to Fund returns relative to the Index during a period when bond coupons generally adjusted higher, while MBS prices remained relatively stable amid market volatility.
See Endnotes and Additional Disclosures in this report.
Past performance is no guarantee of future results. Returns are historical and are calculated by determining the percentage change in net asset value (NAV) or offering price (as applicable) with all distributions reinvested. Furthermore, returns do not reflect the deduction of taxes that shareholders may have to pay on Fund distributions or upon the redemption of Fund shares. Investment return and principal value will fluctuate so that shares, when redeemed, may be worth more or less than their original cost. Performance for periods less than or equal to one year is cumulative. Performance is for the stated time period only; due to market volatility, current Fund performance may be lower or higher than the quoted return. For performance as of the most recent month-end, please refer to eatonvance.com.
Eaton Vance
Government Opportunities Fund
October 31, 2022
Performance
Portfolio Manager(s) Andrew Szczurowski, CFA and Alexander Payne, CFA
| % Average Annual Total Returns1,2 | Class
Inception Date | Performance
Inception Date | One Year | Five Years | Ten Years |
| Class A at NAV | 08/24/1984 | 08/24/1984 | (6.63)% | (0.03)% | 0.29% |
| Class A with 3.25% Maximum Sales Charge | — | — | (9.63) | (0.68) | (0.05) |
| Class C at NAV | 11/01/1993 | 08/24/1984 | (7.34) | (0.77) | (0.32) |
| Class C with 1% Maximum Deferred Sales Charge | — | — | (8.26) | (0.77) | (0.32) |
| Class I at NAV | 04/03/2009 | 08/24/1984 | (6.40) | 0.23 | 0.54 |
| Class R at NAV | 08/12/2005 | 08/24/1984 | (6.90) | (0.28) | 0.04 |
|
| ICE BofA 1-3 Year U.S. Treasury Index | — | — | (4.67)% | 0.57% | 0.60% |
| % Total Annual Operating Expense Ratios3 | Class A | Class C | Class I | Class R |
| Gross | 1.07% | 1.82% | 0.82% | 1.32% |
| Net | 1.05 | 1.80 | 0.80 | 1.30 |
Growth of $10,000
This graph shows the change in value of a hypothetical investment of $10,000 in Class A of the Fund for the period indicated. For comparison, the same investment is shown in the indicated index.
| Growth of Investment | Amount Invested | Period Beginning | At NAV | With Maximum Sales Charge |
| Class C | $10,000 | 10/31/2012 | $9,687 | N.A. |
| Class I, at minimum investment | $1,000,000 | 10/31/2012 | $1,055,019 | N.A. |
| Class R | $10,000 | 10/31/2012 | $10,039 | N.A. |
See Endnotes and Additional Disclosures in this report.
Past performance is no guarantee of future results. Returns are historical and are calculated by determining the percentage change in net asset value (NAV) or offering price (as applicable) with all distributions reinvested. Furthermore, returns do not reflect the deduction of taxes that shareholders may have to pay on Fund distributions or upon the redemption of Fund shares. Investment return and principal value will fluctuate so that shares, when redeemed, may be worth more or less than their original cost. Performance for periods less than or equal to one year is cumulative. Performance is for the stated time period only; due to market volatility, current Fund performance may be lower or higher than the quoted return. For performance as of the most recent month-end, please refer to eatonvance.com.
Eaton Vance
Government Opportunities Fund
October 31, 2022
| Asset Allocation (% of total investments)1 |
Footnotes:
| 1 | Other represents any investment type less than 1% of total investments. |
Eaton Vance
Government Opportunities Fund
October 31, 2022
Endnotes and Additional Disclosures
| † | The views expressed in this report are those of the portfolio manager(s) and are current only through the date stated at the top of this page. These views are subject to change at any time based upon market or other conditions, and Eaton Vance and the Fund(s) disclaim any responsibility to update such views. These views may not be relied upon as investment advice and, because investment decisions are based on many factors, may not be relied upon as an indication of trading intent on behalf of any Eaton Vance fund. This commentary may contain statements that are not historical facts, referred to as “forward-looking statements.” The Fund’s actual future results may differ significantly from those stated in any forward-looking statement, depending on factors such as changes in securities or financial markets or general economic conditions, the volume of sales and purchases of Fund shares, the continuation of investment advisory, administrative and service contracts, and other risks discussed from time to time in the Fund’s filings with the Securities and Exchange Commission. |
| | |
| 1 | ICE BofA 1-3 Year U.S. Treasury Index is an unmanaged index of short-term U.S. Treasury securities. ICE® BofA® indices are not for redistribution or other uses; provided “as is”, without warranties, and with no liability. Eaton Vance has prepared this report and ICE Data Indices, LLC does not endorse it, or guarantee, review, or endorse Eaton Vance’s products. BofA® is a licensed registered trademark of Bank of America Corporation in the United States and other countries. Bloomberg U.S. Intermediate Government Bond Index is an unmanaged index of U.S. government bonds with maturities from one year up to (but not including) 10 years. Unless otherwise stated, index returns do not reflect the effect of any applicable sales charges, commissions, expenses, taxes or leverage, as applicable. It is not possible to invest directly in an index. |
| 2 | Total Returns at NAV do not include applicable sales charges. If sales charges were deducted, the returns would be lower. Total Returns shown with maximum sales charge reflect the stated maximum sales charge. Unless otherwise stated, performance does not reflect the deduction of taxes on Fund distributions or redemptions of Fund shares.Effective November 5, 2020, Class C shares automatically convert to Class A shares eight years after purchase. The average annual total returns listed for Class C reflect conversion to Class A shares after eight years. Prior to November 5, 2020, Class C shares automatically converted to Class A shares ten years after purchase. |
| 3 | Source: Fund prospectus. Net expense ratios reflect a contractual expense reimbursement that continues through 2/28/23. The expense ratios for the current reporting period can be found in the Financial Highlights section of this report. Performance reflects expenses waived and/or reimbursed, if applicable. Without such waivers and/or reimbursements, performance would have been lower. |
| | Fund profile subject to change due to active management. |
| | Additional Information |
| | Duration is a measure of the expected change in price of a bond — in percentage terms — given a one percent change in interest rates, all else being constant. Securities with lower durations tend to be less sensitive to interest rate changes. |
| | Spread is the difference in yield between a U.S. Treasury bond and another debt security of the same maturity but different credit quality. |
Eaton Vance
Government Opportunities Fund
October 31, 2022
Example
As a Fund shareholder, you incur two types of costs: (1) transaction costs, including sales charges (loads) on purchases and redemption fees (if applicable); and (2) ongoing costs, including management fees; distribution and/or service fees; and other Fund expenses. This Example is intended to help you understand your ongoing costs (in dollars) of Fund investing and to compare these costs with the ongoing costs of investing in other mutual funds. The Example is based on an investment of $1,000 invested at the beginning of the period and held for the entire period (May 1, 2022 to October 31, 2022).
Actual Expenses
The first section of the table below provides information about actual account values and actual expenses. You may use the information in this section, together with the amount you invested, to estimate the expenses that you paid over the period. Simply divide your account value by $1,000 (for example, an $8,600 account value divided by $1,000 = 8.6), then multiply the result by the number in the first section under the heading entitled “Expenses Paid During Period” to estimate the expenses you paid on your account during this period.
Hypothetical Example for Comparison Purposes
The second section of the table below provides information about hypothetical account values and hypothetical expenses based on the actual Fund expense ratio and an assumed rate of return of 5% per year (before expenses), which is not the actual Fund return. The hypothetical account values and expenses may not be used to estimate the actual ending account balance or expenses you paid for the period. You may use this information to compare the ongoing costs of investing in your Fund and other funds. To do so, compare this 5% hypothetical example with the 5% hypothetical examples that appear in the shareholder reports of the other funds.
Please note that the expenses shown in the table are meant to highlight your ongoing costs only and do not reflect any transactional costs, such as sales charges (loads) or redemption fees (if applicable). Therefore, the second section of the table is useful in comparing ongoing costs only, and will not help you determine the relative total costs of owning different funds. In addition, if these transactional costs were included, your costs would be higher.
| | Beginning
Account Value
(5/1/22) | Ending
Account Value
(10/31/22) | Expenses Paid
During Period*
(5/1/22 – 10/31/22) | Annualized
Expense
Ratio |
| Actual | | | | |
| Class A | $1,000.00 | $ 954.00 | $5.17** | 1.05% |
| Class C | $1,000.00 | $ 950.30 | $8.85** | 1.80% |
| Class I | $1,000.00 | $ 955.20 | $3.94** | 0.80% |
| Class R | $1,000.00 | $ 952.60 | $6.40** | 1.30% |
| |
| Hypothetical | | | | |
| (5% return per year before expenses) | | | | |
| Class A | $1,000.00 | $1,019.91 | $5.35** | 1.05% |
| Class C | $1,000.00 | $1,016.13 | $9.15** | 1.80% |
| Class I | $1,000.00 | $1,021.17 | $4.08** | 0.80% |
| Class R | $1,000.00 | $1,018.65 | $6.61** | 1.30% |
| * | Expenses are equal to the Fund's annualized expense ratio for the indicated Class, multiplied by the average account value over the period, multiplied by 184/365 (to reflect the one-half year period). The Example assumes that the $1,000 was invested at the net asset value per share determined at the close of business on April 30, 2022. |
| ** | Absent an allocation of certain expenses to an affiliate, expenses would be higher. |
Eaton Vance
Government Opportunities Fund
October 31, 2022
| Asset-Backed Securities — 4.4% |
| Security | Principal
Amount
(000's omitted) | Value |
| KKR SFR Warehouse Participation, 6.55%, (30-day average SOFR + 3.50%), 12/13/23(1) | $ | 2,821 | $ 2,796,206 |
| NewRez Warehouse Securitization Trust, Series 2021-1, Class E, 6.836%, (1 mo. USD LIBOR + 3.25%), 5/25/55(1)(2) | | 4,400 | 4,267,033 |
| NRZ Excess Spread-Collateralized Notes: | | | |
| Series 2021-FNT1, Class A, 2.981%, 3/25/26(2) | | 335 | 295,552 |
| Series 2021-GNT1, Class A, 3.474%, 11/25/26(2) | | 3,165 | 2,777,644 |
| Unison Trust, Series 2021-1, Class A, 4.50%, 4/25/50(2)(3) | | 9,239 | 8,447,562 |
Total Asset-Backed Securities
(identified cost $19,475,655) | | | $ 18,583,997 |
| Collateralized Mortgage Obligations — 29.1% |
| Security | Principal
Amount
(000's omitted) | Value |
| Angel Oak Mortgage Trust I, LLC, Series 2019-1, Class B1, 5.40%, 11/25/48(2)(3) | $ | 1,000 | $ 974,312 |
| Cascade MH Asset Trust, Series 2022-MH1, Class A, 4.25%, to 7/25/27 to 7/25/27, 8/25/54(2) | | 990 | 858,539 |
| CHNGE Mortgage Trust, Series 2022-4, Class A1, 6.00%, 10/25/57(2)(3) | | 3,944 | 3,821,062 |
| Deephaven Residential Mortgage Trust: | | | |
| Series 2020-2, Class B2, 5.851%, 5/25/65(2)(3) | | 500 | 476,425 |
| Series 2020-2, Class M1, 4.112%, 5/25/65(2)(3) | | 1,000 | 947,497 |
| Federal Home Loan Mortgage Corp.: | | | |
| Series 30, Class I, 7.50%, 4/25/24 | | 4 | 4,065 |
| Series 1822, Class Z, 6.90%, 3/15/26 | | 72 | 75,505 |
| Series 1829, Class ZB, 6.50%, 3/15/26 | | 9 | 8,702 |
| Series 1896, Class Z, 6.00%, 9/15/26 | | 28 | 28,959 |
| Series 2075, Class PH, 6.50%, 8/15/28 | | 25 | 25,225 |
| Series 2091, Class ZC, 6.00%, 11/15/28 | | 76 | 77,189 |
| Series 2105, Class Z, 6.00%, 12/15/28 | | 19 | 19,006 |
| Series 2115, Class K, 6.00%, 1/15/29 | | 164 | 170,993 |
| Series 2142, Class Z, 6.50%, 4/15/29 | | 48 | 48,999 |
| Series 4107, Class SA, 0.784%, (2.57% - 1 mo. USD LIBOR x 0.57), 9/15/42(4) | | 419 | 280,587 |
| Series 4107, Class SB, 0.784%, (2.57% - 1 mo. USD LIBOR x 0.57), 9/15/42(4) | | 208 | 139,488 |
| Series 4107, Class SC, 0.784%, (2.57% - 1 mo. USD LIBOR x 0.57), 9/15/42(4) | | 500 | 334,491 |
| Series 4107, Class SD, 0.784%, (2.57% - 1 mo. USD LIBOR x 0.57), 9/15/42(4) | | 373 | 249,850 |
| Series 4204, Class AF, 4.128%, (1 mo. USD LIBOR + 1.00%), 5/15/43(1) | | 540 | 467,213 |
| Security | Principal
Amount
(000's omitted) | Value |
| Federal Home Loan Mortgage Corp.: (continued) | | | |
| Series 4212, Class NS, 1.305%, (5.40% - 1 mo. USD LIBOR x 1.20), 6/15/43(4) | $ | 287 | $ 257,654 |
| Series 4259, Class UE, 2.50%, 5/15/43 | | 295 | 277,332 |
| Series 4623, Class SK, 1.337%, (3.57% - 1 mo. USD LIBOR x 0.71), 10/15/46(4) | | 259 | 151,513 |
| Series 4938, Class KZ, 2.50%, 12/25/49 | | 634 | 380,168 |
| Series 5009, Class ZN, 3.50%, 7/25/50 | | 834 | 668,089 |
| Series 5020, Class EZ, 2.00%, 10/25/50 | | 1,199 | 730,008 |
| Series 5021, Class CZ, 2.00%, 10/25/50 | | 242 | 137,382 |
| Series 5021, Class NZ, 2.00%, 10/25/50 | | 808 | 482,582 |
| Series 5028, Class AZ, 2.00%, 10/25/50 | | 215 | 122,316 |
| Series 5028, Class TZ, 2.00%, 10/25/50 | | 1,064 | 662,219 |
| Series 5028, Class ZT, 2.00%, 10/25/50 | | 747 | 439,290 |
| Series 5031, Class Z, 2.50%, 10/25/50 | | 1 | 267 |
| Series 5035, Class AZ, 2.00%, 11/25/50 | | 1,084 | 644,218 |
| Series 5035, Class ZK, 2.50%, 11/25/50 | | 1,201 | 844,027 |
| Series 5035, Class ZT, 2.00%, 10/25/50 | | 757 | 445,564 |
| Series 5039, Class ZJ, 2.00%, 11/25/50 | | 98 | 55,782 |
| Series 5040, Class TZ, 2.50%, 11/25/50 | | 178 | 104,877 |
| Series 5042, Class PZ, 2.00%, 11/25/50 | | 2,032 | 1,176,145 |
| Series 5058, Class ZH, 3.00%, 5/25/50 | | 151 | 107,275 |
| Series 5071, Class CS, 0.853%, (3.30% - 30-day average SOFR), 2/25/51(4) | | 1,266 | 710,943 |
| Series 5072, Class ZU, 2.50%, 2/25/51 | | 331 | 225,960 |
| Series 5083, Class ZW, 2.50%, 3/25/51 | | 485 | 329,504 |
| Series 5090, Class PZ, 2.50%, 3/25/51 | | 236 | 159,905 |
| Series 5093, Class Z, 3.00%, 1/25/51 | | 0 (5) | 37 |
| Series 5101, Class EZ, 2.00%, 3/25/51 | | 537 | 273,911 |
| Series 5104, Class WZ, 3.00%, 4/25/51 | | 125 | 77,302 |
| Series 5114, Class ZH, 3.00%, 5/25/51 | | 69 | 44,228 |
| Series 5123, Class JZ, 2.00%, 7/25/51 | | 108 | 55,325 |
| Series 5129, Class HZ, 1.25%, 4/25/50 | | 165 | 119,168 |
| Series 5129, Class TZ, 2.50%, 8/25/51 | | 435 | 333,774 |
| Series 5131, Class QZ, 3.00%, 7/25/51 | | 271 | 203,945 |
| Series 5132, Class LZ, 2.50%, 8/25/51 | | 978 | 668,037 |
| Series 5135, Class MZ, 2.50%, 8/25/51 | | 1,894 | 1,323,903 |
| Series 5136, Class ZJ, 2.50%, 8/25/51 | | 2,031 | 1,401,986 |
| Series 5139, Class DZ, 2.50%, 9/25/51 | | 1,334 | 919,690 |
| Series 5141, Class ZJ, 2.50%, 9/25/51 | | 1,748 | 1,206,930 |
| Series 5144, Class Z, 2.50%, 9/25/51 | | 4,061 | 2,861,533 |
| Series 5148, Class AZ, 2.50%, 10/25/51 | | 3,032 | 2,149,464 |
| Series 5150, Class ZJ, 2.50%, 10/25/51 | | 1,660 | 1,164,677 |
| Series 5150, Class ZN, 2.50%, 10/25/51 | | 183 | 103,456 |
| Series 5159, Class ZP, 3.00%, 11/25/51 | | 418 | 304,308 |
| Series 5159, Class ZT, 3.00%, 11/25/51 | | 779 | 599,090 |
| Series 5160, Class ZY, 3.00%, 10/25/50 | | 2,446 | 1,815,655 |
7
See Notes to Financial Statements.
Eaton Vance
Government Opportunities Fund
October 31, 2022
Portfolio of Investments — continued
| Security | Principal
Amount
(000's omitted) | Value |
| Federal Home Loan Mortgage Corp.: (continued) | | | |
| Series 5163, Class Z, 3.00%, 11/25/51 | $ | 524 | $ 369,383 |
| Series 5166, Class ZN, 3.00%, 9/25/50 | | 951 | 736,808 |
| Series 5168, Class MZ, 3.00%, 10/25/51 | | 996 | 744,364 |
| Interest Only:(6) | | | |
| Series 362, Class C12, 4.00%, 12/15/47 | | 2,356 | 491,585 |
| Series 4749, Class IL, 4.00%, 12/15/47 | | 853 | 161,596 |
| Series 4756, Class KI, 4.00%, 1/15/48 | | 948 | 173,749 |
| Series 4768, Class IO, 4.00%, 3/15/48 | | 678 | 126,927 |
| Series 4772, Class PI, 4.00%, 1/15/48 | | 1,004 | 188,173 |
| Series 4791, Class JI, 4.00%, 5/15/48 | | 1,360 | 270,374 |
| Series 4966, Class SY, 2.464%, (6.05% - 1 mo. USD LIBOR), 4/25/50(4) | | 2,318 | 251,201 |
| Series 5008, Class IE, 2.00%, 9/25/50 | | 8,964 | 1,113,712 |
| Series 5010, Class I, 2.00%, 9/25/50 | | 3,565 | 445,160 |
| Series 5010, Class IN, 2.00%, 9/25/50 | | 3,993 | 498,916 |
| Series 5010, Class NI, 2.00%, 9/25/50 | | 2,949 | 367,076 |
| Series 5016, Class UI, 2.00%, 9/25/50 | | 2,903 | 360,716 |
| Series 5017, Class DI, 2.00%, 9/25/50 | | 5,081 | 631,254 |
| Series 5022, Class AI, 2.00%, 10/25/50 | | 3,820 | 479,022 |
| Series 5024, Class CI, 2.00%, 10/25/50 | | 8,820 | 1,112,348 |
| Series 5025, Class GI, 2.00%, 10/25/50 | | 1,219 | 153,203 |
| Series 5028, Class TI, 2.00%, 10/25/50 | | 1,596 | 162,434 |
| Series 5038, Class DI, 2.00%, 11/25/50 | | 8,014 | 1,004,332 |
| Series 5051, Class S, 0.603%, (3.60% - 30-day average SOFR), 12/25/50(4) | | 4,539 | 158,593 |
| Series 5070, Class CI, 2.00%, 2/25/51 | | 8,506 | 1,138,779 |
| Principal Only:(7) | | | |
| Series 246, Class PO, 0.00%, 5/15/37 | | 1,408 | 1,129,190 |
| Series 3435, Class PO, 0.00%, 4/15/38 | | 1,345 | 1,047,815 |
| Series 4239, Class OU, 0.00%, 7/15/43 | | 319 | 160,442 |
| Federal Home Loan Mortgage Corp. Structured Agency Credit Risk Debt Notes: | | | |
| Series 2019-HQA3, Class B2, 11.086%, (1 mo. USD LIBOR + 7.50%), 9/25/49(1)(2) | | 1,000 | 942,849 |
| Series 2020-DNA4, Class M2, 7.336%, (1 mo. USD LIBOR + 3.75%), 8/25/50(1)(2) | | 1 | 1,002 |
| Series 2020-HQA4, Class M2, 6.736%, (1 mo. USD LIBOR + 3.15%), 9/25/50(1)(2) | | 370 | 370,674 |
| Federal National Mortgage Association: | | | |
| Series 1993-16, Class Z, 7.50%, 2/25/23 | | 1 | 873 |
| Series 1993-39, Class Z, 7.50%, 4/25/23 | | 7 | 6,645 |
| Series 1993-45, Class Z, 7.00%, 4/25/23 | | 5 | 5,199 |
| Series 1993-149, Class M, 7.00%, 8/25/23 | | 6 | 6,178 |
| Series 1993-178, Class PK, 6.50%, 9/25/23 | | 13 | 12,877 |
| Series 1994-40, Class Z, 6.50%, 3/25/24 | | 24 | 24,840 |
| Series 1994-42, Class K, 6.50%, 4/25/24 | | 96 | 97,619 |
| Series 1994-82, Class Z, 8.00%, 5/25/24 | | 29 | 30,418 |
| Security | Principal
Amount
(000's omitted) | Value |
| Federal National Mortgage Association: (continued) | | | |
| Series 2000-49, Class A, 8.00%, 3/18/27 | $ | 62 | $ 65,487 |
| Series 2001-81, Class HE, 6.50%, 1/25/32 | | 206 | 212,152 |
| Series 2002-1, Class G, 7.00%, 7/25/23 | | 6 | 5,780 |
| Series 2012-133, Class WS, 1.185%, (3.79% - 1 mo. USD LIBOR x 0.83), 12/25/42(4) | | 305 | 252,773 |
| Series 2012-134, Class ZT, 2.00%, 12/25/42 | | 1,348 | 1,048,065 |
| Series 2013-6, Class TY, 1.50%, 2/25/43 | | 795 | 571,659 |
| Series 2013-58, Class SC, 0.622%, (6.00% - 1 mo. USD LIBOR x 1.50), 6/25/43(4) | | 323 | 240,343 |
| Series 2020-45, Class MA, 0.332%, (3.20% - 1 mo. USD LIBOR x 0.80), 6/25/43(4) | | 199 | 152,199 |
| Series 2020-63, Class ZN, 3.00%, 9/25/50 | | 92 | 57,303 |
| Series 2021-3, Class ZH, 2.50%, 2/25/51 | | 185 | 126,648 |
| Series 2021-14, Class GZ, 2.50%, 3/25/51 | | 130 | 69,755 |
| Series 2021-42, Class ZD, 3.00%, 11/25/50 | | 675 | 472,888 |
| Series 2021-52, Class JZ, 2.50%, 8/25/51 | | 1,590 | 1,111,627 |
| Series 2021-54, Class HZ, 2.50%, 6/25/51 | | 1,037 | 713,174 |
| Series 2021-54, Class ZJ, 2.50%, 8/25/51 | | 2,939 | 2,058,453 |
| Series 2021-56, Class HZ, 2.50%, 9/25/51 | | 2,659 | 1,912,492 |
| Series 2021-56, Class LZ, 2.50%, 9/25/51 | | 3,067 | 2,222,236 |
| Series 2021-56, Class YZ, 2.50%, 9/25/51 | | 1,111 | 767,859 |
| Series 2021-66, Class JZ, 2.50%, 10/25/51 | | 1,342 | 947,294 |
| Series 2021-77, Class WZ, 3.00%, 8/25/50 | | 37 | 23,014 |
| Series 2021-77, Class Z, 3.00%, 5/25/51 | | 407 | 290,429 |
| Series 2021-79, Class Z, 3.00%, 11/25/51 | | 714 | 508,308 |
| Series 2021-95, Class ZC, 3.00%, 8/25/51 | | 517 | 381,798 |
| Interest Only:(6) | | | |
| Series 2017-66, Class TI, 0.05%, (6.05% - 1 mo. USD LIBOR x 1.00), 10/25/42(4) | | 13,662 | 40,938 |
| Series 2018-21, Class IO, 3.00%, 4/25/48 | | 2,655 | 496,093 |
| Series 2019-1, Class SA, 1.814%, (5.40% - 1 mo. USD LIBOR), 2/25/49(4) | | 1,439 | 69,378 |
| Series 2020-23, Class SP, 2.464%, (6.05% - 1 mo. USD LIBOR), 2/25/50(4) | | 2,313 | 251,352 |
| Series 2020-45, Class HI, 2.50%, 7/25/50 | | 3,582 | 517,702 |
| Series 2020-45, Class IJ, 2.50%, 7/25/50 | | 5,749 | 800,456 |
| Series 2020-72, Class DI, 2.00%, 10/25/50 | | 3,824 | 471,223 |
| Series 2020-72, Class IA, 2.00%, 10/25/50 | | 2,888 | 360,097 |
| Series 2020-73, Class NI, 2.00%, 10/25/50 | | 4,615 | 579,988 |
| Series 2021-3, Class KI, 2.50%, 2/25/51 | | 7,391 | 1,072,031 |
| Series 2021-3, Class LI, 2.50%, 2/25/51 | | 7,315 | 1,029,522 |
| Series 2021-4, Class AI, 2.00%, 12/25/49 | | 9,860 | 1,199,928 |
| Series 2021-10, Class EI, 2.00%, 3/25/51 | | 3,930 | 534,338 |
| Principal Only:(7) | | | |
| Series 379, Class 1, 0.00%, 5/25/37 | | 904 | 696,193 |
| Series 2014-9, Class DO, 0.00%, 2/25/43 | | 480 | 336,425 |
| Series 2014-17, Class PO, 0.00%, 4/25/44 | | 1,258 | 883,821 |
8
See Notes to Financial Statements.
Eaton Vance
Government Opportunities Fund
October 31, 2022
Portfolio of Investments — continued
| Security | Principal
Amount
(000's omitted) | Value |
| Federal National Mortgage Association Connecticut Avenue Securities, Series 2019-R04, Class 2B1, 8.836%, (1 mo. USD LIBOR + 5.25%), 6/25/39(1)(2) | $ | 1,310 | $ 1,300,608 |
| Finance of America HECM Buyout, Series 2022-HB2, Class M5, 6.00%, 7/25/29(2)(3) | | 1,000 | 659,077 |
| Government National Mortgage Association: | | | |
| Series 2016-168, Class JS, 0.973%, (4.46% - 1 mo. USD LIBOR x 1.12), 11/20/46(4) | | 32 | 32,008 |
| Series 2017-137, Class AF, 3.989%, (1 mo. USD LIBOR + 0.50%), 9/20/47(1) | | 1,060 | 1,026,875 |
| Series 2020-84, Class BZ, 2.50%, 6/20/50 | | 1,061 | 727,595 |
| Series 2021-1, Class ZD, 3.00%, 1/20/51 | | 131 | 103,916 |
| Series 2021-24, Class EZ, 2.50%, 1/20/51 | | 381 | 252,276 |
| Series 2021-24, Class KZ, 2.50%, 2/20/51 | | 384 | 272,164 |
| Series 2021-25, Class JZ, 2.50%, 2/20/51 | | 217 | 151,682 |
| Series 2021-49, Class VZ, 2.50%, 3/20/51 | | 5 | 4,884 |
| Series 2021-77, Class ZG, 3.00%, 7/20/50 | | 46 | 28,814 |
| Series 2021-97, Class MZ, 3.00%, 8/20/50 | | 270 | 189,910 |
| Series 2021-97, Class ZC, 3.00%, 8/20/50 | | 576 | 401,287 |
| Series 2021-105, Class MZ, 3.00%, 6/20/51 | | 449 | 287,812 |
| Series 2021-114, Class JZ, 3.00%, 6/20/51 | | 178 | 108,795 |
| Series 2021-118, Class EZ, 2.50%, 7/20/51 | | 1,138 | 788,939 |
| Series 2021-118, Class JZ, 2.50%, 7/20/51 | | 2,858 | 1,961,630 |
| Series 2021-121, Class ZE, 2.50%, 7/20/51 | | 60 | 31,904 |
| Series 2021-122, Class ZL, 2.50%, 7/20/51 | | 1,370 | 947,596 |
| Series 2021-131, Class ZN, 3.00%, 7/20/51 | | 295 | 191,695 |
| Series 2021-136, Class WZ, 3.00%, 8/20/51 | | 745 | 554,577 |
| Series 2021-136, Class Z, 2.50%, 8/20/51 | | 1,867 | 1,284,677 |
| Series 2021-137, Class GZ, 2.50%, 8/20/51 | | 2,190 | 1,646,249 |
| Series 2021-138, Class Z, 2.50%, 8/20/51 | | 1,208 | 848,125 |
| Series 2021-139, Class UZ, 3.00%, 8/20/51 | | 763 | 528,381 |
| Series 2021-139, Class ZJ, 2.50%, 8/20/51 | | 1,663 | 1,270,448 |
| Series 2021-154, Class ZC, 2.50%, 9/20/51 | | 865 | 600,630 |
| Series 2021-154, Class ZL, 3.00%, 9/20/51 | | 462 | 315,652 |
| Series 2021-156, Class GZ, 3.00%, 9/20/51 | | 1,624 | 1,144,944 |
| Series 2021-159, Class ZJ, 2.50%, 9/20/51 | | 1,269 | 892,328 |
| Series 2021-159, Class ZP, 2.00%, 9/20/51 | | 1,137 | 772,944 |
| Series 2021-160, Class NZ, 3.00%, 9/20/51 | | 589 | 443,967 |
| Series 2021-175, Class DZ, 3.00%, 10/20/51 | | 445 | 336,172 |
| Series 2021-177, Class JZ, 3.00%, 10/20/51 | | 482 | 287,564 |
| Series 2021-214, Class LZ, 3.00%, 12/20/51 | | 1,025 | 837,803 |
| Series 2022-173, Class S, 12.503%, (22.73% - 30-day average SOFR), 10/20/52(4) | | 1,750 | 1,753,827 |
| Interest Only:(6) | | | |
| Series 2013-66, Class IE, 0.05%, (6.75% - 1 mo. USD LIBOR x 1.00), 7/20/42(4) | | 7,340 | 16,412 |
| Series 2014-94, Class IC, 0.10%, (6.40% - 1 mo. USD LIBOR x 1.00), 9/20/35(4) | | 11,036 | 43,329 |
| Security | Principal
Amount
(000's omitted) | Value |
| Interest Only: (continued) | | | |
| Series 2014-100, Class VI, 0.15%, (6.60% - 1 mo. USD LIBOR x 1.00), 5/20/40(4) | $ | 4,382 | $ 19,757 |
| Series 2014-139, Class BI, 0.25%, (6.65% - 1 mo. USD LIBOR x 1.00), 11/20/37(4) | | 4,932 | 33,743 |
| Series 2018-127, Class SG, 2.761%, (6.25% - 1 mo. USD LIBOR), 9/20/48(4) | | 3,489 | 294,556 |
| Series 2019-27, Class SA, 2.561%, (6.05% - 1 mo. USD LIBOR), 2/20/49(4) | | 2,423 | 277,709 |
| Series 2019-38, Class SQ, 2.561%, (6.05% - 1 mo. USD LIBOR), 3/20/49(4) | | 2,912 | 270,070 |
| Series 2019-43, Class BS, 2.561%, (6.05% - 1 mo. USD LIBOR), 4/20/49(4) | | 3,957 | 425,685 |
| Series 2020-32, Class KI, 3.50%, 3/20/50 | | 3,861 | 613,967 |
| Series 2020-65, Class MI, 2.50%, 12/20/49 | | 3,053 | 366,409 |
| Series 2020-97, Class MI, 2.50%, 3/20/50 | | 1,975 | 250,822 |
| Series 2020-146, Class IQ, 2.00%, 10/20/50 | | 11,329 | 1,301,411 |
| Series 2020-146, Class QI, 2.00%, 10/20/50 | | 6,083 | 682,658 |
| Series 2020-149, Class NI, 2.50%, 10/20/50 | | 11,861 | 1,648,113 |
| Series 2020-165, Class UI, 2.00%, 11/20/50 | | 4,819 | 580,864 |
| Series 2020-167, Class KI, 2.00%, 11/20/50 | | 7,652 | 877,296 |
| Series 2020-167, Class YI, 2.00%, 11/20/50 | | 6,122 | 739,569 |
| Series 2020-173, Class DI, 2.00%, 11/20/50 | | 9,110 | 1,151,284 |
| Series 2020-181, Class TI, 2.00%, 12/20/50 | | 15,612 | 1,888,847 |
| Series 2021-23, Class TI, 2.50%, 2/20/51 | | 7,684 | 1,037,827 |
| Series 2021-56, Class SD, 0.016%, (2.30% - 30-day average SOFR), 9/20/50(4) | | 4,799 | 57,493 |
| Series 2021-114, Class MI, 3.00%, 6/20/51 | | 5,619 | 804,424 |
| Series 2021-122, Class NI, 3.00%, 7/20/51 | | 3,861 | 554,261 |
| Series 2021-125, Class SA, 0.261%, (3.75% - 1 mo. USD LIBOR), 7/20/51(4) | | 4,373 | 130,227 |
| Series 2021-131, Class QI, 3.00%, 7/20/51 | | 7,670 | 920,443 |
| Series 2021-140, Class YS, 0.104%, (1.70% - 1 mo. USD LIBOR), 8/20/51(4) | | 3,587 | 26,184 |
| Series 2021-175, Class SA, 0.204%, (1.80% - 1 mo. USD LIBOR), 10/20/51(4) | | 46,561 | 362,595 |
| Series 2021-193, Class IU, 3.00%, 11/20/49 | | 15,866 | 2,049,274 |
| Series 2021-193, Class YS, 0.165%, (2.45% - 30-day average SOFR), 11/20/51(4) | | 9,171 | 100,788 |
| Series 2021-196, Class GI, 3.00%, 11/20/51 | | 7,158 | 1,037,849 |
| Series 2022-119, Class CS, 0.08%, (3.00% - 30-day average SOFR), 7/20/52(4) | | 49,619 | 387,090 |
| Series 2022-126, Class AS, 0.77%, (3.69% - 30-day average SOFR), 7/20/52(4) | | 14,796 | 216,224 |
| Series 2022-135, Class SA, 0.08%, (3.00% - 30-day average SOFR), 6/20/52(4) | | 19,882 | 193,449 |
| PNMAC GMSR Issuer Trust: | | | |
| Series 2018-GT1, Class A, 6.436%, (1 mo. USD LIBOR + 2.85%), 2/25/23(1)(2) | | 4,000 | 3,963,424 |
| Series 2018-GT2, Class A, 6.236%, (1 mo. USD LIBOR + 2.65%), 8/25/25(1)(2) | | 430 | 424,423 |
9
See Notes to Financial Statements.
Eaton Vance
Government Opportunities Fund
October 31, 2022
Portfolio of Investments — continued
| Security | Principal
Amount
(000's omitted) | Value |
| PNMAC GMSR Issuer Trust: (continued) | | | |
| Series 2022-GT1, Class A, 7.247%, (30-day average SOFR + 4.25%), 5/25/27(1)(2) | $ | 500 | $ 478,320 |
| Radnor Re, Ltd., Series 2022-1, Class M1A, 5.933%, (30-day average SOFR + 3.75%), 9/25/32(1)(2) | | 3,000 | 2,997,710 |
Total Collateralized Mortgage Obligations
(identified cost $157,066,518) | | | $ 122,487,354 |
| Commercial Mortgage-Backed Securities — 0.4% |
| Security | Principal
Amount
(000's omitted) | Value |
| CSMC Trust, Series 2022-NWPT, Class A, 6.519%, (1 mo. SOFR + 3.143%), 9/9/24(1)(2) | $ | 1,520 | $ 1,506,549 |
Total Commercial Mortgage-Backed Securities
(identified cost $1,516,417) | | | $ 1,506,549 |
| Government National Mortgage Association Participation Agreements — 5.9% |
| Security | Principal
Amount
(000's omitted) | Value |
| Government National Mortgage Association Participation Agreement, 4.75%, (SOFR + 1.70%), 9/5/23 | $ | 24,982 | $ 25,021,691 |
Total Government National Mortgage Association Participation Agreements
(identified cost $24,982,244) | | | $ 25,021,691 |
| U.S. Government Agency Commercial Mortgage-Backed Securities — 0.7% |
| Security | Principal
Amount
(000's omitted) | Value |
FRESB Mortgage Trust:
Interest Only:(6)
Series 2021-SB91, Class X1, 0.568%, 8/25/41(3) | $ | 4,940 | $ 134,662 |
| Government National Mortgage Association: | | | |
| Interest Only:(6) | | | |
| Series 2021-101, Class IO, 0.686%, 4/16/63(3) | | 9,652 | 559,653 |
| Series 2021-132, Class IO, 0.727%, 4/16/63(3) | | 8,963 | 538,020 |
| Series 2021-144, Class IO, 0.825%, 4/16/63(3) | | 8,765 | 577,308 |
| Series 2021-186, Class IO, 0.764%, 5/16/63(3) | | 9,714 | 602,722 |
| Security | Principal
Amount
(000's omitted) | Value |
| Interest Only: (continued) | | | |
| Series 2022-3, Class IO, 0.64%, 2/16/61(3) | $ | 9,863 | $ 523,186 |
Total U.S. Government Agency Commercial Mortgage-Backed Securities
(identified cost $3,624,781) | | | $ 2,935,551 |
| U.S. Government Agency Mortgage-Backed Securities — 70.2% |
| Security | Principal
Amount
(000's omitted) | Value |
| Federal Home Loan Mortgage Corp.: | | | |
| 2.848%, (COF + 1.25%), with maturity at 2035(9) | $ | 732 | $ 713,065 |
| 2.852%, (1 yr. CMT + 2.25%), with maturity at 2038(9) | | 431 | 437,967 |
| 2.852%, (COF + 1.25%), with maturity at 2034(9) | | 193 | 192,281 |
| 2.893%, (1 yr. CMT + 2.24%), with maturity at 2036(9) | | 492 | 499,634 |
| 3.50%, with various maturities to 2052 | | 6,663 | 5,891,115 |
| 4.50%, with various maturities to 2052 | | 12,434 | 11,706,166 |
| 4.699%, (30-day average SOFR + 2.14%), with maturity at 2052(9) | | 1,465 | 1,423,880 |
| 5.00%, with various maturities to 2052 | | 40,661 | 39,241,401 |
| 5.50%, with various maturities to 2052 | | 21,421 | 21,181,391 |
| 6.00%, with maturity at 2033 | | 37 | 37,658 |
| 6.00%, with maturity at 2052(10) | | 1,146 | 1,154,826 |
| 6.50%, with various maturities to 2028 | | 146 | 147,242 |
| 7.00%, with various maturities to 2025 | | 70 | 70,614 |
| 7.09%, with maturity at 2023 | | 1 | 714 |
| 7.31%, with maturity at 2027 | | 2 | 1,589 |
| 7.50%, with maturity at 2023 | | 0 (5) | 370 |
| 7.50%, with maturity at 2024 | | 13 | 12,903 |
| 8.00%, with various maturities to 2026 | | 7 | 7,156 |
| 8.50%, with maturity at 2025 | | 2 | 1,855 |
| 9.00%, with various maturities to 2027 | | 2 | 2,794 |
| 9.50%, with various maturities to 2025 | | 0 (5) | 286 |
| Federal National Mortgage Association: | | | |
| 1.932%, (COF + 1.27%), with maturity at 2033(9) | | 221 | 208,792 |
| 1.965%, (COF + 1.30%), with maturity at 2033(9) | | 131 | 125,341 |
| 2.068%, (COF + 1.29%), with maturity at 2035(9) | | 151 | 144,905 |
| 2.119%, (COF + 1.25%), with maturity at 2025(9) | | 62 | 61,314 |
| 2.355%, (COF + 1.25%), with maturity at 2026(9) | | 90 | 87,427 |
| 2.538%, (12 mo. MTA + 1.17%), with maturity at 2044(9) | | 185 | 174,660 |
| 2.907%, (COF + 2.40%), with maturity at 2027(9) | | 125 | 123,745 |
| 2.914%, (COF + 1.31%), with maturity at 2036(9) | | 202 | 198,062 |
| 3.142%, (COF + 1.26%), with maturity at 2036(9) | | 131 | 129,730 |
| 3.155%, (COF + 1.25%), with maturity at 2034(9) | | 247 | 247,600 |
10
See Notes to Financial Statements.
Eaton Vance
Government Opportunities Fund
October 31, 2022
Portfolio of Investments — continued
| Security | Principal
Amount
(000's omitted) | Value |
| Federal National Mortgage Association: (continued) | | | |
| 3.219%, (1 yr. CMT + 2.10%), with maturity at 2040(9) | $ | 238 | $ 240,837 |
| 3.238%, (COF + 1.25%), with maturity at 2035(9) | | 256 | 256,723 |
| 3.419%, (COF + 1.25%), with maturity at 2034(9) | | 119 | 119,447 |
| 3.50%, with various maturities to 2052 | | 8,004 | 7,101,426 |
| 3.683%, (COF + 1.81%), with maturity at 2036(9) | | 2,604 | 2,604,952 |
| 3.996%, (COF + 1.74%), with maturity at 2035(9) | | 483 | 491,045 |
| 4.059%, (COF + 1.26%), with maturity at 2036(9) | | 38 | 38,367 |
| 4.183%, (COF + 1.87%), with maturity at 2034(9) | | 436 | 439,493 |
| 4.50%, with various maturities to 2052 | | 6,386 | 6,010,513 |
| 4.628%, (30-day average SOFR + 2.13%), with maturity at 2052(9) | | 1,476 | 1,434,933 |
| 4.635%, (30-day average SOFR + 2.13%), with maturity at 2052(9) | | 1,473 | 1,432,352 |
| 5.00%, with various maturities to 2052 | | 15,549 | 15,018,223 |
| 5.50%, with various maturities to 2052 | | 3,686 | 3,645,475 |
| 5.50%, 30-Year, TBA(11) | | 12,450 | 12,278,122 |
| 6.00%, with various maturities to 2032 | | 171 | 173,639 |
| 6.00%, 30-Year, TBA(11) | | 2,450 | 2,449,149 |
| 6.458%, with maturity at 2025(3) | | 17 | 17,164 |
| 7.00%, with maturity at 2024 | | 27 | 27,491 |
| 7.50%, with maturity at 2026 | | 7 | 6,832 |
| 8.032%, with maturity at 2030(3) | | 1 | 1,183 |
| 8.25%, with maturity at 2025 | | 1 | 826 |
| 8.50%, with maturity at 2037 | | 82 | 86,721 |
| 9.00%, with various maturities to 2025 | | 14 | 14,401 |
| 9.50%, with various maturities to 2030 | | 5 | 5,314 |
| Government National Mortgage Association: | | | |
| 1.75%, (1 yr. CMT + 1.50%), with maturity at 2027(9) | | 48 | 46,687 |
| 2.00%, (1 yr. CMT + 1.50%), with maturity at 2026(9) | | 36 | 35,069 |
| 3.50%, with maturity at 2050 | | 738 | 663,550 |
| 4.00%, with various maturities to 2049 | | 1,524 | 1,414,688 |
| 4.50%, with various maturities to 2049 | | 574 | 546,946 |
| 4.50%, 30-Year, TBA(11) | | 20,000 | 18,948,741 |
| 5.00%, with various maturities to 2052 | | 11,626 | 11,354,895 |
| 5.00%, 30-Year, TBA(11) | | 48,450 | 47,091,523 |
| 5.50%, 30-Year, TBA(11) | | 6,800 | 6,760,355 |
| 5.50%, 30-Year, TBA(11) | | 8,200 | 8,131,089 |
| 5.50%, with various maturities to 2052 | | 5,985 | 5,989,243 |
| 6.00%, 30-Year, TBA(11) | | 17,000 | 16,994,189 |
| 6.00%, 30-Year, TBA(11) | | 38,900 | 39,050,809 |
| 6.00%, with maturity at 2052 | | 518 | 532,765 |
| 7.50%, with maturity at 2025 | | 14 | 13,938 |
| Security | Principal
Amount
(000's omitted) | Value |
Government National Mortgage Association:
(continued) | | | |
| 9.50%, with maturity at 2025 | $ | 2 | $ 2,421 |
Total U.S. Government Agency Mortgage-Backed Securities
(identified cost $303,256,140) | | | $ 295,698,019 |
| U.S. Government Guaranteed Small Business Administration Loans — 0.4%(12)(13) |
| Security | Principal
Amount
(000's omitted) | Value |
| 0.16%, 7/15/37 to 5/15/42 | $ | 539 | $ 2,636 |
| 0.23%, 4/15/37 to 12/15/37 | | 1,379 | 8,801 |
| 0.41%, 6/15/42 to 7/15/42 | | 215 | 2,995 |
| 0.48%, 3/15/37 to 12/15/37 | | 2,370 | 31,298 |
| 0.66%, 7/15/42 | | 51 | 1,161 |
| 0.73%, 3/15/37 to 10/15/42 | | 1,873 | 38,544 |
| 0.91%, 5/15/42 | | 455 | 14,156 |
| 0.98%, 9/15/37 to 11/15/37 | | 839 | 22,573 |
| 1.23%, 8/15/37 to 12/15/37 | | 1,861 | 62,972 |
| 1.86%, 9/15/42 to 1/15/43 | | 9,541 | 603,204 |
| 1.89%, 11/15/42 | | 151 | 9,703 |
| 2.11%, 10/15/42 | | 3,353 | 240,798 |
| 2.36%, 12/15/42 | | 491 | 39,638 |
| 2.86%, 12/15/42 to 2/15/43 | | 5,320 | 523,746 |
| 3.11%, 12/15/42 | | 2,780 | 297,882 |
Total U.S. Government Guaranteed Small Business Administration Loans
(identified cost $5,063,650) | | | $ 1,900,107 |
| Short-Term Investments — 19.9% |
| Security | Shares | Value |
| Morgan Stanley Institutional Liquidity Funds - Government Portfolio, Institutional Class, 2.88%(14) | | 83,859,312 | $ 83,859,312 |
Total Short-Term Investments
(identified cost $83,859,312) | | | $ 83,859,312 |
Total Purchased Swaptions — 1.3%
(identified cost $1,092,440) | | | $ 5,597,209 |
Total Investments — 132.3%
(identified cost $599,937,157) | | | $ 557,589,789 |
Total Written Options and Swaptions — (0.4)%
(premiums received $1,589,498) | | | $ (1,826,376) |
11
See Notes to Financial Statements.
Eaton Vance
Government Opportunities Fund
October 31, 2022
Portfolio of Investments — continued
| TBA Sale Commitments — (28.2)% |
| U.S. Government Agency Mortgage-Backed Securities — (28.2)% |
| Security | Principal
Amount
(000's omitted) | Value |
| Federal National Mortgage Association, 2.50%, 30-Year, TBA(11) | | $ (16,000) | $ (13,100,007) |
| Federal National Mortgage Association, 2.50%, 30-Year, TBA(11) | | (57,000) | (46,673,233) |
| Federal National Mortgage Association, 3.50%, 30-Year, TBA(11) | | (15,500) | (13,632,727) |
| Federal National Mortgage Association, 4.50%, 30-Year, TBA(11) | | (40,000) | (37,515,606) |
| Federal National Mortgage Association, 6.00%, 30-Year, TBA(11) | | (7,000) | (6,997,568) |
| Federal National Mortgage Association, 6.00%, 30-Year, TBA(11) | | (1,100) | (1,105,619) |
Total U.S. Government Agency Mortgage-Backed Securities
(proceeds $119,534,130) | | | $ (119,024,760) |
Total TBA Sale Commitments
(proceeds $119,534,130) | | | $ (119,024,760) |
| Other Assets, Less Liabilities — (3.7)% | | | $ (15,336,555) |
| Net Assets — 100.0% | | | $ 421,402,098 |
| The percentage shown for each investment category in the Portfolio of Investments is based on net assets. |
| (1) | Variable rate security. The stated interest rate represents the rate in effect at October 31, 2022. |
| (2) | Security exempt from registration under Rule 144A of the Securities Act of 1933, as amended. These securities may be sold in certain transactions in reliance on an exemption from registration (normally to qualified institutional buyers). At October 31, 2022, the aggregate value of these securities is $35,510,262 or 8.4% of the Fund's net assets. |
| (3) | Weighted average fixed-rate coupon that changes/updates monthly. Rate shown is the rate at October 31, 2022. |
| (4) | Inverse floating-rate security whose coupon varies inversely with changes in the interest rate index. The stated interest rate represents the coupon rate in effect at October 31, 2022. |
| (5) | Principal amount is less than $500. |
| (6) | Interest only security that entitles the holder to receive only interest payments on the underlying mortgages. Principal amount shown is the notional amount of the underlying mortgages on which coupon interest is calculated. |
| (7) | Principal only security that entitles the holder to receive only principal payments on the underlying mortgages. |
| (9) | Adjustable rate mortgage security whose interest rate generally adjusts monthly based on a weighted average of interest rates on the underlying mortgages. The coupon rate may not reflect the applicable index value as interest rates on the underlying mortgages may adjust on various dates and at various intervals and may be subject to lifetime ceilings and lifetime floors and lookback periods. Rate shown is the coupon rate at October 31, 2022. |
| (10) | When-issued security. |
| (11) | TBA (To Be Announced) securities are purchased or sold on a forward commitment basis with an approximate principal amount and maturity date. The actual principal amount and maturity date are determined upon settlement. |
| (12) | Interest only security that entitles the holder to receive only a portion of the interest payments on the underlying loans. Principal amount shown is the notional amount of the underlying loans on which coupon interest is calculated. |
| (13) | Securities comprise a trust that is wholly-owned by the Fund and may only be sold on a pro rata basis with all securities in the trust. |
| (14) | May be deemed to be an affiliated investment company. The rate shown is the annualized seven-day yield as of October 31, 2022. |
| Purchased Interest Rate Swaptions (OTC) — 1.3% |
| Description | Counterparty | Notional Amount | Expiration
Date | Value |
| Option to enter into interest rate swap expiring 1/4/33 to pay 3.29% and receive SOFR | Bank of America, N.A. | USD | 15,000,000 | 12/30/22 | $ 711,072 |
| Option to enter into interest rate swap expiring 3/27/33 to pay 2.47% and receive SOFR | Bank of America, N.A. | USD | 25,000,000 | 3/23/23 | 2,699,044 |
| Option to enter into interest rate swap expiring 1/5/33 to pay 3.16% and receive SOFR | Goldman Sachs International | USD | 6,000,000 | 1/3/23 | 339,270 |
| Option to enter into interest rate swap expiring 3/9/28 to pay 1.88% and receive SOFR | Goldman Sachs International | USD | 20,000,000 | 3/7/23 | 1,847,823 |
| Total | | | | | $5,597,209 |
12
See Notes to Financial Statements.
Eaton Vance
Government Opportunities Fund
October 31, 2022
Portfolio of Investments — continued
| Written Interest Rate Swaptions (OTC) — (0.0)%(1) |
| Description | Counterparty | Notional
Amount | Expiration
Date | Value |
| Option to enter into interest rate swap expiring 1/4/33 to pay 2.29% and receive SOFR | Bank of America, N.A. | USD | (15,000,000) | 12/30/22 | $ (954) |
| Option to enter into interest rate swap expiring 3/8/53 to pay 1.13% and receive SOFR | Bank of America, N.A. | USD | (10,000,000) | 3/6/23 | (6,185) |
| Option to enter into interest rate swap expiring 3/27/33 to pay 1.87% and receive SOFR | Bank of America, N.A. | USD | (25,000,000) | 3/23/23 | (7,733) |
| Option to enter into interest rate swap expiring 1/5/33 to pay 2.16% and receive SOFR | Goldman Sachs International | USD | (6,000,000) | 1/3/23 | (253) |
| Option to enter into interest rate swap expiring 3/9/28 to pay 1.28% and receive SOFR | Goldman Sachs International | USD | (20,000,000) | 3/7/23 | (2,566) |
| Option to enter into interest rate swap expiring 3/9/23 to pay 1.88% and receive SOFR | Goldman Sachs International | USD | (20,000,000) | 3/7/23 | (7,913) |
| Option to enter into interest rate swap expiring 3/27/23 to pay 2.47% and receive SOFR | JPMorgan Chase Bank, N.A. | USD | (25,000,000) | 3/23/23 | (44,129) |
| Total | | | | | $(69,733) |
| (1) | Amount is less than (0.05)%. |
| Written Put Options (OTC) — (0.4)% |
| Description | Counterparty | Notional Amount | Exercise
Price | Expiration
Date | Value |
| UMBS, 5.00%, 30-Year, TBA | Bank of America, N.A. | USD | (25,000,000) | $ 99.78125 | 11/7/22 | $ (800,376) |
| UMBS, 5.00%, 30-Year, TBA | JPMorgan Chase Bank, N.A. | USD | (25,000,000) | 100.40625 | 11/7/22 | (956,267) |
| Total | | | | | | $(1,756,643) |
| Futures Contracts |
| Description | Number of
Contracts | Position | Expiration
Date | Notional
Amount | Value/Unrealized
Appreciation
(Depreciation) |
| Interest Rate Futures | | | | | |
| U.S. 10-Year Treasury Note | 105 | Long | 12/20/22 | $11,612,344 | $ (574,299) |
| U.S. 5-Year Treasury Note | (74) | Short | 12/30/22 | (7,887,938) | 342,720 |
| | | | | | $ (231,579) |
13
See Notes to Financial Statements.
Eaton Vance
Government Opportunities Fund
October 31, 2022
Portfolio of Investments — continued
| Interest Rate Swaps (Centrally Cleared) |
Notional Amount
(000's omitted) | Fund
Pays/
Receives
Floating
Rate | Floating Rate | Annual
Fixed Rate | Termination
Date | Value | Unamortized
Upfront
Receipts
(Payments) | Unrealized
Appreciation
(Depreciation) |
| USD | 50,000 | Receives | SOFR
(pays quarterly) | 3.07%
(pays semi-annually) | 10/14/32 | $ 3,029,459 | $ — | $ 3,029,459 |
| USD | 25,000 | Receives | SOFR
(pays annually) | 1.92%
(pays annually) | 4/8/52 | 6,679,106 | — | 6,679,106 |
| USD | 10,000 | Receives | SOFR
(pays annually) | 1.94%
(pays annually) | 4/21/52 | 2,642,464 | — | 2,642,464 |
| USD | 10,000 | Receives | SOFR
(pays annually) | 1.89%
(pays annually) | 8/3/52 | 2,742,082 | (100) | 2,741,982 |
| Total | | | | | | $15,093,111 | $(100) | $15,093,011 |
| Credit Default Swaps - Buy Protection (Centrally Cleared) | |
| Reference Entity | Notional
Amount
(000's omitted) | Contract
Annual
Fixed Rate | Termination
Date | Value | Unamortized
Upfront
Receipts
(Payments) | Unrealized
Appreciation
(Depreciation) |
| Markit CDX North America Investment Grade Index (CDX.NA.IG.39.V1) | | $70,000 | 1.00%
(pays quarterly)(1) | 12/20/27 | $ (387,501) | $ (308,680) | $ (696,181) |
| Total | | | | | $(387,501) | $(308,680) | $(696,181) |
| (1) | Upfront payment is exchanged with the counterparty as a result of the standardized trading coupon. |
| Abbreviations: |
| CMT | – Constant Maturity Treasury |
| COF | – Cost of Funds 11th District |
| LIBOR | – London Interbank Offered Rate |
| MTA | – Monthly Treasury Average |
| OTC | – Over-the-counter |
| SOFR | – Secured Overnight Financing Rate |
| TBA | – To Be Announced |
| UMBS | – Uniform Mortgage-Backed Securities |
| Currency Abbreviations: |
| USD | – United States Dollar |
14
See Notes to Financial Statements.
Eaton Vance
Government Opportunities Fund
October 31, 2022
Statement of Assets and Liabilities
| | October 31, 2022 |
| Assets | |
| Unaffiliated investments, at value (identified cost $516,077,845) | $ 473,730,477 |
| Affiliated investment, at value (identified cost $83,859,312) | 83,859,312 |
| Cash | 1,802,708 |
| Deposits for derivatives collateral: | |
| Futures contracts | 137,850 |
| Centrally cleared swap contracts | 7,056,236 |
| OTC options and swaptions | 5,490,000 |
| Deposits for forward commitment securities | 851,000 |
| Interest receivable | 2,388,359 |
| Dividends receivable from affiliated investment | 136,968 |
| Receivable for investments sold | 100,869,721 |
| Receivable for TBA sale commitments | 119,534,130 |
| Receivable for Fund shares sold | 1,334,324 |
| Receivable for variation margin on open centrally cleared swap contracts | 422,357 |
| Receivable from affiliate | 86,994 |
| Total assets | $ 797,700,436 |
| Liabilities | |
| Cash collateral due to brokers | $ 5,431,000 |
| Written options and swaptions outstanding, at value (premiums received $1,589,498) | 1,826,376 |
| Payable for investments purchased | 1,760,514 |
| Payable for when-issued/forward commitment securities | 246,123,843 |
| TBA sale commitments, at value (proceeds receivable $119,534,130) | 119,024,760 |
| Payable for Fund shares redeemed | 1,069,174 |
| Payable for variation margin on open futures contracts | 21,836 |
| Distributions payable | 60,910 |
| Due to custodian | 471,000 |
| Payable to affiliate: | |
| Investment adviser fee | 218,558 |
| Distribution and service fees | 55,613 |
| Trustees' fees | 2,389 |
| Accrued expenses | 232,365 |
| Total liabilities | $ 376,298,338 |
| Net Assets | $ 421,402,098 |
| Sources of Net Assets | |
| Paid-in capital | $ 527,435,053 |
| Accumulated loss | (106,032,955) |
| Net Assets | $ 421,402,098 |
| Class A Shares | |
| Net Assets | $ 136,321,332 |
| Shares Outstanding | 24,731,549 |
Net Asset Value and Redemption Price Per Share
(net assets ÷ shares of beneficial interest outstanding) | $ 5.51 |
Maximum Offering Price Per Share
(100 ÷ 97.75 of net asset value per share) | $ 5.70 |
| Class C Shares | |
| Net Assets | $ 6,980,440 |
| Shares Outstanding | 1,268,469 |
Net Asset Value and Offering Price Per Share*
(net assets ÷ shares of beneficial interest outstanding) | $ 5.50 |
15
See Notes to Financial Statements.
Eaton Vance
Government Opportunities Fund
October 31, 2022
Statement of Assets and Liabilities — continued
| | October 31, 2022 |
| Class I Shares | |
| Net Assets | $231,854,915 |
| Shares Outstanding | 42,074,019 |
Net Asset Value, Offering Price and Redemption Price Per Share
(net assets ÷ shares of beneficial interest outstanding) | $ 5.51 |
| Class R Shares | |
| Net Assets | $ 46,245,411 |
| Shares Outstanding | 8,423,033 |
Net Asset Value, Offering Price and Redemption Price Per Share
(net assets ÷ shares of beneficial interest outstanding) | $ 5.49 |
| On sales of $100,000 or more, the offering price of Class A shares is reduced. |
| * | Redemption price per share is equal to the net asset value less any applicable contingent deferred sales charge. |
16
See Notes to Financial Statements.
Eaton Vance
Government Opportunities Fund
October 31, 2022
| | Year Ended |
| | October 31, 2022 |
| Investment Income | |
| Dividend income from affiliated investments | $ 335,029 |
| Interest income | 12,602,809 |
| Total investment income | $ 12,937,838 |
| Expenses | |
| Investment adviser fee | $ 2,717,973 |
| Distribution and service fees: | |
| Class A | 386,227 |
| Class C | 101,229 |
| Class R | 248,000 |
| Trustees’ fees and expenses | 25,164 |
| Custodian fee | 163,079 |
| Transfer and dividend disbursing agent fees | 346,684 |
| Legal and accounting services | 76,244 |
| Printing and postage | 34,870 |
| Registration fees | 168,123 |
| Miscellaneous | 37,830 |
| Total expenses | $ 4,305,423 |
| Deduct: | |
| Waiver and/or reimbursement of expenses by affiliate | $ 237,562 |
| Total expense reductions | $ 237,562 |
| Net expenses | $ 4,067,861 |
| Net investment income | $ 8,869,977 |
| Realized and Unrealized Gain (Loss) | |
| Net realized gain (loss): | |
| Investment transactions | $ (21,546,770) |
| Investment transactions - affiliated investments | (5,989) |
| Written options and swaptions | 1,189,215 |
| Futures contracts | (1,748,665) |
| Swap contracts | 9,061 |
| Net realized loss | $(22,103,148) |
| Change in unrealized appreciation (depreciation): | |
| Investments | $ (30,660,319) |
| Written options and swaptions | 919,812 |
| TBA sale commitments | 435,069 |
| Futures contracts | 182,354 |
| Swap contracts | 14,396,830 |
| Net change in unrealized appreciation (depreciation) | $(14,726,254) |
| Net realized and unrealized loss | $(36,829,402) |
| Net decrease in net assets from operations | $(27,959,425) |
17
See Notes to Financial Statements.
Eaton Vance
Government Opportunities Fund
October 31, 2022
Statements of Changes in Net Assets
| | Year Ended October 31, |
| | 2022 | 2021 |
| Increase (Decrease) in Net Assets | | |
| From operations: | | |
| Net investment income | $ 8,869,977 | $ 8,984,285 |
| Net realized loss | (22,103,148) | (5,432,185) |
| Net change in unrealized appreciation (depreciation) | (14,726,254) | (6,069,556) |
| Net decrease in net assets from operations | $ (27,959,425) | $ (2,517,456) |
| Distributions to shareholders: | | |
| Class A | $ (3,116,489) | $ (3,001,525) |
| Class C | (127,983) | (162,520) |
| Class I | (4,531,585) | (4,443,375) |
| Class R | (889,252) | (822,785) |
| Total distributions to shareholders | $ (8,665,309) | $ (8,430,205) |
| Tax return of capital to shareholders: | | |
| Class A | $ (162,425) | $ — |
| Class C | (6,766) | — |
| Class I | (232,529) | — |
| Class R | (46,695) | — |
| Total tax return of capital to shareholders | $ (448,415) | $ — |
| Transactions in shares of beneficial interest: | | |
| Class A | $ (13,221,173) | $ 8,671,700 |
| Class C | (3,928,416) | (12,893,723) |
| Class I | 27,652,623 | 13,815,564 |
| Class R | (1,802,206) | (1,884,735) |
| Net increase in net assets from Fund share transactions | $ 8,700,828 | $ 7,708,806 |
| Net decrease in net assets | $ (28,372,321) | $ (3,238,855) |
| Net Assets | | |
| At beginning of year | $ 449,774,419 | $ 453,013,274 |
| At end of year | $421,402,098 | $449,774,419 |
18
See Notes to Financial Statements.
Eaton Vance
Government Opportunities Fund
October 31, 2022
| | Class A |
| | Year Ended October 31, |
| | 2022 | 2021 | 2020 | 2019 | 2018 |
| Net asset value — Beginning of year | $ 6.030 | $ 6.180 | $ 6.070 | $ 6.100 | $ 6.280 |
| Income (Loss) From Operations | | | | | |
| Net investment income(1) | $ 0.121 | $ 0.118 | $ 0.073 | $ 0.134 | $ 0.142 |
| Net realized and unrealized gain (loss) | (0.516) | (0.158) | 0.191 | 0.029 | (0.116) |
| Total income (loss) from operations | $ (0.395) | $ (0.040) | $ 0.264 | $ 0.163 | $ 0.026 |
| Less Distributions | | | | | |
| From net investment income | $ (0.119) | $ (0.110) | $ (0.154) | $ (0.193) | $ (0.206) |
| Tax return of capital | (0.006) | — | — | — | — |
| Total distributions | $ (0.125) | $ (0.110) | $ (0.154) | $ (0.193) | $ (0.206) |
| Net asset value — End of year | $ 5.510 | $ 6.030 | $ 6.180 | $ 6.070 | $ 6.100 |
| Total Return(2) | (6.63)% (3) | (0.66)% (3) | 4.40% (3) | 2.71% | 0.42% |
| Ratios/Supplemental Data | | | | | |
| Net assets, end of year (000’s omitted) | $136,321 | $163,208 | $158,552 | $138,956 | $133,062 |
| Ratios (as a percentage of average daily net assets):(4) | | | | | |
| Expenses | 1.05% (3)(5) | 1.05% (3) | 1.11% (3)(6) | 1.26% (6) | 1.19% |
| Net investment income | 2.06% | 1.91% | 1.20% | 2.21% | 2.30% |
| Portfolio Turnover of the Portfolio(7) | — | — | — | — | 62% |
| Portfolio Turnover of the Fund | 796% (8) | 335% (8) | 180% (8) | 90% | 1% (9) |
| (1) | Computed using average shares outstanding. |
| (2) | Returns are historical and are calculated by determining the percentage change in net asset value with all distributions reinvested and do not reflect the effect of sales charges. |
| (3) | The investment adviser reimbursed certain operating expenses (equal to 0.05%, 0.02% and 0.03% of average daily net assets for the years ended October 31, 2022, 2021 and 2020, respectively). Absent this reimbursement, total return would be lower. |
| (4) | Includes the Fund’s share of the Portfolio’s allocated expenses for the period while the Fund was investing in the Portfolio. |
| (5) | Includes a reduction by the investment adviser of a portion of its adviser fee due to the Fund's investment in the Liquidity Fund (equal to less than 0.005% of average daily net assets for the year ended October 31, 2022). |
| (6) | Includes interest expense, including on reverse repurchase agreements, of 0.03% and 0.07% of average daily net assets for the years ended October 31, 2020 and 2019, respectively. |
| (7) | Portfolio turnover represents the rate of portfolio activity for the period while the Fund was investing in the Portfolio. |
| (8) | Includes the effect of To-Be-Announced (TBA) transactions. |
| (9) | For the period from October 8, 2018 through October 31, 2018 when the Fund was making investments directly in securities. |
| References to Portfolio herein are to Government Obligations Portfolio, a Massachusetts business trust in which the Fund invested all of its investable assets prior to the close of business on October 5, 2018 and which had the same investment objective and policies as the Fund during such period. |
19
See Notes to Financial Statements.
Eaton Vance
Government Opportunities Fund
October 31, 2022
Financial Highlights — continued
| | Class C |
| | Year Ended October 31, |
| | 2022 | 2021 | 2020 | 2019 | 2018 |
| Net asset value — Beginning of year | $ 6.020 | $ 6.170 | $ 6.060 | $ 6.090 | $ 6.270 |
| Income (Loss) From Operations | | | | | |
| Net investment income(1) | $ 0.073 | $ 0.072 | $ 0.030 | $ 0.090 | $ 0.096 |
| Net realized and unrealized gain (loss) | (0.512) | (0.158) | 0.188 | 0.027 | (0.117) |
| Total income (loss) from operations | $(0.439) | $ (0.086) | $ 0.218 | $ 0.117 | $ (0.021) |
| Less Distributions | | | | | |
| From net investment income | $ (0.077) | $ (0.064) | $ (0.108) | $ (0.147) | $ (0.159) |
| Tax return of capital | (0.004) | — | — | — | — |
| Total distributions | $(0.081) | $ (0.064) | $ (0.108) | $ (0.147) | $ (0.159) |
| Net asset value — End of year | $ 5.500 | $ 6.020 | $ 6.170 | $ 6.060 | $ 6.090 |
| Total Return(2) | (7.34)% (3) | (1.41)% (3) | 3.63% (3) | 1.95% | (0.33)% |
| Ratios/Supplemental Data | | | | | |
| Net assets, end of year (000’s omitted) | $ 6,980 | $11,756 | $24,969 | $29,940 | $46,902 |
| Ratios (as a percentage of average daily net assets):(4) | | | | | |
| Expenses | 1.80% (3)(5) | 1.80% (3) | 1.86% (3)(6) | 1.99% (6) | 1.94% |
| Net investment income | 1.25% | 1.17% | 0.49% | 1.47% | 1.55% |
| Portfolio Turnover of the Portfolio(7) | — | — | — | — | 62% |
| Portfolio Turnover of the Fund | 796% (8) | 335% (8) | 180% (8) | 90% | 1% (9) |
| (1) | Computed using average shares outstanding. |
| (2) | Returns are historical and are calculated by determining the percentage change in net asset value with all distributions reinvested and do not reflect the effect of sales charges. |
| (3) | The investment adviser reimbursed certain operating expenses (equal to 0.05%, 0.02% and 0.03% of average daily net assets for the years ended October 31, 2022, 2021 and 2020, respectively). Absent this reimbursement, total return would be lower. |
| (4) | Includes the Fund’s share of the Portfolio’s allocated expenses for the period while the Fund was investing in the Portfolio. |
| (5) | Includes a reduction by the investment adviser of a portion of its adviser fee due to the Fund's investment in the Liquidity Fund (equal to less than 0.005% of average daily net assets for the year ended October 31, 2022). |
| (6) | Includes interest expense, including on reverse repurchase agreements, of 0.03% and 0.07% of average daily net assets for the years ended October 31, 2020 and 2019, respectively. |
| (7) | Portfolio turnover represents the rate of portfolio activity for the period while the Fund was investing in the Portfolio. |
| (8) | Includes the effect of To-Be-Announced (TBA) transactions. |
| (9) | For the period from October 8, 2018 through October 31, 2018 when the Fund was making investments directly in securities. |
| References to Portfolio herein are to Government Obligations Portfolio, a Massachusetts business trust in which the Fund invested all of its investable assets prior to the close of business on October 5, 2018 and which had the same investment objective and policies as the Fund during such period. |
20
See Notes to Financial Statements.
Eaton Vance
Government Opportunities Fund
October 31, 2022
Financial Highlights — continued
| | Class I |
| | Year Ended October 31, |
| | 2022 | 2021 | 2020 | 2019 | 2018 |
| Net asset value — Beginning of year | $ 6.030 | $ 6.170 | $ 6.060 | $ 6.100 | $ 6.280 |
| Income (Loss) From Operations | | | | | |
| Net investment income(1) | $ 0.133 | $ 0.133 | $ 0.085 | $ 0.149 | $ 0.157 |
| Net realized and unrealized gain (loss) | (0.514) | (0.148) | 0.194 | 0.019 | (0.116) |
| Total income (loss) from operations | $ (0.381) | $ (0.015) | $ 0.279 | $ 0.168 | $ 0.041 |
| Less Distributions | | | | | |
| From net investment income | $ (0.132) | $ (0.125) | $ (0.169) | $ (0.208) | $ (0.221) |
| Tax return of capital | (0.007) | — | — | — | — |
| Total distributions | $ (0.139) | $ (0.125) | $ (0.169) | $ (0.208) | $ (0.221) |
| Net asset value — End of year | $ 5.510 | $ 6.030 | $ 6.170 | $ 6.060 | $ 6.100 |
| Total Return(2) | (6.40)% (3) | (0.25)% (3) | 4.66% (3) | 2.80% | 0.67% |
| Ratios/Supplemental Data | | | | | |
| Net assets, end of year (000’s omitted) | $231,855 | $222,307 | $213,869 | $118,479 | $96,457 |
| Ratios (as a percentage of average daily net assets):(4) | | | | | |
| Expenses | 0.80% (3)(5) | 0.80% (3) | 0.85% (3)(6) | 1.01% (6) | 0.94% |
| Net investment income | 2.28% | 2.17% | 1.39% | 2.44% | 2.54% |
| Portfolio Turnover of the Portfolio(7) | — | — | — | — | 62% |
| Portfolio Turnover of the Fund | 796% (8) | 335% (8) | 180% (8) | 90% | 1% (9) |
| (1) | Computed using average shares outstanding. |
| (2) | Returns are historical and are calculated by determining the percentage change in net asset value with all distributions reinvested. |
| (3) | The investment adviser reimbursed certain operating expenses (equal to 0.05%, 0.02% and 0.03% of average daily net assets for the years ended October 31, 2022, 2021 and 2020, respectively). Absent this reimbursement, total return would be lower. |
| (4) | Includes the Fund’s share of the Portfolio’s allocated expenses for the period while the Fund was investing in the Portfolio. |
| (5) | Includes a reduction by the investment adviser of a portion of its adviser fee due to the Fund's investment in the Liquidity Fund (equal to less than 0.005% of average daily net assets for the year ended October 31, 2022). |
| (6) | Includes interest expense, including on reverse repurchase agreements, of 0.03% and 0.07% of average daily net assets for the years ended October 31, 2020 and 2019, respectively. |
| (7) | Portfolio turnover represents the rate of portfolio activity for the period while the Fund was investing in the Portfolio. |
| (8) | Includes the effect of To-Be-Announced (TBA) transactions. |
| (9) | For the period from October 8, 2018 through October 31, 2018 when the Fund was making investments directly in securities. |
| References to Portfolio herein are to Government Obligations Portfolio, a Massachusetts business trust in which the Fund invested all of its investable assets prior to the close of business on October 5, 2018 and which had the same investment objective and policies as the Fund during such period. |
21
See Notes to Financial Statements.
Eaton Vance
Government Opportunities Fund
October 31, 2022
Financial Highlights — continued
| | Class R |
| | Year Ended October 31, |
| | 2022 | 2021 | 2020 | 2019 | 2018 |
| Net asset value — Beginning of year | $ 6.010 | $ 6.150 | $ 6.040 | $ 6.080 | $ 6.260 |
| Income (Loss) From Operations | | | | | |
| Net investment income(1) | $ 0.107 | $ 0.102 | $ 0.052 | $ 0.118 | $ 0.126 |
| Net realized and unrealized gain (loss) | (0.517) | (0.148) | 0.196 | 0.019 | (0.117) |
| Total income (loss) from operations | $ (0.410) | $ (0.046) | $ 0.248 | $ 0.137 | $ 0.009 |
| Less Distributions | | | | | |
| From net investment income | $ (0.105) | $ (0.094) | $ (0.138) | $ (0.177) | $ (0.189) |
| Tax return of capital | (0.005) | — | — | — | — |
| Total distributions | $ (0.110) | $ (0.094) | $ (0.138) | $ (0.177) | $ (0.189) |
| Net asset value — End of year | $ 5.490 | $ 6.010 | $ 6.150 | $ 6.040 | $ 6.080 |
| Total Return(2) | (6.90)% (3) | (0.75)% (3) | 4.15% (3) | 2.46% | (—)% (4) |
| Ratios/Supplemental Data | | | | | |
| Net assets, end of year (000’s omitted) | $46,245 | $52,503 | $55,623 | $28,673 | $26,376 |
| Ratios (as a percentage of average daily net assets):(5) | | | | | |
| Expenses | 1.30% (3)(6) | 1.30% (3) | 1.34% (3)(7) | 1.51% (7) | 1.44% |
| Net investment income | 1.83% | 1.66% | 0.85% | 1.95% | 2.04% |
| Portfolio Turnover of the Portfolio(8) | — | — | — | — | 62% |
| Portfolio Turnover of the Fund | 796% (9) | 335% (9) | 180% (9) | 90% | 1% (10) |
| (1) | Computed using average shares outstanding. |
| (2) | Returns are historical and are calculated by determining the percentage change in net asset value with all distributions reinvested. |
| (3) | The investment adviser reimbursed certain operating expenses (equal to 0.05%, 0.02% and 0.03% of average daily net assets for the years ended October 31, 2022, 2021 and 2020, respectively). Absent this reimbursement, total return would be lower. |
| (4) | Less than (0.005)%. |
| (5) | Includes the Fund’s share of the Portfolio’s allocated expenses for the period while the Fund was investing in the Portfolio. |
| (6) | Includes a reduction by the investment adviser of a portion of its adviser fee due to the Fund's investment in the Liquidity Fund (equal to less than 0.005% of average daily net assets for the year ended October 31, 2022). |
| (7) | Includes interest expense, including on reverse repurchase agreements, of 0.03% and 0.07% of average daily net assets for the years ended October 31, 2020 and 2019, respectively. |
| (8) | Portfolio turnover represents the rate of portfolio activity for the period while the Fund was investing in the Portfolio. |
| (9) | Includes the effect of To-Be-Announced (TBA) transactions. |
| (10) | For the period from October 8, 2018 through October 31, 2018 when the Fund was making investments directly in securities. |
| References to Portfolio herein are to Government Obligations Portfolio, a Massachusetts business trust in which the Fund invested all of its investable assets prior to the close of business on October 5, 2018 and which had the same investment objective and policies as the Fund during such period. |
22
See Notes to Financial Statements.
Eaton Vance
Government Opportunities Fund
October 31, 2022
Notes to Financial Statements
1 Significant Accounting Policies
Eaton Vance Government Opportunities Fund (the Fund) is a diversified series of Eaton Vance Mutual Funds Trust (the Trust). The Trust is a Massachusetts business trust registered under the Investment Company Act of 1940, as amended (the 1940 Act), as an open-end management investment company. The Fund’s investment objective is to provide a high current return. The Fund offers four classes of shares. Class A shares are generally sold subject to a sales charge imposed at time of purchase. Class C shares are sold at net asset value and are generally subject to a contingent deferred sales charge (see Note 5). Effective November 5, 2020, Class C shares automatically convert to Class A shares eight years after their purchase as described in the Fund’s prospectus. Class I and Class R shares are sold at net asset value and are not subject to a sales charge. Each class represents a pro-rata interest in the Fund, but votes separately on class-specific matters and (as noted below) is subject to different expenses. Realized and unrealized gains and losses are allocated daily to each class of shares based on the relative net assets of each class to the total net assets of the Fund. Net investment income, other than class-specific expenses, is allocated daily to each class of shares based upon the ratio of the value of each class’s paid shares to the total value of all paid shares. Each class of shares differs in its distribution plan and certain other class-specific expenses.
The following is a summary of significant accounting policies of the Fund. The policies are in conformity with accounting principles generally accepted in the United States of America (U.S. GAAP). The Fund is an investment company and follows accounting and reporting guidance in the Financial Accounting Standards Board (FASB) Accounting Standards Codification Topic 946.
A Investment Valuation—The following methodologies are used to determine the market value or fair value of investments.
Debt Obligations. Debt obligations are generally valued on the basis of valuations provided by third party pricing services, as derived from such services’ pricing models. Inputs to the models may include, but are not limited to, reported trades, executable bid and ask prices, broker/dealer quotations, prices or yields of securities with similar characteristics, interest rates, anticipated prepayments, benchmark curves or information pertaining to the issuer, as well as industry and economic events. The pricing services may use a matrix approach, which considers information regarding securities with similar characteristics to determine the valuation for a security. Short-term debt obligations purchased with a remaining maturity of sixty days or less for which a valuation from a third party pricing service is not readily available may be valued at amortized cost, which approximates fair value.
Derivatives. U.S. exchange-traded options are valued at the mean between the bid and ask prices at valuation time as reported by the Options Price Reporting Authority. Non-U.S. exchange-traded options and over-the-counter options are valued by a third party pricing service using techniques that consider factors including the value of the underlying instrument, the volatility of the underlying instrument and the period of time until option expiration.
Futures contracts are valued at the closing settlement price established by the board of trade or exchange on which they are traded. Swaps and options on interest rate swaps (“swaptions”) are normally valued using valuations provided by a third party pricing service. Such pricing service valuations are based on the present value of fixed and projected floating rate cash flows over the term of the swap contract, and in the case of credit default swaps, based on credit spread quotations obtained from broker/dealers and expected default recovery rates determined by the pricing service using proprietary models. Future cash flows on swaps are discounted to their present value using swap rates provided by electronic data services or by broker/dealers. Alternatively, swaptions may be valued at the valuation provided by a broker/dealer (usually the counterparty to the option), so determined using similar techniques as those employed by the pricing service.
Other. Investments in management investment companies (including money market funds) that do not trade on an exchange are valued at the net asset value as of the close of each business day.
Fair Valuation. In connection with Rule 2a-5 of the 1940 Act, which became effective September 8, 2022, the Trustees have designated the Fund’s investment adviser as its valuation designee. Investments for which valuations or market quotations are not readily available or are deemed unreliable are valued by the investment adviser, as valuation designee, at fair value using methods that most fairly reflect the security’s “fair value”, which is the amount that the Fund might reasonably expect to receive for the security upon its current sale in the ordinary course. Each such determination is based on a consideration of relevant factors, which are likely to vary from one pricing context to another. These factors may include, but are not limited to, the type of security, the existence of any contractual restrictions on the security’s disposition, the price and extent of public trading in similar securities of the issuer or of comparable companies or entities, quotations or relevant information obtained from broker/dealers or other market participants, information obtained from the issuer, analysts, and/or the appropriate stock exchange (for exchange-traded securities), an analysis of the company’s or entity’s financial statements, and an evaluation of the forces that influence the issuer and the market(s) in which the security is purchased and sold.
B Investment Transactions—Investment transactions for financial statement purposes are accounted for on a trade date basis. Realized gains and losses on investments sold are determined on the basis of identified cost.
C Income—Interest income is recorded on the basis of interest accrued, adjusted for amortization of premium or accretion of discount. Dividend income is recorded on the ex-dividend date for dividends received in cash and/or securities.
D Federal Taxes—The Fund's policy is to comply with the provisions of the Internal Revenue Code applicable to regulated investment companies and to distribute to shareholders each year substantially all of its net investment income, and all or substantially all of its net realized capital gains. Accordingly, no provision for federal income or excise tax is necessary.
Eaton Vance
Government Opportunities Fund
October 31, 2022
Notes to Financial Statements — continued
As of October 31, 2022, the Fund had no uncertain tax positions that would require financial statement recognition, de-recognition, or disclosure. The Fund files a U.S. federal income tax return annually after its fiscal year-end, which is subject to examination by the Internal Revenue Service for a period of three years from the date of filing.
E Expenses—The majority of expenses of the Trust are directly identifiable to an individual fund. Expenses which are not readily identifiable to a specific fund are allocated taking into consideration, among other things, the nature and type of expense and the relative size of the funds.
F Use of Estimates—The preparation of the financial statements in conformity with U.S. GAAP requires management to make estimates and assumptions that affect the reported amounts of assets and liabilities at the date of the financial statements and the reported amounts of income and expense during the reporting period. Actual results could differ from those estimates.
G Indemnifications—Under the Trust’s organizational documents, its officers and Trustees may be indemnified against certain liabilities and expenses arising out of the performance of their duties to the Fund. Under Massachusetts law, if certain conditions prevail, shareholders of a Massachusetts business trust (such as the Trust) could be deemed to have personal liability for the obligations of the Trust. However, the Trust’s Declaration of Trust contains an express disclaimer of liability on the part of Fund shareholders and the By-laws provide that the Trust shall assume, upon request by the shareholder, the defense on behalf of any Fund shareholders. Moreover, the By-laws also provide for indemnification out of Fund property of any shareholder held personally liable solely by reason of being or having been a shareholder for all loss or expense arising from such liability. Additionally, in the normal course of business, the Fund enters into agreements with service providers that may contain indemnification clauses. The Fund’s maximum exposure under these arrangements is unknown as this would involve future claims that may be made against the Fund that have not yet occurred.
H Futures Contracts—Upon entering into a futures contract, the Fund is required to deposit with the broker, either in cash or securities, an amount equal to a certain percentage of the contract amount (initial margin). Subsequent payments, known as variation margin, are made or received by the Fund each business day, depending on the daily fluctuations in the value of the underlying security, and are recorded as unrealized gains or losses by the Fund. Gains (losses) are realized upon the expiration or closing of the futures contracts. Should market conditions change unexpectedly, the Fund may not achieve the anticipated benefits of the futures contracts and may realize a loss. Futures contracts have minimal counterparty risk as they are exchange traded and the clearinghouse for the exchange is substituted as the counterparty, guaranteeing counterparty performance.
I Interest Rate Swaps—Swap contracts are privately negotiated agreements between the Fund and a counterparty. Certain swap contracts may be centrally cleared (“centrally cleared swaps”), whereby all payments made or received by the Fund pursuant to the contract are with a central clearing party (CCP) rather than the original counterparty. The CCP guarantees the performance of the original parties to the contract. Upon entering into centrally cleared swaps, the Fund is required to deposit with the CCP, either in cash or securities, an amount of initial margin determined by the CCP, which is subject to adjustment. Pursuant to interest rate swap agreements, the Fund either makes floating-rate payments to the counterparty (or CCP in the case of centrally cleared swaps) based on a benchmark interest rate in exchange for fixed-rate payments or the Fund makes fixed-rate payments to the counterparty (or CCP in the case of a centrally cleared swap) in exchange for payments on a floating benchmark interest rate. Payments received or made, including amortization of upfront payments/receipts, if any (which are amortized over the life of the swap contract), are recorded as realized gains or losses. During the term of the outstanding swap agreement, changes in the underlying value of the swap are recorded as unrealized gains or losses. For centrally cleared swaps, the daily change in valuation is recorded as a receivable or payable for variation margin and settled in cash with the CCP daily. The value of the swap is determined by changes in the relationship between two rates of interest. The Fund is exposed to credit loss in the event of non-performance by the swap counterparty. In the case of centrally cleared swaps, counterparty risk is minimal due to protections provided by the CCP. Risk may also arise from movements in interest rates.
J Credit Default Swaps—When the Fund is the buyer of a credit default swap contract, the Fund is entitled to receive the par (or other agreed-upon) value of a referenced debt obligation (or basket of debt obligations) from the counterparty (or CCP in the case of a centrally cleared swap) to the contract if a credit event by a third party, such as a U.S. or foreign corporate issuer or sovereign issuer, on the debt obligation occurs. In return, the Fund pays the counterparty a periodic stream of payments over the term of the contract provided that no credit event has occurred. If no credit event occurs, the Fund would have spent the stream of payments and received no proceeds from the contract. When the Fund is the seller of a credit default swap contract, it receives the stream of payments, but is obligated to pay to the buyer of the protection an amount up to the notional amount of the swap and in certain instances take delivery of securities of the reference entity upon the occurrence of a credit event, as defined under the terms of that particular swap agreement. Credit events are contract specific but may include bankruptcy, failure to pay, restructuring, obligation acceleration and repudiation/moratorium. If the Fund is a seller of protection and a credit event occurs, the maximum potential amount of future payments that the Fund could be required to make would be an amount equal to the notional amount of the agreement. This potential amount would be partially offset by any recovery value of the respective referenced obligation, or net amount received from the settlement of a buy protection credit default swap agreement entered into by the Fund for the same referenced obligation. As the seller, the Fund may create economic leverage to its portfolio because, in addition to its total net assets, the Fund is subject to investment exposure on the notional amount of the swap. The interest fee paid or received on the swap contract, which is based on a specified interest rate on a fixed notional amount, is accrued daily as a component of unrealized appreciation (depreciation) and is recorded as realized gain upon receipt or realized loss upon payment. The Fund also records an increase or decrease to unrealized appreciation (depreciation) in an amount equal to the daily valuation. For centrally cleared swaps, the daily change in valuation is recorded as a receivable or payable for variation margin and settled in cash with the CCP daily. All upfront payments and receipts, if any, are amortized over the life of the swap contract as realized gains or losses. Those upfront payments or receipts for non-centrally cleared swaps are recorded as other assets or other liabilities, respectively, net of amortization. For financial reporting purposes,
Eaton Vance
Government Opportunities Fund
October 31, 2022
Notes to Financial Statements — continued
unamortized upfront payments or receipts, if any, are netted with unrealized appreciation or depreciation on swap contracts to determine the market value of swaps as presented in Notes 8 and 12. These transactions involve certain risks, including the risk that the seller may be unable to fulfill the transaction. In the case of centrally cleared swaps, counterparty risk is minimal due to protections provided by the CCP.
K Written Options—Upon the writing of a call or a put option, the premium received by the Fund is included in the Statement of Assets and Liabilities as a liability. The amount of the liability is subsequently marked-to-market to reflect the current market value of the option written, in accordance with the Fund’s policies on investment valuations discussed above. Premiums received from writing options which expire are treated as realized gains. Premiums received from writing options which are exercised or are closed are added to or offset against the proceeds or amount paid on the transaction to determine the realized gain or loss. When an index option is exercised, the Fund is required to deliver an amount of cash determined by the excess of the exercise price of the option over the value of the index (in the case of a put) or the excess of the value of the index over the exercise price of the option (in the case of a call) at contract termination. If a put option on a security is exercised, the premium reduces the cost basis of the securities purchased by the Fund. The F, as a writer of an option, may have no control over whether the underlying securities or other assets may be sold (call) or purchased (put) and, as a result, bears the market risk of an unfavorable change in the price of the securities or other assets underlying the written option. The Fund may also bear the risk of not being able to enter into a closing transaction if a liquid secondary market does not exist.
L Purchased Options—Upon the purchase of a call or put option, the premium paid by the Fund is included in the Statement of Assets and Liabilities as an investment. The amount of the investment is subsequently marked-to-market to reflect the current market value of the option purchased, in accordance with the Fund’s policies on investment valuations discussed above. As the purchaser of an index option, the Fund has the right to receive a cash payment equal to any depreciation in the value of the index below the exercise price of the option (in the case of a put) or equal to any appreciation in the value of the index over the exercise price of the option (in the case of a call) as of the valuation date of the option. If an option which the Fund had purchased expires on the stipulated expiration date, the Fund will realize a loss in the amount of the cost of the option. If the Fund enters into a closing sale transaction, the Fund will realize a gain or loss, depending on whether the sales proceeds from the closing sale transaction are greater or less than the cost of the option. If the Fund exercises a put option on a security, it will realize a gain or loss from the sale of the underlying security, and the proceeds from such sale will be decreased by the premium originally paid. If the Fund exercises a call option on a security, the cost of the security which the Fund purchases upon exercise will be increased by the premium originally paid. The risk associated with purchasing options is limited to the premium originally paid. Purchased options traded over-the-counter involve risk that the issuer or counterparty will fail to perform its contractual obligations.
M Swaptions—A purchased swaption contract grants the Fund, in return for payment of the purchase price, the right, but not the obligation, to enter into a new swap agreement or to shorten, extend, cancel or otherwise modify an existing swap agreement, at some designated future time on specified terms. When the Fund purchases a swaption, the premium paid to the writer is recorded as an investment and subsequently marked-to-market to reflect the current value of the swaption. A written swaption gives the Fund the obligation, if exercised by the purchaser, to enter into a swap contract according to the terms of the underlying agreement. When the Fund writes a swaption, the premium received by the Fund is recorded as a liability and subsequently marked-to-market to reflect the current value of the swaption. When a swaption is exercised, the cost of the swap is adjusted by the amount of the premium paid or received. When a swaption expires or an unexercised swaption is closed, a gain or loss is recognized in the amount of the premium paid or received, plus the cost to close. The Fund’s risk for purchased swaptions is limited to the premium paid. The writer of a swaption bears the risk of unfavorable changes in the preset terms of the underlying swap contract. Purchased swaptions traded over-the-counter involve risk that the issuer or counterparty will fail to perform its contractual obligations.
N When-Issued Securities and Delayed Delivery Transactions—The Fund may purchase securities on a delayed delivery, when-issued or forward commitment basis, including TBA (To Be Announced) securities. Payment and delivery may take place after the customary settlement period for that security. At the time the transaction is negotiated, the price of the security that will be delivered is fixed. The Fund maintains cash and/or security positions for these commitments such that sufficient liquid assets will be available to make payments upon settlement. Securities purchased on a delayed delivery, when-issued or forward commitment basis are marked-to-market daily and begin earning interest on settlement date. Such security purchases are subject to the risk that when delivered they will be worth less than the agreed upon payment price. Losses may also arise if the counterparty does not perform under the contract. A forward purchase commitment may also be closed by entering into an offsetting commitment. If an offsetting commitment is entered into, the Fund will realize a gain or loss on investments based on the price established when the Fund entered into the commitment.
O Forward Sale Commitments—The Fund may enter into forward sale commitments to sell generic U.S. government agency mortgage-backed securities to hedge its portfolio positions and/or to enhance return. The proceeds to be received from the forward sale commitment are recorded as an asset and a corresponding liability, which is subsequently valued at approximately the current market value of the underlying security in accordance with the Fund's policies on investment valuations discussed above. The Fund records an unrealized gain or loss on investments to the extent of the difference between the proceeds to be received and the value of the open forward sale commitment on the day of determination. If the forward sale commitment is closed through the acquisition of an offsetting purchase commitment or the delivery of securities, the Fund realizes a gain or loss on investments based on the price established when the Fund entered into the commitment. If the Fund enters into a forward sale commitment for the delivery of a security that it does not own or has the right to obtain, it is subject to the risk of loss if the purchase price to settle the commitment is higher than the price at which it was sold.
P Reverse Repurchase Agreements—Under a reverse repurchase agreement, the Fund temporarily transfers possession of a portfolio security to another party, such as a bank or broker/dealer, in return for cash. At the same time, the Fund agrees to repurchase the security at an agreed upon time and price, which reflects an interest payment. In periods of increased demand for a security, the Fund may receive a payment from the counterparty for the use of the
Eaton Vance
Government Opportunities Fund
October 31, 2022
Notes to Financial Statements — continued
security, which is recorded as interest income. Because the Fund retains effective control over the transferred security, the transaction is accounted for as a secured borrowing. The Fund may enter into such agreements when it believes it is able to invest the cash acquired at a rate higher than the cost of the agreement, which would increase earned income. When the Fund enters into a reverse repurchase agreement, any fluctuations in the market value of either the securities transferred to another party or the securities in which the proceeds may be invested would affect the market value of the Fund’s assets. Because reverse repurchase agreements may be considered to be the practical equivalent of borrowing funds (and the counterparty making a loan), they constitute a form of leverage. The Fund segregates cash or liquid assets equal to its obligation to repurchase the security. During the term of the agreement, the Fund may also be obligated to pledge additional cash and/or securities in the event of a decline in the fair value of the transferred security. In the event the counterparty to a reverse repurchase agreement becomes insolvent, recovery of the security transferred by the Fund may be delayed or the Fund may incur a loss equal to the amount by which the value of the security transferred by the Fund exceeds the repurchase price payable by the Fund.
Q Stripped Mortgage-Backed Securities—The Fund may invest in Interest Only (IO) and Principal Only (PO) securities, a form of stripped mortgage-backed securities, whereby the IO security receives all the interest and the PO security receives all the principal on a pool of mortgage assets. The yield to maturity on an IO security is extremely sensitive to the rate of principal payments (including prepayments) on the related underlying mortgage assets, and a rapid rate of principal payments may have a material adverse effect on the yield to maturity from these securities. If the underlying mortgages experience greater than anticipated prepayments of principal, the Fund may fail to recoup its initial investment in an IO security. The market value of IO and PO securities can be unusually volatile due to changes in interest rates.
2 Distributions to Shareholders and Income Tax Information
The Fund declares dividends daily to shareholders of record at the time of declaration. Distributions are generally paid monthly. Distributions of realized capital gains are made at least annually. Distributions are declared separately for each class of shares. Shareholders may reinvest income and capital gain distributions in additional shares of the same class of the Fund at the net asset value as of the reinvestment date or, at the election of the shareholder, receive distributions in cash. Distributions to shareholders are determined in accordance with income tax regulations, which may differ from U.S. GAAP. As required by U.S. GAAP, only distributions in excess of tax basis earnings and profits are reported in the financial statements as a return of capital. Permanent differences between book and tax accounting relating to distributions are reclassified to paid-in capital. For tax purposes, distributions from short-term capital gains are considered to be from ordinary income.
The tax character of distributions declared for the years ended October 31, 2022 and October 31, 2021 was as follows:
| | Year Ended October 31, |
| | 2022 | 2021 |
| Ordinary income | $8,665,309 | $8,430,205 |
| Tax return of capital | $ 448,415 | $ — |
As of October 31, 2022, the components of distributable earnings (accumulated loss) on a tax basis were as follows:
| Deferred capital losses | $ (78,521,362) |
| Net unrealized depreciation | (27,450,683) |
| Distributions payable | (60,910) |
| Accumulated loss | $(106,032,955) |
At October 31, 2022, the Fund, for federal income tax purposes, had deferred capital losses of $78,521,362 which would reduce its taxable income arising from future net realized gains on investment transactions, if any, to the extent permitted by the Internal Revenue Code, and thus would reduce the amount of distributions to shareholders, which would otherwise be necessary to relieve the Fund of any liability for federal income or excise tax. The deferred capital losses are treated as arising on the first day of the Fund’s next taxable year and retain the same short-term or long-term character as when originally deferred. Of the deferred capital losses at October 31, 2022, $20,281,218 are short-term and $58,240,144 are long-term.
Eaton Vance
Government Opportunities Fund
October 31, 2022
Notes to Financial Statements — continued
The cost and unrealized appreciation (depreciation) of investments, including open derivative contracts and TBA sale commitments, of the Fund at October 31, 2022, as determined on a federal income tax basis, were as follows:
| Aggregate cost | $ 479,282,346 |
| Gross unrealized appreciation | $ 27,372,268 |
| Gross unrealized depreciation | (54,822,950) |
| Net unrealized depreciation | $ (27,450,682) |
3 Investment Adviser Fee and Other Transactions with Affiliates
The investment adviser fee is earned by Boston Management and Research (BMR), an indirect, wholly-owned subsidiary of Morgan Stanley, as compensation for investment advisory services rendered to the Fund. The investment adviser fee is computed at an annual rate as a percentage of the Fund’s average daily net assets as follows and is payable monthly:
| Average Daily Net Assets | Annual Fee Rate |
| Up to $500 million | 0.6500% |
| $500 million but less than $1 billion | 0.6250% |
| $1 billion but less than $1.5 billion | 0.6000% |
| $1.5 billion but less than $2 billion | 0.5625% |
| $2 billion but less than $2.5 billion | 0.5000% |
| $2.5 billion and over | 0.4375% |
For the year ended October 31, 2022, the Fund’s investment adviser fee amounted to $2,717,973 or 0.65% of the Fund’s average daily net assets. Effective April 26, 2022, the Fund may invest in a money market fund, the Institutional Class of the Morgan Stanley Institutional Liquidity Funds - Government Portfolio (the Liquidity Fund), an open-end management investment company managed by Morgan Stanley Investment Management Inc., a wholly-owned subsidiary of Morgan Stanley. The investment adviser fee paid by the Fund is reduced by an amount equal to its pro-rata share of the advisory and administration fees paid by the Fund due to its investment in the Liquidity Fund. For the year ended October 31, 2022, the investment adviser fee paid was reduced by $27,126 relating to the Fund’s investment in the Liquidity Fund. Prior to April 26, 2022, the Fund may have invested its cash in Eaton Vance Cash Reserves Fund, LLC (Cash Reserves Fund), an affiliated investment company managed by Eaton Vance Management (EVM). EVM did not receive a fee for advisory services provided to Cash Reserves Fund.
EVM has agreed to reimburse the Fund’s expenses to the extent that total annual operating expenses (relating to ordinary operating expenses only and excluding such expenses as borrowing costs, taxes or litigation expenses) exceed 1.05%, 1.80%, 0.80% and 1.30% of the Fund’s average daily net assets for Class A, Class C, Class I and Class R, respectively. This agreement may be changed or terminated after February 28, 2022. Pursuant to this agreement, EVM was allocated $210,436 of the Fund’s operating expenses for the year ended October 31, 2022.
EVM, an affiliate of BMR, serves as administrator of the Fund, but receives no compensation. EVM provides sub-transfer agency and related services to the Fund pursuant to a Sub-Transfer Agency Support Services Agreement. For the yearended October 31, 2022, EVM earned $53,031 from the Fund pursuant to such agreement, which is included in transfer and dividend disbursing agent fees on the Statement of Operations.The Fund was informed that Eaton Vance Distributors, Inc. (EVD), an affiliate of EVM and the Fund’s principal underwriter, received $406 as its portion of the sales charge on sales of Class A shares for the year ended October 31, 2022. EVD also received distribution and service fees from Class A and Class C shares (see Note 4) and contingent deferred sales charges (see Note 5).
Trustees and officers of the Fund who are members of EVM’s or BMR's organizations receive remuneration for their services to the Fund out of the investment adviser fee. Trustees of the Fund who are not affiliated with the investment adviser may elect to defer receipt of all or a percentage of their annual fees in accordance with the terms of the Trustees Deferred Compensation Plan. For the year ended October 31, 2022, no significant amounts have been deferred. Certain officers and Trustees of the Fund are officers of the above organizations.
Eaton Vance
Government Opportunities Fund
October 31, 2022
Notes to Financial Statements — continued
4 Distribution Plans
The Fund has in effect a distribution plan for Class A shares (Class A Plan) pursuant to Rule 12b-1 under the 1940 Act. Pursuant to the Class A Plan, the Fund pays EVD a distribution and service fee of 0.25% per annum of its average daily net assets attributable to Class A shares for distribution services and facilities provided to the Fund by EVD, as well as for personal services and/or the maintenance of shareholder accounts. Distribution and service fees paid or accrued to EVD for the year ended October 31, 2022 amounted to $386,227 for Class A shares.
The Fund also has in effect distribution plans for Class C shares (Class C Plan) and Class R shares (Class R Plan) pursuant to Rule 12b-1 under the 1940 Act. Pursuant to the Class C Plan, the Fund pays EVD amounts equal to 0.75% per annum of its average daily net assets attributable to Class C shares for providing ongoing distribution services and facilities to the Fund. For the year ended October 31, 2022, the Fund paid or accrued to EVD $75,922 for Class C shares. The Class R Plan requires the Fund to pay EVD an amount up to 0.50% per annum of its average daily net assets attributable to Class R shares for providing ongoing distribution services and facilities to the Fund. The Trustees of the Trust have currently limited Class R distribution payments to 0.25% per annum of the average daily net assets attributable to Class R shares. For the year ended October 31, 2022, the Fund paid or accrued to EVD $124,000 for Class R shares.
Pursuant to the Class C and Class R Plans, the Fund also makes payments of service fees to EVD, financial intermediaries and other persons in amounts equal to 0.25% per annum of its average daily net assets attributable to that class. Service fees paid or accrued are for personal services and/or the maintenance of shareholder accounts. They are separate and distinct from the sales commissions and distribution fees payable to EVD. Service fees paid or accrued for the year ended October 31, 2022 amounted to $25,307 and $124,000 for Class C and Class R shares, respectively.
Distribution and service fees are subject to the limitations contained in the Financial Industry Regulatory Authority Rule 2341(d).
5 Contingent Deferred Sales Charges
A contingent deferred sales charge (CDSC) of 1% generally is imposed on redemptions of Class C shares made within 12 months of purchase. Class A shares may be subject to a 0.75% (1% prior to April 29, 2022) CDSC if redeemed within 12 months of purchase (depending on the circumstances of purchase). Generally, the CDSC is based upon the lower of the net asset value at date of redemption or date of purchase. No charge is levied on shares acquired by reinvestment of dividends or capital gain distributions. For the year ended October 31, 2022, the Fund was informed that EVD received approximately $16,000 and $1,000 of CDSCs paid by Class A and Class C shareholders, respectively.
6 Purchases and Sales of Investments
Purchases and sales of investments, other than short-term obligations and including maturities, paydowns and TBA transactions, for the year ended October 31, 2022 were as follows:
| | Purchases | Sales |
| Investments (non-U.S. Government) | $ 41,468,372 | $ 20,443,392 |
| U.S. Government and Agency Securities | 3,476,763,554 | 3,575,179,938 |
| | $3,518,231,926 | $3,595,623,330 |
Eaton Vance
Government Opportunities Fund
October 31, 2022
Notes to Financial Statements — continued
7 Shares of Beneficial Interest
The Fund’s Declaration of Trust permits the Trustees to issue an unlimited number of full and fractional shares of beneficial interest (without par value). Such shares may be issued in a number of different series (such as the Fund) and classes. Transactions in Fund shares, including direct exchanges pursuant to share class conversions for all periods presented, were as follows:
| | Year Ended
October 31, 2022 | | Year Ended
October 31, 2021 |
| | Shares | Amount | | Shares | Amount |
| Class A | | | | | |
| Sales | 7,105,348 | $ 42,429,186 | | 8,733,903 | $ 53,878,285 |
| Issued to shareholders electing to receive payments of distributions in Fund shares | 521,328 | 3,018,284 | | 441,144 | 2,704,902 |
| Redemptions | (9,947,575) | (58,668,643) | | (7,783,888) | (47,911,487) |
| Net increase (decrease) | (2,320,899) | $ (13,221,173) | | 1,391,159 | $ 8,671,700 |
| Class C | | | | | |
| Sales | 523,893 | $ 3,108,916 | | 279,554 | $ 1,721,370 |
| Issued to shareholders electing to receive payments of distributions in Fund shares | 22,768 | 131,577 | | 25,698 | 157,487 |
| Redemptions | (1,229,831) | (7,168,909) | | (2,400,481) | (14,772,580) |
| Net decrease | (683,170) | $ (3,928,416) | | (2,095,229) | $ (12,893,723) |
| Class I | | | | | |
| Sales | 43,065,146 | $ 248,866,727 | | 24,780,703 | $ 152,235,207 |
| Issued to shareholders electing to receive payments of distributions in Fund shares | 750,078 | 4,345,848 | | 657,344 | 4,027,528 |
| Redemptions | (38,614,717) | (225,559,952) | | (23,205,793) | (142,447,171) |
| Net increase | 5,200,507 | $ 27,652,623 | | 2,232,254 | $ 13,815,564 |
| Class R | | | | | |
| Sales | 6,749,117 | $ 39,539,347 | | 4,558,101 | $ 27,856,077 |
| Issued to shareholders electing to receive payments of distributions in Fund shares | 162,498 | 935,762 | | 134,630 | 822,553 |
| Redemptions | (7,224,766) | (42,277,315) | | (4,994,767) | (30,563,365) |
| Net decrease | (313,151) | $ (1,802,206) | | (302,036) | $ (1,884,735) |
8 Financial Instruments
The Fund may trade in financial instruments with off-balance sheet risk in the normal course of its investing activities. These financial instruments may include futures contracts, written swaptions and swap contracts and may involve, to a varying degree, elements of risk in excess of the amounts recognized for financial statement purposes. The notional or contractual amounts of these instruments represent the investment the Fund has in particular classes of financial instruments and do not necessarily represent the amounts potentially subject to risk. The measurement of the risks associated with these instruments is meaningful only when all related and offsetting transactions are considered. A summary of obligations under these financial instruments at October 31, 2022 is included in the Portfolio of Investments. At October 31, 2022, the Fund had sufficient cash and/or securities to cover commitments under these contracts.
In the normal course of pursuing its investment objective, the Fund is subject to the following risks:
Eaton Vance
Government Opportunities Fund
October 31, 2022
Notes to Financial Statements — continued
Interest Rate Risk: Because the Fund holds fixed-rate bonds, the value of these bonds may decrease if interest rates rise. The Fund utilizes futures contracts and interest rate swaps and swaptions to enhance total return, to change the overall duration of the Fund and/or to hedge against fluctuations in securities prices due to changes in interest rates.
Credit Risk: The Fund enters into credit default swap contracts to manage certain investment risks and/or to enhance total return.
The Fund enters into over-the-counter (OTC) derivatives that may contain provisions whereby the counterparty may terminate the contract under certain conditions, including but not limited to a decline in the Fund’s net assets below a certain level over a certain period of time, which would trigger a payment by the Fund for those derivatives in a liability position. At October 31, 2022, the fair value of derivatives with credit-related contingent features in a net liability position was $1,826,376. The aggregate fair value of assets pledged as collateral by the Fund for such liability was $910,000 at October 31, 2022.
The OTC derivatives in which the Fund invests (except for written options and swaptions as the Fund, not the counterparty, is obligated to perform) are subject to the risk that the counterparty to the contract fails to perform its obligations under the contract. To mitigate this risk, the Fund has entered into an International Swaps and Derivatives Association, Inc. Master Agreement (“ISDA Master Agreement”) or similar agreement with substantially all its derivative counterparties. An ISDA Master Agreement is a bilateral agreement between the Fund and a counterparty that governs certain OTC derivatives and typically contains, among other things, set-off provisions in the event of a default and/or termination event as defined under the relevant ISDA Master Agreement. Under an ISDA Master Agreement, the Fund may, under certain circumstances, offset with the counterparty certain derivative financial instruments’ payables and/or receivables with collateral held and/or posted and create one single net payment. The provisions of the ISDA Master Agreement typically permit a single net payment in the event of default including the bankruptcy or insolvency of the counterparty. However, bankruptcy or insolvency laws of a particular jurisdiction may impose restrictions on or prohibitions against the right of offset in bankruptcy or insolvency. Certain ISDA Master Agreements allow counterparties to OTC derivatives to terminate derivative contracts prior to maturity in the event the Fund’s net assets decline by a stated percentage or the Fund fails to meet the terms of its ISDA Master Agreements, which would cause the counterparty to accelerate payment by the Fund of any net liability owed to it.
The collateral requirements for derivatives traded under an ISDA Master Agreement are governed by a Credit Support Annex to the ISDA Master Agreement. Collateral requirements are determined at the close of business each day and are typically based on changes in market values for each transaction under an ISDA Master Agreement and netted into one amount for such agreement. Generally, the amount of collateral due from or to a counterparty is subject to a minimum transfer threshold amount before a transfer is required, which may vary by counterparty. Collateral pledged for the benefit of the Fund and/or counterparty is held in segregated accounts by the Fund’s custodian and cannot be sold, re-pledged, assigned or otherwise used while pledged. The portion of such collateral representing cash, if any, is reflected as deposits for derivatives collateral and, in the case of cash pledged by a counterparty for the benefit of the Fund, a corresponding liability on the Statement of Assets and Liabilities. Securities pledged by the Fund as collateral, if any, are identified as such in the Portfolio of Investments. The carrying amount of the liability for cash collateral due to brokers at October 31, 2022 approximated its fair value. If measured at fair value, such liability would have been considered as Level 2 in the fair value hierarchy (see Note 12) at October 31, 2022.
The fair value of open derivative instruments (not considered to be hedging instruments for accounting disclosure purposes) by risk exposure at October 31, 2022 was as follows:
| | | Fair Value |
| Risk | Derivative | Asset Derivative | Liability Derivative |
| Credit | Swap contracts | $ — | $ (387,501)(1) |
| Interest Rate | Purchased swaptions | 5,597,209 (2) | — |
| Interest Rate | Written options and swaptions | — | (1,826,376) (3) |
| Interest Rate | Futures contracts | 342,720 (1) | (574,299) (1) |
| Interest Rate | Swap contracts | 15,093,111 (1) | — |
| Total | $21,033,040 | $(2,788,176) |
| Derivatives not subject to master netting or similar agreements | $15,435,831 | $ (961,800) |
| Total Derivatives subject to master netting or similar agreements | $ 5,597,209 | $(1,826,376) |
| (1) | Only the current day’s variation margin on open futures contracts and centrally cleared swap contracts is reported within the Statement of Assets and Liabilities as Receivable or Payable for variation margin on open futures contracts and centrally cleared swap contracts, as applicable. |
| (2) | Statement of Asset and Liabilities location: Unaffiliated investments, at value. |
| (3) | Statement of Assets and Liabilities location: Written options and swaptions outstanding, at value. |
Eaton Vance
Government Opportunities Fund
October 31, 2022
Notes to Financial Statements — continued
The Fund's derivative assets and liabilities at fair value by risk, which are reported gross in the Statement of Assets and Liabilities, are presented in the table above. The following tables present the Fund's derivative assets and liabilities by counterparty, net of amounts available for offset under a master netting agreement and net of the related collateral received by the Fund for such assets and pledged by the Portfolio for such liabilities as of October 31, 2022.
| Counterparty | Derivative
Assets Subject to
Master Netting
Agreement | Derivatives
Available
for Offset | Non-cash
Collateral
Received(a) | Cash
Collateral
Received(a) | Net Amount
of Derivative
Assets(b) |
| Bank of America, N.A. | $ 3,410,116 | $ (815,248) | $ — | $ (2,470,000) | $ 124,868 |
| Goldman Sachs International | 2,187,093 | (10,732) | — | (2,110,000) | 66,361 |
| | $5,597,209 | $(825,980) | $ — | $(4,580,000) | $191,229 |
| Counterparty | Derivative
Liabilities Subject to
Master Netting
Agreement | Derivatives
Available
for Offset | Non-cash
Collateral
Pledged(a) | Cash
Collateral
Pledged(a) | Net Amount
of Derivative
Liabilities(c) |
| Bank of America, N.A. | $ (815,248) | $ 815,248 | $ — | $ — | $ — |
| Goldman Sachs International | (10,732) | 10,732 | — | — | — |
| JPMorgan Chase Bank, N.A. | (1,000,396) | — | — | 910,000 | (90,396) |
| | $(1,826,376) | $825,980 | $ — | $910,000 | $(90,396) |
| (a) | In some instances, the total collateral received and/or pledged may be more than the amount shown due to overcollateralization. |
| (b) | Net amount represents the net amount due from the counterparty in the event of default. |
| (c) | Net amount represents the net amount payable to the counterparty in the event of default. |
The effect of derivative instruments (not considered to be hedging instruments for accounting disclosure purposes) on the Statement of Operations by risk exposure for the year ended October 31, 2022 was as follows:
| Risk | Derivative | Realized Gain (Loss)
on Derivatives Recognized
in Income | Change in Unrealized
Appreciation (Depreciation) on
Derivatives Recognized in Income |
| Credit | Swap contracts | $ 8,918(1) | $ (696,181)(2) |
| Interest Rate | Purchased swaptions | (1,751,742) (3) | 4,241,308 (4) |
| Interest Rate | Written options and swaptions | 1,189,215 (5) | 919,812 (6) |
| Interest Rate | Futures contracts | (1,748,665) (7) | 182,354 (8) |
| Interest Rate | Swap contracts | 143 (1) | 15,093,011 (2) |
| Total | $(2,302,131) | $19,740,304 |
| (1) | Statement of Operations location: Net realized gain (loss) - Swap contracts. |
| (2) | Statement of Operations location: Change in unrealized appreciation (depreciation) - Swap contracts. |
| (3) | Statement of Operations location: Net realized gain (loss) - Investment transactions. |
| (4) | Statement of Operations location: Change in unrealized appreciation (depreciation) - Investments. |
| (5) | Statement of Operations location: Net realized gain (loss) – Written options and swaptions. |
| (6) | Statement of Operations location: Change in unrealized appreciation (depreciation) – Written options and swaptions. |
| (7) | Statement of Operations location: Net realized gain (loss) - Futures contracts. |
Eaton Vance
Government Opportunities Fund
October 31, 2022
Notes to Financial Statements — continued
| (8) | Statement of Operations location: Change in unrealized appreciation (depreciation) - Futures contracts. |
The average notional cost of futures contracts and average notional amounts of other derivative contracts outstanding during the year ended October 31, 2022, which are indicative of the volume of these derivative types, were approximately as follows:
Futures
Contracts — Long | Futures
Contracts — Short | Purchased
Swaptions | Written Options
and Swaptions | Swap
Contracts |
| $40,203,000 | $32,807,000 | $91,846,000 | $89,154,000 | $35,769,000 |
9 Line of Credit
The Fund participates with other portfolios and funds managed by EVM and its affiliates in a $725 million unsecured line of credit agreement with a group of banks, which is in effect through October 24, 2023. In connection with the renewal of the agreement on October 25, 2022, the borrowing limit was decreased from $800 million. Borrowings are made by the Fund solely for temporary purposes related to redemptions and other short-term cash needs. Interest is charged to the Fund based on its borrowings at an amount above either the Secured Overnight Financing Rate (SOFR) or Federal Funds rate. In addition, a fee computed at an annual rate of 0.15% on the daily unused portion of the line of credit is allocated among the participating portfolios and funds at the end of each quarter. Also in connection with the renewal of the agreement, an arrangement fee totaling $150,000 was incurred that was allocated to the participating portfolios and funds. Because the line of credit is not available exclusively to the Fund, it may be unable to borrow some or all of its requested amounts at any particular time. The Fund did not have any significant borrowings or allocated fees during the year ended October 31, 2022.
10 Reverse Repurchase Agreements
There were no open reverse repurchase agreements outstanding as of October 31, 2022. For the year ended October 31, 2022, the average borrowings under settled reverse repurchase agreements and the average annual interest rate were approximately $17,806 and 3.35%, respectively.
11 Investments in Affiliated Funds
At October 31, 2022, the value of the Fund's investment in funds that may be deemed to be affiliated was $83,859,312, which represents 19.9% of the Fund's net assets. Transactions in affiliated funds by the Fund for the year ended October 31, 2022 were as follows:
| Name | Value,
beginning
of period | Purchases | Sales
proceeds | Net
realized
gain (loss) | Change in
unrealized
appreciation
(depreciation) | Value, end
of period | Dividend
income | Units/Shares,
end of period |
| Short-Term Investments |
| Cash Reserves Fund | $66,939,014 | $281,221,124 | $(348,154,149) | $ (5,989) | $ — | $ — | $ 37,071 | — |
| Liquidity Fund | — | 435,041,633 | (351,182,321) | — | — | 83,859,312 | 297,958 | 83,859,312 |
| Total | | | | $(5,989) | $ — | $83,859,312 | $335,029 | |
12 Fair Value Measurements
Under generally accepted accounting principles for fair value measurements, a three-tier hierarchy to prioritize the assumptions, referred to as inputs, is used in valuation techniques to measure fair value. The three-tier hierarchy of inputs is summarized in the three broad levels listed below.
| • | Level 1 – quoted prices in active markets for identical investments |
| • | Level 2 – other significant observable inputs (including quoted prices for similar investments, interest rates, prepayment speeds, credit risk, etc.) |
| • | Level 3 – significant unobservable inputs (including a fund's own assumptions in determining the fair value of investments) |
In cases where the inputs used to measure fair value fall in different levels of the fair value hierarchy, the level disclosed is determined based on the lowest level input that is significant to the fair value measurement in its entirety. The inputs or methodology used for valuing securities are not necessarily an indication of the risk associated with investing in those securities.
Eaton Vance
Government Opportunities Fund
October 31, 2022
Notes to Financial Statements — continued
At October 31, 2022, the hierarchy of inputs used in valuing the Fund’s investments and open derivative instruments, which are carried at value, were as follows:
| Asset Description | Level 1 | Level 2 | Level 3 | Total |
| Asset-Backed Securities | $ — | $ 18,583,997 | $ — | $ 18,583,997 |
| Collateralized Mortgage Obligations | — | 122,487,354 | — | 122,487,354 |
| Commercial Mortgage-Backed Securities | — | 1,506,549 | — | 1,506,549 |
| Government National Mortgage Association Participation Agreements | — | 25,021,691 | — | 25,021,691 |
| U.S. Government Agency Commercial Mortgage-Backed Securities | — | 2,935,551 | — | 2,935,551 |
| U.S. Government Agency Mortgage-Backed Securities | — | 295,698,019 | — | 295,698,019 |
| U.S. Government Guaranteed Small Business Administration Loans | — | 1,900,107 | — | 1,900,107 |
| Short-Term Investments | 83,859,312 | — | — | 83,859,312 |
| Purchased Interest Rate Swaptions | — | 5,597,209 | — | 5,597,209 |
| Total Investments | $ 83,859,312 | $ 473,730,477 | $ — | $ 557,589,789 |
| Futures Contracts | $ 342,720 | $ — | $ — | $ 342,720 |
| Swap Contracts | — | 15,093,111 | — | 15,093,111 |
| Total | $ 84,202,032 | $ 488,823,588 | $ — | $ 573,025,620 |
| Liability Description | | | | |
| TBA Sale Commitments | $ — | $ (119,024,760) | $ — | $ (119,024,760) |
| Written Put Options (OTC) | — | (1,756,643) | — | (1,756,643) |
| Written Interest Rate Swaptions | — | (69,733) | — | (69,733) |
| Futures Contracts | (574,299) | — | — | (574,299) |
| Swap Contracts | — | (387,501) | — | (387,501) |
| Total | $ (574,299) | $ (121,238,637) | $ — | $ (121,812,936) |
13 Risks and Uncertainties
Pandemic Risk
An outbreak of respiratory disease caused by a novel coronavirus was first detected in China in late 2019 and subsequently spread internationally. This coronavirus has resulted in closing borders, enhanced health screenings, changes to healthcare service preparation and delivery, quarantines, cancellations, disruptions to supply chains and customer activity, as well as general concern and uncertainty. Health crises caused by outbreaks of disease, such as the coronavirus outbreak, may exacerbate other pre-existing political, social and economic risks and disrupt normal market conditions and operations. The impact of this outbreak has negatively affected the worldwide economy, as well as the economies of individual countries and industries, and could continue to affect the market in significant and unforeseen ways. Other epidemics and pandemics that may arise in the future may have similar effects. Any such impact could adversely affect the Fund’s performance, or the performance of the securities in which the Fund invests.
Eaton Vance
Government Opportunities Fund
October 31, 2022
Report of Independent Registered Public Accounting Firm
To the Trustees of Eaton Vance Mutual Funds Trust and Shareholders of Eaton Vance Government Opportunities Fund:
Opinion on the Financial Statements and Financial Highlights
We have audited the accompanying statement of assets and liabilities of Eaton Vance Government Opportunities Fund (the “Fund") (one of the funds constituting Eaton Vance Mutual Funds Trust), including the portfolio of investments, as of October 31, 2022, the related statement of operations for the year then ended, the statements of changes in net assets for each of the two years in the period then ended, the financial highlights for each of the five years in the period then ended, and the related notes. In our opinion, the financial statements and financial highlights present fairly, in all material respects, the financial position of the Fund as of October 31, 2022, and the results of its operations for the year then ended, the changes in its net assets for each of the two years in the period then ended, and the financial highlights for each of the five years in the period then ended, in conformity with accounting principles generally accepted in the United States of America.
Basis for Opinion
These financial statements and financial highlights are the responsibility of the Fund's management. Our responsibility is to express an opinion on the Fund's financial statements and financial highlights based on our audits. We are a public accounting firm registered with the Public Company Accounting Oversight Board (United States) (PCAOB) and are required to be independent with respect to the Fund in accordance with the U.S. federal securities laws and the applicable rules and regulations of the Securities and Exchange Commission and the PCAOB.
We conducted our audits in accordance with the standards of the PCAOB. Those standards require that we plan and perform the audit to obtain reasonable assurance about whether the financial statements and financial highlights are free of material misstatement, whether due to error or fraud. The Fund is not required to have, nor were we engaged to perform, an audit of its internal control over financial reporting. As part of our audits, we are required to obtain an understanding of internal control over financial reporting but not for the purpose of expressing an opinion on the effectiveness of the Fund’s internal control over financial reporting. Accordingly, we express no such opinion.
Our audits included performing procedures to assess the risks of material misstatement of the financial statements and financial highlights, whether due to error or fraud, and performing procedures that respond to those risks. Such procedures included examining, on a test basis, evidence regarding the amounts and disclosures in the financial statements and financial highlights. Our audits also included evaluating the accounting principles used and significant estimates made by management, as well as evaluating the overall presentation of the financial statements and financial highlights. Our procedures included confirmation of securities owned as of October 31, 2022, by correspondence with the custodian and brokers; when replies were not received from brokers, we performed other auditing procedures. We believe that our audits provide a reasonable basis for our opinion.
/s/ Deloitte & Touche LLP
Boston, Massachusetts
December 28, 2022
We have served as the auditor of one or more Eaton Vance investment companies since 1959.
Eaton Vance
Government Opportunities Fund
October 31, 2022
Federal Tax Information (Unaudited)
The Form 1099-DIV you receive in February 2023 will show the tax status of all distributions paid to your account in calendar year 2022. Shareholders are advised to consult their own tax adviser with respect to the tax consequences of their investment in the Fund. As required by the Internal Revenue Code and/or regulations, shareholders must be notified regarding 163(j) interest dividends.
163(j) Interest Dividends. For the fiscal year ended October 31, 2022, the Fund designates 100% of distributions from net investment income as a 163(j) interest dividend.
Eaton Vance
Government Opportunities Fund
October 31, 2022
Board of Trustees’ Contract Approval
Overview of the Contract Review Process
The Investment Company Act of 1940, as amended (the “1940 Act”), provides, in substance, that the investment advisory agreement between a fund and its investment adviser will continue in effect from year-to-year only if its continuation is approved on an annual basis by a vote of the fund’s board of trustees, including a majority of the trustees who are not “interested persons” of the fund (“independent trustees”), cast in person at a meeting called for the purpose of considering such approval.
At a meeting held on June 8, 2022, the Boards of Trustees/Directors (collectively, the “Board”) that oversee the registered investment companies advised by Eaton Vance Management or its affiliate, Boston Management and Research (the “Eaton Vance Funds”), including a majority of the independent trustees (the “Independent Trustees”), voted to approve the continuation of existing investment advisory agreements and sub-advisory agreements1 for each of the Eaton Vance Funds for an additional one-year period. The Board relied upon the affirmative recommendation of its Contract Review Committee, which is a committee exclusively comprised of Independent Trustees. Prior to making its recommendation, the Contract Review Committee reviewed information furnished by the adviser and sub-adviser to each of the Eaton Vance Funds (including information specifically requested by the Board) for a series of formal meetings held between April and June 2022. Members of the Contract Review Committee also considered information received at prior meetings of the Board and its committees, to the extent such information was relevant to the Contract Review Committee’s annual evaluation of the investment advisory agreements and sub-advisory agreements.
In connection with its evaluation of the investment advisory agreements and sub-advisory agreements, the Board considered various information relating to the Eaton Vance Funds. This included information applicable to all or groups of Eaton Vance Funds, which is referenced immediately below, and information applicable to the particular Eaton Vance Fund covered by this report (additional fund-specific information is referenced below under “Results of the Contract Review Process”). (For funds that invest through one or more underlying portfolios, references to “each fund” in this section may include information that was considered at the portfolio-level.)
Information about Fees, Performance and Expenses
• A report from an independent data provider comparing advisory and other fees paid by each fund to such fees paid by comparable funds, as identified by the independent data provider (“comparable funds”);
• A report from an independent data provider comparing each fund’s total expense ratio (and its components) to those of comparable funds;
• A report from an independent data provider comparing the investment performance of each fund (including, as relevant, total return data, income data, Sharpe ratios and information ratios) to the investment performance of comparable funds and, as applicable, benchmark indices, over various time periods;
• In certain instances, data regarding investment performance relative to customized groups of peer funds and blended indices identified by the adviser in consultation with the Portfolio Management Committee of the Board (a committee exclusively comprised of Independent Trustees);
• Comparative information concerning the fees charged and services provided by the adviser and sub-adviser to each fund in managing other accounts (which may include other mutual funds, collective investment funds and institutional accounts) using investment strategies and techniques similar to those used in managing such fund(s), if any;
• Profitability analyses with respect to the adviser and sub-adviser to each of the funds;
Information about Portfolio Management and Trading
• Descriptions of the investment management services provided to each fund, as well as each of the funds’ investment strategies and policies;
• The procedures and processes used to determine the value of fund assets, including, when necessary, the determination of “fair value” and actions taken to monitor and test the effectiveness of such procedures and processes;
• Information about the policies and practices of each fund’s adviser and sub-adviser with respect to trading, including their processes for seeking best execution of portfolio transactions;
• Information about the allocation of brokerage transactions and the benefits, if any, received by the adviser and sub-adviser to each fund as a result of brokerage allocation, including, as applicable, information concerning the acquisition of research through client commission arrangements and policies with respect to “soft dollars”;
• Data relating to the portfolio turnover rate of each fund and related information regarding active management in the context of particular strategies;
Information about each Adviser and Sub-adviser
• Reports detailing the financial results and condition of the adviser and sub-adviser to each fund;
• Information regarding the individual investment professionals whose responsibilities include portfolio management and investment research for the funds, and, for portfolio managers and certain other investment professionals, information relating to their responsibilities with respect to managing other mutual funds and investment accounts, as applicable;
1 Not all Eaton Vance Funds have entered into a sub-advisory agreement with a sub-adviser. Accordingly, references to “sub-adviser” or “sub-advisory agreement” in this “Overview” section may not be applicable to the particular Eaton Vance Fund covered by this report. Following the “Overview” section, further information regarding the Board’s evaluation of a fund’s contractual arrangements is included under the “Results of the Contract Review Process” section.
Eaton Vance
Government Opportunities Fund
October 31, 2022
Board of Trustees’ Contract Approval — continued
• Information regarding the adviser’s and its parent company’s (Morgan Stanley’s) efforts to retain and attract talented investment professionals, including in the context of a particularly competitive marketplace for talent, as well as the ongoing unique environment presented by hybrid, remote and other alternative work arrangements;
• The Code of Ethics of the adviser and its affiliates and the sub-adviser of each fund, together with information relating to compliance with, and the administration of, such codes;
• Policies and procedures relating to proxy voting, including regular reporting with respect to fund proxy voting activities;
• Information regarding the handling of corporate actions and class actions, as well as information regarding litigation and other regulatory matters;
• Information concerning the resources devoted to compliance efforts undertaken by the adviser and its affiliates and the sub-adviser of each fund, if any, including descriptions of their various compliance programs and their record of compliance;
• Information concerning the business continuity and disaster recovery plans of the adviser and its affiliates and the sub-adviser of each fund, if any;
• A description of Eaton Vance Management’s and Boston Management and Research’s oversight of sub-advisers, including with respect to regulatory and compliance issues, investment management and other matters;
Other Relevant Information
• Information regarding ongoing initiatives to further integrate and harmonize, where applicable, the investment management and other departments of the adviser and its affiliates with the overall investment management infrastructure of Morgan Stanley, in light of Morgan Stanley’s acquisition of Eaton Vance on March 1, 2021;
• Information concerning the nature, cost and character of the administrative and other non-investment advisory services provided by Eaton Vance Management and its affiliates;
• Information concerning oversight of the relationship with the custodian, subcustodians, fund accountants, and other third-party service providers by the adviser and/or administrator to each of the funds;
• Information concerning efforts to implement policies and procedures with respect to various new regulations applicable to the funds, including Rule 12d1-4 (the Fund-of-Funds Rule), Rule 18f-4 (the Derivatives Rule) and Rule 2a-5 (the Fair Valuation Rule);
• For an Eaton Vance Fund structured as an exchange-listed closed-end fund, information concerning the benefits of the closed-end fund structure, as well as, where relevant, the closed-end fund’s market prices (including as compared to the closed-end fund’s net asset value (NAV)), trading volume data, continued use of auction preferred shares (where applicable), distribution rates and other relevant matters;
• The risks which the adviser and/or its affiliates incur in connection with the management and operation of the funds, including, among others, litigation, regulatory, entrepreneurial, and other business risks (and the associated costs of such risks); and
• The terms of each investment advisory agreement and sub-advisory agreement.
During the various meetings of the Board and its committees over the course of the year leading up to the June 8, 2022 meeting, the Trustees received information from portfolio managers and other investment professionals of the advisers and sub-advisers of the funds regarding investment and performance matters, and considered various investment and trading strategies used in pursuing the funds’ investment objectives. The Trustees also received information regarding risk management techniques employed in connection with the management of the funds. The Board and its committees evaluated issues pertaining to industry and regulatory developments, compliance procedures, fund governance and other issues with respect to the funds, and received and participated in reports and presentations provided by Eaton Vance Management, Boston Management and Research and fund sub-advisers, with respect to such matters. In addition to the formal meetings of the Board and its committees, the Independent Trustees held regular teleconferences to discuss, among other topics, matters relating to the continuation of investment advisory agreements and sub-advisory agreements.
The Contract Review Committee was advised throughout the contract review process by Goodwin Procter LLP, independent legal counsel for the Independent Trustees. The members of the Contract Review Committee, with the advice of such counsel, exercised their own business judgment in determining the material factors to be considered in evaluating each investment advisory agreement and sub-advisory agreement and the weight to be given to each such factor. The conclusions reached with respect to each investment advisory agreement and sub-advisory agreement were based on a comprehensive evaluation of all the information provided and not any single factor. Moreover, each member of the Contract Review Committee may have placed varying emphasis on particular factors in reaching conclusions with respect to each investment advisory agreement and sub-advisory agreement. In evaluating each investment advisory agreement and sub-advisory agreement, including the fee structures and other terms contained in such agreements, the members of the Contract Review Committee were also informed by multiple years of analysis and discussion with the adviser and sub-adviser to each of the Eaton Vance Funds.
Results of the Contract Review Process
Based on its consideration of the foregoing, and such other information it deemed relevant, including the factors and conclusions described below, the Contract Review Committee concluded that the continuation of the investment advisory agreement between Eaton Vance Government Opportunities Fund and Boston Management and Research (the “Adviser”), including its fee structure, is in the interests of shareholders and, therefore, recommended to the Board approval of the agreement. Based on the recommendation of the Contract Review Committee, the Board, including a majority of the Independent Trustees, voted to approve continuation of the investment advisory agreement for the Fund.
Eaton Vance
Government Opportunities Fund
October 31, 2022
Board of Trustees’ Contract Approval — continued
Nature, Extent and Quality of Services
In considering whether to approve the investment advisory agreement for the Fund, the Board evaluated the nature, extent and quality of services provided to the Fund by the Adviser.
The Board considered the Adviser’s management capabilities and investment processes in light of the types of investments held by the Fund, including the education, experience and number of investment professionals and other personnel who provide portfolio management, investment research, and similar services to the Fund. The Board specifically noted the Adviser’s experience in investing in collateralized mortgage obligations and mortgage-backed securities, including seasoned mortgage-backed securities, as well as the Adviser’s process for determining the extent to which the Fund will invest in seasoned mortgage-backed securities instead of other government securities. The Board also noted the Adviser’s experience in investing in instruments other than government securities, including privately issued residential and commercial mortgage-backed securities, mortgage-related loans, asset-backed securities, non-US mortgage-related instruments and other income instruments. The Board also took into account the resources dedicated to portfolio management and other services, the compensation methods of the Adviser and other factors, including the reputation and resources of the Adviser to recruit and retain highly qualified research, advisory and supervisory investment professionals. In addition, the Board considered the time and attention devoted to the Eaton Vance Funds, including the Fund, by senior management, as well as the infrastructure, operational capabilities and support staff in place to assist in the portfolio management and operations of the Fund, including the provision of administrative services. The Board also considered the business-related and other risks to which the Adviser or its affiliates may be subject in managing the Fund.
The Board considered the compliance programs of the Adviser and relevant affiliates thereof. The Board considered compliance and reporting matters regarding, among other things, personal trading by investment professionals, disclosure of portfolio holdings, late trading, frequent trading, portfolio valuation, business continuity and the allocation of investment opportunities. The Board also considered the responses of the Adviser and its affiliates to requests in recent years from regulatory authorities, such as the Securities and Exchange Commission and the Financial Industry Regulatory Authority.
The Board considered other administrative services provided or overseen by Eaton Vance Management and its affiliates, including transfer agency and accounting services. The Board evaluated the benefits to shareholders of investing in a fund that is a part of a large fund complex offering exposure to a variety of asset classes and investment disciplines, as well as the ability, in many cases, to exchange an investment among different funds without incurring additional sales charges.
After consideration of the foregoing factors, among others, the Board concluded that the nature, extent and quality of services provided by the Adviser, taken as a whole, are appropriate and consistent with the terms of the investment advisory agreement.
Fund Performance
The Board compared the Fund’s investment performance to that of comparable funds identified by an independent data provider (the peer group), as well as appropriate benchmark indices. The Board’s review included comparative performance data with respect to the Fund for the one-, three-, five- and ten-year periods ended December 31, 2021. In this regard, the Board noted that the performance of the Fund was higher than the median performance of the Fund’s peer group for the three-year period. The Board also noted that the performance of the Fund was lower than its primary and secondary benchmark indexes for the three-year period. The Board concluded that the performance of the Fund was satisfactory.
Management Fees and Expenses
The Board considered contractual fee rates payable by the Fund for advisory and administrative services (referred to collectively as “management fees”). As part of its review, the Board considered the Fund’s management fees and total expense ratio for the one-year period ended December 31, 2021, as compared to those of comparable funds, before and after giving effect to any undertaking to waive fees or reimburse expenses. The Board also considered certain Fund specific factors that had an impact on the Fund’s total expense ratio relative to comparable funds, as identified by management in response to inquiries from the Contract Review Committee.
After considering the foregoing information, and in light of the nature, extent and quality of the services provided by the Adviser, the Board concluded that the management fees charged for advisory and related services are reasonable.
Profitability and “Fall-Out” Benefits
The Board considered the level of profits realized by the Adviser and relevant affiliates thereof in providing investment advisory and administrative services to the Fund and to all Eaton Vance Funds as a group. The Board considered the level of profits realized without regard to marketing support or other payments by the Adviser and its affiliates to third parties in respect of distribution and other services.
The Board concluded that, in light of the foregoing factors and the nature, extent and quality of the services rendered, the profits realized by the Adviser and its affiliates are deemed not to be excessive.
The Board also considered direct or indirect fall-out benefits received by the Adviser and its affiliates in connection with their respective relationships with the Fund, including the benefits of research services that may be available to the Adviser as a result of securities transactions effected for the Fund and other investment advisory clients.
Eaton Vance
Government Opportunities Fund
October 31, 2022
Board of Trustees’ Contract Approval — continued
Economies of Scale
In reviewing management fees and profitability, the Board also considered the extent to which the Adviser and its affiliates, on the one hand, and the Fund, on the other hand, can expect to realize benefits from economies of scale as the assets of the Fund increase. The Board acknowledged the difficulty in accurately measuring the benefits resulting from economies of scale, if any, with respect to the management of any specific fund or group of funds. The Board reviewed data summarizing the increases and decreases in the assets of the Fund and of all Eaton Vance Funds as a group over various time periods, and evaluated the extent to which the total expense ratio of the Fund and the profitability of the Adviser and its affiliates may have been affected by such increases or decreases. Based upon the foregoing, the Board concluded that the Fund currently shares in the benefits from economies of scale, if any, when they are realized by the Adviser. The Board also concluded that the structure of the advisory fees, which include breakpoints at several asset levels, will allow the Fund to continue to benefit from any economies of scale in the future.
Eaton Vance
Government Opportunities Fund
October 31, 2022
Liquidity Risk Management Program
The Fund has implemented a written liquidity risk management program (Program) and related procedures to manage its liquidity in accordance with Rule 22e-4 under the Investment Company Act of 1940, as amended (Liquidity Rule). The Liquidity Rule defines “liquidity risk” as the risk that a fund could not meet requests to redeem shares issued by the fund without significant dilution of the remaining investors’ interests in the fund. The Fund’s Board of Trustees/Directors has designated the investment adviser to serve as the administrator of the Program and the related procedures. The administrator has established a Liquidity Risk Management Oversight Committee (Committee) to perform the functions necessary to administer the Program. As part of the Program, the administrator is responsible for identifying illiquid investments and categorizing the relative liquidity of the Fund’s investments in accordance with the Liquidity Rule. Under the Program, the administrator assesses, manages, and periodically reviews the Fund’s liquidity risk, and is responsible for making certain reports to the Fund’s Board of Trustees/Directors and the Securities and Exchange Commission (SEC) regarding the liquidity of the Fund’s investments, and to notify the Board of Trustees/Directors and the SEC of certain liquidity events specified in the Liquidity Rule. The liquidity of the Fund’s portfolio investments is determined based on a number of factors including, but not limited to, relevant market, trading and investment-specific considerations under the Program.
At a meeting of the Fund’s Board of Trustees/Directors on June 7, 2022, the Committee provided a written report to the Fund’s Board of Trustees/Directors pertaining to the operation, adequacy, and effectiveness of implementation of the Program, as well as the operation of the highly liquid investment minimum (if applicable) for the period January 1, 2021 through December 31, 2021 (Review Period). The Program operated effectively during the Review Period, supporting the administrator’s ability to assess, manage and monitor Fund liquidity risk, including during periods of market volatility and net redemptions. During the Review Period, the Fund met redemption requests on a timely basis.
There can be no assurance that the Program will achieve its objectives in the future. Please refer to the Fund’s prospectus for more information regarding the Fund’s exposure to liquidity risk and other principal risks to which an investment in the Fund may be subject.
Eaton Vance
Government Opportunities Fund
October 31, 2022
Management and Organization
Fund Management. The Trustees of Eaton Vance Mutual Funds Trust (the Trust) are responsible for the overall management and supervision of the Trust's affairs. The Board members and officers of the Trust are listed below. Except as indicated, each individual has held the office shown or other offices in the same company for the last five years. Board members hold indefinite terms of office. Each Trustee holds office until his or her successor is elected and qualified, subject to a prior death, resignation, retirement, disqualification or removal. Under the terms of the Fund's current Trustee retirement policy, an Independent Trustee must retire and resign as a Trustee on the earlier of: (i) the first day of July following his or her 74th birthday; or (ii), with limited exception, December 31st of the 20th year in which he or she has served as a Trustee. However, if such retirement and resignation would cause the Fund to be out of compliance with Section 16 of the 1940 Act or any other regulations or guidance of the SEC, then such retirement and resignation will not become effective until such time as action has been taken for the Fund to be in compliance therewith. The “noninterested Trustees” consist of those Trustees who are not “interested persons” of the Trust, as that term is defined under the 1940 Act. The business address of each Board member and officer is Two International Place, Boston, Massachusetts 02110. As used below, “BMR” refers to Boston Management and Research, “EVC” refers to Eaton Vance Corp., “EV” refers to EV LLC, “EVM” refers to Eaton Vance Management and “EVD” refers to Eaton Vance Distributors, Inc. EV is the trustee of each of EVM and BMR. Effective March 1, 2021, each of EVM, BMR, EVD and EV are indirect, wholly owned subsidiaries of Morgan Stanley. Each officer affiliated with EVM may hold a position with other EVM affiliates that is comparable to his or her position with EVM listed below. Each Trustee oversees 135 funds (with the exception of Mr. Bowser who oversees 110 funds) in the Eaton Vance fund complex (including both funds and portfolios in a hub and spoke structure).
| Name and Year of Birth | Trust
Position(s) | Length of Service | Principal Occupation(s) and Other Directorships
During Past Five Years and Other Relevant Experience |
| Interested Trustee |
Thomas E. Faust Jr.
1958 | Trustee | Since 2007 | Chairman of Morgan Stanley Investment Management, Inc. (MSIM), member of the Board of Managers and President of EV (since 2021), Chief Executive Officer of EVM and BMR. Formerly, Chairman, Chief Executive Officer (2007-2021) and President (2006-2021) of EVC and Director of EVD (2007-2022). Mr. Faust is an interested person because of his positions with MSIM, BMR, EVM and EV, which are affiliates of the Trust.
Other Directorships. Formerly, Director of EVC (2007-2021) and Hexavest Inc. (investment management firm) (2012-2021). |
| Noninterested Trustees |
Alan C. Bowser(1)
1962 | Trustee | Since 2022 | Chief Diversity Officer, Partner and a member of the Operating Committee, and formerly served as Senior Advisor on Diversity and Inclusion for the firm’s chief executive officer, Co-Head of the Americas Region, and Senior Client Advisor of Bridgewater Associates, an asset management firm (2011- present).
Other Directorships. None. |
Mark R. Fetting
1954 | Trustee | Since 2016 | Private investor. Formerly held various positions at Legg Mason, Inc. (investment management firm) (2000-2012), including President, Chief Executive Officer, Director and Chairman (2008-2012), Senior Executive Vice President (2004-2008) and Executive Vice President (2001-2004). Formerly, President of Legg Mason family of funds (2001-2008). Formerly, Division President and Senior Officer of Prudential Financial Group, Inc. and related companies (investment management firm) (1991-2000).
Other Directorships. None. |
Cynthia E. Frost
1961 | Trustee | Since 2014 | Private investor. Formerly, Chief Investment Officer of Brown University (university endowment) (2000-2012). Formerly, Portfolio Strategist for Duke Management Company (university endowment manager) (1995-2000). Formerly, Managing Director, Cambridge Associates (investment consulting company) (1989-1995). Formerly, Consultant, Bain and Company (management consulting firm) (1987- 1989). Formerly, Senior Equity Analyst, BA Investment Management Company (1983-1985).
Other Directorships. None. |
George J. Gorman
1952 | Chairperson of the
Board and Trustee | Since 2021
(Chairperson) and 2014 (Trustee) | Principal at George J. Gorman LLC (consulting firm). Formerly, Senior Partner at Ernst & Young LLP (a registered public accounting firm) (1974-2009).
Other Directorships. None. |
Eaton Vance
Government Opportunities Fund
October 31, 2022
Management and Organization — continued
| Name and Year of Birth | Trust
Position(s) | Length of Service | Principal Occupation(s) and Other Directorships
During Past Five Years and Other Relevant Experience |
| Noninterested Trustees (continued) |
Valerie A. Mosley
1960 | Trustee | Since 2014 | Chairwoman and Chief Executive Officer of Valmo Ventures (a consulting and investment firm). Founder of Upward Wealth, Inc., dba BrightUp, a fintech platform. Formerly, Partner and Senior Vice President, Portfolio Manager and Investment Strategist at Wellington Management Company, LLP (investment management firm) (1992-2012). Formerly, Chief Investment Officer, PG Corbin Asset Management (1990-1992). Formerly worked in institutional corporate bond sales at Kidder Peabody (1986-1990).
Other Directorships. Director of DraftKings, Inc. (digital sports entertainment and gaming company) (since September 2020). Director of Envestnet, Inc. (provider of intelligent systems for wealth management and financial wellness) (since 2018). Formerly, Director of Dynex Capital, Inc. (mortgage REIT) (2013-2020) and Director of Groupon, Inc. (e-commerce provider) (2020-2022). |
Keith Quinton
1958 | Trustee | Since 2018 | Private investor, researcher and lecturer. Formerly, Independent Investment Committee Member at New Hampshire Retirement System (2017-2021). Formerly, Portfolio Manager and Senior Quantitative Analyst at Fidelity Investments (investment management firm) (2001-2014).
Other Directorships. Formerly, Director (2016-2021) and Chairman (2019-2021) of New Hampshire Municipal Bond Bank. |
Marcus L. Smith
1966 | Trustee | Since 2018 | Private investor and independent corporate director. Formerly, Chief Investment Officer, Canada (2012-2017), Chief Investment Officer, Asia (2010-2012), Director of Asian Research (2004-2010) and portfolio manager (2001-2017) at MFS Investment Management (investment management firm).
Other Directorships. Director of First Industrial Realty Trust, Inc. (an industrial REIT) (since 2021). Director of MSCI Inc. (global provider of investment decision support tools) (since 2017). Formerly, Director of DCT Industrial Trust Inc. (logistics real estate company) (2017-2018). |
Susan J. Sutherland
1957 | Trustee | Since 2015 | Private investor. Director of Ascot Group Limited and certain of its subsidiaries (insurance and reinsurance) (since 2017). Formerly, Director of Hagerty Holding Corp. (insurance) (2015-2018) and Montpelier Re Holdings Ltd. (insurance and reinsurance) (2013-2015). Formerly, Associate, Counsel and Partner at Skadden, Arps, Slate, Meagher & Flom LLP (law firm) (1982-2013).
Other Directorships. Director of Kairos Acquisition Corp. (insurance/InsurTech acquisition company) (since 2021). |
Scott E. Wennerholm
1959 | Trustee | Since 2015 | Private investor. Formerly, Trustee at Wheelock College (postsecondary institution) (2012-2018). Formerly, Consultant at GF Parish Group (executive recruiting firm) (2016-2017). Formerly, Chief Operating Officer and Executive Vice President at BNY Mellon Asset Management (investment management firm) (2005-2011). Formerly, Chief Operating Officer and Chief Financial Officer at Natixis Global Asset Management (investment management firm) (1997-2004). Formerly, Vice President at Fidelity Investments Institutional Services (investment management firm) (1994-1997).
Other Directorships. None. |
Nancy A. Wiser(1)
1967 | Trustee | Since 2022 | Formerly, Executive Vice President and the Global Head of Operations at Wells Fargo Asset Management (2011-2021).
Other Directorships. None. |
| Name and Year of Birth | Trust
Position(s) | Length of Service | Principal Occupation(s)
During Past Five Years |
| Principal Officers who are not Trustees |
Eric A. Stein
1980 | President | Since 2020 | Vice President and Chief Investment Officer, Fixed Income of EVM and BMR. Prior to November 1, 2020, Mr. Stein was a co-Director of Eaton Vance’s Global Income Investments. Also Vice President of Calvert Research and Management (“CRM”). |
Deidre E. Walsh
1971 | Vice President
and
Chief Legal Officer | Since 2009 | Vice President of EVM and BMR. Also Vice President of CRM. |
James F. Kirchner
1967 | Treasurer | Since 2007 | Vice President of EVM and BMR. Also Vice President of CRM. |
Eaton Vance
Government Opportunities Fund
October 31, 2022
Management and Organization — continued
| Name and Year of Birth | Trust
Position(s) | Length of Service | Principal Occupation(s)
During Past Five Years |
| Principal Officers who are not Trustees (continued) |
Nicholas Di Lorenzo
1987 | Secretary | Since 2022 | Formerly, associate (2012-2021) and counsel (2022) at Dechert LLP. |
Richard F. Froio
1968 | Chief Compliance
Officer | Since 2017 | Vice President of EVM and BMR since 2017. Formerly Deputy Chief Compliance Officer (Adviser/Funds) and Chief Compliance Officer (Distribution) at PIMCO (2012-2017) and Managing Director at BlackRock/Barclays Global Investors (2009-2012). |
(1) Mr. Bowser and Ms. Wiser began serving as Trustees effective April 4, 2022.
The SAI for the Fund includes additional information about the Trustees and officers of the Fund and can be obtained without charge on Eaton Vance’s website at www.eatonvance.com or by calling 1-800-262-1122.
| FACTS | WHAT DOES EATON VANCE DO WITH YOUR
PERSONAL INFORMATION? |
| Why? | Financial companies choose how they share your personal information. Federal law gives consumers the right to limit some but not all sharing. Federal law also requires us to tell you how we collect, share, and protect your personal information. Please read this notice carefully to understand what we do. |
| |
| What? | The types of personal information we collect and share depend on the product or service you have with us. This information can include:■ Social Security number and income
■ investment experience and risk tolerance
■ checking account number and wire transfer instructions |
| |
| How? | All financial companies need to share customers’ personal information to run their everyday business. In the section below, we list the reasons financial companies can share their customers’ personal information; the reasons Eaton Vance chooses to share; and whether you can limit this sharing. |
Reasons we can share your
personal information | Does Eaton Vance
share? | Can you limit
this sharing? |
| For our everyday business purposes — such as to process your transactions, maintain your account(s), respond to court orders and legal investigations, or report to credit bureaus | Yes | No |
| For our marketing purposes — to offer our products and services to you | Yes | No |
| For joint marketing with other financial companies | No | We don’t share |
| For our investment management affiliates’ everyday business purposes — information about your transactions, experiences, and creditworthiness | Yes | Yes |
| For our affiliates’ everyday business purposes — information about your transactions and experiences | Yes | No |
| For our affiliates’ everyday business purposes — information about your creditworthiness | No | We don’t share |
| For our investment management affiliates to market to you | Yes | Yes |
| For our affiliates to market to you | No | We don’t share |
| For nonaffiliates to market to you | No | We don’t share |
To limit our
sharing | Call toll-free 1-800-262-1122 or email: EVPrivacy@eatonvance.comPlease note:If you are a new customer, we can begin sharing your information 30 days from the date we sent this notice. When you are no longer our customer, we continue to share your information as described in this notice. However, you can contact us at any time to limit our sharing. |
| Questions? | Call toll-free 1-800-262-1122 or email: EVPrivacy@eatonvance.com |
| Privacy Notice — continued | April 2021 |
| Who we are |
| Who is providing this notice? | Eaton Vance Management, Eaton Vance Distributors, Inc., Eaton Vance Trust Company, Eaton Vance Management (International) Limited, Eaton Vance Advisers International Ltd., Eaton Vance Global Advisors Limited, Eaton Vance Management’s Real Estate Investment Group, Boston Management and Research, Calvert Research and Management, Eaton Vance and Calvert Fund Families and our investment advisory affiliates (“Eaton Vance”) (see Investment Management Affiliates definition below) |
| What we do |
How does Eaton Vance
protect my personal
information? | To protect your personal information from unauthorized access and use, we use security measures that comply with federal law. These measures include computer safeguards and secured files and buildings. We have policies governing the proper handling of customer information by personnel and requiring third parties that provide support to adhere to appropriate security standards with respect to such information. |
How does Eaton Vance
collect my personal
information? | We collect your personal information, for example, when you■ open an account or make deposits or withdrawals from your account
■ buy securities from us or make a wire transfer
■ give us your contact informationWe also collect your personal information from others, such as credit bureaus, affiliates, or other companies. |
| Why can’t I limit all sharing? | Federal law gives you the right to limit only■ sharing for affiliates’ everyday business purposes — information about your creditworthiness
■ affiliates from using your information to market to you
■ sharing for nonaffiliates to market to youState laws and individual companies may give you additional rights to limit sharing. See below for more on your rights under state law. |
| Definitions |
Investment Management
Affiliates | Eaton Vance Investment Management Affiliates include registered investment advisers, registered broker- dealers, and registered and unregistered funds. Investment Management Affiliates does not include entities associated with Morgan Stanley Wealth Management, such as Morgan Stanley Smith Barney LLC and Morgan Stanley & Co. |
| Affiliates | Companies related by common ownership or control. They can be financial and nonfinancial companies.■ Our affiliates include companies with a Morgan Stanley name and financial companies such as Morgan Stanley Smith Barney LLC and Morgan Stanley & Co. |
| Nonaffiliates | Companies not related by common ownership or control. They can be financial and nonfinancial companies.■ Eaton Vance does not share with nonaffiliates so they can market to you. |
| Joint marketing | A formal agreement between nonaffiliated financial companies that together market financial products or services to you.■ Eaton Vance doesn’t jointly market. |
| Other important information |
| Vermont: Except as permitted by law, we will not share personal information we collect about Vermont residents with Nonaffiliates unless you provide us with your written consent to share such information.California: Except as permitted by law, we will not share personal information we collect about California residents with Nonaffiliates and we will limit sharing such personal information with our Affiliates to comply with California privacy laws that apply to us. |
Delivery of Shareholder Documents. The Securities and Exchange Commission (SEC) permits funds to deliver only one copy of shareholder documents, including prospectuses, proxy statements and shareholder reports, to fund investors with multiple accounts at the same residential or post office box address. This practice is often called “householding” and it helps eliminate duplicate mailings to shareholders. Eaton Vance, or your financial intermediary, may household the mailing of your documents indefinitely unless you instruct Eaton Vance, or your financial intermediary, otherwise. If you would prefer that your Eaton Vance documents not be householded, please contact Eaton Vance at 1-800-262-1122, or contact your financial intermediary. Your instructions that householding not apply to delivery of your Eaton Vance documents will typically be effective within 30 days of receipt by Eaton Vance or your financial intermediary.
Portfolio Holdings. Each Eaton Vance Fund and its underlying Portfolio(s) (if applicable) files a schedule of portfolio holdings on Part F to Form N-PORT with the SEC. Certain information filed on Form N-PORT may be viewed on the Eaton Vance website at www.eatonvance.com, by calling Eaton Vance at 1-800-262-1122 or in the EDGAR database on the SEC’s website at www.sec.gov.
Proxy Voting. From time to time, funds are required to vote proxies related to the securities held by the funds. The Eaton Vance Funds or their underlying Portfolios (if applicable) vote proxies according to a set of policies and procedures approved by the Funds’ and Portfolios’ Boards. You may obtain a description of these policies and procedures and information on how the Funds or Portfolios voted proxies relating to portfolio securities during the most recent 12-month period ended June 30, without charge, upon request, by calling 1-800-262-1122 and by accessing the SEC’s website at www.sec.gov.
This Page Intentionally Left Blank
This Page Intentionally Left Blank
Investment Adviser
Boston Management and Research
Two International Place
Boston, MA 02110
Administrator
Eaton Vance Management
Two International Place
Boston, MA 02110
Principal Underwriter*
Eaton Vance Distributors, Inc.
Two International Place
Boston, MA 02110
(617) 482-8260
Custodian
State Street Bank and Trust Company
State Street Financial Center, One Lincoln Street
Boston, MA 02111
Transfer Agent
BNY Mellon Investment Servicing (US) Inc.
Attn: Eaton Vance Funds
P.O. Box 9653
Providence, RI 02940-9653
(800) 262-1122
Independent Registered Public Accounting Firm
Deloitte & Touche LLP
200 Berkeley Street
Boston, MA 02116-5022
Fund Offices
Two International Place
Boston, MA 02110
* FINRA BrokerCheck. Investors may check the background of their Investment Professional by contacting the Financial Industry Regulatory Authority (FINRA). FINRA BrokerCheck is a free tool to help investors check the professional background of current and former FINRA-registered securities firms and brokers. FINRA BrokerCheck is available by calling 1-800-289-9999 and at www.FINRA.org. The FINRA BrokerCheck brochure describing this program is available to investors at www.FINRA.org.

Eaton Vance
High Income Opportunities Fund
Annual Report
October 31, 2022

Commodity Futures Trading Commission Registration. The Commodity Futures Trading Commission (“CFTC”) has adopted regulations that subject registered investment companies and advisers to regulation by the CFTC if a fund invests more than a prescribed level of its assets in certain CFTC-regulated instruments (including futures, certain options and swap agreements) or markets itself as providing investment exposure to such instruments. The investment adviser has claimed an exclusion from the definition of “commodity pool operator” under the Commodity Exchange Act with respect to its management of the Fund. Accordingly, neither the Fund nor the adviser with respect to the operation of the Fund is subject to CFTC regulation. Because of its management of other strategies, the Fund’s adviser is registered with the CFTC as a commodity pool operator. The adviser is also registered as a commodity trading advisor.
Fund shares are not insured by the FDIC and are not deposits or other obligations of, or guaranteed by, any depository institution. Shares are subject to investment risks, including possible loss of principal invested.
This report must be preceded or accompanied by a current summary prospectus or prospectus. Before investing, investors should consider carefully the investment objective, risks, and charges and expenses of a mutual fund. This and other important information is contained in the summary prospectus and prospectus, which can be obtained from a financial intermediary. Prospective investors should read the prospectus carefully before investing. For further information, please call 1-800-262-1122.
Annual Report October 31, 2022
Eaton Vance
High Income Opportunities Fund
Eaton Vance
High Income Opportunities Fund
October 31, 2022
Management’s Discussion of Fund Performance†
Economic and Market Conditions
For the 12-month period ended October 31, 2022, the U.S. high yield bond market recorded negative returns. Two key events -- more restrictive monetary policies by central banks worldwide in response to the highest inflation readings in years, and the first major European war in decades -- prompted a sharp rise in stock volatility and a widespread sell-off of risk assets during the period.
The U.S. high yield bond market began the period with modest returns even as market volatility surged among risk assets. A dizzying combination of a rapidly spreading Omicron variant of COVID-19, central banks’ evolving monetary policies, and concerns over a potential economic slowdown in China, unsettled investors during the period.
The high yield market turned negative during the first quarter of calendar 2022, following money-tightening messages from the U.S. Federal Reserve (the Fed). Elevated tensions over the buildup of Russian troops along the Ukrainian border and the economic impact from the spread of Omicron further weighed on risk sentiment. U.S. Treasury yields leapt, credit spreads generally widened, and fixed-rate products were sold off during the period.
For the most part, volatility increased and investor aversion to risk heightened later in the period. The Fed’s focus on fighting inflation prompted a spike in U.S. Treasury yields and was accompanied by a notable weakening in oil prices. The ongoing war in Ukraine and the precarious energy situation in Western Europe further rattled investors. In the last month of the period, however, expectations that the Fed might moderate its pace of interest rate hikes produced a strong rally in high yield markets.
For the period as a whole, the ICE BofA U.S. High Yield Index returned -11.45%, and the Bloomberg U.S. Aggregate Bond Index returned -15.68%.
By period-end, high yield issuance totaled $139 billion, down from $500 billion during the prior 12-month period. During the same time, the trailing 12-month par-weighted default rate rose to 0.84%, from 0.36% at the end of the prior 12-month period.
Fund Performance
For the 12-month period ended October 31, 2022, Eaton Vance High Income Opportunities Fund (the Fund) returned -8.59% for Class A shares at net asset value (NAV), outperforming its benchmark, the ICE BofA U.S. High Yield Index (the Index), which returned -11.45%.
The Fund’s security selections contributed to performance relative to the Index during the period. Selections in gaming, health care, energy, and telecommunications especially added to relative returns. Allocations by industry also contributed, notably an overweight exposure to gaming. The Fund’s elevated allocation to cash further benefited returns. The Fund’s security selections in consumer products and automotive & auto parts detracted from performance relative to the Index.
Allocations and security selections by credit-rating quality contributed to relative returns. An out-of-Index allocation to nonrated securities was especially beneficial. Selections within the single-B and CCC segments had particularly strong positive impacts. Selections in the BBB-rated segment, however, detracted from returns relative to the Index during the period.
Credit selections by duration also had a positive impact on relative performance. Credit selections among securities with durations of less than two years stood out during the period. Selections among bonds with durations between 2-5 years and 5-10 years also contributed to relative performance, as did Fund allocations by duration. An overweight exposure to short duration securities was particularly beneficial. However, an overweight exposure to bonds with durations between 5-10 years and an underweight exposure to bonds with durations between 2-5 years detracted from returns relative to the Index during the period.
See Endnotes and Additional Disclosures in this report.
Past performance is no guarantee of future results. Returns are historical and are calculated by determining the percentage change in net asset value (NAV) or offering price (as applicable) with all distributions reinvested. Furthermore, returns do not reflect the deduction of taxes that shareholders may have to pay on Fund distributions or upon the redemption of Fund shares. Investment return and principal value will fluctuate so that shares, when redeemed, may be worth more or less than their original cost. Performance for periods less than or equal to one year is cumulative. Performance is for the stated time period only; due to market volatility, current Fund performance may be lower or higher than the quoted return. For performance as of the most recent month-end, please refer to eatonvance.com.
Eaton Vance
High Income Opportunities Fund
October 31, 2022
Performance
Portfolio Manager(s) Kelley Gerrity, Stephen C. Concannon, CFA and Jeffrey D. Mueller
| | | | | | | | | | | | | | | | | | | | |
| % Average Annual Total Returns1,2 | | Class
Inception Date | | | Performance
Inception Date | | | One Year | | | Five Years | | | Ten Years | |
| | | | | |
Class A at NAV | | | 03/11/2004 | | | | 08/19/1986 | | | | (8.59 | )% | | | 2.36 | % | | | 4.34 | % |
Class A with 3.25% Maximum Sales Charge | | | — | | | | — | | | | (11.53 | ) | | | 1.70 | | | | 3.99 | |
Class C at NAV | | | 06/08/1994 | | | | 08/19/1986 | | | | (9.31 | ) | | | 1.57 | | | | 3.71 | |
Class C with 1% Maximum Deferred Sales Charge | | | — | | | | — | | | | (10.18 | ) | | | 1.57 | | | | 3.71 | |
Class I at NAV | | | 10/01/2009 | | | | 08/19/1986 | | | | (8.36 | ) | | | 2.56 | | | | 4.57 | |
|
································································································································································································································································································································ | |
| | | | | |
ICE BofA U.S. High Yield Index | | | — | | | | — | | | | (11.45 | )% | | | 1.90 | % | | | 4.07 | % |
ICE BofA U.S. High Yield Constrained Index | | | — | | | | — | | | | (11.45 | ) | | | 1.88 | | | | 4.06 | |
| | | | | |
| % Total Annual Operating Expense Ratios3 | | | | | | | | Class A | | | Class C | | | Class I | |
| | | | | |
| | | | | | | | | | | 0.90 | % | | | 1.65 | % | | | 0.65 | % |
Growth of $10,000
This graph shows the change in value of a hypothetical investment of $10,000 in Class A of the Fund for the period indicated. For comparison, the same investment is shown in the indicated index.
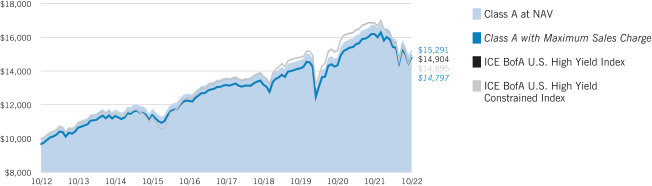
| | | | | | | | | | | | | | | | |
| Growth of Investment | | Amount Invested | | | Period Beginning | | | At NAV | | �� | With Maximum Sales Charge | |
| | | | |
Class C | | | $10,000 | | | | 10/31/2012 | | | | $14,392 | | | | N.A. | |
Class I, at minimum investment | | | $1,000,000 | | | | 10/31/2012 | | | | $1,563,725 | | | | N.A. | |
See Endnotes and Additional Disclosures in this report.
Past performance is no guarantee of future results. Returns are historical and are calculated by determining the percentage change in net asset value (NAV) or offering price (as applicable) with all distributions reinvested. Furthermore, returns do not reflect the deduction of taxes that shareholders may have to pay on Fund distributions or upon the redemption of Fund shares. Investment return and principal value will fluctuate so that shares, when redeemed, may be worth more or less than their original cost. Performance for periods less than or equal to one year is cumulative. Performance is for the stated time period only; due to market volatility, current Fund performance may be lower or higher than the quoted return. For performance as of the most recent month-end, please refer to eatonvance.com.
Eaton Vance
High Income Opportunities Fund
October 31, 2022
Fund Profile
Credit Quality (% of total investments)1
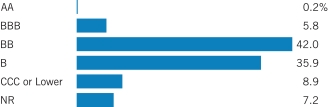
Footnotes:
Fund invests in an affiliated investment company (Portfolio) with the same objective(s) and policies as the Fund. References to investments are to the Portfolio’s holdings.
| 1 | Ratings are based on Moody’s Investors Service, Inc. (“Moody’s”), S&P Global Ratings (“S&P”) or Fitch Ratings (“Fitch”), as applicable. For purposes of ratings restrictions, the average of Moody’s, S&P and Fitch is used. Ratings, which are subject to change, apply to the creditworthiness of the issuers of the underlying securities and not to the Fund or its shares. Credit ratings measure the quality of a bond based on the issuer’s creditworthiness, with ratings ranging from AAA, being the highest, to D, being the lowest based on S&P’s measures. Ratings of BBB or higher by S&P or Fitch (Baa or higher by Moody’s) are considered to be investment-grade quality. Credit ratings are based largely on the ratings agency’s analysis at the time of rating. The rating assigned to any particular security is not necessarily a reflection of the issuer’s current financial condition and does not necessarily reflect its assessment of the volatility of a security’s market value or of the liquidity of an investment in the security. Holdings designated as “Not Rated” (if any) are not rated by the national ratings agencies stated above. |
Eaton Vance
High Income Opportunities Fund
October 31, 2022
| † | The views expressed in this report are those of the portfolio manager(s) and are current only through the date stated at the top of this page. These views are subject to change at any time based upon market or other conditions, and Eaton Vance and the Fund(s) disclaim any responsibility to update such views. These views may not be relied upon as investment advice and, because investment decisions are based on many factors, may not be relied upon as an indication of trading intent on behalf of any Eaton Vance fund. This commentary may contain statements that are not historical facts, referred to as “forward-looking statements.” The Fund’s actual future results may differ significantly from those stated in any forward-looking statement, depending on factors such as changes in securities or financial markets or general economic conditions, the volume of sales and purchases of Fund shares, the continuation of investment advisory, administrative and service contracts, and other risks discussed from time to time in the Fund’s filings with the Securities and Exchange Commission. |
| 1 | ICE BofA U.S. High Yield Index is an unmanaged index of below-investment grade U.S. corporate bonds. ICE BofA U.S. High Yield Constrained Index is an unmanaged index of below-investment grade U.S. corporate bonds, with issuer exposure capped at 2%. ICE® BofA® indices are not for redistribution or other uses; provided “as is”, without warranties, and with no liability. Eaton Vance has prepared this report and ICE Data Indices, LLC does not endorse it, or guarantee, review, or endorse Eaton Vance’s products. BofA® is a licensed registered trademark of Bank of America Corporation in the United States and other countries. Unless otherwise stated, index returns do not reflect the effect of any applicable sales charges, commissions, expenses, taxes or leverage, as applicable. It is not possible to invest directly in an index. |
| 2 | Total Returns at NAV do not include applicable sales charges. If sales charges were deducted, the returns would be lower. Total Returns shown with maximum sales charge reflect the stated maximum sales charge. Unless otherwise stated, performance does not reflect the deduction of taxes on Fund distributions or redemptions of Fund shares. |
Effective November 5, 2020, Class C shares automatically convert to Class A shares eight years after purchase. The average annual total returns listed for Class C reflect conversion to Class A shares after eight years. Prior to November 5, 2020, Class C shares automatically converted to Class A shares ten years after purchase.
| 3 | Source: Fund prospectus. The expense ratios for the current reporting period can be found in the Financial Highlights section of this report. |
Performance reflects expenses waived and/or reimbursed, if applicable. Without such waivers and/or reimbursements, performance would have been lower.
Fund profile subject to change due to active management.
Additional Information
Bloomberg U.S. Aggregate Bond Index is an unmanaged index of domestic investment-grade bonds, including corporate, government and mortgage-backed securities.
Duration is a measure of the expected change in price of a bond — in percentage terms — given a one percent change in interest rates, all else being constant. Securities with lower durations tend to be less sensitive to interest rate changes.
Risk asset is a term broadly used to describe any asset that is not a high-quality government bond.
Eaton Vance
High Income Opportunities Fund
October 31, 2022
Fund Expenses
Example
As a Fund shareholder, you incur two types of costs: (1) transaction costs, including sales charges (loads) on purchases and redemption fees (if applicable); and (2) ongoing costs, including management fees; distribution and/or service fees; and other Fund expenses. This Example is intended to help you understand your ongoing costs (in dollars) of Fund investing and to compare these costs with the ongoing costs of investing in other mutual funds. The Example is based on an investment of $1,000 invested at the beginning of the period and held for the entire period (May 1, 2022 to October 31, 2022).
Actual Expenses
The first section of the table below provides information about actual account values and actual expenses. You may use the information in this section, together with the amount you invested, to estimate the expenses that you paid over the period. Simply divide your account value by $1,000 (for example, an $8,600 account value divided by $1,000 = 8.6), then multiply the result by the number in the first section under the heading entitled “Expenses Paid During Period” to estimate the expenses you paid on your account during this period.
Hypothetical Example for Comparison Purposes
The second section of the table below provides information about hypothetical account values and hypothetical expenses based on the actual Fund expense ratio and an assumed rate of return of 5% per year (before expenses), which is not the actual Fund return. The hypothetical account values and expenses may not be used to estimate the actual ending account balance or expenses you paid for the period. You may use this information to compare the ongoing costs of investing in your Fund and other funds. To do so, compare this 5% hypothetical example with the 5% hypothetical examples that appear in the shareholder reports of the other funds.
Please note that the expenses shown in the table are meant to highlight your ongoing costs only and do not reflect any transactional costs, such as sales charges (loads) or redemption fees (if applicable). Therefore, the second section of the table is useful in comparing ongoing costs only, and will not help you determine the relative total costs of owning different funds. In addition, if these transactional costs were included, your costs would be higher.
| | | | | | | | | | | | | | | | |
| | | Beginning
Account Value
(5/1/22) | | | Ending
Account Value
(10/31/22) | | | Expenses Paid
During Period*
(5/1/22 – 10/31/22) | | | Annualized
Expense
Ratio | |
| | | | |
Actual | | | | | | | | | | | | | | | | |
Class A | | $ | 1,000.00 | | | $ | 959.60 | | | $ | 4.59 | | | | 0.93 | % |
Class C | | $ | 1,000.00 | | | $ | 955.60 | | | $ | 8.28 | | | | 1.68 | % |
Class I | | $ | 1,000.00 | | | $ | 960.90 | | | $ | 3.36 | | | | 0.68 | % |
| | | | | |
Hypothetical | | | | | | | | | | | | | | | | |
(5% return per year before expenses) | | | | | | | | | | | | | | | | |
Class A | | $ | 1,000.00 | | | $ | 1,020.52 | | | $ | 4.74 | | | | 0.93 | % |
Class C | | $ | 1,000.00 | | | $ | 1,016.74 | | | $ | 8.54 | | | | 1.68 | % |
Class I | | $ | 1,000.00 | | | $ | 1,021.78 | | | $ | 3.47 | | | | 0.68 | % |
| * | Expenses are equal to the Fund’s annualized expense ratio for the indicated Class, multiplied by the average account value over the period, multiplied by 184/365 (to reflect the one-half year period). The Example assumes that the $1,000 was invested at the net asset value per share determined at the close of business on April 30, 2022. The Example reflects the expenses of both the Fund and the Portfolio. |
Eaton Vance
High Income Opportunities Fund
October 31, 2022
Statement of Assets and Liabilities
| | | | |
| Assets | | October 31, 2022 | |
| |
Investment in High Income Opportunities Portfolio, at value (identified cost $722,510,703) | | $ | 684,663,719 | |
| |
Receivable for Fund shares sold | | | 1,417,878 | |
| |
Total assets | | $ | 686,081,597 | |
|
| Liabilities | |
| |
Payable for Fund shares redeemed | | $ | 1,922,635 | |
| |
Distributions payable | | | 309,237 | |
| |
Payable to affiliates: | | | | |
| |
Distribution and service fees | | | 59,511 | |
| |
Trustees’ fees | | | 42 | |
| |
Accrued expenses | | | 237,741 | |
| |
Total liabilities | | $ | 2,529,166 | |
| |
Net Assets | | $ | 683,552,431 | |
|
| Sources of Net Assets | |
| |
Paid-in capital | | $ | 747,051,156 | |
| |
Accumulated loss | | | (63,498,725 | ) |
| |
Net Assets | | $ | 683,552,431 | |
| |
| Class A Shares | | | | |
| |
Net Assets | | $ | 188,764,561 | |
| |
Shares Outstanding | | | 48,186,839 | |
| |
Net Asset Value and Redemption Price Per Share | | | | |
| |
(net assets ÷ shares of beneficial interest outstanding) | | $ | 3.92 | |
| |
Maximum Offering Price Per Share | | | | |
| |
(100 ÷ 96.75 of net asset value per share) | | $ | 4.05 | |
|
| Class C Shares | |
| |
Net Assets | | $ | 23,723,601 | |
| |
Shares Outstanding | | | 6,049,878 | |
| |
Net Asset Value and Offering Price Per Share* | | | | |
| |
(net assets ÷ shares of beneficial interest outstanding) | | $ | 3.92 | |
|
| Class I Shares | |
| |
Net Assets | | $ | 471,064,269 | |
| |
Shares Outstanding | | | 120,104,163 | |
| |
Net Asset Value, Offering Price and Redemption Price Per Share | | | | |
| |
(net assets ÷ shares of beneficial interest outstanding) | | $ | 3.92 | |
On sales of $100,000 or more, the offering price of Class A shares is reduced.
| * | Redemption price per share is equal to the net asset value less any applicable contingent deferred sales charge. |
| | | | |
| | 7 | | See Notes to Financial Statements. |
Eaton Vance
High Income Opportunities Fund
October 31, 2022
Statement of Operations
| | | | |
| Investment Income | | Year Ended October 31, 2022 | |
| |
Dividend income allocated from Portfolio (net of foreign taxes withheld of $5,257) | | $ | 808,192 | |
| |
Interest and other income allocated from Portfolio | | | 36,129,976 | |
| |
Expenses allocated from Portfolio | | | (3,406,270 | ) |
| |
Total investment income from Portfolio | | $ | 33,531,898 | |
| |
| Expenses | | | | |
| |
Distribution and service fees: | | | | |
| |
Class A | | $ | 519,790 | |
| |
Class C | | | 278,675 | |
| |
Trustees’ fees and expenses | | | 500 | |
| |
Custodian fee | | | 46,838 | |
| |
Transfer and dividend disbursing agent fees | | | 797,650 | |
| |
Legal and accounting services | | | 49,729 | |
| |
Printing and postage | | | 180,016 | |
| |
Registration fees | | | 83,003 | |
| |
Miscellaneous | | | 14,986 | |
| |
Total expenses | | $ | 1,971,187 | |
| |
Net investment income | | $ | 31,560,711 | |
| |
| Realized and Unrealized Gain (Loss) from Portfolio | | | | |
| |
Net realized gain (loss): | | | | |
| |
Investment transactions | | $ | (4,773,108 | ) |
| |
Swap contracts | | | (63,929 | ) |
| |
Foreign currency transactions | | | (13,557 | ) |
| |
Forward foreign currency exchange contracts | | | 1,640,701 | |
| |
Net realized loss | | $ | (3,209,893 | ) |
| |
Change in unrealized appreciation (depreciation): | | | | |
| |
Investments | | $ | (91,257,779 | ) |
| |
Swap contracts | | | (3,629 | ) |
| |
Foreign currency | | | (3,536 | ) |
| |
Forward foreign currency exchange contracts | | | 95,581 | |
| |
Net change in unrealized appreciation (depreciation) | | $ | (91,169,363 | ) |
| |
Net realized and unrealized loss | | $ | (94,379,256 | ) |
| |
Net decrease in net assets from operations | | $ | (62,818,545 | ) |
| | | | |
| | 8 | | See Notes to Financial Statements. |
Eaton Vance
High Income Opportunities Fund
October 31, 2022
Statements of Changes in Net Assets
| | | | | | | | |
| | | Year Ended October 31, | |
| Increase (Decrease) in Net Assets | | 2022 | | | 2021 | |
| | |
From operations: | | | | | | | | |
| | |
Net investment income | | $ | 31,560,711 | | | $ | 33,925,337 | |
| | |
Net realized gain (loss) | | | (3,209,893 | ) | | | 22,616,290 | |
| | |
Net change in unrealized appreciation (depreciation) | | | (91,169,363 | ) | | | 38,511,802 | |
| | |
Net increase (decrease) in net assets from operations | | $ | (62,818,545 | ) | | $ | 95,053,429 | |
| | |
Distributions to shareholders: | | | | | | | | |
| | |
Class A | | $ | (10,516,890 | ) | | $ | (9,429,952 | ) |
| | |
Class C | | | (1,194,748 | ) | | | (1,155,002 | ) |
| | |
Class I | | | (24,484,753 | ) | | | (20,579,347 | ) |
| | |
Total distributions to shareholders | | $ | (36,196,391 | ) | | $ | (31,164,301 | ) |
| | |
Tax return of capital to shareholders: | | | | | | | | |
| | |
Class A | | $ | (339,864 | ) | | $ | (2,438,488 | ) |
| | |
Class C | | | (38,238 | ) | | | (292,287 | ) |
| | |
Class I | | | (804,758 | ) | | | (5,147,283 | ) |
| | |
Total tax return of capital to shareholders | | $ | (1,182,860 | ) | | $ | (7,878,058 | ) |
| | |
Transactions in shares of beneficial interest: | | | | | | | | |
| | |
Class A | | $ | (15,056,064 | ) | | $ | (10,066,558 | ) |
| | |
Class C | | | (5,218,614 | ) | | | (7,254,004 | ) |
| | |
Class I | | | 60,820,323 | | | | (94,592,628 | ) |
| | |
Net increase (decrease) in net assets from Fund share transactions | | $ | 40,545,645 | | | $ | (111,913,190 | ) |
| | |
Net decrease in net assets | | $ | (59,652,151 | ) | | $ | (55,902,120 | ) |
|
| Net Assets | |
| | |
At beginning of year | | $ | 743,204,582 | | | $ | 799,106,702 | |
| | |
At end of year | | $ | 683,552,431 | | | $ | 743,204,582 | |
| | | | |
| | 9 | | See Notes to Financial Statements. |
Eaton Vance
High Income Opportunities Fund
October 31, 2022
Financial Highlights
| | | | | | | | | | | | | | | | | | | | |
| | | Class A | |
| | | Year Ended October 31, | |
| | | 2022 | | | 2021 | | | 2020 | | | 2019 | | | 2018 | |
| | | | | |
Net asset value — Beginning of year | | $ | 4.520 | | | $ | 4.210 | | | $ | 4.400 | | | $ | 4.330 | | | $ | 4.560 | |
| | | | | |
| Income (Loss) From Operations | | | | | | | | | | | | | | | | | | | | |
| | | | | |
Net investment income(1) | | $ | 0.185 | | | $ | 0.196 | | | $ | 0.206 | | | $ | 0.227 | | | $ | 0.233 | |
| | | | | |
Net realized and unrealized gain (loss) | | | (0.565 | ) | | | 0.340 | | | | (0.157 | ) | | | 0.081 | | | | (0.225 | ) |
| | | | | |
Total income (loss) from operations | | $ | (0.380 | ) | | $ | 0.536 | | | $ | 0.049 | | | $ | 0.308 | | | $ | 0.008 | |
| | | | | |
| Less Distributions | | | | | | | | | | | | | | | | | | | | |
| | | | | |
From net investment income | | $ | (0.213 | ) | | $ | (0.179 | ) | | $ | (0.207 | ) | | $ | (0.238 | ) | | $ | (0.238 | ) |
| | | | | |
Tax return of capital | | | (0.007 | ) | | | (0.047 | ) | | | (0.032 | ) | | | — | | | | — | |
| | | | | |
Total distributions | | $ | (0.220 | ) | | $ | (0.226 | ) | | $ | (0.239 | ) | | $ | (0.238 | ) | | $ | (0.238 | ) |
| | | | | |
Net asset value — End of year | | $ | 3.920 | | | $ | 4.520 | | | $ | 4.210 | | | $ | 4.400 | | | $ | 4.330 | |
| | | | | |
Total Return(2) | | | (8.59 | )% | | | 12.93 | % | | | 1.26 | % | | | 7.31 | % | | | 0.17 | % |
| | | | | |
| Ratios/Supplemental Data | | | | | | | | | | | | | | | | | | | | |
| | | | | |
Net assets, end of year (000’s omitted) | | $ | 188,765 | | | $ | 233,330 | | | $ | 226,927 | | | $ | 269,795 | | | $ | 287,457 | |
| | | | | |
Ratios (as a percentage of average daily net assets):(3) | | | | | | | | | | | | | | | | | | | | |
| | | | | |
Expenses | | | 0.91 | %(4) | | | 0.90 | % | | | 0.93 | % | | | 0.91 | % | | | 0.87 | % |
| | | | | |
Net investment income | | | 4.39 | % | | | 4.39 | % | | | 4.87 | % | | | 5.22 | % | | | 5.24 | % |
| | | | | |
Portfolio Turnover of the Portfolio | | | 19 | % | | | 64 | % | | | 67 | % | | | 32 | % | | | 39 | % |
| (1) | Computed using average shares outstanding. |
| (2) | Returns are historical and are calculated by determining the percentage change in net asset value with all distributions reinvested and do not reflect the effect of sales charges. |
| (3) | Includes the Fund’s share of the Portfolio’s allocated expenses. |
| (4) | Includes a reduction by the investment adviser of a portion of the Portfolio’s adviser fee due to the Portfolio’s investment in the Liquidity Fund (equal to less than 0.005% of average daily net assets for the year ended October 31, 2022). |
| | | | |
| | 10 | | See Notes to Financial Statements. |
Eaton Vance
High Income Opportunities Fund
October 31, 2022
Financial Highlights — continued
| | | | | | | | | | | | | | | | | | | | |
| | | Class C | |
| | | Year Ended October 31, | |
| | | 2022 | | | 2021 | | | 2020 | | | 2019 | | | 2018 | |
| | | | | |
Net asset value — Beginning of year | | $ | 4.520 | | | $ | 4.210 | | | $ | 4.400 | | | $ | 4.330 | | | $ | 4.560 | |
| | | | | |
| Income (Loss) From Operations | | | | | | | | | | | | | | | | | | | | |
| | | | | |
Net investment income(1) | | $ | 0.153 | | | $ | 0.162 | | | $ | 0.174 | | | $ | 0.195 | | | $ | 0.200 | |
| | | | | |
Net realized and unrealized gain (loss) | | | (0.566 | ) | | | 0.341 | | | | (0.159 | ) | | | 0.080 | | | | (0.225 | ) |
| | | | | |
Total income (loss) from operations | | $ | (0.413 | ) | | $ | 0.503 | | | $ | 0.015 | | | $ | 0.275 | | | $ | (0.025 | ) |
| | | | | |
| Less Distributions | | | | | | | | | | | | | | | | | | | | |
| | | | | |
From net investment income | | $ | (0.181 | ) | | $ | (0.153 | ) | | $ | (0.178 | ) | | $ | (0.205 | ) | | $ | (0.205 | ) |
| | | | | |
Tax return of capital | | | (0.006 | ) | | | (0.040 | ) | | | (0.027 | ) | | | — | | | | — | |
| | | | | |
Total distributions | | $ | (0.187 | ) | | $ | (0.193 | ) | | $ | (0.205 | ) | | $ | (0.205 | ) | | $ | (0.205 | ) |
| | | | | |
Net asset value — End of year | | $ | 3.920 | | | $ | 4.520 | | | $ | 4.210 | | | $ | 4.400 | | | $ | 4.330 | |
| | | | | |
Total Return(2) | | | (9.31 | )% | | | 12.09 | % | | | 0.45 | % | | | 6.49 | % | | | (0.58 | )% |
| | | | | |
| Ratios/Supplemental Data | | | | | | | | | | | | | | | | | | | | |
| | | | | |
Net assets, end of year (000’s omitted) | | $ | 23,724 | | | $ | 32,926 | | | $ | 37,680 | | | $ | 55,246 | | | $ | 95,312 | |
| | | | | |
Ratios (as a percentage of average daily net assets):(3) | | | | | | | | | | | | | | | | | | | | |
| | | | | |
Expenses | | | 1.66 | %(4) | | | 1.65 | % | | | 1.68 | % | | | 1.67 | % | | | 1.63 | % |
| | | | | |
Net investment income | | | 3.62 | % | | | 3.64 | % | | | 4.12 | % | | | 4.50 | % | | | 4.49 | % |
| | | | | |
Portfolio Turnover of the Portfolio | | | 19 | % | | | 64 | % | | | 67 | % | | | 32 | % | | | 39 | % |
| (1) | Computed using average shares outstanding. |
| (2) | Returns are historical and are calculated by determining the percentage change in net asset value with all distributions reinvested and do not reflect the effect of sales charges. |
| (3) | Includes the Fund’s share of the Portfolio’s allocated expenses. |
| (4) | Includes a reduction by the investment adviser of a portion of the Portfolio’s adviser fee due to the Portfolio’s investment in the Liquidity Fund (equal to less than 0.005% of average daily net assets for the year ended October 31, 2022). |
| | | | |
| | 11 | | See Notes to Financial Statements. |
Eaton Vance
High Income Opportunities Fund
October 31, 2022
Financial Highlights — continued
| | | | | | | | | | | | | | | | | | | | |
| | | Class I | |
| | | Year Ended October 31, | |
| | | 2022 | | | 2021 | | | 2020 | | | 2019 | | | 2018 | |
| | | | | |
Net asset value — Beginning of year | | $ | 4.520 | | | $ | 4.220 | | | $ | 4.410 | | | $ | 4.340 | | | $ | 4.570 | |
| | | | | |
| Income (Loss) From Operations | | | | | | | | | | | | | | | | | | | | |
| | | | | |
Net investment income(1) | | $ | 0.196 | | | $ | 0.208 | | | $ | 0.216 | | | $ | 0.238 | | | $ | 0.245 | |
| | | | | |
Net realized and unrealized gain (loss) | | | (0.565 | ) | | | 0.329 | | | | (0.156 | ) | | | 0.081 | | | | (0.226 | ) |
| | | | | |
Total income (loss) from operations | | $ | (0.369 | ) | | $ | 0.537 | | | $ | 0.060 | | | $ | 0.319 | | | $ | 0.019 | |
| | | | | |
| Less Distributions | | | | | | | | | | | | | | | | | | | | |
| | | | | |
From net investment income | | $ | (0.224 | ) | | $ | (0.188 | ) | | $ | (0.217 | ) | | $ | (0.249 | ) | | $ | (0.249 | ) |
| | | | | |
Tax return of capital | | | (0.007 | ) | | | (0.049 | ) | | | (0.033 | ) | | | — | | | | — | |
| | | | | |
Total distributions | | $ | (0.231 | ) | | $ | (0.237 | ) | | $ | (0.250 | ) | | $ | (0.249 | ) | | $ | (0.249 | ) |
| | | | | |
Net asset value — End of year | | $ | 3.920 | | | $ | 4.520 | | | $ | 4.220 | | | $ | 4.410 | | | $ | 4.340 | |
| | | | | |
Total Return(2) | | | (8.36 | )% | | | 12.93 | % | | | 1.52 | % | | | 7.57 | % | | | 0.42 | % |
| | | | | |
| Ratios/Supplemental Data | | | | | | | | | | | | | | | | | | | | |
| | | | | |
Net assets, end of year (000’s omitted) | | $ | 471,064 | | | $ | 476,949 | | | $ | 534,500 | | | $ | 549,842 | | | $ | 614,306 | |
| | | | | |
Ratios (as a percentage of average daily net assets):(3) | | | | | | | | | | | | | | | | | | | | |
| | | | | |
Expenses | | | 0.66 | %(4) | | | 0.65 | % | | | 0.68 | % | | | 0.66 | % | | | 0.62 | % |
| | | | | |
Net investment income | | | 4.65 | % | | | 4.65 | % | | | 5.10 | % | | | 5.47 | % | | | 5.49 | % |
| | | | | |
Portfolio Turnover of the Portfolio | | | 19 | % | | | 64 | % | | | 67 | % | | | 32 | % | | | 39 | % |
| (1) | Computed using average shares outstanding. |
| (2) | Returns are historical and are calculated by determining the percentage change in net asset value with all distributions reinvested. |
| (3) | Includes the Fund’s share of the Portfolio’s allocated expenses. |
| (4) | Includes a reduction by the investment adviser of a portion of the Portfolio’s adviser fee due to the Portfolio’s investment in the Liquidity Fund (equal to less than 0.005% of average daily net assets for the year ended October 31, 2022). |
| | | | |
| | 12 | | See Notes to Financial Statements. |
Eaton Vance
High Income Opportunities Fund
October 31, 2022
Notes to Financial Statements
1 Significant Accounting Policies
Eaton Vance High Income Opportunities Fund (the Fund) is a diversified series of Eaton Vance Mutual Funds Trust (the Trust). The Trust is a Massachusetts business trust registered under the Investment Company Act of 1940, as amended (the 1940 Act), as an open-end management investment company. The Fund offers three classes of shares. Class A shares are generally sold subject to a sales charge imposed at time of purchase. Class C shares are sold at net asset value and are generally subject to a contingent deferred sales charge (see Note 5). Effective November 5, 2020, Class C shares automatically convert to Class A shares eight years after their purchase as described in the Fund’s prospectus. Class I shares are sold at net asset value and are not subject to a sales charge. Each class represents a pro-rata interest in the Fund, but votes separately on class-specific matters and (as noted below) is subject to different expenses. Realized and unrealized gains and losses are allocated daily to each class of shares based on the relative net assets of each class to the total net assets of the Fund. Net investment income, other than class-specific expenses, is allocated daily to each class of shares based upon the ratio of the value of each class’s paid shares to the total value of all paid shares. Each class of shares differs in its distribution plan and certain other class-specific expenses. The Fund invests all of its investable assets in interests in High Income Opportunities Portfolio (the Portfolio), a Massachusetts business trust, having the same investment objectives and policies as the Fund. The value of the Fund’s investment in the Portfolio reflects the Fund’s proportionate interest in the net assets of the Portfolio (67.1% at October 31, 2022). The performance of the Fund is directly affected by the performance of the Portfolio. The financial statements of the Portfolio, including the portfolio of investments, are included elsewhere in this report and should be read in conjunction with the Fund’s financial statements.
The following is a summary of significant accounting policies of the Fund. The policies are in conformity with accounting principles generally accepted in the United States of America (U.S. GAAP). The Fund is an investment company and follows accounting and reporting guidance in the Financial Accounting Standards Board (FASB) Accounting Standards Codification Topic 946.
A Investment Valuation — Valuation of securities by the Portfolio is discussed in Note 1A of the Portfolio’s Notes to Financial Statements, which are included elsewhere in this report.
B Income — The Fund’s net investment income or loss consists of the Fund’s pro-rata share of the net investment income or loss of the Portfolio, less all actual and accrued expenses of the Fund.
C Federal Taxes — The Fund’s policy is to comply with the provisions of the Internal Revenue Code applicable to regulated investment companies and to distribute to shareholders each year substantially all of its net investment income, and all or substantially all of its net realized capital gains. Accordingly, no provision for federal income or excise tax is necessary.
As of October 31, 2022, the Fund had no uncertain tax positions that would require financial statement recognition, de-recognition, or disclosure. The Fund files a U.S. federal income tax return annually after its fiscal year-end, which is subject to examination by the Internal Revenue Service for a period of three years from the date of filing.
D Expenses — The majority of expenses of the Trust are directly identifiable to an individual fund. Expenses which are not readily identifiable to a specific fund are allocated taking into consideration, among other things, the nature and type of expense and the relative size of the funds.
E Use of Estimates — The preparation of the financial statements in conformity with U.S. GAAP requires management to make estimates and assumptions that affect the reported amounts of assets and liabilities at the date of the financial statements and the reported amounts of income and expense during the reporting period. Actual results could differ from those estimates.
F Indemnifications — Under the Trust’s organizational documents, its officers and Trustees may be indemnified against certain liabilities and expenses arising out of the performance of their duties to the Fund. Under Massachusetts law, if certain conditions prevail, shareholders of a Massachusetts business trust (such as the Trust) could be deemed to have personal liability for the obligations of the Trust. However, the Trust’s Declaration of Trust contains an express disclaimer of liability on the part of Fund shareholders and the By-laws provide that the Trust shall assume, upon request by the shareholder, the defense on behalf of any Fund shareholders. Moreover, the By-laws also provide for indemnification out of Fund property of any shareholder held personally liable solely by reason of being or having been a shareholder for all loss or expense arising from such liability. Additionally, in the normal course of business, the Fund enters into agreements with service providers that may contain indemnification clauses. The Fund’s maximum exposure under these arrangements is unknown as this would involve future claims that may be made against the Fund that have not yet occurred.
G Other — Investment transactions are accounted for on a trade date basis.
Eaton Vance
High Income Opportunities Fund
October 31, 2022
Notes to Financial Statements — continued
2 Distributions to Shareholders and Income Tax Information
The Fund declares dividends daily to shareholders of record at the time of declaration. Distributions are generally paid monthly. Distributions of realized capital gains are made at least annually. Distributions are declared separately for each class of shares. Shareholders may reinvest income and capital gain distributions in additional shares of the same class of the Fund at the net asset value as of the reinvestment date or, at the election of the shareholder, receive distributions in cash. Distributions to shareholders are determined in accordance with income tax regulations, which may differ from U.S. GAAP. As required by U.S. GAAP, only distributions in excess of tax basis earnings and profits are reported in the financial statements as a return of capital. Permanent differences between book and tax accounting relating to distributions are reclassified to paid-in capital. For tax purposes, distributions from short-term capital gains are considered to be from ordinary income.
The tax character of distributions declared for the years ended October 31, 2022 and October 31, 2021 was as follows:
| | | | | | | | |
| | | Year Ended October 31, | |
| | | 2022 | | | 2021 | |
| | |
Ordinary income | | $ | 36,196,391 | | | $ | 31,164,301 | |
| | |
Tax return of capital | | $ | 1,182,860 | | | $ | 7,878,058 | |
As of October 31, 2022, the components of distributable earnings (accumulated loss) on a tax basis were as follows:
| | | | |
| | |
Deferred capital losses | | $ | (24,164,181 | ) |
| |
Net unrealized depreciation | | | (39,025,307 | ) |
| |
Distributions payable | | | (309,237 | ) |
| |
Accumulated loss | | $ | (63,498,725 | ) |
At October 31, 2022, the Fund, for federal income tax purposes, had deferred capital losses of $24,164,181 which would reduce its taxable income arising from future net realized gains on investment transactions, if any, to the extent permitted by the Internal Revenue Code, and thus would reduce the amount of distributions to shareholders, which would otherwise be necessary to relieve the Fund of any liability for federal income or excise tax. The deferred capital losses are treated as arising on the first day of the Fund’s next taxable year and retain the same short-term or long-term character as when originally deferred. Of the deferred capital losses at October 31, 2022, $1,184,691 are short-term and $22,979,490 are long-term.
3 Investment Adviser Fee and Other Transactions with Affiliates
Pursuant to an investment advisory agreement with Eaton Vance Management (EVM), an indirect, wholly-owned subsidiary of Morgan Stanley, the Fund pays an investment adviser fee on its daily net assets that are not invested in other investment companies, and on its daily gross income that is not derived from other investment companies, for which EVM or its affiliates serve as investment adviser and receive an advisory fee at a per annum rate as follows and is payable monthly:
| | | | | | | | |
| Total Daily Net Assets | | Annual Asset
Rate | | | Daily Income
Rate | |
| | |
Up to $500 million | | | 0.300 | % | | | 3.000 | % |
| | |
$500 million but less than $1 billion | | | 0.275 | % | | | 2.750 | % |
| | |
$1 billion but less than $1.5 billion | | | 0.250 | % | | | 2.500 | % |
| | |
$1.5 billion but less than $2 billion | | | 0.225 | % | | | 2.250 | % |
| | |
$2 billion but less than $3 billion | | | 0.200 | % | | | 2.000 | % |
| | |
$3 billion and over | | | 0.175 | % | | | 1.750 | % |
For the year ended October 31, 2022, the Fund incurred no investment adviser fee on such assets. Pursuant to an investment sub-advisory agreement, EVM has delegated a portion of the investment management of the Fund to Eaton Vance Advisers International Ltd. (EVAIL), an affiliate of EVM. EVM pays EVAIL a portion of its investment adviser fee for sub-advisory services provided to the Fund. To the extent that the Fund’s assets are invested in the Portfolio, the Fund is allocated its share of the Portfolio’s investment adviser fee. The Portfolio has engaged Boston Management and Research (BMR) to render investment advisory services. See Note 2 of the Portfolio’s Notes to Financial Statements which are included elsewhere in this report. EVM also serves as the administrator of the Fund, but receives no compensation.
Eaton Vance
High Income Opportunities Fund
October 31, 2022
Notes to Financial Statements — continued
EVM provides sub-transfer agency and related services to the Fund pursuant to a Sub-Transfer Agency Support Services Agreement. For the year ended October 31, 2022, EVM earned $75,566 from the Fund pursuant to such agreement, which is included in transfer and dividend disbursing agent fees on the Statement of Operations. The Fund was informed that Eaton Vance Distributors, Inc. (EVD), an affiliate of EVM and the Fund’s principal underwriter, received $14,281 as its portion of the sales charge on sales of Class A shares for the year ended October 31, 2022. The Fund was informed that Morgan Stanley affiliated broker-dealers, which may be deemed to be affiliates of EVM, BMR and EVD, also received a portion of the sales charge on sales of Class A Fund shares for the year ended October 31, 2022 in the amount of $978. EVD also received distribution and service fees from Class A and Class C shares (see Note 4) and contingent deferred sales charges (see Note 5).
Trustees and officers of the Fund who are members of EVM’s or BMR’s organizations receive remuneration for their services to the Fund out of the investment adviser fee. Certain officers and Trustees of the Fund and the Portfolio are officers of the above organizations.
4 Distribution Plans
The Fund has in effect a distribution plan for Class A shares (Class A Plan) pursuant to Rule 12b-1 under the 1940 Act. Pursuant to the Class A Plan, the Fund pays EVD a distribution and service fee of 0.25% per annum of its average daily net assets attributable to Class A shares for distribution services and facilities provided to the Fund by EVD, as well as for personal services and/or the maintenance of shareholder accounts. Distribution and service fees paid or accrued to EVD for the year ended October 31, 2022 amounted to $519,790 for Class A shares.
The Fund also has in effect a distribution plan for Class C shares (Class C Plan) pursuant to Rule 12b-1 under the 1940 Act. Pursuant to the Class C Plan, the Fund pays EVD amounts equal to 0.75% per annum of its average daily net assets attributable to Class C shares for providing ongoing distribution services and facilities to the Fund. For the year ended October 31, 2022, the Fund paid or accrued to EVD $209,006 for Class C shares.
Pursuant to the Class C Plan, the Fund also makes payments of service fees to EVD, financial intermediaries and other persons in amounts equal to 0.25% per annum of its average daily net assets attributable to that class. Service fees paid or accrued are for personal services and/or the maintenance of shareholder accounts. They are separate and distinct from the sales commissions and distribution fees payable to EVD. Service fees paid or accrued for the year ended October 31, 2022 amounted to $69,669 for Class C shares.
Distribution and service fees are subject to the limitations contained in the Financial Industry Regulatory Authority Rule 2341(d).
5 Contingent Deferred Sales Charges
A contingent deferred sales charge (CDSC) of 1% generally is imposed on redemptions of Class C shares made within 12 months of purchase. Class A shares may be subject to a 0.75% (1% prior to April 29, 2022) CDSC if redeemed within 12 months (18 months prior to April 29, 2022) of purchase (depending on the circumstances of purchase). Generally, the CDSC is based upon the lower of the net asset value at date of redemption or date of purchase. No charge is levied on shares acquired by reinvestment of dividends or capital gain distributions. For the year ended October 31, 2022, the Fund was informed that EVD received approximately $5,000 of CDSCs paid by Class C shareholders and no CDSCs paid by Class A shareholders.
6 Investment Transactions
For the year ended October 31, 2022, increases and decreases in the Fund’s investment in the Portfolio aggregated $160,417,890 and $162,412,040, respectively.
Eaton Vance
High Income Opportunities Fund
October 31, 2022
Notes to Financial Statements — continued
7 Shares of Beneficial Interest
The Fund’s Declaration of Trust permits the Trustees to issue an unlimited number of full and fractional shares of beneficial interest (without par value). Such shares may be issued in a number of different series (such as the Fund) and classes. Transactions in Fund shares, including direct exchanges pursuant to share class conversions for all periods presented, were as follows:
| | | | | | | | | | | | | | | | |
| | | Year Ended
October 31, 2022 | | | Year Ended
October 31, 2021 | |
| | | Shares | | | Amount | | | Shares | | | Amount | |
| | | | |
Class A | | | | | | | | | | | | | | | | |
| | | | |
Sales | | | 12,855,827 | | | $ | 54,485,167 | | | | 14,685,155 | | | $ | 65,567,089 | |
| | | | |
Issued to shareholders electing to receive payments of distributions in Fund shares | | | 2,136,365 | | | | 8,927,869 | | | | 2,192,853 | | | | 9,785,675 | |
| | | | |
Redemptions | | | (18,460,061 | ) | | | (78,469,100 | ) | | | (19,122,765 | ) | | | (85,419,322 | ) |
| | | | |
Net decrease | | | (3,467,869 | ) | | $ | (15,056,064 | ) | | | (2,244,757 | ) | | $ | (10,066,558 | ) |
| | | | |
Class C | | | | | | | | | | | | | | | | |
| | | | |
Sales | | | 1,179,357 | | | $ | 4,855,528 | | | | 1,079,623 | | | $ | 4,831,633 | |
| | | | |
Issued to shareholders electing to receive payments of distributions in Fund shares | | | 277,417 | | | | 1,162,686 | | | | 301,302 | | | | 1,345,377 | |
| | | | |
Redemptions | | | (2,691,624 | ) | | | (11,236,828 | ) | | | (3,040,069 | ) | | | (13,431,014 | ) |
| | | | |
Net decrease | | | (1,234,850 | ) | | $ | (5,218,614 | ) | | | (1,659,144 | ) | | $ | (7,254,004 | ) |
| | | | |
Class I | | | | | | | | | | | | | | | | |
| | | | |
Sales | | | 59,543,964 | | | $ | 249,072,640 | | | | 37,077,026 | | | $ | 165,723,757 | |
| | | | |
Issued to shareholders electing to receive payments of distributions in Fund shares | | | 5,662,096 | | | | 23,620,177 | | | | 5,362,428 | | | | 23,949,969 | |
| | | | |
Redemptions | | | (50,556,729 | ) | | | (211,872,494 | ) | | | (63,788,577 | ) | | | (284,266,354 | ) |
| | | | |
Net increase (decrease) | | | 14,649,331 | | | $ | 60,820,323 | | | | (21,349,123 | ) | | $ | (94,592,628 | ) |
Eaton Vance
High Income Opportunities Fund
October 31, 2022
Report of Independent Registered Public Accounting Firm
To the Trustees of Eaton Vance Mutual Funds Trust and Shareholders of Eaton Vance High Income Opportunities Fund:
Opinion on the Financial Statements and Financial Highlights
We have audited the accompanying statement of assets and liabilities of Eaton Vance High Income Opportunities Fund (the “Fund”) (one of the funds constituting Eaton Vance Mutual Funds Trust), as of October 31, 2022, the related statement of operations for the year then ended, the statements of changes in net assets for each of the two years in the period then ended, the financial highlights for each of the five years in the period then ended, and the related notes. In our opinion, the financial statements and financial highlights present fairly, in all material respects, the financial position of the Fund as of October 31, 2022, and the results of its operations for the year then ended, the changes in its net assets for each of the two years in the period then ended, and the financial highlights for each of the five years in the period then ended, in conformity with accounting principles generally accepted in the United States of America.
Basis for Opinion
These financial statements and financial highlights are the responsibility of the Fund’s management. Our responsibility is to express an opinion on the Fund’s financial statements and financial highlights based on our audits. We are a public accounting firm registered with the Public Company Accounting Oversight Board (United States) (PCAOB) and are required to be independent with respect to the Fund in accordance with the U.S. federal securities laws and the applicable rules and regulations of the Securities and Exchange Commission and the PCAOB.
We conducted our audits in accordance with the standards of the PCAOB. Those standards require that we plan and perform the audit to obtain reasonable assurance about whether the financial statements and financial highlights are free of material misstatement, whether due to error or fraud. The Fund is not required to have, nor were we engaged to perform, an audit of its internal control over financial reporting. As part of our audits, we are required to obtain an understanding of internal control over financial reporting but not for the purpose of expressing an opinion on the effectiveness of the Fund’s internal control over financial reporting. Accordingly, we express no such opinion.
Our audits included performing procedures to assess the risks of material misstatement of the financial statements and financial highlights, whether due to error or fraud, and performing procedures that respond to those risks. Such procedures included examining, on a test basis, evidence regarding the amounts and disclosures in the financial statements and financial highlights. Our audits also included evaluating the accounting principles used and significant estimates made by management, as well as evaluating the overall presentation of the financial statements and financial highlights. We believe that our audits provide a reasonable basis for our opinion.
/s/ Deloitte & Touche LLP
Boston, Massachusetts
December 22, 2022
We have served as the auditor of one or more Eaton Vance investment companies since 1959.
Eaton Vance
High Income Opportunities Fund
October 31, 2022
Federal Tax Information (Unaudited)
The Form 1099-DIV you receive in February 2023 will show the tax status of all distributions paid to your account in calendar year 2022. Shareholders are advised to consult their own tax adviser with respect to the tax consequences of their investment in the Fund. As required by the Internal Revenue Code and/or regulations, shareholders must be notified regarding the status of qualified dividend income for individuals and 163(j) interest dividends.
Qualified Dividend Income. For the fiscal year ended October 31, 2022, the Fund designates approximately $463,027, or up to the maximum amount of such dividends allowable pursuant to the Internal Revenue Code, as qualified dividend income eligible for the reduced tax rate of 15%.
163(j) Interest Dividends. For the fiscal year ended October 31, 2022, the Fund designates 91.94% of distributions from net investment income as a 163(j) interest dividend.
High Income Opportunities Portfolio
October 31, 2022
Portfolio of Investments
| | | | | | | | | | |
| Asset-Backed Securities — 2.0% | |
| Security | | | | Principal
Amount
(000’s omitted) | | | Value | |
| | | |
Allegany Park CLO, Ltd., Series 2019-1A, Class ER, 10.363%, (3 mo. SOFR + 6.40%), 1/20/35(1)(2) | | | | $ | 2,000 | | | $ | 1,624,268 | |
| | | |
Ares LVlll CLO, Ltd., Series 2020-58A, Class ER, 10.564%, (3 mo. SOFR + 6.70%), 1/15/35(1)(2) | | | | | 2,000 | | | | 1,626,216 | |
| | | |
Atlas Senior Loan Fund XX, Ltd., Series 2022-20A, Class B1, 6.96%, (3 mo. SOFR + 3.15%), 10/19/35(1)(2) | | | | | 2,500 | | | | 2,473,152 | |
| | | |
Benefit Street Partners CLO XVII, Ltd., Series 2019-17A, Class ER, 10.429%, (3 mo. USD LIBOR + 6.35%), 7/15/32(1)(2) | | | | | 1,000 | | | | 833,242 | |
| | | |
Benefit Street Partners CLO XXV, Ltd., Series 2021-25A, Class E, 10.929%, (3 mo. USD LIBOR + 6.85%), 1/15/35(1)(2) | | | | | 2,000 | | | | 1,735,430 | |
| | | |
Canyon Capital CLO, Ltd., Series 2022-1A, Class E, 10.329%, (3 mo. SOFR + 6.40%), 4/15/35(1)(2) | | | | | 2,000 | | | | 1,661,400 | |
| | | |
Carlyle US CLO, Ltd., Series 2019-4A, Class DR, 10.464%, (3 mo. SOFR + 6.60%), 4/15/35(1)(2) | | | | | 2,000 | | | | 1,561,288 | |
| | | |
Golub Capital Partners CLO 50B-R, Ltd., Series 2020-50A, Class ER, 11.063%, (3 mo. SOFR + 7.10%), 4/20/35(1)(2) | | | | | 2,000 | | | | 1,644,464 | |
| | | |
Madison Park Funding LIX, Ltd., Series 2021-59A, Class E, 10.794%, (3 mo. USD LIBOR + 6.60%), 1/18/34(1)(2) | | | | | 2,000 | | | | 1,710,000 | |
| | | |
Madison Park Funding XXXVII, Ltd., Series 2019-37A, Class ER, 10.229%, (3 mo. USD LIBOR + 6.15%), 7/15/33(1)(2) | | | | | 1,000 | | | | 868,749 | |
| | | |
Palmer Square CLO, Ltd., Series 2021-3A, Class E, 10.229%, (3 mo. USD LIBOR + 6.15%), 1/15/35(1)(2) | | | | | 2,000 | | | | 1,760,950 | |
| | | |
| Wellfleet CLO, Ltd.: | | | | | | | | |
| | | |
Series 2021-2A, Class E, 11.039%, (3 mo. USD LIBOR + 6.96%),
7/15/34(1)(2) | | | | | 2,000 | | | | 1,603,080 | |
| | | |
Series 2021-3A, Class E, 11.179%, (3 mo. USD LIBOR + 7.10%),
1/15/35(1)(2) | | | | | 2,000 | | | | 1,657,600 | |
| | | |
Total Asset-Backed Securities
(identified cost $24,407,416) | | | | | | | | $ | 20,759,839 | |
|
| Commercial Mortgage-Backed Securities — 0.2% | |
| Security | | | | Principal
Amount
(000’s omitted) | | | Value | |
| | | |
BAMLL Commercial Mortgage Securities Trust, Series 2019-BPR, Class ENM, 3.843%, 11/5/32(1)(3) | | | | $ | 3,190 | | | $ | 2,333,528 | |
| | | |
Total Commercial Mortgage-Backed Securities
(identified cost $3,056,293) | | | | | | | | $ | 2,333,528 | |
| | | | | | | | | | | | |
| Common Stocks — 1.8% | |
| Security | | | | | Shares | | | Value | |
|
| Building Materials — 0.2% | |
| | | |
Builders FirstSource, Inc.(4) | | | | | | | 38,770 | | | $ | 2,390,558 | |
| | | |
| | | | | | | | | | | $ | 2,390,558 | |
|
| Energy — 0.9% | |
| | | |
Ascent CNR Corp., Class A(4)(5)(6) | | | | | | | 6,273,462 | | | $ | 1,631,100 | |
| | | |
Cheniere Energy, Inc. | | | | | | | 27,181 | | | | 4,795,000 | |
| | | |
Energy Transfer, L.P. | | | | | | | 230,000 | | | | 2,937,100 | |
| | | |
Nine Point Energy Holdings, Inc.(4)(5)(6) | | | | | | | 31,737 | | | | 0 | |
| | | |
| | | | | | | | | | | $ | 9,363,200 | |
|
| Environmental — 0.2% | |
| | | |
GFL Environmental, Inc. | | | | | | | 65,500 | | | $ | 1,767,845 | |
| | | |
| | | | | | | | | | | $ | 1,767,845 | |
|
| Gaming — 0.1% | |
| | | |
Caesars Entertainment, Inc.(4) | | | | | | | 30,000 | | | $ | 1,311,900 | |
| | | |
New Cotai Participation Corp.,
Class B(4)(5)(6) | | | | | | | 7 | | | | 0 | |
| | | |
| | | | | | | | | | | $ | 1,311,900 | |
|
| Leisure — 0.1% | |
| | | |
iFIT Health and Fitness, Inc.(4)(5)(6) | | | | | | | 514,080 | | | $ | 359,856 | |
| | | |
| | | | | | | | | | | $ | 359,856 | |
|
| Technology — 0.0%(7) | |
| | | |
Riverbed Technology, Inc.(4)(8) | | | | | | | 35,977 | | | $ | 18,079 | |
| | | |
| | | | | | | | | | | $ | 18,079 | |
|
| Utility — 0.3% | |
| | | |
NextEra Energy Partners, L.P. | | | | | | | 45,000 | | | $ | 3,333,150 | |
| | | |
| | | | | | | | | | | $ | 3,333,150 | |
| | | |
Total Common Stocks
(identified cost $18,209,757) | | | | | | | | | | $ | 18,544,588 | |
|
| Convertible Bonds — 0.3% | |
| Security | | | | | Principal
Amount
(000’s omitted) | | | Value | |
|
| Healthcare — 0.1% | |
| | | |
1Life Healthcare, Inc., 3.00%, 6/15/25 | | | | | | $ | 1,113 | | | $ | 1,082,949 | |
| | | |
| | | | | | | | | | | $ | 1,082,949 | |
High Income Opportunities Portfolio
October 31, 2022
Portfolio of Investments — continued
| | | | | | | | | | | | |
| Security | | | | | Principal
Amount
(000’s omitted) | | | Value | |
|
| Leisure — 0.2% | |
| | | |
Peloton Interactive, Inc., 0.00%, 2/15/26 | | | | | | $ | 3,289 | | | $ | 2,368,221 | |
| | | |
| | | | | | | | | | | $ | 2,368,221 | |
| | | |
Total Convertible Bonds
(identified cost $3,911,805) | | | | | | | | | | $ | 3,451,170 | |
|
| Convertible Preferred Stocks — 0.3% | |
| Security | | | | | Shares | | | Value | |
|
| Energy — 0.0% | |
| | | |
Nine Point Energy Holdings, Inc., Series A, 12.00% (PIK)(4)(5)(6) | | | | | | | 591 | | | $ | 0 | |
| | | |
| | | | | | | | | | | $ | 0 | |
|
| Environmental — 0.1% | |
| | | |
GFL Environmental, Inc., 6.00% | | | | | | | 11,767 | | | $ | 717,787 | |
| | | |
| | | | | | | | | | | $ | 717,787 | |
|
| Healthcare — 0.2% | |
| | | |
Becton Dickinson and Co., Series B, 6.00% | | | | | | | 36,441 | | | $ | 1,776,134 | |
| | | |
| | | | | | | | | | | $ | 1,776,134 | |
|
| Technology — 0.0%(7) | |
| | | |
Riverbed Technology, Inc., Series A, 6.50%, (1.50% cash, 5.00% PIK)(8) | | | | | | | 22,350 | | | $ | 22,350 | |
| | | |
| | | | | | | | | | | $ | 22,350 | |
| | | |
Total Convertible Preferred Stocks
(identified cost $3,740,399) | | | | | | | | | | $ | 2,516,271 | |
|
| Corporate Bonds — 82.5% | |
| Security | | Principal Amount* (000’s omitted) | | | Value | |
|
| Aerospace — 2.6% | |
| | | |
| Bombardier, Inc.: | | | | | | | | | |
| | | |
7.125%, 6/15/26(1) | | | | | | | 1,033 | | | $ | 979,514 | |
| | | |
7.875%, 4/15/27(1) | | | | | | | 1,357 | | | | 1,291,274 | |
| | | |
| BWX Technologies, Inc.: | | | | | | | | | |
| | | |
4.125%, 6/30/28(1) | | | | | | | 1,501 | | | | 1,315,566 | |
| | | |
4.125%, 4/15/29(1) | | | | | | | 1,016 | | | | 879,907 | |
| | | |
Moog, Inc., 4.25%, 12/15/27(1) | | | | | | | 2,796 | | | | 2,506,488 | |
| | | |
Rolls-Royce PLC, 5.75%, 10/15/27(1) | | | | | | | 4,991 | | | | 4,523,543 | |
| | | | | | | | | | | | |
| Security | | Principal Amount* (000’s omitted) | | | Value | |
|
| Aerospace (continued) | |
| | | |
Science Applications International Corp., 4.875%, 4/1/28(1) | | | | | | | 2,792 | | | $ | 2,546,168 | |
| | | |
TransDigm UK Holdings PLC, 6.875%, 5/15/26 | | | | | | | 1,585 | | | | 1,549,179 | |
| | | |
| TransDigm, Inc.: | | | | | | | | | |
| | | |
4.625%, 1/15/29 | | | | | | | 1,677 | | | | 1,430,733 | |
| | | |
5.50%, 11/15/27 | | | | | | | 3,914 | | | | 3,576,770 | |
| | | |
6.25%, 3/15/26(1) | | | | | | | 4,436 | | | | 4,383,367 | |
| | | |
7.50%, 3/15/27 | | | | | | | 1,705 | | | | 1,682,630 | |
| | | |
| | | | | | | | | | | $ | 26,665,139 | |
|
| Air Transportation — 1.3% | |
| | | |
| Air Canada: | | | | | | | | | |
| | | |
3.875%, 8/15/26(1) | | | | | | | 1,891 | | | $ | 1,675,984 | |
| | | |
4.625%, 8/15/29(1) | | | CAD | | | | 1,045 | | | | 640,493 | |
| | | |
| American Airlines, Inc./AAdvantage Loyalty IP, Ltd.: | | | | | | | | | |
| | | |
5.50%, 4/20/26(1) | | | | | | | 2,780 | | | | 2,651,930 | |
| | | |
5.75%, 4/20/29(1) | | | | | | | 3,580 | | | | 3,264,190 | |
| | | |
| United Airlines, Inc.: | | | | | | | | | |
| | | |
4.375%, 4/15/26(1) | | | | | | | 1,156 | | | | 1,057,183 | |
| | | |
4.625%, 4/15/29(1) | | | | | | | 1,799 | | | | 1,541,788 | |
| | | |
VistaJet Malta Finance PLC/XO Management Holding, Inc., 6.375%, 2/1/30(1) | | | | | | | 2,796 | | | | 2,327,992 | |
| | | |
| | | | | | | | | | | $ | 13,159,560 | |
|
| Automotive & Auto Parts — 2.9% | |
| | | |
Allison Transmission, Inc., 3.75%, 1/30/31(1) | | | | | | | 792 | | | $ | 633,795 | |
| | | |
| Ford Motor Co.: | | | | | | | | | |
| | | |
3.25%, 2/12/32 | | | | | | | 6,249 | | | | 4,702,529 | |
| | | |
4.75%, 1/15/43 | | | | | | | 2,651 | | | | 1,850,862 | |
| | | |
7.45%, 7/16/31 | | | | | | | 794 | | | | 797,752 | |
| | | |
9.625%, 4/22/30 | | | | | | | 350 | | | | 391,173 | |
| | | |
| Ford Motor Credit Co., LLC: | | | | | | | | | |
| | | |
2.90%, 2/16/28 | | | | | | | 568 | | | | 462,498 | |
| | | |
3.37%, 11/17/23 | | | | | | | 881 | | | | 851,563 | |
| | | |
3.625%, 6/17/31 | | | | | | | 2,065 | | | | 1,610,287 | |
| | | |
3.815%, 11/2/27 | | | | | | | 4,294 | | | | 3,698,343 | |
| | | |
4.00%, 11/13/30 | | | | | | | 1,461 | | | | 1,185,528 | |
| | | |
4.125%, 8/17/27 | | | | | | | 6,184 | | | | 5,504,935 | |
| | | |
4.271%, 1/9/27 | | | | | | | 752 | | | | 680,707 | |
| | | |
5.584%, 3/18/24 | | | | | | | 403 | | | | 397,478 | |
| | | |
| Goodyear Tire & Rubber Co. (The): | | | | | | | | | |
| | | |
5.00%, 7/15/29 | | | | | | | 2,856 | | | | 2,484,063 | |
| | | |
5.25%, 7/15/31 | | | | | | | 2,301 | | | | 1,952,629 | |
High Income Opportunities Portfolio
October 31, 2022
Portfolio of Investments — continued
| | | | | | | | | | | | |
| Security | | | | | Principal Amount* (000’s omitted) | | | Value | |
|
| Automotive & Auto Parts (continued) | |
| | | |
Real Hero Merger Sub 2, Inc., 6.25%, 2/1/29(1) | | | | | | | 1,572 | | | $ | 1,130,787 | |
| | | |
Wheel Pros, Inc., 6.50%, 5/15/29(1) | | | | | | | 3,302 | | | | 1,559,017 | |
| | | |
| | | | | | | | | | | $ | 29,893,946 | |
|
| Banking & Thrifts — 0.4% | |
| | | |
JPMorgan Chase & Co., Series HH, 4.60% to 2/1/25(9)(10) | | | | | | | 2,385 | | | $ | 2,134,336 | |
| | | |
SVB Financial Group, 4.10% to 2/15/31(9)(10) | | | | | | | 3,729 | | | | 2,310,991 | |
| | | |
| | | | | | | | | | | $ | 4,445,327 | |
|
| Broadcasting — 2.0% | |
| | | |
Audacy Capital Corp., 6.75%, 3/31/29(1) | | | | | | | 2,316 | | | $ | 662,141 | |
| | | |
| Netflix, Inc.: | | | | | | | | | |
| | | |
5.875%, 2/15/25 | | | | | | | 2,155 | | | | 2,170,537 | |
| | | |
5.875%, 11/15/28 | | | | | | | 4,530 | | | | 4,507,350 | |
| | | |
Playtika Holding Corp., 4.25%, 3/15/29(1) | | | | | | | 1,512 | | | | 1,262,097 | |
| | | |
| Sirius XM Radio, Inc.: | | | | | | | | | |
| | | |
3.125%, 9/1/26(1) | | | | | | | 1,394 | | | | 1,248,668 | |
| | | |
3.875%, 9/1/31(1) | | | | | | | 1,401 | | | | 1,123,504 | |
| | | |
4.125%, 7/1/30(1) | | | | | | | 3,608 | | | | 2,959,006 | |
| | | |
5.00%, 8/1/27(1) | | | | | | | 2,980 | | | | 2,747,575 | |
| | | |
Townsquare Media, Inc., 6.875%, 2/1/26(1) | | | | | | | 2,038 | | | | 1,927,978 | |
| | | |
| Univision Communications, Inc.: | | | | | | | | | |
| | | |
4.50%, 5/1/29(1) | | | | | | | 1,583 | | | | 1,336,369 | |
| | | |
7.375%, 6/30/30(1) | | | | | | | 754 | | | | 730,404 | |
| | | |
| | | | | | | | | | | $ | 20,675,629 | |
|
| Building Materials — 2.2% | |
| | | |
| Builders FirstSource, Inc.: | | | | | | | | | |
| | | |
4.25%, 2/1/32(1) | | | | | | | 3,014 | | | $ | 2,416,881 | |
| | | |
5.00%, 3/1/30(1) | | | | | | | 2,685 | | | | 2,309,959 | |
| | | |
Masonite International Corp., 5.375%, 2/1/28(1) | | | | | | | 1,059 | | | | 970,987 | |
| | | |
MIWD Holdco II, LLC/MIWD Finance Corp., 5.50%, 2/1/30(1) | | | | | | | 2,025 | | | | 1,565,092 | |
| | | |
Oscar AcquisitionCo, LLC/Oscar Finance, Inc., 9.50%, 4/15/30(1) | | | | | | | 1,251 | | | | 1,062,273 | |
| | | |
PGT Innovations, Inc., 4.375%, 10/1/29(1) | | | | | | | 2,368 | | | | 1,969,111 | |
| | | |
Smyrna Ready Mix Concrete, LLC, 6.00%, 11/1/28(1) | | | | | | | 7,210 | | | | 6,076,732 | |
| | | |
| Standard Industries, Inc.: | | | | | | | | | |
| | | |
2.25%, 11/21/26(11) | | | EUR | | | | 2,443 | | | | 2,009,115 | |
| | | |
3.375%, 1/15/31(1) | | | | | | | 863 | | | | 647,759 | |
| | | |
4.375%, 7/15/30(1) | | | | | | | 2,932 | | | | 2,376,122 | |
| | | |
5.00%, 2/15/27(1) | | | | | | | 690 | | | | 625,420 | |
| | | |
| | | | | | | | | | | $ | 22,029,451 | |
| | | | | | | | | | | | |
| Security | | | | | Principal Amount* (000’s omitted) | | | Value | |
|
| Cable & Satellite TV — 1.9% | |
| | | |
| CCO Holdings, LLC/CCO Holdings Capital Corp.: | | | | | | | | | |
| | | |
4.50%, 8/15/30(1) | | | | | | | 5,982 | | | $ | 4,865,041 | |
| | | |
4.50%, 5/1/32 | | | | | | | 2,500 | | | | 1,979,275 | |
| | | |
4.75%, 3/1/30(1) | | | | | | | 4,255 | | | | 3,583,412 | |
| | | |
4.75%, 2/1/32(1) | | | | | | | 1,825 | | | | 1,464,412 | |
| | | |
5.00%, 2/1/28(1) | | | | | | | 1,895 | | | | 1,718,272 | |
| | | |
5.375%, 6/1/29(1) | | | | | | | 868 | | | | 776,860 | |
| | | |
6.375%, 9/1/29(1) | | | | | | | 3,715 | | | | 3,429,281 | |
| | | |
| CSC Holdings, LLC: | | | | | | | | | |
| | | |
3.375%, 2/15/31(1) | | | | | | | 1,221 | | | | 887,649 | |
| | | |
6.50%, 2/1/29(1) | | | | | | | 201 | | | | 189,767 | |
| | | |
Radiate Holdco, LLC/Radiate Finance, Inc., 6.50%, 9/15/28(1) | | | | | | | 995 | | | | 629,263 | |
| | | |
| | | | | | | | | | | $ | 19,523,232 | |
| | | |
| Capital Goods — 0.7% | | | | | | | | | |
| | | |
Madison IAQ, LLC, 5.875%, 6/30/29(1) | | | | | | | 3,851 | | | $ | 2,648,583 | |
| | | |
| Patrick Industries, Inc.: | | | | | | | | | |
| | | |
4.75%, 5/1/29(1) | | | | | | | 1,642 | | | | 1,242,313 | |
| | | |
7.50%, 10/15/27(1) | | | | | | | 415 | | | | 382,226 | |
| | | |
Roller Bearing Co. of America, Inc., 4.375%, 10/15/29(1) | | | | | | | 2,847 | | | | 2,501,744 | |
| | | |
| | | | | | | | | | | $ | 6,774,866 | |
| | | |
| Chemicals — 1.9% | | | | | | | | | |
| | | |
ASP Unifrax Holdings, Inc., 5.25%, 9/30/28(1) | | | | | | | 1,431 | | | $ | 1,141,460 | |
| | | |
Avient Corp., 7.125%, 8/1/30(1) | | | | | | | 1,496 | | | | 1,432,562 | |
| | | |
Compass Minerals International, Inc., 6.75%, 12/1/27(1) | | | | | | | 2,935 | | | | 2,765,259 | |
| | | |
Herens Holdco S.a.r.l., 4.75%, 5/15/28(1) | | | | | | | 2,171 | | | | 1,781,714 | |
| | | |
Herens Midco S.a.r.l., 5.25%, 5/15/29(11) | | | EUR | | | | 2,000 | | | | 1,287,690 | |
| | | |
| NOVA Chemicals Corp.: | | | | | | | | | |
| | | |
4.25%, 5/15/29(1) | | | | | | | 2,428 | | | | 1,985,860 | |
| | | |
4.875%, 6/1/24(1) | | | | | | | 1,632 | | | | 1,590,800 | |
| | | |
Nufarm Australia, Ltd./Nufarm Americas, Inc., 5.00%, 1/27/30(1) | | | | | | | 2,294 | | | | 1,943,729 | |
| | | |
| SPCM S.A.: | | | | | | | | | |
| | | |
2.625%, 2/1/29(11) | | | EUR | | | | 910 | | | | 696,855 | |
| | | |
2.625%, 2/1/29(1) | | | EUR | | | | 250 | | | | 191,444 | |
| | | |
| Valvoline, Inc.: | | | | | | | | | |
| | | |
3.625%, 6/15/31(1) | | | | | | | 1,154 | | | | 912,128 | |
| | | |
4.25%, 2/15/30(1) | | | | | | | 2,566 | | | | 2,473,650 | |
| | | |
W.R. Grace Holdings, LLC, 4.875%, 6/15/27(1) | | | | | | | 1,829 | | | | 1,602,661 | |
| | | |
| | | | | | | | | | | $ | 19,805,812 | |
High Income Opportunities Portfolio
October 31, 2022
Portfolio of Investments — continued
| | | | | | | | | | | | |
| Security | | | | | Principal Amount* (000’s omitted) | | | Value | |
|
| Consumer Products — 1.0% | |
| | | |
| Central Garden & Pet Co.: | | | | | | | | | |
| | | |
4.125%, 10/15/30 | | | | | | | 1,215 | | | $ | 1,005,997 | |
| | | |
5.125%, 2/1/28 | | | | | | | 1,391 | | | | 1,274,613 | |
| | | |
Edgewell Personal Care Co., 4.125%, 4/1/29(1) | | | | | | | 2,936 | | | | 2,511,748 | |
| | | |
Spectrum Brands, Inc., 5.50%, 7/15/30(1) | | | | | | | 1,830 | | | | 1,471,946 | |
| | | |
Tempur Sealy International, Inc., 3.875%, 10/15/31(1) | | | | | | | 5,159 | | | | 3,884,366 | |
| | | |
| | | | | | | | | | | $ | 10,148,670 | |
|
| Containers — 0.7% | |
| | | |
Ardagh Metal Packaging Finance USA, LLC/Ardagh
Metal Packaging Finance PLC: | | | | | | | | | |
| | | |
3.00%, 9/1/29(11) | | | EUR | | | | 1,150 | | | $ | 816,055 | |
| | | |
4.00%, 9/1/29(1) | | | | | | | 1,068 | | | | 812,930 | |
| | | |
Canpack S.A./Canpack US, LLC, 3.875%, 11/15/29(1) | | | | | | | 3,826 | | | | 3,045,993 | |
| | | |
Crown Americas, LLC/Crown Americas Capital Corp. V, 4.25%, 9/30/26 | | | | | | | 1,415 | | | | 1,309,349 | |
| | | |
Mauser Packaging Solutions Holding Co., 7.25%, 4/15/25(1) | | | | | | | 1,232 | | | | 1,110,743 | |
| | | |
| | | | | | | | | | | $ | 7,095,070 | |
|
| Diversified Financial Services — 3.4% | |
| | | |
AG TTMT Escrow Issuer, LLC, 8.625%, 9/30/27(1) | | | | | | | 2,131 | | | $ | 2,141,847 | |
| | | |
Ally Financial, Inc., Series B, 4.70% to 5/15/26(9)(10) | | | | | | | 3,182 | | | | 2,316,894 | |
| | | |
Cargo Aircraft Management, Inc., 4.75%, 2/1/28(1) | | | | | | | 2,114 | | | | 1,890,603 | |
| | | |
Compass Group Diversified Holdings, LLC, 5.25%, 4/15/29(1) | | | | | | | 1,000 | | | | 862,535 | |
| | | |
Icahn Enterprises, L.P./Icahn Enterprises Finance
Corp.: | | | | | | | | | |
| | | |
5.25%, 5/15/27 | | | | | | | 2,726 | | | | 2,516,698 | |
| | | |
6.25%, 5/15/26 | | | | | | | 2,030 | | | | 1,952,535 | |
| | | |
Jane Street Group/JSG Finance, Inc., 4.50%, 11/15/29(1) | | | | | | | 3,426 | | | | 3,035,933 | |
| | | |
Jefferson Capital Holdings, LLC, 6.00%, 8/15/26(1) | | | | | | | 3,288 | | | | 2,742,192 | |
| | | |
MoneyGram International, Inc., 5.375%, 8/1/26(1) | | | | | | | 2,666 | | | | 2,621,963 | |
| | | |
| MSCI, Inc.: | | | | | | | | | |
| | | |
3.625%, 9/1/30(1) | | | | | | | 867 | | | | 725,982 | |
| | | |
3.875%, 2/15/31(1) | | | | | | | 2,176 | | | | 1,837,469 | |
| | | |
Oxford Finance, LLC/Oxford Finance Co-Issuer II, Inc., 6.375%, 2/1/27(1) | | | | | | | 2,769 | | | | 2,538,259 | |
| | | |
| PRA Group, Inc.: | | | | | | | | | |
| | | |
5.00%, 10/1/29(1) | | | | | | | 2,015 | | | | 1,618,992 | |
| | | |
7.375%, 9/1/25(1) | | | | | | | 2,428 | | | | 2,325,974 | |
| | | |
PROG Holdings, Inc., 6.00%, 11/15/29(1) | | | | | | | 1,660 | | | | 1,359,133 | |
| | | |
Rocket Mortgage, LLC/Rocket Mortgage Co.-Issuer,
Inc.: | | | | | | | | | |
| | | |
2.875%, 10/15/26(1) | | | | | | | 2,036 | | | | 1,704,570 | |
| | | | | | | | | | | | |
| Security | | | | | Principal Amount* (000’s omitted) | | | Value | |
|
| Diversified Financial Services (continued) | |
| | | |
Rocket Mortgage, LLC/Rocket Mortgage Co.-Issuer,
Inc.: (continued) | | | | | | | | | |
| | | |
3.625%, 3/1/29(1) | | | | | | | 3,127 | | | $ | 2,431,586 | |
| | | |
4.00%, 10/15/33(1) | | | | | | | 425 | | | | 297,874 | |
| | | |
| | | | | | | | | | | $ | 34,921,039 | |
|
| Diversified Media — 1.2% | |
| | | |
| Arches Buyer, Inc.: | | | | | | | | | |
| | | |
4.25%, 6/1/28(1) | | | | | | | 1,226 | | | $ | 1,008,606 | |
| | | |
6.125%, 12/1/28(1) | | | | | | | 1,234 | | | | 953,265 | |
| | | |
Cars.com, Inc., 6.375%, 11/1/28(1) | | | | | | | 3,183 | | | | 2,762,716 | |
| | | |
Clear Channel Outdoor Holdings, Inc., 7.75%, 4/15/28(1) | | | | | | | 2,025 | | | | 1,656,865 | |
| | | |
CMG Media Corp., 8.875%, 12/15/27(1) | | | | | | | 2,509 | | | | 2,133,089 | |
| | | |
Match Group Holdings II, LLC, 3.625%, 10/1/31(1) | | | | | | | 2,563 | | | | 1,957,363 | |
| | | |
| National CineMedia, LLC: | | | | | | | | | |
| | | |
5.75%, 8/15/26 | | | | | | | 1,660 | | | | 143,250 | |
| | | |
5.875%, 4/15/28(1) | | | | | | | 2,260 | | | | 911,673 | |
| | | |
Urban One, Inc., 7.375%, 2/1/28(1) | | | | | | | 1,400 | | | | 1,226,736 | |
| | | |
| | | | | | | | | | | $ | 12,753,563 | |
|
| Energy — 10.7% | |
| | | |
Aethon III BR, LLC, 9.00%, (1 mo. USD LIBOR + 7.50%), 10/1/25(2) | | | | | | | 3,437 | | | $ | 3,447,129 | |
| | | |
Aethon United BR, L.P./Aethon United Finance Corp., 8.25%, 2/15/26(1) | | | | | | | 3,039 | | | | 3,093,328 | |
| | | |
Antero Midstream Partners, L.P./Antero Midstream
Finance Corp.: | | | | | | | | | |
| | | |
5.75%, 3/1/27(1) | | | | | | | 3,242 | | | | 3,094,684 | |
| | | |
7.875%, 5/15/26(1) | | | | | | | 1,283 | | | | 1,310,315 | |
| | | |
Archrock Partners, L.P./Archrock Partners Finance Corp., 6.25%, 4/1/28(1) | | | | | | | 1,272 | | | | 1,185,440 | |
| | | |
| Callon Petroleum Co.: | | | | | | | | | |
| | | |
7.50%, 6/15/30(1) | | | | | | | 1,157 | | | | 1,100,932 | |
| | | |
8.00%, 8/1/28(1) | | | | | | | 3,002 | | | | 2,998,308 | |
| | | |
Centennial Resource Production, LLC, 5.375%, 1/15/26(1) | | | | | | | 328 | | | | 303,840 | |
| | | |
| Cheniere Energy Partners, L.P.: | | | | | | | | | |
| | | |
4.00%, 3/1/31 | | | | | | | 2,552 | | | | 2,154,845 | |
| | | |
4.50%, 10/1/29 | | | | | | | 1,896 | | | | 1,677,107 | |
| | | |
Cheniere Energy, Inc., 4.625%, 10/15/28 | | | | | | | 2,512 | | | | 2,322,482 | |
| | | |
Chord Energy Corp., 6.375%, 6/1/26(1) | | | | | | | 1,560 | | | | 1,526,249 | |
| | | |
| Colgate Energy Partners III, LLC: | | | | | | | | | |
| | | |
5.875%, 7/1/29(1) | | | | | | | 4,333 | | | | 4,050,358 | |
| | | |
7.75%, 2/15/26(1) | | | | | | | 1,675 | | | | 1,670,279 | |
High Income Opportunities Portfolio
October 31, 2022
Portfolio of Investments — continued
| | | | | | | | | | |
| Security | | | | Principal
Amount* (000’s omitted) | | | Value | |
|
| Energy (continued) | |
| | | |
CrownRock, L.P./CrownRock Finance, Inc., 5.00%, 5/1/29(1) | | | | | 2,637 | | | $ | 2,399,290 | |
| | | |
CVR Energy, Inc., 5.75%, 2/15/28(1) | | | | | 4,038 | | | | 3,660,346 | |
| | | |
DT Midstream, Inc., 4.125%, 6/15/29(1) | | | | | 2,690 | | | | 2,332,190 | |
| | | |
| EQM Midstream Partners, L.P.: | | | | | | | | |
| | | |
4.50%, 1/15/29(1) | | | | | 2,111 | | | | 1,799,522 | |
| | | |
4.75%, 1/15/31(1) | | | | | 2,377 | | | | 1,992,152 | |
| | | |
6.00%, 7/1/25(1) | | | | | 410 | | | | 397,618 | |
| | | |
6.50%, 7/1/27(1) | | | | | 1,121 | | | | 1,095,710 | |
| | | |
7.50%, 6/1/30(1) | | | | | 1,881 | | | | 1,831,812 | |
| | | |
| EQT Corp.: | | | | | | | | |
| | | |
5.00%, 1/15/29 | | | | | 489 | | | | 454,927 | |
| | | |
6.125%, 2/1/25 | | | | | 614 | | | | 616,177 | |
| | | |
7.00%, 2/1/30 | | | | | 900 | | | | 923,648 | |
| | | |
| Hilcorp Energy I, L.P./Hilcorp Finance Co.: | | | | | | | | |
| | | |
5.75%, 2/1/29(1) | | | | | 994 | | | | 911,771 | |
| | | |
6.00%, 2/1/31(1) | | | | | 794 | | | | 723,477 | |
| | | |
Kinetik Holdings, L.P., 5.875%, 6/15/30(1) | | | | | 3,659 | | | | 3,437,058 | |
| | | |
Laredo Petroleum, Inc., 9.50%, 1/15/25 | | | | | 694 | | | | 695,301 | |
| | | |
| Nabors Industries, Ltd.: | | | | | | | | |
| | | |
7.50%, 1/15/28(1) | | | | | 1,118 | | | | 1,038,516 | |
| | | |
9.00%, 2/1/25(1) | | | | | 1,722 | | | | 1,748,607 | |
| | | |
Neptune Energy Bondco PLC, 6.625%, 5/15/25(1) | | | | | 5,066 | | | | 4,931,277 | |
| | | |
New Fortress Energy, Inc., 6.50%, 9/30/26(1) | | | | | 3,289 | | | | 3,196,924 | |
| | | |
| Occidental Petroleum Corp.: | | | | | | | | |
| | | |
6.125%, 1/1/31 | | | | | 1,739 | | | | 1,745,730 | |
| | | |
6.20%, 3/15/40 | | | | | 736 | | | | 709,710 | |
| | | |
8.50%, 7/15/27 | | | | | 3,859 | | | | 4,201,563 | |
| | | |
8.875%, 7/15/30 | | | | | 3,417 | | | | 3,882,583 | |
| | | |
| Parkland Corp.: | | | | | | | | |
| | | |
4.50%, 10/1/29(1) | | | | | 2,371 | | | | 2,001,266 | |
| | | |
4.625%, 5/1/30(1) | | | | | 2,389 | | | | 1,993,143 | |
| | | |
Plains All American Pipeline, L.P., Series B, 6.125% to 12/5/22(9)(10) | | | | | 1,947 | | | | 1,636,453 | |
| | | |
| Precision Drilling Corp.: | | | | | | | | |
| | | |
6.875%, 1/15/29(1) | | | | | 1,307 | | | | 1,203,832 | |
| | | |
7.125%, 1/15/26(1) | | | | | 1,095 | | | | 1,077,206 | |
| | | |
| Shelf Drilling Holdings, Ltd.: | | | | | | | | |
| | | |
8.25%, 2/15/25(1) | | | | | 2,176 | | | | 1,838,111 | |
| | | |
8.875%, 11/15/24(1) | | | | | 630 | | | | 621,413 | |
| | | |
Southwestern Energy Co., 4.75%, 2/1/32 | | | | | 2,583 | | | | 2,233,468 | |
| | | |
| Sunoco, L.P./Sunoco Finance Corp.: | | | | | | | | |
| | | |
4.50%, 5/15/29 | | | | | 1,297 | | | | 1,117,139 | |
| | | |
4.50%, 4/30/30 | | | | | 3,300 | | | | 2,814,751 | |
| | | | | | | | | | | | |
| Security | | | | | Principal
Amount* (000’s omitted) | | | Value | |
|
| Energy (continued) | |
| | | |
Superior Plus, L.P./Superior General Partner, Inc., 4.50%, 3/15/29(1) | | | | | | | 2,921 | | | $ | 2,483,087 | |
| | | |
Tap Rock Resources, LLC, 7.00%, 10/1/26(1) | | | | | | | 4,270 | | | | 3,993,542 | |
| | | |
Tervita Corp., 11.00%, 12/1/25(1) | | | | | | | 1,838 | | | | 1,999,619 | |
| | | |
Transocean Poseidon, Ltd., 6.875%, 2/1/27(1) | | | | | | | 1,355 | | | | 1,299,852 | |
| | | |
| Venture Global Calcasieu Pass, LLC: | | | | | | | | | |
| | | |
3.875%, 8/15/29(1) | | | | | | | 2,380 | | | | 2,047,264 | |
| | | |
3.875%, 11/1/33(1) | | | | | | | 1,117 | | | | 898,543 | |
| | | |
4.125%, 8/15/31(1) | | | | | | | 1,449 | | | | 1,238,917 | |
| | | |
Weatherford International, Ltd., 8.625%, 4/30/30(1) | | | | | | | 2,338 | | | | 2,208,381 | |
| | | |
| Western Midstream Operating, L.P.: | | | | | | | | | |
| | | |
4.30%, 2/1/30 | | | | | | | 1,803 | | | | 1,589,390 | |
| | | |
4.50%, 3/1/28 | | | | | | | 224 | | | | 205,827 | |
| | | |
4.75%, 8/15/28 | | | | | | | 224 | | | | 207,053 | |
| | | |
| | | | | | | | | | | $ | 109,369,462 | |
|
| Entertainment & Film — 0.2% | |
| | | |
| Cinemark USA, Inc.: | | | | | | | | | |
| | | |
5.25%, 7/15/28(1) | | | | | | | 2,166 | | | $ | 1,649,648 | |
| | | |
5.875%, 3/15/26(1) | | | | | | | 588 | | | | 495,893 | |
| | | |
8.75%, 5/1/25(1) | | | | | | | 411 | | | | 412,723 | |
| | | |
| | | | | | | | | | | $ | 2,558,264 | |
|
| Environmental — 1.5% | |
| | | |
| Clean Harbors, Inc.: | | | | | | | | | |
| | | |
4.875%, 7/15/27(1) | | | | | | | 1,029 | | | $ | 969,879 | |
| | | |
5.125%, 7/15/29(1) | | | | | | | 1,117 | | | | 1,037,224 | |
| | | |
| Covanta Holding Corp.: | | | | | | | | | |
| | | |
4.875%, 12/1/29(1) | | | | | | | 3,689 | | | | 3,149,871 | |
| | | |
5.00%, 9/1/30 | | | | | | | 804 | | | | 671,340 | |
| | | |
| GFL Environmental, Inc.: | | | | | | | | | |
| | | |
3.50%, 9/1/28(1) | | | | | | | 5,074 | | | | 4,315,158 | |
| | | |
3.75%, 8/1/25(1) | | | | | | | 669 | | | | 633,837 | |
| | | |
4.75%, 6/15/29(1) | | | | | | | 5,193 | | | | 4,537,838 | |
| | | |
| | | | | | | | | | | $ | 15,315,147 | |
|
| Food & Drug Retail — 1.1% | |
| | | |
Albertsons Cos., Inc./Safeway, Inc./New
Albertsons, L.P./Albertsons, LLC: | | | | | | | | | |
| | | |
4.875%, 2/15/30(1) | | | | | | | 2,492 | | | $ | 2,217,656 | |
| | | |
5.875%, 2/15/28(1) | | | | | | | 1,807 | | | | 1,691,750 | |
| | | |
Arko Corp., 5.125%, 11/15/29(1) | | | | | | | 4,390 | | | | 3,482,148 | |
| | | |
Ingles Markets, Inc., 4.00%, 6/15/31(1) | | | | | | | 2,410 | | | | 2,004,873 | |
High Income Opportunities Portfolio
October 31, 2022
Portfolio of Investments — continued
| | | | | | | | | | | | |
| Security | | | | | Principal
Amount* (000’s omitted) | | | Value | |
|
| Food & Drug Retail (continued) | |
| | | |
| Murphy Oil USA, Inc.: | | | | | | | | | |
| | | |
4.75%, 9/15/29 | | | | | | | 210 | | | $ | 189,341 | |
| | | |
5.625%, 5/1/27 | | | | | | | 1,190 | | | | 1,143,667 | |
| | | |
| | | | | | | | | | | $ | 10,729,435 | |
|
| Food, Beverage & Tobacco — 2.5% | |
| | | |
BellRing Brands, Inc., 7.00%, 3/15/30(1) | | | | | | | 3,553 | | | $ | 3,363,039 | |
| | | |
Darling Ingredients, Inc., 6.00%, 6/15/30(1) | | | | | | | 1,700 | | | | 1,638,553 | |
| | | |
Herbalife Nutrition, Ltd./HLF Financing, Inc., 7.875%, 9/1/25(1) | | | | | | | 2,154 | | | | 2,015,832 | |
| | | |
JBS USA LUX S.A./JBS USA Food Co./JBS USA Finance, Inc., 5.50%, 1/15/30(1) | | | | | | | 2,970 | | | | 2,714,219 | |
| | | |
| Kraft Heinz Foods Co.: | | | | | | | | | |
| | | |
3.875%, 5/15/27 | | | | | | | 1,198 | | | | 1,123,328 | |
| | | |
4.375%, 6/1/46 | | | | | | | 525 | | | | 410,774 | |
| | | |
4.625%, 10/1/39 | | | | | | | 1,361 | | | | 1,130,558 | |
| | | |
5.50%, 6/1/50 | | | | | | | 369 | | | | 338,708 | |
| | | |
| Performance Food Group, Inc.: | | | | | | | | | |
| | | |
4.25%, 8/1/29(1) | | | | | | | 4,485 | | | | 3,810,232 | |
| | | |
5.50%, 10/15/27(1) | | | | | | | 1,504 | | | | 1,425,574 | |
| | | |
6.875%, 5/1/25(1) | | | | | | | 890 | | | | 889,137 | |
| | | |
Pilgrim’s Pride Corp., 3.50%, 3/1/32(1) | | | | | | | 4,361 | | | | 3,350,186 | |
| | | |
US Foods, Inc., 4.75%, 2/15/29(1) | | | | | | | 3,511 | | | | 3,119,874 | |
| | | |
| | | | | | | | | | | $ | 25,330,014 | |
|
| Gaming — 2.5% | |
| | | |
| Caesars Entertainment, Inc.: | | | | | | | | | |
| | | |
4.625%, 10/15/29(1) | | | | | | | 784 | | | $ | 628,752 | |
| | | |
6.25%, 7/1/25(1) | | | | | | | 3,256 | | | | 3,181,917 | |
| | | |
8.125%, 7/1/27(1) | | | | | | | 2,617 | | | | 2,549,625 | |
| | | |
CDI Escrow Issuer, Inc., 5.75%, 4/1/30(1) | | | | | | | 3,352 | | | | 3,030,208 | |
| | | |
Fertitta Entertainment, LLC/Fertitta Entertainment
Finance Co., Inc.: | | | | | | | | | |
| | | |
4.625%, 1/15/29(1) | | | | | | | 1,303 | | | | 1,135,649 | |
| | | |
6.75%, 1/15/30(1) | | | | | | | 3,482 | | | | 2,740,909 | |
| | | |
| International Game Technology PLC: | | | | | | | | | |
| | | |
4.125%, 4/15/26(1) | | | | | | | 1,237 | | | | 1,150,113 | |
| | | |
6.25%, 1/15/27(1) | | | | | | | 1,848 | | | | 1,835,258 | |
| | | |
6.50%, 2/15/25(1) | | | | | | | 1,412 | | | | 1,414,711 | |
| | | |
Jacobs Entertainment, Inc., 6.75%, 2/15/29(1) | | | | | | | 3,259 | | | | 2,878,789 | |
| | | |
| MGM Resorts International: | | | | | | | | | |
| | | |
4.75%, 10/15/28 | | | | | | | 2,206 | | | | 1,917,736 | |
| | | |
5.50%, 4/15/27 | | | | | | | 779 | | | | 719,442 | |
| | | |
Scientific Games International, Inc., 7.00%, 5/15/28(1) | | | | | | | 2,834 | | | | 2,748,725 | |
| | | |
| | | | | | | | | | | $ | 25,931,834 | |
| | | | | | | | | | |
| Security | | | | Principal
Amount* (000’s omitted) | | | Value | |
|
| Healthcare — 9.0% | |
| | | |
| AdaptHealth, LLC: | | | | | | | | |
| | | |
4.625%, 8/1/29(1) | | | | | 2,182 | | | $ | 1,843,479 | |
| | | |
5.125%, 3/1/30(1) | | | | | 1,609 | | | | 1,399,331 | |
| | | |
6.125%, 8/1/28(1) | | | | | 1,065 | | | | 986,456 | |
| | | |
Athenahealth Group, Inc., 6.50%, 2/15/30(1) | | | | | 3,988 | | | | 3,117,699 | |
| | | |
Avantor Funding, Inc., 3.875%, 7/15/28(11) | | EUR | | | 2,400 | | | | 2,084,219 | |
| | | |
| Centene Corp.: | | | | | | | | |
| | | |
2.50%, 3/1/31 | | | | | 3,104 | | | | 2,387,317 | |
| | | |
3.00%, 10/15/30 | | | | | 3,896 | | | | 3,142,631 | |
| | | |
3.375%, 2/15/30 | | | | | 4,823 | | | | 4,013,942 | |
| | | |
4.25%, 12/15/27 | | | | | 1,716 | | | | 1,585,618 | |
| | | |
4.625%, 12/15/29 | | | | | 3,802 | | | | 3,447,045 | |
| | | |
| Encompass Health Corp.: | | | | | | | | |
| | | |
4.625%, 4/1/31 | | | | | 2,043 | | | | 1,688,601 | |
| | | |
4.75%, 2/1/30 | | | | | 1,044 | | | | 892,317 | |
| | | |
Endo DAC/Endo Finance, LLC/Endo Finco, Inc., 5.875%, 10/15/24(1)(12) | | | | | 1,153 | | | | 916,853 | |
| | | |
Endo Luxembourg Finance Co. I S.a.r.l./Endo US, Inc., 6.125%, 4/1/29(1)(12) | | | | | 2,774 | | | | 2,102,142 | |
| | | |
Grifols Escrow Issuer S.A., 4.75%, 10/15/28(1) | | | | | 3,686 | | | | 2,884,571 | |
| | | |
| HCA, Inc.: | | | | | | | | |
| | | |
5.875%, 2/15/26 | | | | | 2,349 | | | | 2,328,063 | |
| | | |
5.875%, 2/1/29 | | | | | 2,038 | | | | 1,991,366 | |
| | | |
HealthEquity, Inc., 4.50%, 10/1/29(1) | | | | | 2,483 | | | | 2,172,625 | |
| | | |
Horizon Therapeutics USA, Inc., 5.50%, 8/1/27(1) | | | | | 2,853 | | | | 2,752,960 | |
| | | |
| IQVIA, Inc.: | | | | | | | | |
| | | |
2.25%, 3/15/29(11) | | EUR | | | 1,476 | | | | 1,188,263 | |
| | | |
5.00%, 5/15/27(1) | | | | | 1,329 | | | | 1,268,205 | |
| | | |
Jazz Securities DAC, 4.375%, 1/15/29(1) | | | | | 1,910 | | | | 1,699,938 | |
| | | |
Legacy LifePoint Health, LLC, 4.375%, 2/15/27(1) | | | | | 587 | | | | 464,215 | |
| | | |
LifePoint Health, Inc., 5.375%, 1/15/29(1) | | | | | 4,020 | | | | 2,574,006 | |
| | | |
Medline Borrower, L.P., 5.25%, 10/1/29(1) | | | | | 7,014 | | | | 5,474,497 | |
| | | |
ModivCare Escrow Issuer, Inc., 5.00%, 10/1/29(1) | | | | | 1,123 | | | | 957,207 | |
| | | |
ModivCare, Inc., 5.875%, 11/15/25(1) | | | | | 1,659 | | | | 1,578,398 | |
| | | |
| Molina Healthcare, Inc.: | | | | | | | | |
| | | |
3.875%, 11/15/30(1) | | | | | 2,889 | | | | 2,461,810 | |
| | | |
3.875%, 5/15/32(1) | | | | | 2,207 | | | | 1,846,465 | |
| | | |
Option Care Health, Inc., 4.375%, 10/31/29(1) | | | | | 3,184 | | | | 2,753,921 | |
| | | |
Organon & Co./Organon Foreign Debt Co.-Issuer B.V., 5.125%, 4/30/31(1) | | | | | 1,850 | | | | 1,574,258 | |
| | | |
P&L Development, LLC/PLD Finance Corp., 7.75%, 11/15/25(1) | | | | | 1,824 | | | | 1,410,536 | |
| | | |
Perrigo Finance Unlimited Co., 4.40%, 6/15/30 | | | | | 4,350 | | | | 3,645,170 | |
| | | |
PRA Health Sciences, Inc., 2.875%, 7/15/26(1) | | | | | 866 | | | | 781,822 | |
High Income Opportunities Portfolio
October 31, 2022
Portfolio of Investments — continued
| | | | | | | | | | | | |
| Security | | | | | Principal
Amount* (000’s omitted) | | | Value | |
|
| Healthcare (continued) | |
| | | |
RegionalCare Hospital Partners Holdings, Inc./LifePoint Health, Inc., 9.75%, 12/1/26(1) | | | | | | | 810 | | | $ | 647,490 | |
| | | |
Team Health Holdings, Inc., 6.375%, 2/1/25(1) | | | | | | | 2,682 | | | | 2,030,784 | |
| | | |
Teleflex, Inc., 4.25%, 6/1/28(1) | | | | | | | 787 | | | | 713,427 | |
| | | |
| Tenet Healthcare Corp.: | | | | | | | | | |
| | | |
4.375%, 1/15/30(1) | | | | | | | 1,379 | | | | 1,159,394 | |
| | | |
4.625%, 9/1/24(1) | | | | | | | 1,476 | | | | 1,428,274 | |
| | | |
5.125%, 11/1/27(1) | | | | | | | 2,855 | | | | 2,636,678 | |
| | | |
6.125%, 10/1/28(1) | | | | | | | 2,985 | | | | 2,588,368 | |
| | | |
6.875%, 11/15/31 | | | | | | | 1,683 | | | | 1,430,802 | |
| | | |
US Acute Care Solutions, LLC, 6.375%, 3/1/26(1) | | | | | | | 5,799 | | | | 5,271,900 | |
| | | |
Varex Imaging Corp., 7.875%, 10/15/27(1) | | | | | | | 2,397 | | | | 2,343,034 | |
| | | |
| | | | | | | | | | | $ | 91,666,097 | |
|
| Homebuilders & Real Estate — 3.2% | |
| | | |
Brookfield Property REIT, Inc./BPR Cumulus, LLC/
BPR Nimbus, LLC/GGSI Sellco, LLC,
4.50%, 4/1/27(1) | | | | | 2,778 | | | $2,369,412 | |
| | | |
Brundage-Bone Concrete Pumping Holdings, Inc., 6.00%, 2/1/26(1) | | | | | | | 1,227 | | | | 1,112,312 | |
| | | |
Dycom Industries, Inc., 4.50%, 4/15/29(1) | | | | | | | 1,923 | | | | 1,679,866 | |
| | | |
| HAT Holdings I, LLC/HAT Holdings II, LLC: | | | | | | | | | |
| | | |
3.375%, 6/15/26(1) | | | | | | | 1,155 | | | | 941,625 | |
| | | |
3.75%, 9/15/30(1) | | | | | | | 3,492 | | | | 2,414,805 | |
| | | |
6.00%, 4/15/25(1) | | | | | | | 1,287 | | | | 1,228,699 | |
| | | |
| KB Home: | | | | | | | | | |
| | | |
4.00%, 6/15/31 | | | | | | | 162 | | | | 122,948 | |
| | | |
4.80%, 11/15/29 | | | | | | | 1,044 | | | | 853,714 | |
| | | |
M/I Homes, Inc., 4.95%, 2/1/28 | | | | | | | 1,537 | | | | 1,321,036 | |
| | | |
MGM Growth Properties Operating Partnership, L.P./MGP Finance Co-Issuer, Inc., 5.625%, 5/1/24 | | | | | | | 585 | | | | 579,169 | |
| | | |
Outfront Media Capital, LLC/Outfront Media
Capital Corp.: | | | | | | | | | |
| | | |
4.625%, 3/15/30(1) | | | | | | | 929 | | | | 769,774 | |
| | | |
6.25%, 6/15/25(1) | | | | | | | 2,319 | | | | 2,289,746 | |
| | | |
| Taylor Morrison Communities, Inc.: | | | | | | | | | |
| | | |
5.75%, 1/15/28(1) | | | | | | | 1,071 | | | | 983,060 | |
| | | |
5.875%, 6/15/27(1) | | | | | | | 1,493 | | | | 1,401,994 | |
| | | |
TopBuild Corp., 4.125%, 2/15/32(1) | | | | | | | 2,753 | | | | 2,159,476 | |
| | | |
| VICI Properties, L.P./VICI Note Co., Inc.: | | | | | | | | | |
| | | |
3.75%, 2/15/27(1) | | | | | | | 543 | | | | 476,971 | |
| | | |
4.125%, 8/15/30(1) | | | | | | | 1,859 | | | | 1,537,829 | |
| | | |
4.625%, 12/1/29(1) | | | | | | | 4,004 | | | | 3,491,024 | |
| | | |
5.625%, 5/1/24(1) | | | | | | | 2,505 | | | | 2,475,717 | |
| | | |
| Vivion Investments S.a.r.l.: | | | | | | | | | |
| | | |
3.00%, 8/8/24(11) | | | EUR | | | | 4,600 | | | | 3,914,380 | |
| | | | | | | | | | | | |
| Security | | | | | Principal
Amount* (000’s omitted) | | | Value | |
|
| Homebuilders & Real Estate (continued) | |
|
| Vivion Investments S.a.r.l.: (continued) | |
| | | |
3.50%, 11/1/25(11) | | | EUR | | | | 100 | | | $ | 82,519 | |
| | | |
| | | | | | | | | | | $ | 32,206,076 | |
|
| Insurance — 0.7% | |
| | | |
Alliant Holdings Intermediate, LLC/Alliant Holdings Co-Issuer, 6.75%, 10/15/27(1) | | | | | | | 2,895 | | | $ | 2,645,726 | |
| | | |
AmWINS Group, Inc., 4.875%, 6/30/29(1) | | | | | | | 1,466 | | | | 1,256,532 | |
| | | |
BroadStreet Partners, Inc., 5.875%, 4/15/29(1) | | | | | | | 3,404 | | | | 2,740,096 | |
| | | |
| | | | | | | | | | | $ | 6,642,354 | |
|
| Leisure — 2.3% | |
| | | |
| Carnival Corp.: | | | | | | | | | |
| | | |
5.75%, 3/1/27(1) | | | | | | | 1,786 | | | $ | 1,240,913 | |
| | | |
6.00%, 5/1/29(1) | | | | | | | 973 | | | | 646,979 | |
| | | |
| Life Time, Inc.: | | | | | | | | | |
| | | |
5.75%, 1/15/26(1) | | | | | | | 1,452 | | | | 1,354,070 | |
| | | |
8.00%, 4/15/26(1) | | | | | | | 1,415 | | | | 1,235,852 | |
| | | |
Lindblad Expeditions, LLC, 6.75%, 2/15/27(1) | | | | | | | 2,637 | | | | 2,349,729 | |
| | | |
| NCL Corp., Ltd.: | | | | | | | | | |
| | | |
5.875%, 3/15/26(1) | | | | | | | 792 | | | | 650,101 | |
| | | |
5.875%, 2/15/27(1) | | | | | | | 946 | | | | 845,814 | |
| | | |
7.75%, 2/15/29(1) | | | | | | | 792 | | | | 632,760 | |
| | | |
NCL Finance, Ltd., 6.125%, 3/15/28(1) | | | | | | | 485 | | | | 377,813 | |
| | | |
Royal Caribbean Cruises, Ltd., 11.625%, 8/15/27(1) | | | | | | | 2,973 | | | | 2,856,221 | |
| | | |
SeaWorld Parks & Entertainment, Inc., 5.25%, 8/15/29(1) | | | | | | | 3,227 | | | | 2,780,104 | |
| | | |
Speedway Motorsports, LLC/Speedway Funding II, Inc., 4.875%, 11/1/27(1) | | | | | | | 2,674 | | | | 2,327,263 | |
| | | |
| Viking Cruises, Ltd.: | | | | | | | | | |
| | | |
5.875%, 9/15/27(1) | | | | | | | 4,354 | | | | 3,451,207 | |
| | | |
6.25%, 5/15/25(1) | | | | | | | 1,820 | | | | 1,594,857 | |
| | | |
7.00%, 2/15/29(1) | | | | | | | 753 | | | | 598,511 | |
| | | |
Viking Ocean Cruises Ship VII, Ltd., 5.625%, 2/15/29(1) | | | | | | | 521 | | | | 406,909 | |
| | | |
| | | | | | | | | | | $ | 23,349,103 | |
|
| Metals & Mining — 2.0% | |
| | | |
Arconic Corp., 6.125%, 2/15/28(1) | | | | | | | 787 | | | $ | 739,213 | |
| | | |
Constellium N.V., 5.875%, 2/15/26(1) | | | | | | | 815 | | | | 759,869 | |
| | | |
Coronado Finance Pty, Ltd., 10.75%, 5/15/26(1) | | | | | | | 3,250 | | | | 3,388,824 | |
| | | |
Eldorado Gold Corp., 6.25%, 9/1/29(1) | | | | | | | 2,968 | | | | 2,405,594 | |
| | | |
| First Quantum Minerals, Ltd.: | | | | | | | | | |
| | | |
6.875%, 3/1/26(1) | | | | | | | 448 | | | | 421,532 | |
| | | |
7.50%, 4/1/25(1) | | | | | | | 2,736 | | | | 2,657,231 | |
| | | |
Freeport-McMoRan, Inc., 5.45%, 3/15/43 | | | | | | | 2,400 | | | | 1,975,164 | |
High Income Opportunities Portfolio
October 31, 2022
Portfolio of Investments — continued
| | | | | | | | | | | | |
| Security | | | | | Principal
Amount* (000’s omitted) | | | Value | |
|
| Metals & Mining (continued) | |
| | | |
| Hudbay Minerals, Inc.: | | | | | | | | | |
| | | |
4.50%, 4/1/26(1) | | | | | | | 2,459 | | | $ | 2,163,355 | |
| | | |
6.125%, 4/1/29(1) | | | | | | | 1,069 | | | | 887,612 | |
| | | |
New Gold, Inc., 7.50%, 7/15/27(1) | | | | | | | 2,994 | | | | 2,557,658 | |
| | | |
| Novelis Corp.: | | | | | | | | | |
| | | |
3.25%, 11/15/26(1) | | | | | | | 1,755 | | | | 1,540,542 | |
| | | |
4.75%, 1/30/30(1) | | | | | | | 1,281 | | | | 1,090,720 | |
| | | |
| | | | | | | | | | | $ | 20,587,314 | |
|
| Paper — 0.5% | |
| | | |
Enviva Partners, L.P./Enviva Partners Finance Corp., 6.50%, 1/15/26(1) | | | | | | | 4,583 | | | $ | 4,407,173 | |
| | | |
Glatfelter Corp., 4.75%, 11/15/29(1) | | | | | | | 457 | | | | 294,987 | |
| | | |
| | | | | | | | | | | $ | 4,702,160 | |
|
| Publishing & Printing — 0.7% | |
| | | |
| LABL, Inc.: | | | | | | | | | |
| | | |
5.875%, 11/1/28(1) | | | | | | | 767 | | | $ | 667,700 | |
| | | |
8.25%, 11/1/29(1) | | | | | | | 1,537 | | | | 1,227,118 | |
| | | |
| McGraw-Hill Education, Inc.: | | | | | | | | | |
| | | |
5.75%, 8/1/28(1) | | | | | | | 2,092 | | | | 1,847,644 | |
| | | |
8.00%, 8/1/29(1) | | | | | | | 4,514 | | | | 3,853,466 | |
| | | |
| | | | | | | | | | | $ | 7,595,928 | |
|
| Restaurant — 1.3% | |
| | | |
1011778 B.C. Unlimited Liability Company/New
Red Finance, Inc.: | | | | | | | | | |
| | | |
3.875%, 1/15/28(1) | | | | | | | 1,761 | | | $ | 1,551,124 | |
| | | |
4.00%, 10/15/30(1) | | | | | | | 4,616 | | | | 3,775,195 | |
| | | |
5.75%, 4/15/25(1) | | | | | | | 581 | | | | 579,603 | |
| | | |
Dave & Buster’s, Inc., 7.625%, 11/1/25(1) | | | | | | | 4,883 | | | | 4,876,676 | |
| | | |
IRB Holding Corp., 7.00%, 6/15/25(1) | | | | | | | 1,978 | | | | 1,979,167 | |
| | | |
Yum! Brands, Inc., 3.625%, 3/15/31 | | | | | | | 452 | | | | 363,657 | |
| | | |
| | | | | | | | | | | $ | 13,125,422 | |
|
| Services — 5.5% | |
| | | |
Adtalem Global Education, Inc., 5.50%, 3/1/28(1) | | | | | | | 2,764 | | | $ | 2,526,268 | |
| | | |
Allied Universal Holdco, LLC/Allied Universal
Finance Corp.: | | | | | | | | | |
| | | |
6.625%, 7/15/26(1) | | | | | | | 2,712 | | | | 2,595,099 | |
| | | |
9.75%, 7/15/27(1) | | | | | | | 2,000 | | | | 1,743,690 | |
| | | |
Allied Universal Holdco, LLC/Allied Universal
Finance Corp./Atlas Luxco 4 S.a.r.l.: | | | | | | | | | |
| | | |
4.625%, 6/1/28(1) | | | | | | | 1,076 | | | | 882,298 | |
| | | |
4.625%, 6/1/28(1) | | | | | | | 1,231 | | | | 1,032,199 | |
| | | | | | | | | | | | |
| Security | | | | | Principal
Amount* (000’s omitted) | | | Value | |
|
| Services (continued) | |
| | | |
APi Group DE, Inc., 4.75%, 10/15/29(1) | | | | | | | 3,657 | | | $ | 3,087,943 | |
| | | |
BCPE Empire Holdings, Inc., 7.625%, 5/1/27(1) | | | | | | | 5,653 | | | | 5,177,121 | |
| | | |
| Gartner, Inc.: | | | | | | | | | |
| | | |
3.625%, 6/15/29(1) | | | | | | | 605 | | | | 515,533 | |
| | | |
3.75%, 10/1/30(1) | | | | | | | 2,100 | | | | 1,769,252 | |
| | | |
4.50%, 7/1/28(1) | | | | | | | 1,449 | | | | 1,345,752 | |
| | | |
GEMS MENASA Cayman, Ltd./GEMS Education | | | | | | | | | | | | |
| | | |
Delaware, LLC, 7.125%, 7/31/26(1) | | | | | | | 4,546 | | | | 4,307,199 | |
| | | |
| Hertz Corp. (The): | | | | | | | | | |
| | | |
4.625%, 12/1/26(1) | | | | | | | 372 | | | | 317,684 | |
| | | |
5.00%, 12/1/29(1) | | | | | | | 2,980 | | | | 2,368,728 | |
| | | |
Korn Ferry, 4.625%, 12/15/27(1) | | | | | | | 4,099 | | | | 3,734,517 | |
| | | |
NESCO Holdings II, Inc., 5.50%, 4/15/29(1) | | | | | | | 1,776 | | | | 1,560,989 | |
| | | |
| Sabre GLBL, Inc.: | | | | | | | | | |
| | | |
7.375%, 9/1/25(1) | | | | | | | 1,500 | | | | 1,411,530 | |
| | | |
9.25%, 4/15/25(1) | | | | | | | 2,614 | | | | 2,537,501 | |
| | | |
| SRS Distribution, Inc.: | | | | | | | | | |
| | | |
6.00%, 12/1/29(1) | | | | | | | 1,692 | | | | 1,383,557 | |
| | | |
6.125%, 7/1/29(1) | | | | | | | 2,668 | | | | 2,173,546 | |
| | | |
Summer (BC) Bidco B, LLC, 5.50%, 10/31/26(1) | | | | | | | 2,854 | | | | 2,275,683 | |
| | | |
Terminix Co., LLC (The), 7.45%, 8/15/27 | | | | | | | 5,040 | | | | 5,626,051 | |
| | | |
WASH Multifamily Acquisition, Inc., 5.75%, 4/15/26(1) | | | | | | | 4,401 | | | | 4,110,616 | |
| | | |
WESCO Distribution, Inc., 7.25%, 6/15/28(1) | | | | | | | 1,743 | | | | 1,770,722 | |
| | | |
White Cap Buyer, LLC, 6.875%, 10/15/28(1) | | | | | | | 755 | | | | 641,675 | |
| | | |
White Cap Parent, LLC, 8.25%, (8.25% cash or 9.00% PIK), 3/15/26(1)(13) | | | | | | | 1,481 | | | | 1,253,704 | |
| | | |
| | | | | | | | | | | $ | 56,148,857 | |
|
| Steel — 1.4% | |
| | | |
Allegheny Ludlum, LLC, 6.95%, 12/15/25 | | | | | | | 2,155 | | | $ | 2,111,276 | |
| | | |
ATI, Inc., 5.875%, 12/1/27 | | | | | | | 86 | | | | 78,278 | |
| | | |
Big River Steel, LLC/BRS Finance Corp., 6.625%, 1/31/29(1) | | | | | | | 1,292 | | | | 1,218,201 | |
| | | |
Cleveland-Cliffs, Inc., 6.75%, 3/15/26(1) | | | | | | | 3,792 | | | | 3,770,822 | |
| | | |
Infrabuild Australia Pty, Ltd., 12.00%, 10/1/24(1) | | | | | | | 5,740 | | | | 5,339,405 | |
| | | |
TMS International Corp., 6.25%, 4/15/29(1) | | | | | | | 2,204 | | | | 1,549,002 | |
| | | |
| | | | | | | | | | | $ | 14,066,984 | |
|
| Super Retail — 3.1% | |
| | | |
| Asbury Automotive Group, Inc.: | | | | | | | | | |
| | | |
4.625%, 11/15/29(1) | | | | | | | 839 | | | $ | 692,141 | |
| | | |
4.75%, 3/1/30 | | | | | | | 743 | | | | 609,897 | |
| | | |
5.00%, 2/15/32(1) | | | | | | | 2,334 | | | | 1,887,693 | |
| | | |
| Bath & Body Works, Inc.: | | | | | | | | | |
| | | |
6.625%, 10/1/30(1) | | | | | | | 201 | | | | 180,317 | |
High Income Opportunities Portfolio
October 31, 2022
Portfolio of Investments — continued
| | | | | | | | | | | | |
| Security | | | | | Principal
Amount* (000’s omitted) | | | Value | |
|
| Super Retail (continued) | |
| | | |
Bath & Body Works, Inc.: (continued) 6.75%, 7/1/36 | | | | | | | 694 | | | $ | 575,114 | |
| | | |
6.875%, 11/1/35 | | | | | | | 3,067 | | | | 2,582,583 | |
| | | |
6.95%, 3/1/33 | | | | | | | 1,621 | | | | 1,337,001 | |
| | | |
7.60%, 7/15/37 | | | | | | | 855 | | | | 677,468 | |
| | | |
9.375%, 7/1/25(1) | | | | | | | 289 | | | | 300,206 | |
| | | |
Group 1 Automotive, Inc., 4.00%, 8/15/28(1) | | | | | | | 1,497 | | | | 1,233,146 | |
| | | |
Ken Garff Automotive, LLC, 4.875%, 9/15/28(1) | | | | | | | 2,048 | | | | 1,703,337 | |
| | | |
LCM Investments Holdings II, LLC, 4.875%, 5/1/29(1) | | | | | | | 2,840 | | | | 2,403,023 | |
| | | |
| Lithia Motors, Inc.: | | | | | | | | | |
| | | |
3.875%, 6/1/29(1) | | | | | | | 905 | | | | 731,670 | |
| | | |
4.375%, 1/15/31(1) | | | | | | | 3,144 | | | | 2,557,534 | |
| | | |
Metis Merger Sub, LLC, 6.50%, 5/15/29(1) | | | | | | | 2,482 | | | | 1,997,787 | |
| | | |
| PetSmart, Inc./PetSmart Finance Corp.: | | | | | | | | | |
| | | |
4.75%, 2/15/28(1) | | | | | | | 2,225 | | | | 2,035,897 | |
| | | |
7.75%, 2/15/29(1) | | | | | | | 3,088 | | | | 2,906,148 | |
| | | |
| Sonic Automotive, Inc.: | | | | | | | | | |
| | | |
4.625%, 11/15/29(1) | | | | | | | 1,961 | | | | 1,541,022 | |
| | | |
4.875%, 11/15/31(1) | | | | | | | 1,634 | | | | 1,236,002 | |
| | | |
Victoria’s Secret & Co., 4.625%, 7/15/29(1) | | | | | | | 3,559 | | | | 2,839,833 | |
| | | |
William Carter Co. (The), 5.625%, 3/15/27(1) | | | | | | | 1,510 | | | | 1,437,643 | |
| | | |
| | | | | | | | | | | $ | 31,465,462 | |
|
| Technology — 4.2% | |
| | | |
Black Knight InfoServ, LLC, 3.625%, 9/1/28(1) | | | | | | | 2,048 | | | $ | 1,779,200 | |
| | | |
| Booz Allen Hamilton, Inc.: | | | | | | | | | |
| | | |
3.875%, 9/1/28(1) | | | | | | | 2,659 | | | | 2,347,631 | |
| | | |
4.00%, 7/1/29(1) | | | | | | | 1,006 | | | | 880,719 | |
| | | |
Ciena Corp., 4.00%, 1/31/30(1) | | | | | | | 1,543 | | | | 1,306,327 | |
| | | |
Clarios Global, L.P., 6.75%, 5/15/25(1) | | | | | | | 653 | | | | 654,384 | |
| | | |
| Clarios Global, L.P./Clarios US Finance Co.: | | | | | | | | | |
| | | |
4.375%, 5/15/26(11) | | | EUR | | | | 2,958 | | | | 2,741,271 | |
| | | |
8.50%, 5/15/27(1) | | | | | | | 3,369 | | | | 3,307,331 | |
| | | |
Coherent Corp., 5.00%, 12/15/29(1) | | | | | | | 1,836 | | | | 1,579,511 | |
| | | |
Condor Merger Sub, Inc., 7.375%, 2/15/30(1) | | | | | | | 2,042 | | | | 1,692,263 | |
| | | |
Fair Isaac Corp., 4.00%, 6/15/28(1) | | | | | | | 2,227 | | | | 2,020,947 | |
| | | |
Imola Merger Corp., 4.75%, 5/15/29(1) | | | | | | | 4,502 | | | | 3,889,480 | |
| | | |
| NCR Corp.: | | | | | | | | | |
| | | |
5.125%, 4/15/29(1) | | | | | | | 321 | | | | 270,106 | |
| | | |
5.25%, 10/1/30(1) | | | | | | | 259 | | | | 209,574 | |
| | | |
ON Semiconductor Corp., 3.875%, 9/1/28(1) | | | | | | | 3,132 | | | | 2,767,326 | |
| | | |
Open Text Corp., 3.875%, 2/15/28(1) | | | | | | | 1,596 | | | | 1,369,320 | |
| | | |
Open Text Holdings, Inc., 4.125%, 2/15/30(1) | | | | | | | 1,481 | | | | 1,182,719 | |
| | | |
| Presidio Holdings, Inc.: | | | | | | | | | |
| | | |
4.875%, 2/1/27(1) | | | | | | | 412 | | | | 380,974 | |
| | | | | | | | | | | | |
| Security | | | | | Principal
Amount* (000’s omitted) | | | Value | |
|
| Technology (continued) | |
|
| Presidio Holdings, Inc.: (continued) | |
| | | |
8.25%, 2/1/28(1) | | | | | | | 4,481 | | | $ | 3,994,408 | |
| | | |
Seagate HDD Cayman, 3.375%, 7/15/31 | | | | | | | 847 | | | | 605,783 | |
| | | |
Sensata Technologies B.V., 5.00%, 10/1/25(1) | | | | | | | 842 | | | | 817,714 | |
| | | |
Sensata Technologies, Inc., 3.75%, 2/15/31(1) | | | | | | | 3,219 | | | | 2,570,854 | |
| | | |
SS&C Technologies, Inc., 5.50%, 9/30/27(1) | | | | | | | 961 | | | | 895,202 | |
| | | |
Viavi Solutions, Inc., 3.75%, 10/1/29(1) | | | | | | | 2,295 | | | | 1,919,412 | |
| | | |
VM Consolidated, Inc., 5.50%, 4/15/29(1) | | | | | | | 3,657 | | | | 3,197,315 | |
| | | |
| | | | | | | | | | | $ | 42,379,771 | |
|
| Telecommunications — 4.7% | |
| | | |
| Altice France Holding S.A.: | | | | | | | | | |
| | | |
6.00%, 2/15/28(1) | | | | | | | 884 | | | $ | 573,819 | |
| | | |
10.50%, 5/15/27(1) | | | | | | | 1,614 | | | | 1,261,228 | |
| | | |
| Altice France S.A.: | | | | | | | | | |
| | | |
5.125%, 7/15/29(1) | | | | | | | 1,060 | | | | 800,300 | |
| | | |
5.50%, 1/15/28(1) | | | | | | | 1,052 | | | | 833,910 | |
| | | |
5.50%, 10/15/29(1) | | | | | | | 1,158 | | | | 885,204 | |
| | | |
8.125%, 2/1/27(1) | | | | | | | 4,715 | | | | 4,323,655 | |
| | | |
Connect Finco S.a.r.l./Connect US Finco, LLC, 6.75%, 10/1/26(1) | | | | | | | 5,056 | | | | 4,760,982 | |
| | | |
DKT Finance ApS, 9.375%, 6/17/23(1) | | | | | | | 2,503 | | | | 2,418,524 | |
| | | |
| Iliad Holding SASU: | | | | | | | | | |
| | | |
5.125%, 10/15/26(11) | | | EUR | | | | 100 | | | | 92,228 | |
| | | |
6.50%, 10/15/26(1) | | | | | | | 2,438 | | | | 2,261,708 | |
| | | |
7.00%, 10/15/28(1) | | | | | | | 1,349 | | | | 1,224,373 | |
| | | |
| LCPR Senior Secured Financing DAC: | | | | | | | | | |
| | | |
5.125%, 7/15/29(1) | | | | | | | 2,163 | | | | 1,827,584 | |
| | | |
6.75%, 10/15/27(1) | | | | | | | 425 | | | | 396,831 | |
| | | |
Level 3 Financing, Inc., 4.25%, 7/1/28(1) | | | | | | | 2,084 | | | | 1,724,989 | |
| | | |
Sprint Capital Corp., 6.875%, 11/15/28 | | | | | | | 3,985 | | | | 4,118,458 | |
| | | |
| Sprint Corp.: | | | | | | | | | |
| | | |
7.125%, 6/15/24 | | | | | | | 1,813 | | | | 1,835,284 | |
| | | |
7.625%, 2/15/25 | | | | | | | 3,285 | | | | 3,379,772 | |
| | | |
7.625%, 3/1/26 | | | | | | | 1,199 | | | | 1,253,417 | |
| | | |
7.875%, 9/15/23 | | | | | | | 2,800 | | | | 2,849,680 | |
| | | |
Telecom Italia SpA, 5.303%, 5/30/24(1) | | | | | | | 880 | | | | 829,400 | |
| | | |
| T-Mobile USA, Inc.: | | | | | | | | | |
| | | |
2.25%, 2/15/26 | | | | | | | 844 | | | | 759,080 | |
| | | |
2.625%, 2/15/29 | | | | | | | 2,505 | | | | 2,074,763 | |
| | | |
2.875%, 2/15/31 | | | | | | | 903 | | | | 728,017 | |
| | | |
4.75%, 2/1/28 | | | | | | | 1,095 | | | | 1,038,060 | |
| | | |
Viasat, Inc., 5.625%, 4/15/27(1) | | | | | | | 888 | | | | 822,612 | |
| | | |
Virgin Media Finance PLC, 5.00%, 7/15/30(1) | | | | | | | 1,029 | | | | 826,547 | |
High Income Opportunities Portfolio
October 31, 2022
Portfolio of Investments — continued
| | | | | | | | | | | | |
| Security | | | | | Principal Amount* (000’s omitted) | | | Value | |
|
| Telecommunications (continued) | |
| | | |
Virgin Media Vendor Financing Notes III DAC, 4.875%, 7/15/28(11) | | | GBP | | | | 1,106 | | | $ | 1,020,326 | |
| | | |
Virgin Media Vendor Financing Notes IV DAC, 5.00%, 7/15/28(1) | | | | | | | 1,100 | | | | 938,031 | |
| | | |
Ziggo B.V., 4.875%, 1/15/30(1) | | | | | | | 2,756 | | | | 2,320,221 | |
| | | |
| | | | | | | | | | | $ | 48,179,003 | |
|
| Transport Excluding Air & Rail — 0.3% | |
| | | |
Seaspan Corp., 5.50%, 8/1/29(1) | | | | | | | 3,386 | | | $ | 2,616,494 | |
| | | |
| | | | | | | | | | | $ | 2,616,494 | |
|
| Utility — 2.9% | |
| | | |
| Calpine Corp.: | | | | | | | | | |
| | | |
4.50%, 2/15/28(1) | | | | | | | 1,810 | | | $ | 1,629,548 | |
| | | |
4.625%, 2/1/29(1) | | | | | | | 1,060 | | | | 893,113 | |
| | | |
5.00%, 2/1/31(1) | | | | | | | 420 | | | | 355,848 | |
| | | |
5.125%, 3/15/28(1) | | | | | | | 3,554 | | | | 3,158,792 | |
| | | |
Drax Finco PLC, 6.625%, 11/1/25(1) | | | | | | | 2,026 | | | | 1,886,946 | |
| | | |
| FirstEnergy Corp.: | | | | | | | | | |
| | | |
2.65%, 3/1/30 | | | | | | | 750 | | | | 607,991 | |
| | | |
Series B, 4.40%, 7/15/27 | | | | | | | 2,275 | | | | 2,140,252 | |
| | | |
Leeward Renewable Energy Operations, LLC, 4.25%, 7/1/29(1) | | | | | | | 2,400 | | | | 1,947,516 | |
| | | |
NextEra Energy Operating Partners, L.P., 4.50%, 9/15/27(1) | | | | | | | 1,628 | | | | 1,516,441 | |
| | | |
| NRG Energy, Inc.: | | | | | | | | | |
| | | |
3.375%, 2/15/29(1) | | | | | | | 970 | | | | 809,388 | |
| | | |
3.625%, 2/15/31(1) | | | | | | | 1,617 | | | | 1,288,959 | |
| | | |
3.875%, 2/15/32(1) | | | | | | | 3,164 | | | | 2,501,300 | |
| | | |
5.25%, 6/15/29(1) | | | | | | | 1,247 | | | | 1,134,620 | |
| | | |
Pattern Energy Operations, L.P./Pattern Energy Operations, Inc., 4.50%, 8/15/28(1) | | | | | | | 1,596 | | | | 1,439,086 | |
| | | |
Suburban Propane Partners, L.P./Suburban Energy Finance Corp., 5.00%, 6/1/31(1) | | | | | | | 2,345 | | | | 1,976,812 | |
| | | |
TerraForm Power Operating, LLC, 5.00%, 1/31/28(1) | | | | | | | 2,981 | | | | 2,768,369 | |
| | | |
| Vistra Operations Co., LLC: | | | | | | | | | |
| | | |
4.375%, 5/1/29(1) | | | | | | | 2,094 | | | | 1,796,045 | |
| | | |
5.00%, 7/31/27(1) | | | | | | | 2,344 | | | | 2,166,430 | |
| | | |
| | | | | | | | | | | $ | 30,017,456 | |
| | | |
Total Corporate Bonds
(identified cost $959,722,686) | | | | | | | | | | $ | 841,873,941 | |
| | | | | | | | | | | | |
| Preferred Stocks — 0.4% | | | | | | | | | | | | |
| Security | | | | | Shares | | | Value | |
|
| Services — 0.4% | |
| | | |
WESCO International, Inc., Series A, 10.625% to 6/22/25(10) | | | | | | | 147,488 | | | $ | 3,982,176 | |
| | | |
Total Preferred Stocks
(identified cost $4,129,729) | | | | | | | | | | $ | 3,982,176 | |
|
| Senior Floating-Rate Loans — 4.0%(14) | |
| Borrower/Description | | | | | Principal
Amount
(000’s omitted) | | | Value | |
|
| Air Transportation — 0.7% | |
| | | |
Air Canada, Term Loan, 6.421%, (3 mo. USD LIBOR + 3.50%), 8/11/28 | | | | | | $ | 1,826 | | | $ | 1,786,659 | |
| | | |
Mileage Plus Holdings, LLC, Term Loan, 8.777%, (3 mo. USD LIBOR + 5.25%), 6/21/27 | | | | | | | 4,126 | | | | 4,221,746 | |
| | | |
SkyMiles IP, Ltd., Term Loan, 7.993%, (3 mo. USD LIBOR + 3.75%), 10/20/27 | | | | | | | 1,373 | | | | 1,387,112 | |
| | | |
| | | | | | | | | | | $ | 7,395,517 | |
|
| Gaming — 0.4% | |
| | | |
Spectacle Gary Holdings, LLC, Term Loan, 8.004%, (1 mo. USD LIBOR + 4.25%), 11/19/28 | | | | | | $ | 3,781 | | | $ | 3,639,670 | |
| | | |
| | | | | | | | | | | $ | 3,639,670 | |
|
| Healthcare — 0.8% | |
| | | |
Jazz Financing Lux S.a.r.l., Term Loan, 7.254%, (1 mo. USD LIBOR + 3.50%), 5/5/28 | | | | | | $ | 4,634 | | | $ | 4,588,221 | |
| | | |
Pluto Acquisition I, Inc., Term Loan, 6/22/26(15) | | | | | | | 2,076 | | | | 1,809,877 | |
| | | |
Verscend Holding Corp., Term Loan, 7.754%, (1 mo. USD LIBOR + 4.00%), 8/27/25 | | | | | | | 2,095 | | | | 2,069,758 | |
| | | |
| | | | | | | | | | | $ | 8,467,856 | |
|
| Leisure — 0.2% | |
| | | |
Peloton Interactive, Inc., Term Loan, 8.346%, (SOFR + 6.50%), 5/25/27 | | | | | | $ | 2,082 | | | $ | 2,022,799 | |
| | | |
| | | | | | | | | | | $ | 2,022,799 | |
|
| Restaurant — 0.4% | |
| | | |
IRB Holding Corp., Term Loan, 6.208%, (SOFR + 3.00%), 12/15/27 | | | | | | $ | 3,845 | | | $ | 3,736,569 | |
| | | |
| | | | | | | | | | | $ | 3,736,569 | |
High Income Opportunities Portfolio
October 31, 2022
Portfolio of Investments — continued
| | | | | | | | | | | | |
| Borrower/Description | | | | | Principal
Amount
(000’s omitted) | | | Value | |
|
| Services — 0.7% | |
| | | |
AlixPartners, LLP, Term Loan, 6.504%, (1 mo. USD LIBOR + 2.75%), 2/4/28 | | | | | | $ | 1,886 | | | $ | 1,843,126 | |
| | | |
Spin Holdco, Inc., Term Loan, 7.144%, (3 mo. USD LIBOR + 4.00%), 3/4/28 | | | | | | | 3,480 | | | | 3,081,117 | |
| | | |
Travelport Finance (Luxembourg) S.a.r.l., Term Loan, 12.424%, (3 mo. USD LIBOR + 8.75%), 5.174% cash, 7.25% PIK, 2/28/25 | | | | | | | 2,585 | | | | 2,563,770 | |
| | | |
| | | | | | | | | | | $ | 7,488,013 | |
|
| Super Retail — 0.7% | |
| | | |
Crocs, Inc., Term Loan, 2/20/29(15) | | | | | | $ | 3,000 | | | $ | 2,902,500 | |
| | | |
PetSmart, Inc., Term Loan, 7.50%, (1 mo. USD LIBOR + 3.75%), 2/11/28 | | | | | | | 4,351 | | | | 4,198,220 | |
| | | |
| | | | | | | | | | | $ | 7,100,720 | |
|
| Technology — 0.1% | |
| | | |
Riverbed Technology, Inc., Term Loan, 11.20%, (1 mo. USD LIBOR + 8.00%), 9.20% cash, 2.00% PIK, 12/7/26 | | | | | | $ | 1,221 | | | $ | 474,527 | |
| | | |
| | | | | | | | | | | $ | 474,527 | |
| | | |
Total Senior Floating-Rate Loans
(identified cost $42,029,923) | | | | | | | | | | $ | 40,325,671 | |
| | | |
| Miscellaneous — 3.4% | | | | | | | | | | | | |
| Security | | | | | Principal
Amount/
Shares | | | Value | |
|
| Containers — 0.0% | |
| | | |
ACC Claims Holdings, LLC(4)(5) | | | | | | | 8,415,190 | | | $ | 0 | |
| | | |
| | | | | | | | | | | $ | 0 | |
|
| Gaming — 3.4% | |
| | | |
PGP Investors, LLC, Membership Interests(4)(5)(6) | | | | | | | 15,849 | | | $ | 34,364,043 | |
| | | |
| | | | | | | | | | | $ | 34,364,043 | |
|
| Services — 0.0%(7) | |
| | | |
Hertz Corp., Escrow Certificates(4) | | | | | | $ | 502,000 | | | $ | 37,650 | |
| | | |
| | | | | | | | | | | $ | 37,650 | |
| | | |
Total Miscellaneous
(identified cost $295,372) | | | | | | | | | | $ | 34,401,693 | |
| | | | | | | | | | | | |
| Short-Term Investments — 3.7% | �� | | | | | | | | | | | |
| Security | | | | | Shares | | | Value | |
| | | |
Morgan Stanley Institutional Liquidity Funds - Government Portfolio, Institutional Class, 2.88%(16) | | | | | | | 37,909,716 | | | $ | 37,909,716 | |
| |
Total Short-Term Investments
(identified cost $37,909,716) | | | $ | 37,909,716 | |
| |
Total Investments — 98.6%
(identified cost $1,097,413,096) | | | $ | 1,006,098,593 | |
| |
Other Assets, Less Liabilities — 1.4% | | | $ | 14,174,777 | |
| |
Net Assets — 100.0% | | | $ | 1,020,273,370 | |
The percentage shown for each investment category in the Portfolio of Investments is based on net assets.
| | * | In U.S. dollars unless otherwise indicated. |
| | (1) | Security exempt from registration under Rule 144A of the Securities Act of 1933, as amended. These securities may be sold in certain transactions in reliance on an exemption from registration (normally to qualified institutional buyers). At October 31, 2022, the aggregate value of these securities is $683,565,941 or 67.0% of the Portfolio’s net assets. |
| | (2) | Variable rate security. The stated interest rate represents the rate in effect at October 31, 2022. |
| | (3) | Weighted average fixed-rate coupon that changes/updates monthly. Rate shown is the rate at October 31, 2022. |
| | (4) | Non-income producing security. |
| | (5) | For fair value measurement disclosure purposes, security is categorized as Level 3 (see Note 9). |
| | (6) | Restricted security (see Note 5). |
| | (7) | Amount is less than 0.05%. |
| | (8) | Security was acquired in connection with a restructuring of a Senior Loan and may be subject to restrictions on resale. |
| | (9) | Perpetual security with no stated maturity date but may be subject to calls by the issuer. |
| | (10) | Security converts to variable rate after the indicated fixed-rate coupon period. |
| | (11) | Security exempt from registration under Regulation S of the Securities Act of 1933, as amended, which exempts from registration securities offered and sold outside the United States. Security may not be offered or sold in the United States except pursuant to an exemption from, or in a transaction not subject to, the registration requirements of the Securities Act of 1933, as amended. At October 31, 2022, the aggregate value of these securities is $15,932,921 or 1.6% of the Portfolio’s net assets. |
| | (12) | Issuer is in default with respect to interest and/or principal payments. |
| | (13) | Represents a payment-in-kind security which may pay interest in additional principal at the issuer’s discretion. |
High Income Opportunities Portfolio
October 31, 2022
Portfolio of Investments — continued
| | (14) | Senior floating-rate loans (Senior Loans) often require prepayments from excess cash flows or permit the borrowers to repay at their election. The degree to which borrowers repay, whether as a contractual requirement or at their election, cannot be predicted with accuracy. As a result, the actual remaining maturity may be substantially less than the stated maturities shown. However, Senior Loans will typically have an expected average life of approximately two to four years. Senior Loans typically have rates of interest which are redetermined periodically by reference to a base lending rate, plus a spread. These base lending rates are primarily the London Interbank Offered Rate (“LIBOR”) or the Secured Overnight Financing Rate (SOFR) and secondarily, the prime rate offered by one or more major United States banks (the “Prime Rate”). Base lending rates may be subject to a floor, or minimum rate. Rates for SOFR are generally 1 or 3-month tenors and may also be subject to a credit spread adjustment. Senior Loans are generally subject to contractual restrictions that must be satisfied before they can be bought or sold. |
| | (15) | This Senior Loan will settle after October 31, 2022, at which time the interest rate will be determined. |
| | (16) | May be deemed to be an affiliated investment company. The rate shown is the annualized seven-day yield as of October 31, 2022. |
| | | | | | | | | | | | | | | | | | | | | | | | |
| Forward Foreign Currency Exchange Contracts (OTC) | |
| | | | | |
| Currency Purchased | | | Currency Sold | | | Counterparty | | Settlement
Date | | | Unrealized
Appreciation | | | Unrealized
(Depreciation) | |
| | | | | | | |
| USD | | | 645,069 | | | CAD | | | 873,098 | | | HSBC Bank USA, N.A. | | | 1/31/23 | | | $ | 3,392 | | | $ | — | |
| | | | | | | |
| USD | | | 3,788,327 | | | EUR | | | 3,753,934 | | | Bank of America, N.A. | | | 1/31/23 | | | | 50,736 | | | | — | |
| | | | | | | |
| USD | | | 3,783,995 | | | EUR | | | 3,753,933 | | | Bank of America, N.A. | | | 1/31/23 | | | | 46,405 | | | | — | |
| | | | | | | |
| USD | | | 3,783,291 | | | EUR | | | 3,753,934 | | | Bank of America, N.A. | | | 1/31/23 | | | | 45,700 | | | | — | |
| | | | | | | |
| USD | | | 3,006,431 | | | EUR | | | 2,987,184 | | | Bank of America, N.A. | | | 1/31/23 | | | | 32,251 | | | | — | |
| | | | | | | |
| USD | | | 1,075,054 | | | EUR | | | 1,069,562 | | | Bank of America, N.A. | | | 1/31/23 | | | | 10,148 | | | | — | |
| | | | | | | |
| USD | | | 975,782 | | | GBP | | | 838,686 | | | Bank of America, N.A. | | | 1/31/23 | | | | 11,035 | | | | — | |
| | | | | | | |
| USD | | | 29,443 | | | GBP | | | 25,368 | | | Citibank, N.A. | | | 1/31/23 | | | | 262 | | | | — | |
| | | | | | | |
| | | | | | | | | | | | | | | | | | | $ | 199,929 | | | $ | — | |
Abbreviations:
| | | | |
| | |
| LIBOR | | – | | London Interbank Offered Rate |
| | |
| OTC | | – | | Over-the-counter |
| | |
| PIK | | – | | Payment In Kind |
| | |
| SOFR | | – | | Secured Overnight Financing Rate |
Currency Abbreviations:
| | | | |
| | |
| CAD | | – | | Canadian Dollar |
| | |
| EUR | | – | | Euro |
| | |
| GBP | | – | | British Pound Sterling |
| | |
| USD | | – | | United States Dollar |
High Income Opportunities Portfolio
October 31, 2022
Statement of Assets and Liabilities
| | | | |
| Assets | | October 31, 2022 | |
| |
Unaffiliated investments, at value (identified cost $1,059,503,380) | | $ | 968,188,877 | |
| |
Affiliated investment, at value (identified cost $37,909,716) | | | 37,909,716 | |
| |
Cash | | | 850,854 | |
| |
Deposits for derivatives collateral — forward foreign currency exchange contracts | | | 230,000 | |
| |
Foreign currency, at value (identified cost $1,082) | | | 1,078 | |
| |
Interest receivable | | | 14,245,461 | |
| |
Dividends receivable from affiliated investment | | | 101,137 | |
| |
Receivable for investments sold | | | 5,360,623 | |
| |
Receivable for open forward foreign currency exchange contracts | | | 199,929 | |
| |
Total assets | | $ | 1,027,087,675 | |
|
| Liabilities | |
| |
Cash collateral due to brokers | | $ | 230,000 | |
| |
Payable for investments purchased | | | 5,925,136 | |
| |
Payable to affiliates: | | | | |
| |
Investment adviser fee | | | 396,745 | |
| |
Trustees’ fees | | | 6,225 | |
| |
Accrued expenses | | | 256,199 | |
| |
Total liabilities | | $ | 6,814,305 | |
| |
Net Assets applicable to investors’ interest in Portfolio | | $ | 1,020,273,370 | |
| | | | |
| | 31 | | See Notes to Financial Statements. |
High Income Opportunities Portfolio
October 31, 2022
Statement of Operations
| | | | |
| Investment Income | | Year Ended
October 31, 2022 | |
| |
Dividend income (net of foreign taxes withheld of $8,291) | | $ | 808,315 | |
| |
Dividend income from affiliated investments | | | 420,992 | |
| |
Interest and other income | | | 55,595,675 | |
| |
Total investment income | | $ | 56,824,982 | |
| |
| Expenses | | | | |
| |
Investment adviser fee | | $ | 4,762,114 | |
| |
Trustees’ fees and expenses | | | 67,633 | |
| |
Custodian fee | | | 276,027 | |
| |
Legal and accounting services | | | 123,766 | |
| |
Miscellaneous | | | 34,918 | |
| |
Total expenses | | $ | 5,264,458 | |
| |
Deduct: | | | | |
| |
Waiver and/or reimbursement of expenses by affiliate | | $ | 34,133 | |
| |
Total expense reductions | | $ | 34,133 | |
| |
Net expenses | | $ | 5,230,325 | |
| |
Net investment income | | $ | 51,594,657 | |
|
| Realized and Unrealized Gain (Loss) | |
| |
Net realized gain (loss): | | | | |
| |
Investment transactions | | $ | (7,693,933 | ) |
| |
Investment transactions - affiliated investment | | | (4,186 | ) |
| |
Swap contracts | | | (114,503 | ) |
| |
Foreign currency transactions | | | (23,611 | ) |
| |
Forward foreign currency exchange contracts | | | 2,554,125 | |
| |
Net realized loss | | $ | (5,282,108 | ) |
| |
Change in unrealized appreciation (depreciation): | | | | |
| |
Investments | | $ | (141,498,956 | ) |
| |
Swap contracts | | | (4,385 | ) |
| |
Foreign currency | | | (5,941 | ) |
| |
Forward foreign currency exchange contracts | | | 148,630 | |
| |
Net change in unrealized appreciation (depreciation) | | $ | (141,360,652 | ) |
| |
Net realized and unrealized loss | | $ | (146,642,760 | ) |
| |
Net decrease in net assets from operations | | $ | (95,048,103 | ) |
| | | | |
| | 32 | | See Notes to Financial Statements. |
High Income Opportunities Portfolio
October 31, 2022
Statements of Changes in Net Assets
| | | | | | | | |
| | | Year Ended October 31, | |
| Increase (Decrease) in Net Assets | | 2022 | | | 2021 | |
| | |
From operations: | | | | | | | | |
| | |
Net investment income | | $ | 51,594,657 | | | $ | 45,403,248 | |
| | |
Net realized gain (loss) | | | (5,282,108 | ) | | | 27,958,272 | |
| | |
Net change in unrealized appreciation (depreciation) | | | (141,360,652 | ) | | | 45,885,631 | |
| | |
Net increase (decrease) in net assets from operations | | $ | (95,048,103 | ) | | $ | 119,247,151 | |
| | |
Capital transactions: | | | | | | | | |
| | |
Contributions | | $ | 343,450,718 | | | $ | 200,254,483 | |
| | |
Withdrawals | | | (228,224,245 | ) | | | (269,157,903 | ) |
| | |
Net increase (decrease) in net assets from capital transactions | | $ | 115,226,473 | | | $ | (68,903,420 | ) |
| | |
Net increase in net assets | | $ | 20,178,370 | | | $ | 50,343,731 | |
|
| Net Assets | |
| | |
At beginning of year | | $ | 1,000,095,000 | | | $ | 949,751,269 | |
| | |
At end of year | | $ | 1,020,273,370 | | | $ | 1,000,095,000 | |
| | | | |
| | 33 | | See Notes to Financial Statements. |
High Income Opportunities Portfolio
October 31, 2022
Financial Highlights
| | | | | | | | | | | | | | | | | | | | |
| | | Year Ended October 31, | |
| Ratios/Supplemental Data | | 2022 | | | 2021 | | | 2020 | | | 2019 | | | 2018 | |
| | | | | |
Ratios (as a percentage of average daily net assets): | | | | | | | | | | | | | | | | | | | | |
| | | | | |
Expenses | | | 0.49 | %(1) | | | 0.49 | % | | | 0.51 | % | | | 0.50 | % | | | 0.48 | % |
| | | | | |
Net investment income | | | 4.82 | % | | | 4.78 | % | | | 5.26 | % | | | 5.61 | % | | | 5.61 | % |
| | | | | |
Portfolio Turnover | | | 19 | % | | | 64 | % | | | 67 | % | | | 32 | % | | | 39 | % |
| | | | | |
Total Return | | | (8.20 | )% | | | 13.11 | % | | | 1.69 | % | | | 7.74 | % | | | 0.59 | % |
| | | | | |
Net assets, end of year (000’s omitted) | | $ | 1,020,273 | | | $ | 1,000,095 | | | $ | 949,751 | | | $ | 1,088,999 | | | $ | 1,373,102 | |
| (1) | Includes a reduction by the investment adviser of a portion of its adviser fee due to the Portfolio’s investment in the Liquidity Fund (equal to less than 0.005% of average daily net assets for the year ended October 31, 2022). |
High Income Opportunities Portfolio
October 31, 2022
Notes to Financial Statements
1 Significant Accounting Policies
High Income Opportunities Portfolio (the Portfolio) is a Massachusetts business trust registered under the Investment Company Act of 1940, as amended (the 1940 Act), as a diversified, open-end management investment company. The Portfolio’s investment objective is to provide a high level of current income. The Portfolio also seeks growth of capital as a secondary investment objective. The Declaration of Trust permits the Trustees to issue interests in the Portfolio. At October 31, 2022, Eaton Vance High Income Opportunities Fund and Eaton Vance Floating-Rate & High Income Fund held an interest of
67.1% and 23.9%, respectively, in the Portfolio.
The following is a summary of significant accounting policies of the Portfolio. The policies are in conformity with accounting principles generally accepted in the United States of America (U.S. GAAP). The Portfolio is an investment company and follows accounting and reporting guidance in the Financial Accounting Standards Board (FASB) Accounting Standards Codification Topic 946.
A Investment Valuation — The following methodologies are used to determine the market value or fair value of investments.
Debt Obligations. Debt obligations are generally valued on the basis of valuations provided by third party pricing services, as derived from such services’ pricing models. Inputs to the models may include, but are not limited to, reported trades, executable bid and ask prices, broker/dealer quotations, prices or yields of securities with similar characteristics, interest rates, anticipated prepayments, benchmark curves or information pertaining to the issuer, as well as industry and economic events. The pricing services may use a matrix approach, which considers information regarding securities with similar characteristics to determine the valuation for a security. Short-term debt obligations purchased with a remaining maturity of sixty days or less for which a valuation from a third party pricing service is not readily available may be valued at amortized cost, which approximates fair value.
Senior Floating-Rate Loans. Interests in senior floating-rate loans (Senior Loans) are valued generally at the average mean of bid and ask quotations obtained from a third party pricing service. Senior Loans, for which a valuation is not available or deemed unreliable, are fair valued by the investment adviser utilizing one or more of the valuation techniques described below to assess the likelihood that the borrower will make a full repayment of the loan underlying such Senior Loan. If the investment adviser believes that there is a reasonable likelihood of full repayment, the investment adviser will determine fair value using a matrix pricing approach that considers the yield on the Senior Loan relative to yields on other Senior Loans issued by companies of comparable credit quality. If the investment adviser believes there is not a reasonable likelihood of full repayment, the investment adviser will determine fair value using analyses that include, but are not limited to: (i) a comparison of the value of the borrower’s outstanding equity and debt to that of comparable public companies; (ii) a discounted cash flow analysis; or (iii) when the investment adviser believes it is likely that a borrower will be liquidated or sold, an analysis of the terms of such liquidation or sale. In certain cases, the investment adviser will use a combination of analytical methods to determine fair value, such as when only a portion of a borrower’s assets are likely to be sold. In conducting its assessment and analyses for purposes of determining fair value of a Senior Loan, the investment adviser will use its discretion and judgment in considering and appraising relevant factors. Junior Loans (i.e., subordinated loans and second lien loans) are valued in the same manner as Senior Loans.
Equity Securities. Equity securities listed on a U.S. securities exchange generally are valued at the last sale or closing price on the day of valuation or, if no sales took place on such date, at the mean between the closing bid and ask prices on the exchange where such securities are principally traded. Equity securities listed on the NASDAQ National Market System are valued at the NASDAQ official closing price. Unlisted or listed securities for which closing sales prices or closing quotations are not available are valued at the mean between the latest available bid and ask prices or, in the case of preferred equity securities that are not listed or traded in the over-the-counter market, by a third party pricing service that uses various techniques that consider factors including, but not limited to, prices or yields of securities with similar characteristics, benchmark yields, broker/dealer quotes, quotes of underlying common stock, issuer spreads, as well as industry and economic events.
Derivatives. Forward foreign currency exchange contracts are generally valued at the mean of the average bid and average ask prices that are reported by currency dealers to a third party pricing service at the valuation time. Such third party pricing service valuations are supplied for specific settlement periods and the Portfolio’s forward foreign currency exchange contracts are valued at an interpolated rate between the closest preceding and subsequent settlement period reported by the third party pricing service. Swaps are normally valued using valuations provided by a third party pricing service. Such pricing service valuations are based on the present value of fixed and projected floating rate cash flows over the term of the swap contract, and in the case of credit default swaps, based on credit spread quotations obtained from broker/dealers and expected default recovery rates determined by the pricing service using proprietary models. Future cash flows on swaps are discounted to their present value using swap rates provided by electronic data services or by broker/dealers.
Foreign Securities and Currencies. Foreign securities and currencies are valued in U.S. dollars, based on foreign currency exchange rate quotations supplied by a third party pricing service. The pricing service uses a proprietary model to determine the exchange rate. Inputs to the model include reported trades and implied bid/ask spreads.
High Income Opportunities Portfolio
October 31, 2022
Notes to Financial Statements — continued
Other. Investments in management investment companies (including money market funds) that do not trade on an exchange are valued at the net asset value as of the close of each business day.
Fair Valuation. In connection with Rule 2a-5 of the 1940 Act, which became effective September 8, 2022, the Trustees have designated the Portfolio’s investment adviser as its valuation designee. Investments for which valuations or market quotations are not readily available or are deemed unreliable are valued by the investment adviser, as valuation designee, at fair value using methods that most fairly reflect the security’s “fair value”, which is the amount that the Portfolio might reasonably expect to receive for the security upon its current sale in the ordinary course. Each such determination is based on a consideration of relevant factors, which are likely to vary from one pricing context to another. These factors may include, but are not limited to, the type of security, the existence of any contractual restrictions on the security’s disposition, the price and extent of public trading in similar securities of the issuer or of comparable companies or entities, quotations or relevant information obtained from broker/dealers or other market participants, information obtained from the issuer, analysts, and/or the appropriate stock exchange (for exchange-traded securities), an analysis of the company’s or entity’s financial statements, and an evaluation of the forces that influence the issuer and the market(s) in which the security is purchased and sold.
B Investment Transactions — Investment transactions for financial statement purposes are accounted for on a trade date basis. Realized gains and losses on investments sold are determined on the basis of identified cost.
C Income — Interest income is recorded on the basis of interest accrued, adjusted for amortization of premium or accretion of discount. Fees associated with loan amendments are recognized immediately. Dividend income is recorded on the ex-dividend date for dividends received in cash and/or securities. Withholding taxes on foreign dividends have been provided for in accordance with the Portfolio’s understanding of the applicable countries’ tax rules and rates. Distributions from investment companies are recorded as dividend income, capital gains or return of capital based on the nature of the distribution.
D Federal Taxes — The Portfolio has elected to be treated as a partnership for federal tax purposes. No provision is made by the Portfolio for federal or state taxes on any taxable income of the Portfolio because each investor in the Portfolio is ultimately responsible for the payment of any taxes on its share of taxable income. Since at least one of the Portfolio’s investors is a regulated investment company that invests all or substantially all of its assets in the Portfolio, the Portfolio normally must satisfy the applicable source of income and diversification requirements (under the Internal Revenue Code) in order for its investors to satisfy them. The Portfolio will allocate, at least annually among its investors, each investor’s distributive share of the Portfolio’s net investment income, net realized capital gains and losses and any other items of income, gain, loss, deduction or credit.
As of October 31, 2022, the Portfolio had no uncertain tax positions that would require financial statement recognition, de-recognition, or disclosure. The Portfolio files a U.S. federal income tax return annually after its fiscal year-end, which is subject to examination by the Internal Revenue Service for a period of three years from the date of filing.
E Foreign Currency Translation — Investment valuations, other assets, and liabilities initially expressed in foreign currencies are translated each business day into U.S. dollars based upon current exchange rates. Purchases and sales of foreign investment securities and income and expenses denominated in foreign currencies are translated into U.S. dollars based upon currency exchange rates in effect on the respective dates of such transactions. Recognized gains or losses on investment transactions attributable to changes in foreign currency exchange rates are recorded for financial statement purposes as net realized gains and losses on investments. That portion of unrealized gains and losses on investments that results from fluctuations in foreign currency exchange rates is not separately disclosed.
F Use of Estimates — The preparation of the financial statements in conformity with U.S. GAAP requires management to make estimates and assumptions that affect the reported amounts of assets and liabilities at the date of the financial statements and the reported amounts of income and expense during the reporting period. Actual results could differ from those estimates.
G Indemnifications — Under the Portfolio’s organizational documents, its officers and Trustees may be indemnified against certain liabilities and expenses arising out of the performance of their duties to the Portfolio. Under Massachusetts law, if certain conditions prevail, interestholders in the Portfolio could be deemed to have personal liability for the obligations of the Portfolio. However, the Portfolio’s Declaration of Trust contains an express disclaimer of liability on the part of Portfolio interestholders. Additionally, in the normal course of business, the Portfolio enters into agreements with service providers that may contain indemnification clauses. The Portfolio’s maximum exposure under these arrangements is unknown as this would involve future claims that may be made against the Portfolio that have not yet occurred.
H Forward Foreign Currency Exchange Contracts — The Portfolio may enter into forward foreign currency exchange contracts for the purchase or sale of a specific foreign currency at a fixed price on a future date. The forward foreign currency exchange contracts are adjusted by the daily exchange rate of the underlying currency and any gains or losses are recorded as unrealized until such time as the contracts have been closed. Risks may arise upon entering these contracts from the potential inability of counterparties to meet the terms of their contracts and from movements in the value of a foreign currency relative to the U.S. dollar.
I Credit Default Swaps — Swap contracts are privately negotiated agreements between the Portfolio and a counterparty. Certain swap contracts may be centrally cleared (“centrally cleared swaps”), whereby all payments made or received by the Portfolio pursuant to the contract are with a central clearing party (CCP) rather than the original counterparty. The CCP guarantees the performance of the original parties to the contract. Upon entering into centrally cleared swaps, the Portfolio is required to deposit with the CCP, either in cash or securities, an amount of initial margin determined by the CCP, which is
High Income Opportunities Portfolio
October 31, 2022
Notes to Financial Statements — continued
subject to adjustment. When the Portfolio is the buyer of a credit default swap contract, the Portfolio is entitled to receive the par (or other agreed-upon) value of a referenced debt obligation (or basket of debt obligations) from the counterparty (or CCP in the case of a centrally cleared swap) to the contract if a credit event by a third party, such as a U.S. or foreign corporate issuer or sovereign issuer, on the debt obligation occurs. In return, the Portfolio pays the counterparty a periodic stream of payments over the term of the contract provided that no credit event has occurred. If no credit event occurs, the Portfolio would have spent the stream of payments and received no proceeds from the contract. When the Portfolio is the seller of a credit default swap contract, it receives the stream of payments, but is obligated to pay to the buyer of the protection an amount up to the notional amount of the swap and in certain instances take delivery of securities of the reference entity upon the occurrence of a credit event, as defined under the terms of that particular swap agreement. Credit events are contract specific but may include bankruptcy, failure to pay, restructuring, obligation acceleration and repudiation/moratorium. If the Portfolio is a seller of protection and a credit event occurs, the maximum potential amount of future payments that the Portfolio could be required to make would be an amount equal to the notional amount of the agreement. This potential amount would be partially offset by any recovery value of the respective referenced obligation, or net amount received from the settlement of a buy protection credit default swap agreement entered into by the Portfolio for the same referenced obligation. As the seller, the Portfolio may create economic leverage to its portfolio because, in addition to its total net assets, the Portfolio is subject to investment exposure on the notional amount of the swap. The interest fee paid or received on the swap contract, which is based on a specified interest rate on a fixed notional amount, is accrued daily as a component of unrealized appreciation (depreciation) and is recorded as realized gain upon receipt or realized loss upon payment. The Portfolio also records an increase or decrease to unrealized appreciation (depreciation) in an amount equal to the daily valuation. For centrally cleared swaps, the daily change in valuation is recorded as a receivable or payable for variation margin and settled in cash with the CCP daily. All upfront payments and receipts, if any, are amortized over the life of the swap contract as realized gains or losses. Those upfront payments or receipts for non-centrally cleared swaps are recorded as other assets or other liabilities, respectively, net of amortization. For financial reporting purposes, unamortized upfront payments or receipts, if any, are netted with unrealized appreciation or depreciation on swap contracts to determine the market value of swaps. These transactions involve certain risks, including the risk that the seller may be unable to fulfill the transaction. In the case of centrally cleared swaps, counterparty risk is minimal due to protections provided by the CCP.
2 Investment Adviser Fee and Other Transactions with Affiliates
The investment adviser fee is earned by Boston Management and Research (BMR), an indirect, wholly-owned subsidiary of Morgan Stanley. as compensation for investment advisory services rendered to the Portfolio. The investment adviser fee is based upon a percentage of total daily net assets plus a percentage of total daily gross income as follows and is payable monthly:
| | | | | | | | |
| Total Daily Net Assets | | Annual Asset
Rate | | | Daily Income
Rate | |
| | |
Up to $500 million | | | 0.300 | % | | | 3.000 | % |
| | |
$500 million but less than $1 billion | | | 0.275 | % | | | 2.750 | % |
| | |
$1 billion but less than $1.5 billion | | | 0.250 | % | | | 2.500 | % |
| | |
$1.5 billion but less than $2 billion | | | 0.225 | % | | | 2.250 | % |
| | |
$2 billion but less than $3 billion | | | 0.200 | % | | | 2.000 | % |
| | |
$3 billion and over | | | 0.175 | % | | | 1.750 | % |
For the year ended October 31, 2022, the Portfolio’s investment adviser fee amounted to $4,762,114 or 0.44% of the Portfolio’s average daily net assets. Pursuant to an investment sub-advisory agreement, BMR has delegated a portion of the investment management of the Portfolio to Eaton Vance Advisers International Ltd. (EVAIL), an affiliate of BMR. BMR pays EVAIL a portion of its investment adviser fee for sub-advisory services provided to the Portfolio. Effective April 26, 2022, the Portfolio may invest in a money market fund, the Institutional Class of the Morgan Stanley Institutional Liquidity Funds -Government Portfolio (the “Liquidity Fund”), an open-end management investment company managed by Morgan Stanley Investment Management Inc., a wholly-owned subsidiary of Morgan Stanley. The investment adviser fee paid by the Portfolio is reduced by an amount equal to its pro-rata share of the advisory and administration fees paid by the Portfolio due to its investment in the Liquidity Fund. For the year ended October 31, 2022, the investment adviser fee paid was reduced by $34,133 relating to the Portfolio’s investment in the Liquidity Fund. Prior to April 26, 2022, the Portfolio may have invested its cash in Eaton Vance Cash Reserves Fund, LLC (Cash Reserves Fund), an affiliated investment company managed by Eaton Vance Management (EVM), an affiliate of BMR. EVM did not receive a fee for advisory services provided to Cash Reserves Fund.
Trustees and officers of the Portfolio who are members of EVM’s or BMR’s organizations receive remuneration for their services to the Portfolio out of the investment adviser fee. Trustees of the Portfolio who are not affiliated with the investment adviser may elect to defer receipt of all or a percentage of their annual fees in accordance with the terms of the Trustees Deferred Compensation Plan. For the year ended October 31, 2022, no significant amounts have been deferred. Certain officers and Trustees of the Portfolio are officers of the above organizations.
High Income Opportunities Portfolio
October 31, 2022
Notes to Financial Statements — continued
3 Purchases and Sales of Investments
Purchases and sales of investments, other than short-term obligations and including maturities, paydowns and principal repayments on Senior Loans, aggregated $457,052,024 and $187,097,772, respectively, for the year ended October 31, 2022.
4 Federal Income Tax Basis of Investments
The cost and unrealized appreciation (depreciation) of investments, including open derivative contracts, of the Portfolio at October 31, 2022, as determined on a federal income tax basis, were as follows:
| | | | |
| |
Aggregate cost | | $ | 1,102,524,863 | |
| |
Gross unrealized appreciation | | | 41,559,096 | |
| |
Gross unrealized depreciation | | | (137,985,366 | ) |
| |
Net unrealized depreciation | | $ | (96,426,270 | ) |
5 Restricted Securities
At October 31, 2022, the Portfolio owned the following securities (representing 3.6% of net assets) which were restricted as to public resale and not registered under the Securities Act of 1933 (excluding Rule 144A securities). The Portfolio has various registration rights (exercisable under a variety of circumstances) with respect to these securities. The value of these securities is determined based on valuations provided by brokers when available, or if not available, they are valued at fair value using methods determined in good faith by or at the direction of the Trustees.
| | | | | | | | | | | | | | | | |
| Description | | Date(s) of
Acquisition | | | Shares | | | Cost | | | Value | |
| | | | |
Common Stocks | | | | | | | | | | | | | | | | |
| | | | |
Ascent CNR Corp., Class A | | | 4/25/16, 11/16/16 | | | | 6,273,462 | | | $ | 0 | | | $ | 1,631,100 | |
| | | | |
iFIT Health and Fitness, Inc. | | | 10/06/22 | | | | 514,080 | | | | 1,799,280 | | | | 359,856 | |
| | | | |
New Cotai Participation Corp., Class B | | | 4/12/13 | | | | 7 | | | | 216,125 | | | | 0 | |
| | | | |
Nine Point Energy Holdings, Inc. | | | 7/15/14, 10/21/14 | | | | 31,737 | | | | 1,460,742 | | | | 0 | |
| | | | |
Total Common Stocks | | | | | | | | | | $ | 3,476,147 | | | $ | 1,990,956 | |
| | | | |
Convertible Preferred Stocks | | | | | | | | | | | | | | | | |
| | | | |
Nine Point Energy Holdings, Inc., Series A, 12.00% (PIK) | | | 5/26/17 | | | | 591 | | | $ | 591,000 | | | $ | 0 | |
| | | | |
Total Convertible Preferred Stocks | | | | | | | | | | $ | 591,000 | | | $ | 0 | |
| | | | |
Miscellaneous | | | | | | | | | | | | | | | | |
| | | | |
PGP Investors, LLC, Membership Interests | |
| 2/18/15, 4/23/18,
12/17/21 |
| | | 15,849 | | | $ | 295,372 | | | $ | 34,364,043 | |
| | | | |
Total Miscellaneous | | | | | | | | | | $ | 295,372 | | | $ | 34,364,043 | |
| | | | |
Total Restricted Securities | | | | | | | | | | $ | 4,362,519 | | | $ | 36,354,999 | |
6 Financial Instruments
The Portfolio may trade in financial instruments with off-balance sheet risk in the normal course of its investing activities. These financial instruments may include forward foreign currency exchange contracts and swap contracts and may involve, to a varying degree, elements of risk in excess of the amounts
High Income Opportunities Portfolio
October 31, 2022
Notes to Financial Statements — continued
recognized for financial statement purposes. The notional or contractual amounts of these instruments represent the investment the Portfolio has in particular classes of financial instruments and do not necessarily represent the amounts potentially subject to risk. The measurement of the risks associated with these instruments is meaningful only when all related and offsetting transactions are considered. A summary of obligations under these financial instruments at October 31, 2022 is included in the Portfolio of Investments. At October 31, 2022, the Portfolio had sufficient cash and/or securities to cover commitments under these contracts.
In the normal course of pursuing its investment objective, the Portfolio is subject to the following risks:
Credit Risk: The Portfolio enters into credit default swap contracts to manage its credit risk, to gain exposure to a credit in which it may otherwise invest, or to enhance total return.
Foreign Exchange Risk: The Portfolio holds foreign currency denominated investments. The value of these investments and related receivables and payables may change due to future changes in foreign currency exchange rates. To hedge against this risk, the Portfolio enters into forward foreign currency exchange contracts.
The Portfolio enters into forward foreign currency exchange contracts that may contain provisions whereby the counterparty may terminate the contract under certain conditions, including but not limited to a decline in the Portfolio’s net assets below a certain level over a certain period of time, which would trigger a payment by the Portfolio for those derivatives in a liability position. At October 31, 2022, the Portfolio had no open derivatives with credit-related contingent features in a net liability position.
The over-the-counter (OTC) derivatives in which the Portfolio invests are subject to the risk that the counterparty to the contract fails to perform its obligations under the contract. To mitigate this risk, the Portfolio has entered into an International Swaps and Derivatives Association, Inc. Master Agreement (“ISDA Master Agreement”) or similar agreement with substantially all its derivative counterparties. An ISDA Master Agreement is a bilateral agreement between the Portfolio and a counterparty that governs certain OTC derivatives and typically contains, among other things, set-off provisions in the event of a default and/or termination event as defined under the relevant ISDA Master Agreement. Under an ISDA Master Agreement, the Portfolio may, under certain circumstances, offset with the counterparty certain derivative financial instruments’ payables and/or receivables with collateral held and/or posted and create one single net payment. The provisions of the ISDA Master Agreement typically permit a single net payment in the event of default including the bankruptcy or insolvency of the counterparty. However, bankruptcy or insolvency laws of a particular jurisdiction may impose restrictions on or prohibitions against the right of offset in bankruptcy or insolvency. Certain ISDA Master Agreements allow counterparties to OTC derivatives to terminate derivative contracts prior to maturity in the event the Portfolio’s net assets decline by a stated percentage or the Portfolio fails to meet the terms of its ISDA Master Agreements, which would cause the counterparty to accelerate payment by the Portfolio of any net liability owed to it.
The collateral requirements for derivatives traded under an ISDA Master Agreement are governed by a Credit Support Annex to the ISDA Master Agreement. Collateral requirements are determined at the close of business each day and are typically based on changes in market values for each transaction under an ISDA Master Agreement and netted into one amount for such agreement. Generally, the amount of collateral due from or to a counterparty is subject to a minimum transfer threshold amount before a transfer is required, which may vary by counterparty. Collateral pledged for the benefit of the Portfolio and/or counterparty is held in segregated accounts by the Portfolio’s custodian and cannot be sold, re-pledged, assigned or otherwise used while pledged. The portion of such collateral representing cash, if any, is reflected as deposits for derivatives collateral and, in the case of cash pledged by a counterparty for the benefit of the Portfolio, a corresponding liability on the Statement of Assets and Liabilities. Securities pledged by the Portfolio as collateral, if any, are identified as such in the Portfolio of Investments.
The fair value of open derivative instruments (not considered to be hedging instruments for accounting disclosure purposes) and whose primary underlying risk exposure is foreign exchange risk at October 31, 2022 was as follows:
| | | | | | | | |
| | | Fair Value | |
| Derivative | | Asset Derivative | | | Liability Derivative | |
| | |
Forward foreign currency exchange contracts | | $ | 199,929 | (1) | | $ | — | |
| (1) | Statement of Assets and Liabilities location: Receivable for open forward foreign currency exchange contracts. |
High Income Opportunities Portfolio
October 31, 2022
Notes to Financial Statements — continued
The Portfolio’s derivative assets at fair value by type, which are reported gross in the Statement of Assets and Liabilities, are presented in the table above. The following table presents the Portfolio’s derivative assets by counterparty, net of amounts available for offset under a master netting agreement and net of the related collateral received by the Portfolio for such assets as of October 31, 2022.
| | | | | | | | | | | | | | | | | | | | |
| Counterparty | | Derivative
Assets Subject to
Master Netting
Agreement | | | Derivatives
Available
for Offset | | | Non-cash
Collateral
Received(a) | | | Cash Collateral Received(a) | | | Net Amount
of Derivative
Assets(b) | |
| | | | | |
Bank of America, N.A. | | | $196,275 | | | $ | — | | | $ | — | | | $ | (110,000 | ) | | $ | 86,275 | |
| | | | | |
Citibank, N.A. | | | 262 | | | | — | | | | — | | | | — | | | | 262 | |
| | | | | |
HSBC Bank USA, N.A. | | | 3,392 | | | | — | | | | — | | | | — | | | | 3,392 | |
| | | | | |
| | | $ | 199,929 | | | $ | — | | | $ | — | | | $ | (110,000 | ) | | $ | 89,929 | |
| (a) | In some instances, the total collateral received and/or pledged may be more than the amount shown due to overcollateralization. |
| (b) | Net amount represents the net amount due from the counterparty in the event of default. |
The effect of derivative instruments (not considered to be hedging instruments for accounting disclosure purposes) on the Statement of Operations by risk exposure for the year ended October 31, 2022 was as follows:
| | | | | | | | | | |
| Risk | | Derivative | | Realized Gain (Loss)
on Derivatives Recognized
in Income(1) | | | Change in Unrealized
Appreciation (Depreciation) on
Derivatives Recognized in Income(2) | |
| | | |
Credit | | Swap contracts (centrally cleared) | | $ | (114,503 | ) | | $ | (4,385 | ) |
| | | |
Foreign Exchange | | Forward foreign currency exchange contracts | | | 2,554,125 | | | | 148,630 | |
| | | |
Total | | | | $ | 2,439,622 | | | $ | 144,245 | |
| (1) | Statement of Operations location: Net realized gain (loss) – Swap contracts and Forward foreign currency exchange contracts, respectively. |
| (2) | Statement of Operations location: Change in unrealized appreciation (depreciation) – Swap contracts and Forward foreign currency exchange contracts, respectively. |
The average notional amounts of derivative contracts outstanding during the year ended October 31, 2022, which are indicative of the volume of these derivative types, were as follows:
| | | | | | |
Forward
Foreign Currency
Exchange Contracts* | | | Swap
Contracts | |
| |
| | $18,654,000 | | | $ | 3,462,000 | |
| * | The average notional amount for forward foreign currency exchange contracts is based on the absolute value of notional amounts of currency purchased and currency sold. |
High Income Opportunities Portfolio
October 31, 2022
Notes to Financial Statements — continued
7 Line of Credit
The Portfolio participates with other portfolios and funds managed by EVM and its affiliates in a $725 million unsecured line of credit agreement with a group of banks, which is in effect through October 24, 2023. In connection with the renewal of the agreement on October 25, 2022, the borrowing limit was decreased from $800 million. Borrowings are made by the Portfolio solely for temporary purposes related to redemptions and other short-term cash needs. Interest is charged to the Portfolio based on its borrowings at an amount above either the Secured Overnight Financing Rate (SOFR) or Federal Funds rate. In addition, a fee computed at an annual rate of 0.15% on the daily unused portion of the line of credit is allocated among the participating portfolios and funds at the end of each quarter. Also in connection with the renewal of the agreement, an arrangement fee totaling $150,000 was incurred that was allocated to the participating portfolios and funds. Because the line of credit is not available exclusively to the Portfolio, it may be unable to borrow some or all of its requested amounts at any particular time. The Portfolio did not have any significant borrowings or allocated fees during the year ended October 31, 2022.
8 Investments in Affiliated Funds
At October 31, 2022, the value of the Portfolio’s investment in funds that may be deemed to be affiliated was $37,909,716, which represents 3.7% of the Portfolio’s net assets. Transactions in affiliated funds by the Portfolio for the year ended October 31, 2022 were as follows:
| | | | | | | | | | | | | | | | | | | | | | | | | | | | | | | | |
| Name | | Value,
beginning
of period | | | Purchases | | | Sales
proceeds | | | Net
realized
gain (loss) | | | Change in
unrealized
appreciation (depreciation) | | | Value, end
of period | | | Dividend
income | | | Units/Shares,
end of period | |
| | | | | | | | |
Short-Term Investments | | | | | | | | | | | | | | | | | | | | | | | | | | | | | | | | |
| | | | | | | | |
Cash Reserves Fund | | $ | 43,702,301 | | | $ | 257,583,839 | | | $ | (301,281,954 | ) | | $ | (4,186 | ) | | $ | — | | | $ | — | | | $ | 23,552 | | | | — | |
| | | | | | | | |
Liquidity Fund | | | — | | | | 216,266,066 | | | | (178,356,350 | ) | | | — | | | | — | | | | 37,909,716 | | | | 397,440 | | | | 37,909,716 | |
| | | | | | | | |
Total | | | | | | | | | | | | | | $ | (4,186 | ) | | $ | — | | | $ | 37,909,716 | | | $ | 420,992 | | | | | |
9 Fair Value Measurements
Under generally accepted accounting principles for fair value measurements, a three-tier hierarchy to prioritize the assumptions, referred to as inputs, is used in valuation techniques to measure fair value. The three-tier hierarchy of inputs is summarized in the three broad levels listed below.
| • | | Level 1 – quoted prices in active markets for identical investments |
| • | | Level 2 – other significant observable inputs (including quoted prices for similar investments, interest rates, prepayment speeds, credit risk, etc.) |
| • | | Level 3 – significant unobservable inputs (including a fund’s own assumptions in determining the fair value of investments) |
In cases where the inputs used to measure fair value fall in different levels of the fair value hierarchy, the level disclosed is determined based on the lowest level input that is significant to the fair value measurement in its entirety. The inputs or methodology used for valuing securities are not necessarily an indication of the risk associated with investing in those securities.
At October 31, 2022, the hierarchy of inputs used in valuing the Portfolio’s investments and open derivative instruments, which are carried at value, were as follows:
| | | | | | | | | | | | | | | | |
| Asset Description | | Level 1 | | | Level 2 | | | Level 3 | | | Total | |
| | | | |
Asset-Backed Securities | | $ | — | | | $ | 20,759,839 | | | $ | — | | | $ | 20,759,839 | |
| | | | |
Commercial Mortgage-Backed Securities | | | — | | | | 2,333,528 | | | | — | | | | 2,333,528 | |
| | | | |
Common Stocks | | | 16,535,553 | | | | 18,079 | | | | 1,990,956 | | | | 18,544,588 | |
| | | | |
Convertible Bonds | | | — | | | | 3,451,170 | | | | — | | | | 3,451,170 | |
| | | | |
Convertible Preferred Stocks | | | 2,493,921 | | | | 22,350 | | | | 0 | | | | 2,516,271 | |
| | | | |
Corporate Bonds | | | — | | | | 841,873,941 | | | | — | | | | 841,873,941 | |
| | | | |
Preferred Stocks | | | 3,982,176 | | | | — | | | | — | | | | 3,982,176 | |
| | | | |
Senior Floating-Rate Loans | | | — | | | | 40,325,671 | | | | — | | | | 40,325,671 | |
| | | | |
Miscellaneous | | | — | | | | 37,650 | | | | 34,364,043 | | | | 34,401,693 | |
High Income Opportunities Portfolio
October 31, 2022
Notes to Financial Statements — continued
| | | | | | | | | | | | | | | | |
| Asset Description (continued) | | Level 1 | | | Level 2 | | | Level 3 | | | Total | |
| | | | |
Short-Term Investments | | $ | 37,909,716 | | | $ | — | | | $ | — | | | $ | 37,909,716 | |
| | | | |
Total Investments | | $ | 60,921,366 | | | $ | 908,822,228 | | | $ | 36,354,999 | | | $ | 1,006,098,593 | |
| | | | |
Forward Foreign Currency Exchange Contracts | | $ | — | | | $ | 199,929 | | | $ | — | | | $ | 199,929 | |
| | | | |
Total | | $ | 60,921,366 | | | $ | 909,022,157 | | | $ | 36,354,999 | | | $ | 1,006,298,522 | |
The following is a reconciliation of Level 3 investments for which significant unobservable inputs were used to determine fair value:
| | | | | | | | | | | | | | | | |
| | | Common Stocks | | | Convertible Preferred
Stocks | | | Miscellaneous | | | Total | |
| | | | |
Balance as of October 31, 2021 | | $ | 8,166,894 | | | $ | 0 | | | $ | 10,053,840 | | | $ | 18,220,734 | |
| | | | |
Realized gains (losses) | | | 1,068,830 | | | | — | | | | — | | | | 1,068,830 | |
| | | | |
Change in net unrealized appreciation (depreciation) | | | (7,244,768 | ) | | | — | | | | 25,511,282 | | | | 18,266,514 | |
| | | | |
Cost of purchases | | | 1,799,280 | | | | — | | | | 340,355 | | | | 2,139,635 | |
| | | | |
Proceeds from sales, including return of capital | | | (1,799,280 | ) | | | — | | | | (1,541,434 | ) | | | (3,340,714 | ) |
| | | | |
Accrued discount (premium) | | | — | | | | — | | | | — | | | | — | |
| | | | |
Transfers to Level 3 | | | — | | | | — | | | | — | | | | — | |
| | | | |
Transfers from Level 3 | | | — | | | | — | | | | — | | | | — | |
| | | | |
Balance as of October 31, 2022 | | $ | 1,990,956 | | | $ | 0 | | | $ | 34,364,043 | | | $ | 36,354,999 | |
| | | | |
Change in net unrealized appreciation (depreciation) on investments still held as of October 31, 2022 | | $ | (623,874 | ) | | $ | — | | | $ | 25,511,282 | | | $ | 24,887,408 | |
The following is a summary of quantitative information about significant unobservable valuation inputs for Level 3 investments held as of October 31, 2022:
| | | | | | | | | | | | | | | | |
| Type of Investment | | Fair Value as of
October 31, 2022 | | | Valuation Technique | | Unobservable Input | | Input | | | Impact to
Valuation from
an Increase to Input* | |
| | | | | |
Common Stocks | | $ | 1,631,100 | | | Market approach | | EBITDA multiple
discount rate | | | 15 | % | | | Decrease | |
| | | | | |
Common Stocks | | $ | 359,856 | | | Discounted cash flow
blended terminal value | | Discount rate | | | 25 | % | | | Increase | |
| | | | | |
Convertible Preferred Stocks | | $ | 0 | | | Estimated recovery value | | Estimated recovery
value percentage | | | 0 | % | | | Increase | |
| | | | | |
Miscellaneous | | $ | 34,364,043 | | | Market approach | | Liquidity discount | | | 15 | % | | | Decrease | |
Included in common stocks and miscellaneous are securites valued at $0 based on their estimated recovery value percentage.
| * | Represents the directional change in the fair value of the Level 3 investments that would result from an increase to the corresponding unobservable input. A decrease to the unobservable input would have the opposite effect. |
10 Risks and Uncertainties
Credit Risk
The Portfolio primarily invests in lower rated and comparable quality unrated high yield securities. These investments have different risks than investments in debt securities rated investment grade. Risk of loss upon default by the borrower is significantly greater with respect to such debt than with other debt securities because these securities are generally unsecured and are more sensitive to adverse economic conditions, such as recession or increasing interest rates, than are investment grade issuers.
High Income Opportunities Portfolio
October 31, 2022
Notes to Financial Statements — continued
Pandemic Risk
An outbreak of respiratory disease caused by a novel coronavirus was first detected in China in late 2019 and subsequently spread internationally. This coronavirus has resulted in closing borders, enhanced health screenings, changes to healthcare service preparation and delivery, quarantines, cancellations, disruptions to supply chains and customer activity, as well as general concern and uncertainty. Health crises caused by outbreaks of disease, such as the coronavirus outbreak, may exacerbate other pre-existing political, social and economic risks and disrupt normal market conditions and operations. The impact of this outbreak has negatively affected the worldwide economy, as well as the economies of individual countries and industries, and could continue to affect the market in significant and unforeseen ways. Other epidemics and pandemics that may arise in the future may have similar effects. Any such impact could adversely affect the Portfolio’s performance, or the performance of the securities in which the Portfolio invests.
High Income Opportunities Portfolio
October 31, 2022
Report of Independent Registered Public Accounting Firm
To the Trustees and Investors of High Income Opportunities Portfolio:
Opinion on the Financial Statements and Financial Highlights
We have audited the accompanying statement of assets and liabilities of High Income Opportunities Portfolio (the “Portfolio”), including the portfolio of investments, as of October 31, 2022, the related statement of operations for the year then ended, the statements of changes in net assets for each of the two years in the period then ended, the financial highlights for each of the five years in the period then ended, and the related notes. In our opinion, the financial statements and financial highlights present fairly, in all material respects, the financial position of the Portfolio as of October 31, 2022, and the results of its operations for the year then ended, the changes in its net assets for each of the two years in the period then ended, and the financial highlights for each of the five years in the period then ended, in conformity with accounting principles generally accepted in the United States of America.
Basis for Opinion
These financial statements and financial highlights are the responsibility of the Portfolio’s management. Our responsibility is to express an opinion on the Portfolio’s financial statements and financial highlights based on our audits. We are a public accounting firm registered with the Public Company Accounting Oversight Board (United States) (PCAOB) and are required to be independent with respect to the Portfolio in accordance with the U.S. federal securities laws and the applicable rules and regulations of the Securities and Exchange Commission and the PCAOB.
We conducted our audits in accordance with the standards of the PCAOB. Those standards require that we plan and perform the audit to obtain reasonable assurance about whether the financial statements and financial highlights are free of material misstatement, whether due to error or fraud. The Portfolio is not required to have, nor were we engaged to perform, an audit of its internal control over financial reporting. As part of our audits, we are required to obtain an understanding of internal control over financial reporting but not for the purpose of expressing an opinion on the effectiveness of the Portfolio’s internal control over financial reporting. Accordingly, we express no such opinion.
Our audits included performing procedures to assess the risks of material misstatement of the financial statements and financial highlights, whether due to error or fraud, and performing procedures that respond to those risks. Such procedures included examining, on a test basis, evidence regarding the amounts and disclosures in the financial statements and financial highlights. Our audits also included evaluating the accounting principles used and significant estimates made by management, as well as evaluating the overall presentation of the financial statements and financial highlights. Our procedures included confirmation of securities and senior loans owned as of October 31, 2022, by correspondence with the custodian, brokers, and selling or agent banks; when replies were not received from brokers and selling or agent banks, we performed other auditing procedures. We believe that our audits provide a reasonable basis for our opinion.
/s/ Deloitte & Touche LLP
Boston, Massachusetts
December 22, 2022
We have served as the auditor of one or more Eaton Vance investment companies since 1959.
Eaton Vance
High Income Opportunities Fund
October 31, 2022
Board of Trustees’ Contract Approval
Overview of the Contract Review Process
The Investment Company Act of 1940, as amended (the “1940 Act”), provides, in substance, that the investment advisory agreement between a fund and its investment adviser will continue in effect from year-to-year only if its continuation is approved on an annual basis by a vote of the fund’s board of trustees, including a majority of the trustees who are not “interested persons” of the fund (“independent trustees”), cast in person at a meeting called for the purpose of considering such approval.
At a meeting held on June 8, 2022, the Boards of Trustees/Directors (collectively, the “Board”) that oversee the registered investment companies advised by Eaton Vance Management or its affiliate, Boston Management and Research (the “Eaton Vance Funds”), including a majority of the independent trustees (the “Independent Trustees”), voted to approve the continuation of existing investment advisory agreements and sub-advisory agreements1 for each of the Eaton Vance Funds for an additional one-year period. The Board relied upon the affirmative recommendation of its Contract Review Committee, which is a committee exclusively comprised of Independent Trustees. Prior to making its recommendation, the Contract Review Committee reviewed information furnished by the adviser and sub-adviser to each of the Eaton Vance Funds (including information specifically requested by the Board) for a series of formal meetings held between April and June 2022. Members of the Contract Review Committee also considered information received at prior meetings of the Board and its committees, to the extent such information was relevant to the Contract Review Committee’s annual evaluation of the investment advisory agreements and sub-advisory agreements.
In connection with its evaluation of the investment advisory agreements and sub-advisory agreements, the Board considered various information relating to the Eaton Vance Funds. This included information applicable to all or groups of Eaton Vance Funds, which is referenced immediately below, and information applicable to the particular Eaton Vance Fund covered by this report (additional fund-specific information is referenced below under “Results of the Contract Review Process”). (For funds that invest through one or more underlying portfolios, references to “each fund” in this section may include information that was considered at the portfolio-level.)
Information about Fees, Performance and Expenses
| | • | | A report from an independent data provider comparing advisory and other fees paid by each fund to such fees paid by comparable funds, as identified by the independent data provider (“comparable funds”); |
| | • | | A report from an independent data provider comparing each fund’s total expense ratio (and its components) to those of comparable funds; |
| | • | | A report from an independent data provider comparing the investment performance of each fund (including, as relevant, total return data, income data, Sharpe ratios and information ratios) to the investment performance of comparable funds and, as applicable, benchmark indices, over various time periods; |
| | • | | In certain instances, data regarding investment performance relative to customized groups of peer funds and blended indices identified by the adviser in consultation with the Portfolio Management Committee of the Board (a committee exclusively comprised of Independent Trustees); |
| | • | | Comparative information concerning the fees charged and services provided by the adviser and sub-adviser to each fund in managing other accounts (which may include other mutual funds, collective investment funds and institutional accounts) using investment strategies and techniques similar to those used in managing such fund(s), if any; |
| | • | | Profitability analyses with respect to the adviser and sub-adviser to each of the funds; |
Information about Portfolio Management and Trading
| | • | | Descriptions of the investment management services provided to each fund, as well as each of the funds’ investment strategies and policies; |
| | • | | The procedures and processes used to determine the value of fund assets, including, when necessary, the determination of “fair value” and actions taken to monitor and test the effectiveness of such procedures and processes; |
| | • | | Information about the policies and practices of each fund’s adviser and sub-adviser with respect to trading, including their processes for seeking best execution of portfolio transactions; |
| | • | | Information about the allocation of brokerage transactions and the benefits, if any, received by the adviser and sub-adviser to each fund as a result of brokerage allocation, including, as applicable, information concerning the acquisition of research through client commission arrangements and policies with respect to “soft dollars”; |
| | • | | Data relating to the portfolio turnover rate of each fund and related information regarding active management in the context of particular strategies; |
Information about each Adviser and Sub-adviser
| | • | | Reports detailing the financial results and condition of the adviser and sub-adviser to each fund; |
| 1 | Not all Eaton Vance Funds have entered into a sub-advisory agreement with a sub-adviser. Accordingly, references to “sub-adviser” or “sub-advisory agreement” in this “Overview” section may not be applicable to the particular Eaton Vance Fund covered by this report. Following the “Overview” section, further information regarding the Board’s evaluation of a fund’s contractual arrangements is included under the “Results of the Contract Review Process” section. |
Eaton Vance
High Income Opportunities Fund
October 31, 2022
Board of Trustees’ Contract Approval — continued
| | • | | Information regarding the individual investment professionals whose responsibilities include portfolio management and investment research for the funds, and, for portfolio managers and certain other investment professionals, information relating to their responsibilities with respect to managing other mutual funds and investment accounts, as applicable; |
| | • | | Information regarding the adviser’s and its parent company’s (Morgan Stanley’s) efforts to retain and attract talented investment professionals, including in the context of a particularly competitive marketplace for talent, as well as the ongoing unique environment presented by hybrid, remote and other alternative work arrangements; |
| | • | | The Code of Ethics of the adviser and its affiliates and the sub-adviser of each fund, together with information relating to compliance with, and the administration of, such codes; |
| | • | | Policies and procedures relating to proxy voting, including regular reporting with respect to fund proxy voting activities; |
| | • | | Information regarding the handling of corporate actions and class actions, as well as information regarding litigation and other regulatory matters; |
| | • | | Information concerning the resources devoted to compliance efforts undertaken by the adviser and its affiliates and the sub-adviser of each fund, if any, including descriptions of their various compliance programs and their record of compliance; |
| | • | | Information concerning the business continuity and disaster recovery plans of the adviser and its affiliates and the sub-adviser of each fund, if any; |
| | • | | A description of Eaton Vance Management’s and Boston Management and Research’s oversight of sub-advisers, including with respect to regulatory and compliance issues, investment management and other matters; |
Other Relevant Information
| | • | | Information regarding ongoing initiatives to further integrate and harmonize, where applicable, the investment management and other departments of the adviser and its affiliates with the overall investment management infrastructure of Morgan Stanley, in light of Morgan Stanley’s acquisition of Eaton Vance on March 1, 2021; |
| | • | | Information concerning the nature, cost and character of the administrative and other non-investment advisory services provided by Eaton Vance Management and its affiliates; |
| | • | | Information concerning oversight of the relationship with the custodian, subcustodians, fund accountants, and other third-party service providers by the adviser and/or administrator to each of the funds; |
| | • | | Information concerning efforts to implement policies and procedures with respect to various new regulations applicable to the funds, including Rule 12d1-4 (the Fund-of-Funds Rule), Rule 18f-4 (the Derivatives Rule) and Rule 2a-5 (the Fair Valuation Rule); |
| | • | | For an Eaton Vance Fund structured as an exchange-listed closed-end fund, information concerning the benefits of the closed-end fund structure, as well as, where relevant, the closed-end fund’s market prices (including as compared to the closed-end fund’s net asset value (NAV)), trading volume data, continued use of auction preferred shares (where applicable), distribution rates and other relevant matters; |
| | • | | The risks which the adviser and/or its affiliates incur in connection with the management and operation of the funds, including, among others, litigation, regulatory, entrepreneurial, and other business risks (and the associated costs of such risks); and |
| | • | | The terms of each investment advisory agreement and sub-advisory agreement. |
During the various meetings of the Board and its committees over the course of the year leading up to the June 8, 2022 meeting, the Trustees received information from portfolio managers and other investment professionals of the advisers and sub-advisers of the funds regarding investment and performance matters, and considered various investment and trading strategies used in pursuing the funds’ investment objectives. The Trustees also received information regarding risk management techniques employed in connection with the management of the funds. The Board and its committees evaluated issues pertaining to industry and regulatory developments, compliance procedures, fund governance and other issues with respect to the funds, and received and participated in reports and presentations provided by Eaton Vance Management, Boston Management and Research and fund sub-advisers, with respect to such matters. In addition to the formal meetings of the Board and its committees, the Independent Trustees held regular teleconferences to discuss, among other topics, matters relating to the continuation of investment advisory agreements and sub-advisory agreements.
The Contract Review Committee was advised throughout the contract review process by Goodwin Procter LLP, independent legal counsel for the Independent Trustees. The members of the Contract Review Committee, with the advice of such counsel, exercised their own business judgment in determining the material factors to be considered in evaluating each investment advisory agreement and sub-advisory agreement and the weight to be given to each such factor. The conclusions reached with respect to each investment advisory agreement and sub-advisory agreement were based on a comprehensive evaluation of all the information provided and not any single factor. Moreover, each member of the Contract Review Committee may have placed varying emphasis on particular factors in reaching conclusions with respect to each investment advisory agreement and sub-advisory agreement. In evaluating each investment advisory agreement and sub-advisory agreement, including the fee structures and other terms contained in such agreements, the members of the Contract Review Committee were also informed by multiple years of analysis and discussion with the adviser and sub-adviser to each of the Eaton Vance Funds.
Results of the Contract Review Process
Based on its consideration of the foregoing, and such other information it deemed relevant, including the factors and conclusions described below, the Contract Review Committee concluded that the continuation of the investment advisory agreement between Eaton Vance High Income Opportunities Fund (the “Fund”) and Eaton Vance Management (“EVM”), as well as the investment advisory agreement between High Income Opportunities Portfolio (the “Portfolio”), the portfolio in which the Fund invests, and Boston Management and Research (“BMR”) (EVM, with respect to the Fund, and BMR, with
Eaton Vance
High Income Opportunities Fund
October 31, 2022
Board of Trustees’ Contract Approval — continued
respect to the Portfolio, are each referred to herein as the “Adviser”), and the sub-advisory agreement between EVM and Eaton Vance Advisers International Ltd. (the “Sub-adviser”), an affiliate of the Advisers, with respect to the Fund, and the sub-advisory agreement between BMR and the Sub-adviser, with respect to the Portfolio, including their respective fee structures, are in the interests of shareholders and, therefore, recommended to the Board approval of each agreement. Based on the recommendation of the Contract Review Committee, the Board, including a majority of the Independent Trustees, voted to approve continuation of the investment advisory agreements for the Fund and the Portfolio (together, the “investment advisory agreements”) and the sub-advisory agreements for the Fund and the Portfolio (together, the “sub-advisory agreements”).
Nature, Extent and Quality of Services
In considering whether to approve the investment advisory agreements and sub-advisory agreements for the Fund and the Portfolio, the Board evaluated the nature, extent and quality of services provided to the Fund and to the Portfolio by the applicable Adviser and the Sub-adviser, respectively.
The Board considered each Adviser’s and the Sub-adviser’s management capabilities and investment processes in light of the types of investments held by the Fund and the Portfolio, including the education, experience and number of investment professionals and other personnel who provide portfolio management, investment research, and similar services to the Fund and the Portfolio. Regarding each Adviser, the Board considered the Adviser’s responsibilities with respect to oversight of the Sub-adviser. The Board also considered the abilities and experience of each Adviser’s investment professionals in analyzing special considerations relevant to investing in high-yield debt. With respect to the Sub-adviser, the Board considered the abilities and experience of the Sub-adviser’s investment professionals in analyzing factors such as special considerations relevant to investing in global high yield debt and foreign markets. The Board considered the international investment capabilities of the Sub-adviser, which is based in London, and the benefits to the Fund and the Portfolio of having portfolio management services involving investments in international securities provided by investment professionals located abroad. The Board also took into account the resources dedicated to portfolio management and other services, the compensation methods of each Adviser and other factors, including the reputation and resources of each Adviser to recruit and retain highly qualified research, advisory and supervisory investment professionals. In addition, the Board considered the time and attention devoted to the Eaton Vance Funds, including the Fund and the Portfolio, by senior management, as well as the infrastructure, operational capabilities and support staff in place to assist in the portfolio management and operations of the Fund and the Portfolio, including the provision of administrative services. The Board also considered the business-related and other risks to which each Adviser or its affiliates may be subject in managing the Fund and the Portfolio.
The Board noted that, under the terms of the investment advisory agreement of the Fund, EVM may invest assets of the Fund directly in securities, for which it would receive a fee, or in the Portfolio, for which it receives no separate fee but for which BMR receives an advisory fee from the Portfolio.
The Board considered the compliance programs of each Adviser and relevant affiliates thereof, including the Sub-adviser. The Board considered compliance and reporting matters regarding, among other things, personal trading by investment professionals, disclosure of portfolio holdings, late trading, frequent trading, portfolio valuation, business continuity and the allocation of investment opportunities. The Board also considered the responses of each Adviser and its affiliates to requests in recent years from regulatory authorities, such as the Securities and Exchange Commission and the Financial Industry Regulatory Authority.
The Board considered other administrative services provided or overseen by EVM and its affiliates, including transfer agency and accounting services. The Board evaluated the benefits to shareholders of investing in a fund that is a part of a large fund complex offering exposure to a variety of asset classes and investment disciplines, as well as the ability, in many cases, to exchange an investment among different funds without incurring additional sales charges.
After consideration of the foregoing factors, among others, the Board concluded that the nature, extent and quality of services provided by each Adviser and the Sub-adviser, taken as a whole, are appropriate and consistent with the terms of the applicable investment advisory agreement and the applicable sub-advisory agreement.
Fund Performance
The Board compared the Fund’s investment performance to that of comparable funds identified by an independent data provider (the peer group), as well as appropriate benchmark indices. The Board’s review included comparative performance data with respect to the Fund for the one-, three-, five- and ten-year periods ended December 31, 2021. In this regard, the Board noted that the performance of the Fund was higher than the median performance of the Fund’s peer group for the three-year period. The Board also noted that the performance of the Fund was lower than its primary and secondary benchmark indexes for the three-year period. The Board concluded that the performance of the Fund was satisfactory.
Management Fees and Expenses
The Board considered contractual fee rates payable by the Portfolio and by the Fund for advisory and administrative services (referred to collectively as “management fees”). As part of its review, the Board considered the Fund’s management fees and total expense ratio for the one-year period ended December 31, 2021, as compared to those of comparable funds, before and after giving effect to any undertaking to waive fees or reimburse expenses. The Board also received and considered information about the services offered and the fee rates charged by the Adviser and/or Sub-adviser to other types of accounts with investment objectives and strategies that are substantially similar to and/or managed in a similar investment style as the Portfolio. In this regard, the Board received information about the differences in the nature and scope of services the Adviser and/or Sub-adviser provide to the Portfolio as
Eaton Vance
High Income Opportunities Fund
October 31, 2022
Board of Trustees’ Contract Approval — continued
compared to other types of accounts and the material differences in compliance, reporting and other legal burdens and risks to the Adviser and/or Sub-adviser as between the Portfolio and other types of accounts. The Board also considered factors that had an impact on the Fund’s total expense ratio relative to comparable funds.
After considering the foregoing information, and in light of the nature, extent and quality of the services provided by each Adviser and the Sub-adviser, the Board concluded that the management fees charged for advisory and related services are reasonable.
Profitability and “Fall-Out” Benefits
The Board considered the level of profits realized by each Adviser and relevant affiliates thereof, including the Sub-adviser, in providing investment advisory and administrative services to the Fund, to the Portfolio and to all Eaton Vance Funds as a group. The Board considered the level of profits realized without regard to marketing support or other payments by each Adviser and its affiliates to third parties in respect of distribution or other services.
The Board concluded that, in light of the foregoing factors and the nature, extent and quality of the services rendered, the profits realized by each Adviser and its affiliates, including the Sub-adviser, are deemed not to be excessive.
The Board also considered direct or indirect fall-out benefits received by each Adviser and its affiliates, including the Sub-adviser, in connection with their respective relationships with the Fund and the Portfolio, including the benefits of research services that may be available to each Adviser or the Sub-adviser as a result of securities transactions effected for the Fund and the Portfolio and other investment advisory clients.
Economies of Scale
In reviewing management fees and profitability, the Board also considered the extent to which the applicable Adviser and its affiliates, on the one hand, and the Fund and the Portfolio, on the other hand, can expect to realize benefits from economies of scale as the assets of the Fund and the Portfolio increase. The Board acknowledged the difficulty in accurately measuring the benefits resulting from economies of scale, if any, with respect to the management of any specific fund or group of funds. The Board reviewed data summarizing the increases and decreases in the assets of the Fund and of all Eaton Vance Funds as a group over various time periods, and evaluated the extent to which the total expense ratio of the Fund and the profitability of each Adviser and its affiliates may have been affected by such increases or decreases. Based upon the foregoing, the Board concluded that the Fund currently shares in the benefits from economies of scale, if any, when they are realized by the Adviser. The Board also concluded that the structure of the advisory fees, which include breakpoints at several asset levels, will allow the Fund and the Portfolio to continue to benefit from any economies of scale in the future.
High Income Opportunities Portfolio
October 31, 2022
Liquidity Risk Management Program
The Fund has implemented a written liquidity risk management program (Program) and related procedures to manage its liquidity in accordance with Rule 22e-4 under the Investment Company Act of 1940, as amended (Liquidity Rule). The Liquidity Rule defines “liquidity risk” as the risk that a fund could not meet requests to redeem shares issued by the fund without significant dilution of the remaining investors’ interests in the fund. The Fund’s Board of Trustees/Directors has designated the investment adviser to serve as the administrator of the Program and the related procedures. The administrator has established a Liquidity Risk Management Oversight Committee (Committee) to perform the functions necessary to administer the Program. As part of the Program, the administrator is responsible for identifying illiquid investments and categorizing the relative liquidity of the Fund’s investments in accordance with the Liquidity Rule. Under the Program, the administrator assesses, manages, and periodically reviews the Fund’s liquidity risk, and is responsible for making certain reports to the Fund’s Board of Trustees/Directors and the Securities and Exchange Commission (SEC) regarding the liquidity of the Fund’s investments, and to notify the Board of Trustees/Directors and the SEC of certain liquidity events specified in the Liquidity Rule. The liquidity of the Fund’s portfolio investments is determined based on a number of factors including, but not limited to, relevant market, trading and investment-specific considerations under the Program.
At a meeting of the Fund’s Board of Trustees/Directors on June 7, 2022, the Committee provided a written report to the Fund’s Board of Trustees/Directors pertaining to the operation, adequacy, and effectiveness of implementation of the Program, as well as the operation of the highly liquid investment minimum (if applicable) for the period January 1, 2021 through December 31, 2021 (Review Period). The Program operated effectively during the Review Period, supporting the administrator’s ability to assess, manage and monitor Fund liquidity risk, including during periods of market volatility and net redemptions. During the Review Period, the Fund met redemption requests on a timely basis.
There can be no assurance that the Program will achieve its objectives in the future. Please refer to the Fund’s prospectus for more information regarding the Fund’s exposure to liquidity risk and other principal risks to which an investment in the Fund may be subject.
Eaton Vance
High Income Opportunities Fund
October 31, 2022
Management and Organization
Fund Management. The Trustees of Eaton Vance Mutual Funds Trust (the Trust) and High Income Opportunities Portfolio (the Portfolio) are responsible for the overall management and supervision of the Trust’s and the Portfolio’s affairs. The Board members and officers of the Trust and the Portfolio are listed below. Except as indicated, each individual has held the office shown or other offices in the same company for the last five years. Board members hold indefinite terms of office. Each Trustee holds office until his or her successor is elected and qualified, subject to a prior death, resignation, retirement, disqualification or removal. Under the terms of the Fund’s and the Portfolio’s current Trustee retirement policy, an Independent Trustee must retire and resign as a Trustee on the earlier of: (i) the first day of July following his or her 74th birthday; or (ii), with limited exception, December 31st of the 20th year in which he or she has served as a Trustee. However, if such retirement and resignation would cause the Fund and the Portfolio to be out of compliance with Section 16 of the 1940 Act or any other regulations or guidance of the SEC, then such retirement and resignation will not become effective until such time as action has been taken for the Fund and the Portfolio to be in compliance therewith. The “noninterested Trustees” consist of those Trustees who are not “interested persons” of the Trust and the Portfolio, as that term is defined under the 1940 Act. The business address of each Board member and officer is Two International Place, Boston, Massachusetts 02110. As used below, “BMR” refers to Boston Management and Research, “EVC” refers to Eaton Vance Corp., “EV” refers to EV LLC, “EVM” refers to Eaton Vance Management and “EVD” refers to Eaton Vance Distributors, Inc. EV is the trustee of each of EVM and BMR. Effective March 1, 2021, each of EVM, BMR, EVD and EV are indirect, wholly owned subsidiaries of Morgan Stanley. Each officer affiliated with EVM may hold a position with other EVM affiliates that is comparable to his or her position with EVM listed below. Each Trustee oversees 135 funds (with the exception of Mr. Bowser who oversees 110 funds) in the Eaton Vance fund complex (including both funds and portfolios in a hub and spoke structure).
| | | | | | |
| Name and Year of Birth | | Trust/Portfolio
Position(s) | | Length of Service | | Principal Occupation(s) and Other Directorships During Past Five Years and Other Relevant Experience |
|
| Interested Trustee |
| | | |
Thomas E. Faust Jr. 1958 | | Trustee | | Since 2007 | | Chairman of Morgan Stanley Investment Management, Inc. (MSIM), member of the Board of Managers and President of EV (since 2021), Chief Executive Officer of EVM and BMR. Formerly, Chairman, Chief Executive Officer (2007-2021) and President (2006-2021) of EVC and Director of EVD (2007-2022). Mr. Faust is an interested person because of his positions with MSIM, BMR, EVM and EV, which are affiliates of the Trust and the Portfolio. Other Directorships. Formerly, Director of EVC (2007-2021) and Hexavest Inc. (investment management firm) (2012-2021). |
|
| Noninterested Trustees |
| | | |
Alan C. Bowser(1) 1962 | | Trustee | | Since 2022 | | Chief Diversity Officer, Partner and a member of the Operating Committee, and formerly served as Senior Advisor on Diversity and Inclusion for the firm’s chief executive officer, Co-Head of the Americas Region, and Senior Client Advisor of Bridgewater Associates, an asset management firm (2011- present). Other Directorships. None. |
| | | |
Mark R. Fetting 1954 | | Trustee | | Since 2016 | | Private investor. Formerly held various positions at Legg Mason, Inc. (investment management firm) (2000-2012), including President, Chief Executive Officer, Director and Chairman (2008-2012), Senior Executive Vice President (2004-2008) and Executive Vice President (2001-2004). Formerly, President of Legg Mason family of funds (2001-2008). Formerly, Division President and Senior Officer of Prudential Financial Group, Inc. and related companies (investment management firm) (1991-2000). Other Directorships. None. |
| | | |
Cynthia E. Frost 1961 | | Trustee | | Since 2014 | | Private investor. Formerly, Chief Investment Officer of Brown University (university endowment) (2000-2012). Formerly, Portfolio Strategist for Duke Management Company (university endowment manager) (1995-2000). Formerly, Managing Director, Cambridge Associates (investment consulting company) (1989-1995). Formerly, Consultant, Bain and Company (management consulting firm) (1987-1989). Formerly, Senior Equity Analyst, BA Investment Management Company (1983-1985). Other Directorships. None. |
| | | |
George J. Gorman 1952 | | Chairperson of the Board and Trustee | | Since 2021 (Chairperson) and 2014 (Trustee) | | Principal at George J. Gorman LLC (consulting firm). Formerly, Senior Partner at Ernst & Young LLP (a registered public accounting firm) (1974-2009). Other Directorships. None. |
Eaton Vance
High Income Opportunities Fund
October 31, 2022
Management and Organization — continued
| | | | | | |
| Name and Year of Birth | | Trust/Portfolio
Position(s) | | Length of Service | | Principal Occupation(s) and Other Directorships During Past Five Years and Other Relevant Experience |
|
| Noninterested Trustees (continued) |
| | | |
Valerie A. Mosley 1960 | | Trustee | | Since 2014 | | Chairwoman and Chief Executive Officer of Valmo Ventures (a consulting and investment firm). Founder of Upward Wealth, Inc., dba BrightUp, a fintech platform. Formerly, Partner and Senior Vice President, Portfolio Manager and Investment Strategist at Wellington Management Company, LLP (investment management firm) (1992-2012). Formerly, Chief Investment Officer, PG Corbin Asset Management (1990-1992). Formerly worked in institutional corporate bond sales at Kidder Peabody (1986-1990). Other Directorships. Director of DraftKings, Inc. (digital sports entertainment and gaming company) (since September 2020). Director of Envestnet, Inc. (provider of intelligent systems for wealth management and financial wellness) (since 2018). Formerly, Director of Dynex Capital, Inc. (mortgage REIT) (2013-2020) and Director of Groupon, Inc. (e-commerce provider) (2020-2022). |
| | | |
Keith Quinton 1958 | | Trustee | | Since 2018 | | Private investor, researcher and lecturer. Formerly, Independent Investment Committee Member at New Hampshire Retirement System (2017-2021). Formerly, Portfolio Manager and Senior Quantitative Analyst at Fidelity Investments (investment management firm) (2001-2014). Other Directorships. Formerly, Director (2016-2021) and Chairman (2019-2021) of New Hampshire Municipal Bond Bank. |
| | | |
Marcus L. Smith 1966 | | Trustee | | Since 2018 | | Private investor and independent corporate director. Formerly, Chief Investment Officer, Canada (2012-2017), Chief Investment Officer, Asia (2010-2012), Director of Asian Research (2004-2010) and portfolio manager (2001-2017) at MFS Investment Management (investment management firm). Other Directorships. Director of First Industrial Realty Trust, Inc. (an industrial REIT) (since 2021). Director of MSCI Inc. (global provider of investment decision support tools) (since 2017). Formerly, Director of DCT Industrial Trust Inc. (logistics real estate company) (2017-2018). |
| | | |
Susan J. Sutherland 1957 | | Trustee | | Since 2015 | | Private investor. Director of Ascot Group Limited and certain of its subsidiaries (insurance and reinsurance) (since 2017). Formerly, Director of Hagerty Holding Corp. (insurance) (2015-2018) and Montpelier Re Holdings Ltd. (insurance and reinsurance) (2013-2015). Formerly, Associate, Counsel and Partner at Skadden, Arps, Slate, Meagher & Flom LLP (law firm) (1982-2013). Other Directorships. Director of Kairos Acquisition Corp. (insurance/InsurTech acquisition company) (since 2021). |
| | | |
Scott E. Wennerholm 1959 | | Trustee | | Since 2016 | | Private investor. Formerly, Trustee at Wheelock College (postsecondary institution) (2012-2018). Formerly, Consultant at GF Parish Group (executive recruiting firm) (2016-2017). Formerly, Chief Operating Officer and Executive Vice President at BNY Mellon Asset Management (investment management firm) (2005-2011). Formerly, Chief Operating Officer and Chief Financial Officer at Natixis Global Asset Management (investment management firm) (1997-2004). Formerly, Vice President at Fidelity Investments Institutional Services (investment management firm) (1994-1997). Other Directorships. None. |
| | | |
Nancy A. Wiser(1) 1967 | | Trustee | | Since 2022 | | Formerly, Executive Vice President and the Global Head of Operations at Wells Fargo Asset Management (2011-2021). Other Directorships. None. |
| | | | | | |
| Name and Year of Birth | | Trust/Portfolio
Position(s) | | Length of Service | | Principal Occupation(s) During Past Five Years |
|
| Principal Officers who are not Trustees |
| | | |
Eric A. Stein 1980 | | President | | Since 2020 | | Vice President and Chief Investment Officer, Fixed Income of EVM and BMR. Prior to November 1, 2020, Mr. Stein was a co-Director of Eaton Vance’s Global Income Investments. Also Vice President of Calvert Research and Management (“CRM”). |
| | | |
Deidre E. Walsh 1971 | | Vice President and Chief Legal Officer | | Since 2009 | | Vice President of EVM and BMR. Also Vice President of CRM. |
| | | |
James F. Kirchner 1967 | | Treasurer | | Since 2007 | | Vice President of EVM and BMR. Also Vice President of CRM. |
Eaton Vance
High Income Opportunities Fund
October 31, 2022
Management and Organization — continued
| | | | | | |
| Name and Year of Birth | | Trust/Portfolio
Position(s) | | Length of Service | | Principal Occupation(s) During Past Five Years |
|
| Principal Officers who are not Trustees (continued) |
| | | |
Nicholas Di Lorenzo 1987 | | Secretary | | Since 2022 | | Formerly, associate (2012-2021) and counsel (2022) at Dechert LLP. |
| | | |
Richard F. Froio 1968 | | Chief Compliance Officer | | Since 2017 | | Vice President of EVM and BMR since 2017. Formerly, Deputy Chief Compliance Officer (Adviser/Funds) and Chief Compliance Officer (Distribution) at PIMCO (2012-2017) and Managing Director at BlackRock/Barclays Global Investors (2009-2012). |
| (1) | Mr. Bowser and Ms. Wiser began serving as Trustees effective April 4, 2022. |
The SAI for the Fund includes additional information about the Trustees and officers of the Fund and the Portfolio and can be obtained without charge on Eaton Vance’s website at www.eatonvance.com or by calling 1-800-262-1122.
Eaton Vance Funds
| | |
| Privacy Notice | | April 2021 |
| | |
| |
| FACTS | | WHAT DOES EATON VANCE DO WITH YOUR PERSONAL INFORMATION? |
| | | |
| |
| | |
| Why? | | Financial companies choose how they share your personal information. Federal law gives consumers the right to limit some but not all sharing. Federal law also requires us to tell you how we collect, share, and protect your personal information. Please read this notice carefully to understand what we do. |
| | |
| | | |
| What? | | The types of personal information we collect and share depend on the product or service you have with us. This information can include: ∎ Social Security number and income ∎ investment experience and risk tolerance ∎ checking account number and wire transfer instructions |
| | |
| | | |
| How? | | All financial companies need to share customers’ personal information to run their everyday business. In the section below, we list the reasons financial companies can share their customers’ personal information; the reasons Eaton Vance chooses to share; and whether you can limit this sharing. |
| | | | |
Reasons we can share your personal information | | Does Eaton Vance share? | | Can you limit this sharing? |
| For our everyday business purposes — such as to process your transactions, maintain your account(s), respond to court orders and legal investigations, or report to credit bureaus | | Yes | | No |
| For our marketing purposes — to offer our products and services to you | | Yes | | No |
| For joint marketing with other financial companies | | No | | We don’t share |
| For our investment management affiliates’ everyday business purposes — information about your transactions, experiences, and creditworthiness | | Yes | | Yes |
| For our affiliates’ everyday business purposes — information about your transactions and experiences | | Yes | | No |
| For our affiliates’ everyday business purposes — information about your creditworthiness | | No | | We don’t share |
| For our investment management affiliates to market to you | | Yes | | Yes |
| For our affiliates to market to you | | No | | We don’t share |
| For nonaffiliates to market to you | | No | | We don’t share |
| | |
| To limit our sharing | | Call toll-free 1-800-262-1122 or email: EVPrivacy@eatonvance.com Please note: If you are a new customer, we can begin sharing your information 30 days from the date we sent this notice. When you are no longer our customer, we continue to share your information as described in this notice. However, you can contact us at any time to limit our sharing. |
| | |
| Questions? | | Call toll-free 1-800-262-1122 or email: EVPrivacy@eatonvance.com |
Eaton Vance Funds
| | |
| Privacy Notice — continued | | April 2021 |
| | |
| Who we are |
| Who is providing this notice? | | Eaton Vance Management, Eaton Vance Distributors, Inc., Eaton Vance Trust Company, Eaton Vance Management (International) Limited, Eaton Vance Advisers International Ltd., Eaton Vance Global Advisors Limited, Eaton Vance Management’s Real Estate Investment Group, Boston Management and Research, Calvert Research and Management, Eaton Vance and Calvert Fund Families and our investment advisory affiliates (“Eaton Vance”) (see Investment Management Affiliates definition below) |
| What we do |
| How does Eaton Vance protect my personal information? | | To protect your personal information from unauthorized access and use, we use security measures that comply with federal law. These measures include computer safeguards and secured files and buildings. We have policies governing the proper handling of customer information by personnel and requiring third parties that provide support to adhere to appropriate security standards with respect to such information. |
| How does Eaton Vance collect my personal information? | | We collect your personal information, for example, when you ∎ open an account or make deposits or withdrawals from your account ∎ buy securities from us or make a wire transfer ∎ give us your contact information We also collect your personal information from others, such as credit bureaus, affiliates, or other companies. |
| Why can’t I limit all sharing? | | Federal law gives you the right to limit only ∎ sharing for affiliates’ everyday business purposes — information about your creditworthiness ∎ affiliates from using your information to market to you ∎ sharing for nonaffiliates to market to you State laws and individual companies may give you additional rights to limit sharing. See below for more on your rights under state law. |
| Definitions |
| Investment Management Affiliates | | Eaton Vance Investment Management Affiliates include registered investment advisers, registered broker-dealers, and registered and unregistered funds. Investment Management Affiliates does not include entities associated with Morgan Stanley Wealth Management, such as Morgan Stanley Smith Barney LLC and Morgan Stanley & Co. |
| Affiliates | | Companies related by common ownership or control. They can be financial and nonfinancial companies. ∎ Our affiliates include companies with a Morgan Stanley name and financial companies such as Morgan Stanley Smith Barney LLC and Morgan Stanley & Co. |
| Nonaffiliates | | Companies not related by common ownership or control. They can be financial and nonfinancial companies. ∎ Eaton Vance does not share with nonaffiliates so they can market to you. |
| Joint marketing | | A formal agreement between nonaffiliated financial companies that together market financial products or services to you. ∎ Eaton Vance doesn’t jointly market. |
| Other important information |
Vermont: Except as permitted by law, we will not share personal information we collect about Vermont residents with Nonaffiliates unless you provide us with your written consent to share such information. California: Except as permitted by law, we will not share personal information we collect about California residents with Nonaffiliates and we will limit sharing such personal information with our Affiliates to comply with California privacy laws that apply to us. |
Eaton Vance Funds
IMPORTANT NOTICES
Delivery of Shareholder Documents. The Securities and Exchange Commission (SEC) permits funds to deliver only one copy of shareholder documents, including prospectuses, proxy statements and shareholder reports, to fund investors with multiple accounts at the same residential or post office box address. This practice is often called “householding” and it helps eliminate duplicate mailings to shareholders. Eaton Vance, or your financial intermediary, may household the mailing of your documents indefinitely unless you instruct Eaton Vance, or your financial intermediary, otherwise. If you would prefer that your Eaton Vance documents not be householded, please contact Eaton Vance at 1-800-262-1122, or contact your financial intermediary. Your instructions that householding not apply to delivery of your Eaton Vance documents will typically be effective within 30 days of receipt by Eaton Vance or your financial intermediary.
Portfolio Holdings. Each Eaton Vance Fund and its underlying Portfolio(s) (if applicable) files a schedule of portfolio holdings on Part F to Form N-PORT with the SEC. Certain information filed on Form N-PORT may be viewed on the Eaton Vance website at www.eatonvance.com, by calling Eaton Vance at 1-800-262-1122 or in the EDGAR database on the SEC’s website at www.sec.gov.
Proxy Voting. From time to time, funds are required to vote proxies related to the securities held by the funds. The Eaton Vance Funds or their underlying Portfolios (if applicable) vote proxies according to a set of policies and procedures approved by the Funds’ and Portfolios’ Boards. You may obtain a description of these policies and procedures and information on how the Funds or Portfolios voted proxies relating to portfolio securities during the most recent 12-month period ended June 30, without charge, upon request, by calling 1-800-262-1122 and by accessing the SEC’s website at www.sec.gov.
This Page Intentionally Left Blank
Investment Adviser of High Income Opportunities Portfolio
Boston Management and Research
Two International Place
Boston, MA 02110
Investment Sub-Adviser of High Income Opportunities Portfolio and Eaton Vance High Income Opportunities Fund
Eaton Vance Advisers International Ltd.
125 Old Broad Street
London, EC2N 1AR
United Kingdom
Investment Adviser and Administrator of Eaton Vance High Income Opportunities Fund
Eaton Vance Management
Two International Place
Boston, MA 02110
Principal Underwriter*
Eaton Vance Distributors, Inc.
Two International Place
Boston, MA 02110
(617) 482-8260
Custodian
State Street Bank and Trust Company
State Street Financial Center, One Lincoln Street
Boston, MA 02111
Transfer Agent
BNY Mellon Investment Servicing (US) Inc.
Attn: Eaton Vance Funds
P.O. Box 9653
Providence, RI 02940-9653
(800) 262-1122
Independent Registered Public Accounting Firm
Deloitte & Touche LLP
200 Berkeley Street
Boston, MA 02116-5022
Fund Offices
Two International Place
Boston, MA 02110
| * | FINRA BrokerCheck. Investors may check the background of their Investment Professional by contacting the Financial Industry Regulatory Authority (FINRA). FINRA BrokerCheck is a free tool to help investors check the professional background of current and former FINRA-registered securities firms and brokers. FINRA BrokerCheck is available by calling 1-800-289-9999 and at www.FINRA.org. The FINRA BrokerCheck brochure describing this program is available to investors at www.FINRA.org. |
446 10.31.22

Eaton Vance
Global Bond Fund
Annual Report
October 31, 2022

Commodity Futures Trading Commission Registration. The Commodity Futures Trading Commission (“CFTC”) has adopted regulations that subject registered investment companies and advisers to regulation by the CFTC if a fund invests more than a prescribed level of its assets in certain CFTC-regulated instruments (including futures, certain options and swap agreements) or markets itself as providing investment exposure to such instruments. The investment adviser has claimed an exclusion from the definition of “commodity pool operator” under the Commodity Exchange Act with respect to its management of the Fund. Accordingly, neither the Fund nor the adviser with respect to the operation of the Fund is subject to CFTC regulation. Because of its management of other strategies, the Fund’s adviser is registered with the CFTC as a commodity pool operator. The adviser is also registered as a commodity trading advisor.
Fund shares are not insured by the FDIC and are not deposits or other obligations of, or guaranteed by, any depository institution. Shares are subject to investment risks, including possible loss of principal invested.
This report must be preceded or accompanied by a current summary prospectus or prospectus. Before investing, investors should consider carefully the investment objective, risks, and charges and expenses of a mutual fund. This and other important information is contained in the summary prospectus and prospectus, which can be obtained from a financial intermediary. Prospective investors should read the prospectus carefully before investing. For further information, please call 1-800-262-1122.
Annual Report October 31, 2022
Eaton Vance
Global Bond Fund
Eaton Vance
Global Bond Fund
October 31, 2022
Management’s Discussion of Fund Performance†
Economic and Market Conditions
The world’s equity and fixed-income markets posted broad losses during the 12-month period ended October 31, 2022. The declines were due to several factors, including high inflation in many countries, aggressive monetary tightening by the U.S. Federal Reserve (the Fed), and slowing global economic growth.
During the period, U.S. inflation surged as strong consumer demand following the relaxation of COVID-19 restrictions coincided with supply shortages created by the pandemic. Production and trade disruptions resulting from Russia’s February 2022 invasion of Ukraine added to inflationary pressures by driving up prices of energy and grains. The Fed responded by increasing short-term interest rates at the fastest pace in decades and signaling that it would continue hiking rates until inflation was under control — even if it meant pushing the U.S. economy into recession.
The European Central Bank and Bank of England also raised interest rates during the period in efforts to tame inflation, despite signs of deterioration in the European economy. Conversely, the Bank of Japan held its main policy rate at –0.1%. Inflation rose in Japan during the period but remained low compared to inflation in other developed countries. The widening differential between interest rates in Japan and the U.S. contributed to a substantial weakening in the Japanese yen versus the U.S. dollar during the period.
In China, government policies helped contain inflation but also significantly slowed economic growth. First, China maintained its zero-COVID policy, which led to lockdowns of major cities during the period. Second, Chinese leaders renewed their focus on the country’s “common prosperity” agenda, implementing measures that negatively affected certain sectors of China’s economy, including real estate and technology.
During the period, a number of emerging and frontier nations either defaulted on their sovereign debt or were pushed to the brink of default. Rising food and energy prices pressured these governments to offer subsidies to consumers, putting additional stress on fiscal balances already strained by pandemic-related spending. In addition, broad strength in the U.S. dollar made servicing U.S. dollar-denominated debt more expensive.
On a positive note, we believe there were signs late in the period that inflation may have peaked in several major emerging-market economies. Central banks in these countries indicated that they were at, or near, the end of their tightening cycles.
Fund Performance
For the 12-month period ended October 31, 2022, Eaton Vance Global Bond Fund (the Fund) returned –18.94% for Class A shares at net asset value (NAV), outperforming its benchmark, the Bloomberg Global Aggregate Bond Index (the Index), which returned –20.79%.
During the period, holdings in Western Europe contributed to the Fund’s returns relative to the Index. An underweight position in U.K. local interest rates was particularly helpful as U.K. rates increased sharply and the British pound fell to a record low versus the U.S. dollar. Out-of-Index exposure to the Icelandic krona was another contributor to relative performance. In an effort to control the highest inflation in more than a decade, Iceland’s central bank raised its key policy rate to 5.75% during the period, which was supportive of the krona.
Investments in Latin America also contributed to returns relative to the Index, led by gains in local bond positions in Brazil and Chile. Inflation in Brazil moderated during the period, prompting the country’s central bank to pause its rate-hiking campaign in September 2022. Similarly, price pressures in Chile showed signs of easing, and Chilean monetary authorities indicated they had raised rates to the maximum level of the tightening cycle.
Holdings in the Middle East & Africa had minimal impact on performance versus the Index during the period, while investments in Asia and Eastern Europe detracted from relative returns. In Asia, an overweight position in South Korean local interest rates was especially unfavorable amid broad U.S. dollar strength and slowing growth in China, South Korea’s largest trading partner. In Eastern Europe, an out-of-Index allocation to Ukrainian local bonds performed poorly due to the Russia-Ukraine war, which led to a steep sell-off in Ukrainian local assets.
Results in the Dollar Bloc — Canada, New Zealand, and Australia — also negatively affected returns relative to the Index. An overweight position in New Zealand local rates was a notable detractor, as the country’s central bank hiked interest rates seven times during the period and signaled that additional tightening might be forthcoming.
The Fund used derivatives extensively to both hedge select undesired risk exposures as well as gain select desired risk exposures. Some of the above commentary about notable drivers of performance at the country level involved the use of derivatives. The Fund’s use of derivatives broadly weighed on returns versus the Index. Specifically, the Fund’s use of currency forwards to gain exposure to select currencies around the world detracted from relative performance during the period. However, interest rate swaps used to gain select exposures as well as hedge others aided relative performance during the period.
See Endnotes and Additional Disclosures in this report.
Past performance is no guarantee of future results. Returns are historical and are calculated by determining the percentage change in net asset value (NAV) or offering price (as applicable) with all distributions reinvested. Furthermore, returns do not reflect the deduction of taxes that shareholders may have to pay on Fund distributions or upon the redemption of Fund shares. Investment return and principal value will fluctuate so that shares, when redeemed, may be worth more or less than their original cost. Performance for periods less than or equal to one year is cumulative. Performance is for the stated time period only; due to market volatility, current Fund performance may be lower or higher than the quoted return. For performance as of the most recent month-end, please refer to eatonvance.com.
Eaton Vance
Global Bond Fund
October 31, 2022
Performance
Portfolio Manager(s) Kyle Lee, CFA, Patrick Campbell, CFA and Brian Shaw, CFA
| | | | | | | | | | | | | | | | | | | | |
| % Average Annual Total Returns1,2 | | Class
Inception Date | | | Performance
Inception Date | | | One Year | | | Five Years | �� | | Ten Years | |
| | | | | |
Class A at NAV | | | 06/27/2007 | | | | 06/27/2007 | | | | (18.94 | )% | | | (2.56 | )% | | | (0.78 | )% |
Class A with 3.25% Maximum Sales Charge | | | — | | | | — | | | | (21.60 | ) | | | (3.21 | ) | | | (1.10 | ) |
| | | | | |
Class C at NAV | | | 03/01/2011 | | | | 06/27/2007 | | | | (19.50 | ) | | | (3.24 | ) | | | (1.34 | ) |
Class C with 1% Maximum Deferred Sales Charge | | | — | | | | — | | | | (20.28 | ) | | | (3.24 | ) | | | (1.34 | ) |
| | | | | |
Class I at NAV | | | 03/01/2011 | | | | 06/27/2007 | | | | (18.65 | ) | | | (2.26 | ) | | | (0.48 | ) |
|
| |
| | | | | |
Bloomberg Global Aggregate Bond Index | | | — | | | | — | | | | (20.79 | )% | | | (2.38 | )% | | | (0.98 | )% |
Blended Index | | | — | | | | — | | | | (20.75 | ) | | | (2.35 | ) | | | (0.87 | ) |
| | | | | |
| % Total Annual Operating Expense Ratios3 | | | | | | | | Class A | | | Class C | | | Class I | |
| | | | | |
Gross | | | | | | | | | | | 1.50 | % | | | 2.20 | % | | | 1.20 | % |
Net | | | | | | | | | | | 1.01 | | | | 1.71 | | | | 0.71 | |
Growth of $10,000
This graph shows the change in value of a hypothetical investment of $10,000 in Class A of the Fund for the period indicated. For comparison, the same investment is shown in the indicated index.
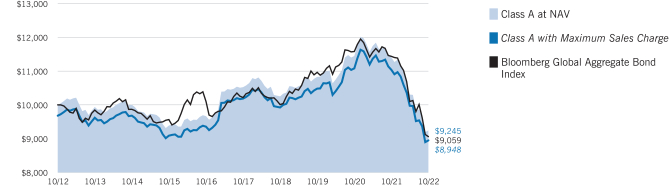
| | | | | | | | | | | | | | | | |
| Growth of Investment | | Amount Invested | | | Period Beginning | | | At NAV | | | With Maximum Sales Charge | |
| | | | |
Class C | | | $10,000 | | | | 10/31/2012 | | | | $8,740 | | | | N.A. | |
Class I, at minimum investment | | | $1,000,000 | | | | 10/31/2012 | | | | $952,590 | | | | N.A. | |
See Endnotes and Additional Disclosures in this report.
Past performance is no guarantee of future results. Returns are historical and are calculated by determining the percentage change in net asset value (NAV) or offering price (as applicable) with all distributions reinvested. Furthermore, returns do not reflect the deduction of taxes that shareholders may have to pay on Fund distributions or upon the redemption of Fund shares. Investment return and principal value will fluctuate so that shares, when redeemed, may be worth more or less than their original cost. Performance for periods less than or equal to one year is cumulative. Performance is for the stated time period only; due to market volatility, current Fund performance may be lower or higher than the quoted return. For performance as of the most recent month-end, please refer to eatonvance.com.
Eaton Vance
Global Bond Fund
October 31, 2022
Fund Profile
Asset Allocation (% of net assets)1
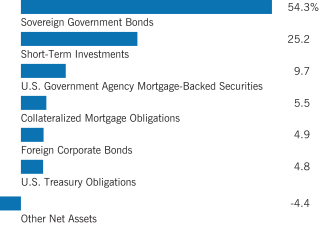
Foreign Currency Exposure (% of net assets)2
| | | | |
| |
Euro | | | 19.5 | % |
| |
Japan | | | 10.8 | |
| |
Singapore | | | 5.8 | |
| |
Sweden | | | 5.4 | |
| |
Serbia | | | 5.4 | |
| |
South Korea | | | 5.2 | |
| |
Iceland | | | 4.7 | |
| |
New Zealand | | | 3.2 | |
| |
Dominican Republic | | | 2.8 | |
| |
Ukraine | | | 2.4 | |
| |
Australia | | | 1.5 | |
| |
Uruguay | | | 1.4 | |
| |
Kazakhstan | | | 1.3 | |
| |
Brazil | | | 1.1 | |
| |
Other | | | –0.4 | 3 |
| |
Total Long | | | 72.7 | |
| |
Total Short | | | –2.6 | |
| |
Total Net | | | 70.1 | |
Footnotes:
Fund invests in an affiliated investment company (Portfolio) with the same objective(s) and policies as the Fund. References to investments are to the Portfolio’s holdings.
| 1 | Other Net Assets represents other assets less liabilities and includes any investment type that represents less than 1% of net assets. |
| 2 | Currency exposures include all foreign exchange denominated assets and currency derivatives. Total exposures may exceed 100% due to implicit leverage created by derivatives. |
| 3 | Includes amounts each less than 1.0% or –1.0%, as applicable. |
Eaton Vance
Global Bond Fund
October 31, 2022
Endnotes and Additional Disclosures
| † | The views expressed in this report are those of the portfolio manager(s) and are current only through the date stated at the top of this page. These views are subject to change at any time based upon market or other conditions, and Eaton Vance and the Fund(s) disclaim any responsibility to update such views. These views may not be relied upon as investment advice and, because investment decisions are based on many factors, may not be relied upon as an indication of trading intent on behalf of any Eaton Vance fund. This commentary may contain statements that are not historical facts, referred to as “forward-looking statements.” The Fund’s actual future results may differ significantly from those stated in any forward-looking statement, depending on factors such as changes in securities or financial markets or general economic conditions, the volume of sales and purchases of Fund shares, the continuation of investment advisory, administrative and service contracts, and other risks discussed from time to time in the Fund’s filings with the Securities and Exchange Commission. |
| 1 | Bloomberg Global Aggregate Bond Index is an unmanaged index of global investment-grade bonds denominated in the U.S. Dollar, Euro, Japanese Yen, and British Sterling. The index includes corporate bonds, government bonds, and mortgage-backed securities. The Blended Index consists of 85% Bloomberg Global Aggregate Bond Index and 15% J.P. Morgan Emerging Markets Bond (JEMB) Hard Currency/Local Currency 50-50 Index, rebalanced monthly. J.P. Morgan Emerging Markets Bond (JEMB) Hard Currency/Local Currency 50-50 Index is a blended index comprised of 50% J.P. Morgan Government Bond Index: Emerging Market Global Diversified (JPM GBI-EM GD), 25% J.P. Morgan Emerging Market Bond Index Global Diversified (JPM EMBI GD) and 25% J.P. Morgan Corporate Emerging Markets Bond Index Broad Diversified (JPM CEMBI BD). J.P. Morgan Government Bond Index: Emerging Market Global Diversified (JPM GBI-EM GD) is an unmanaged index of local currency bonds with maturities of more than one year issued by emerging markets governments. J.P. Morgan Emerging Market Bond Index Global Diversified (JPM EMBI GD) is a market-cap weighted index that measures USD-denominated Brady Bonds, Eurobonds, and traded loans issued by sovereign entities. J.P. Morgan Corporate Emerging Markets Bond Index Broad Diversified (JPM CEMBI BD) is an unmanaged index of USD-denominated emerging market corporate bonds. Information has been obtained from sources believed to be reliable but J.P. Morgan does not warrant its completeness or accuracy. The indexes are used with permission. The indexes may not be copied, used, or distributed without J.P. Morgan’s prior written approval. Copyright 2021, J.P. Morgan Chase & Co. All rights reserved. Unless otherwise stated, index returns do not reflect the effect of any applicable sales charges, commissions, expenses, taxes or leverage, as applicable. It is not possible to invest directly in an index. |
| 2 | Total Returns at NAV do not include applicable sales charges. If sales charges were deducted, the returns would be lower. Total Returns shown with maximum sales charge reflect the stated maximum sales charge. Unless otherwise stated, performance does not reflect the deduction of taxes on Fund distributions or redemptions of Fund shares. |
Effective November 5, 2020, Class C shares automatically convert to Class A shares eight years after purchase. The average annual total returns listed for Class C reflect conversion to Class A shares after eight years. Prior to November 5, 2020, Class C shares automatically converted to Class A shares ten years after purchase.
| 3 | Source: Fund prospectus. Net expense ratios reflect a contractual expense reimbursement that continues through 2/28/23. The expense ratios for the current reporting period can be found in the Financial Highlights section of this report. Performance reflects expenses waived and/or reimbursed, if applicable. Without such waivers and/or reimbursements, performance would have been lower. |
Fund profile subject to change due to active management.
Eaton Vance
Global Bond Fund
October 31, 2022
Fund Expenses
Example
As a Fund shareholder, you incur two types of costs: (1) transaction costs, including sales charges (loads) on purchases and redemption fees (if applicable); and (2) ongoing costs, including management fees; distribution and/or service fees; and other Fund expenses. This Example is intended to help you understand your ongoing costs (in dollars) of Fund investing and to compare these costs with the ongoing costs of investing in other mutual funds. The Example is based on an investment of $1,000 invested at the beginning of the period and held for the entire period (May 1, 2022 to October 31, 2022).
Actual Expenses
The first section of the table below provides information about actual account values and actual expenses. You may use the information in this section, together with the amount you invested, to estimate the expenses that you paid over the period. Simply divide your account value by $1,000 (for example, an $8,600 account value divided by $1,000 = 8.6), then multiply the result by the number in the first section under the heading entitled “Expenses Paid During Period” to estimate the expenses you paid on your account during this period.
Hypothetical Example for Comparison Purposes
The second section of the table below provides information about hypothetical account values and hypothetical expenses based on the actual Fund expense ratio and an assumed rate of return of 5% per year (before expenses), which is not the actual Fund return. The hypothetical account values and expenses may not be used to estimate the actual ending account balance or expenses you paid for the period. You may use this information to compare the ongoing costs of investing in your Fund and other funds. To do so, compare this 5% hypothetical example with the 5% hypothetical examples that appear in the shareholder reports of the other funds.
Please note that the expenses shown in the table are meant to highlight your ongoing costs only and do not reflect any transactional costs, such as sales charges (loads) or redemption fees (if applicable). Therefore, the second section of the table is useful in comparing ongoing costs only, and will not help you determine the relative total costs of owning different funds. In addition, if these transactional costs were included, your costs would be higher.
| | | | | | | | | | | | | | | | |
| | | Beginning
Account Value
(5/1/22) | | | Ending
Account Value
(10/31/22) | | | Expenses Paid
During Period*
(5/1/22 – 10/31/22) | | | Annualized
Expense
Ratio | |
| | | | |
Actual | | | | | | | | | | | | | | | | |
Class A | | $ | 1,000.00 | | | $ | 897.20 | | | $ | 4.88 | ** | | | 1.02 | % |
Class C | | $ | 1,000.00 | | | $ | 894.10 | | | $ | 8.21 | ** | | | 1.72 | % |
Class I | | $ | 1,000.00 | | | $ | 898.20 | | | $ | 3.44 | ** | | | 0.72 | % |
| | | | | |
Hypothetical | | | | | | | | | | | | | | | | |
(5% return per year before expenses) | | | | | | | | | | | | | | | | |
Class A | | $ | 1,000.00 | | | $ | 1,020.06 | | | $ | 5.19 | ** | | | 1.02 | % |
Class C | | $ | 1,000.00 | | | $ | 1,016.54 | | | $ | 8.74 | ** | | | 1.72 | % |
Class I | | $ | 1,000.00 | | | $ | 1,021.58 | | | $ | 3.67 | ** | | | 0.72 | % |
| * | Expenses are equal to the Fund’s annualized expense ratio for the indicated Class, multiplied by the average account value over the period, multiplied by 184/365 (to reflect the one-half year period). The Example assumes that the $1,000 was invested at the net asset value per share determined at the close of business on April 30, 2022. The Example reflects the expenses of both the Fund and the Portfolio. |
| ** | Absent an allocation of certain expenses to an affiliate, expenses would be higher. |
Eaton Vance
Global Bond Fund
October 31, 2022
Statement of Assets and Liabilities
| | | | |
| Assets | | October 31, 2022 | |
| |
Investment in International Income Portfolio, at value (identified cost $35,081,338) | | $ | 28,547,832 | |
| |
Receivable for Fund shares sold | | | 17,346 | |
| |
Receivable from affiliate | | | 12,283 | |
| |
Total assets | | $ | 28,577,461 | |
|
| Liabilities | |
| |
Payable for Fund shares redeemed | | $ | 98,149 | |
| |
Payable to affiliate: | | | | |
| |
Distribution and service fees | | | 4,008 | |
| |
Trustees’ fees | | | 43 | |
| |
Accrued expenses | | | 65,399 | |
| |
Total liabilities | | $ | 167,599 | |
| |
Net Assets | | $ | 28,409,862 | |
|
| Sources of Net Assets | |
| |
Paid-in capital | | $ | 67,029,751 | |
| |
Accumulated loss | | | (38,619,889 | ) |
| |
Net Assets | | $ | 28,409,862 | |
| |
| Class A Shares | | | | |
| |
Net Assets | | $ | 11,465,523 | |
| |
Shares Outstanding | | | 1,853,506 | |
| |
Net Asset Value and Redemption Price Per Share | | | | |
| |
(net assets ÷ shares of beneficial interest outstanding) | | $ | 6.19 | |
| |
Maximum Offering Price Per Share | | | | |
| |
(100 ÷ 96.75 of net asset value per share) | | $ | 6.40 | |
|
| Class C Shares | |
| |
Net Assets | | $ | 1,238,130 | |
| |
Shares Outstanding | | | 200,162 | |
| |
Net Asset Value and Offering Price Per Share* | | | | |
| |
(net assets ÷ shares of beneficial interest outstanding) | | $ | 6.19 | |
|
| Class I Shares | |
| |
Net Assets | | $ | 15,706,209 | |
| |
Shares Outstanding | | | 2,548,167 | |
| |
Net Asset Value, Offering Price and Redemption Price Per Share | | | | |
| |
(net assets ÷ shares of beneficial interest outstanding) | | $ | 6.16 | |
On sales of $50,000 or more, the offering price of Class A shares is reduced.
| * | Redemption price per share is equal to the net asset value less any applicable contingent deferred sales charge. |
| | | | |
| | 7 | | See Notes to Financial Statements. |
Eaton Vance
Global Bond Fund
October 31, 2022
Statement of Operations
| | | | |
| Investment Income | | Year Ended
October 31, 2022 | |
| |
Dividend income allocated from Portfolio | | $ | 13,263 | |
| |
Interest income allocated from Portfolio (net of foreign taxes withheld of $31,673) | | | 1,547,261 | |
| |
Expenses, excluding interest expense, allocated from Portfolio | | | (283,493 | ) |
| |
Interest expense allocated from Portfolio | | | (9,755 | ) |
| |
Total investment income from Portfolio | | $ | 1,267,276 | |
| |
| Expenses | | | | |
| |
Distribution and service fees: | | | | |
| |
Class A | | $ | 45,899 | |
| |
Class C | | | 16,358 | |
| |
Trustees’ fees and expenses | | | 500 | |
| |
Custodian fee | | | 20,145 | |
| |
Transfer and dividend disbursing agent fees | | | 39,073 | |
| |
Legal and accounting services | | | 40,335 | |
| |
Printing and postage | | | 23,510 | |
| |
Registration fees | | | 48,727 | |
| |
Miscellaneous | | | 10,376 | |
| |
Total expenses | | $ | 244,923 | |
| |
Deduct: | | | | |
| |
Waiver and/or reimbursement of expenses by affiliate | | $ | 184,484 | |
| |
Total expense reductions | | $ | 184,484 | |
| |
Net expenses | | $ | 60,439 | |
| |
Net investment income | | $ | 1,206,837 | |
| |
| Realized and Unrealized Gain (Loss) from Portfolio | | | | |
| |
Net realized gain (loss): | | | | |
| |
Investment transactions (net of foreign capital gains taxes of $1,895) | | $ | (1,635,637 | ) |
| |
Futures contracts | | | 582,465 | |
| |
Swap contracts | | | 349,589 | |
| |
Foreign currency transactions | | | 117,283 | |
| |
Forward foreign currency exchange contracts | | | (1,971,210 | ) |
| |
Non-deliverable bond forward contracts | | | (281,852 | ) |
| |
Net realized loss | | $ | (2,839,362 | ) |
| |
Change in unrealized appreciation (depreciation): | | | | |
| |
Investments (including net decrease in accrued foreign capital gains taxes of $7,886) | | $ | (6,627,941 | ) |
| |
Written swaptions | | | (109,879 | ) |
| |
Futures contracts | | | 77,430 | |
| |
Swap contracts | | | (259,169 | ) |
| |
Foreign currency | | | 10,588 | |
| |
Forward foreign currency exchange contracts | | | 500,923 | |
| |
Non-deliverable bond forward contracts | | | 30,102 | |
| |
Net change in unrealized appreciation (depreciation) | | $ | (6,377,946 | ) |
| |
Net realized and unrealized loss | | $ | (9,217,308 | ) |
| |
Net decrease in net assets from operations | | $ | (8,010,471 | ) |
| | | | |
| | 8 | | See Notes to Financial Statements. |
Eaton Vance
Global Bond Fund
October 31, 2022
Statements of Changes in Net Assets
| | | | | | | | |
| | | Year Ended October 31, | |
| Increase (Decrease) in Net Assets | | 2022 | | | 2021 | |
| | |
From operations: | | | | | | | | |
| | |
Net investment income | | $ | 1,206,837 | | | $ | 1,012,352 | |
| | |
Net realized gain (loss) | | | (2,839,362 | ) | | | 232,528 | |
| | |
Net change in unrealized appreciation (depreciation) | | | (6,377,946 | ) | | | (1,483,776 | ) |
| | |
Net decrease in net assets from operations | | $ | (8,010,471 | ) | | $ | (238,896 | ) |
| | |
Distributions to shareholders: | | | | | | | | |
| | |
Class A | | $ | — | | | $ | (338,341 | ) |
| | |
Class C | | | — | | | | (64,543 | ) |
| | |
Class I | | | — | | | | (628,192 | ) |
| | |
Total distributions to shareholders | | $ | — | | | $ | (1,031,076 | ) |
| | |
Tax return of capital to shareholders: | | | | | | | | |
| | |
Class A | | $ | (632,949 | ) | | $ | (786,092 | ) |
| | |
Class C | | | (56,224 | ) | | | (101,321 | ) |
| | |
Class I | | | (1,023,870 | ) | | | (1,425,879 | ) |
| | |
Total tax return of capital to shareholders | | $ | (1,713,043 | ) | | $ | (2,313,292 | ) |
| | |
Transactions in shares of beneficial interest: | | | | | | | | |
| | |
Class A | | $ | (5,394,244 | ) | | $ | 3,475,301 | |
| | |
Class C | | | (477,741 | ) | | | (2,952,236 | ) |
| | |
Class I | | | (13,964,529 | ) | | | 3,905,497 | |
| | |
Net increase (decrease) in net assets from Fund share transactions | | $ | (19,836,514 | ) | | $ | 4,428,562 | |
| | |
Net increase (decrease) in net assets | | $ | (29,560,028 | ) | | $ | 845,298 | |
|
| Net Assets | |
| | |
At beginning of year | | $ | 57,969,890 | | | $ | 57,124,592 | |
| | |
At end of year | | $ | 28,409,862 | | | $ | 57,969,890 | |
| | | | |
| | 9 | | See Notes to Financial Statements. |
Eaton Vance
Global Bond Fund
October 31, 2022
Financial Highlights
| | | | | | | | | | | | | | | | | | | | |
| | | Class A | |
| |
| | | Year Ended October 31, | |
| | | 2022 | | | 2021 | | | 2020 | | | 2019 | | | 2018 | |
| | | | | |
Net asset value — Beginning of year | | $ | 7.960 | | | $ | 8.440 | | | $ | 8.510 | | | $ | 8.500 | | | $ | 9.130 | |
| | | | | |
| Income (Loss) From Operations | | | | | | | | | | | | | | | | | | | | |
| | | | | |
Net investment income(1) | | $ | 0.207 | | | $ | 0.132 | | | $ | 0.176 | | | $ | 0.295 | | | $ | 0.315 | |
| | | | | |
Net realized and unrealized gain (loss) | | | (1.675 | ) | | | (0.150 | ) | | | 0.292 | | | | 0.174 | | | | (0.539 | ) |
| | | | | |
Total income (loss) from operations | | $ | (1.468 | ) | | $ | (0.018 | ) | | $ | 0.468 | | | $ | 0.469 | | | $ | (0.224 | ) |
| | | | | |
| Less Distributions | | | | | | | | | | | | | | | | | | | | |
| | | | | |
From net investment income | | $ | — | | | $ | (0.146 | ) | | $ | (0.378 | ) | | $ | (0.459 | ) | | $ | (0.052 | ) |
| | | | | |
Tax return of capital | | | (0.302 | ) | | | (0.316 | ) | | | (0.160 | ) | | | — | | | | (0.354 | ) |
| | | | | |
Total distributions | | $ | (0.302 | ) | | $ | (0.462 | ) | | $ | (0.538 | ) | | $ | (0.459 | ) | | $ | (0.406 | ) |
| | | | | |
Net asset value — End of year | | $ | 6.190 | | | $ | 7.960 | | | $ | 8.440 | | | $ | 8.510 | | | $ | 8.500 | |
| | | | | |
Total Return(2)(3) | | | (18.94 | )% | | | (0.38 | )% | | | 5.72 | % | | | 5.62 | % | | | (2.58 | )% |
| | | | | |
| Ratios/Supplemental Data | | | | | | | | | | | | | | | | | | | | |
| | | | | |
Net assets, end of year (000’s omitted) | | $ | 11,466 | | | $ | 20,539 | | | $ | 18,354 | | | $ | 18,677 | | | $ | 19,483 | |
| | | | | |
Ratios (as a percentage of average daily net assets):(4) | | | | | | | | | | | | | | | | | | | | |
| | | | | |
Expenses(3) | | | 1.02 | %(5)(6) | | | 1.01 | %(6) | | | 1.01 | %(6) | | | 1.11 | %(6) | | | 1.11 | %(6) |
| | | | | |
Net investment income | | | 2.89 | % | | | 1.57 | % | | | 2.09 | % | | | 3.43 | % | | | 3.51 | % |
| | | | | |
Portfolio Turnover of the Portfolio | | | 159 | %(7) | | | 102 | %(7) | | | 88 | %(7) | | | 92 | % | | | 23 | % |
| (1) | Computed using average shares outstanding. |
| (2) | Returns are historical and are calculated by determining the percentage change in net asset value with all distributions reinvested and do not reflect the effect of sales charges. |
| (3) | The investment adviser and administrator of the Fund and the investment adviser of the Portfolio reimbursed certain operating expenses (equal to 0.86%, 0.49%, 0.49%, 0.40% and 0.34% of average daily net assets for the years ended October 31, 2022, 2021, 2020, 2019 and 2018, respectively). Absent this reimbursement, total return would be lower. |
| (4) | Includes the Fund’s share of the Portfolio’s allocated expenses. |
| (5) | Includes a reduction by the investment adviser of a portion of the Portfolio’s adviser fee due to the Portfolio’s investment in the Liquidity Fund (equal to less than 0.005% of average daily net assets for the year ended October 31, 2022). |
| (6) | Includes interest expense of 0.02% of average daily net assets for the year ended October 31, 2022 and 0.01% of average daily net assets for each of the years ended October 31, 2021, 2020, 2019 and 2018. |
| (7) | Includes the effect of To-Be-Announced (TBA) transactions. |
| | | | |
| | 10 | | See Notes to Financial Statements. |
Eaton Vance
Global Bond Fund
October 31, 2022
Financial Highlights — continued
| | | | | | | | | | | | | | | | | | | | |
| | | Class C | |
| |
| | | Year Ended October 31, | |
| | | 2022 | | | 2021 | | | 2020 | | | 2019 | | | 2018 | |
| | | | | |
Net asset value — Beginning of year | | $ | 7.960 | | | $ | 8.440 | | | $ | 8.510 | | | $ | 8.500 | | | $ | 9.130 | |
| | | | | |
| Income (Loss) From Operations | | | | | | | | | | | | | | | | | | | | |
| | | | | |
Net investment income(1) | | $ | 0.157 | | | $ | 0.068 | | | $ | 0.123 | | | $ | 0.237 | | | $ | 0.252 | |
| | | | | |
Net realized and unrealized gain (loss) | | | (1.674 | ) | | | (0.146 | ) | | | 0.286 | | | | 0.171 | | | | (0.539 | ) |
| | | | | |
Total income (loss) from operations | | $ | (1.517 | ) | | $ | (0.078 | ) | | $ | 0.409 | | | $ | 0.408 | | | $ | (0.287 | ) |
| | | | | |
| Less Distributions | | | | | | | | | | | | | | | | | | | | |
| | | | | |
From net investment income | | $ | — | | | $ | (0.127 | ) | | $ | (0.336 | ) | | $ | (0.398 | ) | | $ | (0.044 | ) |
| | | | | |
Tax return of capital | | | (0.253 | ) | | | (0.275 | ) | | | (0.143 | ) | | | — | | | | (0.299 | ) |
| | | | | |
Total distributions | | $ | (0.253 | ) | | $ | (0.402 | ) | | $ | (0.479 | ) | | $ | (0.398 | ) | | $ | (0.343 | ) |
| | | | | |
Net asset value — End of year | | $ | 6.190 | | | $ | 7.960 | | | $ | 8.440 | | | $ | 8.510 | | | $ | 8.500 | |
| | | | | |
Total Return(2)(3) | | | (19.50 | )% | | | (1.09 | )% | | | 4.98 | % | | | 4.88 | % | | | (3.26 | )% |
| | | | | |
| Ratios/Supplemental Data | | | | | | | | | | | | | | | | | | | | |
| | | | | |
Net assets, end of year (000’s omitted) | | $ | 1,238 | | | $ | 2,115 | | | $ | 5,173 | | | $ | 9,517 | | | $ | 14,107 | |
| | | | | |
Ratios (as a percentage of average daily net assets):(4) | | | | | | | | | | | | | | | | | | | | |
| | | | | |
Expenses(3) | | | 1.72 | %(5)(6) | | | 1.71 | %(6) | | | 1.71 | %(6) | | | 1.81 | %(6) | | | 1.81 | %(6) |
| | | | | |
Net investment income | | | 2.20 | % | | | 0.80 | % | | | 1.47 | % | | | 2.76 | % | | | 2.81 | % |
| | | | | |
Portfolio Turnover of the Portfolio | | | 159 | %(7) | | | 102 | %(7) | | | 88 | %(7) | | | 92 | % | | | 23 | % |
| (1) | Computed using average shares outstanding. |
| (2) | Returns are historical and are calculated by determining the percentage change in net asset value with all distributions reinvested and do not reflect the effect of sales charges. |
| (3) | The investment adviser and administrator of the Fund and the investment adviser of the Portfolio reimbursed certain operating expenses (equal to 0.86%, 0.49%, 0.49%, 0.40% and 0.34% of average daily net assets for the years ended October 31, 2022, 2021, 2020, 2019 and 2018, respectively). Absent this reimbursement, total return would be lower. |
| (4) | Includes the Fund’s share of the Portfolio’s allocated expenses. |
| (5) | Includes a reduction by the investment adviser of a portion of the Portfolio’s adviser fee due to the Portfolio’s investment in the Liquidity Fund (equal to less than 0.005% of average daily net assets for the year ended October 31, 2022). |
| (6) | Includes interest expense of 0.02% of average daily net assets for the year ended October 31, 2022 and 0.01% of average daily net assets for each of the years ended October 31, 2021, 2020, 2019 and 2018. |
| (7) | Includes the effect of To-Be-Announced (TBA) transactions. |
| | | | |
| | 11 | | See Notes to Financial Statements. |
Eaton Vance
Global Bond Fund
October 31, 2022
Financial Highlights — continued
| | | | | | | | | | | | | | | | | | | | |
| | | Class I | |
| |
| | | Year Ended October 31, | |
| | | 2022 | | | 2021 | | | 2020 | | | 2019 | | | 2018 | |
| | | | | |
Net asset value — Beginning of year | | $ | 7.930 | | | $ | 8.410 | | | $ | 8.480 | | | $ | 8.480 | | | $ | 9.100 | |
| | | | | |
| Income (Loss) From Operations | | | | | | | | | | | | | | | | | | | | |
| | | | | |
Net investment income(1) | | $ | 0.224 | | | $ | 0.156 | | | $ | 0.213 | | | $ | 0.319 | | | $ | 0.341 | |
| | | | | |
Net realized and unrealized gain (loss) | | | (1.671 | ) | | | (0.151 | ) | | | 0.279 | | | | 0.164 | | | | (0.529 | ) |
| | | | | |
Total income (loss) from operations | | $ | (1.447 | ) | | $ | 0.005 | | | $ | 0.492 | | | $ | 0.483 | | | $ | (0.188 | ) |
| | | | | |
| Less Distributions | | | | | | | | | | | | | | | | | | | | |
| | | | | |
From net investment income | | $ | — | | | $ | (0.152 | ) | | $ | (0.395 | ) | | $ | (0.483 | ) | | $ | (0.056 | ) |
| | | | | |
Tax return of capital | | | (0.323 | ) | | | (0.333 | ) | | | (0.167 | ) | | | — | | | | (0.376 | ) |
| | | | | |
Total distributions | | $ | (0.323 | ) | | $ | (0.485 | ) | | $ | (0.562 | ) | | $ | (0.483 | ) | | $ | (0.432 | ) |
| | | | | |
Net asset value — End of year | | $ | 6.160 | | | $ | 7.930 | | | $ | 8.410 | | | $ | 8.480 | | | $ | 8.480 | |
| | | | | |
Total Return(2)(3) | | | (18.65 | )% | | | (0.11 | )% | | | 6.04 | % | | | 5.82 | % | | | (2.19 | )% |
| | | | | |
| Ratios/Supplemental Data | | | | | | | | | | | | | | | | | | | | |
| | | | | |
Net assets, end of year (000’s omitted) | | $ | 15,706 | | | $ | 35,316 | | | $ | 33,597 | | | $ | 56,451 | | | $ | 62,225 | |
| | | | | |
Ratios (as a percentage of average daily net assets):(4) | | | | | | | | | | | | | | | | | | | | |
| | | | | |
Expenses(3) | | | 0.72 | %(5)(6) | | | 0.71 | %(6) | | | 0.71 | %(6) | | | 0.81 | %(6) | | | 0.81 | %(6) |
| | | | | |
Net investment income | | | 3.11 | % | | | 1.86 | % | | | 2.54 | % | | | 3.73 | % | | | 3.81 | % |
| | | | | |
Portfolio Turnover of the Portfolio | | | 159 | %(7) | | | 102 | %(7) | | | 88 | %(7) | | | 92 | % | | | 23 | % |
| (1) | Computed using average shares outstanding. |
| (2) | Returns are historical and are calculated by determining the percentage change in net asset value with all distributions reinvested. |
| (3) | The investment adviser and administrator of the Fund and the investment adviser of the Portfolio reimbursed certain operating expenses (equal to 0.86%, 0.49%, 0.49%, 0.40% and 0.34% of average daily net assets for the years ended October 31, 2022, 2021, 2020, 2019 and 2018, respectively). Absent this reimbursement, total return would be lower. |
| (4) | Includes the Fund’s share of the Portfolio’s allocated expenses. |
| (5) | Includes a reduction by the investment adviser of a portion of the Portfolio’s adviser fee due to the Portfolio’s investment in the Liquidity Fund (equal to less than 0.005% of average daily net assets for the year ended October 31, 2022). |
| (6) | Includes interest expense of 0.02% of average daily net assets for the year ended October 31, 2022 and 0.01% of average daily net assets for each of the years ended October 31, 2021, 2020, 2019 and 2018. |
| (7) | Includes the effect of To-Be-Announced (TBA) transactions. |
| | | | |
| | 12 | | See Notes to Financial Statements. |
Eaton Vance
Global Bond Fund
October 31, 2022
Notes to Financial Statements
1 Significant Accounting Policies
Eaton Vance Global Bond Fund (the Fund) is a diversified series of Eaton Vance Mutual Funds Trust (the Trust). The Trust is a Massachusetts business trust registered under the Investment Company Act of 1940, as amended (the 1940 Act), as an open-end management investment company. The Fund offers three classes of shares. Class A shares are generally sold subject to a sales charge imposed at time of purchase. Class C shares are sold at net asset value and are generally subject to a contingent deferred sales charge (see Note 5). Effective November 5, 2020, Class C shares automatically convert to Class A shares eight years after their purchase as described in the Fund’s prospectus. Class I shares are sold at net asset value and are not subject to a sales charge. Each class represents a pro-rata interest in the Fund, but votes separately on class-specific matters and (as noted below) is subject to different expenses. Realized and unrealized gains and losses and net investment income and losses, other than class-specific expenses, are allocated daily to each class of shares based on the relative net assets of each class to the total net assets of the Fund. Each class of shares differs in its distribution plan and certain other class-specific expenses. The Fund invests all of its investable assets in interests in International Income Portfolio (the Portfolio), a Massachusetts business trust, having the same investment objective and policies as the Fund. The value of the Fund’s investment in the Portfolio reflects the Fund’s proportionate interest in the net assets of the Portfolio (99.9% at October 31, 2022). The performance of the Fund is directly affected by the performance of the Portfolio. The financial statements of the Portfolio, including the portfolio of investments, are included elsewhere in this report and should be read in conjunction with the Fund’s financial statements.
The following is a summary of significant accounting policies of the Fund. The policies are in conformity with accounting principles generally accepted in the United States of America (U.S. GAAP). The Fund is an investment company and follows accounting and reporting guidance in the Financial Accounting Standards Board (FASB) Accounting Standards Codification Topic 946.
A Investment Valuation — Valuation of securities by the Portfolio is discussed in Note 1A of the Portfolio’s Notes to Financial Statements, which are included elsewhere in this report.
B Income — The Fund’s net investment income or loss consists of the Fund’s pro-rata share of the net investment income or loss of the Portfolio, less all actual and accrued expenses of the Fund.
C Federal and Other Taxes — The Fund’s policy is to comply with the provisions of the Internal Revenue Code applicable to regulated investment companies and to distribute to shareholders each year substantially all of its net investment income, and all or substantially all of its net realized capital gains. Accordingly, no provision for federal income or excise tax is necessary.
As of October 31, 2022, the Fund had no uncertain tax positions that would require financial statement recognition, de-recognition, or disclosure. The Fund files a U.S. federal income tax return annually after its fiscal year-end, which is subject to examination by the Internal Revenue Service for a period of three years from the date of filing.
D Expenses — The majority of expenses of the Trust are directly identifiable to an individual fund. Expenses which are not readily identifiable to a specific fund are allocated taking into consideration, among other things, the nature and type of expense and the relative size of the funds.
E Use of Estimates — The preparation of the financial statements in conformity with U.S. GAAP requires management to make estimates and assumptions that affect the reported amounts of assets and liabilities at the date of the financial statements and the reported amounts of income and expense during the reporting period. Actual results could differ from those estimates.
F Indemnifications — Under the Trust’s organizational documents, its officers and Trustees may be indemnified against certain liabilities and expenses arising out of the performance of their duties to the Fund. Under Massachusetts law, if certain conditions prevail, shareholders of a Massachusetts business trust (such as the Trust) could be deemed to have personal liability for the obligations of the Trust. However, the Trust’s Declaration of Trust contains an express disclaimer of liability on the part of Fund shareholders and the By-laws provide that the Trust shall assume, upon request by the shareholder, the defense on behalf of any Fund shareholders. Moreover, the By-laws also provide for indemnification out of Fund property of any shareholder held personally liable solely by reason of being or having been a shareholder for all loss or expense arising from such liability. Additionally, in the normal course of business, the Fund enters into agreements with service providers that may contain indemnification clauses. The Fund’s maximum exposure under these arrangements is unknown as this would involve future claims that may be made against the Fund that have not yet occurred.
G Other — Investment transactions are accounted for on a trade date basis.
Eaton Vance
Global Bond Fund
October 31, 2022
Notes to Financial Statements — continued
2 Distributions to Shareholders and Income Tax Information
The Fund expects to pay any required income distributions monthly and intends to distribute annually all or substantially all of its net realized capital gains. The Fund may include in its distributions amounts attributable to the imputed interest on foreign currency exposures and certain other derivative positions which, in certain circumstances, may result in a return of capital for federal income tax purposes. Distributions to shareholders are recorded on the ex-dividend date. Distributions are declared separately for each class of shares. Shareholders may reinvest income and capital gain distributions in additional shares of the same class of the Fund at the net asset value as of the ex-dividend date or, at the election of the shareholder, receive distributions in cash. Distributions to shareholders are determined in accordance with income tax regulations, which may differ from U.S. GAAP. As required by U.S. GAAP, only distributions in excess of tax basis earnings and profits are reported in the financial statements as a return of capital. Permanent differences between book and tax accounting relating to distributions are reclassified to paid-in capital. For tax purposes, distributions from short-term capital gains are considered to be from ordinary income.
The tax character of distributions declared for the years ended October 31, 2022 and October 31, 2021 was as follows:
| | | | | | | | |
| | | Year Ended October 31, | |
| | | 2022 | | | 2021 | |
| | |
Ordinary income | | $ | — | | | $ | 1,031,076 | |
| | |
Tax return of capital | | $ | 1,713,043 | | | $ | 2,313,292 | |
During the year ended October 31, 2022, accumulated loss was decreased by $5,506,809 and paid-in capital was decreased by $5,506,809 primarily due to differences between book and tax accounting for net operating losses. These reclassifications had no effect on the net assets or net asset value per share of the Fund.
As of October 31, 2022, the components of distributable earnings (accumulated loss) on a tax basis were as follows:
| | | | |
| | |
Deferred capital losses | | $ | (32,696,823 | ) |
| |
Net unrealized depreciation | | | (5,923,066 | ) |
| |
Accumulated loss | | $ | (38,619,889 | ) |
At October 31, 2022, the Fund, for federal income tax purposes, had deferred capital losses of $32,696,823 which would reduce its taxable income arising from future net realized gains on investment transactions, if any, to the extent permitted by the Internal Revenue Code, and thus would reduce the amount of distributions to shareholders, which would otherwise be necessary to relieve the Fund of any liability for federal income or excise tax. The deferred capital losses are treated as arising on the first day of the Fund’s next taxable year and retain the same short-term or long-term character as when originally deferred. Of the deferred capital losses at October 31, 2022, $8,026,020 are short-term and $24,670,803 are long-term.
3 Investment Adviser Fee and Other Transactions with Affiliates
The investment adviser fee is earned by Eaton Vance Management (EVM), an indirect, wholly-owned subsidiary of Morgan Stanley, as compensation for investment advisory services rendered to the Fund. The investment adviser fee is computed at an annual rate as a percentage of the Fund’s average daily net assets that are not invested in other investment companies for which EVM or its affiliates serve as investment adviser and receive an advisory fee as follows and is payable monthly:
| | | | |
| Average Daily Net Assets | | Annual Fee Rate | |
| |
Up to $1 billion | | | 0.500 | % |
| |
$1 billion but less than $2.5 billion | | | 0.475 | % |
| |
$2.5 billion but less than $5 billion | | | 0.455 | % |
| |
$5 billion and over | | | 0.440 | % |
For the year ended October 31, 2022, the Fund incurred no investment adviser fee on such assets. To the extent the Fund’s assets are invested in the Portfolio, the Fund is allocated its share of the Portfolio’s investment adviser fee. The Portfolio has engaged Boston Management and Research (BMR), a subsidiary of EVM, to render investment advisory services. See Note 2 of the Portfolio’s Notes to Financial Statements which are included elsewhere in this report. EVM also serves as the administrator of the Fund, but receives no compensation. EVM has agreed to reimburse the Fund’s expenses to the extent that total annual operating expenses (relating to ordinary operating expenses only and excluding such expenses as borrowing costs, taxes or litigation expenses) exceed 1.00%, 1.70% and 0.70% of the Fund’s average daily net assets for Class A, Class C and Class I, respectively. This agreement may be changed or terminated after February 28, 2023. Pursuant to this agreement, EVM was allocated $184,484 of the Fund’s operating expenses for the year ended October 31, 2022.
Eaton Vance
Global Bond Fund
October 31, 2022
Notes to Financial Statements — continued
EVM provides sub-transfer agency and related services to the Fund pursuant to a Sub-Transfer Agency Support Services Agreement. For the year ended October 31, 2022, EVM earned $4,031 from the Fund pursuant to such agreement, which is included in transfer and dividend disbursing agent fees on the Statement of Operations. The Fund was informed that Eaton Vance Distributors, Inc. (EVD), an affiliate of EVM and the Fund’s principal underwriter, received $1,009 as its portion of the sales charge on sales of Class A shares for the year ended October 31, 2022. EVD also received distribution and service fees from Class A and Class C shares (see Note 4) and contingent deferred sales charges (see Note 5).
Trustees and officers of the Fund who are members of EVM’s or BMR’s organizations receive remuneration for their services to the Fund out of the investment adviser fee. Certain officers and Trustees of the Fund and the Portfolio are officers of the above organizations.
4 Distribution Plans
The Fund has in effect a distribution plan for Class A shares (Class A Plan) pursuant to Rule 12b-1 under the 1940 Act. Pursuant to the Class A Plan, the Fund pays EVD a distribution and service fee of 0.30% per annum of its average daily net assets attributable to Class A shares for distribution services and facilities provided to the Fund by EVD, as well as for personal services and/or the maintenance of shareholder accounts. Distribution and service fees paid or accrued to EVD for the year ended October 31, 2022 amounted to $45,899 for Class A shares.
The Fund also has in effect a distribution plan for Class C shares (Class C Plan) pursuant to Rule 12b-1 under the 1940 Act. Pursuant to the Class C Plan, the Fund pays EVD amounts equal to 0.75% per annum of its average daily net assets attributable to Class C shares for providing ongoing distribution services and facilities to the Fund. For the year ended October 31, 2022, the Fund paid or accrued to EVD $12,269 for Class C shares.
Pursuant to the Class C Plan, the Fund also makes payments of service fees to EVD, financial intermediaries and other persons in amounts equal to 0.25% per annum of its average daily net assets attributable to that class. Service fees paid or accrued are for personal services and/or the maintenance of shareholder accounts. They are separate and distinct from the sales commissions and distribution fees payable to EVD. Service fees paid or accrued for the year ended October 31, 2022 amounted to $4,089 for Class C shares.
Distribution and service fees are subject to the limitations contained in the Financial Industry Regulatory Authority Rule 2341(d).
5 Contingent Deferred Sales Charges
A contingent deferred sales charge (CDSC) of 1% generally is imposed on redemptions of Class C shares made within 12 months of purchase. Class A shares may be subject to a 0.75% (1% prior to April 29, 2022) CDSC if redeemed within 12 months (18 months prior to April 29, 2022) of purchase (depending on the circumstances of purchase). Generally, the CDSC is based upon the lower of the net asset value at date of redemption or date of purchase. No charge is levied on shares acquired by reinvestment of dividends or capital gain distributions. For the year ended October 31, 2022, the Fund was informed that EVD received approximately $100 of CDSCs paid by Class C shareholders and no CDSCs paid by Class A shareholders.
6 Investment Transactions
For the year ended October 31, 2022, increases and decreases in the Fund’s investment in the Portfolio aggregated $3,228,450 and $24,824,354, respectively.
7 Shares of Beneficial Interest
The Fund’s Declaration of Trust permits the Trustees to issue an unlimited number of full and fractional shares of beneficial interest (without par value). Such shares may be issued in a number of different series (such as the Fund) and classes. Transactions in Fund shares, including direct exchanges pursuant to share class conversions for all periods presented, were as follows:
| | | | | | | | | | | | | | | | |
| | | Year Ended
October 31, 2022 | | | Year Ended
October 31, 2021 | |
| | | Shares | | | Amount | | | Shares | | | Amount | |
| | | | |
Class A | | | | | | | | | | | | | | | | |
| | | | |
Sales | | | 408,177 | | | $ | 3,124,350 | | | | 691,537 | | | $ | 5,881,860 | |
| | | | |
Issued to shareholders electing to receive payments of distributions in Fund shares | | | 83,567 | | | | 588,630 | | | | 124,272 | | | | 1,044,743 | |
| | | | |
Redemptions | | | (1,218,517 | ) | | | (9,107,224 | ) | | | (409,469 | ) | | | (3,451,302 | ) |
| | | | |
Net increase (decrease) | | | (726,773 | ) | | $ | (5,394,244 | ) | | | 406,340 | | | $ | 3,475,301 | |
Eaton Vance
Global Bond Fund
October 31, 2022
Notes to Financial Statements — continued
| | | | | | | | | | | | | | | | |
| | | Year Ended
October 31, 2022 | | | Year Ended
October 31, 2021 | |
| | | Shares | | | Amount | | | Shares | | | Amount | |
| | | | |
Class C | | | | | | | | | | | | | | | | |
| | | | |
Sales | | | 38,835 | | | $ | 264,123 | | | | 46,277 | | | $ | 396,685 | |
| | | | |
Issued to shareholders electing to receive payments of distributions in Fund shares | | | 7,225 | | | | 50,726 | | | | 17,461 | | | | 148,164 | |
| | | | |
Redemptions | | | (111,572 | ) | | | (792,590 | ) | | | (410,797 | ) | | | (3,497,085 | ) |
| | | | |
Net decrease | | | (65,512 | ) | | $ | (477,741 | ) | | | (347,059 | ) | | $ | (2,952,236 | ) |
| | | | |
Class I | | | | | | | | | | | | | | | | |
| | | | |
Sales | | | 552,602 | | | $ | 3,938,764 | | | | 1,383,572 | | | $ | 11,674,860 | |
| | | | |
Issued to shareholders electing to receive payments of distributions in Fund shares | | | 144,084 | | | | 1,019,604 | | | | 243,869 | | | | 2,044,729 | |
| | | | |
Redemptions | | | (2,599,911 | ) | | | (18,922,897 | ) | | | (1,168,674 | ) | | | (9,814,092 | ) |
| | | | |
Net increase (decrease) | | | (1,903,225 | ) | | $ | (13,964,529 | ) | | | 458,767 | | | $ | 3,905,497 | |
Eaton Vance
Global Bond Fund
October 31, 2022
Report of Independent Registered Public Accounting Firm
To the Trustees of Eaton Vance Mutual Funds Trust and Shareholders of Eaton Vance Global Bond Fund:
Opinion on the Financial Statements and Financial Highlights
We have audited the accompanying statement of assets and liabilities of Eaton Vance Global Bond Fund (the “Fund”) (one of the funds constituting Eaton Vance Mutual Funds Trust), as of October 31, 2022, the related statement of operations for the year then ended, the statements of changes in net assets for each of the two years in the period then ended, the financial highlights for each of the five years in the period then ended, and the related notes. In our opinion, the financial statements and financial highlights present fairly, in all material respects, the financial position of the Fund as of October 31, 2022, and the results of its operations for the year then ended, the changes in its net assets for each of the two years in the period then ended, and the financial highlights for each of the five years in the period then ended, in conformity with accounting principles generally accepted in the United States of America.
Basis for Opinion
These financial statements and financial highlights are the responsibility of the Fund’s management. Our responsibility is to express an opinion on the Fund’s financial statements and financial highlights based on our audits. We are a public accounting firm registered with the Public Company Accounting Oversight Board (United States) (PCAOB) and are required to be independent with respect to the Fund in accordance with the U.S. federal securities laws and the applicable rules and regulations of the Securities and Exchange Commission and the PCAOB.
We conducted our audits in accordance with the standards of the PCAOB. Those standards require that we plan and perform the audit to obtain reasonable assurance about whether the financial statements and financial highlights are free of material misstatement, whether due to error or fraud. The Fund is not required to have, nor were we engaged to perform, an audit of its internal control over financial reporting. As part of our audits, we are required to obtain an understanding of internal control over financial reporting but not for the purpose of expressing an opinion on the effectiveness of the Fund’s internal control over financial reporting. Accordingly, we express no such opinion.
Our audits included performing procedures to assess the risks of material misstatement of the financial statements and financial highlights, whether due to error or fraud, and performing procedures that respond to those risks. Such procedures included examining, on a test basis, evidence regarding the amounts and disclosures in the financial statements and financial highlights. Our audits also included evaluating the accounting principles used and significant estimates made by management, as well as evaluating the overall presentation of the financial statements and financial highlights. We believe that our audits provide a reasonable basis for our opinion.
/s/ Deloitte & Touche LLP
Boston, Massachusetts
December 28, 2022
We have served as the auditor of one or more Eaton Vance investment companies since 1959.
Eaton Vance
Global Bond Fund
October 31, 2022
Federal Tax Information (Unaudited)
The Form 1099-DIV you receive in February 2023 will show the tax status of all distributions paid to your account in calendar year 2022. Shareholders are advised to consult their own tax adviser with respect to the tax consequences of their investment in the Fund. As required by the Internal Revenue Code and/or regulations, shareholders must be notified regarding 163(j) interest dividends and the foreign tax credit.
163(j) Interest Dividends. For the fiscal year ended October 31, 2022, the Fund designates 100% of distributions from net investment income as a 163(j) interest dividend.
Foreign Tax Credit. For the fiscal year ended October 31, 2022, the Fund paid foreign taxes of $33,568 and recognized foreign source income of $1,200,064.
International Income Portfolio
October 31, 2022
Portfolio of Investments
| | | | | | | | | | | | |
| Collateralized Mortgage Obligations — 5.5% | |
| Security | | Principal
Amount
(000’s omitted) | | | Value | |
| | | |
Federal Home Loan Mortgage Corp., Series 2022-DNA1, Class M2, 5.497%, (30-day SOFR + 2.50%), 1/25/42(1)(2) | | | $ | | | | 1,800 | | | $ | 1,572,634 | |
| |
Total Collateralized Mortgage Obligations
(identified cost $1,146,021) | | | $ | 1,572,634 | |
|
| Foreign Corporate Bonds — 4.9% | |
| Security | | Principal
Amount
(000’s omitted) | | | Value | |
|
| Iceland — 4.3% | |
| | | |
Arion Banki HF, 6.00%, 4/12/24(3) | | | ISK | | | | 100,000 | | | $ | 687,218 | |
| | | |
Islandsbanki HF, 6.40%, 10/26/23 | | | ISK | | | | 40,000 | | | | 275,852 | |
| | | |
Landsbankinn HF, 5.00%, 11/23/23(3) | | | ISK | | | | 40,000 | | | | 272,763 | |
| | | |
| | | | | | | | | | | $ | 1,235,833 | |
|
| India — 0.6% | |
| | | |
Indian Railway Finance Corp., Ltd., 3.57%, 1/21/32(3) | | | USD | | | | 200 | | | $ | 156,529 | |
| | | |
| | | | | | | | | | | $ | 156,529 | |
| |
Total Foreign Corporate Bonds
(identified cost $1,759,452) | | | $ | 1,392,362 | |
|
| Sovereign Government Bonds — 54.3% | |
| Security | | Principal
Amount
(000’s omitted) | | | Value | |
|
| Australia — 9.4% | |
| | | |
Australian Capital Territory, 1.25%, 5/22/25(3) | | | AUD | | | | 2,350 | | | $ | 1,415,292 | |
| | | |
New South Wales Treasury Corp., 4.00%, 5/20/26(3) | | | AUD | | | | 1,967 | | | | 1,264,390 | |
| | | |
| | | | | | | | | | | $ | 2,679,682 | |
|
| Colombia — 2.5% | |
| |
| Titulos De Tesoreria B: | | | | |
| | | |
5.75%, 11/3/27 | | | COP | | | | 1,654,000 | | | $ | 243,139 | |
| | | |
6.00%, 4/28/28 | | | COP | | | | 645,000 | | | | 93,829 | |
| | | |
7.00%, 3/26/31 | | | COP | | | | 1,409,600 | | | | 191,579 | |
| | | |
7.00%, 6/30/32 | | | COP | | | | 1,367,900 | | | | 178,980 | |
| | | |
| | | | | | | | | | | $ | 707,527 | |
| | | | | | | | | | | | |
| Security | | Principal
Amount
(000’s omitted) | | | Value | |
|
| Dominican Republic — 2.7% | |
| |
| Dominican Republic: | | | | |
| | | |
8.00%, 1/15/27(3) | | | DOP | | | | 3,970 | | | $ | 62,276 | |
| | | |
8.00%, 2/12/27(3) | | | DOP | | | | 20,150 | | | | 314,234 | |
| | | |
12.00%, 8/8/25(1) | | | DOP | | | | 10,930 | | | | 192,793 | |
| | | |
13.00%, 6/9/34(3) | | | DOP | | | | 10,600 | | | | 193,931 | |
| | | |
Dominican Republic Central Bank Notes, 8.00%, 3/12/27(3) | | | DOP | | | | 900 | | | | 13,414 | |
| | | |
| | | | | | | | | | | $ | 776,648 | |
|
| Egypt — 1.2% | |
| |
| Arab Republic of Egypt: | | | | |
| | | |
7.50%, 2/16/61(3) | | | USD | | | | 200 | | | $ | 112,200 | |
| | | |
8.875%, 5/29/50(3) | | | USD | | | | 388 | | | | 231,775 | |
| | | |
| | | | | | | | | | | $ | 343,975 | |
|
| Honduras — 1.1% | |
| | | |
Honduras Government International Bond, 7.50%, 3/15/24(3) | | | USD | | | | 317 | | | $ | 316,667 | |
| | | |
| | | | | | | | | | | $ | 316,667 | |
|
| Iceland — 0.1% | |
| | | |
Republic of Iceland, 5.00%, 11/15/28 | | | ISK | | | | 3,916 | | | $ | 25,369 | |
| | | |
| | | | | | | | | | | $ | 25,369 | |
|
| India — 2.6% | |
| | | |
Export-Import Bank of India, 2.25%, 1/13/31(3) | | | USD | | | | 1,000 | | | $ | 735,490 | |
| | | |
| | | | | | | | | | | $ | 735,490 | |
|
| Italy — 6.4% | |
| | | |
Italy Buoni Poliennali Del Tesoro, 0.00%, 8/1/26(3) | | | EUR | | | | 2,100 | | | $ | 1,834,286 | |
| | | |
| | | | | | | | | | | $ | 1,834,286 | |
|
| Jordan — 0.5% | |
| | | |
Kingdom of Jordan, 7.375%, 10/10/47(3) | | | USD | | | | 200 | | | $ | 150,667 | |
| | | |
| | | | | | | | | | | $ | 150,667 | |
|
| New Zealand — 5.1% | |
| | | |
New Zealand Government Bond, 3.00%, 9/20/30(3)(4) | | | NZD | | | | 2,364 | | | $ | 1,461,297 | |
| | | |
| | | | | | | | | | | $ | 1,461,297 | |
|
| Oman — 0.6% | |
| | | |
Oman Government International Bond, 6.75%, 1/17/48(3) | | | USD | | | | 200 | | | $ | 168,610 | |
| | | |
| | | | | | | | | | | $ | 168,610 | |
| | | | |
| | 19 | | See Notes to Financial Statements. |
International Income Portfolio
October 31, 2022
Portfolio of Investments — continued
| | | | | | | | | | | | |
| Security | | Principal
Amount
(000’s omitted) | | | Value | |
|
| Peru — 0.9% | |
| | | |
Peru Government Bond: | | | | | | | | | | | | |
| | | |
6.15%, 8/12/32 | | | PEN | | | | 355 | | | $ | 76,004 | |
| | | |
6.95%, 8/12/31 | | | PEN | | | | 845 | | | | 195,200 | |
| | | |
| | | | | | | | | | | $ | 271,204 | |
|
| Philippines — 1.9% | |
| | | |
Republic of the Philippines, 6.25%, 1/14/36 | | | PHP | | | | 34,000 | | | $ | 533,468 | |
| | | |
| | | | | | | | | | | $ | 533,468 | |
|
| Romania — 0.7% | |
| | | |
Romania Government International Bond, 3.375%, 1/28/50(3) | | | EUR | | | | 405 | | | $ | 214,008 | |
| | | |
| | | | | | | | | | | $ | 214,008 | |
|
| Serbia — 5.2% | |
| | | |
Serbia Treasury Bond, 5.875%, 2/8/28 | | | RSD | | | | 187,260 | | | $ | 1,471,164 | |
| | | |
| | | | | | | | | | | $ | 1,471,164 | |
|
| South Africa — 5.5% | |
| | | |
Republic of South Africa, 10.50%, 12/21/26 | | | ZAR | | | | 27,560 | | | $ | 1,574,605 | |
| | | |
| | | | | | | | | | | $ | 1,574,605 | |
|
| South Korea — 4.6% | |
| | | |
Korea Treasury Bond, 4.00%, 12/10/31 | | | KRW | | | | 1,901,500 | | | $ | 1,317,631 | |
| | | |
| | | | | | | | | | | $ | 1,317,631 | |
|
| Ukraine — 1.9% | |
| | | |
Ukraine Government Bond: | | | | | | | | | | | | |
| | | |
10.95%, 11/1/23(5) | | | UAH | | | | 302 | | | $ | 3,155 | |
| | | |
11.67%, 11/22/23(5) | | | UAH | | | | 1,508 | | | | 15,755 | |
| | | |
15.84%, 2/26/25(5) | | | UAH | | | | 45,809 | | | | 512,787 | |
| | | |
15.97%, 4/19/23(5) | | | UAH | | | | 70 | | | | 732 | |
| | | |
| | | | | | | | | | | $ | 532,429 | |
|
| Uruguay — 1.4% | |
| | | |
Uruguay Government Bond, 3.875%, 7/2/40(4) | | | UYU | | | | 15,978 | | | $ | 396,697 | |
| | | |
| | | | | | | | | | | $ | 396,697 | |
| |
Total Sovereign Government Bonds
(identified cost $21,633,075) | | | $ | 15,511,424 | |
| | | | | | | | | | | | |
| U.S. Government Agency Mortgage-Backed Securities — 9.7% | |
| Security | | Principal
Amount
(000’s omitted) | | | Value | |
| | | |
Federal National Mortgage Association: | | | | | | | | | | | | |
| | | |
4.152%, (COF + 1.79%), with maturity at 2035(7) | | $ | | | | | 115 | | | $ | 116,694 | |
| | | |
5.50%, 30-Year, TBA(6) | | | | | | | 2,700 | | | | 2,662,725 | |
| |
Total U.S. Government Agency Mortgage-Backed Securities
(identified cost $2,788,505) | | | $ | 2,779,419 | |
|
| U.S. Treasury Obligations — 4.8% | |
| Security | | Principal
Amount
(000’s omitted) | | | Value | |
| | | |
U.S. Treasury Bond, 1.75%, 8/15/41(8) | | | $ | | | | 1,828 | | | $ | 1,193,912 | |
| | | |
U.S. Treasury Inflation-Protected Bond, 0.125%, 2/15/52(9) | | | | | | | 284 | | | | 182,505 | |
| |
Total U.S. Treasury Obligations
(identified cost $1,658,064) | | | $ | 1,376,417 | |
|
| Short-Term Investments — 25.2% | |
|
| Affiliated Fund — 4.8% | |
| Security | | | | | Shares | | | Value | |
| | | |
Morgan Stanley Institutional Liquidity Funds - Government Portfolio, Institutional Class, 2.88%(10) | | | | | | | 1,368,351 | | | $ | 1,368,351 | |
| |
Total Affiliated Fund
(identified cost $1,368,351) | | | $ | 1,368,351 | |
|
| Sovereign Government Securities — 4.9% | |
| Security | | Principal
Amount
(000’s omitted) | | | Value | |
|
| Israel — 4.8% | |
| | | |
Bank of Israel Treasury Bill: | | | | | | | | | | | | |
| | | |
0.00%, 12/7/22 | | | ILS | | | | 1,735 | | | $ | 490,368 | |
| | | |
0.00%, 12/7/22 | | | ILS | | | | 1,735 | | | | 490,369 | |
| | | |
0.00%, 12/7/22 | | | ILS | | | | 1,230 | | | | 347,508 | |
| | | |
0.00%, 1/4/23 | | | ILS | | | | 45 | | | | 12,696 | |
| | | |
0.00%, 1/4/23 | | | ILS | | | | 45 | | | | 12,696 | |
| | | |
0.00%, 1/4/23 | | | ILS | | | | 32 | | | | 8,932 | |
| | | |
| | | | | | | | | | | $ | 1,362,569 | |
| | | | |
| | 20 | | See Notes to Financial Statements. |
International Income Portfolio
October 31, 2022
Portfolio of Investments — continued
| | | | | | | | | | | | |
| Security | | Principal
Amount
(000’s omitted) | | | Value | |
|
| Ukraine — 0.1% | |
| | | |
Ukraine Treasury Bill, 0.00%, 3/1/23(5) | | | UAH | | | | 1,775 | | | $ | 41,884 | |
| | | |
| | | | | | | | | | | $ | 41,884 | |
| |
Total Sovereign Government Securities
(identified cost $1,460,525) | | | $ | 1,404,453 | |
|
| U.S. Treasury Obligations — 15.5% | |
| Security | | Principal
Amount
(000’s omitted) | | | Value | |
| | | |
U.S. Treasury Bill: | | | | | | | | | | | | |
| | | |
0.00%, 11/1/22 | | | $ | | | | 1,200 | | | $ | 1,200,000 | |
| | | |
0.00%, 11/8/22(8) | | | | | | | 1,025 | | | | 1,024,469 | |
| | | |
0.00%, 12/6/22 | | | | | | | 884 | | | | 880,980 | |
| | | |
0.00%, 12/6/22 | | | | | | | 1,316 | | | | 1,311,504 | |
| |
Total U.S. Treasury Obligations
(identified cost $4,417,006) | | | $ | 4,416,953 | |
| |
Total Short-Term Investments
(identified cost $7,245,882) | | | $ | 7,189,757 | |
| |
Total Purchased Options — 0.0%(11)
(identified cost $32,900) | | | $ | 1 | |
| |
Total Investments — 104.4%
(identified cost $36,263,899) | | | $ | 29,822,014 | |
| |
Total Written Swaptions — (0.6)%
(premiums received $61,500) | | | $ | (171,406 | ) |
| |
Other Assets, Less Liabilities — (3.8)% | | | $ | (1,095,742 | ) |
| |
Net Assets — 100.0% | | | $ | 28,554,866 | |
The percentage shown for each investment category in the Portfolio of Investments is based on net assets.
| (1) | Security exempt from registration under Rule 144A of the Securities Act of 1933, as amended. These securities may be sold in certain transactions in reliance on an exemption from registration (normally to qualified institutional buyers). At October 31, 2022, the aggregate value of these securities is $1,765,427 or 6.2% of the Portfolio’s net assets. |
| (2) | Variable rate security. The stated interest rate represents the rate in effect at October 31, 2022. |
| (3) | Security exempt from registration under Regulation S of the Securities Act of 1933, as amended, which exempts from registration securities offered and sold outside the United States. Security may not be offered or sold in the United States except pursuant to an exemption from, or in a transaction not subject to, the registration requirements of the Securities Act of 1933, as amended. At October 31, 2022, the aggregate value of these securities is $9,605,047 or 33.6% of the Portfolio’s net assets. |
| (4) | Inflation-linked security whose principal is adjusted for inflation based on changes in a designated inflation index or inflation rate for the applicable country. Interest is calculated based on the inflation-adjusted principal. |
| (5) | For fair value measurement disclosure purposes, security is categorized as Level 3 (see Note 8). |
| (6) | TBA (To Be Announced) securities are purchased on a forward commitment basis with an approximate principal amount and maturity date. The actual principal amount and maturity date are determined upon settlement. |
| (7) | Adjustable rate mortgage security whose interest rate generally adjusts monthly based on a weighted average of interest rates on the underlying mortgages. The coupon rate may not reflect the applicable index value as interest rates on the underlying mortgages may adjust on various dates and at various intervals and may be subject to lifetime ceilings and lifetime floors and lookback periods. Rate shown is the coupon rate at October 31, 2022. |
| (8) | Security (or a potion thereof) has been pledged to cover collateral requirements on open derivative contracts. |
| (9) | Inflation-linked security whose principal is adjusted for inflation based on changes in the U.S. Consumer Price Index. Interest is calculated based on the inflation-adjusted principal. |
| (10) | May be deemed to be an affiliated investment company. The rate shown is the annualized seven-day yield as of October 31, 2022. |
| (11) | Amount is less than 0.05%. |
| | | | | | | | | | | | | | | | |
| Purchased Call Options — 0.0%(1) | |
| | | | | |
| Description | | Counterparty | | Notional Amount | | Spread | | | Expiration
Date | | | Value | |
| | | | | |
| 2-year 10 Constant Maturity Swap Curve Cap | | Bank of America, N.A. | | USD 23,500,000 | | | 1.09% | | | | 1/4/23 | | | $ | 1 | |
| | | | | |
Total | | | | | | | | | | | | | | $ | 1 | |
| (1) | Amount is less than 0.05%. |
| | | | |
| | 21 | | See Notes to Financial Statements. |
International Income Portfolio
October 31, 2022
Portfolio of Investments — continued
| | | | | | | | | | | | | | | | | | | | |
| Written Interest Rate Swaptions — (0.6)% | |
| | | | | |
| Description | | Counterparty | | | | | | Notional
Amount | | | Expiration
Date | | | Value | |
| | | | | |
| Option to enter into interest rate swap expiring 11/3/22 to pay SOFR and receive 3.06% | | | Bank of America, N.A. | | | | USD | | | | (1,000,000) | | | | 11/3/22 | | | $ | (62,363 | ) |
| | | | | |
| Option to enter into interest rate swap expiring 5/3/23 to pay SOFR and receive 3.31% | | | Bank of America, N.A. | | | | USD | | | | (1,000,000) | | | | 5/3/23 | | | | (52,573 | ) |
| | | | | |
| Option to enter into interest rate swap expiring 1/31/33 to pay SOFR and receive 3.18% | | | JPMorgan Chase Bank, N.A. | | | | USD | | | | (1,000,000) | | | | 1/31/23 | | | | (56,470 | ) |
| | | | | |
Total | | | | | | | | | | | | | | | | | | $ | (171,406 | ) |
| | | | | | | | | | | | | | | | | | |
| Forward Foreign Currency Exchange Contracts (Centrally Cleared) | |
| | | |
| Currency Purchased | | | Currency Sold | | | Settlement
Date | | | Value/Unrealized
Appreciation
(Depreciation) | |
| | | | | |
| BRL | | | 419,608 | | | USD | | | 77,777 | | | | 11/4/22 | | | $ | 3,436 | |
| | | | | |
| BRL | | | 64,754 | | | USD | | | 11,974 | | | | 11/4/22 | | | | 559 | |
| | | | | |
| USD | | | 93,147 | | | BRL | | | 484,362 | | | | 11/4/22 | | | | (599 | ) |
| | | | | |
| USD | | | 780,924 | | | ZAR | | | 13,418,611 | | | | 11/18/22 | | | | 51,323 | |
| | | | | |
| USD | | | 166,413 | | | PHP | | | 9,400,000 | | | | 11/25/22 | | | | 4,760 | |
| | | | | |
| USD | | | 164,666 | | | PHP | | | 9,300,000 | | | | 11/25/22 | | | | 4,733 | |
| | | | | |
| USD | | | 159,027 | | | PHP | | | 9,000,000 | | | | 11/25/22 | | | | 4,254 | |
| | | | | |
| USD | | | 137,834 | | | PHP | | | 7,800,000 | | | | 11/25/22 | | | | 3,696 | |
| | | | | |
| BRL | | | 484,362 | | | USD | | | 92,572 | | | | 12/2/22 | | | | 618 | |
| | | | | |
| AUD | | | 3,657,925 | | | USD | | | 2,475,793 | | | | 12/21/22 | | | | (132,279 | ) |
| | | | | |
| COP | | | 1,144,074,000 | | | USD | | | 232,064 | | | | 12/21/22 | | | | (2,380 | ) |
| | | | | |
| EUR | | | 583,018 | | | USD | | | 579,578 | | | | 12/21/22 | | | | (1,055 | ) |
| | | | | |
| EUR | | | 11,008,954 | | | USD | | | 11,077,422 | | | | 12/21/22 | | | | (153,356 | ) |
| | | | | |
| IDR | | | 1,224,700,000 | | | USD | | | 81,739 | | | | 12/21/22 | | | | (3,488 | ) |
| | | | | |
| IDR | | | 1,210,100,000 | | | USD | | | 81,247 | | | | 12/21/22 | | | | (3,929 | ) |
| | | | | |
| IDR | | | 1,254,000,000 | | | USD | | | 84,164 | | | | 12/21/22 | | | | (4,041 | ) |
| | | | | |
| IDR | | | 33,905,129,911 | | | USD | | | 2,264,690 | | | | 12/21/22 | | | | (98,345 | ) |
| | | | | |
| KRW | | | 556,618,900 | | | USD | | | 390,218 | | | | 12/21/22 | | | | 114 | |
| | | | | |
| NZD | | | 550,000 | | | USD | | | 330,550 | | | | 12/21/22 | | | | (10,540 | ) |
| | | | | |
| NZD | | | 1,600,000 | | | USD | | | 961,600 | | | | 12/21/22 | | | | (30,662 | ) |
| | | | | |
| PEN | | | 68,804 | | | USD | | | 17,137 | | | | 12/21/22 | | | | 38 | |
| | | | | |
| PEN | | | 1,096,770 | | | USD | | | 279,760 | | | | 12/21/22 | | | | (5,991 | ) |
| | | | | |
| SEK | | | 17,150,000 | | | USD | | | 1,611,388 | | | | 12/21/22 | | | | (51,663 | ) |
| | | | | |
| USD | | | 3,269,882 | | | AUD | | | 4,831,242 | | | | 12/21/22 | | | | 174,661 | |
| | | | | |
| USD | | | 290,558 | | | CLP | | | 278,500,000 | | | | 12/21/22 | | | | (2,208 | ) |
| | | | | |
| USD | | | 431,608 | | | COP | | | 1,934,638,000 | | | | 12/21/22 | | | | 43,210 | |
| | | | | |
| USD | | | 286,471 | | | COP | | | 1,284,078,000 | | | | 12/21/22 | | | | 28,680 | |
| | | | | |
| USD | | | 180,817 | | | COP | | | 812,543,000 | | | | 12/21/22 | | | | 17,692 | |
| | | | | |
| USD | | | 120,014 | | | COP | | | 539,309,000 | | | | 12/21/22 | | | | 11,742 | |
| | | | | |
| USD | | | 116,856 | | | COP | | | 523,794,000 | | | | 12/21/22 | | | | 11,699 | |
| | | | | |
| USD | | | 102,919 | | | COP | | | 462,477,348 | | | | 12/21/22 | | | | 10,072 | |
| | | | | |
| USD | | | 68,310 | | | COP | | | 306,960,168 | | | | 12/21/22 | | | | 6,685 | |
| | | | |
| | 22 | | See Notes to Financial Statements. |
International Income Portfolio
October 31, 2022
Portfolio of Investments — continued
| | | | | | | | | | | | | | | | | | |
| Forward Foreign Currency Exchange Contracts (Centrally Cleared) (continued) | |
| | | |
| Currency Purchased | | | Currency Sold | | | Settlement
Date | | | Value/Unrealized
Appreciation
(Depreciation) | |
| | | | | |
| USD | | | 48,955 | | | COP | | | 219,992,000 | | | | 12/21/22 | | | $ | 4,790 | |
| | | | | |
| USD | | | 27,865 | | | COP | | | 125,214,000 | | | | 12/21/22 | | | | 2,727 | |
| | | | | |
| USD | | | 2,102,918 | | | EUR | | | 2,089,920 | | | | 12/21/22 | | | | 29,113 | |
| | | | | |
| USD | | | 1,798,774 | | | EUR | | | 1,787,656 | | | | 12/21/22 | | | | 24,902 | |
| | | | | |
| USD | | | 1,426,153 | | | EUR | | | 1,417,338 | | | | 12/21/22 | | | | 19,744 | |
| | | | | |
| USD | | | 1,171,739 | | | EUR | | | 1,164,497 | | | | 12/21/22 | | | | 16,222 | |
| | | | | |
| USD | | | 780,565 | | | EUR | | | 775,740 | | | | 12/21/22 | | | | 10,806 | |
| | | | | |
| USD | | | 775,689 | | | EUR | | | 770,895 | | | | 12/21/22 | | | | 10,739 | |
| | | | | |
| USD | | | 482,711 | | | EUR | | | 479,727 | | | | 12/21/22 | | | | 6,683 | |
| | | | | |
| USD | | | 264,046 | | | EUR | | | 262,414 | | | | 12/21/22 | | | | 3,655 | |
| | | | | |
| USD | | | 2,164,545 | | | IDR | | | 32,405,834,412 | | | | 12/21/22 | | | | 93,996 | |
| | | | | |
| USD | | | 356,605 | | | IDR | | | 5,314,000,000 | | | | 12/21/22 | | | | 17,071 | |
| | | | | |
| USD | | | 5,692 | | | IDR | | | 85,100,000 | | | | 12/21/22 | | | | 255 | |
| | | | | |
| USD | | | 5,255 | | | IDR | | | 78,670,740 | | | | 12/21/22 | | | | 228 | |
| | | | | |
| USD | | | 1,805 | | | IDR | | | 26,900,000 | | | | 12/21/22 | | | | 86 | |
| | | | | |
| USD | | | 1,819,232 | | | NZD | | | 3,027,008 | | | | 12/21/22 | | | | 58,009 | |
| | | | | |
| USD | | | 162,119 | | | PEN | | | 634,000 | | | | 12/21/22 | | | | 3,864 | |
| | | | | |
| USD | | | 70,897 | | | PEN | | | 278,574 | | | | 12/21/22 | | | | 1,361 | |
| | | | | |
| USD | | | 64,431 | | | PEN | | | 253,000 | | | | 12/21/22 | | | | 1,278 | |
| | | | | |
| USD | | | 271,746 | | | PEN | | | 1,087,255 | | | | 12/21/22 | | | | 352 | |
| | | | | |
| USD | | | 2,373 | | | PEN | | | 9,515 | | | | 12/21/22 | | | | (2 | ) |
| | | | | |
| BRL | | | 712,000 | | | USD | | | 130,223 | | | | 1/4/23 | | | | 5,805 | |
| | | | | |
| BRL | | | 453,638 | | | USD | | | 83,032 | | | | 1/4/23 | | | | 3,636 | |
| | | | | |
| IDR | | | 1,525,000,000 | | | USD | | | 99,991 | | | | 1/11/23 | | | | (2,666 | ) |
| | | | | |
| IDR | | | 1,624,000,000 | | | USD | | | 106,422 | | | | 1/11/23 | | | | (2,779 | ) |
| | | | | |
| IDR | | | 1,827,000,000 | | | USD | | | 119,850 | | | | 1/11/23 | | | | (3,252 | ) |
| | | | | |
| JPY | | | 546,145,699 | | | USD | | | 3,823,115 | | | | 1/12/23 | | | | (115,394 | ) |
| | | | | |
| USD | | | 159,724 | | | IDR | | | 2,435,000,000 | | | | 7/11/23 | | | | 5,773 | |
| | | | | |
| USD | | | 91,708 | | | IDR | | | 1,398,000,000 | | | | 7/11/23 | | | | 3,320 | |
| | | | | |
| USD | | | 75,028 | | | IDR | | | 1,143,000,000 | | | | 7/11/23 | | | | 2,762 | |
| | | | | |
| | | | | | | | | | | | | | | | | $ | 80,520 | |
| | | | | | | | | | | | | | | | | | | | | | | | |
| Forward Foreign Currency Exchange Contracts (OTC) | |
| | | | | |
| Currency Purchased | | | Currency Sold | | | Counterparty | | Settlement
Date | | | Unrealized
Appreciation | | | Unrealized
(Depreciation) | |
| | | | | | | |
| KZT | | | 6,498,460 | | | USD | | | 13,468 | | | Citibank, N.A. | | | 11/1/22 | | | $ | 443 | | | $ | — | |
| | | | | | | |
| KZT | | | 6,498,460 | | | USD | | | 13,468 | | | Citibank, N.A. | | | 11/1/22 | | | | 443 | | | | — | |
| | | | | | | |
| USD | | | 13,879 | | | KZT | | | 6,498,460 | | | Citibank, N.A. | | | 11/1/22 | | | | — | | | | (32 | ) |
| | | | | | | |
| USD | | | 13,879 | | | KZT | | | 6,498,460 | | | Citibank, N.A. | | | 11/1/22 | | | | — | | | | (32 | ) |
| | | | | | | |
| EUR | | | 104,336 | | | USD | | | 104,867 | | | UBS AG | | | 11/4/22 | | | | — | | | | (1,743 | ) |
| | | | | | | |
| KZT | | | 12,424,360 | | | USD | | | 25,551 | | | JPMorgan Chase Bank, N.A. | | | 11/7/22 | | | | 997 | | | | — | |
| | | | | | | |
| KZT | | | 12,373,231 | | | USD | | | 25,644 | | | JPMorgan Chase Bank, N.A. | | | 11/7/22 | | | | 795 | | | | — | |
| | | | |
| | 23 | | See Notes to Financial Statements. |
International Income Portfolio
October 31, 2022
Portfolio of Investments — continued
| | | | | | | | | | | | | | | | | | | | | | | | |
| Forward Foreign Currency Exchange Contracts (OTC) (continued) | |
| | | | | |
| Currency Purchased | | | Currency Sold | | | Counterparty | | Settlement
Date | | | Unrealized
Appreciation | | | Unrealized
(Depreciation) | |
| | | | | | | |
| KZT | | | 7,845,674 | | | USD | | | 15,927 | | | Citibank, N.A. | | | 11/22/22 | | | $ | 748 | | | $ | — | |
| | | | | | | |
| KZT | | | 7,836,117 | | | USD | | | 15,927 | | | Citibank, N.A. | | | 11/22/22 | | | | 728 | | | | — | |
| | | | | | | |
| KZT | | | 6,435,109 | | | USD | | | 13,296 | | | JPMorgan Chase Bank, N.A. | | | 11/25/22 | | | | 367 | | | | — | |
| | | | | | | |
| KZT | | | 39,200,495 | | | USD | | | 79,635 | | | Citibank, N.A. | | | 11/28/22 | | | | 3,505 | | | | — | |
| | | | | | | |
| KZT | | | 15,632,417 | | | USD | | | 31,854 | | | Citibank, N.A. | | | 11/28/22 | | | | 1,301 | | | | — | |
| | | | | | | |
| KZT | | | 15,600,563 | | | USD | | | 31,854 | | | Citibank, N.A. | | | 11/28/22 | | | | 1,233 | | | | — | |
| | | | | | | |
| SGD | | | 2,140,000 | | | USD | | | 1,535,871 | | | HSBC Bank USA, N.A. | | | 11/29/22 | | | | — | | | | (23,896 | ) |
| | | | | | | |
| KZT | | | 10,382,887 | | | USD | | | 21,331 | | | JPMorgan Chase Bank, N.A. | | | 12/2/22 | | | | 659 | | | | — | |
| | | | | | | |
| KZT | | | 10,181,991 | | | USD | | | 20,940 | | | JPMorgan Chase Bank, N.A. | | | 12/6/22 | | | | 590 | | | | — | |
| | | | | | | |
| USD | | | 1,384,960 | | | ILS | | | 4,700,000 | | | Citibank, N.A. | | | 12/8/22 | | | | 51,859 | | | | — | |
| | | | | | | |
| KZT | | | 12,507,444 | | | USD | | | 25,565 | | | JPMorgan Chase Bank, N.A. | | | 12/13/22 | | | | 810 | | | | — | |
| | | | | | | |
| KZT | | | 12,488,271 | | | USD | | | 25,565 | | | JPMorgan Chase Bank, N.A. | | | 12/13/22 | | | | 769 | | | | — | |
| | | | | | | |
| KZT | | | 18,809,100 | | | USD | | | 38,347 | | | JPMorgan Chase Bank, N.A. | | | 12/15/22 | | | | 1,284 | | | | — | |
| | | | | | | |
| USD | | | 390,052 | | | ZAR | | | 6,946,428 | | | State Street Bank and Trust Company | | | 12/15/22 | | | | 13,146 | | | | — | |
| | | | | | | |
| USD | | | 261,462 | | | ZAR | | | 4,616,765 | | | State Street Bank and Trust Company | | | 12/15/22 | | | | 10,961 | | | | — | |
| | | | | | | |
| USD | | | 197,039 | | | ZAR | | | 3,462,574 | | | State Street Bank and Trust Company | | | 12/15/22 | | | | 9,164 | | | | — | |
| | | | | | | |
| USD | | | 131,360 | | | ZAR | | | 2,308,383 | | | State Street Bank and Trust Company | | | 12/15/22 | | | | 6,109 | | | | — | |
| | | | | | | |
| ZAR | | | 239,621 | | | USD | | | 13,570 | | | State Street Bank and Trust Company | | | 12/15/22 | | | | — | | | | (569 | ) |
| | | | | | | |
| ZAR | | | 239,621 | | | USD | | | 13,636 | | | State Street Bank and Trust Company | | | 12/15/22 | | | | — | | | | (634 | ) |
| | | | | | | |
| ZAR | | | 239,621 | | | USD | | | 13,636 | | | State Street Bank and Trust Company | | | 12/15/22 | | | | — | | | | (634 | ) |
| | | | | | | |
| ZAR | | | 728,037 | | | USD | | | 40,880 | | | State Street Bank and Trust Company | | | 12/15/22 | | | | — | | | | (1,378 | ) |
| | | | | | | |
| MXN | | | 245,733 | | | USD | | | 12,110 | | | Goldman Sachs International | | | 12/21/22 | | | | 186 | | | | — | |
| | | | | | | |
| MXN | | | 8,664,776 | | | USD | | | 426,031 | | | UBS AG | | | 12/21/22 | | | | 7,564 | | | | — | |
| | | | | | | |
| MXN | | | 7,968,206 | | | USD | | | 392,591 | | | UBS AG | | | 12/21/22 | | | | 6,146 | | | | — | |
| | | | | | | |
| THB | | | 1,702,600 | | | USD | | | 46,247 | | | Standard Chartered Bank | | | 12/21/22 | | | | — | | | | (1,316 | ) |
| | | | | | | |
| THB | | | 1,700,000 | | | USD | | | 46,309 | | | Standard Chartered Bank | | | 12/21/22 | | | | — | | | | (1,446 | ) |
| | | | | | | |
| THB | | | 2,000,000 | | | USD | | | 54,331 | | | Standard Chartered Bank | | | 12/21/22 | | | | — | | | | (1,551 | ) |
| | | | | | | |
| USD | | | 826,342 | | | MXN | | | 16,878,715 | | | Standard Chartered Bank | | | 12/21/22 | | | | — | | | | (18,285 | ) |
| | | | | | | |
| USD | | | 582,670 | | | CNH | | | 3,900,000 | | | BNP Paribas | | | 12/22/22 | | | | 49,505 | | | | — | |
| | | | | | | |
| USD | | | 179,354 | | | CNH | | | 1,200,000 | | | BNP Paribas | | | 12/22/22 | | | | 15,303 | | | | — | |
| | | | | | | |
| USD | | | 104,582 | | | CNH | | | 700,000 | | | BNP Paribas | | | 12/22/22 | | | | 8,885 | | | | — | |
| | | | | | | |
| USD | | | 29,892 | | | CNH | | | 200,000 | | | BNP Paribas | | | 12/22/22 | | | | 2,551 | | | | — | |
| | | | | | | |
| USD | | | 134,465 | | | CNH | | | 900,000 | | | JPMorgan Chase Bank, N.A. | | | 12/22/22 | | | | 11,427 | | | | — | |
| | | | | | | |
| USD | | | 14,940 | | | CNH | | | 100,000 | | | JPMorgan Chase Bank, N.A. | | | 12/22/22 | | | | 1,270 | | | | — | |
| | | | | | | |
| USD | | | 164,325 | | | CNH | | | 1,100,000 | | | Standard Chartered Bank | | | 12/22/22 | | | | 13,945 | | | | — | |
| | | | | | | |
| USD | | | 149,520 | | | CNH | | | 1,000,501 | | | Standard Chartered Bank | | | 12/22/22 | | | | 12,742 | | | | — | |
| | | | | | | |
| USD | | | 29,877 | | | CNH | | | 200,000 | | | Standard Chartered Bank | | | 12/22/22 | | | | 2,535 | | | | — | |
| | | | | | | |
| USD | | | 25,555 | | | CNH | | | 171,000 | | | Standard Chartered Bank | | | 12/22/22 | | | | 2,178 | | | | — | |
| | | | | | | |
| USD | | | 34,615 | | | ILS | | | 121,667 | | | Goldman Sachs International | | | 1/4/23 | | | | — | | | | (11 | ) |
| | | | | | | |
| | | | | | | | | | | | | | | | | | | $ | 240,148 | | | $ | (51,527 | ) |
| | | | |
| | 24 | | See Notes to Financial Statements. |
International Income Portfolio
October 31, 2022
Portfolio of Investments — continued
| | | | | | | | | | | | | | | | | | |
| Non-Deliverable Bond Forward Contracts* | |
| | | | | |
| Settlement Date | | Notional Amount
(000’s omitted) | | | Reference Entity | | Counterparty | | Aggregate Cost | | | Unrealized
Appreciation
(Depreciation) | |
| | | | | | |
| 11/22/22 | | COP | | | 645,915 | | | Republic of Colombia, 5.75%, 11/3/27 | | Bank of America, N.A. | | $ | 130,785 | | | $ | (5,352 | ) |
| | | | | | |
| 11/23/22 | | COP | | | 699,000 | | | Republic of Colombia, 6.25%, 11/26/25 | | Goldman Sachs International | | | 141,534 | | | | 1,971 | |
| | | | | | |
| 12/3/22 | | COP | | | 309,900 | | | Republic of Colombia, 6.00%, 4/28/28 | | Goldman Sachs International | | | 62,749 | | | | 238 | |
| | | | | | |
| 12/7/22 | | COP | | | 350,000 | | | Republic of Colombia, 6.25%, 11/26/25 | | Bank of America, N.A. | | | 70,868 | | | | (442 | ) |
| | | | | | |
| 12/8/22 | | COP | | | 1,056,780 | | | Republic of Colombia, 5.75%, 11/3/27 | | Bank of America, N.A. | | | 213,977 | | | | 9,796 | |
| | | | | | |
| 12/8/22 | | COP | | | 400,000 | | | Republic of Colombia, 6.25%, 11/26/25 | | Bank of America, N.A. | | | 80,992 | | | | 2,577 | |
| | | | | | |
| 12/14/22 | | COP | | | 609,000 | | | Republic of Colombia, 6.25%, 11/26/25 | | Goldman Sachs International | | | 123,311 | | | | (423 | ) |
| | | | | | |
| 12/15/22 | | COP | | | 687,700 | | | Republic of Colombia, 6.25%, 11/26/25 | | Goldman Sachs International | | | 139,246 | | | | (1,134 | ) |
| | | | | | |
| 12/16/22 | | COP | | | 604,000 | | | Republic of Colombia, 6.25%, 11/26/25 | | Goldman Sachs International | | | 122,298 | | | | 1,941 | |
| | | | | | |
| 12/19/22 | | COP | | | 881,000 | | | Republic of Colombia, 6.25%, 11/26/25 | | Goldman Sachs International | | | 178,385 | | | | (1,302 | ) |
| | | | | | |
| 12/21/22 | | COP | | | 213,000 | | | Republic of Colombia, 6.25%, 11/26/25 | | Goldman Sachs International | | | 43,128 | | | | 1,434 | |
| | | | | | |
| 12/22/22 | | COP | | | 233,000 | | | Republic of Colombia, 6.25%, 11/26/25 | | Goldman Sachs International | | | 47,178 | | | | 1,138 | |
| | | | | | |
| 12/23/22 | | COP | | | 991,000 | | | Republic of Colombia, 6.25%, 11/26/25 | | Goldman Sachs International | | | 200,658 | | | | 6,407 | |
| | | | | | |
| 1/10/23 | | COP | | | 158,000 | | | Republic of Colombia, 6.25%, 11/26/25 | | Goldman Sachs International | | | 31,992 | | | | — | |
| | | | | | |
| | | | | | | | | | | | | | | | | $ | 16,849 | |
| * | Represents a short-term forward contract to purchase the reference entity denominated in a non-deliverable foreign currency. |
| | | | | | | | | | | | | | | | | | | | |
| Futures Contracts | |
| | | | | |
| Description | | Number of
Contracts | | | Position | | | Expiration
Date | | | Notional
Amount | | | Value/Unrealized
Appreciation
(Depreciation) | |
| | | | | |
Interest Rate Futures | | | | | | | | | | | | | | | | | | | | |
| | | | | |
| U.S. 10-Year Treasury Note | | | 8 | | | | Long | | | | 12/20/22 | | | $ | 884,750 | | | $ | (55,875 | ) |
| | | | | |
| Euro-Bobl | | | (12 | ) | | | Short | | | | 12/8/22 | | | | (1,419,166 | ) | | | 36,763 | |
| | | | | |
| Euro-Buxl | | | (1 | ) | | | Short | | | | 12/8/22 | | | | (142,525 | ) | | | 14,032 | |
| | | | | |
| U.S. Ultra 10-Year Treasury Note | | | (10 | ) | | | Short | | | | 12/20/22 | | | | (1,159,844 | ) | | | 100,479 | |
| | | | | |
| U.S. Ultra-Long Treasury Bond | | | (1 | ) | | | Short | | | | 12/20/22 | | | | (127,656 | ) | | | 22,086 | |
| | | | | |
| | | | | | | | | | | | | | | | | | | $ | 117,485 | |
| | | | |
| | 25 | | See Notes to Financial Statements. |
International Income Portfolio
October 31, 2022
Portfolio of Investments — continued
| | | | | | | | | | | | | | | | | | |
| Inflation Swaps (Centrally Cleared) | |
| | | | | | |
Notional Amount
(000’s omitted) | | Portfolio
Pays/Receives
Return on
Reference Index | | | Reference Index | | Portfolio
Pays/Receives
Rate | | Annual
Rate | | Termination
Date | | Value/Unrealized
Appreciation
(Depreciation) | |
| | | | | | | |
| EUR | | 300 | | | Receives | | | Eurostat Eurozone HICP ex Tobacco NSA (pays upon termination) | | Pays | | 2.20% (pays upon termination) | | 10/15/36 | | $ | 34,681 | |
| | | | | | | |
| EUR | | 300 | | | Receives | | | Eurostat Eurozone HICP ex Tobacco NSA (pays upon termination) | | Pays | | 2.20% (pays upon termination) | | 10/15/36 | | | 34,681 | |
| | | | | | | |
| EUR | | 200 | | | Receives | | | Eurostat Eurozone HICP ex Tobacco NSA (pays upon termination) | | Pays | | 2.20% (pays upon termination) | | 10/15/36 | | | 23,098 | |
| | | | | | | |
| EUR | | 280 | | | Receives | | | Eurostat Eurozone HICP ex Tobacco NSA (pays upon termination) | | Pays | | 2.08% (pays upon termination) | | 1/15/37 | | | 34,216 | |
| | | | | | | |
| EUR | | 200 | | | Pays | | | Eurostat Eurozone HICP ex Tobacco NSA (pays upon termination) | | Receives | | 2.29% (pays upon termination) | | 10/15/46 | | | (27,204 | ) |
| | | | | | | |
| EUR | | 300 | | | Pays | | | Eurostat Eurozone HICP ex Tobacco NSA (pays upon termination) | | Receives | | 2.29% (pays upon termination) | | 10/15/46 | | | (40,806 | ) |
| | | | | | | |
| EUR | | 300 | | | Pays | | | Eurostat Eurozone HICP ex Tobacco NSA (pays upon termination) | | Receives | | 2.29% (pays upon termination) | | 10/15/46 | | | (40,911 | ) |
| | | | | | | |
| EUR | | 280 | | | Pays | | | Eurostat Eurozone HICP ex Tobacco NSA (pays upon termination) | | Receives | | 2.18% (pays upon termination) | | 1/15/47 | | | (42,779 | ) |
| | | | | | | |
| USD | | 880 | | | Pays | | | Return on CPI-U (NSA) (pays upon termination) | | Receives | | 2.90% (pays upon termination) | | 1/11/27 | | | (37,083 | ) |
| | | | | | | |
| USD | | 1,300 | | | Pays | | | Return on CPI-U (NSA) (pays upon termination) | | Receives | | 2.75% (pays upon termination) | | 10/29/36 | | | (55,199 | ) |
| | | | | | | |
| USD | | 450 | | | Pays | | | Return on CPI-U (NSA) (pays upon termination) | | Receives | | 2.67% (pays upon termination) | | 1/7/37 | | | (19,394 | ) |
| | | | | | | |
| USD | | 800 | | | Receives | | | Return on CPI-U (NSA) (pays upon termination) | | Pays | | 2.62% (pays upon termination) | | 10/29/46 | | | 34,638 | |
| | | | | | | |
| USD | | 400 | | | Receives | | | Return on CPI-U (NSA) (pays upon termination) | | Pays | | 2.62% (pays upon termination) | | 10/29/46 | | | 17,158 | |
| | | | | | | |
| USD | | 490 | | | Receives | | | Return on CPI-U (NSA) (pays upon termination) | | Pays | | 2.54% (pays upon termination) | | 1/7/47 | | | 25,230 | |
| | | | | | | |
| | | | | | | | | | | | | | | | | $ | (59,674 | ) |
| | | | | | | | | | | | | | | | | | | | |
| Interest Rate Swaps (Centrally Cleared) | |
| | | | | | | |
Notional Amount
(000’s omitted) | | Portfolio
Pays/
Receives
Floating
Rate | | Floating Rate | | Annual
Fixed Rate | | Termination
Date | | Value | | Unamortized
Upfront
Receipts
(Payments) | | | Unrealized
Appreciation
(Depreciation) | |
| | | | | | | | |
| AUD | | 7,060 | | Pays | | 6-month AUD Bank Bill (pays semi-annually) | | 1.58% (pays semi-annually) | | 1/17/24 | | $(117,464) | | $ | — | | | $ | (117,464 | ) |
| | | | | | | | |
| BRL | | 2,559 | | Pays | | Brazil CETIP Interbank Deposit Rate (pays upon termination) | | 11.48% (pays upon termination) | | 1/2/25 | | (2,064) | | | — | | | | (2,064 | ) |
| | | | |
| | 26 | | See Notes to Financial Statements. |
International Income Portfolio
October 31, 2022
Portfolio of Investments — continued
| | | | | | | | | | | | | | | | | | | | |
| Interest Rate Swaps (Centrally Cleared) (continued) | |
| | | | | | | |
Notional Amount
(000’s omitted) | | Portfolio
Pays/
Receives
Floating
Rate | | Floating Rate | | Annual
Fixed Rate | | Termination
Date | | Value | | Unamortized
Upfront
Receipts
(Payments) | | | Unrealized
Appreciation
(Depreciation) | |
| | | | | | | | |
| BRL | | 2,556 | | Pays | | Brazil CETIP Interbank Deposit Rate (pays upon termination) | | 11.49% (pays upon termination) | | 1/2/25 | | $ (1,961) | | $ | — | | | $ | (1,961 | ) |
| | | | | | | | |
| BRL | | 1,685 | | Pays | | Brazil CETIP Interbank Deposit Rate (pays upon termination) | | 11.51% (pays upon termination) | | 1/2/25 | | (1,159) | | | — | | | | (1,159 | ) |
| | | | | | | | |
| BRL | | 7,743 | | Pays | | Brazil CETIP Interbank Deposit Rate (pays upon termination) | | 11.72% (pays upon termination) | | 1/2/25 | | (833) | | | — | | | | (833 | ) |
| | | | | | | | |
| BRL | | 1,200 | | Pays | | Brazil CETIP Interbank Deposit Rate (pays upon termination) | | 11.53% (pays upon termination) | | 1/4/27 | | 1,554 | | | — | | | | 1,554 | |
| | | | | | | | |
| CAD | | 3,870 | | Pays | | 3-month Canadian Bankers Acceptances (pays quarterly) | | 2.19% (pays semi-annually) | | 1/18/24 | | (66,196) | | | — | | | | (66,196 | ) |
| | | | | | | | |
| CAD | | 2,610 | | Pays | | 3-month Canadian Bankers Acceptances (pays quarterly) | | 2.19% (pays semi-annually) | | 1/18/24 | | (44,588) | | | — | | | | (44,588 | ) |
| | | | | | | | |
| CAD | | 2,280 | | Pays | | 3-month Canadian Bankers Acceptances (pays semi-annually) | | 3.45% (pays semi-annually) | | 7/21/27 | | (27,748) | | | 1 | | | | (27,747 | ) |
| | | | | | | | |
| CLP | | 279,100 | | Pays | | 6-month Sinacofi Chile Interbank Rate (pays semi-annually) | | 6.61% (pays semi-annually) | | 12/21/27 | | 293 | | | — | | | | 293 | |
| | | | | | | | |
| CLP | | 66,000 | | Pays | | 6-month Sinacofi Chile Interbank Rate (pays semi-annually) | | 6.20% (pays semi-annually) | | 4/8/32 | | (965) | | | — | | | | (965 | ) |
| | | | | | | | |
| CLP | | 202,840 | | Pays | | 6-month Sinacofi Chile Interbank Rate (pays semi-annually) | | 6.35% (pays semi-annually) | | 4/11/32 | | (793) | | | — | | | | (793 | ) |
| | | | | | | | |
| CLP | | 38,900 | | Pays | | 6-month Sinacofi Chile Interbank Rate (pays semi-annually) | | 6.40% (pays semi-annually) | | 4/20/32 | | 32 | | | — | | | | 32 | |
| | | | | | | | |
| CLP | | 198,050 | | Pays | | 6-month Sinacofi Chile Interbank Rate (pays semi-annually) | | 6.38% (pays semi-annually) | | 4/22/32 | | (17) | | | — | | | | (17 | ) |
| | | | | | | | |
| CNY | | 24,000 | | Pays | | 7-day China Fixing Repo Rates (pays quarterly) | | 2.76%
(pays quarterly) | | 6/1/26 | | 58,927 | | | — | | | | 58,927 | |
| | | | | | | | |
| CNY | | 1,450 | | Pays | | 7-day China Fixing Repo Rates (pays quarterly) | | 2.45%
(pays quarterly) | | 12/16/26 | | 1,277 | | | — | | | | 1,277 | |
| | | | | | | | |
| CNY | | 1,800 | | Pays | | 7-day China Fixing Repo Rates (pays quarterly) | | 2.47%
(pays quarterly) | | 9/21/27 | | 1,316 | | | — | | | | 1,316 | |
| | | | | | | | |
| CNY | | 3,100 | | Pays | | 7-day China Fixing Repo Rates (pays quarterly) | | 2.47%
(pays quarterly) | | 9/21/27 | | 2,267 | | | — | | | | 2,267 | |
| | | | | | | | |
| CNY | | 1,300 | | Pays | | 7-day China Fixing Repo Rates (pays quarterly) | | 2.50%
(pays quarterly) | | 9/21/27 | | 1,193 | | | — | | | | 1,193 | |
| | | | | | | | |
| CNY | | 1,600 | | Pays | | 7-day China Fixing Repo Rates (pays quarterly) | | 2.50%
(pays quarterly) | | 9/21/27 | | 1,518 | | | — | | | | 1,518 | |
| | | | |
| | 27 | | See Notes to Financial Statements. |
International Income Portfolio
October 31, 2022
Portfolio of Investments — continued
| | | | | | | | | | | | | | | | | | | | |
| Interest Rate Swaps (Centrally Cleared) (continued) | |
| | | | | | | |
Notional Amount
(000’s omitted) | | Portfolio
Pays/
Receives
Floating
Rate | | Floating Rate | | Annual Fixed Rate | | Termination
Date | | Value | | Unamortized
Upfront
Receipts
(Payments) | | | Unrealized
Appreciation
(Depreciation) | |
| | | | | | | | |
| CNY | | 1,000 | | Pays | | 7-day China Fixing Repo Rates (pays quarterly) | | 2.51% (pays quarterly) | | 9/21/27 | | $ 1,024 | | $ | — | | | $ | 1,024 | |
| | | | | | | | |
| CNY | | 1,600 | | Pays | | 7-day China Fixing Repo Rates (pays quarterly) | | 2.52% (pays quarterly) | | 9/21/27 | | 1,717 | | | — | | | | 1,717 | |
| | | | | | | | |
| CNY | | 500 | | Pays | | 7-day China Fixing Repo Rates (pays quarterly) | | 2.52% (pays quarterly) | | 9/21/27 | | 549 | | | — | | | | 549 | |
| | | | | | | | |
| CNY | | 1,500 | | Pays | | 7-day China Fixing Repo Rates (pays quarterly) | | 2.52% (pays quarterly) | | 9/21/27 | | 1,647 | | | — | | | | 1,647 | |
| | | | | | | | |
| CNY | | 1,600 | | Pays | | 7-day China Fixing Repo Rates (pays quarterly) | | 2.53% (pays quarterly) | | 9/21/27 | | 1,767 | | | — | | | | 1,767 | |
| | | | | | | | |
| COP | | 347,000 | | Receives | | Colombia Overnight Interbank Reference Rate (pays quarterly) | | 6.00% (pays quarterly) | | 11/26/25 | | 9,951 | | | — | | | | 9,951 | |
| | | | | | | | |
| COP | | 984,000 | | Receives | | Colombia Overnight Interbank Reference Rate (pays quarterly) | | 6.05% (pays quarterly) | | 11/26/25 | | 27,934 | | | — | | | | 27,934 | |
| | | | | | | | |
| COP | | 303,000 | | Receives | | Colombia Overnight Interbank Reference Rate (pays quarterly) | | 6.06% (pays quarterly) | | 11/26/25 | | 8,208 | | | — | | | | 8,208 | |
| | | | | | | | |
| COP | | 636,900 | | Receives | | Colombia Overnight Interbank Reference Rate (pays quarterly) | | 6.09% (pays quarterly) | | 11/26/25 | | 17,163 | | | — | | | | 17,163 | |
| | | | | | | | |
| COP | | 310,000 | | Receives | | Colombia Overnight Interbank Reference Rate (pays quarterly) | | 6.14% (pays quarterly) | | 11/26/25 | | 8,278 | | | — | | | | 8,278 | |
| | | | | | | | |
| COP | | 318,000 | | Receives | | Colombia Overnight Interbank Reference Rate (pays quarterly) | | 6.18% (pays quarterly) | | 11/26/25 | | 8,426 | | | — | | | | 8,426 | |
| | | | | | | | |
| COP | | 651,600 | | Receives | | Colombia Overnight Interbank Reference Rate (pays quarterly) | | 6.25% (pays quarterly) | | 11/26/25 | | 17,012 | | | — | | | | 17,012 | |
| | | | | | | | |
| COP | | 853,000 | | Receives | | Colombia Overnight Interbank Reference Rate (pays quarterly) | | 7.03% (pays quarterly) | | 11/26/25 | | 19,593 | | | — | | | | 19,593 | |
| | | | | | | | |
| COP | | 210,500 | | Receives | | Colombia Overnight Interbank Reference Rate (pays quarterly) | | 8.60% (pays quarterly) | | 11/26/25 | | 3,007 | | | — | | | | 3,007 | |
| | | | | | | | |
| COP | | 400,000 | | Receives | | Colombia Overnight Interbank Reference Rate (pays quarterly) | | 8.75% (pays quarterly) | | 11/26/25 | | 5,376 | | | — | | | | 5,376 | |
| | | | | | | | |
| COP | | 211,000 | | Receives | | Colombia Overnight Interbank Reference Rate (pays quarterly) | | 8.85% (pays quarterly) | | 11/26/25 | | 2,719 | | | — | | | | 2,719 | |
| | | | | | | | |
| COP | | 213,000 | | Receives | | Colombia Overnight Interbank Reference Rate (pays quarterly) | | 9.23% (pays quarterly) | | 11/26/25 | | 2,293 | | | — | | | | 2,293 | |
| | | | | | | | |
| COP | | 147,000 | | Receives | | Colombia Overnight Interbank Reference Rate (pays quarterly) | | 9.42% (pays quarterly) | | 11/26/25 | | 1,434 | | | — | | | | 1,434 | |
| | | | |
| | 28 | | See Notes to Financial Statements. |
International Income Portfolio
October 31, 2022
Portfolio of Investments — continued
| | | | | | | | | | | | | | | | | | | | |
| Interest Rate Swaps (Centrally Cleared) (continued) | |
| | | | | | | |
Notional Amount
(000’s omitted) | | Portfolio
Pays/
Receives
Floating
Rate | | Floating Rate | | Annual Fixed Rate | | Termination
Date | | Value | | Unamortized
Upfront
Receipts
(Payments) | | | Unrealized
Appreciation
(Depreciation) | |
| | | | | | | | |
| COP | | 351,773 | | Receives | | Colombia Overnight Interbank Reference Rate (pays quarterly) | | 10.00% (pays quarterly) | | 11/26/25 | | $ 2,287 | | $ | — | | | $ | 2,287 | |
| | | | | | | | |
| COP | | 131,000 | | Receives | | Colombia Overnight Interbank Reference Rate (pays quarterly) | | 10.17% (pays quarterly) | | 11/26/25 | | 727 | | | (2 | ) | | | 725 | |
| | | | | | | | |
| COP | | 252,000 | | Receives | | Colombia Overnight Interbank Reference Rate (pays quarterly) | | 10.28% (pays quarterly) | | 11/26/25 | | 1,250 | | | — | | | | 1,250 | |
| | | | | | | | |
| COP | | 1,132,600 | | Receives | | Colombia Overnight Interbank Reference Rate (pays quarterly) | | 4.38% (pays quarterly) | | 3/30/26 | | 45,164 | | | — | | | | 45,164 | |
| | | | | | | | |
| COP | | 480,600 | | Receives | | Colombia Overnight Interbank Reference Rate (pays quarterly) | | 4.48% (pays quarterly) | | 3/31/26 | | 18,883 | | | — | | | | 18,883 | |
| | | | | | | | |
| COP | | 514,400 | | Receives | | Colombia Overnight Interbank Reference Rate (pays quarterly) | | 4.56% (pays quarterly) | | 4/6/26 | | 19,940 | | | — | | | | 19,940 | |
| | | | | | | | |
| COP | | 1,135,000 | | Receives | | Colombia Overnight Interbank Reference Rate (pays quarterly) | | 11.93% (pays quarterly) | | 12/21/27 | | (7,378) | | | — | | | | (7,378 | ) |
| | | | | | | | |
| COP | | 511,000 | | Receives | | Colombia Overnight Interbank Reference Rate (pays quarterly) | | 12.10% (pays quarterly) | | 12/21/27 | | (3,958) | | | — | | | | (3,958 | ) |
| | | | | | | | |
| COP | | 181,400 | | Receives | | Colombia Overnight Interbank Reference Rate (pays quarterly) | | 4.82% (pays quarterly) | | 3/26/28 | | 9,220 | | | — | | | | 9,220 | |
| | | | | | | | |
| COP | | 129,500 | | Receives | | Colombia Overnight Interbank Reference Rate (pays quarterly) | | 4.83% (pays quarterly) | | 3/26/28 | | 6,572 | | | — | | | | 6,572 | |
| | | | | | | | |
| COP | | 726,000 | | Receives | | Colombia Overnight Interbank Reference Rate (pays quarterly) | | 11.93% (pays quarterly) | | 12/21/32 | | (8,437) | | | — | | | | (8,437 | ) |
| | | | | | | | |
| HUF | | 98,100 | | Receives | | 6-month HUF BUBOR (pays semi-annually) | | 10.03% (pays annually) | | 9/21/27 | | 18,340 | | | — | | | | 18,340 | |
| | | | | | | | |
| ILS | | 1,580 | | Pays | | 3-month ILS TELBOR (pays quarterly) | | 3.64% (pays annually) | | 12/21/27 | | 66 | | | — | | | | 66 | |
| | | | | | | | |
| INR | | 35,000 | | Pays | | 1-day INR FBIL MIBOR (pays semi-annually) | | 6.87% (pays semi-annually) | | 12/21/27 | | (1,440) | | | — | | | | (1,440 | ) |
| | | | | | | | |
| JPY | | 80,000 | | Receives | | 1-day Overnight Tokyo Average Rate (pays annually) | | 0.43% (pays annually) | | 6/15/32 | | 4,078 | | | — | | | | 4,078 | |
| | | | | | | | |
| JPY | | 90,000 | | Receives | | 1-day Overnight Tokyo Average Rate (pays annually) | | 0.43% (pays annually) | | 6/15/32 | | 4,587 | | | — | | | | 4,587 | |
| | | | | | | | |
| KRW | | 6,626,500 | | Pays | | 3-month KRW Certificate of Deposit Rate (pays quarterly) | | 1.75% (pays quarterly) | | 10/5/23 | | (107,073) | | | — | | | | (107,073 | ) |
| | | | | | | | |
| KRW | | 4,556,500 | | Pays | | 3-month KRW Certificate of Deposit Rate (pays quarterly) | | 1.75% (pays quarterly) | | 10/5/23 | | (73,597) | | | — | | | | (73,597 | ) |
| | | | | | | | |
| KRW | | 1,595,000 | | Pays | | 3-month KRW Certificate of Deposit Rate (pays quarterly) | | 1.77% (pays quarterly) | | 10/5/23 | | (25,640) | | | — | | | | (25,640 | ) |
| | | | |
| | 29 | | See Notes to Financial Statements. |
International Income Portfolio
October 31, 2022
Portfolio of Investments — continued
| | | | | | | | | | | | | | | | | | | | | | |
| Interest Rate Swaps (Centrally Cleared) (continued) | |
| | | | | | | |
Notional Amount
(000’s omitted) | | Portfolio
Pays/
Receives
Floating
Rate | | | Floating Rate | | Annual Fixed Rate | | Termination
Date | | Value | | Unamortized
Upfront
Receipts
(Payments) | | | Unrealized
Appreciation
(Depreciation) | |
| | | | | | | | |
| KRW | | 3,112,000 | | | Pays | | | 3-month KRW Certificate of Deposit Rate (pays quarterly) | | 3.29% (pays quarterly) | | 7/25/25 | | $ (49,154) | | $ | — | | | $ | (49,154 | ) |
| | | | | | | | |
| NZD | | 3,880 | | | Pays | | | 3-month NZD Bank Bill (pays quarterly) | | 2.69% (pays semi-annually) | | 1/18/24 | | (55,747) | | | — | | | | (55,747 | ) |
| | | | | | | | |
| NZD | | 3,780 | | | Pays | | | 3-month NZD Bank Bill (pays quarterly) | | 2.71% (pays semi-annually) | | 1/18/24 | | (53,891) | | | — | | | | (53,891 | ) |
| | | | | | | | |
| PLN | | 650 | | | Receives | | | 6-month PLN WIBOR (pays semi-annually) | | 6.51% (pays annually) | | 6/28/32 | | 8,323 | | | — | | | | 8,323 | |
| | | | | | | | |
| PLN | | 650 | | | Receives | | | 6-month PLN WIBOR (pays semi-annually) | | 6.78% (pays annually) | | 6/28/32 | | 5,709 | | | — | | | | 5,709 | |
| | | | | | | | |
| PLN | | 800 | | | Receives | | | 6-month PLN WIBOR (pays semi-annually) | | 6.99% (pays annually) | | 9/21/32 | | 4,380 | | | — | | | | 4,380 | |
| | | | | | | | |
| THB | | 9,788 | | | Pays | | | Thai Overnight Repurchase Rate (pays quarterly) | | 2.87% (pays quarterly) | | 12/21/27 | | 180 | | | — | | | | 180 | |
| | | | | | | | |
| THB | | 10,212 | | | Pays | | | Thai Overnight Repurchase Rate (pays quarterly) | | 2.87% (pays quarterly) | | 12/21/27 | | 239 | | | — | | | | 239 | |
| | | | | | | | |
| THB | | 70,000 | | | Pays | | | Thai Overnight Repurchase Rate (pays semi-annually) | | 1.37% (pays semi-annually) | | 10/17/29 | | (200,580) | | | — | | | | (200,580 | ) |
| | | | | | | | |
| TWD | | 80,000 | | | Receives | | | 3-month TWD TAIBOR (pays quarterly) | | 1.00% (pays quarterly) | | 3/16/27 | | 52,017 | | | — | | | | 52,017 | |
| | | | | | | | |
| USD | | 500 | | | Receives | | | SOFR (pays annually) | | 1.39% (pays annually) | | 1/12/27 | | 50,956 | | | — | | | | 50,956 | |
| | | | | | | | |
| USD | | 500 | | | Receives | | | SOFR (pays annually) | | 1.39% (pays annually) | | 1/13/27 | | 51,087 | | | — | | | | 51,087 | |
| | | | | | | | |
Total | | | | | | | | | | | | | | $(340,203) | | $ | (1 | ) | | $ | (340,204 | ) |
| | | | | | | | | | | | | | | | | | | | | | | | |
| Credit Default Swaps - Sell Protection (Centrally Cleared) | |
| | | | | | | |
| Reference Entity | | Notional
Amount*
(000’s omitted) | | | Contract Annual
Fixed Rate** | | | Current
Market Annual
Fixed Rate*** | | Termination
Date | | Value | | | Unamortized
Upfront
Receipts
(Payments) | | | Unrealized
Appreciation
(Depreciation) | |
| | | | | | | |
| Pemex | | | $2,100 | | |
| 1.00%
(pays quarterly)(1) |
| | 6.65% | | 12/20/27 | | $ | (454,805 | ) | | $ | 478,206 | | | $ | 23,401 | |
| | | | | | | |
Total | | $ | 2,100 | | | | | | | | | | | $ | (454,805 | ) | | $ | 478,206 | | | $ | 23,401 | |
| | | | |
| | 30 | | See Notes to Financial Statements. |
International Income Portfolio
October 31, 2022
Portfolio of Investments — continued
| | | | | | | | | | | | | | | | | | | | | | | | | | | | | | |
| Credit Default Swaps - Sell Protection (OTC) | |
| | | | | | | | |
| Reference Entity | | Counterparty | | | Notional
Amount*
(000’s omitted) | | | Contract Annual
Fixed Rate** | | Current
Market Annual
Fixed Rate*** | | | Termination
Date | | | Value | | | Unamortized
Upfront
Receipts
(Payments) | | | Unrealized
Appreciation
(Depreciation) | |
| | | | | | | | |
| Vietnam | |
| Goldman Sachs
International |
| | $ | 300 | | | 1.00% (pays quarterly)(1) | | | 0.71 | % | | | 6/20/24 | | | $ | 1,726 | | | $ | (1,466 | ) | | $ | 260 | |
| | | | | | | | |
| Vietnam | |
| Goldman Sachs
International |
| | | 900 | | | 1.00% (pays quarterly)(1) | | | 1.56 | | | | 12/20/27 | | | | (21,487 | ) | | | 30,895 | | | | 9,408 | |
| | | | | | | | |
Total | | | | | | $ | 1,200 | | | | | | | | | | | | | $ | (19,761 | ) | | $ | 29,429 | | | $ | 9,668 | |
| * | If the Portfolio is the seller of credit protection, the notional amount is the maximum potential amount of future payments the Portfolio could be required to make if a credit event, as defined in the credit default swap agreement, were to occur. At October 31, 2022, such maximum potential amount for all open credit default swaps in which the Portfolio is the seller was $3,300,000. |
| ** | The contract annual fixed rate represents the fixed rate of interest received by the Portfolio (as a seller of protection) or paid by the Portfolio (as a buyer of protection) on the notional amount of the credit default swap contract. |
| *** | Current market annual fixed rates, utilized in determining the net unrealized appreciation or depreciation as of period end, serve as an indicator of the market’s perception of the current status of the payment/performance risk associated with the credit derivative. The current market annual fixed rate of a particular reference entity reflects the cost, as quoted by the pricing vendor, of selling protection against default of that entity as of period end and may include upfront payments required to be made to enter into the agreement. The higher the fixed rate, the greater the market perceived risk of a credit event involving the reference entity. A rate identified as “Defaulted” indicates a credit event has occurred for the reference entity. |
| (1) | Upfront payment is exchanged with the counterparty as a result of the standardized trading coupon. |
| | | | | | | | | | |
| Cross-Currency Swaps (OTC) | |
| | | | |
| Counterparty | | Portfolio Receives | | Portfolio Pays | | Effective Date/ Termination
Date(1) | | Value/Unrealized
Appreciation
(Depreciation) | |
| | | | |
| BNP Paribas | | 3-month PLN WIBOR + 1.45% on PLN 520,798 (Notional Amount) (pays quarterly) plus EUR equivalent of Notional Amount at effective date* | | 3-month EURIBOR on EUR equivalent of Notional Amount at effective date (pays quarterly) plus Notional Amount* | | 10/14/25/ 10/14/28 | | $ | (29 | ) |
| | | | |
| Goldman Sachs International | | 1-day Indice Camara Promedio Rate on CLP 63,504,540 (pays semi-annually)** | | 2.10% on CLP equivalent of CLF 2,000 (pays semi-annually)** | | Not Applicable/ 4/8/32 | | | (3,940 | ) |
| | | | |
| Goldman Sachs International | | 1-day Indice Camara Promedio Rate on CLP 158,776,700 (pays semi-annually)** | | 2.25% on CLP equivalent of CLF 5,000 (pays semi-annually)** | | Not Applicable/ 4/11/32 | | | (12,153 | ) |
| | | | |
| Goldman Sachs International | | 1-day Indice Camara Promedio Rate on CLP 28,777,725 (pays semi-annually)** | | 1.85% on CLP equivalent of CLF 900 (pays semi-annually)** | | Not Applicable/ 4/20/32 | | | (927 | ) |
| | | | |
| Goldman Sachs International | | 1-day Indice Camara Promedio Rate on CLP 160,077,000 (pays semi-annually)** | | 1.84% on CLP equivalent of CLF 5,000 (pays semi-annually)** | | Not Applicable/ 4/22/32 | | | (4,954 | ) |
| | | | |
| | | | | | | | | $ | (22,003 | ) |
| (1) | Effective date represents the date on which the Portfolio and counterparty exchange the currencies and begin interest payment accrual. |
| * | The Portfolio pays interest on the currency received and receives interest on the currency delivered. At the termination date, the notional amount of the currency received will be exchanged for the notional amount of the currency delivered. |
| ** | At the termination date, the Portfolio will either pay or receive the USD equivalent of the difference between the initial CLP notional amount and the CLP equivalent of the CLF notional amount on such date. |
Abbreviations:
| | | | |
| | |
| BUBOR | | – | | Budapest Interbank Offered Rate |
| | |
| COF | | – | | Cost of Funds 11th District |
| | |
| CPI-U (NSA) | | – | | Consumer Price Index All Urban Non-Seasonally Adjusted |
| | | | |
| | |
| EURIBOR | | – | | Euro Interbank Offered Rate |
| | |
| FBIL | | – | | Financial Benchmarks India Ltd. |
| | |
| HICP | | – | | Harmonised Indices of Consumer Prices |
| | | | |
| | 31 | | See Notes to Financial Statements. |
International Income Portfolio
October 31, 2022
Portfolio of Investments — continued
| | | | |
| | |
| MIBOR | | – | | Mumbai Interbank Offered Rate |
| | |
| OTC | | – | | Over-the-counter |
| | |
| SOFR | | – | | Secured Overnight Financing Rate |
| | |
| TAIBOR | | – | | Taipei Interbank Offered Rate |
| | | | |
| | |
| TBA | | – | | To Be Announced |
| | |
| TELBOR | | – | | Tel Aviv Interbank Offered Rate |
| | |
| WIBOR | | – | | Warsaw Interbank Offered Rate |
Currency Abbreviations:
| | | | |
| | |
| AUD | | – | | Australian Dollar |
| | |
| BRL | | – | | Brazilian Real |
| | |
| CAD | | – | | Canadian Dollar |
| | |
| CLF | | – | | Chilean Unidad de Fomento |
| | |
| CLP | | – | | Chilean Peso |
| | |
| CNH | | – | | Yuan Renminbi Offshore |
| | |
| CNY | | – | | Yuan Renminbi |
| | |
| COP | | – | | Colombian Peso |
| | |
| DOP | | – | | Dominican Peso |
| | |
| EUR | | – | | Euro |
| | |
| HUF | | – | | Hungarian Forint |
| | |
| IDR | | – | | Indonesian Rupiah |
| | |
| ILS | | – | | Israeli Shekel |
| | |
| INR | | – | | Indian Rupee |
| | |
| ISK | | – | | Icelandic Krona |
| | |
| JPY | | – | | Japanese Yen |
| | | | |
| | |
| KRW | | – | | South Korean Won |
| | |
| KZT | | – | | Kazakhstani Tenge |
| | |
| MXN | | – | | Mexican Peso |
| | |
| NZD | | – | | New Zealand Dollar |
| | |
| PEN | | – | | Peruvian Sol |
| | |
| PHP | | – | | Philippine Peso |
| | |
| PLN | | – | | Polish Zloty |
| | |
| RSD | | – | | Serbian Dinar |
| | |
| SEK | | – | | Swedish Krona |
| | |
| SGD | | – | | Singapore Dollar |
| | |
| THB | | – | | Thai Baht |
| | |
| TWD | | – | | Taiwan New Dollar |
| | |
| UAH | | – | | Ukrainian Hryvnia |
| | |
| USD | | – | | United States Dollar |
| | |
| UYU | | – | | Uruguayan Peso |
| | |
| ZAR | | – | | South African Rand |
| | | | |
| | 32 | | See Notes to Financial Statements. |
International Income Portfolio
October 31, 2022
Statement of Assets and Liabilities
| | | | |
| Assets | | October 31, 2022 | |
| |
Unaffiliated investments, at value (identified cost $34,895,548) | | $ | 28,453,663 | |
| |
Affiliated investment, at value (identified cost $1,368,351) | | | 1,368,351 | |
| |
Cash | | | 408 | |
| |
Deposits for derivatives collateral: | | | | |
| |
Futures contracts | | | 70,982 | |
| |
Centrally cleared derivatives | | | 1,693,563 | |
| |
Foreign currency, at value (identified cost $558,677) | | | 554,393 | |
| |
Interest and dividends receivable | | | 376,931 | |
| |
Dividends receivable from affiliated investment | | | 3,480 | |
| |
Receivable for investments sold | | | 1,529,683 | |
| |
Receivable for variation margin on open futures contracts | | | 8,283 | |
| |
Receivable for open forward foreign currency exchange contracts | | | 240,148 | |
| |
Receivable for open swap contracts | | | 9,668 | |
| |
Upfront payments on open non-centrally cleared swap contracts | | | 1,466 | |
| |
Receivable for open non-deliverable bond forward contracts | | | 25,502 | |
| |
Receivable from affiliate | | | 22,408 | |
| |
Total assets | | $ | 34,358,929 | |
| |
| Liabilities | | | | |
| |
Written swaptions outstanding, at value (premiums received $61,500) | | $ | 171,406 | |
| |
Payable for investments purchased | | | 5,274,094 | |
| |
Payable for variation margin on open centrally cleared derivatives | | | 75,310 | |
| |
Payable for open forward foreign currency exchange contracts | | | 51,527 | |
| |
Payable for open swap contracts | | | 22,003 | |
| |
Payable for closed swap contracts | | | 1,399 | |
| |
Upfront receipts on open non-centrally cleared swap contracts | | | 30,895 | |
| |
Payable for open non-deliverable bond forward contracts | | | 8,653 | |
| |
Payable to affiliate: | | | | |
| |
Investment adviser fee | | | 11,939 | |
| |
Trustees’ fees | | | 247 | |
| |
Accrued expenses | | | 156,590 | |
| |
Total liabilities | | $ | 5,804,063 | |
| |
Net Assets applicable to investors’ interest in Portfolio | | $ | 28,554,866 | |
| | | | |
| | 33 | | See Notes to Financial Statements. |
International Income Portfolio
October 31, 2022
Statement of Operations
| | | | |
| Investment Income | | Year Ended
October 31, 2022 | |
| |
Dividend income from affiliated investments | | $ | 13,263 | |
| |
Interest income (net of foreign taxes withheld of $31,679) | | | 1,547,564 | |
| |
Total investment income | | $ | 1,560,827 | |
| |
| Expenses | | | | |
| |
Investment adviser fee | | $ | 202,967 | |
| |
Trustees’ fees and expenses | | | 2,926 | |
| |
Custodian fee | | | 140,696 | |
| |
Legal and accounting services | | | 79,050 | |
| |
Interest expense | | | 9,755 | |
| |
Miscellaneous | | | 20,293 | |
| |
Total expenses | | $ | 455,687 | |
| |
Deduct: | | | | |
| |
Waiver and/or reimbursement of expenses by affiliate | | $ | 162,381 | |
| |
Total expense reductions | | $ | 162,381 | |
| |
Net expenses | | $ | 293,306 | |
| |
Net investment income | | $ | 1,267,521 | |
| |
| Realized and Unrealized Gain (Loss) | | | | |
| |
Net realized gain (loss): | | | | |
| |
Investment transactions (net of foreign capital gains taxes of $1,896) | | $ | (1,635,600 | ) |
| |
Investment transactions - affiliated investment | | | (395 | ) |
| |
Futures contracts | | | 582,589 | |
| |
Swap contracts | | | 349,652 | |
| |
Foreign currency transactions | | | 117,306 | |
| |
Forward foreign currency exchange contracts | | | (1,971,599 | ) |
| |
Non-deliverable bond forward contracts | | | (281,908 | ) |
| |
Net realized loss | | $ | (2,839,955 | ) |
| |
Change in unrealized appreciation (depreciation): | | | | |
| |
Investments (including net decrease in accrued foreign capital gains taxes of $7,888) | | $ | (6,629,221 | ) |
| |
Written swaptions | | | (109,906 | ) |
| |
Futures contracts | | | 77,439 | |
| |
Swap contracts | | | (259,242 | ) |
| |
Foreign currency | | | 10,594 | |
| |
Forward foreign currency exchange contracts | | | 501,030 | |
| |
Non-deliverable bond forward contracts | | | 30,108 | |
| |
Net change in unrealized appreciation (depreciation) | | $ | (6,379,198 | ) |
| |
Net realized and unrealized loss | | $ | (9,219,153 | ) |
| |
Net decrease in net assets from operations | | $ | (7,951,632 | ) |
| | | | |
| | 34 | | See Notes to Financial Statements. |
International Income Portfolio
October 31, 2022
Statement of Changes in Net Assets
| | | | | | | | |
| | | Year Ended October 31, | |
| Increase (Decrease) in Net Assets | | 2022 | | | 2021 | |
| | |
From operations: | | | | | | | | |
| | |
Net investment income | | $ | 1,267,521 | | | $ | 1,110,378 | |
| | |
Net realized gain (loss) | | | (2,839,955 | ) | | | 232,563 | |
| | |
Net change in unrealized appreciation (depreciation) | | | (6,379,198 | ) | | | (1,483,991 | ) |
| | |
Net decrease in net assets from operations | | $ | (7,951,632 | ) | | $ | (141,050 | ) |
| | |
Capital transactions: | | | | | | | | |
| | |
Contributions | | $ | 3,228,450 | | | $ | 8,877,399 | |
| | |
Withdrawals | | | (24,824,354 | ) | | | (7,801,173 | ) |
| | |
Net increase (decrease) in net assets from capital transactions | | $ | (21,595,904 | ) | | $ | 1,076,226 | |
| | |
Net increase (decrease) in net assets | | $ | (29,547,536 | ) | | $ | 935,176 | |
| | |
| Net Assets | | | | | | | | |
| | |
At beginning of year | | $ | 58,102,402 | | | $ | 57,167,226 | |
| | |
At end of year | | $ | 28,554,866 | | | $ | 58,102,402 | |
| | | | |
| | 35 | | See Notes to Financial Statements. |
International Income Portfolio
October 31, 2022
Financial Highlights
| | | | | | | | | | | | | | | | | | | | |
| | | Year Ended October 31, | |
| Ratios/Supplemental Data | | 2022 | | | 2021 | | | 2020 | | | 2019 | | | 2018 | |
| | | | | |
Ratios (as a percentage of average daily net assets): | | | | | | | | | | | | | | | | | | | | |
| | | | | |
Expenses | | | 0.72 | %(1)(2)(3) | | | 0.71 | %(2)(3) | | | 0.71 | %(2)(3) | | | 0.81 | %(2)(3) | | | 0.81 | %(2)(3) |
| | | | | |
Net investment income | | | 3.13 | % | | | 1.86 | % | | | 2.48 | % | | | 3.73 | % | | | 3.81 | % |
| | | | | |
Portfolio Turnover | | | 159 | %(4) | | | 102 | %(4) | | | 88 | %(4) | | | 92 | % | | | 23 | % |
| | | | | |
Total Return | | | (18.54 | )%(3) | | | (0.08 | )%(3) | | | 6.04 | %(3) | | | 5.92 | %(3) | | | (2.28 | )%(3) |
| | | | | |
Net assets, end of year (000’s omitted) | | $ | 28,555 | | | $ | 58,102 | | | $ | 57,167 | | | $ | 84,644 | | | $ | 95,163 | |
| (1) | Includes a reduction by the investment adviser of a portion of its adviser fee due to the Portfolio’s investment in the Liquidity Fund (equal to less than 0.005% of average daily net assets for the year ended October 31, 2022). |
| (2) | Includes interest expense of 0.02% of average daily net assets for the year ended October 31, 2022 and 0.01% of average daily net assets for each of the years ended October 31, 2021, 2020, 2019 and 2018. |
| (3) | The investment adviser reimbursed certain operating expenses (equal to 0.40%, 0.19%, 0.16%, 0.09% and 0.11% of average daily net assets for the years ended October 31, 2022, 2021, 2020, 2019 and 2018, respectively). Absent this reimbursement, total return would be lower. |
| (4) | Includes the effect of To-Be-Announced (TBA) transactions. |
| | | | |
| | 36 | | See Notes to Financial Statements. |
International Income Portfolio
October 31, 2022
Notes to Financial Statements
1 Significant Accounting Policies
International Income Portfolio (the Portfolio) is a Massachusetts business trust registered under the Investment Company Act of 1940, as amended (the 1940 Act), as a diversified, open-end management investment company. The Portfolio’s investment objective is total return. The Declaration of Trust permits the Trustees to issue interests in the Portfolio. At October 31, 2022, Eaton Vance Global Bond Fund held a 99.9% interest in the Portfolio.
The following is a summary of significant accounting policies of the Portfolio. The policies are in conformity with accounting principles generally accepted in the United States of America (U.S. GAAP). The Portfolio is an investment company and follows accounting and reporting guidance in the Financial Accounting Standards Board (FASB) Accounting Standards Codification Topic 946.
A Investment Valuation — The following methodologies are used to determine the market value or fair value of investments.
Debt Obligations. Debt obligations are generally valued on the basis of valuations provided by third party pricing services, as derived from such services’ pricing models. Inputs to the models may include, but are not limited to, reported trades, executable bid and ask prices, broker/dealer quotations, prices or yields of securities with similar characteristics, interest rates, anticipated prepayments, benchmark curves or information pertaining to the issuer, as well as industry and economic events. The pricing services may use a matrix approach, which considers information regarding securities with similar characteristics to determine the valuation for a security. Short-term debt obligations purchased with a remaining maturity of sixty days or less for which a valuation from a third party pricing service is not readily available may be valued at amortized cost, which approximates fair value.
Derivatives. U.S. exchange-traded options are valued at the mean between the bid and asked prices at valuation time as reported by the Options Price Reporting Authority. Non-U.S. exchange-traded options and over-the-counter options (including options on securities, indices and foreign currencies) are valued by a third party pricing service using techniques that consider factors including the value of the underlying instrument, the volatility of the underlying instrument and the period of time until option expiration. Futures contracts are valued at the closing settlement price established by the board of trade or exchange on which they are traded. Forward foreign currency exchange contracts are generally valued at the mean of the average bid and average ask prices that are reported by currency dealers to a third party pricing service at the valuation time. Such third party pricing service valuations are supplied for specific settlement periods and the Portfolio’s forward foreign currency exchange contracts are valued at an interpolated rate between the closest preceding and subsequent settlement period reported by the third party pricing service. Non-deliverable bond forward contracts are generally valued based on the current price of the underlying bond as provided by a third party pricing service and current interest rates. Swaps and options on interest rate swaps (“swaptions”) are normally valued using valuations provided by a third party pricing service. Such pricing service valuations are based on the present value of fixed and projected floating rate cash flows over the term of the swap contract, and in the case of credit default swaps, based on credit spread quotations obtained from broker/dealers and expected default recovery rates determined by the pricing service using proprietary models. Future cash flows on swaps are discounted to their present value using swap rates provided by electronic data services or by broker/dealers. Alternatively, swaptions may be valued at the valuation provided by a broker/dealer (usually the counterparty to the option), so determined using similar techniques as those employed by the pricing service.
Foreign Securities and Currencies. Foreign securities and currencies are valued in U.S. dollars, based on foreign currency exchange rate quotations supplied by a third party pricing service. The pricing service uses a proprietary model to determine the exchange rate. Inputs to the model include reported trades and implied bid/ask spreads.
Other. Investments in management investment companies (including money market funds) that do not trade on an exchange are valued at the net asset value as of the close of each business day.
Fair Valuation. In connection with Rule 2a-5 of the 1940 Act, which became effective September 8, 2022, the Trustees have designated the Portfolio’s investment adviser as its valuation designee. Investments for which valuations or market quotations are not readily available or are deemed unreliable are valued by the investment adviser, as valuation designee, at fair value using methods that most fairly reflect the security’s “fair value”, which is the amount that the Portfolio might reasonably expect to receive for the security upon its current sale in the ordinary course. Each such determination is based on a consideration of relevant factors, which are likely to vary from one pricing context to another. These factors may include, but are not limited to, the type of security, the existence of any contractual restrictions on the security’s disposition, the price and extent of public trading in similar securities of the issuer or of comparable companies or entities, quotations or relevant information obtained from broker/dealers or other market participants, information obtained from the issuer, analysts, and/or the appropriate stock exchange (for exchange-traded securities), an analysis of the company’s or entity’s financial statements, and an evaluation of the forces that influence the issuer and the market(s) in which the security is purchased and sold.
B Investment Transactions — Investment transactions for financial statement purposes are accounted for on a trade date basis. Realized gains and losses on investments sold are determined on the basis of identified cost.
C Income — Interest income is recorded on the basis of interest accrued, adjusted for amortization of premium or accretion of discount. Withholding taxes on foreign interest have been provided for in accordance with the Portfolio’s understanding of the applicable countries’ tax rules and rates. Inflation adjustments to the principal amount of inflation-adjusted bonds and notes are reflected as interest income. Deflation adjustments to the principal amount of an inflation-adjusted bond or note are reflected as reductions to interest income to the extent of interest income previously recorded on such bond or note. Dividend income is recorded on the ex-dividend date for dividends received in cash and/or securities.
D Federal and Other Taxes — The Portfolio has elected to be treated as a partnership for federal tax purposes. No provision is made by the Portfolio for federal or state taxes on any taxable income of the Portfolio because each investor in the Portfolio is ultimately responsible for the payment of any taxes on
International Income Portfolio
October 31, 2022
Notes to Financial Statements — continued
its share of taxable income. Since at least one of the Portfolio’s investors is a regulated investment company that invests all or substantially all of its assets in the Portfolio, the Portfolio normally must satisfy the applicable source of income and diversification requirements (under the Internal Revenue Code) in order for its investors to satisfy them. The Portfolio will allocate, at least annually among its investors, each investor’s distributive share of the Portfolio’s net investment income, net realized capital gains and losses and any other items of income, gain, loss, deduction or credit.
In addition to the requirements of the Internal Revenue Code, the Portfolio may also be subject to local taxes on the recognition of capital gains in certain countries. In determining the daily net asset value, the Portfolio estimates the accrual for such taxes, if any, based on the unrealized appreciation on certain portfolio securities and the related tax rates. Taxes attributable to unrealized appreciation are included in the change in unrealized appreciation (depreciation) on investments. Capital gains taxes on securities sold are included in net realized gain (loss) on investments.
As of October 31, 2022, the Portfolio had no uncertain tax positions that would require financial statement recognition, de-recognition, or disclosure. The Portfolio files a U.S. federal income tax return annually after its fiscal year-end, which is subject to examination by the Internal Revenue Service for a period of three years from the date of filing.
E Foreign Currency Translation — Investment valuations, other assets, and liabilities initially expressed in foreign currencies are translated each business day into U.S. dollars based upon current exchange rates. Purchases and sales of foreign investment securities and income and expenses denominated in foreign currencies are translated into U.S. dollars based upon currency exchange rates in effect on the respective dates of such transactions. Recognized gains or losses on investment transactions attributable to changes in foreign currency exchange rates are recorded for financial statement purposes as net realized gains and losses on investments. That portion of unrealized gains and losses on investments that results from fluctuations in foreign currency exchange rates is not separately disclosed.
F Use of Estimates — The preparation of the financial statements in conformity with U.S. GAAP requires management to make estimates and assumptions that affect the reported amounts of assets and liabilities at the date of the financial statements and the reported amounts of income and expense during the reporting period. Actual results could differ from those estimates.
G Indemnifications — Under the Portfolio’s organizational documents, its officers and Trustees may be indemnified against certain liabilities and expenses arising out of the performance of their duties to the Portfolio. Under Massachusetts law, if certain conditions prevail, interestholders in the Portfolio could be deemed to have personal liability for the obligations of the Portfolio. However, the Portfolio’s Declaration of Trust contains an express disclaimer of liability on the part of Portfolio interestholders. Additionally, in the normal course of business, the Portfolio enters into agreements with service providers that may contain indemnification clauses. The Portfolio’s maximum exposure under these arrangements is unknown as this would involve future claims that may be made against the Portfolio that have not yet occurred.
H Futures Contracts — Upon entering into a futures contract, the Portfolio is required to deposit with the broker, either in cash or securities, an amount equal to a certain percentage of the contract amount (initial margin). Subsequent payments, known as variation margin, are made or received by the Portfolio each business day, depending on the daily fluctuations in the value of the underlying security or index, and are recorded as unrealized gains or losses by the Portfolio. Gains (losses) are realized upon the expiration or closing of the futures contracts. Should market conditions change unexpectedly, the Portfolio may not achieve the anticipated benefits of the futures contracts and may realize a loss. Futures contracts have minimal counterparty risk as they are exchange traded and the clearinghouse for the exchange is substituted as the counterparty, guaranteeing counterparty performance.
I Forward Foreign Currency Exchange and Non-Deliverable Bond Forward Contracts — The Portfolio may enter into forward foreign currency exchange contracts for the purchase or sale of a specific foreign currency at a fixed price on a future date. The forward foreign currency exchange contracts are adjusted by the daily exchange rate of the underlying currency and any gains or losses are recorded as unrealized until such time as the contracts have been closed. While forward foreign currency exchange contracts are privately negotiated agreements between the Portfolio and a counterparty, certain contracts may be “centrally cleared”, whereby all payments made or received by the Portfolio pursuant to the contract are with a central clearing party (CCP) rather than the original counterparty. The CCP guarantees the performance of the original parties to the contract. Upon entering into centrally cleared contracts, the Portfolio is required to deposit with the CCP, either in cash or securities, an amount of initial margin determined by the CCP, which is subject to adjustment. For centrally cleared contracts, the daily change in valuation is recorded as a receivable or payable for variation margin and settled in cash with the CCP daily. The Portfolio may also enter into non-deliverable bond forward contracts for the purchase or sale of a bond denominated in a non-deliverable foreign currency at a fixed price on a future date. For non-deliverable bond forward contracts, unrealized gains and losses, based on changes in the value of the contract, and realized gains and losses are accounted for as described above. Risks may arise upon entering these contracts from the potential inability of counterparties to meet the terms of their contracts and, in the case of forward foreign currency exchange contracts, from movements in the value of a foreign currency relative to the U.S. dollar. In the case of centrally cleared contracts, counterparty risk is minimal due to protections provided by the CCP.
J Purchased Options — Upon the purchase of a call or put option, the premium paid by the Portfolio is included in the Statement of Assets and Liabilities as an investment. The amount of the investment is subsequently marked-to-market to reflect the current market value of the option purchased, in accordance with the Portfolio’s policies on investment valuations discussed above. As the purchaser of an index option, the Portfolio has the right to receive a cash payment equal to any depreciation in the value of the index below the exercise price of the option (in the case of a put) or equal to any appreciation in the value of the index over the exercise price of the option (in the case of a call) as of the valuation date of the option. If an option which the Portfolio
International Income Portfolio
October 31, 2022
Notes to Financial Statements — continued
had purchased expires on the stipulated expiration date, the Portfolio will realize a loss in the amount of the cost of the option. If the Portfolio enters into a closing sale transaction, the Portfolio will realize a gain or loss, depending on whether the sales proceeds from the closing sale transaction are greater or less than the cost of the option. If the Portfolio exercises a put option on a security, it will realize a gain or loss from the sale of the underlying security, and the proceeds from such sale will be decreased by the premium originally paid. If the Portfolio exercises a call option on a security, the cost of the security which the Portfolio purchases upon exercise will be increased by the premium originally paid. The risk associated with purchasing options is limited to the premium originally paid. Purchased options traded over-the-counter involve risk that the issuer or counterparty will fail to perform its contractual obligations.
K Interest Rate Swaps — Swap contracts are privately negotiated agreements between the Portfolio and a counterparty. Certain swap contracts may be centrally cleared. Pursuant to interest rate swap agreements, the Portfolio either makes floating-rate payments to the counterparty (or CCP in the case of centrally cleared swaps) based on a benchmark interest rate in exchange for fixed-rate payments or the Portfolio makes fixed-rate payments to the counterparty (or CCP in the case of a centrally cleared swap) in exchange for payments on a floating benchmark interest rate. Payments received or made, including amortization of upfront payments/receipts, if any (which are amortized over the life of the swap contract), are recorded as realized gains or losses. During the term of the outstanding swap agreement, changes in the underlying value of the swap are recorded as unrealized gains or losses. For centrally cleared swaps, the daily change in valuation is recorded as a receivable or payable for variation margin and settled in cash with the CCP daily. The value of the swap is determined by changes in the relationship between two rates of interest. The Portfolio is exposed to credit loss in the event of non-performance by the swap counterparty. In the case of centrally cleared swaps, counterparty risk is minimal due to protections provided by the CCP. Risk may also arise from movements in interest rates.
L Inflation Swaps — Pursuant to inflation swap agreements, the Portfolio either makes floating-rate payments to the counterparty (or CCP in the case of centrally cleared swaps) based on a benchmark index in exchange for fixed-rate payments or the Portfolio makes fixed-rate payments to the counterparty (or CCP in the case of centrally cleared swaps) in exchange for floating-rate payments based on the return of a benchmark index. By design, the benchmark index is an inflation index, such as the Consumer Price Index. The accounting policy for payments received or made and changes in the underlying value of the inflation swap are the same as for interest rate swaps as described above. The value of the swap is determined by changes in the relationship between the rate of interest and the benchmark index. The Portfolio is exposed to credit loss in the event of nonperformance by the swap counterparty. In the case of centrally cleared swaps, counterparty risk is minimal due to protections provided by the CCP. Risk may also arise from the unanticipated movements in value of interest rates or the index.
M Cross-Currency Swaps — Cross-currency swaps are interest rate swaps in which interest cash flows are exchanged between two parties based on the notional amounts of two different currencies. The notional amounts are typically determined based on the spot exchange rates at the inception of the trade. Cross-currency swaps also involve the exchange of the notional amounts at the start of the contract at the current spot rate with an agreement to re-exchange such amounts at a later date at either the same exchange rate, a specified rate or the then current spot rate. The entire principal value of a cross currency swap is subject to the risk that the counterparty to the swap will default on its contractual delivery obligations.
N Credit Default Swaps — When the Portfolio is the buyer of a credit default swap contract, the Portfolio is entitled to receive the par (or other agreed-upon) value of a referenced debt obligation (or basket of debt obligations) from the counterparty (or CCP in the case of a centrally cleared swap) to the contract if a credit event by a third party, such as a U.S. or foreign corporate issuer or sovereign issuer, on the debt obligation occurs. In return, the Portfolio pays the counterparty a periodic stream of payments over the term of the contract provided that no credit event has occurred. If no credit event occurs, the Portfolio would have spent the stream of payments and received no proceeds from the contract. When the Portfolio is the seller of a credit default swap contract, it receives the stream of payments, but is obligated to pay to the buyer of the protection an amount up to the notional amount of the swap and in certain instances take delivery of securities of the reference entity upon the occurrence of a credit event, as defined under the terms of that particular swap agreement. Credit events are contract specific but may include bankruptcy, failure to pay, restructuring, obligation acceleration and repudiation/moratorium. If the Portfolio is a seller of protection and a credit event occurs, the maximum potential amount of future payments that the Portfolio could be required to make would be an amount equal to the notional amount of the agreement. This potential amount would be partially offset by any recovery value of the respective referenced obligation, or net amount received from the settlement of a buy protection credit default swap agreement entered into by the Portfolio for the same referenced obligation. As the seller, the Portfolio may create economic leverage to its portfolio because, in addition to its total net assets, the Portfolio is subject to investment exposure on the notional amount of the swap. The interest fee paid or received on the swap contract, which is based on a specified interest rate on a fixed notional amount, is accrued daily as a component of unrealized appreciation (depreciation) and is recorded as realized gain upon receipt or realized loss upon payment. The Portfolio also records an increase or decrease to unrealized appreciation (depreciation) in an amount equal to the daily valuation. For centrally cleared swaps, the daily change in valuation is recorded as a receivable or payable for variation margin and settled in cash with the CCP daily. All upfront payments and receipts, if any, are amortized over the life of the swap contract as realized gains or losses. Those upfront payments or receipts for non-centrally cleared swaps are recorded as other assets or other liabilities, respectively, net of amortization. For financial reporting purposes, unamortized upfront payments or receipts, if any, are netted with unrealized appreciation or depreciation on swap contracts to determine the market value of swaps as presented in Notes 5 and 8. These transactions involve certain risks, including the risk that the seller may be unable to fulfill the transaction. In the case of centrally cleared swaps, counterparty risk is minimal due to protections provided by the CCP.
International Income Portfolio
October 31, 2022
Notes to Financial Statements — continued
O Swaptions — A written swaption gives the Portfolio the obligation, if exercised by the purchaser, to enter into a swap contract according to the terms of the underlying agreement. When the Portfolio writes a swaption, the premium received by the Portfolio is recorded as a liability and subsequently marked-to-market to reflect the current value of the swaption. When a swaption is exercised, the cost of the swap is adjusted by the amount of the premium paid or received. When a swaption expires or an unexercised swaption is closed, a gain or loss is recognized in the amount of the premium paid or received, plus the cost to close. The writer of a swaption bears the risk of unfavorable changes in the preset terms of the underlying swap contract.
P When-Issued Securities and Delayed Delivery Transactions — The Portfolio may purchase securities on a delayed delivery, when-issued or forward commitment basis, including TBA (To Be Announced) securities. Payment and delivery may take place after the customary settlement period for that security. At the time the transaction is negotiated, the price of the security that will be delivered is fixed. The Portfolio maintains cash and/or security positions for these commitments such that sufficient liquid assets will be available to make payments upon settlement. Securities purchased on a delayed delivery, when-issued or forward commitment basis are marked-to-market daily and begin earning interest on settlement date. Such security purchases are subject to the risk that when delivered they will be worth less than the agreed upon payment price. Losses may also arise if the counterparty does not perform under the contract. A forward purchase commitment may also be closed by entering into an offsetting commitment. If an offsetting commitment is entered into, the Portfolio will realize a gain or loss on investments based on the price established when the Portfolio entered into the commitment.
2 Investment Adviser Fee and Other Transactions with Affiliates
The investment adviser fee is earned by Boston Management and Research (BMR), an indirect, wholly-owned subsidiary of Morgan Stanley, as compensation for investment advisory services rendered to the Portfolio. The fee is computed at an annual rate as a percentage of the Portfolio’s average daily net assets as follows and is payable monthly:
| | | | |
| Average Daily Net Assets | | | | Annual Fee Rate |
| | |
| Up to $1 billion | | | | 0.500% |
| | |
| $1 billion but less than $2.5 billion | | | | 0.475% |
| | |
| $2.5 billion but less than $5 billion | | | | 0.455% |
| | |
| $5 billion and over | | | | 0.440% |
For the year ended October 31, 2022, the Portfolio’s investment adviser fee amounted to $202,967 or 0.50% of the Portfolio’s average daily net assets. Pursuant to a voluntary expense reimbursement, BMR was allocated $161,279 of the Portfolio’s operating expenses for the year ended October 31, 2022.
Effective April 26, 2022, the Portfolio may invest in a money market fund, the Institutional Class of the Morgan Stanley Institutional Liquidity Funds - Government Portfolio (the “Liquidity Fund”), an open-end management investment company managed by Morgan Stanley Investment Management Inc., a wholly-owned subsidiary of Morgan Stanley. The investment adviser fee paid by the Portfolio is reduced by an amount equal to its pro-rata share of the advisory and administration fees paid by the Portfolio due to its investment in the Liquidity Fund. For the year ended October 31, 2022, the investment adviser fee paid was reduced by $1,102 relating to the Portfolio’s investment in the Liquidity Fund. Prior to April 26, 2022, the Portfolio may have invested its cash in Eaton Vance Cash Reserves Fund, LLC (Cash Reserves Fund), an affiliated investment company managed by Eaton Vance Management (EVM), an affiliate of BMR. EVM did not receive a fee for advisory services provided to Cash Reserves Fund.
Trustees and officers of the Portfolio who are members of EVM’s or BMR’s organizations receive remuneration for their services to the Portfolio out of the investment adviser fee. Trustees of the Portfolio who are not affiliated with the investment adviser may elect to defer receipt of all or a percentage of their annual fees in accordance with the terms of the Trustees Deferred Compensation Plan. For the year ended October 31, 2022, no significant amounts have been deferred. Certain officers and Trustees of the Portfolio are officers of the above organizations.
3 Purchases and Sales of Investments
Purchases and sales of investments, other than short-term obligations, and including maturities, paydowns and TBA transactions, for the year ended October 31, 2022 were as follows:
| | | | | | | | |
| | | Purchases | | | Sales | |
| | |
Investments (non-U.S. Government) | | $ | 38,761,740 | | | $ | 43,836,871 | |
| | |
U.S. Government and Agency Securities | | | 6,302,648 | | | | 351,908 | |
| | |
| | | $ | 45,064,388 | | | $ | 44,188,779 | |
International Income Portfolio
October 31, 2022
Notes to Financial Statements — continued
4 Federal Income Tax Basis of Investments
The cost and unrealized appreciation (depreciation) of investments, including open derivative contracts, of the Portfolio at October 31, 2022, as determined on a federal income tax basis, were as follows:
| | | | |
Aggregate cost | | $ | 37,014,149 | |
| |
Gross unrealized appreciation | | $ | 294,447 | |
| |
Gross unrealized depreciation | | | (4,301,616 | ) |
| |
Net unrealized depreciation | | $ | (4,007,169 | ) |
5 Financial Instruments
The Portfolio may trade in financial instruments with off-balance sheet risk in the normal course of its investing activities. These financial instruments may include swaptions, forward foreign currency exchange contracts, non-deliverable bond forward contracts, futures contracts and swap contracts and may involve, to a varying degree, elements of risk in excess of the amounts recognized for financial statement purposes. The notional or contractual amounts of these instruments represent the investment the Portfolio has in particular classes of financial instruments and do not necessarily represent the amounts potentially subject to risk. The measurement of the risks associated with these instruments is meaningful only when all related and offsetting transactions are considered. A summary of obligations under these financial instruments at October 31, 2022 is included in the Portfolio of Investments. At October 31, 2022, the Portfolio had sufficient cash and/or securities to cover commitments under these contracts.
In the normal course of pursuing its investment objective, the Portfolio is subject to the following risks:
Credit Risk: The Portfolio enters into credit default swap contracts to enhance total return and/or as a substitute for the purchase or sale of securities.
Foreign Exchange Risk: The Portfolio engages in forward foreign currency exchange contracts and cross-currency swaps to enhance total return, to seek to hedge against fluctuations in currency exchange rates and/or as a substitute for the purchase or sale of securities or currencies.
Interest Rate Risk: The Portfolio utilizes various interest rate derivatives including non-deliverable bond forward contracts, interest rate futures contracts, interest rate swaps and swaptions, inflation swaps, cross-currency swaps and options contracts to enhance total return, to seek to hedge against fluctuations in interest rates and/or to change the effective duration of its portfolio.
The Portfolio enters into over-the-counter (OTC) derivatives that may contain provisions whereby the counterparty may terminate the contract under certain conditions, including but not limited to a decline in the Portfolio’s net assets below a certain level over a certain period of time, which would trigger a payment by the Portfolio for those derivatives in a liability position. At October 31, 2022, the fair value of derivatives with credit-related contingent features in a net liability position was $275,076. The aggregate fair value of assets pledged as collateral by the Portfolio for such liability was $306,113 at October 31, 2022.
The OTC derivatives in which the Portfolio invests (except for written swaptions as the Portfolio, not the counterparty, is obligated to perform) are subject to the risk that the counterparty to the contract fails to perform its obligations under the contract. To mitigate this risk, the Portfolio has entered into an International Swaps and Derivatives Association, Inc. Master Agreement (“ISDA Master Agreement”) or similar agreement with substantially all its derivative counterparties. An ISDA Master Agreement is a bilateral agreement between the Portfolio and a counterparty that governs certain OTC derivatives and typically contains, among other things, set-off provisions in the event of a default and/ or termination event as defined under the relevant ISDA Master Agreement. Under an ISDA Master Agreement, the Portfolio may, under certain circumstances, offset with the counterparty certain derivative financial instruments’ payables and/or receivables with collateral held and/or posted and create one single net payment. The provisions of the ISDA Master Agreement typically permit a single net payment in the event of default including the bankruptcy or insolvency of the counterparty. However, bankruptcy or insolvency laws of a particular jurisdiction may impose restrictions on or prohibitions against the right of offset in bankruptcy or insolvency. Certain ISDA Master Agreements allow counterparties to OTC derivatives to terminate derivative contracts prior to maturity in the event the Portfolio’s net assets decline by a stated percentage or the Portfolio fails to meet the terms of its ISDA Master Agreements, which would cause the counterparty to accelerate payment by the Portfolio of any net liability owed to it.
The collateral requirements for derivatives traded under an ISDA Master Agreement are governed by a Credit Support Annex to the ISDA Master Agreement. Collateral requirements are determined at the close of business each day and are typically based on changes in market values for each transaction under an ISDA Master Agreement and netted into one amount for such agreement. Generally, the amount of collateral due from or to a counterparty is subject to a minimum transfer threshold amount before a transfer is required, which may vary by counterparty. Collateral pledged for the benefit of the Portfolio and/ or counterparty is held in segregated accounts by the Portfolio’s custodian and cannot be sold, re-pledged, assigned or otherwise used while pledged. The
International Income Portfolio
October 31, 2022
Notes to Financial Statements — continued
portion of such collateral representing cash, if any, is reflected as deposits for derivatives collateral and, in the case of cash pledged by a counterparty for the benefit of the Portfolio, a corresponding liability on the Statement of Assets and Liabilities. Securities pledged by the Portfolio as collateral, if any, are identified as such in the Portfolio of Investments.
The fair value of open derivative instruments (not considered to be hedging instruments for accounting disclosure purposes) by risk exposure at October 31, 2022 was as follows:
| | | | | | | | | | | | | | | | |
| | | Fair Value | |
| Statement of Assets and Liabilities Caption | | Credit | | | Foreign
Exchange | | | Interest Rate | | | Total | |
| | | | |
Unaffiliated investments, at value | | $ | — | | | $ | — | | | $ | 1 | | | $ | 1 | |
| | | | |
Not applicable | | | — | | | | 705,149 | * | | | 887,542 | * | | | 1,592,691 | |
| | | | |
Receivable for open forward foreign currency exchange contracts | | | — | | | | 240,148 | | | | — | | | | 240,148 | |
| | | | |
Receivable for open swap contracts; Upfront payments on open non-centrally cleared swap contracts | | | 1,726 | | | | — | | | | — | | | | 1,726 | |
| | | | |
Receivable for open non-deliverable bond forward contracts | | | — | | | | — | | | | 25,502 | | | | 25,502 | |
| | | | |
Total Asset Derivatives | | $ | 1,726 | | | $ | 945,297 | | | $ | 913,045 | | | $ | 1,860,068 | |
| | | | |
Derivatives not subject to master netting or similar agreements | | $ | — | | | $ | 705,149 | | | $ | 887,542 | | | $ | 1,592,691 | |
| | | | |
Total Asset Derivatives subject to master netting or similar agreements | | $ | 1,726 | | | $ | 240,148 | | | $ | 25,503 | | | $ | 267,377 | |
| | | | |
Written swaptions outstanding, at value | | $ | — | | | $ | — | | | $ | (171,406 | ) | | $ | (171,406 | ) |
| | | | |
Not applicable | | | (454,805 | )* | | | (624,629 | )* | | | (1,169,934 | )* | | | (2,249,368 | ) |
| | | | |
Payable for open forward foreign currency exchange contracts | | | — | | | | (51,527 | ) | | | — | | | | (51,527 | ) |
| | | | |
Payable for open swap contracts; Upfront receipts on open non-centrally cleared swap contracts | | | (21,487 | ) | | | — | | | | (22,003 | ) | | | (43,490 | ) |
| | | | |
Payable for open non-deliverable bond forward contracts | | | — | | | | — | | | | (8,653 | ) | | | (8,653 | ) |
| | | | |
Total Liability Derivatives | | $ | (476,292 | ) | | $ | (676,156 | ) | | $ | (1,371,996 | ) | | $ | (2,524,444 | ) |
| | | | |
Derivatives not subject to master netting or similar agreements | | $ | (454,805 | ) | | $ | (624,629 | ) | | $ | (1,169,934 | ) | | $ | (2,249,368 | ) |
| | | | |
Total Liability Derivatives subject to master netting or similar agreements | | $ | (21,487 | ) | | $ | (51,527 | ) | | $ | (202,062 | ) | | $ | (275,076 | ) |
| * | Only the current day’s variation margin on open futures contracts and centrally cleared derivatives is reported within the Statement of Assets and Liabilities as Receivable or Payable for variation margin on open futures contracts and centrally cleared derivatives, as applicable. |
The Portfolio’s derivative assets and liabilities at fair value by risk, which are reported gross in the Statement of Assets and Liabilities, are presented in the table above. The following tables present the Portfolio’s derivative assets and liabilities by counterparty, net of amounts available for offset under a master netting agreement and net of the related collateral received by the Portfolio for such assets and pledged by the Portfolio for such liabilities as of October 31, 2022.
| | | | | | | | | | | | | | | | | | | | |
| Counterparty | | Derivative
Assets Subject to
Master Netting
Agreement | | | Derivatives
Available
for Offset | | | Non-cash
Collateral
Received(a) | | | Cash
Collateral
Received(a) | | | Net Amount
of Derivative
Assets(b) | |
| | | | | |
Bank of America, N.A. | | $ | 12,374 | | | $ | (12,374 | ) | | $ | — | | | $ | — | | | $ | — | |
| | | | | |
BNP Paribas | | | 76,244 | | | | (29 | ) | | | — | | | | — | | | | 76,215 | |
| | | | | |
Citibank, N.A. | | | 60,260 | | | | (64 | ) | | | — | | | | — | | | | 60,196 | |
| | | | | |
Goldman Sachs International | | | 15,041 | | | | (15,041 | ) | | | — | | | | — | | | | — | |
| | | | | |
JPMorgan Chase Bank, N.A. | | | 18,968 | | | | (18,968 | ) | | | — | | | | — | | | | — | |
International Income Portfolio
October 31, 2022
Notes to Financial Statements — continued
| | | | | | | | | | | | | | | | | | | | |
| Counterparty | | Derivative
Assets Subject to
Master Netting
Agreement | | | Derivatives
Available
for Offset | | | Non-cash
Collateral
Received(a) | | | Cash
Collateral
Received(a) | | | Net Amount
of Derivative
Assets(b) | |
| | | | | |
Standard Chartered Bank | | $ | 31,400 | | | $ | (22,598 | ) | | $ | — | | | $ | — | | | $ | 8,802 | |
| | | | | |
State Street Bank and Trust Company | | | 39,380 | | | | (3,215 | ) | | | — | | | | — | | | | 36,165 | |
| | | | | |
UBS AG | | | 13,710 | | | | (1,743 | ) | | | — | | | | — | | | | 11,967 | |
| | | | | |
| | | $ | 267,377 | | | $ | (74,032 | ) | | $ | — | | | $ | — | | | $ | 193,345 | |
| | | | | | | | | | | | | | | | | | | | |
| Counterparty | | Derivative
Liabilities Subject to
Master Netting
Agreement | | | Derivatives
Available
for Offset | | | Non-cash
Collateral
Pledged(a) | | | Cash
Collateral
Pledged(a) | | | Net Amount
of Derivative
Liabilities(c) | |
| | | | | |
Bank of America, N.A. | | $ | (120,730 | ) | | $ | 12,374 | | | $ | 108,356 | | | $ | — | | | $ | — | |
| | | | | |
BNP Paribas | | | (29 | ) | | | 29 | | | | — | | | | — | | | | — | |
| | | | | |
Citibank, N.A. | | | (64 | ) | | | 64 | | | | — | | | | — | | | | — | |
| | | | | |
Goldman Sachs International | | | (46,331 | ) | | | 15,041 | | | | — | | | | — | | | | (31,290 | ) |
| | | | | |
HSBC Bank USA, N.A. | | | (23,896 | ) | | | — | | | | — | | | | — | | | | (23,896 | ) |
| | | | | |
JPMorgan Chase Bank, N.A. | | | (56,470 | ) | | | 18,968 | | | | 37,502 | | | | — | | | | — | |
| | | | | |
Standard Chartered Bank | | | (22,598 | ) | | | 22,598 | | | | — | | | | — | | | | — | |
| | | | | |
State Street Bank and Trust Company | | | (3,215 | ) | | | 3,215 | | | | — | | | | — | | | | — | |
| | | | | |
UBS AG | | | (1,743 | ) | | | 1,743 | | | | — | | | | — | | | | — | |
| | | | | |
| | | $ | (275,076 | ) | | $ | 74,032 | | | $ | 145,858 | | | $ | — | | | $ | (55,186 | ) |
| (a) | In some instances, the total collateral received and/or pledged may be more than the amount shown due to overcollateralization. |
| (b) | Net amount represents the net amount due from the counterparty in the event of default. |
| (c) | Net amount represents the net amount payable to the counterparty in the event of default. |
International Income Portfolio
October 31, 2022
Notes to Financial Statements — continued
The effect of derivative instruments (not considered to be hedging instruments for accounting disclosure purposes) on the Statement of Operations by risk exposure for the year ended October 31, 2022 was as follows:
| | | | | | | | | | | | | | | | |
| Statement of Operations Caption | | Credit | | | Foreign
Exchange | | | Interest
Rate | | | Total | |
| | | | |
Net realized gain (loss): | | | | | | | | | | | | | | | | |
| | | | |
Futures contracts | | $ | — | | | $ | — | | | $ | 582,589 | | | $ | 582,589 | |
| | | | |
Swap contracts | | | (222,723 | ) | | | — | | | | 572,375 | | | | 349,652 | |
| | | | |
Forward foreign currency exchange contracts | | | — | | | | (1,971,599 | ) | | | ��� | | | | (1,971,599 | ) |
| | | | |
Non-deliverable bond forward contracts | | | — | | | | — | | | | (281,908 | ) | | | (281,908 | ) |
| | | | |
Total | | $ | (222,723 | ) | | $ | (1,971,599 | ) | | $ | 873,056 | | | $ | (1,321,266 | ) |
| | | | |
Change in unrealized appreciation (depreciation): | | | | | | | | | | | | | | | | |
| | | | |
Investments | | $ | — | | | $ | — | | | $ | (9,711 | ) | | $ | (9,711 | ) |
| | | | |
Written swaptions | | | — | | | | — | | | | (109,906 | ) | | | (109,906 | ) |
| | | | |
Futures contracts | | | — | | | | — | | | | 77,439 | | | | 77,439 | |
| | | | |
Swap contracts | | | 74,143 | | | | — | | | | (333,385 | ) | | | (259,242 | ) |
| | | | |
Forward foreign currency exchange contracts | | | — | | | | 501,030 | | | | — | | | | 501,030 | |
| | | | |
Non-deliverable bond forward contracts | | | — | | | | — | | | | 30,108 | | | | 30,108 | |
| | | | |
Total | | $ | 74,143 | | | $ | 501,030 | | | $ | (345,455 | ) | | $ | 229,718 | |
The average notional cost of futures contracts and average notional amounts of other derivative contracts outstanding during the year ended October 31, 2022, which are indicative of the volume of these derivative types, were approximately as follows:
| | | | | | | | | | | | | | | | | | | | | | | | | | |
Futures
Contracts — Long | | | Futures
Contracts — Short | | | Forward
Foreign Currency
Exchange Contracts* | | | Non-Deliverable
Bond Forward
Contracts | | | Purchased Call
Options | | | Written
Swaptions | | | Swap
Contracts | |
| | | | | | |
| | $830,000 | | | $ | 4,703,000 | | | $ | 82,875,000 | | | $ | 1,693,000 | | | $ | 23,500,000 | | | $ | 1,154,000 | | | $ | 62,077,000 | |
| * | The average notional amount for forward foreign currency exchange contracts is based on the absolute value of notional amounts of currency purchased and currency sold. |
6 Line of Credit
The Portfolio participates with other portfolios and funds managed by EVM and its affiliates in a $725 million unsecured line of credit agreement with a group of banks, which is in effect through October 24, 2023. In connection with the renewal of the agreement on October 25, 2022, the borrowing limit was decreased from $800 million. Borrowings are made by the Portfolio solely for temporary purposes related to redemptions and other short-term cash needs. Interest is charged to the Portfolio based on its borrowings at an amount above either the Secured Overnight Financing Rate (SOFR) or Federal Funds rate. In addition, a fee computed at an annual rate of 0.15% on the daily unused portion of the line of credit is allocated among the participating portfolios and funds at the end of each quarter. Also in connection with the renewal of the agreement, an arrangement fee totaling $150,000 was incurred that was allocated to the participating portfolios and funds. Because the line of credit is not available exclusively to the Portfolio, it may be unable to borrow some or all of its requested amounts at any particular time. The Portfolio did not have any significant borrowings or allocated fees during the year ended October 31, 2022.
International Income Portfolio
October 31, 2022
Notes to Financial Statements — continued
7 Investments in Affiliated Funds
At October 31, 2022, the value of the Portfolio’s investment in funds that may be deemed to be affiliated was $1,368,351, which represents 4.8% of the Portfolio’s net assets. Transactions in affiliated funds by the Portfolio for the year ended October 31, 2022 were as follows:
| | | | | | | | | | | | | | | | | | | | | | | | | | | | | | | | |
| Name | | Value,
beginning
of period | | | Purchases | | | Sales
proceeds | | | Net
realized
gain (loss) | | | Change in
unrealized
appreciation
(depreciation) | | | Value, end
of period | | | Dividend
income | | | Units/Shares,
end of period | |
| | | | | | | | |
Short-Term Investments | | | | | | | | | | | | | | | | | | | | | | | | | | | | | | | | |
| | | | | | | | |
Cash Reserves Fund | | $ | 54,663 | | | $ | 42,683,650 | | | $ | (42,737,918 | ) | | $ | (395 | ) | | $ | — | | | $ | — | | | $ | 2,070 | | | | — | |
| | | | | | | | |
Liquidity Fund | | | — | | | | 37,088,357 | | | | (35,720,006 | ) | | | — | | | | — | | | | 1,368,351 | | | | 11,193 | | | | 1,368,351 | |
| | | | | | | | |
Total | | | | | | | | | | | | | | $ | (395 | ) | | $ | — | | | $ | 1,368,351 | | | $ | 13,263 | | | | | |
8 Fair Value Measurements
Under generally accepted accounting principles for fair value measurements, a three-tier hierarchy to prioritize the assumptions, referred to as inputs, is used in valuation techniques to measure fair value. The three-tier hierarchy of inputs is summarized in the three broad levels listed below.
| • | | Level 1 – quoted prices in active markets for identical investments |
| • | | Level 2 – other significant observable inputs (including quoted prices for similar investments, interest rates, prepayment speeds, credit risk, etc.) |
| • | | Level 3 – significant unobservable inputs (including a fund’s own assumptions in determining the fair value of investments) |
In cases where the inputs used to measure fair value fall in different levels of the fair value hierarchy, the level disclosed is determined based on the lowest level input that is significant to the fair value measurement in its entirety. The inputs or methodology used for valuing securities are not necessarily an indication of the risk associated with investing in those securities.
At October 31, 2022, the hierarchy of inputs used in valuing the Portfolio’s investments and open derivative instruments, which are carried at value, were as follows:
| | | | | | | | | | | | | | | | |
| Asset Description | | Level 1 | | | Level 2 | | | Level 3 | | | Total | |
| | | | |
Collateralized Mortgage Obligations | | $ | — | | | $ | 1,572,634 | | | $ | — | | | $ | 1,572,634 | |
| | | | |
Foreign Corporate Bonds | | | — | | | | 1,392,362 | | | | — | | | | 1,392,362 | |
| | | | |
Sovereign Government Bonds | | | — | | | | 14,978,995 | | | | 532,429 | | | | 15,511,424 | |
| | | | |
U.S. Government Agency Mortgage-Backed Securities | | | — | | | | 2,779,419 | | | | — | | | | 2,779,419 | |
| | | | |
U.S. Treasury Obligations | | | — | | | | 1,376,417 | | | | — | | | | 1,376,417 | |
| | | | |
Short-Term Investments: | | | | | | | | | | | | | | | | |
| | | | |
Affiliated Fund | | | 1,368,351 | | | | — | | | | — | | | | 1,368,351 | |
| | | | |
Sovereign Government Securities | | | — | | | | 1,362,569 | | | | 41,884 | | | | 1,404,453 | |
| | | | |
U.S. Treasury Obligations | | | — | | | | 4,416,953 | | | | — | | | | 4,416,953 | |
| | | | |
Purchased Call Options | | | — | | | | 1 | | | | — | | | | 1 | |
| | | | |
Total Investments | | $ | 1,368,351 | | | $ | 27,879,350 | | | $ | 574,313 | | | $ | 29,822,014 | |
| | | | |
Forward Foreign Currency Exchange Contracts | | $ | — | | | $ | 945,297 | | | $ | — | | | $ | 945,297 | |
| | | | |
Non-Deliverable Bond Forward Contracts | | | — | | | | 25,502 | | | | — | | | | 25,502 | |
| | | | |
Futures Contracts | | | 173,360 | | | | — | | | | — | | | | 173,360 | |
| | | | |
Swap Contracts | | | — | | | | 715,908 | | | | — | | | | 715,908 | |
| | | | |
Total | | $ | 1,541,711 | | | $ | 29,566,057 | | | $ | 574,313 | | | $ | 31,682,081 | |
International Income Portfolio
October 31, 2022
Notes to Financial Statements — continued
| | | | | | | | | | | | | | | | |
| Liability Description | | Level 1 | | | Level 2 | | | Level 3 | | | Total | |
| | | | |
Written Interest Rate Swaptions | | $ | — | | | $ | (171,406 | ) | | $ | — | | | $ | (171,406 | ) |
| | | | |
Forward Foreign Currency Exchange Contracts | | | — | | | | (676,156 | ) | | | — | | | | (676,156 | ) |
| | | | |
Non-Deliverable Bond Forward Contracts | | | — | | | | (8,653 | ) | | | — | | | | (8,653 | ) |
| | | | |
Futures Contracts | | | (55,875 | ) | | | — | | | | — | | | | (55,875 | ) |
| | | | |
Swap Contracts | | | — | | | | (1,612,354 | ) | | | — | | | | (1,612,354 | ) |
| | | | |
Total | | $ | (55,875 | ) | | $ | (2,468,569 | ) | | $ | — | | | $ | (2,524,444 | ) |
The following is a reconciliation of Level 3 investments for which significant unobservable inputs were used to determine fair value:
| | | | | | | | |
| | | Sovereign
Government
Bonds | | | Sovereign
Government
Securities | |
| | |
Balance as of October 31, 2021 | | $ | — | | | $ | — | |
| | |
Realized gains (losses) | | | (9,350 | ) | | | — | |
| | |
Change in net unrealized appreciation (depreciation) | | | (1,423,114 | ) | | | (11,739 | ) |
| | |
Cost of purchases | | | 64,992 | | | | 52,046 | |
| | |
Proceeds from sales, including return of capital | | | (63,971 | ) | | | — | |
| | |
Accrued discount (premium) | | | — | | | | 1,577 | |
| | |
Transfers to Level 3 | | | 1,963,872 | | | | — | |
| | |
Transfers from Level 3 | | | — | | | | — | |
| | |
Balance as of October 31, 2022 | | $ | 532,429 | | | $ | 41,884 | |
| | |
Change in net unrealized appreciation (depreciation) on investments still held as of October 31, 2022 | | $ | (1,421,154 | ) | | $ | (11,739 | ) |
The following is a summary of quantitative information about significant unobservable valuation inputs for Level 3 investments held as of October 31, 2022:
| | | | | | | | | | | | | | | | |
| Type of Investment | | Fair Value as of
October 31, 2022 | | | Valuation Technique | | Unobservable Input | | Input | | | Impact to
Valuation from an
Increase to Input* | |
| | | | | |
Sovereign Government Bonds | | $ | 532,429 | | | Third Party
Indication of Value | | Foreign Currency
Exchange Rate | | | 40.20 UAH/USD | | | | Decrease | |
| | | | | |
Sovereign Government Securities | | | 41,884 | | | Third Party
Indication of Value | | Foreign Currency
Exchange Rate | | | 40.20 UAH/USD | | | | Decrease | |
| * | Represents the directional change in the fair value of the Level 3 investments that would result from an increase to the corresponding unobservable input. A decrease to the unobservable input would have the opposite effect. |
9 Risks and Uncertainties
Risks Associated with Foreign Investments
Foreign investments can be adversely affected by political, economic and market developments abroad, including the imposition of economic and other sanctions by the United States or another country. There may be less publicly available information about foreign issuers because they may not be subject to reporting practices, requirements or regulations comparable to those to which United States companies are subject. Foreign markets may be smaller, less liquid and more volatile than the major markets in the United States. Trading in foreign markets typically involves higher expense than trading in the United States. The Portfolio may have difficulties enforcing its legal or contractual rights in a foreign country. Securities that trade or are denominated in currencies other than the U.S. dollar may be adversely affected by fluctuations in currency exchange rates.
International Income Portfolio
October 31, 2022
Notes to Financial Statements — continued
Emerging market securities often involve greater risks than developed market securities. Investment markets within emerging market countries are typically smaller, less liquid, less developed and more volatile than those in more developed markets like the United States, and may be focused in certain economic sectors. The information available about an emerging market issuer may be less reliable than for comparable issuers in more developed capital markets. Governmental actions can have a significant effect on the economic conditions in emerging market countries. It may be more difficult to make a claim or obtain a judgment in the courts of these countries than it is in the United States. The possibility of fraud, negligence, undue influence being exerted by an issuer or refusal to recognize ownership exists in some emerging markets. Disruptions due to work stoppages and trading improprieties in foreign securities markets have caused such markets to close. Emerging market securities are also subject to speculative trading, which contributes to their volatility.
Economic data as reported by sovereign entities may be delayed, inaccurate or fraudulent. In the event of a default by a sovereign entity, there are typically no assets to be seized or cash flows to be attached. Furthermore, the willingness or ability of a sovereign entity to restructure defaulted debt may be limited. Therefore, losses on sovereign defaults may far exceed the losses from the default of a similarly rated U.S. debt issuer.
On February 24, 2022, Russia launched an invasion of Ukraine, following rising tensions over the buildup of Russian troops along the Ukrainian border and joint military exercises by Russia with Belarus. In response to the invasion, many countries, including the U.S., have imposed economic sanctions on Russian governmental institutions, Russian entities, and Russian individuals. The conflict and sanctions have had a negative impact on the Russian economy, on the Russian currency, and on investments having exposure to Russia, Belarus and Ukraine. The conflict could also have a significant effect on investments outside the region. The duration and extent of the military conflict with Russia and the related sanctions cannot be predicted at this time.
LIBOR Transition Risk
Certain instruments held by the Portfolio may pay an interest rate based on the London Interbank Offered Rate (“LIBOR”), which is the average offered rate for various maturities of short-term loans between certain major international banks. LIBOR is used throughout global banking and financial industries to determine interest rates for a variety of financial instruments (such as debt instruments and derivatives) and borrowing arrangements. The ICE Benchmark Administration Limited, the administrator of LIBOR, ceased publishing certain LIBOR settings on December 31, 2021, and is expected to cease publishing the remaining LIBOR settings on June 30, 2023. Although the transition process away from LIBOR has become increasingly well-defined, the impact on certain debt securities, derivatives and other financial instruments that utilize LIBOR remains uncertain. The phase-out of LIBOR may result in, among other things, increased volatility or illiquidity in markets for instruments based on LIBOR and changes in the value of such instruments.
Pandemic Risk
An outbreak of respiratory disease caused by a novel coronavirus was first detected in China in late 2019 and subsequently spread internationally. This coronavirus has resulted in closing borders, enhanced health screenings, changes to healthcare service preparation and delivery, quarantines, cancellations, disruptions to supply chains and customer activity, as well as general concern and uncertainty. Health crises caused by outbreaks of disease, such as the coronavirus outbreak, may exacerbate other pre-existing political, social and economic risks and disrupt normal market conditions and operations. The impact of this outbreak has negatively affected the worldwide economy, as well as the economies of individual countries and industries, and could continue to affect the market in significant and unforeseen ways. Other epidemics and pandemics that may arise in the future may have similar effects. Any such impact could adversely affect the Portfolio’s performance, or the performance of the securities in which the Portfolio invests.
International Income Portfolio
October 31, 2022
Report of Independent Registered Public Accounting Firm
To the Trustees and Investors of International Income Portfolio:
Opinion on the Financial Statements and Financial Highlights
We have audited the accompanying statement of assets and liabilities of International Income Portfolio (the “Portfolio”), including the portfolio of investments, as of October 31, 2022, the related statement of operations for the year then ended, the statements of changes in net assets for each of the two years in the period then ended, the financial highlights for each of the five years in the period then ended, and the related notes. In our opinion, the financial statements and financial highlights present fairly, in all material respects, the financial position of the Portfolio as of October 31, 2022, and the results of its operations for the year then ended, the changes in its net assets for each of the two years in the period then ended, and the financial highlights for each of the five years in the period then ended, in conformity with accounting principles generally accepted in the United States of America.
Basis for Opinion
These financial statements and financial highlights are the responsibility of the Portfolio’s management. Our responsibility is to express an opinion on the Portfolio’s financial statements and financial highlights based on our audits. We are a public accounting firm registered with the Public Company Accounting Oversight Board (United States) (PCAOB) and are required to be independent with respect to the Portfolio in accordance with the U.S. federal securities laws and the applicable rules and regulations of the Securities and Exchange Commission and the PCAOB.
We conducted our audits in accordance with the standards of the PCAOB. Those standards require that we plan and perform the audit to obtain reasonable assurance about whether the financial statements and financial highlights are free of material misstatement, whether due to error or fraud. The Portfolio is not required to have, nor were we engaged to perform, an audit of its internal control over financial reporting. As part of our audits, we are required to obtain an understanding of internal control over financial reporting but not for the purpose of expressing an opinion on the effectiveness of the Portfolio’s internal control over financial reporting. Accordingly, we express no such opinion.
Our audits included performing procedures to assess the risks of material misstatement of the financial statements and financial highlights, whether due to error or fraud, and performing procedures that respond to those risks. Such procedures included examining, on a test basis, evidence regarding the amounts and disclosures in the financial statements and financial highlights. Our audits also included evaluating the accounting principles used and significant estimates made by management, as well as evaluating the overall presentation of the financial statements and financial highlights. Our procedures included confirmation of securities owned as of October 31, 2022, by correspondence with the custodian and brokers; when replies were not received from brokers, we performed other auditing procedures. We believe that our audits provide a reasonable basis for our opinion.
/s/ Deloitte & Touche LLP
Boston, Massachusetts
December 28, 2022
We have served as the auditor of one or more Eaton Vance investment companies since 1959.
Eaton Vance
Global Bond Fund
October 31, 2022
Board of Trustees’ Contract Approval
Overview of the Contract Review Process
The Investment Company Act of 1940, as amended (the “1940 Act”), provides, in substance, that the investment advisory agreement between a fund and its investment adviser will continue in effect from year-to-year only if its continuation is approved on an annual basis by a vote of the fund’s board of trustees, including a majority of the trustees who are not “interested persons” of the fund (“independent trustees”), cast in person at a meeting called for the purpose of considering such approval.
At a meeting held on June 8, 2022, the Boards of Trustees/Directors (collectively, the “Board”) that oversee the registered investment companies advised by Eaton Vance Management or its affiliate, Boston Management and Research (the “Eaton Vance Funds”), including a majority of the independent trustees (the “Independent Trustees”), voted to approve the continuation of existing investment advisory agreements and sub-advisory agreements1 for each of the Eaton Vance Funds for an additional one-year period. The Board relied upon the affirmative recommendation of its Contract Review Committee, which is a committee exclusively comprised of Independent Trustees. Prior to making its recommendation, the Contract Review Committee reviewed information furnished by the adviser and sub-adviser to each of the Eaton Vance Funds (including information specifically requested by the Board) for a series of formal meetings held between April and June 2022. Members of the Contract Review Committee also considered information received at prior meetings of the Board and its committees, to the extent such information was relevant to the Contract Review Committee’s annual evaluation of the investment advisory agreements and sub-advisory agreements.
In connection with its evaluation of the investment advisory agreements and sub-advisory agreements, the Board considered various information relating to the Eaton Vance Funds. This included information applicable to all or groups of Eaton Vance Funds, which is referenced immediately below, and information applicable to the particular Eaton Vance Fund covered by this report (additional fund-specific information is referenced below under “Results of the Contract Review Process”). (For funds that invest through one or more underlying portfolios, references to “each fund” in this section may include information that was considered at the portfolio-level.)
Information about Fees, Performance and Expenses
| | • | | A report from an independent data provider comparing advisory and other fees paid by each fund to such fees paid by comparable funds, as identified by the independent data provider (“comparable funds”); |
| | • | | A report from an independent data provider comparing each fund’s total expense ratio (and its components) to those of comparable funds; |
| | • | | A report from an independent data provider comparing the investment performance of each fund (including, as relevant, total return data, income data, Sharpe ratios and information ratios) to the investment performance of comparable funds and, as applicable, benchmark indices, over various time periods; |
| | • | | In certain instances, data regarding investment performance relative to customized groups of peer funds and blended indices identified by the adviser in consultation with the Portfolio Management Committee of the Board (a committee exclusively comprised of Independent Trustees); |
| | • | | Comparative information concerning the fees charged and services provided by the adviser and sub-adviser to each fund in managing other accounts (which may include other mutual funds, collective investment funds and institutional accounts) using investment strategies and techniques similar to those used in managing such fund(s), if any; |
| | • | | Profitability analyses with respect to the adviser and sub-adviser to each of the funds; |
Information about Portfolio Management and Trading
| | • | | Descriptions of the investment management services provided to each fund, as well as each of the funds’ investment strategies and policies; |
| | • | | The procedures and processes used to determine the value of fund assets, including, when necessary, the determination of “fair value” and actions taken to monitor and test the effectiveness of such procedures and processes; |
| | • | | Information about the policies and practices of each fund’s adviser and sub-adviser with respect to trading, including their processes for seeking best execution of portfolio transactions; |
| | • | | Information about the allocation of brokerage transactions and the benefits, if any, received by the adviser and sub-adviser to each fund as a result of brokerage allocation, including, as applicable, information concerning the acquisition of research through client commission arrangements and policies with respect to “soft dollars”; |
| | • | | Data relating to the portfolio turnover rate of each fund and related information regarding active management in the context of particular strategies; |
| 1 | Not all Eaton Vance Funds have entered into a sub-advisory agreement with a sub-adviser. Accordingly, references to “sub-adviser” or “sub-advisory agreement” in this “Overview” section may not be applicable to the particular Eaton Vance Fund covered by this report. Following the “Overview” section, further information regarding the Board’s evaluation of a fund’s contractual arrangements is included under the “Results of the Contract Review Process” section. |
Eaton Vance
Global Bond Fund
October 31, 2022
Board of Trustees’ Contract Approval — continued
Information about each Adviser and Sub-adviser
| | • | | Reports detailing the financial results and condition of the adviser and sub-adviser to each fund; |
| | • | | Information regarding the individual investment professionals whose responsibilities include portfolio management and investment research for the funds, and, for portfolio managers and certain other investment professionals, information relating to their responsibilities with respect to managing other mutual funds and investment accounts, as applicable; |
| | • | | Information regarding the adviser’s and its parent company’s (Morgan Stanley’s) efforts to retain and attract talented investment professionals, including in the context of a particularly competitive marketplace for talent, as well as the ongoing unique environment presented by hybrid, remote and other alternative work arrangements; |
| | • | | The Code of Ethics of the adviser and its affiliates and the sub-adviser of each fund, together with information relating to compliance with, and the administration of, such codes; |
| | • | | Policies and procedures relating to proxy voting, including regular reporting with respect to fund proxy voting activities; |
| | • | | Information regarding the handling of corporate actions and class actions, as well as information regarding litigation and other regulatory matters; |
| | • | | Information concerning the resources devoted to compliance efforts undertaken by the adviser and its affiliates and the sub-adviser of each fund, if any, including descriptions of their various compliance programs and their record of compliance; |
| | • | | Information concerning the business continuity and disaster recovery plans of the adviser and its affiliates and the sub-adviser of each fund, if any; |
| | • | | A description of Eaton Vance Management’s and Boston Management and Research’s oversight of sub-advisers, including with respect to regulatory and compliance issues, investment management and other matters; |
Other Relevant Information
| | • | | Information regarding ongoing initiatives to further integrate and harmonize, where applicable, the investment management and other departments of the adviser and its affiliates with the overall investment management infrastructure of Morgan Stanley, in light of Morgan Stanley’s acquisition of Eaton Vance on March 1, 2021; |
| | • | | Information concerning the nature, cost and character of the administrative and other non-investment advisory services provided by Eaton Vance Management and its affiliates; |
| | • | | Information concerning oversight of the relationship with the custodian, subcustodians, fund accountants, and other third-party service providers by the adviser and/or administrator to each of the funds; |
| | • | | Information concerning efforts to implement policies and procedures with respect to various new regulations applicable to the funds, including Rule 12d1-4 (the Fund-of-Funds Rule), Rule 18f-4 (the Derivatives Rule) and Rule 2a-5 (the Fair Valuation Rule); |
| | • | | For an Eaton Vance Fund structured as an exchange-listed closed-end fund, information concerning the benefits of the closed-end fund structure, as well as, where relevant, the closed-end fund’s market prices (including as compared to the closed-end fund’s net asset value (NAV)), trading volume data, continued use of auction preferred shares (where applicable), distribution rates and other relevant matters; |
| | • | | The risks which the adviser and/or its affiliates incur in connection with the management and operation of the funds, including, among others, litigation, regulatory, entrepreneurial, and other business risks (and the associated costs of such risks); and |
| | • | | The terms of each investment advisory agreement and sub-advisory agreement. |
During the various meetings of the Board and its committees over the course of the year leading up to the June 8, 2022 meeting, the Trustees received information from portfolio managers and other investment professionals of the advisers and sub-advisers of the funds regarding investment and performance matters, and considered various investment and trading strategies used in pursuing the funds’ investment objectives. The Trustees also received information regarding risk management techniques employed in connection with the management of the funds. The Board and its committees evaluated issues pertaining to industry and regulatory developments, compliance procedures, fund governance and other issues with respect to the funds, and received and participated in reports and presentations provided by Eaton Vance Management, Boston Management and Research and fund sub-advisers, with respect to such matters. In addition to the formal meetings of the Board and its committees, the Independent Trustees held regular teleconferences to discuss, among other topics, matters relating to the continuation of investment advisory agreements and sub-advisory agreements.
The Contract Review Committee was advised throughout the contract review process by Goodwin Procter LLP, independent legal counsel for the Independent Trustees. The members of the Contract Review Committee, with the advice of such counsel, exercised their own business judgment in determining the material factors to be considered in evaluating each investment advisory agreement and sub-advisory agreement and the weight to be given to each such factor. The conclusions reached with respect to each investment advisory agreement and sub-advisory agreement were based on a comprehensive evaluation of all the information provided and not any single factor. Moreover, each member of the Contract Review Committee may have placed varying emphasis on particular factors in reaching conclusions with respect to each investment advisory agreement and sub-advisory agreement. In evaluating each investment advisory agreement and sub-advisory agreement, including the fee structures and other terms contained in such agreements, the members of the Contract Review Committee were also informed by multiple years of analysis and discussion with the adviser and sub-adviser to each of the Eaton Vance Funds.
Eaton Vance
Global Bond Fund
October 31, 2022
Board of Trustees’ Contract Approval — continued
Results of the Contract Review Process
Based on its consideration of the foregoing, and such other information it deemed relevant, including the factors and conclusions described below, the Contract Review Committee concluded that the continuation of the investment advisory agreement between Eaton Vance Global Bond Fund (the “Fund”) and Eaton Vance Management (“EVM”), as well as the investment advisory agreement between International Income Portfolio (the “Portfolio”), the portfolio in which the Fund invests, and Boston Management and Research (“BMR”) (EVM, with respect to the Fund, and BMR, with respect to the Portfolio, are each referred to herein as the “Adviser”), including their respective fee structures, are in the interests of shareholders and, therefore, recommended to the Board approval of each agreement. Based on the recommendation of the Contract Review Committee, the Board, including a majority of the Independent Trustees, voted to approve continuation of the investment advisory agreements for the Fund and the Portfolio.
Nature, Extent and Quality of Services
In considering whether to approve the investment advisory agreements for the Fund and the Portfolio, the Board evaluated the nature, extent and quality of services provided to the Fund and the Portfolio by the applicable Adviser.
The Board considered each Adviser’s management capabilities and investment processes in light of the types of investments held by the Fund and the Portfolio, including the education, experience and number of investment professionals and other personnel who provide portfolio management, investment research, and similar services to the Fund and the Portfolio, including recent changes to such personnel. The Board considered the abilities and experience of each Adviser’s investment professionals in analyzing factors relevant to investment in a broad range of income securities. The Board also considered each Adviser’s expertise with respect to global markets and in-house research capabilities. The Board also took into account the resources dedicated to portfolio management and other services, the compensation methods of each Adviser and other factors, including the reputation and resources of the Adviser to recruit and retain highly qualified research, advisory and supervisory investment professionals. In addition, the Board considered the time and attention devoted to the Eaton Vance Funds, including the Fund and the Portfolio, by senior management, as well as the infrastructure, operational capabilities and support staff in place to assist in the portfolio management and operations of the Fund and the Portfolio, including the provision of administrative services. The Board also considered the business-related and other risks to which each Adviser or its affiliates may be subject in managing the Fund and the Portfolio.
The Board noted that under the terms of the investment advisory agreement of the Fund, EVM may invest assets of the Fund directly in securities, for which it would receive a fee, or in the Portfolio, for which it receives no separate fee but for which BMR receives an advisory fee from the Portfolio.
The Board considered the compliance programs of each Adviser and relevant affiliates thereof. The Board considered compliance and reporting matters regarding, among other things, personal trading by investment professionals, disclosure of portfolio holdings, late trading, frequent trading, portfolio valuation, business continuity and the allocation of investment opportunities. The Board also considered the responses of each Adviser and its affiliates to requests in recent years from regulatory authorities, such as the Securities and Exchange Commission and the Financial Industry Regulatory Authority.
The Board considered other administrative services provided or overseen by Eaton Vance Management and its affiliates, including transfer agency and accounting services. The Board evaluated the benefits to shareholders of investing in a fund that is a part of a large fund complex offering exposure to a variety of asset classes and investment disciplines, as well as the ability, in many cases, to exchange an investment among different funds without incurring additional sales charges.
After consideration of the foregoing factors, among others, the Board concluded that the nature, extent and quality of services provided by each Adviser, taken as a whole, are appropriate and consistent with the terms of the applicable investment advisory agreement.
Fund Performance
The Board noted that, effective October 16, 2019, the Fund changed its name and investment strategies to allow the Fund, under normal market conditions, to invest at least 80% of its net assets (plus the amount of any borrowings for investment purposes) in bonds. The Board also noted that the Fund normally invests at least 40% of its net assets in foreign investments. Although the Board considered information comparing the Fund’s investment performance to that of comparable funds identified by an independent data provider (the peer group), as well as appropriate benchmark indices and a custom peer group of similarly managed funds, the Board determined, in light of the recent changes to the Fund, to continue to monitor and evaluate the effectiveness of such changes over time.
Management Fees and Expenses
The Board considered contractual fee rates payable by the Portfolio and by the Fund for advisory and administrative services (referred to collectively as “management fees”). As part of its review, the Board considered the Fund’s management fees and total expense ratio for the one-year period ended December 31, 2021, as compared to those of comparable funds, before and after giving effect to any undertaking to waive fees or reimburse expenses. The Board also considered factors that had an impact on the Fund’s total expense ratio relative to comparable funds.
Eaton Vance
Global Bond Fund
October 31, 2022
Board of Trustees’ Contract Approval — continued
After considering the foregoing information, and in light of the nature, extent and quality of the services provided by each Adviser, the Board concluded that the management fees charged for advisory and related services are reasonable.
Profitability and “Fall-Out” Benefits
The Board considered the level of profits realized by each Adviser and relevant affiliates thereof in providing investment advisory and administrative services to the Fund, to the Portfolio and to all Eaton Vance Funds as a group. The Board considered the level of profits realized without regard to marketing support or other payments by each Adviser and its affiliates to third parties in respect of distribution or other services.
The Board concluded that, in light of the foregoing factors and the nature, extent and quality of the services rendered, the profits realized by each Adviser and its affiliates are deemed not to be excessive.
The Board also considered direct or indirect fall-out benefits received by each Adviser and its affiliates in connection with their respective relationships with the Fund and the Portfolio, including the benefits of research services that may be available to each Adviser as a result of securities transactions effected for the Fund and the Portfolio and other investment advisory clients.
Economies of Scale
In reviewing management fees and profitability, the Board also considered the extent to which the applicable Adviser and its affiliates, on the one hand, and the Fund and the Portfolio, on the other hand, can expect to realize benefits from economies of scale as the assets of the Fund and the Portfolio increase. The Board acknowledged the difficulty in accurately measuring the benefits resulting from economies of scale, if any, with respect to the management of any specific fund or group of funds. The Board reviewed data summarizing the increases and decreases in the assets of the Fund and of all Eaton Vance Funds as a group over various time periods, and evaluated the extent to which the total expense ratio of the Fund and the profitability of each Adviser and its affiliates may have been affected by such increases or decreases. Based upon the foregoing, the Board concluded that the Fund currently shares in the benefits from economies of scale, if any, when they are realized by the Adviser. The Board also concluded that the structure of the advisory fees, which include breakpoints at several asset levels, will allow the Fund and the Portfolio to continue to benefit from any economies of scale in the future.
Eaton Vance
Global Bond Fund
October 31, 2022
Liquidity Risk Management Program
The Fund has implemented a written liquidity risk management program (Program) and related procedures to manage its liquidity in accordance with Rule 22e-4 under the Investment Company Act of 1940, as amended (Liquidity Rule). The Liquidity Rule defines “liquidity risk” as the risk that a fund could not meet requests to redeem shares issued by the fund without significant dilution of the remaining investors’ interests in the fund. The Fund’s Board of Trustees/Directors has designated the investment adviser to serve as the administrator of the Program and the related procedures. The administrator has established a Liquidity Risk Management Oversight Committee (Committee) to perform the functions necessary to administer the Program. As part of the Program, the administrator is responsible for identifying illiquid investments and categorizing the relative liquidity of the Fund’s investments in accordance with the Liquidity Rule. Under the Program, the administrator assesses, manages, and periodically reviews the Fund’s liquidity risk, and is responsible for making certain reports to the Fund’s Board of Trustees/Directors and the Securities and Exchange Commission (SEC) regarding the liquidity of the Fund’s investments, and to notify the Board of Trustees/Directors and the SEC of certain liquidity events specified in the Liquidity Rule. The liquidity of the Fund’s portfolio investments is determined based on a number of factors including, but not limited to, relevant market, trading and investment-specific considerations under the Program.
At a meeting of the Fund’s Board of Trustees/Directors on June 7, 2022, the Committee provided a written report to the Fund’s Board of Trustees/Directors pertaining to the operation, adequacy, and effectiveness of implementation of the Program, as well as the operation of the highly liquid investment minimum (if applicable) for the period January 1, 2021 through December 31, 2021 (Review Period). The Program operated effectively during the Review Period, supporting the administrator’s ability to assess, manage and monitor Fund liquidity risk, including during periods of market volatility and net redemptions. During the Review Period, the Fund met redemption requests on a timely basis.
There can be no assurance that the Program will achieve its objectives in the future. Please refer to the Fund’s prospectus for more information regarding the Fund’s exposure to liquidity risk and other principal risks to which an investment in the Fund may be subject.
Eaton Vance
Global Bond Fund
October 31, 2022
Management and Organization
Fund Management. The Trustees of Eaton Vance Mutual Funds Trust (the Trust) and International Income Portfolio (the Portfolio) are responsible for the overall management and supervision of the Trust’s and the Portfolio’s affairs. The Board members and officers of the Trust and the Portfolio are listed below. Except as indicated, each individual has held the office shown or other offices in the same company for the last five years. Board members hold indefinite terms of office. Each Trustee holds office until his or her successor is elected and qualified, subject to a prior death, resignation, retirement, disqualification or removal. Under the terms of the Fund’s and the Portfolio’s current Trustee retirement policy, an Independent Trustee must retire and resign as a Trustee on the earlier of: (i) the first day of July following his or her 74th birthday; or (ii), with limited exception, December 31st of the 20th year in which he or she has served as a Trustee. However, if such retirement and resignation would cause the Fund and the Portfolio to be out of compliance with Section 16 of the 1940 Act or any other regulations or guidance of the SEC, then such retirement and resignation will not become effective until such time as action has been taken for the Fund and the Portfolio to be in compliance therewith. The “noninterested Trustees” consist of those Trustees who are not “interested persons” of the Trust/Portfolio, as that term is defined under the 1940 Act. The business address of each Board member and officer is Two International Place, Boston, Massachusetts 02110. As used below, “BMR” refers to Boston Management and Research, “EVC” refers to Eaton Vance Corp., “EV” refers to EV LLC, “EVM” refers to Eaton Vance Management and “EVD” refers to Eaton Vance Distributors, Inc. EV is the trustee of each of EVM and BMR. Effective March 1, 2021, each of EVM, BMR, EVD and EV are indirect, wholly owned subsidiaries of Morgan Stanley. Each officer affiliated with EVM may hold a position with other EVM affiliates that is comparable to his or her position with EVM listed below. Each Trustee oversees 135 funds (with the exception of Mr. Bowser who oversees 110 funds) in the Eaton Vance fund complex (including both funds and portfolios in a hub and spoke structure).
| | | | | | |
| Name and Year of Birth | | Trust/Portfolio
Position(s) | | Length of Service | | Principal Occupation(s) and Other Directorships During Past Five Years and Other Relevant Experience |
|
| Interested Trustee |
| | | |
| Thomas E. Faust Jr. 1958 | | Trustee | | Since 2007 | | Chairman of Morgan Stanley Investment Management, Inc. (MSIM), member of the Board of Managers and President of EV (since 2021), Chief Executive Officer of EVM and BMR. Formerly, Chairman, Chief Executive Officer (2007-2021) and President (2006-2021) of EVC and Director of EVD (2007-2022). Mr. Faust is an interested person because of his positions with MSIM, BMR, EVM and EV, which are affiliates of the Trust and the Portfolio. Other Directorships. Formerly, Director of EVC (2007-2021) and Hexavest Inc. (investment management firm) (2012-2021). |
|
| Noninterested Trustees |
| | | |
Alan C. Bowser(1) 1962 | | Trustee | | Since 2022 | | Chief Diversity Officer, Partner and a member of the Operating Committee, and formerly served as Senior Advisor on Diversity and Inclusion for the firm’s chief executive officer, Co-Head of the Americas Region, and Senior Client Advisor of Bridgewater Associates, an asset management firm (2011- present). Other Directorships. None. |
| | | |
Mark R. Fetting 1954 | | Trustee | | Since 2016 | | Private investor. Formerly held various positions at Legg Mason, Inc. (investment management firm) (2000-2012), including President, Chief Executive Officer, Director and Chairman (2008-2012), Senior Executive Vice President (2004-2008) and Executive Vice President (2001-2004). Formerly, President of Legg Mason family of funds (2001-2008). Formerly, Division President and Senior Officer of Prudential Financial Group, Inc. and related companies (investment management firm) (1991-2000). Other Directorships. None. |
| | | |
Cynthia E. Frost 1961 | | Trustee | | Since 2014 | | Private investor. Formerly, Chief Investment Officer of Brown University (university endowment) (2000-2012). Formerly, Portfolio Strategist for Duke Management Company (university endowment manager) (1995-2000). Formerly, Managing Director, Cambridge Associates (investment consulting company) (1989-1995). Formerly, Consultant, Bain and Company (management consulting firm) (1987-1989). Formerly, Senior Equity Analyst, BA Investment Management Company (1983-1985). Other Directorships None. |
| | | |
George J. Gorman 1952 | | Chairperson of the Board and Trustee | | Since 2021 (Chairperson) and 2014 (Trustee) | | Principal at George J. Gorman LLC (consulting firm). Formerly, Senior Partner at Ernst & Young LLP (a registered public accounting firm) (1974-2009). Other Directorships. None. |
Eaton Vance
Global Bond Fund
October 31, 2022
Management and Organization — continued
| | | | | | |
| Name and Year of Birth | | Trust/Portfolio
Position(s) | | Length of Service | | Principal Occupation(s) and Other Directorships During Past Five Years and Other Relevant Experience |
|
| Noninterested Trustees (continued) |
| | | |
Valerie A. Mosley 1960 | | Trustee | | Since 2014 | | Chairwoman and Chief Executive Officer of Valmo Ventures (a consulting and investment firm). Founder of Upward Wealth, Inc., dba BrightUp, a fintech platform. Formerly, Partner and Senior Vice President, Portfolio Manager and Investment Strategist at Wellington Management Company, LLP (investment management firm) (1992-2012). Formerly, Chief Investment Officer, PG Corbin Asset Management (1990-1992). Formerly worked in institutional corporate bond sales at Kidder Peabody (1986-1990). Other Directorships. Director of DraftKings, Inc. (digital sports entertainment and gaming company) (since September 2020). Director of Envestnet, Inc. (provider of intelligent systems for wealth management and financial wellness) (since 2018). Formerly, Director of Dynex Capital, Inc. (mortgage REIT) (2013-2020) and Director of Groupon, Inc. (e-commerce provider) (2020-2022). |
| | | |
Keith Quinton 1958 | | Trustee | | Since 2018 | | Private investor, researcher and lecturer. Formerly, Independent Investment Committee Member at New Hampshire Retirement System (2017-2021). Formerly, Portfolio Manager and Senior Quantitative Analyst at Fidelity Investments (investment management firm) (2001-2014). Other Directorships. Formerly, Director (2016-2021) and Chairman (2019-2021) of New Hampshire Municipal Bond Bank. |
| | | |
Marcus L. Smith 1966 | | Trustee | | Since 2018 | | Private investor and independent corporate director. Formerly, Chief Investment Officer, Canada (2012-2017), Chief Investment Officer, Asia (2010-2012), Director of Asian Research (2004-2010) and portfolio manager (2001-2017) at MFS Investment Management (investment management firm). Other Directorships. Director of First Industrial Realty Trust, Inc. (an industrial REIT) (since 2021). Director of MSCI Inc. (global provider of investment decision support tools) (since 2017). Formerly, Director of DCT Industrial Trust Inc. (logistics real estate company) (2017-2018). |
| | | |
Susan J. Sutherland 1957 | | Trustee | | Since 2015 | | Private investor. Director of Ascot Group Limited and certain of its subsidiaries (insurance and reinsurance) (since 2017). Formerly, Director of Hagerty Holding Corp. (insurance) (2015-2018) and Montpelier Re Holdings Ltd. (insurance and reinsurance) (2013-2015). Formerly, Associate, Counsel and Partner at Skadden, Arps, Slate, Meagher & Flom LLP (law firm) (1982-2013). Other Directorships. Director of Kairos Acquisition Corp. (insurance/InsurTech acquisition company) (since 2021). |
| | | |
| Scott E. Wennerholm 1959 | | Trustee | | Since 2016 | | Private investor. Formerly, Trustee at Wheelock College (postsecondary institution) (2012-2018). Formerly, Consultant at GF Parish Group (executive recruiting firm) (2016-2017). Formerly, Chief Operating Officer and Executive Vice President at BNY Mellon Asset Management (investment management firm) (2005-2011). Formerly, Chief Operating Officer and Chief Financial Officer at Natixis Global Asset Management (investment management firm) (1997-2004). Formerly, Vice President at Fidelity Investments Institutional Services (investment management firm) (1994-1997). Other Directorships. None. |
| | | |
Nancy A. Wiser(1) 1967 | | Trustee | | Since 2022 | | Formerly, Executive Vice President and the Global Head of Operations at Wells Fargo Asset Management (2011-2021). Other Directorships. None. |
| | | | | | |
| Name and Year of Birth | | Trust/Portfolio
Position(s) | | Length of Service | | Principal Occupation(s) During Past Five Years |
|
| Principal Officers who are not Trustees |
| | | |
Eric A. Stein 1980 | | President | | Since 2020 | | Vice President and Chief Investment Officer, Fixed Income of EVM and BMR. Prior to November 1, 2020, Mr. Stein was a co-Director of Eaton Vance’s Global Income Investments. Also Vice President of Calvert Research and Management (“CRM”). |
| | | |
Deidre E. Walsh 1971 | | Vice President and Chief Legal Officer | | Since 2009 | | Vice President of EVM and BMR. Also Vice President of CRM. |
Eaton Vance
Global Bond Fund
October 31, 2022
Management and Organization — continued
| | | | | | |
| Name and Year of Birth | | Trust/Portfolio
Position(s) | | Length of Service | | Principal Occupation(s) During Past Five Years |
|
| Principal Officers who are not Trustees (continued) |
| | | |
James F. Kirchner 1967 | | Treasurer | | Since 2007 | | Vice President of EVM and BMR. Also Vice President of CRM. |
| | | |
Nicholas Di Lorenzo 1987 | | Secretary | | Since 2022 | | Formerly, associate (2012-2021) and counsel (2022) at Dechert LLP. |
| | | |
Richard F. Froio 1968 | | Chief Compliance Officer | | Since 2017 | | Vice President of EVM and BMR since 2017. Formerly, Deputy Chief Compliance Officer (Adviser/Funds) and Chief Compliance Officer (Distribution) at PIMCO (2012-2017) and Managing Director at BlackRock/Barclays Global Investors (2009-2012). |
| (1) | Mr. Bowser and Ms. Wiser began serving as Trustees effective April 4, 2022. |
The SAI for the Fund includes additional information about the Trustees and officers of the Fund and the Portfolio and can be obtained without charge on Eaton Vance’s website at www.eatonvance.com or by calling 1-800-262-1122.
Eaton Vance Funds
| | |
| Privacy Notice | | April 2021 |
| | |
| |
| FACTS | | WHAT DOES EATON VANCE DO WITH YOUR PERSONAL INFORMATION? |
| | | |
| |
| | |
| Why? | | Financial companies choose how they share your personal information. Federal law gives consumers the right to limit some but not all sharing. Federal law also requires us to tell you how we collect, share, and protect your personal information. Please read this notice carefully to understand what we do. |
| | |
| | | |
| What? | | The types of personal information we collect and share depend on the product or service you have with us. This information can include: ∎ Social Security number and income ∎ investment experience and risk tolerance ∎ checking account number and wire transfer instructions |
| | |
| | | |
| How? | | All financial companies need to share customers’ personal information to run their everyday business. In the section below, we list the reasons financial companies can share their customers’ personal information; the reasons Eaton Vance chooses to share; and whether you can limit this sharing. |
| | | | |
Reasons we can share your personal information | | Does Eaton Vance share? | | Can you limit this sharing? |
| For our everyday business purposes — such as to process your transactions, maintain your account(s), respond to court orders and legal investigations, or report to credit bureaus | | Yes | | No |
| For our marketing purposes — to offer our products and services to you | | Yes | | No |
| For joint marketing with other financial companies | | No | | We don’t share |
| For our investment management affiliates’ everyday business purposes — information about your transactions, experiences, and creditworthiness | | Yes | | Yes |
| For our affiliates’ everyday business purposes — information about your transactions and experiences | | Yes | | No |
| For our affiliates’ everyday business purposes — information about your creditworthiness | | No | | We don’t share |
| For our investment management affiliates to market to you | | Yes | | Yes |
| For our affiliates to market to you | | No | | We don’t share |
| For nonaffiliates to market to you | | No | | We don’t share |
| | |
| To limit our sharing | | Call toll-free 1-800-262-1122 or email: EVPrivacy@eatonvance.com Please note: If you are a new customer, we can begin sharing your information 30 days from the date we sent this notice. When you are no longer our customer, we continue to share your information as described in this notice. However, you can contact us at any time to limit our sharing. |
| | |
| | | |
| | |
| Questions? | | Call toll-free 1-800-262-1122 or email: EVPrivacy@eatonvance.com |
| | |
| | | |
Eaton Vance Funds
| | |
| Privacy Notice — continued | | April 2021 |
| | |
| Who we are |
| Who is providing this notice? | | Eaton Vance Management, Eaton Vance Distributors, Inc., Eaton Vance Trust Company, Eaton Vance Management (International) Limited, Eaton Vance Advisers International Ltd., Eaton Vance Global Advisors Limited, Eaton Vance Management’s Real Estate Investment Group, Boston Management and Research, Calvert Research and Management, Eaton Vance and Calvert Fund Families and our investment advisory affiliates (“Eaton Vance”) (see Investment Management Affiliates definition below) |
| What we do |
| How does Eaton Vance protect my personal information? | | To protect your personal information from unauthorized access and use, we use security measures that comply with federal law. These measures include computer safeguards and secured files and buildings. We have policies governing the proper handling of customer information by personnel and requiring third parties that provide support to adhere to appropriate security standards with respect to such information. |
| How does Eaton Vance collect my personal information? | | We collect your personal information, for example, when you ∎ open an account or make deposits or withdrawals from your account ∎ buy securities from us or make a wire transfer ∎ give us your contact information We also collect your personal information from others, such as credit bureaus, affiliates, or other companies. |
| Why can’t I limit all sharing? | | Federal law gives you the right to limit only ∎ sharing for affiliates’ everyday business purposes — information about your creditworthiness ∎ affiliates from using your information to market to you ∎ sharing for nonaffiliates to market to you State laws and individual companies may give you additional rights to limit sharing. See below for more on your rights under state law. |
| Definitions |
| Investment Management Affiliates | | Eaton Vance Investment Management Affiliates include registered investment advisers, registered broker- dealers, and registered and unregistered funds. Investment Management Affiliates does not include entities associated with Morgan Stanley Wealth Management, such as Morgan Stanley Smith Barney LLC and Morgan Stanley & Co. |
| Affiliates | | Companies related by common ownership or control. They can be financial and nonfinancial companies. ∎ Our affiliates include companies with a Morgan Stanley name and financial companies such as Morgan Stanley Smith Barney LLC and Morgan Stanley & Co. |
| Nonaffiliates | | Companies not related by common ownership or control. They can be financial and nonfinancial companies. ∎ Eaton Vance does not share with nonaffiliates so they can market to you. |
| Joint marketing | | A formal agreement between nonaffiliated financial companies that together market financial products or services to you. ∎ Eaton Vance doesn’t jointly market. |
| Other important information |
Vermont: Except as permitted by law, we will not share personal information we collect about Vermont residents with Nonaffiliates unless you provide us with your written consent to share such information. California: Except as permitted by law, we will not share personal information we collect about California residents with Nonaffiliates and we will limit sharing such personal information with our Affiliates to comply with California privacy laws that apply to us. |
Eaton Vance Funds
IMPORTANT NOTICES
Delivery of Shareholder Documents. The Securities and Exchange Commission (SEC) permits funds to deliver only one copy of shareholder documents, including prospectuses, proxy statements and shareholder reports, to fund investors with multiple accounts at the same residential or post office box address. This practice is often called “householding” and it helps eliminate duplicate mailings to shareholders. Eaton Vance, or your financial intermediary, may household the mailing of your documents indefinitely unless you instruct Eaton Vance, or your financial intermediary, otherwise. If you would prefer that your Eaton Vance documents not be householded, please contact Eaton Vance at 1-800-262-1122, or contact your financial intermediary. Your instructions that householding not apply to delivery of your Eaton Vance documents will typically be effective within 30 days of receipt by Eaton Vance or your financial intermediary.
Portfolio Holdings. Each Eaton Vance Fund and its underlying Portfolio(s) (if applicable) files a schedule of portfolio holdings on Part F to Form N-PORT with the SEC. Certain information filed on Form N-PORT may be viewed on the Eaton Vance website at www.eatonvance.com, by calling Eaton Vance at 1-800-262-1122 or in the EDGAR database on the SEC’s website at www.sec.gov.
Proxy Voting. From time to time, funds are required to vote proxies related to the securities held by the funds. The Eaton Vance Funds or their underlying Portfolios (if applicable) vote proxies according to a set of policies and procedures approved by the Funds’ and Portfolios’ Boards. You may obtain a description of these policies and procedures and information on how the Funds or Portfolios voted proxies relating to portfolio securities during the most recent 12-month period ended June 30, without charge, upon request, by calling 1-800-262-1122 and by accessing the SEC’s website at www.sec.gov.
This Page Intentionally Left Blank
Investment Adviser of International Income Portfolio
Boston Management and Research
Two International Place
Boston, MA 02110
Investment Adviser and Administrator of Eaton Vance Global Bond Fund
Eaton Vance Management
Two International Place
Boston, MA 02110
Principal Underwriter*
Eaton Vance Distributors, Inc.
Two International Place
Boston, MA 02110
(617) 482-8260
Custodian
State Street Bank and Trust Company
State Street Financial Center, One Lincoln Street
Boston, MA 02111
Transfer Agent
BNY Mellon Investment Servicing (US) Inc.
Attn: Eaton Vance Funds
P.O. Box 9653
Providence, RI 02940-9653
(800) 262-1122
Independent Registered Public Accounting Firm
Deloitte & Touche LLP
200 Berkeley Street
Boston, MA 02116-5022
Fund Offices
Two International Place
Boston, MA 02110
| * | FINRA BrokerCheck. Investors may check the background of their Investment Professional by contacting the Financial Industry Regulatory Authority (FINRA). FINRA BrokerCheck is a free tool to help investors check the professional background of current and former FINRA-registered securities firms and brokers. FINRA BrokerCheck is available by calling 1-800-289-9999 and at www.FINRA.org. The FINRA BrokerCheck brochure describing this program is available to investors at www.FINRA.org. |
3042 10.31.22

Eaton Vance
Short Duration Government Income Fund
Annual Report
October 31, 2022

Commodity Futures Trading Commission Registration. The Commodity Futures Trading Commission (“CFTC”) has adopted regulations that subject registered investment companies and advisers to regulation by the CFTC if a fund invests more than a prescribed level of its assets in certain CFTC-regulated instruments (including futures, certain options and swap agreements) or markets itself as providing investment exposure to such instruments. The investment adviser has claimed an exclusion from the definition of “commodity pool operator” under the Commodity Exchange Act with respect to its management of the Fund. Accordingly, neither the Fund nor the adviser with respect to the operation of the Fund is subject to CFTC regulation. Because of its management of other strategies, the Fund’s adviser is registered with the CFTC as a commodity pool operator. The adviser is also registered as a commodity trading advisor.
Fund shares are not insured by the FDIC and are not deposits or other obligations of, or guaranteed by, any depository institution. Shares are subject to investment risks, including possible loss of principal invested.
This report must be preceded or accompanied by a current summary prospectus or prospectus. Before investing, investors should consider carefully the investment objective, risks, and charges and expenses of a mutual fund. This and other important information is contained in the summary prospectus and prospectus, which can be obtained from a financial intermediary. Prospective investors should read the prospectus carefully before investing. For further information, please call 1-800-262-1122.
Annual Report October 31, 2022
Eaton Vance
Short Duration Government Income Fund
Eaton Vance
Short Duration Government Income Fund
October 31, 2022
Management’s Discussion of Fund Performance†
Economic and Market Conditions
The 12-month period ended October 31, 2022, saw a reversal in U.S. monetary policy in response to surging inflation, a hot housing market, and strength in the U.S. labor market. At the same time, financial markets suffered as prices for equity and fixed-income assets around the globe experienced steep declines, while U.S. Treasury yields generally rose.
The period began with the U.S. Federal Reserve (the Fed) taking its first step toward tighter monetary policy by tapering its monthly asset purchases. As COVID-19 vaccinations increased and the U.S. economy began to recover, a jump in consumer and corporate spending raised the threat of out-of-control inflation.
Against the backdrop of rising inflation readings, the Fed’s hawkish response — to intentionally slow economic growth by raising the cost of borrowing through higher interest rates — caused short-term U.S. Treasury yields to shoot higher and longer term yields to fall. Reduced demand for agency mortgage-backed securities (MBS) also caused the yield spreads on these securities to widen toward the end of 2021.
During the first quarter of 2022, major central banks worldwide tightened their monetary policies to seek to rein in inflation, which forced bond yields even higher. In February, Russia’s invasion of Ukraine pushed energy costs further up and COVID-19 lockdowns in China exacerbated global supply-chain disruptions, adding to inflationary pressures. Short-term U.S. Treasury yields continued to grow while the Fed raised the federal funds rate 0.25% in March — to a 0.25%-0.50% range — and signaled several more increases by year-end. Mortgage rates skyrocketed during the period, resulting in a drop in refinancing activity.
Surging inflation, growing fears of recession, and a tight monetary policy weighed on investor sentiment during the second quarter of 2022. This led to declines in equity and fixed-income markets, and a further rise in U.S. Treasury yields. The agency MBS market remained under pressure due to heightened interest rate volatility and concerns about a potential increase in MBS sell-offs by the Fed.
At its June, July, and September meetings, the Fed hiked the federal funds rate 0.75% each time — to a 3.00%-3.25% range — its first moves of that magnitude since 1994, leading the MBS market to its worst quarterly return since 1981. Meanwhile, mortgage rates ended the period at their highest levels since 2008. Despite the Fed raising rates, inflation remained stubbornly high during the third quarter of 2022.
For the period as a whole, the 2-year U.S. Treasury yield rose by roughly 4%, and the average 30-year fixed-rate mortgage briefly rose above 7% — its highest point in more than 20 years. Agency MBS spreads widened by more than 100 basis points during the period — levels not seen since the Great Recession.
Fund Performance
For the 12-month period ended October 31, 2022, Eaton Vance Short Duration Government Income Fund (the Fund) returned -2.85% for Class A shares at net asset value (NAV), underperforming its benchmark, the ICE BofA 0-1 Year U.S. Treasury Index (the Index), which returned -0.07%.
The main detractor from Fund performance relative to the Index during the period was its exposure to fixed-rate agency mortgage-backed securities (Agency MBS) pools, which were negatively impacted by the sharp rise in interest rates during the period. The Fund’s allocation to lower coupon collateralized mortgage obligations also weighed on returns versus the Index due to higher Treasury yields and wider Agency MBS spreads.
Strong performance by the Fund’s interest-only securities helped offset some market headwinds as interest-only MBS prices reacted positively to rising rates. Exposure to floating-rate government-guaranteed loans also contributed to Fund returns relative to the Index during a period when bond coupons generally adjusted higher and MBS prices remained relatively stable amid market volatility.
See Endnotes and Additional Disclosures in this report.
Past performance is no guarantee of future results. Returns are historical and are calculated by determining the percentage change in net asset value (NAV) or offering price (as applicable) with all distributions reinvested. Furthermore, returns do not reflect the deduction of taxes that shareholders may have to pay on Fund distributions or upon the redemption of Fund shares. Investment return and principal value will fluctuate so that shares, when redeemed, may be worth more or less than their original cost. Performance for periods less than or equal to one year is cumulative. Performance is for the stated time period only; due to market volatility, current Fund performance may be lower or higher than the quoted return. For performance as of the most recent month-end, please refer to eatonvance.com.
Eaton Vance
Short Duration Government Income Fund
October 31, 2022
Performance
Portfolio Manager(s) Andrew Szczurowski, CFA and Alexander Payne, CFA
| | | | | | | | | | | | | | | | | | | | |
| % Average Annual Total Returns1,2 | | Class
Inception Date | | | Performance
Inception Date | | | One Year | | | Five Years | | | Ten Years | |
| | | | | |
Advisers Class at NAV | | | 05/17/2021 | | | | 09/30/2002 | | | | (2.73 | )% | | | 0.64 | % | | | 0.82 | % |
Class A at NAV | | | 09/30/2002 | | | | 09/30/2002 | | | | (2.85 | ) | | | 0.64 | | | | 0.82 | |
Class A with 2.25% Maximum Sales Charge | | | — | | | | — | | | | (4.99 | ) | | | 0.18 | | | | 0.59 | |
Class C at NAV | | | 09/30/2002 | | | | 09/30/2002 | | | | (3.43 | ) | | | 0.04 | | | | 0.34 | |
Class C with 1% Maximum Deferred Sales Charge | | | — | | | | — | | | | (4.38 | ) | | | 0.04 | | | | 0.34 | |
Class I at NAV | | | 05/04/2009 | | | | 09/30/2002 | | | | (2.49 | ) | | | 0.91 | | | | 1.09 | |
|
| |
ICE BofA 0-1 Year U.S. Treasury Index | | | — | | | | — | | | | (0.07 | )% | | | 1.15 | % | | | 0.75 | % |
| | | | | |
| % Total Annual Operating Expense Ratios3 | | | | | Advisers Class | | | Class A | | | Class C | | | Class I | |
| | | | | |
| | | | | | | 0.77% | | | | 0.77 | % | | | 1.37 | % | | | 0.52 | % |
Growth of $10,000
This graph shows the change in value of a hypothetical investment of $10,000 in Class A of the Fund for the period indicated. For comparison, the same investment is shown in the indicated index.
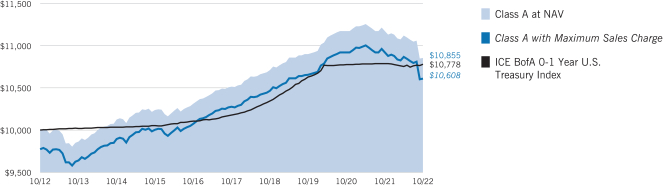
| | | | | | | | | | | | | | | | |
| Growth of Investment2 | | Amount Invested | | | Period Beginning | | | At NAV | | | With Maximum Sales Charge | |
| | | | |
Advisers Class | | | $10,000 | | | | 10/31/2012 | | | | $10,855 | | | | N.A. | |
Class C | | | $10,000 | | | | 10/31/2012 | | | | $10,345 | | | | N.A. | |
| | | | |
Class I, at minimum investment | | | $1,000,000 | | | | 10/31/2012 | | | | $1,114,202 | | | | N.A. | |
See Endnotes and Additional Disclosures in this report.
Past performance is no guarantee of future results. Returns are historical and are calculated by determining the percentage change in net asset value (NAV) or offering price (as applicable) with all distributions reinvested. Furthermore, returns do not reflect the deduction of taxes that shareholders may have to pay on Fund distributions or upon the redemption of Fund shares. Investment return and principal value will fluctuate so that shares, when redeemed, may be worth more or less than their original cost. Performance for periods less than or equal to one year is cumulative. Performance is for the stated time period only; due to market volatility, current Fund performance may be lower or higher than the quoted return. For performance as of the most recent month-end, please refer to eatonvance.com.
Eaton Vance
Short Duration Government Income Fund
October 31, 2022
Fund Profile
Asset Allocation (% of total investments)1
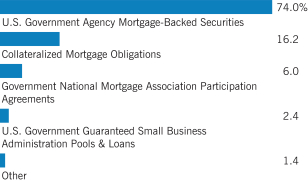
Footnotes:
| 1 | Other represents any investment type less than 1% of total investments. |
Eaton Vance
Short Duration Government Income Fund
October 31, 2022
Endnotes and Additional Disclosures
| † | The views expressed in this report are those of the portfolio manager(s) and are current only through the date stated at the top of this page. These views are subject to change at any time based upon market or other conditions, and Eaton Vance and the Fund(s) disclaim any responsibility to update such views. These views may not be relied upon as investment advice and, because investment decisions are based on many factors, may not be relied upon as an indication of trading intent on behalf of any Eaton Vance fund. This commentary may contain statements that are not historical facts, referred to as “forward-looking statements.” The Fund’s actual future results may differ significantly from those stated in any forward-looking statement, depending on factors such as changes in securities or financial markets or general economic conditions, the volume of sales and purchases of Fund shares, the continuation of investment advisory, administrative and service contracts, and other risks discussed from time to time in the Fund’s filings with the Securities and Exchange Commission. |
| 1 | ICE BofA 0-1 Year U.S. Treasury Index is an unmanaged index of short-term U.S. Treasury securities having a maturity of less than one year. ICE® BofA® indices are not for redistribution or other uses; provided “as is”, without warranties, and with no liability. Eaton Vance has prepared this report and ICE Data Indices, LLC does not endorse it, or guarantee, review, or endorse Eaton Vance’s products. BofA® is a licensed registered trademark of Bank of America Corporation in the United States and other countries. Unless otherwise stated, index returns do not reflect the effect of any applicable sales charges, commissions, expenses, taxes or leverage, as applicable. It is not possible to invest directly in an index. |
| 2 | Total Returns at NAV do not include applicable sales charges. If sales charges were deducted, the returns would be lower. Total Returns shown with maximum sales charge reflect the stated maximum sales charge. Unless otherwise stated, performance does not reflect the deduction of taxes on Fund distributions or redemptions of Fund shares. |
Performance prior to the inception date of a class may be linked to the performance of an older class of the Fund. This linked performance is adjusted for any applicable sales charge, but is not adjusted for class expense differences. If adjusted for such differences, the performance would be different. The performance of Advisers Class is linked to Class A. Performance presented in the Financial Highlights included in the financial statements is not linked.
Effective November 5, 2020, Class C shares automatically convert to Class A shares eight years after purchase. The average annual total returns listed for Class C reflect conversion to Class A shares after eight years. Prior to November 5, 2020, Class C shares automatically converted to Class A shares ten years after purchase.
| 3 | Source: Fund prospectus. The expense ratios for the current reporting period can be found in the Financial Highlights section of this report. Performance reflects expenses waived and/or reimbursed, if applicable. Without such waivers and/or reimbursements, performance would have been lower. |
Fund profile subject to change due to active management.
Additional Information
Spread is the difference in yield between a U.S. Treasury bond and another debt security of the same maturity but different credit quality.
Eaton Vance
Short Duration Government Income Fund
October 31, 2022
Fund Expenses
Example
As a Fund shareholder, you incur two types of costs: (1) transaction costs, including sales charges (loads) on purchases and redemption fees (if applicable); and (2) ongoing costs, including management fees; distribution and/or service fees; and other Fund expenses. This Example is intended to help you understand your ongoing costs (in dollars) of Fund investing and to compare these costs with the ongoing costs of investing in other mutual funds. The Example is based on an investment of $1,000 invested at the beginning of the period and held for the entire period (May 1, 2022 to October 31, 2022).
Actual Expenses
The first section of the table below provides information about actual account values and actual expenses. You may use the information in this section, together with the amount you invested, to estimate the expenses that you paid over the period. Simply divide your account value by $1,000 (for example, an $8,600 account value divided by $1,000 = 8.6), then multiply the result by the number in the first section under the heading entitled “Expenses Paid During Period” to estimate the expenses you paid on your account during this period.
Hypothetical Example for Comparison Purposes
The second section of the table below provides information about hypothetical account values and hypothetical expenses based on the actual Fund expense ratio and an assumed rate of return of 5% per year (before expenses), which is not the actual Fund return. The hypothetical account values and expenses may not be used to estimate the actual ending account balance or expenses you paid for the period. You may use this information to compare the ongoing costs of investing in your Fund and other funds. To do so, compare this 5% hypothetical example with the 5% hypothetical examples that appear in the shareholder reports of the other funds.
Please note that the expenses shown in the table are meant to highlight your ongoing costs only and do not reflect any transactional costs, such as sales charges (loads) or redemption fees (if applicable). Therefore, the second section of the table is useful in comparing ongoing costs only, and will not help you determine the relative total costs of owning different funds. In addition, if these transactional costs were included, your costs would be higher.
| | | | | | | | | | | | | | | | |
| | | Beginning
Account Value
(5/1/22) | | | Ending
Account Value
(10/31/22) | | | Expenses Paid
During Period*
(5/1/22 – 10/31/22) | | | Annualized
Expense
Ratio% | |
| | | | |
Actual | | | | | | | | | | | | | | | | |
Advisers Class | | $ | 1,000.00 | | | $ | 977.30 | | | $ | 3.99 | | | | 0.80 | % |
Class A | | $ | 1,000.00 | | | $ | 976.10 | | | $ | 4.03 | | | | 0.81 | % |
Class C | | $ | 1,000.00 | | | $ | 973.20 | | | $ | 6.96 | | | | 1.40 | % |
Class I | | $ | 1,000.00 | | | $ | 978.50 | | | $ | 2.74 | | | | 0.55 | % |
| | | | | |
Hypothetical | | | | | | | | | | | | | | | | |
(5% return per year before expenses) | | | | | | | | | | | | | | | | |
Advisers Class | | $ | 1,000.00 | | | $ | 1,021.17 | | | $ | 4.08 | | | | 0.80 | % |
Class A | | $ | 1,000.00 | | | $ | 1,021.12 | | | $ | 4.13 | | | | 0.81 | % |
Class C | | $ | 1,000.00 | | | $ | 1,018.15 | | | $ | 7.12 | | | | 1.40 | % |
Class I | | $ | 1,000.00 | | | $ | 1,022.43 | | | $ | 2.80 | | | | 0.55 | % |
| * | Expenses are equal to the Fund’s annualized expense ratio for the indicated Class, multiplied by the average account value over the period, multiplied by 184/365 (to reflect the one-half year period). The Example assumes that the $1,000 was invested at the net asset value per share determined at the close of business on April 30, 2022. |
Eaton Vance
Short Duration Government Income Fund
October 31, 2022
Portfolio of Investments
| | | | | | | | |
| Collateralized Mortgage Obligations — 21.8% | |
| Security | | Principal
Amount
(000’s omitted) | | | Value | |
| | |
| Federal Home Loan Mortgage Corp.: | | | | | | |
| | |
Series 2135, Class JZ, 6.00%, 3/15/29 | | $ | 297 | | | $ | 300,111 | |
| | |
Series 3866, Class DF, 4.862%, (1 mo. USD LIBOR + 1.45%), 5/15/41(1) | | | 1,044 | | | | 979,669 | |
| | |
Series 4102, Class DF, 4.278%, (1 mo. USD LIBOR + 1.15%), 9/15/42(1) | | | 271 | | | | 243,135 | |
| | |
Series 4159, Class FP, 4.028%, (1 mo. USD LIBOR + 0.90%), 11/15/42(1) | | | 618 | | | | 540,411 | |
| | |
Series 4180, Class KF, 4.128%, (1 mo. USD LIBOR + 1.00%), 1/15/43(1) | | | 3,147 | | | | 2,784,868 | |
| | |
Series 4204, Class AF, 4.128%, (1 mo. USD LIBOR + 1.00%), 5/15/43(1) | | | 540 | | | | 467,213 | |
| | |
Series 4212, Class NS, 1.305%, (5.40% - 1 mo. USD LIBOR x 1.20), 6/15/43(2) | | | 1,693 | | | | 1,519,269 | |
| | |
Series 4223, Class NF, 4.078%, (1 mo. USD LIBOR + 0.95%), 7/15/43(1) | | | 1,931 | | | | 1,741,998 | |
| | |
Series 4249, Class CF, 3.928%, (1 mo. USD LIBOR + 0.80%), 9/15/43(1) | | | 7,082 | | | | 7,007,206 | |
| | |
Series 4299, Class JG, 2.50%, 7/15/43 | | | 744 | | | | 716,963 | |
| | |
Series 4389, Class CA, 3.00%, 9/15/44 | | | 1,405 | | | | 1,297,365 | |
| | |
Series 4619, Class KF, 3.878%, (1 mo. USD LIBOR + 0.75%), 6/15/39(1) | | | 710 | | | | 680,292 | |
| | |
Series 4678, Class PC, 3.00%, 1/15/46 | | | 1,705 | | | | 1,611,341 | |
| | |
Series 4876, Class FA, 4.112%, (1 mo. USD LIBOR + 0.70%), 5/15/49(1) | | | 7,390 | | | | 7,357,384 | |
| | |
Series 4995, Class ZN, 2.50%, 7/25/50 | | | 1,016 | | | | 700,073 | |
| | |
Series 5009, Class ZN, 3.50%, 7/25/50 | | | 4,984 | | | | 3,991,743 | |
| | |
Series 5020, Class EZ, 2.00%, 10/25/50 | | | 10,793 | | | | 6,570,072 | |
| | |
Series 5021, Class CZ, 2.00%, 10/25/50 | | | 3,725 | | | | 2,112,486 | |
| | |
Series 5021, Class NZ, 2.00%, 10/25/50 | | | 3,160 | | | | 1,888,274 | |
| | |
Series 5028, Class AZ, 2.00%, 10/25/50 | | | 990 | | | | 563,837 | |
| | |
Series 5028, Class TZ, 2.00%, 10/25/50 | | | 2,659 | | | | 1,655,547 | |
| | |
Series 5028, Class ZA, 2.00%, 10/25/50 | | | 1,138 | | | | 656,524 | |
| | |
Series 5028, Class ZT, 2.00%, 10/25/50 | | | 2,213 | | | | 1,301,324 | |
| | |
Series 5031, Class Z, 2.50%, 10/25/50 | | | 8 | | | | 3,869 | |
| | |
Series 5035, Class AZ, 2.00%, 11/25/50 | | | 1,446 | | | | 859,380 | |
| | |
Series 5035, Class ZK, 2.50%, 11/25/50 | | | 16,868 | | | | 11,856,892 | |
| | |
Series 5035, Class ZT, 2.00%, 10/25/50 | | | 1,617 | | | | 951,427 | |
| | |
Series 5036, Class Z, 2.00%, 11/25/50 | | | 14,568 | | | | 8,564,499 | |
| | |
Series 5037, Class QZ, 2.00%, 11/25/50 | | | 6,493 | | | | 3,821,347 | |
| | |
Series 5037, Class ZQ, 2.00%, 11/25/50 | | | 764 | | | | 445,265 | |
| | |
Series 5038, Class Z, 2.50%, 10/25/50 | | | 4 | | | | 1,731 | |
| | |
Series 5038, Class ZN, 2.00%, 11/25/50 | | | 1,784 | | | | 1,011,489 | |
| | |
Series 5039, Class PZ, 2.00%, 11/25/50 | | | 1,154 | | | | 661,277 | |
| | |
Series 5039, Class ZJ, 2.00%, 11/25/50 | | | 350 | | | | 198,689 | |
| | |
Series 5040, Class TZ, 2.50%, 11/25/50 | | | 4,238 | | | | 2,495,824 | |
| | |
Series 5048, Class CZ, 2.00%, 12/25/50 | | | 1,860 | | | | 1,067,416 | |
| | |
Series 5050, Class DZ, 2.00%, 11/25/50 | | | 3,602 | | | | 2,081,783 | |
| | | | | | | | |
| Security | | Principal
Amount
(000’s omitted) | | | Value | |
| | |
| Federal Home Loan Mortgage Corp.: (continued) | | | | | | |
| | |
Series 5050, Class ZC, 2.00%, 12/25/50 | | $ | 6,194 | | | $ | 3,687,857 | |
| | |
Series 5050, Class ZJ, 2.00%, 12/25/50 | | | 8,031 | | | | 4,745,173 | |
| | |
Series 5054, Class DZ, 2.00%, 12/25/50 | | | 15,293 | | | | 9,001,310 | |
| | |
Series 5057, Class AZ, 2.00%, 12/25/50 | | | 3,023 | | | | 1,495,270 | |
| | |
Series 5058, Class CZ, 2.00%, 1/25/51 | | | 8,588 | | | | 5,250,264 | |
| | |
Series 5058, Class Z, 2.00%, 1/25/51 | | | 700 | | | | 400,563 | |
| | |
Series 5058, Class ZA, 2.00%, 1/25/51 | | | 1,016 | | | | 584,730 | |
| | |
Series 5058, Class ZH, 3.00%, 5/25/50 | | | 2,854 | | | | 2,034,157 | |
| | |
Series 5068, Class UZ, 2.50%, 1/25/51 | | | 9,341 | | | | 6,675,271 | |
| | |
Series 5071, Class CS, 0.853%, (3.30% - 30-day average SOFR), 2/25/51(2) | | | 6,990 | | | | 3,924,406 | |
| | |
Series 5071, Class SP, 0.853%, (3.30% - 30-day average SOFR), 2/25/51(2) | | | 9,615 | | | | 6,184,205 | |
| | |
Series 5072, Class ZU, 2.50%, 2/25/51 | | | 2,975 | | | | 2,033,641 | |
| | |
Series 5083, Class SK, 0.605%, (3.867% - 30-day average SOFR x 1.33), 3/25/51(2) | | | 8,471 | | | | 5,217,903 | |
| | |
Series 5083, Class ZW, 2.50%, 3/25/51 | | | 4,989 | | | | 3,390,594 | |
| | |
Series 5090, Class PZ, 2.50%, 3/25/51 | | | 521 | | | | 352,309 | |
| | |
Series 5093, Class Z, 3.00%, 1/25/51 | | | 1 | | | | 560 | |
| | |
Series 5093, Class ZM, 3.00%, 3/25/51 | | | 2 | | | | 1,224 | |
| | |
Series 5101, Class EZ, 2.00%, 3/25/51 | | | 2,003 | | | | 1,022,579 | |
| | |
Series 5104, Class WZ, 3.00%, 4/25/51 | | | 882 | | | | 545,865 | |
| | |
Series 5114, Class ZH, 3.00%, 5/25/51 | | | 532 | | | | 343,083 | |
| | |
Series 5123, Class JZ, 2.00%, 7/25/51 | | | 765 | | | | 393,693 | |
| | |
Series 5129, Class CZ, 3.00%, 8/25/50 | | | 14,763 | | | | 10,182,594 | |
| | |
Series 5129, Class HZ, 1.25%, 4/25/50 | | | 1,617 | | | | 1,167,823 | |
| | |
Series 5129, Class TZ, 2.50%, 8/25/51 | | | 3,147 | | | | 2,412,177 | |
| | |
Series 5129, Class WZ, 3.00%, 8/25/50 | | | 1 | | | | 595 | |
| | |
Series 5129, Class ZE, 3.00%, 9/25/50 | | | 201 | | | | 128,422 | |
| | |
Series 5129, Class ZH, 3.00%, 7/25/50 | | | 1 | | | | 595 | |
| | |
Series 5129, Class ZW, 3.00%, 8/25/50 | | | 1 | | | | 398 | |
| | |
Series 5131, Class QZ, 3.00%, 7/25/51 | | | 2,977 | | | | 2,239,593 | |
| | |
Series 5132, Class LZ, 2.50%, 8/25/51 | | | 8,288 | | | | 5,660,878 | |
| | |
Series 5135, Class MZ, 2.50%, 8/25/51 | | | 12,654 | | | | 8,844,794 | |
| | |
Series 5136, Class ZJ, 2.50%, 8/25/51 | | | 16,955 | | | | 11,706,180 | |
| | |
Series 5139, Class DZ, 2.50%, 9/25/51 | | | 10,197 | | | | 7,030,529 | |
| | |
Series 5139, Class EZ, 2.50%, 9/25/51 | | | 11,827 | | | | 8,074,597 | |
| | |
Series 5140, Class WZ, 2.50%, 9/25/51 | | | 6,672 | | | | 4,685,985 | |
| | |
Series 5141, Class ZJ, 2.50%, 9/25/51 | | | 12,304 | | | | 8,497,130 | |
| | |
Series 5141, Class ZP, 3.00%, 4/25/50 | | | 12,117 | | | | 8,658,057 | |
| | |
Series 5144, Class Z, 2.50%, 9/25/51 | | | 35,182 | | | | 24,789,152 | |
| | |
Series 5148, Class AZ, 2.50%, 10/25/51 | | | 38,544 | | | | 27,321,797 | |
| | |
Series 5150, Class QZ, 2.50%, 10/25/51 | | | 4,694 | | | | 3,316,322 | |
| | |
Series 5150, Class ZJ, 2.50%, 10/25/51 | | | 13,482 | | | | 9,458,339 | |
| | |
Series 5150, Class ZN, 2.50%, 10/25/51 | | | 1,186 | | | | 671,465 | |
| | |
Series 5159, Class KZ, 3.00%, 11/25/51 | | | 6,485 | | | | 4,734,891 | |
| | | | |
| | 7 | | See Notes to Financial Statements. |
Eaton Vance
Short Duration Government Income Fund
October 31, 2022
Portfolio of Investments — continued
| | | | | | | | |
| Security | | Principal
Amount
(000’s omitted) | | | Value | |
| | |
| Federal Home Loan Mortgage Corp.: (continued) | | | | | | |
| | |
Series 5159, Class MZ, 3.00%, 11/25/51 | | $ | 983 | | | $ | 614,275 | |
| | |
Series 5159, Class ZP, 3.00%, 11/25/51 | | | 4,435 | | | | 3,232,185 | |
| | |
Series 5159, Class ZT, 3.00%, 11/25/51 | | | 8,324 | | | | 6,403,316 | |
| | |
Series 5160, Class ZW, 3.00%, 8/25/50 | | | 2,626 | | | | 1,827,001 | |
| | |
Series 5160, Class ZY, 3.00%, 10/25/50 | | | 30,717 | | | | 22,797,103 | |
| | |
Series 5163, Class Z, 3.00%, 11/25/51 | | | 5,568 | | | | 3,927,151 | |
| | |
Series 5166, Class ZN, 3.00%, 9/25/50 | | | 9,996 | | | | 7,741,502 | |
| | |
Series 5168, Class MZ, 3.00%, 10/25/51 | | | 6,353 | | | | 4,746,263 | |
| | |
Series 5169, Class JZ, 3.00%, 1/25/49 | | | 372 | | | | 238,312 | |
| | |
| Interest Only:(3) | | | | | | |
| | |
Series 354, Class C11, 3.50%, 7/15/46 | | | 9,346 | | | | 1,658,125 | |
| | |
Series 354, Class C15, 3.50%, 11/15/46 | | | 8,416 | | | | 1,833,284 | |
| | |
Series 362, Class C7, 3.50%, 9/15/47 | | | 14,762 | | | | 2,642,750 | |
| | |
Series 362, Class C11, 4.00%, 12/15/47 | | | 4,475 | | | | 903,361 | |
| | |
Series 362, Class C12, 4.00%, 12/15/47 | | | 9,042 | | | | 1,886,915 | |
| | |
Series 380, Class C1, 3.00%, 1/25/50 | | | 33,296 | | | | 5,696,150 | |
| | |
Series 380, Class C5, 3.50%, 1/25/50 | | | 10,577 | | | | 1,972,025 | |
| | |
Series 3030, Class SL, 2.688%, (6.10% - 1 mo. USD LIBOR), 9/15/35(2) | | | 1,056 | | | | 94,275 | |
| | |
Series 3114, Class TS, 3.238%, (6.65% - 1 mo. USD LIBOR), 9/15/30(2) | | | 1,980 | | | | 91,739 | |
| | |
Series 3339, Class JI, 3.178%, (6.59% - 1 mo. USD LIBOR), 7/15/37(2) | | | 957 | | | | 91,917 | |
| | |
Series 4088, Class EI, 3.50%, 9/15/41 | | | 75 | | | | 906 | |
| | |
Series 4094, Class CS, 2.588%, (6.00% - 1 mo. USD LIBOR), 8/15/42(2) | | | 739 | | | | 101,310 | |
| | |
Series 4109, Class SA, 2.788%, (6.20% - 1 mo. USD LIBOR), 9/15/32(2) | | | 1,115 | | | | 88,398 | |
| | |
Series 4497, Class CS, 2.788%, (6.20% - 1 mo. USD LIBOR), 9/15/44(2) | | | 222 | | | | 4,776 | |
| | |
Series 4507, Class EI, 4.00%, 8/15/44 | | | 3,032 | | | | 400,084 | |
| | |
Series 4507, Class MI, 3.50%, 8/15/44 | | | 312 | | | | 15,827 | |
| | |
Series 4549, Class DS, 2.488%, (5.90% - 1 mo. USD LIBOR), 8/15/45(2) | | | 941 | | | | 63,388 | |
| | |
Series 4601, Class IN, 3.50%, 7/15/46 | | | 14,633 | | | | 2,547,299 | |
| | |
Series 4625, Class BI, 3.50%, 6/15/46 | | | 2,876 | | | | 480,081 | |
| | |
Series 4637, Class IP, 3.50%, 4/15/44 | | | 168 | | | | 7,347 | |
| | |
Series 4672, Class LI, 3.50%, 1/15/43 | | | 74 | | | | 563 | |
| | |
Series 4749, Class IL, 4.00%, 12/15/47 | | | 1,023 | | | | 193,915 | |
| | |
Series 4768, Class IO, 4.00%, 3/15/48 | | | 1,186 | | | | 222,122 | |
| | |
Series 4768, Class KI, 4.00%, 11/15/47 | | | 2,073 | | | | 392,334 | |
| | |
Series 4772, Class PI, 4.00%, 1/15/48 | | | 1,288 | | | | 241,325 | |
| | |
Series 4791, Class JI, 4.00%, 5/15/48 | | | 1,855 | | | | 368,691 | |
| | |
Series 4791, Class SA, 2.788%, (6.20% - 1 mo. USD LIBOR), 5/15/48(2) | | | 5,101 | | | | 527,212 | |
| | |
Series 4796, Class AS, 2.788%, (6.20% - 1 mo. USD LIBOR), 5/15/48(2) | | | 3,230 | | | | 326,468 | |
| | |
Series 4808, Class IB, 4.00%, 5/15/48 | | | 4,988 | | | | 982,343 | |
| | | | | | | | |
| Security | | Principal
Amount
(000’s omitted) | | | Value | |
| | |
| Interest Only: (continued) | | | | | | |
| | |
Series 4966, Class SY, 2.464%, (6.05% - 1 mo. USD LIBOR), 4/25/50(2) | | $ | 4,636 | | | $ | 502,403 | |
| | |
Series 5008, Class IE, 2.00%, 9/25/50 | | | 68,603 | | | | 8,523,277 | |
| | |
Series 5010, Class I, 2.00%, 9/25/50 | | | 32,084 | | | | 4,006,440 | |
| | |
Series 5010, Class IB, 2.00%, 9/25/50 | | | 47,633 | | | | 5,918,003 | |
| | |
Series 5010, Class IN, 2.00%, 9/25/50 | | | 85,855 | | | | 10,726,700 | |
| | |
Series 5010, Class NI, 2.00%, 9/25/50 | | | 17,787 | | | | 2,213,929 | |
| | |
Series 5016, Class UI, 2.00%, 9/25/50 | | | 15,243 | | | | 1,893,761 | |
| | |
Series 5017, Class DI, 2.00%, 9/25/50 | | | 31,574 | | | | 3,922,790 | |
| | |
Series 5019, Class CI, 2.00%, 10/25/50 | | | 25,809 | | | | 3,242,720 | |
| | |
Series 5020, Class CI, 2.00%, 9/25/50 | | | 6,368 | | | | 770,534 | |
| | |
Series 5022, Class AI, 2.00%, 10/25/50 | | | 34,383 | | | | 4,311,196 | |
| | |
Series 5024, Class CI, 2.00%, 10/25/50 | | | 103,935 | | | | 13,108,006 | |
| | |
Series 5025, Class GI, 2.00%, 10/25/50 | | | 11,165 | | | | 1,402,761 | |
| | |
Series 5028, Class TI, 2.00%, 10/25/50 | | | 14,363 | | | | 1,461,908 | |
| | |
Series 5038, Class DI, 2.00%, 11/25/50 | | | 82,141 | | | | 10,294,401 | |
| | |
Series 5051, Class S, 0.603%, (3.60% - 30-day average SOFR), 12/25/50(2) | | | 31,597 | | | | 1,104,043 | |
| | |
Series 5070, Class CI, 2.00%, 2/25/51 | | | 78,614 | | | | 10,525,424 | |
| | |
Series 5191, Class IB, 2.50%, 2/25/51 | | | 53,262 | | | | 8,445,345 | |
| | |
| Principal Only:(4) | | | | | | |
| | |
Series 213, Class PO, 0.00%, 6/1/31 | | | 1,106 | | | | 944,958 | |
| | |
Series 239, Class PO, 0.00%, 8/15/36 | | | 543 | | | | 409,358 | |
| | |
Series 246, Class PO, 0.00%, 5/15/37 | | | 1,329 | | | | 1,066,032 | |
| | |
Series 3072, Class WO, 0.00%, 11/15/35 | | | 491 | | | | 392,273 | |
| | |
Series 3342, Class KO, 0.00%, 7/15/37 | | | 182 | | | | 146,304 | |
| | |
Series 3476, Class PO, 0.00%, 7/15/38 | | | 234 | | | | 177,137 | |
| | |
Series 3862, Class PO, 0.00%, 5/15/41 | | | 499 | | | | 377,285 | |
| | |
Series 4239, Class OU, 0.00%, 7/15/43 | | | 2,826 | | | | 1,420,155 | |
| | |
| Federal National Mortgage Association: | | | | | | |
| | |
Series G93-17, Class FA, 4.586%, (1 mo. USD LIBOR + 1.00%), 4/25/23(1) | | | 1 | | | | 624 | |
| | |
Series G97-4, Class FA, 4.212%, (1 mo. USD LIBOR + 0.80%), 6/17/27(1) | | | 71 | | | | 71,184 | |
| | |
Series 1993-203, Class PL, 6.50%, 10/25/23 | | | 15 | | | | 14,827 | |
| | |
Series 1994-14, Class F, 5.76%, (12 mo. USD LIBOR + 1.60%), 10/25/23(1) | | | 14 | | | | 14,388 | |
| | |
Series 2001-4, Class GA, 9.00%, 4/17/25(5) | | | 0 | (6) | | | 36 | |
| | |
Series 2009-48, Class WA, 5.803%, 7/25/39(5) | | | 282 | | | | 283,891 | |
| | |
Series 2009-62, Class WA, 5.581%, 8/25/39(5) | | | 411 | | | | 413,762 | |
| | |
Series 2010-112, Class DZ, 4.00%, 10/25/40 | | | 354 | | | | 337,303 | |
| | |
Series 2011-49, Class NT, 6.00%, (66.00% - 1 mo. USD LIBOR x 10.00, Cap 6.00%), 6/25/41(2) | | | 142 | | | | 134,696 | |
| | |
Series 2012-51, Class FD, 4.166%, (1 mo. USD LIBOR + 0.58%), 5/25/42(1) | | | 18,453 | | | | 18,289,585 | |
| | |
Series 2012-103, Class ZP, 3.00%, 9/25/42 | | | 784 | | | | 579,977 | |
| | | | |
| | 8 | | See Notes to Financial Statements. |
Eaton Vance
Short Duration Government Income Fund
October 31, 2022
Portfolio of Investments — continued
| | | | | | | | |
| Security | | Principal
Amount
(000’s omitted) | | | Value | |
|
| Federal National Mortgage Association: (continued) | |
| | |
Series 2012-115, Class MX, 0.503%, (3.46% - 1 mo. USD LIBOR x 1.154), 10/25/42(2) | | $ | 628 | | | $ | 207,114 | |
| | |
Series 2012-128, Class SH, 0.414%, (4.00% - 1 mo. USD LIBOR), 11/25/42(2) | | | 3,778 | | | | 2,334,031 | |
| | |
Series 2012-128, Class WS, 0.414%, (4.00% - 1 mo. USD LIBOR), 11/25/42(2) | | | 548 | | | | 315,857 | |
| | |
Series 2012-134, Class ZT, 2.00%, 12/25/42 | | | 1,011 | | | | 786,049 | |
| | |
Series 2013-52, Class GA, 1.00%, 6/25/43 | | | 662 | | | | 588,840 | |
| | |
Series 2013-58, Class SC, 0.622%, (6.00% - 1 mo. USD LIBOR x 1.50), 6/25/43(2) | | | 2,651 | | | | 1,973,728 | |
| | |
Series 2013-67, Class NF, 4.586%, (1 mo. USD LIBOR + 1.00%), 7/25/43(1) | | | 631 | | | | 595,142 | |
| | |
Series 2014-1, Class HF, 4.628%, (1 mo. USD LIBOR + 1.50%), 6/25/43(1) | | | 730 | | | | 641,300 | |
| | |
Series 2014-5, Class LB, 2.50%, 7/25/43 | | | 27 | | | | 27,011 | |
| | |
Series 2015-74, Class SL, 0.243%, (2.349% - 1 mo. USD LIBOR x 0.587), 10/25/45(2) | | | 1,883 | | | | 996,701 | |
| | |
Series 2016-26, Class KS, 0.973%, (5.25% - 1 mo. USD LIBOR x 1.75), 11/25/42(2) | | | 1,608 | | | | 1,199,044 | |
| | |
Series 2017-15, Class LE, 3.00%, 6/25/46 | | | 176 | | | | 171,810 | |
| | |
Series 2017-56, Class KF, 4.128%, (1 mo. USD LIBOR + 1.00%), 7/25/47(1) | | | 561 | | | | 551,278 | |
| | |
Series 2017-56, Class KS, 1.872%, (5.00% - 1 mo. USD LIBOR), 7/25/47(2) | | | 314 | | | | 169,421 | |
| | |
Series 2019-1, Class FA, 4.186%, (1 mo. USD LIBOR + 0.60%), 2/25/49(1) | | | 6,983 | | | | 6,798,522 | |
| | |
Series 2019-8, Class FD, 4.286%, (1 mo. USD LIBOR + 0.70%), 3/25/49(1) | | | 23,908 | | | | 23,804,791 | |
| | |
Series 2019-9, Class LF, 4.136%, (1 mo. USD LIBOR + 0.55%), 3/25/49(1) | | | 9,005 | | | | 8,899,548 | |
| | |
Series 2019-16, Class AF, 4.136%, (1 mo. USD LIBOR + 0.55%), 4/25/49(1) | | | 8,017 | | | | 7,907,902 | |
| | |
Series 2020-45, Class MA, 0.332%, (3.20% - 1 mo. USD LIBOR x 0.80), 6/25/43(2) | | | 1,126 | | | | 862,460 | |
| | |
Series 2020-63, Class ZN, 3.00%, 9/25/50 | | | 300 | | | | 187,615 | |
| | |
Series 2020-81, Class CZ, 2.00%, 11/25/50 | | | 4,913 | | | | 2,932,794 | |
| | |
Series 2020-86, Class ZK, 2.00%, 12/25/50 | | | 4,206 | | | | 2,458,427 | |
| | |
Series 2020-86, Class ZP, 2.50%, 12/25/50 | | | 1,358 | | | | 904,250 | |
| | |
Series 2020-95, Class BZ, 2.50%, 1/25/51 | | | 311 | | | | 218,445 | |
| | |
Series 2020-95, Class ZT, 2.00%, 1/25/51 | | | 3,416 | | | | 2,015,496 | |
| | |
Series 2020-96, Class DZ, 2.50%, 1/25/51 | | | 8,111 | | | | 5,622,220 | |
| | |
Series 2020-96, Class EZ, 2.50%, 1/25/51 | | | 640 | | | | 438,294 | |
| | |
Series 2020-96, Class KZ, 2.50%, 1/25/51 | | | 305 | | | | 210,086 | |
| | |
Series 2021-3, Class ZH, 2.50%, 2/25/51 | | | 1,661 | | | | 1,139,830 | |
| | |
Series 2021-8, Class NZ, 2.50%, 3/25/51 | | | 1,034 | | | | 566,738 | |
| | |
Series 2021-11, Class KZ, 3.00%, 6/25/50 | | | 534 | | | | 357,918 | |
| | |
Series 2021-14, Class GZ, 2.50%, 3/25/51 | | | 669 | | | | 359,495 | |
| | |
Series 2021-22, Class MZ, 3.00%, 4/25/51 | | | 2,198 | | | | 1,397,989 | |
| | |
Series 2021-42, Class ZA, 3.00%, 2/25/51 | | | 4,657 | | | | 3,289,945 | |
| | |
Series 2021-42, Class ZD, 3.00%, 11/25/50 | | | 5,765 | | | | 4,037,397 | |
| | | | | | | | |
| Security | | Principal
Amount
(000’s omitted) | | | Value | |
|
| Federal National Mortgage Association: (continued) | |
| | |
Series 2021-45, Class DZ, 3.00%, 7/25/51 | | $ | 368 | | | $ | 220,379 | |
| | |
Series 2021-51, Class EZ, 2.50%, 8/25/51 | | | 1,198 | | | | 664,592 | |
| | |
Series 2021-52, Class JZ, 2.50%, 8/25/51 | | | 14,686 | | | | 10,270,397 | |
| | |
Series 2021-54, Class HZ, 2.50%, 6/25/51 | | | 7,408 | | | | 5,092,162 | |
| | |
Series 2021-54, Class ZJ, 2.50%, 8/25/51 | | | 22,108 | | | | 15,485,056 | |
| | |
Series 2021-55, Class ZN, 2.50%, 8/25/51 | | | 345 | | | | 189,982 | |
| | |
Series 2021-56, Class HZ, 2.50%, 9/25/51 | | | 30,655 | | | | 22,050,259 | |
| | |
Series 2021-56, Class LZ, 2.50%, 9/25/51 | | | 13,957 | | | | 10,113,692 | |
| | |
Series 2021-56, Class YZ, 2.50%, 9/25/51 | | | 33,221 | | | | 22,958,513 | |
| | |
Series 2021-57, Class ZW, 2.50%, 7/25/51 | | | 18,560 | | | | 12,773,250 | |
| | |
Series 2021-59, Class EZ, 2.50%, 9/25/51 | | | 1,426 | | | | 799,995 | |
| | |
Series 2021-61, Class Z, 2.50%, 9/25/51 | | | 12,679 | | | | 8,994,343 | |
| | |
Series 2021-63, Class QZ, 2.50%, 6/25/51 | | | 9,486 | | | | 6,481,547 | |
| | |
Series 2021-64, Class ZJ, 2.50%, 10/25/51 | | | 17,191 | | | | 11,959,977 | |
| | |
Series 2021-66, Class JZ, 2.50%, 10/25/51 | | | 12,764 | | | | 9,010,044 | |
| | |
Series 2021-69, Class JZ, 2.50%, 10/25/51 | | | 13,381 | | | | 9,468,973 | |
| | |
Series 2021-77, Class WZ, 3.00%, 8/25/50 | | | 1,806 | | | | 1,124,686 | |
| | |
Series 2021-77, Class Z, 3.00%, 5/25/51 | | | 15,224 | | | | 10,871,130 | |
| | |
Series 2021-79, Class Z, 3.00%, 11/25/51 | | | 16,657 | | | | 11,853,209 | |
| | |
Series 2021-95, Class ZC, 3.00%, 8/25/51 | | | 4,370 | | | | 3,226,233 | |
| | |
Series 2022-2, Class ZN, 3.00%, 2/25/52 | | | 11,347 | | | | 8,281,217 | |
|
| Interest Only:(3) | |
| | |
Series 296, Class 2, 8.00%, 4/25/24 | | | 4 | | | | 38 | |
| | |
Series 424, Class C8, 3.50%, 2/25/48 | | | 4,135 | | | | 744,988 | |
| | |
Series 2004-60, Class SW, 3.464%, (7.05% - 1 mo. USD LIBOR), 4/25/34(2) | | | 932 | | | | 38,184 | |
| | |
Series 2005-68, Class XI, 6.00%, 8/25/35 | | | 1,312 | | | | 267,170 | |
| | |
Series 2006-65, Class PS, 3.634%, (7.22% - 1 mo. USD LIBOR), 7/25/36(2) | | | 795 | | | | 95,480 | |
| | |
Series 2007-99, Class SD, 2.814%, (6.40% - 1 mo. USD LIBOR), 10/25/37(2) | | | 1,241 | | | | 115,256 | |
| | |
Series 2007-102, Class ST, 2.854%, (6.44% - 1 mo. USD LIBOR), 11/25/37(2) | | | 626 | | | | 50,011 | |
| | |
Series 2011-59, Class IW, 6.00%, 7/25/41 | | | 890 | | | | 174,664 | |
| | |
Series 2011-82, Class AI, 5.50%, 8/25/26 | | | 0 | (6) | | | 3 | |
| | |
Series 2011-101, Class IC, 3.50%, 10/25/26 | | | 1,180 | | | | 46,810 | |
| | |
Series 2012-147, Class SA, 2.514%, (6.10% - 1 mo. USD LIBOR), 1/25/43(2) | | | 807 | | | | 84,416 | |
| | |
Series 2014-41, Class SA, 2.464%, (6.05% - 1 mo. USD LIBOR), 7/25/44(2) | | | 807 | | | | 107,503 | |
| | |
Series 2014-55, Class IL, 3.50%, 9/25/44 | | | 658 | | | | 140,379 | |
| | |
Series 2014-55, Class IN, 3.50%, 7/25/44 | | | 699 | | | | 139,990 | |
| | |
Series 2014-89, Class IO, 3.50%, 1/25/45 | | | 1,054 | | | | 232,851 | |
| | |
Series 2015-22, Class GI, 3.50%, 4/25/45 | | | 365 | | | | 68,583 | |
| | |
Series 2015-31, Class SG, 2.514%, (6.10% - 1 mo. USD LIBOR), 5/25/45(2) | | | 849 | | | | 150,946 | |
| | |
Series 2015-36, Class IL, 3.00%, 6/25/45 | | | 877 | | | | 131,294 | |
| | |
Series 2016-61, Class DI, 3.00%, 4/25/46 | | | 735 | | | | 78,672 | |
| | | | |
| | 9 | | See Notes to Financial Statements. |
Eaton Vance
Short Duration Government Income Fund
October 31, 2022
Portfolio of Investments — continued
| | | | | | | | |
| Security | | Principal
Amount
(000’s omitted) | | | Value | |
| | |
| Interest Only: (continued) | | | | | | |
| | |
Series 2018-21, Class IO, 3.00%, 4/25/48 | | $ | 4,418 | | | $ | 825,415 | |
| | |
Series 2018-42, Class IA, 3.50%, 6/25/47 | | | 1,176 | | | | 216,538 | |
| | |
Series 2019-1, Class SA, 1.814%, (5.40% - 1 mo. | | | | | | | | |
| | |
USD LIBOR), 2/25/49(2) | | | 4,881 | | | | 235,376 | |
| | |
Series 2020-23, Class SP, 2.464%, (6.05% - 1 mo. USD LIBOR), 2/25/50(2) | | | 13,163 | | | | 1,430,109 | |
| | |
Series 2020-45, Class HI, 2.50%, 7/25/50 | | | 7,164 | | | | 1,035,405 | |
| | |
Series 2020-62, Class DI, 2.00%, 9/25/50 | | | 39,182 | | | | 4,883,728 | |
| | |
Series 2020-72, Class DI, 2.00%, 10/25/50 | | | 24,857 | | | | 3,062,953 | |
| | |
Series 2020-72, Class IA, 2.00%, 10/25/50 | | | 25,993 | | | | 3,240,873 | |
| | |
Series 2020-73, Class NI, 2.00%, 10/25/50 | | | 41,538 | | | | 5,219,892 | |
| | |
Series 2020-89, Class PI, 2.50%, 12/25/50 | | | 14,138 | | | | 2,205,872 | |
| | |
Series 2020-94, Class DI, 2.00%, 1/25/51 | | | 15,793 | | | | 2,097,974 | |
| | |
Series 2021-3, Class KI, 2.50%, 2/25/51 | | | 30,421 | | | | 4,412,392 | |
| | |
Series 2021-3, Class LI, 2.50%, 2/25/51 | | | 28,676 | | | | 4,035,825 | |
| | |
Series 2021-10, Class EI, 2.00%, 3/25/51 | | | 12,480 | | | | 1,696,935 | |
| | |
Series 2021-34, Class QI, 3.00%, 6/25/51 | | | 42,946 | | | | 7,361,018 | |
| | |
Series 2021-73, Class AI, 2.50%, 6/25/49 | | | 8,436 | | | | 924,886 | |
| | |
Series 2021-94, Class CI, 3.00%, 1/25/52 | | | 12,146 | | | | 1,930,786 | |
| | |
Series 2022-6, Class IO, 2.50%, 7/25/51 | | | 32,903 | | | | 5,287,840 | |
| | |
| Principal Only:(4) | | | | | | |
| | |
Series 379, Class 1, 0.00%, 5/25/37 | | | 1,172 | | | | 902,473 | |
| | |
Series 380, Class 1, 0.00%, 7/25/37 | | | 284 | | | | 219,931 | |
| | |
Series 2007-17, Class PO, 0.00%, 3/25/37 | | | 205 | | | | 157,160 | |
| | |
Series 2009-82, Class PO, 0.00%, 10/25/39 | | | 577 | | | | 444,163 | |
| | |
Series 2012-5, Class PO, 0.00%, 12/25/39 | | | 359 | | | | 283,774 | |
| | |
Series 2012-61, Class PO, 0.00%, 8/25/37 | | | 1,698 | | | | 1,331,791 | |
| | |
Series 2014-9, Class DO, 0.00%, 2/25/43 | | | 7,491 | | | | 5,254,232 | |
| | |
Series 2014-17, Class PO, 0.00%, 4/25/44 | | | 1,212 | | | | 851,309 | |
| | |
| Government National Mortgage Association: | | | | | | |
| | |
Series 2012-77, Class MT, 3.802%, (1 mo. USD LIBOR + 0.39%), 5/16/41(1) | | | 418 | | | | 400,354 | |
| | |
Series 2014-H20, Class MF, 2.863%, (1 mo. USD LIBOR + 0.65%), 10/20/64(1) | | | 5,818 | | | | 5,801,467 | |
| | |
Series 2015-144, Class KB, 3.00%, 8/20/44 | | | 503 | | | | 388,483 | |
| | |
Series 2015-H03, Class FD, 2.404%, (1 mo. USD LIBOR + 0.64%), 1/20/65(1) | | | 19,632 | | | | 19,552,408 | |
| | |
Series 2015-H05, Class FB, 2.534%, (1 mo. USD LIBOR + 0.64%), 2/20/65(1) | | | 19,625 | | | | 19,519,968 | |
| | |
Series 2016-168, Class JF, 4.128%, (1 mo. USD LIBOR + 1.00%), 11/20/46(1) | | | 128 | | | | 116,957 | |
| | |
Series 2017-121, Class DF, 3.989%, (1 mo. USD LIBOR + 0.50%), 8/20/47(1) | | | 3,545 | | | | 3,434,706 | |
| | |
Series 2017-137, Class AF, 3.989%, (1 mo. USD LIBOR + 0.50%), 9/20/47(1) | | | 1,590 | | | | 1,540,312 | |
| | |
Series 2018-H18, Class FG, 3.233%, (1 mo. USD LIBOR + 0.60%), 10/20/68(1) | | | 32,972 | | | | 32,609,539 | |
| | |
Series 2018-H20, Class FA, 2.314%, (1 mo. USD LIBOR + 0.60%), 12/20/68(1) | | | 51,599 | | | | 50,920,701 | |
| | | | | | | | |
| Security | | Principal
Amount
(000’s omitted) | | | Value | |
| | |
| Government National Mortgage Association: (continued) | | | | | | |
| | |
Series 2019-H02, Class FE, 3.183%, (1 mo. USD LIBOR + 0.55%), 1/20/69(1) | | $ | 20,352 | | | $ | 20,231,586 | |
| | |
Series 2020-76, Class ZL, 2.75%, 5/20/50 | | | 381 | | | | 327,153 | |
| | |
Series 2021-1, Class CZ, 2.50%, 12/20/50 | | | 701 | | | | 376,185 | |
| | |
Series 2021-1, Class ZD, 3.00%, 1/20/51 | | | 1,540 | | | | 1,221,809 | |
| | |
Series 2021-8, Class ZG, 2.50%, 1/20/51 | | | 3,160 | | | | 2,180,034 | |
| | |
Series 2021-24, Class EZ, 2.50%, 1/20/51 | | | 3,430 | | | | 2,270,479 | |
| | |
Series 2021-24, Class KZ, 2.50%, 2/20/51 | | | 3,508 | | | | 2,484,611 | |
| | |
Series 2021-25, Class JZ, 2.50%, 2/20/51 | | | 1,953 | | | | 1,365,134 | |
| | |
Series 2021-49, Class VZ, 2.50%, 3/20/51 | | | 47 | | | | 44,076 | |
| | |
Series 2021-77, Class ZG, 3.00%, 7/20/50 | | | 344 | | | | 215,516 | |
| | |
Series 2021-86, Class ZJ, 1.50%, 5/20/51 | | | 280 | | | | 125,683 | |
| | |
Series 2021-97, Class MZ, 3.00%, 8/20/50 | | | 5,618 | | | | 3,952,865 | |
| | |
Series 2021-97, Class ZC, 3.00%, 8/20/50 | | | 7,200 | | | | 5,013,477 | |
| | |
Series 2021-105, Class MZ, 3.00%, 6/20/51 | | | 4,594 | | | | 2,944,102 | |
| | |
Series 2021-105, Class ZH, 1.50%, 6/20/51 | | | 1,465 | | | | 953,611 | |
| | |
Series 2021-107, Class GZ, 3.00%, 6/20/51 | | | 2,340 | | | | 1,895,358 | |
| | |
Series 2021-114, Class JZ, 3.00%, 6/20/51 | | | 2,006 | | | | 1,227,558 | |
| | |
Series 2021-118, Class EZ, 2.50%, 7/20/51 | | | 6,909 | | | | 4,787,961 | |
| | |
Series 2021-118, Class JZ, 2.50%, 7/20/51 | | | 19,568 | | | | 13,432,512 | |
| | |
Series 2021-121, Class ZE, 2.50%, 7/20/51 | | | 208 | | | | 110,724 | |
| | |
Series 2021-122, Class ZL, 2.50%, 7/20/51 | | | 11,197 | | | | 7,744,641 | |
| | |
Series 2021-131, Class ZN, 3.00%, 7/20/51 | | | 2,546 | | | | 1,655,839 | |
| | |
Series 2021-136, Class WZ, 3.00%, 8/20/51 | | | 5,919 | | | | 4,406,950 | |
| | |
Series 2021-136, Class Z, 2.50%, 8/20/51 | | | 10,529 | | | | 7,245,577 | |
| | |
Series 2021-137, Class GZ, 2.50%, 8/20/51 | | | 1,309 | | | | 983,996 | |
| | |
Series 2021-138, Class Z, 2.50%, 8/20/51 | | | 11,214 | | | | 7,872,233 | |
| | |
Series 2021-139, Class UZ, 3.00%, 8/20/51 | | | 8,501 | | | | 5,883,370 | |
| | |
Series 2021-154, Class ZC, 2.50%, 9/20/51 | | | 6,052 | | | | 4,204,411 | |
| | |
Series 2021-154, Class ZL, 3.00%, 9/20/51 | | | 8,008 | | | | 5,470,597 | |
| | |
Series 2021-156, Class ZQ, 2.50%, 9/20/51 | | | 4,804 | | | | 3,359,986 | |
| | |
Series 2021-159, Class ZJ, 2.50%, 9/20/51 | | | 8,035 | | | | 5,651,413 | |
| | |
Series 2021-159, Class ZP, 2.00%, 9/20/51 | | | 7,478 | | | | 5,082,522 | |
| | |
Series 2021-160, Class NZ, 3.00%, 9/20/51 | | | 2,498 | | | | 1,881,902 | |
| | |
Series 2021-172, Class ZA, 3.00%, 9/20/51 | | | 1,611 | | | | 1,261,388 | |
| | |
Series 2021-175, Class DZ, 3.00%, 10/20/51 | | | 2,042 | | | | 1,542,472 | |
| | |
Series 2021-177, Class JZ, 3.00%, 10/20/51 | | | 4,729 | | | | 2,822,527 | |
| | |
Series 2021-182, Class KZ, 3.00%, 10/20/51 | | | 1,291 | | | | 809,075 | |
| | |
Series 2021-194, Class HZ, 3.00%, 11/20/51 | | | 9,043 | | | | 7,174,105 | |
| | |
Series 2021-199, Class ZM, 3.00%, 11/20/51 | | | 3,706 | | | | 2,907,894 | |
| | |
Series 2021-213, Class NZ, 3.00%, 12/20/51 | | | 7,423 | | | | 5,929,509 | |
| | |
Series 2021-214, Class LZ, 3.00%, 12/20/51 | | | 10,105 | | | | 8,257,457 | |
| | |
Series 2021-228, Class JZ, 3.00%, 12/20/51 | | | 7,469 | | | | 5,590,185 | |
| | |
Series 2022-31, Class ZD, 3.00%, 2/20/52 | | | 1,031 | | | | 977,707 | |
| | | | |
| | 10 | | See Notes to Financial Statements. |
Eaton Vance
Short Duration Government Income Fund
October 31, 2022
Portfolio of Investments — continued
| | | | | | | | |
| Security | | Principal
Amount
(000’s omitted) | | | Value | |
| | |
| Interest Only:(3) | | | | | | |
| | |
Series 2014-98, Class IM, 0.283%, 1/20/43(5) | | $ | 5,689 | | | $ | 77,209 | |
| | |
Series 2015-151, Class KI, 0.021%, 11/20/42(5) | | | 7,029 | | | | 104,025 | |
| | |
Series 2017-104, Class SD, 2.711%, (6.20% - 1 mo. USD LIBOR), 7/20/47(2) | | | 2,546 | | | | 248,256 | |
| | |
Series 2017-121, Class DS, 1.011%, (4.50% - 1 mo. USD LIBOR), 8/20/47(2) | | | 2,884 | | | | 115,480 | |
| | |
Series 2018-127, Class SG, 2.761%, (6.25% - 1 mo. USD LIBOR), 9/20/48(2) | | | 7,133 | | | | 602,240 | |
| | |
Series 2019-27, Class SA, 2.561%, (6.05% - 1 mo. USD LIBOR), 2/20/49(2) | | | 2,423 | | | | 277,710 | |
| | |
Series 2019-38, Class SQ, 2.561%, (6.05% - 1 mo. USD LIBOR), 3/20/49(2) | | | 7,070 | | | | 655,718 | |
| | |
Series 2019-43, Class BS, 2.561%, (6.05% - 1 mo. USD LIBOR), 4/20/49(2) | | | 3,934 | | | | 423,203 | |
| | |
Series 2020-97, Class MI, 2.50%, 3/20/50 | | | 5,925 | | | | 752,633 | |
| | |
Series 2020-116, Class MI, 2.00%, 8/20/50 | | | 535 | | | | 73,096 | |
| | |
Series 2020-134, Class IM, 2.50%, 9/20/50 | | | 15,718 | | | | 2,175,564 | |
| | |
Series 2020-146, Class IQ, 2.00%, 10/20/50 | | | 147,840 | | | | 16,983,415 | |
| | |
Series 2020-146, Class QI, 2.00%, 10/20/50 | | | 44,610 | | | | 5,006,157 | |
| | |
Series 2020-151, Class AI, 2.00%, 10/20/50 | | | 91,404 | | | | 11,742,375 | |
| | |
Series 2020-162, Class BI, 2.00%, 10/20/50 | | | 20,723 | | | | 2,626,501 | |
| | |
Series 2020-167, Class KI, 2.00%, 11/20/50 | | | 91,266 | | | | 10,464,022 | |
| | |
Series 2020-167, Class YI, 2.00%, 11/20/50 | | | 109,902 | | | | 13,276,219 | |
| | |
Series 2020-173, Class DI, 2.00%, 11/20/50 | | | 90,336 | | | | 11,416,900 | |
| | |
Series 2020-176, Class AI, 2.00%, 11/20/50 | | | 30,526 | | | | 3,648,198 | |
| | |
Series 2020-176, Class HI, 2.50%, 11/20/50 | | | 21,302 | | | | 2,974,629 | |
| | |
Series 2020-181, Class TI, 2.00%, 12/20/50 | | | 88,678 | | | | 10,728,654 | |
| | |
Series 2020-185, Class BI, 2.00%, 12/20/50 | | | 17,762 | | | | 2,062,471 | |
| | |
Series 2021-9, Class GI, 2.00%, 1/20/51 | | | 43,639 | | | | 5,340,762 | |
| | |
Series 2021-15, Class AI, 2.00%, 1/20/51 | | | 23,812 | | | | 3,027,334 | |
| | |
Series 2021-23, Class TI, 2.50%, 2/20/51 | | | 12,486 | | | | 1,686,469 | |
| | |
Series 2021-30, Class AI, 2.00%, 2/20/51 | | | 10,037 | | | | 1,269,127 | |
| | |
Series 2021-46, Class IM, 2.50%, 3/20/51 | | | 5,001 | | | | 683,717 | |
| | |
Series 2021-56, Class SD, 0.016%, (2.30% -30-day average SOFR), 9/20/50(2) | | | 15,916 | | | | 190,667 | |
| | |
Series 2021-56, Class SE, 0.016%, (2.30% - 30-day average SOFR), 10/20/50(2) | | | 5,848 | | | | 70,696 | |
| | |
Series 2021-77, Class SB, 0.261%, (3.75% - 1 mo. USD LIBOR), 5/20/51(2) | | | 18,092 | | | | 557,052 | |
| | |
Series 2021-77, Class SE, 0.261%, (1 mo. USD LIBOR + 3.75%), 5/20/51(1) | | | 11,032 | | | | 338,881 | |
| | |
Series 2021-97, Class IG, 2.50%, 8/20/49 | | | 83,702 | | | | 9,303,976 | |
| | |
Series 2021-97, Class QI, 3.00%, 6/20/51 | | | 18,626 | | | | 2,631,343 | |
| | |
Series 2021-98, Class EI, 3.00%, 6/20/51 | | | 36,788 | | | | 5,048,399 | |
| | |
Series 2021-114, Class MI, 3.00%, 6/20/51 | | | 13,614 | | | | 1,949,047 | |
| | |
Series 2021-122, Class NI, 3.00%, 7/20/51 | | | 9,333 | | | | 1,339,693 | |
| | |
Series 2021-125, Class SA, 0.261%, (3.75% - 1 mo. USD LIBOR), 7/20/51(2) | | | 20,988 | | | | 625,091 | |
| | |
Series 2021-131, Class QI, 3.00%, 7/20/51 | | | 36,562 | | | | 4,387,821 | |
| | | | | | | | |
| Security | | Principal
Amount
(000’s omitted) | | | Value | |
| | |
| Interest Only: (continued) | | | | | | |
| | |
Series 2021-140, Class YS, 0.104%, (1.70% - 1 mo. USD LIBOR), 8/20/51(2) | | $ | 22,955 | | | $ | 167,575 | |
| | |
Series 2021-160, Class DI, 3.00%, 9/20/51 | | | 31,214 | | | | 5,072,413 | |
| | |
Series 2021-160, Class IT, 2.50%, 9/20/51 | | | 45,180 | | | | 5,302,929 | |
| | |
Series 2021-175, Class SA, 0.204%, (1.80% - 1 mo. USD LIBOR), 10/20/51(2) | | | 116,403 | | | | 906,488 | |
| | |
Series 2021-193, Class IU, 3.00%, 11/20/49 | | | 74,217 | | | | 9,585,870 | |
| | |
Series 2021-193, Class YS, 0.165%, (2.45% -30-day average SOFR), 11/20/51(2) | | | 55,027 | | | | 604,727 | |
| | |
Series 2021-196, Class GI, 3.00%, 11/20/51 | | | 34,820 | | | | 5,048,704 | |
| | |
Series 2021-201, Class PI, 3.00%, 11/20/51 | | | 31,275 | | | | 3,546,664 | |
| | |
Series 2021-209, Class IW, 3.00%, 11/20/51 | | | 19,624 | | | | 2,449,845 | |
| | |
Series 2022-104, Class IO, 2.50%, 6/20/51 | | | 28,920 | | | | 3,762,962 | |
| | |
Series 2022-119, Class CS, 0.08%, (3.00% - 30-day average SOFR), 7/20/52(2) | | | 223,287 | | | | 1,741,904 | |
| | |
Series 2022-119, Class SC, 0.08%, (3.00% - 30-day average SOFR), 7/20/52(2) | | | 24,810 | | | | 193,545 | |
| | |
Series 2022-126, Class AS, 0.77%, (3.69% - 30-day average SOFR), 7/20/52(2) | | | 66,584 | | | | 973,007 | |
| | |
Series 2022-126, Class SC, 0.81%, (3.73% - 30-day average SOFR), 7/20/52(2) | | | 49,619 | | | | 746,934 | |
| | |
Series 2022-135, Class SA, 0.08%, (3.00% - 30-day average SOFR), 6/20/52(2) | | | 138,549 | | | | 1,348,072 | |
| | |
| Principal Only:(4) | | | | | | |
| | |
Series 2009-117, Class PO, 0.00%, 12/16/39 | | | 855 | | | | 642,380 | |
| | |
Series 2010-88, Class OA, 0.00%, 7/20/40 | | | 557 | | | | 408,525 | |
| | |
Series 2015-24, Class KO, 0.00%, 6/20/35 | | | 712 | | | | 611,877 | |
| |
Total Collateralized Mortgage Obligations
(identified cost $1,628,949,351) | | | $ | 1,285,617,685 | |
|
| Government National Mortgage Association Participation Agreements — 8.1% | |
| Security | | Principal
Amount
(000’s omitted) | | | Value | |
| | |
Government National Mortgage Association Participation Agreement, 4.75%, (SOFR + 1.70%), 9/5/23(1)(7) | | $ | 474,663 | | | $ | 475,412,134 | |
| | |
Total Government National Mortgage Association Participation Agreements
(identified cost $474,662,641) | | | | | | $ | 475,412,134 | |
| | | | |
| | 11 | | See Notes to Financial Statements. |
Eaton Vance
Short Duration Government Income Fund
October 31, 2022
Portfolio of Investments — continued
| | | | | | | | |
| U.S. Government Agency Commercial Mortgage-Backed Securities — 0.3% | |
| Security | | Principal
Amount
(000’s omitted) | | | Value | |
| | |
FRESB Mortgage Trust: | | | | | | | | |
| | |
| Interest Only:(3) | | | | | | |
| | |
Series 2021-SB91, Class X1, 0.568%, 8/25/41(5) | | $ | 47,421 | | | $ | 1,292,757 | |
| | |
Series 2021-SB92, Class X1, 0.58%, 8/25/41(5) | | | 24,527 | | | | 683,455 | |
| | |
Government National Mortgage Association: | | | | | | | | |
| | |
| Interest Only:(3) | | | | | | |
| | |
Series 2021-101, Class IO, 0.686%, 4/16/63(5) | | | 57,910 | | | | 3,357,917 | |
| | |
Series 2021-132, Class IO, 0.727%, 4/16/63(5) | | | 59,315 | | | | 3,560,643 | |
| | |
Series 2021-144, Class IO, 0.825%, 4/16/63(5) | | | 52,592 | | | | 3,463,849 | |
| | |
Series 2021-186, Class IO, 0.764%, 5/16/63(5) | | | 48,569 | | | | 3,013,610 | |
| | |
Series 2022-3, Class IO, 0.64%, 2/16/61(5) | | | 69,044 | | | | 3,662,302 | |
| | |
Total U.S. Government Agency Commercial
Mortgage-Backed Securities
(identified cost $23,935,870) | | | | | | $ | 19,034,533 | |
|
| U.S. Government Agency Mortgage-Backed Securities — 99.6% | |
| Security | | Principal
Amount
(000’s omitted) | | | Value | |
| | |
| Federal Home Loan Mortgage Corp.: | | | | | | |
| | |
1.957%, (COF + 1.29%), with maturity at 2034(8) | | $ | 21 $ | | | | 21,003 | |
| | |
2.119%, (COF + 1.25%), with maturity at 2025(8) | | | 55 | | | | 54,341 | |
| | |
2.40%, (1 yr. CMT + 2.27%), with maturity at 2023(8) | | | 2 | | | | 1,965 | |
| | |
2.525%, (COF + 2.27%), with maturity at 2025(8) | | | 78 | | | | 76,876 | |
| | |
2.751%, (1 yr. CMT + 1.98%), with maturity at 2034(8) | | | 524 | | | | 527,601 | |
| | |
2.848%, (COF + 1.25%), with maturity at 2035(8) | | | 320 | | | | 311,596 | |
| | |
2.852%, (1 yr. CMT + 2.25%), with maturity at 2038(8) | | | 431 | | | | 437,968 | |
| | |
2.893%, (1 yr. CMT + 2.24%), with maturity at 2036(8) | | | 492 | | | | 499,634 | |
| | |
3.49%, (COF + 1.25%), with maturity at 2032(8) | | | 95 | | | | 91,067 | |
| | |
3.50%, with various maturities to 2052 | | | 76,518 | | | | 67,919,506 | |
| | |
3.579%, (1 yr. CMT + 2.26%), with maturity at 2035(8) | | | 1,520 | | | | 1,541,518 | |
| | |
3.68%, (1 yr. CMT + 2.31%), with maturity at 2036(8) | | | 557 | | | | 566,021 | |
| | |
4.00%, with maturity at 2050 | | | 809 | | | | 743,289 | |
| | |
4.052%, (COF + 2.29%), with maturity at 2037(8) | | | 479 | | | | 477,338 | |
| | |
4.06%, (COF + 1.25%), with maturity at 2029(8) | | | 6 | | | | 6,102 | |
| | |
4.171%, (5 yr. CMT + 2.51%), with maturity at 2032(8) | | | 162 | | | | 156,208 | |
| | |
4.208%, (30-day average SOFR + 2.37%), with maturity at 2052(8) | | | 1,548 | | | | 1,460,422 | |
| | |
4.345%, (30-day average SOFR + 2.13%), with maturity at 2052(8) | | | 7,079 | | | | 6,726,617 | |
| | | | | | | | |
| Security | | Principal
Amount
(000’s omitted) | | | Value | |
| | |
| Federal Home Loan Mortgage Corp.: (continued) | | | | | | |
| | |
4.41%, (30-day average SOFR + 2.38%), with maturity at 2052(8) | | $ | 3,916 | | | $ | 3,768,034 | |
| | |
4.426%, (COF + 1.25%), with maturity at 2030(8) | | | 143 | | | | 145,650 | |
| | |
4.50%, with various maturities to 2052 | | | 195,100 | | | | 183,326,956 | |
| | |
4.699%, (30-day average SOFR + 2.14%), with maturity at 2052(8) | | | 25,027 | | | | 24,322,337 | |
| | |
4.70%, (COF + 1.25%), with maturity at 2033(8) | | | 188 | | | | 188,663 | |
| | |
5.00%, with various maturities to 2052(9) | | | 344,049 | | | | 332,263,884 | |
| | |
5.00%, with various maturities to 2052 | | | 251,244 | | | | 243,013,579 | |
| | |
5.50%, with various maturities to 2052 | | | 584,977 | | | | 577,787,461 | |
| | |
6.00%, with maturity at 2029 | | | 118 | | | | 120,060 | |
| | |
7.00%, with maturity at 2033 | | | 82 | | | | 83,597 | |
| | |
| Federal National Mortgage Association: | | | | | | |
| | |
2.123%, (COF + 1.25%), with maturity at 2033(8) | | | 124 | | | | 118,763 | |
| | |
2.27%, (12 mo. MTA + 1.26%), with maturity at 2038(8) | | | 19 | | | | 18,824 | |
| | |
2.355%, (COF + 1.25%), with various maturities to 2027(8) | | | 105 | | | | 102,708 | |
| | |
2.439%, (COF + 1.25%), with maturity at 2037(8) | | | 75 | | | | 73,540 | |
| | |
2.585%, (COF + 2.20%), with maturity at 2030(8) | | | 48 | | | | 47,071 | |
| | |
2.80%, (COF + 1.69%), with maturity at 2029(8) | | | 1 | | | | 509 | |
| | |
2.827%, (12 mo. USD LIBOR + 1.75%), with maturity at 2035(8) | | | 397 | | | | 396,702 | |
| | |
2.914%, (COF + 1.31%), with maturity at 2036(8) | | | 67 | | | | 66,021 | |
| | |
3.00%, with various maturities to 2050 | | | 19,345 | | | | 16,690,855 | |
| | |
3.142%, (COF + 1.26%), with maturity at 2036(8) | | | 131 | | | | 129,730 | |
| | |
3.155%, (COF + 1.25%), with maturity at 2034(8) | | | 247 | | | | 247,600 | |
| | |
3.175%, (12 mo. USD LIBOR + 1.80%), with maturity at 2034(8) | | | 158 | | | | 158,832 | |
| | |
3.212%, (COF + 1.25%), with maturity at 2034(8) | | | 204 | | | | 204,603 | |
| | |
3.219%, (1 yr. CMT + 2.10%), with maturity at 2040(8) | | | 226 | | | | 227,987 | |
| | |
3.233%, (1 yr. CMT + 2.21%), with maturity at 2039(8) | | | 908 | | | | 926,535 | |
| | |
3.238%, (COF + 1.25%), with maturity at 2035(8) | | | 89 | | | | 89,035 | |
| | |
3.374%, (1 yr. CMT + 2.52%), with maturity at 2038(8) | | | 440 | | | | 450,160 | |
| | |
3.394%, (1 yr. CMT + 2.11%), with maturity at 2037(8) | | | 504 | | | | 514,265 | |
| | |
3.419%, (COF + 1.25%), with maturity at 2034(8) | | | 81 | | | | 80,833 | |
| | |
3.442%, (1 yr. CMT + 2.17%), with maturity at 2036(8) | | | 154 | | | | 156,821 | |
| | |
3.496%, (1 yr. CMT + 2.16%), with maturity at 2031(8) | | | 97 | | | | 96,246 | |
| | |
3.50%, 30-Year, TBA(10) | | | 175,500 | | | | 154,357,647 | |
| | |
3.50%, with various maturities to 2052 | | | 303,674 | | | | 269,742,088 | |
| | |
3.521%, (COF + 2.33%), with maturity at 2026(8) | | | 66 | | | | 65,866 | |
| | |
3.525%, (COF + 1.81%), with maturity at 2034(8) | | | 170 | | | | 170,194 | |
| | |
3.683%, (COF + 1.81%), with maturity at 2036(8) | | | 417 | | | | 416,989 | |
| | | | |
| | 12 | | See Notes to Financial Statements. |
Eaton Vance
Short Duration Government Income Fund
October 31, 2022
Portfolio of Investments — continued
| | | | | | | | |
| Security | | Principal
Amount
(000’s omitted) | | | Value | |
| | |
| Federal National Mortgage Association: (continued) | | | | | | |
| | |
3.996%, (COF + 1.74%), with maturity at 2035(8) | | $ | 219 | | | $ | 222,595 | |
| | |
4.00%, with various maturities to 2052 | | | 22,509 | | | | 20,635,958 | |
| | |
4.001%, (1 yr. CMT + 2.25%), with maturity at 2033(8) | | | 1,212 | | | | 1,237,569 | |
| | |
4.027%, (30-day average SOFR + 2.33%), with maturity at 2052(8) | | | 1,637 | | | | 1,544,621 | |
| | |
4.059%, (COF + 1.26%), with maturity at 2036(8) | | | 36 | | | | 36,762 | |
| | |
4.077%, (1 yr. CMT + 2.09%), with maturity at 2033(8) | | | 191 | | | | 194,801 | |
| | |
4.103%, (COF + 1.25%), with maturity at 2033(8) | | | 182 | | | | 183,715 | |
| | |
4.152%, (COF + 1.79%), with maturity at 2035(8) | | | 161 | | | | 162,685 | |
| | |
4.183%, (COF + 1.87%), with maturity at 2034(8) | | | 83 | | | | 83,844 | |
| | |
4.443%, (30-day average SOFR + 2.33%), with maturity at 2052(8) | | | 1,527 | | | | 1,474,984 | |
| | |
4.50%, with various maturities to 2052 | | | 175,372 | | | | 164,793,699 | |
| | |
4.628%, (30-day average SOFR + 2.13%), with maturity at 2052(8) | | | 37,938 | | | | 36,889,343 | |
| | |
4.635%, (30-day average SOFR + 2.13%), with maturity at 2052(8) | | | 47,774 | | | | 46,461,943 | |
| | |
4.675%, (COF + 1.49%), with maturity at 2029(8) | | | 255 | | | | 259,888 | |
| | |
4.79%, (COF + 1.73%), with maturity at 2034(8) | | | 57 | | | | 57,706 | |
| | |
5.00%, with various maturities to 2052 | | | 218,292 | | | | 210,919,227 | |
| | |
5.00%, with maturity at 2052(9) | | | 107,420 | | | | 103,693,517 | |
| | |
5.50%, with various maturities to 2052 | | | 585,841 | | | | 578,582,918 | |
| | |
5.50%, with various maturities to 2052(9) | | | 299,493 | | | | 296,748,743 | |
| | |
5.50%, 30-Year, TBA(10) | | | 174,225 | | | | 171,819,745 | |
| | |
6.00%, with various maturities to 2031 | | | 17 | | | | 17,433 | |
| | |
6.00%, 30-Year, TBA(10) | | | 8,225 | | | | 8,222,142 | |
| | |
6.334%, (COF + 2.00%), with maturity at 2032(8) | | | 31 | | | | 32,261 | |
| | |
| Government National Mortgage Association: | | | | | | |
| | |
1.75%, (1 yr. CMT + 1.50%), with various maturities to 2027(8) | | | 59 | | | | 57,560 | |
| | |
2.00%, (1 yr. CMT + 1.50%), with maturity at 2026(8) | | | 36 | | | | 35,069 | |
| | |
2.50%, with maturity at 2051 | | | 2,227 | | | | 1,879,013 | |
| | |
4.00%, with various maturities to 2052 | | | 10,549 | | | | 9,754,215 | |
| | |
4.50%, with various maturities to 2052 | | | 331,055 | | | | 310,836,766 | |
| | |
4.50%, 30-Year, TBA(10) | | | 185,000 | | | | 175,275,854 | |
| | |
5.00%, with various maturities to 2052 | | | 160,031 | | | | 155,697,380 | |
| | |
5.00%, 30-Year, TBA(10) | | | 805,450 | | | | 782,866,189 | |
| | |
5.50%, 30-Year, TBA(10) | | | 87,700 | | | | 87,188,696 | |
| | |
5.50%, with various maturities to 2062 | | | 34,517 | | | | 34,294,493 | |
| | |
5.50%, 30-Year, TBA(10) | | | 105,600 | | | | 104,712,557 | |
| | |
6.00%, 30-Year, TBA(10) | | | 166,000 | | | | 165,943,253 | |
| | |
6.00%, 30-Year, TBA(10) | | | 504,000 | | | | 505,953,932 | |
| |
Total U.S. Government Agency Mortgage-Backed
Securities
(identified cost $6,066,420,261) | | | $ | 5,870,960,793 | |
| | | | | | | | |
| U.S. Government Guaranteed Small Business Administration Pools & Loans — 3.2% | |
| Security | | Principal
Amount
(000’s omitted) | | | Value | |
| | |
3.875%, (USD Prime - 2.375%), 2/25/29(1) | | $ | 46,143 | | | $ | 46,278,889 | |
| | |
4.00%, (USD Prime - 2.25%), 1/25/44 to 2/25/44(1) | | | 44,309 | | | | 44,503,941 | |
| | |
4.05%, (USD Prime - 2.20%), 4/25/44(1) | | | 20,543 | | | | 20,687,145 | |
| | |
5.25%, (USD Prime - 1.00%), 4/25/44(1) | | | 24,533 | | | | 25,644,187 | |
| | |
5.575%, (USD Prime - 0.675%), 2/25/44(1) | | | 20,395 | | | | 21,626,651 | |
| | |
| Interest Only:(11)(12) | | | | | | |
| | |
1.03%, 1/18/39 | | | 407 | | | | 11,683 | |
| | |
1.26%, 2/15/44 | | | 1,461 | | | | 65,059 | |
| | |
1.51%, 2/15/44 | | | 1,072 | | | | 53,682 | |
| | |
1.56%, 3/14/44 | | | 538 | | | | 27,502 | |
| | |
1.68%, 11/1/43 | | | 1,583 | | | | 81,378 | |
| | |
1.76%, 12/18/28 | | | 104 | | | | 3,113 | |
| | |
1.81%, 7/10/43 to 2/6/44 | | | 5,316 | | | | 273,150 | |
| | |
1.88%, 12/18/43 to 12/27/43 | | | 5,933 | | | | 330,514 | |
| | |
1.91%, 7/15/42 to 4/15/44 | | | 17,904 | | | | 985,945 | |
| | |
1.93%, 6/14/43 to 2/8/44 | | | 24,321 | | | | 1,387,696 | |
| | |
2.01%, 3/12/29 to 2/15/44 | | | 3,794 | | | | 212,265 | |
| | |
2.06%, 3/15/29 to 3/15/44 | | | 12,938 | | | | 804,624 | |
| | |
2.13%, 9/14/43 to 1/9/44 | | | 5,034 | | | | 309,133 | |
| | |
2.16%, 3/15/42 to 4/15/44 | | | 2,665 | | | | 168,942 | |
| | |
2.168%, 11/1/32 to 5/16/43(13) | | | 58,133 | | | | 2,871,529 | |
| | |
2.18%, 12/3/28 to 2/15/44 | | | 16,054 | | | | 1,020,762 | |
| | |
2.26%, 12/28/28 to 1/15/44 | | | 3,192 | | | | 194,403 | |
| | |
2.31%, 12/15/28 to 4/15/44 | | | 24,298 | | | | 1,606,220 | |
| | |
2.38%, 8/31/28 to 12/27/43 | | | 3,213 | | | | 214,190 | |
| | |
2.41%, 6/15/42 to 4/15/44 | | | 18,522 | | | | 1,330,630 | |
| | |
2.43%, 5/7/28 to 2/12/44 | | | 10,284 | | | | 720,656 | |
| | |
2.48%, 3/15/44 | | | 2,588 | | | | 194,865 | |
| | |
2.504%, 2/21/33 to 4/1/43(13) | | | 14,815 | | | | 1,043,066 | |
| | |
2.51%, 7/12/28 to 1/15/44 | | | 3,528 | | | | 236,240 | |
| | |
2.56%, 12/15/28 to 9/18/44 | | | 19,601 | | | | 1,450,068 | |
| | |
2.61%, 4/15/29 | | | 67 | | | | 2,986 | |
| | |
2.63%, 9/13/42 to 1/11/44 | | | 3,710 | | | | 294,423 | |
| | |
2.66%, 6/15/42 to 4/15/44 | | | 13,660 | | | | 1,074,547 | |
| | |
2.68%, 10/19/28 to 2/19/44 | | | 17,884 | | | | 1,303,201 | |
| | |
2.721%, 3/21/23 to 12/13/42(13) | | | 20,008 | | | | 1,052,772 | |
| | |
2.76%, 10/1/28 to 2/15/44 | | | 9,836 | | | | 627,174 | |
| | |
2.81%, 3/15/29 to 4/24/44 | | | 21,537 | | | | 1,660,072 | |
| | |
2.88%, 12/3/43 to 12/27/43 | | | 3,514 | | | | 295,376 | |
| | |
2.91%, 3/15/44 | | | 681 | | | | 61,644 | |
| | |
2.93%, 10/1/28 to 1/23/44 | | | 5,121 | | | | 402,733 | |
| | |
3.01%, 10/13/28 to 1/15/44 | | | 1,575 | | | | 117,605 | |
| | |
3.06%, 1/15/29 to 2/21/44 | | | 1,529 | | | | 126,296 | |
| | |
3.13%, 9/29/43 to 1/31/44 | | | 7,866 | | | | 756,120 | |
| | |
3.156%, 1/21/24 to 7/28/42(13) | | | 11,731 | | | | 640,464 | |
| | | | |
| | 13 | | See Notes to Financial Statements. |
Eaton Vance
Short Duration Government Income Fund
October 31, 2022
Portfolio of Investments — continued
| | | | | | | | |
| Security | | Principal
Amount
(000’s omitted) | | | Value | |
| | |
| Interest Only: (continued) | | | | | | |
| | |
3.18%, 5/8/28 to 2/19/44 | | $ | 6,776 | | | $ | 533,569 | |
| | |
3.26%, 10/18/28 to 2/15/44 | | | 2,808 | | | | 226,228 | |
| | |
3.31%, 4/15/29 to 2/28/44 | | | 3,630 | | | | 405,304 | |
| | |
3.36%, 1/15/29 | | | 53 | | | | 2,978 | |
| | |
3.38%, 8/28/43 to 1/16/44 | | | 8,326 | | | | 907,729 | |
| | |
3.43%, 4/27/28 to 7/27/43 | | | 21,668 | | | | 1,531,103 | |
| | |
3.452%, 3/10/26 to 3/23/42(13) | | | 351 | | | | 29,256 | |
| | |
3.51%, 10/4/28 to 3/15/44 | | | 14,184 | | | | 1,243,690 | |
| | |
3.56%, 12/28/28 to 3/15/44 | | | 10,277 | | | | 821,872 | |
| | |
3.61%, 12/27/28 | | | 10 | | | | 640 | |
| | |
3.66%, 11/15/43 to 4/15/44 | | | 6,760 | | | | 763,774 | |
| | |
3.98%, 12/11/28 to 12/13/28 | | | 330 | | | | 22,890 | |
| | |
4.11%, 12/31/28 | | | 30 | | | | 2,144 | |
| |
Total U.S. Government Guaranteed Small Business
Administration Pools & Loans
(identified cost $205,874,094) | | | $ | 189,244,718 | |
|
| U.S. Department of Agriculture Loans — 0.1% | |
| Security | | Principal Amount (000’s omitted) | | | Value | |
| | |
| USDA Guaranteed Loan: | | | | | | |
| | |
5.75%, (USD Prime - 0.50%), 10/4/48(1) | | $ | 2,179 | | | $ | 2,179,229 | |
| | |
5.75%, (USD Prime - 0.50%), 4/12/50(1) | | | 2,504 | | | | 2,505,277 | |
| |
Total U.S. Department of Agriculture Loans
(identified cost $4,682,885) | | | $ | 4,684,506 | |
|
| Short-Term Investments — 0.7% | |
| Security | | Shares | | | Value | |
| | |
Morgan Stanley Institutional Liquidity Funds - Government Portfolio, Institutional Class, 2.88%(14) | | | 40,759,128 | | | $ | 40,759,128 | |
| | |
Total Short-Term Investments
(identified cost $40,759,128) | | | | | | $ | 40,759,128 | |
| | |
Total Purchased Swaptions — 0.8%
(identified cost $9,488,460) | | | | | | $ | 46,533,578 | |
| | |
Total Investments — 134.6%
(identified cost $8,454,772,690) | | | | | | $ | 7,932,247,075 | |
| | |
Total Written Options and Swaptions — (0.3)%
(premiums received $14,080,723) | | | | | | $ | (17,854,134 | ) |
| | | | | | | | |
| TBA Sale Commitments — (40.1)% | |
|
| U.S. Government Agency Mortgage-Backed Securities — (40.1)% | |
| Security | | Principal Amount (000’s omitted) | | | Value | |
| | |
Federal National Mortgage Association, 2.00%, 30-Year, TBA(10) | | $ | (200,000 | ) | | $ | (157,556,150 | ) |
| | |
Federal National Mortgage Association, 2.50%, 30-Year, TBA(10) | | | (239,000 | ) | | | (195,681,358 | ) |
| | |
Federal National Mortgage Association, 2.50%, 30-Year, TBA(10) | | | (538,000 | ) | | | (440,529,814 | ) |
| | |
Federal National Mortgage Association, 3.50%, 30-Year, TBA(10) | | | (550,000 | ) | | | (483,741,912 | ) |
| | |
Federal National Mortgage Association, 4.50%, 30-Year, TBA(10) | | | (1,040,000 | ) | | | (975,405,756 | ) |
| | |
Government National Mortgage Association, 2.00%, 30-Year, TBA(10) | | | (130,000 | ) | | | (106,679,189 | ) |
| | |
Total U.S. Government Agency Mortgage-Backed Securities
(proceeds $2,390,300,365) | | | | | | $ | (2,359,594,179 | ) |
| | |
Total TBA Sale Commitments
(proceeds $2,390,300,365) | | | | | | $ | (2,359,594,179 | ) |
| | |
Other Assets, Less Liabilities — 5.7% | | | | | | $ | 336,763,600 | |
| | |
Net Assets — 100.0% | | | | | | $ | 5,891,562,362 | |
The percentage shown for each investment category in the Portfolio of Investments is based on net assets.
| | (1) | Variable rate security. The stated interest rate represents the rate in effect at October 31, 2022. |
| | (2) | Inverse floating-rate security whose coupon varies inversely with changes in the interest rate index. The stated interest rate represents the coupon rate in effect at October 31, 2022. |
| | (3) | Interest only security that entitles the holder to receive only interest payments on the underlying mortgages. Principal amount shown is the notional amount of the underlying mortgages on which coupon interest is calculated. |
| | (4) | Principal only security that entitles the holder to receive only principal payments on the underlying mortgages. |
| | (5) | Weighted average fixed-rate coupon that changes/updates monthly. Rate shown is the rate at October 31, 2022. |
| | (6) | Principal amount is less than $500. |
| | (7) | Represents a participation interest, through a participation agreement with a financial institution, in mortgage loans guaranteed by Government National Mortgage Association. |
| | (8) | Adjustable rate mortgage security whose interest rate generally adjusts monthly based on a weighted average of interest rates on the underlying mortgages. The coupon rate may not reflect the applicable index value as interest rates on the underlying mortgages may adjust on various dates and at various intervals and may be subject to lifetime ceilings and lifetime floors and lookback periods. Rate shown is the coupon rate at October 31, 2022. |
| | | | |
| | 14 | | See Notes to Financial Statements. |
Eaton Vance
Short Duration Government Income Fund
October 31, 2022
Portfolio of Investments — continued
| | (9) | Security (or a portion thereof) has been pledged for the benefit of the counterparty for reverse repurchase agreements. |
| | (10) | TBA (To Be Announced) securities are purchased or sold on a forward commitment basis with an approximate principal amount and maturity date. The actual principal amount and maturity date are determined upon settlement. |
| | (11) | Interest only security that entitles the holder to receive only a portion of the interest payments on the underlying loans. Principal amount shown is the notional amount of the underlying loans on which coupon interest is calculated. |
| | (12) | Securities comprise a trust that is wholly-owned by the Fund and may only be sold on a pro-rata basis with all securities in the trust. |
| | (13) | The stated interest rate represents the weighted average fixed interest rate at October 31, 2022 of all interest only securities comprising the certificate. |
| | (14) | May be deemed to be an affiliated investment company. The rate shown is the annualized seven-day yield as of October 31, 2022. |
| | (15) | Amount is less than (0.05)%. |
| | | | | | | | | | | | | | |
| Purchased Interest Rate Swaptions (OTC) — 0.8% | |
| | | | |
| Description | | Counterparty | | Notional Amount | | | Expiration
Date | | Value | |
| | | | | |
| Option to enter into interest rate swap expiring 1/4/33 to pay 3.29% and receive SOFR | | Bank of America, N.A. | | USD | | | 234,000,000 | | | 12/30/22 | | $ | 11,092,718 | |
| | | | | |
| Option to enter into interest rate swap expiring 3/27/33 to pay 2.47% and receive SOFR | | Bank of America, N.A. | | USD | | | 125,000,000 | | | 3/23/23 | | | 13,495,220 | |
| | | | | |
| Option to enter into interest rate swap expiring 1/5/33 to pay 3.16% and receive SOFR | | Goldman Sachs International | | USD | | | 94,000,000 | | | 1/3/23 | | | 5,315,237 | |
| | | | | |
| Option to enter into interest rate swap expiring 3/9/28 to pay 1.88% and receive SOFR | | Goldman Sachs International | | USD | | | 180,000,000 | | | 3/7/23 | | | 16,630,403 | |
| | | | | |
Total | | | | | | | | | | | | $ | 46,533,578 | |
| | | | | | | | | | | | | | |
| Written Interest Rate Swaptions (OTC) — (0.0)%(15) | |
| | | | |
| Description | | Counterparty | | Notional Amount | | | Expiration
Date | | Value | |
| | | | | |
| Option to enter into interest rate swap expiring 1/4/33 to pay 2.29% and receive SOFR | | Bank of America, N.A. | | USD | | | (234,000,000 | ) | | 12/30/22 | | $ | (14,878 | ) |
| | | | | |
| Option to enter into interest rate swap expiring 3/8/53 to pay 1.13% and receive SOFR | | Bank of America, N.A. | | USD | | | (115,000,000 | ) | | 3/6/23 | | | (71,131 | ) |
| | | | | |
| Option to enter into interest rate swap expiring 3/27/33 to pay 1.87% and receive SOFR | | Bank of America, N.A. | | USD | | | (125,000,000 | ) | | 3/23/23 | | | (38,668 | ) |
| | | | | |
| Option to enter into interest rate swap expiring 1/5/33 to pay 2.16% and receive SOFR | | Goldman Sachs International | | USD | | | (94,000,000 | ) | | 1/3/23 | | | (3,961 | ) |
| | | | | |
| Option to enter into interest rate swap expiring 3/9/28 to pay 1.28% and receive SOFR | | Goldman Sachs International | | USD | | | (180,000,000 | ) | | 3/7/23 | | | (23,092 | ) |
| | | | | |
| Option to enter into interest rate swap expiring 3/9/23 to pay 1.88% and receive SOFR | | Goldman Sachs International | | USD | | | (180,000,000 | ) | | 3/7/23 | | | (71,215 | ) |
| | | | | |
| Option to enter into interest rate swap expiring 3/27/23 to pay 2.47% and receive SOFR | | JPMorgan Chase Bank, N.A. | | USD | | | (125,000,000 | ) | | 3/23/23 | | | (220,645 | ) |
| | | | | |
Total | | | | | | | | | | | | $ | (443,590 | ) |
| | | | |
| | 15 | | See Notes to Financial Statements. |
Eaton Vance
Short Duration Government Income Fund
October 31, 2022
Portfolio of Investments — continued
| | | | | | | | | | | | | | | | | | |
| Written Put Options (OTC) — (0.3)% | |
| | | | | |
| Description | | Counterparty | | Notional
Amount | | | Exercise
Price | | | Expiration
Date | | | Value | |
| | | | | |
| UMBS, 5.00%, 30-Year TBA | | Bank of America, N.A. | | $ | (275,000,000 | ) | | $ | 99.78125 | | | | 11/7/22 | | | $ | (8,804,139 | ) |
| | | | | |
| UMBS, 5.00%, 30-Year TBA | | JPMorgan Chase Bank, N.A. | | | (225,000,000 | ) | | | 100.40625 | | | | 11/7/22 | | | | (8,606,405 | ) |
| | | | | |
Total | | | | | | | | | | | | | | | | $ | (17,410,544 | ) |
| | | | | | | | | | | | | | | | | | | | |
| Futures Contracts | | | | |
| | | | | |
| Description | | Number of
Contracts | | | Position | | | Expiration
Date | | | Notional Amount | | | Value/Unrealized
Appreciation
(Depreciation) | |
Interest Rate Futures | | | | | | | | | | | | | | | | | | | | |
| | | | | |
| U.S. 5-Year Treasury Note | | | (4,674 | ) | | | Short | | | | 12/30/22 | | | $ | (498,219,187 | ) | | $ | 21,646,949 | |
| | | | | |
| U.S. 10-Year Treasury Note | | | (11,325 | ) | | | Short | | | | 12/20/22 | | | | (1,252,474,219 | ) | | | 77,938,684 | |
| | | | | |
| | | | | | | | | | | | | | | | | | | $ | 99,585,633 | |
| | | | | | | | | | | | | | | | | | | | | | | | | | |
| Interest Rate Swaps (Centrally Cleared) | |
| | | | | | | |
Notional Amount
(000’s omitted) | | Fund
Pays/
Receives
Floating
Rate | | | Floating Rate | | Annual
Fixed Rate | | Termination
Date | | | Value | | | Unamortized
Upfront
Receipts
(Payments) | | | Unrealized
Appreciation
(Depreciation) | |
| | | | | | | | |
| USD | | 450,000 | | | Receives | | | SOFR (pays quarterly) | | 3.07% (pays semi-annually) | | | 10/14/32 | | | $ | 27,947,630 | | | $ | — | | | $ | 27,947,630 | |
| | | | | | | | |
| USD | | 300,000 | | | Receives | | | 3-month USD LIBOR (pays semi-annually) | | 2.01% (pays semi-annually) | | | 2/16/52 | | | | 92,991,634 | | | | — | | | | 92,991,634 | |
| | | | | | | | |
| USD | | 300,000 | | | Receives | | | SOFR (pays annually) | | 1.92%
(pays annually) | | | 4/8/52 | | | | 82,992,270 | | | | — | | | | 82,992,270 | |
| | | | | | | | |
| USD | | 100,000 | | | Receives | | | SOFR (pays annually) | | 1.94%
(pays annually) | | | 4/21/52 | | | | 27,361,669 | | | | — | | | | 27,361,669 | |
| | | | | | | | |
| USD | | 100,000 | | | Receives | | | SOFR (pays annually) | | 1.89%
(pays annually) | | | 8/3/52 | | | | 28,064,691 | | | | (992 | ) | | | 28,063,699 | |
| | | | | | | | |
Total | | | | | | | | | | | | | | | | $ | 259,357,894 | | | $ | (992 | ) | | $ | 259,356,902 | |
| | | | | | | | | | | | | | | | | | | | | | | | |
| Credit Default Swaps - Buy Protection (Centrally Cleared) | | | | |
| | | | | | |
| Reference Entity | | Notional
Amount
(000’s omitted) | | | Contract
Annual
Fixed Rate | | | Termination
Date | | | Value | | | Unamortized
Upfront
Receipts
(Payments) | | | Unrealized
Appreciation
(Depreciation) | |
| | | | | | |
| Markit CDX North America Investment Grade | | | | | | | 1.00% | | | | | | | | | | | | | | | | | |
| Index (CDX.NA.IG.39.V1) | | $ | 1,200,000 | | | | (pays quarterly)(1) | | | | 12/20/27 | | | $ | (6,643,306 | ) | | $ | (5,291,660 | ) | | $ | (11,934,966 | ) |
| | | | | | |
Total | | | | | | | | | | | | | | $ | (6,643,306 | ) | | $ | (5,291,660 | ) | | $ | (11,934,966 | ) |
| (1) | Upfront payment is exchanged with the counterparty as a result of the standardized trading coupon. |
| | | | |
| | 16 | | See Notes to Financial Statements. |
Eaton Vance
Short Duration Government Income Fund
October 31, 2022
Portfolio of Investments — continued
Abbreviations:
| | | | | | |
| | | |
CMT | | – | | Constant Maturity Treasury | | |
| | | |
| COF | | – | | Cost of Funds 11th District | | |
| | | |
| LIBOR | | – | | London Interbank Offered Rate | | |
| | | |
| MTA | | – | | Monthly Treasury Average | | |
| | | |
| SOFR | | – | | Secured Overnight Financing Rate | | |
| | | |
| TBA | | – | | To Be Announced | | |
| | | |
| UMBS | | – | | Uniform Mortgaged-Backed Securities | | |
Currency Abbreviations:
| | | | | | |
| | | |
USD | | – | | United States Dollar | | |
| | | | |
| | 17 | | See Notes to Financial Statements. |
Eaton Vance
Short Duration Government Income Fund
October 31, 2022
Statement of Assets and Liabilities
| | | | |
| Assets | | October 31, 2022 | |
| |
Unaffiliated investments, at value (identified cost $8,414,013,562) | | $ | 7,891,487,947 | |
| |
Affiliated investment, at value (identified cost $40,759,128) | | | 40,759,128 | |
| |
Cash | | | 328,567,501 | |
| |
Deposits for forward purchase commitments | | | 19,933,856 | |
| |
Deposits for reverse repurchase agreements | | | 4,345,000 | |
| |
Deposits for derivatives collateral: | | | | |
| |
Futures contracts | | | 29,661,000 | |
| |
Centrally cleared swap contracts | | | 104,820,333 | |
| |
OTC options and swaptions | | | 46,930,000 | |
| |
Interest receivable | | | 37,809,325 | |
| |
Dividends receivable from affiliated investment | | | 450,835 | |
| |
Receivable for investments sold | | | 1,611,832,164 | |
| |
Receivable for TBA sale commitments | | | 2,390,300,365 | |
| |
Receivable for Fund shares sold | | | 25,326,186 | |
| |
Receivable for variation margin on open futures contracts | | | 5,915,438 | |
| |
Receivable for variation margin on open centrally cleared swap contracts | | | 12,815,641 | |
| |
Total assets | | $ | 12,550,954,719 | |
|
| Liabilities | |
| |
Payable for reverse repurchase agreements, including accrued interest of $163,860 | | $ | 555,410,235 | |
| |
Cash collateral due to brokers | | | 54,157,856 | |
| |
Written options and swaptions outstanding, at value (premiums received $14,080,723) | | | 17,854,134 | |
| |
Payable for forward commitment securities | | | 3,619,028,711 | |
| |
TBA sale commitments, at value (proceeds receivable $2,390,300,365) | | | 2,359,594,179 | |
| |
Payable for Fund shares redeemed | | | 46,713,170 | |
| |
Distributions payable | | | 2,352,465 | |
| |
Payable to affiliates: | | | | |
| |
Investment adviser fee | | | 2,367,672 | |
| |
Distribution and service fees | | | 292,051 | |
| |
Trustees’ fees | | | 9,063 | |
| |
Accrued expenses | | | 1,612,821 | |
| |
Total liabilities | | $ | 6,659,392,357 | |
| |
Net Assets | | $ | 5,891,562,362 | |
|
| Sources of Net Assets | |
| |
Paid-in capital | | $ | 6,452,592,854 | |
| |
Accumulated loss | | | (561,030,492 | ) |
| |
Net Assets | | $ | 5,891,562,362 | |
|
| Advisers Class Shares | |
| |
Net Assets | | $ | 201,055,931 | |
| |
Shares Outstanding | | | 26,426,592 | |
| |
Net Asset Value, Offering Price and Redemption Price Per Share | | | | |
| |
(net assets ÷ shares of beneficial interest outstanding) | | $ | 7.61 | |
|
| Class A Shares | |
| |
Net Assets | | $ | 879,760,055 | |
| |
Shares Outstanding | | | 115,559,436 | |
| |
Net Asset Value and Redemption Price Per Share | | | | |
| |
(net assets ÷ shares of beneficial interest outstanding) | | $ | 7.61 | |
| |
Maximum Offering Price Per Share | | | | |
| |
(100 ÷ 97.75 of net asset value per share) | | $ | 7.79 | |
| | | | |
| | 18 | | See Notes to Financial Statements. |
Eaton Vance
Short Duration Government Income Fund
October 31, 2022
Statement of Assets and Liabilities — continued
| | | | |
| Class C Shares | | | October 31, 2022 | |
| |
Net Assets | | $ | 72,212,035 | |
| |
Shares Outstanding | | | 9,472,293 | |
| |
Net Asset Value and Offering Price Per Share* | | | | |
| |
(net assets ÷ shares of beneficial interest outstanding) | | $ | 7.62 | |
|
| Class I Shares | |
| |
Net Assets | | $ | 4,738,534,341 | |
| |
Shares Outstanding | | | 623,173,674 | |
| |
Net Asset Value, Offering Price and Redemption Price Per Share | | | | |
| |
(net assets ÷ shares of beneficial interest outstanding) | | $ | 7.60 | |
On sales of $100,000 or more, the offering price of Class A shares is reduced.
| * | Redemption price per share is equal to the net asset value less any applicable contingent deferred sales charge. |
| | | | |
| | 19 | | See Notes to Financial Statements. |
Eaton Vance
Short Duration Government Income Fund
October 31, 2022
Statement of Operations
| | | | |
| Investment Income | | Year Ended October 31, 2022 | |
| |
Dividend income from affiliated investments | | $ | 5,917,767 | |
| |
Interest income | | | 185,680,755 | |
| |
Total investment income | | $ | 191,598,522 | |
| |
| Expenses | | | | |
| |
Investment adviser fee | | $ | 35,745,400 | |
| |
Distribution and service fees: | | | | |
| |
Advisers Class | | | 705,840 | |
| |
Class A | | | 3,383,650 | |
| |
Class C | | | 732,929 | |
| |
Trustees’ fees and expenses | | | 108,500 | |
| |
Custodian fee | | | 1,259,399 | |
| |
Transfer and dividend disbursing agent fees | | | 2,633,796 | |
| |
Legal and accounting services | | | 469,584 | |
| |
Printing and postage | | | 551,450 | |
| |
Registration fees | | | 301,045 | |
| |
Interest expense and fees | | | 968,967 | |
| |
Miscellaneous | | | 347,840 | |
| |
Total expenses | | $ | 47,208,400 | |
| |
Deduct: | | | | |
| |
Waiver and/or reimbursement of expenses by affiliate | | $ | 543,117 | |
| |
Total expense reductions | | $ | 543,117 | |
| |
Net expenses | | $ | 46,665,283 | |
| |
Net investment income | | $ | 144,933,239 | |
| |
| Realized and Unrealized Gain (Loss) | | | | |
| |
Net realized gain (loss): | | | | |
| |
Investment transactions | | $ | (461,750,998 | ) |
| |
Investment transactions - affiliated investments | | | (188,098 | ) |
| |
Written options and swaptions | | | 11,904,634 | |
| |
Futures contracts | | | 195,731,401 | |
| |
Swap contracts | | | (1,521,002 | ) |
| |
Net realized loss | | $ | (255,824,063 | ) |
| |
Change in unrealized appreciation (depreciation): | | | | |
| |
Investments | | $ | (423,185,366 | ) |
| |
Written options and swaptions | | | 3,166,729 | |
| |
TBA sale commitments | | | 29,880,616 | |
| |
Futures contracts | | | 64,352,836 | |
| |
Swap contracts | | | 247,421,936 | |
| |
Net change in unrealized appreciation (depreciation) | | $ | (78,363,249 | ) |
| |
Net realized and unrealized loss | | $ | (334,187,312 | ) |
| |
Net decrease in net assets from operations | | $ | (189,254,073 | ) |
| | | | |
| | 20 | | See Notes to Financial Statements. |
Eaton Vance
Short Duration Government Income Fund
October 31, 2022
Statements of Changes in Net Assets
| | | | | | | | |
| | | Year Ended October 31, | |
| Increase (Decrease) in Net Assets | | 2022 | | | 2021 | |
| | |
From operations: | | | | | | | | |
| | |
Net investment income | | $ | 144,933,239 | | | $ | 111,757,591 | |
| | |
Net realized loss | | | (255,824,063 | ) | | | (70,401,149 | ) |
| | |
Net change in unrealized appreciation (depreciation) | | | (78,363,249 | ) | | | (33,043,587 | ) |
| | |
Net increase (decrease) in net assets from operations | | $ | (189,254,073 | ) | | $ | 8,312,855 | |
| | |
Distributions to shareholders: | | | | | | | | |
| | |
Advisers Class | | $ | (5,106,640 | ) | | $ | (1,183,676 | )(1) |
| | |
Class A | | | (23,856,615 | ) | | | (33,424,816 | ) |
| | |
Class C | | | (1,110,912 | ) | | | (1,035,440 | ) |
| | |
Class I | | | (124,075,281 | ) | | | (127,267,351 | ) |
| | |
Total distributions to shareholders | | $ | (154,149,448 | ) | | $ | (162,911,283 | ) |
| | |
Tax return of capital to shareholders: | | | | | | | | |
| | |
Advisers Class | | $ | (595,669 | ) | | $ | (79,612 | )(1) |
| | |
Class A | | | (2,607,488 | ) | | | (1,916,162 | ) |
| | |
Class C | | | (131,406 | ) | | | (55,636 | ) |
| | |
Class I | | | (13,935,767 | ) | | | (7,173,558 | ) |
| | |
Total tax return of capital to shareholders | | $ | (17,270,330 | ) | | $ | (9,224,968 | ) |
| | |
Transactions in shares of beneficial interest: | | | | | | | | |
| | |
Advisers Class | | $ | (62,059,678 | ) | | $ | 278,094,952 | (1) |
| | |
Class A | | | (1,079,149,132 | ) | | | 291,233,772 | |
| | |
Class C | | | (27,197,878 | ) | | | (39,452,008 | ) |
| | |
Class I | | | (2,659,546,385 | ) | | | 1,039,283,487 | |
| | |
Net increase (decrease) in net assets from Fund share transactions | | $ | (3,827,953,073 | ) | | $ | 1,569,160,203 | |
| | |
Net increase (decrease) in net assets | | $ | (4,188,626,924 | ) | | $ | 1,405,336,807 | |
|
| Net Assets | |
| | |
At beginning of year | | $ | 10,080,189,286 | | | $ | 8,674,852,479 | |
| | |
At end of year | | $ | 5,891,562,362 | | | $ | 10,080,189,286 | |
| (1) | For the period from the commencement of operations, May 17, 2021, to October 31, 2021. |
| | | | |
| | 21 | | See Notes to Financial Statements. |
Eaton Vance
Short Duration Government Income Fund
October 31, 2022
Financial Highlights
| | | | | | | | |
| | | Advisers Class | |
| | | Year Ended
October 31, 2022 | | | Period Ended
October 31, 2021(1) | |
| | |
Net asset value — Beginning of period | | $ | 7.990 | | | $ | 8.100 | |
|
| Income (Loss) From Operations | |
| | |
Net investment income(2) | | $ | 0.133 | | | $ | 0.033 | |
| | |
Net realized and unrealized loss | | | (0.349 | ) | | | (0.089 | ) |
| | |
Total loss from operations | | $ | (0.216 | ) | | $ | (0.056 | ) |
|
| Less Distributions | |
| | |
From net investment income | | $ | (0.147 | ) | | $ | (0.051 | ) |
| | |
Tax return of capital | | | (0.017 | ) | | | (0.003 | ) |
| | |
Total distributions | | $ | (0.164 | ) | | $ | (0.054 | ) |
| | |
Net asset value — End of period | | $ | 7.610 | | | $ | 7.990 | |
| | |
Total Return(3) | | | (2.73 | )% | | | (0.70 | )%(4) |
|
| Ratios/Supplemental Data | |
| | |
Net assets, end of period (000’s omitted) | | $ | 201,056 | | | $ | 276,067 | |
| | |
Ratios (as a percentage of average daily net assets): | | | | | | | | |
| | |
Expenses | | | 0.79 | %(5)(9) | | | 0.75 | %(6) |
| | |
Net investment income | | | 1.69 | % | | | 0.90 | %(6) |
| | |
Portfolio Turnover of the Fund | | | 798 | %(8) | | | 310 | %(7)(8) |
| (1) | For the period from the commencement of operations, May 17, 2021, to October 31, 2021. |
| (2) | Computed using average shares outstanding. |
| (3) | Returns are historical and are calculated by determining the percentage change in net asset value with all distributions reinvested. |
| (5) | Includes a reduction by the investment adviser of a portion of its adviser fee due to the Fund’s investment in the Liquidity Fund (equal to less than 0.01% of average daily net assets for the year ended October 31, 2022). |
| (7) | For the year ended October 31, 2021. |
| (8) | Includes the effect of To Be Announced (TBA) transactions. |
| (9) | Includes interest expense, including on reverse repurchase agreements, of 0.01% of average daily net assets for the year ended October 31, 2022. |
| | | | |
| | 22 | | See Notes to Financial Statements. |
Eaton Vance
Short Duration Government Income Fund
October 31, 2022
Financial Highlights — continued
| | | | | | | | | | | | | | | | | | | | |
| | | Class A | |
| |
| | | Year Ended October 31, | |
| | | 2022 | | | 2021 | | | 2020 | | | 2019 | | | 2018 | |
| | | | | | |
Net asset value — Beginning of year | | $ | 8.000 | | | $ | 8.120 | | | $ | 8.100 | | | $ | 8.200 | | | $ | 8.250 | |
| | | | | |
| Income (Loss) From Operations | | | | | | | | | | | | | | | | | | | | |
| | | | | |
Net investment income(1) | | $ | 0.127 | | | $ | 0.072 | | | $ | 0.097 | | | $ | 0.202 | | | $ | 0.219 | |
| | | | | |
Net realized and unrealized gain (loss) | | | (0.353 | ) | | | (0.072 | ) | | | 0.104 | | | | (0.057 | ) | | | (0.068 | ) |
| | | | | |
Total income (loss) from operations | | $ | (0.226 | ) | | $ | — | | | $ | 0.201 | | | $ | 0.145 | | | $ | 0.151 | |
| | | | | |
| Less Distributions | | | | | | | | | | | | | | | | | | | | |
| | | | | |
From net investment income | | $ | (0.147 | ) | | $ | (0.114 | ) | | $ | (0.166 | ) | | $ | (0.245 | ) | | $ | (0.201 | ) |
| | | | | |
From net realized gain | | | — | | | | — | | | | (0.015 | ) | | | — | | | | — | |
| | | | | |
Tax return of capital | | | (0.017 | ) | | | (0.006 | ) | | | — | | | | — | | | | — | |
| | | | | |
Total distributions | | $ | (0.164 | ) | | $ | (0.120 | ) | | $ | (0.181 | ) | | $ | (0.245 | ) | | $ | (0.201 | ) |
| | | | | |
Net asset value — End of year | | $ | 7.610 | | | $ | 8.000 | | | $ | 8.120 | | | $ | 8.100 | | | $ | 8.200 | |
| | | | | |
Total Return(2) | | | (2.85 | )% | | | (0.01 | )% | | | 2.51 | % | | | 1.78 | % | | | 1.85 | % |
| | | | | |
| Ratios/Supplemental Data | | | | | | | | | | | | | | | | | | | | |
| | | | | |
Net assets, end of year (000’s omitted) | | $ | 879,760 | | | $ | 2,018,166 | | | $ | 1,764,637 | | | $ | 795,015 | | | $ | 394,465 | |
| | | | | |
Ratios (as a percentage of average daily net assets):(3) | | | | | | | | | | | | | | | | | | | | |
| | | | | |
Expenses | | | 0.79 | %(4)(5) | | | 0.77 | % | | | 0.82 | %(5) | | | 0.85 | %(5) | | | 0.90 | % |
| | | | | |
Net investment income | | | 1.61 | % | | | 0.89 | % | | | 1.19 | % | | | 2.47 | % | | | 2.67 | % |
| | | | | |
Portfolio Turnover of the Fund | | | 798 | %(7) | | | 310 | %(7) | | | 152 | %(7) | | | 59 | % | | | 42 | %(6) |
| (1) | Computed using average shares outstanding. |
| (2) | Returns are historical and are calculated by determining the percentage change in net asset value with all distributions reinvested and do not reflect the effect of sales charges. |
| (3) | Includes the Fund’s share of the Portfolio’s/Portfolios’ allocated expenses for the period while the Fund was investing in the Portfolio/Portfolios. |
| (4) | Includes a reduction by the investment adviser of a portion of its adviser fee due to the Fund’s investment in the Liquidity Fund (equal to less than 0.01% of average daily net assets for the year ended October 31, 2022). |
| (5) | Includes interest expense, including on reverse repurchase agreements, of 0.01%, 0.02% and 0.02% of average daily net assets for the years ended October 31, 2022, 2020 and 2019, respectively. |
| (6) | Represents the portfolio turnover of Short-Term U.S. Government Portfolio from November 1, 2017 to October 12, 2018. The portfolio turnover based on the Fund’s investments in securities for the period October 15, 2018, the date the Fund began investing its assets directly, through October 31, 2018 was less than 1%. |
| (7) | Includes the effect of To Be Announced (TBA) transactions. |
References to Portfolios herein are to Massachusetts business trusts managed by Eaton Vance Management or its affiliates in which the Fund invested a substantial portion of its investable assets during the year ended October 31, 2018 and fiscal years prior thereto.
| | | | |
| | 23 | | See Notes to Financial Statements. |
Eaton Vance
Short Duration Government Income Fund
October 31, 2022
Financial Highlights — continued
| | | | | | | | | | | | | | | | | | | | |
| | | Class C | |
| |
| | | Year Ended October 31, | |
| | | 2022 | | | 2021 | | | 2020 | | | 2019 | | | 2018 | |
| | | | | | |
Net asset value — Beginning of year | | $ | 8.010 | | | $ | 8.130 | | | $ | 8.110 | | | $ | 8.210 | | | $ | 8.260 | |
| | | | | |
| Income (Loss) From Operations | | | | | | | | | | | | | | | | | | | | |
| | | | | |
Net investment income(1) | | $ | 0.088 | | | $ | 0.024 | | | $ | 0.054 | | | $ | 0.154 | | | $ | 0.169 | |
| | | | | |
Net realized and unrealized gain (loss) | | | (0.361 | ) | | | (0.073 | ) | | | 0.098 | | | | (0.058 | ) | | | (0.067 | ) |
| | | | | |
Total income (loss) from operations | | $ | (0.273 | ) | | $ | (0.049 | ) | | $ | 0.152 | | | $ | 0.096 | | | $ | 0.102 | |
| | | | | |
| Less Distributions | | | | | | | | | | | | | | | | | | | | |
| | | | | |
From net investment income | | $ | (0.104 | ) | | $ | (0.067 | ) | | $ | (0.117 | ) | | $ | (0.196 | ) | | $ | (0.152 | ) |
| | | | | |
From net realized gain | | | — | | | | — | | | | (0.015 | ) | | | — | | | | — | |
| | | | | |
Tax return of capital | | | (0.013 | ) | | | (0.004 | ) | | | — | | | | — | | | | — | |
| | | | | |
Total distributions | | $ | (0.117 | ) | | $ | (0.071 | ) | | $ | (0.132 | ) | | $ | (0.196 | ) | | $ | (0.152 | ) |
| | | | | |
Net asset value — End of year | | $ | 7.620 | | | $ | 8.010 | | | $ | 8.130 | | | $ | 8.110 | | | $ | 8.210 | |
| | | | | |
Total Return(2) | | | (3.43 | )% | | | (0.60 | )% | | | 1.89 | % | | | 1.18 | % | | | 1.24 | % |
| | | | | |
| Ratios/Supplemental Data | | | | | | | | | | | | | | | | | | | | |
| | | | | |
Net assets, end of year (000’s omitted) | | $ | 72,212 | | | $ | 103,518 | | | $ | 144,742 | | | $ | 112,868 | | | $ | 66,706 | |
| | | | | |
Ratios (as a percentage of average daily net assets):(3) | | | | | | | | | | | | | | | | | | | | |
| | | | | |
Expenses | | | 1.39 | %(4)(5) | | | 1.37 | % | | | 1.42 | %(5) | | | 1.45 | %(5) | | | 1.50 | % |
| | | | | |
Net investment income | | | 1.11 | % | | | 0.30 | % | | | 0.67 | % | | | 1.88 | % | | | 2.05 | % |
| | | | | |
Portfolio Turnover of the Fund | | | 798 | %(7) | | | 310 | %(7) | | | 152 | %(7) | | | 59 | % | | | 42 | %(6) |
| (1) | Computed using average shares outstanding. |
| (2) | Returns are historical and are calculated by determining the percentage change in net asset value with all distributions reinvested and do not reflect the effect of sales charges. |
| (3) | Includes the Fund’s share of the Portfolio’s/Portfolios’ allocated expenses for the period while the Fund was investing in the Portfolio/Portfolios. |
| (4) | Includes a reduction by the investment adviser of a portion of its adviser fee due to the Fund’s investment in the Liquidity Fund (equal to less than 0.01% of average daily net assets for the year ended October 31, 2022). |
| (5) | Includes interest expense, including on reverse repurchase agreements, of 0.01%, 0.02% and 0.02% of average daily net assets for the years ended October 31, 2022, 2020 and 2019, respectively. |
| (6) | Represents the portfolio turnover of Short-Term U.S. Government Portfolio from November 1, 2017 to October 12, 2018. The portfolio turnover based on the Fund’s investments in securities for the period October 15, 2018, the date the Fund began investing its assets directly, through October 31, 2018 was less than 1%. |
| (7) | Includes the effect of To Be Announced (TBA) transactions. |
References to Portfolios herein are to Massachusetts business trusts managed by Eaton Vance Management or its affiliates in which the Fund invested a substantial portion of its investable assets during the year ended October 31, 2018 and fiscal years prior thereto.
| | | | |
| | 24 | | See Notes to Financial Statements. |
Eaton Vance
Short Duration Government Income Fund
October 31, 2022
Financial Highlights — continued
| | | | | | | | | | | | | | | | | | | | |
| | | Class I | |
| |
| | | Year Ended October 31, | |
| | | 2022 | | | 2021 | | | 2020 | | | 2019 | | | 2018 | |
| | | | | | |
Net asset value — Beginning of year | | $ | 7.990 | | | $ | 8.110 | | | $ | 8.090 | | | $ | 8.190 | | | $ | 8.240 | |
| | | | | |
| Income (Loss) From Operations | | | | | | | | | | | | | | | | | | | | |
| | | | | |
Net investment income(1) | | $ | 0.153 | | | $ | 0.093 | | | $ | 0.118 | | | $ | 0.223 | | | $ | 0.243 | |
| | | | | |
Net realized and unrealized gain (loss) | | | (0.359 | ) | | | (0.073 | ) | | | 0.103 | | | | (0.058 | ) | | | (0.071 | ) |
| | | | | |
Total income (loss) from operations | | $ | (0.206 | ) | | $ | 0.020 | | | $ | 0.221 | | | $ | 0.165 | | | $ | 0.172 | |
| | | | | |
| Less Distributions | | | | | | | | | | | | | | | | | | | | |
| | | | | |
From net investment income | | $ | (0.165 | ) | | $ | (0.133 | ) | | $ | (0.186 | ) | | $ | (0.265 | ) | | $ | (0.222 | ) |
| | | | | |
From net realized gain | | | — | | | | — | | | | (0.015 | ) | | | — | | | | — | |
| | | | | |
Tax return of capital | | | (0.019 | ) | | | (0.007 | ) | | | — | | | | — | | | | — | |
| | | | | |
Total distributions | | $ | (0.184 | ) | | $ | (0.140 | ) | | $ | (0.201 | ) | | $ | (0.265 | ) | | $ | (0.222 | ) |
| | | | | |
Net asset value — End of year | | $ | 7.600 | | | $ | 7.990 | | | $ | 8.110 | | | $ | 8.090 | | | $ | 8.190 | |
| | | | | |
Total Return(2) | | | (2.49 | )% | | | 0.24 | % | | | 2.76 | % | | | 2.04 | % | | | 2.11 | % |
| | | | | |
| Ratios/Supplemental Data | | | | | | | | | | | | | | | | | | | | |
| | | | | |
Net assets, end of year (000’s omitted) | | $ | 4,738,534 | | | $ | 7,682,437 | | | $ | 6,765,473 | | | $ | 3,605,659 | | | $ | 1,282,116 | |
| | | | | |
Ratios (as a percentage of average daily net assets):(3) | | | | | | | | | | | | | | | | | | | | |
| | | | | |
Expenses | | | 0.54 | %(4)(5) | | | 0.52 | % | | | 0.57 | %(5) | | | 0.60 | %(5) | | | 0.65 | % |
| | | | | |
Net investment income | | | 1.94 | % | | | 1.15 | % | | | 1.46 | % | | | 2.73 | % | | | 2.96 | % |
| | | | | |
Portfolio Turnover of the Fund | | | 798 | %(7) | | | 310 | %(7) | | | 152 | %(7) | | | 59 | % | | | 42 | %(6) |
| (1) | Computed using average shares outstanding. |
| (2) | Returns are historical and are calculated by determining the percentage change in net asset value with all distributions reinvested. |
| (3) | Includes the Fund’s share of the Portfolio’s/Portfolios’ allocated expenses for the period while the Fund was investing in the Portfolio/Portfolios. |
| (4) | Includes a reduction by the investment adviser of a portion of its adviser fee due to the Fund’s investment in the Liquidity Fund (equal to less than 0.01% of average daily net assets for the year ended October 31, 2022). |
| (5) | Includes interest expense, including on reverse repurchase agreements, of 0.01%, 0.02% and 0.02% of average daily net assets for the years ended October 31, 2022, 2020 and 2019, respectively. |
| (6) | Represents the portfolio turnover of Short-Term U.S. Government Portfolio from November 1, 2017 to October 12, 2018. The portfolio turnover based on the Fund’s investments in securities for the period October 15, 2018, the date the Fund began investing its assets directly, through October 31, 2018 was less than 1%. |
| (7) | Includes the effect of To Be Announced (TBA) transactions. |
References to Portfolios herein are to Massachusetts business trusts managed by Eaton Vance Management or its affiliates in which the Fund invested a substantial portion of its investable assets during the year ended October 31, 2018 and fiscal years prior thereto.
| | | | |
| | 25 | | See Notes to Financial Statements. |
Eaton Vance
Short Duration Government Income Fund
October 31, 2022
Notes to Financial Statements
1 Significant Accounting Policies
Eaton Vance Short Duration Government Income Fund (the Fund) is a diversified series of Eaton Vance Mutual Funds Trust (the Trust). The Trust is a Massachusetts business trust registered under the Investment Company Act of 1940, as amended (the 1940 Act), as an open-end management investment company. The Fund’s investment objective is to seek total return. The Fund offers four classes of shares. Class A shares are generally sold subject to a sales charge imposed at time of purchase. Class C shares are sold at net asset value and are generally subject to a contingent deferred sales charge (see Note 5). Effective November 5, 2020, Class C shares automatically convert to Class A shares eight years after their purchase as described in the Fund’s prospectus. Advisers Class and Class I shares are sold at net asset value and are not subject to a sales charge. Each class represents a pro-rata interest in the Fund, but votes separately on class-specific matters and (as noted below) is subject to different expenses. Realized and unrealized gains and losses are allocated daily to each class of shares based on the relative net assets of each class to the total net assets of the Fund. Net investment income, other than class-specific expenses, is allocated daily to each class of shares based upon the ratio of the value of each class’s paid shares to the total value of all paid shares. Each class of shares differs in its distribution plan and certain other class-specific expenses.
The following is a summary of significant accounting policies of the Fund. The policies are in conformity with accounting principles generally accepted in the United States of America (U.S. GAAP). The Fund is an investment company and follows accounting and reporting guidance in the Financial Accounting Standards Board (FASB) Accounting Standards Codification Topic 946.
A Investment Valuation — The following methodologies are used to determine the market value or fair value of investments.
Debt Obligations. Debt obligations are generally valued on the basis of valuations provided by third party pricing services, as derived from such services’ pricing models. Inputs to the models may include, but are not limited to, reported trades, executable bid and ask prices, broker/dealer quotations, prices or yields of securities with similar characteristics, interest rates, anticipated prepayments, benchmark curves or information pertaining to the issuer, as well as industry and economic events. The pricing services may use a matrix approach, which considers information regarding securities with similar characteristics to determine the valuation for a security. Short-term debt obligations purchased with a remaining maturity of sixty days or less for which a valuation from a third party pricing service is not readily available may be valued at amortized cost, which approximates fair value.
Derivatives. U.S. exchange-traded options are valued at the mean between the bid and ask prices at valuation time as reported by the Options Price Reporting Authority. Non-U.S. exchange-traded options and over-the-counter options are valued by a third party pricing service using techniques that consider factors including the value of the underlying instrument, the volatility of the underlying instrument and the period of time until option expiration. Futures contracts are valued at the closing settlement price established by the board of trade or exchange on which they are traded. Swaps and options on interest rate swaps (“swaptions”) are normally valued using valuations provided by a third party pricing service. Such pricing service valuations are based on the present value of fixed and projected floating rate cash flows over the term of the swap contract, and in the case of credit default swaps, based on credit spread quotations obtained from broker/dealers and expected default recovery rates determined by the pricing service using proprietary models. Future cash flows on swaps are discounted to their present value using swap rates provided by electronic data services or by broker/dealers. Alternatively, swaptions may be valued at the valuation provided by a broker/dealer (usually the counterparty to the option), so determined using similar techniques as those employed by the pricing service.
Other. Investments in management investment companies (including money market funds) that do not trade on an exchange are valued at the net asset value as of the close of each business day.
Fair Valuation. In connection with Rule 2a-5 of the 1940 Act, which became effective September 8, 2022, the Trustees have designated the Fund’s investment adviser as its valuation designee. Investments for which valuations or market quotations are not readily available or are deemed unreliable are valued by the investment adviser, as valuation designee, at fair value using methods that most fairly reflect the security’s “fair value”, which is the amount that the Fund might reasonably expect to receive for the security upon its current sale in the ordinary course. Each such determination is based on a consideration of relevant factors, which are likely to vary from one pricing context to another. These factors may include, but are not limited to, the type of security, the existence of any contractual restrictions on the security’s disposition, the price and extent of public trading in similar securities of the issuer or of comparable companies or entities, quotations or relevant information obtained from broker/dealers or other market participants, information obtained from the issuer, analysts, and/or the appropriate stock exchange (for exchange-traded securities), an analysis of the company’s or entity’s financial statements, and an evaluation of the forces that influence the issuer and the market(s) in which the security is purchased and sold.
B Investment Transactions — Investment transactions for financial statement purposes are accounted for on a trade date basis. Realized gains and losses on investments sold are determined on the basis of identified cost.
C Income — Interest income is recorded on the basis of interest accrued, adjusted for amortization of premium or accretion of discount. Dividend income is recorded on the ex-dividend date for dividends received in cash and/or securities.
D Federal Taxes — The Fund’s policy is to comply with the provisions of the Internal Revenue Code applicable to regulated investment companies and to distribute to shareholders each year substantially all of its net investment income, and all or substantially all of its net realized capital gains. Accordingly, no provision for federal income or excise tax is necessary.
As of October 31, 2022, the Fund had no uncertain tax positions that would require financial statement recognition, de-recognition, or disclosure. The Fund files a U.S. federal income tax return annually after its fiscal year-end, which is subject to examination by the Internal Revenue Service for a period of three years from the date of filing.
Eaton Vance
Short Duration Government Income Fund
October 31, 2022
Notes to Financial Statements — continued
E Expenses — The majority of expenses of the Trust are directly identifiable to an individual fund. Expenses which are not readily identifiable to a specific fund are allocated taking into consideration, among other things, the nature and type of expense and the relative size of the funds.
F Use of Estimates — The preparation of the financial statements in conformity with U.S. GAAP requires management to make estimates and assumptions that affect the reported amounts of assets and liabilities at the date of the financial statements and the reported amounts of income and expense during the reporting period. Actual results could differ from those estimates.
G Indemnifications — Under the Trust’s organizational documents, its officers and Trustees may be indemnified against certain liabilities and expenses arising out of the performance of their duties to the Fund. Under Massachusetts law, if certain conditions prevail, shareholders of a Massachusetts business trust (such as the Trust) could be deemed to have personal liability for the obligations of the Trust. However, the Trust’s Declaration of Trust contains an express disclaimer of liability on the part of Fund shareholders and the By-laws provide that the Trust shall assume, upon request by the shareholder, the defense on behalf of any Fund shareholders. Moreover, the By-laws also provide for indemnification out of Fund property of any shareholder held personally liable solely by reason of being or having been a shareholder for all loss or expense arising from such liability. Additionally, in the normal course of business, the Fund enters into agreements with service providers that may contain indemnification clauses. The Fund’s maximum exposure under these arrangements is unknown as this would involve future claims that may be made against the Fund that have not yet occurred.
H Futures Contracts — Upon entering into a futures contract, the Fund is required to deposit with the broker, either in cash or securities, an amount equal to a certain percentage of the contract amount (initial margin). Subsequent payments, known as variation margin, are made or received by the Fund each business day, depending on the daily fluctuations in the value of the underlying security, and are recorded as unrealized gains or losses by the Fund. Gains (losses) are realized upon the expiration or closing of the futures contracts. Should market conditions change unexpectedly, the Fund may not achieve the anticipated benefits of the futures contracts and may realize a loss. Futures contracts have minimal counterparty risk as they are exchange traded and the clearinghouse for the exchange is substituted as the counterparty, guaranteeing counterparty performance.
I Interest Rate Swaps — Swap contracts are privately negotiated agreements between the Fund and a counterparty. Certain swap contracts may be centrally cleared (“centrally cleared swaps”), whereby all payments made or received by the Fund pursuant to the contract are with a central clearing party (CCP) rather than the original counterparty. The CCP guarantees the performance of the original parties to the contract. Upon entering into centrally cleared swaps, the Fund is required to deposit with the CCP, either in cash or securities, an amount of initial margin determined by the CCP, which is subject to adjustment. Pursuant to interest rate swap agreements, the Fund either makes floating-rate payments to the counterparty (or CCP in the case of centrally cleared swaps) based on a benchmark interest rate in exchange for fixed-rate payments or the Fund makes fixed-rate payments to the counterparty (or CCP in the case of a centrally cleared swap) in exchange for payments on a floating benchmark interest rate. Payments received or made, including amortization of upfront payments/receipts, if any (which are amortized over the life of the swap contract), are recorded as realized gains or losses. During the term of the outstanding swap agreement, changes in the underlying value of the swap are recorded as unrealized gains or losses. For centrally cleared swaps, the daily change in valuation is recorded as a receivable or payable for variation margin and settled in cash with the CCP daily. The value of the swap is determined by changes in the relationship between two rates of interest. The Fund is exposed to credit loss in the event of non-performance by the swap counterparty. In the case of centrally cleared swaps, counterparty risk is minimal due to protections provided by the CCP. Risk may also arise from movements in interest rates.
J Credit Default Swaps — When the Fund is the buyer of a credit default swap contract, the Fund is entitled to receive the par (or other agreed-upon) value of a referenced debt obligation (or basket of debt obligations) from the counterparty (or CCP in the case of a centrally cleared swap) to the contract if a credit event by a third party, such as a U.S. or foreign corporate issuer or sovereign issuer, on the debt obligation occurs. In return, the Fund pays the counterparty a periodic stream of payments over the term of the contract provided that no credit event has occurred. If no credit event occurs, the Fund would have spent the stream of payments and received no proceeds from the contract. When the Fund is the seller of a credit default swap contract, it receives the stream of payments, but is obligated to pay to the buyer of the protection an amount up to the notional amount of the swap and in certain instances take delivery of securities of the reference entity upon the occurrence of a credit event, as defined under the terms of that particular swap agreement. Credit events are contract specific but may include bankruptcy, failure to pay, restructuring, obligation acceleration and repudiation/moratorium. If the Fund is a seller of protection and a credit event occurs, the maximum potential amount of future payments that the Fund could be required to make would be an amount equal to the notional amount of the agreement. This potential amount would be partially offset by any recovery value of the respective referenced obligation, or net amount received from the settlement of a buy protection credit default swap agreement entered into by the Fund for the same referenced obligation. As the seller, the Fund may create economic leverage to its portfolio because, in addition to its total net assets, the Fund is subject to investment exposure on the notional amount of the swap. The interest fee paid or received on the swap contract, which is based on a specified interest rate on a fixed notional amount, is accrued daily as a component of unrealized appreciation (depreciation) and is recorded as realized gain upon receipt or realized loss upon payment. The Fund also records an increase or decrease to unrealized appreciation (depreciation) in an amount equal to the daily valuation. For centrally cleared swaps, the daily change in valuation is recorded as a receivable or payable for variation margin and settled in cash with the CCP daily. All upfront payments and receipts, if any, are amortized over the life of the swap contract as realized gains or losses. Those upfront payments or receipts for non-centrally cleared swaps are recorded as other assets or other liabilities, respectively, net of amortization. For financial reporting purposes, unamortized upfront payments or receipts, if any, are netted with unrealized appreciation or depreciation on swap contracts to determine the market value of swaps as presented in Notes 8 and 12. These transactions involve certain risks, including the risk that the seller may be unable to fulfill the transaction. In the case of centrally cleared swaps, counterparty risk is minimal due to protections provided by the CCP.
Eaton Vance
Short Duration Government Income Fund
October 31, 2022
Notes to Financial Statements — continued
K Written Options — Upon the writing of a call or a put option, the premium received by the Fund is included in the Statement of Assets and Liabilities as a liability. The amount of the liability is subsequently marked-to-market to reflect the current market value of the option written, in accordance with the Fund’s policies on investment valuations discussed above. Premiums received from writing options which expire are treated as realized gains. Premiums received from writing options which are exercised or are closed are added to or offset against the proceeds or amount paid on the transaction to determine the realized gain or loss. When an index option is exercised, the Fund is required to deliver an amount of cash determined by the excess of the exercise price of the option over the value of the index (in the case of a put) or the excess of the value of the index over the exercise price of the option (in the case of a call) at contract termination. If a put option on a security is exercised, the premium reduces the cost basis of the securities purchased by the Fund. The Fund, as a writer of an option, may have no control over whether the underlying securities or other assets may be sold (call) or purchased (put) and, as a result, bears the market risk of an unfavorable change in the price of the securities or other assets underlying the written option. The Fund may also bear the risk of not being able to enter into a closing transaction if a liquid secondary market does not exist.
L Purchased Options — Upon the purchase of a call or put option, the premium paid by the Fund is included in the Statement of Assets and Liabilities as an investment. The amount of the investment is subsequently marked-to-market to reflect the current market value of the option purchased, in accordance with the Fund’s policies on investment valuations discussed above. As the purchaser of an index option, the Fund has the right to receive a cash payment equal to any depreciation in the value of the index below the exercise price of the option (in the case of a put) or equal to any appreciation in the value of the index over the exercise price of the option (in the case of a call) as of the valuation date of the option. If an option which the Fund had purchased expires on the stipulated expiration date, the Fund will realize a loss in the amount of the cost of the option. If the Fund enters into a closing sale transaction, the Fund will realize a gain or loss, depending on whether the sales proceeds from the closing sale transaction are greater or less than the cost of the option. If the Fund exercises a put option on a security, it will realize a gain or loss from the sale of the underlying security, and the proceeds from such sale will be decreased by the premium originally paid. If the Fund exercises a call option on a security, the cost of the security which the Fund purchases upon exercise will be increased by the premium originally paid. The risk associated with purchasing options is limited to the premium originally paid. Purchased options traded over-the-counter involve risk that the issuer or counterparty will fail to perform its contractual obligations.
M Swaptions — A purchased swaption contract grants the Fund, in return for payment of the purchase price, the right, but not the obligation, to enter into a new swap agreement or to shorten, extend, cancel or otherwise modify an existing swap agreement, at some designated future time on specified terms. When the Fund purchases a swaption, the premium paid to the writer is recorded as an investment and subsequently marked-to-market to reflect the current value of the swaption. A written swaption gives the Fund the obligation, if exercised by the purchaser, to enter into a swap contract according to the terms of the underlying agreement. When the Fund writes a swaption, the premium received by the Fund is recorded as a liability and subsequently marked-to-market to reflect the current value of the swaption. When a swaption is exercised, the cost of the swap is adjusted by the amount of the premium paid or received. When a swaption expires or an unexercised swaption is closed, a gain or loss is recognized in the amount of the premium paid or received, plus the cost to close. The Fund’s risk for purchased swaptions is limited to the premium paid. The writer of a swaption bears the risk of unfavorable changes in the preset terms of the underlying swap contract. Purchased swaptions traded over-the-counter involve risk that the issuer or counterparty will fail to perform its contractual obligations.
N When-Issued Securities and Delayed Delivery Transactions — The Fund may purchase securities on a delayed delivery, when-issued or forward commitment basis, including TBA (To Be Announced) securities. Payment and delivery may take place after the customary settlement period for that security. At the time the transaction is negotiated, the price of the security that will be delivered is fixed. The Fund maintains cash and/or security positions for these commitments such that sufficient liquid assets will be available to make payments upon settlement. Securities purchased on a delayed delivery, when-issued or forward commitment basis are marked-to-market daily and begin earning interest on settlement date. Such security purchases are subject to the risk that when delivered they will be worth less than the agreed upon payment price. Losses may also arise if the counterparty does not perform under the contract. A forward purchase commitment may also be closed by entering into an offsetting commitment. If an offsetting commitment is entered into, the Fund will realize a gain or loss on investments based on the price established when the Fund entered into the commitment.
O Forward Sale Commitments — The Fund may enter into forward sale commitments to sell generic U.S. government agency mortgage-backed securities to hedge its portfolio positions and/or to enhance return. The proceeds to be received from the forward sale commitment are recorded as an asset and a corresponding liability, which is subsequently valued at approximately the current market value of the underlying security in accordance with the Fund’s policies on investment valuations discussed above. The Fund records an unrealized gain or loss on investments to the extent of the difference between the proceeds to be received and the value of the open forward sale commitment on the day of determination. If the forward sale commitment is closed through the acquisition of an offsetting purchase commitment or the delivery of securities, the Fund realizes a gain or loss on investments based on the price established when the Fund entered into the commitment. If the Fund enters into a forward sale commitment for the delivery of a security that it does not own or has the right to obtain, it is subject to the risk of loss if the purchase price to settle the commitment is higher than the price at which it was sold.
P Reverse Repurchase Agreements — Under a reverse repurchase agreement, the Fund temporarily transfers possession of a portfolio security to another party, such as a bank or broker/dealer, in return for cash. At the same time, the Fund agrees to repurchase the security at an agreed upon time and price, which reflects an interest payment. In periods of increased demand for a security, the Fund may receive a payment from the counterparty for the use of the security, which is recorded as interest income. Because the Fund retains effective control over the transferred security, the transaction is accounted for as a secured borrowing. The Fund may enter into such agreements when it believes it is able to invest the cash acquired at a rate higher than the cost of the agreement, which would increase earned income. When the Fund enters into a reverse repurchase agreement, any fluctuations in the market value of either the securities transferred to another party or the securities in which the proceeds may be invested would affect the market value of the Fund’s assets. Because reverse repurchase agreements may be considered to be the practical equivalent of borrowing funds (and the counterparty making a loan), they
Eaton Vance
Short Duration Government Income Fund
October 31, 2022
Notes to Financial Statements — continued
constitute a form of leverage. The Fund segregates cash or liquid assets equal to its obligation to repurchase the security. During the term of the agreement, the Fund may also be obligated to pledge additional cash and/or securities in the event of a decline in the fair value of the transferred security. In the event the counterparty to a reverse repurchase agreement becomes insolvent, recovery of the security transferred by the Fund may be delayed or the Fund may incur a loss equal to the amount by which the value of the security transferred by the Fund exceeds the repurchase price payable by the Fund.
O Stripped Mortgage-Backed Securities — The Fund may invest in Interest Only (IO) and Principal Only (PO) securities, a form of stripped mortgage-backed securities, whereby the IO security receives all the interest and the PO security receives all the principal on a pool of mortgage assets. The yield to maturity on an IO security is extremely sensitive to the rate of principal payments (including prepayments) on the related underlying mortgage assets, and a rapid rate of principal payments may have a material adverse effect on the yield to maturity from these securities. If the underlying mortgages experience greater than anticipated prepayments of principal, the Fund may fail to recoup its initial investment in an IO security. The market value of IO and PO securities can be unusually volatile due to changes in interest rates.
2 Distributions to Shareholders and Income Tax Information
The Fund declares dividends daily to shareholders of record at the time of declaration. Distributions are generally paid monthly. Distributions of realized capital gains are made at least annually. Distributions are declared separately for each class of shares. Shareholders may reinvest income and capital gain distributions in additional shares of the same class of the Fund at the net asset value as of the reinvestment date or, at the election of the shareholder, receive distributions in cash. Distributions to shareholders are determined in accordance with income tax regulations, which may differ from U.S. GAAP. As required by U.S. GAAP, only distributions in excess of tax basis earnings and profits are reported in the financial statements as a return of capital.
Permanent differences between book and tax accounting relating to distributions are reclassified to paid-in capital. For tax purposes, distributions from short-term capital gains are considered to be from ordinary income.
The tax character of distributions declared for the years ended October 31, 2022 and October 31, 2021 was as follows:
| | | | | | |
| | | Year Ended October 31, | |
| | | 2022 | | 2021 | |
| | |
Ordinary income | | $154,149,448 | | $ | 162,911,283 | |
Tax return of capital | | $ 17,270,330 | | $ | 9,224,968 | |
As of October 31, 2022, the components of distributable earnings (accumulated loss) on a tax basis were as follows:
| | | | |
| |
| | | | | |
| |
Deferred capital losses | | $ | (318,779,715 | ) |
Net unrealized depreciation | | | (239,898,312 | ) |
| |
Distributions payable | | | (2,352,465 | ) |
| |
Accumulated loss | | $ | (561,030,492 | ) |
At October 31, 2022, the Fund, for federal income tax purposes, had deferred capital losses of $318,779,715 which would reduce its taxable income arising from future net realized gains on investment transactions, if any, to the extent permitted by the Internal Revenue Code, and thus would reduce the amount of distributions to shareholders, which would otherwise be necessary to relieve the Fund of any liability for federal income or excise tax. The deferred capital losses are treated as arising on the first day of the Fund’s next taxable year and retain the same short-term or long-term character as when originally deferred. Of the deferred capital losses at October 31, 2022, $318,779,715 are short-term.
The cost and unrealized appreciation (depreciation) of investments, including open derivative contracts and TBA sale commitments, of the Fund at October 31, 2022, as determined on a federal income tax basis, were as follows:
| | | | |
| |
Aggregate cost | | $ | 5,498,807,601 | |
| |
Gross unrealized appreciation | | $ | 395,438,424 | |
| |
Gross unrealized depreciation | | | (635,336,735 | ) |
| |
Net unrealized depreciation | | $ | (239,898,311 | ) |
Eaton Vance
Short Duration Government Income Fund
October 31, 2022
Notes to Financial Statements — continued
3 Investment Adviser Fee and Other Transactions with Affiliates
The investment adviser fee is earned by Boston Management and Research (BMR), an indirect, wholly-owned subsidiary of Morgan Stanley, as compensation for investment advisory services rendered to the Fund. The investment adviser fee is computed at an annual rate as a percentage of the Fund’s average daily net assets as follows and is payable monthly:
| | | | |
| Average Daily Net Assets | | Annual Fee Rate | |
| |
Up to $1 billion | | | 0.5000 | % |
| |
$1 billion but less than $2.5 billion | | | 0.4750 | % |
| |
$2.5 billion but less than $5 billion | | | 0.4550 | % |
| |
$5 billion but less than $10 billion | | | 0.4400 | % |
| |
$10 billion but less than $15 billion | | | 0.4300 | % |
| |
$15 billion but less than $20 billion | | | 0.4225 | % |
| |
$20 billion and over | | | 0.4175 | % |
Pursuant to an amendment to the investment advisory agreement dated April 29, 2022, BMR contractually agreed to reduce its investment advisory fee rate on average daily net assets of $10 billion and over from 0.4400% to the rates as stated above. This contractual reduction cannot be terminated or reduced without Trustee and shareholder approval. For the year ended October 31, 2022, the Fund’s investment adviser fee amounted to $35,745,400 or
0.46% of the Fund’s average daily net assets. Effective April 26, 2022, the Fund may invest in a money market fund, the Institutional Class of the Morgan Stanley Institutional Liquidity Funds - Government Portfolio (the “Liquidity Fund”), an open-end management investment company managed by Morgan Stanley Investment Management Inc., a wholly-owned subsidiary of Morgan Stanley. The investment adviser fee paid by the Fund is reduced by an amount equal to its pro-rata share of the advisory and administration fees paid by the Fund due to its investment in the Liquidity Fund. For the year ended October 31, 2022, the investment adviser fee paid was reduced by $543,117 relating to the Fund’s investment in the Liquidity Fund. Prior to April 26, 2022, the Fund may have invested its cash in Eaton Vance Cash Reserves Fund, LLC (Cash Reserves Fund), an affiliated investment company managed by Eaton Vance Management (EVM). EVM did not receive a fee for advisory services provided to Cash Reserves Fund.
EVM, an affiliate of BMR, serves as the administrator of the Fund, but receives no compensation. EVM provides sub-transfer agency and related services to the Fund pursuant to a Sub-Transfer Agency Support Services Agreement. For the year ended October 31, 2022, EVM earned $68,148 from the Fund pursuant to such agreement, which is included in transfer and dividend disbursing agent fees on the Statement of Operations. The Fund was informed that Eaton Vance Distributors, Inc. (EVD), an affiliate of EVM and the Fund’s principal underwriter, received $4,223 as its portion of the sales charge on sales of Class A shares for the year ended October 31, 2022. EVD also received distribution and service fees from Class A and Class C shares (see Note 4) and contingent deferred sales charges (see Note 5).
Trustees and officers of the Fund who are members of EVM’s or BMR’s organizations receive remuneration for their services to the Fund out of the investment adviser fee. Trustees of the Fund who are not affiliated with the investment adviser may elect to defer receipt of all or a percentage of their annual fees in accordance with the terms of the Trustees Deferred Compensation Plan. For the year ended October 31, 2022, no significant amounts have been deferred. Certain officers and Trustees of the Fund are officers of the above organizations.
Eaton Vance
Short Duration Government Income Fund
October 31, 2022
Notes to Financial Statements — continued
4 Distribution Plans
The Fund has in effect distribution plans for the Advisers Class shares and Class A shares (Advisers/Class A Plan) pursuant to Rule 12b-1 under the 1940 Act. Pursuant to the Advisers/Class A Plan, the Fund pays EVD a distribution and service fee of 0.25% per annum of its average daily net assets attributable to Advisers Class shares and Class A shares for distribution services and facilities provided to the Fund by EVD, as well as for personal services and/or the maintenance of shareholder accounts. Distribution and service fees paid or accrued to EVD for the year ended October 31, 2022 amounted to $705,840 for Advisers Class shares and $3,383,650 for Class A shares. The Fund also has in effect a distribution plan for Class C shares (Class C Plan) pursuant to Rule 12b-1 under the 1940 Act. Pursuant to the Class C Plan, the Fund pays EVD amounts equal to 0.60% per annum of its average daily net assets attributable to Class C shares for providing ongoing distribution services and facilities to the Fund. For the year ended October 31, 2022, the Fund paid or accrued to EVD $517,362 for Class C shares.
Pursuant to the Class C Plan, the Fund also makes payments of service fees to EVD, financial intermediaries and other persons in amounts equal to 0.25% per annum of its average daily net assets attributable to Class C shares. Service fees paid or accrued are for personal services and/or the maintenance of shareholder accounts. They are separate and distinct from the sales commissions and distribution fees payable to EVD. Service fees paid or accrued for the year ended October 31, 2022 amounted to $215,567 for Class C shares.
Distribution and service fees are subject to the limitations contained in the Financial Industry Regulatory Authority Rule 2341(d).
5 Contingent Deferred Sales Charges
A contingent deferred sales charge (CDSC) of 1% generally is imposed on redemptions of Class C shares made within 12 months of purchase. Class A shares may be subject to a 0.25% (1% prior to April 29, 2022) CDSC if redeemed within 12 months (18 months prior to April 29, 2022) of purchase (depending on the circumstances of purchase). Generally, the CDSC is based upon the lower of the net asset value at date of redemption or date of purchase. No charge is levied on shares acquired by reinvestment of dividends or capital gain distributions. For the year ended October 31, 2022, the Fund was informed that EVD received approximately $109,000 and $19,000 of CDSCs paid by Class A and Class C shareholders, respectively.
6 Purchases and Sales of Investments
Purchases and sales of investments (all U.S. Government and Agency Securities), other than short-term obligations and including maturities, paydowns and TBA transactions, aggregated $62,802,334,955 and $66,280,955,039, respectively, for the year ended October 31, 2022.
7 Shares of Beneficial Interest
The Fund’s Declaration of Trust permits the Trustees to issue an unlimited number of full and fractional shares of beneficial interest (without par value). Such shares may be issued in a number of different series (such as the Fund) and classes. Transactions in Fund shares, including direct exchanges pursuant to share class conversions for all periods presented, were as follows:
| | | | | | | | | | | | | | | | | | |
| | | Year Ended | | | | | Year Ended | |
| | | October 31, 2022 | | | | | October 31, 2021(1) | |
| | | Shares | | | Amount | | | | | Shares | | | Amount | |
| | | | | |
Advisers Class | | | | | | | | | | | | | | | | | | |
| | | | | |
Sales | | | 20,487,425 | | | $ | 162,612,808 | | | | | | 45,840,345 | | | $ | 368,764,472 | |
| | | | | |
Issued to shareholders electing to receive payments of distributions in Fund shares | | | 730,097 | | | | 5,701,996 | | | | | | 157,557 | | | | 1,263,246 | |
| | | | | |
Redemptions | | | (29,325,327 | ) | | | (230,374,482 | ) | | | | | (11,463,505 | ) | | | (91,932,766 | ) |
| | | | | |
Net increase (decrease) | | | (8,107,805 | ) | | $ | (62,059,678 | ) | | | | | 34,534,397 | | | $ | 278,094,952 | |
| | | | | |
Class A | | | | | | | | | | | | | | | | | | |
| | | | | |
Sales | | | 38,308,816 | | | $ | 302,540,513 | | | | | | 271,517,967 | | | $ | 2,203,017,522 | |
| | | | | |
Issued to shareholders electing to receive payments of distributions in Fund shares | | | 3,220,325 | | | | 25,211,768 | | | | | | 4,268,532 | | | | 34,491,244 | |
| | | | | |
Redemptions | | | (178,238,891 | ) | | | (1,406,901,413 | ) | | | | | (240,791,624 | ) | | | (1,946,274,994 | ) |
| | | | | |
Net increase (decrease) | | | (136,709,750 | ) | | $ | (1,079,149,132 | ) | | | | | 34,994,875 | | | $ | 291,233,772 | |
Eaton Vance
Short Duration Government Income Fund
October 31, 2022
Notes to Financial Statements — continued
| | | | | | | | | | | | | | | | | | |
| | | Year Ended | | | | | Year Ended | |
| | | October 31, 2022 | | | | | October 31, 2021(1) | |
| | | Shares | | | Amount | | | | | Shares | | | Amount | |
| | | | | |
Class C | | | | | | | | | | | | | | | | | | |
| | | | | |
Sales | | | 2,240,137 | | | $ | 17,655,395 | | | | | | 3,324,297 | | | $ | 26,990,553 | |
| | | | | |
Issued to shareholders electing to receive payments of distributions in Fund shares | | | 156,626 | | | | 1,222,521 | | | | | | 133,030 | | | | 1,076,699 | |
| | | | | |
Redemptions | | | (5,847,025 | ) | | | (46,075,794 | ) | | | | | (8,333,846 | ) | | | (67,519,260 | ) |
| | | | | |
Net decrease | | | (3,450,262 | ) | | $ | (27,197,878 | ) | | | | | (4,876,519 | ) | | $ | (39,452,008 | ) |
| | | | | |
Class I | | | | | | | | | | | | | | | | | | |
| | | | | |
Sales | | | 484,037,962 | | | $ | 3,809,561,374 | | | | | | 795,793,018 | | | $ | 6,434,038,662 | |
| | | | | |
Issued to shareholders electing to receive payments of distributions in Fund shares | | | 15,149,682 | | | | 118,325,821 | | | | | | 14,470,596 | | | | 116,747,938 | |
| | | | | |
Redemptions | | | (837,429,151 | ) | | | (6,587,433,580 | ) | | | | | (682,857,773 | ) | | | (5,511,503,113 | ) |
| | | | | |
Net increase (decrease) | | | (338,241,507 | ) | | $ | (2,659,546,385 | ) | | | | | 127,405,841 | | | $ | 1,039,283,487 | |
| (1) | For Advisers Class, for the period from the commencement of operations, May 17, 2021, to October 31, 2021. |
8 Financial Instruments
The Fund may trade in financial instruments with off-balance sheet risk in the normal course of its investing activities. These financial instruments may include futures contracts, written swaptions and swap contracts and may involve, to a varying degree, elements of risk in excess of the amounts recognized for financial statement purposes. The notional or contractual amounts of these instruments represent the investment the Fund has in particular classes of financial instruments and do not necessarily represent the amounts potentially subject to risk. The measurement of the risks associated with these instruments is meaningful only when all related and offsetting transactions are considered. A summary of obligations under these financial instruments at October 31, 2022 is included in the Portfolio of Investments. At October 31, 2022, the Fund had sufficient cash and/or securities to cover commitments under these contracts.
In the normal course of pursuing its investment objective, the Fund is subject to the following risks:
Interest Rate Risk: Because the Fund holds fixed-rate bonds, the value of these bonds may decrease if interest rates rise.
The Fund utilizes futures contracts and interest rate swaps and swaptions to enhance total return, to change the overall duration of the Fund and/or to hedge against fluctuations in securities prices due to changes in interest rates.
Credit Risk: The Fund enters into credit default swap contracts to manage certain investment risks and/or to enhance total return.
The Fund enters into over-the-counter (OTC) derivatives that may contain provisions whereby the counterparty may terminate the contract under certain conditions, including but not limited to a decline in the Fund’s net assets below a certain level over a certain period of time, which would trigger a payment by the Fund for those derivatives in a liability position. At October 31, 2022, the fair value of derivatives with credit-related contingent features in a net liability position was $17,854,134. The aggregate fair value of assets pledged as collateral by the Fund for such liability was $11,810,000 at October 31, 2022.
The OTC derivatives in which the Fund invests (except for written options and swaptions as the Fund, not the counterparty, is obligated to perform) are subject to the risk that the counterparty to the contract fails to perform its obligations under the contract. To mitigate this risk, the Fund has entered into an International Swaps and Derivatives Association, Inc. Master Agreement (“ISDA Master Agreement”) or similar agreement with substantially all its derivative counterparties. An ISDA Master Agreement is a bilateral agreement between the Fund and a counterparty that governs certain OTC derivatives and typically contains, among other things, set-off provisions in the event of a default and/or termination event as defined under the relevant ISDA Master Agreement. Under an ISDA Master Agreement, the Fund may, under certain circumstances, offset with the counterparty certain derivative financial instruments’ payables and/or receivables with collateral held and/or posted and create one single net payment. The provisions of the ISDA Master Agreement typically permit a single net payment in the event of default including the bankruptcy or insolvency of the counterparty. However, bankruptcy or insolvency laws of a particular jurisdiction may impose restrictions on or prohibitions against the right of offset in bankruptcy or insolvency. Certain ISDA Master Agreements allow counterparties to OTC derivatives to terminate derivative contracts prior to maturity in the event the Fund’s net assets decline by a stated percentage or the Fund fails to meet the terms of its ISDA Master Agreements, which would cause the counterparty to accelerate payment by the Fund of any net liability owed to it.
Eaton Vance
Short Duration Government Income Fund
October 31, 2022
Notes to Financial Statements — continued
The collateral requirements for derivatives traded under an ISDA Master Agreement are governed by a Credit Support Annex to the ISDA Master Agreement. Collateral requirements are determined at the close of business each day and are typically based on changes in market values for each transaction under an ISDA Master Agreement and netted into one amount for such agreement. Generally, the amount of collateral due from or to a counterparty is subject to a minimum transfer threshold amount before a transfer is required, which may vary by counterparty. Collateral pledged for the benefit of the Fund and/or counterparty is held in segregated accounts by the Fund’s custodian and cannot be sold, re-pledged, assigned or otherwise used while pledged. The portion of such collateral representing cash, if any, is reflected as deposits for derivatives collateral and, in the case of cash pledged by a counterparty for the benefit of the Fund, a corresponding liability on the Statement of Assets and Liabilities. Securities pledged by the Fund as collateral, if any, are identified as such in the Portfolio of Investments. The carrying amount of the liability for cash collateral due to brokers at October 31, 2022 approximated its fair value. If measured at fair value, such liability would have been considered as Level 2 in the fair value hierarchy (see Note 12) at October 31, 2022.
The fair value of open derivative instruments (not considered to be hedging instruments for accounting disclosure purposes) by risk exposure at October 31, 2022 was as follows:
| | | | | | | | | | |
| | | | | Fair Value | |
Risk | | Derivative | | Asset
Derivative | | | Liability
Derivative | |
| | | |
Credit | | Swap contracts | | $ | — | | | $ | (6,643,306 | )(1) |
| | | |
Interest Rate | | Purchased swaptions | | | 46,533,578 | (2) | | | — | |
| | | |
Interest Rate | | Written options and swaptions | | | — | | | | (17,854,134 | )(3) |
| | | |
| Interest Rate | | Futures contracts | | | 99,585,633 | (1) | | | — | |
| | | |
Interest Rate | | Swap contracts | | | 259,357,894 | (1) | | | — | |
| | | |
Total | | | | $ | 405,477,105 | | | $ | (24,497,440 | ) |
| | |
Derivatives not subject to master netting or similar agreements | | $ | 358,943,527 | | | $ | (6,643,306 | ) |
| | |
Total Derivatives subject to master netting or similar agreements | | $ | 46,533,578 | | | $ | (17,854,134 | ) |
| (1) | Only the current day’s variation margin on open futures contracts and centrally cleared swap contracts is reported within the Statement of Assets and Liabilities as Receivable or Payable for variation margin on open futures contracts and centrally cleared swap contracts, as applicable. |
| (2) | Statement of Assets and Liabilities location: Unaffiliated investments, at value. |
| (3) | Statement of Assets and Liabilities location: Written options and swaptions outstanding, at value. |
The Fund’s derivative assets and liabilities at fair value by risk, which are reported gross in the Statement of Assets and Liabilities, are presented in the table above. The following tables present the Fund’s derivative assets and liabilities by counterparty, net of amounts available for offset under a master netting agreement and net of the related collateral received by the Fund for such assets and pledged by the Fund for such liabilities as of October 31, 2022.
| | | | | | | | | | | | | | | | | | | | |
| Counterparty | | Derivative Assets Subject to Master Netting Agreement | | | Derivatives Available for Offset | | | Non-cash Collateral Received(a) | | | Cash Collateral Received(a) | | | Net Amount of Derivative Assets(b) | |
| | | | | |
Bank of America, N.A. | | $ | 24,587,938 | | | $ | (8,928,816 | ) | | $ | — | | | $ | (14,860,000 | ) | | $ | 799,122 | |
| | | | | |
Goldman Sachs International | | | 21,945,640 | | | | (98,268 | ) | | | — | | | | (21,050,000 | ) | | | 797,372 | |
| | | | | |
| | | $ | 46,533,578 | | | $ | (9,027,084 | ) | | $ | — | | | $ | (35,910,000 | ) | | $ | 1,596,494 | |
| | | | | |
| Counterparty | | Derivative Liabilities Subject to Master Netting Agreement | | | Derivatives Available for Offset | | | Non-cash Collateral Pledged(a) | | | Cash Collateral Pledged(a) | | | Net Amount of Derivative Liabilities(c) | |
| | | | | |
Bank of America, N.A. | | $ | (8,928,816 | ) | | $ | 8,928,816 | | | $ | — | | | $ | — | | | $ | — | |
| | | | | |
Goldman Sachs International | | | (98,268 | ) | | | 98,268 | | | | — | | | | — | | | | — | |
| | | | | |
JPMorgan Chase Bank, N.A. | | | (8,827,050 | ) | | | — | | | | — | | | | 8,827,050 | | | | — | |
| | | | | |
| | | $ | (17,854,134 | ) | | $ | 9,027,084 | | | $ | — | | | $ | 8,827,050 | | | $ | — | |
Eaton Vance
Short Duration Government Income Fund
October 31, 2022
Notes to Financial Statements — continued
| (a) | In some instances, the total collateral received and/or pledged may be more than the amount shown due to overcollateralization. |
| (b) | Net amount represents the net amount due from the counterparty in the event of default. |
| (c) | Net amount represents the net amount payable to the counterparty in the event of default. |
The effect of derivative instruments (not considered to be hedging instruments for accounting disclosure purposes) on the Statement of Operations by risk exposure for the year ended October 31, 2022 was as follows:
| | | | | | | | | | |
| Risk | | Derivative | | Realized Gain (Loss)
on Derivatives Recognized
in Income | | | Change in Unrealized
Appreciation (Depreciation) on
Derivatives Recognized in Income | |
| | | |
Credit | | Swap contracts | | $ | (337,102 | )(1) | | $ | (11,934,966 | )(2) |
| | | |
Interest Rate | | Purchased swaptions | | | (18,617,206 | )(3) | | | 35,464,355 | (4) |
| | | |
Interest Rate | | Written options and swaptions | | | 11,904,634 | (5) | | | 3,166,729 | (6) |
| | | |
| Interest Rate | | Futures contracts | | | 195,731,401 | (7) | | | 64,352,836 | (8) |
| | | |
Interest Rate | | Swap contracts | | | (1,183,900 | )(1) | | | 259,356,902 | (2) |
| | | |
Total | | | | $ | 187,497,827 | | | $ | 350,405,856 | |
| (1) | Statement of Operations location: Net realized gain (loss) - Swap contracts. |
| (2) | Statement of Operations location: Change in unrealized appreciation (depreciation) - Swap contracts. |
| (3) | Statement of Operations location: Net realized gain (loss) - Investment transactions. |
| (4) | Statement of Operations location: Change in unrealized appreciation (depreciation) - Investments. |
| (5) | Statement of Operations location: Net realized gain (loss) - Written options and swaptions. |
| (6) | Statement of Operations location: Change in unrealized appreciation (depreciation) - Written options and swaptions. |
| (7) | Statement of Operations location: Net realized gain (loss) - Futures contracts. |
| (8) | Statement of Operations location: Change in unrealized appreciation (depreciation) - Futures contracts. |
The average notional cost of futures contracts and average notional amounts of other derivative contracts outstanding during the year ended October 31, 2022, which are indicative of the volume of these derivative types, were approximately as follows:
| | | | | | | | | | | | | | | | | | |
Futures Contracts — Long | | | Futures Contracts — Short | | | Purchased Swaptions | | | Written Options
and Swaptions | | | Swap
Contracts | |
| | | | |
| | $812,139,000 | | | $ | 2,756,304,000 | | | $ | 897,385,000 | | | $ | 866,231,000 | | | $ | 665,385,000 | |
9 Line of Credit
The Fund participates with other portfolios and funds managed by EVM and its affiliates in a $725 million unsecured line of credit agreement with a group of banks, which is in effect through October 24, 2023. In connection with the renewal of the agreement on October 25, 2022, the borrowing limit was decreased from $800 million. Borrowings are made by the Fund solely for temporary purposes related to redemptions and other short-term cash needs. Interest is charged to the Fund based on its borrowings at an amount above either the Secured Overnight Financing Rate (SOFR) or Federal Funds rate. In addition, a fee computed at an annual rate of 0.15% on the daily unused portion of the line of credit is allocated among the participating portfolios and funds at the end of each quarter. Also in connection with the renewal of the agreement, an arrangement fee totaling $150,000 was incurred that was allocated to the participating portfolios and funds. Because the line of credit is not available exclusively to the Fund, it may be unable to borrow some or all of its requested amounts at any particular time. The Fund did not have any significant borrowings or allocated fees during the year ended October 31, 2022.
Eaton Vance
Short Duration Government Income Fund
October 31, 2022
Notes to Financial Statements — continued
10 Reverse Repurchase Agreements
Reverse repurchase agreements outstanding as of October 31, 2022 were as follows:
| | | | | | | | | | | | | | | | | | | | |
| Counterparty | | Trade Date | | | Maturity
Date | | | Interest
Rate
Paid | | | Principal
Amount | | | Value
Including
Accrued
Interest | |
| | | | | |
| MUFG Securities Americas, Inc. | | | 10/25/2022 | | | | 11/2/2022 | | | | 3.43 | % | | $ | 232,914,672 | | | $ | 233,047,822 | |
| | | | | |
| MUFG Securities Americas, Inc. | | | 10/28/2022 | | | | 10/28/2023 | | | | 3.43 | % | | | 322,331,703 | | | | 322,362,413 | |
| | | | | |
Total | | | | | | | | | | | | | | $ | 555,246,375 | | | $ | 555,410,235 | |
For the year ended October 31, 2022, the average borrowings under settled reverse repurchase agreements and the average interest rate received were approximately $27,512,577 and 3.47%, respectively. Based on the short-term nature of the borrowings under the reverse repurchase agreements, the carrying value of the payable for reverse repurchase agreements approximated its fair value at October 31, 2022. If measured at fair value, borrowings under the reverse repurchase agreements would have been considered as Level 2 in the fair value hierarchy (see Note 12) at October 31, 2022.
Reverse repurchase agreements entered into by the Fund are subject to Master Repurchase Agreements (MRA), which permit the Fund, under certain circumstances, including an event of default (such as bankruptcy or insolvency), to offset payables and/or receivables under the MRA with collateral held and/or posted to the counterparty and create one single net payment due to or from the Fund.
The following table presents the Fund’s reverse repurchase agreements net of amounts available for offset under an MRA and net of the related collateral pledged by the Fund as of October 31, 2022.
| | | | | | | | | | | | | | | | |
| Counterparty | | Reverse
Repurchase
Agreements | | | Assets
Available for
Offset | | | Securities
Collateral
Pledged(a) | | | Net
Amount(b) | |
| | | | |
MUFG Securities Americas, Inc. | | $ | (555,410,235 | ) | | $ | — | | | $ | 555,410,236 | | | $ | — | |
| (a) | In some instances, the total collateral pledged may be more than the amount shown due to overcollateralization. |
| (b) | Net amount represents the net amount payable to the counterparty in the event of default. |
The Fund also pledged cash of $4,345,000 to MUFG Securities Americas, Inc. as additional collateral for its reverse repurchase agreements.
11 Investments in Affiliated Funds
At October 31, 2022, the value of the Fund’s investment in funds that may be deemed to be affiliated was $40,759,128, which represents 0.7% of the Fund’s net assets. Transactions (in thousands) in affiliated funds by the Fund for the year ended October 31, 2022 were as follows:
| | | | | | | | | | | | | | | | | | | | | | | | | | | | | | | | |
| Name | | Value,
beginning of period | | | Purchases | | | Sales
proceeds | | | Net
realized
gain (loss) | | | Change in
unrealized
appreciation (depreciation) | | | Value, end
of period | | | Dividend
income | | | Units/Shares,
end of period | |
| | | | | | | | |
Short-Term Investments | | | | | | | | | | | | | | | | | | | | | | | | | | | | | | | | |
| | | | | | | | |
Cash Reserves Fund | | $ | 2,318,224 | | | $ | 5,437,885 | | | $ | (7,755,921 | ) | | $ | (188 | ) | | $ | — | | | $ | — | | | $ | 872 | | | | — | |
| | | | | | | | |
Liquidity Fund | | | — | | | | 6,698,166 | | | | (6,657,407 | ) | | | — | | | | — | | | | 40,759 | | | | 5,046 | | | | 40,759 | |
| | | | | | | | |
Total | | | | | | | | | | | | | | $ | (188 | ) | | $ | — | | | $ | 40,759 | | | $ | 5,918 | | | | | |
Eaton Vance
Short Duration Government Income Fund
October 31, 2022
Notes to Financial Statements — continued
12 Fair Value Measurements
Under generally accepted accounting principles for fair value measurements, a three-tier hierarchy to prioritize the assumptions, referred to as inputs, is used in valuation techniques to measure fair value. The three-tier hierarchy of inputs is summarized in the three broad levels listed below.
| • | | “ Level 1 – quoted prices in active markets for identical investments |
| • | | “ Level 2 – other significant observable inputs (including quoted prices for similar investments, interest rates, prepayment speeds, credit risk, etc.) |
| • | | “ Level 3 – significant unobservable inputs (including a fund’s own assumptions in determining the fair value of investments) |
In cases where the inputs used to measure fair value fall in different levels of the fair value hierarchy, the level disclosed is determined based on the lowest level input that is significant to the fair value measurement in its entirety. The inputs or methodology used for valuing securities are not necessarily an indication of the risk associated with investing in those securities.
At October 31, 2022, the hierarchy of inputs used in valuing the Fund’s investments and open derivative instruments, which are carried at value, were as follows:
| | | | | | | | | | | | | | | | |
| Asset Description | | Level 1 | | | Level 2 | | | Level 3 | | | Total | |
| | | | |
Collateralized Mortgage Obligations | | $ | — | | | $ | 1,285,617,685 | | | $ | — | | | $ | 1,285,617,685 | |
| | | | |
Government National Mortgage Association Participation Agreements | | | — | | | | 475,412,134 | | | | — | | | | 475,412,134 | |
| | | | |
U.S. Government Agency Commercial Mortgage-Backed Securities | | | — | | | | 19,034,533 | | | | — | | | | 19,034,533 | |
| | | | |
U.S. Government Agency Mortgage-Backed Securities | | | — | | | | 5,870,960,793 | | | | — | | | | 5,870,960,793 | |
| | | | |
U.S. Government Guaranteed Small Business Administration Pools & Loans | | | — | | | | 189,244,718 | | | | — | | | | 189,244,718 | |
| | | | |
U.S. Department of Agriculture Loans | | | — | | | | 4,684,506 | | | | — | | |
| 4,684,506
|
|
| | | | |
Short-Term Investments | | | 40,759,128 | | | | — | | | | — | | | | 40,759,128 | |
| | | | |
Purchased Interest Rate Swaptions | | | — | | | | 46,533,578 | | | | — | | | | 46,533,578 | |
| | | | |
Total Investments | | $ | 40,759,128 | | | $ | 7,891,487,947 | | | $ | — | | | $ | 7,932,247,075 | |
| | | | |
Futures Contracts | | $ | 99,585,633 | | | $ | — | | | $ | — | | | $ | 99,585,633 | |
| | | | |
Swap Contracts | | | — | | | | 259,357,894 | | | | — | | | | 259,357,894 | |
| | | | |
Total | | $ | 140,344,761 | | | $ | 8,150,845,841 | | | $ | — | | | $ | 8,291,190,602 | |
| | | | |
Liability Description | | | | | | | | | | | | | | | | |
| | | | |
TBA Sale Commitments | | $ | — | | | $ | (2,359,594,179 | ) | | $ | — | | | $ | (2,359,594,179 | ) |
| | | | |
Written Interest Rate Swaptions | | | — | | | | (443,590 | ) | | | — | | | | (443,590 | ) |
| | | | |
Written Put Options | | | — | | | | (17,410,544 | ) | | | — | | | | (17,410,544 | ) |
| | | | |
Swap Contracts | | | — | | | | (6,643,306 | ) | | | — | | | | (6,643,306 | ) |
| | | | |
Total | | $ | — | | | $ | (2,384,091,619 | ) | | $ | — | | | $ | (2,384,091,619 | ) |
13 Risks and Uncertainties
Pandemic Risk
An outbreak of respiratory disease caused by a novel coronavirus was first detected in China in late 2019 and subsequently spread internationally. This coronavirus has resulted in closing borders, enhanced health screenings, changes to healthcare service preparation and delivery, quarantines, cancellations, disruptions to supply chains and customer activity, as well as general concern and uncertainty. Health crises caused by outbreaks of disease, such as the coronavirus outbreak, may exacerbate other pre-existing political, social and economic risks and disrupt normal market conditions and operations. The impact of this outbreak has negatively affected the worldwide economy, as well as the economies of individual countries and industries, and could continue to affect the market in significant and unforeseen ways. Other epidemics and pandemics that may arise in the future may have similar effects. Any such impact could adversely affect the Fund’s performance, or the performance of the securities in which the Fund invests.
Eaton Vance
Short Duration Government Income Fund
October 31, 2022
Report of Independent Registered Public Accounting Firm
To the Trustees of Eaton Vance Mutual Funds Trust and Shareholders of Eaton Vance Short Duration Government Income Fund:
Opinion on the Financial Statements and Financial Highlights
We have audited the accompanying statement of assets and liabilities of Eaton Vance Short Duration Government Income Fund (the “Fund”) (one of the funds constituting Eaton Vance Mutual Funds Trust), including the portfolio of investments, as of October 31, 2022, the related statement of operations for the year then ended, the statements of changes in net assets for each of the two years in the period then ended, the financial highlights for each of the five years in the period then ended, and the related notes. In our opinion, the financial statements and financial highlights present fairly, in all material respects, the financial position of the Fund as of October 31, 2022, and the results of its operations for the year then ended, the changes in its net assets for each of the two years in the period then ended, and the financial highlights for each of the five years in the period then ended, in conformity with accounting principles generally accepted in the United States of America.
Basis for Opinion
These financial statements and financial highlights are the responsibility of the Fund’s management. Our responsibility is to express an opinion on the Fund’s financial statements and financial highlights based on our audits. We are a public accounting firm registered with the Public Company Accounting Oversight Board (United States) (PCAOB) and are required to be independent with respect to the Fund in accordance with the U.S. federal securities laws and the applicable rules and regulations of the Securities and Exchange Commission and the PCAOB.
We conducted our audits in accordance with the standards of the PCAOB. Those standards require that we plan and perform the audit to obtain reasonable assurance about whether the financial statements and financial highlights are free of material misstatement, whether due to error or fraud. The Fund is not required to have, nor were we engaged to perform, an audit of its internal control over financial reporting. As part of our audits, we are required to obtain an understanding of internal control over financial reporting but not for the purpose of expressing an opinion on the effectiveness of the Fund’s internal control over financial reporting. Accordingly, we express no such opinion.
Our audits included performing procedures to assess the risks of material misstatement of the financial statements and financial highlights, whether due to error or fraud, and performing procedures that respond to those risks. Such procedures included examining, on a test basis, evidence regarding the amounts and disclosures in the financial statements and financial highlights. Our audits also included evaluating the accounting principles used and significant estimates made by management, as well as evaluating the overall presentation of the financial statements and financial highlights. Our procedures included confirmation of securities owned as of October 31, 2022, by correspondence with the custodian and brokers; when replies were not received from brokers, we performed other auditing procedures. We believe that our audits provide a reasonable basis for our opinion.
/s/ Deloitte & Touche LLP
Boston, Massachusetts
December 28, 2022
We have served as the auditor of one or more Eaton Vance investment companies since 1959.
Eaton Vance
Short Duration Government Income Fund
October 31, 2022
Federal Tax Information (Unaudited)
The Form 1099-DIV you receive in February 2023 will show the tax status of all distributions paid to your account in calendar year 2022. Shareholders are advised to consult their own tax adviser with respect to the tax consequences of their investment in the Fund. As required by the Internal Revenue Code and/or regulations, shareholders must be notified regarding the status of 163(j) interest dividends.
163(j) Interest Dividends. For the fiscal year ended October 31, 2022, the Fund designates 100% of distributions from net investment income as a 163(j) interest dividend.
Eaton Vance
Short Duration Government Income Fund
October 31, 2022
Board of Trustees’ Contract Approval
Overview of the Contract Review Process
The Investment Company Act of 1940, as amended (the “1940 Act”), provides, in substance, that the investment advisory agreement between a fund and its investment adviser will continue in effect from year-to-year only if its continuation is approved on an annual basis by a vote of the fund’s board of trustees, including a majority of the trustees who are not “interested persons” of the fund (“independent trustees”), cast in person at a meeting called for the purpose of considering such approval.
At a meeting held on June 8, 2022, the Boards of Trustees/Directors (collectively, the “Board”) that oversee the registered investment companies advised by Eaton Vance Management or its affiliate, Boston Management and Research (the “Eaton Vance Funds”), including a majority of the independent trustees (the “Independent Trustees”), voted to approve the continuation of existing investment advisory agreements and sub-advisory agreements1 for each of the Eaton Vance Funds for an additional one-year period. The Board relied upon the affirmative recommendation of its Contract Review Committee, which is a committee exclusively comprised of Independent Trustees. Prior to making its recommendation, the Contract Review Committee reviewed information furnished by the adviser and sub-adviser to each of the Eaton Vance Funds (including information specifically requested by the Board) for a series of formal meetings held between April and June 2022. Members of the Contract Review Committee also considered information received at prior meetings of the Board and its committees, to the extent such information was relevant to the Contract Review Committee’s annual evaluation of the investment advisory agreements and sub-advisory agreements.
In connection with its evaluation of the investment advisory agreements and sub-advisory agreements, the Board considered various information relating to the Eaton Vance Funds. This included information applicable to all or groups of Eaton Vance Funds, which is referenced immediately below, and information applicable to the particular Eaton Vance Fund covered by this report (additional fund-specific information is referenced below under “Results of the Contract Review Process”). (For funds that invest through one or more underlying portfolios, references to “each fund” in this section may include information that was considered at the portfolio-level.)
Information about Fees, Performance and Expenses
| | • | | A report from an independent data provider comparing advisory and other fees paid by each fund to such fees paid by comparable funds, as identified by the independent data provider (“comparable funds”); |
| | • | | A report from an independent data provider comparing each fund’s total expense ratio (and its components) to those of comparable funds; |
| | • | | A report from an independent data provider comparing the investment performance of each fund (including, as relevant, total return data, income data, Sharpe ratios and information ratios) to the investment performance of comparable funds and, as applicable, benchmark indices, over various time periods; |
| | • | | In certain instances, data regarding investment performance relative to customized groups of peer funds and blended indices identified by the adviser in consultation with the Portfolio Management Committee of the Board (a committee exclusively comprised of Independent Trustees); |
| | • | | Comparative information concerning the fees charged and services provided by the adviser and sub-adviser to each fund in managing other accounts (which may include other mutual funds, collective investment funds and institutional accounts) using investment strategies and techniques similar to those used in managing such fund(s), if any; |
| | • | | Profitability analyses with respect to the adviser and sub-adviser to each of the funds; |
Information about Portfolio Management and Trading
| | • | | Descriptions of the investment management services provided to each fund, as well as each of the funds’ investment strategies and policies; |
| | • | | The procedures and processes used to determine the value of fund assets, including, when necessary, the determination of “fair value” and actions taken to monitor and test the effectiveness of such procedures and processes; |
| | • | | Information about the policies and practices of each fund’s adviser and sub-adviser with respect to trading, including their processes for seeking best execution of portfolio transactions; |
| | • | | Information about the allocation of brokerage transactions and the benefits, if any, received by the adviser and sub-adviser to each fund as a result of brokerage allocation, including, as applicable, information concerning the acquisition of research through client commission arrangements and policies with respect to “soft dollars”; |
| | • | | Data relating to the portfolio turnover rate of each fund and related information regarding active management in the context of particular strategies; |
Information about each Adviser and Sub-adviser
| | • | | Reports detailing the financial results and condition of the adviser and sub-adviser to each fund; |
| 1 | Not all Eaton Vance Funds have entered into a sub-advisory agreement with a sub-adviser. Accordingly, references to “sub-adviser” or “sub-advisory agreement” in this “Overview” section may not be applicable to the particular Eaton Vance Fund covered by this report. Following the “Overview” section, further information regarding the Board’s evaluation of a fund’s contractual arrangements is included under the “Results of the Contract Review Process” section. |
Eaton Vance
Short Duration Government Income Fund
October 31, 2022
Board of Trustees’ Contract Approval — continued
| | • | | Information regarding the individual investment professionals whose responsibilities include portfolio management and investment research for the funds, and, for portfolio managers and certain other investment professionals, information relating to their responsibilities with respect to managing other mutual funds and investment accounts, as applicable; |
| | • | | Information regarding the adviser’s and its parent company’s (Morgan Stanley’s) efforts to retain and attract talented investment professionals, including in the context of a particularly competitive marketplace for talent, as well as the ongoing unique environment presented by hybrid, remote and other alternative work arrangements; |
| | • | | The Code of Ethics of the adviser and its affiliates and the sub-adviser of each fund, together with information relating to compliance with, and the administration of, such codes; |
| | • | | Policies and procedures relating to proxy voting, including regular reporting with respect to fund proxy voting activities; |
| | • | | Information regarding the handling of corporate actions and class actions, as well as information regarding litigation and other regulatory matters; |
| | • | | Information concerning the resources devoted to compliance efforts undertaken by the adviser and its affiliates and the sub-adviser of each fund, if any, including descriptions of their various compliance programs and their record of compliance; |
| | • | | Information concerning the business continuity and disaster recovery plans of the adviser and its affiliates and the sub-adviser of each fund, if any; |
| | • | | A description of Eaton Vance Management’s and Boston Management and Research’s oversight of sub-advisers, including with respect to regulatory and compliance issues, investment management and other matters; |
Other Relevant Information
| | • | | Information regarding ongoing initiatives to further integrate and harmonize, where applicable, the investment management and other departments of the adviser and its affiliates with the overall investment management infrastructure of Morgan Stanley, in light of Morgan Stanley’s acquisition of Eaton Vance on March 1, 2021; |
| | • | | Information concerning the nature, cost and character of the administrative and other non-investment advisory services provided by Eaton Vance Management and its affiliates; |
| | • | | Information concerning oversight of the relationship with the custodian, subcustodians, fund accountants, and other third-party service providers by the adviser and/or administrator to each of the funds; |
| | • | | Information concerning efforts to implement policies and procedures with respect to various new regulations applicable to the funds, including Rule 12d1-4 (the Fund-of-Funds Rule), Rule 18f-4 (the Derivatives Rule) and Rule 2a-5 (the Fair Valuation Rule); |
| | • | | For an Eaton Vance Fund structured as an exchange-listed closed-end fund, information concerning the benefits of the closed-end fund structure, as well as, where relevant, the closed-end fund’s market prices (including as compared to the closed-end fund’s net asset value (NAV)), trading volume data, continued use of auction preferred shares (where applicable), distribution rates and other relevant matters; |
| | • | | The risks which the adviser and/or its affiliates incur in connection with the management and operation of the funds, including, among others, litigation, regulatory, entrepreneurial, and other business risks (and the associated costs of such risks); and |
| | • | | The terms of each investment advisory agreement and sub-advisory agreement. |
During the various meetings of the Board and its committees over the course of the year leading up to the June 8, 2022 meeting, the Trustees received information from portfolio managers and other investment professionals of the advisers and sub-advisers of the funds regarding investment and performance matters, and considered various investment and trading strategies used in pursuing the funds’ investment objectives. The Trustees also received information regarding risk management techniques employed in connection with the management of the funds. The Board and its committees evaluated issues pertaining to industry and regulatory developments, compliance procedures, fund governance and other issues with respect to the funds, and received and participated in reports and presentations provided by Eaton Vance Management, Boston Management and Research and fund sub-advisers, with respect to such matters. In addition to the formal meetings of the Board and its committees, the Independent Trustees held regular teleconferences to discuss, among other topics, matters relating to the continuation of investment advisory agreements and sub-advisory agreements.
The Contract Review Committee was advised throughout the contract review process by Goodwin Procter LLP, independent legal counsel for the Independent Trustees. The members of the Contract Review Committee, with the advice of such counsel, exercised their own business judgment in determining the material factors to be considered in evaluating each investment advisory agreement and sub-advisory agreement and the weight to be given to each such factor. The conclusions reached with respect to each investment advisory agreement and sub-advisory agreement were based on a comprehensive evaluation of all the information provided and not any single factor. Moreover, each member of the Contract Review Committee may have placed varying emphasis on particular factors in reaching conclusions with respect to each investment advisory agreement and sub-advisory agreement. In evaluating each investment advisory agreement and sub-advisory agreement, including the fee structures and other terms contained in such agreements, the members of the Contract Review Committee were also informed by multiple years of analysis and discussion with the adviser and sub-adviser to each of the Eaton Vance Funds.
Results of the Contract Review Process
Based on its consideration of the foregoing, and such other information it deemed relevant, including the factors and conclusions described below, the Contract Review Committee concluded that the continuation of the investment advisory and administrative agreement between Eaton Vance Short Duration Government Income Fund (the “Fund”) and Eaton Vance Management (the “Adviser”), including its fee structure, is in the interests of shareholders and,
Eaton Vance
Short Duration Government Income Fund
October 31, 2022
Board of Trustees’ Contract Approval — continued
therefore, recommended to the Board approval of the agreement. Based on the recommendation of the Contract Review Committee, the Board, including a majority of the Independent Trustees, voted to approve continuation of the investment advisory and administrative agreement for the Fund.
Nature, Extent and Quality of Services
In considering whether to approve the investment advisory agreement for the Fund, the Board evaluated the nature, extent and quality of services provided to the Fund by the Adviser.
The Board considered the Adviser’s management capabilities and investment processes in light of the types of investments held by the Fund, including the education, experience and number of investment professionals and other personnel who provide portfolio management, investment research, and similar services to the Fund. In particular, the Board considered the abilities and experience of the Adviser’s investment professionals in analyzing special considerations relevant to investing in investment grade and other income securities, including in investing in securities issued, backed or otherwise guaranteed by the U.S. government. The Board also took into account the resources dedicated to portfolio management and other services, the compensation methods of the Adviser and other factors, including the reputation and resources of the Adviser to recruit and retain highly qualified research, advisory and supervisory investment professionals. In addition, the Board considered the time and attention devoted to the Eaton Vance Funds, including the Fund, by senior management, as well as the infrastructure, operational capabilities and support staff in place to assist in the portfolio management and operations of the Fund, including the provision of administrative services. The Board also considered the business-related and other risks to which the Adviser or its affiliates may be subject in managing the Fund.
The Board considered the compliance programs of the Adviser and relevant affiliates thereof. The Board considered compliance and reporting matters regarding, among other things, personal trading by investment professionals, disclosure of portfolio holdings, late trading, frequent trading, portfolio valuation, business continuity and the allocation of investment opportunities. The Board also considered the responses of the Adviser and its affiliates to requests in recent years from regulatory authorities, such as the Securities and Exchange Commission and the Financial Industry Regulatory Authority.
The Board considered other administrative services provided or overseen by Eaton Vance Management and its affiliates, including transfer agency and accounting services. The Board evaluated the benefits to shareholders of investing in a fund that is a part of a large fund complex offering exposure to a variety of asset classes and investment disciplines, as well as the ability, in many cases, to exchange an investment among different funds without incurring additional sales charges.
After consideration of the foregoing factors, among others, the Board concluded that the nature, extent and quality of services provided by the Adviser, taken as a whole, are appropriate and consistent with the terms of the investment advisory agreement.
Fund Performance
The Board compared the Fund’s investment performance to that of comparable funds identified by an independent data provider (the peer group), as well as an appropriate benchmark index and a custom peer group of similarly managed funds. The Board’s review included comparative performance data with respect to the Fund for the one-, three-, five- and ten-year periods ended December 31, 2021. In this regard, the Board noted that the performance of the Fund was lower than the median performance of the Fund’s peer group and custom peer group for the three-year period. The Board also noted that the performance of the Fund was equal to its benchmark index for the three-year period. On the basis of the foregoing, the performance of the Fund over other periods, and other relevant information provided by the Adviser in response to inquiries from the Contract Review Committee, the Board concluded that the performance of the Fund was satisfactory.
Management Fees and Expenses
The Board considered contractual fee rates payable by the Fund for advisory and administrative services (referred to collectively as “management fees”). As part of its review, the Board considered the Fund’s management fees and total expense ratio for the one-year period ended December 31, 2021, as compared to those of comparable funds, before and after giving effect to any undertaking to waive fees or reimburse expenses. The Board also considered certain factors identified by management in response to inquiries from the Contract Review Committee regarding the Fund’s total expense ratio relative to comparable funds.
After considering the foregoing information, and in light of the nature, extent and quality of the services provided by the Adviser, the Board concluded that the management fees charged for advisory and related services are reasonable.
Profitability and “Fall-Out” Benefits
The Board considered the level of profits realized by the Adviser and relevant affiliates thereof in providing investment advisory and administrative services to the Fund and to all Eaton Vance Funds as a group. The Board considered the level of profits realized without regard to marketing support or other payments by the Adviser and its affiliates to third parties in respect of distribution or other services.
The Board concluded that, in light of the foregoing factors and the nature, extent and quality of the services rendered, the profits realized by the Adviser and its affiliates are deemed not to be excessive.
Eaton Vance
Short Duration Government Income Fund
October 31, 2022
Board of Trustees’ Contract Approval — continued
The Board also considered direct or indirect fall-out benefits received by the Adviser and its affiliates in connection with their respective relationships with the Fund, including the benefits of research services that may be available to the Adviser as a result of securities transactions effected for the Fund and other investment advisory clients.
Economies of Scale
In reviewing management fees and profitability, the Board also considered the extent to which the Adviser and its affiliates, on the one hand, and the Fund, on the other hand, can expect to realize benefits from economies of scale as the assets of the Fund increase. The Board acknowledged the difficulty in accurately measuring the benefits resulting from economies of scale, if any, with respect to the management of any specific fund or group of funds. The Board reviewed data summarizing the increases and decreases in the assets of the Fund and of all Eaton Vance Funds as a group over various time periods, and evaluated the extent to which the total expense ratio of the Fund and the profitability of the Adviser and its affiliates may have been affected by such increases or decreases. Based upon the foregoing, the Board concluded that the Fund currently shares in the benefits from economies of scale, if any, when they are realized by the Adviser. The Board also concluded that the structure of the advisory fee, which includes breakpoints at several asset levels, will allow the Fund to continue to benefit from any economies of scale in the future.
Eaton Vance
Short Duration Government Income Fund
October 31, 2022
Liquidity Risk Management Program
The Fund has implemented a written liquidity risk management program (Program) and related procedures to manage its liquidity in accordance with Rule 22e-4 under the Investment Company Act of 1940, as amended (Liquidity Rule). The Liquidity Rule defines “liquidity risk” as the risk that a fund could not meet requests to redeem shares issued by the fund without significant dilution of the remaining investors’ interests in the fund. The Fund’s Board of Trustees/Directors has designated the investment adviser to serve as the administrator of the Program and the related procedures. The administrator has established a Liquidity Risk Management Oversight Committee (Committee) to perform the functions necessary to administer the Program. As part of the Program, the administrator is responsible for identifying illiquid investments and categorizing the relative liquidity of the Fund’s investments in accordance with the Liquidity Rule. Under the Program, the administrator assesses, manages, and periodically reviews the Fund’s liquidity risk, and is responsible for making certain reports to the Fund’s Board of Trustees/Directors and the Securities and Exchange Commission (SEC) regarding the liquidity of the Fund’s investments, and to notify the Board of Trustees/Directors and the SEC of certain liquidity events specified in the Liquidity Rule. The liquidity of the Fund’s portfolio investments is determined based on a number of factors including, but not limited to, relevant market, trading and investment-specific considerations under the Program.
At a meeting of the Fund’s Board of Trustees/Directors on June 7, 2022, the Committee provided a written report to the Fund’s Board of Trustees/Directors pertaining to the operation, adequacy, and effectiveness of implementation of the Program, as well as the operation of the highly liquid investment minimum (if applicable) for the period January 1, 2021 through December 31, 2021 (Review Period). The Program operated effectively during the Review Period, supporting the administrator’s ability to assess, manage and monitor Fund liquidity risk, including during periods of market volatility and net redemptions. During the Review Period, the Fund met redemption requests on a timely basis.
There can be no assurance that the Program will achieve its objectives in the future. Please refer to the Fund’s prospectus for more information regarding the Fund’s exposure to liquidity risk and other principal risks to which an investment in the Fund may be subject.
Eaton Vance
Short Duration Government Income Fund
October 31, 2022
Management and Organization
Fund Management. The Trustees of Eaton Vance Mutual Funds Trust (the Trust) are responsible for the overall management and supervision of the Trust’s affairs. The Board members and officers of the Trust are listed below. Except as indicated, each individual has held the office shown or other offices in the same company for the last five years. Board members hold indefinite terms of office. Each Trustee holds office until his or her successor is elected and qualified, subject to a prior death, resignation, retirement, disqualification or removal. Under the terms of the Fund’s current Trustee retirement policy, an Independent Trustee must retire and resign as a Trustee on the earlier of: (i) the first day of July following his or her 74th birthday; or (ii), with limited exception, December 31st of the 20th year in which he or she has served as a Trustee. However, if such retirement and resignation would cause the Fund to be out of compliance with Section 16 of the 1940 Act or any other regulations or guidance of the SEC, then such retirement and resignation will not become effective until such time as action has been taken for the Fund to be in compliance therewith. The “noninterested Trustees” consist of those Trustees who are not “interested persons” of the Trust, as that term is defined under the 1940 Act. The business address of each Board member and officer is Two International Place, Boston, Massachusetts 02110. As used below, “BMR” refers to Boston Management and Research, “EVC” refers to Eaton Vance Corp., “EV” refers to EV LLC, “EVM” refers to Eaton Vance Management and “EVD” refers to Eaton Vance Distributors, Inc. EV is the trustee of each of EVM and BMR. Effective March 1, 2021, each of EVM, BMR, EVD and EV are indirect, wholly owned subsidiaries of Morgan Stanley. Each officer affiliated with EVM may hold a position with other EVM affiliates that is comparable to his or her position with EVM listed below. Each Trustee oversees 135 funds (with the exception of Mr. Bowser who oversees 110 funds) in the Eaton Vance fund complex (including both funds and portfolios in a hub and spoke structure).
| | | | | | |
| Name and Year of Birth | | Trust Position(s) | | Length of Service | | Principal Occupation(s) and Other Directorships During Past Five Years and Other Relevant Experience |
| | | |
| Interested Trustee | | | | | | |
| | | |
| Thomas E. Faust Jr. 1958 | | Trustee | | Since 2007 | | Chairman of Morgan Stanley Investment Management, Inc. (MSIM), member of the Board of Managers and President of EV (since 2021), Chief Executive Officer of EVM and BMR. Formerly, Chairman, Chief Executive Officer (2007-2021) and President (2006-2021) of EVC and Director of EVD (2007-2022). Mr. Faust is an interested person because of his positions with MSIM, BMR, EVM and EV, which are affiliates of the Trust. Other Directorships. Formerly, Director of EVC (2007-2021) and Hexavest Inc. (investment management firm) (2012-2021). |
| |
| Noninterested Trustees | | |
| | | |
Alan C. Bowser(1) 1962 | | Trustee | | Since 2022 | | Chief Diversity Officer, Partner and a member of the Operating Committee, and formerly served as Senior Advisor on Diversity and Inclusion for the firm’s chief executive officer, Co-Head of the Americas Region, and Senior Client Advisor of Bridgewater Associates, an asset management firm (2011- present). Other Directorships. None. |
| | | |
Mark R. Fetting 1954 | | Trustee | | Since 2016 | | Private investor. Formerly held various positions at Legg Mason, Inc. (investment management firm) (2000-2012), including President, Chief Executive Officer, Director and Chairman (2008-2012), Senior Executive Vice President (2004-2008) and Executive Vice President (2001-2004). Formerly, President of Legg Mason family of funds (2001-2008). Formerly, Division President and Senior Officer of Prudential Financial Group, Inc. and related companies (investment management firm) (1991-2000). Other Directorships. None. |
| | | |
Cynthia E. Frost 1961 | | Trustee | | Since 2014 | | Private investor. Formerly, Chief Investment Officer of Brown University (university endowment) (2000-2012). Formerly, Portfolio Strategist for Duke Management Company (university endowment manager) (1995-2000). Formerly, Managing Director, Cambridge Associates (investment consulting company) (1989-1995). Formerly, Consultant, Bain and Company (management consulting firm) (1987- 1989). Formerly, Senior Equity Analyst, BA Investment Management Company (1983-1985). Other Directorships. None. |
| | | |
George J. Gorman 1952 | | Chairperson of the Board and Trustee | | Since 2021 (Chairperson) and 2014 (Trustee) | | Principal at George J. Gorman LLC (consulting firm). Formerly, Senior Partner at Ernst & Young LLP (a registered public accounting firm) (1974-2009). Other Directorships. None. |
Eaton Vance
Short Duration Government Income Fund
October 31, 2022
Management and Organization — continued
| | | | | | |
| Name and Year of Birth | | Trust Position(s) | | Length of Service | | Principal Occupation(s) and Other Directorships During Past Five Years and Other Relevant Experience |
| | |
| Noninterested Trustees (continued) | | | | |
| | | |
Valerie A. Mosley 1960 | | Trustee | | Since 2014 | | Chairwoman and Chief Executive Officer of Valmo Ventures (a consulting and investment firm). Founder of Upward Wealth, Inc., dba BrightUp, a fintech platform. Formerly, Partner and Senior Vice President, Portfolio Manager and Investment Strategist at Wellington Management Company, LLP (investment management firm) (1992-2012). Formerly, Chief Investment Officer, PG Corbin Asset Management (1990-1992). Formerly worked in institutional corporate bond sales at Kidder Peabody (1986-1990). Other Directorships. Director of DraftKings, Inc. (digital sports entertainment and gaming company) (since September 2020). Director of Envestnet, Inc. (provider of intelligent systems for wealth management and financial wellness) (since 2018). Formerly, Director of Dynex Capital, Inc. (mortgage REIT) (2013-2020) and Director of Groupon, Inc. (e-commerce provider) (2020-2022). |
| | | |
Keith Quinton 1958 | | Trustee | | Since 2018 | | Private investor, researcher and lecturer. Formerly, Independent Investment Committee Member at New Hampshire Retirement System (2017-2021). Formerly, Portfolio Manager and Senior Quantitative Analyst at Fidelity Investments (investment management firm) (2001-2014). Other Directorships. Formerly, Director (2016-2021) and Chairman (2019-2021) of New Hampshire Municipal Bond Bank. |
| | | |
Marcus L. Smith 1966 | | Trustee | | Since 2018 | | Private investor and independent corporate director. Formerly, Chief Investment Officer, Canada (2012-2017), Chief Investment Officer, Asia (2010-2012), Director of Asian Research (2004-2010) and portfolio manager (2001-2017) at MFS Investment Management (investment management firm). Other Directorships. Director of First Industrial Realty Trust, Inc. (an industrial REIT) (since 2021). Director of MSCI Inc. (global provider of investment decision support tools) (since 2017). Formerly, Director of DCT Industrial Trust Inc. (logistics real estate company) (2017-2018). |
| | | |
Susan J. Sutherland 1957 | | Trustee | | Since 2015 | | Private investor. Director of Ascot Group Limited and certain of its subsidiaries (insurance and reinsurance) (since 2017). Formerly, Director of Hagerty Holding Corp. (insurance) (2015-2018) and Montpelier Re Holdings Ltd. (insurance and reinsurance) (2013-2015). Formerly, Associate, Counsel and Partner at Skadden, Arps, Slate, Meagher & Flom LLP (law firm) (1982-2013). Other Directorships. Director of Kairos Acquisition Corp. (insurance/InsurTech acquisition company) (since 2021). |
| | | |
| Scott E. Wennerholm 1959 | | Trustee | | Since 2016 | | Private investor. Formerly, Trustee at Wheelock College (postsecondary institution) (2012-2018). Formerly, Consultant at GF Parish Group (executive recruiting firm) (2016-2017). Formerly, Chief Operating Officer and Executive Vice President at BNY Mellon Asset Management (investment management firm) (2005-2011). Formerly, Chief Operating Officer and Chief Financial Officer at Natixis Global Asset Management (investment management firm) (1997-2004). Formerly, Vice President at Fidelity Investments Institutional Services (investment management firm) (1994-1997). Other Directorships. None. |
| | | |
Nancy A. Wiser(1) 1967 | | Trustee | | Since 2022 | | Formerly, Executive Vice President and the Global Head of Operations at Wells Fargo Asset Management (2011-2021). Other Directorships. None. |
| | | |
| Name and Year of Birth | | Trust Position(s) | | Length of Service | | Principal Occupation(s) During Past Five Years |
|
| Principal Officers who are not Trustees |
| | | |
Eric A. Stein 1980 | | President | | Since 2020 | | Vice President and Chief Investment Officer, Fixed Income of EVM and BMR. Prior to November 1, 2020, Mr. Stein was a co-Director of Eaton Vance’s Global Income Investments. Also Vice President of Calvert Research and Management (“CRM”). |
| | | |
Deidre E. Walsh 1971 | | Vice President and
Chief
Legal Officer | | Since 2009 | | Vice President of EVM and BMR. Also Vice President of CRM. |
| | | |
James F. Kirchner 1967 | | Treasurer | | Since 2007 | | Vice President of EVM and BMR. Also Vice President of CRM. |
Eaton Vance
Short Duration Government Income Fund
October 31, 2022
Management and Organization — continued
| | | | | | |
| | | |
| Name and Year of Birth | | Trust Position(s) | | Length of Service | | Principal Occupation(s) During Past Five Years |
|
| Principal Officers who are not Trustees (continued) |
| | | |
Nicholas Di Lorenzo 1987 | | Secretary | | Since 2022 | | Formerly, associate (2012-2021) and counsel (2022) at Dechert LLP. |
| | | |
Richard F. Froio 1968 | | Chief Compliance Officer | | Since 2017 | | Vice President of EVM and BMR since 2017. Formerly, Deputy Chief Compliance Officer (Adviser/Funds) and Chief Compliance Officer (Distribution) at PIMCO (2012-2017) and Managing Director at BlackRock/Barclays Global Investors (2009-2012). |
| (1) | Mr. Bowser and Ms. Wiser began serving as Trustees effective April 4, 2022. |
The SAI for the Fund includes additional information about the Trustees and officers of the Fund and can be obtained without charge on Eaton Vance’s website at www.eatonvance.com or by calling 1-800-262-1122.
Eaton Vance Funds
| | |
| Privacy Notice | | April 2021 |
| | |
| |
| FACTS | | WHAT DOES EATON VANCE DO WITH YOUR
PERSONAL INFORMATION? |
| | | |
| |
| | |
| Why? | | Financial companies choose how they share your personal information. Federal law gives consumers the right to limit some but not all sharing. Federal law also requires us to tell you how we collect, share, and protect your personal information. Please read this notice carefully to understand what we do. |
| | |
| | | |
| What? | | The types of personal information we collect and share depend on the product or service you have with us. This information can include: ∎ Social Security number and income ∎ investment experience and risk tolerance ∎ checking account number and wire transfer instructions |
| | |
| | | |
| How? | | All financial companies need to share customers’ personal information to run their everyday business. In the section below, we list the reasons financial companies can share their customers’ personal information; the reasons Eaton Vance chooses to share; and whether you can limit this sharing. |
| | |
| | | |
| | | | |
Reasons we can share your
personal information | | Does Eaton Vance share? | | Can you limit this sharing? |
| For our everyday business purposes — such as to process your transactions, maintain your account(s), respond to court orders and legal investigations, or report to credit bureaus | | Yes | | No |
| For our marketing purposes — to offer our products and services to you | | Yes | | No |
| For joint marketing with other financial companies | | No | | We don’t share |
| For our investment management affiliates’ everyday business purposes — information about your transactions, experiences, and creditworthiness | | Yes | | Yes |
| For our affiliates’ everyday business purposes — information about your transactions and experiences | | Yes | | No |
| For our affiliates’ everyday business purposes — information about your creditworthiness | | No | | We don’t share |
| For our investment management affiliates to market to you | | Yes | | Yes |
| For our affiliates to market to you | | No | | We don’t share |
| For nonaffiliates to market to you | | No | | We don’t share |
| | |
| To limit our sharing | | Call toll-free 1-800-262-1122 or email: EVPrivacy@eatonvance.com Please note: If you are a new customer, we can begin sharing your information 30 days from the date we sent this notice. When you are no longer our customer, we continue to share your information as described in this notice. However, you can contact us at any time to limit our sharing. |
| | |
| | | |
| | |
| Questions? | | Call toll-free 1-800-262-1122 or email: EVPrivacy@eatonvance.com |
| | |
| | | |
Eaton Vance Funds
| | |
| Privacy Notice — continued | | April 2021 |
| | |
| Who we are |
| Who is providing this notice? | | Eaton Vance Management, Eaton Vance Distributors, Inc., Eaton Vance Trust Company, Eaton Vance Management (International) Limited, Eaton Vance Advisers International Ltd., Eaton Vance Global Advisors Limited, Eaton Vance Management’s Real Estate Investment Group, Boston Management and Research, Calvert Research and Management, Eaton Vance and Calvert Fund Families and our investment advisory affiliates (“Eaton Vance”) (see Investment Management Affiliates definition below) |
| What we do |
| How does Eaton Vance protect my personal information? | | To protect your personal information from unauthorized access and use, we use security measures that comply with federal law. These measures include computer safeguards and secured files and buildings. We have policies governing the proper handling of customer information by personnel and requiring third parties that provide support to adhere to appropriate security standards with respect to such information. |
| How does Eaton Vance collect my personal information? | | We collect your personal information, for example, when you ∎ open an account or make deposits or withdrawals from your account ∎ buy securities from us or make a wire transfer ∎ give us your contact information We also collect your personal information from others, such as credit bureaus, affiliates, or other companies. |
| Why can’t I limit all sharing? | | Federal law gives you the right to limit only ∎ sharing for affiliates’ everyday business purposes — information about your creditworthiness ∎ affiliates from using your information to market to you ∎ sharing for nonaffiliates to market to you State laws and individual companies may give you additional rights to limit sharing. See below for more on your rights under state law. |
| Definitions |
| Investment Management Affiliates | | Eaton Vance Investment Management Affiliates include registered investment advisers, registered broker- dealers, and registered and unregistered funds. Investment Management Affiliates does not include entities associated with Morgan Stanley Wealth Management, such as Morgan Stanley Smith Barney LLC and Morgan Stanley & Co. |
| Affiliates | | Companies related by common ownership or control. They can be financial and nonfinancial companies. ∎ Our affiliates include companies with a Morgan Stanley name and financial companies such as Morgan Stanley Smith Barney LLC and Morgan Stanley & Co. |
| Nonaffiliates | | Companies not related by common ownership or control. They can be financial and nonfinancial companies. ∎ Eaton Vance does not share with nonaffiliates so they can market to you. |
| Joint marketing | | A formal agreement between nonaffiliated financial companies that together market financial products or services to you. ∎ Eaton Vance doesn’t jointly market. |
| Other important information |
Vermont: Except as permitted by law, we will not share personal information we collect about Vermont residents with Nonaffiliates unless you provide us with your written consent to share such information. California: Except as permitted by law, we will not share personal information we collect about California residents with Nonaffiliates and we will limit sharing such personal information with our Affiliates to comply with California privacy laws that apply to us. |
Eaton Vance Funds
IMPORTANT NOTICES
Delivery of Shareholder Documents. The Securities and Exchange Commission (SEC) permits funds to deliver only one copy of shareholder documents, including prospectuses, proxy statements and shareholder reports, to fund investors with multiple accounts at the same residential or post office box address. This practice is often called “householding” and it helps eliminate duplicate mailings to shareholders. Eaton Vance, or your financial intermediary, may household the mailing of your documents indefinitely unless you instruct Eaton Vance, or your financial intermediary, otherwise. If you would prefer that your Eaton Vance documents not be householded, please contact Eaton Vance at 1-800-262-1122, or contact your financial intermediary. Your instructions that householding not apply to delivery of your Eaton Vance documents will typically be effective within 30 days of receipt by Eaton Vance or your financial intermediary.
Portfolio Holdings. Each Eaton Vance Fund and its underlying Portfolio(s) (if applicable) files a schedule of portfolio holdings on Part F to Form N-PORT with the SEC. Certain information filed on Form N-PORT may be viewed on the Eaton Vance website at www.eatonvance.com, by calling Eaton Vance at 1-800-262-1122 or in the EDGAR database on the SEC’s website at www.sec.gov.
Proxy Voting. From time to time, funds are required to vote proxies related to the securities held by the funds. The Eaton Vance Funds or their underlying Portfolios (if applicable) vote proxies according to a set of policies and procedures approved by the Funds’ and Portfolios’ Boards. You may obtain a description of these policies and procedures and information on how the Funds or Portfolios voted proxies relating to portfolio securities during the most recent 12-month period ended June 30, without charge, upon request, by calling 1-800-262-1122 and by accessing the SEC’s website at www.sec.gov.
This Page Intentionally Left Blank
This Page Intentionally Left Blank
This Page Intentionally Left Blank
Investment Adviser
Boston Management and Research
Two International Place
Boston, MA 02110
Administrator
Eaton Vance Management
Two International Place
Boston, MA 02110
Principal Underwriter*
Eaton Vance Distributors, Inc.
Two International Place
Boston, MA 02110
(617) 482-8260
Custodian
State Street Bank and Trust Company
State Street Financial Center, One Lincoln Street
Boston, MA 02111
Transfer Agent
BNY Mellon Investment Servicing (US) Inc.
Attn: Eaton Vance Funds
P.O. Box 9653
Providence, RI 02940-9653
(800) 262-1122
Independent Registered Public Accounting Firm
Deloitte & Touche LLP
200 Berkeley Street
Boston, MA 02116-5022
Fund Offices
Two International Place
Boston, MA 02110
| * | FINRA BrokerCheck. Investors may check the background of their Investment Professional by contacting the Financial Industry Regulatory Authority (FINRA). FINRA BrokerCheck is a free tool to help investors check the professional background of current and former FINRA-registered securities firms and brokers. FINRA BrokerCheck is available by calling 1-800-289-9999 and at www.FINRA.org. The FINRA BrokerCheck brochure describing this program is available to investors at www.FINRA.org. |
1560 10.31.22
Eaton Vance
Tax-Managed Global Dividend Income Fund
Annual Report
October 31, 2022
Commodity Futures Trading Commission Registration. The Commodity Futures Trading Commission (“CFTC”) has adopted regulations that subject registered investment companies and advisers to regulation by the CFTC if a fund invests more than a prescribed level of its assets in certain CFTC-regulated instruments (including futures, certain options and swap agreements) or markets itself as providing investment exposure to such instruments. The investment adviser has claimed an exclusion from the definition of “commodity pool operator” under the Commodity Exchange Act with respect to its management of the Fund. Accordingly, neither the Fund nor the adviser with respect to the operation of the Fund is subject to CFTC regulation. Because of its management of other strategies, the Fund's adviser is registered with the CFTC as a commodity pool operator. The adviser is also registered as a commodity trading advisor.
Fund shares are not insured by the FDIC and are not deposits or other obligations of, or guaranteed by, any depository institution. Shares are subject to investment risks, including possible loss of principal invested.
This report must be preceded or accompanied by a current summary prospectus or prospectus. Before investing, investors should consider carefully the investment objective, risks, and charges and expenses of a mutual fund. This and other important information is contained in the summary prospectus and prospectus, which can be obtained from a financial intermediary. Prospective investors should read the prospectus carefully before investing. For further information, please call 1-800-262-1122.
Annual Report October 31, 2022
Eaton Vance
Tax-Managed Global Dividend Income Fund
Eaton Vance
Tax-Managed Global Dividend Income Fund
October 31, 2022
Management’s Discussion of Fund Performance†
Economic and Market Conditions
The 12-month period starting November 1, 2021, was dominated by the ongoing effects of one black swan event -- the COVID-19 pandemic -- and fallout from another -- Russia’s invasion of Ukraine in February 2022.
In the opening months of the period, stock investors as well as consumers appeared to take a “glass is half full” approach. In both the U.S. and Europe, consumers rushed to spend money saved earlier in the pandemic. Major U.S. equity indexes closed at new all-time highs during the final months of 2021.
But as the new year began, investors appeared to reevaluate the twin threats of inflation and interest rate hikes, and stock performance turned negative. In February, Russia’s invasion of Ukraine sent shock waves through U.S. and global markets, exacerbating inflationary pressures on energy and food costs. Central banks around the world -- including the U.S. Federal Reserve (the Fed), the Bank of England, and the European Central Bank (ECB) -- initiated their first interest rate hikes in years. In Europe, looming energy shortages caused by the Russia-Ukraine conflict pushed inflation rates even higher and stock prices lower during the period.
In the U.S., investors began to expect the Fed would raise interest rates at every policy meeting in 2022 and, in turn, worried that aggressive rate hikes could tip the economy into recession. At its June, July, and September 2022 meetings, the Fed hiked the federal funds rate 0.75% each time -- to a 3.00%-3.25% range -- its first moves of that magnitude since 1994. Higher interest rates, inflation, and recessionary worries drove stock prices down around the globe.
As the period came to a close in October 2022, however, U.S. and European stocks delivered positive performance for the first time in months -- driven by a combination of better-than-expected U.S. company earnings; improving investor sentiment that stocks had been oversold during the August-September market pullback; government measures to address Europe’s energy crisis; and hope that central bank rate hikes would help tame inflation.
Meanwhile in the world’s second-largest economy, China’s zero-COVID policy severely restricted economic output. The MSCI Golden Dragon Index, a measure of Chinese large-cap and mid-cap stocks, lost more ground in October and was one of the worst-performing major indexes during the period, declining 42.74%.
Major equity indexes elsewhere also suffered significant losses. For the period as a whole, the MSCI ACWI Index, a broad measure of global equities, returned -19.96%; the S&P 500® Index, a broad measure of U.S. stocks, returned -14.61%; and the technology-laden Nasdaq Composite Index returned -28.56%. The MSCI EAFE Index of developed-market international equities returned -23.00%, while the MSCI Emerging Markets Index, dragged down by its China allocation, returned -31.03% during the period.
Fund Performance
For the 12-month period ended October 31, 2022, Eaton Vance Tax-Managed Global Dividend Income Fund (the Fund) returned -19.65% for Class A shares at net asset value (NAV), underperforming its benchmark, the MSCI World Index (the Index), which returned -18.48%.
The Fund’s use of equity index futures contracts, a type of derivative, detracted from performance relative to the Index. Within the Fund’s common stock portfolio, the Fund’s strategy of emphasizing dividend-paying stocks resulted in an overweight allocation to European equities and an underweight allocation to U.S. equities. The Fund hedged these overweight and underweight exposures by selling short European index futures contracts and buying U.S. index futures contracts. By period-end, these index futures contracts were no longer in effect.
The Fund’s common stock allocation underperformed the Index and detracted from Fund performance versus the Index as well. Within the common stock allocation, detractors from relative returns included stock selections in the industrials, utilities, and information technology sectors.
On an individual stock basis, an overweight position in Germany-based athletic apparel company Adidas AG (Adidas) was the largest detractor from returns versus the Index. Several factors precipitated a significant decline in Adidas’ stock price during the period: lowered sales forecasts amid initiatives to clear out excess inventory; the termination of Adidas’ partnership with Kanye West’s Yeezy brand; lower revenues in China due to the country’s zero-COVID-19 policies and lockdowns; and the unexpected resignation of Adidas’ CEO.
In contrast, contributors to performance of the common stock allocation included security selections in the financials and communication services sectors, along with security selections and an underweight position in the consumer discretionary sector.
On an individual stock basis, the largest contributor to relative returns was an overweight position in oil and gas producer EOG Resources, Inc., as higher energy prices led to increased profits that boosted its stock price during the period.
The Fund’s allocation to preferred securities contributed modestly to performance versus the Index as well. The Fund’s preferred allocation -- preferred stocks, exchange-traded funds investing primarily in preferred stocks, and corporate bonds and other debt securities with preferred characteristics -- outperformed both the Index and the overall preferred market, as measured by the ICE BofA Fixed Rate Preferred Securities Index (the Preferred Index).
See Endnotes and Additional Disclosures in this report.
Past performance is no guarantee of future results. Returns are historical and are calculated by determining the percentage change in net asset value (NAV) or offering price (as applicable) with all distributions reinvested. Furthermore, returns do not reflect the deduction of taxes that shareholders may have to pay on Fund distributions or upon the redemption of Fund shares. Investment return and principal value will fluctuate so that shares, when redeemed, may be worth more or less than their original cost. Performance for periods less than or equal to one year is cumulative. Performance is for the stated time period only; due to market volatility, current Fund performance may be lower or higher than the quoted return. For performance as of the most recent month-end, please refer to eatonvance.com.
Eaton Vance
Tax-Managed Global Dividend Income Fund
October 31, 2022
Management’s Discussion of Fund Performance† — continued
Outperformance versus the Preferred Index was driven largely by an overweight position in the energy sector where demand grew and commodity prices rose, particularly after Russia -- one of the world’s largest oil and gas exporters -- invaded Ukraine and its exports were sanctioned by much of the world.
See Endnotes and Additional Disclosures in this report.
Past performance is no guarantee of future results. Returns are historical and are calculated by determining the percentage change in net asset value (NAV) or offering price (as applicable) with all distributions reinvested. Furthermore, returns do not reflect the deduction of taxes that shareholders may have to pay on Fund distributions or upon the redemption of Fund shares. Investment return and principal value will fluctuate so that shares, when redeemed, may be worth more or less than their original cost. Performance for periods less than or equal to one year is cumulative. Performance is for the stated time period only; due to market volatility, current Fund performance may be lower or higher than the quoted return. For performance as of the most recent month-end, please refer to eatonvance.com.
Eaton Vance
Tax-Managed Global Dividend Income Fund
October 31, 2022
Performance
Portfolio Manager(s) Christopher M. Dyer, CFA, of Eaton Vance Advisers International Ltd.; John H. Croft, CFA and Derek J.V. DiGregorio, each of Eaton Vance Management
| % Average Annual Total Returns1,2 | Class
Inception Date | Performance
Inception Date | One Year | Five Years | Ten Years |
| Class A at NAV | 05/30/2003 | 05/30/2003 | (19.65)% | 5.24% | 7.20% |
| Class A with 5.25% Maximum Sales Charge | — | — | (23.88) | 4.12 | 6.63 |
| Class C at NAV | 05/30/2003 | 05/30/2003 | (20.22) | 4.46 | 6.55 |
| Class C with 1% Maximum Deferred Sales Charge | — | — | (20.96) | 4.46 | 6.55 |
| Class I at NAV | 08/27/2007 | 05/30/2003 | (19.44) | 5.50 | 7.46 |
|
| MSCI World Index | — | — | (18.48)% | 6.37% | 8.93% |
| % After-Tax Returns with Maximum Sales Charge | Class
Inception Date | Performance
Inception Date | One Year | Five Years | Ten Years |
| Class A After Taxes on Distributions | 05/30/2003 | 05/30/2003 | (25.13)% | 3.22% | 5.69% |
| Class A After Taxes on Distributions and Sale of Fund Shares | — | — | (12.51) | 3.38 | 5.36 |
| Class C After Taxes on Distributions | 05/30/2003 | 05/30/2003 | (22.15) | 3.73 | 5.76 |
| Class C After Taxes on Distributions and Sale of Fund Shares | — | — | (10.84) | 3.63 | 5.35 |
| Class I After Taxes on Distributions | 08/27/2007 | 05/30/2003 | (20.80) | 4.54 | 6.46 |
| Class I After Taxes on Distributions and Sale of Fund Shares | — | — | (9.75) | 4.46 | 6.07 |
| % Total Annual Operating Expense Ratios3 | Class A | Class C | Class I |
| | 1.16% | 1.92% | 0.91% |
Growth of $10,000
This graph shows the change in value of a hypothetical investment of $10,000 in Class A of the Fund for the period indicated. For comparison, the same investment is shown in the indicated index.
| Growth of Investment | Amount Invested | Period Beginning | At NAV | With Maximum Sales Charge |
| Class C | $10,000 | 10/31/2012 | $18,867 | N.A. |
| Class I, at minimum investment | $1,000,000 | 10/31/2012 | $2,054,565 | N.A. |
See Endnotes and Additional Disclosures in this report.
Past performance is no guarantee of future results. Returns are historical and are calculated by determining the percentage change in net asset value (NAV) or offering price (as applicable) with all distributions reinvested. Furthermore, returns do not reflect the deduction of taxes that shareholders may have to pay on Fund distributions or upon the redemption of Fund shares. Investment return and principal value will fluctuate so that shares, when redeemed, may be worth more or less than their original cost. Performance for periods less than or equal to one year is cumulative. Performance is for the stated time period only; due to market volatility, current Fund performance may be lower or higher than the quoted return. For performance as of the most recent month-end, please refer to eatonvance.com.
Eaton Vance
Tax-Managed Global Dividend Income Fund
October 31, 2022
| Sector Allocation (% of total investments)1 |
| Country Allocation (% of total investments) |
| Top 10 Holdings (% of total investments)1 |
| Alphabet, Inc., Class C | 4.4% |
| Microsoft Corp. | 4.0 |
| Apple, Inc. | 3.2 |
| EOG Resources, Inc. | 3.1 |
| Eli Lilly & Co. | 2.8 |
| Coca-Cola Co. (The) | 2.4 |
| Nestle S.A. | 2.3 |
| Berkshire Hathaway, Inc., Class B | 2.0 |
| Amazon.com, Inc. | 2.0 |
| Novo Nordisk A/S, Class B | 1.9 |
| Total | 28.1% |
Footnotes:
| 1 | Excludes cash and cash equivalents. |
Eaton Vance
Tax-Managed Global Dividend Income Fund
October 31, 2022
Endnotes and Additional Disclosures
| † | The views expressed in this report are those of the portfolio manager(s) and are current only through the date stated at the top of this page. These views are subject to change at any time based upon market or other conditions, and Eaton Vance and the Fund(s) disclaim any responsibility to update such views. These views may not be relied upon as investment advice and, because investment decisions are based on many factors, may not be relied upon as an indication of trading intent on behalf of any Eaton Vance fund. This commentary may contain statements that are not historical facts, referred to as “forward-looking statements.” The Fund’s actual future results may differ significantly from those stated in any forward-looking statement, depending on factors such as changes in securities or financial markets or general economic conditions, the volume of sales and purchases of Fund shares, the continuation of investment advisory, administrative and service contracts, and other risks discussed from time to time in the Fund’s filings with the Securities and Exchange Commission. |
| | |
| 1 | MSCI World Index is an unmanaged index of equity securities in the developed markets. MSCI indexes are net of foreign withholding taxes. Source: MSCI. MSCI data may not be reproduced or used for any other purpose. MSCI provides no warranties, has not prepared or approved this report, and has no liability hereunder. Unless otherwise stated, index returns do not reflect the effect of any applicable sales charges, commissions, expenses, taxes or leverage, as applicable. It is not possible to invest directly in an index. |
| 2 | Total Returns at NAV do not include applicable sales charges. If sales charges were deducted, the returns would be lower. Total Returns shown with maximum sales charge reflect the stated maximum sales charge. Unless otherwise stated, performance does not reflect the deduction of taxes on Fund distributions or redemptions of Fund shares. After-tax returns are calculated using certain assumptions, including using the highest historical individual federal income tax rates, and do not reflect the impact of state/local taxes. Actual after-tax returns depend on a shareholder’s tax situation and the actual characterization of distributions and may differ from those shown. After-tax returns are not relevant to shareholders who hold shares in tax-deferred accounts or shares held by nontaxable entities. Return After Taxes on Distributions may be the same as Return Before Taxes for the same period because no taxable distributions were made during that period. Return After Taxes on Distributions and Sale of Fund Shares may be greater than or equal to Return After Taxes on Distributions for the same period because of losses realized on the sale of Fund shares. The Fund’s after-tax returns also may reflect foreign tax credits passed by the Fund to its shareholders.Effective November 5, 2020, Class C shares automatically convert to Class A shares eight years after purchase. The average annual total returns listed for Class C reflect conversion to Class A shares after eight years. Prior to November 5, 2020, Class C shares automatically converted to Class A shares ten years after purchase. |
| 3 | Source: Fund prospectus. The expense ratios for the current reporting period can be found in the Financial Highlights section of this report. Performance reflects expenses waived and/or reimbursed, if applicable. Without such waivers and/or reimbursements, performance would have been lower. |
| | Fund profile subject to change due to active management. |
| | Additional Information |
| | S&P 500® Index is an unmanaged index of large-cap stocks commonly used as a measure of U.S. stock market performance. S&P Dow Jones Indices are a product of S&P Dow Jones Indices LLC (“S&P DJI”) and have been licensed for use. S&P® and S&P 500® are registered trademarks of S&P DJI; Dow Jones® is a registered trademark of Dow Jones Trademark Holdings LLC (“Dow Jones”); S&P DJI, Dow Jones and their respective affiliates do not sponsor, endorse, sell or promote the Fund, will not have any liability with respect thereto and do not have any liability for any errors, omissions, or interruptions of the S&P Dow Jones Indices. Nasdaq Composite Index is a market capitalization-weighted index of all domestic and international securities listed on Nasdaq. Source: Nasdaq, Inc. The information is provided by Nasdaq (with its affiliates, are referred to as the “Corporations”) and Nasdaq’s third party licensors on an “as is” basis and the Corporations make no guarantees and bear no liability of any kind with respect to the information or the Fund. MSCI Golden Dragon Index is an unmanaged index of common stocks traded in China, Hong Kong and Taiwan. MSCI ACWI Index is an unmanaged free-float-adjusted, market-capitalization-weighted index designed to measure the equity market performance of developed and emerging markets. MSCI EAFE Index is an unmanaged index of equities in the developed markets, excluding the U.S. and Canada. MSCI Emerging Markets Index is an unmanaged index of emerging markets common stocks. |
| | Important Notice to Shareholders |
| | Effective November 18, 2022, the Fund is managed by Christopher M. Dyer, CFA and Derek J.V. DiGregorio. |
Eaton Vance
Tax-Managed Global Dividend Income Fund
October 31, 2022
Example
As a Fund shareholder, you incur two types of costs: (1) transaction costs, including sales charges (loads) on purchases and redemption fees (if applicable); and (2) ongoing costs, including management fees; distribution and/or service fees; and other Fund expenses. This Example is intended to help you understand your ongoing costs (in dollars) of Fund investing and to compare these costs with the ongoing costs of investing in other mutual funds. The Example is based on an investment of $1,000 invested at the beginning of the period and held for the entire period (May 1, 2022 to October 31, 2022).
Actual Expenses
The first section of the table below provides information about actual account values and actual expenses. You may use the information in this section, together with the amount you invested, to estimate the expenses that you paid over the period. Simply divide your account value by $1,000 (for example, an $8,600 account value divided by $1,000 = 8.6), then multiply the result by the number in the first section under the heading entitled “Expenses Paid During Period” to estimate the expenses you paid on your account during this period.
Hypothetical Example for Comparison Purposes
The second section of the table below provides information about hypothetical account values and hypothetical expenses based on the actual Fund expense ratio and an assumed rate of return of 5% per year (before expenses), which is not the actual Fund return. The hypothetical account values and expenses may not be used to estimate the actual ending account balance or expenses you paid for the period. You may use this information to compare the ongoing costs of investing in your Fund and other funds. To do so, compare this 5% hypothetical example with the 5% hypothetical examples that appear in the shareholder reports of the other funds.
Please note that the expenses shown in the table are meant to highlight your ongoing costs only and do not reflect any transactional costs, such as sales charges (loads) or redemption fees (if applicable). Therefore, the second section of the table is useful in comparing ongoing costs only, and will not help you determine the relative total costs of owning different funds. In addition, if these transactional costs were included, your costs would be higher.
| | Beginning
Account Value
(5/1/22) | Ending
Account Value
(10/31/22) | Expenses Paid
During Period*
(5/1/22 – 10/31/22) | Annualized
Expense
Ratio |
| Actual | | | | |
| Class A | $1,000.00 | $ 929.30 | $5.84 | 1.20% |
| Class C | $1,000.00 | $ 926.00 | $9.47 | 1.95% |
| Class I | $1,000.00 | $ 929.80 | $4.62 | 0.95% |
| |
| Hypothetical | | | | |
| (5% return per year before expenses) | | | | |
| Class A | $1,000.00 | $1,019.16 | $6.11 | 1.20% |
| Class C | $1,000.00 | $1,015.38 | $9.91 | 1.95% |
| Class I | $1,000.00 | $1,020.42 | $4.84 | 0.95% |
| * | Expenses are equal to the Fund's annualized expense ratio for the indicated Class, multiplied by the average account value over the period, multiplied by 184/365 (to reflect the one-half year period). The Example assumes that the $1,000 was invested at the net asset value per share determined at the close of business on April 30, 2022. |
Eaton Vance
Tax-Managed Global Dividend Income Fund
October 31, 2022
| Security | Shares | Value |
| Aerospace & Defense — 1.1% |
| Safran S.A. | | 49,881 | $ 5,555,241 |
| | | | $ 5,555,241 |
| Air Freight & Logistics — 0.9% |
| GXO Logistics, Inc.(1) | | 131,897 | $ 4,819,516 |
| | | | $ 4,819,516 |
| Automobiles — 0.7% |
| Stellantis NV | | 279,338 | $ 3,768,707 |
| | | | $ 3,768,707 |
| Banks — 5.6% |
| Banco Santander S.A. | | 2,020,541 | $ 5,240,223 |
| Citigroup, Inc. | | 22,166 | 1,016,533 |
| Citizens Financial Group, Inc. | | 91,549 | 3,744,354 |
| HDFC Bank, Ltd. | | 216,762 | 3,931,790 |
| ING Groep NV | | 293,763 | 2,890,506 |
| M&T Bank Corp. | | 13,863 | 2,334,113 |
| Standard Chartered PLC | | 491,649 | 2,937,473 |
| Toronto-Dominion Bank (The) | | 7,722 | 494,206 |
| Wells Fargo & Co. | | 139,323 | 6,407,465 |
| | | | $ 28,996,663 |
| Beverages — 3.7% |
| Coca-Cola Co. (The) | | 201,470 | $ 12,057,979 |
| Diageo PLC | | 174,536 | 7,182,586 |
| | | | $ 19,240,565 |
| Biotechnology — 1.0% |
| CSL, Ltd. | | 28,206 | $ 5,049,308 |
| | | | $ 5,049,308 |
| Building Products — 0.6% |
| Assa Abloy AB, Class B | | 162,340 | $ 3,277,981 |
| | | | $ 3,277,981 |
| Capital Markets — 1.8% |
| Bank of New York Mellon Corp. (The) | | 111,987 | $ 4,715,773 |
| State Street Corp. | | 61,772 | 4,571,128 |
| | | | $ 9,286,901 |
| Security | Shares | Value |
| Chemicals — 0.5% |
| Sika AG | | 10,725 | $ 2,418,227 |
| | | | $ 2,418,227 |
| Construction Materials — 0.2% |
| CRH PLC | | 22,005 | $ 792,572 |
| | | | $ 792,572 |
| Consumer Finance — 0.6% |
| Capital One Financial Corp. | | 31,393 | $ 3,328,286 |
| | | | $ 3,328,286 |
| Diversified Financial Services — 2.0% |
| Berkshire Hathaway, Inc., Class B(1) | | 35,231 | $ 10,396,316 |
| | | | $ 10,396,316 |
| Electric Utilities — 2.2% |
| Iberdrola S.A. | | 601,442 | $ 6,116,228 |
| NextEra Energy, Inc. | | 71,119 | 5,511,723 |
| | | | $ 11,627,951 |
| Electrical Equipment — 2.2% |
| AMETEK, Inc. | | 50,969 | $ 6,608,641 |
| Schneider Electric SE | | 37,208 | 4,705,186 |
| | | | $ 11,313,827 |
| Electronic Equipment, Instruments & Components — 4.6% |
| CDW Corp. | | 42,219 | $ 7,295,865 |
| Halma PLC | | 138,550 | 3,359,738 |
| Keyence Corp. | | 7,127 | 2,687,343 |
| Keysight Technologies, Inc.(1) | | 17,629 | 3,070,090 |
| TE Connectivity, Ltd. | | 34,983 | 4,275,972 |
| Zebra Technologies Corp., Class A(1) | | 10,994 | 3,113,721 |
| | | | $ 23,802,729 |
| Entertainment — 1.2% |
| Nintendo Co., Ltd. | | 28,460 | $ 1,155,450 |
| Walt Disney Co. (The)(1) | | 46,611 | 4,965,936 |
| | | | $ 6,121,386 |
| Equity Real Estate Investment Trusts (REITs) — 1.1% |
| American Tower Corp. | | 4,449 | $ 921,788 |
| Equity Residential | | 49,769 | 3,136,443 |
| Healthpeak Properties, Inc. | | 72,069 | 1,710,197 |
| | | | $ 5,768,428 |
8
See Notes to Financial Statements.
Eaton Vance
Tax-Managed Global Dividend Income Fund
October 31, 2022
Portfolio of Investments — continued
| Security | Shares | Value |
| Food Products — 3.9% |
| Mondelez International, Inc., Class A | | 143,954 | $ 8,850,292 |
| Nestle S.A. | | 105,121 | 11,443,346 |
| | | | $ 20,293,638 |
| Health Care Equipment & Supplies — 3.6% |
| Alcon, Inc. | | 36,766 | $ 2,238,511 |
| Boston Scientific Corp.(1) | | 171,972 | 7,413,713 |
| Intuitive Surgical, Inc.(1) | | 24,797 | 6,111,717 |
| Straumann Holding AG | | 30,224 | 2,876,457 |
| | | | $ 18,640,398 |
| Health Care Providers & Services — 1.6% |
| Elevance Health, Inc. | | 15,491 | $ 8,470,014 |
| | | | $ 8,470,014 |
| Hotels, Restaurants & Leisure — 2.2% |
| Compass Group PLC | | 382,509 | $ 8,056,334 |
| InterContinental Hotels Group PLC | | 59,229 | 3,182,416 |
| | | | $ 11,238,750 |
| Industrial Conglomerates — 1.0% |
| Siemens AG | | 49,382 | $ 5,392,957 |
| | | | $ 5,392,957 |
| Insurance — 2.6% |
| AIA Group, Ltd. | | 539,760 | $ 4,088,569 |
| Allstate Corp. (The) | | 17,579 | 2,219,349 |
| Arch Capital Group, Ltd.(1) | | 8,440 | 485,300 |
| Aviva PLC | | 3 | 14 |
| AXA S.A. | | 131,430 | 3,245,648 |
| RenaissanceRe Holdings, Ltd. | | 21,294 | 3,293,756 |
| | | | $ 13,332,636 |
| Interactive Media & Services — 4.6% |
| Alphabet, Inc., Class C(1) | | 234,440 | $ 22,192,090 |
| Meta Platforms, Inc., Class A(1) | | 18,723 | 1,744,235 |
| | | | $ 23,936,325 |
| Internet & Direct Marketing Retail — 1.9% |
| Amazon.com, Inc.(1) | | 97,566 | $ 9,994,661 |
| | | | $ 9,994,661 |
| IT Services — 4.1% |
| Amadeus IT Group S.A.(1) | | 76,667 | $ 3,998,587 |
| Fidelity National Information Services, Inc. | | 86,424 | 7,172,328 |
| Security | Shares | Value |
| IT Services (continued) |
| Global Payments, Inc. | | 28,431 | $ 3,248,526 |
| Visa, Inc., Class A | | 31,830 | 6,593,903 |
| | | | $ 21,013,344 |
| Leisure Products — 0.9% |
| Yamaha Corp. | | 125,843 | $ 4,751,108 |
| | | | $ 4,751,108 |
| Life Sciences Tools & Services — 1.0% |
| Danaher Corp. | | 14,037 | $ 3,532,692 |
| Lonza Group AG | | 2,852 | 1,468,163 |
| | | | $ 5,000,855 |
| Machinery — 1.5% |
| Graco, Inc. | | 42,870 | $ 2,982,895 |
| Ingersoll Rand, Inc. | | 90,452 | 4,567,826 |
| Sandvik AB | | 20,944 | 327,286 |
| | | | $ 7,878,007 |
| Metals & Mining — 0.9% |
| Alleima AB(1) | | 4,188 | $ 14,270 |
| Anglo American PLC | | 42,552 | 1,274,611 |
| Rio Tinto, Ltd. | | 55,322 | 3,139,501 |
| | | | $ 4,428,382 |
| Multiline Retail — 1.1% |
| Dollar Tree, Inc.(1) | | 34,683 | $ 5,497,256 |
| | | | $ 5,497,256 |
| Multi-Utilities — 0.3% |
| CMS Energy Corp. | | 29,030 | $ 1,656,162 |
| | | | $ 1,656,162 |
| Oil, Gas & Consumable Fuels — 4.3% |
| Chevron Corp. | | 38,001 | $ 6,874,381 |
| EOG Resources, Inc. | | 114,956 | 15,693,793 |
| | | | $ 22,568,174 |
| Personal Products — 0.5% |
| Kose Corp. | | 23,638 | $ 2,359,556 |
| | | | $ 2,359,556 |
| Pharmaceuticals — 9.1% |
| AstraZeneca PLC | | 41,056 | $ 4,817,187 |
| Eli Lilly & Co. | | 39,712 | 14,379,318 |
9
See Notes to Financial Statements.
Eaton Vance
Tax-Managed Global Dividend Income Fund
October 31, 2022
Portfolio of Investments — continued
| Security | Shares | Value |
| Pharmaceuticals (continued) |
| Novo Nordisk A/S, Class B | | 89,023 | $ 9,679,582 |
| Roche Holding AG PC | | 22,965 | 7,619,744 |
| Sanofi | | 67,099 | 5,774,392 |
| Zoetis, Inc. | | 31,896 | 4,809,279 |
| | | | $ 47,079,502 |
| Professional Services — 2.5% |
| Recruit Holdings Co., Ltd. | | 120,228 | $ 3,699,556 |
| RELX PLC | | 201,694 | 5,417,598 |
| Verisk Analytics, Inc. | | 21,703 | 3,967,959 |
| | | | $ 13,085,113 |
| Semiconductors & Semiconductor Equipment — 4.3% |
| ASML Holding NV | | 18,467 | $ 8,662,622 |
| Infineon Technologies AG | | 187,453 | 4,548,634 |
| Micron Technology, Inc. | | 86,340 | 4,670,994 |
| Taiwan Semiconductor Manufacturing Co., Ltd. ADR | | 69,711 | 4,290,712 |
| | | | $ 22,172,962 |
| Software — 6.5% |
| Adobe, Inc.(1) | | 17,527 | $ 5,582,350 |
| Dassault Systemes SE | | 71,140 | 2,384,525 |
| Intuit, Inc. | | 11,846 | 5,064,165 |
| Microsoft Corp. | | 88,063 | 20,442,064 |
| | | | $ 33,473,104 |
| Specialty Retail — 2.4% |
| Lowe's Cos., Inc. | | 29,619 | $ 5,774,224 |
| TJX Cos., Inc. (The) | | 92,526 | 6,671,125 |
| | | | $ 12,445,349 |
| Technology Hardware, Storage & Peripherals — 3.2% |
| Apple, Inc. | | 107,256 | $ 16,446,635 |
| | | | $ 16,446,635 |
| Textiles, Apparel & Luxury Goods — 1.4% |
| LVMH Moet Hennessy Louis Vuitton SE | | 11,937 | $ 7,532,182 |
| | | | $ 7,532,182 |
| Trading Companies & Distributors — 0.8% |
| Ashtead Group PLC | | 83,174 | $ 4,332,785 |
| | | | $ 4,332,785 |
Total Common Stocks
(identified cost $384,286,350) | | | $498,584,459 |
| Security | Principal
Amount
(000's omitted) | Value |
| Banks — 0.2% |
| Citigroup, Inc.: | | | |
| Series M, 6.30% to 5/15/24(2)(3) | $ | 180 | $ 168,525 |
| Series W, 4.00% to 12/10/25(2)(3) | | 62 | 52,452 |
| Farm Credit Bank of Texas, Series 3, 6.20% to 6/15/28(2)(3)(4) | | 280 | 248,252 |
| HSBC Holdings PLC, 6.00% to 5/22/27(2)(3) | | 200 | 162,540 |
| JPMorgan Chase & Co.: | | | |
| Series KK, 3.65% to 6/1/26(2)(3) | | 221 | 183,419 |
| Series X, 6.10% to 10/1/24(2)(3) | | 118 | 115,604 |
| Societe Generale S.A., 5.375% to 11/18/30(2)(3)(4) | | 200 | 145,370 |
| UniCredit SpA, 7.296% to 4/2/29, 4/2/34(3)(4) | | 200 | 169,851 |
| | | | $ 1,246,013 |
| Capital Markets — 0.0%(5) |
| Charles Schwab Corp. (The), Series G, 5.375% to 6/1/25(2)(3) | $ | 151 | $ 148,169 |
| | | | $ 148,169 |
| Diversified Financial Services — 0.7% |
| Goldman Sachs Group, Inc. (The), Series V, 4.125% to 11/10/26(2)(3) | $ | 38 | $ 29,877 |
| PPTT, 2006-A GS, Class A, 1.754%(2)(4)(6) | | 4,541 | 3,692,341 |
| | | | $ 3,722,218 |
| Electric Utilities — 0.0%(5) |
| Emera, Inc., Series 16-A, 6.75% to 6/15/26, 6/15/76(3) | $ | 80 | $ 74,870 |
| | | | $ 74,870 |
| Gas Utilities — 0.1% |
| NiSource, Inc., 5.65% to 6/15/23(2)(3) | $ | 290 | $ 268,250 |
| | | | $ 268,250 |
| Insurance — 0.1% |
| Liberty Mutual Group, Inc., 4.125% to 9/15/26, 12/15/51(3)(4) | $ | 80 | $ 60,108 |
| QBE Insurance Group, Ltd., 5.875% to 5/12/25(2)(3)(4) | | 200 | 182,570 |
| | | | $ 242,678 |
| Oil, Gas & Consumable Fuels — 0.1% |
| EnLink Midstream Partners, L.P., Series C, 6.00% to 12/15/22(2)(3) | $ | 151 | $ 116,361 |
10
See Notes to Financial Statements.
Eaton Vance
Tax-Managed Global Dividend Income Fund
October 31, 2022
Portfolio of Investments — continued
| Security | Principal
Amount
(000's omitted) | Value |
| Oil, Gas & Consumable Fuels (continued) |
| Odebrecht Oil & Gas Finance, Ltd., 0.00%(2)(4) | $ | 2,008 | $ 3,513 |
| Plains All American Pipeline, L.P., Series B, 6.125% to 12/5/22(2)(3) | | 195 | 163,898 |
| | | | $ 283,772 |
| Pipelines — 0.0%(5) |
| Energy Transfer, L.P., Series B, 6.625% to 2/15/28(2)(3) | $ | 135 | $ 97,200 |
| | | | $ 97,200 |
Total Corporate Bonds
(identified cost $9,108,128) | | | $ 6,083,170 |
| Exchange-Traded Funds — 0.1% |
| Security | Shares | Value |
| Equity Funds — 0.1% |
| iShares Preferred & Income Securities ETF | | 25,815 | $ 787,616 |
Total Exchange-Traded Funds
(identified cost $905,252) | | | $ 787,616 |
| Security | Shares | Value |
| Banks — 0.0%(5) |
| First Republic Bank, Series M, 4.00% | | 4,100 | $ 61,541 |
| JPMorgan Chase & Co., Series LL, 4.625% | | 2,100 | 38,934 |
| | | | $ 100,475 |
| Capital Markets — 0.0%(5) |
| Stifel Financial Corp., Series D, 4.50% | | 4,100 | $ 66,379 |
| | | | $ 66,379 |
| Oil, Gas & Consumable Fuels — 0.1% |
| NuStar Energy, L.P., Series B, 9.126%, (3 mo. USD LIBOR + 5.643%)(7) | | 13,811 | $ 293,345 |
| | | | $ 293,345 |
| Security | Shares | Value |
| Pipelines — 0.0% |
| Energy Transfer, L.P., Series E, 7.60% to 5/15/24(3) | | 1,000 | $ 23,030 |
| | | | $ 23,030 |
Total Preferred Stocks
(identified cost $627,845) | | | $ 483,229 |
| Short-Term Investments — 1.0% |
| Security | Shares | Value |
| Morgan Stanley Institutional Liquidity Funds - Government Portfolio, Institutional Class, 2.88%(8) | | 5,023,564 | $ 5,023,564 |
Total Short-Term Investments
(identified cost $5,023,564) | | | $ 5,023,564 |
Total Investments — 98.6%
(identified cost $399,951,139) | | | $510,962,038 |
| Other Assets, Less Liabilities — 1.4% | | | $ 7,507,240 |
| Net Assets — 100.0% | | | $518,469,278 |
| The percentage shown for each investment category in the Portfolio of Investments is based on net assets. |
| (1) | Non-income producing security. |
| (2) | Perpetual security with no stated maturity date but may be subject to calls by the issuer. |
| (3) | Security converts to variable rate after the indicated fixed-rate coupon period. |
| (4) | Security exempt from registration under Rule 144A of the Securities Act of 1933, as amended. These securities may be sold in certain transactions in reliance on an exemption from registration (normally to qualified institutional buyers). At October 31, 2022, the aggregate value of these securities is $4,502,005 or 0.9% of the Fund's net assets. |
| (5) | Amount is less than 0.05%. |
| (6) | Variable rate security. The stated interest rate, which resets quarterly, is determined at auction and represents the rate in effect at October 31, 2022. |
| (7) | Variable rate security. The stated interest rate represents the rate in effect at October 31, 2022. |
| (8) | May be deemed to be an affiliated investment company. The rate shown is the annualized seven-day yield as of October 31, 2022. |
11
See Notes to Financial Statements.
Eaton Vance
Tax-Managed Global Dividend Income Fund
October 31, 2022
Portfolio of Investments — continued
| Country Concentration of Portfolio |
| Country | Percentage of
Total Investments | Value |
| United States | 61.4% | $313,686,362 |
| United Kingdom | 8.0 | 40,723,282 |
| Switzerland | 6.3 | 32,340,420 |
| France | 5.7 | 29,342,544 |
| Spain | 3.0 | 15,355,038 |
| Netherlands | 3.0 | 15,321,835 |
| Japan | 2.9 | 14,653,013 |
| Germany | 2.0 | 9,941,591 |
| Denmark | 1.9 | 9,679,582 |
| Australia | 1.6 | 8,371,379 |
| Taiwan | 0.8 | 4,290,712 |
| Hong Kong | 0.8 | 4,088,569 |
| India | 0.8 | 3,931,790 |
| Sweden | 0.7 | 3,619,537 |
| Bermuda | 0.6 | 3,293,756 |
| Ireland | 0.2 | 792,572 |
| Canada | 0.1 | 569,076 |
| Italy | 0.0 (1) | 169,851 |
| Brazil | 0.0 (1) | 3,513 |
| Exchange-Traded Funds | 0.2 | 787,616 |
| Total Investments | 100.0% | $510,962,038 |
| (1) | Amount is less than 0.05%. |
| Abbreviations: |
| ADR | – American Depositary Receipt |
| LIBOR | – London Interbank Offered Rate |
| PC | – Participation Certificate |
| PPTT | – Preferred Pass-Through Trust |
| Currency Abbreviations: |
| USD | – United States Dollar |
12
See Notes to Financial Statements.
Eaton Vance
Tax-Managed Global Dividend Income Fund
October 31, 2022
Statement of Assets and Liabilities
| | October 31, 2022 |
| Assets | |
| Unaffiliated investments, at value (identified cost $394,927,575) | $ 505,938,474 |
| Affiliated investment, at value (identified cost $5,023,564) | 5,023,564 |
| Foreign currency, at value (identified cost $4,533,785) | 4,591,328 |
| Interest and dividends receivable | 317,776 |
| Dividends receivable from affiliated investment | 16,950 |
| Receivable for investments sold | 1,438,226 |
| Receivable for Fund shares sold | 359,486 |
| Tax reclaims receivable | 2,084,003 |
| Total assets | $519,769,807 |
| Liabilities | |
| Payable for Fund shares redeemed | $ 500,104 |
| Payable to affiliates: | |
| Investment adviser fee | 276,213 |
| Administration fee | 63,983 |
| Distribution and service fees | 90,100 |
| Trustees' fees | 3,341 |
| Accrued foreign capital gains taxes | 118,552 |
| Accrued expenses | 248,236 |
| Total liabilities | $ 1,300,529 |
| Net Assets | $518,469,278 |
| Sources of Net Assets | |
| Paid-in capital | $ 442,917,094 |
| Distributable earnings | 75,552,184 |
| Net Assets | $518,469,278 |
| Class A Shares | |
| Net Assets | $ 356,745,670 |
| Shares Outstanding | 27,356,042 |
Net Asset Value and Redemption Price Per Share
(net assets ÷ shares of beneficial interest outstanding) | $ 13.04 |
Maximum Offering Price Per Share
(100 ÷ 94.75 of net asset value per share) | $ 13.76 |
| Class C Shares | |
| Net Assets | $ 20,043,639 |
| Shares Outstanding | 1,540,736 |
Net Asset Value and Offering Price Per Share*
(net assets ÷ shares of beneficial interest outstanding) | $ 13.01 |
| Class I Shares | |
| Net Assets | $ 141,679,969 |
| Shares Outstanding | 10,853,017 |
Net Asset Value, Offering Price and Redemption Price Per Share
(net assets ÷ shares of beneficial interest outstanding) | $ 13.05 |
| On sales of $50,000 or more, the offering price of Class A shares is reduced. |
| * | Redemption price per share is equal to the net asset value less any applicable contingent deferred sales charge. |
13
See Notes to Financial Statements.
Eaton Vance
Tax-Managed Global Dividend Income Fund
October 31, 2022
| | Year Ended |
| | October 31, 2022 |
| Investment Income | |
| Dividend income (net of foreign taxes withheld of $3,563,830) | $ 27,829,826 |
| Dividend income from affiliated investments | 57,448 |
| Interest income | 288,109 |
| Other income | 9,319,759 |
| Total investment income | $ 37,495,142 |
| Expenses | |
| Investment adviser fee | $ 3,936,251 |
| Administration fee | 914,724 |
| Distribution and service fees: | |
| Class A | 1,050,129 |
| Class C | 253,876 |
| Trustees’ fees and expenses | 38,329 |
| Custodian fee | 229,273 |
| Transfer and dividend disbursing agent fees | 276,893 |
| Legal and accounting services | 95,469 |
| Printing and postage | 11,682 |
| Registration fees | 54,150 |
| Miscellaneous | 135,261 |
| Total expenses | $ 6,996,037 |
| Deduct: | |
| Waiver and/or reimbursement of expenses by affiliate | $ 4,204 |
| Total expense reductions | $ 4,204 |
| Net expenses | $ 6,991,833 |
| Net investment income | $ 30,503,309 |
| Realized and Unrealized Gain (Loss) | |
| Net realized gain (loss): | |
| Investment transactions (net of foreign capital gains taxes of $14,715) | $ (23,984,906) |
| Investment transactions - affiliated investments | 1,164,154 |
| Futures contracts | (4,620,285) |
| Foreign currency transactions | (548,005) |
| Net realized loss | $ (27,989,042) |
| Change in unrealized appreciation (depreciation): | |
| Investments (including net increase in accrued foreign capital gains taxes of $118,552) | $ (135,887,737) |
| Investments - affiliated investment | (733,495) |
| Foreign currency | (333,117) |
| Net change in unrealized appreciation (depreciation) | $(136,954,349) |
| Net realized and unrealized loss | $(164,943,391) |
| Net decrease in net assets from operations | $(134,440,082) |
14
See Notes to Financial Statements.
Eaton Vance
Tax-Managed Global Dividend Income Fund
October 31, 2022
Statements of Changes in Net Assets
| | Year Ended October 31, |
| | 2022 | 2021 |
| Increase (Decrease) in Net Assets | | |
| From operations: | | |
| Net investment income | $ 30,503,309 | $ 16,238,064 |
| Net realized gain (loss) | (27,989,042) | 31,184,026 |
| Net change in unrealized appreciation (depreciation) | (136,954,349) | 179,415,946 |
| Net increase (decrease) in net assets from operations | $(134,440,082) | $226,838,036 |
| Distributions to shareholders: | | |
| Class A | $ (36,746,038) | $ (12,219,524) |
| Class C | (2,080,114) | (686,082) |
| Class I | (14,667,950) | (5,165,761) |
| Total distributions to shareholders | $ (53,494,102) | $ (18,071,367) |
| Transactions in shares of beneficial interest: | | |
| Class A | $ (8,254,820) | $ (3,189,380) |
| Class C | (4,029,377) | (23,480,455) |
| Class I | 4,202,035 | (18,861,930) |
| Net decrease in net assets from Fund share transactions | $ (8,082,162) | $ (45,531,765) |
| Net increase (decrease) in net assets | $(196,016,346) | $163,234,904 |
| Net Assets | | |
| At beginning of year | $ 714,485,624 | $ 551,250,720 |
| At end of year | $ 518,469,278 | $714,485,624 |
15
See Notes to Financial Statements.
Eaton Vance
Tax-Managed Global Dividend Income Fund
October 31, 2022
| | Class A |
| | Year Ended October 31, |
| | 2022 | 2021 | 2020 | 2019 | 2018 |
| Net asset value — Beginning of year | $ 17.640 | $ 12.690 | $ 12.730 | $ 11.830 | $ 12.520 |
| Income (Loss) From Operations | | | | | |
| Net investment income(1) | $ 0.743 | $ 0.390 | $ 0.392 | $ 0.494 | $ 0.389 |
| Net realized and unrealized gain (loss) | (4.024) | 4.992 | — | 0.838 | (0.647) |
| Total income (loss) from operations | $ (3.281) | $ 5.382 | $ 0.392 | $ 1.332 | $ (0.258) |
| Less Distributions | | | | | |
| From net investment income | $ (0.644) | $ (0.432) | $ (0.432) | $ (0.432) | $ (0.432) |
| From net realized gain | (0.675) | — | — | — | — |
| Total distributions | $ (1.319) | $ (0.432) | $ (0.432) | $ (0.432) | $ (0.432) |
| Net asset value — End of year | $ 13.040 | $ 17.640 | $ 12.690 | $ 12.730 | $ 11.830 |
| Total Return(2) | (19.65)% | 42.80% | 3.20% | 11.52% | (2.24)% |
| Ratios/Supplemental Data | | | | | |
| Net assets, end of year (000’s omitted) | $356,746 | $494,280 | $357,048 | $383,956 | $302,220 |
| Ratios (as a percentage of average daily net assets): | | | | | |
| Expenses | 1.18% (3) | 1.16% | 1.20% | 1.22% | 1.18% |
| Net investment income | 4.97% | 2.41% | 3.09% | 4.08% | 3.07% |
| Portfolio Turnover | 99% | 56% | 173% | 128% | 136% |
| (1) | Computed using average shares outstanding. |
| (2) | Returns are historical and are calculated by determining the percentage change in net asset value with all distributions reinvested and do not reflect the effect of sales charges. |
| (3) | Includes a reduction by the investment adviser of a portion of its adviser fee due to the Fund’s investment in the Liquidity Fund (equal to less than 0.005% of average daily net assets for the year ended October 31, 2022). |
16
See Notes to Financial Statements.
Eaton Vance
Tax-Managed Global Dividend Income Fund
October 31, 2022
Financial Highlights — continued
| | Class C |
| | Year Ended October 31, |
| | 2022 | 2021 | 2020 | 2019 | 2018 |
| Net asset value — Beginning of year | $ 17.590 | $ 12.650 | $ 12.700 | $ 11.800 | $ 12.480 |
| Income (Loss) From Operations | | | | | |
| Net investment income(1) | $ 0.612 | $ 0.248 | $ 0.300 | $ 0.312 | $ 0.295 |
| Net realized and unrealized gain (loss) | (3.990) | 5.003 | (0.014) | 0.927 | (0.639) |
| Total income (loss) from operations | $ (3.378) | $ 5.251 | $ 0.286 | $ 1.239 | $ (0.344) |
| Less Distributions | | | | | |
| From net investment income | $ (0.527) | $ (0.311) | $ (0.336) | $ (0.339) | $ (0.336) |
| From net realized gain | (0.675) | — | — | — | — |
| Total distributions | $ (1.202) | $ (0.311) | $ (0.336) | $ (0.339) | $ (0.336) |
| Net asset value — End of year | $13.010 | $17.590 | $12.650 | $12.700 | $ 11.800 |
| Total Return(2) | (20.22)% | 41.79% | 2.34% | 10.70% | (2.90)% |
| Ratios/Supplemental Data | | | | | |
| Net assets, end of year (000’s omitted) | $ 20,044 | $ 31,961 | $ 42,936 | $ 72,014 | $184,009 |
| Ratios (as a percentage of average daily net assets): | | | | | |
| Expenses | 1.94% (3) | 1.92% | 1.96% | 1.97% | 1.93% |
| Net investment income | 4.08% | 1.55% | 2.38% | 2.62% | 2.33% |
| Portfolio Turnover | 99% | 56% | 173% | 128% | 136% |
| (1) | Computed using average shares outstanding. |
| (2) | Returns are historical and are calculated by determining the percentage change in net asset value with all distributions reinvested and do not reflect the effect of sales charges. |
| (3) | Includes a reduction by the investment adviser of a portion of its adviser fee due to the Fund’s investment in the Liquidity Fund (equal to less than 0.005% of average daily net assets for the year ended October 31, 2022). |
17
See Notes to Financial Statements.
Eaton Vance
Tax-Managed Global Dividend Income Fund
October 31, 2022
Financial Highlights — continued
| | Class I |
| | Year Ended October 31, |
| | 2022 | 2021 | 2020 | 2019 | 2018 |
| Net asset value — Beginning of year | $ 17.650 | $ 12.700 | $ 12.750 | $ 11.850 | $ 12.530 |
| Income (Loss) From Operations | | | | | |
| Net investment income(1) | $ 0.788 | $ 0.424 | $ 0.424 | $ 0.503 | $ 0.419 |
| Net realized and unrealized gain (loss) | (4.032) | 4.998 | (0.010) | 0.859 | (0.635) |
| Total income (loss) from operations | $ (3.244) | $ 5.422 | $ 0.414 | $ 1.362 | $ (0.216) |
| Less Distributions | | | | | |
| From net investment income | $ (0.681) | $ (0.472) | $ (0.464) | $ (0.462) | $ (0.464) |
| From net realized gain | (0.675) | — | — | — | — |
| Total distributions | $ (1.356) | $ (0.472) | $ (0.464) | $ (0.462) | $ (0.464) |
| Net asset value — End of year | $ 13.050 | $ 17.650 | $ 12.700 | $ 12.750 | $ 11.850 |
| Total Return(2) | (19.44)% | 43.12% | 3.38% | 11.78% | (1.91)% |
| Ratios/Supplemental Data | | | | | |
| Net assets, end of year (000’s omitted) | $141,680 | $188,245 | $151,266 | $177,646 | $182,260 |
| Ratios (as a percentage of average daily net assets): | | | | | |
| Expenses | 0.93% (3) | 0.91% | 0.95% | 0.97% | 0.93% |
| Net investment income | 5.26% | 2.63% | 3.34% | 4.16% | 3.30% |
| Portfolio Turnover | 99% | 56% | 173% | 128% | 136% |
| (1) | Computed using average shares outstanding. |
| (2) | Returns are historical and are calculated by determining the percentage change in net asset value with all distributions reinvested. |
| (3) | Includes a reduction by the investment adviser of a portion of its adviser fee due to the Fund’s investment in the Liquidity Fund (equal to less than 0.005% of average daily net assets for the year ended October 31, 2022). |
18
See Notes to Financial Statements.
Eaton Vance
Tax-Managed Global Dividend Income Fund
October 31, 2022
Notes to Financial Statements
1 Significant Accounting Policies
Eaton Vance Tax-Managed Global Dividend Income Fund (the Fund) is a diversified series of Eaton Vance Mutual Funds Trust (the Trust). The Trust is a Massachusetts business trust registered under the Investment Company Act of 1940, as amended (the 1940 Act), as an open-end management investment company. The Fund’s investment objective is to achieve after-tax total return for its shareholders. The Fund offers three classes of shares. Class A shares are generally sold subject to a sales charge imposed at time of purchase. Class C shares are sold at net asset value and are generally subject to a contingent deferred sales charge (see Note 5). Effective November 5, 2020, Class C shares automatically convert to Class A shares eight years after their purchase as described in the Fund’s prospectus. Class I shares are sold at net asset value and are not subject to a sales charge. Each class represents a pro-rata interest in the Fund, but votes separately on class-specific matters and (as noted below) is subject to different expenses. Realized and unrealized gains and losses and net investment income and losses, other than class-specific expenses, are allocated daily to each class of shares based on the relative net assets of each class to the total net assets of the Fund. Each class of shares differs in its distribution plan and certain other class-specific expenses.
The following is a summary of significant accounting policies of the Fund. The policies are in conformity with accounting principles generally accepted in the United States of America (U.S. GAAP). The Fund is an investment company and follows accounting and reporting guidance in the Financial Accounting Standards Board (FASB) Accounting Standards Codification Topic 946.
A Investment Valuation—The following methodologies are used to determine the market value or fair value of investments.
Equity Securities. Equity securities listed on a U.S. securities exchange generally are valued at the last sale or closing price on the day of valuation or, if no sales took place on such date, at the mean between the closing bid and ask prices on the exchange where such securities are principally traded. Equity securities listed on the NASDAQ National Market System are valued at the NASDAQ official closing price. Unlisted or listed securities for which closing sales prices or closing quotations are not available are valued at the mean between the latest available bid and ask prices or, in the case of preferred equity securities that are not listed or traded in the over-the-counter market, by a third party pricing service that uses various techniques that consider factors including, but not limited to, prices or yields of securities with similar characteristics, benchmark yields, broker/dealer quotes, quotes of underlying common stock, issuer spreads, as well as industry and economic events.
Debt Obligations. Debt obligations are generally valued on the basis of valuations provided by third party pricing services, as derived from such services’ pricing models. Inputs to the models may include, but are not limited to, reported trades, executable bid and ask prices, broker/dealer quotations, prices or yields of securities with similar characteristics, interest rates, anticipated prepayments, benchmark curves or information pertaining to the issuer, as well as industry and economic events. The pricing services may use a matrix approach, which considers information regarding securities with similar characteristics to determine the valuation for a security. Short-term debt obligations purchased with a remaining maturity of sixty days or less for which a valuation from a third party pricing service is not readily available may be valued at amortized cost, which approximates fair value.
Derivatives. Futures contracts are valued at the closing settlement price established by the board of trade or exchange on which they are traded, with adjustments for fair valuation for certain foreign futures contracts as described below.
Foreign Securities, Futures Contracts and Currencies. Foreign securities, futures contracts and currencies are valued in U.S. dollars, based on foreign currency exchange rate quotations supplied by a third party pricing service. The pricing service uses a proprietary model to determine the exchange rate. Inputs to the model include reported trades and implied bid/ask spreads. The daily valuation of exchange-traded foreign securities and certain exchange-traded foreign futures contracts generally is determined as of the close of trading on the principal exchange on which such securities and contracts trade. Events occurring after the close of trading on foreign exchanges may result in adjustments to the valuation of foreign securities and certain foreign futures contracts to more accurately reflect their fair value as of the close of regular trading on the New York Stock Exchange. When valuing foreign equity securities and foreign futures contracts that meet certain criteria, the Fund’s Trustees have approved the use of a fair value service that values such securities and foreign futures contracts to reflect market trading that occurs after the close of the applicable foreign markets of comparable securities or other instruments that have a strong correlation to the fair-valued securities and foreign futures contracts.
Other. Investments in management investment companies (including money market funds) that do not trade on an exchange are valued at the net asset value as of the close of each business day.
Fair Valuation. In connection with Rule 2a-5 of the 1940 Act, which became effective September 8, 2022, the Trustees have designated the Fund’s investment adviser as its valuation designee. Investments for which valuations or market quotations are not readily available or are deemed unreliable are valued by the investment adviser, as valuation designee, at fair value using methods that most fairly reflect the security’s “fair value”, which is the amount that the Fund might reasonably expect to receive for the security upon its current sale in the ordinary course. Each such determination is based on a consideration of relevant factors, which are likely to vary from one pricing context to another. These factors may include, but are not limited to, the type of security, the existence of any contractual restrictions on the security’s disposition, the price and extent of public trading in similar securities of the issuer or of comparable companies or entities, quotations or relevant information obtained from broker/dealers or other market participants, information obtained from the issuer, analysts, and/or the appropriate stock exchange (for exchange-traded securities), an analysis of the company’s or entity’s financial statements, and an evaluation of the forces that influence the issuer and the market(s) in which the security is purchased and sold.
B Investment Transactions—Investment transactions for financial statement purposes are accounted for on a trade date basis. Realized gains and losses on investments sold are determined on the basis of identified cost.
Eaton Vance
Tax-Managed Global Dividend Income Fund
October 31, 2022
Notes to Financial Statements — continued
C Income—Dividend income is recorded on the ex-dividend date for dividends received in cash and/or securities. However, if the ex-dividend date has passed, certain dividends from foreign securities are recorded as the Fund is informed of the ex-dividend date. Withholding taxes on foreign dividends and capital gains have been provided for in accordance with the Fund’s understanding of the applicable countries’ tax rules and rates. In consideration of recent decisions rendered by European courts, the Fund has filed additional tax reclaims for previously withheld taxes on dividends earned in certain European Union countries. These filings are subject to various administrative and judicial proceedings within these countries. During the year ended October 31, 2022, the Fund received approximately $9,315,000 from France for previously withheld foreign taxes and interest thereon. Such amount is included in other income on the Statement of Operations. No other amounts for additional tax reclaims are reflected in the financial statements due to the uncertainty as to the ultimate resolution of these proceedings, the likelihood of receipt of these reclaims, and the potential timing of payment. Interest income is recorded on the basis of interest accrued, adjusted for amortization of premium or accretion of discount. Distributions from investment companies are recorded as dividend income, capital gains or return of capital based on the nature of the distribution.
D Federal Taxes—The Fund's policy is to comply with the provisions of the Internal Revenue Code applicable to regulated investment companies and to distribute to shareholders each year substantially all of its net investment income, and all or substantially all of its net realized capital gains. Accordingly, no provision for federal income or excise tax is necessary.
As of October 31, 2022, the Fund had no uncertain tax positions that would require financial statement recognition, de-recognition, or disclosure. The Fund files a U.S. federal income tax return annually after its fiscal year-end, which is subject to examination by the Internal Revenue Service for a period of three years from the date of filing.
E Expenses—The majority of expenses of the Trust are directly identifiable to an individual fund. Expenses which are not readily identifiable to a specific fund are allocated taking into consideration, among other things, the nature and type of expense and the relative size of the funds.
F Foreign Currency Translation—Investment valuations, other assets, and liabilities initially expressed in foreign currencies are translated each business day into U.S. dollars based upon current exchange rates. Purchases and sales of foreign investment securities and income and expenses denominated in foreign currencies are translated into U.S. dollars based upon currency exchange rates in effect on the respective dates of such transactions. Recognized gains or losses on investment transactions attributable to changes in foreign currency exchange rates are recorded for financial statement purposes as net realized gains and losses on investments. That portion of unrealized gains and losses on investments that results from fluctuations in foreign currency exchange rates is not separately disclosed.
G Use of Estimates—The preparation of the financial statements in conformity with U.S. GAAP requires management to make estimates and assumptions that affect the reported amounts of assets and liabilities at the date of the financial statements and the reported amounts of income and expense during the reporting period. Actual results could differ from those estimates.
H Indemnifications—Under the Trust’s organizational documents, its officers and Trustees may be indemnified against certain liabilities and expenses arising out of the performance of their duties to the Fund. Under Massachusetts law, if certain conditions prevail, shareholders of a Massachusetts business trust (such as the Trust) could be deemed to have personal liability for the obligations of the Trust. However, the Trust’s Declaration of Trust contains an express disclaimer of liability on the part of Fund shareholders and the By-laws provide that the Trust shall assume, upon request by the shareholder, the defense on behalf of any Fund shareholders. Moreover, the By-laws also provide for indemnification out of Fund property of any shareholder held personally liable solely by reason of being or having been a shareholder for all loss or expense arising from such liability. Additionally, in the normal course of business, the Fund enters into agreements with service providers that may contain indemnification clauses. The Fund’s maximum exposure under these arrangements is unknown as this would involve future claims that may be made against the Fund that have not yet occurred.
I Futures Contracts—Upon entering into a futures contract, the Fund is required to deposit with the broker, either in cash or securities, an amount equal to a certain percentage of the contract amount (initial margin). Subsequent payments, known as variation margin, are made or received by the Fund each business day, depending on the daily fluctuations in the value of the underlying security or index and are recorded as unrealized gains or losses by the Fund. Gains (losses) are realized upon the expiration or closing of the futures contracts. Should market conditions change unexpectedly, the Fund may not achieve the anticipated benefits of the futures contracts and may realize a loss. Futures contracts have minimal counterparty risk as they are exchange traded and the clearinghouse for the exchange is substituted as the counterparty, guaranteeing counterparty performance.
2 Distributions to Shareholders and Income Tax Information
It is the present policy of the Fund to make monthly distributions of all or substantially all of its net investment income and to distribute annually all or substantially all of its net realized capital gains. Distributions to shareholders are recorded on the ex-dividend date. Distributions are declared separately for each class of shares. Shareholders may reinvest income and capital gain distributions in additional shares of the same class of the Fund at the net asset value as of the ex-dividend date or, at the election of the shareholder, receive distributions in cash. Distributions to shareholders are determined in accordance with income tax regulations, which may differ from U.S. GAAP. As required by U.S. GAAP, only distributions in excess of tax basis earnings and profits are reported in the financial statements as a return of capital. Permanent differences between book and tax accounting relating to distributions are reclassified to paid-in capital. For tax purposes, distributions from short-term capital gains are considered to be from ordinary income.
Eaton Vance
Tax-Managed Global Dividend Income Fund
October 31, 2022
Notes to Financial Statements — continued
The tax character of distributions declared for the years ended October 31, 2022 and October 31, 2021 was as follows:
| | Year Ended October 31, |
| | 2022 | 2021 |
| Ordinary income | $26,337,455 | $18,071,367 |
| Long-term capital gains | $27,156,647 | $ — |
During the year ended October 31, 2022, distributable earnings was decreased by $920,411 and paid-in capital was increased by $920,411 due to the Fund’s use of equalization accounting. Tax equalization accounting allows the Fund to treat as a distribution that portion of redemption proceeds representing a redeeming shareholder’s portion of undistributed taxable income and net capital gains. These reclassifications had no effect on the net assets or net asset value per share of the Fund.
As of October 31, 2022, the components of distributable earnings (accumulated loss) on a tax basis were as follows:
| Undistributed ordinary income | $ 7,864,063 |
| Deferred capital losses | (32,866,715) |
| Net unrealized appreciation | 100,540,413 |
| Other temporary differences | 14,423 |
| Distributable earnings | $ 75,552,184 |
At October 31, 2022, the Fund, for federal income tax purposes, had deferred capital losses of $32,866,715 which would reduce its taxable income arising from future net realized gains on investment transactions, if any, to the extent permitted by the Internal Revenue Code, and thus would reduce the amount of distributions to shareholders, which would otherwise be necessary to relieve the Fund of any liability for federal income or excise tax. The deferred capital losses are treated as arising on the first day of the Fund’s next taxable year and retain the same short-term or long-term character as when originally deferred. Of the deferred capital losses at October 31, 2022, $32,866,715 are short-term.
The cost and unrealized appreciation (depreciation) of investments of the Fund at October 31, 2022, as determined on a federal income tax basis, were as follows:
| Aggregate cost | $ 410,097,610 |
| Gross unrealized appreciation | $ 111,779,718 |
| Gross unrealized depreciation | (10,915,290) |
| Net unrealized appreciation | $ 100,864,428 |
3 Investment Adviser Fee and Other Transactions with Affiliates
The investment adviser fee is earned by Eaton Vance Management (EVM), an indirect, wholly-owned subsidiary of Morgan Stanley, as compensation for investment advisory services rendered to the Fund. The fee is computed at an annual rate as a percentage of average daily net assets as follows and is payable monthly:
| Average Daily Net Assets | Annual Fee Rate |
| Up to $500 million | 0.650% |
| $500 million but less than $1 billion | 0.625% |
| $1 billion but less than $2.5 billion | 0.600% |
| $2.5 billion and over | 0.575% |
For the year ended October 31, 2022, the Fund’s investment adviser fee amounted to $3,936,251 or 0.65% of the Fund’s average daily net assets.
Eaton Vance
Tax-Managed Global Dividend Income Fund
October 31, 2022
Notes to Financial Statements — continued
Pursuant to an investment sub-advisory agreement, EVM has delegated the investment management of the Fund to Eaton Vance Advisers International Ltd. (EVAIL), an affiliate of EVM and an indirect wholly-owned subsidiary of Morgan Stanley. EVM pays EVAIL a portion of its investment adviser fee for sub-advisory services provided to the Fund. Effective April 26, 2022, the Fund may invest in a money market fund, the Institutional Class of the Morgan Stanley Institutional Liquidity Funds - Government Portfolio (the "Liquidity Fund"), an open-end management investment company managed by Morgan Stanley Investment Management Inc., a wholly-owned subsidiary of Morgan Stanley. The investment adviser fee paid by the Fund is reduced by an amount equal to its pro-rata share of the advisory and administration fees paid by the Fund due to its investment in the Liquidity Fund. For the year ended October 31, 2022, the investment adviser fee paid was reduced by $4,204 relating to the Fund's investment in the Liquidity Fund. Prior to April 26, 2022, the Fund may have invested its cash in Eaton Vance Cash Reserves Fund, LLC (Cash Reserves Fund), an affiliated investment company managed by EVM. EVM did not receive a fee for advisory services provided to Cash Reserves Fund.
The administration fee is earned by EVM for administering the business affairs of the Fund and is computed at an annual rate of 0.15% of the Fund’s average daily net assets. For the year ended October 31, 2022, the administration fee amounted to $914,724.
EVM provides sub-transfer agency and related services to the Fund pursuant to a Sub-Transfer Agency Support Services Agreement. For the year ended October 31, 2022, EVM earned $38,458 from the Fund pursuant to such agreement, which is included in transfer and dividend disbursing agent fees on the Statement of Operations. The Fund was informed that Eaton Vance Distributors, Inc. (EVD), an affiliate of EVM and the Fund’s principal underwriter, received $15,940 as its portion of the sales charge on sales of Class A shares for the year ended October 31, 2022. EVD also received distribution and service fees from Class A and Class C shares (see Note 4) and contingent deferred sales charges (see Note 5).
Trustees and officers of the Fund who are members of EVM’s organization receive remuneration for their services to the Fund out of the investment adviser fee. Trustees of the Fund who are not affiliated with EVM may elect to defer receipt of all or a percentage of their annual fees in accordance with the terms of the Trustees Deferred Compensation Plan. For the year ended October 31, 2022, no significant amounts have been deferred. Certain officers and Trustees of the Fund are officers of EVM.
4 Distribution Plan
The Fund has in effect a distribution plan for Class A shares (Class A Plan) pursuant to Rule 12b-1 under the 1940 Act. Pursuant to the Class A Plan, the Fund pays EVD a distribution and service fee of 0.25% per annum of its average daily net assets attributable to Class A shares for distribution services and facilities provided to the Fund by EVD, as well as for personal services and/or the maintenance of shareholder accounts. Distribution and service fees paid or accrued to EVD for the year ended October 31, 2022 amounted to $1,050,129 for Class A shares.
The Fund also has in effect a distribution plan for Class C shares (Class C Plan) pursuant to Rule 12b-1 under the 1940 Act. Pursuant to the Class C Plan, the Fund pays EVD amounts equal to 0.75% per annum of its average daily net assets attributable to Class C shares for providing ongoing distribution services and facilities to the Fund. For the year ended October 31, 2022, the Fund paid or accrued to EVD $190,407 for Class C shares.
Pursuant to the Class C Plan, the Fund also makes payments of service fees to EVD, financial intermediaries and other persons in amounts equal to 0.25% per annum of its average daily net assets attributable to that class. Service fees paid or accrued are for personal services and/or the maintenance of shareholder accounts. They are separate and distinct from the sales commissions and distribution fees payable to EVD. Service fees paid or accrued for the year ended October 31, 2022 amounted to $63,469 for Class C shares.
Distribution and service fees are subject to the limitations contained in the Financial Industry Regulatory Authority Rule 2341(d).
5 Contingent Deferred Sales Charges
A contingent deferred sales charge (CDSC) of 1% generally is imposed on redemptions of Class C shares made within 12 months of purchase. Class A shares may be subject to a 1% CDSC if redeemed within 12 months (18 months prior to April 29, 2022) of purchase (depending on the circumstances of purchase). Generally, the CDSC is based upon the lower of the net asset value at date of redemption or date of purchase. No charge is levied on shares acquired by reinvestment of dividends or capital gain distributions. For the year ended October 31, 2022, the Fund was informed that EVD received approximately $1,000 and $2,000 of CDSCs paid by Class A and Class C shareholders, respectively.
6 Purchases and Sales of Investments
Purchases and sales of investments, other than short-term obligations, aggregated $594,829,118 and $634,189,701, respectively, for the year ended October 31, 2022.
Eaton Vance
Tax-Managed Global Dividend Income Fund
October 31, 2022
Notes to Financial Statements — continued
7 Shares of Beneficial Interest
The Fund’s Declaration of Trust permits the Trustees to issue an unlimited number of full and fractional shares of beneficial interest (without par value). Such shares may be issued in a number of different series (such as the Fund) and classes. Transactions in Fund shares, including direct exchanges pursuant to share class conversions for all periods presented, were as follows:
| | Year Ended
October 31, 2022 | | Year Ended
October 31, 2021 |
| | Shares | Amount | | Shares | Amount |
| Class A | | | | | |
| Sales | 837,928 | $ 12,746,332 | | 2,234,565 | $ 34,306,855 |
| Issued to shareholders electing to receive payments of distributions in Fund shares | 1,988,103 | 31,128,867 | | 647,031 | 10,360,944 |
| Redemptions | (3,492,728) | (52,130,019) | | (3,002,896) | (47,857,179) |
| Net decrease | (666,697) | $ (8,254,820) | | (121,300) | $ (3,189,380) |
| Class C | | | | | |
| Sales | 151,545 | $ 2,260,680 | | 140,253 | $ 2,271,288 |
| Issued to shareholders electing to receive payments of distributions in Fund shares | 123,746 | 1,950,604 | | 40,723 | 643,002 |
| Redemptions | (551,290) | (8,240,661) | | (1,757,510) | (26,394,745) |
| Net decrease | (275,999) | $ (4,029,377) | | (1,576,534) | $(23,480,455) |
| Class I | | | | | |
| Sales | 1,203,000 | $ 18,090,072 | | 1,057,748 | $ 17,031,239 |
| Issued to shareholders electing to receive payments of distributions in Fund shares | 924,788 | 14,449,527 | | 306,479 | 4,916,542 |
| Redemptions | (1,937,346) | (28,337,564) | | (2,614,560) | (40,809,711) |
| Net increase (decrease) | 190,442 | $ 4,202,035 | | (1,250,333) | $(18,861,930) |
8 Financial Instruments
The Fund may trade in financial instruments with off-balance sheet risk in the normal course of its investing activities. These financial instruments may include futures contracts and may involve, to a varying degree, elements of risk in excess of the amounts recognized for financial statement purposes. The notional or contractual amounts of these instruments represent the investment the Fund has in particular classes of financial instruments and do not necessarily represent the amounts potentially subject to risk. The measurement of the risks associated with these instruments is meaningful only when all related and offsetting transactions are considered. At October 31, 2022, there were no obligations outstanding under these financial instruments.
The Fund is subject to equity price risk in the normal course of pursuing its investment objective. During the year ended October 31, 2022, the Fund entered into equity futures contracts on securities indices to gain or limit exposure to certain markets, particularly in connection with engaging in the dividend capture trading strategy.
The effect of derivative instruments (not considered to be hedging instruments for accounting disclosure purposes) on the Statement of Operations and whose primary underlying risk exposure is equity price risk for the year ended October 31, 2022 was as follows:
| Derivative | Realized Gain (Loss)
on Derivatives Recognized
in Income(1) | Change in Unrealized
Appreciation (Depreciation) on
Derivatives Recognized in Income |
| Futures contracts | $(4,620,285) | $ — |
| (1) | Statement of Operations location: Net realized gain (loss) - Futures contracts. |
Eaton Vance
Tax-Managed Global Dividend Income Fund
October 31, 2022
Notes to Financial Statements — continued
The average notional cost of futures contracts outstanding during the year ended October 31, 2022, which is indicative of the volume of this derivative type, was approximately as follows:
Futures
Contracts — Long | Futures
Contracts — Short |
| $31,015,000 | $30,670,000 |
9 Line of Credit
The Fund participates with other portfolios and funds managed by EVM and its affiliates in a $725 million unsecured line of credit agreement with a group of banks, which is in effect through October 24, 2023. In connection with the renewal of the agreement on October 25, 2022, the borrowing limit was decreased from $800 million. Borrowings are made by the Fund solely for temporary purposes related to redemptions and other short-term cash needs. Interest is charged to the Fund based on its borrowings at an amount above either the Secured Overnight Financing Rate (SOFR) or Federal Funds rate. In addition, a fee computed at an annual rate of 0.15% on the daily unused portion of the line of credit is allocated among the participating portfolios and funds at the end of each quarter. Also in connection with the renewal of the agreement, an arrangement fee totaling $150,000 was incurred that was allocated to the participating portfolios and funds. Because the line of credit is not available exclusively to the Fund, it may be unable to borrow some or all of its requested amounts at any particular time. The Fund did not have any significant borrowings or allocated fees during the year ended October 31, 2022.
10 Investments in Affiliated Issuers and Funds
The Fund invested in issuers that may be deemed to be affiliated with Morgan Stanley. At October 31, 2022, the value of the Fund's investment in affiliated issuers and funds was $5,023,564, which represents 1.0% of the Fund's net assets. Transactions in affiliated issuers and funds by the Fund for the year ended October 31, 2022 were as follows:
| Name | Value,
beginning
of period | Purchases | Sales
proceeds | Net
realized
gain (loss) | Change in
unrealized
appreciation
(depreciation) | Value, end
of period | Dividend
income | Units/Shares,
end of period |
| Common Stocks |
| Mitsubishi UFJ Financial Group, Inc. | $5,427,003 | $ — | $ (5,857,757) | $ 1,164,249 | $ (733,495) | $ — | $ — | — |
| Short-Term Investments |
| Cash Reserves Fund | 4,612,971 | 36,412,067 | (41,024,943) | (95) | — | — | 481 | — |
| Liquidity Fund | — | 115,192,424 | (110,168,860) | — | — | 5,023,564 | 56,967 | 5,023,564 |
| Total | | | | $1,164,154 | $(733,495) | $5,023,564 | $57,448 | |
11 Fair Value Measurements
Under generally accepted accounting principles for fair value measurements, a three-tier hierarchy to prioritize the assumptions, referred to as inputs, is used in valuation techniques to measure fair value. The three-tier hierarchy of inputs is summarized in the three broad levels listed below.
| • | Level 1 – quoted prices in active markets for identical investments |
| • | Level 2 – other significant observable inputs (including quoted prices for similar investments, interest rates, prepayment speeds, credit risk, etc.) |
| • | Level 3 – significant unobservable inputs (including a fund's own assumptions in determining the fair value of investments) |
In cases where the inputs used to measure fair value fall in different levels of the fair value hierarchy, the level disclosed is determined based on the lowest level input that is significant to the fair value measurement in its entirety. The inputs or methodology used for valuing securities are not necessarily an indication of the risk associated with investing in those securities.
Eaton Vance
Tax-Managed Global Dividend Income Fund
October 31, 2022
Notes to Financial Statements — continued
At October 31, 2022, the hierarchy of inputs used in valuing the Fund's investments, which are carried at value, were as follows:
| Asset Description | Level 1 | Level 2 | Level 3 | Total |
| Common Stocks: | | | | |
| Communication Services | $ 28,902,261 | $ 1,155,450 | $ — | $ 30,057,711 |
| Consumer Discretionary | 27,937,266 | 27,290,747 | — | 55,228,013 |
| Consumer Staples | 20,908,271 | 20,985,488 | — | 41,893,759 |
| Energy | 22,568,174 | — | — | 22,568,174 |
| Financials | 43,006,579 | 22,334,223 | — | 65,340,802 |
| Health Care | 44,716,733 | 39,523,344 | — | 84,240,077 |
| Industrials | 22,946,837 | 32,708,590 | — | 55,655,427 |
| Information Technology | 91,267,325 | 25,641,449 | — | 116,908,774 |
| Materials | 14,270 | 7,624,911 | — | 7,639,181 |
| Real Estate | 5,768,428 | — | — | 5,768,428 |
| Utilities | 7,167,885 | 6,116,228 | — | 13,284,113 |
| Total Common Stocks | $315,204,029 | $183,380,430* | $ — | $498,584,459 |
| Corporate Bonds | $ — | $ 6,083,170 | $ — | $ 6,083,170 |
| Exchange-Traded Funds | 787,616 | — | — | 787,616 |
| Preferred Stocks: | | | | |
| Energy | 316,375 | — | — | 316,375 |
| Financials | 166,854 | — | — | 166,854 |
| Total Preferred Stocks | $ 483,229 | $ — | $ — | $ 483,229 |
| Short-Term Investments | $ 5,023,564 | $ — | $ — | $ 5,023,564 |
| Total Investments | $321,498,438 | $189,463,600 | $ — | $510,962,038 |
| * | Includes foreign equity securities whose values were adjusted to reflect market trading of comparable securities or other correlated instruments that occurred after the close of trading in their applicable foreign markets. |
Eaton Vance
Tax-Managed Global Dividend Income Fund
October 31, 2022
Notes to Financial Statements — continued
12 Risks and Uncertainties
Risks Associated with Foreign Investments
Foreign investments can be adversely affected by political, economic and market developments abroad, including the imposition of economic and other sanctions by the United States or another country. There may be less publicly available information about foreign issuers because they may not be subject to reporting practices, requirements or regulations comparable to those to which United States companies are subject. Foreign markets may be smaller, less liquid and more volatile than the major markets in the United States. Trading in foreign markets typically involves higher expense than trading in the United States. The Fund may have difficulties enforcing its legal or contractual rights in a foreign country. Securities that trade or are denominated in currencies other than the U.S. dollar may be adversely affected by fluctuations in currency exchange rates.
Pandemic Risk
An outbreak of respiratory disease caused by a novel coronavirus was first detected in China in late 2019 and subsequently spread internationally. This coronavirus has resulted in closing borders, enhanced health screenings, changes to healthcare service preparation and delivery, quarantines, cancellations, disruptions to supply chains and customer activity, as well as general concern and uncertainty. Health crises caused by outbreaks of disease, such as the coronavirus outbreak, may exacerbate other pre-existing political, social and economic risks and disrupt normal market conditions and operations. The impact of this outbreak has negatively affected the worldwide economy, as well as the economies of individual countries and industries, and could continue to affect the market in significant and unforeseen ways. Other epidemics and pandemics that may arise in the future may have similar effects. Any such impact could adversely affect the Fund's performance, or the performance of the securities in which the Fund invests.
Eaton Vance
Tax-Managed Global Dividend Income Fund
October 31, 2022
Report of Independent Registered Public Accounting Firm
To the Trustees of Eaton Vance Mutual Funds Trust and Shareholders of Eaton Vance Tax-Managed Global Dividend Income Fund:
Opinion on the Financial Statements and Financial Highlights
We have audited the accompanying statement of assets and liabilities of Eaton Vance Tax-Managed Global Dividend Income Fund (the “Fund") (one of the funds constituting Eaton Vance Mutual Funds Trust), including the portfolio of investments, as of October 31, 2022, the related statement of operations for the year then ended, the statements of changes in net assets for each of the two years in the period then ended, the financial highlights for each of the five years in the period then ended, and the related notes. In our opinion, the financial statements and financial highlights present fairly, in all material respects, the financial position of the Fund as of October 31, 2022, and the results of its operations for the year then ended, the changes in its net assets for each of the two years in the period then ended, and the financial highlights for each of the five years in the period then ended, in conformity with accounting principles generally accepted in the United States of America.
Basis for Opinion
These financial statements and financial highlights are the responsibility of the Fund's management. Our responsibility is to express an opinion on the Fund's financial statements and financial highlights based on our audits. We are a public accounting firm registered with the Public Company Accounting Oversight Board (United States) (PCAOB) and are required to be independent with respect to the Fund in accordance with the U.S. federal securities laws and the applicable rules and regulations of the Securities and Exchange Commission and the PCAOB.
We conducted our audits in accordance with the standards of the PCAOB. Those standards require that we plan and perform the audit to obtain reasonable assurance about whether the financial statements and financial highlights are free of material misstatement, whether due to error or fraud. The Fund is not required to have, nor were we engaged to perform, an audit of its internal control over financial reporting. As part of our audits, we are required to obtain an understanding of internal control over financial reporting but not for the purpose of expressing an opinion on the effectiveness of the Fund’s internal control over financial reporting. Accordingly, we express no such opinion.
Our audits included performing procedures to assess the risks of material misstatement of the financial statements and financial highlights, whether due to error or fraud, and performing procedures that respond to those risks. Such procedures included examining, on a test basis, evidence regarding the amounts and disclosures in the financial statements and financial highlights. Our audits also included evaluating the accounting principles used and significant estimates made by management, as well as evaluating the overall presentation of the financial statements and financial highlights. Our procedures included confirmation of securities owned as of October 31, 2022, by correspondence with the custodian and brokers; when replies were not received from brokers, we performed other auditing procedures. We believe that our audits provide a reasonable basis for our opinion.
/s/ Deloitte & Touche LLP
Boston, Massachusetts
December 22, 2022
We have served as the auditor of one or more Eaton Vance investment companies since 1959.
Eaton Vance
Tax-Managed Global Dividend Income Fund
October 31, 2022
Federal Tax Information (Unaudited)
The Form 1099-DIV you receive in February 2023 will show the tax status of all distributions paid to your account in calendar year 2022. Shareholders are advised to consult their own tax adviser with respect to the tax consequences of their investment in the Fund. As required by the Internal Revenue Code and/or regulations, shareholders must be notified regarding the status of qualified dividend income for individuals, the dividends received deduction for corporations and 163(j) interest dividends.
Qualified Dividend Income. For the fiscal year ended October 31, 2022, the Fund designates approximately $30,631,498, or up to the maximum amount of such dividends allowable pursuant to the Internal Revenue Code, as qualified dividend income eligible for the reduced tax rate of 15%.
Dividends Received Deduction. Corporate shareholders are generally entitled to take the dividends received deduction on the portion of the Fund’s dividend distribution that qualifies under tax law. For the Fund’s fiscal 2022 ordinary income dividends, 15.09% qualifies for the corporate dividends received deduction.
163(j) Interest Dividends. For the fiscal year ended October 31, 2022, the Fund designates 0.69% of distributions from net investment income as a 163(j) interest dividend.
Eaton Vance
Tax-Managed Global Dividend Income Fund
October 31, 2022
Board of Trustees’ Contract Approval
Overview of the Contract Review Process
The Investment Company Act of 1940, as amended (the “1940 Act”), provides, in substance, that the investment advisory agreement between a fund and its investment adviser will continue in effect from year-to-year only if its continuation is approved on an annual basis by a vote of the fund’s board of trustees, including a majority of the trustees who are not “interested persons” of the fund (“independent trustees”), cast in person at a meeting called for the purpose of considering such approval.
At a meeting held on June 8, 2022, the Boards of Trustees/Directors (collectively, the “Board”) that oversee the registered investment companies advised by Eaton Vance Management or its affiliate, Boston Management and Research (the “Eaton Vance Funds”), including a majority of the independent trustees (the “Independent Trustees”), voted to approve the continuation of existing investment advisory agreements and sub-advisory agreements1 for each of the Eaton Vance Funds for an additional one-year period. The Board relied upon the affirmative recommendation of its Contract Review Committee, which is a committee exclusively comprised of Independent Trustees. Prior to making its recommendation, the Contract Review Committee reviewed information furnished by the adviser and sub-adviser to each of the Eaton Vance Funds (including information specifically requested by the Board) for a series of formal meetings held between April and June 2022. Members of the Contract Review Committee also considered information received at prior meetings of the Board and its committees, to the extent such information was relevant to the Contract Review Committee’s annual evaluation of the investment advisory agreements and sub-advisory agreements.
In connection with its evaluation of the investment advisory agreements and sub-advisory agreements, the Board considered various information relating to the Eaton Vance Funds. This included information applicable to all or groups of Eaton Vance Funds, which is referenced immediately below, and information applicable to the particular Eaton Vance Fund covered by this report (additional fund-specific information is referenced below under “Results of the Contract Review Process”). (For funds that invest through one or more underlying portfolios, references to “each fund” in this section may include information that was considered at the portfolio-level.)
Information about Fees, Performance and Expenses
• A report from an independent data provider comparing advisory and other fees paid by each fund to such fees paid by comparable funds, as identified by the independent data provider (“comparable funds”);
• A report from an independent data provider comparing each fund’s total expense ratio (and its components) to those of comparable funds;
• A report from an independent data provider comparing the investment performance of each fund (including, as relevant, total return data, income data, Sharpe ratios and information ratios) to the investment performance of comparable funds and, as applicable, benchmark indices, over various time periods;
• In certain instances, data regarding investment performance relative to customized groups of peer funds and blended indices identified by the adviser in consultation with the Portfolio Management Committee of the Board (a committee exclusively comprised of Independent Trustees);
• Comparative information concerning the fees charged and services provided by the adviser and sub-adviser to each fund in managing other accounts (which may include other mutual funds, collective investment funds and institutional accounts) using investment strategies and techniques similar to those used in managing such fund(s), if any;
• Profitability analyses with respect to the adviser and sub-adviser to each of the funds;
Information about Portfolio Management and Trading
• Descriptions of the investment management services provided to each fund, as well as each of the funds’ investment strategies and policies;
• The procedures and processes used to determine the value of fund assets, including, when necessary, the determination of “fair value” and actions taken to monitor and test the effectiveness of such procedures and processes;
• Information about the policies and practices of each fund’s adviser and sub-adviser with respect to trading, including their processes for seeking best execution of portfolio transactions;
• Information about the allocation of brokerage transactions and the benefits, if any, received by the adviser and sub-adviser to each fund as a result of brokerage allocation, including, as applicable, information concerning the acquisition of research through client commission arrangements and policies with respect to “soft dollars”;
• Data relating to the portfolio turnover rate of each fund and related information regarding active management in the context of particular strategies;
Information about each Adviser and Sub-adviser
• Reports detailing the financial results and condition of the adviser and sub-adviser to each fund;
• Information regarding the individual investment professionals whose responsibilities include portfolio management and investment research for the funds, and, for portfolio managers and certain other investment professionals, information relating to their responsibilities with respect to managing other mutual funds and investment accounts, as applicable;
1 Not all Eaton Vance Funds have entered into a sub-advisory agreement with a sub-adviser. Accordingly, references to “sub-adviser” or “sub-advisory agreement” in this “Overview” section may not be applicable to the particular Eaton Vance Fund covered by this report. Following the “Overview” section, further information regarding the Board’s evaluation of a fund’s contractual arrangements is included under the “Results of the Contract Review Process” section.
Eaton Vance
Tax-Managed Global Dividend Income Fund
October 31, 2022
Board of Trustees’ Contract Approval — continued
• Information regarding the adviser’s and its parent company’s (Morgan Stanley’s) efforts to retain and attract talented investment professionals, including in the context of a particularly competitive marketplace for talent, as well as the ongoing unique environment presented by hybrid, remote and other alternative work arrangements;
• The Code of Ethics of the adviser and its affiliates and the sub-adviser of each fund, together with information relating to compliance with, and the administration of, such codes;
• Policies and procedures relating to proxy voting, including regular reporting with respect to fund proxy voting activities;
• Information regarding the handling of corporate actions and class actions, as well as information regarding litigation and other regulatory matters;
• Information concerning the resources devoted to compliance efforts undertaken by the adviser and its affiliates and the sub-adviser of each fund, if any, including descriptions of their various compliance programs and their record of compliance;
• Information concerning the business continuity and disaster recovery plans of the adviser and its affiliates and the sub-adviser of each fund, if any;
• A description of Eaton Vance Management’s and Boston Management and Research’s oversight of sub-advisers, including with respect to regulatory and compliance issues, investment management and other matters;
Other Relevant Information
• Information regarding ongoing initiatives to further integrate and harmonize, where applicable, the investment management and other departments of the adviser and its affiliates with the overall investment management infrastructure of Morgan Stanley, in light of Morgan Stanley’s acquisition of Eaton Vance on March 1, 2021;
• Information concerning the nature, cost and character of the administrative and other non-investment advisory services provided by Eaton Vance Management and its affiliates;
• Information concerning oversight of the relationship with the custodian, subcustodians, fund accountants, and other third-party service providers by the adviser and/or administrator to each of the funds;
• Information concerning efforts to implement policies and procedures with respect to various new regulations applicable to the funds, including Rule 12d1-4 (the Fund-of-Funds Rule), Rule 18f-4 (the Derivatives Rule) and Rule 2a-5 (the Fair Valuation Rule);
• For an Eaton Vance Fund structured as an exchange-listed closed-end fund, information concerning the benefits of the closed-end fund structure, as well as, where relevant, the closed-end fund’s market prices (including as compared to the closed-end fund’s net asset value (NAV)), trading volume data, continued use of auction preferred shares (where applicable), distribution rates and other relevant matters;
• The risks which the adviser and/or its affiliates incur in connection with the management and operation of the funds, including, among others, litigation, regulatory, entrepreneurial, and other business risks (and the associated costs of such risks); and
• The terms of each investment advisory agreement and sub-advisory agreement.
During the various meetings of the Board and its committees over the course of the year leading up to the June 8, 2022 meeting, the Trustees received information from portfolio managers and other investment professionals of the advisers and sub-advisers of the funds regarding investment and performance matters, and considered various investment and trading strategies used in pursuing the funds’ investment objectives. The Trustees also received information regarding risk management techniques employed in connection with the management of the funds. The Board and its committees evaluated issues pertaining to industry and regulatory developments, compliance procedures, fund governance and other issues with respect to the funds, and received and participated in reports and presentations provided by Eaton Vance Management, Boston Management and Research and fund sub-advisers, with respect to such matters. In addition to the formal meetings of the Board and its committees, the Independent Trustees held regular teleconferences to discuss, among other topics, matters relating to the continuation of investment advisory agreements and sub-advisory agreements.
The Contract Review Committee was advised throughout the contract review process by Goodwin Procter LLP, independent legal counsel for the Independent Trustees. The members of the Contract Review Committee, with the advice of such counsel, exercised their own business judgment in determining the material factors to be considered in evaluating each investment advisory agreement and sub-advisory agreement and the weight to be given to each such factor. The conclusions reached with respect to each investment advisory agreement and sub-advisory agreement were based on a comprehensive evaluation of all the information provided and not any single factor. Moreover, each member of the Contract Review Committee may have placed varying emphasis on particular factors in reaching conclusions with respect to each investment advisory agreement and sub-advisory agreement. In evaluating each investment advisory agreement and sub-advisory agreement, including the fee structures and other terms contained in such agreements, the members of the Contract Review Committee were also informed by multiple years of analysis and discussion with the adviser and sub-adviser to each of the Eaton Vance Funds.
Results of the Contract Review Process
Based on its consideration of the foregoing, and such other information it deemed relevant, including the factors and conclusions described below, the Contract Review Committee concluded that the continuation of the investment advisory agreement between Eaton Vance Tax-Managed Global Dividend Income Fund (the “Fund”) and Eaton Vance Management (the “Adviser”), and the sub-advisory agreement between the Adviser and Eaton Vance Advisers International Ltd. (the “Sub-adviser”), an affiliate of the Adviser, with respect to the Fund, including their respective fee structures, are in the interests of shareholders and, therefore, recommended to the Board approval of each agreement. Based on the recommendation of the Contract Review Committee, the Board, including a majority of the Independent Trustees, voted to approve continuation of the investment advisory agreement and the sub-advisory agreement for the Fund.
Eaton Vance
Tax-Managed Global Dividend Income Fund
October 31, 2022
Board of Trustees’ Contract Approval — continued
Nature, Extent and Quality of Services
In considering whether to approve the investment advisory agreement and the sub-advisory agreement for the Fund, the Board evaluated the nature, extent and quality of services provided to the Fund by the Adviser and the Sub-adviser.
The Board considered the Adviser’s and the Sub-adviser’s management capabilities and investment processes in light of the types of investments held by the Fund, including the education, experience and number of investment professionals and other personnel who provide portfolio management, investment research, and similar services to the Fund, including recent changes to such personnel. Regarding the Adviser, the Board considered the Adviser’s responsibilities with respect to oversight of the Sub-adviser and coordinating activities in implementing the investment strategies of the Fund. The Board also considered the Adviser’s in-house equity research capabilities and experience in managing funds that seek to maximize after-tax returns. With respect to the Sub-adviser, the Board considered the abilities and experience of the Sub-adviser’s investment professionals in investing in equity securities, including investing in both U.S. and foreign common stocks. In particular, the Board considered the abilities and experience of the Adviser’s and the Sub-adviser’s investment professionals in analyzing factors such as special considerations relevant to investing in dividend-paying common and preferred stocks and foreign markets. The Board considered the international investment capabilities of the Sub-adviser, which is based in London, and the benefits to the Fund of having portfolio management services involving investments in international equities provided by investment professionals located abroad. The Board also took into account the resources dedicated to portfolio management and other services, the compensation methods of the Adviser and other factors, including the reputation and resources of the Adviser to recruit and retain highly qualified research, advisory and supervisory investment professionals. In addition, the Board considered the time and attention devoted to the Eaton Vance Funds, including the Fund, by senior management, as well as the infrastructure, operational capabilities and support staff in place to assist in the portfolio management and operations of the Fund, including the provision of administrative services. The Board also considered the business-related and other risks to which the Adviser or its affiliates may be subject in managing the Fund.
The Board considered the compliance programs of the Adviser and relevant affiliates thereof, including the Sub-adviser. The Board considered compliance and reporting matters regarding, among other things, personal trading by investment professionals, disclosure of portfolio holdings, late trading, frequent trading, portfolio valuation, business continuity and the allocation of investment opportunities. The Board also considered the responses of the Adviser and its affiliates to requests in recent years from regulatory authorities, such as the Securities and Exchange Commission and the Financial Industry Regulatory Authority.
The Board considered other administrative services provided or overseen by Eaton Vance Management and its affiliates, including transfer agency and accounting services. The Board evaluated the benefits to shareholders of investing in a fund that is a part of a large fund complex offering exposure to a variety of asset classes and investment disciplines, as well as the ability, in many cases, to exchange an investment among different funds without incurring additional sales charges.
After consideration of the foregoing factors, among others, the Board concluded that the nature, extent and quality of services provided by the Adviser and the Sub-adviser, taken as a whole, are appropriate and consistent with the terms of the investment advisory agreement and the sub-advisory agreement.
Fund Performance
The Board compared the Fund’s investment performance to that of comparable funds identified by an independent data provider (the peer group), as well as an appropriate benchmark index. The Board’s review included comparative performance data with respect to the Fund for the one-, three-, five- and ten-year periods ended December 31, 2021. In this regard, the Board noted that the performance of the Fund was higher than the median performance of the Fund’s peer group for the three-year period. The Board also noted that the performance of the Fund was lower than its benchmark index for the three-year period. The Board concluded that the performance of the Fund was satisfactory.
Management Fees and Expenses
The Board considered contractual fee rates payable by the Fund for advisory and administrative services (referred to collectively as “management fees”). As part of its review, the Board considered the Fund’s management fees and total expense ratio for the one-year period ended December 31, 2021, as compared to those of comparable funds, before and after giving effect to any undertaking to waive fees or reimburse expenses. The Board also considered certain factors identified by management in response to inquiries from the Contract Review Committee regarding the Fund’s total expense ratio relative to comparable funds.
After considering the foregoing information, and in light of the nature, extent and quality of the services provided by the Adviser and the Sub-adviser, the Board concluded that the management fees charged for advisory and related services are reasonable.
Profitability and “Fall-Out” Benefits
The Board considered the level of profits realized by the Adviser and relevant affiliates thereof, including the Sub-adviser, in providing investment advisory and administrative services to the Fund and to all Eaton Vance Funds as a group. The Board considered the level of profits realized without regard to marketing support or other payments by the Adviser and its affiliates to third parties in respect of distribution or other services.
Eaton Vance
Tax-Managed Global Dividend Income Fund
October 31, 2022
Board of Trustees’ Contract Approval — continued
The Board concluded that, in light of the foregoing factors and the nature, extent and quality of the services rendered, the profits realized by the Adviser and its affiliates, including the Sub-adviser, are deemed not to be excessive.
The Board also considered direct or indirect fall-out benefits received by the Adviser and its affiliates, including the Sub-adviser, in connection with their respective relationships with the Fund, including the benefits of research services that may be available to the Adviser or the Sub-adviser as a result of securities transactions effected for the Fund and other investment advisory clients.
Economies of Scale
In reviewing management fees and profitability, the Board also considered the extent to which the Adviser and its affiliates, on the one hand, and the Fund, on the other hand, can expect to realize benefits from economies of scale as the assets of the Fund increase. The Board acknowledged the difficulty in accurately measuring the benefits resulting from economies of scale, if any, with respect to the management of any specific fund or group of funds. The Board reviewed data summarizing the increases and decreases in the assets of the Fund and of all Eaton Vance Funds as a group over various time periods, and evaluated the extent to which the total expense ratio of the Fund and the profitability of the Adviser and its affiliates may have been affected by such increases or decreases. Based upon the foregoing, the Board concluded that the Fund currently shares in the benefits from economies of scale, if any, when they are realized by the Adviser. The Board also concluded that the structure of the advisory fee, which includes breakpoints at several asset levels, will allow the Fund to continue to benefit from any economies of scale in the future.
Eaton Vance
Tax-Managed Global Dividend Income Fund
October 31, 2022
Liquidity Risk Management Program
The Fund has implemented a written liquidity risk management program (Program) and related procedures to manage its liquidity in accordance with Rule 22e-4 under the Investment Company Act of 1940, as amended (Liquidity Rule). The Liquidity Rule defines “liquidity risk” as the risk that a fund could not meet requests to redeem shares issued by the fund without significant dilution of the remaining investors’ interests in the fund. The Fund’s Board of Trustees/Directors has designated the investment adviser to serve as the administrator of the Program and the related procedures. The administrator has established a Liquidity Risk Management Oversight Committee (Committee) to perform the functions necessary to administer the Program. As part of the Program, the administrator is responsible for identifying illiquid investments and categorizing the relative liquidity of the Fund’s investments in accordance with the Liquidity Rule. Under the Program, the administrator assesses, manages, and periodically reviews the Fund’s liquidity risk, and is responsible for making certain reports to the Fund’s Board of Trustees/Directors and the Securities and Exchange Commission (SEC) regarding the liquidity of the Fund’s investments, and to notify the Board of Trustees/Directors and the SEC of certain liquidity events specified in the Liquidity Rule. The liquidity of the Fund’s portfolio investments is determined based on a number of factors including, but not limited to, relevant market, trading and investment-specific considerations under the Program.
At a meeting of the Fund’s Board of Trustees/Directors on June 7, 2022, the Committee provided a written report to the Fund’s Board of Trustees/Directors pertaining to the operation, adequacy, and effectiveness of implementation of the Program, as well as the operation of the highly liquid investment minimum (if applicable) for the period January 1, 2021 through December 31, 2021 (Review Period). The Program operated effectively during the Review Period, supporting the administrator’s ability to assess, manage and monitor Fund liquidity risk, including during periods of market volatility and net redemptions. During the Review Period, the Fund met redemption requests on a timely basis.
There can be no assurance that the Program will achieve its objectives in the future. Please refer to the Fund’s prospectus for more information regarding the Fund’s exposure to liquidity risk and other principal risks to which an investment in the Fund may be subject.
Eaton Vance
Tax-Managed Global Dividend Income Fund
October 31, 2022
Management and Organization
Fund Management. The Trustees of Eaton Vance Mutual Funds Trust (the Trust) are responsible for the overall management and supervision of the Trust's affairs. The Board members and officers of the Trust are listed below. Except as indicated, each individual has held the office shown or other offices in the same company for the last five years. Board members hold indefinite terms of office. Each Trustee holds office until his or her successor is elected and qualified, subject to a prior death, resignation, retirement, disqualification or removal. Under the terms of the Fund’s current Trustee retirement policy, an Independent Trustee must retire and resign as a Trustee on the earlier of: (i) the first day of July following his or her 74th birthday; or (ii), with limited exception, December 31st of the 20th year in which he or she has served as a Trustee. However, if such retirement and resignation would cause the Fund to be out of compliance with Section 16 of the 1940 Act or any other regulations or guidance of the SEC, then such retirement and resignation will not become effective until such time as action has been taken for the Fund to be in compliance therewith. The “noninterested Trustees” consist of those Trustees who are not “interested persons” of the Trust, as that term is defined under the 1940 Act. The business address of each Board member and officer is Two International Place, Boston, Massachusetts 02110. As used below, “BMR” refers to Boston Management and Research, “EVC” refers to Eaton Vance Corp., “EV” refers to EV LLC, “EVM” refers to Eaton Vance Management and “EVD” refers to Eaton Vance Distributors, Inc. EV is the trustee of each of EVM and BMR. Effective March 1, 2021, each of EVM, BMR, EVD and EV are indirect, wholly owned subsidiaries of Morgan Stanley. Each officer affiliated with EVM may hold a position with other EVM affiliates that is comparable to his or her position with EVM listed below. Each Trustee oversees 135 funds (with the exception of Mr. Bowser who oversees 110 funds) in the Eaton Vance fund complex (including both funds and portfolios in a hub and spoke structure).
| Name and Year of Birth | Trust
Position(s) | Length of Service | Principal Occupation(s) and Other Directorships
During Past Five Years and Other Relevant Experience |
| Interested Trustee |
Thomas E. Faust Jr.
1958 | Trustee | Since 2007 | Chairman of Morgan Stanley Investment Management, Inc. (MSIM), member of the Board of Managers and President of EV (since 2021), Chief Executive Officer of EVM and BMR. Formerly, Chairman, Chief Executive Officer (2007-2021) and President (2006-2021) of EVC and Director of EVD (2007-2022). Mr. Faust is an interested person because of his positions with MSIM, BMR, EVM and EV, which are affiliates of the Trust.
Other Directorships. Formerly, Director of EVC (2007-2021) and Hexavest Inc. (investment management firm) (2012-2021). |
| Noninterested Trustees |
Alan C. Bowser(1)
1962 | Trustee | Since 2022 | Chief Diversity Officer, Partner and a member of the Operating Committee, and formerly served as Senior Advisor on Diversity and Inclusion for the firm’s chief executive officer, Co-Head of the Americas Region, and Senior Client Advisor of Bridgewater Associates, an asset management firm (2011- present).
Other Directorships. None. |
Mark R. Fetting
1954 | Trustee | Since 2016 | Private investor. Formerly held various positions at Legg Mason, Inc. (investment management firm) (2000-2012), including President, Chief Executive Officer, Director and Chairman (2008-2012), Senior Executive Vice President (2004-2008) and Executive Vice President (2001-2004). Formerly, President of Legg Mason family of funds (2001-2008). Formerly, Division President and Senior Officer of Prudential Financial Group, Inc. and related companies (investment management firm) (1991-2000).
Other Directorships. None. |
Cynthia E. Frost
1961 | Trustee | Since 2014 | Private investor. Formerly, Chief Investment Officer of Brown University (university endowment) (2000-2012). Formerly, Portfolio Strategist for Duke Management Company (university endowment manager) (1995-2000). Formerly, Managing Director, Cambridge Associates (investment consulting company) (1989-1995). Formerly, Consultant, Bain and Company (management consulting firm) (1987- 1989). Formerly, Senior Equity Analyst, BA Investment Management Company (1983-1985).
Other Directorships. None. |
George J. Gorman
1952 | Chairperson of the
Board and Trustee | Since 2021
(Chairperson) and 2014 (Trustee) | Principal at George J. Gorman LLC (consulting firm). Formerly, Senior Partner at Ernst & Young LLP (a registered public accounting firm) (1974-2009).
Other Directorships. None. |
Eaton Vance
Tax-Managed Global Dividend Income Fund
October 31, 2022
Management and Organization — continued
| Name and Year of Birth | Trust
Position(s) | Length of Service | Principal Occupation(s) and Other Directorships
During Past Five Years and Other Relevant Experience |
| Noninterested Trustees (continued) |
Valerie A. Mosley
1960 | Trustee | Since 2014 | Chairwoman and Chief Executive Officer of Valmo Ventures (a consulting and investment firm). Founder of Upward Wealth, Inc., dba BrightUp, a fintech platform. Formerly, Partner and Senior Vice President, Portfolio Manager and Investment Strategist at Wellington Management Company, LLP (investment management firm) (1992-2012). Formerly, Chief Investment Officer, PG Corbin Asset Management (1990-1992). Formerly worked in institutional corporate bond sales at Kidder Peabody (1986-1990).
Other Directorships. Director of DraftKings, Inc. (digital sports entertainment and gaming company) (since September 2020). Director of Envestnet, Inc. (provider of intelligent systems for wealth management and financial wellness) (since 2018). Formerly, Director of Dynex Capital, Inc. (mortgage REIT) (2013-2020) and Director of Groupon, Inc. (e-commerce provider) (2020-2022). |
Keith Quinton
1958 | Trustee | Since 2018 | Private investor, researcher and lecturer. Formerly, Independent Investment Committee Member at New Hampshire Retirement System (2017-2021). Formerly, Portfolio Manager and Senior Quantitative Analyst at Fidelity Investments (investment management firm) (2001-2014).
Other Directorships. Formerly, Director (2016-2021) and Chairman (2019-2021) of New Hampshire Municipal Bond Bank. |
Marcus L. Smith
1966 | Trustee | Since 2018 | Private investor and independent corporate director. Formerly, Chief Investment Officer, Canada (2012-2017), Chief Investment Officer, Asia (2010-2012), Director of Asian Research (2004-2010) and portfolio manager (2001-2017) at MFS Investment Management (investment management firm).
Other Directorships. Director of First Industrial Realty Trust, Inc. (an industrial REIT) (since 2021). Director of MSCI Inc. (global provider of investment decision support tools) (since 2017). Formerly, Director of DCT Industrial Trust Inc. (logistics real estate company) (2017-2018). |
Susan J. Sutherland
1957 | Trustee | Since 2015 | Private investor. Director of Ascot Group Limited and certain of its subsidiaries (insurance and reinsurance) (since 2017). Formerly, Director of Hagerty Holding Corp. (insurance) (2015-2018) and Montpelier Re Holdings Ltd. (insurance and reinsurance) (2013-2015). Formerly, Associate, Counsel and Partner at Skadden, Arps, Slate, Meagher & Flom LLP (law firm) (1982-2013).
Other Directorships. Director of Kairos Acquisition Corp. (insurance/InsurTech acquisition company) (since 2021). |
Scott E. Wennerholm
1959 | Trustee | Since 2016 | Private investor. Formerly, Trustee at Wheelock College (postsecondary institution) (2012-2018). Formerly, Consultant at GF Parish Group (executive recruiting firm) (2016-2017). Formerly, Chief Operating Officer and Executive Vice President at BNY Mellon Asset Management (investment management firm) (2005-2011). Formerly, Chief Operating Officer and Chief Financial Officer at Natixis Global Asset Management (investment management firm) (1997-2004). Formerly, Vice President at Fidelity Investments Institutional Services (investment management firm) (1994-1997).
Other Directorships. None. |
Nancy A. Wiser(1)
1967 | Trustee | Since 2022 | Formerly, Executive Vice President and the Global Head of Operations at Wells Fargo Asset Management (2011-2021).
Other Directorships. None. |
| Name and Year of Birth | Trust
Position(s) | Length of Service | Principal Occupation(s)
During Past Five Years |
| Principal Officers who are not Trustees |
Eric A. Stein
1980 | President | Since 2020 | Vice President and Chief Investment Officer, Fixed Income of EVM and BMR. Prior to November 1, 2020, Mr. Stein was a co-Director of Eaton Vance’s Global Income Investments. Also Vice President of Calvert Research and Management (“CRM”). |
Deidre E. Walsh
1971 | Vice President and Chief
Legal Officer | Since 2009 | Vice President of EVM and BMR. Also Vice President of CRM. |
James F. Kirchner
1967 | Treasurer | Since 2007 | Vice President of EVM and BMR. Also Vice President of CRM. |
Eaton Vance
Tax-Managed Global Dividend Income Fund
October 31, 2022
Management and Organization — continued
| Name and Year of Birth | Trust
Position(s) | Length of Service | Principal Occupation(s)
During Past Five Years |
| Principal Officers who are not Trustees (continued) |
Nicholas Di Lorenzo
1987 | Secretary | Since 2022 | Formerly, associate (2012-2021) and counsel (2022) at Dechert LLP. |
Richard F. Froio
1968 | Chief Compliance
Officer | Since 2017 | Vice President of EVM and BMR since 2017. Formerly, Deputy Chief Compliance Officer (Adviser/Funds) and Chief Compliance Officer (Distribution) at PIMCO (2012-2017) and Managing Director at BlackRock/Barclays Global Investors (2009-2012). |
(1) Mr. Bowser and Ms. Wiser began serving as Trustees effective April 4, 2022.
The SAI for the Fund includes additional information about the Trustees and officers of the Fund and can be obtained without charge on Eaton Vance’s website at www.eatonvance.com or by calling 1-800-262-1122.
| FACTS | WHAT DOES EATON VANCE DO WITH YOUR
PERSONAL INFORMATION? |
| Why? | Financial companies choose how they share your personal information. Federal law gives consumers the right to limit some but not all sharing. Federal law also requires us to tell you how we collect, share, and protect your personal information. Please read this notice carefully to understand what we do. |
| |
| What? | The types of personal information we collect and share depend on the product or service you have with us. This information can include:■ Social Security number and income
■ investment experience and risk tolerance
■ checking account number and wire transfer instructions |
| |
| How? | All financial companies need to share customers’ personal information to run their everyday business. In the section below, we list the reasons financial companies can share their customers’ personal information; the reasons Eaton Vance chooses to share; and whether you can limit this sharing. |
Reasons we can share your
personal information | Does Eaton Vance
share? | Can you limit
this sharing? |
| For our everyday business purposes — such as to process your transactions, maintain your account(s), respond to court orders and legal investigations, or report to credit bureaus | Yes | No |
| For our marketing purposes — to offer our products and services to you | Yes | No |
| For joint marketing with other financial companies | No | We don’t share |
| For our investment management affiliates’ everyday business purposes — information about your transactions, experiences, and creditworthiness | Yes | Yes |
| For our affiliates’ everyday business purposes — information about your transactions and experiences | Yes | No |
| For our affiliates’ everyday business purposes — information about your creditworthiness | No | We don’t share |
| For our investment management affiliates to market to you | Yes | Yes |
| For our affiliates to market to you | No | We don’t share |
| For nonaffiliates to market to you | No | We don’t share |
To limit our
sharing | Call toll-free 1-800-262-1122 or email: EVPrivacy@eatonvance.comPlease note:If you are a new customer, we can begin sharing your information 30 days from the date we sent this notice. When you are no longer our customer, we continue to share your information as described in this notice. However, you can contact us at any time to limit our sharing. |
| Questions? | Call toll-free 1-800-262-1122 or email: EVPrivacy@eatonvance.com |
| Privacy Notice — continued | April 2021 |
| Who we are |
| Who is providing this notice? | Eaton Vance Management, Eaton Vance Distributors, Inc., Eaton Vance Trust Company, Eaton Vance Management (International) Limited, Eaton Vance Advisers International Ltd., Eaton Vance Global Advisors Limited, Eaton Vance Management’s Real Estate Investment Group, Boston Management and Research, Calvert Research and Management, Eaton Vance and Calvert Fund Families and our investment advisory affiliates (“Eaton Vance”) (see Investment Management Affiliates definition below) |
| What we do |
How does Eaton Vance
protect my personal
information? | To protect your personal information from unauthorized access and use, we use security measures that comply with federal law. These measures include computer safeguards and secured files and buildings. We have policies governing the proper handling of customer information by personnel and requiring third parties that provide support to adhere to appropriate security standards with respect to such information. |
How does Eaton Vance
collect my personal
information? | We collect your personal information, for example, when you■ open an account or make deposits or withdrawals from your account
■ buy securities from us or make a wire transfer
■ give us your contact informationWe also collect your personal information from others, such as credit bureaus, affiliates, or other companies. |
| Why can’t I limit all sharing? | Federal law gives you the right to limit only■ sharing for affiliates’ everyday business purposes — information about your creditworthiness
■ affiliates from using your information to market to you
■ sharing for nonaffiliates to market to youState laws and individual companies may give you additional rights to limit sharing. See below for more on your rights under state law. |
| Definitions |
Investment Management
Affiliates | Eaton Vance Investment Management Affiliates include registered investment advisers, registered broker- dealers, and registered and unregistered funds. Investment Management Affiliates does not include entities associated with Morgan Stanley Wealth Management, such as Morgan Stanley Smith Barney LLC and Morgan Stanley & Co. |
| Affiliates | Companies related by common ownership or control. They can be financial and nonfinancial companies.■ Our affiliates include companies with a Morgan Stanley name and financial companies such as Morgan Stanley Smith Barney LLC and Morgan Stanley & Co. |
| Nonaffiliates | Companies not related by common ownership or control. They can be financial and nonfinancial companies.■ Eaton Vance does not share with nonaffiliates so they can market to you. |
| Joint marketing | A formal agreement between nonaffiliated financial companies that together market financial products or services to you.■ Eaton Vance doesn’t jointly market. |
| Other important information |
| Vermont: Except as permitted by law, we will not share personal information we collect about Vermont residents with Nonaffiliates unless you provide us with your written consent to share such information.California: Except as permitted by law, we will not share personal information we collect about California residents with Nonaffiliates and we will limit sharing such personal information with our Affiliates to comply with California privacy laws that apply to us. |
Delivery of Shareholder Documents. The Securities and Exchange Commission (SEC) permits funds to deliver only one copy of shareholder documents, including prospectuses, proxy statements and shareholder reports, to fund investors with multiple accounts at the same residential or post office box address. This practice is often called “householding” and it helps eliminate duplicate mailings to shareholders. Eaton Vance, or your financial intermediary, may household the mailing of your documents indefinitely unless you instruct Eaton Vance, or your financial intermediary, otherwise. If you would prefer that your Eaton Vance documents not be householded, please contact Eaton Vance at 1-800-262-1122, or contact your financial intermediary. Your instructions that householding not apply to delivery of your Eaton Vance documents will typically be effective within 30 days of receipt by Eaton Vance or your financial intermediary.
Portfolio Holdings. Each Eaton Vance Fund and its underlying Portfolio(s) (if applicable) files a schedule of portfolio holdings on Part F to Form N-PORT with the SEC. Certain information filed on Form N-PORT may be viewed on the Eaton Vance website at www.eatonvance.com, by calling Eaton Vance at 1-800-262-1122 or in the EDGAR database on the SEC’s website at www.sec.gov.
Proxy Voting. From time to time, funds are required to vote proxies related to the securities held by the funds. The Eaton Vance Funds or their underlying Portfolios (if applicable) vote proxies according to a set of policies and procedures approved by the Funds’ and Portfolios’ Boards. You may obtain a description of these policies and procedures and information on how the Funds or Portfolios voted proxies relating to portfolio securities during the most recent 12-month period ended June 30, without charge, upon request, by calling 1-800-262-1122 and by accessing the SEC’s website at www.sec.gov.
This Page Intentionally Left Blank
Investment Adviser and Administrator
Eaton Vance Management
Two International Place
Boston, MA 02110
Investment Sub-Adviser
Eaton Vance Advisers International Ltd.
125 Old Broad Street
London, EC2N 1AR
United Kingdom
Principal Underwriter*
Eaton Vance Distributors, Inc.
Two International Place
Boston, MA 02110
(617) 482-8260
Custodian
State Street Bank and Trust Company
State Street Financial Center, One Lincoln Street
Boston, MA 02111
Transfer Agent
BNY Mellon Investment Servicing (US) Inc.
Attn: Eaton Vance Funds
P.O. Box 9653
Providence, RI 02940-9653
(800) 262-1122
Independent Registered Public Accounting Firm
Deloitte & Touche LLP
200 Berkeley Street
Boston, MA 02116-5022
Fund Offices
Two International Place
Boston, MA 02110
* FINRA BrokerCheck. Investors may check the background of their Investment Professional by contacting the Financial Industry Regulatory Authority (FINRA). FINRA BrokerCheck is a free tool to help investors check the professional background of current and former FINRA-registered securities firms and brokers. FINRA BrokerCheck is available by calling 1-800-289-9999 and at www.FINRA.org. The FINRA BrokerCheck brochure describing this program is available to investors at www.FINRA.org.
Parametric
Tax-Managed International Equity Fund
Annual Report
October 31, 2022
Commodity Futures Trading Commission Registration. The Commodity Futures Trading Commission (“CFTC”) has adopted regulations that subject registered investment companies and advisers to regulation by the CFTC if a fund invests more than a prescribed level of its assets in certain CFTC-regulated instruments (including futures, certain options and swap agreements) or markets itself as providing investment exposure to such instruments. The investment adviser has claimed an exclusion from the definition of “commodity pool operator” under the Commodity Exchange Act with respect to its management of the Fund. Accordingly, neither the Fund nor the adviser with respect to the operation of the Fund is subject to CFTC regulation. Because of its management of other strategies, the Fund's adviser and Parametric Portfolio Associates LLC (Parametric), sub-adviser to the Fund, are registered with the CFTC as commodity pool operators. The adviser and Parametric are also registered as commodity trading advisors.
Fund shares are not insured by the FDIC and are not deposits or other obligations of, or guaranteed by, any depository institution. Shares are subject to investment risks, including possible loss of principal invested.
This report must be preceded or accompanied by a current summary prospectus or prospectus. Before investing, investors should consider carefully the investment objective, risks, and charges and expenses of a mutual fund. This and other important information is contained in the summary prospectus and prospectus, which can be obtained from a financial intermediary. Prospective investors should read the prospectus carefully before investing. For further information, please call 1-800-260-0761.
Annual Report October 31, 2022
Parametric
Tax-Managed International Equity Fund
Parametric
Tax-Managed International Equity Fund
October 31, 2022
Management’s Discussion of Fund Performance†
Economic and Market Conditions
Stock prices in developed markets outside the U.S. fell significantly during the 12 months ended October 31, 2022, finishing the period in bear-market territory, as measured by the MSCI EAFE Index (the Index). Negative country-level returns were universal across constituents, with every country declining by double-digits.
Markets directly impacted by Russia’s war in Ukraine -- or with high exposure to technology-related businesses -- fared the worst during the period. Hong Kong, with its close ties to mainland China, was among the hardest hit. On the other hand, a strong showing from energy stocks was beneficial to a handful of energy-rich nations. U.S.-based exporters, however, faced an added challenge by the strength of the U.S. dollar, resulting in additional losses from foreign currency depreciation during the period.
In Europe, the Russia-Ukraine conflict weighed strongly on markets, with heavy equity losses in Germany and Austria due to their outsized dependence on Russian energy. High inflation, rising interest rates, and growing recessionary fears across the region also punished stocks. Countries with high exposure to the industrials sector, such as Ireland and Sweden, were particularly vulnerable during the period. Additionally, a strong pullback in technology stocks, including key semiconductor manufacturing equipment suppliers, was a significant challenge for the Netherlands -- the worst-performing developed nation during the period. In contrast, both the U.K. and Norway avoided the full brunt of the widespread equity sell-off, buoyed in part by rising energy prices.
Turning to the Pacific region, stocks in Japan modestly lagged the Index largely due to a sharp decline in the yen versus the U.S. dollar -- a side effect of rising U.S. interest rates, while the Bank of Japan held its rates near zero percent during the period. Hong Kong was another underperformer in the region as spillover from China’s regulatory crackdown and zero-COVID policy soured investor sentiment abroad. Results were a bit better in Australia, where a handful of sectors -- including energy -- were up over the period, leading to outperformance from the land down under.
Fund Performance
For the 12-month period ended October 31, 2022, Parametric Tax-Managed International Equity Fund (the Fund) returned -25.40% for Class A shares at net asset value (NAV), underperforming its benchmark, the Index, which returned -23.00%.
Factors detracting from the Fund’s performance relative to the Index included an underweight exposure to the U.K., which declined less than the broader market due in part to a rally in energy stocks. In Sweden, stock selections emphasizing medium- and small-size companies also detracted from relative performance versus the Index. This decline was partially the result of underperforming small-cap stocks within the communication services sector. Finally, sector diversification within Denmark, which resulted in an overweight exposure to health care, harmed the Fund’s relative performance during the period.
In contrast, factors contributing to Fund performance relative to the Index included stock selections within Israel. These gains were partly the result of excluding investments in high beta equities -- a measure of a stock's potential volatility and risk relative to its index -- and including small-cap companies within the industrials sector.
Sector diversification within Japan also contributed to returns relative to the Index during the period. Relative performance was largely due to overweight positions in the utilities and energy sectors, which limited losses to single digits. Additionally, an underweight exposure to the Netherlands added to relative performance, as the European country was the worst-performing Index constituent during the period.
See Endnotes and Additional Disclosures in this report.
Past performance is no guarantee of future results. Returns are historical and are calculated by determining the percentage change in net asset value (NAV) or offering price (as applicable) with all distributions reinvested. Furthermore, returns do not reflect the deduction of taxes that shareholders may have to pay on Fund distributions or upon the redemption of Fund shares. Investment return and principal value will fluctuate so that shares, when redeemed, may be worth more or less than their original cost. Performance for periods less than or equal to one year is cumulative. Performance is for the stated time period only; due to market volatility, current Fund performance may be lower or higher than the quoted return. For performance as of the most recent month-end, please refer to eatonvance.com.
Parametric
Tax-Managed International Equity Fund
October 31, 2022
Performance
Portfolio Manager(s) Thomas C. Seto, Paul W. Bouchey, CFA and Jennifer Sireklove, CFA, each of Parametric Portfolio Associates LLC
| % Average Annual Total Returns1,2 | Class
Inception Date | Performance
Inception Date | One Year | Five Years | Ten Years |
| Class A at NAV | 04/22/1998 | 04/22/1998 | (25.40)% | (0.75)% | 3.58% |
| Class A with 5.25% Maximum Sales Charge | — | — | (29.32) | (1.82) | 3.02 |
| Class C at NAV | 04/22/1998 | 04/22/1998 | (25.98) | (1.48) | 2.98 |
| Class C with 1% Maximum Deferred Sales Charge | — | — | (26.71) | (1.48) | 2.98 |
| Class I at NAV | 09/02/2008 | 04/22/1998 | (25.19) | (0.50) | 3.84 |
|
| MSCI EAFE Index | — | — | (23.00)% | (0.09)% | 4.12% |
| % After-Tax Returns with Maximum Sales Charge2 | Class
Inception Date | Performance
Inception Date | One Year | Five Years | Ten Years |
| Class A After Taxes on Distributions | 04/22/1998 | 04/22/1998 | (29.44)% | (1.94)% | 2.87% |
| Class A After Taxes on Distributions and Sale of Fund Shares | — | — | (16.71) | (1.14) | 2.72 |
| Class C After Taxes on Distributions | 04/22/1998 | 04/22/1998 | (26.67) | (1.42) | 2.91 |
| Class C After Taxes on Distributions and Sale of Fund Shares | — | — | (15.29) | (0.87) | 2.66 |
| Class I After Taxes on Distributions | 09/02/2008 | 04/22/1998 | (25.37) | (0.67) | 3.66 |
| Class I After Taxes on Distributions and Sale of Fund Shares | — | — | (14.18) | (0.08) | 3.43 |
| % Total Annual Operating Expense Ratios3 | Class A | Class C | Class I |
| Gross | 1.39% | 2.14% | 1.14% |
| Net | 1.05 | 1.80 | 0.80 |
Growth of $10,000
This graph shows the change in value of a hypothetical investment of $10,000 in Class A of the Fund for the period indicated. For comparison, the same investment is shown in the indicated index.
| Growth of Investment | Amount Invested | Period Beginning | At NAV | With Maximum Sales Charge |
| Class C | $10,000 | 10/31/2012 | $13,411 | N.A. |
| Class I, at minimum investment | $1,000,000 | 10/31/2012 | $1,458,396 | N.A. |
See Endnotes and Additional Disclosures in this report.
Past performance is no guarantee of future results. Returns are historical and are calculated by determining the percentage change in net asset value (NAV) or offering price (as applicable) with all distributions reinvested. Furthermore, returns do not reflect the deduction of taxes that shareholders may have to pay on Fund distributions or upon the redemption of Fund shares. Investment return and principal value will fluctuate so that shares, when redeemed, may be worth more or less than their original cost. Performance for periods less than or equal to one year is cumulative. Performance is for the stated time period only; due to market volatility, current Fund performance may be lower or higher than the quoted return. For performance as of the most recent month-end, please refer to eatonvance.com.
Parametric
Tax-Managed International Equity Fund
October 31, 2022
| Sector Allocation (% of net assets)1 |
| Geographic Allocation (% of common stocks) |
| Top 10 Holdings (% of net assets)1 |
| Nestle S.A. | 1.2% |
| Air Liquide S.A. | 1.0 |
| Cie Financiere Richemont S.A. | 1.0 |
| TotalEnergies SE | 0.9 |
| AstraZeneca PLC | 0.9 |
| E.ON SE | 0.7 |
| Deutsche Telekom AG | 0.7 |
| CSL, Ltd. | 0.7 |
| Novo Nordisk A/S, Class B | 0.7 |
| LVMH Moet Hennessy Louis Vuitton SE | 0.7 |
| Total | 8.5% |
Footnotes:
Fund invests in an affiliated investment company (Portfolio) with the same objective(s) and policies as the Fund. References to investments are to the Portfolio’s holdings.
| 1 | Excludes cash and cash equivalents. |
Parametric
Tax-Managed International Equity Fund
October 31, 2022
Endnotes and Additional Disclosures
| † | The views expressed in this report are those of the portfolio manager(s) and are current only through the date stated at the top of this page. These views are subject to change at any time based upon market or other conditions, and Eaton Vance and the Fund(s) disclaim any responsibility to update such views. These views may not be relied upon as investment advice and, because investment decisions are based on many factors, may not be relied upon as an indication of trading intent on behalf of any Eaton Vance fund. This commentary may contain statements that are not historical facts, referred to as “forward-looking statements.” The Fund’s actual future results may differ significantly from those stated in any forward-looking statement, depending on factors such as changes in securities or financial markets or general economic conditions, the volume of sales and purchases of Fund shares, the continuation of investment advisory, administrative and service contracts, and other risks discussed from time to time in the Fund’s filings with the Securities and Exchange Commission. |
| | |
| 1 | MSCI EAFE Index is an unmanaged index of equities in the developed markets, excluding the U.S. and Canada. MSCI indexes are net of foreign withholding taxes. Source: MSCI. MSCI data may not be reproduced or used for any other purpose. MSCI provides no warranties, has not prepared or approved this report, and has no liability hereunder. Unless otherwise stated, index returns do not reflect the effect of any applicable sales charges, commissions, expenses, taxes or leverage, as applicable. It is not possible to invest directly in an index. |
| 2 | Total Returns at NAV do not include applicable sales charges. If sales charges were deducted, the returns would be lower. Total Returns shown with maximum sales charge reflect the stated maximum sales charge. Unless otherwise stated, performance does not reflect the deduction of taxes on Fund distributions or redemptions of Fund shares. After-tax returns are calculated using certain assumptions, including using the highest historical individual federal income tax rates, and do not reflect the impact of state/local taxes. Actual after-tax returns depend on a shareholder’s tax situation and the actual characterization of distributions and may differ from those shown. After-tax returns are not relevant to shareholders who hold shares in tax-deferred accounts or shares held by nontaxable entities. Return After Taxes on Distributions may be the same as Return Before Taxes for the same period because no taxable distributions were made during that period. Return After Taxes on Distributions and Sale of Fund Shares may be greater than or equal to Return After Taxes on Distributions for the same period because of losses realized on the sale of Fund shares. The Fund’s after-tax returns also may reflect foreign tax credits passed by the Fund to its shareholders.Effective November 5, 2020, Class C shares automatically convert to Class A shares eight years after purchase. The average annual total returns listed for Class C reflect conversion to Class A shares after eight years. Prior to November 5, 2020, Class C shares automatically converted to Class A shares ten years after purchase. |
| 3 | Source: Fund prospectus. Net expense ratios reflect a contractual expense reimbursement that continues through 2/28/23. The expense ratios for the current reporting period can be found in the Financial Highlights section of this report. Performance reflects expenses waived and/or reimbursed, if applicable. Without such waivers and/or |
| | reimbursements, performance would have been lower. |
| | Fund profile subject to change due to active management. |
| | Important Notice to Shareholders |
| | Effective April 29, 2022, the Fund’s Investor Class shares were redesignated as Class A shares. Class A shares are subject to a front-end sales charge, subject to certain exceptions. Former Investor Class shareholders, who established their Fund accounts before April 29, 2022, did not pay a sales charge in connection with the redesignation or will not be subject to this sales charge on future purchases of Class A shares for such accounts. Effective April 29, 2022, the Fund’s Institutional Class shares were redesignated as Class I shares. This share class redesignation did not result in changes to the annual operating expenses of Class I or the Fund. |
Parametric
Tax-Managed International Equity Fund
October 31, 2022
Example
As a Fund shareholder, you incur two types of costs: (1) transaction costs, including sales charges (loads) on purchases and redemption fees (if applicable); and (2) ongoing costs, including management fees; distribution and/or service fees; and other Fund expenses. This Example is intended to help you understand your ongoing costs (in dollars) of Fund investing and to compare these costs with the ongoing costs of investing in other mutual funds. The Example is based on an investment of $1,000 invested at the beginning of the period and held for the entire period (May 1, 2022 to October 31, 2022).
Actual Expenses
The first section of the table below provides information about actual account values and actual expenses. You may use the information in this section, together with the amount you invested, to estimate the expenses that you paid over the period. Simply divide your account value by $1,000 (for example, an $8,600 account value divided by $1,000 = 8.6), then multiply the result by the number in the first section under the heading entitled “Expenses Paid During Period” to estimate the expenses you paid on your account during this period.
Hypothetical Example for Comparison Purposes
The second section of the table below provides information about hypothetical account values and hypothetical expenses based on the actual Fund expense ratio and an assumed rate of return of 5% per year (before expenses), which is not the actual Fund return. The hypothetical account values and expenses may not be used to estimate the actual ending account balance or expenses you paid for the period. You may use this information to compare the ongoing costs of investing in your Fund and other funds. To do so, compare this 5% hypothetical example with the 5% hypothetical examples that appear in the shareholder reports of the other funds.
Please note that the expenses shown in the table are meant to highlight your ongoing costs only and do not reflect any transactional costs, such as sales charges (loads) or redemption fees (if applicable). Therefore, the second section of the table is useful in comparing ongoing costs only, and will not help you determine the relative total costs of owning different funds. In addition, if these transactional costs were included, your costs would be higher.
| | Beginning
Account Value
(5/1/22) | Ending
Account Value
(10/31/22) | Expenses Paid
During Period*
(5/1/22 – 10/31/22) | Annualized
Expense
Ratio |
| Actual | | | | |
| Class A | $1,000.00 | $ 856.40 | $4.91** | 1.05% |
| Class C | $1,000.00 | $ 853.60 | $8.41** | 1.80% |
| Class I | $1,000.00 | $ 857.60 | $3.75** | 0.80% |
| |
| Hypothetical | | | | |
| (5% return per year before expenses) | | | | |
| Class A | $1,000.00 | $1,019.91 | $5.35** | 1.05% |
| Class C | $1,000.00 | $1,016.13 | $9.15** | 1.80% |
| Class I | $1,000.00 | $1,021.17 | $4.08** | 0.80% |
| * | Expenses are equal to the Fund's annualized expense ratio for the indicated Class, multiplied by the average account value over the period, multiplied by 184/365 (to reflect the one-half year period). The Example assumes that the $1,000 was invested at the net asset value per share determined at the close of business on April 30, 2022. The Example reflects the expenses of both the Fund and the Portfolio. |
| ** | Absent an allocation of certain expenses to affiliates, expenses would be higher. |
Parametric
Tax-Managed International Equity Fund
October 31, 2022
Statement of Assets and Liabilities
| | October 31, 2022 |
| Assets | |
| Investment in Tax-Managed International Equity Portfolio, at value (identified cost $36,661,983) | $ 33,556,492 |
| Receivable for Fund shares sold | 164,116 |
| Receivable from affiliates | 14,561 |
| Total assets | $33,735,169 |
| Liabilities | |
| Payable for Fund shares redeemed | $ 272,938 |
| Payable to affiliates: | |
| Distribution and service fees | 3,418 |
| Trustees' fees | 43 |
| Accrued expenses | 58,969 |
| Total liabilities | $ 335,368 |
| Net Assets | $33,399,801 |
| Sources of Net Assets | |
| Paid-in capital | $ 37,666,686 |
| Accumulated loss | (4,266,885) |
| Net Assets | $33,399,801 |
| Class A Shares | |
| Net Assets | $ 15,636,955 |
| Shares Outstanding | 1,580,078 |
Net Asset Value and Redemption Price Per Share
(net assets ÷ shares of beneficial interest outstanding) | $ 9.90 |
Maximum Offering Price Per Share
(100 ÷ 94.75 of net asset value per share) | $ 10.45 |
| Class C Shares | |
| Net Assets | $ 208,604 |
| Shares Outstanding | 22,223 |
Net Asset Value and Offering Price Per Share*
(net assets ÷ shares of beneficial interest outstanding) | $ 9.39 |
| Class I Shares | |
| Net Assets | $ 17,554,242 |
| Shares Outstanding | 1,777,171 |
Net Asset Value, Offering Price and Redemption Price Per Share
(net assets ÷ shares of beneficial interest outstanding) | $ 9.88 |
| On sales of $50,000 or more, the offering price of Class A shares is reduced. |
| * | Redemption price per share is equal to the net asset value less any applicable contingent deferred sales charge. |
7
See Notes to Financial Statements.
Parametric
Tax-Managed International Equity Fund
October 31, 2022
| | Year Ended |
| | October 31, 2022 |
| Investment Income | |
| Dividend income allocated from Portfolio (net of foreign taxes withheld of $145,879) | $ 1,101,654 |
| Securities lending income allocated from Portfolio, net | 23,613 |
| Expenses allocated from Portfolio | (256,402) |
| Total investment income from Portfolio | $ 868,865 |
| Expenses | |
| Distribution and service fees: | |
| Class A | $ 47,555 |
| Class C | 2,851 |
| Trustees’ fees and expenses | 500 |
| Custodian fee | 18,005 |
| Transfer and dividend disbursing agent fees | 61,467 |
| Legal and accounting services | 33,555 |
| Printing and postage | 12,760 |
| Registration fees | 55,017 |
| Miscellaneous | 10,094 |
| Total expenses | $ 241,804 |
| Deduct: | |
| Waiver and/or reimbursement of expenses by affiliates | $ 151,087 |
| Total expense reductions | $ 151,087 |
| Net expenses | $ 90,717 |
| Net investment income | $ 778,148 |
| Realized and Unrealized Gain (Loss) from Portfolio | |
| Net realized gain (loss): | |
| Investment transactions | $ (664,824) |
| Foreign currency transactions | (17,050) |
| Net realized loss | $ (681,874) |
| Change in unrealized appreciation (depreciation): | |
| Investments | $ (10,791,555) |
| Foreign currency | (13,141) |
| Net change in unrealized appreciation (depreciation) | $(10,804,696) |
| Net realized and unrealized loss | $(11,486,570) |
| Net decrease in net assets from operations | $(10,708,422) |
8
See Notes to Financial Statements.
Parametric
Tax-Managed International Equity Fund
October 31, 2022
Statements of Changes in Net Assets
| | Year Ended October 31, |
| | 2022 | 2021 |
| Increase (Decrease) in Net Assets | | |
| From operations: | | |
| Net investment income | $ 778,148 | $ 768,425 |
| Net realized loss | (681,874) | (327,229) |
| Net change in unrealized appreciation (depreciation) | (10,804,696) | 8,853,823 |
| Net increase (decrease) in net assets from operations | $(10,708,422) | $ 9,295,019 |
| Distributions to shareholders: | | |
| Class A | $ (449,871) | $ (234,080) |
| Class C | (4,143) | — |
| Class I | (383,363) | (179,742) |
| Total distributions to shareholders | $ (837,377) | $ (413,822) |
| Transactions in shares of beneficial interest: | | |
| Class A | $ (671,576) | $ (1,175,092) |
| Class C | (121,046) | (318,573) |
| Class I | 6,720,798 | 1,306,907 |
| Net increase (decrease) in net assets from Fund share transactions | $ 5,928,176 | $ (186,758) |
| Net increase (decrease) in net assets | $ (5,617,623) | $ 8,694,439 |
| Net Assets | | |
| At beginning of year | $ 39,017,424 | $ 30,322,985 |
| At end of year | $ 33,399,801 | $39,017,424 |
9
See Notes to Financial Statements.
Parametric
Tax-Managed International Equity Fund
October 31, 2022
| | Class A |
| | Year Ended October 31, |
| | 2022 | 2021 | 2020 | 2019 | 2018 |
| Net asset value — Beginning of year | $13.550 | $ 10.480 | $ 11.330 | $ 10.370 | $ 11.310 |
| Income (Loss) From Operations | | | | | |
| Net investment income(1) | $ 0.230 | $ 0.250 | $ 0.147 | $ 0.242 | $ 0.179 |
| Net realized and unrealized gain (loss) | (3.606) | 2.955 | (0.738) | 0.887 | (0.848) |
| Total income (loss) from operations | $ (3.376) | $ 3.205 | $ (0.591) | $ 1.129 | $ (0.669) |
| Less Distributions | | | | | |
| From net investment income | $ (0.274) | $ (0.135) | $ (0.259) | $ (0.169) | $ (0.271) |
| Total distributions | $ (0.274) | $ (0.135) | $ (0.259) | $ (0.169) | $ (0.271) |
| Net asset value — End of year | $ 9.900 | $13.550 | $10.480 | $11.330 | $10.370 |
| Total Return(2)(3) | (25.40)% | 30.73% | (5.41)% | 11.16% | (6.09)% |
| Ratios/Supplemental Data | | | | | |
| Net assets, end of year (000’s omitted) | $15,637 | $ 22,264 | $ 18,165 | $ 21,757 | $ 17,824 |
| Ratios (as a percentage of average daily net assets):(4) | | | | | |
| Expenses (3) | 1.05% (5) | 1.05% | 1.05% | 1.05% | 1.05% |
| Net investment income | 1.97% | 1.93% | 1.37% | 2.26% | 1.59% |
| Portfolio Turnover of the Portfolio | 22% | 23% | 10% | 37% | 30% |
| (1) | Computed using average shares outstanding. |
| (2) | Returns are historical and are calculated by determining the percentage change in net asset value with all distributions reinvested and do not reflect the effect of sales charges. |
| (3) | The administrator of the Fund and sub-adviser of the Portfolio reimbursed certain operating expenses (equal to 0.41%, 0.34%, 0.45%, 0.51% and 0.41% of average daily net assets for the years ended October 31, 2022, 2021, 2020, 2019 and 2018, respectively). Absent this reimbursement, total return would be lower. |
| (4) | Includes the Fund’s share of the Portfolio’s allocated expenses. |
| (5) | Includes a reduction by the investment adviser of a portion of the Portfolio’s adviser fee due to the Portfolio’s investment in the Liquidity Fund (equal to less than 0.005% of average daily net assets for the year ended October 31, 2022). |
10
See Notes to Financial Statements.
Parametric
Tax-Managed International Equity Fund
October 31, 2022
Financial Highlights — continued
| | Class C |
| | Year Ended October 31, |
| | 2022 | 2021 | 2020 | 2019 | 2018 |
| Net asset value — Beginning of year | $12.840 | $ 9.900 | $10.690 | $ 9.770 | $10.670 |
| Income (Loss) From Operations | | | | | |
| Net investment income(1) | $ 0.133 | $ 0.133 | $ 0.062 | $ 0.119 | $ 0.086 |
| Net realized and unrealized gain (loss) | (3.431) | 2.807 | (0.701) | 0.886 | (0.794) |
| Total income (loss) from operations | $ (3.298) | $ 2.940 | $ (0.639) | $ 1.005 | $ (0.708) |
| Less Distributions | | | | | |
| From net investment income | $ (0.152) | $ — | $ (0.151) | $ (0.085) | $ (0.192) |
| Total distributions | $ (0.152) | $ — | $ (0.151) | $ (0.085) | $ (0.192) |
| Net asset value — End of year | $ 9.390 | $12.840 | $ 9.900 | $10.690 | $ 9.770 |
| Total Return(2)(3) | (25.98)% | 29.70% | (6.11)% | 10.42% | (6.78)% |
| Ratios/Supplemental Data | | | | | |
| Net assets, end of year (000’s omitted) | $ 209 | $ 419 | $ 598 | $ 1,862 | $ 6,186 |
| Ratios (as a percentage of average daily net assets):(4) | | | | | |
| Expenses (3) | 1.80% (5) | 1.80% | 1.80% | 1.80% | 1.80% |
| Net investment income | 1.19% | 1.09% | 0.62% | 1.20% | 0.81% |
| Portfolio Turnover of the Portfolio | 22% | 23% | 10% | 37% | 30% |
| (1) | Computed using average shares outstanding. |
| (2) | Returns are historical and are calculated by determining the percentage change in net asset value with all distributions reinvested and do not reflect the effect of sales charges. |
| (3) | The administrator of the Fund and sub-adviser of the Portfolio reimbursed certain operating expenses (equal to 0.41%, 0.34%, 0.45%, 0.51% and 0.41% of average daily net assets for the years ended October 31, 2022, 2021, 2020, 2019 and 2018, respectively). Absent this reimbursement, total return would be lower. |
| (4) | Includes the Fund’s share of the Portfolio’s allocated expenses. |
| (5) | Includes a reduction by the investment adviser of a portion of the Portfolio’s adviser fee due to the Portfolio’s investment in the Liquidity Fund (equal to less than 0.005% of average daily net assets for the year ended October 31, 2022). |
11
See Notes to Financial Statements.
Parametric
Tax-Managed International Equity Fund
October 31, 2022
Financial Highlights — continued
| | Class I |
| | Year Ended October 31, |
| | 2022 | 2021 | 2020 | 2019 | 2018 |
| Net asset value — Beginning of year | $13.520 | $ 10.460 | $ 11.310 | $ 10.350 | $ 11.290 |
| Income (Loss) From Operations | | | | | |
| Net investment income(1) | $ 0.260 | $ 0.289 | $ 0.173 | $ 0.264 | $ 0.198 |
| Net realized and unrealized gain (loss) | (3.592) | 2.934 | (0.736) | 0.895 | (0.840) |
| Total income (loss) from operations | $ (3.332) | $ 3.223 | $ (0.563) | $ 1.159 | $ (0.642) |
| Less Distributions | | | | | |
| From net investment income | $ (0.308) | $ (0.163) | $ (0.287) | $ (0.199) | $ (0.298) |
| Total distributions | $ (0.308) | $ (0.163) | $ (0.287) | $ (0.199) | $ (0.298) |
| Net asset value — End of year | $ 9.880 | $13.520 | $10.460 | $11.310 | $10.350 |
| Total Return(2)(3) | (25.19)% | 30.99% | (5.19)% | 11.52% | (5.88)% |
| Ratios/Supplemental Data | | | | | |
| Net assets, end of year (000’s omitted) | $17,554 | $ 16,335 | $ 11,560 | $ 13,301 | $ 12,011 |
| Ratios (as a percentage of average daily net assets):(4) | | | | | |
| Expenses (3) | 0.80% (5) | 0.80% | 0.80% | 0.80% | 0.80% |
| Net investment income | 2.27% | 2.23% | 1.62% | 2.48% | 1.76% |
| Portfolio Turnover of the Portfolio | 22% | 23% | 10% | 37% | 30% |
| (1) | Computed using average shares outstanding. |
| (2) | Returns are historical and are calculated by determining the percentage change in net asset value with all distributions reinvested. |
| (3) | The administrator of the Fund and sub-adviser of the Portfolio reimbursed certain operating expenses (equal to 0.41%, 0.34%, 0.45%, 0.51% and 0.41% of average daily net assets for the years ended October 31, 2022, 2021, 2020, 2019 and 2018, respectively). Absent this reimbursement, total return would be lower. |
| (4) | Includes the Fund’s share of the Portfolio’s allocated expenses. |
| (5) | Includes a reduction by the investment adviser of a portion of the Portfolio’s adviser fee due to the Portfolio’s investment in the Liquidity Fund (equal to less than 0.005% of average daily net assets for the year ended October 31, 2022). |
12
See Notes to Financial Statements.
Parametric
Tax-Managed International Equity Fund
October 31, 2022
Notes to Financial Statements
1 Significant Accounting Policies
Parametric Tax-Managed International Equity Fund (the Fund) is a diversified series of Eaton Vance Mutual Funds Trust (the Trust). The Trust is a Massachusetts business trust registered under the Investment Company Act of 1940, as amended (the 1940 Act), as an open-end management investment company. The Fund offers three classes of shares. Class A (renamed from Investor Class effective April 29, 2022) shares are generally sold subject to a sales charge imposed at time of purchase. Former Investor Class shareholders, who established their Fund accounts before April 29, 2022, did not pay a sales charge in connection with the redesignation or will not be subject to this sales charge on future purchases of Class A shares for such accounts. Class C shares are sold at net asset value and are generally subject to a contingent deferred sales charge (see Note 5). Effective March 1, 2013, Class C shares of the Fund are no longer available for purchase, except by existing shareholders (including shares acquired through the reinvestment of dividends and distributions) or employer sponsored retirement plans. Effective November 5, 2020, Class C shares automatically convert to Class A shares eight years after their purchase as described in the Fund’s prospectus. Class I (renamed from Institutional Class effective April 29, 2022) shares are sold at net asset value and are not subject to a sales charge. Each class represents a pro-rata interest in the Fund, but votes separately on class-specific matters and (as noted below) is subject to different expenses. Realized and unrealized gains and losses and net investment income and losses, other than class-specific expenses, are allocated daily to each class of shares based on the relative net assets of each class to the total net assets of the Fund. Each class of shares differs in its distribution plan and certain other class-specific expenses. The Fund invests all of its investable assets in interests in Tax-Managed International Equity Portfolio (the Portfolio), a Massachusetts business trust, having the same investment objective and policies as the Fund. The value of the Fund’s investment in the Portfolio reflects the Fund’s proportionate interest in the net assets of the Portfolio (56.3% at October 31, 2022). The performance of the Fund is directly affected by the performance of the Portfolio. The financial statements of the Portfolio, including the portfolio of investments, are included elsewhere in this report and should be read in conjunction with the Fund’s financial statements.
The following is a summary of significant accounting policies of the Fund. The policies are in conformity with accounting principles generally accepted in the United States of America (U.S. GAAP). The Fund is an investment company and follows accounting and reporting guidance in the Financial Accounting Standards Board (FASB) Accounting Standards Codification Topic 946.
A Investment Valuation— Valuation of securities by the Portfolio is discussed in Note 1A of the Portfolio's Notes to Financial Statements, which are included elsewhere in this report.
B Income— The Fund's net investment income or loss consists of the Fund's pro-rata share of the net investment income or loss of the Portfolio, less all actual and accrued expenses of the Fund.
C Federal Taxes—The Fund’s policy is to comply with the provisions of the Internal Revenue Code applicable to regulated investment companies and to distribute to shareholders each year substantially all of its net investment income, and all or substantially all of its net realized capital gains. Accordingly, no provision for federal income or excise tax is necessary.
As of October 31, 2022, the Fund had no uncertain tax positions that would require financial statement recognition, de-recognition, or disclosure. The Fund files a U.S. federal income tax return annually after its fiscal year-end, which is subject to examination by the Internal Revenue Service for a period of three years from the date of filing.
D Expenses—The majority of expenses of the Trust are directly identifiable to an individual fund. Expenses which are not readily identifiable to a specific fund are allocated taking into consideration, among other things, the nature and type of expense and the relative size of the funds.
E Use of Estimates—The preparation of the financial statements in conformity with U.S. GAAP requires management to make estimates and assumptions that affect the reported amounts of assets and liabilities at the date of the financial statements and the reported amounts of income and expense during the reporting period. Actual results could differ from those estimates.
F Indemnifications—Under the Trust’s organizational documents, its officers and Trustees may be indemnified against certain liabilities and expenses arising out of the performance of their duties to the Fund. Under Massachusetts law, if certain conditions prevail, shareholders of a Massachusetts business trust (such as the Trust) could be deemed to have personal liability for the obligations of the Trust. However, the Trust’s Declaration of Trust contains an express disclaimer of liability on the part of Fund shareholders and the By-laws provide that the Trust shall assume, upon request by the shareholder, the defense on behalf of any Fund shareholders. Moreover, the By-laws also provide for indemnification out of Fund property of any shareholder held personally liable solely by reason of being or having been a shareholder for all loss or expense arising from such liability. Additionally, in the normal course of business, the Fund enters into agreements with service providers that may contain indemnification clauses. The Fund's maximum exposure under these arrangements is unknown as this would involve future claims that may be made against the Fund that have not yet occurred.
G Other—Investment transactions are accounted for on a trade date basis.
Parametric
Tax-Managed International Equity Fund
October 31, 2022
Notes to Financial Statements — continued
2 Distributions to Shareholders and Income Tax Information
It is the present policy of the Fund to make at least one distribution annually (normally in December) of all or substantially all of its net investment income and to distribute annually all or substantially all of its net realized capital gains. Distributions to shareholders are recorded on the ex-dividend date. Distributions are declared separately for each class of shares. Shareholders may reinvest income and capital gain distributions in additional shares of the same class of the Fund at the net asset value as of the ex-dividend date or, at the election of the shareholder, receive distributions in cash. Distributions to shareholders are determined in accordance with income tax regulations, which may differ from U.S. GAAP. As required by U.S. GAAP, only distributions in excess of tax basis earnings and profits are reported in the financial statements as a return of capital. Permanent differences between book and tax accounting relating to distributions are reclassified to paid-in capital. For tax purposes, distributions from short-term capital gains are considered to be from ordinary income.
The tax character of distributions declared for the years ended October 31, 2022 and October 31, 2021 was as follows:
| | Year Ended October 31, |
| | 2022 | 2021 |
| Ordinary income | $837,377 | $413,822 |
During the year ended October 31, 2022, accumulated loss was increased by $105,516 and paid-in capital was increased by $105,516 due to the Fund’s use of equalization accounting. Tax equalization accounting allows the Fund to treat as a distribution that portion of redemption proceeds representing a redeeming shareholder’s portion of undistributed taxable income and net capital gains. These reclassifications had no effect on the net assets or net asset value per share of the Fund.
As of October 31, 2022, the components of distributable earnings (accumulated loss) on a tax basis were as follows:
| Undistributed ordinary income | $ 596,220 |
| Deferred capital losses | (1,415,808) |
| Net unrealized depreciation | (3,447,297) |
| Accumulated loss | $(4,266,885) |
At October 31, 2022, the Fund, for federal income tax purposes, had deferred capital losses of $1,415,808 which would reduce its taxable income arising from future net realized gains on investment transactions, if any, to the extent permitted by the Internal Revenue Code, and thus would reduce the amount of distributions to shareholders, which would otherwise be necessary to relieve the Fund of any liability for federal income or excise tax. The deferred capital losses are treated as arising on the first day of the Fund’s next taxable year and retain the same short-term or long-term character as when originally deferred. Of the deferred capital losses at October 31, 2022, $468,046 are short-term and $947,762 are long-term.
3 Investment Adviser Fee and Other Transactions with Affiliates
The investment adviser fee is earned by Eaton Vance Management (EVM), an indirect, wholly-owned subsidiary of Morgan Stanley, as compensation for investment advisory services rendered to the Fund. The fee is computed at an annual rate as a percentage of the Fund’s average daily net assets that are not invested in other investment companies for which EVM or its affiliates serve as investment adviser and receive an advisory fee as follows and is payable monthly:
| Average Daily Net Assets | Annual Fee Rate |
| Up to $1 billion | 0.500% |
| $1 billion but less than $2.5 billion | 0.475% |
| $2.5 billion but less than $5.0 billion | 0.455% |
| $5 billion and over | 0.440% |
For the year ended October 31, 2022, the Fund incurred no investment adviser fee on such assets. Pursuant to an investment sub-advisory agreement, EVM has delegated the investment management of the Fund to Parametric Portfolio Associates LLC (Parametric), an affiliate of EVM and an indirect, wholly-owned subsidiary of Morgan Stanley. EVM pays Parametric a portion of its investment adviser fee for sub-advisory services provided to the Fund. To
Parametric
Tax-Managed International Equity Fund
October 31, 2022
Notes to Financial Statements — continued
the extent that the Fund’s assets are invested in the Portfolio, the Fund is allocated its share of the Portfolio’s investment adviser fee. The Portfolio has engaged Boston Management and Research (BMR) to render investment advisory services. See Note 2 of the Portfolio’s Notes to Financial Statements which are included elsewhere in this report. EVM also serves as the administrator of the Fund, but receives no compensation.
EVM and Parametric have agreed to reimburse the Fund’s expenses to the extent that total annual operating expenses (relating to ordinary operating expenses only) exceed 1.05%, 1.80% and 0.80% of the Fund’s average daily net assets for Class A, Class C and Class I, respectively. This agreement may be changed or terminated after February 28, 2023. Pursuant to this agreement, EVM and Parametric were allocated $151,087 in total of the Fund’s operating expenses for the year ended October 31, 2022.
EVM provides sub-transfer agency and related services to the Fund pursuant to a Sub-Transfer Agency Support Services Agreement. For the year ended October 31, 2022, EVM earned $21,368 from the Fund pursuant to such agreement, which is included in transfer and dividend disbursing agent fees on the Statement of Operations. The Fund was informed that Eaton Vance Distributors, Inc. (EVD), an affiliate of EVM and the Fund’s principal underwriter, received $3 as its portion of the sales charge on sales of Class A shares for the year ended October 31, 2022. EVD also received distribution and service fees from Class A and Class C shares (see Note 4) and contingent deferred sales charges (see Note 5).
Trustees and officers of the Fund who are members of EVM’s or BMR’s organizations receive remuneration for their services to the Fund out of the investment adviser fee. Certain officers and Trustees of the Fund and the Portfolio are officers of the above organizations.
4 Distribution Plans
The Fund has in effect a distribution plan for Class A shares (Class A Plan) pursuant to Rule 12b-1 under the 1940 Act. Pursuant to the Class A Plan, the Fund pays EVD a distribution and service fee of 0.25% per annum of its average daily net assets attributable to Class A shares for distribution services and facilities provided to the Fund by EVD, as well as for personal services and/or the maintenance of shareholder accounts. Distribution and service fees paid or accrued to EVD for the year ended October 31, 2022 amounted to $47,555 for Class A shares.
The Fund also has in effect a distribution plan for Class C shares (Class C Plan) pursuant to Rule 12b-1 under the 1940 Act. Pursuant to the Class C Plan, the Fund pays EVD amounts equal to 0.75% per annum of its average daily net assets attributable to Class C shares for providing ongoing distribution services and facilities to the Fund. For the year ended October 31, 2022, the Fund paid or accrued to EVD $2,138 for Class C shares.
Pursuant to the Class C Plan, the Fund also makes payments of service fees to EVD, financial intermediaries and other persons in amounts equal to 0.25% per annum of its average daily net assets attributable to that class. Service fees paid or accrued are for personal services and/or the maintenance of shareholder accounts. They are separate and distinct from the sales commissions and distribution fees payable to EVD. Service fees paid or accrued for the year ended October 31, 2022 amounted to $713 for Class C shares.
Distribution and service fees are subject to the limitations contained in the Financial Industry Regulatory Authority Rule 2341(d).
5 Contingent Deferred Sales Charges
A contingent deferred sales charge (CDSC) of 1% generally is imposed on redemptions of Class C shares made within 12 months of purchase. Class A shares may be subject to a 1% CDSC if redeemed within 12 months of purchase (depending on the circumstances of purchase). Redemptions of Class A shares by former Investor Class shareholders are not subject to a CDSC. Generally, the CDSC is based upon the lower of the net asset value at date of redemption or date of purchase. No charge is levied on shares acquired by reinvestment of dividends or capital gain distributions. For the year ended October 31, 2022, the Fund was informed that EVD received approximately $1,000 of CDSCs paid by Class C shareholders and no CDSCs paid by Class A shareholders.
6 Investment Transactions
For the year ended October 31, 2022, increases and decreases in the Fund's investment in the Portfolio aggregated $10,344,047 and $5,214,977, respectively.
Parametric
Tax-Managed International Equity Fund
October 31, 2022
Notes to Financial Statements — continued
7 Shares of Beneficial Interest
The Fund’s Declaration of Trust permits the Trustees to issue an unlimited number of full and fractional shares of beneficial interest (without par value). Such shares may be issued in a number of different series (such as the Fund) and classes. Transactions in Fund shares, including direct exchanges pursuant to share class conversions for all periods presented, were as follows:
| | Year Ended
October 31, 2022 | | Year Ended
October 31, 2021 |
| | Shares | Amount | | Shares | Amount |
| Class A | | | | | |
| Sales | 31,676 | $ 383,229 | | 50,456 | $ 638,019 |
| Issued to shareholders electing to receive payments of distributions in Fund shares | 31,812 | 416,101 | | 17,774 | 216,129 |
| Redemptions | (126,605) | (1,470,906) | | (157,811) | (2,029,240) |
| Net decrease | (63,117) | $ (671,576) | | (89,581) | $(1,175,092) |
| Class C | | | | | |
| Sales | 2,090 | $ 24,376 | | 1,584 | $ 19,419 |
| Issued to shareholders electing to receive payments of distributions in Fund shares | 326 | 4,067 | | — | — |
| Redemptions | (12,818) | (149,489) | | (29,381) | (337,992) |
| Net decrease | (10,402) | $ (121,046) | | (27,797) | $ (318,573) |
| Class I | | | | | |
| Sales | 1,168,258 | $ 13,128,703 | | 282,298 | $ 3,637,343 |
| Issued to shareholders electing to receive payments of distributions in Fund shares | 28,431 | 370,458 | | 14,247 | 172,530 |
| Redemptions | (627,257) | (6,778,363) | | (193,637) | (2,502,966) |
| Net increase | 569,432 | $ 6,720,798 | | 102,908 | $ 1,306,907 |
Parametric
Tax-Managed International Equity Fund
October 31, 2022
Report of Independent Registered Public Accounting Firm
To the Trustees of Eaton Vance Mutual Funds Trust and Shareholders of Parametric Tax-Managed International Equity Fund:
Opinion on the Financial Statements and Financial Highlights
We have audited the accompanying statement of assets and liabilities of Parametric Tax-Managed International Equity Fund (the “Fund”) (one of the funds constituting Eaton Vance Mutual Funds Trust), as of October 31, 2022, the related statement of operations for the year then ended, the statements of changes in net assets for each of the two years in the period then ended, the financial highlights for each of the five years in the period then ended, and the related notes. In our opinion, the financial statements and financial highlights present fairly, in all material respects, the financial position of the Fund as of October 31, 2022, and the results of its operations for the year then ended, the changes in its net assets for each of the two years in the period then ended, and the financial highlights for each of the five years in the period then ended, in conformity with accounting principles generally accepted in the United States of America.
Basis for Opinion
These financial statements and financial highlights are the responsibility of the Fund's management. Our responsibility is to express an opinion on the Fund's financial statements and financial highlights based on our audits. We are a public accounting firm registered with the Public Company Accounting Oversight Board (United States) (PCAOB) and are required to be independent with respect to the Fund in accordance with the U.S. federal securities laws and the applicable rules and regulations of the Securities and Exchange Commission and the PCAOB.
We conducted our audits in accordance with the standards of the PCAOB. Those standards require that we plan and perform the audit to obtain reasonable assurance about whether the financial statements and financial highlights are free of material misstatement, whether due to error or fraud. The Fund is not required to have, nor were we engaged to perform, an audit of its internal control over financial reporting. As part of our audits, we are required to obtain an understanding of internal control over financial reporting but not for the purpose of expressing an opinion on the effectiveness of the Fund’s internal control over financial reporting. Accordingly, we express no such opinion.
Our audits included performing procedures to assess the risks of material misstatement of the financial statements and financial highlights, whether due to error or fraud, and performing procedures that respond to those risks. Such procedures included examining, on a test basis, evidence regarding the amounts and disclosures in the financial statements and financial highlights. Our audits also included evaluating the accounting principles used and significant estimates made by management, as well as evaluating the overall presentation of the financial statements and financial highlights. We believe that our audits provide a reasonable basis for our opinion.
/s/ Deloitte & Touche LLP
Boston, Massachusetts
December 20, 2022
We have served as the auditor of one or more Eaton Vance investment companies since 1959.
Parametric
Tax-Managed International Equity Fund
October 31, 2022
Federal Tax Information (Unaudited)
The Form 1099-DIV you receive in February 2023 will show the tax status of all distributions paid to your account in calendar year 2022. Shareholders are advised to consult their own tax adviser with respect to the tax consequences of their investment in the Fund. As required by the Internal Revenue Code and/or regulations, shareholders must be notified regarding the status of qualified dividend income for individuals and the foreign tax credit.
Qualified Dividend Income. For the fiscal year ended October 31, 2022, the Fund designates approximately $1,035,036, or up to the maximum amount of such dividends allowable pursuant to the Internal Revenue Code, as qualified dividend income eligible for the reduced tax rate of 15%.
Foreign Tax Credit. For the fiscal year ended October 31, 2022, the Fund paid foreign taxes of $141,318 and recognized foreign source income of $1,190,988.
Tax-Managed International Equity Portfolio
October 31, 2022
| Security | Shares | Value |
| Australia — 8.3% |
| AGL Energy, Ltd. | | 18,829 | $ 82,034 |
| Altium, Ltd. | | 2,652 | 59,880 |
| Ampol, Ltd. | | 3,627 | 63,261 |
| Ansell, Ltd. | | 1,409 | 25,437 |
| APA Group | | 24,888 | 167,556 |
| ASX, Ltd.(1) | | 1,525 | 66,076 |
| Aurizon Holdings, Ltd. | | 14,009 | 32,464 |
| Australia and New Zealand Banking Group, Ltd. | | 2,177 | 35,667 |
| BHP Group, Ltd. | | 8,183 | 196,557 |
| Brambles, Ltd. | | 17,422 | 130,434 |
| carsales.com, Ltd.(1) | | 5,155 | 66,777 |
| Charter Hall Long Wale REIT | | 6,388 | 17,812 |
| Charter Hall Retail REIT(1) | | 6,757 | 17,399 |
| Cleanaway Waste Management, Ltd. | | 15,558 | 26,911 |
| Coles Group, Ltd. | | 12,714 | 132,933 |
| Commonwealth Bank of Australia | | 4,049 | 271,472 |
| Cromwell Property Group(1) | | 20,061 | 8,997 |
| CSL, Ltd. | | 2,345 | 419,791 |
| Dexus | | 13,975 | 69,639 |
| Domino's Pizza Enterprises, Ltd.(1) | | 933 | 38,042 |
| Elders, Ltd.(1) | | 3,009 | 25,087 |
| EVT, Ltd.(1)(2) | | 2,551 | 24,355 |
| Goodman Group | | 12,811 | 139,393 |
| GPT Group (The)(1) | | 22,015 | 60,840 |
| GWA Group, Ltd. | | 11,241 | 14,594 |
| Hansen Technologies, Ltd. | | 14,633 | 46,081 |
| Harvey Norman Holdings, Ltd.(1) | | 17,000 | 45,225 |
| IDP Education, Ltd.(1) | | 3,186 | 60,110 |
| IPH, Ltd. | | 4,980 | 31,672 |
| IRESS, Ltd. | | 3,720 | 24,146 |
| JB Hi-Fi, Ltd.(1) | | 1,878 | 51,480 |
| Lendlease Corp., Ltd.(1) | | 9,400 | 52,271 |
| Lottery Corp., Ltd. (The)(2) | | 26,454 | 72,573 |
| Medibank Private, Ltd. | | 16,474 | 29,664 |
| Metcash, Ltd.(1) | | 11,800 | 30,977 |
| Mirvac Group(1) | | 41,842 | 55,439 |
| Newcrest Mining, Ltd. | | 2,354 | 26,071 |
| Nine Entertainment Co. Holdings, Ltd. | | 46,592 | 61,530 |
| Northern Star Resources, Ltd.(1) | | 3,606 | 20,125 |
| Orica, Ltd. | | 4,147 | 36,889 |
| Qube Holdings, Ltd. | | 28,277 | 49,229 |
| REA Group, Ltd.(1) | | 1,183 | 91,689 |
| Reece, Ltd.(1) | | 3,969 | 39,412 |
| Rio Tinto, Ltd. | | 2,262 | 128,368 |
| Security | Shares | Value |
| Australia (continued) |
| Shopping Centres Australasia Property Group | | 20,523 | $ 35,745 |
| Sonic Healthcare, Ltd. | | 2,770 | 57,991 |
| Suncorp Group, Ltd. | | 10,185 | 74,503 |
| Tabcorp Holdings, Ltd.(1) | | 26,454 | 16,332 |
| Technology One, Ltd. | | 10,774 | 82,885 |
| Telstra Group, Ltd.(1) | | 78,759 | 197,483 |
| TPG Telecom, Ltd.(1) | | 20,255 | 63,540 |
| Transurban Group | | 22,607 | 191,774 |
| Washington H. Soul Pattinson & Co., Ltd. | | 6,497 | 116,271 |
| Waypoint REIT, Ltd. | | 9,833 | 17,168 |
| Wesfarmers, Ltd. | | 7,953 | 230,788 |
| Westpac Banking Corp. | | 3,483 | 53,781 |
| Whitehaven Coal, Ltd. | | 17,283 | 100,393 |
| Woodside Energy Group, Ltd. | | 10,133 | 234,259 |
| Woolworths Group, Ltd. | | 14,196 | 299,788 |
| Worley, Ltd.(1) | | 4,927 | 45,004 |
| | | | $ 4,964,064 |
| Austria — 1.1% |
| ams-OSRAM AG(1)(2) | | 3,049 | $ 17,258 |
| ANDRITZ AG | | 1,698 | 78,917 |
| AT&S Austria Technologie & Systemtechnik AG | | 704 | 21,743 |
| BAWAG Group AG(3) | | 822 | 39,683 |
| CA Immobilien Anlagen AG | | 2,850 | 90,015 |
| Erste Group Bank AG | | 2,269 | 55,919 |
| IMMOFINANZ AG | | 1,241 | 0 |
| Kontron AG | | 1,191 | 17,238 |
| Lenzing AG | | 466 | 22,295 |
| Mayr Melnhof Karton AG | | 125 | 17,787 |
| Oesterreichische Post AG | | 768 | 21,852 |
| OMV AG | | 2,018 | 92,916 |
| PIERER Mobility AG(1) | | 420 | 24,368 |
| Telekom Austria AG | | 8,000 | 46,504 |
| Verbund AG | | 1,229 | 96,274 |
| voestalpine AG | | 1,029 | 22,340 |
| | | | $ 665,109 |
| Belgium — 2.2% |
| Ackermans & van Haaren NV | | 831 | $ 115,776 |
| Ageas S.A./NV | | 1,164 | 40,296 |
| Anheuser-Busch InBev S.A./NV | | 2,419 | 120,999 |
| Cofinimmo S.A. | | 488 | 40,473 |
| Deceuninck NV | | 12,470 | 25,381 |
| D'Ieteren Group | | 881 | 146,623 |
| Econocom Group S.A./NV | | 10,730 | 29,162 |
| Elia Group S.A./NV | | 938 | 118,594 |
19
See Notes to Financial Statements.
Tax-Managed International Equity Portfolio
October 31, 2022
Portfolio of Investments — continued
| Security | Shares | Value |
| Belgium (continued) |
| Etablissements Franz Colruyt NV | | 478 | $ 11,522 |
| Euronav NV | | 5,526 | 96,339 |
| EVS Broadcast Equipment S.A. | | 1,740 | 35,562 |
| Fagron | | 1,130 | 14,068 |
| Groupe Bruxelles Lambert NV | | 459 | 33,840 |
| KBC Group NV | | 340 | 17,039 |
| Melexis NV | | 909 | 62,518 |
| Montea NV | | 196 | 13,369 |
| Proximus SADP | | 9,427 | 98,830 |
| Shurgard Self Storage S.A. | | 370 | 16,110 |
| Sofina S.A. | | 150 | 29,250 |
| Solvay S.A. | | 537 | 48,459 |
| UCB S.A. | | 1,600 | 120,588 |
| Umicore S.A. | | 2,338 | 77,074 |
| VGP NV | | 165 | 12,511 |
| | | | $ 1,324,383 |
| Denmark — 4.3% |
| Alm Brand A/S | | 18,202 | $ 24,875 |
| AP Moller - Maersk A/S, Class A | | 34 | 68,023 |
| AP Moller - Maersk A/S, Class B | | 45 | 94,013 |
| Bakkafrost P/F | | 1,540 | 77,027 |
| Carlsberg A/S, Class B | | 2,213 | 260,571 |
| Chr. Hansen Holding A/S | | 2,271 | 126,134 |
| Coloplast A/S, Class B | | 665 | 74,128 |
| DFDS A/S | | 1,410 | 42,818 |
| DSV A/S | | 1,214 | 164,046 |
| Jyske Bank A/S(2) | | 1,046 | 56,452 |
| Netcompany Group A/S(2)(3) | | 1,534 | 52,592 |
| Novo Nordisk A/S, Class B | | 3,847 | 418,289 |
| Novozymes A/S, Class B | | 4,578 | 240,302 |
| Orsted A/S(1)(3) | | 4,338 | 357,910 |
| Pandora A/S | | 2,723 | 143,239 |
| Ringkjoebing Landbobank A/S | | 652 | 70,913 |
| Scandinavian Tobacco Group A/S(3) | | 1,702 | 28,510 |
| SimCorp A/S | | 792 | 47,291 |
| Spar Nord Bank A/S | | 2,029 | 24,566 |
| Sydbank A/S | | 1,310 | 39,890 |
| Topdanmark A/S | | 972 | 44,861 |
| Tryg A/S | | 5,012 | 108,406 |
| | | | $ 2,564,856 |
| Finland — 2.2% |
| Elisa Oyj | | 2,351 | $ 113,615 |
| Fortum Oyj | | 7,644 | 107,584 |
| Kemira Oyj | | 2,727 | 36,008 |
| Security | Shares | Value |
| Finland (continued) |
| Kesko Oyj, Class B | | 4,942 | $ 96,175 |
| Kojamo Oyj(1) | | 3,939 | 51,265 |
| Kone Oyj, Class B | | 1,969 | 80,622 |
| Neste Oyj | | 2,521 | 110,492 |
| Nokia Oyj | | 23,544 | 104,628 |
| Nokian Renkaat Oyj | | 5,452 | 61,481 |
| Nordea Bank Abp | | 13,924 | 133,009 |
| Orion Oyj, Class B | | 3,636 | 167,322 |
| TietoEVRY Oyj(1) | | 956 | 22,790 |
| Tokmanni Group Corp. | | 7,427 | 89,801 |
| UPM-Kymmene Oyj | | 3,680 | 123,712 |
| Valmet Oyj | | 1,377 | 31,317 |
| | | | $ 1,329,821 |
| France — 8.8% |
| Air Liquide S.A. | | 4,518 | $ 591,016 |
| Altarea SCA | | 326 | 43,427 |
| Amundi S.A.(3) | | 792 | 37,366 |
| Atos SE(1)(2) | | 2,719 | 26,533 |
| AXA S.A. | | 8,332 | 205,758 |
| BNP Paribas S.A. | | 1,617 | 75,827 |
| Bollore SE | | 13,714 | 68,591 |
| Bouygues S.A. | | 1,100 | 31,384 |
| Carrefour S.A. | | 5,094 | 81,990 |
| Cie Generale des Etablissements Michelin SCA | | 2,492 | 63,506 |
| Credit Agricole S.A. | | 7,839 | 71,128 |
| Danone S.A. | | 2,980 | 148,104 |
| Dassault Systemes SE | | 7,700 | 258,095 |
| Edenred | | 1,747 | 89,562 |
| Engie S.A. | | 23,380 | 303,785 |
| EssilorLuxottica S.A. | | 1,642 | 259,646 |
| Eurazeo SE | | 634 | 36,179 |
| Gecina S.A. | | 1,055 | 94,058 |
| Getlink SE | | 2,197 | 34,766 |
| Hermes International | | 100 | 129,439 |
| ICADE | | 1,083 | 40,286 |
| Klepierre S.A. | | 4,222 | 84,855 |
| Legrand S.A. | | 560 | 42,675 |
| LVMH Moet Hennessy Louis Vuitton SE | | 650 | 410,147 |
| Neoen S.A.(1)(3) | | 1,189 | 41,472 |
| Orange S.A. | | 25,469 | 242,666 |
| Pernod Ricard S.A.(1) | | 786 | 137,952 |
| Remy Cointreau S.A. | | 343 | 52,458 |
| Rothschild & Co. | | 845 | 29,967 |
| Rubis SCA | | 2,794 | 63,450 |
| Sanofi | | 3,896 | 335,281 |
20
See Notes to Financial Statements.
Tax-Managed International Equity Portfolio
October 31, 2022
Portfolio of Investments — continued
| Security | Shares | Value |
| France (continued) |
| Schneider Electric SE | | 857 | $ 108,373 |
| SOITEC (2) | | 493 | 63,126 |
| Technip Energies NV | | 3,214 | 41,489 |
| Teleperformance | | 177 | 47,424 |
| Thales S.A. | | 600 | 76,308 |
| TotalEnergies SE | | 9,935 | 541,988 |
| Ubisoft Entertainment S.A.(2) | | 1,529 | 41,950 |
| Vinci S.A. | | 1,159 | 106,671 |
| Vivendi SE | | 3,744 | 30,645 |
| Wendel SE | | 356 | 27,875 |
| | | | $ 5,217,218 |
| Germany — 8.7% |
| 7C Solarparken AG | | 20,398 | $ 88,681 |
| adidas AG | | 673 | 65,695 |
| AIXTRON SE | | 763 | 18,750 |
| Allianz SE | | 1,213 | 218,224 |
| BASF SE | | 4,755 | 213,360 |
| Bayer AG | | 4,117 | 216,476 |
| Bayerische Motoren Werke AG | | 1,291 | 101,333 |
| Bechtle AG | | 893 | 30,850 |
| Beiersdorf AG | | 2,655 | 254,867 |
| Brenntag SE | | 725 | 43,990 |
| Covestro AG(3) | | 1,046 | 35,508 |
| Cropenergies AG | | 2,253 | 35,906 |
| Daimler Truck Holding AG(2) | | 1,859 | 49,584 |
| Delivery Hero SE(2)(3) | | 1,222 | 40,215 |
| Deutsche Bank AG | | 6,495 | 61,909 |
| Deutsche Boerse AG | | 659 | 107,166 |
| Deutsche Lufthansa AG(2) | | 5,121 | 35,012 |
| Deutsche Post AG | | 3,011 | 106,438 |
| Deutsche Telekom AG | | 23,227 | 438,421 |
| Deutsche Wohnen SE | | 2,636 | 53,169 |
| E.ON SE | | 52,993 | 443,763 |
| Evonik Industries AG | | 3,498 | 64,439 |
| Gea Group AG | | 1,075 | 37,576 |
| Hamborner REIT AG | | 13,027 | 92,935 |
| Hannover Rueck SE | | 220 | 35,799 |
| HelloFresh SE(2) | | 2,469 | 49,353 |
| Henkel AG & Co. KGaA, PFC Shares | | 1,138 | 71,692 |
| K+S AG | | 3,195 | 70,542 |
| Merck KGaA | | 792 | 129,068 |
| Muenchener Rueckversicherungs-Gesellschaft AG | | 361 | 95,295 |
| Nemetschek SE | | 733 | 34,947 |
| Puma SE | | 927 | 40,984 |
| QIAGEN NV(2) | | 1,735 | 74,923 |
| Security | Shares | Value |
| Germany (continued) |
| Rheinmetall AG | | 216 | $ 35,111 |
| SAP SE | | 3,984 | 383,471 |
| Sartorius AG, PFC Shares | | 95 | 33,496 |
| Siemens AG | | 1,867 | 203,893 |
| Siemens Healthineers AG(3) | | 1,428 | 65,420 |
| Software AG | | 2,115 | 46,270 |
| Suedzucker AG | | 11,715 | 149,295 |
| Symrise AG | | 1,413 | 144,229 |
| Telefonica Deutschland Holding AG | | 31,010 | 67,568 |
| United Internet AG | | 2,526 | 47,219 |
| Vitesco Technologies Group AG(2) | | 915 | 48,960 |
| Volkswagen AG | | 307 | 52,476 |
| Volkswagen AG, PFC Shares | | 790 | 101,121 |
| Vonovia SE | | 14,528 | 321,223 |
| Zalando SE(2)(3) | | 1,079 | 24,869 |
| | | | $ 5,181,491 |
| Hong Kong — 4.3% |
| AIA Group, Ltd. | | 34,200 | $ 259,058 |
| Bank of East Asia, Ltd. (The) | | 28,200 | 27,026 |
| Beijing Tong Ren Tang Chinese Medicine Co., Ltd.(1) | | 21,000 | 23,480 |
| BOC Hong Kong Holdings, Ltd. | | 20,000 | 62,146 |
| Budweiser Brewing Co. APAC, Ltd.(3) | | 73,300 | 154,276 |
| Cafe de Coral Holdings, Ltd. | | 22,000 | 25,675 |
| China Evergrande New Energy Vehicle Group, Ltd.(2)(4) | | 88,500 | 0 |
| China Ruyi Holdings, Ltd.(2) | | 112,000 | 17,568 |
| China Traditional Chinese Medicine Holdings Co., Ltd. | | 60,000 | 25,935 |
| Chow Tai Fook Jewellery Group, Ltd. | | 43,000 | 73,619 |
| CK Asset Holdings, Ltd. | | 13,000 | 71,871 |
| CK Hutchison Holdings, Ltd. | | 25,000 | 124,446 |
| CLP Holdings, Ltd. | | 19,500 | 130,880 |
| Fosun International, Ltd. | | 54,000 | 33,000 |
| Galaxy Entertainment Group, Ltd. | | 34,000 | 155,334 |
| Hang Seng Bank, Ltd. | | 3,700 | 52,088 |
| Henderson Land Development Co., Ltd. | | 17,260 | 42,257 |
| HK Electric Investments & HK Electric Investments, Ltd. | | 64,500 | 41,010 |
| HKT Trust and HKT, Ltd. | | 121,000 | 136,844 |
| Hong Kong & China Gas Co., Ltd. | | 147,906 | 114,001 |
| Hysan Development Co., Ltd. | | 5,000 | 10,898 |
| Jardine Matheson Holdings, Ltd. | | 2,200 | 101,350 |
| Kerry Properties, Ltd. | | 10,000 | 15,819 |
| Link REIT | | 12,000 | 70,927 |
| Luk Fook Holdings International, Ltd. | | 15,000 | 32,586 |
| MTR Corp., Ltd. | | 17,000 | 74,803 |
| New World Development Co., Ltd. | | 11,000 | 22,500 |
| NWS Holdings, Ltd. | | 51,000 | 36,167 |
21
See Notes to Financial Statements.
Tax-Managed International Equity Portfolio
October 31, 2022
Portfolio of Investments — continued
| Security | Shares | Value |
| Hong Kong (continued) |
| Pacific Basin Shipping, Ltd. | | 119,000 | $ 28,810 |
| PAX Global Technology, Ltd. | | 75,000 | 58,944 |
| PCCW, Ltd. | | 115,000 | 43,936 |
| Power Assets Holdings, Ltd. | | 22,000 | 105,194 |
| Sands China, Ltd.(2) | | 34,800 | 60,838 |
| Shangri-La Asia, Ltd.(2) | | 48,000 | 26,559 |
| Sino Land Co., Ltd.(1) | | 32,000 | 34,170 |
| SJM Holdings, Ltd.(1)(2) | | 94,000 | 29,333 |
| Sun Hung Kai Properties, Ltd. | | 8,000 | 85,971 |
| Swire Properties, Ltd. | | 17,200 | 33,057 |
| VSTECS Holdings, Ltd. | | 60,000 | 28,849 |
| VTech Holdings, Ltd. | | 10,000 | 53,232 |
| Zhongyu Energy Holdings, Ltd. | | 36,000 | 26,792 |
| | | | $ 2,551,249 |
| Ireland — 2.2% |
| Bank of Ireland Group PLC | | 31,887 | $ 229,606 |
| CRH PLC | | 6,065 | 218,448 |
| DCC PLC | | 1,417 | 78,645 |
| Flutter Entertainment PLC(2) | | 1,544 | 203,915 |
| ICON PLC(2) | | 1,080 | 213,667 |
| Irish Residential Properties REIT PLC | | 42,500 | 45,952 |
| Kerry Group PLC, Class A | | 2,357 | 204,717 |
| Kingspan Group PLC | | 2,396 | 120,798 |
| | | | $ 1,315,748 |
| Israel — 2.2% |
| Amot Investments, Ltd. | | 5,499 | $ 33,265 |
| Azrieli Group, Ltd. | | 509 | 37,709 |
| Bank Hapoalim B.M. | | 4,902 | 47,252 |
| Bank Leumi Le-Israel B.M. | | 4,425 | 42,213 |
| Bezeq The Israeli Telecommunication Corp., Ltd. | | 74,540 | 131,953 |
| Check Point Software Technologies, Ltd.(2) | | 385 | 49,754 |
| Elbit Systems, Ltd. | | 297 | 60,094 |
| Electra, Ltd. | | 76 | 44,221 |
| Energix-Renewable Energies, Ltd. | | 13,304 | 46,447 |
| Fiverr International, Ltd.(2) | | 353 | 10,925 |
| Fox Wizel, Ltd. | | 369 | 44,985 |
| ICL Group, Ltd. | | 12,708 | 114,596 |
| Kenon Holdings, Ltd. | | 1,599 | 61,260 |
| Maytronics, Ltd. | | 4,367 | 47,087 |
| Mizrahi Tefahot Bank, Ltd. | | 781 | 29,523 |
| Nice, Ltd.(2) | | 490 | 92,350 |
| Oil Refineries, Ltd. | | 76,583 | 28,521 |
| OPC Energy, Ltd.(2) | | 1,911 | 23,496 |
| Paz Oil Co., Ltd.(2) | | 650 | 77,651 |
| Security | Shares | Value |
| Israel (continued) |
| Reit 1, Ltd. | | 7,407 | $ 38,864 |
| Shufersal, Ltd. | | 11,960 | 81,645 |
| Strauss Group, Ltd. | | 1,358 | 33,974 |
| Teva Pharmaceutical Industries, Ltd. ADR(2) | | 13,432 | 119,813 |
| ZIM Integrated Shipping Services, Ltd.(1) | | 400 | 9,396 |
| | | | $ 1,306,994 |
| Italy — 4.4% |
| Assicurazioni Generali SpA | | 4,184 | $ 62,790 |
| Atlantia SpA | | 6,270 | 139,868 |
| Banco BPM SpA | | 12,713 | 38,463 |
| Brunello Cucinelli SpA | | 1,252 | 72,573 |
| Cementir Holding NV | | 6,913 | 40,236 |
| Davide Campari-Milano NV | | 18,866 | 169,423 |
| De'Longhi SpA | | 1,200 | 20,705 |
| DiaSorin SpA | | 977 | 127,729 |
| Enel SpA | | 40,123 | 179,243 |
| Eni SpA | | 20,895 | 274,429 |
| Ferrari NV | | 793 | 156,331 |
| FinecoBank Banca Fineco SpA | | 1,887 | 25,428 |
| GVS SpA(2)(3) | | 4,062 | 20,840 |
| Infrastrutture Wireless Italiane SpA(3) | | 21,493 | 189,701 |
| Interpump Group SpA | | 778 | 30,121 |
| Intesa Sanpaolo SpA | | 70,463 | 134,340 |
| Italgas SpA | | 7,381 | 38,029 |
| Italmobiliare SpA | | 1,360 | 34,766 |
| Iveco Group NV(2) | | 3,449 | 18,637 |
| MFE-MediaForEurope NV, Class B | | 9,790 | 4,890 |
| Moncler SpA | | 627 | 27,051 |
| Poste Italiane SpA(3) | | 5,564 | 48,486 |
| Prysmian SpA | | 2,617 | 85,178 |
| RAI Way SpA(3) | | 4,122 | 19,746 |
| Recordati Industria Chimica e Farmaceutica SpA | | 4,029 | 151,376 |
| Reply SpA | | 996 | 108,338 |
| Saipem SpA (1)(2) | | 540 | 525 |
| Salvatore Ferragamo SpA(1) | | 2,265 | 33,293 |
| Saras SpA(2) | | 14,538 | 17,571 |
| STMicroelectronics NV(1) | | 7,572 | 235,462 |
| Technogym SpA(3) | | 2,741 | 18,844 |
| Terna - Rete Elettrica Nazionale | | 8,968 | 59,473 |
| UnipolSai Assicurazioni SpA | | 10,716 | 24,162 |
| | | | $ 2,608,047 |
| Japan — 13.1% |
| Advance Residence Investment Corp. | | 13 | $ 30,266 |
| Air Water, Inc. | | 2,000 | 22,330 |
22
See Notes to Financial Statements.
Tax-Managed International Equity Portfolio
October 31, 2022
Portfolio of Investments — continued
| Security | Shares | Value |
| Japan (continued) |
| Ajinomoto Co., Inc. | | 1,400 | $ 38,504 |
| ANA Holdings, Inc.(2) | | 1,100 | 21,383 |
| Asahi Intecc Co., Ltd. | | 3,900 | 66,437 |
| Asahi Kasei Corp. | | 8,100 | 51,936 |
| Astellas Pharma, Inc. | | 6,200 | 85,549 |
| Bandai Namco Holdings, Inc. | | 800 | 52,882 |
| Bank of Kyoto, Ltd. (The) | | 500 | 18,018 |
| Bridgestone Corp. | | 1,600 | 57,866 |
| Canon, Inc. | | 1,500 | 31,796 |
| Central Japan Railway Co. | | 200 | 23,155 |
| Chiba Bank, Ltd. (The) | | 7,000 | 38,354 |
| Chubu Electric Power Co., Inc. | | 3,500 | 28,490 |
| Chugai Pharmaceutical Co., Ltd. | | 2,700 | 62,564 |
| Chugoku Electric Power Co., Inc. (The) | | 3,800 | 17,828 |
| Concordia Financial Group, Ltd. | | 10,800 | 32,953 |
| CyberAgent, Inc. | | 3,200 | 26,289 |
| Daiichi Sankyo Co., Ltd. | | 3,800 | 121,641 |
| Daikin Industries, Ltd. | | 500 | 74,894 |
| Daito Trust Construction Co., Ltd. | | 500 | 49,512 |
| Daiwa House Industry Co., Ltd. | | 3,500 | 70,516 |
| Daiwa House REIT Investment Corp. | | 23 | 46,421 |
| Daiwa Securities Group, Inc. | | 7,000 | 27,312 |
| Disco Corp. | | 200 | 47,836 |
| ENEOS Holdings, Inc. | | 41,800 | 137,884 |
| FANUC Corp. | | 200 | 26,170 |
| Frontier Real Estate Investment Corp. | | 8 | 28,244 |
| FUJIFILM Holdings Corp. | | 500 | 22,875 |
| Fujitsu, Ltd. | | 300 | 34,518 |
| GLP J-REIT | | 41 | 42,520 |
| Hirose Electric Co., Ltd. | | 315 | 40,862 |
| Hitachi, Ltd. | | 1,300 | 58,986 |
| Honda Motor Co., Ltd. | | 3,100 | 70,688 |
| Hoya Corp. | | 1,300 | 120,850 |
| Hulic Co., Ltd. | | 4,000 | 29,057 |
| Idemitsu Kosan Co., Ltd. | | 3,700 | 80,957 |
| Industrial & Infrastructure Fund Investment Corp. | | 21 | 22,179 |
| ITOCHU Corp. | | 1,500 | 38,767 |
| Iwatani Corp. | | 1,800 | 66,279 |
| Japan Exchange Group, Inc. | | 2,100 | 27,598 |
| Japan Post Bank Co., Ltd. | | 2,300 | 15,325 |
| Japan Post Holdings Co., Ltd.(1) | | 2,800 | 18,829 |
| Japan Real Estate Investment Corp. | | 11 | 46,093 |
| Japan Tobacco, Inc. | | 5,900 | 98,810 |
| JSR Corp. | | 1,500 | 28,502 |
| Kakaku.com, Inc. | | 1,900 | 32,135 |
| Kao Corp. | | 1,000 | 37,352 |
| Security | Shares | Value |
| Japan (continued) |
| KDDI Corp. | | 6,400 | $ 189,165 |
| Kenedix Office Investment Corp. | | 12 | 27,336 |
| Keyence Corp. | | 400 | 150,826 |
| Kintetsu Group Holdings Co., Ltd. | | 800 | 27,036 |
| Kirin Holdings Co., Ltd. | | 3,800 | 55,860 |
| Kobe Bussan Co., Ltd.(1) | | 1,400 | 30,367 |
| Komatsu, Ltd. | | 2,200 | 43,098 |
| Kubota Corp. | | 2,500 | 34,874 |
| Kuraray Co., Ltd. | | 4,800 | 33,007 |
| Kyocera Corp. | | 900 | 43,584 |
| Kyowa Kirin Co., Ltd. | | 2,700 | 63,590 |
| Kyushu Electric Power Co., Inc. | | 3,600 | 17,824 |
| Lion Corp. | | 5,400 | 54,576 |
| Marubeni Corp. | | 7,000 | 61,277 |
| Maruichi Steel Tube, Ltd. | | 1,200 | 22,651 |
| MatsukiyoCocokara & Co. | | 900 | 32,768 |
| Mitsubishi Chemical Group Corp. | | 10,000 | 45,173 |
| Mitsubishi Corp. | | 2,200 | 59,596 |
| Mitsubishi Electric Corp. | | 2,600 | 22,876 |
| Mitsubishi Estate Co., Ltd. | | 7,600 | 95,572 |
| Mitsubishi Gas Chemical Co., Inc. | | 2,900 | 36,851 |
| Mitsubishi UFJ Financial Group, Inc.(1)(5) | | 28,900 | 136,519 |
| Mitsui & Co., Ltd. | | 1,400 | 30,981 |
| Mitsui Chemicals, Inc. | | 1,300 | 24,062 |
| Mitsui Fudosan Co., Ltd. | | 5,100 | 97,657 |
| Mizuho Financial Group, Inc. | | 8,230 | 89,011 |
| MS&AD Insurance Group Holdings, Inc. | | 1,800 | 47,666 |
| Murata Manufacturing Co., Ltd. | | 1,500 | 71,009 |
| NEC Corp. | | 1,500 | 49,651 |
| Nexon Co., Ltd. | | 3,000 | 50,203 |
| Nintendo Co., Ltd. | | 4,000 | 162,396 |
| Nippon Accommodations Fund, Inc. | | 8 | 34,067 |
| Nippon Building Fund, Inc. | | 11 | 48,898 |
| Nippon Gas Co., Ltd. | | 4,300 | 62,466 |
| Nippon Paint Holdings Co., Ltd. | | 10,100 | 64,367 |
| Nippon Prologis REIT, Inc.(1) | | 23 | 48,261 |
| Nippon Shokubai Co., Ltd. | | 600 | 21,522 |
| Nippon Telegraph & Telephone Corp. | | 5,000 | 137,903 |
| Nissan Motor Co., Ltd. | | 10,300 | 32,829 |
| Nisshin Seifun Group, Inc. | | 4,900 | 52,947 |
| Nissin Foods Holdings Co., Ltd. | | 700 | 45,310 |
| Nitto Denko Corp. | | 700 | 36,880 |
| NOF Corp. | | 800 | 27,517 |
| Nomura Holdings, Inc. | | 10,500 | 33,978 |
| Nomura Research Institute, Ltd. | | 2,000 | 44,260 |
| NTT Data Corp. | | 4,400 | 63,729 |
23
See Notes to Financial Statements.
Tax-Managed International Equity Portfolio
October 31, 2022
Portfolio of Investments — continued
| Security | Shares | Value |
| Japan (continued) |
| Obic Co., Ltd. | | 300 | $ 45,019 |
| Oji Holdings Corp. | | 5,000 | 17,334 |
| Omron Corp. | | 800 | 37,311 |
| Ono Pharmaceutical Co., Ltd. | | 2,500 | 58,834 |
| Oriental Land Co., Ltd. | | 500 | 66,964 |
| Osaka Gas Co., Ltd. | | 5,500 | 81,442 |
| Otsuka Holdings Co., Ltd. | | 2,400 | 76,931 |
| Pan Pacific International Holdings Corp. | | 2,000 | 32,821 |
| PeptiDream, Inc.(2) | | 1,400 | 15,316 |
| Resona Holdings, Inc. | | 12,400 | 46,735 |
| Rinnai Corp. | | 600 | 40,839 |
| ROHM Co., Ltd. | | 200 | 14,053 |
| Rohto Pharmaceutical Co., Ltd. | | 1,800 | 55,994 |
| SECOM Co., Ltd. | | 600 | 34,182 |
| Sekisui House, Ltd. | | 2,000 | 33,206 |
| Seven & i Holdings Co., Ltd.(1) | | 1,800 | 67,191 |
| Shikoku Electric Power Co., Inc. | | 2,600 | 12,508 |
| Shimadzu Corp. | | 1,200 | 31,611 |
| Shimano, Inc. | | 300 | 46,423 |
| Shin-Etsu Chemical Co., Ltd. | | 1,600 | 166,288 |
| Shizuoka Financial Group, Inc. | | 5,800 | 36,626 |
| Showa Denko K.K. | | 1,600 | 23,358 |
| SMC Corp. | | 100 | 40,140 |
| SoftBank Corp. | | 11,800 | 116,400 |
| Sony Group Corp. | | 1,600 | 107,895 |
| Square Enix Holdings Co., Ltd. | | 700 | 31,235 |
| Subaru Corp. | | 2,400 | 37,514 |
| Sumitomo Chemical Co., Ltd. | | 10,900 | 36,703 |
| Sumitomo Corp. | | 1,600 | 20,342 |
| Sumitomo Mitsui Financial Group, Inc. | | 3,800 | 106,710 |
| Sumitomo Mitsui Trust Holdings, Inc. | | 1,500 | 43,154 |
| Sumitomo Realty & Development Co., Ltd. | | 2,600 | 59,628 |
| Suntory Beverage & Food, Ltd. | | 900 | 30,111 |
| Sysmex Corp. | | 500 | 26,912 |
| Takeda Pharmaceutical Co., Ltd. | | 5,000 | 132,045 |
| TDK Corp. | | 1,000 | 31,238 |
| TEIJIN, Ltd. | | 3,300 | 29,961 |
| Toho Co., Ltd. | | 500 | 17,779 |
| Tohoku Electric Power Co., Inc. | | 12,500 | 52,505 |
| Tokio Marine Holdings, Inc. | | 6,000 | 108,631 |
| Tokyo Gas Co., Ltd. | | 5,200 | 92,932 |
| Tokyu Corp.(1) | | 2,000 | 23,061 |
| Toppan, Inc. | | 2,000 | 29,828 |
| Toshiba Corp. | | 1,800 | 62,463 |
| Tosoh Corp. | | 2,200 | 23,935 |
| Toyo Suisan Kaisha, Ltd. | | 1,000 | 37,517 |
| Security | Shares | Value |
| Japan (continued) |
| Toyota Industries Corp. | | 400 | $ 20,606 |
| Toyota Motor Corp. | | 16,000 | 221,994 |
| Trend Micro, Inc. | | 600 | 30,254 |
| Unicharm Corp. | | 2,200 | 66,861 |
| Yakult Honsha Co., Ltd.(1) | | 1,400 | 77,558 |
| Yamato Holdings Co., Ltd. | | 2,000 | 29,619 |
| Yamato Kogyo Co., Ltd. | | 1,000 | 29,040 |
| Yamazaki Baking Co., Ltd. | | 3,800 | 38,719 |
| Z Holdings Corp. | | 11,200 | 28,904 |
| | | | $ 7,815,388 |
| Netherlands — 4.4% |
| ABN AMRO Bank NV(3) | | 2,263 | $ 22,247 |
| Aegon NV | | 12,248 | 56,698 |
| ASML Holding NV(1) | | 768 | 360,259 |
| ASR Nederland NV | | 1,620 | 71,333 |
| Corbion NV(1) | | 2,072 | 55,176 |
| Euronext NV(3) | | 576 | 36,558 |
| Flow Traders NV(3) | | 619 | 14,894 |
| IMCD NV(1) | | 840 | 108,943 |
| ING Groep NV | | 3,977 | 39,132 |
| JDE Peet's NV | | 1,640 | 46,945 |
| Just Eat Takeaway.com NV(2)(3) | | 2,956 | 50,725 |
| Koninklijke Ahold Delhaize NV(1) | | 9,251 | 257,994 |
| Koninklijke DSM NV | | 1,929 | 226,909 |
| Koninklijke KPN NV | | 80,454 | 225,038 |
| Koninklijke Philips NV | | 18,081 | 229,355 |
| Koninklijke Vopak NV | | 771 | 15,753 |
| NN Group NV | | 1,992 | 84,346 |
| NSI NV | | 1,000 | 23,910 |
| Prosus NV | | 5,634 | 243,624 |
| SBM Offshore NV | | 4,496 | 60,846 |
| Signify NV(3) | | 1,727 | 47,847 |
| Universal Music Group NV(1) | | 7,168 | 140,747 |
| Wolters Kluwer NV | | 2,003 | 212,836 |
| | | | $ 2,632,115 |
| New Zealand — 1.1% |
| a2 Milk Co., Ltd. (The)(1)(2) | | 21,613 | $ 72,811 |
| Auckland International Airport, Ltd.(2) | | 12,240 | 54,718 |
| Contact Energy, Ltd. | | 9,580 | 42,022 |
| Fisher & Paykel Healthcare Corp., Ltd. | | 5,931 | 67,406 |
| Fletcher Building, Ltd. | | 7,381 | 22,039 |
| Goodman Property Trust | | 27,739 | 33,358 |
| Heartland Group Holdings, Ltd.(1) | | 19,544 | 19,414 |
| KMD Brands, Ltd. | | 27,332 | 17,159 |
24
See Notes to Financial Statements.
Tax-Managed International Equity Portfolio
October 31, 2022
Portfolio of Investments — continued
| Security | Shares | Value |
| New Zealand (continued) |
| Mercury NZ, Ltd. | | 13,643 | $ 46,131 |
| Pacific Edge, Ltd.(2) | | 33,981 | 8,490 |
| Precinct Properties New Zealand, Ltd. | | 39,851 | 28,589 |
| Pushpay Holdings, Ltd.(2) | | 16,676 | 12,096 |
| SKYCITY Entertainment Group, Ltd.(2) | | 40,446 | 68,190 |
| Spark New Zealand, Ltd. | | 29,667 | 88,312 |
| Vulcan Steel, Ltd.(1) | | 3,600 | 17,275 |
| Xero, Ltd.(2) | | 1,231 | 61,130 |
| | | | $ 659,140 |
| Norway — 2.2% |
| ArcticZymes Technologies ASA(1)(2) | | 4,268 | $ 27,498 |
| Atea ASA | | 6,274 | 69,814 |
| Autostore Holdings, Ltd.(1)(2)(3) | | 13,450 | 25,419 |
| Borregaard ASA | | 2,485 | 33,412 |
| DNB Bank ASA | | 6,189 | 109,464 |
| Entra ASA(3) | | 6,540 | 59,612 |
| Equinor ASA | | 3,918 | 142,747 |
| Europris ASA(3) | | 9,810 | 58,410 |
| Gjensidige Forsikring ASA | | 1,701 | 31,092 |
| Kongsberg Gruppen ASA | | 1,873 | 67,167 |
| Mowi ASA | | 4,027 | 60,106 |
| Nordic Semiconductor ASA(2) | | 4,420 | 62,398 |
| Norsk Hydro ASA | | 6,598 | 41,873 |
| Opera, Ltd. ADR(1)(2) | | 6,200 | 29,574 |
| Orkla ASA | | 8,207 | 55,358 |
| Salmar ASA | | 643 | 21,799 |
| Scatec ASA(3) | | 3,300 | 23,376 |
| Schibsted ASA, Class B | | 2,498 | 37,138 |
| SFL Corp, Ltd. | | 2,400 | 24,480 |
| SpareBank 1 SMN | | 2,095 | 22,614 |
| Telenor ASA | | 14,322 | 130,156 |
| TOMRA Systems ASA(1) | | 2,450 | 39,571 |
| Veidekke ASA | | 3,671 | 30,534 |
| Yara International ASA | | 2,459 | 109,749 |
| | | | $ 1,313,361 |
| Portugal — 1.1% |
| Banco Comercial Portugues S.A. | | 634,436 | $ 90,391 |
| Corticeira Amorim SGPS S.A. | | 4,721 | 45,619 |
| CTT-Correios de Portugal S.A. | | 12,855 | 39,680 |
| EDP-Energias de Portugal S.A. | | 19,728 | 86,198 |
| Galp Energia SGPS S.A., Class B | | 11,338 | 115,116 |
| Jeronimo Martins SGPS S.A. | | 5,858 | 121,220 |
| Navigator Co. S.A. (The) | | 16,287 | 62,051 |
| Security | Shares | Value |
| Portugal (continued) |
| NOS SGPS S.A. | | 17,214 | $ 67,423 |
| REN - Redes Energeticas Nacionais SGPS S.A. | | 11,590 | 29,997 |
| | | | $ 657,695 |
| Singapore — 2.2% |
| CapitaLand Ascendas REIT | | 23,500 | $ 43,480 |
| CapitaLand Investment, Ltd. | | 11,500 | 24,456 |
| ComfortDelGro Corp., Ltd. | | 36,500 | 32,766 |
| Flex, Ltd.(2) | | 7,557 | 147,966 |
| Genting Singapore, Ltd. | | 108,600 | 61,758 |
| Keppel Corp., Ltd. | | 8,600 | 42,329 |
| Keppel Infrastructure Trust | | 106,657 | 39,911 |
| Mapletree Industrial Trust | | 18,060 | 28,082 |
| Mapletree Logistics Trust(1) | | 30,900 | 33,164 |
| Mapletree Pan Asia Commercial Trust | | 18,500 | 20,761 |
| Olam Group, Ltd. | | 33,100 | 31,337 |
| Oversea-Chinese Banking Corp., Ltd. | | 10,000 | 85,841 |
| Raffles Medical Group, Ltd. | | 38,400 | 36,079 |
| Sea, Ltd. ADR(2) | | 965 | 47,941 |
| Sembcorp Industries, Ltd. | | 21,400 | 43,991 |
| Singapore Airlines, Ltd.(1)(2) | | 14,800 | 54,898 |
| Singapore Exchange, Ltd. | | 7,000 | 41,626 |
| Singapore Post, Ltd. | | 26,100 | 9,966 |
| Singapore Technologies Engineering, Ltd. | | 19,500 | 45,461 |
| Singapore Telecommunications, Ltd. | | 42,000 | 73,951 |
| Suntec Real Estate Investment Trust | | 27,000 | 24,624 |
| United Overseas Bank, Ltd. | | 4,500 | 88,285 |
| UOL Group, Ltd. | | 4,600 | 20,092 |
| Venture Corp., Ltd. | | 5,000 | 56,267 |
| Wilmar International, Ltd. | | 58,400 | 159,990 |
| | | | $ 1,295,022 |
| Spain — 4.4% |
| Acerinox S.A. | | 6,807 | $ 59,657 |
| Aena SME S.A.(2)(3) | | 1,064 | 125,053 |
| Almirall S.A. | | 2,741 | 25,539 |
| Amadeus IT Group S.A.(2) | | 5,033 | 262,497 |
| Banco Santander S.A.(1) | | 70,803 | 183,626 |
| Bankinter S.A.(1) | | 12,265 | 74,191 |
| CaixaBank S.A. | | 15,438 | 51,193 |
| Cellnex Telecom S.A.(3) | | 4,799 | 157,072 |
| Cia de Distribucion Integral Logista Holdings S.A. | | 2,665 | 55,116 |
| Ebro Foods S.A.(1) | | 2,380 | 37,112 |
| Ercros S.A. | | 8,525 | 27,369 |
| Fluidra S.A.(1) | | 2,164 | 29,389 |
| Grifols S.A.(1)(2) | | 11,886 | 101,121 |
25
See Notes to Financial Statements.
Tax-Managed International Equity Portfolio
October 31, 2022
Portfolio of Investments — continued
| Security | Shares | Value |
| Spain (continued) |
| Iberdrola S.A. | | 28,912 | $ 294,014 |
| Indra Sistemas S.A. | | 3,340 | 29,872 |
| Industria de Diseno Textil S.A.(1) | | 13,126 | 297,937 |
| Laboratorios Farmaceuticos Rovi S.A. | | 1,773 | 80,640 |
| Merlin Properties Socimi S.A. | | 18,476 | 156,613 |
| Metrovacesa S.A.(1)(3) | | 2,645 | 18,713 |
| Red Electrica Corp. S.A. | | 2,456 | 39,728 |
| Repsol S.A. | | 23,523 | 320,018 |
| Siemens Gamesa Renewable Energy S.A.(2) | | 3,287 | 58,274 |
| Telefonica S.A. | | 22,919 | 79,006 |
| Viscofan S.A. | | 825 | 49,126 |
| | | | $ 2,612,876 |
| Sweden — 4.4% |
| AddLife AB, Class B | | 2,191 | $ 20,482 |
| Alfa Laval AB | | 2,000 | 49,231 |
| Arjo AB, Class B | | 8,801 | 35,107 |
| Assa Abloy AB, Class B | | 2,883 | 58,214 |
| Atlas Copco AB, Class A(1) | | 6,514 | 69,525 |
| Axfood AB | | 2,975 | 73,657 |
| Billerud AB | | 2,548 | 32,894 |
| BioGaia AB, Class B | | 4,605 | 36,493 |
| Biotage AB | | 1,896 | 31,120 |
| Boliden AB | | 2,274 | 66,130 |
| Castellum AB(1) | | 6,400 | 73,178 |
| Catena AB | | 932 | 31,653 |
| Electrolux AB, Class B(1) | | 3,051 | 37,641 |
| Elekta AB, Class B | | 5,121 | 26,029 |
| Embracer Group AB(1)(2) | | 9,503 | 45,716 |
| Epiroc AB, Class A | | 2,897 | 44,349 |
| Essity AB, Class B | | 8,378 | 177,013 |
| Evolution AB(3) | | 1,309 | 122,107 |
| Fabege AB | | 7,085 | 51,437 |
| Fingerprint Cards AB, Class B(1)(2) | | 29,632 | 14,016 |
| Getinge AB, Class B | | 4,555 | 92,434 |
| HMS Networks AB | | 1,113 | 28,636 |
| Holmen AB, Class B | | 2,532 | 91,887 |
| Hufvudstaden AB, Class A | | 2,401 | 28,612 |
| Husqvarna AB, Class B | | 3,790 | 22,502 |
| Industrivarden AB, Class A | | 1,060 | 24,007 |
| Industrivarden AB, Class C | | 1,534 | 34,447 |
| Investor AB, Class A | | 2,160 | 36,730 |
| Investor AB, Class B | | 5,782 | 94,366 |
| JM AB | | 2,031 | 30,580 |
| MIPS AB(1) | | 1,251 | 40,460 |
| Mycronic AB | | 2,681 | 42,076 |
| Security | Shares | Value |
| Sweden (continued) |
| Oatly Group AB ADR(1)(2) | | 7,600 | $ 16,720 |
| Orron Energy AB | | 4,713 | 9,777 |
| Sagax AB, Class B | | 3,417 | 62,966 |
| Securitas AB, Class B | | 1,900 | 15,524 |
| Skanska AB, Class B | | 1,238 | 19,253 |
| Spotify Technology S.A.(2) | | 1,272 | 102,498 |
| Svenska Cellulosa AB SCA, Class B | | 9,048 | 106,746 |
| Svenska Handelsbanken AB, Class A | | 7,120 | 66,152 |
| Swedbank AB, Class A | | 2,384 | 35,541 |
| Swedish Orphan Biovitrum AB(2) | | 3,003 | 55,313 |
| Tele2 AB, Class B | | 5,717 | 46,857 |
| Telefonaktiebolaget LM Ericsson, Class B | | 25,375 | 141,068 |
| Telia Co. AB(1) | | 24,113 | 63,894 |
| Thule Group AB(1)(3) | | 1,277 | 25,158 |
| Truecaller AB, Class B(1)(2) | | 6,505 | 23,809 |
| Vitrolife AB | | 1,099 | 17,762 |
| Volvo AB, Class B | | 1,722 | 28,184 |
| Volvo Car AB, Class B(1)(2) | | 9,789 | 41,545 |
| Wallenstam AB, Class B(1) | | 7,080 | 24,979 |
| Wihlborgs Fastigheter AB | | 3,468 | 22,720 |
| | | | $ 2,589,195 |
| Switzerland — 8.7% |
| Allreal Holding AG | | 346 | $ 49,563 |
| ALSO Holding AG | | 245 | 38,506 |
| Baloise Holding AG | | 396 | 54,102 |
| Banque Cantonale Vaudoise(1) | | 570 | 50,727 |
| Belimo Holding AG | | 140 | 57,023 |
| BKW AG | | 330 | 38,499 |
| Bucher Industries AG | | 149 | 50,238 |
| Cembra Money Bank AG | | 670 | 48,588 |
| Cie Financiere Richemont S.A. | | 5,971 | 583,567 |
| DKSH Holding AG | | 773 | 55,765 |
| EMS-Chemie Holding AG | | 104 | 65,394 |
| Flughafen Zurich AG(2) | | 295 | 45,765 |
| Forbo Holding AG | | 26 | 31,474 |
| Geberit AG | | 263 | 116,913 |
| Givaudan S.A. | | 78 | 232,981 |
| Helvetia Holding AG | | 425 | 42,203 |
| Inficon Holding AG | | 86 | 68,380 |
| Intershop Holding AG | | 78 | 47,440 |
| Kuehne & Nagel International AG(1) | | 464 | 98,770 |
| Landis+Gyr Group AG | | 1,111 | 64,023 |
| LEM Holding S.A. | | 13 | 21,644 |
| Logitech International S.A.(1) | | 2,732 | 135,868 |
| Nestle S.A. | | 6,891 | 750,146 |
26
See Notes to Financial Statements.
Tax-Managed International Equity Portfolio
October 31, 2022
Portfolio of Investments — continued
| Security | Shares | Value |
| Switzerland (continued) |
| Novartis AG | | 4,292 | $ 347,183 |
| Roche Holding AG PC | | 1,075 | 356,683 |
| Roche Holding AG, Bearer Shares | | 147 | 59,666 |
| Schindler Holding AG | | 320 | 50,374 |
| Schindler Holding AG PC(1) | | 353 | 57,562 |
| Schweiter Technologies AG | | 45 | 30,148 |
| SGS S.A. | | 36 | 79,362 |
| SIG Group AG | | 5,783 | 111,167 |
| Sika AG | | 1,387 | 312,735 |
| Stadler Rail AG(1) | | 1,511 | 44,462 |
| Swatch Group AG (The), Bearer Shares | | 279 | 62,694 |
| Swiss Life Holding AG | | 139 | 67,307 |
| Swiss Prime Site AG | | 1,669 | 134,676 |
| Swiss Re AG | | 262 | 19,463 |
| Swisscom AG | | 418 | 206,404 |
| UBS Group AG | | 10,259 | 162,648 |
| Zehnder Group AG | | 691 | 37,213 |
| Zurich Insurance Group AG | | 683 | 291,077 |
| | | | $ 5,178,403 |
| United Kingdom — 8.7% |
| 3i Group PLC | | 3,933 | $ 52,381 |
| Admiral Group PLC | | 1,052 | 24,328 |
| Antofagasta PLC | | 4,694 | 63,254 |
| Assura PLC | | 34,782 | 22,285 |
| AstraZeneca PLC | | 4,331 | 508,165 |
| Auto Trader Group PLC(3) | | 12,550 | 75,121 |
| Aviva PLC | | 9,030 | 43,314 |
| BAE Systems PLC | | 8,600 | 80,441 |
| Bellway PLC | | 608 | 12,930 |
| Berkeley Group Holdings PLC | | 509 | 20,252 |
| Big Yellow Group PLC | | 2,400 | 30,882 |
| BP PLC | | 23,461 | 129,800 |
| British American Tobacco PLC | | 3,774 | 149,048 |
| BT Group PLC | | 34,771 | 51,817 |
| Bunzl PLC | | 1,400 | 45,620 |
| Burberry Group PLC | | 3,492 | 72,763 |
| Capricorn Energy PLC(2) | | 43,432 | 123,374 |
| Compass Group PLC | | 7,473 | 157,395 |
| Croda International PLC | | 729 | 56,475 |
| Derwent London PLC | | 1,020 | 25,244 |
| Direct Line Insurance Group PLC | | 9,041 | 20,889 |
| Diversified Energy Co. PLC | | 103,611 | 149,580 |
| DS Smith PLC | | 10,893 | 36,327 |
| Experian PLC | | 2,304 | 73,464 |
| Ferguson PLC | | 689 | 75,141 |
| Security | Shares | Value |
| United Kingdom (continued) |
| Fresnillo PLC | | 1,893 | $ 15,826 |
| Grainger PLC | | 11,835 | 30,772 |
| Great Portland Estates PLC | | 4,065 | 23,962 |
| Halma PLC | | 5,460 | 132,401 |
| Hikma Pharmaceuticals PLC | | 1,344 | 19,293 |
| Howden Joinery Group PLC | | 5,263 | 31,002 |
| HSBC Holdings PLC | | 21,374 | 109,692 |
| InterContinental Hotels Group PLC | | 751 | 40,352 |
| Intertek Group PLC | | 543 | 22,748 |
| Lloyds Banking Group PLC | | 135,333 | 64,996 |
| London Stock Exchange Group PLC | | 726 | 62,931 |
| LondonMetric Property PLC | | 11,374 | 24,391 |
| Marks & Spencer Group PLC(2) | | 30,532 | 36,977 |
| Mondi PLC | | 3,379 | 56,694 |
| Moneysupermarket.com Group PLC | | 7,023 | 14,773 |
| National Grid PLC | | 18,771 | 204,512 |
| NCC Group PLC | | 21,199 | 48,480 |
| Next PLC | | 582 | 32,871 |
| Noble Corp. PLC | | 779 | 27,689 |
| Pearson PLC | | 5,346 | 59,090 |
| Pennon Group PLC | | 2,714 | 26,081 |
| Persimmon PLC | | 2,761 | 41,315 |
| Phoenix Group Holdings PLC | | 5,262 | 32,751 |
| Primary Health Properties PLC | | 23,037 | 29,351 |
| QinetiQ Group PLC | | 8,311 | 34,257 |
| Reckitt Benckiser Group PLC | | 1,454 | 96,493 |
| RELX PLC | | 3,168 | 85,094 |
| Rentokil Initial PLC | | 5,526 | 34,483 |
| Rightmove PLC | | 13,046 | 73,465 |
| Rio Tinto PLC | | 3,415 | 178,473 |
| Safestore Holdings PLC | | 3,803 | 39,401 |
| Sage Group PLC (The) | | 15,349 | 127,930 |
| Segro PLC | | 8,635 | 77,715 |
| Severn Trent PLC | | 3,397 | 97,493 |
| Shell PLC | | 13,561 | 375,661 |
| Sirius Real Estate, Ltd. | | 24,045 | 19,453 |
| Spectris PLC | | 815 | 28,247 |
| Spirax-Sarco Engineering PLC | | 358 | 44,118 |
| Standard Chartered PLC | | 5,917 | 35,353 |
| Taylor Wimpey PLC | | 39,034 | 41,967 |
| Tesco PLC | | 31,547 | 77,917 |
| Tritax Big Box REIT PLC | | 37,589 | 60,441 |
| Unilever PLC | | 2,896 | 131,636 |
| United Utilities Group PLC | | 9,445 | 101,781 |
| Vodafone Group PLC | | 116,824 | 136,381 |
| | | | $ 5,186,999 |
27
See Notes to Financial Statements.
Tax-Managed International Equity Portfolio
October 31, 2022
Portfolio of Investments — continued
| Security | Shares | Value |
| United States — 0.4% |
| Atlassian Corp., Class A | | 1,238 | $ 250,980 |
| | | | $ 250,980 |
Total Common Stocks
(identified cost $63,071,488) | | | $59,220,154 |
| Short-Term Investments — 4.0% |
| Security | Shares | Value |
| Morgan Stanley Institutional Liquidity Funds - Government Portfolio, Institutional Class, 2.88%(6) | | 161,268 | $ 161,268 |
Total Affiliated Fund
(identified cost $161,268) | | | $ 161,268 |
| Securities Lending Collateral — 3.7% |
| Security | Shares | Value |
| State Street Navigator Securities Lending Government Money Market Portfolio, 3.12%(7) | | 2,195,222 | $ 2,195,222 |
Total Securities Lending Collateral
(identified cost $2,195,222) | | | $ 2,195,222 |
Total Short-Term Investments
(identified cost $2,356,490) | | | $ 2,356,490 |
| | | |
Total Investments — 103.4%
(identified cost $65,427,978) | | | $61,576,644 |
| Other Assets, Less Liabilities — (3.4)% | | | $ (1,999,753) |
| Net Assets — 100.0% | | | $59,576,891 |
| The percentage shown for each investment category in the Portfolio of Investments is based on net assets. |
| (1) | All or a portion of this security was on loan at October 31, 2022. The aggregate market value of securities on loan at October 31, 2022 was $4,507,859. |
| (2) | Non-income producing security. |
| (3) | Security exempt from registration under Rule 144A of the Securities Act of 1933, as amended. These securities may be sold in certain transactions in reliance on an exemption from registration (normally to qualified institutional buyers). At October 31, 2022, the aggregate value of these securities is $2,037,750 or 3.4% of the Portfolio's net assets. |
| (4) | For fair value measurement disclosure purposes, security is categorized as Level 3 (see Note 8). |
| (5) | Represents an investment in an issuer that may be deemed to be an affiliate (see Note 7). |
| (6) | May be deemed to be an affiliated investment company. The rate shown is the annualized seven-day yield as of October 31, 2022. |
| (7) | Represents investment of cash collateral received in connection with securities lending. |
| Sector Classification of Portfolio |
| Sector | Percentage
of Net Assets | Value |
| Financials | 11.4% | $6,759,593 |
| Industrials | 11.3 | 6,713,159 |
| Health Care | 10.2 | 6,086,451 |
| Consumer Discretionary | 10.2 | 6,061,781 |
| Consumer Staples | 9.9 | 5,917,185 |
| Materials | 9.2 | 5,461,985 |
| Information Technology | 8.8 | 5,250,676 |
| Communication Services | 8.3 | 4,961,230 |
| Utilities | 7.0 | 4,186,434 |
| Real Estate | 7.0 | 4,174,461 |
| Energy | 6.1 | 3,647,199 |
| Short-Term Investments | 4.0 | 2,356,490 |
| Total Investments | 103.4% | $61,576,644 |
| Abbreviations: |
| ADR | – American Depositary Receipt |
| PC | – Participation Certificate |
| PFC Shares | – Preference Shares |
28
See Notes to Financial Statements.
Tax-Managed International Equity Portfolio
October 31, 2022
Statement of Assets and Liabilities
| | October 31, 2022 |
| Assets | |
| Unaffiliated investments, at value (identified cost $65,113,948) — including $4,507,859 of securities on loan | $ 61,278,857 |
| Affiliated investments, at value (identified cost $314,030) | 297,787 |
| Foreign currency, at value (identified cost $73,170) | 72,970 |
| Dividends receivable | 97,508 |
| Dividends receivable from affiliated investments | 3,809 |
| Receivable for investments sold | 1,215,684 |
| Securities lending income receivable | 2,486 |
| Tax reclaims receivable | 158,951 |
| Total assets | $63,128,052 |
| Liabilities | |
| Collateral for securities loaned | $ 2,195,222 |
| Payable for investments purchased | 1,252,757 |
| Payable to affiliates: | |
| Investment adviser fee | 24,797 |
| Trustees' fees | 439 |
| Accrued expenses | 77,946 |
| Total liabilities | $ 3,551,161 |
| Net Assets applicable to investors' interest in Portfolio | $59,576,891 |
29
See Notes to Financial Statements.
Tax-Managed International Equity Portfolio
October 31, 2022
| | Year Ended |
| | October 31, 2022 |
| Investment Income | |
| Dividend income (net of foreign taxes withheld of $269,195) | $ 2,030,837 |
| Dividend income from affiliated investments (net of foreign taxes withheld of $1,098) | 8,061 |
| Securities lending income, net | 43,535 |
| Total investment income | $ 2,082,433 |
| Expenses | |
| Investment adviser fee | $ 343,604 |
| Trustees’ fees and expenses | 4,856 |
| Custodian fee | 61,088 |
| Legal and accounting services | 60,464 |
| Miscellaneous | 6,470 |
| Total expenses | $ 476,482 |
| Deduct: | |
| Waiver and/or reimbursement of expenses by affiliate | $ 179 |
| Total expense reductions | $ 179 |
| Net expenses | $ 476,303 |
| Net investment income | $ 1,606,130 |
| Realized and Unrealized Gain (Loss) | |
| Net realized gain (loss): | |
| Investment transactions | $ (1,188,065) |
| Investment transactions - affiliated investments | (8,539) |
| Foreign currency transactions | (30,499) |
| Net realized loss | $ (1,227,103) |
| Change in unrealized appreciation (depreciation): | |
| Investments | $ (20,016,766) |
| Investments - affiliated investments | (18,787) |
| Foreign currency | (24,528) |
| Net change in unrealized appreciation (depreciation) | $(20,060,081) |
| Net realized and unrealized loss | $(21,287,184) |
| Net decrease in net assets from operations | $(19,681,054) |
30
See Notes to Financial Statements.
Tax-Managed International Equity Portfolio
October 31, 2022
Statements of Changes in Net Assets
| | Year Ended October 31, |
| | 2022 | 2021 |
| Increase (Decrease) in Net Assets | | |
| From operations: | | |
| Net investment income | $ 1,606,130 | $ 1,715,573 |
| Net realized loss | (1,227,103) | (639,164) |
| Net change in unrealized appreciation (depreciation) | (20,060,081) | 17,468,645 |
| Net increase (decrease) in net assets from operations | $(19,681,054) | $18,545,054 |
| Capital transactions: | | |
| Contributions | $ 11,445,206 | $ 4,433,462 |
| Withdrawals | (9,274,277) | (5,907,437) |
| Net increase (decrease) in net assets from capital transactions | $ 2,170,929 | $ (1,473,975) |
| Net increase (decrease) in net assets | $(17,510,125) | $17,071,079 |
| Net Assets | | |
| At beginning of year | $ 77,087,016 | $ 60,015,937 |
| At end of year | $ 59,576,891 | $77,087,016 |
31
See Notes to Financial Statements.
Tax-Managed International Equity Portfolio
October 31, 2022
| | Year Ended October 31, |
| Ratios/Supplemental Data | 2022 | 2021 | 2020 | 2019 | 2018 |
| Ratios (as a percentage of average daily net assets): | | | | | |
| Expenses | 0.69% (1) | 0.68% | 0.69% | 0.74% | 0.71% |
| Net investment income | 2.34% | 2.31% | 1.74% | 2.53% | 1.90% |
| Portfolio Turnover | 22% | 23% | 10% | 37% | 30% |
| Total Return | (25.13)% | 31.20% | (5.07)% | 11.59% | (5.77)% |
| Net assets, end of year (000’s omitted) | $59,577 | $77,087 | $60,016 | $71,054 | $68,042 |
| (1) | Includes a reduction by the investment adviser of a portion of its adviser fee due to the Portfolio’s investment in the Liquidity Fund (equal to less than 0.005% of average daily net assets for the year ended October 31, 2022). |
32
See Notes to Financial Statements.
Tax-Managed International Equity Portfolio
October 31, 2022
Notes to Financial Statements
1 Significant Accounting Policies
Tax-Managed International Equity Portfolio (the Portfolio) is a Massachusetts business trust registered under the Investment Company Act of 1940, as amended (the 1940 Act), as a diversified, open-end management investment company. The Portfolio’s investment objective is to achieve long-term, after-tax returns by investing in a diversified portfolio of foreign equity securities. The Declaration of Trust permits the Trustees to issue interests in the Portfolio. At October 31, 2022, Parametric Tax-Managed International Equity Fund and Eaton Vance Tax-Managed Equity Asset Allocation Fund held an interest of 56.3% and 43.7%, respectively, in the Portfolio.
The following is a summary of significant accounting policies of the Portfolio. The policies are in conformity with accounting principles generally accepted in the United States of America (U.S. GAAP). The Portfolio is an investment company and follows accounting and reporting guidance in the Financial Accounting Standards Board (FASB) Accounting Standards Codification Topic 946.
A Investment Valuation—The following methodologies are used to determine the market value or fair value of investments.
Equity Securities. Equity securities listed on a U.S. securities exchange generally are valued at the last sale or closing price on the day of valuation or, if no sales took place on such date, at the mean between the closing bid and ask prices on the exchange where such securities are principally traded. Equity securities listed on the NASDAQ National Market System are valued at the NASDAQ official closing price. Unlisted or listed securities for which closing sales prices or closing quotations are not available are valued at the mean between the latest available bid and ask prices.
Foreign Securities and Currencies. Foreign securities and currencies are valued in U.S. dollars, based on foreign currency exchange rate quotations supplied by a third party pricing service. The pricing service uses a proprietary model to determine the exchange rate. Inputs to the model include reported trades and implied bid/ask spreads. The daily valuation of exchange-traded foreign securities generally is determined as of the close of trading on the principal exchange on which such securities trade. Events occurring after the close of trading on foreign exchanges may result in adjustments to the valuation of foreign securities to more accurately reflect their fair value as of the close of regular trading on the New York Stock Exchange. When valuing foreign equity securities that meet certain criteria, the Portfolio's Trustees have approved the use of a fair value service that values such securities to reflect market trading that occurs after the close of the applicable foreign markets of comparable securities or other instruments that have a strong correlation to the fair-valued securities.
Other. Investments in management investment companies (including money market funds) that do not trade on an exchange are valued at the net asset value as of the close of each business day.
Fair Valuation. In connection with Rule 2a-5 of the 1940 Act, which became effective September 8, 2022, the Trustees have designated the Portfolio’s investment adviser as its valuation designee. Investments for which valuations or market quotations are not readily available or are deemed unreliable are valued by the investment adviser, as valuation designee, at fair value using methods that most fairly reflect the security’s “fair value”, which is the amount that the Portfolio might reasonably expect to receive for the security upon its current sale in the ordinary course. Each such determination is based on a consideration of relevant factors, which are likely to vary from one pricing context to another. These factors may include, but are not limited to, the type of security, the existence of any contractual restrictions on the security’s disposition, the price and extent of public trading in similar securities of the issuer or of comparable companies or entities, quotations or relevant information obtained from broker/dealers or other market participants, information obtained from the issuer, analysts, and/or the appropriate stock exchange (for exchange-traded securities), an analysis of the company’s or entity’s financial statements, and an evaluation of the forces that influence the issuer and the market(s) in which the security is purchased and sold.
B Investment Transactions—Investment transactions for financial statement purposes are accounted for on a trade date basis. Realized gains and losses on investments sold are determined on the basis of identified cost.
C Income—Dividend income is recorded on the ex-dividend date for dividends received in cash and/or securities. However, if the ex-dividend date has passed, certain dividends from foreign securities are recorded as the Portfolio is informed of the ex-dividend date. Withholding taxes on foreign dividends and capital gains have been provided for in accordance with the Portfolio's understanding of the applicable countries’ tax rules and rates. In consideration of recent decisions rendered by European courts, the Portfolio has filed additional tax reclaims for previously withheld taxes on dividends earned in certain European Union countries. These filings are subject to various administrative and judicial proceedings within these countries. Due to the uncertainty as to the ultimate resolution of these proceedings, the likelihood of receipt of these reclaims, and the potential timing of payment, no amounts are reflected in the Portfolio's financial statements for such outstanding reclaims.
D Federal Taxes—The Portfolio has elected to be treated as a partnership for federal tax purposes. No provision is made by the Portfolio for federal or state taxes on any taxable income of the Portfolio because each investor in the Portfolio is ultimately responsible for the payment of any taxes on its share of taxable income. Since at least one of the Portfolio's investors is a regulated investment company that invests all or substantially all of its assets in the Portfolio, the Portfolio normally must satisfy the applicable source of income and diversification requirements (under the Internal Revenue Code) in order for its investors to satisfy them. The Portfolio will allocate, at least annually among its investors, each investor's distributive share of the Portfolio's net investment income, net realized capital gains and losses and any other items of income, gain, loss, deduction or credit.
Tax-Managed International Equity Portfolio
October 31, 2022
Notes to Financial Statements — continued
As of October 31, 2022, the Portfolio had no uncertain tax positions that would require financial statement recognition, de-recognition, or disclosure. The Portfolio files a U.S. federal income tax return annually after its fiscal year-end, which is subject to examination by the Internal Revenue Service for a period of three years from the date of filing.
E Foreign Currency Translation—Investment valuations, other assets, and liabilities initially expressed in foreign currencies are translated each business day into U.S. dollars based upon current exchange rates. Purchases and sales of foreign investment securities and income and expenses denominated in foreign currencies are translated into U.S. dollars based upon currency exchange rates in effect on the respective dates of such transactions. Recognized gains or losses on investment transactions attributable to changes in foreign currency exchange rates are recorded for financial statement purposes as net realized gains and losses on investments. That portion of unrealized gains and losses on investments that results from fluctuations in foreign currency exchange rates is not separately disclosed.
F Use of Estimates—The preparation of the financial statements in conformity with U.S. GAAP requires management to make estimates and assumptions that affect the reported amounts of assets and liabilities at the date of the financial statements and the reported amounts of income and expense during the reporting period. Actual results could differ from those estimates.
G Indemnifications—Under the Portfolio’s organizational documents, its officers and Trustees may be indemnified against certain liabilities and expenses arising out of the performance of their duties to the Portfolio. Under Massachusetts law, if certain conditions prevail, interestholders in the Portfolio could be deemed to have personal liability for the obligations of the Portfolio. However, the Portfolio’s Declaration of Trust contains an express disclaimer of liability on the part of Portfolio interestholders. Additionally, in the normal course of business, the Portfolio enters into agreements with service providers that may contain indemnification clauses. The Portfolio’s maximum exposure under these arrangements is unknown as this would involve future claims that may be made against the Portfolio that have not yet occurred.
2 Investment Adviser Fee and Other Transactions with Affiliates
The investment adviser fee is earned by Boston Management and Research (BMR), an indirect, wholly-owned subsidiary of Morgan Stanley, as compensation for investment advisory services rendered to the Portfolio. The fee is computed at an annual rate as a percentage of the Portfolio’s average daily net assets as follows and is payable monthly:
| Average Daily Net Assets | Annual Fee Rate |
| Up to $1 billion | 0.500% |
| $1 billion but less than $2.5 billion | 0.475% |
| $2.5 billion but less than $5 billion | 0.455% |
| $5 billion and over | 0.440% |
For the year ended October 31, 2022, the investment adviser fee amounted to $343,604 or 0.50% of the Portfolio’s average daily net assets. Pursuant to an investment sub-advisory agreement, BMR has delegated the investment management of the Portfolio to Parametric Portfolio Associates LLC (Parametric), an affiliate of BMR and an indirect, wholly-owned subsidiary of Morgan Stanley. BMR pays Parametric a portion of its investment adviser fee for sub-advisory services provided to the Portfolio. Effective April 26, 2022, the Portfolio may invest in a money market fund, the Institutional Class of the Morgan Stanley Institutional Liquidity Funds - Government Portfolio (the “Liquidity Fund”), an open-end management investment company managed by Morgan Stanley Investment Management Inc., a wholly-owned subsidiary of Morgan Stanley. The investment adviser fee paid by the Portfolio is reduced by an amount equal to its pro-rata share of the advisory and administration fees paid by the Portfolio due to its investment in the Liquidity Fund. For the year ended October 31, 2022, the investment adviser fee paid was reduced by $179 relating to the Portfolio's investment in the Liquidity Fund. Prior to April 26, 2022, the Portfolio may have invested its cash in Eaton Vance Cash Reserves Fund, LLC (Cash Reserves Fund), an affiliated investment company managed by Eaton Vance Management (EVM), an affiliate of BMR. EVM did not receive a fee for advisory services provided to Cash Reserves Fund.
Trustees and officers of the Portfolio who are members of EVM’s or BMR’s organizations receive remuneration for their services to the Portfolio out of the investment adviser fee. Trustees of the Portfolio who are not affiliated with the investment adviser may elect to defer receipt of all or a percentage of their annual fees in accordance with the terms of the Trustees Deferred Compensation Plan. For the year ended October 31, 2022, no significant amounts have been deferred. Certain officers and Trustees of the Portfolio are officers of the above organizations.
3 Purchases and Sales of Investments
Purchases and sales of investments, other than short-term obligations, aggregated $19,145,338 and $15,208,814, respectively, for the year ended October 31, 2022.
Tax-Managed International Equity Portfolio
October 31, 2022
Notes to Financial Statements — continued
4 Federal Income Tax Basis of Investments
The cost and unrealized appreciation (depreciation) of investments of the Portfolio at October 31, 2022, as determined on a federal income tax basis, were as follows:
| Aggregate cost | $ 65,815,101 |
| Gross unrealized appreciation | $ 7,316,815 |
| Gross unrealized depreciation | (11,555,272) |
| Net unrealized depreciation | $ (4,238,457) |
5 Line of Credit
The Portfolio participates with other portfolios and funds managed by EVM and its affiliates in a $725 million unsecured line of credit agreement with a group of banks, which is in effect through October 24, 2023. In connection with the renewal of the agreement on October 25, 2022, the borrowing limit was decreased from $800 million. Borrowings are made by the Portfolio solely for temporary purposes related to redemptions and other short-term cash needs. Interest is charged to the Portfolio based on its borrowings at an amount above either the Secured Overnight Financing Rate (SOFR) or Federal Funds rate. In addition, a fee computed at an annual rate of 0.15% on the daily unused portion of the line of credit is allocated among the participating portfolios and funds at the end of each quarter. Also in connection with the renewal of the agreement, an arrangement fee totaling $150,000 was incurred that was allocated to the participating portfolios and funds. Because the line of credit is not available exclusively to the Portfolio, it may be unable to borrow some or all of its requested amounts at any particular time. The Portfolio did not have any significant borrowings or allocated fees during the year ended October 31, 2022.
6 Securities Lending Agreement
The Portfolio has established a securities lending agreement with State Street Bank and Trust Company (SSBT) as securities lending agent in which the Portfolio lends portfolio securities to qualified borrowers in exchange for collateral consisting of either cash or securities issued or guaranteed by the U.S. government or its agencies or instrumentalities in an amount at least equal to the market value of the securities on loan. The market value of securities loaned is determined daily and any additional required collateral is delivered to the Portfolio on the next business day. Cash collateral is invested in the State Street Navigator Securities Lending Government Money Market Portfolio, a money market fund registered under the 1940 Act. The Portfolio earns interest on the amount invested but it must pay (and at times receive from) the broker a loan rebate fee computed as a varying percentage of the collateral received. For security loans secured by non-cash collateral, the Portfolio earns a negotiated lending fee from the borrower. A portion of the income earned by the Portfolio from its investment of cash collateral, net of rebate fees, and lending fees received is allocated to SSBT for its services as lending agent and the portion allocated to the Portfolio is presented as securities lending income, net on the Statement of Operations. Non-cash collateral is held by the lending agent on behalf of the Portfolio and cannot be sold or re-pledged by the Portfolio; accordingly, such collateral is not reflected in the Statement of Assets and Liabilities.
The Portfolio is subject to possible delay in the recovery of loaned securities. Pursuant to the securities lending agreement, SSBT has provided indemnification to the Portfolio in the event of default by a borrower with respect to a loan. The Portfolio bears the risk of loss with respect to the investment of cash collateral.
At October 31, 2022, the value of the securities loaned and the value of the collateral received, which exceeded the value of the securities loaned, amounted to $4,507,859 and $4,803,080, respectively. Collateral received was comprised of cash of $2,195,222 and U.S. government and/or agencies securities of $2,607,858. The securities lending transactions have no contractual maturity date and each of the Portfolio and borrower has the option to terminate a loan at any time.
The following table provides a breakdown of securities lending transactions accounted for as secured borrowings, the obligations by class of collateral pledged, and the remaining contractual maturity of those transactions as of October 31, 2022.
| | Remaining Contractual Maturity of the Transactions |
| | Overnight and
Continuous | <30 days | 30 to 90 days | >90 days | Total |
| Common Stocks | $2,195,222 | $ — | $ — | $ — | $2,195,222 |
Tax-Managed International Equity Portfolio
October 31, 2022
Notes to Financial Statements — continued
The carrying amount of the liability for collateral for securities loaned at October 31, 2022 approximated its fair value. If measured at fair value, such liability would have been considered as Level 2 in the fair value hierarchy (see Note 8) at October 31, 2022.
7 Investments in Affiliated Issuers and Funds
The Portfolio invested in issuers that may be deemed to be affiliated with Morgan Stanley. At October 31, 2022, the value of the Portfolio's investment in affiliated issuers and funds was $297,787, which represents 0.5% of the Portfolio's net assets. Transactions in affiliated issuers and funds by the Portfolio for the year ended October 31, 2022 were as follows:
| Name | Value,
beginning
of period | Purchases | Sales
proceeds | Net
realized
gain (loss) | Change in
unrealized
appreciation
(depreciation) | Value, end
of period | Dividend
income | Units/Shares,
end of period |
| Common Stocks |
| Mitsubishi UFJ Financial Group, Inc. | $176,569 | $ 51,306 | $ (64,035) | $ (8,534) | $ (18,787) | $ 136,519 | $ 6,073 | 28,900 |
| Short-Term Investments |
| Cash Reserves Fund | 221,857 | 3,408,354 | (3,630,206) | (5) | — | — | 72 | — |
| Liquidity Fund | — | 6,391,654 | (6,230,386) | — | — | 161,268 | 1,916 | 161,268 |
| Total | | | | $(8,539) | $(18,787) | $297,787 | $8,061 | |
8 Fair Value Measurements
Under generally accepted accounting principles for fair value measurements, a three-tier hierarchy to prioritize the assumptions, referred to as inputs, is used in valuation techniques to measure fair value. The three-tier hierarchy of inputs is summarized in the three broad levels listed below.
| • | Level 1 – quoted prices in active markets for identical investments |
| • | Level 2 – other significant observable inputs (including quoted prices for similar investments, interest rates, prepayment speeds, credit risk, etc.) |
| • | Level 3 – significant unobservable inputs (including a fund's own assumptions in determining the fair value of investments) |
In cases where the inputs used to measure fair value fall in different levels of the fair value hierarchy, the level disclosed is determined based on the lowest level input that is significant to the fair value measurement in its entirety. The inputs or methodology used for valuing securities are not necessarily an indication of the risk associated with investing in those securities.
At October 31, 2022, the hierarchy of inputs used in valuing the Portfolio's investments, which are carried at value, were as follows:
| Asset Description | Level 1 | Level 2 | Level 3* | Total |
| Common Stocks: | | | | |
| Asia/Pacific | $ 393,390 | $ 16,891,473 | $ 0 | $ 17,284,863 |
| Developed Europe | 414,628 | 39,962,689 | — | 40,377,317 |
| Developed Middle East | 189,888 | 1,117,106 | — | 1,306,994 |
| North America | 250,980 | — | — | 250,980 |
| Total Common Stocks | $1,248,886 | $57,971,268** | $ 0 | $59,220,154 |
| Short-Term Investments: | | | | |
| Affiliated Fund | $ 161,268 | $ — | $ — | $ 161,268 |
Tax-Managed International Equity Portfolio
October 31, 2022
Notes to Financial Statements — continued
| Asset Description (continued) | Level 1 | Level 2 | Level 3* | Total |
| Securities Lending Collateral | $ 2,195,222 | $ — | $ — | $ 2,195,222 |
| Total Investments | $3,605,376 | $57,971,268 | $ 0 | $61,576,644 |
| * | None of the unobservable inputs for Level 3 assets, individually or collectively, had a material impact on the Portfolio. |
| ** | Includes foreign equity securities whose values were adjusted to reflect market trading of comparable securities or other correlated instruments that occurred after the close of trading in their applicable foreign markets. |
Level 3 investments at the beginning and/or end of the period were valued at $0 and accordingly, a reconciliation of Level 3 assets for the year ended October 31, 2022 is not presented.
9 Risks and Uncertainties
Risks Associated with Foreign Investments
Foreign investments can be adversely affected by political, economic and market developments abroad, including the imposition of economic and other sanctions by the United States or another country. There may be less publicly available information about foreign issuers because they may not be subject to reporting practices, requirements or regulations comparable to those to which United States companies are subject. Foreign markets may be smaller, less liquid and more volatile than the major markets in the United States. Trading in foreign markets typically involves higher expense than trading in the United States. The Portfolio may have difficulties enforcing its legal or contractual rights in a foreign country. Securities that trade or are denominated in currencies other than the U.S. dollar may be adversely affected by fluctuations in currency exchange rates.
Pandemic Risk
An outbreak of respiratory disease caused by a novel coronavirus was first detected in China in late 2019 and subsequently spread internationally. This coronavirus has resulted in closing borders, enhanced health screenings, changes to healthcare service preparation and delivery, quarantines, cancellations, disruptions to supply chains and customer activity, as well as general concern and uncertainty. Health crises caused by outbreaks of disease, such as the coronavirus outbreak, may exacerbate other pre-existing political, social and economic risks and disrupt normal market conditions and operations. The impact of this outbreak has negatively affected the worldwide economy, as well as the economies of individual countries and industries, and could continue to affect the market in significant and unforeseen ways. Other epidemics and pandemics that may arise in the future may have similar effects. Any such impact could adversely affect the Portfolio’s performance, or the performance of the securities in which the Portfolio invests.
Tax-Managed International Equity Portfolio
October 31, 2022
Report of Independent Registered Public Accounting Firm
To the Trustees and Investors of Tax-Managed International Equity Portfolio:
Opinion on the Financial Statements and Financial Highlights
We have audited the accompanying statement of assets and liabilities of Tax-Managed International Equity Portfolio (the “Portfolio”), including the portfolio of investments, as of October 31, 2022, the related statement of operations for the year then ended, the statements of changes in net assets for each of the two years in the period then ended, the financial highlights for each of the five years in the period then ended, and the related notes. In our opinion, the financial statements and financial highlights present fairly, in all material respects, the financial position of the Portfolio as of October 31, 2022, and the results of its operations for the year then ended, the changes in its net assets for each of the two years in the period then ended, and the financial highlights for each of the five years in the period then ended, in conformity with accounting principles generally accepted in the United States of America.
Basis for Opinion
These financial statements and financial highlights are the responsibility of the Portfolio’s management. Our responsibility is to express an opinion on the Portfolio’s financial statements and financial highlights based on our audits. We are a public accounting firm registered with the Public Company Accounting Oversight Board (United States) (PCAOB) and are required to be independent with respect to the Portfolio in accordance with the U.S. federal securities laws and the applicable rules and regulations of the Securities and Exchange Commission and the PCAOB.
We conducted our audits in accordance with the standards of the PCAOB. Those standards require that we plan and perform the audit to obtain reasonable assurance about whether the financial statements and financial highlights are free of material misstatement, whether due to error or fraud. The Portfolio is not required to have, nor were we engaged to perform, an audit of its internal control over financial reporting. As part of our audits, we are required to obtain an understanding of internal control over financial reporting but not for the purpose of expressing an opinion on the effectiveness of the Portfolio’s internal control over financial reporting. Accordingly, we express no such opinion.
Our audits included performing procedures to assess the risks of material misstatement of the financial statements and financial highlights, whether due to error or fraud, and performing procedures that respond to those risks. Such procedures included examining, on a test basis, evidence regarding the amounts and disclosures in the financial statements and financial highlights. Our audits also included evaluating the accounting principles used and significant estimates made by management, as well as evaluating the overall presentation of the financial statements and financial highlights. Our procedures included confirmation of securities owned as of October 31, 2022, by correspondence with the custodian and brokers; when replies were not received from brokers, we performed other auditing procedures. We believe that our audits provide a reasonable basis for our opinion.
/s/ Deloitte & Touche LLP
Boston, Massachusetts
December 20, 2022
We have served as the auditor of one or more Eaton Vance investment companies since 1959.
Parametric
Tax-Managed International Equity Fund
October 31, 2022
Board of Trustees’ Contract Approval
Overview of the Contract Review Process
The Investment Company Act of 1940, as amended (the “1940 Act”), provides, in substance, that the investment advisory agreement between a fund and its investment adviser will continue in effect from year-to-year only if its continuation is approved on an annual basis by a vote of the fund’s board of trustees, including a majority of the trustees who are not “interested persons” of the fund (“independent trustees”), cast in person at a meeting called for the purpose of considering such approval.
At a meeting held on June 8, 2022, the Boards of Trustees/Directors (collectively, the “Board”) that oversee the registered investment companies advised by Eaton Vance Management or its affiliate, Boston Management and Research (the “Eaton Vance Funds”), including a majority of the independent trustees (the “Independent Trustees”), voted to approve the continuation of existing investment advisory agreements and sub-advisory agreements1 for each of the Eaton Vance Funds for an additional one-year period. The Board relied upon the affirmative recommendation of its Contract Review Committee, which is a committee exclusively comprised of Independent Trustees. Prior to making its recommendation, the Contract Review Committee reviewed information furnished by the adviser and sub-adviser to each of the Eaton Vance Funds (including information specifically requested by the Board) for a series of formal meetings held between April and June 2022. Members of the Contract Review Committee also considered information received at prior meetings of the Board and its committees, to the extent such information was relevant to the Contract Review Committee’s annual evaluation of the investment advisory agreements and sub-advisory agreements.
In connection with its evaluation of the investment advisory agreements and sub-advisory agreements, the Board considered various information relating to the Eaton Vance Funds. This included information applicable to all or groups of Eaton Vance Funds, which is referenced immediately below, and information applicable to the particular Eaton Vance Fund covered by this report (additional fund-specific information is referenced below under “Results of the Contract Review Process”). (For funds that invest through one or more underlying portfolios, references to “each fund” in this section may include information that was considered at the portfolio-level.)
Information about Fees, Performance and Expenses
• A report from an independent data provider comparing advisory and other fees paid by each fund to such fees paid by comparable funds, as identified by the independent data provider (“comparable funds”);
• A report from an independent data provider comparing each fund’s total expense ratio (and its components) to those of comparable funds;
• A report from an independent data provider comparing the investment performance of each fund (including, as relevant, total return data, income data, Sharpe ratios and information ratios) to the investment performance of comparable funds and, as applicable, benchmark indices, over various time periods;
• In certain instances, data regarding investment performance relative to customized groups of peer funds and blended indices identified by the adviser in consultation with the Portfolio Management Committee of the Board (a committee exclusively comprised of Independent Trustees);
• Comparative information concerning the fees charged and services provided by the adviser and sub-adviser to each fund in managing other accounts (which may include other mutual funds, collective investment funds and institutional accounts) using investment strategies and techniques similar to those used in managing such fund(s), if any;
• Profitability analyses with respect to the adviser and sub-adviser to each of the funds;
Information about Portfolio Management and Trading
• Descriptions of the investment management services provided to each fund, as well as each of the funds’ investment strategies and policies;
• The procedures and processes used to determine the value of fund assets, including, when necessary, the determination of “fair value” and actions taken to monitor and test the effectiveness of such procedures and processes;
• Information about the policies and practices of each fund’s adviser and sub-adviser with respect to trading, including their processes for seeking best execution of portfolio transactions;
• Information about the allocation of brokerage transactions and the benefits, if any, received by the adviser and sub-adviser to each fund as a result of brokerage allocation, including, as applicable, information concerning the acquisition of research through client commission arrangements and policies with respect to “soft dollars”;
• Data relating to the portfolio turnover rate of each fund and related information regarding active management in the context of particular strategies;
Information about each Adviser and Sub-adviser
• Reports detailing the financial results and condition of the adviser and sub-adviser to each fund;
• Information regarding the individual investment professionals whose responsibilities include portfolio management and investment research for the funds, and, for portfolio managers and certain other investment professionals, information relating to their responsibilities with respect to managing other mutual funds and investment accounts, as applicable;
1 Not all Eaton Vance Funds have entered into a sub-advisory agreement with a sub-adviser. Accordingly, references to “sub-adviser” or “sub-advisory agreement” in this “Overview” section may not be applicable to the particular Eaton Vance Fund covered by this report. Following the “Overview” section, further information regarding the Board’s evaluation of a fund’s contractual arrangements is included under the “Results of the Contract Review Process” section.
Parametric
Tax-Managed International Equity Fund
October 31, 2022
Board of Trustees’ Contract Approval — continued
• Information regarding the adviser’s and its parent company’s (Morgan Stanley’s) efforts to retain and attract talented investment professionals, including in the context of a particularly competitive marketplace for talent, as well as the ongoing unique environment presented by hybrid, remote and other alternative work arrangements;
• The Code of Ethics of the adviser and its affiliates and the sub-adviser of each fund, together with information relating to compliance with, and the administration of, such codes;
• Policies and procedures relating to proxy voting, including regular reporting with respect to fund proxy voting activities;
• Information regarding the handling of corporate actions and class actions, as well as information regarding litigation and other regulatory matters;
• Information concerning the resources devoted to compliance efforts undertaken by the adviser and its affiliates and the sub-adviser of each fund, if any, including descriptions of their various compliance programs and their record of compliance;
• Information concerning the business continuity and disaster recovery plans of the adviser and its affiliates and the sub-adviser of each fund, if any;
• A description of Eaton Vance Management’s and Boston Management and Research’s oversight of sub-advisers, including with respect to regulatory and compliance issues, investment management and other matters;
Other Relevant Information
• Information regarding ongoing initiatives to further integrate and harmonize, where applicable, the investment management and other departments of the adviser and its affiliates with the overall investment management infrastructure of Morgan Stanley, in light of Morgan Stanley’s acquisition of Eaton Vance on March 1, 2021;
• Information concerning the nature, cost and character of the administrative and other non-investment advisory services provided by Eaton Vance Management and its affiliates;
• Information concerning oversight of the relationship with the custodian, subcustodians, fund accountants, and other third-party service providers by the adviser and/or administrator to each of the funds;
• Information concerning efforts to implement policies and procedures with respect to various new regulations applicable to the funds, including Rule 12d1-4 (the Fund-of-Funds Rule), Rule 18f-4 (the Derivatives Rule) and Rule 2a-5 (the Fair Valuation Rule);
• For an Eaton Vance Fund structured as an exchange-listed closed-end fund, information concerning the benefits of the closed-end fund structure, as well as, where relevant, the closed-end fund’s market prices (including as compared to the closed-end fund’s net asset value (NAV)), trading volume data, continued use of auction preferred shares (where applicable), distribution rates and other relevant matters;
• The risks which the adviser and/or its affiliates incur in connection with the management and operation of the funds, including, among others, litigation, regulatory, entrepreneurial, and other business risks (and the associated costs of such risks); and
• The terms of each investment advisory agreement and sub-advisory agreement.
During the various meetings of the Board and its committees over the course of the year leading up to the June 8, 2022 meeting, the Trustees received information from portfolio managers and other investment professionals of the advisers and sub-advisers of the funds regarding investment and performance matters, and considered various investment and trading strategies used in pursuing the funds’ investment objectives. The Trustees also received information regarding risk management techniques employed in connection with the management of the funds. The Board and its committees evaluated issues pertaining to industry and regulatory developments, compliance procedures, fund governance and other issues with respect to the funds, and received and participated in reports and presentations provided by Eaton Vance Management, Boston Management and Research and fund sub-advisers, with respect to such matters. In addition to the formal meetings of the Board and its committees, the Independent Trustees held regular teleconferences to discuss, among other topics, matters relating to the continuation of investment advisory agreements and sub-advisory agreements.
The Contract Review Committee was advised throughout the contract review process by Goodwin Procter LLP, independent legal counsel for the Independent Trustees. The members of the Contract Review Committee, with the advice of such counsel, exercised their own business judgment in determining the material factors to be considered in evaluating each investment advisory agreement and sub-advisory agreement and the weight to be given to each such factor. The conclusions reached with respect to each investment advisory agreement and sub-advisory agreement were based on a comprehensive evaluation of all the information provided and not any single factor. Moreover, each member of the Contract Review Committee may have placed varying emphasis on particular factors in reaching conclusions with respect to each investment advisory agreement and sub-advisory agreement. In evaluating each investment advisory agreement and sub-advisory agreement, including the fee structures and other terms contained in such agreements, the members of the Contract Review Committee were also informed by multiple years of analysis and discussion with the adviser and sub-adviser to each of the Eaton Vance Funds.
Results of the Contract Review Process
Based on its consideration of the foregoing, and such other information it deemed relevant, including the factors and conclusions described below, the Contract Review Committee concluded that the continuation of the investment advisory agreement between Parametric Tax-Managed International Equity Fund (the “Fund”) and Eaton Vance Management (“EVM”), as well as the investment advisory agreement between Tax-Managed International Equity Portfolio (the “Portfolio”), the portfolio in which the Fund invests, and Boston Management and Research (“BMR”) (EVM, with respect to the Fund, and BMR, with respect to the Portfolio, are each referred to herein as the “Adviser”), and the sub-advisory agreement between EVM and Parametric Portfolio Associates LLC (the “Sub-adviser”), an affiliate of the Advisers, with respect to the Fund, and the sub-advisory agreement between BMR and the Sub-adviser, with respect to the Portfolio, including their respective fee structures, are in the interests of shareholders and, therefore, recommended to the
Parametric
Tax-Managed International Equity Fund
October 31, 2022
Board of Trustees’ Contract Approval — continued
Board approval of each agreement. Based on the recommendation of the Contract Review Committee, the Board, including a majority of the Independent Trustees, voted to approve continuation of the investment advisory agreements for the Fund and the Portfolio (together, the “investment advisory agreements”) and sub-advisory agreements for the Fund and the Portfolio (together, the “sub-advisory agreements”).
Nature, Extent and Quality of Services
In considering whether to approve the investment advisory agreements and sub-advisory agreements for the Fund and the Portfolio, the Board evaluated the nature, extent and quality of services provided to the Fund and to the Portfolio by the applicable Adviser and the Sub-adviser, respectively.
The Board considered each Adviser’s and the Sub-adviser’s management capabilities and investment processes in light of the types of investments held by the Fund and the Portfolio, including the education, experience and number of investment professionals and other personnel who provide portfolio management, investment research, and similar services to the Portfolio. Regarding each Adviser, the Board considered such Adviser’s responsibilities with respect to oversight of the Sub-adviser. The Board also considered each Adviser’s in-house equity research capabilities and experience in managing funds that seek to maximize after-tax returns. With respect to the Sub-adviser, the Board considered the Sub-adviser’s experience in deploying quantitative-based investment strategies. The Board also took into account the resources dedicated to portfolio management and other services, the compensation methods of each Adviser and other factors, including the reputation and resources of each Adviser to recruit and retain highly qualified research, advisory and supervisory investment professionals. In addition, the Board considered the time and attention devoted to the Eaton Vance Funds, including the Fund and the Portfolio, by senior management, as well as the infrastructure, operational capabilities and support staff in place to assist in the portfolio management and operations of the Fund and the Portfolio, including the provision of administrative services. The Board also considered the business-related and other risks to which each Adviser or its affiliates may be subject in managing the Fund and the Portfolio.
The Board noted that, under the terms of the investment advisory agreement of the Fund, EVM may invest assets of the Fund directly in securities, for which it would receive a fee, or in the Portfolio, for which it receives no separate fee but for which BMR receives an advisory fee from the Portfolio.
The Board considered the compliance programs of each Adviser and relevant affiliates thereof, including the Sub-adviser. The Board considered compliance and reporting matters regarding, among other things, personal trading by investment professionals, disclosure of portfolio holdings, late trading, frequent trading, portfolio valuation, business continuity and the allocation of investment opportunities. The Board also considered the responses of each Adviser and its affiliates to requests in recent years from regulatory authorities, such as the Securities and Exchange Commission and the Financial Industry Regulatory Authority.
The Board considered other administrative services provided or overseen by EVM and its affiliates, including transfer agency and accounting services. The Board evaluated the benefits to shareholders of investing in a fund that is a part of a large fund complex offering exposure to a variety of asset classes and investment disciplines, as well as the ability, in many cases, to exchange an investment among different funds without incurring additional sales charges.
After consideration of the foregoing factors, among others, the Board concluded that the nature, extent and quality of services provided by each Adviser and the Sub-adviser, taken as a whole, are appropriate and consistent with the terms of the applicable investment advisory agreement and the applicable sub-advisory agreement.
Fund Performance
The Board compared the Fund’s investment performance to that of comparable funds identified by an independent data provider (the peer group), as well as an appropriate benchmark index. The Board’s review included comparative performance data with respect to the Fund for the one-, three-, five- and ten-year periods ended December 31, 2021. In this regard, the Board noted that the performance of the Fund was consistent with the median performance of the Fund’s peer group for the three-year period. The Board also noted that the performance of the Fund was lower than its benchmark index for the three-year period. The Board concluded that the performance of the Fund was satisfactory.
Management Fees and Expenses
The Board considered contractual fee rates payable by the Portfolio and by the Fund for advisory and administrative services (referred to collectively as “management fees”). As part of its review, the Board considered the Fund’s management fees and total expense ratio for the one-year period ended December 31, 2021, as compared to those of comparable funds, before and after giving effect to any undertaking to waive fees or reimburse expenses. The Board also considered factors that had an impact on the Fund’s total expense ratio relative to comparable funds.
After considering the foregoing information, and in light of the nature, extent and quality of the services provided by each Adviser and the Sub-adviser, the Board concluded that the management fees charged for advisory and related services are reasonable.
Profitability and “Fall-Out” Benefits
The Board considered the level of profits realized by each Adviser and relevant affiliates thereof, including the Sub-adviser, in providing investment advisory and administrative services to the Fund, to the Portfolio and to all Eaton Vance Funds as a group. The Board considered the level of profits realized without regard to marketing support or other payments by each Adviser and its affiliates to third parties in respect of distribution or other services.
Parametric
Tax-Managed International Equity Fund
October 31, 2022
Board of Trustees’ Contract Approval — continued
The Board concluded that, in light of the foregoing factors and the nature, extent and quality of the services rendered, the profits realized by each Adviser and its affiliates, including the Sub-adviser, are deemed not to be excessive.
The Board also considered direct or indirect fall-out benefits received by each Adviser and its affiliates, including the Sub-adviser, in connection with their respective relationships with the Fund and the Portfolio, including the benefits of research services that may be available to each Adviser or the Sub-adviser as a result of securities transactions effected for the Fund and the Portfolio and other investment advisory clients.
Economies of Scale
In reviewing management fees and profitability, the Board also considered the extent to which the applicable Adviser and its affiliates, on the one hand, and the Fund and the Portfolio, on the other hand, can expect to realize benefits from economies of scale as the assets of the Fund and the Portfolio increase. The Board acknowledged the difficulty in accurately measuring the benefits resulting from economies of scale, if any, with respect to the management of any specific fund or group of funds. The Board reviewed data summarizing the increases and decreases in the assets of the Fund and of all Eaton Vance Funds as a group over various time periods, and evaluated the extent to which the total expense ratio of the Fund and the profitability of each Adviser and its affiliates may have been affected by such increases or decreases. Based upon the foregoing, the Board concluded that the Fund currently shares in the benefits from economies of scale, if any, when they are realized by each Adviser. The Board also concluded that the structure of the advisory fees, which include breakpoints at several asset levels, will allow the Fund and the Portfolio to continue to benefit from any economies of scale in the future.
Parametric
Tax-Managed International Equity Fund
October 31, 2022
Liquidity Risk Management Program
The Fund has implemented a written liquidity risk management program (Program) and related procedures to manage its liquidity in accordance with Rule 22e-4 under the Investment Company Act of 1940, as amended (Liquidity Rule). The Liquidity Rule defines “liquidity risk” as the risk that a fund could not meet requests to redeem shares issued by the fund without significant dilution of the remaining investors’ interests in the fund. The Fund’s Board of Trustees/Directors has designated the investment adviser to serve as the administrator of the Program and the related procedures. The administrator has established a Liquidity Risk Management Oversight Committee (Committee) to perform the functions necessary to administer the Program. As part of the Program, the administrator is responsible for identifying illiquid investments and categorizing the relative liquidity of the Fund’s investments in accordance with the Liquidity Rule. Under the Program, the administrator assesses, manages, and periodically reviews the Fund’s liquidity risk, and is responsible for making certain reports to the Fund’s Board of Trustees/Directors and the Securities and Exchange Commission (SEC) regarding the liquidity of the Fund’s investments, and to notify the Board of Trustees/Directors and the SEC of certain liquidity events specified in the Liquidity Rule. The liquidity of the Fund’s portfolio investments is determined based on a number of factors including, but not limited to, relevant market, trading and investment-specific considerations under the Program.
At a meeting of the Fund’s Board of Trustees/Directors on June 7, 2022, the Committee provided a written report to the Fund’s Board of Trustees/Directors pertaining to the operation, adequacy, and effectiveness of implementation of the Program, as well as the operation of the highly liquid investment minimum (if applicable) for the period January 1, 2021 through December 31, 2021 (Review Period). The Program operated effectively during the Review Period, supporting the administrator’s ability to assess, manage and monitor Fund liquidity risk, including during periods of market volatility and net redemptions. During the Review Period, the Fund met redemption requests on a timely basis.
There can be no assurance that the Program will achieve its objectives in the future. Please refer to the Fund’s prospectus for more information regarding the Fund’s exposure to liquidity risk and other principal risks to which an investment in the Fund may be subject.
Parametric
Tax-Managed International Equity Fund
October 31, 2022
Management and Organization
Fund Management. The Trustees of Eaton Vance Mutual Funds Trust (the Trust) and Tax-Managed International Equity Portfolio (the Portfolio) are responsible for the overall management and supervision of the Trust's and the Portfolio's affairs. The Board members and officers of the Trust and the Portfolio are listed below. Except as indicated, each individual has held the office shown or other offices in the same company for the last five years. Board members hold indefinite terms of office. Each Trustee holds office until his or her successor is elected and qualified, subject to a prior death, resignation, retirement, disqualification or removal. Under the terms of the Fund's and the Portfolio's current Trustee retirement policy, an Independent Trustee must retire and resign as a Trustee on the earlier of: (i) the first day of July following his or her 74th birthday; or (ii), with limited exception, December 31st of the 20th year in which he or she has served as a Trustee. However, if such retirement and resignation would cause the Fund and the Portfolio to be out of compliance with Section 16 of the 1940 Act or any other regulations or guidance of the SEC, then such retirement and resignation will not become effective until such time as action has been taken for the Fund and the Portfolio to be in compliance therewith. The “noninterested Trustees” consist of those Trustees who are not “interested persons” of the Trust and the Portfolio, as that term is defined under the 1940 Act. The business address of each Board member and officer is Two International Place, Boston, Massachusetts 02110. As used below, “BMR” refers to Boston Management and Research, “EVC” refers to Eaton Vance Corp., “EV” refers to EV LLC, “EVM” refers to Eaton Vance Management and “EVD” refers to Eaton Vance Distributors, Inc. EV is the trustee of each of EVM and BMR. Effective March 1, 2021, each of EVM, BMR, EVD and EV are indirect, wholly owned subsidiaries of Morgan Stanley. Each officer affiliated with EVM may hold a position with other EVM affiliates that is comparable to his or her position with EVM listed below. Each Trustee oversees 135 funds (with the exception of Mr. Bowser who oversees 110 funds) in the Eaton Vance fund complex (including both funds and portfolios in a hub and spoke structure).
| Name and Year of Birth | Trust/Portfolio
Position(s) | Length of Service | Principal Occupation(s) and Other Directorships
During Past Five Years and Other Relevant Experience |
| Interested Trustee |
Thomas E. Faust Jr.
1958 | Trustee | Since 2007 | Chairman of Morgan Stanley Investment Management, Inc. (MSIM), member of the Board of Managers and President of EV (since 2021), Chief Executive Officer of EVM and BMR. Formerly, Chairman, Chief Executive Officer (2007-2021) and President (2006-2021) of EVC and Director of EVD (2007-2022). Mr. Faust is an interested person because of his positions with EVM, BMR, EVC and EV, which are affiliates of the Trust and the Portfolio.
Other Directorships. Formerly, Director of EVC (2007-2021) and Hexavest Inc. (investment management firm) (2012-2021). |
| Noninterested Trustees |
Alan C. Bowser(1)
1962 | Trustee | Since 2022 | Chief Diversity Officer, Partner and a member of the Operating Committee, and formerly served as Senior Advisor on Diversity and Inclusion for the firm’s chief executive officer, Co-Head of the Americas Region, and Senior Client Advisor of Bridgewater Associates, an asset management firm (2011- present).
Other Directorships. None. |
Mark R. Fetting
1954 | Trustee | Since 2016 | Private investor. Formerly held various positions at Legg Mason, Inc. (investment management firm) (2000-2012), including President, Chief Executive Officer, Director and Chairman (2008-2012), Senior Executive Vice President (2004-2008) and Executive Vice President (2001-2004). Formerly, President of Legg Mason family of funds (2001-2008). Formerly, Division President and Senior Officer of Prudential Financial Group, Inc. and related companies (investment management firm) (1991-2000).
Other Directorships. None. |
Cynthia E. Frost
1961 | Trustee | Since 2014 | Private investor. Formerly, Chief Investment Officer of Brown University (university endowment) (2000-2012). Formerly, Portfolio Strategist for Duke Management Company (university endowment manager) (1995-2000). Formerly, Managing Director, Cambridge Associates (investment consulting company) (1989-1995). Formerly, Consultant, Bain and Company (management consulting firm) (1987- 1989). Formerly, Senior Equity Analyst, BA Investment Management Company (1983-1985).
Other Directorships. None. |
George J. Gorman
1952 | Chairperson of the
Board and Trustee | Since 2021
(Chairperson) and 2014 (Trustee) | Principal at George J. Gorman LLC (consulting firm). Formerly, Senior Partner at Ernst & Young LLP (a registered public accounting firm) (1974-2009).
Other Directorships. None. |
Parametric
Tax-Managed International Equity Fund
October 31, 2022
Management and Organization — continued
| Name and Year of Birth | Trust/Portfolio
Position(s) | Length of Service | Principal Occupation(s) and Other Directorships
During Past Five Years and Other Relevant Experience |
| Noninterested Trustees (continued) |
Valerie A. Mosley
1960 | Trustee | Since 2014 | Chairwoman and Chief Executive Officer of Valmo Ventures (a consulting and investment firm). Founder of Upward Wealth, Inc., dba BrightUp, a fintech platform. Formerly, Partner and Senior Vice President, Portfolio Manager and Investment Strategist at Wellington Management Company, LLP (investment management firm) (1992-2012). Formerly, Chief Investment Officer, PG Corbin Asset Management (1990-1992). Formerly worked in institutional corporate bond sales at Kidder Peabody (1986-1990).
Other Directorships. Director of DraftKings, Inc. (digital sports entertainment and gaming company) (since September 2020). Director of Envestnet, Inc. (provider of intelligent systems for wealth management and financial wellness) (since 2018). Formerly, Director of Dynex Capital, Inc. (mortgage REIT) (2013-2020) and Director of Groupon, Inc. (e-commerce provider) (2020-2022). |
Keith Quinton
1958 | Trustee | Since 2018 | Private investor, researcher and lecturer. Formerly, Independent Investment Committee Member at New Hampshire Retirement System (2017-2021). Formerly, Portfolio Manager and Senior Quantitative Analyst at Fidelity Investments (investment management firm) (2001-2014).
Other Directorships. Formerly, Director (2016-2021) and Chairman (2019-2021) of New Hampshire Municipal Bond Bank. |
Marcus L. Smith
1966 | Trustee | Since 2018 | Private investor and independent corporate director. Formerly, Chief Investment Officer, Canada (2012-2017), Chief Investment Officer, Asia (2010-2012), Director of Asian Research (2004-2010) and portfolio manager (2001-2017) at MFS Investment Management (investment management firm).
Other Directorships. Director of First Industrial Realty Trust, Inc. (an industrial REIT) (since 2021). Director of MSCI Inc. (global provider of investment decision support tools) (since 2017). Formerly, Director of DCT Industrial Trust Inc. (logistics real estate company) (2017-2018). |
Susan J. Sutherland
1957 | Trustee | Since 2015 | Private investor. Director of Ascot Group Limited and certain of its subsidiaries (insurance and reinsurance) (since 2017). Formerly, Director of Hagerty Holding Corp. (insurance) (2015-2018) and Montpelier Re Holdings Ltd. (insurance and reinsurance) (2013-2015). Formerly, Associate, Counsel and Partner at Skadden, Arps, Slate, Meagher & Flom LLP (law firm) (1982-2013).
Other Directorships. Director of Kairos Acquisition Corp. (insurance/InsurTech acquisition company) (since 2021). |
Scott E. Wennerholm
1959 | Trustee | Since 2016 | Private investor. Formerly, Trustee at Wheelock College (postsecondary institution) (2012-2018). Formerly, Consultant at GF Parish Group (executive recruiting firm) (2016-2017). Formerly, Chief Operating Officer and Executive Vice President at BNY Mellon Asset Management (investment management firm) (2005-2011). Formerly, Chief Operating Officer and Chief Financial Officer at Natixis Global Asset Management (investment management firm) (1997-2004). Formerly, Vice President at Fidelity Investments Institutional Services (investment management firm) (1994-1997).
Other Directorships. None. |
Nancy A. Wiser(1)
1967 | Trustee | Since 2022 | Formerly, Executive Vice President and the Global Head of Operations at Wells Fargo Asset Management (2011-2021).
Other Directorships. None. |
| Name and Year of Birth | Trust/Portfolio
Position(s) | Length of Service | Principal Occupation(s)
During Past Five Years |
| Principal Officers who are not Trustees |
Eric A. Stein
1980 | President of the Trust | Since 2020 | Vice President and Chief Investment Officer, Fixed Income of EVM and BMR. Prior to November 1, 2020, Mr. Stein was a co-Director of Eaton Vance’s Global Income Investments. Also Vice President of Calvert Research and Management (“CRM”). |
Edward J. Perkin
1971 | President of the Portfolio | Since 2014 | Chief Equity Investment Officer and Vice President of EVM and BMR since 2014. Also Vice President of CRM. |
Deidre E. Walsh
1971 | Vice President and Chief Legal Officer | Since 2009 | Vice President of EVM and BMR. Also Vice President of CRM. |
Parametric
Tax-Managed International Equity Fund
October 31, 2022
Management and Organization — continued
| Name and Year of Birth | Trust/Portfolio
Position(s) | Length of Service | Principal Occupation(s)
During Past Five Years |
| Principal Officers who are not Trustees (continued) |
James F. Kirchner
1967 | Treasurer | Since 2007 | Vice President of EVM and BMR. Also Vice President of CRM. |
Nicholas Di Lorenzo
1987 | Secretary | Since 2022 | Formerly, associate (2012-2021) and counsel (2022) at Dechert LLP. |
Richard F. Froio
1968 | Chief Compliance
Officer | Since 2017 | Vice President of EVM and BMR since 2017. Formerly Deputy Chief Compliance Officer (Adviser/Funds) and Chief Compliance Officer (Distribution) at PIMCO (2012-2017) and Managing Director at BlackRock/Barclays Global Investors (2009-2012). |
(1) Mr. Bowser and Ms. Wiser began serving as Trustees effective April 4, 2022.
The SAI for the Fund includes additional information about the Trustees and officers of the Fund and the Portfolio and can be obtained without charge on Eaton Vance’s website at www.eatonvance.com or by calling 1-800-260-0761.
| FACTS | WHAT DOES EATON VANCE DO WITH YOUR
PERSONAL INFORMATION? |
| Why? | Financial companies choose how they share your personal information. Federal law gives consumers the right to limit some but not all sharing. Federal law also requires us to tell you how we collect, share, and protect your personal information. Please read this notice carefully to understand what we do. |
| |
| What? | The types of personal information we collect and share depend on the product or service you have with us. This information can include:■ Social Security number and income
■ investment experience and risk tolerance
■ checking account number and wire transfer instructions |
| |
| How? | All financial companies need to share customers’ personal information to run their everyday business. In the section below, we list the reasons financial companies can share their customers’ personal information; the reasons Eaton Vance chooses to share; and whether you can limit this sharing. |
Reasons we can share your
personal information | Does Eaton Vance
share? | Can you limit
this sharing? |
| For our everyday business purposes — such as to process your transactions, maintain your account(s), respond to court orders and legal investigations, or report to credit bureaus | Yes | No |
| For our marketing purposes — to offer our products and services to you | Yes | No |
| For joint marketing with other financial companies | No | We don’t share |
| For our investment management affiliates’ everyday business purposes — information about your transactions, experiences, and creditworthiness | Yes | Yes |
| For our affiliates’ everyday business purposes — information about your transactions and experiences | Yes | No |
| For our affiliates’ everyday business purposes — information about your creditworthiness | No | We don’t share |
| For our investment management affiliates to market to you | Yes | Yes |
| For our affiliates to market to you | No | We don’t share |
| For nonaffiliates to market to you | No | We don’t share |
To limit our
sharing | Call toll-free 1-800-262-1122 or email: EVPrivacy@eatonvance.comPlease note:If you are a new customer, we can begin sharing your information 30 days from the date we sent this notice. When you are no longer our customer, we continue to share your information as described in this notice. However, you can contact us at any time to limit our sharing. |
| Questions? | Call toll-free 1-800-262-1122 or email: EVPrivacy@eatonvance.com |
| Privacy Notice — continued | April 2021 |
| Who we are |
| Who is providing this notice? | Eaton Vance Management, Eaton Vance Distributors, Inc., Eaton Vance Trust Company, Eaton Vance Management (International) Limited, Eaton Vance Advisers International Ltd., Eaton Vance Global Advisors Limited, Eaton Vance Management’s Real Estate Investment Group, Boston Management and Research, Calvert Research and Management, Eaton Vance and Calvert Fund Families and our investment advisory affiliates (“Eaton Vance”) (see Investment Management Affiliates definition below) |
| What we do |
How does Eaton Vance
protect my personal
information? | To protect your personal information from unauthorized access and use, we use security measures that comply with federal law. These measures include computer safeguards and secured files and buildings. We have policies governing the proper handling of customer information by personnel and requiring third parties that provide support to adhere to appropriate security standards with respect to such information. |
How does Eaton Vance
collect my personal
information? | We collect your personal information, for example, when you■ open an account or make deposits or withdrawals from your account
■ buy securities from us or make a wire transfer
■ give us your contact informationWe also collect your personal information from others, such as credit bureaus, affiliates, or other companies. |
| Why can’t I limit all sharing? | Federal law gives you the right to limit only■ sharing for affiliates’ everyday business purposes — information about your creditworthiness
■ affiliates from using your information to market to you
■ sharing for nonaffiliates to market to youState laws and individual companies may give you additional rights to limit sharing. See below for more on your rights under state law. |
| Definitions |
Investment Management
Affiliates | Eaton Vance Investment Management Affiliates include registered investment advisers, registered broker- dealers, and registered and unregistered funds. Investment Management Affiliates does not include entities associated with Morgan Stanley Wealth Management, such as Morgan Stanley Smith Barney LLC and Morgan Stanley & Co. |
| Affiliates | Companies related by common ownership or control. They can be financial and nonfinancial companies.■ Our affiliates include companies with a Morgan Stanley name and financial companies such as Morgan Stanley Smith Barney LLC and Morgan Stanley & Co. |
| Nonaffiliates | Companies not related by common ownership or control. They can be financial and nonfinancial companies.■ Eaton Vance does not share with nonaffiliates so they can market to you. |
| Joint marketing | A formal agreement between nonaffiliated financial companies that together market financial products or services to you.■ Eaton Vance doesn’t jointly market. |
| Other important information |
| Vermont: Except as permitted by law, we will not share personal information we collect about Vermont residents with Nonaffiliates unless you provide us with your written consent to share such information.California: Except as permitted by law, we will not share personal information we collect about California residents with Nonaffiliates and we will limit sharing such personal information with our Affiliates to comply with California privacy laws that apply to us. |
Delivery of Shareholder Documents. The Securities and Exchange Commission (SEC) permits funds to deliver only one copy of shareholder documents, including prospectuses, proxy statements and shareholder reports, to fund investors with multiple accounts at the same residential or post office box address. This practice is often called “householding” and it helps eliminate duplicate mailings to shareholders. Eaton Vance, or your financial intermediary, may household the mailing of your documents indefinitely unless you instruct Eaton Vance, or your financial intermediary, otherwise. If you would prefer that your Eaton Vance documents not be householded, please contact Eaton Vance at 1-800-260-0761, or contact your financial intermediary. Your instructions that householding not apply to delivery of your Eaton Vance documents will typically be effective within 30 days of receipt by Eaton Vance or your financial intermediary.
Portfolio Holdings. Each Eaton Vance Fund and its underlying Portfolio(s) (if applicable) files a schedule of portfolio holdings on Part F to Form N-PORT with the SEC. Certain information filed on Form N-PORT may be viewed on the Eaton Vance website at www.eatonvance.com, by calling Eaton Vance at 1-800-260-0761 or in the EDGAR database on the SEC’s website at www.sec.gov.
Proxy Voting. From time to time, funds are required to vote proxies related to the securities held by the funds. The Eaton Vance Funds or their underlying Portfolios (if applicable) vote proxies according to a set of policies and procedures approved by the Funds’ and Portfolios’ Boards. You may obtain a description of these policies and procedures and information on how the Funds or Portfolios voted proxies relating to portfolio securities during the most recent 12-month period ended June 30, without charge, upon request, by calling 1-800-260-0761 and by accessing the SEC’s website at www.sec.gov.
This Page Intentionally Left Blank
This Page Intentionally Left Blank
This Page Intentionally Left Blank
Investment Adviser of Tax-Managed International Equity Portfolio
Boston Management and Research
Two International Place
Boston, MA 02110
Investment Sub-Adviser of Parametric Tax-Managed International
Equity Fund and Tax-Managed International Equity Portfolio
Parametric Portfolio Associates LLC
800 Fifth Avenue, Suite 2800
Seattle, WA 98104
Investment Adviser and Administrator of Parametric Tax-Managed
International Equity Fund
Eaton Vance Management
Two International Place
Boston, MA 02110
Principal Underwriter*
Eaton Vance Distributors, Inc.
Two International Place
Boston, MA 02110
(617) 482-8260
Custodian
State Street Bank and Trust Company
State Street Financial Center, One Lincoln Street
Boston, MA 02111
Transfer Agent
BNY Mellon Investment Servicing (US) Inc.
Attn: Eaton Vance Funds
P.O. Box 9653
Providence, RI 02940-9653
(800) 260-0761
Independent Registered Public Accounting Firm
Deloitte & Touche LLP
200 Berkeley Street
Boston, MA 02116-5022
Fund Offices
Two International Place
Boston, MA 02110
*FINRA BrokerCheck. Investors may check the background of their Investment Professional by contacting the Financial Industry Regulatory Authority (FINRA). FINRA BrokerCheck is a free tool to help investors check the professional background of current and former FINRA-registered securities firms and brokers. FINRA BrokerCheck is available by calling 1-800-289-9999 and at www.FINRA.org. The FINRA BrokerCheck brochure describing this program is available to investors at www.FINRA.org.
Eaton Vance
Tax-Managed Multi-Cap Growth Fund
Annual Report
October 31, 2022
Commodity Futures Trading Commission Registration. The Commodity Futures Trading Commission (“CFTC”) has adopted regulations that subject registered investment companies and advisers to regulation by the CFTC if a fund invests more than a prescribed level of its assets in certain CFTC-regulated instruments (including futures, certain options and swap agreements) or markets itself as providing investment exposure to such instruments. The investment adviser has claimed an exclusion from the definition of “commodity pool operator” under the Commodity Exchange Act with respect to its management of the Fund. Accordingly, neither the Fund nor the adviser with respect to the operation of the Fund is subject to CFTC regulation. Because of its management of other strategies, the Fund's adviser is registered with the CFTC as a commodity pool operator. The adviser is also registered as a commodity trading advisor.
Fund shares are not insured by the FDIC and are not deposits or other obligations of, or guaranteed by, any depository institution. Shares are subject to investment risks, including possible loss of principal invested.
This report must be preceded or accompanied by a current summary prospectus or prospectus. Before investing, investors should consider carefully the investment objective, risks, and charges and expenses of a mutual fund. This and other important information is contained in the summary prospectus and prospectus, which can be obtained from a financial intermediary. Prospective investors should read the prospectus carefully before investing. For further information, please call 1-800-262-1122.
Annual Report October 31, 2022
Eaton Vance
Tax-Managed Multi-Cap Growth Fund
Eaton Vance
Tax-Managed Multi-Cap Growth Fund
October 31, 2022
Management’s Discussion of Fund Performance†
Economic and Market Conditions
The 12-month period starting November 1, 2021, was dominated by the ongoing effects of one black swan event -- the COVID-19 pandemic -- and fallout from another -- Russia’s invasion of Ukraine in February 2022.
In the opening months of the period, stock investors as well as consumers generally appeared to take a “glass is half full” approach. Despite the appearance of a more contagious COVID-19 variant, the highest inflation readings in four decades, and the U.S. Federal Reserve’s (the Fed’s) announcement that it would begin tapering bond purchases that had supported economic growth, major U.S. equity indexes repeatedly closed at new all-time highs during the final months of 2021. As consumers rushed to spend money saved earlier in the pandemic, Mastercard, Inc. reported its highest retail sales on record during the 2021 holiday season.
But as the new year began, investors appeared to reevaluate the twin threats of inflation and interest rate hikes, and stock performance turned negative. In February, Russia’s invasion of Ukraine sent shock waves through U.S. and global markets, exacerbating inflationary pressures on energy and food costs.
As the Fed’s outlook on inflation worsened from “transitory” to “persistent,” investors began to expect the Fed would raise interest rates at every 2022 policy meeting and, in turn, worried that aggressive rate hikes could tip the U.S. economy into recession. At its June, July, and September meetings, the Fed hiked the federal funds rate 0.75% each time -- to a 3.00%-3.25% range -- its first moves of that magnitude since 1994. Higher interest rates, inflation, and recessionary worries drove stock prices down, with rate-sensitive technology stocks -- star performers earlier in the pandemic -- suffering some of the worst declines.
As the period came to a close in October 2022, however, U.S. stocks delivered positive performance for the first time in months -- driven by a combination of better-than-expected company earnings; improving investor sentiment that stocks had been oversold during the August-September 2022 market pullback; and hope that after three aggressive rate hikes, the Fed might announce a smaller rate increase at its next meeting in November.
For the period as a whole, the blue-chip Dow Jones Industrial Average® returned -6.74%; the S&P 500® Index, a broad measure of U.S. stocks, returned -14.61%; and the technology-laden Nasdaq Composite Index returned -28.56%.
Fund Performance
For the 12-month period ended October 31, 2022, Eaton Vance Tax-Managed Multi-Cap Growth Fund (the Fund) returned -27.42% for Class A shares at net asset value (NAV), underperforming its benchmark, the Russell 3000® Growth Index (the Index), which returned -24.67%.
Meta Platforms, Inc. (Meta), formerly known as Facebook, was a leading detractor from returns relative to the Index during the period. Meta’s share price declined as its revenue growth slowed, falling short of the previous year’s performance. Investor concerns about Meta’s costly investment in its “Metaverse” virtual-reality initiative also weighed on the social media company’s stock price.
Elsewhere, several other stocks detracted from relative returns because rising interest rates drove down the value of future cash flows and weakened share prices, despite relatively strong company fundamentals. These firms included Okta, Inc., a provider of security software; and Adobe, Inc. (Adobe), a producer of software for creative professionals. Adobe’s share price also fell on concerns over the company’s acquisition cost of Figma, an online collaborative design firm.
UnitedHealth Group, Inc. (UnitedHealth), a leading managed care company, contributed to relative returns. UnitedHealth’s stock price rose as the company, which benefited from its vertically integrated business through Optum, delivered sustained earnings growth during a period of softening economic conditions that weakened other areas of health care.
Vertex Pharmaceuticals, Inc. (Vertex), a leader in treatments for cystic fibrosis (CF), has a portfolio of long-standing and new patented drugs. Vertex’s stock price rose during the period largely on the strength of sales of its Trikafta therapy, which benefited from global expansion and its launch among younger patients. Setbacks for competitors of Vertex’s CF drug drove up its share price further during the period.
The Fund also benefited from its lack of exposure to Nvidia Corp. (Nvidia), a producer of graphics processor units. Nvidia’s share price weakened on expectations that company growth would slow as interest rates rose, depressing the value of future cash flows.
See Endnotes and Additional Disclosures in this report.
Past performance is no guarantee of future results. Returns are historical and are calculated by determining the percentage change in net asset value (NAV) or offering price (as applicable) with all distributions reinvested. Furthermore, returns do not reflect the deduction of taxes that shareholders may have to pay on Fund distributions or upon the redemption of Fund shares. Investment return and principal value will fluctuate so that shares, when redeemed, may be worth more or less than their original cost. Performance for periods less than or equal to one year is cumulative. Performance is for the stated time period only; due to market volatility, current Fund performance may be lower or higher than the quoted return. For performance as of the most recent month-end, please refer to eatonvance.com.
Eaton Vance
Tax-Managed Multi-Cap Growth Fund
October 31, 2022
Performance
Portfolio Manager(s) Douglas R. Rogers, CFA, CMT
| % Average Annual Total Returns1,2 | Class
Inception Date | Performance
Inception Date | One Year | Five Years | Ten Years |
| Class A at NAV | 06/30/2000 | 06/30/2000 | (27.42)% | 9.29% | 11.31% |
| Class A with 5.25% Maximum Sales Charge | — | — | (31.23) | 8.12 | 10.71 |
| Class C at NAV | 07/10/2000 | 07/10/2000 | (27.95) | 8.47 | 10.64 |
| Class C with 1% Maximum Deferred Sales Charge | — | — | (28.64) | 8.47 | 10.64 |
|
| Russell 3000® Growth Index | — | — | (24.67)% | 12.07% | 14.36% |
| S&P 500® Index | — | — | (14.61) | 10.44 | 12.78 |
| % After-Tax Returns with Maximum Sales Charge2 | Class
Inception Date | Performance
Inception Date | One Year | Five Years | Ten Years |
| Class A After Taxes on Distributions | 06/30/2000 | 06/30/2000 | (31.66)% | 7.64% | 10.46% |
| Class A After Taxes on Distributions and Sale of Fund Shares | — | — | (17.78) | 6.69 | 9.21 |
| Class C After Taxes on Distributions | 07/10/2000 | 07/10/2000 | (29.18) | 7.90 | 10.37 |
| Class C After Taxes on Distributions and Sale of Fund Shares | — | — | (16.06) | 7.00 | 9.14 |
| % Total Annual Operating Expense Ratios3 | Class A | Class C |
| | 1.25% | 2.00% |
Growth of $10,000
This graph shows the change in value of a hypothetical investment of $10,000 in Class A of the Fund for the period indicated. For comparison, the same investment is shown in the indicated index.
| Growth of Investment | Amount Invested | Period Beginning | At NAV | With Maximum Sales Charge |
| Class C | $10,000 | 10/31/2012 | $27,491 | N.A. |
See Endnotes and Additional Disclosures in this report.
Past performance is no guarantee of future results. Returns are historical and are calculated by determining the percentage change in net asset value (NAV) or offering price (as applicable) with all distributions reinvested. Furthermore, returns do not reflect the deduction of taxes that shareholders may have to pay on Fund distributions or upon the redemption of Fund shares. Investment return and principal value will fluctuate so that shares, when redeemed, may be worth more or less than their original cost. Performance for periods less than or equal to one year is cumulative. Performance is for the stated time period only; due to market volatility, current Fund performance may be lower or higher than the quoted return. For performance as of the most recent month-end, please refer to eatonvance.com.
Eaton Vance
Tax-Managed Multi-Cap Growth Fund
October 31, 2022
| Sector Allocation (% of net assets)1 |
| Top 10 Holdings (% of net assets)1 |
| Apple, Inc. | 11.5% |
| Microsoft Corp. | 9.7 |
| Amazon.com, Inc. | 7.3 |
| Visa, Inc., Class A | 4.8 |
| UnitedHealth Group, Inc. | 4.8 |
| Alphabet, Inc., Class C | 3.9 |
| Alphabet, Inc., Class A | 3.9 |
| Accenture PLC, Class A | 2.9 |
| Vertex Pharmaceuticals, Inc. | 2.7 |
| Adobe, Inc. | 2.5 |
| Total | 54.0% |
Footnotes:
Fund invests in an affiliated investment company (Portfolio) with the same objective(s) and policies as the Fund. References to investments are to the Portfolio’s holdings.
| 1 | Excludes cash and cash equivalents. |
Eaton Vance
Tax-Managed Multi-Cap Growth Fund
October 31, 2022
Endnotes and Additional Disclosures
| † | The views expressed in this report are those of the portfolio manager(s) and are current only through the date stated at the top of this page. These views are subject to change at any time based upon market or other conditions, and Eaton Vance and the Fund(s) disclaim any responsibility to update such views. These views may not be relied upon as investment advice and, because investment decisions are based on many factors, may not be relied upon as an indication of trading intent on behalf of any Eaton Vance fund. This commentary may contain statements that are not historical facts, referred to as “forward-looking statements.” The Fund’s actual future results may differ significantly from those stated in any forward-looking statement, depending on factors such as changes in securities or financial markets or general economic conditions, the volume of sales and purchases of Fund shares, the continuation of investment advisory, administrative and service contracts, and other risks discussed from time to time in the Fund’s filings with the Securities and Exchange Commission. |
| | |
| 1 | Russell 3000® Growth Index is an unmanaged index of the broad growth segment of the U.S. equity universe. S&P 500® Index is an unmanaged index of large-cap stocks commonly used as a measure of U.S. stock market performance. S&P Dow Jones Indices are a product of S&P Dow Jones Indices LLC (“S&P DJI”) and have been licensed for use. S&P® and S&P 500® are registered trademarks of S&P DJI; Dow Jones® is a registered trademark of Dow Jones Trademark Holdings LLC (“Dow Jones”); S&P DJI, Dow Jones and their respective affiliates do not sponsor, endorse, sell or promote the Fund, will not have any liability with respect thereto and do not have any liability for any errors, omissions, or interruptions of the S&P Dow Jones Indices. Unless otherwise stated, index returns do not reflect the effect of any applicable sales charges, commissions, expenses, taxes or leverage, as applicable. It is not possible to invest directly in an index. |
| 2 | Total Returns at NAV do not include applicable sales charges. If sales charges were deducted, the returns would be lower. Total Returns shown with maximum sales charge reflect the stated maximum sales charge. Unless otherwise stated, performance does not reflect the deduction of taxes on Fund distributions or redemptions of Fund shares. After-tax returns are calculated using certain assumptions, including using the highest historical individual federal income tax rates, and do not reflect the impact of state/local taxes. Actual after-tax returns depend on a shareholder’s tax situation and the actual characterization of distributions and may differ from those shown. After-tax returns are not relevant to shareholders who hold shares in tax-deferred accounts or shares held by nontaxable entities. Return After Taxes on Distributions may be the same as Return Before Taxes for the same period because no taxable distributions were made during that period. Return After Taxes on Distributions and Sale of Fund Shares may be greater than or equal to Return After Taxes on Distributions for the same period because of losses realized on the sale of Fund shares. The Fund’s after-tax returns also may reflect foreign tax credits passed by the Fund to its shareholders.Effective November 5, 2020, Class C shares automatically convert to Class A shares eight years after purchase. The average annual total returns listed for Class C reflect conversion to Class A shares after eight years. Prior to November 5, 2020, Class C shares automatically converted to Class A shares ten years after purchase. |
| 3 | Source: Fund prospectus. The expense ratios for the current reporting period can be found in the Financial Highlights section of this report. Performance reflects expenses waived and/or reimbursed, if applicable. Without such waivers and/or reimbursements, performance would have been lower. |
| | Fund profile subject to change due to active management. |
| | Additional Information |
| | Dow Jones Industrial Average® is a price-weighted average of 30 blue-chip stocks that are generally the leaders in their industry. Nasdaq Composite Index is a market capitalization-weighted index of all domestic and international securities listed on Nasdaq. Source: Nasdaq, Inc. The information is provided by Nasdaq (with its affiliates, are referred to as the “Corporations”) and Nasdaq’s third party licensors on an “as is” basis and the Corporations make no guarantees and bear no liability of any kind with respect to the information or the Fund. |
Eaton Vance
Tax-Managed Multi-Cap Growth Fund
October 31, 2022
Example
As a Fund shareholder, you incur two types of costs: (1) transaction costs, including sales charges (loads) on purchases and redemption fees (if applicable); and (2) ongoing costs, including management fees; distribution and/or service fees; and other Fund expenses. This Example is intended to help you understand your ongoing costs (in dollars) of Fund investing and to compare these costs with the ongoing costs of investing in other mutual funds. The Example is based on an investment of $1,000 invested at the beginning of the period and held for the entire period (May 1, 2022 to October 31, 2022).
Actual Expenses
The first section of the table below provides information about actual account values and actual expenses. You may use the information in this section, together with the amount you invested, to estimate the expenses that you paid over the period. Simply divide your account value by $1,000 (for example, an $8,600 account value divided by $1,000 = 8.6), then multiply the result by the number in the first section under the heading entitled “Expenses Paid During Period” to estimate the expenses you paid on your account during this period.
Hypothetical Example for Comparison Purposes
The second section of the table below provides information about hypothetical account values and hypothetical expenses based on the actual Fund expense ratio and an assumed rate of return of 5% per year (before expenses), which is not the actual Fund return. The hypothetical account values and expenses may not be used to estimate the actual ending account balance or expenses you paid for the period. You may use this information to compare the ongoing costs of investing in your Fund and other funds. To do so, compare this 5% hypothetical example with the 5% hypothetical examples that appear in the shareholder reports of the other funds.
Please note that the expenses shown in the table are meant to highlight your ongoing costs only and do not reflect any transactional costs, such as sales charges (loads) or redemption fees (if applicable). Therefore, the second section of the table is useful in comparing ongoing costs only, and will not help you determine the relative total costs of owning different funds. In addition, if these transactional costs were included, your costs would be higher.
| | Beginning
Account Value
(5/1/22) | Ending
Account Value
(10/31/22) | Expenses Paid
During Period*
(5/1/22 – 10/31/22) | Annualized
Expense
Ratio |
| Actual | | | | |
| Class A | $1,000.00 | $ 900.90 | $ 6.32 | 1.32% |
| Class C | $1,000.00 | $ 897.80 | $ 9.90 | 2.07% |
| |
| Hypothetical | | | | |
| (5% return per year before expenses) | | | | |
| Class A | $1,000.00 | $1,018.55 | $ 6.72 | 1.32% |
| Class C | $1,000.00 | $1,014.77 | $10.51 | 2.07% |
| * | Expenses are equal to the Fund's annualized expense ratio for the indicated Class, multiplied by the average account value over the period, multiplied by 184/365 (to reflect the one-half year period). The Example assumes that the $1,000 was invested at the net asset value per share determined at the close of business on April 30, 2022. The Example reflects the expenses of both the Fund and the Portfolio. |
Eaton Vance
Tax-Managed Multi-Cap Growth Fund
October 31, 2022
Statement of Assets and Liabilities
| | October 31, 2022 |
| Assets | |
| Investment in Tax-Managed Multi-Cap Growth Portfolio, at value (identified cost $37,745,045) | $ 100,744,362 |
| Receivable for Fund shares sold | 160 |
| Total assets | $100,744,522 |
| Liabilities | |
| Payable for Fund shares redeemed | $ 52,374 |
| Payable to affiliates: | |
| Administration fee | 12,605 |
| Distribution and service fees | 25,696 |
| Trustees' fees | 43 |
| Accrued expenses | 65,498 |
| Total liabilities | $ 156,216 |
| Net Assets | $100,588,306 |
| Sources of Net Assets | |
| Paid-in capital | $ 48,618,512 |
| Distributable earnings | 51,969,794 |
| Net Assets | $100,588,306 |
| Class A Shares | |
| Net Assets | $ 93,206,464 |
| Shares Outstanding | 2,568,064 |
Net Asset Value and Redemption Price Per Share
(net assets ÷ shares of beneficial interest outstanding) | $ 36.29 |
Maximum Offering Price Per Share
(100 ÷ 94.75 of net asset value per share) | $ 38.30 |
| Class C Shares | |
| Net Assets | $ 7,381,842 |
| Shares Outstanding | 247,982 |
Net Asset Value and Offering Price Per Share*
(net assets ÷ shares of beneficial interest outstanding) | $ 29.77 |
| On sales of $50,000 or more, the offering price of Class A shares is reduced. |
| * | Redemption price per share is equal to the net asset value less any applicable contingent deferred sales charge. |
7
See Notes to Financial Statements.
Eaton Vance
Tax-Managed Multi-Cap Growth Fund
October 31, 2022
| | Year Ended |
| | October 31, 2022 |
| Investment Income | |
| Dividend income allocated from Portfolio (net of foreign taxes withheld of $12,975) | $ 589,453 |
| Securities lending income allocated from Portfolio, net | 2,860 |
| Expenses allocated from Portfolio | (868,080) |
| Total investment loss from Portfolio | $ (275,767) |
| Expenses | |
| Administration fee | $ 181,490 |
| Distribution and service fees: | |
| Class A | 277,797 |
| Class C | 98,745 |
| Trustees’ fees and expenses | 500 |
| Custodian fee | 18,537 |
| Transfer and dividend disbursing agent fees | 72,503 |
| Legal and accounting services | 34,725 |
| Printing and postage | 8,532 |
| Registration fees | 34,515 |
| ReFlow liquidity program fees | 11,251 |
| Miscellaneous | 8,630 |
| Total expenses | $ 747,225 |
| Net investment loss | $ (1,022,992) |
| Realized and Unrealized Gain (Loss) from Portfolio | |
| Net realized gain (loss): | |
| Investment transactions | $ 655,563(1) |
| Foreign currency transactions | 3 |
| Net realized gain | $ 655,566 |
| Change in unrealized appreciation (depreciation): | |
| Investments | $ (39,125,213) |
| Foreign currency | (35) |
| Net change in unrealized appreciation (depreciation) | $(39,125,248) |
| Net realized and unrealized loss | $(38,469,682) |
| Net decrease in net assets from operations | $(39,492,674) |
| (1) | Includes $1,699,231 of net realized gains from redemptions in-kind. |
8
See Notes to Financial Statements.
Eaton Vance
Tax-Managed Multi-Cap Growth Fund
October 31, 2022
Statements of Changes in Net Assets
| | Year Ended October 31, |
| | 2022 | 2021 |
| Increase (Decrease) in Net Assets | | |
| From operations: | | |
| Net investment loss | $ (1,022,992) | $ (1,231,778) |
| Net realized gain | 655,566 (1) | 6,942,068 (2) |
| Net change in unrealized appreciation (depreciation) | (39,125,248) | 33,267,557 |
| Net increase (decrease) in net assets from operations | $ (39,492,674) | $ 38,977,847 |
| Distributions to shareholders: | | |
| Class A | $ (4,198,521) | $ (3,595,423) |
| Class C | (485,564) | (477,758) |
| Total distributions to shareholders | $ (4,684,085) | $ (4,073,181) |
| Transactions in shares of beneficial interest: | | |
| Class A | $ (2,928,925) | $ 3,383,764 |
| Class C | (2,142,964) | (5,082,163) |
| Net decrease in net assets from Fund share transactions | $ (5,071,889) | $ (1,698,399) |
| Net increase (decrease) in net assets | $ (49,248,648) | $ 33,206,267 |
| Net Assets | | |
| At beginning of year | $ 149,836,954 | $ 116,630,687 |
| At end of year | $100,588,306 | $149,836,954 |
| (1) | Includes $1,699,231 of net realized gains from redemptions in-kind. |
| (2) | Includes $2,055,702 of net realized gains from redemptions in-kind. |
9
See Notes to Financial Statements.
Eaton Vance
Tax-Managed Multi-Cap Growth Fund
October 31, 2022
| | Class A |
| | Year Ended October 31, |
| | 2022 | 2021 | 2020 | 2019 | 2018 |
| Net asset value — Beginning of year | $ 51.600 | $ 39.630 | $ 32.250 | $ 29.220 | $ 26.040 |
| Income (Loss) From Operations | | | | | |
| Net investment loss(1) | $ (0.333) | $ (0.387) | $ (0.229) | $ (0.192) | $ (0.186) |
| Net realized and unrealized gain (loss) | (13.382) | 13.730 | 8.361 | 3.849 | 3.429 |
| Total income (loss) from operations | $(13.715) | $ 13.343 | $ 8.132 | $ 3.657 | $ 3.243 |
| Less Distributions | | | | | |
| From net realized gain | $ (1.595) | $ (1.373) | $ (0.752) | $ (0.627) | $ (0.063) |
| Total distributions | $ (1.595) | $ (1.373) | $ (0.752) | $ (0.627) | $ (0.063) |
| Net asset value — End of year | $ 36.290 | $ 51.600 | $ 39.630 | $32.250 | $29.220 |
| Total Return(2) | (27.42)% | 34.39% | 25.65% | 13.07% | 12.52% |
| Ratios/Supplemental Data | | | | | |
| Net assets, end of year (000’s omitted) | $ 93,206 | $136,537 | $101,649 | $ 82,914 | $ 64,579 |
| Ratios (as a percentage of average daily net assets):(3) | | | | | |
| Expenses | 1.28% (4) | 1.25% | 1.28% | 1.33% | 1.31% |
| Net investment loss | (0.79)% | (0.83)% | (0.64)% | (0.63)% | (0.63)% |
| Portfolio Turnover of the Portfolio | 0% (5) | 13% | 24% | 18% | 18% |
| (1) | Computed using average shares outstanding. |
| (2) | Returns are historical and are calculated by determining the percentage change in net asset value with all distributions reinvested and do not reflect the effect of sales charges. |
| (3) | Includes the Fund's share of the Portfolio's allocated expenses. |
| (4) | Includes a reduction by the investment adviser of a portion of the Portfolio's adviser fee due to the Portfolio’s investment in the Liquidity Fund (equal to less than 0.005% of average daily net assets for the year ended October 31, 2022). |
| (5) | Amount is less than 0.5%. |
10
See Notes to Financial Statements.
Eaton Vance
Tax-Managed Multi-Cap Growth Fund
October 31, 2022
Financial Highlights — continued
| | Class C |
| | Year Ended October 31, |
| | 2022 | 2021 | 2020 | 2019 | 2018 |
| Net asset value — Beginning of year | $ 42.920 | $ 33.410 | $ 27.510 | $ 25.210 | $ 22.640 |
| Income (Loss) From Operations | | | | | |
| Net investment loss(1) | $ (0.538) | $ (0.607) | $ (0.418) | $ (0.353) | $ (0.352) |
| Net realized and unrealized gain (loss) | (11.017) | 11.490 | 7.070 | 3.280 | 2.985 |
| Total income (loss) from operations | $(11.555) | $10.883 | $ 6.652 | $ 2.927 | $ 2.633 |
| Less Distributions | | | | | |
| From net realized gain | $ (1.595) | $ (1.373) | $ (0.752) | $ (0.627) | $ (0.063) |
| Total distributions | $ (1.595) | $ (1.373) | $ (0.752) | $ (0.627) | $ (0.063) |
| Net asset value — End of year | $ 29.770 | $42.920 | $33.410 | $27.510 | $25.210 |
| Total Return(2) | (27.95)% | 33.40% | 24.67% | 12.24% | 11.65% |
| Ratios/Supplemental Data | | | | | |
| Net assets, end of year (000’s omitted) | $ 7,382 | $ 13,300 | $ 14,982 | $ 14,216 | $ 24,706 |
| Ratios (as a percentage of average daily net assets):(3) | | | | | |
| Expenses | 2.03% (4) | 2.00% | 2.03% | 2.09% | 2.06% |
| Net investment loss | (1.53)% | (1.57)% | (1.39)% | (1.37)% | (1.38)% |
| Portfolio Turnover of the Portfolio | 0% (5) | 13% | 24% | 18% | 18% |
| (1) | Computed using average shares outstanding. |
| (2) | Returns are historical and are calculated by determining the percentage change in net asset value with all distributions reinvested and do not reflect the effect of sales charges. |
| (3) | Includes the Fund's share of the Portfolio's allocated expenses. |
| (4) | Includes a reduction by the investment adviser of a portion of the Portfolio's adviser fee due to the Portfolio’s investment in the Liquidity Fund (equal to less than 0.005% of average daily net assets for the year ended October 31, 2022). |
| (5) | Amount is less than 0.5%. |
11
See Notes to Financial Statements.
Eaton Vance
Tax-Managed Multi-Cap Growth Fund
October 31, 2022
Notes to Financial Statements
1 Significant Accounting Policies
Eaton Vance Tax-Managed Multi-Cap Growth Fund (the Fund) is a non-diversified series of Eaton Vance Mutual Funds Trust (the Trust). The Trust is a Massachusetts business trust registered under the Investment Company Act of 1940, as amended (the 1940 Act), as an open-end management investment company. The Fund offers two classes of shares. Class A shares are generally sold subject to a sales charge imposed at time of purchase. Class C shares are sold at net asset value and are generally subject to a contingent deferred sales charge (see Note 5). Effective November 5, 2020, Class C shares automatically convert to Class A shares eight years after their purchase as described in the Fund’s prospectus. Each class represents a pro-rata interest in the Fund, but votes separately on class-specific matters and (as noted below) is subject to different expenses. Realized and unrealized gains and losses and net investment income and losses, other than class-specific expenses, are allocated daily to each class of shares based on the relative net assets of each class to the total net assets of the Fund. Each class of shares differs in its distribution plan and certain other class-specific expenses. The Fund invests all of its investable assets in interests in Tax-Managed Multi-Cap Growth Portfolio (the Portfolio), a Massachusetts business trust, having the same investment objective and policies as the Fund. The value of the Fund’s investment in the Portfolio reflects the Fund’s proportionate interest in the net assets of the Portfolio (56.3% at October 31, 2022). The performance of the Fund is directly affected by the performance of the Portfolio. The financial statements of the Portfolio, including the portfolio of investments, are included elsewhere in this report and should be read in conjunction with the Fund’s financial statements.
The following is a summary of significant accounting policies of the Fund. The policies are in conformity with accounting principles generally accepted in the United States of America (U.S. GAAP). The Fund is an investment company and follows accounting and reporting guidance in the Financial Accounting Standards Board (FASB) Accounting Standards Codification Topic 946.
A Investment Valuation—Valuation of securities by the Portfolio is discussed in Note 1A of the Portfolio's Notes to Financial Statements, which are included elsewhere in this report.
B Income— The Fund's net investment income or loss consists of the Fund's pro-rata share of the net investment income or loss of the Portfolio, less all actual and accrued expenses of the Fund.
C Federal Taxes—The Fund's policy is to comply with the provisions of the Internal Revenue Code applicable to regulated investment companies and to distribute to shareholders each year substantially all of its net investment income, and all or substantially all of its net realized capital gains. Accordingly, no provision for federal income or excise tax is necessary.
As of October 31, 2022, the Fund had no uncertain tax positions that would require financial statement recognition, de-recognition, or disclosure. The Fund files a U.S. federal income tax return annually after its fiscal year-end, which is subject to examination by the Internal Revenue Service for a period of three years from the date of filing.
D Expenses—The majority of expenses of the Trust are directly identifiable to an individual fund. Expenses which are not readily identifiable to a specific fund are allocated taking into consideration, among other things, the nature and type of expense and the relative size of the funds.
E Use of Estimates—The preparation of the financial statements in conformity with U.S. GAAP requires management to make estimates and assumptions that affect the reported amounts of assets and liabilities at the date of the financial statements and the reported amounts of income and expense during the reporting period. Actual results could differ from those estimates.
F Indemnifications—Under the Trust’s organizational documents, its officers and Trustees may be indemnified against certain liabilities and expenses arising out of the performance of their duties to the Fund. Under Massachusetts law, if certain conditions prevail, shareholders of a Massachusetts business trust (such as the Trust) could be deemed to have personal liability for the obligations of the Trust. However, the Trust’s Declaration of Trust contains an express disclaimer of liability on the part of Fund shareholders and the By-laws provide that the Trust shall assume, upon request by the shareholder, the defense on behalf of any Fund shareholders. Moreover, the By-laws also provide for indemnification out of Fund property of any shareholder held personally liable solely by reason of being or having been a shareholder for all loss or expense arising from such liability. Additionally, in the normal course of business, the Fund enters into agreements with service providers that may contain indemnification clauses. The Fund's maximum exposure under these arrangements is unknown as this would involve future claims that may be made against the Fund that have not yet occurred.
G Other—Investment transactions are accounted for on a trade date basis.
Eaton Vance
Tax-Managed Multi-Cap Growth Fund
October 31, 2022
Notes to Financial Statements — continued
2 Distributions to Shareholders and Income Tax Information
It is the present policy of the Fund to make at least one distribution annually (normally in December) of all or substantially all of its net investment income and to distribute annually all or substantially all of its net realized capital gains. Distributions to shareholders are recorded on the ex-dividend date. Distributions are declared separately for each class of shares. Shareholders may reinvest income and capital gain distributions in additional shares of the same class of the Fund at the net asset value as of the ex-dividend date or, at the election of the shareholder, receive distributions in cash. Distributions to shareholders are determined in accordance with income tax regulations, which may differ from U.S. GAAP. As required by U.S. GAAP, only distributions in excess of tax basis earnings and profits are reported in the financial statements as a return of capital. Permanent differences between book and tax accounting relating to distributions are reclassified to paid-in capital. For tax purposes, distributions from short-term capital gains are considered to be from ordinary income.
The tax character of distributions declared for the years ended October 31, 2022 and October 31, 2021 was as follows:
| | Year Ended October 31, |
| | 2022 | 2021 |
| Long-term capital gains | $4,684,085 | $4,073,181 |
During the year ended October 31, 2022, distributable earnings was decreased by $2,816,526 and paid-in capital was increased by $2,816,526 due to differences between book and tax accounting, primarily for net operating losses and redemptions in-kind. These reclassifications had no effect on the net assets or net asset value per share of the Fund.
As of October 31, 2022, the components of distributable earnings (accumulated loss) on a tax basis were as follows:
| Deferred capital losses | $ (1,051,523) |
| Late year ordinary losses | (2,432,272) |
| Net unrealized appreciation | 55,453,589 |
| Distributable earnings | $51,969,794 |
At October 31, 2022, the Fund, for federal income tax purposes, had deferred capital losses of $1,051,523 which would reduce its taxable income arising from future net realized gains on investment transactions, if any, to the extent permitted by the Internal Revenue Code, and thus would reduce the amount of distributions to shareholders, which would otherwise be necessary to relieve the Fund of any liability for federal income or excise tax. The deferred capital losses are treated as arising on the first day of the Fund’s next taxable year and retain the same short-term or long-term character as when originally deferred. Of the deferred capital losses at October 31, 2022, $1,051,523 are short-term.
Additionally, at October 31, 2022, the Fund had a late year ordinary loss of $2,432,272 which it has elected to defer to the following taxable year pursuant to income tax regulations. Late year ordinary losses represent certain specified losses realized in that portion of a taxable year after October 31 that are treated as ordinary for tax purposes plus ordinary losses attributable to that portion of a taxable year after December 31.
3 Investment Adviser Fee and Other Transactions with Affiliates
The investment adviser fee is earned by Eaton Vance Management (EVM), an indirect, wholly-owned subsidiary of Morgan Stanley, as compensation for investment advisory services rendered to the Fund. The fee is computed at an annual rate as a percentage of the Fund’s average daily net assets that are not invested in other investment companies for which EVM or its affiliates serve as investment adviser and receive an advisory fee as follows and is payable monthly:
| Average Daily Net Assets | Annual Fee Rate |
| Up to $500 million | 0.650% |
| $500 million but less than $1 billion | 0.625% |
| $1 billion but less than $2.5 billion | 0.600% |
| $2.5 billion and over | 0.600% |
For the year ended October 31, 2022, the Fund incurred no investment adviser fee on such assets. To the extent that the Fund’s assets are invested in the Portfolio, the Fund is allocated its share of the Portfolio’s investment adviser fee. The Portfolio has engaged Boston Management and Research (BMR) to
Eaton Vance
Tax-Managed Multi-Cap Growth Fund
October 31, 2022
Notes to Financial Statements — continued
render investment advisory services. See Note 2 of the Portfolio’s Notes to Financial Statements which are included elsewhere in this report. The administration fee is earned by EVM as compensation for administrative services rendered to the Fund. The fee is computed at an annual rate of 0.15% of the Fund’s average daily net assets. For the year ended October 31, 2022, the administration fee amounted to $181,490.
EVM provides sub-transfer agency and related services to the Fund pursuant to a Sub-Transfer Agency Support Services Agreement. For the year ended October 31, 2022, EVM earned $24,384 from the Fund pursuant to such agreement, which is included in transfer and dividend disbursing agent fees on the Statement of Operations. The Fund was informed that Eaton Vance Distributors, Inc. (EVD), an affiliate of EVM and the Fund's principal underwriter, received $5,164 as its portion of the sales charge on sales of Class A shares for the year ended October 31, 2022. EVD also received distribution and service fees from Class A and Class C shares (see Note 4) and contingent deferred sales charges (see Note 5).
Trustees and officers of the Fund who are members of EVM’s or BMR's organizations receive remuneration for their services to the Fund out of the investment adviser fee. Certain officers and Trustees of the Fund and the Portfolio are officers of the above organizations.
4 Distribution Plans
The Fund has in effect a distribution plan for Class A shares (Class A Plan) pursuant to Rule 12b-1 under the 1940 Act. Pursuant to the Class A Plan, the Fund pays EVD a distribution and service fee of 0.25% per annum of its average daily net assets attributable to Class A shares for distribution services and facilities provided to the Fund by EVD, as well as for personal services and/or the maintenance of shareholder accounts. Distribution and service fees paid or accrued to EVD for the year ended October 31, 2022 amounted to $277,797 for Class A shares.
The Fund also has in effect a distribution plan for Class C shares (Class C Plan) pursuant to Rule 12b-1 under the 1940 Act. Pursuant to the Class C Plan, the Fund pays EVD amounts equal to 0.75% per annum of its average daily net assets attributable to Class C shares for providing ongoing distribution services and facilities to the Fund. For the year ended October 31, 2022, the Fund paid or accrued to EVD $74,059 for Class C shares.
Pursuant to the Class C Plan, the Fund also makes payments of service fees to EVD, financial intermediaries and other persons in amounts equal to 0.25% per annum of its average daily net assets attributable to that class. Service fees paid or accrued are for personal services and/or the maintenance of shareholder accounts. They are separate and distinct from the sales commissions and distribution fees payable to EVD. Service fees paid or accrued for the year ended October 31, 2022 amounted to $24,686 for Class C shares.
Distribution fees are subject to the limitations contained in the Financial Industry Regulatory Authority Rule 2341(d).
5 Contingent Deferred Sales Charges
A contingent deferred sales charge (CDSC) of 1% generally is imposed on redemptions of Class C shares made within 12 months of purchase. Class A shares may be subject to a 1% CDSC if redeemed within 12 months (18 months prior to April 29, 2022) of purchase (depending on the circumstances of purchase). Generally, the CDSC is based upon the lower of the net asset value at date of redemption or date of purchase. No charge is levied on shares acquired by reinvestment of dividends or capital gain distributions. For the year ended October 31, 2022, the Fund was informed that EVD received approximately $500 and $200 of CDSCs paid by Class A and Class C shareholders, respectively.
6 Investment Transactions
For the year ended October 31, 2022, increases and decreases in the Fund's investment in the Portfolio aggregated $2,259,748 and $12,806,325, respectively. Decreases in the Fund's investment in the Portfolio include distributions of securities as the result of redemptions in-kind of $3,210,987.
Eaton Vance
Tax-Managed Multi-Cap Growth Fund
October 31, 2022
Notes to Financial Statements — continued
7 Shares of Beneficial Interest
The Fund’s Declaration of Trust permits the Trustees to issue an unlimited number of full and fractional shares of beneficial interest (without par value). Such shares may be issued in a number of different series (such as the Fund) and classes. Sales and redemptions of Class A shares include shares purchased and redeemed in connection with the ReFlow liquidity program, a program designed to provide an alternative liquidity source for mutual funds experiencing net redemptions of their shares. Transactions in Fund shares, including direct exchanges pursuant to share class conversions for all periods presented, were as follows:
| | Year Ended
October 31, 2022 | | Year Ended
October 31, 2021 |
| | Shares | Amount | | Shares | Amount |
| Class A | | | | | |
| Sales | 236,476 | $ 9,713,120 | | 316,668 | $ 14,094,072 |
| Issued to shareholders electing to receive payments of distributions in Fund shares | 80,222 | 3,995,868 | | 80,163 | 3,424,573 |
| Redemptions | (394,902) | (16,637,913) | | (315,802) | (14,134,881) |
| Net increase (decrease) | (78,204) | $ (2,928,925) | | 81,029 | $ 3,383,764 |
| Class C | | | | | |
| Sales | 21,295 | $ 759,472 | | 25,276 | $ 1,006,171 |
| Issued to shareholders electing to receive payments of distributions in Fund shares | 11,778 | 484,298 | | 13,206 | 472,362 |
| Redemptions | (94,992) | (3,386,734) | | (176,990) | (6,560,696) |
| Net decrease | (61,919) | $ (2,142,964) | | (138,508) | $ (5,082,163) |
Eaton Vance
Tax-Managed Multi-Cap Growth Fund
October 31, 2022
Report of Independent Registered Public Accounting Firm
To the Trustees of Eaton Vance Mutual Funds Trust and Shareholders of Eaton Vance Tax-Managed Multi-Cap Growth Fund:
Opinion on the Financial Statements and Financial Highlights
We have audited the accompanying statement of assets and liabilities of Eaton Vance Tax-Managed Multi-Cap Growth Fund (the “Fund") (one of the funds constituting Eaton Vance Mutual Funds Trust), as of October 31, 2022, the related statement of operations for the year then ended, the statements of changes in net assets for each of the two years in the period then ended, the financial highlights for each of the five years in the period then ended, and the related notes. In our opinion, the financial statements and financial highlights present fairly, in all material respects, the financial position of the Fund as of October 31, 2022, and the results of its operations for the year then ended, the changes in its net assets for each of the two years in the period then ended, and the financial highlights for each of the five years in the period then ended, in conformity with accounting principles generally accepted in the United States of America.
Basis for Opinion
These financial statements and financial highlights are the responsibility of the Fund's management. Our responsibility is to express an opinion on the Fund's financial statements and financial highlights based on our audits. We are a public accounting firm registered with the Public Company Accounting Oversight Board (United States) (PCAOB) and are required to be independent with respect to the Fund in accordance with the U.S. federal securities laws and the applicable rules and regulations of the Securities and Exchange Commission and the PCAOB.
We conducted our audits in accordance with the standards of the PCAOB. Those standards require that we plan and perform the audit to obtain reasonable assurance about whether the financial statements and financial highlights are free of material misstatement, whether due to error or fraud. The Fund is not required to have, nor were we engaged to perform, an audit of its internal control over financial reporting. As part of our audits, we are required to obtain an understanding of internal control over financial reporting but not for the purpose of expressing an opinion on the effectiveness of the Fund’s internal control over financial reporting. Accordingly, we express no such opinion.
Our audits included performing procedures to assess the risks of material misstatement of the financial statements and financial highlights, whether due to error or fraud, and performing procedures that respond to those risks. Such procedures included examining, on a test basis, evidence regarding the amounts and disclosures in the financial statements and financial highlights. Our audits also included evaluating the accounting principles used and significant estimates made by management, as well as evaluating the overall presentation of the financial statements and financial highlights. We believe that our audits provide a reasonable basis for our opinion.
/s/ Deloitte & Touche LLP
Boston, Massachusetts
December 22, 2022
We have served as the auditor of one or more Eaton Vance investment companies since 1959.
Eaton Vance
Tax-Managed Multi-Cap Growth Fund
October 31, 2022
Federal Tax Information (Unaudited)
The Form 1099-DIV you receive in February 2023 will show the tax status of all distributions paid to your account in calendar year 2022. Shareholders are advised to consult their own tax adviser with respect to the tax consequences of their investment in the Fund. As required by the Internal Revenue Code and/or regulations, shareholders must be notified regarding the status of qualified dividend income for individuals.
Qualified Dividend Income. For the fiscal year ended October 31, 2022, the Fund designates approximately $585,571, or up to the maximum amount of such dividends allowable pursuant to the Internal Revenue Code, as qualified dividend income eligible for the reduced tax rate of 15%.
Tax-Managed Multi-Cap Growth Portfolio
October 31, 2022
| Security | Shares | Value |
| Biotechnology — 2.7% |
| Vertex Pharmaceuticals, Inc.(1) | | 15,175 | $ 4,734,600 |
| | | | $ 4,734,600 |
| Building Products — 0.4% |
| Trex Co., Inc.(1) | | 15,892 | $ 764,246 |
| | | | $ 764,246 |
| Capital Markets — 1.1% |
| S&P Global, Inc. | | 5,966 | $ 1,916,577 |
| | | | $ 1,916,577 |
| Chemicals — 1.8% |
| Celanese Corp. | | 6,569 | $ 631,413 |
| Ecolab, Inc. | | 7,531 | 1,182,894 |
| Sherwin-Williams Co. (The) | | 6,570 | 1,478,447 |
| | | | $ 3,292,754 |
| Commercial Services & Supplies — 2.0% |
| Copart, Inc.(1) | | 12,355 | $ 1,421,072 |
| Waste Connections, Inc. | | 16,156 | 2,131,138 |
| | | | $ 3,552,210 |
| Electrical Equipment — 2.5% |
| AMETEK, Inc. | | 34,300 | $ 4,447,338 |
| | | | $ 4,447,338 |
| Entertainment — 1.3% |
| Electronic Arts, Inc. | | 7,649 | $ 963,468 |
| Walt Disney Co. (The)(1) | | 12,454 | 1,326,849 |
| | | | $ 2,290,317 |
| Food & Staples Retailing — 1.7% |
| Performance Food Group Co.(1) | | 58,516 | $ 3,045,173 |
| | | | $ 3,045,173 |
| Food Products — 1.2% |
| Mondelez International, Inc., Class A | | 35,144 | $ 2,160,653 |
| | | | $ 2,160,653 |
| Health Care Equipment & Supplies — 2.8% |
| Intuitive Surgical, Inc.(1) | | 8,574 | $ 2,113,234 |
| Security | Shares | Value |
| Health Care Equipment & Supplies (continued) |
| Stryker Corp. | | 12,668 | $ 2,904,012 |
| | | | $ 5,017,246 |
| Health Care Providers & Services — 4.8% |
| UnitedHealth Group, Inc. | | 15,597 | $ 8,658,675 |
| | | | $ 8,658,675 |
| Hotels, Restaurants & Leisure — 1.4% |
| Booking Holdings, Inc.(1) | | 735 | $ 1,374,068 |
| Starbucks Corp. | | 12,443 | 1,077,439 |
| | | | $ 2,451,507 |
| Interactive Media & Services — 9.2% |
| Alphabet, Inc., Class A(1) | | 74,040 | $ 6,997,520 |
| Alphabet, Inc., Class C(1) | | 74,560 | 7,057,850 |
| Meta Platforms, Inc., Class A(1) | | 26,189 | 2,439,767 |
| | | | $ 16,495,137 |
| Internet & Direct Marketing Retail — 7.3% |
| Amazon.com, Inc.(1) | | 127,700 | $ 13,081,588 |
| | | | $ 13,081,588 |
| IT Services — 11.8% |
| Accenture PLC, Class A | | 18,307 | $ 5,197,357 |
| Fiserv, Inc.(1) | | 13,974 | 1,435,689 |
| GoDaddy, Inc., Class A(1) | | 44,180 | 3,552,072 |
| Okta, Inc.(1) | | 15,035 | 843,764 |
| PayPal Holdings, Inc.(1) | | 17,140 | 1,432,561 |
| Visa, Inc., Class A | | 42,000 | 8,700,720 |
| | | | $ 21,162,163 |
| Life Sciences Tools & Services — 1.7% |
| Danaher Corp. | | 11,868 | $ 2,986,820 |
| | | | $ 2,986,820 |
| Personal Products — 1.2% |
| Estee Lauder Cos., Inc. (The), Class A | | 10,679 | $ 2,141,033 |
| | | | $ 2,141,033 |
| Pharmaceuticals — 3.0% |
| Royalty Pharma PLC, Class A | | 35,581 | $ 1,505,788 |
| Zoetis, Inc. | | 26,003 | 3,920,732 |
| | | | $ 5,426,520 |
18
See Notes to Financial Statements.
Tax-Managed Multi-Cap Growth Portfolio
October 31, 2022
Portfolio of Investments — continued
| Security | Shares | Value |
| Road & Rail — 3.2% |
| J.B. Hunt Transport Services, Inc. | | 14,100 | $ 2,412,087 |
| Norfolk Southern Corp. | | 8,734 | 1,991,963 |
| Uber Technologies, Inc.(1) | | 47,387 | 1,259,073 |
| | | | $ 5,663,123 |
| Semiconductors & Semiconductor Equipment — 1.7% |
| Monolithic Power Systems, Inc. | | 8,854 | $ 3,005,490 |
| | | | $ 3,005,490 |
| Software — 16.7% |
| Adobe, Inc.(1) | | 14,102 | $ 4,491,487 |
| Altair Engineering, Inc., Class A(1) | | 7,902 | 387,593 |
| Intuit, Inc. | | 6,414 | 2,741,985 |
| Microsoft Corp. | | 74,352 | 17,259,330 |
| NICE, Ltd. ADR(1)(2) | | 2,287 | 434,278 |
| Salesforce, Inc.(1) | | 27,530 | 4,476,103 |
| | | | $ 29,790,776 |
| Specialty Retail — 1.8% |
| TJX Cos., Inc. (The) | | 44,664 | $ 3,220,274 |
| | | | $ 3,220,274 |
| Technology Hardware, Storage & Peripherals — 11.5% |
| Apple, Inc. | | 134,541 | $ 20,630,517 |
| | | | $ 20,630,517 |
| Textiles, Apparel & Luxury Goods — 3.4% |
| Lululemon Athletica, Inc.(1) | | 13,063 | $ 4,298,250 |
| NIKE, Inc., Class B | | 19,321 | 1,790,670 |
| | | | $ 6,088,920 |
| Trading Companies & Distributors — 2.0% |
| United Rentals, Inc.(1) | | 11,573 | $ 3,653,712 |
| | | | $ 3,653,712 |
Total Common Stocks
(identified cost $68,269,588) | | | $175,677,369 |
| Short-Term Investments — 0.9% |
| Security | Shares | Value |
| Morgan Stanley Institutional Liquidity Funds - Government Portfolio, Institutional Class, 2.88%(3) | | 1,264,568 | $ 1,264,568 |
Total Affiliated Fund
(identified cost $1,264,568) | | | $ 1,264,568 |
| Securities Lending Collateral — 0.2% |
| Security | Shares | Value |
| State Street Navigator Securities Lending Government Money Market Portfolio, 3.12%(4) | | 444,310 | $ 444,310 |
Total Securities Lending Collateral
(identified cost $444,310) | | | $ 444,310 |
Total Short-Term Investments
(identified cost $1,708,878) | | | $ 1,708,878 |
Total Investments — 99.1%
(identified cost $69,978,466) | | | $177,386,247 |
| Other Assets, Less Liabilities — 0.9% | | | $ 1,587,715 |
| Net Assets — 100.0% | | | $178,973,962 |
| The percentage shown for each investment category in the Portfolio of Investments is based on net assets. |
| (1) | Non-income producing security. |
| (2) | All or a portion of this security was on loan at October 31, 2022. The aggregate market value of securities on loan at October 31, 2022 was $429,911. |
| (3) | May be deemed to be an affiliated investment company. The rate shown is the annualized seven-day yield as of October 31, 2022. |
| (4) | Represents investment of cash collateral received in connection with securities lending. |
| Abbreviations: |
| ADR | – American Depositary Receipt |
19
See Notes to Financial Statements.
Tax-Managed Multi-Cap Growth Portfolio
October 31, 2022
Statement of Assets and Liabilities
| | October 31, 2022 |
| Assets | |
| Unaffiliated investments, at value (identified cost $68,713,898) — including $429,911 of securities on loan | $ 176,121,679 |
| Affiliated investment, at value (identified cost $1,264,568) | 1,264,568 |
| Cash | 2,181,008 |
| Dividends receivable | 28,427 |
| Dividends receivable from affiliated investment | 1,394 |
| Securities lending income receivable | 87 |
| Tax reclaims receivable | 1,236 |
| Total assets | $179,598,399 |
| Liabilities | |
| Collateral for securities loaned | $ 444,310 |
| Payable to affiliates: | |
| Investment adviser fee | 96,988 |
| Trustees' fees | 1,210 |
| Accrued expenses | 81,929 |
| Total liabilities | $ 624,437 |
| Net Assets applicable to investors' interest in Portfolio | $178,973,962 |
20
See Notes to Financial Statements.
Tax-Managed Multi-Cap Growth Portfolio
October 31, 2022
| | Year Ended |
| | October 31, 2022 |
| Investment Income | |
| Dividend income (net of foreign taxes withheld of $22,922) | $ 1,035,947 |
| Dividend income from affiliated investments | 3,596 |
| Securities lending income, net | 5,040 |
| Total investment income | $ 1,044,583 |
| Expenses | |
| Investment adviser fee | $ 1,388,329 |
| Trustees’ fees and expenses | 13,866 |
| Custodian fee | 54,479 |
| Legal and accounting services | 67,005 |
| Miscellaneous | 7,628 |
| Total expenses | $ 1,531,307 |
| Deduct: | |
| Waiver and/or reimbursement of expenses by affiliate | $ 246 |
| Total expense reductions | $ 246 |
| Net expenses | $ 1,531,061 |
| Net investment loss | $ (486,478) |
| Realized and Unrealized Gain (Loss) | |
| Net realized gain (loss): | |
| Investment transactions | $ 1,183,136(1) |
| Investment transactions - affiliated investments | (77) |
| Foreign currency transactions | 5 |
| Net realized gain | $ 1,183,064 |
| Change in unrealized appreciation (depreciation): | |
| Investments | $ (69,092,884) |
| Foreign currency | (61) |
| Net change in unrealized appreciation (depreciation) | $(69,092,945) |
| Net realized and unrealized loss | $(67,909,881) |
| Net decrease in net assets from operations | $(68,396,359) |
| (1) | Includes $3,009,242 of net realized gains from redemptions in-kind. |
21
See Notes to Financial Statements.
Tax-Managed Multi-Cap Growth Portfolio
October 31, 2022
Statements of Changes in Net Assets
| | Year Ended October 31, |
| | 2022 | 2021 |
| Increase (Decrease) in Net Assets | | |
| From operations: | | |
| Net investment loss | $ (486,478) | $ (675,019) |
| Net realized gain | 1,183,064 (1) | 12,064,831 (2) |
| Net change in unrealized appreciation (depreciation) | (69,092,945) | 57,764,780 |
| Net increase (decrease) in net assets from operations | $ (68,396,359) | $ 69,154,592 |
| Capital transactions: | | |
| Contributions | $ 3,854,719 | $ 5,630,543 |
| Withdrawals | (18,838,502) | (13,225,746) |
| Net decrease in net assets from capital transactions | $ (14,983,783) | $ (7,595,203) |
| Net increase (decrease) in net assets | $ (83,380,142) | $ 61,559,389 |
| Net Assets | | |
| At beginning of year | $ 262,354,104 | $ 200,794,715 |
| At end of year | $178,973,962 | $262,354,104 |
| (1) | Includes $3,009,242 of net realized gains from redemptions in-kind. |
| (2) | Includes $3,559,989 of net realized gains from redemptions in-kind. |
22
See Notes to Financial Statements.
Tax-Managed Multi-Cap Growth Portfolio
October 31, 2022
| | Year Ended October 31, |
| Ratios/Supplemental Data | 2022 | 2021 | 2020 | 2019 | 2018 |
| Ratios (as a percentage of average daily net assets): | | | | | |
| Expenses | 0.72% (1) | 0.70% | 0.71% | 0.72% | 0.72% |
| Net investment loss | (0.23)% | (0.28)% | (0.08)% | (0.01)% | (0.04)% |
| Portfolio Turnover | 0% (2) | 13% | 24% | 18% | 18% |
| Total Return | (27.00)% | 35.12% | 26.36% | 13.76% | 13.18% |
| Net assets, end of year (000’s omitted) | $178,974 | $262,354 | $200,795 | $167,562 | $153,366 |
| (1) | Includes a reduction by the investment adviser of a portion of its adviser fee due to the Portfolio's investment in the Liquidity Fund (equal to less than 0.005% of average daily net assets for the year ended October 31, 2022). |
| (2) | Amount is less than 0.5%. |
Tax-Managed Multi-Cap Growth Portfolio
October 31, 2022
Notes to Financial Statements
1 Significant Accounting Policies
Tax-Managed Multi-Cap Growth Portfolio (the Portfolio) is a Massachusetts business trust registered under the Investment Company Act of 1940, as amended (the 1940 Act), as a non-diversified, open-end management investment company. The Portfolio’s investment objective is to achieve long-term, after-tax returns by investing in a portfolio of equity securities. The Declaration of Trust permits the Trustees to issue interests in the Portfolio. At October 31, 2022, Eaton Vance Tax-Managed Multi-Cap Growth Fund and Eaton Vance Tax-Managed Equity Asset Allocation Fund held an interest of 56.3% and 43.7%, respectively, in the Portfolio.
The following is a summary of significant accounting policies of the Portfolio. The policies are in conformity with accounting principles generally accepted in the United States of America (U.S. GAAP). The Portfolio is an investment company and follows accounting and reporting guidance in the Financial Accounting Standards Board (FASB) Accounting Standards Codification Topic 946.
A Investment Valuation—The following methodologies are used to determine the market value or fair value of investments.
Equity Securities. Equity securities listed on a U.S. securities exchange generally are valued at the last sale or closing price on the day of valuation or, if no sales took place on such date, at the mean between the closing bid and ask prices on the exchange where such securities are principally traded. Equity securities listed on the NASDAQ National Market System are valued at the NASDAQ official closing price. Unlisted or listed securities for which closing sales prices or closing quotations are not available are valued at the mean between the latest available bid and ask prices.
Foreign Securities and Currencies. Foreign securities and currencies are valued in U.S. dollars, based on foreign currency exchange rate quotations supplied by a third party pricing service. The pricing service uses a proprietary model to determine the exchange rate. Inputs to the model include reported trades and implied bid/ask spreads. The daily valuation of exchange-traded foreign securities generally is determined as of the close of trading on the principal exchange on which such securities trade. Events occurring after the close of trading on foreign exchanges may result in adjustments to the valuation of foreign securities to more accurately reflect their fair value as of the close of regular trading on the New York Stock Exchange. When valuing foreign equity securities that meet certain criteria, the Portfolio's Trustees have approved the use of a fair value service that values such securities to reflect market trading that occurs after the close of the applicable foreign markets of comparable securities or other instruments that have a strong correlation to the fair-valued securities.
Other. Investments in management investment companies (including money market funds) that do not trade on an exchange are valued at the net asset value as of the close of each business day.
Fair Valuation. In connection with Rule 2a-5 of the 1940 Act, which became effective September 8, 2022, the Trustees have designated the Portfolio’s investment adviser as its valuation designee. Investments for which valuations or market quotations are not readily available or are deemed unreliable are valued by the investment adviser, as valuation designee, at fair value using methods that most fairly reflect the security’s “fair value”, which is the amount that the Portfolio might reasonably expect to receive for the security upon its current sale in the ordinary course. Each such determination is based on a consideration of relevant factors, which are likely to vary from one pricing context to another. These factors may include, but are not limited to, the type of security, the existence of any contractual restrictions on the security’s disposition, the price and extent of public trading in similar securities of the issuer or of comparable companies or entities, quotations or relevant information obtained from broker/dealers or other market participants, information obtained from the issuer, analysts, and/or the appropriate stock exchange (for exchange-traded securities), an analysis of the company’s or entity’s financial statements, and an evaluation of the forces that influence the issuer and the market(s) in which the security is purchased and sold.
B Investment Transactions—Investment transactions for financial statement purposes are accounted for on a trade date basis. Realized gains and losses on investments sold are determined on the basis of identified cost.
C Income—Dividend income is recorded on the ex-dividend date for dividends received in cash and/or securities. However, if the ex-dividend date has passed, certain dividends from foreign securities are recorded as the Portfolio is informed of the ex-dividend date. Withholding taxes on foreign dividends and capital gains have been provided for in accordance with the Portfolio's understanding of the applicable countries’ tax rules and rates.
D Federal Taxes—The Portfolio has elected to be treated as a partnership for federal tax purposes. No provision is made by the Portfolio for federal or state taxes on any taxable income of the Portfolio because each investor in the Portfolio is ultimately responsible for the payment of any taxes on its share of taxable income. Since at least one of the Portfolio's investors is a regulated investment company that invests all or substantially all of its assets in the Portfolio, the Portfolio normally must satisfy the applicable source of income and diversification requirements (under the Internal Revenue Code) in order for its investors to satisfy them. The Portfolio will allocate, at least annually among its investors, each investor's distributive share of the Portfolio's net investment income, net realized capital gains and losses and any other items of income, gain, loss, deduction or credit.
As of October 31, 2022, the Portfolio had no uncertain tax positions that would require financial statement recognition, de-recognition, or disclosure. The Portfolio files a U.S. federal income tax return annually after its fiscal year-end, which is subject to examination by the Internal Revenue Service for a period of three years from the date of filing.
E Foreign Currency Translation—Investment valuations, other assets, and liabilities initially expressed in foreign currencies are translated each business day into U.S. dollars based upon current exchange rates. Purchases and sales of foreign investment securities and income and expenses denominated in foreign currencies are translated into U.S. dollars based upon currency exchange rates in effect on the respective dates of such transactions. Recognized
Tax-Managed Multi-Cap Growth Portfolio
October 31, 2022
Notes to Financial Statements — continued
gains or losses on investment transactions attributable to changes in foreign currency exchange rates are recorded for financial statement purposes as net realized gains and losses on investments. That portion of unrealized gains and losses on investments that results from fluctuations in foreign currency exchange rates is not separately disclosed.
F Use of Estimates—The preparation of the financial statements in conformity with U.S. GAAP requires management to make estimates and assumptions that affect the reported amounts of assets and liabilities at the date of the financial statements and the reported amounts of income and expense during the reporting period. Actual results could differ from those estimates.
G Indemnifications—Under the Portfolio’s organizational documents, its officers and Trustees may be indemnified against certain liabilities and expenses arising out of the performance of their duties to the Portfolio. Under Massachusetts law, if certain conditions prevail, interestholders in the Portfolio could be deemed to have personal liability for the obligations of the Portfolio. However, the Portfolio’s Declaration of Trust contains an express disclaimer of liability on the part of Portfolio interestholders. Additionally, in the normal course of business, the Portfolio enters into agreements with service providers that may contain indemnification clauses. The Portfolio’s maximum exposure under these arrangements is unknown as this would involve future claims that may be made against the Portfolio that have not yet occurred.
2 Investment Adviser Fee and Other Transactions with Affiliates
The investment adviser fee is earned by Boston Management and Research (BMR), an indirect, wholly-owned subsidiary of Morgan Stanley, as compensation for investment advisory services rendered to the Portfolio. The fee is computed at an annual rate as a percentage of the Portfolio’s average daily net assets as follows and is payable monthly:
| Average Daily Net Assets | Annual Fee Rate |
| Up to $500 million | 0.650% |
| $500 million but less than $1 billion | 0.625% |
| $1 billion but less than $2.5 billion | 0.600% |
| $2.5 billion and over | 0.600% |
For the year ended October 31, 2022, the investment adviser fee amounted to $1,388,329 or 0.65% of the Portfolio’s average daily net assets. Effective April 26, 2022, the Portfolio may invest in a money market fund, the Institutional Class of the Morgan Stanley Institutional Liquidity Funds - Government Portfolio (the “Liquidity Fund”), an open-end management investment company managed by Morgan Stanley Investment Management Inc., a wholly-owned subsidiary of Morgan Stanley. The investment adviser fee paid by the Portfolio is reduced by an amount equal to its pro-rata share of the advisory and administration fees paid by the Portfolio due to its investment in the Liquidity Fund. For the year ended October 31, 2022, the investment adviser fee paid was reduced by $246 relating to the Portfolio’s investment in the Liquidity Fund. Prior to April 26, 2022, the Portfolio may have invested its cash in Eaton Vance Cash Reserves Fund, LLC (Cash Reserves Fund), an affiliated investment company managed by Eaton Vance Management (EVM), an affiliate of BMR. EVM did not receive a fee for advisory services provided to Cash Reserves Fund.
Trustees and officers of the Portfolio who are members of EVM’s or BMR’s organizations receive remuneration for their services to the Portfolio out of the investment adviser fee. Trustees of the Portfolio who are not affiliated with the investment adviser may elect to defer receipt of all or a percentage of their annual fees in accordance with the terms of the Trustees Deferred Compensation Plan. For the year ended October 31, 2022, no significant amounts have been deferred. Certain officers and Trustees of the Portfolio are officers of the above organizations.
3 Purchases and Sales of Investments
Purchases and sales of investments, other than short-term obligations and in-kind transactions, aggregated $969,217 and $15,421,609, respectively, for the year ended October 31, 2022. In-kind sales for the year ended October 31, 2022 aggregated $3,210,987.
Tax-Managed Multi-Cap Growth Portfolio
October 31, 2022
Notes to Financial Statements — continued
4 Federal Income Tax Basis of Investments
The cost and unrealized appreciation (depreciation) of investments of the Portfolio at October 31, 2022, as determined on a federal income tax basis, were as follows:
| Aggregate cost | $ 70,360,746 |
| Gross unrealized appreciation | $ 107,788,763 |
| Gross unrealized depreciation | (763,262) |
| Net unrealized appreciation | $107,025,501 |
5 Line of Credit
The Portfolio participates with other portfolios and funds managed by EVM and its affiliates in a $725 million unsecured line of credit agreement with a group of banks, which is in effect through October 24, 2023. In connection with the renewal of the agreement on October 25, 2022, the borrowing limit was decreased from $800 million. Borrowings are made by the Portfolio solely for temporary purposes related to redemptions and other short-term cash needs. Interest is charged to the Portfolio based on its borrowings at an amount above either the Secured Overnight Financing Rate (SOFR) or Federal Funds rate. In addition, a fee computed at an annual rate of 0.15% on the daily unused portion of the line of credit is allocated among the participating portfolios and funds at the end of each quarter. Also in connection with the renewal of the agreement, an arrangement fee totaling $150,000 was incurred that was allocated to the participating portfolios and funds. Because the line of credit is not available exclusively to the Portfolio, it may be unable to borrow some or all of its requested amounts at any particular time. The Portfolio did not have any significant borrowings or allocated fees during the year ended October 31, 2022.
6 Securities Lending Agreement
The Portfolio has established a securities lending agreement with State Street Bank and Trust Company (SSBT) as securities lending agent in which the Portfolio lends portfolio securities to qualified borrowers in exchange for collateral consisting of either cash or securities issued or guaranteed by the U.S. government or its agencies or instrumentalities in an amount at least equal to the market value of the securities on loan. The market value of securities loaned is determined daily and any additional required collateral is delivered to the Portfolio on the next business day. Cash collateral is invested in the State Street Navigator Securities Lending Government Money Market Portfolio, a money market fund registered under the 1940 Act. The Portfolio earns interest on the amount invested but it must pay (and at times receive from) the broker a loan rebate fee computed as a varying percentage of the collateral received. For security loans secured by non-cash collateral, the Portfolio earns a negotiated lending fee from the borrower. A portion of the income earned by the Portfolio from its investment of cash collateral, net of rebate fees, and lending fees received is allocated to SSBT for its services as lending agent and the portion allocated to the Portfolio is presented as securities lending income, net on the Statement of Operations. Non-cash collateral is held by the lending agent on behalf of the Portfolio and cannot be sold or re-pledged by the Portfolio; accordingly, such collateral is not reflected in the Statement of Assets and Liabilities.
The Portfolio is subject to possible delay in the recovery of loaned securities. Pursuant to the securities lending agreement, SSBT has provided indemnification to the Portfolio in the event of default by a borrower with respect to a loan. The Portfolio bears the risk of loss with respect to the investment of cash collateral.
At October 31, 2022, the value of the securities loaned and the value of the collateral received, which exceeded the value of the securities loaned, amounted to $429,911 and $444,310, respectively. Collateral received was comprised of cash. The securities lending transactions have no contractual maturity date and each of the Portfolio and borrower has the option to terminate a loan at any time.
The following table provides a breakdown of securities lending transactions accounted for as secured borrowings, the obligations by class of collateral pledged, and the remaining contractual maturity of those transactions as of October 31, 2022.
| | Remaining Contractual Maturity of the Transactions |
| | Overnight and
Continuous | <30 days | 30 to 90 days | >90 days | Total |
| Common Stocks | $444,310 | $ — | $ — | $ — | $444,310 |
Tax-Managed Multi-Cap Growth Portfolio
October 31, 2022
Notes to Financial Statements — continued
The carrying amount of the liability for collateral for securities loaned at October 31, 2022 approximated its fair value. If measured at fair value, such liability would have been considered as Level 2 in the fair value hierarchy (see Note 8) at October 31, 2022.
7 Investments in Affiliated Funds
At October 31, 2022, the value of the Portfolio's investment in funds that may be deemed to be affiliated was $1,264,568, which represents 0.7% of the Portfolio's net assets. Transactions in affiliated funds by the Portfolio for the year ended October 31, 2022 were as follows:
| Name | Value,
beginning
of period | Purchases | Sales
proceeds | Net
realized
gain (loss) | Change in
unrealized
appreciation
(depreciation) | Value, end
of period | Dividend
income | Units/Shares,
end of period |
| Short-Term Investments |
| Cash Reserves Fund | $1,271,595 | $7,251,596 | $(8,523,114) | $ (77) | $ — | $ — | $ 164 | — |
| Liquidity Fund | — | 4,720,633 | (3,456,065) | — | — | 1,264,568 | 3,432 | 1,264,568 |
| Total | | | | $ (77) | $ — | $1,264,568 | $3,596 | |
8 Fair Value Measurements
Under generally accepted accounting principles for fair value measurements, a three-tier hierarchy to prioritize the assumptions, referred to as inputs, is used in valuation techniques to measure fair value. The three-tier hierarchy of inputs is summarized in the three broad levels listed below.
| • | Level 1 – quoted prices in active markets for identical investments |
| • | Level 2 – other significant observable inputs (including quoted prices for similar investments, interest rates, prepayment speeds, credit risk, etc.) |
| • | Level 3 – significant unobservable inputs (including a fund's own assumptions in determining the fair value of investments) |
In cases where the inputs used to measure fair value fall in different levels of the fair value hierarchy, the level disclosed is determined based on the lowest level input that is significant to the fair value measurement in its entirety. The inputs or methodology used for valuing securities are not necessarily an indication of the risk associated with investing in those securities.
At October 31, 2022, the hierarchy of inputs used in valuing the Portfolio's investments, which are carried at value, were as follows:
| Asset Description | Level 1 | Level 2 | Level 3 | Total |
| Common Stocks | $ 175,677,369* | $ — | $ — | $ 175,677,369 |
| Short-Term Investments: | | | | |
| Affiliated Fund | 1,264,568 | — | — | 1,264,568 |
| Securities Lending Collateral | 444,310 | — | — | 444,310 |
| Total Investments | $177,386,247 | $ — | $ — | $177,386,247 |
| * | The level classification by major category of investments is the same as the category presentation in the Portfolio of Investments. |
9 Risks and Uncertainties
Pandemic Risk
An outbreak of respiratory disease caused by a novel coronavirus was first detected in China in late 2019 and subsequently spread internationally. This coronavirus has resulted in closing borders, enhanced health screenings, changes to healthcare service preparation and delivery, quarantines, cancellations, disruptions to supply chains and customer activity, as well as general concern and uncertainty. Health crises caused by outbreaks of disease, such as the coronavirus outbreak, may exacerbate other pre-existing political, social and economic risks and disrupt normal market conditions and operations. The impact of this outbreak has negatively affected the worldwide economy, as well as the economies of individual countries and industries, and could continue to affect the market in significant and unforeseen ways. Other epidemics and pandemics that may arise in the future may have similar effects. Any such impact could adversely affect the Portfolio's performance, or the performance of the securities in which the Portfolio invests.
Tax-Managed Multi-Cap Growth Portfolio
October 31, 2022
Report of Independent Registered Public Accounting Firm
To the Trustees and Investors of Tax-Managed Multi-Cap Growth Portfolio:
Opinion on the Financial Statements and Financial Highlights
We have audited the accompanying statement of assets and liabilities of Tax-Managed Multi-Cap Growth Portfolio (the “Portfolio"), including the portfolio of investments, as of October 31, 2022, the related statement of operations for the year then ended, the statements of changes in net assets for each of the two years in the period then ended, the financial highlights for each of the five years in the period then ended, and the related notes. In our opinion, the financial statements and financial highlights present fairly, in all material respects, the financial position of the Portfolio as of October 31, 2022, and the results of its operations for the year then ended, the changes in its net assets for each of the two years in the period then ended, and the financial highlights for each of the five years in the period then ended, in conformity with accounting principles generally accepted in the United States of America.
Basis for Opinion
These financial statements and financial highlights are the responsibility of the Portfolio’s management. Our responsibility is to express an opinion on the Portfolio’s financial statements and financial highlights based on our audits. We are a public accounting firm registered with the Public Company Accounting Oversight Board (United States) (PCAOB) and are required to be independent with respect to the Portfolio in accordance with the U.S. federal securities laws and the applicable rules and regulations of the Securities and Exchange Commission and the PCAOB.
We conducted our audits in accordance with the standards of the PCAOB. Those standards require that we plan and perform the audit to obtain reasonable assurance about whether the financial statements and financial highlights are free of material misstatement, whether due to error or fraud. The Portfolio is not required to have, nor were we engaged to perform, an audit of its internal control over financial reporting. As part of our audits we are required to obtain an understanding of internal control over financial reporting but not for the purpose of expressing an opinion on the effectiveness of the Portfolio’s internal control over financial reporting. Accordingly, we express no such opinion.
Our audits included performing procedures to assess the risks of material misstatement of the financial statements and financial highlights, whether due to error or fraud, and performing procedures that respond to those risks. Such procedures included examining, on a test basis, evidence regarding the amounts and disclosures in the financial statements and financial highlights. Our audits also included evaluating the accounting principles used and significant estimates made by management, as well as evaluating the overall presentation of the financial statements and financial highlights. Our procedures included confirmation of securities owned as of October 31, 2022, by correspondence with the custodian and brokers; when replies were not received from brokers, we performed other auditing procedures. We believe that our audits provide a reasonable basis for our opinion.
/s/ Deloitte & Touche LLP
Boston, Massachusetts
December 22, 2022
We have served as the auditor of one or more Eaton Vance investment companies since 1959.
Eaton Vance
Tax-Managed Multi-Cap Growth Fund
October 31, 2022
Board of Trustees’ Contract Approval
Overview of the Contract Review Process
The Investment Company Act of 1940, as amended (the “1940 Act”), provides, in substance, that the investment advisory agreement between a fund and its investment adviser will continue in effect from year-to-year only if its continuation is approved on an annual basis by a vote of the fund’s board of trustees, including a majority of the trustees who are not “interested persons” of the fund (“independent trustees”), cast in person at a meeting called for the purpose of considering such approval.
At a meeting held on June 8, 2022, the Boards of Trustees/Directors (collectively, the “Board”) that oversee the registered investment companies advised by Eaton Vance Management or its affiliate, Boston Management and Research (the “Eaton Vance Funds”), including a majority of the independent trustees (the “Independent Trustees”), voted to approve the continuation of existing investment advisory agreements and sub-advisory agreements1 for each of the Eaton Vance Funds for an additional one-year period. The Board relied upon the affirmative recommendation of its Contract Review Committee, which is a committee exclusively comprised of Independent Trustees. Prior to making its recommendation, the Contract Review Committee reviewed information furnished by the adviser and sub-adviser to each of the Eaton Vance Funds (including information specifically requested by the Board) for a series of formal meetings held between April and June 2022. Members of the Contract Review Committee also considered information received at prior meetings of the Board and its committees, to the extent such information was relevant to the Contract Review Committee’s annual evaluation of the investment advisory agreements and sub-advisory agreements.
In connection with its evaluation of the investment advisory agreements and sub-advisory agreements, the Board considered various information relating to the Eaton Vance Funds. This included information applicable to all or groups of Eaton Vance Funds, which is referenced immediately below, and information applicable to the particular Eaton Vance Fund covered by this report (additional fund-specific information is referenced below under “Results of the Contract Review Process”). (For funds that invest through one or more underlying portfolios, references to “each fund” in this section may include information that was considered at the portfolio-level.)
Information about Fees, Performance and Expenses
• A report from an independent data provider comparing advisory and other fees paid by each fund to such fees paid by comparable funds, as identified by the independent data provider (“comparable funds”);
• A report from an independent data provider comparing each fund’s total expense ratio (and its components) to those of comparable funds;
• A report from an independent data provider comparing the investment performance of each fund (including, as relevant, total return data, income data, Sharpe ratios and information ratios) to the investment performance of comparable funds and, as applicable, benchmark indices, over various time periods;
• In certain instances, data regarding investment performance relative to customized groups of peer funds and blended indices identified by the adviser in consultation with the Portfolio Management Committee of the Board (a committee exclusively comprised of Independent Trustees);
• Comparative information concerning the fees charged and services provided by the adviser and sub-adviser to each fund in managing other accounts (which may include other mutual funds, collective investment funds and institutional accounts) using investment strategies and techniques similar to those used in managing such fund(s), if any;
• Profitability analyses with respect to the adviser and sub-adviser to each of the funds;
Information about Portfolio Management and Trading
• Descriptions of the investment management services provided to each fund, as well as each of the funds’ investment strategies and policies;
• The procedures and processes used to determine the value of fund assets, including, when necessary, the determination of “fair value” and actions taken to monitor and test the effectiveness of such procedures and processes;
• Information about the policies and practices of each fund’s adviser and sub-adviser with respect to trading, including their processes for seeking best execution of portfolio transactions;
• Information about the allocation of brokerage transactions and the benefits, if any, received by the adviser and sub-adviser to each fund as a result of brokerage allocation, including, as applicable, information concerning the acquisition of research through client commission arrangements and policies with respect to “soft dollars”;
• Data relating to the portfolio turnover rate of each fund and related information regarding active management in the context of particular strategies;
Information about each Adviser and Sub-adviser
• Reports detailing the financial results and condition of the adviser and sub-adviser to each fund;
1 Not all Eaton Vance Funds have entered into a sub-advisory agreement with a sub-adviser. Accordingly, references to “sub-adviser” or “sub-advisory agreement” in this “Overview” section may not be applicable to the particular Eaton Vance Fund covered by this report. Following the “Overview” section, further information regarding the Board’s evaluation of a fund’s contractual arrangements is included under the “Results of the Contract Review Process” section.
Eaton Vance
Tax-Managed Multi-Cap Growth Fund
October 31, 2022
Board of Trustees’ Contract Approval — continued
• Information regarding the individual investment professionals whose responsibilities include portfolio management and investment research for the funds, and, for portfolio managers and certain other investment professionals, information relating to their responsibilities with respect to managing other mutual funds and investment accounts, as applicable;
• Information regarding the adviser’s and its parent company’s (Morgan Stanley’s) efforts to retain and attract talented investment professionals, including in the context of a particularly competitive marketplace for talent, as well as the ongoing unique environment presented by hybrid, remote and other alternative work arrangements;
• The Code of Ethics of the adviser and its affiliates and the sub-adviser of each fund, together with information relating to compliance with, and the administration of, such codes;
• Policies and procedures relating to proxy voting, including regular reporting with respect to fund proxy voting activities;
• Information regarding the handling of corporate actions and class actions, as well as information regarding litigation and other regulatory matters;
• Information concerning the resources devoted to compliance efforts undertaken by the adviser and its affiliates and the sub-adviser of each fund, if any, including descriptions of their various compliance programs and their record of compliance;
• Information concerning the business continuity and disaster recovery plans of the adviser and its affiliates and the sub-adviser of each fund, if any;
• A description of Eaton Vance Management’s and Boston Management and Research’s oversight of sub-advisers, including with respect to regulatory and compliance issues, investment management and other matters;
Other Relevant Information
• Information regarding ongoing initiatives to further integrate and harmonize, where applicable, the investment management and other departments of the adviser and its affiliates with the overall investment management infrastructure of Morgan Stanley, in light of Morgan Stanley’s acquisition of Eaton Vance on March 1, 2021;
• Information concerning the nature, cost and character of the administrative and other non-investment advisory services provided by Eaton Vance Management and its affiliates;
• Information concerning oversight of the relationship with the custodian, subcustodians, fund accountants, and other third-party service providers by the adviser and/or administrator to each of the funds;
• Information concerning efforts to implement policies and procedures with respect to various new regulations applicable to the funds, including Rule 12d1-4 (the Fund-of-Funds Rule), Rule 18f-4 (the Derivatives Rule) and Rule 2a-5 (the Fair Valuation Rule);
• For an Eaton Vance Fund structured as an exchange-listed closed-end fund, information concerning the benefits of the closed-end fund structure, as well as, where relevant, the closed-end fund’s market prices (including as compared to the closed-end fund’s net asset value (NAV)), trading volume data, continued use of auction preferred shares (where applicable), distribution rates and other relevant matters;
• The risks which the adviser and/or its affiliates incur in connection with the management and operation of the funds, including, among others, litigation, regulatory, entrepreneurial, and other business risks (and the associated costs of such risks); and
• The terms of each investment advisory agreement and sub-advisory agreement.
During the various meetings of the Board and its committees over the course of the year leading up to the June 8, 2022 meeting, the Trustees received information from portfolio managers and other investment professionals of the advisers and sub-advisers of the funds regarding investment and performance matters, and considered various investment and trading strategies used in pursuing the funds’ investment objectives. The Trustees also received information regarding risk management techniques employed in connection with the management of the funds. The Board and its committees evaluated issues pertaining to industry and regulatory developments, compliance procedures, fund governance and other issues with respect to the funds, and received and participated in reports and presentations provided by Eaton Vance Management, Boston Management and Research and fund sub-advisers, with respect to such matters. In addition to the formal meetings of the Board and its committees, the Independent Trustees held regular teleconferences to discuss, among other topics, matters relating to the continuation of investment advisory agreements and sub-advisory agreements.
The Contract Review Committee was advised throughout the contract review process by Goodwin Procter LLP, independent legal counsel for the Independent Trustees. The members of the Contract Review Committee, with the advice of such counsel, exercised their own business judgment in determining the material factors to be considered in evaluating each investment advisory agreement and sub-advisory agreement and the weight to be given to each such factor. The conclusions reached with respect to each investment advisory agreement and sub-advisory agreement were based on a comprehensive evaluation of all the information provided and not any single factor. Moreover, each member of the Contract Review Committee may have placed varying emphasis on particular factors in reaching conclusions with respect to each investment advisory agreement and sub-advisory agreement. In evaluating each investment advisory agreement and sub-advisory agreement, including the fee structures and other terms contained in such agreements, the members of the Contract Review Committee were also informed by multiple years of analysis and discussion with the adviser and sub-adviser to each of the Eaton Vance Funds.
Results of the Contract Review Process
Based on its consideration of the foregoing, and such other information it deemed relevant, including the factors and conclusions described below, the Contract Review Committee concluded that the continuation of the investment advisory agreement between Eaton Vance Tax-Managed Multi-Cap Growth Fund (the “Fund”) and Eaton Vance Management (“EVM”), as well as the investment advisory agreement between Tax-Managed Multi-Cap Growth Portfolio (the “Portfolio”), the portfolio in which the Fund invests, and Boston Management and Research (“BMR”) (EVM, with respect to the Fund, and BMR, with
Eaton Vance
Tax-Managed Multi-Cap Growth Fund
October 31, 2022
Board of Trustees’ Contract Approval — continued
respect to the Portfolio, are each referred to herein as the “Adviser”), including their respective fee structures, are in the interests of shareholders and, therefore, recommended to the Board approval of each agreement. Based on the recommendation of the Contract Review Committee, the Board, including a majority of the Independent Trustees, voted to approve continuation of the investment advisory agreements for the Fund and the Portfolio (together, the “investment advisory agreements”).
Nature, Extent and Quality of Services
In considering whether to approve the investment advisory agreements for the Fund and the Portfolio, the Board evaluated the nature, extent and quality of services provided to the Fund and to the Portfolio by the applicable Adviser.
The Board considered each Adviser’s management capabilities and investment processes in light of the types of investments held by the Fund and the Portfolio, including the education, experience and number of investment professionals and other personnel who provide portfolio management, investment research, and similar services to the Portfolio, including recent changes to such personnel. The Board specifically noted that each Adviser has devoted extensive resources to in-house equity research capabilities and also draws upon independent research available from third-party sources. The Board considered each Adviser’s experience managing funds that seek to maximize after-tax returns. The Board also took into account the resources dedicated to portfolio management and other services, the compensation methods of each Adviser and other factors, including the reputation and resources of each Adviser to recruit and retain highly qualified research, advisory and supervisory investment professionals. In addition, the Board considered the time and attention devoted to the Eaton Vance Funds, including the Fund and the Portfolio, by senior management, as well as the infrastructure, operational capabilities and support staff in place to assist in the portfolio management and operations of the Fund and the Portfolio, including the provision of administrative services. The Board also considered the business-related and other risks to which each Adviser or its affiliates may be subject in managing the Fund and the Portfolio.
The Board noted that, under the terms of the investment advisory agreement of the Fund, EVM may invest assets of the Fund directly in securities, for which it would receive a fee, or in the Portfolio, for which it receives no separate fee but for which BMR receives an advisory fee from the Portfolio.
The Board considered the compliance programs of each Adviser and relevant affiliates thereof. The Board considered compliance and reporting matters regarding, among other things, personal trading by investment professionals, disclosure of portfolio holdings, late trading, frequent trading, portfolio valuation, business continuity and the allocation of investment opportunities. The Board also considered the responses of each Adviser and its affiliates to requests in recent years from regulatory authorities, such as the Securities and Exchange Commission and the Financial Industry Regulatory Authority.
The Board considered other administrative services provided or overseen by EVM and its affiliates, including transfer agency and accounting services. The Board evaluated the benefits to shareholders of investing in a fund that is a part of a large fund complex offering exposure to a variety of asset classes and investment disciplines, as well as the ability, in many cases, to exchange an investment among different funds without incurring additional sales charges.
After consideration of the foregoing factors, among others, the Board concluded that the nature, extent and quality of services provided by each Adviser, taken as a whole, are appropriate and consistent with the terms of the applicable investment advisory agreement.
Fund Performance
The Board compared the Fund’s investment performance to that of comparable funds identified by an independent data provider (the peer group), as well as appropriate benchmark indices. The Board’s review included comparative performance data with respect to the Fund for the one-, three-, five- and ten-year periods ended December 31, 2021. In this regard, the Board noted that the performance of the Fund was consistent with the median performance of the Fund’s peer group for the three-year period. The Board also noted that the performance of the Fund was higher than its secondary benchmark index and lower than its primary benchmark index for the three-year period. The Board concluded that the performance of the Fund was satisfactory.
Management Fees and Expenses
The Board considered contractual fee rates payable by the Portfolio and by the Fund for advisory and administrative services (referred to collectively as “management fees”). As part of its review, the Board considered the Fund’s management fees and total expense ratio for the one-year period ended December 31, 2021, as compared to those of comparable funds, before and after giving effect to any undertaking to waive fees or reimburse expenses. The Board also considered certain factors identified by management in response to inquiries from the Contract Review Committee regarding the Fund’s total expense ratio relative to comparable funds.
After considering the foregoing information, and in light of the nature, extent and quality of the services provided by each Adviser, the Board concluded that the management fees charged for advisory and related services are reasonable.
Profitability and “Fall-Out” Benefits
The Board considered the level of profits realized by each Adviser and relevant affiliates thereof in providing investment advisory and administrative services to the Fund, to the Portfolio and to all Eaton Vance Funds as a group. The Board considered the level of profits realized without regard to marketing support or other payments by each Adviser and its affiliates to third parties in respect of distribution or other services.
Eaton Vance
Tax-Managed Multi-Cap Growth Fund
October 31, 2022
Board of Trustees’ Contract Approval — continued
The Board concluded that, in light of the foregoing factors and the nature, extent and quality of the services rendered, the profits realized by each Adviser and its affiliates are deemed not to be excessive.
The Board also considered direct or indirect fall-out benefits received by each Adviser and its affiliates in connection with their respective relationships with the Fund and the Portfolio, including the benefits of research services that may be available to each Adviser as a result of securities transactions effected for the Fund and the Portfolio and other investment advisory clients.
Economies of Scale
In reviewing management fees and profitability, the Board also considered the extent to which the applicable Adviser and its affiliates, on the one hand, and the Fund and the Portfolio, on the other hand, can expect to realize benefits from economies of scale as the assets of the Fund and the Portfolio increase. The Board acknowledged the difficulty in accurately measuring the benefits resulting from economies of scale, if any, with respect to the management of any specific fund or group of funds. The Board reviewed data summarizing the increases and decreases in the assets of the Fund and of all Eaton Vance Funds as a group over various time periods, and evaluated the extent to which the total expense ratio of the Fund and the profitability of each Adviser and its affiliates may have been affected by such increases or decreases. Based upon the foregoing, the Board concluded that the Fund currently shares in the benefits from economies of scale, if any, when they are realized by each Adviser. The Board also concluded that the structure of the advisory fees, which include breakpoints at several asset levels, will allow the Fund and the Portfolio to continue to benefit from any economies of scale in the future.
Eaton Vance
Tax-Managed Multi-Cap Growth Fund
October 31, 2022
Liquidity Risk Management Program
The Fund has implemented a written liquidity risk management program (Program) and related procedures to manage its liquidity in accordance with Rule 22e-4 under the Investment Company Act of 1940, as amended (Liquidity Rule). The Liquidity Rule defines “liquidity risk” as the risk that a fund could not meet requests to redeem shares issued by the fund without significant dilution of the remaining investors’ interests in the fund. The Fund’s Board of Trustees/Directors has designated the investment adviser to serve as the administrator of the Program and the related procedures. The administrator has established a Liquidity Risk Management Oversight Committee (Committee) to perform the functions necessary to administer the Program. As part of the Program, the administrator is responsible for identifying illiquid investments and categorizing the relative liquidity of the Fund’s investments in accordance with the Liquidity Rule. Under the Program, the administrator assesses, manages, and periodically reviews the Fund’s liquidity risk, and is responsible for making certain reports to the Fund’s Board of Trustees/Directors and the Securities and Exchange Commission (SEC) regarding the liquidity of the Fund’s investments, and to notify the Board of Trustees/Directors and the SEC of certain liquidity events specified in the Liquidity Rule. The liquidity of the Fund’s portfolio investments is determined based on a number of factors including, but not limited to, relevant market, trading and investment-specific considerations under the Program.
At a meeting of the Fund’s Board of Trustees/Directors on June 7, 2022, the Committee provided a written report to the Fund’s Board of Trustees/Directors pertaining to the operation, adequacy, and effectiveness of implementation of the Program, as well as the operation of the highly liquid investment minimum (if applicable) for the period January 1, 2021 through December 31, 2021 (Review Period). The Program operated effectively during the Review Period, supporting the administrator’s ability to assess, manage and monitor Fund liquidity risk, including during periods of market volatility and net redemptions. During the Review Period, the Fund met redemption requests on a timely basis.
There can be no assurance that the Program will achieve its objectives in the future. Please refer to the Fund’s prospectus for more information regarding the Fund’s exposure to liquidity risk and other principal risks to which an investment in the Fund may be subject.
Eaton Vance
Tax-Managed Multi-Cap Growth Fund
October 31, 2022
Management and Organization
Fund Management. The Trustees of Eaton Vance Mutual Funds Trust (the Trust) and Tax-Managed Multi-Cap Growth Portfolio (the Portfolio) are responsible for the overall management and supervision of the Trust's and the Portfolio's affairs. The Board members and officers of the Trust and the Portfolio are listed below. Except as indicated, each individual has held the office shown or other offices in the same company for the last five years. Board members hold indefinite terms of office. Each Trustee holds office until his or her successor is elected and qualified, subject to a prior death, resignation, retirement, disqualification or removal. Under the terms of the Fund's and the Portfolio's current Trustee retirement policy, an Independent Trustee must retire and resign as a Trustee on the earlier of: (i) the first day of July following his or her 74th birthday; or (ii), with limited exception, December 31st of the 20th year in which he or she has served as a Trustee. However, if such retirement and resignation would cause the Fund and the Portfolio to be out of compliance with Section 16 of the 1940 Act or any other regulations or guidance of the SEC, then such retirement and resignation will not become effective until such time as action has been taken for the Fund and the Portfolio to be in compliance therewith. The “noninterested Trustees” consist of those Trustees who are not “interested persons” of the Trust and the Portfolio, as that term is defined under the 1940 Act. The business address of each Board member and officer is Two International Place, Boston, Massachusetts 02110. As used below, “BMR” refers to Boston Management and Research, “EVC” refers to Eaton Vance Corp., “EV” refers to EV LLC, “EVM” refers to Eaton Vance Management and “EVD” refers to Eaton Vance Distributors, Inc. EV is the trustee of each of EVM and BMR. Effective March 1, 2021, each of EVM, BMR, EVD and EV are indirect, wholly owned subsidiaries of Morgan Stanley. Each officer affiliated with EVM may hold a position with other EVM affiliates that is comparable to his or her position with EVM listed below. Each Trustee oversees 135 funds (with the exception of Mr. Bowser who oversees 110 funds) in the Eaton Vance fund complex (including both funds and portfolios in a hub and spoke structure).
| Name and Year of Birth | Trust/Portfolio
Position(s) | Length of Service | Principal Occupation(s) and Other Directorships
During Past Five Years and Other Relevant Experience |
| Interested Trustee |
Thomas E. Faust Jr.
1958 | Trustee | Since 2007 | Chairman of Morgan Stanley Investment Management, Inc. (MSIM), member of the Board of Managers and President of EV (since 2021), Chief Executive Officer of EVM and BMR. Formerly, Chairman, Chief Executive Officer (2007-2021) and President (2006-2021) of EVC and Director of EVD (2007-2022). Mr. Faust is an interested person because of his positions with MSIM, BMR, EVM and EV, which are affiliates of the Trust and the Portfolio.
Other Directorships. Formerly, Director of EVC (2007-2021) and Hexavest Inc. (investment management firm) (2012-2021). |
| Noninterested Trustees |
Alan C. Bowser(1)
1962 | Trustee | Since 2022 | Chief Diversity Officer, Partner and a member of the Operating Committee, and formerly served as Senior Advisor on Diversity and Inclusion for the firm’s chief executive officer, Co-Head of the Americas Region, and Senior Client Advisor of Bridgewater Associates, an asset management firm (2011- present).
Other Directorships. None. |
Mark R. Fetting
1954 | Trustee | Since 2016 | Private investor. Formerly held various positions at Legg Mason, Inc. (investment management firm) (2000-2012), including President, Chief Executive Officer, Director and Chairman (2008-2012), Senior Executive Vice President (2004-2008) and Executive Vice President (2001-2004). Formerly, President of Legg Mason family of funds (2001-2008). Formerly, Division President and Senior Officer of Prudential Financial Group, Inc. and related companies (investment management firm) (1991-2000).
Other Directorships. None. |
Cynthia E. Frost
1961 | Trustee | Since 2014 | Private investor. Formerly, Chief Investment Officer of Brown University (university endowment) (2000-2012). Formerly, Portfolio Strategist for Duke Management Company (university endowment manager) (1995-2000). Formerly, Managing Director, Cambridge Associates (investment consulting company) (1989-1995). Formerly, Consultant, Bain and Company (management consulting firm) (1987- 1989). Formerly, Senior Equity Analyst, BA Investment Management Company (1983-1985).
Other Directorships. None. |
George J. Gorman
1952 | Chairperson of the
Board and Trustee | Since 2021
(Chairperson) and 2014 (Trustee) | Principal at George J. Gorman LLC (consulting firm). Formerly, Senior Partner at Ernst & Young LLP (a registered public accounting firm) (1974-2009).
Other Directorships. None. |
Eaton Vance
Tax-Managed Multi-Cap Growth Fund
October 31, 2022
Management and Organization — continued
| Name and Year of Birth | Trust/Portfolio
Position(s) | Length of Service | Principal Occupation(s) and Other Directorships
During Past Five Years and Other Relevant Experience |
| Noninterested Trustees (continued) |
Valerie A. Mosley
1960 | Trustee | Since 2014 | Chairwoman and Chief Executive Officer of Valmo Ventures (a consulting and investment firm). Founder of Upward Wealth, Inc., dba BrightUp, a fintech platform. Formerly, Partner and Senior Vice President, Portfolio Manager and Investment Strategist at Wellington Management Company, LLP (investment management firm) (1992-2012). Formerly, Chief Investment Officer, PG Corbin Asset Management (1990-1992). Formerly worked in institutional corporate bond sales at Kidder Peabody (1986-1990).
Other Directorships. Director of DraftKings, Inc. (digital sports entertainment and gaming company) (since September 2020). Director of Envestnet, Inc. (provider of intelligent systems for wealth management and financial wellness) (since 2018). Formerly, Director of Dynex Capital, Inc. (mortgage REIT) (2013-2020) and Director of Groupon, Inc. (e-commerce provider) (2020-2022). |
Keith Quinton
1958 | Trustee | Since 2018 | Private investor, researcher and lecturer. Formerly, Independent Investment Committee Member at New Hampshire Retirement System (2017-2021). Formerly, Portfolio Manager and Senior Quantitative Analyst at Fidelity Investments (investment management firm) (2001-2014).
Other Directorships. Formerly, Director (2016-2021) and Chairman (2019-2021) of New Hampshire Municipal Bond Bank. |
Marcus L. Smith
1966 | Trustee | Since 2018 | Private investor and independent corporate director. Formerly, Chief Investment Officer, Canada (2012-2017), Chief Investment Officer, Asia (2010-2012), Director of Asian Research (2004-2010) and portfolio manager (2001-2017) at MFS Investment Management (investment management firm).
Other Directorships. Director of First Industrial Realty Trust, Inc. (an industrial REIT) (since 2021). Director of MSCI Inc. (global provider of investment decision support tools) (since 2017). Formerly, Director of DCT Industrial Trust Inc. (logistics real estate company) (2017-2018). |
Susan J. Sutherland
1957 | Trustee | Since 2015 | Private investor. Director of Ascot Group Limited and certain of its subsidiaries (insurance and reinsurance) (since 2017). Formerly, Director of Hagerty Holding Corp. (insurance) (2015-2018) and Montpelier Re Holdings Ltd. (insurance and reinsurance) (2013-2015). Formerly, Associate, Counsel and Partner at Skadden, Arps, Slate, Meagher & Flom LLP (law firm) (1982-2013).
Other Directorships. Director of Kairos Acquisition Corp. (insurance/InsurTech acquisition company) (since 2021). |
Scott E. Wennerholm
1959 | Trustee | Since 2016 | Private Investor. Formerly, Trustee at Wheelock College (postsecondary institution) (2012-2018). Formerly, Consultant at GF Parish Group (executive recruiting firm) (2016-2017). Formerly, Chief Operating Officer and Executive Vice President at BNY Mellon Asset Management (investment management firm) (2005-2011). Formerly, Chief Operating Officer and Chief Financial Officer at Natixis Global Asset Management (investment management firm) (1997-2004). Formerly, Vice President at Fidelity Investments Institutional Services (investment management firm) (1994-1997).
Other Directorships. None. |
Nancy A. Wiser(1)
1967 | Trustee | Since 2022 | Formerly, Executive Vice President and the Global Head of Operations at Wells Fargo Asset Management (2011-2021).
Other Directorships. None. |
| Name and Year of Birth | Trust/Portfolio
Position(s) | Length of Service | Principal Occupation(s)
During Past Five Years |
| Principal Officers who are not Trustees |
Eric A. Stein
1980 | President of the
Trust | Since 2020 | Vice President and Chief Investment Officer, Fixed Income of EVM and BMR. Prior to November 1, 2020, Mr. Stein was a co-Director of Eaton Vance’s Global Income Investments. Also Vice President of Calvert Research and Management (“CRM”). |
Edward J. Perkin
1972 | President of the
Portfolio | Since 2014 | Chief Equity Investment Officer and Vice President of EVM and BMR since 2014. Also Vice President of CRM. |
Deidre E. Walsh
1971 | Vice President and Chief
Legal Officer | Since 2009 | Vice President of EVM and BMR. Also Vice President of CRM. |
Eaton Vance
Tax-Managed Multi-Cap Growth Fund
October 31, 2022
Management and Organization — continued
| Name and Year of Birth | Trust/Portfolio
Position(s) | Length of Service | Principal Occupation(s)
During Past Five Years |
| Principal Officers who are not Trustees (continued) |
James F. Kirchner
1967 | Treasurer | Since 2007 | Vice President of EVM and BMR. Also Vice President of CRM. |
Nicholas Di Lorenzo
1987 | Secretary | Since 2022 | Formerly, associate (2012-2021) and counsel (2022) at Dechert LLP. |
Richard F. Froio
1968 | Chief Compliance
Officer | Since 2017 | Vice President of EVM and BMR since 2017. Formerly Deputy Chief Compliance Officer (Adviser/Funds) and Chief Compliance Officer (Distribution) at PIMCO (2012-2017) and Managing Director at BlackRock/Barclays Global Investors (2009-2012). |
(1) Mr. Bowser and Ms. Wiser began serving as Trustees effective April 4, 2022.
The SAI for the Fund includes additional information about the Trustees and officers of the Fund and the Portfolio and can be obtained without charge on Eaton Vance’s website at www.eatonvance.com or by calling 1-800-262-1122.
| FACTS | WHAT DOES EATON VANCE DO WITH YOUR
PERSONAL INFORMATION? |
| Why? | Financial companies choose how they share your personal information. Federal law gives consumers the right to limit some but not all sharing. Federal law also requires us to tell you how we collect, share, and protect your personal information. Please read this notice carefully to understand what we do. |
| |
| What? | The types of personal information we collect and share depend on the product or service you have with us. This information can include:■ Social Security number and income
■ investment experience and risk tolerance
■ checking account number and wire transfer instructions |
| |
| How? | All financial companies need to share customers’ personal information to run their everyday business. In the section below, we list the reasons financial companies can share their customers’ personal information; the reasons Eaton Vance chooses to share; and whether you can limit this sharing. |
Reasons we can share your
personal information | Does Eaton Vance
share? | Can you limit
this sharing? |
| For our everyday business purposes — such as to process your transactions, maintain your account(s), respond to court orders and legal investigations, or report to credit bureaus | Yes | No |
| For our marketing purposes — to offer our products and services to you | Yes | No |
| For joint marketing with other financial companies | No | We don’t share |
| For our investment management affiliates’ everyday business purposes — information about your transactions, experiences, and creditworthiness | Yes | Yes |
| For our affiliates’ everyday business purposes — information about your transactions and experiences | Yes | No |
| For our affiliates’ everyday business purposes — information about your creditworthiness | No | We don’t share |
| For our investment management affiliates to market to you | Yes | Yes |
| For our affiliates to market to you | No | We don’t share |
| For nonaffiliates to market to you | No | We don’t share |
To limit our
sharing | Call toll-free 1-800-262-1122 or email: EVPrivacy@eatonvance.comPlease note:If you are a new customer, we can begin sharing your information 30 days from the date we sent this notice. When you are no longer our customer, we continue to share your information as described in this notice. However, you can contact us at any time to limit our sharing. |
| Questions? | Call toll-free 1-800-262-1122 or email: EVPrivacy@eatonvance.com |
| Privacy Notice — continued | April 2021 |
| Who we are |
| Who is providing this notice? | Eaton Vance Management, Eaton Vance Distributors, Inc., Eaton Vance Trust Company, Eaton Vance Management (International) Limited, Eaton Vance Advisers International Ltd., Eaton Vance Global Advisors Limited, Eaton Vance Management’s Real Estate Investment Group, Boston Management and Research, Calvert Research and Management, Eaton Vance and Calvert Fund Families and our investment advisory affiliates (“Eaton Vance”) (see Investment Management Affiliates definition below) |
| What we do |
How does Eaton Vance
protect my personal
information? | To protect your personal information from unauthorized access and use, we use security measures that comply with federal law. These measures include computer safeguards and secured files and buildings. We have policies governing the proper handling of customer information by personnel and requiring third parties that provide support to adhere to appropriate security standards with respect to such information. |
How does Eaton Vance
collect my personal
information? | We collect your personal information, for example, when you■ open an account or make deposits or withdrawals from your account
■ buy securities from us or make a wire transfer
■ give us your contact informationWe also collect your personal information from others, such as credit bureaus, affiliates, or other companies. |
| Why can’t I limit all sharing? | Federal law gives you the right to limit only■ sharing for affiliates’ everyday business purposes — information about your creditworthiness
■ affiliates from using your information to market to you
■ sharing for nonaffiliates to market to youState laws and individual companies may give you additional rights to limit sharing. See below for more on your rights under state law. |
| Definitions |
Investment Management
Affiliates | Eaton Vance Investment Management Affiliates include registered investment advisers, registered broker- dealers, and registered and unregistered funds. Investment Management Affiliates does not include entities associated with Morgan Stanley Wealth Management, such as Morgan Stanley Smith Barney LLC and Morgan Stanley & Co. |
| Affiliates | Companies related by common ownership or control. They can be financial and nonfinancial companies.■ Our affiliates include companies with a Morgan Stanley name and financial companies such as Morgan Stanley Smith Barney LLC and Morgan Stanley & Co. |
| Nonaffiliates | Companies not related by common ownership or control. They can be financial and nonfinancial companies.■ Eaton Vance does not share with nonaffiliates so they can market to you. |
| Joint marketing | A formal agreement between nonaffiliated financial companies that together market financial products or services to you.■ Eaton Vance doesn’t jointly market. |
| Other important information |
| Vermont: Except as permitted by law, we will not share personal information we collect about Vermont residents with Nonaffiliates unless you provide us with your written consent to share such information.California: Except as permitted by law, we will not share personal information we collect about California residents with Nonaffiliates and we will limit sharing such personal information with our Affiliates to comply with California privacy laws that apply to us. |
Delivery of Shareholder Documents. The Securities and Exchange Commission (SEC) permits funds to deliver only one copy of shareholder documents, including prospectuses, proxy statements and shareholder reports, to fund investors with multiple accounts at the same residential or post office box address. This practice is often called “householding” and it helps eliminate duplicate mailings to shareholders. Eaton Vance, or your financial intermediary, may household the mailing of your documents indefinitely unless you instruct Eaton Vance, or your financial intermediary, otherwise. If you would prefer that your Eaton Vance documents not be householded, please contact Eaton Vance at 1-800-262-1122, or contact your financial intermediary. Your instructions that householding not apply to delivery of your Eaton Vance documents will typically be effective within 30 days of receipt by Eaton Vance or your financial intermediary.
Portfolio Holdings. Each Eaton Vance Fund and its underlying Portfolio(s) (if applicable) files a schedule of portfolio holdings on Part F to Form N-PORT with the SEC. Certain information filed on Form N-PORT may be viewed on the Eaton Vance website at www.eatonvance.com, by calling Eaton Vance at 1-800-262-1122 or in the EDGAR database on the SEC’s website at www.sec.gov.
Proxy Voting. From time to time, funds are required to vote proxies related to the securities held by the funds. The Eaton Vance Funds or their underlying Portfolios (if applicable) vote proxies according to a set of policies and procedures approved by the Funds’ and Portfolios’ Boards. You may obtain a description of these policies and procedures and information on how the Funds or Portfolios voted proxies relating to portfolio securities during the most recent 12-month period ended June 30, without charge, upon request, by calling 1-800-262-1122 and by accessing the SEC’s website at www.sec.gov.
This Page Intentionally Left Blank
Investment Adviser of Tax-Managed Multi-Cap Growth Portfolio
Boston Management and Research
Two International Place
Boston, MA 02110
Investment Adviser and Administrator of Eaton Vance
Tax-Managed Multi-Cap Growth Fund
Eaton Vance Management
Two International Place
Boston, MA 02110
Principal Underwriter*
Eaton Vance Distributors, Inc.
Two International Place
Boston, MA 02110
(617) 482-8260
Custodian
State Street Bank and Trust Company
State Street Financial Center, One Lincoln Street
Boston, MA 02111
Transfer Agent
BNY Mellon Investment Servicing (US) Inc.
Attn: Eaton Vance Funds
P.O. Box 9653
Providence, RI 02940-9653
(800) 262-1122
Independent Registered Public Accounting Firm
Deloitte & Touche LLP
200 Berkeley Street
Boston, MA 02116-5022
Fund Offices
Two International Place
Boston, MA 02110
* FINRA BrokerCheck. Investors may check the background of their Investment Professional by contacting the Financial Industry Regulatory Authority (FINRA). FINRA BrokerCheck is a free tool to help investors check the professional background of current and former FINRA-registered securities firms and brokers. FINRA BrokerCheck is available by calling 1-800-289-9999 and at www.FINRA.org. The FINRA BrokerCheck brochure describing this program is available to investors at www.FINRA.org.
Eaton Vance
Tax-Managed Small-Cap Fund
Annual Report
October 31, 2022
Commodity Futures Trading Commission Registration. The Commodity Futures Trading Commission (“CFTC”) has adopted regulations that subject registered investment companies and advisers to regulation by the CFTC if a fund invests more than a prescribed level of its assets in certain CFTC-regulated instruments (including futures, certain options and swap agreements) or markets itself as providing investment exposure to such instruments. The investment adviser has claimed an exclusion from the definition of “commodity pool operator” under the Commodity Exchange Act with respect to its management of the Fund. Accordingly, neither the Fund nor the adviser with respect to the operation of the Fund is subject to CFTC regulation. Because of its management of other strategies, the Fund's adviser is registered with the CFTC as a commodity pool operator. The adviser is also registered as a commodity trading advisor.
Fund shares are not insured by the FDIC and are not deposits or other obligations of, or guaranteed by, any depository institution. Shares are subject to investment risks, including possible loss of principal invested.
This report must be preceded or accompanied by a current summary prospectus or prospectus. Before investing, investors should consider carefully the investment objective, risks, and charges and expenses of a mutual fund. This and other important information is contained in the summary prospectus and prospectus, which can be obtained from a financial intermediary. Prospective investors should read the prospectus carefully before investing. For further information, please call 1-800-262-1122.
Annual Report October 31, 2022
Eaton Vance
Tax-Managed Small-Cap Fund
Eaton Vance
Tax-Managed Small-Cap Fund
October 31, 2022
Management’s Discussion of Fund Performance†
Economic and Market Conditions
The 12-month period starting November 1, 2021, was dominated by the ongoing effects of one black swan event -- the COVID-19 pandemic -- and fallout from another -- Russia’s invasion of Ukraine in February 2022.
In the opening months of the period, stock investors as well as consumers generally appeared to take a “glass is half full” approach. Despite the appearance of a more contagious COVID-19 variant, the highest inflation readings in four decades, and the U.S. Federal Reserve’s (the Fed’s) announcement that it would begin tapering bond purchases that had supported economic growth, major U.S. equity indexes repeatedly closed at new all-time highs during the final months of 2021. As consumers rushed to spend money saved earlier in the pandemic, Mastercard, Inc. reported its highest retail sales on record during the 2021 holiday season.
But as the new year began, investors appeared to reevaluate the twin threats of inflation and interest rate hikes, and stock performance turned negative. In February, Russia’s invasion of Ukraine sent shock waves through U.S. and global markets, exacerbating inflationary pressures on energy and food costs.
As the Fed’s outlook on inflation worsened from “transitory” to “persistent,” investors began to expect the Fed would raise interest rates at every 2022 policy meeting and, in turn, worried that aggressive rate hikes could tip the U.S. economy into recession. At its June, July, and September meetings, the Fed hiked the federal funds rate 0.75% each time -- to a 3.00%-3.25% range -- its first moves of that magnitude since 1994. Higher interest rates, inflation, and recessionary worries drove stock prices down, with rate-sensitive technology stocks -- star performers earlier in the pandemic -- suffering some of the worst declines.
As the period came to a close in October 2022, however, U.S. stocks delivered positive performance for the first time in months -- driven by a combination of better-than-expected company earnings; improving investor sentiment that stocks had been oversold during the August-September 2022 market pullback; and hope that after three aggressive rate hikes, the Fed might announce a smaller rate increase at its next meeting in November.
For the period as a whole, the blue-chip Dow Jones Industrial Average® returned -6.74%; the S&P 500® Index, a broad measure of U.S. stocks, returned -14.61%; and the technology-laden Nasdaq Composite Index returned -28.56%.
Fund Performance
For the 12-month period ended October 31, 2022, Eaton Vance Tax-Managed Small-Cap Fund (the Fund) returned -12.82% for Class A shares at net asset value (NAV), outperforming its benchmark, the Russell 2000® Index (the Index), which returned -18.54%.
Security selection contributed to performance relative to the Index during the period. Selections in the health care, financials, and consumer discretionary sectors were particularly beneficial. An underweight exposure to the health care, communication services, and information technology (IT) sectors also enhanced relative performance.
Sector allocations overall detracted from performance relative to the Index during the period. In particular, an underweight exposure to the energy sector weighed on relative returns. Security selections within the IT and industrials sectors also had a negative impact on relative performance.
CBIZ, Inc. (CBIZ), a global consulting firm providing accounting, tax, insurance, and advisory services, was a leading contributor to returns relative to the Index during the period. CBIZ’s share price rose after the company reported strong second-quarter earnings and revenue, driven by growth in its property and casualty insurance, and financial services businesses.
The share price of Performance Food Group Co. (Performance) -- a food distributor for restaurants, businesses, and schools -- rose as sales and profits increased, largely attributed to Performance’s 2021 acquisition of competitor Core-Mark Holding Co., Inc., a wholesale distributor to the convenience retail industry.
Ryan Specialty Holdings, Inc., a specialty insurance firm, was also a top contributor to relative performance during the period. The company reported strong revenue growth in the second quarter.
Ambarella, Inc. (Ambarella), a developer of semiconductors for high-definition video in the IT sector, detracted from relative returns during the period. Ambarella’s stock price fell after the company announced that revenue and earnings projections for the first quarter of 2022 were lower than expected. Ambarella attributed the disappointing projections to slowing demand due to disruptions in customer supply chains.
AZEK Co., Inc. (AZEK), a manufacturer of composite decking and building materials in the industrials sector, also detracted from returns relative to the Index. Excess customer inventory and investor concerns about decelerating demand for both new construction and home renovations weighed on AZEK’s share price during the period.
National Vision Holdings, Inc. (National Vision), an optical retailer, also detracted from Fund performance relative to the Index during the period. National Vision’s stock price fell after the company announced lower first-quarter earnings and revenue than the first quarter a year earlier.
See Endnotes and Additional Disclosures in this report.
Past performance is no guarantee of future results. Returns are historical and are calculated by determining the percentage change in net asset value (NAV) or offering price (as applicable) with all distributions reinvested. Furthermore, returns do not reflect the deduction of taxes that shareholders may have to pay on Fund distributions or upon the redemption of Fund shares. Investment return and principal value will fluctuate so that shares, when redeemed, may be worth more or less than their original cost. Performance for periods less than or equal to one year is cumulative. Performance is for the stated time period only; due to market volatility, current Fund performance may be lower or higher than the quoted return. For performance as of the most recent month-end, please refer to eatonvance.com.
Eaton Vance
Tax-Managed Small-Cap Fund
October 31, 2022
Performance
Portfolio Manager(s) J. Griffith Noble, CFA and Michael D. McLean, CFA
| % Average Annual Total Returns1,2 | Class
Inception Date | Performance
Inception Date | One Year | Five Years | Ten Years |
| Class A at NAV | 09/25/1997 | 09/25/1997 | (12.82)% | 7.34% | 10.14% |
| Class A with 5.25% Maximum Sales Charge | — | — | (17.40) | 6.19 | 9.55 |
| Class C at NAV | 09/29/1997 | 09/25/1997 | (13.43) | 6.55 | 9.48 |
| Class C with 1% Maximum Deferred Sales Charge | — | — | (14.22) | 6.55 | 9.48 |
| Class I at NAV | 10/01/2009 | 09/25/1997 | (12.56) | 7.62 | 10.41 |
|
| Russell 2000® Index | — | — | (18.54)% | 5.56% | 9.93% |
| % After-Tax Returns with Maximum Sales Charge2 | Class
Inception Date | Performance
Inception Date | One Year | Five Years | Ten Years |
| Class A After Taxes on Distributions | 09/25/1997 | 09/25/1997 | (18.85)% | 4.66% | 8.42% |
| Class A After Taxes on Distributions and Sale of Fund Shares | — | — | (8.80) | 4.75 | 7.81 |
| Class C After Taxes on Distributions | 09/29/1997 | 09/25/1997 | (16.00) | 4.70 | 8.18 |
| Class C After Taxes on Distributions and Sale of Fund Shares | — | — | (6.43) | 5.03 | 7.70 |
| Class I After Taxes on Distributions | 10/01/2009 | 09/25/1997 | (14.11) | 6.07 | 9.29 |
| Class I After Taxes on Distributions and Sale of Fund Shares | — | — | (5.88) | 5.90 | 8.58 |
| % Total Annual Operating Expense Ratios3 | Class A | Class C | Class I |
| | 1.11% | 1.86% | 0.86% |
Growth of $10,000
This graph shows the change in value of a hypothetical investment of $10,000 in Class A of the Fund for the period indicated. For comparison, the same investment is shown in the indicated index.
| Growth of Investment | Amount Invested | Period Beginning | At NAV | With Maximum Sales Charge |
| Class C | $10,000 | 10/31/2012 | $24,751 | N.A. |
| Class I, at minimum investment | $1,000,000 | 10/31/2012 | $2,694,546 | N.A. |
See Endnotes and Additional Disclosures in this report.
Past performance is no guarantee of future results. Returns are historical and are calculated by determining the percentage change in net asset value (NAV) or offering price (as applicable) with all distributions reinvested. Furthermore, returns do not reflect the deduction of taxes that shareholders may have to pay on Fund distributions or upon the redemption of Fund shares. Investment return and principal value will fluctuate so that shares, when redeemed, may be worth more or less than their original cost. Performance for periods less than or equal to one year is cumulative. Performance is for the stated time period only; due to market volatility, current Fund performance may be lower or higher than the quoted return. For performance as of the most recent month-end, please refer to eatonvance.com.
Eaton Vance
Tax-Managed Small-Cap Fund
October 31, 2022
| Sector Allocation (% of net assets)1 |
| Top 10 Holdings (% of net assets)1 |
| CBIZ, Inc. | 3.2% |
| Performance Food Group Co. | 2.9 |
| SouthState Corp. | 2.7 |
| Chemed Corp. | 2.4 |
| Commerce Bancshares, Inc. | 2.4 |
| RLI Corp. | 2.4 |
| Addus HomeCare Corp. | 2.3 |
| Valvoline, Inc. | 2.3 |
| Ryan Specialty Holdings, Inc., Class A | 2.2 |
| ONE Gas, Inc. | 2.2 |
| Total | 25.0% |
Footnotes:
Fund invests in an affiliated investment company (Portfolio) with the same objective(s) and policies as the Fund. References to investments are to the Portfolio’s holdings.
| 1 | Excludes cash and cash equivalents. |
Eaton Vance
Tax-Managed Small-Cap Fund
October 31, 2022
Endnotes and Additional Disclosures
| † | The views expressed in this report are those of the portfolio manager(s) and are current only through the date stated at the top of this page. These views are subject to change at any time based upon market or other conditions, and Eaton Vance and the Fund(s) disclaim any responsibility to update such views. These views may not be relied upon as investment advice and, because investment decisions are based on many factors, may not be relied upon as an indication of trading intent on behalf of any Eaton Vance fund. This commentary may contain statements that are not historical facts, referred to as “forward-looking statements.” The Fund’s actual future results may differ significantly from those stated in any forward-looking statement, depending on factors such as changes in securities or financial markets or general economic conditions, the volume of sales and purchases of Fund shares, the continuation of investment advisory, administrative and service contracts, and other risks discussed from time to time in the Fund’s filings with the Securities and Exchange Commission. |
| | |
| 1 | Russell 2000® Index is an unmanaged index of 2,000 U.S. small-cap stocks. Unless otherwise stated, index returns do not reflect the effect of any applicable sales charges, commissions, expenses, taxes or leverage, as applicable. It is not possible to invest directly in an index. |
| 2 | Total Returns at NAV do not include applicable sales charges. If sales charges were deducted, the returns would be lower. Total Returns shown with maximum sales charge reflect the stated maximum sales charge. Unless otherwise stated, performance does not reflect the deduction of taxes on Fund distributions or redemptions of Fund shares. After-tax returns are calculated using certain assumptions, including using the highest historical individual federal income tax rates, and do not reflect the impact of state/local taxes. Actual after-tax returns depend on a shareholder’s tax situation and the actual characterization of distributions and may differ from those shown. After-tax returns are not relevant to shareholders who hold shares in tax-deferred accounts or shares held by nontaxable entities. Return After Taxes on Distributions may be the same as Return Before Taxes for the same period because no taxable distributions were made during that period. Return After Taxes on Distributions and Sale of Fund Shares may be greater than or equal to Return After Taxes on Distributions for the same period because of losses realized on the sale of Fund shares. The Fund’s after-tax returns also may reflect foreign tax credits passed by the Fund to its shareholders.Effective November 5, 2020, Class C shares automatically convert to Class A shares eight years after purchase. The average annual total returns listed for Class C reflect conversion to Class A shares after eight years. Prior to November 5, 2020, Class C shares automatically converted to Class A shares ten years after purchase. |
| 3 | Source: Fund prospectus. The expense ratios for the current reporting period can be found in the Financial Highlights section of this report. Performance reflects expenses waived and/or reimbursed, if applicable. Without such waivers and/or reimbursements, performance would have been lower. |
| | Fund profile subject to change due to active management. |
| | Additional Information |
| | S&P 500® Index is an unmanaged index of large-cap stocks commonly used as a measure of U.S. stock market performance. Dow Jones Industrial Average® is a price-weighted average of 30 blue-chip stocks that are generally the leaders in their industry. S&P Dow Jones Indices are a product of S&P Dow Jones Indices LLC (“S&P DJI”) and have been licensed for use. S&P® and S&P 500® are registered trademarks of S&P DJI; Dow Jones® is a registered trademark of Dow Jones Trademark Holdings LLC (“Dow Jones”); S&P DJI, Dow Jones and their respective affiliates do not sponsor, endorse, sell or promote the Fund, will not have any liability with respect thereto and do not have any liability for any errors, omissions, or interruptions of the S&P Dow Jones Indices. Nasdaq Composite Index is a market capitalization-weighted index of all domestic and international securities listed on Nasdaq. Source: Nasdaq, Inc. The information is provided by Nasdaq (with its affiliates, are referred to as the “Corporations”) and Nasdaq’s third party licensors on an “as is” basis and the Corporations make no guarantees and bear no liability of any kind with respect to the information or the Fund. |
Eaton Vance
Tax-Managed Small-Cap Fund
October 31, 2022
Example
As a Fund shareholder, you incur two types of costs: (1) transaction costs, including sales charges (loads) on purchases and redemption fees (if applicable); and (2) ongoing costs, including management fees; distribution and/or service fees; and other Fund expenses. This Example is intended to help you understand your ongoing costs (in dollars) of Fund investing and to compare these costs with the ongoing costs of investing in other mutual funds. The Example is based on an investment of $1,000 invested at the beginning of the period and held for the entire period (May 1, 2022 to October 31, 2022).
Actual Expenses
The first section of the table below provides information about actual account values and actual expenses. You may use the information in this section, together with the amount you invested, to estimate the expenses that you paid over the period. Simply divide your account value by $1,000 (for example, an $8,600 account value divided by $1,000 = 8.6), then multiply the result by the number in the first section under the heading entitled “Expenses Paid During Period” to estimate the expenses you paid on your account during this period.
Hypothetical Example for Comparison Purposes
The second section of the table below provides information about hypothetical account values and hypothetical expenses based on the actual Fund expense ratio and an assumed rate of return of 5% per year (before expenses), which is not the actual Fund return. The hypothetical account values and expenses may not be used to estimate the actual ending account balance or expenses you paid for the period. You may use this information to compare the ongoing costs of investing in your Fund and other funds. To do so, compare this 5% hypothetical example with the 5% hypothetical examples that appear in the shareholder reports of the other funds.
Please note that the expenses shown in the table are meant to highlight your ongoing costs only and do not reflect any transactional costs, such as sales charges (loads) or redemption fees (if applicable). Therefore, the second section of the table is useful in comparing ongoing costs only, and will not help you determine the relative total costs of owning different funds. In addition, if these transactional costs were included, your costs would be higher.
| | Beginning
Account Value
(5/1/22) | Ending
Account Value
(10/31/22) | Expenses Paid
During Period*
(5/1/22 – 10/31/22) | Annualized
Expense
Ratio |
| Actual | | | | |
| Class A | $1,000.00 | $ 967.10 | $5.80 | 1.17% |
| Class C | $1,000.00 | $ 963.70 | $9.50 | 1.92% |
| Class I | $1,000.00 | $ 968.60 | $4.56 | 0.92% |
| |
| Hypothetical | | | | |
| (5% return per year before expenses) | | | | |
| Class A | $1,000.00 | $1,019.31 | $5.96 | 1.17% |
| Class C | $1,000.00 | $1,015.53 | $9.75 | 1.92% |
| Class I | $1,000.00 | $1,020.57 | $4.69 | 0.92% |
| * | Expenses are equal to the Fund's annualized expense ratio for the indicated Class, multiplied by the average account value over the period, multiplied by 184/365 (to reflect the one-half year period). The Example assumes that the $1,000 was invested at the net asset value per share determined at the close of business on April 30, 2022. The Example reflects the expenses of both the Fund and the Portfolio. |
Eaton Vance
Tax-Managed Small-Cap Fund
October 31, 2022
Statement of Assets and Liabilities
| | October 31, 2022 |
| Assets | |
| Investment in Tax-Managed Small-Cap Portfolio, at value (identified cost $97,511,771) | $ 118,408,984 |
| Receivable for Fund shares sold | 33,901 |
| Total assets | $118,442,885 |
| Liabilities | |
| Payable for Fund shares redeemed | $ 52,938 |
| Payable to affiliates: | |
| Distribution and service fees | 19,802 |
| Trustees' fees | 42 |
| Accrued expenses | 73,767 |
| Total liabilities | $ 146,549 |
| Net Assets | $118,296,336 |
| Sources of Net Assets | |
| Paid-in capital | $ 98,625,896 |
| Distributable earnings | 19,670,440 |
| Net Assets | $118,296,336 |
| Class A Shares | |
| Net Assets | $ 88,303,156 |
| Shares Outstanding | 3,160,117 |
Net Asset Value and Redemption Price Per Share
(net assets ÷ shares of beneficial interest outstanding) | $ 27.94 |
Maximum Offering Price Per Share
(100 ÷ 94.75 of net asset value per share) | $ 29.49 |
| Class C Shares | |
| Net Assets | $ 2,574,302 |
| Shares Outstanding | 122,840 |
Net Asset Value and Offering Price Per Share*
(net assets ÷ shares of beneficial interest outstanding) | $ 20.96 |
| Class I Shares | |
| Net Assets | $ 27,418,878 |
| Shares Outstanding | 945,284 |
Net Asset Value, Offering Price and Redemption Price Per Share
(net assets ÷ shares of beneficial interest outstanding) | $ 29.01 |
| On sales of $50,000 or more, the offering price of Class A shares is reduced. |
| * | Redemption price per share is equal to the net asset value less any applicable contingent deferred sales charge. |
7
See Notes to Financial Statements.
Eaton Vance
Tax-Managed Small-Cap Fund
October 31, 2022
| | Year Ended |
| | October 31, 2022 |
| Investment Income | |
| Dividend income allocated from Portfolio | $ 1,391,179 |
| Expenses allocated from Portfolio | (869,121) |
| Total investment income from Portfolio | $ 522,058 |
| Expenses | |
| Distribution and service fees: | |
| Class A | $ 238,759 |
| Class C | 26,720 |
| Trustees’ fees and expenses | 499 |
| Custodian fee | 18,983 |
| Transfer and dividend disbursing agent fees | 116,051 |
| Legal and accounting services | 34,820 |
| Printing and postage | 13,731 |
| Registration fees | 50,960 |
| ReFlow liquidity program fees | 23,583 |
| Miscellaneous | 10,816 |
| Total expenses | $ 534,922 |
| Net investment loss | $ (12,864) |
| Realized and Unrealized Gain (Loss) from Portfolio | |
| Net realized gain (loss): | |
| Investment transactions | $ 5,996,029(1) |
| Net realized gain | $ 5,996,029 |
| Change in unrealized appreciation (depreciation): | |
| Investments | $ (23,823,045) |
| Net change in unrealized appreciation (depreciation) | $(23,823,045) |
| Net realized and unrealized loss | $(17,827,016) |
| Net decrease in net assets from operations | $(17,839,880) |
| (1) | Includes $3,413,071 of net realized gains from redemptions in-kind. |
8
See Notes to Financial Statements.
Eaton Vance
Tax-Managed Small-Cap Fund
October 31, 2022
Statements of Changes in Net Assets
| | Year Ended October 31, |
| | 2022 | 2021 |
| Increase (Decrease) in Net Assets | | |
| From operations: | | |
| Net investment loss | $ (12,864) | $ (169,495) |
| Net realized gain | 5,996,029 (1) | 15,615,435 (2) |
| Net change in unrealized appreciation (depreciation) | (23,823,045) | 27,298,975 |
| Net increase (decrease) in net assets from operations | $ (17,839,880) | $ 42,744,915 |
| Distributions to shareholders: | | |
| Class A | $ (8,360,876) | $ (86,568) |
| Class C | (312,679) | — |
| Class I | (2,381,714) | (74,765) |
| Total distributions to shareholders | $ (11,055,269) | $ (161,333) |
| Transactions in shares of beneficial interest: | | |
| Class A | $ 2,875,658 | $ (3,763,833) |
| Class C | 49,659 | (1,546,614) |
| Class I | 3,524,878 | 1,127,150 |
| Net increase (decrease) in net assets from Fund share transactions | $ 6,450,195 | $ (4,183,297) |
| Net increase (decrease) in net assets | $ (22,444,954) | $ 38,400,285 |
| Net Assets | | |
| At beginning of year | $ 140,741,290 | $ 102,341,005 |
| At end of year | $118,296,336 | $140,741,290 |
| (1) | Includes $3,413,071 of net realized gains from redemptions in-kind. |
| (2) | Includes $1,757,643 of net realized gains from redemptions in-kind. |
9
See Notes to Financial Statements.
Eaton Vance
Tax-Managed Small-Cap Fund
October 31, 2022
| | Class A |
| | Year Ended October 31, |
| | 2022 | 2021 | 2020 | 2019 | 2018 |
| Net asset value — Beginning of year | $ 34.810 | $ 24.520 | $ 26.960 | $ 25.910 | $ 27.390 |
| Income (Loss) From Operations | | | | | |
| Net investment income (loss)(1) | $ (0.014) | $ (0.052) | $ 0.016 | $ (0.001) | $ (0.059) |
| Net realized and unrealized gain (loss) | (4.121) | 10.369 | (0.739) | 2.765 | 1.583 |
| Total income (loss) from operations | $ (4.135) | $ 10.317 | $ (0.723) | $ 2.764 | $ 1.524 |
| Less Distributions | | | | | |
| From net investment income | $ (0.025) | $ (0.027) | $ — | $ (0.032) | $ — |
| From net realized gain | (2.710) | — | (1.717) | (1.682) | (3.004) |
| Total distributions | $ (2.735) | $ (0.027) | $ (1.717) | $ (1.714) | $ (3.004) |
| Net asset value — End of year | $27.940 | $ 34.810 | $24.520 | $26.960 | $25.910 |
| Total Return(2) | (12.82)% | 42.10% | (3.09)% | 12.26% | 5.79% |
| Ratios/Supplemental Data | | | | | |
| Net assets, end of year (000’s omitted) | $ 88,303 | $107,257 | $ 78,430 | $ 89,352 | $ 75,199 |
| Ratios (as a percentage of average daily net assets):(3) | | | | | |
| Expenses | 1.15% (4) | 1.11% | 1.17% | 1.20% | 1.17% |
| Net investment income (loss) | (0.05)% | (0.16)% | 0.06% | (0.01)% | (0.22)% |
| Portfolio Turnover of the Portfolio | 43% | 40% | 44% | 51% | 51% |
| (1) | Computed using average shares outstanding. |
| (2) | Returns are historical and are calculated by determining the percentage change in net asset value with all distributions reinvested and do not reflect the effect of sales charges. |
| (3) | Includes the Fund’s share of the Portfolio’s allocated expenses. |
| (4) | Includes a reduction by the investment adviser of a portion of the Portfolio's adviser fee due to the Portfolio’s investment in the Liquidity Fund (equal to less than 0.005% of average daily net assets for the year ended October 31, 2022). |
10
See Notes to Financial Statements.
Eaton Vance
Tax-Managed Small-Cap Fund
October 31, 2022
Financial Highlights — continued
| | Class C |
| | Year Ended October 31, |
| | 2022 | 2021 | 2020 | 2019 | 2018 |
| Net asset value — Beginning of year | $ 26.780 | $ 18.990 | $ 21.410 | $ 21.070 | $ 22.970 |
| Income (Loss) From Operations | | | | | |
| Net investment loss(1) | $ (0.177) | $ (0.215) | $ (0.126) | $ (0.111) | $ (0.212) |
| Net realized and unrealized gain (loss) | (3.100) | 8.005 | (0.577) | 2.133 | 1.316 |
| Total income (loss) from operations | $ (3.277) | $ 7.790 | $ (0.703) | $ 2.022 | $ 1.104 |
| Less Distributions | | | | | |
| From net realized gain | $ (2.543) | $ — | $ (1.717) | $ (1.682) | $ (3.004) |
| Total distributions | $ (2.543) | $ — | $ (1.717) | $ (1.682) | $ (3.004) |
| Net asset value — End of year | $20.960 | $26.780 | $18.990 | $21.410 | $21.070 |
| Total Return(2) | (13.43)% | 41.02% | (3.86)% | 11.45% | 4.99% |
| Ratios/Supplemental Data | | | | | |
| Net assets, end of year (000’s omitted) | $ 2,574 | $ 3,236 | $ 3,565 | $ 5,675 | $ 18,482 |
| Ratios (as a percentage of average daily net assets):(3) | | | | | |
| Expenses | 1.90% (4) | 1.86% | 1.92% | 1.95% | 1.92% |
| Net investment loss | (0.79)% | (0.87)% | (0.66)% | (0.55)% | (0.96)% |
| Portfolio Turnover of the Portfolio | 43% | 40% | 44% | 51% | 51% |
| (1) | Computed using average shares outstanding. |
| (2) | Returns are historical and are calculated by determining the percentage change in net asset value with all distributions reinvested and do not reflect the effect of sales charges. |
| (3) | Includes the Fund’s share of the Portfolio’s allocated expenses. |
| (4) | Includes a reduction by the investment adviser of a portion of the Portfolio's adviser fee due to the Portfolio’s investment in the Liquidity Fund (equal to less than 0.005% of average daily net assets for the year ended October 31, 2022). |
11
See Notes to Financial Statements.
Eaton Vance
Tax-Managed Small-Cap Fund
October 31, 2022
Financial Highlights — continued
| | Class I |
| | Year Ended October 31, |
| | 2022 | 2021 | 2020 | 2019 | 2018 |
| Net asset value — Beginning of year | $ 36.020 | $ 25.370 | $ 27.770 | $ 26.650 | $ 28.020 |
| Income (Loss) From Operations | | | | | |
| Net investment income(1) | $ 0.059 | $ 0.027 | $ 0.081 | $ 0.071 | $ 0.007 |
| Net realized and unrealized gain (loss) | (4.251) | 10.714 | (0.764) | 2.833 | 1.627 |
| Total income (loss) from operations | $ (4.192) | $10.741 | $ (0.683) | $ 2.904 | $ 1.634 |
| Less Distributions | | | | | |
| From net investment income | $ (0.108) | $ (0.091) | $ — | $ (0.102) | $ — |
| From net realized gain | (2.710) | — | (1.717) | (1.682) | (3.004) |
| Total distributions | $ (2.818) | $ (0.091) | $ (1.717) | $ (1.784) | $ (3.004) |
| Net asset value — End of year | $29.010 | $36.020 | $25.370 | $27.770 | $26.650 |
| Total Return(2) | (12.56)% | 42.46% | (2.89)% | 12.52% | 6.07% |
| Ratios/Supplemental Data | | | | | |
| Net assets, end of year (000’s omitted) | $ 27,419 | $ 30,248 | $ 20,346 | $ 24,763 | $ 24,628 |
| Ratios (as a percentage of average daily net assets):(3) | | | | | |
| Expenses | 0.90% (4) | 0.86% | 0.92% | 0.95% | 0.92% |
| Net investment income | 0.19% | 0.08% | 0.32% | 0.27% | 0.02% |
| Portfolio Turnover of the Portfolio | 43% | 40% | 44% | 51% | 51% |
| (1) | Computed using average shares outstanding. |
| (2) | Returns are historical and are calculated by determining the percentage change in net asset value with all distributions reinvested. |
| (3) | Includes the Fund’s share of the Portfolio’s allocated expenses. |
| (4) | Includes a reduction by the investment adviser of a portion of the Portfolio's adviser fee due to the Portfolio’s investment in the Liquidity Fund (equal to less than 0.005% of average daily net assets for the year ended October 31, 2022). |
12
See Notes to Financial Statements.
Eaton Vance
Tax-Managed Small-Cap Fund
October 31, 2022
Notes to Financial Statements
1 Significant Accounting Policies
Eaton Vance Tax-Managed Small-Cap Fund (the Fund) is a diversified series of Eaton Vance Mutual Funds Trust (the Trust). The Trust is a Massachusetts business trust registered under the Investment Company Act of 1940, as amended (the 1940 Act), as an open-end management investment company. The Fund offers three classes of shares. Class A shares are generally sold subject to a sales charge imposed at time of purchase. Class C shares are sold at net asset value and are generally subject to a contingent deferred sales charge (see Note 5). Effective November 5, 2020, Class C shares automatically convert to Class A shares eight years after their purchase as described in the Fund’s prospectus. Class I shares are sold at net asset value and are not subject to a sales charge. Each class represents a pro-rata interest in the Fund, but votes separately on class-specific matters and (as noted below) is subject to different expenses. Realized and unrealized gains and losses and net investment income and losses, other than class-specific expenses, are allocated daily to each class of shares based on the relative net assets of each class to the total net assets of the Fund. Each class of shares differs in its distribution plan and certain other class-specific expenses. The Fund invests all of its investable assets in interests in Tax-Managed Small-Cap Portfolio (the Portfolio), a Massachusetts business trust, having the same investment objective and policies as the Fund. The value of the Fund’s investment in the Portfolio reflects the Fund’s proportionate interest in the net assets of the Portfolio (65.9% at October 31, 2022). The performance of the Fund is directly affected by the performance of the Portfolio. The financial statements of the Portfolio, including the portfolio of investments, are included elsewhere in this report and should be read in conjunction with the Fund’s financial statements.
The following is a summary of significant accounting policies of the Fund. The policies are in conformity with accounting principles generally accepted in the United States of America (U.S. GAAP). The Fund is an investment company and follows accounting and reporting guidance in the Financial Accounting Standards Board (FASB) Accounting Standards Codification Topic 946.
A Investment Valuation—Valuation of securities by the Portfolio is discussed in Note 1A of the Portfolio's Notes to Financial Statements, which are included elsewhere in this report.
B Income— The Fund's net investment income or loss consists of the Fund's pro-rata share of the net investment income or loss of the Portfolio, less all actual and accrued expenses of the Fund.
C Federal Taxes—The Fund's policy is to comply with the provisions of the Internal Revenue Code applicable to regulated investment companies and to distribute to shareholders each year substantially all of its net investment income, and all or substantially all of its net realized capital gains. Accordingly, no provision for federal income or excise tax is necessary.
As of October 31, 2022, the Fund had no uncertain tax positions that would require financial statement recognition, de-recognition, or disclosure. The Fund files a U.S. federal income tax return annually after its fiscal year-end, which is subject to examination by the Internal Revenue Service for a period of three years from the date of filing.
D Expenses—The majority of expenses of the Trust are directly identifiable to an individual fund. Expenses which are not readily identifiable to a specific fund are allocated taking into consideration, among other things, the nature and type of expense and the relative size of the funds.
E Use of Estimates—The preparation of the financial statements in conformity with U.S. GAAP requires management to make estimates and assumptions that affect the reported amounts of assets and liabilities at the date of the financial statements and the reported amounts of income and expense during the reporting period. Actual results could differ from those estimates.
F Indemnifications—Under the Trust’s organizational documents, its officers and Trustees may be indemnified against certain liabilities and expenses arising out of the performance of their duties to the Fund. Under Massachusetts law, if certain conditions prevail, shareholders of a Massachusetts business trust (such as the Trust) could be deemed to have personal liability for the obligations of the Trust. However, the Trust’s Declaration of Trust contains an express disclaimer of liability on the part of Fund shareholders and the By-laws provide that the Trust shall assume, upon request by the shareholder, the defense on behalf of any Fund shareholders. Moreover, the By-laws also provide for indemnification out of Fund property of any shareholder held personally liable solely by reason of being or having been a shareholder for all loss or expense arising from such liability. Additionally, in the normal course of business, the Fund enters into agreements with service providers that may contain indemnification clauses. The Fund’s maximum exposure under these arrangements is unknown as this would involve future claims that may be made against the Fund that have not yet occurred.
G Other—Investment transactions are accounted for on a trade date basis.
Eaton Vance
Tax-Managed Small-Cap Fund
October 31, 2022
Notes to Financial Statements — continued
2 Distributions to Shareholders and Income Tax Information
It is the present policy of the Fund to make at least one distribution annually (normally in December) of all or substantially all of its net investment income and to distribute annually all or substantially all of its net realized capital gains. Distributions to shareholders are recorded on the ex-dividend date. Distributions are declared separately for each class of shares. Shareholders may reinvest income and capital gain distributions in additional shares of the same class of the Fund at the net asset value as of the ex-dividend date or, at the election of the shareholder, receive distributions in cash. Distributions to shareholders are determined in accordance with income tax regulations, which may differ from U.S. GAAP. As required by U.S. GAAP, only distributions in excess of tax basis earnings and profits are reported in the financial statements as a return of capital. Permanent differences between book and tax accounting relating to distributions are reclassified to paid-in capital. For tax purposes, distributions from short-term capital gains are considered to be from ordinary income.
The tax character of distributions declared for the years ended October 31, 2022 and October 31, 2021 was as follows:
| | Year Ended October 31, |
| | 2022 | 2021 |
| Ordinary income | $1,966,083 | $161,333 |
| Long-term capital gains | $9,089,186 | $ — |
During the year ended October 31, 2022, distributable earnings was decreased by $5,143,163 and paid-in capital was increased by $5,143,163 due to differences between book and tax accounting for net operating losses and redemptions in-kind. These reclassifications had no effect on the net assets or net asset value per share of the Fund.
As of October 31, 2022, the components of distributable earnings (accumulated loss) on a tax basis were as follows:
| Undistributed long-term capital gains | $ 2,943,765 |
| Net unrealized appreciation | 16,726,675 |
| Distributable earnings | $19,670,440 |
3 Investment Adviser Fee and Other Transactions with Affiliates
The investment adviser fee is earned by Eaton Vance Management (EVM), an indirect, wholly-owned subsidiary of Morgan Stanley, as compensation for investment advisory services rendered to the Fund. The fee is computed at an annual rate as a percentage of the Fund’s average daily net assets that are not invested in other investment companies for which EVM or its affiliates serve as investment adviser and receive an advisory fee as follows and is payable monthly:
| Average Daily Net Assets | Annual Fee Rate |
| Up to $500 million | 0.6250% |
| $500 million but less than $1 billion | 0.5625% |
| $1 billion but less than $1.5 billion | 0.5000% |
| $1.5 billion and over | 0.4375% |
For the year ended October 31, 2022, the Fund incurred no investment adviser fee on such assets. To the extent that the Fund’s assets are invested in the Portfolio, the Fund is allocated its share of the Portfolio’s investment adviser fee. The Portfolio has engaged Boston Management and Research (BMR) to render investment advisory services. See Note 2 of the Portfolio’s Notes to Financial Statements which are included elsewhere in this report. EVM also serves as the administrator of the Fund, but receives no compensation.
EVM provides sub-transfer agency and related services to the Fund pursuant to a Sub-Transfer Agency Support Services Agreement. For the year ended October 31, 2022, EVM earned $37,000 from the Fund pursuant to such agreement, which is included in transfer and dividend disbursing agent fees on the Statement of Operations. The Fund was informed that Eaton Vance Distributors, Inc. (EVD), an affiliate of EVM and the Fund's principal underwriter, received $1,996 as its portion of the sales charge on sales of Class A shares for the year ended October 31, 2022. EVD also received distribution and service fees from Class A and Class C shares (see Note 4) and contingent deferred sales charges (see Note 5).
Eaton Vance
Tax-Managed Small-Cap Fund
October 31, 2022
Notes to Financial Statements — continued
Trustees and officers of the Fund who are members of EVM’s or BMR's organizations receive remuneration for their services to the Fund out of the investment adviser fee. Certain officers and Trustees of the Fund and the Portfolio are officers of the above organizations.
4 Distribution Plans
The Fund has in effect a distribution plan for Class A shares (Class A Plan) pursuant to Rule 12b-1 under the 1940 Act. Pursuant to the Class A Plan, the Fund pays EVD a distribution and service fee of 0.25% per annum of its average daily net assets attributable to Class A shares for distribution services and facilities provided to the Fund by EVD, as well as for personal services and/or the maintenance of shareholder accounts. Distribution and service fees paid or accrued to EVD for the year ended October 31, 2022 amounted to $238,759 for Class A shares.
The Fund also has in effect a distribution plan for Class C shares (Class C Plan) pursuant to Rule 12b-1 under the 1940 Act. Pursuant to the Class C Plan, the Fund pays EVD amounts equal to 0.75% per annum of its average daily net assets attributable to Class C shares for providing ongoing distribution services and facilities to the Fund. For the year ended October 31, 2022, the Fund paid or accrued to EVD $20,040 for Class C shares.
Pursuant to the Class C Plan, the Fund also makes payments of service fees to EVD, financial intermediaries and other persons in amounts equal to 0.25% per annum of its average daily net assets attributable to that class. Service fees paid or accrued are for personal services and/or the maintenance of shareholder accounts. They are separate and distinct from the sales commissions and distribution fees payable to EVD. Service fees paid or accrued for the year ended October 31, 2022 amounted to $6,680 for Class C shares.
Distribution and service fees are subject to the limitations contained in the Financial Industry Regulatory Authority Rule 2341(d).
5 Contingent Deferred Sales Charges
A contingent deferred sales charge (CDSC) of 1% generally is imposed on redemptions of Class C shares made within 12 months of purchase. Class A shares may be subject to a 1% CDSC if redeemed within 12 months (18 months prior to April 29, 2022) of purchase (depending on the circumstances of purchase). Generally, the CDSC is based upon the lower of the net asset value at date of redemption or date of purchase. No charge is levied on shares acquired by reinvestment of dividends or capital gain distributions. For the year ended October 31, 2022, the Fund was informed that EVD received approximately $100 and less than $100 of CDSCs paid by Class A and Class C shareholders, respectively.
6 Investment Transactions
For the year ended October 31, 2022, increases and decreases in the Fund's investment in the Portfolio aggregated $6,438,215 and $11,630,269, respectively. Decreases in the Fund's investment in the Portfolio include distributions of securities as the result of redemptions in-kind of $9,219,705.
7 Shares of Beneficial Interest
The Fund’s Declaration of Trust permits the Trustees to issue an unlimited number of full and fractional shares of beneficial interest (without par value). Such shares may be issued in a number of different series (such as the Fund) and classes. Sales and redemptions of Class I shares include shares purchased and redeemed in connection with the ReFlow liquidity program, a program designed to provide an alternative liquidity source for mutual funds experiencing net redemptions of their shares. Transactions in Fund shares, including direct exchanges pursuant to share class conversions for all periods presented, were as follows:
| | Year Ended
October 31, 2022 | | Year Ended
October 31, 2021 |
| | Shares | Amount | | Shares | Amount |
| Class A | | | | | |
| Sales | 81,221 | $ 2,443,616 | | 91,151 | $ 2,823,943 |
| Issued to shareholders electing to receive payments of distributions in Fund shares | 245,909 | 7,810,082 | | 2,731 | 79,938 |
| Redemptions | (248,566) | (7,378,040) | | (211,333) | (6,667,714) |
| Net increase (decrease) | 78,564 | $ 2,875,658 | | (117,451) | $(3,763,833) |
Eaton Vance
Tax-Managed Small-Cap Fund
October 31, 2022
Notes to Financial Statements — continued
| | Year Ended
October 31, 2022 | | Year Ended
October 31, 2021 |
| | Shares | Amount | | Shares | Amount |
| Class C | | | | | |
| Sales | 18,563 | $ 424,160 | | 22,031 | $ 524,648 |
| Issued to shareholders electing to receive payments of distributions in Fund shares | 12,995 | 311,624 | | — | — |
| Redemptions | (29,551) | (686,125) | | (88,910) | (2,071,262) |
| Net increase (decrease) | 2,007 | $ 49,659 | | (66,879) | $(1,546,614) |
| Class I | | | | | |
| Sales | 638,523 | $ 19,988,523 | | 254,253 | $ 8,281,733 |
| Issued to shareholders electing to receive payments of distributions in Fund shares | 70,535 | 2,320,590 | | 2,126 | 64,278 |
| Redemptions | (603,427) | (18,784,235) | | (218,846) | (7,218,861) |
| Net increase | 105,631 | $ 3,524,878 | | 37,533 | $ 1,127,150 |
Eaton Vance
Tax-Managed Small-Cap Fund
October 31, 2022
Report of Independent Registered Public Accounting Firm
To the Trustees of Eaton Vance Mutual Funds Trust and Shareholders of Eaton Vance Tax-Managed Small-Cap Fund:
Opinion on the Financial Statements and Financial Highlights
We have audited the accompanying statement of assets and liabilities of Eaton Vance Tax-Managed Small-Cap Fund (the “Fund") (one of the funds constituting Eaton Vance Mutual Funds Trust), as of October 31, 2022, the related statement of operations for the year then ended, the statements of changes in net assets for each of the two years in the period then ended, the financial highlights for each of the five years in the period then ended, and the related notes. In our opinion, the financial statements and financial highlights present fairly, in all material respects, the financial position of the Fund as of October 31, 2022, and the results of its operations for the year then ended, the changes in its net assets for each of the two years in the period then ended, and the financial highlights for each of the five years in the period then ended, in conformity with accounting principles generally accepted in the United States of America.
Basis for Opinion
These financial statements and financial highlights are the responsibility of the Fund's management. Our responsibility is to express an opinion on the Fund's financial statements and financial highlights based on our audits. We are a public accounting firm registered with the Public Company Accounting Oversight Board (United States) (PCAOB) and are required to be independent with respect to the Fund in accordance with the U.S. federal securities laws and the applicable rules and regulations of the Securities and Exchange Commission and the PCAOB.
We conducted our audits in accordance with the standards of the PCAOB. Those standards require that we plan and perform the audit to obtain reasonable assurance about whether the financial statements and financial highlights are free of material misstatement, whether due to error or fraud. The Fund is not required to have, nor were we engaged to perform, an audit of its internal control over financial reporting. As part of our audits, we are required to obtain an understanding of internal control over financial reporting but not for the purpose of expressing an opinion on the effectiveness of the Fund’s internal control over financial reporting. Accordingly, we express no such opinion.
Our audits included performing procedures to assess the risks of material misstatement of the financial statements and financial highlights, whether due to error or fraud, and performing procedures that respond to those risks. Such procedures included examining, on a test basis, evidence regarding the amounts and disclosures in the financial statements and financial highlights. Our audits also included evaluating the accounting principles used and significant estimates made by management, as well as evaluating the overall presentation of the financial statements and financial highlights. We believe that our audits provide a reasonable basis for our opinion.
/s/ Deloitte & Touche LLP
Boston, Massachusetts
December 20, 2022
We have served as the auditor of one or more Eaton Vance investment companies since 1959.
Eaton Vance
Tax-Managed Small-Cap Fund
October 31, 2022
Federal Tax Information (Unaudited)
The Form 1099-DIV you receive in February 2023 will show the tax status of all distributions paid to your account in calendar year 2022. Shareholders are advised to consult their own tax adviser with respect to the tax consequences of their investment in the Fund. As required by the Internal Revenue Code and/or regulations, shareholders must be notified regarding the status of qualified dividend income for individuals, the dividends received deduction for corporations and capital gains dividends.
Qualified Dividend Income. For the fiscal year ended October 31, 2022, the Fund designates approximately $1,050,265, or up to the maximum amount of such dividends allowable pursuant to the Internal Revenue Code, as qualified dividend income eligible for the reduced tax rate of 15%.
Dividends Received Deduction. Corporate shareholders are generally entitled to take the dividends received deduction on the portion of the Fund’s dividend distribution that qualifies under tax law. For the Fund’s fiscal 2022 ordinary income dividends, 53.43% qualifies for the corporate dividends received deduction.
Capital Gains Dividends. The Fund hereby designates as a capital gain dividend with respect to the taxable year ended October 31, 2022, $3,091,882 or, if subsequently determined to be different, the net capital gain of such year.
Tax-Managed Small-Cap Portfolio
October 31, 2022
| Security | Shares | Value |
| Aerospace & Defense — 1.6% |
| Hexcel Corp. | | 50,900 | $ 2,835,130 |
| | | | $ 2,835,130 |
| Auto Components — 4.2% |
| Dana, Inc. | | 102,272 | $ 1,632,261 |
| Dorman Products, Inc.(1) | | 43,823 | 3,576,833 |
| Visteon Corp.(1) | | 17,908 | 2,336,457 |
| | | | $ 7,545,551 |
| Automobiles — 1.1% |
| Harley-Davidson, Inc. | | 44,328 | $ 1,906,104 |
| | | | $ 1,906,104 |
| Banks — 13.4% |
| Commerce Bancshares, Inc. | | 60,285 | $ 4,270,589 |
| Community Bank System, Inc. | | 44,671 | 2,788,811 |
| CVB Financial Corp. | | 85,002 | 2,441,257 |
| Glacier Bancorp, Inc. | | 38,830 | 2,224,182 |
| Independent Bank Corp. | | 30,477 | 2,651,804 |
| SouthState Corp. | | 53,064 | 4,798,578 |
| Stock Yards Bancorp, Inc. | | 29,426 | 2,300,819 |
| Wintrust Financial Corp. | | 28,290 | 2,648,510 |
| | | | $ 24,124,550 |
| Biotechnology — 1.1% |
| Neurocrine Biosciences, Inc.(1) | | 17,040 | $ 1,961,645 |
| | | | $ 1,961,645 |
| Building Products — 5.9% |
| AAON, Inc. | | 54,623 | $ 3,522,637 |
| AZEK Co., Inc. (The)(1) | | 177,639 | 3,110,459 |
| CSW Industrials, Inc. | | 22,807 | 2,940,279 |
| Hayward Holdings, Inc.(1) | | 108,325 | 1,002,006 |
| | | | $ 10,575,381 |
| Capital Markets — 1.9% |
| Cohen & Steers, Inc. | | 23,772 | $ 1,430,123 |
| Stifel Financial Corp. | | 31,471 | 1,947,111 |
| | | | $ 3,377,234 |
| Chemicals — 4.6% |
| Balchem Corp. | | 11,154 | $ 1,559,329 |
| Security | Shares | Value |
| Chemicals (continued) |
| Quaker Houghton | | 15,760 | $ 2,563,207 |
| Valvoline, Inc. | | 137,981 | 4,051,122 |
| | | | $ 8,173,658 |
| Commercial Services & Supplies — 1.9% |
| Rentokil Initial PLC ADR | | 110,207 | $ 3,409,805 |
| | | | $ 3,409,805 |
| Containers & Packaging — 1.0% |
| AptarGroup, Inc. | | 18,330 | $ 1,817,419 |
| | | | $ 1,817,419 |
| Diversified Consumer Services — 0.8% |
| Bright Horizons Family Solutions, Inc.(1) | | 21,290 | $ 1,390,663 |
| | | | $ 1,390,663 |
| Electronic Equipment, Instruments & Components — 1.3% |
| National Instruments Corp. | | 62,796 | $ 2,397,551 |
| | | | $ 2,397,551 |
| Equity Real Estate Investment Trusts (REITs) — 6.2% |
| CubeSmart | | 75,272 | $ 3,151,639 |
| EastGroup Properties, Inc. | | 16,479 | 2,582,094 |
| Essential Properties Realty Trust, Inc. | | 156,184 | 3,361,080 |
| Rexford Industrial Realty, Inc. | | 29,353 | 1,622,634 |
| Terreno Realty Corp. | | 7,854 | 448,777 |
| | | | $ 11,166,224 |
| Food & Staples Retailing — 3.3% |
| Chefs' Warehouse, Inc. (The)(1) | | 21,569 | $ 790,072 |
| Performance Food Group Co.(1) | | 98,744 | 5,138,638 |
| | | | $ 5,928,710 |
| Food Products — 0.9% |
| J&J Snack Foods Corp. | | 11,110 | $ 1,639,947 |
| | | | $ 1,639,947 |
| Gas Utilities — 2.2% |
| ONE Gas, Inc. | | 51,317 | $ 3,976,041 |
| | | | $ 3,976,041 |
| Health Care Equipment & Supplies — 6.1% |
| Envista Holdings Corp.(1) | | 88,950 | $ 2,936,239 |
| ICU Medical, Inc.(1) | | 8,304 | 1,232,397 |
| Inari Medical, Inc.(1) | | 13,764 | 1,058,865 |
19
See Notes to Financial Statements.
Tax-Managed Small-Cap Portfolio
October 31, 2022
Portfolio of Investments — continued
| Security | Shares | Value |
| Health Care Equipment & Supplies (continued) |
| Integra LifeSciences Holdings Corp.(1) | | 52,457 | $ 2,635,964 |
| Neogen Corp.(1) | | 112,980 | 1,491,336 |
| Tandem Diabetes Care, Inc.(1) | | 29,160 | 1,637,334 |
| | | | $ 10,992,135 |
| Health Care Providers & Services — 8.8% |
| Addus HomeCare Corp.(1) | | 40,723 | $ 4,170,850 |
| Agiliti, Inc.(1) | | 167,867 | 2,932,636 |
| Chemed Corp. | | 9,316 | 4,349,361 |
| R1 RCM, Inc.(1) | | 94,174 | 1,663,113 |
| U.S. Physical Therapy, Inc. | | 29,399 | 2,610,631 |
| | | | $ 15,726,591 |
| Hotels, Restaurants & Leisure — 2.0% |
| Texas Roadhouse, Inc. | | 8,881 | $ 878,775 |
| Wyndham Hotels & Resorts, Inc. | | 35,590 | 2,702,349 |
| | | | $ 3,581,124 |
| Insurance — 7.3% |
| RLI Corp. | | 32,760 | $ 4,261,093 |
| Ryan Specialty Holdings, Inc., Class A(1) | | 88,924 | 3,988,242 |
| Selective Insurance Group, Inc. | | 37,279 | 3,656,324 |
| White Mountains Insurance Group, Ltd. | | 808 | 1,144,249 |
| | | | $ 13,049,908 |
| IT Services — 0.6% |
| Euronet Worldwide, Inc.(1) | | 13,838 | $ 1,162,530 |
| | | | $ 1,162,530 |
| Leisure Products — 0.7% |
| Brunswick Corp. | | 18,692 | $ 1,320,964 |
| | | | $ 1,320,964 |
| Machinery — 4.3% |
| Chart Industries, Inc.(1) | | 11,730 | $ 2,614,382 |
| Middleby Corp.(1) | | 19,936 | 2,788,249 |
| Woodward, Inc. | | 24,603 | 2,256,095 |
| | | | $ 7,658,726 |
| Oil, Gas & Consumable Fuels — 1.1% |
| Archaea Energy, Inc.(1) | | 75,099 | $ 1,938,305 |
| | | | $ 1,938,305 |
| Security | Shares | Value |
| Professional Services — 3.2% |
| CBIZ, Inc.(1) | | 116,563 | $ 5,786,187 |
| | | | $ 5,786,187 |
| Road & Rail — 1.7% |
| Landstar System, Inc. | | 20,116 | $ 3,142,522 |
| | | | $ 3,142,522 |
| Semiconductors & Semiconductor Equipment — 0.4% |
| Ambarella, Inc.(1) | | 14,533 | $ 795,391 |
| | | | $ 795,391 |
| Software — 6.5% |
| Altair Engineering, Inc., Class A(1) | | 69,589 | $ 3,413,340 |
| Clearwater Analytics Holdings, Inc., Class A(1) | | 88,869 | 1,447,676 |
| Envestnet, Inc.(1) | | 54,558 | 2,690,255 |
| nCino, Inc.(1) | | 34,397 | 1,082,818 |
| SPS Commerce, Inc.(1) | | 24,178 | 3,059,001 |
| | | | $ 11,693,090 |
| Specialty Retail — 1.3% |
| Five Below, Inc.(1) | | 7,746 | $ 1,133,627 |
| National Vision Holdings, Inc.(1) | | 32,205 | 1,192,873 |
| | | | $ 2,326,500 |
| Trading Companies & Distributors — 2.4% |
| Core & Main, Inc., Class A(1) | | 123,170 | $ 2,904,349 |
| Herc Holdings, Inc. | | 11,605 | 1,364,864 |
| | | | $ 4,269,213 |
Total Common Stocks
(identified cost $139,247,424) | | | $175,668,799 |
| Short-Term Investments — 3.0% |
| Security | Shares | Value |
| Morgan Stanley Institutional Liquidity Funds - Government Portfolio, Institutional Class, 2.88%(2) | | 5,430,229 | $ 5,430,229 |
Total Short-Term Investments
(identified cost $5,430,229) | | | $ 5,430,229 |
Total Investments — 100.8%
(identified cost $144,677,653) | | | $181,099,028 |
| Other Assets, Less Liabilities — (0.8)% | | | $ (1,469,560) |
| Net Assets — 100.0% | | | $179,629,468 |
20
See Notes to Financial Statements.
Tax-Managed Small-Cap Portfolio
October 31, 2022
Portfolio of Investments — continued
| The percentage shown for each investment category in the Portfolio of Investments is based on net assets. |
| (1) | Non-income producing security. |
| (2) | May be deemed to be an affiliated investment company. The rate shown is the annualized seven-day yield as of October 31, 2022. |
| Abbreviations: |
| ADR | – American Depositary Receipt |
21
See Notes to Financial Statements.
Tax-Managed Small-Cap Portfolio
October 31, 2022
Statement of Assets and Liabilities
| | October 31, 2022 |
| Assets | |
| Unaffiliated investments, at value (identified cost $139,247,424) | $ 175,668,799 |
| Affiliated investment, at value (identified cost $5,430,229) | 5,430,229 |
| Dividends receivable | 10,842 |
| Dividends receivable from affiliated investment | 8,443 |
| Receivable for investments sold | 720,658 |
| Total assets | $181,838,971 |
| Liabilities | |
| Payable for investments purchased | $ 2,043,997 |
| Payable to affiliates: | |
| Investment adviser fee | 89,236 |
| Trustees' fees | 1,128 |
| Accrued expenses | 75,142 |
| Total liabilities | $ 2,209,503 |
| Net Assets applicable to investors' interest in Portfolio | $179,629,468 |
22
See Notes to Financial Statements.
Tax-Managed Small-Cap Portfolio
October 31, 2022
| | Year Ended |
| | October 31, 2022 |
| Investment Income | |
| Dividend income | $ 2,078,913 |
| Dividend income from affiliated investments | 34,500 |
| Total investment income | $ 2,113,413 |
| Expenses | |
| Investment adviser fee | $ 1,203,968 |
| Trustees’ fees and expenses | 12,550 |
| Custodian fee | 52,891 |
| Legal and accounting services | 48,595 |
| Miscellaneous | 4,362 |
| Total expenses | $ 1,322,366 |
| Deduct: | |
| Waiver and/or reimbursement of expenses by affiliate | $ 2,840 |
| Total expense reductions | $ 2,840 |
| Net expenses | $ 1,319,526 |
| Net investment income | $ 793,887 |
| Realized and Unrealized Gain (Loss) | |
| Net realized gain (loss): | |
| Investment transactions | $ 9,133,055(1) |
| Investment transactions - affiliated investments | 693 |
| Net realized gain | $ 9,133,748 |
| Change in unrealized appreciation (depreciation): | |
| Investments | $ (36,265,894) |
| Net change in unrealized appreciation (depreciation) | $(36,265,894) |
| Net realized and unrealized loss | $(27,132,146) |
| Net decrease in net assets from operations | $(26,338,259) |
| (1) | Includes $5,199,110 of net realized gains from redemptions in-kind. |
23
See Notes to Financial Statements.
Tax-Managed Small-Cap Portfolio
October 31, 2022
Statements of Changes in Net Assets
| | Year Ended October 31, |
| | 2022 | 2021 |
| Increase (Decrease) in Net Assets | | |
| From operations: | | |
| Net investment income | $ 793,887 | $ 533,812 |
| Net realized gain | 9,133,748 (1) | 23,712,287 (2) |
| Net change in unrealized appreciation (depreciation) | (36,265,894) | 41,436,346 |
| Net increase (decrease) in net assets from operations | $ (26,338,259) | $ 65,682,445 |
| Capital transactions: | | |
| Contributions | $ 7,915,041 | $ 4,855,208 |
| Withdrawals | (17,215,619) | (10,698,425) |
| Net decrease in net assets from capital transactions | $ (9,300,578) | $ (5,843,217) |
| Net increase (decrease) in net assets | $ (35,638,837) | $ 59,839,228 |
| Net Assets | | |
| At beginning of year | $ 215,268,305 | $ 155,429,077 |
| At end of year | $179,629,468 | $215,268,305 |
| (1) | Includes $5,199,110 of net realized gains from redemptions in-kind. |
| (2) | Includes $2,671,978 of net realized gains from redemptions in-kind. |
24
See Notes to Financial Statements.
Tax-Managed Small-Cap Portfolio
October 31, 2022
| | Year Ended October 31, |
| Ratios/Supplemental Data | 2022 | 2021 | 2020 | 2019 | 2018 |
| Ratios (as a percentage of average daily net assets): | | | | | |
| Expenses | 0.69% (1) | 0.68% | 0.69% | 0.69% | 0.69% |
| Net investment income | 0.41% | 0.27% | 0.54% | 0.51% | 0.26% |
| Portfolio Turnover | 43% | 40% | 44% | 51% | 51% |
| Total Return | (12.42)% | 42.69% | (2.63)% | 12.82% | 6.30% |
| Net assets, end of year (000’s omitted) | $179,629 | $215,268 | $155,429 | $178,500 | $172,324 |
| (1) | Includes a reduction by the investment adviser of a portion of its adviser fee due to the Portfolio’s investment in the Liquidity Fund (equal to less than 0.005% of average daily net assets for the year ended October 31, 2022). |
Tax-Managed Small-Cap Portfolio
October 31, 2022
Notes to Financial Statements
1 Significant Accounting Policies
Tax-Managed Small-Cap Portfolio (the Portfolio) is a Massachusetts business trust registered under the Investment Company Act of 1940, as amended (the 1940 Act), as a diversified, open-end management investment company. The Portfolio’s investment objective is to achieve long-term, after-tax returns by investing primarily in a diversified portfolio of publicly-traded equity securities of small-cap companies. The Declaration of Trust permits the Trustees to issue interests in the Portfolio. At October 31, 2022, Eaton Vance Tax-Managed Small-Cap Fund and Eaton Vance Tax-Managed Equity Asset Allocation Fund held an interest of 65.9% and 34.1%, respectively, in the Portfolio.
The following is a summary of significant accounting policies of the Portfolio. The policies are in conformity with accounting principles generally accepted in the United States of America (U.S. GAAP). The Portfolio is an investment company and follows accounting and reporting guidance in the Financial Accounting Standards Board (FASB) Accounting Standards Codification Topic 946.
A Investment Valuation—The following methodologies are used to determine the market value or fair value of investments.
Equity Securities. Equity securities listed on a U.S. securities exchange generally are valued at the last sale or closing price on the day of valuation or, if no sales took place on such date, at the mean between the closing bid and ask prices on the exchange where such securities are principally traded. Equity securities listed on the NASDAQ National Market System are valued at the NASDAQ official closing price. Unlisted or listed securities for which closing sales prices or closing quotations are not available are valued at the mean between the latest available bid and ask prices.
Other. Investments in management investment companies (including money market funds) that do not trade on an exchange are valued at the net asset value as of the close of each business day.
Fair Valuation. In connection with Rule 2a-5 of the 1940 Act, which became effective September 8, 2022, the Trustees have designated the Portfolio’s investment adviser as its valuation designee. Investments for which valuations or market quotations are not readily available or are deemed unreliable are valued by the investment adviser, as valuation designee, at fair value using methods that most fairly reflect the security’s “fair value”, which is the amount that the Portfolio might reasonably expect to receive for the security upon its current sale in the ordinary course. Each such determination is based on a consideration of relevant factors, which are likely to vary from one pricing context to another. These factors may include, but are not limited to, the type of security, the existence of any contractual restrictions on the security’s disposition, the price and extent of public trading in similar securities of the issuer or of comparable companies or entities, quotations or relevant information obtained from broker/dealers or other market participants, information obtained from the issuer, analysts, and/or the appropriate stock exchange (for exchange-traded securities), an analysis of the company’s or entity’s financial statements, and an evaluation of the forces that influence the issuer and the market(s) in which the security is purchased and sold.
B Investment Transactions—Investment transactions for financial statement purposes are accounted for on a trade date basis. Realized gains and losses on investments sold are determined on the basis of identified cost.
C Income—Dividend income is recorded on the ex-dividend date for dividends received in cash and/or securities.
D Federal Taxes—The Portfolio has elected to be treated as a partnership for federal tax purposes. No provision is made by the Portfolio for federal or state taxes on any taxable income of the Portfolio because each investor in the Portfolio is ultimately responsible for the payment of any taxes on its share of taxable income. Since at least one of the Portfolio's investors is a regulated investment company that invests all or substantially all of its assets in the Portfolio, the Portfolio normally must satisfy the applicable source of income and diversification requirements (under the Internal Revenue Code) in order for its investors to satisfy them. The Portfolio will allocate, at least annually among its investors, each investor's distributive share of the Portfolio's net investment income, net realized capital gains and losses and any other items of income, gain, loss, deduction or credit.
As of October 31, 2022, the Portfolio had no uncertain tax positions that would require financial statement recognition, de-recognition, or disclosure. The Portfolio files a U.S. federal income tax return annually after its fiscal year-end, which is subject to examination by the Internal Revenue Service for a period of three years from the date of filing.
E Use of Estimates—The preparation of the financial statements in conformity with U.S. GAAP requires management to make estimates and assumptions that affect the reported amounts of assets and liabilities at the date of the financial statements and the reported amounts of income and expense during the reporting period. Actual results could differ from those estimates.
F Indemnifications—Under the Portfolio’s organizational documents, its officers and Trustees may be indemnified against certain liabilities and expenses arising out of the performance of their duties to the Portfolio. Under Massachusetts law, if certain conditions prevail, interestholders in the Portfolio could be deemed to have personal liability for the obligations of the Portfolio. However, the Portfolio’s Declaration of Trust contains an express disclaimer of liability on the part of Portfolio interestholders. Additionally, in the normal course of business, the Portfolio enters into agreements with service providers that may contain indemnification clauses. The Portfolio’s maximum exposure under these arrangements is unknown as this would involve future claims that may be made against the Portfolio that have not yet occurred.
Tax-Managed Small-Cap Portfolio
October 31, 2022
Notes to Financial Statements — continued
2 Investment Adviser Fee and Other Transactions with Affiliates
The investment adviser fee is earned by Boston Management and Research (BMR), an indirect, wholly-owned subsidiary of Morgan Stanley, as compensation for investment advisory services rendered to the Portfolio. The fee is computed at an annual rate as a percentage of the Portfolio’s average daily net assets as follows and is payable monthly:
| Average Daily Net Assets | Annual Fee Rate |
| Up to $500 million | 0.6250% |
| $500 million but less than $1 billion | 0.5625% |
| $1 billion but less than $1.5 billion | 0.5000% |
| $1.5 billion and over | 0.4375% |
For the year ended October 31, 2022, the investment adviser fee amounted to $1,203,968 or 0.625% of the Portfolio's average daily net assets. Effective April 26, 2022, the Portfolio may invest in a money market fund, the Institutional Class of the Morgan Stanley Institutional Liquidity Funds - Government Portfolio (the “Liquidity Fund”), an open-end management investment company managed by Morgan Stanley Investment Management Inc., a wholly-owned subsidiary of Morgan Stanley. The investment adviser fee paid by the Portfolio is reduced by an amount equal to its pro-rata share of the advisory and administration fees paid by the Portfolio due to its investment in the Liquidity Fund. For the year ended October 31, 2022, the investment adviser fee paid was reduced by $2,840 relating to the Portfolio's investment in the Liquidity Fund. Prior to April 26, 2022, the Portfolio may have invested its cash in Eaton Vance Cash Reserves Fund, LLC (Cash Reserves Fund), an affiliated investment company managed by Eaton Vance Management (EVM), an affiliate of BMR. EVM did not receive a fee for advisory services provided to Cash Reserves Fund.
Trustees and officers of the Portfolio who are members of EVM’s or BMR’s organizations receive remuneration for their services to the Portfolio out of the investment adviser fee. Trustees of the Portfolio who are not affiliated with the investment adviser may elect to defer receipt of all or a percentage of their annual fees in accordance with the terms of the Trustees Deferred Compensation Plan. For the year ended October 31, 2022, no significant amounts have been deferred. Certain officers and Trustees of the Portfolio are officers of the above organizations.
3 Purchases and Sales of Investments
Purchases and sales of investments, other than short-term obligations and in-kind transactions, aggregated $82,792,310 and $85,468,322, respectively, for the year ended October 31, 2022. In-kind sales for the year ended October 31, 2022 aggregated $9,219,705.
4 Federal Income Tax Basis of Investments
The cost and unrealized appreciation (depreciation) of investments of the Portfolio at October 31, 2022, as determined on a federal income tax basis, were as follows:
| Aggregate cost | $145,739,206 |
| Gross unrealized appreciation | $ 40,408,981 |
| Gross unrealized depreciation | (5,049,159) |
| Net unrealized appreciation | $ 35,359,822 |
5 Line of Credit
The Portfolio participates with other portfolios and funds managed by EVM and its affiliates in a $725 million unsecured line of credit agreement with a group of banks, which is in effect through October 24, 2023. In connection with the renewal of the agreement on October 25, 2022, the borrowing limit was decreased from $800 million. Borrowings are made by the Portfolio solely for temporary purposes related to redemptions and other short-term cash needs. Interest is charged to the Portfolio based on its borrowings at an amount above either the Secured Overnight Financing Rate (SOFR) or Federal Funds rate. In addition, a fee computed at an annual rate of 0.15% on the daily unused portion of the line of credit is allocated among the participating portfolios and funds at the end of each quarter. Also in connection with the renewal of the agreement, an arrangement fee totaling $150,000 was incurred that was allocated to the participating portfolios and funds. Because the line of credit is not available exclusively to the Portfolio, it may be unable to borrow some or all of its requested amounts at any particular time. The Portfolio did not have any significant borrowings or allocated fees during the year ended October 31, 2022.
Tax-Managed Small-Cap Portfolio
October 31, 2022
Notes to Financial Statements — continued
6 Investments in Affiliated Funds
At October 31, 2022, the value of the Portfolio's investment in funds that may be deemed to be affiliated was $5,430,229, which represents 3.0% of the Portfolio's net assets. Transactions in affiliated funds by the Portfolio for the year ended October 31, 2022 were as follows:
| Name | Value,
beginning
of period | Purchases | Sales
proceeds | Net
realized
gain (loss) | Change in
unrealized
appreciation
(depreciation) | Value, end
of period | Dividend
income | Units/Shares,
end of period |
| Short-Term Investments |
| Cash Reserves Fund | $719,232 | $20,082,288 | $(20,802,213) | $ 693 | $ — | $ — | $ 654 | — |
| Liquidity Fund | — | 31,010,299 | (25,580,070) | — | — | 5,430,229 | 33,846 | 5,430,229 |
| Total | | | | $ 693 | $ — | $5,430,229 | $34,500 | |
7 Fair Value Measurements
Under generally accepted accounting principles for fair value measurements, a three-tier hierarchy to prioritize the assumptions, referred to as inputs, is used in valuation techniques to measure fair value. The three-tier hierarchy of inputs is summarized in the three broad levels listed below.
| • | Level 1 – quoted prices in active markets for identical investments |
| • | Level 2 – other significant observable inputs (including quoted prices for similar investments, interest rates, prepayment speeds, credit risk, etc.) |
| • | Level 3 – significant unobservable inputs (including a fund's own assumptions in determining the fair value of investments) |
In cases where the inputs used to measure fair value fall in different levels of the fair value hierarchy, the level disclosed is determined based on the lowest level input that is significant to the fair value measurement in its entirety. The inputs or methodology used for valuing securities are not necessarily an indication of the risk associated with investing in those securities.
At October 31, 2022, the hierarchy of inputs used in valuing the Portfolio's investments, which are carried at value, were as follows:
| Asset Description | Level 1 | Level 2 | Level 3 | Total |
| Common Stocks | $ 175,668,799* | $ — | $ — | $ 175,668,799 |
| Short-Term Investments | 5,430,229 | — | — | 5,430,229 |
| Total Investments | $181,099,028 | $ — | $ — | $181,099,028 |
| * | The level classification by major category of investments is the same as the category presentation in the Portfolio of Investments. |
8 Risks and Uncertainties
Pandemic Risk
An outbreak of respiratory disease caused by a novel coronavirus was first detected in China in late 2019 and subsequently spread internationally. This coronavirus has resulted in closing borders, enhanced health screenings, changes to healthcare service preparation and delivery, quarantines, cancellations, disruptions to supply chains and customer activity, as well as general concern and uncertainty. Health crises caused by outbreaks of disease, such as the coronavirus outbreak, may exacerbate other pre-existing political, social and economic risks and disrupt normal market conditions and operations. The impact of this outbreak has negatively affected the worldwide economy, as well as the economies of individual countries and industries, and could continue to affect the market in significant and unforeseen ways. Other epidemics and pandemics that may arise in the future may have similar effects. Any such impact could adversely affect the Portfolio's performance, or the performance of the securities in which the Portfolio invests.
Tax-Managed Small-Cap Portfolio
October 31, 2022
Report of Independent Registered Public Accounting Firm
To the Trustees and Investors of Tax-Managed Small-Cap Portfolio:
Opinion on the Financial Statements and Financial Highlights
We have audited the accompanying statement of assets and liabilities of Tax-Managed Small-Cap Portfolio (the “Portfolio"), including the portfolio of investments, as of October 31, 2022, the related statement of operations for the year then ended, the statements of changes in net assets for each of the two years in the period then ended, the financial highlights for each of the five years in the period then ended, and the related notes. In our opinion, the financial statements and financial highlights present fairly, in all material respects, the financial position of the Portfolio as of October 31, 2022, and the results of its operations for the year then ended, the changes in its net assets for each of the two years in the period then ended, and the financial highlights for each of the five years in the period then ended, in conformity with accounting principles generally accepted in the United States of America.
Basis for Opinion
These financial statements and financial highlights are the responsibility of the Portfolio’s management. Our responsibility is to express an opinion on the Portfolio’s financial statements and financial highlights based on our audits. We are a public accounting firm registered with the Public Company Accounting Oversight Board (United States) (PCAOB) and are required to be independent with respect to the Portfolio in accordance with the U.S. federal securities laws and the applicable rules and regulations of the Securities and Exchange Commission and the PCAOB.
We conducted our audits in accordance with the standards of the PCAOB. Those standards require that we plan and perform the audit to obtain reasonable assurance about whether the financial statements and financial highlights are free of material misstatement, whether due to error or fraud. The Portfolio is not required to have, nor were we engaged to perform, an audit of its internal control over financial reporting. As part of our audits, we are required to obtain an understanding of internal control over financial reporting but not for the purpose of expressing an opinion on the effectiveness of the Portfolio’s internal control over financial reporting. Accordingly, we express no such opinion.
Our audits included performing procedures to assess the risks of material misstatement of the financial statements and financial highlights, whether due to error or fraud, and performing procedures that respond to those risks. Such procedures included examining, on a test basis, evidence regarding the amounts and disclosures in the financial statements and financial highlights. Our audits also included evaluating the accounting principles used and significant estimates made by management, as well as evaluating the overall presentation of the financial statements and financial highlights. Our procedures included confirmation of securities owned as of October 31, 2022, by correspondence with the custodian and brokers; when replies were not received from brokers, we performed other auditing procedures. We believe that our audits provide a reasonable basis for our opinion.
/s/ Deloitte & Touche LLP
Boston, Massachusetts
December 20, 2022
We have served as the auditor of one or more Eaton Vance investment companies since 1959.
Eaton Vance
Tax-Managed Small-Cap Fund
October 31, 2022
Board of Trustees’ Contract Approval
Overview of the Contract Review Process
The Investment Company Act of 1940, as amended (the “1940 Act”), provides, in substance, that the investment advisory agreement between a fund and its investment adviser will continue in effect from year-to-year only if its continuation is approved on an annual basis by a vote of the fund’s board of trustees, including a majority of the trustees who are not “interested persons” of the fund (“independent trustees”), cast in person at a meeting called for the purpose of considering such approval.
At a meeting held on June 8, 2022, the Boards of Trustees/Directors (collectively, the “Board”) that oversee the registered investment companies advised by Eaton Vance Management or its affiliate, Boston Management and Research (the “Eaton Vance Funds”), including a majority of the independent trustees (the “Independent Trustees”), voted to approve the continuation of existing investment advisory agreements and sub-advisory agreements1 for each of the Eaton Vance Funds for an additional one-year period. The Board relied upon the affirmative recommendation of its Contract Review Committee, which is a committee exclusively comprised of Independent Trustees. Prior to making its recommendation, the Contract Review Committee reviewed information furnished by the adviser and sub-adviser to each of the Eaton Vance Funds (including information specifically requested by the Board) for a series of formal meetings held between April and June 2022. Members of the Contract Review Committee also considered information received at prior meetings of the Board and its committees, to the extent such information was relevant to the Contract Review Committee’s annual evaluation of the investment advisory agreements and sub-advisory agreements.
In connection with its evaluation of the investment advisory agreements and sub-advisory agreements, the Board considered various information relating to the Eaton Vance Funds. This included information applicable to all or groups of Eaton Vance Funds, which is referenced immediately below, and information applicable to the particular Eaton Vance Fund covered by this report (additional fund-specific information is referenced below under “Results of the Contract Review Process”). (For funds that invest through one or more underlying portfolios, references to “each fund” in this section may include information that was considered at the portfolio-level.)
Information about Fees, Performance and Expenses
• A report from an independent data provider comparing advisory and other fees paid by each fund to such fees paid by comparable funds, as identified by the independent data provider (“comparable funds”);
• A report from an independent data provider comparing each fund’s total expense ratio (and its components) to those of comparable funds;
• A report from an independent data provider comparing the investment performance of each fund (including, as relevant, total return data, income data, Sharpe ratios and information ratios) to the investment performance of comparable funds and, as applicable, benchmark indices, over various time periods;
• In certain instances, data regarding investment performance relative to customized groups of peer funds and blended indices identified by the adviser in consultation with the Portfolio Management Committee of the Board (a committee exclusively comprised of Independent Trustees);
• Comparative information concerning the fees charged and services provided by the adviser and sub-adviser to each fund in managing other accounts (which may include other mutual funds, collective investment funds and institutional accounts) using investment strategies and techniques similar to those used in managing such fund(s), if any;
• Profitability analyses with respect to the adviser and sub-adviser to each of the funds;
Information about Portfolio Management and Trading
• Descriptions of the investment management services provided to each fund, as well as each of the funds’ investment strategies and policies;
• The procedures and processes used to determine the value of fund assets, including, when necessary, the determination of “fair value” and actions taken to monitor and test the effectiveness of such procedures and processes;
• Information about the policies and practices of each fund’s adviser and sub-adviser with respect to trading, including their processes for seeking best execution of portfolio transactions;
• Information about the allocation of brokerage transactions and the benefits, if any, received by the adviser and sub-adviser to each fund as a result of brokerage allocation, including, as applicable, information concerning the acquisition of research through client commission arrangements and policies with respect to “soft dollars”;
• Data relating to the portfolio turnover rate of each fund and related information regarding active management in the context of particular strategies;
Information about each Adviser and Sub-adviser
• Reports detailing the financial results and condition of the adviser and sub-adviser to each fund;
1 Not all Eaton Vance Funds have entered into a sub-advisory agreement with a sub-adviser. Accordingly, references to “sub-adviser” or “sub-advisory agreement” in this “Overview” section may not be applicable to the particular Eaton Vance Fund covered by this report. Following the “Overview” section, further information regarding the Board’s evaluation of a fund’s contractual arrangements is included under the “Results of the Contract Review Process” section.
Eaton Vance
Tax-Managed Small-Cap Fund
October 31, 2022
Board of Trustees’ Contract Approval — continued
• Information regarding the individual investment professionals whose responsibilities include portfolio management and investment research for the funds, and, for portfolio managers and certain other investment professionals, information relating to their responsibilities with respect to managing other mutual funds and investment accounts, as applicable;
• Information regarding the adviser’s and its parent company’s (Morgan Stanley’s) efforts to retain and attract talented investment professionals, including in the context of a particularly competitive marketplace for talent, as well as the ongoing unique environment presented by hybrid, remote and other alternative work arrangements;
• The Code of Ethics of the adviser and its affiliates and the sub-adviser of each fund, together with information relating to compliance with, and the administration of, such codes;
• Policies and procedures relating to proxy voting, including regular reporting with respect to fund proxy voting activities;
• Information regarding the handling of corporate actions and class actions, as well as information regarding litigation and other regulatory matters;
• Information concerning the resources devoted to compliance efforts undertaken by the adviser and its affiliates and the sub-adviser of each fund, if any, including descriptions of their various compliance programs and their record of compliance;
• Information concerning the business continuity and disaster recovery plans of the adviser and its affiliates and the sub-adviser of each fund, if any;
• A description of Eaton Vance Management’s and Boston Management and Research’s oversight of sub-advisers, including with respect to regulatory and compliance issues, investment management and other matters;
Other Relevant Information
• Information regarding ongoing initiatives to further integrate and harmonize, where applicable, the investment management and other departments of the adviser and its affiliates with the overall investment management infrastructure of Morgan Stanley, in light of Morgan Stanley’s acquisition of Eaton Vance on March 1, 2021;
• Information concerning the nature, cost and character of the administrative and other non-investment advisory services provided by Eaton Vance Management and its affiliates;
• Information concerning oversight of the relationship with the custodian, subcustodians, fund accountants, and other third-party service providers by the adviser and/or administrator to each of the funds;
• Information concerning efforts to implement policies and procedures with respect to various new regulations applicable to the funds, including Rule 12d1-4 (the Fund-of-Funds Rule), Rule 18f-4 (the Derivatives Rule) and Rule 2a-5 (the Fair Valuation Rule);
• For an Eaton Vance Fund structured as an exchange-listed closed-end fund, information concerning the benefits of the closed-end fund structure, as well as, where relevant, the closed-end fund’s market prices (including as compared to the closed-end fund’s net asset value (NAV)), trading volume data, continued use of auction preferred shares (where applicable), distribution rates and other relevant matters;
• The risks which the adviser and/or its affiliates incur in connection with the management and operation of the funds, including, among others, litigation, regulatory, entrepreneurial, and other business risks (and the associated costs of such risks); and
• The terms of each investment advisory agreement and sub-advisory agreement.
During the various meetings of the Board and its committees over the course of the year leading up to the June 8, 2022 meeting, the Trustees received information from portfolio managers and other investment professionals of the advisers and sub-advisers of the funds regarding investment and performance matters, and considered various investment and trading strategies used in pursuing the funds’ investment objectives. The Trustees also received information regarding risk management techniques employed in connection with the management of the funds. The Board and its committees evaluated issues pertaining to industry and regulatory developments, compliance procedures, fund governance and other issues with respect to the funds, and received and participated in reports and presentations provided by Eaton Vance Management, Boston Management and Research and fund sub-advisers, with respect to such matters. In addition to the formal meetings of the Board and its committees, the Independent Trustees held regular teleconferences to discuss, among other topics, matters relating to the continuation of investment advisory agreements and sub-advisory agreements.
The Contract Review Committee was advised throughout the contract review process by Goodwin Procter LLP, independent legal counsel for the Independent Trustees. The members of the Contract Review Committee, with the advice of such counsel, exercised their own business judgment in determining the material factors to be considered in evaluating each investment advisory agreement and sub-advisory agreement and the weight to be given to each such factor. The conclusions reached with respect to each investment advisory agreement and sub-advisory agreement were based on a comprehensive evaluation of all the information provided and not any single factor. Moreover, each member of the Contract Review Committee may have placed varying emphasis on particular factors in reaching conclusions with respect to each investment advisory agreement and sub-advisory agreement. In evaluating each investment advisory agreement and sub-advisory agreement, including the fee structures and other terms contained in such agreements, the members of the Contract Review Committee were also informed by multiple years of analysis and discussion with the adviser and sub-adviser to each of the Eaton Vance Funds.
Results of the Contract Review Process
Based on its consideration of the foregoing, and such other information it deemed relevant, including the factors and conclusions described below, the Contract Review Committee concluded that the continuation of the investment advisory agreement between Eaton Vance Tax-Managed Small-Cap Fund (the “Fund”) and Eaton Vance Management (“EVM”), as well as the investment advisory agreement between Tax-Managed Small-Cap Portfolio (the “Portfolio”), the portfolio in which the Fund invests, and Boston Management and Research (“BMR”) (EVM, with respect to the Fund, and BMR, with
Eaton Vance
Tax-Managed Small-Cap Fund
October 31, 2022
Board of Trustees’ Contract Approval — continued
respect to the Portfolio, are each referred to herein as the “Adviser”), including their respective fee structures, are in the interests of shareholders and, therefore, recommended to the Board approval of each agreement. Based on the recommendation of the Contract Review Committee, the Board, including a majority of the Independent Trustees, voted to approve continuation of the investment advisory agreements for the Fund and the Portfolio (together, the “investment advisory agreements”).
Nature, Extent and Quality of Services
In considering whether to approve the investment advisory agreements for the Fund and the Portfolio, the Board evaluated the nature, extent and quality of services provided to the Fund and to the Portfolio by the applicable Adviser.
The Board considered each Adviser’s management capabilities and investment processes in light of the types of investments held by the Fund and the Portfolio, including the education, experience and number of investment professionals and other personnel who provide portfolio management, investment research, and similar services to the Fund and the Portfolio. The Board specifically noted that each Adviser has devoted extensive resources to in-house equity research and also draws upon independent research available from third-party sources. The Board considered each Adviser’s experience managing funds that seek to maximize after-tax returns. The Board also took into account the resources dedicated to portfolio management and other services, the compensation methods of each Adviser and other factors, including the reputation and resources of the Adviser to recruit and retain highly qualified research, advisory and supervisory investment professionals. In addition, the Board considered the time and attention devoted to the Eaton Vance Funds, including the Fund and the Portfolio, by senior management, as well as the infrastructure, operational capabilities and support staff in place to assist in the portfolio management and operations of the Fund and the Portfolio, including the provision of administrative services. The Board also considered the business-related and other risks to which each Adviser or its affiliates may be subject in managing the Fund and the Portfolio.
The Board noted that, under the terms of the investment advisory agreement of the Fund, EVM may invest assets of the Fund directly in securities, for which it would receive a fee, or in the Portfolio, for which it receives no separate fee but for which BMR receives an advisory fee from the Portfolio.
The Board considered the compliance programs of each Adviser and relevant affiliates thereof. The Board considered compliance and reporting matters regarding, among other things, personal trading by investment professionals, disclosure of portfolio holdings, late trading, frequent trading, portfolio valuation, business continuity and the allocation of investment opportunities. The Board also considered the responses of each Adviser and its affiliates to requests in recent years from regulatory authorities, such as the Securities and Exchange Commission and the Financial Industry Regulatory Authority.
The Board considered other administrative services provided or overseen by EVM and its affiliates, including transfer agency and accounting services. The Board evaluated the benefits to shareholders of investing in a fund that is a part of a large fund complex offering exposure to a variety of asset classes and investment disciplines, as well as the ability, in many cases, to exchange an investment among different funds without incurring additional sales charges.
After consideration of the foregoing factors, among others, the Board concluded that the nature, extent and quality of services provided by each Adviser, taken as a whole, are appropriate and consistent with the terms of the applicable investment advisory agreement.
Fund Performance
The Board compared the Fund’s investment performance to that of comparable funds identified by an independent data provider (the peer group), as well as an appropriate benchmark index and a custom peer group of similarly managed funds. The Board’s review included comparative performance data with respect to the Fund for the one-, three-, five- and ten-year periods ended December 31, 2021. In this regard, the Board noted that the performance of the Fund was higher than the median performance of the Fund’s custom peer group and lower than the median performance of the Fund’s peer group for the three-year period. The Board also noted that the performance of the Fund was lower than its benchmark index for the three-year period. The Board concluded that the performance of the Fund was satisfactory.
Management Fees and Expenses
The Board considered contractual fee rates payable by the Portfolio and by the Fund for advisory and administrative services (referred to collectively as “management fees”). As part of its review, the Board considered the Fund’s management fees and total expense ratio for the one-year period ended December 31, 2021, as compared to those of comparable funds, before and after giving effect to any undertaking to waive fees or reimburse expenses. The Board also considered factors that had an impact on the Fund’s total expense ratio relative to comparable funds.
After considering the foregoing information, and in light of the nature, extent and quality of the services provided by each Adviser, the Board concluded that the management fees charged for advisoryand related services are reasonable.
Profitability and “Fall-Out” Benefits
The Board considered the level of profits realized by each Adviser and relevant affiliates thereof in providing investment advisory and administrative services to the Fund, to the Portfolio and to all Eaton Vance Funds as a group. The Board considered the level of profits realized without regard to marketing support or other payments by each Adviser and its affiliates to third parties in respect of distribution or other services.
The Board concluded that, in light of the foregoing factors and the nature, extent and quality of the services rendered, the profits realized by each Adviser and its affiliates are deemed not to be excessive.
Eaton Vance
Tax-Managed Small-Cap Fund
October 31, 2022
Board of Trustees’ Contract Approval — continued
The Board also considered direct or indirect fall-out benefits received by each Adviser and its affiliates in connection with their respective relationships with the Fund and the Portfolio, including the benefits of research services that may be available to each Adviser as a result of securities transactions effected for the Fund and the Portfolio and other investment advisory clients.
Economies of Scale
In reviewing management fees and profitability, the Board also considered the extent to which the applicable Adviser and its affiliates, on the one hand, and the Fund and the Portfolio, on the other hand, can expect to realize benefits from economies of scale as the assets of the Fund and the Portfolio increase. The Board acknowledged the difficulty in accurately measuring the benefits resulting from economies of scale, if any, with respect to the management of any specific fund or group of funds. The Board reviewed data summarizing the increases and decreases in the assets of the Fund and of all Eaton Vance Funds as a group over various time periods, and evaluated the extent to which the total expense ratio of the Fund and the profitability of each Adviser and its affiliates may have been affected by such increases or decreases. Based upon the foregoing, the Board concluded that the Fund currently shares in the benefits from economies of scale, if any, when they are realized by the Adviser. The Board also concluded that the structure of the advisory fees, which include breakpoints at several asset levels, will allow the Fund and the Portfolio to continue to benefit from any economies of scale in the future.
Eaton Vance
Tax-Managed Small-Cap Fund
October 31, 2022
Liquidity Risk Management Program
The Fund has implemented a written liquidity risk management program (Program) and related procedures to manage its liquidity in accordance with Rule 22e-4 under the Investment Company Act of 1940, as amended (Liquidity Rule). The Liquidity Rule defines “liquidity risk” as the risk that a fund could not meet requests to redeem shares issued by the fund without significant dilution of the remaining investors’ interests in the fund. The Fund’s Board of Trustees/Directors has designated the investment adviser to serve as the administrator of the Program and the related procedures. The administrator has established a Liquidity Risk Management Oversight Committee (Committee) to perform the functions necessary to administer the Program. As part of the Program, the administrator is responsible for identifying illiquid investments and categorizing the relative liquidity of the Fund’s investments in accordance with the Liquidity Rule. Under the Program, the administrator assesses, manages, and periodically reviews the Fund’s liquidity risk, and is responsible for making certain reports to the Fund’s Board of Trustees/Directors and the Securities and Exchange Commission (SEC) regarding the liquidity of the Fund’s investments, and to notify the Board of Trustees/Directors and the SEC of certain liquidity events specified in the Liquidity Rule. The liquidity of the Fund’s portfolio investments is determined based on a number of factors including, but not limited to, relevant market, trading and investment-specific considerations under the Program.
At a meeting of the Fund’s Board of Trustees/Directors on June 7, 2022, the Committee provided a written report to the Fund’s Board of Trustees/Directors pertaining to the operation, adequacy, and effectiveness of implementation of the Program, as well as the operation of the highly liquid investment minimum (if applicable) for the period January 1, 2021 through December 31, 2021 (Review Period). The Program operated effectively during the Review Period, supporting the administrator’s ability to assess, manage and monitor Fund liquidity risk, including during periods of market volatility and net redemptions. During the Review Period, the Fund met redemption requests on a timely basis.
There can be no assurance that the Program will achieve its objectives in the future. Please refer to the Fund’s prospectus for more information regarding the Fund’s exposure to liquidity risk and other principal risks to which an investment in the Fund may be subject.
Eaton Vance
Tax-Managed Small-Cap Fund
October 31, 2022
Management and Organization
Fund Management. The Trustees of Eaton Vance Mutual Funds Trust (the Trust) and Tax-Managed Small-Cap Portfolio (the Portfolio) are responsible for the overall management and supervision of the Trust's and the Portfolio's affairs. The Board members and officers of the Trust and the Portfolio are listed below. Except as indicated, each individual has held the office shown or other offices in the same company for the last five years. Board members hold indefinite terms of office. Each Trustee holds office until his or her successor is elected and qualified, subject to a prior death, resignation, retirement, disqualification or removal. Under the terms of the Fund’s and the Portfolio's current Trustee retirement policy, an Independent Trustee must retire and resign as a Trustee on the earlier of: (i) the first day of July following his or her 74th birthday; or (ii), with limited exception, December 31st of the 20th year in which he or she has served as a Trustee. However, if such retirement and resignation would cause the Fund and the Portfolio to be out of compliance with Section 16 of the 1940 Act or any other regulations or guidance of the SEC, then such retirement and resignation will not become effective until such time as action has been taken for the Fund and the Portfolio to be in compliance therewith. The “noninterested Trustees” consist of those Trustees who are not “interested persons” of the the Trust and the Portfolio, as that term is defined under the 1940 Act. The business address of each Board member and officer is Two International Place, Boston, Massachusetts 02110. As used below, “BMR” refers to Boston Management and Research, “EVC” refers to Eaton Vance Corp., “EV” refers to EV LLC, “EVM” refers to Eaton Vance Management and “EVD” refers to Eaton Vance Distributors, Inc. EV is the trustee of each of EVM and BMR. Effective March 1, 2021, each of EVM, BMR, EVD and EV are indirect, wholly owned subsidiaries of Morgan Stanley. Each officer affiliated with EVM may hold a position with other EVM affiliates that is comparable to his or her position with EVM listed below. Each Trustee oversees 135 funds (with the exception of Mr. Bowser who oversees 110 funds) in the Eaton Vance fund complex (including both funds and portfolios in a hub and spoke structure).
| Name and Year of Birth | Trust/Portfolio
Position(s) | Length of Service | Principal Occupation(s) and Other Directorships
During Past Five Years and Other Relevant Experience |
| Interested Trustee |
Thomas E. Faust Jr.
1958 | Trustee | 2007 | Chairman of Morgan Stanley Investment Management, Inc. (MSIM), member of the Board of Managers and President of EV (since 2021), Chief Executive Officer of EVM and BMR. Formerly, Chairman, Chief Executive Officer (2007-2021) and President (2006-2021) of EVC and Director of EVD (2007-2022). Mr. Faust is an interested person because of his positions with MSIM, BMR, EVM and EV, which are affiliates of the Trust and the Portfolio.
Other Directorships. Formerly, Director of EVC (2007-2021) and Hexavest Inc. (investment management firm) (2012-2021). |
| Noninterested Trustees |
Alan C. Bowser(1)
1962 | Trustee | Since 2022 | Chief Diversity Officer, Partner and a member of the Operating Committee, and formerly served as Senior Advisor on Diversity and Inclusion for the firm’s chief executive officer, Co-Head of the Americas Region, and Senior Client Advisor of Bridgewater Associates, an asset management firm (2011- present).
Other Directorships. None. |
Mark R. Fetting
1954 | Trustee | Since 2016 | Private investor. Formerly held various positions at Legg Mason, Inc. (investment management firm) (2000-2012), including President, Chief Executive Officer, Director and Chairman (2008-2012), Senior Executive Vice President (2004-2008) and Executive Vice President (2001-2004). Formerly, President of Legg Mason family of funds (2001-2008). Formerly, Division President and Senior Officer of Prudential Financial Group, Inc. and related companies (investment management firm) (1991-2000).
Other Directorships. None. |
Cynthia E. Frost
1961 | Trustee | Since 2014 | Private investor. Formerly, Chief Investment Officer of Brown University (university endowment) (2000-2012). Formerly, Portfolio Strategist for Duke Management Company (university endowment manager) (1995-2000). Formerly, Managing Director, Cambridge Associates (investment consulting company) (1989-1995). Formerly, Consultant, Bain and Company (management consulting firm) (1987-1989). Formerly, Senior Equity Analyst, BA Investment Management Company (1983-1985).
Other Directorships. None. |
George J. Gorman
1952 | Chairperson of the Board and Trustee | Since 2021
(Chairperson) and 2014 (Trustee) | Principal at George J. Gorman LLC (consulting firm). Formerly, Senior Partner at Ernst & Young LLP (a registered public accounting firm) (1974-2009).
Other Directorships. None. |
Eaton Vance
Tax-Managed Small-Cap Fund
October 31, 2022
Management and Organization — continued
| Name and Year of Birth | Trust/Portfolio
Position(s) | Length of Service | Principal Occupation(s) and Other Directorships
During Past Five Years and Other Relevant Experience |
| Noninterested Trustees (continued) |
Valerie A. Mosley
1960 | Trustee | Since 2014 | Chairwoman and Chief Executive Officer of Valmo Ventures (a consulting and investment firm). Founder of Upward Wealth, Inc., dba BrightUp, a fintech platform. Formerly, Partner and Senior Vice President, Portfolio Manager and Investment Strategist at Wellington Management Company, LLP (investment management firm) (1992-2012). Formerly, Chief Investment Officer, PG Corbin Asset Management (1990-1992). Formerly worked in institutional corporate bond sales at Kidder Peabody (1986-1990).
Other Directorships. Director of DraftKings, Inc. (digital sports entertainment and gaming company) (since September 2020). Director of Envestnet, Inc. (provider of intelligent systems for wealth management and financial wellness) (since 2018). Formerly, Director of Dynex Capital, Inc. (mortgage REIT) (2013-2020) and Director of Groupon, Inc. (e-commerce provider) (2020-2022). |
Keith Quinton
1958 | Trustee | Since 2018 | Private investor, researcher and lecturer. Formerly, Independent Investment Committee Member at New Hampshire Retirement System (2017-2021). Formerly, Portfolio Manager and Senior Quantitative Analyst at Fidelity Investments (investment management firm) (2001-2014).
Other Directorships. Formerly, Director (2016-2021) and Chairman (2019-2021) of New Hampshire Municipal Bond Bank. |
Marcus L. Smith
1966 | Trustee | Since 2018 | Private investor and independent corporate director. Formerly, Chief Investment Officer, Canada (2012-2017), Chief Investment Officer, Asia (2010-2012), Director of Asian Research (2004-2010) and portfolio manager (2001-2017) at MFS Investment Management (investment management firm).
Other Directorships. Director of First Industrial Realty Trust, Inc. (an industrial REIT) (since 2021). Director of MSCI Inc. (global provider of investment decision support tools) (since 2017). Formerly, Director of DCT Industrial Trust Inc. (logistics real estate company) (2017-2018). |
Susan J. Sutherland
1957 | Trustee | Since 2015 | Private investor. Director of Ascot Group Limited and certain of its subsidiaries (insurance and reinsurance) (since 2017). Formerly, Director of Hagerty Holding Corp. (insurance) (2015-2018) and Montpelier Re Holdings Ltd. (insurance and reinsurance) (2013-2015). Formerly, Associate, Counsel and Partner at Skadden, Arps, Slate, Meagher & Flom LLP (law firm) (1982-2013).
Other Directorships. Director of Kairos Acquisition Corp. (insurance/InsurTech acquisition company) (since 2021). |
Scott E. Wennerholm
1959 | Trustee | Since 2016 | Private investor. Formerly, Trustee at Wheelock College (postsecondary institution) (2012-2018). Formerly, Consultant at GF Parish Group (executive recruiting firm) (2016-2017). Formerly, Chief Operating Officer and Executive Vice President at BNY Mellon Asset Management (investment management firm) (2005-2011). Formerly, Chief Operating Officer and Chief Financial Officer at Natixis Global Asset Management (investment management firm) (1997-2004). Formerly, Vice President at Fidelity Investments Institutional Services (investment management firm) (1994-1997).
Other Directorships. None. |
Nancy A. Wiser(1)
1967 | Trustee | Since 2022 | Formerly, Executive Vice President and the Global Head of Operations at Wells Fargo Asset Management (2011-2021).
Other Directorships. None. |
| Name and Year of Birth | Trust/Portfolio
Position(s) | Length of Service | Principal Occupation(s)
During Past Five Years |
| Principal Officers who are not Trustees |
Eric A. Stein
1980 | President of the
Trust | Since 2020 | Vice President and Chief Investment Officer, Fixed Income of EVM and BMR. Prior to November 1, 2020, Mr. Stein was a co-Director of Eaton Vance’s Global Income Investments. Also Vice President of Calvert Research and Management (“CRM”). |
Edward J. Perkin
1972 | President of the
Portfolio | Since 2014 | Chief Equity Investment Officer and Vice President of EVM and BMR since 2014. Also Vice President of CRM. |
Deidre E. Walsh
1971 | Vice President and Chief Legal Officer | Since 2009 | Vice President of EVM and BMR. Also Vice President of CRM. |
Eaton Vance
Tax-Managed Small-Cap Fund
October 31, 2022
Management and Organization — continued
| Name and Year of Birth | Trust/Portfolio
Position(s) | Length of Service | Principal Occupation(s)
During Past Five Years |
| Principal Officers who are not Trustees (continued) |
James F. Kirchner
1967 | Treasurer | Since 2007 | Vice President of EVM and BMR. Also Vice President of CRM. |
Nicholas Di Lorenzo
1987 | Secretary | Since 2022 | Formerly, associate (2012-2021) and counsel (2022) at Dechert LLP. |
Richard F. Froio
1968 | Chief Compliance
Officer | Since 2017 | Vice President of EVM and BMR since 2017. Formerly, Deputy Chief Compliance Officer (Adviser/Funds) and Chief Compliance Officer (Distribution) at PIMCO (2012-2017) and Managing Director at BlackRock/Barclays Global Investors (2009-2012). |
(1) Mr. Bowser and Ms. Wiser began serving as Trustees effective April 4, 2022.
The SAI for the Fund includes additional information about the Trustees and officers of the Fund and the Portfolio and can be obtained without charge on Eaton Vance’s website at www.eatonvance.com or by calling 1-800-262-1122.
| FACTS | WHAT DOES EATON VANCE DO WITH YOUR
PERSONAL INFORMATION? |
| Why? | Financial companies choose how they share your personal information. Federal law gives consumers the right to limit some but not all sharing. Federal law also requires us to tell you how we collect, share, and protect your personal information. Please read this notice carefully to understand what we do. |
| |
| What? | The types of personal information we collect and share depend on the product or service you have with us. This information can include:■ Social Security number and income
■ investment experience and risk tolerance
■ checking account number and wire transfer instructions |
| |
| How? | All financial companies need to share customers’ personal information to run their everyday business. In the section below, we list the reasons financial companies can share their customers’ personal information; the reasons Eaton Vance chooses to share; and whether you can limit this sharing. |
Reasons we can share your
personal information | Does Eaton Vance
share? | Can you limit
this sharing? |
| For our everyday business purposes — such as to process your transactions, maintain your account(s), respond to court orders and legal investigations, or report to credit bureaus | Yes | No |
| For our marketing purposes — to offer our products and services to you | Yes | No |
| For joint marketing with other financial companies | No | We don’t share |
| For our investment management affiliates’ everyday business purposes — information about your transactions, experiences, and creditworthiness | Yes | Yes |
| For our affiliates’ everyday business purposes — information about your transactions and experiences | Yes | No |
| For our affiliates’ everyday business purposes — information about your creditworthiness | No | We don’t share |
| For our investment management affiliates to market to you | Yes | Yes |
| For our affiliates to market to you | No | We don’t share |
| For nonaffiliates to market to you | No | We don’t share |
To limit our
sharing | Call toll-free 1-800-262-1122 or email: EVPrivacy@eatonvance.comPlease note:If you are a new customer, we can begin sharing your information 30 days from the date we sent this notice. When you are no longer our customer, we continue to share your information as described in this notice. However, you can contact us at any time to limit our sharing. |
| Questions? | Call toll-free 1-800-262-1122 or email: EVPrivacy@eatonvance.com |
| Privacy Notice — continued | April 2021 |
| Who we are |
| Who is providing this notice? | Eaton Vance Management, Eaton Vance Distributors, Inc., Eaton Vance Trust Company, Eaton Vance Management (International) Limited, Eaton Vance Advisers International Ltd., Eaton Vance Global Advisors Limited, Eaton Vance Management’s Real Estate Investment Group, Boston Management and Research, Calvert Research and Management, Eaton Vance and Calvert Fund Families and our investment advisory affiliates (“Eaton Vance”) (see Investment Management Affiliates definition below) |
| What we do |
How does Eaton Vance
protect my personal
information? | To protect your personal information from unauthorized access and use, we use security measures that comply with federal law. These measures include computer safeguards and secured files and buildings. We have policies governing the proper handling of customer information by personnel and requiring third parties that provide support to adhere to appropriate security standards with respect to such information. |
How does Eaton Vance
collect my personal
information? | We collect your personal information, for example, when you■ open an account or make deposits or withdrawals from your account
■ buy securities from us or make a wire transfer
■ give us your contact informationWe also collect your personal information from others, such as credit bureaus, affiliates, or other companies. |
| Why can’t I limit all sharing? | Federal law gives you the right to limit only■ sharing for affiliates’ everyday business purposes — information about your creditworthiness
■ affiliates from using your information to market to you
■ sharing for nonaffiliates to market to youState laws and individual companies may give you additional rights to limit sharing. See below for more on your rights under state law. |
| Definitions |
Investment Management
Affiliates | Eaton Vance Investment Management Affiliates include registered investment advisers, registered broker- dealers, and registered and unregistered funds. Investment Management Affiliates does not include entities associated with Morgan Stanley Wealth Management, such as Morgan Stanley Smith Barney LLC and Morgan Stanley & Co. |
| Affiliates | Companies related by common ownership or control. They can be financial and nonfinancial companies.■ Our affiliates include companies with a Morgan Stanley name and financial companies such as Morgan Stanley Smith Barney LLC and Morgan Stanley & Co. |
| Nonaffiliates | Companies not related by common ownership or control. They can be financial and nonfinancial companies.■ Eaton Vance does not share with nonaffiliates so they can market to you. |
| Joint marketing | A formal agreement between nonaffiliated financial companies that together market financial products or services to you.■ Eaton Vance doesn’t jointly market. |
| Other important information |
| Vermont: Except as permitted by law, we will not share personal information we collect about Vermont residents with Nonaffiliates unless you provide us with your written consent to share such information.California: Except as permitted by law, we will not share personal information we collect about California residents with Nonaffiliates and we will limit sharing such personal information with our Affiliates to comply with California privacy laws that apply to us. |
Delivery of Shareholder Documents. The Securities and Exchange Commission (SEC) permits funds to deliver only one copy of shareholder documents, including prospectuses, proxy statements and shareholder reports, to fund investors with multiple accounts at the same residential or post office box address. This practice is often called “householding” and it helps eliminate duplicate mailings to shareholders. Eaton Vance, or your financial intermediary, may household the mailing of your documents indefinitely unless you instruct Eaton Vance, or your financial intermediary, otherwise. If you would prefer that your Eaton Vance documents not be householded, please contact Eaton Vance at 1-800-262-1122, or contact your financial intermediary. Your instructions that householding not apply to delivery of your Eaton Vance documents will typically be effective within 30 days of receipt by Eaton Vance or your financial intermediary.
Portfolio Holdings. Each Eaton Vance Fund and its underlying Portfolio(s) (if applicable) files a schedule of portfolio holdings on Part F to Form N-PORT with the SEC. Certain information filed on Form N-PORT may be viewed on the Eaton Vance website at www.eatonvance.com, by calling Eaton Vance at 1-800-262-1122 or in the EDGAR database on the SEC’s website at www.sec.gov.
Proxy Voting. From time to time, funds are required to vote proxies related to the securities held by the funds. The Eaton Vance Funds or their underlying Portfolios (if applicable) vote proxies according to a set of policies and procedures approved by the Funds’ and Portfolios’ Boards. You may obtain a description of these policies and procedures and information on how the Funds or Portfolios voted proxies relating to portfolio securities during the most recent 12-month period ended June 30, without charge, upon request, by calling 1-800-262-1122 and by accessing the SEC’s website at www.sec.gov.
Investment Adviser of Tax-Managed Small-Cap Portfolio
Boston Management and Research
Two International Place
Boston, MA 02110
Investment Adviser and Administrator of Eaton Vance
Tax-Managed Small-Cap Fund
Eaton Vance Management
Two International Place
Boston, MA 02110
Principal Underwriter*
Eaton Vance Distributors, Inc.
Two International Place
Boston, MA 02110
(617) 482-8260
Custodian
State Street Bank and Trust Company
State Street Financial Center, One Lincoln Street
Boston, MA 02111
Transfer Agent
BNY Mellon Investment Servicing (US) Inc.
Attn: Eaton Vance Funds
P.O. Box 9653
Providence, RI 02940-9653
(800) 262-1122
Independent Registered Public Accounting Firm
Deloitte & Touche LLP
200 Berkeley Street
Boston, MA 02116-5022
Fund Offices
Two International Place
Boston, MA 02110
* FINRA BrokerCheck. Investors may check the background of their Investment Professional by contacting the Financial Industry Regulatory Authority (FINRA). FINRA BrokerCheck is a free tool to help investors check the professional background of current and former FINRA-registered securities firms and brokers. FINRA BrokerCheck is available by calling 1-800-289-9999 and at www.FINRA.org. The FINRA BrokerCheck brochure describing this program is available to investors at www.FINRA.org.
Eaton Vance
Global Small-Cap Equity Fund
Annual Report
October 31, 2022
Commodity Futures Trading Commission Registration. The Commodity Futures Trading Commission (“CFTC”) has adopted regulations that subject registered investment companies and advisers to regulation by the CFTC if a fund invests more than a prescribed level of its assets in certain CFTC-regulated instruments (including futures, certain options and swap agreements) or markets itself as providing investment exposure to such instruments. The investment adviser has claimed an exclusion from the definition of “commodity pool operator” under the Commodity Exchange Act with respect to its management of the Fund. Accordingly, neither the Fund nor the adviser with respect to the operation of the Fund is subject to CFTC regulation. Because of its management of other strategies, the Fund's adviser is registered with the CFTC as a commodity pool operator. The adviser is also registered as a commodity trading advisor.
Fund shares are not insured by the FDIC and are not deposits or other obligations of, or guaranteed by, any depository institution. Shares are subject to investment risks, including possible loss of principal invested.
This report must be preceded or accompanied by a current summary prospectus or prospectus. Before investing, investors should consider carefully the investment objective, risks, and charges and expenses of a mutual fund. This and other important information is contained in the summary prospectus and prospectus, which can be obtained from a financial intermediary. Prospective investors should read the prospectus carefully before investing. For further information, please call 1-800-262-1122.
Annual Report October 31, 2022
Eaton Vance
Global Small-Cap Equity Fund
Eaton Vance
Global Small-Cap Equity Fund
October 31, 2022
Management’s Discussion of Fund Performance†
Economic and Market Conditions
The 12-month period starting November 1, 2021, was dominated by the ongoing effects of one black swan event -- the COVID-19 pandemic -- and fallout from another -- Russia’s invasion of Ukraine in February 2022.
In the opening months of the period, stock investors as well as consumers appeared to take a “glass is half full” approach. In both the U.S. and Europe, consumers rushed to spend money saved earlier in the pandemic. Major U.S. equity indexes closed at new all-time highs during the final months of 2021.
But as the new year began, investors appeared to reevaluate the twin threats of inflation and interest rate hikes, and stock performance turned negative. In February, Russia’s invasion of Ukraine sent shock waves through U.S. and global markets, exacerbating inflationary pressures on energy and food costs. Central banks around the world -- including the U.S. Federal Reserve (the Fed), the Bank of England, and the European Central Bank (ECB) -- initiated their first interest rate hikes in years. In Europe, looming energy shortages caused by the Russia-Ukraine conflict pushed inflation rates even higher and stock prices lower during the period.
In the U.S., investors began to expect the Fed would raise interest rates at every policy meeting in 2022 and, in turn, worried that aggressive rate hikes could tip the economy into recession. At its June, July, and September 2022 meetings, the Fed hiked the federal funds rate 0.75% each time -- to a 3.00%-3.25% range -- its first moves of that magnitude since 1994. Higher interest rates, inflation, and recessionary worries drove stock prices down around the globe.
As the period came to a close in October 2022, however, U.S. and European stocks delivered positive performance for the first time in months -- driven by a combination of better-than-expected U.S. company earnings; improving investor sentiment that stocks had been oversold during the August-September market pullback; government measures to address Europe’s energy crisis; and hope that central bank rate hikes would help tame inflation.
Meanwhile in the world’s second-largest economy, China’s zero-COVID policy severely restricted economic output. The MSCI Golden Dragon Index, a measure of Chinese large-cap and mid-cap stocks, lost more ground in October and was one of the worst-performing major indexes during the period, declining 42.74%.
Major equity indexes elsewhere also suffered significant losses. For the period as a whole, the MSCI ACWI Index, a broad measure of global equities, returned -19.96%; the S&P 500® Index, a broad measure of U.S. stocks, returned -14.61%; and the technology-laden Nasdaq Composite Index returned -28.56%. The MSCI EAFE Index of developed-market international equities returned -23.00%, while the MSCI Emerging Markets Index, dragged down by its China allocation, returned -31.03% during the period.
Fund Performance
For the 12-month period ended October 31, 2022, Eaton Vance Global Small-Cap Equity Fund (the Fund) returned -22.54% for Class A shares at net asset value (NAV), underperforming its benchmark, the MSCI World Small Cap Index (the Index), which returned -21.81%.
Sector allocations detracted from Fund performance relative to the Index during the period. The Fund’s underweight exposure to the energy sector especially weighed on relative returns. Security selections in the industrials sector also had a negative impact on relative performance.
Security selections overall contributed to returns relative to the Index during the period. Selections in the financials and consumer discretionary sectors were particularly beneficial. An overweight exposure to financials further added to relative performance.
Sdiptech AB (Sdiptech), a Swedish engineering services firm that specializes in urban infrastructure, was among the largest detractors from Fund performance during the period. Sdiptech’s share price fell during much of the period as the outlook for the European economy weakened.
AZEK Co., Inc. (AZEK), a manufacturer of composite decking and building materials in the industrials sector, also detracted from returns relative to the Index. Excess customer inventory and investor concerns about decelerating demand for both new construction and home renovations weighed on AZEK’s share price during the period.
PolyPeptide Group AG (PolyPeptide) is a Swiss manufacturer of peptides for the pharmaceutical and biotechnology industries. PolyPeptide’s share price declined after the company reported decreased profits because of inflation and capital expenditures to accommodate growth.
CBIZ, Inc. (CBIZ), a global consulting firm providing accounting, tax, insurance, and advisory services, was a leading contributor to returns relative to the Index during the period. CBIZ’s share price rose after the company reported strong second-quarter earnings and revenue, driven by growth in its property and casualty insurance, and financial services businesses.
W.R. Berkley Corp., a property and casualty insurance company, also contributed to performance relative to the Index during the period. Its share price rose on strong premium growth and return on equity.
See Endnotes and Additional Disclosures in this report.
Past performance is no guarantee of future results. Returns are historical and are calculated by determining the percentage change in net asset value (NAV) or offering price (as applicable) with all distributions reinvested. Furthermore, returns do not reflect the deduction of taxes that shareholders may have to pay on Fund distributions or upon the redemption of Fund shares. Investment return and principal value will fluctuate so that shares, when redeemed, may be worth more or less than their original cost. Performance for periods less than or equal to one year is cumulative. Performance is for the stated time period only; due to market volatility, current Fund performance may be lower or higher than the quoted return. For performance as of the most recent month-end, please refer to eatonvance.com.
Eaton Vance
Global Small-Cap Equity Fund
October 31, 2022
Management’s Discussion of Fund Performance† — continued
The share price of Performance Food Group Co. (Performance) -- a food distributor for restaurants, businesses, and schools -- rose as sales and profits increased, largely attributed to Performance’s 2021 acquisition of competitor Core-Mark Holding Co., Inc., a wholesale distributor to the convenience retail industry.
See Endnotes and Additional Disclosures in this report.
Past performance is no guarantee of future results. Returns are historical and are calculated by determining the percentage change in net asset value (NAV) or offering price (as applicable) with all distributions reinvested. Furthermore, returns do not reflect the deduction of taxes that shareholders may have to pay on Fund distributions or upon the redemption of Fund shares. Investment return and principal value will fluctuate so that shares, when redeemed, may be worth more or less than their original cost. Performance for periods less than or equal to one year is cumulative. Performance is for the stated time period only; due to market volatility, current Fund performance may be lower or higher than the quoted return. For performance as of the most recent month-end, please refer to eatonvance.com.
Eaton Vance
Global Small-Cap Equity Fund
October 31, 2022
Performance
Portfolio Manager(s) Aidan M. Farrell of MSIM Fund Management (Ireland) Limited (MSIM FMIL); Michael D. McLean, CFA and J. Griffith Noble, CFA, each of Eaton Vance Management
| % Average Annual Total Returns1,2 | Class
Inception Date | Performance
Inception Date | One Year | Five Years | Ten Years |
| Class A at NAV | 03/04/2002 | 03/04/2002 | (22.54)% | 4.16% | 7.98% |
| Class A with 5.25% Maximum Sales Charge | — | — | (26.60) | 3.04 | 7.40 |
| Class C at NAV | 03/04/2002 | 03/04/2002 | (23.12) | 3.38 | 7.34 |
| Class C with 1% Maximum Deferred Sales Charge | — | — | (23.75) | 3.38 | 7.34 |
| Class I at NAV | 10/01/2009 | 03/04/2002 | (22.34) | 4.42 | 8.26 |
|
| MSCI World Small Cap Index | — | — | (21.81)% | 3.70% | 8.39% |
| % Total Annual Operating Expense Ratios3 | Class A | Class C | Class I |
| Gross | 1.65% | 2.40% | 1.40% |
| Net | 1.35 | 2.10 | 1.10 |
Growth of $10,000
This graph shows the change in value of a hypothetical investment of $10,000 in Class A of the Fund for the period indicated. For comparison, the same investment is shown in the indicated index.
| Growth of Investment | Amount Invested | Period Beginning | At NAV | With Maximum Sales Charge |
| Class C | $10,000 | 10/31/2012 | $20,318 | N.A. |
| Class I, at minimum investment | $1,000,000 | 10/31/2012 | $2,212,375 | N.A. |
See Endnotes and Additional Disclosures in this report.
Past performance is no guarantee of future results. Returns are historical and are calculated by determining the percentage change in net asset value (NAV) or offering price (as applicable) with all distributions reinvested. Furthermore, returns do not reflect the deduction of taxes that shareholders may have to pay on Fund distributions or upon the redemption of Fund shares. Investment return and principal value will fluctuate so that shares, when redeemed, may be worth more or less than their original cost. Performance for periods less than or equal to one year is cumulative. Performance is for the stated time period only; due to market volatility, current Fund performance may be lower or higher than the quoted return. For performance as of the most recent month-end, please refer to eatonvance.com.
Eaton Vance
Global Small-Cap Equity Fund
October 31, 2022
| Sector Allocation (% of net assets)1 |
| Country Allocation (% of net assets) |
| Top 10 Holdings (% of net assets)1 |
| CBIZ, Inc. | 2.0% |
| Performance Food Group Co. | 1.8 |
| Ryan Specialty Holdings, Inc., Class A | 1.5 |
| Chemed Corp. | 1.5 |
| RLI Corp. | 1.5 |
| Valvoline, Inc. | 1.5 |
| SouthState Corp. | 1.4 |
| Selective Insurance Group, Inc. | 1.4 |
| M&T Bank Corp. | 1.4 |
| W.R. Berkley Corp. | 1.4 |
| Total | 15.4% |
Footnotes:
| 1 | Excludes cash and cash equivalents. |
Eaton Vance
Global Small-Cap Equity Fund
October 31, 2022
Endnotes and Additional Disclosures
| † | The views expressed in this report are those of the portfolio manager(s) and are current only through the date stated at the top of this page. These views are subject to change at any time based upon market or other conditions, and Eaton Vance and the Fund(s) disclaim any responsibility to update such views. These views may not be relied upon as investment advice and, because investment decisions are based on many factors, may not be relied upon as an indication of trading intent on behalf of any Eaton Vance fund. This commentary may contain statements that are not historical facts, referred to as “forward-looking statements.” The Fund’s actual future results may differ significantly from those stated in any forward-looking statement, depending on factors such as changes in securities or financial markets or general economic conditions, the volume of sales and purchases of Fund shares, the continuation of investment advisory, administrative and service contracts, and other risks discussed from time to time in the Fund’s filings with the Securities and Exchange Commission. |
| | |
| 1 | MSCI World Small Cap Index is an unmanaged index of small-cap equity securities in the developed markets. MSCI indexes are net of foreign withholding taxes. Source: MSCI. MSCI data may not be reproduced or used for any other purpose. MSCI provides no warranties, has not prepared or approved this report, and has no liability hereunder. Unless otherwise stated, index returns do not reflect the effect of any applicable sales charges, commissions, expenses, taxes or leverage, as applicable. It is not possible to invest directly in an index. |
| 2 | Total Returns at NAV do not include applicable sales charges. If sales charges were deducted, the returns would be lower. Total Returns shown with maximum sales charge reflect the stated maximum sales charge. Unless otherwise stated, performance does not reflect the deduction of taxes on Fund distributions or redemptions of Fund shares.Effective November 5, 2020, Class C shares automatically convert to Class A shares eight years after purchase. The average annual total returns listed for Class C reflect conversion to Class A shares after eight years. Prior to November 5, 2020, Class C shares automatically converted to Class A shares ten years after purchase.Prior to August 7, 2015, the Fund’s investment adviser employed an investment objective and strategy of seeking to achieve long-term after-tax returns by investing in value stocks of small-cap companies. From August 7, 2015 until March 1, 2018, the Fund’s investment adviser employed an investment objective and strategy of seeking long-term, after-tax returns by investing in stocks of global small-cap companies. Effective March 1, 2018, the Fund changed its investment objective and strategy to no longer seek after-tax returns. Performance prior to March 1, 2018 reflects the Fund’s performance under its former investment objectives and policies. |
| 3 | Source: Fund prospectus. Net expense ratios reflect a contractual expense reimbursement that continues through 2/28/23. The expense ratios for the current reporting period can be found in the Financial Highlights section of this report. Performance reflects expenses waived and/or reimbursed, if applicable. Without such waivers and/or reimbursements, performance would have been lower. |
| | Fund profile subject to change due to active management. |
| | Additional Information |
| | S&P 500® Index is an unmanaged index of large-cap stocks commonly used as a measure of U.S. stock market performance. S&P Dow Jones Indices are a product of S&P Dow Jones Indices LLC (“S&P DJI”) and have been licensed for use. S&P® and S&P 500® are registered trademarks of S&P DJI; Dow Jones® is a registered trademark of Dow Jones Trademark Holdings LLC (“Dow Jones”); S&P DJI, Dow Jones and their respective affiliates do not sponsor, endorse, sell or promote the Fund, will not have any liability with respect thereto and do not have any liability for any errors, omissions, or interruptions of the S&P Dow Jones Indices. Nasdaq Composite Index is a market capitalization-weighted index of all domestic and international securities listed on Nasdaq. Source: Nasdaq, Inc. The information is provided by Nasdaq (with its affiliates, are referred to as the “Corporations”) and Nasdaq’s third party licensors on an “as is” basis and the Corporations make no guarantees and bear no liability of any kind with respect to the information or the Fund. MSCI Golden Dragon Index is an unmanaged index of common stocks traded in China, Hong Kong and Taiwan. MSCI ACWI Index is an unmanaged free-float-adjusted, market-capitalization-weighted index designed to measure the equity market performance of developed and emerging markets. MSCI EAFE Index is an unmanaged index of equities in the developed markets, excluding the U.S. and Canada. MSCI Emerging Markets Index is an unmanaged index of emerging markets common stocks. |
Eaton Vance
Global Small-Cap Equity Fund
October 31, 2022
Example
As a Fund shareholder, you incur two types of costs: (1) transaction costs, including sales charges (loads) on purchases and redemption fees (if applicable); and (2) ongoing costs, including management fees; distribution and/or service fees; and other Fund expenses. This Example is intended to help you understand your ongoing costs (in dollars) of Fund investing and to compare these costs with the ongoing costs of investing in other mutual funds. The Example is based on an investment of $1,000 invested at the beginning of the period and held for the entire period (May 1, 2022 to October 31, 2022).
Actual Expenses
The first section of the table below provides information about actual account values and actual expenses. You may use the information in this section, together with the amount you invested, to estimate the expenses that you paid over the period. Simply divide your account value by $1,000 (for example, an $8,600 account value divided by $1,000 = 8.6), then multiply the result by the number in the first section under the heading entitled “Expenses Paid During Period” to estimate the expenses you paid on your account during this period.
Hypothetical Example for Comparison Purposes
The second section of the table below provides information about hypothetical account values and hypothetical expenses based on the actual Fund expense ratio and an assumed rate of return of 5% per year (before expenses), which is not the actual Fund return. The hypothetical account values and expenses may not be used to estimate the actual ending account balance or expenses you paid for the period. You may use this information to compare the ongoing costs of investing in your Fund and other funds. To do so, compare this 5% hypothetical example with the 5% hypothetical examples that appear in the shareholder reports of the other funds.
Please note that the expenses shown in the table are meant to highlight your ongoing costs only and do not reflect any transactional costs, such as sales charges (loads) or redemption fees (if applicable). Therefore, the second section of the table is useful in comparing ongoing costs only, and will not help you determine the relative total costs of owning different funds. In addition, if these transactional costs were included, your costs would be higher.
| | Beginning
Account Value
(5/1/22) | Ending
Account Value
(10/31/22) | Expenses Paid
During Period*
(5/1/22 – 10/31/22) | Annualized
Expense
Ratio |
| Actual | | | | |
| Class A | $1,000.00 | $ 912.70 | $ 6.51** | 1.35% |
| Class C | $1,000.00 | $ 909.30 | $10.11** | 2.10% |
| Class I | $1,000.00 | $ 913.70 | $ 5.31** | 1.10% |
| |
| Hypothetical | | | | |
| (5% return per year before expenses) | | | | |
| Class A | $1,000.00 | $1,018.40 | $ 6.87** | 1.35% |
| Class C | $1,000.00 | $1,014.62 | $10.66** | 2.10% |
| Class I | $1,000.00 | $1,019.66 | $ 5.60** | 1.10% |
| * | Expenses are equal to the Fund's annualized expense ratio for the indicated Class, multiplied by the average account value over the period, multiplied by 184/365 (to reflect the one-half year period). The Example assumes that the $1,000 was invested at the net asset value per share determined at the close of business on April 30, 2022. |
| ** | Absent an allocation of certain expenses to an affiliate, expenses would be higher. |
Eaton Vance
Global Small-Cap Equity Fund
October 31, 2022
| Security | Shares | Value |
| Australia — 4.0% |
| BlueScope Steel, Ltd. | | 3,988 | $ 40,159 |
| carsales.com, Ltd. | | 19,497 | 252,561 |
| Data#3, Ltd. | | 24,387 | 107,433 |
| Dicker Data, Ltd. | | 18,575 | 128,018 |
| IGO, Ltd. | | 11,035 | 107,922 |
| Northern Star Resources, Ltd. | | 11,535 | 64,378 |
| OZ Minerals, Ltd. | | 2,742 | 42,457 |
| Steadfast Group, Ltd. | | 42,842 | 138,797 |
| WiseTech Global, Ltd. | | 2,931 | 108,397 |
| | | | $ 990,122 |
| Austria — 0.8% |
| ams-OSRAM AG(1) | | 8,528 | $ 48,272 |
| BAWAG Group AG(2) | | 3,322 | 160,372 |
| | | | $ 208,644 |
| Belgium — 1.1% |
| Azelis Group NV | | 11,939 | $ 273,247 |
| | | | $ 273,247 |
| Canada — 3.3% |
| Agnico Eagle Mines, Ltd. | | 1,169 | $ 51,424 |
| ARC Resources, Ltd. | | 7,396 | 104,125 |
| ATS Automation Tooling Systems, Inc.(1) | | 7,363 | 232,940 |
| CAE, Inc.(1) | | 5,667 | 108,153 |
| Granite Real Estate Investment Trust | | 2,133 | 109,002 |
| Keyera Corp. | | 3,669 | 78,640 |
| Killam Apartment Real Estate Investment Trust | | 8,550 | 99,097 |
| Pan American Silver Corp. | | 1,784 | 28,482 |
| | | | $ 811,863 |
| France — 0.1% |
| Rubis SCA | | 1,450 | $ 32,928 |
| | | | $ 32,928 |
| Ireland — 0.8% |
| Jazz Pharmaceuticals PLC(1) | | 1,422 | $ 204,469 |
| | | | $ 204,469 |
| Italy — 2.5% |
| Amplifon SpA | | 3,810 | $ 94,656 |
| BFF Bank SpA(2) | | 17,164 | 121,085 |
| Security | Shares | Value |
| Italy (continued) |
| DiaSorin SpA | | 789 | $ 103,150 |
| FinecoBank Banca Fineco SpA | | 9,807 | 132,155 |
| MARR SpA | | 9,249 | 97,457 |
| Moncler SpA | | 1,705 | 73,561 |
| | | | $ 622,064 |
| Japan — 10.2% |
| As One Corp. | | 4,775 | $ 203,617 |
| Asahi Intecc Co., Ltd. | | 6,099 | 103,897 |
| Chiba Bank, Ltd. (The) | | 13,763 | 75,409 |
| Cosmos Pharmaceutical Corp. | | 2,130 | 206,002 |
| Fukuoka Financial Group, Inc. | | 4,497 | 76,519 |
| Goldwin, Inc. | | 3,344 | 174,635 |
| JMDC, Inc. | | 2,291 | 81,135 |
| Kose Corp. | | 1,484 | 148,134 |
| Kuraray Co., Ltd. | | 15,624 | 107,439 |
| Kyoritsu Maintenance Co., Ltd. | | 4,196 | 172,858 |
| LaSalle Logiport REIT | | 113 | 120,606 |
| Lion Corp. | | 11,142 | 112,609 |
| Mitsubishi Research Institute, Inc. | | 6,235 | 217,772 |
| Miura Co., Ltd. | | 8,409 | 171,253 |
| Nihon M&A Center Holdings, Inc. | | 14,970 | 168,919 |
| Sanwa Holdings Corp. | | 21,190 | 182,533 |
| Sumco Corp. | | 9,134 | 115,772 |
| Yamaha Corp. | | 2,543 | 96,009 |
| | | | $ 2,535,118 |
| Luxembourg — 0.1% |
| APERAM S.A. | | 1,011 | $ 26,398 |
| | | | $ 26,398 |
| Netherlands — 1.5% |
| BE Semiconductor Industries NV | | 1,757 | $ 89,545 |
| Euronext NV(2) | | 1,618 | 102,693 |
| IMCD NV | | 1,445 | 187,408 |
| | | | $ 379,646 |
| New Zealand — 1.3% |
| EBOS Group, Ltd. | | 5,594 | $ 121,955 |
| Fisher & Paykel Healthcare Corp., Ltd. | | 7,995 | 90,863 |
| Spark New Zealand, Ltd. | | 32,819 | 97,695 |
| | | | $ 310,513 |
| Norway — 0.6% |
| Entra ASA(2) | | 7,075 | $ 64,489 |
8
See Notes to Financial Statements.
Eaton Vance
Global Small-Cap Equity Fund
October 31, 2022
Portfolio of Investments — continued
| Security | Shares | Value |
| Norway (continued) |
| SmartCraft ASA(1) | | 45,305 | $ 69,734 |
| TGS ASA | | 1,845 | 25,119 |
| | | | $ 159,342 |
| Singapore — 0.4% |
| Daiwa House Logistics Trust | | 216,288 | $ 85,535 |
| | | | $ 85,535 |
| Spain — 0.2% |
| Inmobiliaria Colonial Socimi S.A. | | 10,642 | $ 56,124 |
| | | | $ 56,124 |
| Sweden — 0.7% |
| Boliden AB | | 1,662 | $ 48,333 |
| Sdiptech AB, Class B(1) | | 6,037 | 116,405 |
| | | | $ 164,738 |
| Switzerland — 0.9% |
| Galenica AG(2) | | 2,081 | $ 149,516 |
| PolyPeptide Group AG(2) | | 2,231 | 64,870 |
| | | | $ 214,386 |
| United Kingdom — 10.4% |
| Abcam PLC(1) | | 7,426 | $ 114,950 |
| Allfunds Group PLC | | 18,138 | 114,066 |
| Capital & Counties Properties PLC | | 56,279 | 69,027 |
| Capricorn Energy PLC(1) | | 17,448 | 49,563 |
| Cranswick PLC | | 4,824 | 164,700 |
| Dechra Pharmaceuticals PLC | | 4,412 | 132,635 |
| Diploma PLC | | 7,118 | 202,456 |
| DiscoverIE Group PLC | | 27,541 | 235,273 |
| Dr. Martens PLC | | 37,469 | 106,558 |
| Games Workshop Group PLC | | 1,674 | 122,878 |
| Greggs PLC | | 4,570 | 105,939 |
| JTC PLC(2) | | 22,624 | 182,033 |
| Rentokil Initial PLC ADR | | 10,335 | 319,778 |
| RWS Holdings PLC | | 53,027 | 186,432 |
| St. James's Place PLC | | 7,437 | 90,817 |
| Volution Group PLC | | 37,289 | 131,993 |
| Watches of Switzerland Group PLC(1)(2) | | 15,033 | 134,044 |
| Wise PLC, Class A(1) | | 16,762 | 127,673 |
| | | | $ 2,590,815 |
| United States — 60.6% |
| AAON, Inc. | | 4,491 | $ 289,625 |
| Addus HomeCare Corp.(1) | | 1,427 | 146,153 |
| Security | Shares | Value |
| United States (continued) |
| Agiliti, Inc.(1) | | 15,123 | $ 264,199 |
| Alliant Energy Corp. | | 3,418 | 178,317 |
| Altair Engineering, Inc., Class A(1) | | 5,919 | 290,327 |
| Ambarella, Inc.(1) | | 430 | 23,534 |
| Amedisys, Inc.(1) | | 607 | 59,237 |
| AptarGroup, Inc. | | 2,143 | 212,478 |
| Archaea Energy, Inc.(1) | | 5,926 | 152,950 |
| Autoliv, Inc. | | 2,106 | 169,217 |
| AZEK Co., Inc. (The)(1) | | 14,816 | 259,428 |
| Brunswick Corp. | | 1,556 | 109,963 |
| CarGurus, Inc.(1) | | 7,065 | 102,866 |
| CBIZ, Inc.(1) | | 9,959 | 494,365 |
| Ceridian HCM Holding, Inc.(1) | | 1,754 | 116,097 |
| Chart Industries, Inc.(1) | | 1,068 | 238,036 |
| Chemed Corp. | | 823 | 384,234 |
| Clearwater Analytics Holdings, Inc., Class A(1) | | 7,477 | 121,800 |
| CMS Energy Corp. | | 3,001 | 171,207 |
| Commerce Bancshares, Inc. | | 4,902 | 347,258 |
| Cooper Cos., Inc. (The) | | 827 | 226,094 |
| Core & Main, Inc., Class A(1) | | 10,373 | 244,595 |
| CubeSmart | | 5,746 | 240,585 |
| CVB Financial Corp. | | 7,134 | 204,888 |
| Dana, Inc. | | 9,341 | 149,082 |
| Dorman Products, Inc.(1) | | 3,879 | 316,604 |
| EastGroup Properties, Inc. | | 1,771 | 277,498 |
| Envestnet, Inc.(1) | | 4,362 | 215,090 |
| Envista Holdings Corp.(1) | | 7,743 | 255,596 |
| Equity LifeStyle Properties, Inc. | | 3,833 | 245,159 |
| F5, Inc.(1) | | 1,906 | 272,386 |
| Fair Isaac Corp.(1) | | 643 | 307,894 |
| Five Below, Inc.(1) | | 1,253 | 183,377 |
| Floor & Decor Holdings, Inc., Class A(1) | | 977 | 71,683 |
| Generac Holdings, Inc.(1) | | 639 | 74,067 |
| Graco, Inc. | | 4,334 | 301,560 |
| Harley-Davidson, Inc. | | 3,203 | 137,729 |
| Herc Holdings, Inc. | | 974 | 114,552 |
| Hexcel Corp. | | 4,754 | 264,798 |
| Landstar System, Inc. | | 1,236 | 193,088 |
| LPL Financial Holdings, Inc. | | 491 | 125,524 |
| M&T Bank Corp. | | 2,107 | 354,756 |
| MarketAxess Holdings, Inc. | | 632 | 154,233 |
| Middleby Corp.(1) | | 2,379 | 332,727 |
| National Instruments Corp. | | 5,700 | 217,626 |
| nCino, Inc.(1) | | 4,194 | 132,027 |
| Neurocrine Biosciences, Inc.(1) | | 2,159 | 248,544 |
| Nordson Corp. | | 813 | 182,925 |
9
See Notes to Financial Statements.
Eaton Vance
Global Small-Cap Equity Fund
October 31, 2022
Portfolio of Investments — continued
| Security | Shares | Value |
| United States (continued) |
| Performance Food Group Co.(1) | | 8,517 | $ 443,225 |
| Quaker Houghton | | 1,324 | 215,335 |
| R1 RCM, Inc.(1) | | 15,406 | 272,070 |
| Rexford Industrial Realty, Inc. | | 4,322 | 238,920 |
| RH (1) | | 253 | 64,244 |
| RLI Corp. | | 2,952 | 383,967 |
| Ryan Specialty Holdings, Inc., Class A(1) | | 8,610 | 386,159 |
| Selective Insurance Group, Inc. | | 3,631 | 356,129 |
| SouthState Corp. | | 3,951 | 357,289 |
| Stifel Financial Corp. | | 1,591 | 98,435 |
| Tandem Diabetes Care, Inc.(1) | | 2,465 | 138,410 |
| Teleflex, Inc. | | 1,172 | 251,464 |
| Texas Roadhouse, Inc. | | 996 | 98,554 |
| Tradeweb Markets, Inc., Class A | | 2,623 | 144,475 |
| Valvoline, Inc. | | 12,428 | 364,886 |
| Visteon Corp.(1) | | 1,333 | 173,917 |
| W.R. Berkley Corp. | | 4,672 | 347,503 |
| Wintrust Financial Corp. | | 1,862 | 174,320 |
| Woodward, Inc. | | 1,709 | 156,715 |
| Wyndham Hotels & Resorts, Inc. | | 2,985 | 226,651 |
| | | | $15,068,646 |
Total Common Stocks
(identified cost $23,491,765) | | | $24,734,598 |
| Short-Term Investments — 1.1% |
| Security | Shares | Value |
| Morgan Stanley Institutional Liquidity Funds - Government Portfolio, Institutional Class, 2.88%(3) | | 273,997 | $ 273,997 |
Total Short-Term Investments
(identified cost $273,997) | | | $ 273,997 |
| | | |
Total Investments — 100.6%
(identified cost $23,765,762) | | | $25,008,595 |
| Other Assets, Less Liabilities — (0.6)% | | | $ (148,207) |
| Net Assets — 100.0% | | | $24,860,388 |
| The percentage shown for each investment category in the Portfolio of Investments is based on net assets. |
| (1) | Non-income producing security. |
| (2) | Security exempt from registration under Rule 144A of the Securities Act of 1933, as amended. These securities may be sold in certain transactions in reliance on an exemption from registration (normally to qualified institutional buyers). At October 31, 2022, the aggregate value of these securities is $979,102 or 3.9% of the Fund's net assets. |
| (3) | May be deemed to be an affiliated investment company. The rate shown is the annualized seven-day yield as of October 31, 2022. |
| Sector Classification of Portfolio |
| Sector | Percentage
of Net Assets | Value |
| Industrials | 22.8% | $5,663,271 |
| Financials | 18.6 | 4,628,882 |
| Health Care | 14.9 | 3,711,714 |
| Information Technology | 10.9 | 2,709,397 |
| Consumer Discretionary | 10.8 | 2,687,503 |
| Real Estate | 6.5 | 1,606,042 |
| Materials | 5.3 | 1,309,691 |
| Consumer Staples | 4.7 | 1,172,127 |
| Communication Services | 1.8 | 453,122 |
| Energy | 1.7 | 410,397 |
| Utilities | 1.5 | 382,452 |
| Short-Term Investments | 1.1 | 273,997 |
| Total Investments | 100.6% | $25,008,595 |
| Abbreviations: |
| ADR | – American Depositary Receipt |
10
See Notes to Financial Statements.
Eaton Vance
Global Small-Cap Equity Fund
October 31, 2022
Statement of Assets and Liabilities
| | October 31, 2022 |
| Assets | |
| Unaffiliated investments, at value (identified cost $23,491,765) | $ 24,734,598 |
| Affiliated investment, at value (identified cost $273,997) | 273,997 |
| Dividends receivable | 23,187 |
| Dividends receivable from affiliated investment | 737 |
| Receivable for investments sold | 74,875 |
| Receivable for Fund shares sold | 34,008 |
| Tax reclaims receivable | 10,772 |
| Receivable from affiliate | 17,163 |
| Total assets | $25,169,337 |
| Liabilities | |
| Payable for investments purchased | $ 195,408 |
| Payable for Fund shares redeemed | 11,657 |
| Payable to affiliates: | |
| Investment adviser fee | 15,204 |
| Administration fee | 3,049 |
| Distribution and service fees | 4,556 |
| Trustees' fees | 207 |
| Accrued expenses | 78,868 |
| Total liabilities | $ 308,949 |
| Net Assets | $24,860,388 |
| Sources of Net Assets | |
| Paid-in capital | $ 22,962,170 |
| Distributable earnings | 1,898,218 |
| Net Assets | $24,860,388 |
| Class A Shares | |
| Net Assets | $ 17,979,747 |
| Shares Outstanding | 1,432,974 |
Net Asset Value and Redemption Price Per Share
(net assets ÷ shares of beneficial interest outstanding) | $ 12.55 |
Maximum Offering Price Per Share
(100 ÷ 94.75 of net asset value per share) | $ 13.25 |
| Class C Shares | |
| Net Assets | $ 1,080,957 |
| Shares Outstanding | 123,984 |
Net Asset Value and Offering Price Per Share*
(net assets ÷ shares of beneficial interest outstanding) | $ 8.72 |
| Class I Shares | |
| Net Assets | $ 5,799,684 |
| Shares Outstanding | 441,809 |
Net Asset Value, Offering Price and Redemption Price Per Share
(net assets ÷ shares of beneficial interest outstanding) | $ 13.13 |
| On sales of $50,000 or more, the offering price of Class A shares is reduced. |
| * | Redemption price per share is equal to the net asset value less any applicable contingent deferred sales charge. |
11
See Notes to Financial Statements.
Eaton Vance
Global Small-Cap Equity Fund
October 31, 2022
| | Year Ended |
| | October 31, 2022 |
| Investment Income | |
| Dividend income (net of foreign taxes withheld of $24,253) | $ 448,694 |
| Dividend income from affiliated investments | 2,707 |
| Total investment income | $ 451,401 |
| Expenses | |
| Investment adviser fee | $ 243,371 |
| Administration fee | 48,674 |
| Distribution and service fees: | |
| Class A | 56,621 |
| Class C | 15,656 |
| Trustees’ fees and expenses | 2,494 |
| Custodian fee | 44,928 |
| Transfer and dividend disbursing agent fees | 52,950 |
| Legal and accounting services | 48,202 |
| Printing and postage | 6,653 |
| Registration fees | 49,652 |
| Miscellaneous | 16,166 |
| Total expenses | $ 585,367 |
| Deduct: | |
| Waiver and/or reimbursement of expenses by affiliate | $ 156,487 |
| Total expense reductions | $ 156,487 |
| Net expenses | $ 428,880 |
| Net investment income | $ 22,521 |
| Realized and Unrealized Gain (Loss) | |
| Net realized gain (loss): | |
| Investment transactions | $ 909,120 |
| Investment transactions - affiliated investments | 11 |
| Foreign currency transactions | (5,996) |
| Net realized gain | $ 903,135 |
| Change in unrealized appreciation (depreciation): | |
| Investments | $ (9,465,824) |
| Foreign currency | (1,778) |
| Net change in unrealized appreciation (depreciation) | $(9,467,602) |
| Net realized and unrealized loss | $(8,564,467) |
| Net decrease in net assets from operations | $(8,541,946) |
12
See Notes to Financial Statements.
Eaton Vance
Global Small-Cap Equity Fund
October 31, 2022
Statements of Changes in Net Assets
| | Year Ended October 31, |
| | 2022 | 2021 |
| Increase (Decrease) in Net Assets | | |
| From operations: | | |
| Net investment income | $ 22,521 | $ 509 |
| Net realized gain | 903,135 | 6,622,948 |
| Net change in unrealized appreciation (depreciation) | (9,467,602) | 4,940,611 |
| Net increase (decrease) in net assets from operations | $ (8,541,946) | $11,564,068 |
| Distributions to shareholders: | | |
| Class A | $ (3,839,738) | $ (250,535) |
| Class C | (351,503) | (23,929) |
| Class I | (1,563,078) | (127,427) |
| Total distributions to shareholders | $ (5,754,319) | $ (401,891) |
| Transactions in shares of beneficial interest: | | |
| Class A | $ (479,340) | $ (221,589) |
| Class C | (144,215) | (776,713) |
| Class I | (2,389,961) | 286,473 |
| Net decrease in net assets from Fund share transactions | $ (3,013,516) | $ (711,829) |
| Net increase (decrease) in net assets | $(17,309,781) | $10,450,348 |
| Net Assets | | |
| At beginning of year | $ 42,170,169 | $ 31,719,821 |
| At end of year | $ 24,860,388 | $42,170,169 |
13
See Notes to Financial Statements.
Eaton Vance
Global Small-Cap Equity Fund
October 31, 2022
| | Class A |
| | Year Ended October 31, |
| | 2022 | 2021 | 2020 | 2019 | 2018 |
| Net asset value — Beginning of year | $ 18.820 | $ 13.990 | $ 14.050 | $ 13.770 | $ 14.010 |
| Income (Loss) From Operations | | | | | |
| Net investment income (loss)(1) | $ 0.007 | $ (0.006) | $ —(2) | $ 0.045 | $ 0.001 |
| Net realized and unrealized gain (loss) | (3.702) | 5.000 | 0.438 | 1.384 | 0.128 |
| Total income (loss) from operations | $ (3.695) | $ 4.994 | $ 0.438 | $ 1.429 | $ 0.129 |
| Less Distributions | | | | | |
| From net investment income | $ (0.030) | $ (0.005) | $ (0.071) | $ (0.030) | $ (0.072) |
| From net realized gain | (2.545) | (0.159) | (0.427) | (1.119) | (0.297) |
| Total distributions | $ (2.575) | $ (0.164) | $ (0.498) | $ (1.149) | $ (0.369) |
| Net asset value — End of year | $12.550 | $18.820 | $13.990 | $14.050 | $13.770 |
| Total Return(3)(4) | (22.54)% | 35.88% | 2.98% | 12.20% | 0.84% |
| Ratios/Supplemental Data | | | | | |
| Net assets, end of year (000’s omitted) | $ 17,980 | $ 28,269 | $ 21,164 | $ 24,111 | $ 22,341 |
| Ratios (as a percentage of average daily net assets):(5) | | | | | |
| Expenses (4) | 1.35% (6) | 1.35% | 1.35% | 1.35% | 1.36% |
| Net investment income (loss) | 0.05% | (0.04)% | 0.00% (7) | 0.34% | 0.01% |
| Portfolio Turnover of the Portfolio(8) | — | — | — | — | 11% (9) |
| Portfolio Turnover of the Fund | 45% | 58% | 51% | 50% | 41% (9)(10) |
| (1) | Computed using average shares outstanding. |
| (2) | Amount is less than $0.0005. |
| (3) | Returns are historical and are calculated by determining the percentage change in net asset value with all distributions reinvested and do not reflect the effect of sales charges. |
| (4) | The investment adviser of the Portfolio and/or the administrator of the Fund reimbursed certain operating expenses (equal to 0.48%, 0.30%, 0.48%, 0.58% and 0.62% of average daily net assets for the years ended October 31, 2022, 2021, 2020, 2019 and 2018, respectively). Absent this reimbursement, total return would be lower. |
| (5) | Includes the Fund’s share of the Portfolio’s allocated expenses for the period while the Fund was investing in the Portfolio. |
| (6) | Includes a reduction by the investment adviser of a portion of its adviser fee due to the Fund’s investment in the Liquidity Fund (equal to less than 0.005% of average daily net assets for the year ended October 31, 2022). |
| (7) | Amount is less than 0.005%. |
| (8) | Portfolio turnover represents the rate of portfolio activity for the period while the Fund was investing in the Portfolio. |
| (9) | Not annualized. |
| (10) | For the period from January 22, 2018 through October 31, 2018 when the Fund was making investments directly in securities. |
References to Portfolio herein are to Tax-Managed Global Small-Cap Portfolio, a Massachusetts business trust in which the Fund invested all of its investable assets prior to the close of business on January 19, 2018 and which had the same investment objective and policies as the Fund during such period.
14
See Notes to Financial Statements.
Eaton Vance
Global Small-Cap Equity Fund
October 31, 2022
Financial Highlights — continued
| | Class C |
| | Year Ended October 31, |
| | 2022 | 2021 | 2020 | 2019 | 2018 |
| Net asset value — Beginning of year | $13.870 | $ 10.420 | $ 10.590 | $ 10.690 | $ 10.970 |
| Income (Loss) From Operations | | | | | |
| Net investment loss(1) | $ (0.071) | $ (0.103) | $ (0.076) | $ (0.046) | $ (0.087) |
| Net realized and unrealized gain (loss) | (2.597) | 3.712 | 0.333 | 1.030 | 0.104 |
| Total income (loss) from operations | $ (2.668) | $ 3.609 | $ 0.257 | $ 0.984 | $ 0.017 |
| Less Distributions | | | | | |
| From net realized gain | $ (2.482) | $ (0.159) | $ (0.427) | $ (1.084) | $ (0.297) |
| Total distributions | $ (2.482) | $ (0.159) | $ (0.427) | $ (1.084) | $ (0.297) |
| Net asset value — End of year | $ 8.720 | $13.870 | $10.420 | $10.590 | $10.690 |
| Total Return(2)(3) | (23.12)% | 34.86% | 2.25% | 11.32% | 0.06% |
| Ratios/Supplemental Data | | | | | |
| Net assets, end of year (000’s omitted) | $ 1,081 | $ 1,995 | $ 2,202 | $ 3,227 | $ 8,988 |
| Ratios (as a percentage of average daily net assets):(4) | | | | | |
| Expenses (3) | 2.10% (5) | 2.10% | 2.10% | 2.10% | 2.11% |
| Net investment loss | (0.70)% | (0.79)% | (0.75)% | (0.45)% | (0.76)% |
| Portfolio Turnover of the Portfolio(6) | — | — | — | — | 11% (7) |
| Portfolio Turnover of the Fund | 45% | 58% | 51% | 50% | 41% (7)(8) |
| (1) | Computed using average shares outstanding. |
| (2) | Returns are historical and are calculated by determining the percentage change in net asset value with all distributions reinvested and do not reflect the effect of sales charges. |
| (3) | The investment adviser of the Portfolio and/or the administrator of the Fund reimbursed certain operating expenses (equal to 0.48%, 0.30%, 0.48%, 0.58% and 0.62% of average daily net assets for the years ended October 31, 2022, 2021, 2020, 2019 and 2018, respectively). Absent this reimbursement, total return would be lower. |
| (4) | Includes the Fund’s share of the Portfolio’s allocated expenses for the period while the Fund was investing in the Portfolio. |
| (5) | Includes a reduction by the investment adviser of a portion of its adviser fee due to the Fund’s investment in the Liquidity Fund (equal to less than 0.005% of average daily net assets for the year ended October 31, 2022). |
| (6) | Portfolio turnover represents the rate of portfolio activity for the period while the Fund was investing in the Portfolio. |
| (7) | Not annualized. |
| (8) | For the period from January 22, 2018 through October 31, 2018 when the Fund was making investments directly in securities. |
References to Portfolio herein are to Tax-Managed Global Small-Cap Portfolio, a Massachusetts business trust in which the Fund invested all of its investable assets prior to the close of business on January 19, 2018 and which had the same investment objective and policies as the Fund during such period.
15
See Notes to Financial Statements.
Eaton Vance
Global Small-Cap Equity Fund
October 31, 2022
Financial Highlights — continued
| | Class I |
| | Year Ended October 31, |
| | 2022 | 2021 | 2020 | 2019 | 2018 |
| Net asset value — Beginning of year | $ 19.570 | $ 14.530 | $ 14.580 | $ 14.240 | $ 14.480 |
| Income (Loss) From Operations | | | | | |
| Net investment income(1) | $ 0.042 | $ 0.039 | $ 0.034 | $ 0.079 | $ 0.040 |
| Net realized and unrealized gain (loss) | (3.862) | 5.201 | 0.450 | 1.442 | 0.123 |
| Total income (loss) from operations | $ (3.820) | $ 5.240 | $ 0.484 | $ 1.521 | $ 0.163 |
| Less Distributions | | | | | |
| From net investment income | $ (0.075) | $ (0.041) | $ (0.107) | $ (0.062) | $ (0.106) |
| From net realized gain | (2.545) | (0.159) | (0.427) | (1.119) | (0.297) |
| Total distributions | $ (2.620) | $ (0.200) | $ (0.534) | $ (1.181) | $ (0.403) |
| Net asset value — End of year | $13.130 | $19.570 | $14.530 | $14.580 | $14.240 |
| Total Return(2)(3) | (22.34)% | 36.28% | 3.18% | 12.51% | 1.05% |
| Ratios/Supplemental Data | | | | | |
| Net assets, end of year (000’s omitted) | $ 5,800 | $ 11,906 | $ 8,354 | $ 9,273 | $ 9,078 |
| Ratios (as a percentage of average daily net assets):(4) | | | | | |
| Expenses (3) | 1.10% (5) | 1.10% | 1.10% | 1.10% | 1.11% |
| Net investment income | 0.27% | 0.21% | 0.24% | 0.57% | 0.27% |
| Portfolio Turnover of the Portfolio(6) | — | — | — | — | 11% (7) |
| Portfolio Turnover of the Fund | 45% | 58% | 51% | 50% | 41% (7)(8) |
| (1) | Computed using average shares outstanding. |
| (2) | Returns are historical and are calculated by determining the percentage change in net asset value with all distributions reinvested. |
| (3) | The investment adviser of the Portfolio and/or the administrator of the Fund reimbursed certain operating expenses (equal to 0.48%, 0.30%, 0.48%, 0.58% and 0.62% of average daily net assets for the years ended October 31, 2022, 2021, 2020, 2019 and 2018, respectively). Absent this reimbursement, total return would be lower. |
| (4) | Includes the Fund’s share of the Portfolio’s allocated expenses for the period while the Fund was investing in the Portfolio. |
| (5) | Includes a reduction by the investment adviser of a portion of its adviser fee due to the Fund’s investment in the Liquidity Fund (equal to less than 0.005% of average daily net assets for the year ended October 31, 2022). |
| (6) | Portfolio turnover represents the rate of portfolio activity for the period while the Fund was investing in the Portfolio. |
| (7) | Not annualized. |
| (8) | For the period from January 22, 2018 through October 31, 2018 when the Fund was making investments directly in securities. |
References to Portfolio herein are to Tax-Managed Global Small-Cap Portfolio, a Massachusetts business trust in which the Fund invested all of its investable assets prior to the close of business on January 19, 2018 and which had the same investment objective and policies as the Fund during such period.
16
See Notes to Financial Statements.
Eaton Vance
Global Small-Cap Equity Fund
October 31, 2022
Notes to Financial Statements
1 Significant Accounting Policies
Eaton Vance Global Small-Cap Equity Fund (the Fund) is a diversified series of Eaton Vance Mutual Funds Trust (the Trust). The Trust is a Massachusetts business trust registered under the Investment Company Act of 1940, as amended (the 1940 Act), as an open-end management investment company. The Fund’s investment objective is to seek long-term total return. The Fund offers three classes of shares. Class A shares are generally sold subject to a sales charge imposed at time of purchase. Class C shares are sold at net asset value and are generally subject to a contingent deferred sales charge (see Note 5). Effective November 5, 2020, Class C shares automatically convert to Class A shares eight years after their purchase as described in the Fund’s prospectus. Class I shares are sold at net asset value and are not subject to a sales charge. Each class represents a pro-rata interest in the Fund, but votes separately on class-specific matters and (as noted below) is subject to different expenses. Realized and unrealized gains and losses and net investment income and losses, other than class-specific expenses, are allocated daily to each class of shares based on the relative net assets of each class to the total net assets of the Fund. Each class of shares differs in its distribution plan and certain other class-specific expenses.
The following is a summary of significant accounting policies of the Fund. The policies are in conformity with accounting principles generally accepted in the United States of America (U.S. GAAP). The Fund is an investment company and follows accounting and reporting guidance in the Financial Accounting Standards Board (FASB) Accounting Standards Codification Topic 946.
A Investment Valuation—The following methodologies are used to determine the market value or fair value of investments.
Equity Securities. Equity securities listed on a U.S. securities exchange generally are valued at the last sale or closing price on the day of valuation or, if no sales took place on such date, at the mean between the closing bid and ask prices on the exchange where such securities are principally traded. Equity securities listed on the NASDAQ National Market System are valued at the NASDAQ official closing price. Unlisted or listed securities for which closing sales prices or closing quotations are not available are valued at the mean between the latest available bid and ask prices.
Foreign Securities and Currencies. Foreign securities and currencies are valued in U.S. dollars, based on foreign currency exchange rate quotations supplied by a third party pricing service. The pricing service uses a proprietary model to determine the exchange rate. Inputs to the model include reported trades and implied bid/ask spreads. The daily valuation of exchange-traded foreign securities generally is determined as of the close of trading on the principal exchange on which such securities trade. Events occurring after the close of trading on foreign exchanges may result in adjustments to the valuation of foreign securities to more accurately reflect their fair value as of the close of regular trading on the New York Stock Exchange. When valuing foreign equity securities that meet certain criteria, the Fund's Trustees have approved the use of a fair value service that values such securities to reflect market trading that occurs after the close of the applicable foreign markets of comparable securities or other instruments that have a strong correlation to the fair-valued securities.
Other. Investments in management investment companies (including money market funds) that do not trade on an exchange are valued at the net asset value as of the close of each business day.
Fair Valuation. In connection with Rule 2a-5 of the 1940 Act, which became effective September 8, 2022, the Trustees have designated the Fund’s investment adviser as its valuation designee. Investments for which valuations or market quotations are not readily available or are deemed unreliable are valued by the investment adviser, as valuation designee, at fair value using methods that most fairly reflect the security’s “fair value”, which is the amount that the Fund might reasonably expect to receive for the security upon its current sale in the ordinary course. Each such determination is based on a consideration of relevant factors, which are likely to vary from one pricing context to another. These factors may include, but are not limited to, the type of security, the existence of any contractual restrictions on the security’s disposition, the price and extent of public trading in similar securities of the issuer or of comparable companies or entities, quotations or relevant information obtained from broker/dealers or other market participants, information obtained from the issuer, analysts, and/or the appropriate stock exchange (for exchange-traded securities), an analysis of the company’s or entity’s financial statements, and an evaluation of the forces that influence the issuer and the market(s) in which the security is purchased and sold.
B Investment Transactions—Investment transactions for financial statement purposes are accounted for on a trade date basis. Realized gains and losses on investments sold are determined on the basis of identified cost.
C Income—Dividend income is recorded on the ex-dividend date for dividends received in cash and/or securities. However, if the ex-dividend date has passed, certain dividends from foreign securities are recorded as the Fund is informed of the ex-dividend date. Withholding taxes on foreign dividends and capital gains have been provided for in accordance with the Fund's understanding of the applicable countries’ tax rules and rates. Distributions from investment companies are recorded as dividend income, capital gains or return of capital based on the nature of the distribution.
D Federal Taxes—The Fund's policy is to comply with the provisions of the Internal Revenue Code applicable to regulated investment companies and to distribute to shareholders each year substantially all of its net investment income, and all or substantially all of its net realized capital gains. Accordingly, no provision for federal income or excise tax is necessary.
As of October 31, 2022, the Fund had no uncertain tax positions that would require financial statement recognition, de-recognition, or disclosure. The Fund files a U.S. federal income tax return annually after its fiscal year-end, which is subject to examination by the Internal Revenue Service for a period of three years from the date of filing.
Eaton Vance
Global Small-Cap Equity Fund
October 31, 2022
Notes to Financial Statements — continued
E Expenses—The majority of expenses of the Trust are directly identifiable to an individual fund. Expenses which are not readily identifiable to a specific fund are allocated taking into consideration, among other things, the nature and type of expense and the relative size of the funds.
F Foreign Currency Translation—Investment valuations, other assets, and liabilities initially expressed in foreign currencies are translated each business day into U.S. dollars based upon current exchange rates. Purchases and sales of foreign investment securities and income and expenses denominated in foreign currencies are translated into U.S. dollars based upon currency exchange rates in effect on the respective dates of such transactions. Recognized gains or losses on investment transactions attributable to changes in foreign currency exchange rates are recorded for financial statement purposes as net realized gains and losses on investments. That portion of unrealized gains and losses on investments that results from fluctuations in foreign currency exchange rates is not separately disclosed.
G Use of Estimates—The preparation of the financial statements in conformity with U.S. GAAP requires management to make estimates and assumptions that affect the reported amounts of assets and liabilities at the date of the financial statements and the reported amounts of income and expense during the reporting period. Actual results could differ from those estimates.
H Indemnifications—Under the Trust’s organizational documents, its officers and Trustees may be indemnified against certain liabilities and expenses arising out of the performance of their duties to the Fund. Under Massachusetts law, if certain conditions prevail, shareholders of a Massachusetts business trust (such as the Trust) could be deemed to have personal liability for the obligations of the Trust. However, the Trust’s Declaration of Trust contains an express disclaimer of liability on the part of Fund shareholders and the By-laws provide that the Trust shall assume, upon request by the shareholder, the defense on behalf of any Fund shareholders. Moreover, the By-laws also provide for indemnification out of Fund property of any shareholder held personally liable solely by reason of being or having been a shareholder for all loss or expense arising from such liability. Additionally, in the normal course of business, the Fund enters into agreements with service providers that may contain indemnification clauses. The Fund’s maximum exposure under these arrangements is unknown as this would involve future claims that may be made against the Fund that have not yet occurred.
2 Distributions to Shareholders and Income Tax Information
It is the present policy of the Fund to make at least one distribution annually (normally in December) of all or substantially all of its net investment income and to distribute annually all or substantially all of its net realized capital gains. Distributions to shareholders are recorded on the ex-dividend date. Distributions are declared separately for each class of shares. Shareholders may reinvest income and capital gain distributions in additional shares of the same class of the Fund at the net asset value as of the ex-dividend date or, at the election of the shareholder, receive distributions in cash. Distributions to shareholders are determined in accordance with income tax regulations, which may differ from U.S. GAAP. As required by U.S. GAAP, only distributions in excess of tax basis earnings and profits are reported in the financial statements as a return of capital. Permanent differences between book and tax accounting relating to distributions are reclassified to paid-in capital. For tax purposes, distributions from short-term capital gains are considered to be from ordinary income.
The tax character of distributions declared for the years ended October 31, 2022 and October 31, 2021 was as follows:
| | Year Ended October 31, |
| | 2022 | 2021 |
| Ordinary income | $1,505,681 | $ 34,402 |
| Long-term capital gains | $4,248,638 | $367,489 |
During the year ended October 31, 2022, distributable earnings was decreased by $373,554 and paid-in capital was increased by $373,554 due to the Fund’s use of equalization accounting and other differences between book and tax accounting. Tax equalization accounting allows the Fund to treat as a distribution that portion of redemption proceeds representing a redeeming shareholder’s portion of undistributed taxable income and net capital gains. These reclassifications had no effect on the net assets or net asset value per share of the Fund.
As of October 31, 2022, the components of distributable earnings (accumulated loss) on a tax basis were as follows:
| Undistributed ordinary income | $ 34,977 |
| Undistributed long-term capital gains | 936,209 |
| Net unrealized appreciation | 927,032 |
| Distributable earnings | $1,898,218 |
Eaton Vance
Global Small-Cap Equity Fund
October 31, 2022
Notes to Financial Statements — continued
The cost and unrealized appreciation (depreciation) of investments of the Fund at October 31, 2022, as determined on a federal income tax basis, were as follows:
| Aggregate cost | $ 24,080,141 |
| Gross unrealized appreciation | $ 3,824,629 |
| Gross unrealized depreciation | (2,896,175) |
| Net unrealized appreciation | $ 928,454 |
3 Investment Adviser Fee and Other Transactions with Affiliates
The investment adviser fee is earned by Boston Management and Research (BMR), an indirect, wholly-owned subsidiary of Morgan Stanley, as compensation for investment advisory services rendered to the Fund. The fee is computed at an annual rate as a percentage of average daily net assets as follows and is payable monthly:
| Average Daily Net Assets | Annual Fee Rate |
| Up to $500 million | 0.750% |
| $500 million but less than $1 billion | 0.725% |
| $1 billion but less than $2.5 billion | 0.700% |
| $2.5 billion but less than $5 billion | 0.680% |
| $5 billion and over | 0.665% |
For the year ended October 31, 2022, the investment adviser fee amounted to $243,371 or 0.75% of the Fund’s average daily net assets. Effective April 26, 2022, the Fund may invest in a money market fund, the Institutional Class of the Morgan Stanley Institutional Liquidity Funds - Government Portfolio (the "Liquidity Fund"), an open-end management investment company managed by Morgan Stanley Investment Management Inc., a wholly-owned subsidiary of Morgan Stanley. The investment adviser fee paid by the Fund is reduced by an amount equal to its pro-rata share of the advisory and administration fees paid by the Fund due to its investment in the Liquidity Fund. For the year ended October 31, 2022, the investment adviser fee paid was reduced by $189 relating to the Fund's investment in the Liquidity Fund. Prior to April 26, 2022, the Fund may have invested its cash in Eaton Vance Cash Reserves Fund, LLC (Cash Reserves Fund), an affiliated investment company managed by Eaton Vance Management (EVM). EVM did not receive a fee for advisory services provided to Cash Reserves Fund.
Pursuant to an investment sub-advisory agreement, BMR has delegated the investment management of the Fund to Eaton Vance Advisers International Ltd. (EVAIL), an affiliate of BMR and an indirect, wholly-owned subsidiary of Morgan Stanley. EVAIL uses the portfolio management, research and other resources of its affiliate, MSIM Fund Management (Ireland) Limited (MSIM FMIL) to render investment advisory services to the Fund. MSIM FMIL has entered into a Memorandum of Understanding with EVAIL pursuant to which MSIM FMIL is considered a participating affiliate of the sub-adviser as that term is used in relief granted by the staff of the U.S. Securities and Exchange Commission allowing U.S. registered investment advisers to use portfolio management or research resources of unregistered advisory affiliates subject to the supervision of a U.S. registered adviser. BMR pays EVAIL a portion of its investment adviser fee for subadvisory services provided to the Fund.
The administration fee is earned by EVM, an affiliate of BMR and an indirect, wholly-owned subsidiary of Morgan Stanley, as compensation for administrative services rendered to the Fund. The fee is computed at an annual rate of 0.15% of the Fund’s average daily net assets. For the year ended October 31, 2022, the administration fee amounted to $48,674. EVM has agreed to reimburse the Fund’s expenses to the extent that total annual operating expenses (related to ordinary operating expenses only) exceed 1.35%, 2.10% and 1.10% of the Fund’s average daily net assets for Class A, Class C and Class I, respectively. This agreement may be changed or terminated after February 28, 2023. Pursuant to this agreement, EVM was allocated $156,298 of the Fund’s operating expenses for the year ended October 31, 2022.
EVM provides sub-transfer agency and related services to the Fund pursuant to a Sub-Transfer Agency Support Services Agreement. For the year ended October 31, 2022, EVM earned $14,547 from the Fund pursuant to such agreement, which is included in transfer and dividend disbursing agent fees on the Statement of Operations. The Fund was informed that Eaton Vance Distributors, Inc. (EVD), an affiliate of EVM and the Fund’s principal underwriter, received $907 as its portion of the sales charge on sales of Class A shares for the year ended October 31, 2022. EVD also received distribution and service fees from Class A and Class C shares (see Note 4) and contingent deferred sales charges (see Note 5).
Eaton Vance
Global Small-Cap Equity Fund
October 31, 2022
Notes to Financial Statements — continued
Trustees and officers of the Fund who are members of EVM’s or BMR’s organizations receive remuneration for their services to the Fund out of the investment adviser fee. Trustees of the Fund who are not affiliated with the investment adviser may elect to defer receipt of all or a percentage of their annual fees in accordance with the terms of the Trustees Deferred Compensation Plan. For the year ended October 31, 2022, no significant amounts have been deferred. Certain officers and Trustees of the Fund are officers of the above organizations.
4 Distribution Plans
The Fund has in effect a distribution plan for Class A shares (Class A Plan) pursuant to Rule 12b-1 under the 1940 Act. Pursuant to the Class A Plan, the Fund pays EVD a distribution and service fee of 0.25% per annum of its average daily net assets attributable to Class A shares for distribution services and facilities provided to the Fund by EVD, as well as for personal services and/or the maintenance of shareholder accounts. Distribution and service fees paid or accrued to EVD for the year ended October 31, 2022 amounted to $56,621 for Class A shares.
The Fund also has in effect a distribution plan for Class C shares (Class C Plan) pursuant to Rule 12b-1 under the 1940 Act. Pursuant to the Class C Plan, the Fund pays EVD amounts equal to 0.75% per annum of its average daily net assets attributable to Class C shares for providing ongoing distribution services and facilities to the Fund. For the year ended October 31, 2022, the Fund paid or accrued to EVD $11,742 for Class C shares.
Pursuant to the Class C Plan, the Fund also makes payments of service fees to EVD, financial intermediaries and other persons in amounts equal to 0.25% per annum of its average daily net assets attributable to that class. Service fees paid or accrued are for personal services and/or the maintenance of shareholder accounts. They are separate and distinct from the sales commissions and distribution fees payable to EVD. Service fees paid or accrued for the year ended October 31, 2022 amounted to $3,914 for Class C shares.
Distribution and service fees are subject to the limitations contained in the Financial Industry Regulatory Authority Rule 2341(d).
5 Contingent Deferred Sales Charges
A contingent deferred sales charge (CDSC) of 1% generally is imposed on redemptions of Class C shares made within 12 months of purchase. Class A shares may be subject to a 1% CDSC if redeemed within 12 months of purchase (18 months of purchase prior to April 29, 2022) (depending on the circumstances of purchase). Generally, the CDSC is based upon the lower of the net asset value at date of redemption or date of purchase. No charge is levied on shares acquired by reinvestment of dividends or capital gain distributions. For the year ended October 31, 2022, the Fund was informed that EVD received approximately $200 of CDSCs paid by Class C shareholders and no CDSCs paid by Class A shareholders.
6 Purchases and Sales of Investments
Purchases and sales of investments, other than short-term obligations, aggregated $14,660,383 and $23,035,899, respectively, for the year ended October 31, 2022.
7 Shares of Beneficial Interest
The Fund’s Declaration of Trust permits the Trustees to issue an unlimited number of full and fractional shares of beneficial interest (without par value). Such shares may be issued in a number of different series (such as the Fund) and classes. Transactions in Fund shares, including direct exchanges pursuant to share class conversions for all periods presented, were as follows:
| | Year Ended
October 31, 2022 | | Year Ended
October 31, 2021 |
| | Shares | Amount | | Shares | Amount |
| Class A | | | | | |
| Sales | 77,477 | $ 1,127,641 | | 163,318 | $ 2,800,707 |
| Issued to shareholders electing to receive payments of distributions in Fund shares | 222,819 | 3,549,501 | | 14,246 | 231,789 |
| Redemptions | (369,251) | (5,156,482) | | (188,839) | (3,254,085) |
| Net decrease | (68,955) | $ (479,340) | | (11,275) | $ (221,589) |
Eaton Vance
Global Small-Cap Equity Fund
October 31, 2022
Notes to Financial Statements — continued
| | Year Ended
October 31, 2022 | | Year Ended
October 31, 2021 |
| | Shares | Amount | | Shares | Amount |
| Class C | | | | | |
| Sales | 9,484 | $ 99,315 | | 34,300 | $ 460,944 |
| Issued to shareholders electing to receive payments of distributions in Fund shares | 31,457 | 350,428 | | 1,973 | 23,815 |
| Redemptions | (60,810) | (593,958) | | (103,777) | (1,261,472) |
| Net decrease | (19,869) | $ (144,215) | | (67,504) | $ (776,713) |
| Class I | | | | | |
| Sales | 90,384 | $ 1,364,487 | | 251,927 | $ 4,416,545 |
| Issued to shareholders electing to receive payments of distributions in Fund shares | 92,437 | 1,537,221 | | 7,454 | 125,831 |
| Redemptions | (349,307) | (5,291,669) | | (225,854) | (4,255,903) |
| Net increase (decrease) | (166,486) | $(2,389,961) | | 33,527 | $ 286,473 |
8 Line of Credit
The Fund participates with other portfolios and funds managed by EVM and its affiliates in a $725 million unsecured line of credit agreement with a group of banks, which is in effect through October 24, 2023. In connection with the renewal of the agreement on October 25, 2022, the borrowing limit was decreased from $800 million. Borrowings are made by the Fund solely for temporary purposes related to redemptions and other short-term cash needs. Interest is charged to the Fund based on its borrowings at an amount above either the Secured Overnight Financing Rate (SOFR) or Federal Funds rate. In addition, a fee computed at an annual rate of 0.15% on the daily unused portion of the line of credit is allocated among the participating portfolios and funds at the end of each quarter. Also in connection with the renewal of the agreement, an arrangement fee totaling $150,000 was incurred that was allocated to the participating portfolios and funds. Because the line of credit is not available exclusively to the Fund, it may be unable to borrow some or all of its requested amounts at any particular time. The Fund did not have any significant borrowings or allocated fees during the year ended October 31, 2022.
9 Investments in Affiliated Funds
At October 31, 2022, the value of the Fund's investment in funds that may be deemed to be affiliated was $273,997, which represents 1.1% of the Fund's net assets. Transactions in affiliated funds by the Fund for the year ended October 31, 2022 were as follows:
| Name | Value,
beginning
of period | Purchases | Sales
proceeds | Net
realized
gain (loss) | Change in
unrealized
appreciation
(depreciation) | Value, end
of period | Dividend
income | Units/Shares,
end of period |
| Short-Term Investments |
| Cash Reserves Fund | $651,529 | $3,154,751 | $(3,806,291) | $ 11 | $ — | $ — | $ 74 | — |
| Liquidity Fund | — | 3,099,371 | (2,825,374) | — | — | 273,997 | 2,633 | 273,997 |
| Total | | | | $ 11 | $ — | $273,997 | $2,707 | |
Eaton Vance
Global Small-Cap Equity Fund
October 31, 2022
Notes to Financial Statements — continued
10 Fair Value Measurements
Under generally accepted accounting principles for fair value measurements, a three-tier hierarchy to prioritize the assumptions, referred to as inputs, is used in valuation techniques to measure fair value. The three-tier hierarchy of inputs is summarized in the three broad levels listed below.
| • | Level 1 – quoted prices in active markets for identical investments |
| • | Level 2 – other significant observable inputs (including quoted prices for similar investments, interest rates, prepayment speeds, credit risk, etc.) |
| • | Level 3 – significant unobservable inputs (including a fund's own assumptions in determining the fair value of investments) |
In cases where the inputs used to measure fair value fall in different levels of the fair value hierarchy, the level disclosed is determined based on the lowest level input that is significant to the fair value measurement in its entirety. The inputs or methodology used for valuing securities are not necessarily an indication of the risk associated with investing in those securities.
At October 31, 2022, the hierarchy of inputs used in valuing the Fund's investments, which are carried at value, were as follows:
| Asset Description | Level 1 | Level 2 | Level 3 | Total |
| Common Stocks: | | | | |
| Asia/Pacific | $ — | $ 3,921,288 | $ — | $ 3,921,288 |
| Developed Europe | 524,247 | 4,408,554 | — | 4,932,801 |
| North America | 15,880,509 | — | — | 15,880,509 |
| Total Common Stocks | $16,404,756 | $8,329,842* | $ — | $24,734,598 |
| Short-Term Investments | $ 273,997 | $ — | $ — | $ 273,997 |
| Total Investments | $16,678,753 | $8,329,842 | $ — | $25,008,595 |
| * | Includes foreign equity securities whose values were adjusted to reflect market trading of comparable securities or other correlated instruments that occurred after the close of trading in their applicable foreign markets. |
11 Risks and Uncertainties
Risks Associated with Foreign Investments
Foreign investments can be adversely affected by political, economic and market developments abroad, including the imposition of economic and other sanctions by the United States or another country. There may be less publicly available information about foreign issuers because they may not be subject to reporting practices, requirements or regulations comparable to those to which United States companies are subject. Foreign markets may be smaller, less liquid and more volatile than the major markets in the United States. Trading in foreign markets typically involves higher expense than trading in the United States. The Fund may have difficulties enforcing its legal or contractual rights in a foreign country. Securities that trade or are denominated in currencies other than the U.S. dollar may be adversely affected by fluctuations in currency exchange rates.
Pandemic Risk
An outbreak of respiratory disease caused by a novel coronavirus was first detected in China in late 2019 and subsequently spread internationally. This coronavirus has resulted in closing borders, enhanced health screenings, changes to healthcare service preparation and delivery, quarantines, cancellations, disruptions to supply chains and customer activity, as well as general concern and uncertainty. Health crises caused by outbreaks of disease, such as the coronavirus outbreak, may exacerbate other pre-existing political, social and economic risks and disrupt normal market conditions and operations. The impact of this outbreak has negatively affected the worldwide economy, as well as the economies of individual countries and industries, and could continue to affect the market in significant and unforeseen ways. Other epidemics and pandemics that may arise in the future may have similar effects. Any such impact could adversely affect the Fund's performance, or the performance of the securities in which the Fund invests.
Eaton Vance
Global Small-Cap Equity Fund
October 31, 2022
Report of Independent Registered Public Accounting Firm
To the Trustees of Eaton Vance Mutual Funds Trust and Shareholders of Eaton Vance Global Small-Cap Equity Fund:
Opinion on the Financial Statements and Financial Highlights
We have audited the accompanying statement of assets and liabilities of Eaton Vance Global Small-Cap Equity Fund (one of the funds constituting Eaton Vance Mutual Funds Trust) (the “Fund”), including the portfolio of investments, as of October 31, 2022, the related statement of operations for the year then ended, the statements of changes in net assets for each of the two years in the period then ended, the financial highlights for each of the five years in the period then ended, and the related notes. In our opinion, the financial statements and financial highlights present fairly, in all material respects, the financial position of the Fund as of October 31, 2022, and the results of its operations for the year then ended, the changes in its net assets for each of the two years in the period then ended, and the financial highlights for each of the five years in the period then ended, in conformity with accounting principles generally accepted in the United States of America.
Basis for Opinion
These financial statements and financial highlights are the responsibility of the Fund's management. Our responsibility is to express an opinion on the Fund's financial statements and financial highlights based on our audits. We are a public accounting firm registered with the Public Company Accounting Oversight Board (United States) (PCAOB) and are required to be independent with respect to the Fund in accordance with the U.S. federal securities laws and the applicable rules and regulations of the Securities and Exchange Commission and the PCAOB.
We conducted our audits in accordance with the standards of the PCAOB. Those standards require that we plan and perform the audit to obtain reasonable assurance about whether the financial statements and financial highlights are free of material misstatement, whether due to error or fraud. The Fund is not required to have, nor were we engaged to perform, an audit of its internal control over financial reporting. As part of our audits, we are required to obtain an understanding of internal control over financial reporting but not for the purpose of expressing an opinion on the effectiveness of the Fund’s internal control over financial reporting. Accordingly, we express no such opinion.
Our audits included performing procedures to assess the risks of material misstatement of the financial statements and financial highlights, whether due to error or fraud, and performing procedures that respond to those risks. Such procedures included examining, on a test basis, evidence regarding the amounts and disclosures in the financial statements and financial highlights. Our audits also included evaluating the accounting principles used and significant estimates made by management, as well as evaluating the overall presentation of the financial statements and financial highlights. Our procedures included confirmation of securities owned as of October 31, 2022, by correspondence with the custodian and brokers; when replies were not received from brokers, we performed other auditing procedures. We believe that our audits provide a reasonable basis for our opinion.
/s/ Deloitte & Touche LLP
Boston, Massachusetts
December 20, 2022
We have served as the auditor of one or more Eaton Vance investment companies since 1959.
Eaton Vance
Global Small-Cap Equity Fund
October 31, 2022
Federal Tax Information (Unaudited)
The Form 1099-DIV you receive in February 2023 will show the tax status of all distributions paid to your account in calendar year 2022. Shareholders are advised to consult their own tax adviser with respect to the tax consequences of their investment in the Fund. As required by the Internal Revenue Code and/or regulations, shareholders must be notified regarding the status of qualified dividend income for individuals, the dividends received deduction for corporations and capital gains dividends.
Qualified Dividend Income. For the fiscal year ended October 31, 2022, the Fund designates approximately $398,500, or up to the maximum amount of such dividends allowable pursuant to the Internal Revenue Code, as qualified dividend income eligible for the reduced tax rate of 15%.
Dividends Received Deduction. Corporate shareholders are generally entitled to take the dividends received deduction on the portion of the Fund’s dividend distribution that qualifies under tax law. For the Fund’s fiscal 2022 ordinary income dividends, 9.80% qualifies for the corporate dividends received deduction.
Capital Gains Dividends. The Fund hereby designates as a capital gain dividend with respect to the taxable year ended October 31, 2022, $936,209 or, if subsequently determined to be different, the net capital gain of such year.
Eaton Vance
Global Small-Cap Equity Fund
October 31, 2022
Board of Trustees’ Contract Approval
Overview of the Contract Review Process
The Investment Company Act of 1940, as amended (the “1940 Act”), provides, in substance, that the investment advisory agreement between a fund and its investment adviser will continue in effect from year-to-year only if its continuation is approved on an annual basis by a vote of the fund’s board of trustees, including a majority of the trustees who are not “interested persons” of the fund (“independent trustees”), cast in person at a meeting called for the purpose of considering such approval.
At a meeting held on June 8, 2022, the Boards of Trustees/Directors (collectively, the “Board”) that oversee the registered investment companies advised by Eaton Vance Management or its affiliate, Boston Management and Research (the “Eaton Vance Funds”), including a majority of the independent trustees (the “Independent Trustees”), voted to approve the continuation of existing investment advisory agreements and sub-advisory agreements1 for each of the Eaton Vance Funds for an additional one-year period. The Board relied upon the affirmative recommendation of its Contract Review Committee, which is a committee exclusively comprised of Independent Trustees. Prior to making its recommendation, the Contract Review Committee reviewed information furnished by the adviser and sub-adviser to each of the Eaton Vance Funds (including information specifically requested by the Board) for a series of formal meetings held between April and June 2022. Members of the Contract Review Committee also considered information received at prior meetings of the Board and its committees, to the extent such information was relevant to the Contract Review Committee’s annual evaluation of the investment advisory agreements and sub-advisory agreements.
In connection with its evaluation of the investment advisory agreements and sub-advisory agreements, the Board considered various information relating to the Eaton Vance Funds. This included information applicable to all or groups of Eaton Vance Funds, which is referenced immediately below, and information applicable to the particular Eaton Vance Fund covered by this report (additional fund-specific information is referenced below under “Results of the Contract Review Process”). (For funds that invest through one or more underlying portfolios, references to “each fund” in this section may include information that was considered at the portfolio-level.)
Information about Fees, Performance and Expenses
• A report from an independent data provider comparing advisory and other fees paid by each fund to such fees paid by comparable funds, as identified by the independent data provider (“comparable funds”);
• A report from an independent data provider comparing each fund’s total expense ratio (and its components) to those of comparable funds;
• A report from an independent data provider comparing the investment performance of each fund (including, as relevant, total return data, income data, Sharpe ratios and information ratios) to the investment performance of comparable funds and, as applicable, benchmark indices, over various time periods;
• In certain instances, data regarding investment performance relative to customized groups of peer funds and blended indices identified by the adviser in consultation with the Portfolio Management Committee of the Board (a committee exclusively comprised of Independent Trustees);
• Comparative information concerning the fees charged and services provided by the adviser and sub-adviser to each fund in managing other accounts (which may include other mutual funds, collective investment funds and institutional accounts) using investment strategies and techniques similar to those used in managing such fund(s), if any;
• Profitability analyses with respect to the adviser and sub-adviser to each of the funds;
Information about Portfolio Management and Trading
• Descriptions of the investment management services provided to each fund, as well as each of the funds’ investment strategies and policies;
• The procedures and processes used to determine the value of fund assets, including, when necessary, the determination of “fair value” and actions taken to monitor and test the effectiveness of such procedures and processes;
• Information about the policies and practices of each fund’s adviser and sub-adviser with respect to trading, including their processes for seeking best execution of portfolio transactions;
• Information about the allocation of brokerage transactions and the benefits, if any, received by the adviser and sub-adviser to each fund as a result of brokerage allocation, including, as applicable, information concerning the acquisition of research through client commission arrangements and policies with respect to “soft dollars”;
• Data relating to the portfolio turnover rate of each fund and related information regarding active management in the context of particular strategies;
Information about each Adviser and Sub-adviser
• Reports detailing the financial results and condition of the adviser and sub-adviser to each fund;
1 Not all Eaton Vance Funds have entered into a sub-advisory agreement with a sub-adviser. Accordingly, references to “sub-adviser” or “sub-advisory agreement” in this “Overview” section may not be applicable to the particular Eaton Vance Fund covered by this report. Following the “Overview” section, further information regarding the Board’s evaluation of a fund’s contractual arrangements is included under the “Results of the Contract Review Process” section.
Eaton Vance
Global Small-Cap Equity Fund
October 31, 2022
Board of Trustees’ Contract Approval — continued
• Information regarding the individual investment professionals whose responsibilities include portfolio management and investment research for the funds, and, for portfolio managers and certain other investment professionals, information relating to their responsibilities with respect to managing other mutual funds and investment accounts, as applicable;
• Information regarding the adviser’s and its parent company’s (Morgan Stanley’s) efforts to retain and attract talented investment professionals, including in the context of a particularly competitive marketplace for talent, as well as the ongoing unique environment presented by hybrid, remote and other alternative work arrangements;
• The Code of Ethics of the adviser and its affiliates and the sub-adviser of each fund, together with information relating to compliance with, and the administration of, such codes;
• Policies and procedures relating to proxy voting, including regular reporting with respect to fund proxy voting activities;
• Information regarding the handling of corporate actions and class actions, as well as information regarding litigation and other regulatory matters;
• Information concerning the resources devoted to compliance efforts undertaken by the adviser and its affiliates and the sub-adviser of each fund, if any, including descriptions of their various compliance programs and their record of compliance;
• Information concerning the business continuity and disaster recovery plans of the adviser and its affiliates and the sub-adviser of each fund, if any;
• A description of Eaton Vance Management’s and Boston Management and Research’s oversight of sub-advisers, including with respect to regulatory and compliance issues, investment management and other matters;
Other Relevant Information
• Information regarding ongoing initiatives to further integrate and harmonize, where applicable, the investment management and other departments of the adviser and its affiliates with the overall investment management infrastructure of Morgan Stanley, in light of Morgan Stanley’s acquisition of Eaton Vance on March 1, 2021;
• Information concerning the nature, cost and character of the administrative and other non-investment advisory services provided by Eaton Vance Management and its affiliates;
• Information concerning oversight of the relationship with the custodian, subcustodians, fund accountants, and other third-party service providers by the adviser and/or administrator to each of the funds;
• Information concerning efforts to implement policies and procedures with respect to various new regulations applicable to the funds, including Rule 12d1-4 (the Fund-of-Funds Rule), Rule 18f-4 (the Derivatives Rule) and Rule 2a-5 (the Fair Valuation Rule);
• For an Eaton Vance Fund structured as an exchange-listed closed-end fund, information concerning the benefits of the closed-end fund structure, as well as, where relevant, the closed-end fund’s market prices (including as compared to the closed-end fund’s net asset value (NAV)), trading volume data, continued use of auction preferred shares (where applicable), distribution rates and other relevant matters;
• The risks which the adviser and/or its affiliates incur in connection with the management and operation of the funds, including, among others, litigation, regulatory, entrepreneurial, and other business risks (and the associated costs of such risks); and
• The terms of each investment advisory agreement and sub-advisory agreement.
During the various meetings of the Board and its committees over the course of the year leading up to the June 8, 2022 meeting, the Trustees received information from portfolio managers and other investment professionals of the advisers and sub-advisers of the funds regarding investment and performance matters, and considered various investment and trading strategies used in pursuing the funds’ investment objectives. The Trustees also received information regarding risk management techniques employed in connection with the management of the funds. The Board and its committees evaluated issues pertaining to industry and regulatory developments, compliance procedures, fund governance and other issues with respect to the funds, and received and participated in reports and presentations provided by Eaton Vance Management, Boston Management and Research and fund sub-advisers, with respect to such matters. In addition to the formal meetings of the Board and its committees, the Independent Trustees held regular teleconferences to discuss, among other topics, matters relating to the continuation of investment advisory agreements and sub-advisory agreements.
The Contract Review Committee was advised throughout the contract review process by Goodwin Procter LLP, independent legal counsel for the Independent Trustees. The members of the Contract Review Committee, with the advice of such counsel, exercised their own business judgment in determining the material factors to be considered in evaluating each investment advisory agreement and sub-advisory agreement and the weight to be given to each such factor. The conclusions reached with respect to each investment advisory agreement and sub-advisory agreement were based on a comprehensive evaluation of all the information provided and not any single factor. Moreover, each member of the Contract Review Committee may have placed varying emphasis on particular factors in reaching conclusions with respect to each investment advisory agreement and sub-advisory agreement. In evaluating each investment advisory agreement and sub-advisory agreement, including the fee structures and other terms contained in such agreements, the members of the Contract Review Committee were also informed by multiple years of analysis and discussion with the adviser and sub-adviser to each of the Eaton Vance Funds.
Results of the Contract Review Process
Based on its consideration of the foregoing, and such other information it deemed relevant, including the factors and conclusions described below, the Contract Review Committee concluded that the continuation of the investment advisory agreement between Eaton Vance Global Small-Cap Equity Fund (the “Fund”) and Boston Management and Research (the “Adviser”), and the sub-advisory agreement between the Adviser and Eaton Vance Advisers
Eaton Vance
Global Small-Cap Equity Fund
October 31, 2022
Board of Trustees’ Contract Approval — continued
International Ltd. (the “Sub-adviser”), an affiliate of the Adviser, with respect to the Fund, including their respective fee structures, are in the interests of shareholders and, therefore, recommended to the Board approval of each agreement. Based on the recommendation of the Contract Review Committee, the Board, including a majority of the Independent Trustees, voted to approve continuation of the investment advisory agreement and the sub-advisory agreement for the Fund.
Nature, Extent and Quality of Services
In considering whether to approve the investment advisory agreement and the sub-advisory agreement for the Fund, the Board evaluated the nature, extent and quality of services provided to the Fund by the Adviser and the Sub-adviser.
The Board considered the Adviser’s and the Sub-adviser’s management capabilities and investment processes in light of the types of investments held by the Fund, including the education, experience and number of investment professionals and other personnel who provide portfolio management, investment research, and similar services to the Fund. Regarding the Adviser, the Board considered the Adviser’s responsibilities with respect to oversight of the Sub-adviser and coordinating activities in implementing the investment strategies of the Fund. The Board specifically noted that the Adviser has devoted extensive resources to in-house equity research and also draws upon independent research available from third-party sources. With respect to the Sub-adviser, the Board considered the abilities and experience of the Sub-adviser’s investment professionals in investing in equity securities, including investing in both U.S. and foreign common stocks. The Board also considered the international investment capabilities of the Sub-adviser, which is based in London, and the benefits to the Fund of having portfolio management services involving investments in international equities provided by investment professionals located abroad. The Board also took into account the resources dedicated to portfolio management and other services, the compensation methods of the Adviser and other factors, including the reputation and resources of the Adviser to recruit and retain highly qualified research, advisory and supervisory investment professionals. In addition, the Board considered the time and attention devoted to the Eaton Vance Funds, including the Fund, by senior management, as well as the infrastructure, operational capabilities and support staff in place to assist in the portfolio management and operations of the Fund, including the provision of administrative services. The Board also considered the business-related and other risks to which the Adviser or its affiliates may be subject in managing the Fund.
The Board considered the compliance programs of the Adviser and relevant affiliates thereof, including the Sub-adviser. The Board considered compliance and reporting matters regarding, among other things, personal trading by investment professionals, disclosure of portfolio holdings, late trading, frequent trading, portfolio valuation, business continuity and the allocation of investment opportunities. The Board also considered the responses of the Adviser and its affiliates to requests in recent years from regulatory authorities, such as the Securities and Exchange Commission and the Financial Industry Regulatory Authority.
The Board considered other administrative services provided or overseen by Eaton Vance Management and its affiliates, including transfer agency and accounting services. The Board evaluated the benefits to shareholders of investing in a fund that is a part of a large fund complex offering exposure to a variety of asset classes and investment disciplines, as well as the ability, in many cases, to exchange an investment among different funds without incurring additional sales charges.
After consideration of the foregoing factors, among others, the Board concluded that the nature, extent and quality of services provided by the Adviser and Sub-adviser, taken as a whole, are appropriate and consistent with the terms of the investment advisory agreement and the sub-advisory agreement.
Fund Performance
The Board compared the Fund’s investment performance to that of comparable funds identified by an independent data provider (the peer group), as well as an appropriate benchmark index and a custom peer group of similarly managed funds. The Board’s review included comparative performance data with respect to the Fund for the one-, three-, five- and ten-year periods ended December 31, 2021. In this regard, the Board noted that the performance of the Fund was lower than the median performance of the Fund’s peer group and custom peer group for the three-year period. The Board also noted that the performance of the Fund was higher than its benchmark index for the three-year period. On the basis of the foregoing, the performance of the Fund over other periods, and other relevant information provided by the Adviser in response to inquiries from the Contract Review Committee, the Board concluded that the performance of the Fund was satisfactory.
Management Fees and Expenses
The Board considered contractual fee rates payable by the Fund for advisory and administrative services (referred to collectively as “management fees”). As part of its review, the Board considered the Fund’s management fees and total expense ratio for the one-year period ended December 31, 2021, as compared to those of comparable funds, before and after giving effect to any undertaking to waive fees or reimburse expenses. The Board also considered factors that had an impact on the Fund’s total expense ratio relative to comparable funds.
After considering the foregoing information, and in light of the nature, extent and quality of the services provided by the Adviser and the Sub-adviser, the Board concluded that the management fees charged for advisory and related services are reasonable.
Eaton Vance
Global Small-Cap Equity Fund
October 31, 2022
Board of Trustees’ Contract Approval — continued
Profitability and “Fall-Out” Benefits
The Board considered the level of profits realized by the Adviser and relevant affiliates thereof, including the Sub-adviser, in providing investment advisory and administrative services to the Fund and to all Eaton Vance Funds as a group. The Board considered the level of profits realized without regard to marketing support or other payments by the Adviser and its affiliates to third parties in respect of distribution or other services.
The Board concluded that, in light of the foregoing factors and the nature, extent and quality of the services rendered, the profits realized by the Adviser and its affiliates, including the Sub-adviser, are deemed not to be excessive.
The Board also considered direct or indirect fall-out benefits received by the Adviser and its affiliates, including the Sub-adviser, in connection with their respective relationships with the Fund, including the benefits of research services that may be available to the Adviser or the Sub-adviser as a result of securities transactions effected for the Fund and other investment advisory clients.
Economies of Scale
In reviewing management fees and profitability, the Board also considered the extent to which the Adviser and its affiliates, on the one hand, and the Fund, on the other hand, can expect to realize benefits from economies of scale as the assets of the Fund increase. The Board acknowledged the difficulty in accurately measuring the benefits resulting from economies of scale, if any, with respect to the management of any specific fund or group of funds. The Board reviewed data summarizing the increases and decreases in the assets of the Fund and of all Eaton Vance Funds as a group over various time periods, and evaluated the extent to which the total expense ratio of the Fund and the profitability of the Adviser and its affiliates may have been affected by such increases or decreases. Based upon the foregoing, the Board concluded that the Fund currently shares in the benefits from economies of scale, if any, when they are realized by the Adviser. The Board also concluded that the structure of the advisory fee, which includes breakpoints at several asset levels, will allow the Fund to continue to benefit from any economies of scale in the future.
Eaton Vance
Global Small-Cap Equity Fund
October 31, 2022
Liquidity Risk Management Program
The Fund has implemented a written liquidity risk management program (Program) and related procedures to manage its liquidity in accordance with Rule 22e-4 under the Investment Company Act of 1940, as amended (Liquidity Rule). The Liquidity Rule defines “liquidity risk” as the risk that a fund could not meet requests to redeem shares issued by the fund without significant dilution of the remaining investors’ interests in the fund. The Fund’s Board of Trustees/Directors has designated the investment adviser to serve as the administrator of the Program and the related procedures. The administrator has established a Liquidity Risk Management Oversight Committee (Committee) to perform the functions necessary to administer the Program. As part of the Program, the administrator is responsible for identifying illiquid investments and categorizing the relative liquidity of the Fund’s investments in accordance with the Liquidity Rule. Under the Program, the administrator assesses, manages, and periodically reviews the Fund’s liquidity risk, and is responsible for making certain reports to the Fund’s Board of Trustees/Directors and the Securities and Exchange Commission (SEC) regarding the liquidity of the Fund’s investments, and to notify the Board of Trustees/Directors and the SEC of certain liquidity events specified in the Liquidity Rule. The liquidity of the Fund’s portfolio investments is determined based on a number of factors including, but not limited to, relevant market, trading and investment-specific considerations under the Program.
At a meeting of the Fund’s Board of Trustees/Directors on June 7, 2022, the Committee provided a written report to the Fund’s Board of Trustees/Directors pertaining to the operation, adequacy, and effectiveness of implementation of the Program, as well as the operation of the highly liquid investment minimum (if applicable) for the period January 1, 2021 through December 31, 2021 (Review Period). The Program operated effectively during the Review Period, supporting the administrator’s ability to assess, manage and monitor Fund liquidity risk, including during periods of market volatility and net redemptions. During the Review Period, the Fund met redemption requests on a timely basis.
There can be no assurance that the Program will achieve its objectives in the future. Please refer to the Fund’s prospectus for more information regarding the Fund’s exposure to liquidity risk and other principal risks to which an investment in the Fund may be subject.
Eaton Vance
Global Small-Cap Equity Fund
October 31, 2022
Management and Organization
Fund Management. The Trustees of Eaton Vance Mutual Funds Trust (the Trust) are responsible for the overall management and supervision of the Trust's affairs. The Board members and officers of the Trust are listed below. Except as indicated, each individual has held the office shown or other offices in the same company for the last five years. Board members hold indefinite terms of office. Each Trustee holds office until his or her successor is elected and qualified, subject to a prior death, resignation, retirement, disqualification or removal. Under the terms of the Fund's current Trustee retirement policy, an Independent Trustee must retire and resign as a Trustee on the earlier of: (i) the first day of July following his or her 74th birthday; or (ii), with limited exception, December 31st of the 20th year in which he or she has served as a Trustee. However, if such retirement and resignation would cause the Fund to be out of compliance with Section 16 of the 1940 Act or any other regulations or guidance of the SEC, then such retirement and resignation will not become effective until such time as action has been taken for the Fund to be in compliance therewith. The “noninterested Trustees” consist of those Trustees who are not “interested persons” of the Trust, as that term is defined under the 1940 Act. The business address of each Board member and officer is Two International Place, Boston, Massachusetts 02110. As used below, “BMR” refers to Boston Management and Research, “EVC” refers to Eaton Vance Corp., “EV” refers to EV LLC, “EVM” refers to Eaton Vance Management and “EVD” refers to Eaton Vance Distributors, Inc. EV is the trustee of each of EVM and BMR. Effective March 1, 2021, each of EVM, BMR, EVD and EV are indirect, wholly owned subsidiaries of Morgan Stanley. Each officer affiliated with EVM may hold a position with other EVM affiliates that is comparable to his or her position with EVM listed below. Each Trustee oversees 135 funds (with the exception of Mr. Bowser who oversees 110 funds) in the Eaton Vance fund complex (including both funds and portfolios in a hub and spoke structure).
| Name and Year of Birth | Trust
Position(s) | Length of Service | Principal Occupation(s) and Other Directorships
During Past Five Years and Other Relevant Experience |
| Interested Trustee |
Thomas E. Faust Jr.
1958 | Trustee | Since 2007 | Chairman of Morgan Stanley Investment Management, Inc. (MSIM), member of the Board of Managers and President of EV (since 2021), Chief Executive Officer of EVM and BMR. Formerly, Chairman, Chief Executive Officer (2007-2021) and President (2006-2021) of EVC and Director of EVD (2007-2022). Mr. Faust is an interested person because of his positions with MSIM, BMR, EVM and EV, which are affiliates of the Trust.
Other Directorships. Formerly, Director of EVC (2007-2021) and Hexavest Inc. (investment management firm) (2012-2021). |
| Noninterested Trustees |
Alan C. Bowser(1)
1962 | Trustee | Since 2022 | Chief Diversity Officer, Partner and a member of the Operating Committee, and formerly served as Senior Advisor on Diversity and Inclusion for the firm’s chief executive officer, Co-Head of the Americas Region, and Senior Client Advisor of Bridgewater Associates, an asset management firm (2011- present).
Other Directorships. None. |
Mark R. Fetting
1954 | Trustee | Since 2016 | Private investor. Formerly held various positions at Legg Mason, Inc. (investment management firm) (2000-2012), including President, Chief Executive Officer, Director and Chairman (2008-2012), Senior Executive Vice President (2004-2008) and Executive Vice President (2001-2004). Formerly, President of Legg Mason family of funds (2001-2008). Formerly, Division President and Senior Officer of Prudential Financial Group, Inc. and related companies (investment management firm) (1991-2000).
Other Directorships. None. |
Cynthia E. Frost
1961 | Trustee | Since 2014 | Private investor. Formerly, Chief Investment Officer of Brown University (university endowment) (2000-2012). Formerly, Portfolio Strategist for Duke Management Company (university endowment manager) (1995-2000). Formerly, Managing Director, Cambridge Associates (investment consulting company) (1989-1995). Formerly, Consultant, Bain and Company (management consulting firm) (1987-1989). Formerly, Senior Equity Analyst, BA Investment Management Company (1983-1985).
Other Directorships. None. |
George J. Gorman
1952 | Chairperson
of the Board
and Trustee | Since 2021
(Chairperson) and
2014 (Trustee) | Principal at George J. Gorman LLC (consulting firm). Formerly, Senior Partner at Ernst & Young LLP (a registered public accounting firm) (1974-2009).
Other Directorships. None. |
Eaton Vance
Global Small-Cap Equity Fund
October 31, 2022
Management and Organization — continued
| Name and Year of Birth | Trust
Position(s) | Length of Service | Principal Occupation(s) and Other Directorships
During Past Five Years and Other Relevant Experience |
| Noninterested Trustees (continued) |
Valerie A. Mosley
1960 | Trustee | Since 2014 | Chairwoman and Chief Executive Officer of Valmo Ventures (a consulting and investment firm). Founder of Upward Wealth, Inc., dba BrightUp, a fintech platform. Formerly, Partner and Senior Vice President, Portfolio Manager and Investment Strategist at Wellington Management Company, LLP (investment management firm) (1992-2012). Formerly, Chief Investment Officer, PG Corbin Asset Management (1990-1992). Formerly worked in institutional corporate bond sales at Kidder Peabody (1986-1990).
Other Directorships. Director of DraftKings, Inc. (digital sports entertainment and gaming company) (since September 2020). Director of Envestnet, Inc. (provider of intelligent systems for wealth management and financial wellness) (since 2018). Formerly, Director of Dynex Capital, Inc. (mortgage REIT) (2013-2020) and Director of Groupon, Inc. (e-commerce provider) (2020-2022). |
Keith Quinton
1958 | Trustee | Since 2018 | Private investor, researcher and lecturer. Formerly, Independent Investment Committee Member at New Hampshire Retirement System (2017-2021). Formerly, Portfolio Manager and Senior Quantitative Analyst at Fidelity Investments (investment management firm) (2001-2014).
Other Directorships. Formerly, Director (2016-2021) and Chairman (2019-2021) of New Hampshire Municipal Bond Bank. |
Marcus L. Smith
1966 | Trustee | Since 2018 | Private investor and independent corporate director. Formerly, Chief Investment Officer, Canada (2012-2017), Chief Investment Officer, Asia (2010-2012), Director of Asian Research (2004-2010) and portfolio manager (2001-2017) at MFS Investment Management (investment management firm).
Other Directorships. Director of First Industrial Realty Trust, Inc. (an industrial REIT) (since 2021). Director of MSCI Inc. (global provider of investment decision support tools) (since 2017). Formerly, Director of DCT Industrial Trust Inc. (logistics real estate company) (2017-2018). |
Susan J. Sutherland
1957 | Trustee | Since 2015 | Private investor. Director of Ascot Group Limited and certain of its subsidiaries (insurance and reinsurance) (since 2017). Formerly, Director of Hagerty Holding Corp. (insurance) (2015-2018) and Montpelier Re Holdings Ltd. (insurance and reinsurance) (2013-2015). Formerly, Associate, Counsel and Partner at Skadden, Arps, Slate, Meagher & Flom LLP (law firm) (1982-2013).
Other Directorships. Director of Kairos Acquisition Corp. (insurance/InsurTech acquisition company) (since 2021). |
Scott E. Wennerholm
1959 | Trustee | Since 2016 | Private investor. Formerly, Trustee at Wheelock College (postsecondary institution) (2012-2018). Formerly, Consultant at GF Parish Group (executive recruiting firm) (2016-2017). Formerly, Chief Operating Officer and Executive Vice President at BNY Mellon Asset Management (investment management firm) (2005-2011). Formerly, Chief Operating Officer and Chief Financial Officer at Natixis Global Asset Management (investment management firm) (1997-2004). Formerly, Vice President at Fidelity Investments Institutional Services (investment management firm) (1994-1997).
Other Directorships. None. |
Nancy A. Wiser(1)
1967 | Trustee | Since 2022 | Formerly, Executive Vice President and the Global Head of Operations at Wells Fargo Asset Management (2011-2021).
Other Directorships. None. |
| Name and Year of Birth | Trust
Position(s) | Length of Service | Principal Occupation(s)
During Past Five Years |
| Principal Officers who are not Trustees |
Eric A. Stein
1980 | President | Since 2020 | Vice President and Chief Investment Officer, Fixed Income of EVM and BMR. Prior to November 1, 2020, Mr. Stein was a co-Director of Eaton Vance’s Global Income Investments. Also Vice President of Calvert Research and Management (“CRM”). |
Deidre E. Walsh
1971 | Vice President and
Chief Legal Officer | Since 2009 | Vice President of EVM and BMR. Also Vice President of CRM. |
James F. Kirchner
1967 | Treasurer | Since 2007 | Vice President of EVM and BMR. Also Vice President of CRM. |
Eaton Vance
Global Small-Cap Equity Fund
October 31, 2022
Management and Organization — continued
| Name and Year of Birth | Trust
Position(s) | Length of Service | Principal Occupation(s)
During Past Five Years |
| Principal Officers who are not Trustees (continued) |
Nicholas Di Lorenzo
1987 | Secretary | Since 2022 | Formerly, associate (2012-2021) and counsel (2022) at Dechert LLP. |
Richard F. Froio
1968 | Chief Compliance
Officer | Since 2017 | Vice President of EVM and BMR since 2017. Formerly, Deputy Chief Compliance Officer (Adviser/Funds) and Chief Compliance Officer (Distribution) at PIMCO (2012-2017) and Managing Director at BlackRock/Barclays Global Investors (2009-2012). |
(1) Mr. Bowser and Ms. Wiser began serving as Trustees effective April 4, 2022.
The SAI for the Fund includes additional information about the Trustees and officers of the Fund and can be obtained without charge on Eaton Vance’s website at www.eatonvance.com or by calling 1-800-262-1122.
| FACTS | WHAT DOES EATON VANCE DO WITH YOUR
PERSONAL INFORMATION? |
| Why? | Financial companies choose how they share your personal information. Federal law gives consumers the right to limit some but not all sharing. Federal law also requires us to tell you how we collect, share, and protect your personal information. Please read this notice carefully to understand what we do. |
| |
| What? | The types of personal information we collect and share depend on the product or service you have with us. This information can include:■ Social Security number and income
■ investment experience and risk tolerance
■ checking account number and wire transfer instructions |
| |
| How? | All financial companies need to share customers’ personal information to run their everyday business. In the section below, we list the reasons financial companies can share their customers’ personal information; the reasons Eaton Vance chooses to share; and whether you can limit this sharing. |
Reasons we can share your
personal information | Does Eaton Vance
share? | Can you limit
this sharing? |
| For our everyday business purposes — such as to process your transactions, maintain your account(s), respond to court orders and legal investigations, or report to credit bureaus | Yes | No |
| For our marketing purposes — to offer our products and services to you | Yes | No |
| For joint marketing with other financial companies | No | We don’t share |
| For our investment management affiliates’ everyday business purposes — information about your transactions, experiences, and creditworthiness | Yes | Yes |
| For our affiliates’ everyday business purposes — information about your transactions and experiences | Yes | No |
| For our affiliates’ everyday business purposes — information about your creditworthiness | No | We don’t share |
| For our investment management affiliates to market to you | Yes | Yes |
| For our affiliates to market to you | No | We don’t share |
| For nonaffiliates to market to you | No | We don’t share |
To limit our
sharing | Call toll-free 1-800-262-1122 or email: EVPrivacy@eatonvance.comPlease note:If you are a new customer, we can begin sharing your information 30 days from the date we sent this notice. When you are no longer our customer, we continue to share your information as described in this notice. However, you can contact us at any time to limit our sharing. |
| Questions? | Call toll-free 1-800-262-1122 or email: EVPrivacy@eatonvance.com |
| Privacy Notice — continued | April 2021 |
| Who we are |
| Who is providing this notice? | Eaton Vance Management, Eaton Vance Distributors, Inc., Eaton Vance Trust Company, Eaton Vance Management (International) Limited, Eaton Vance Advisers International Ltd., Eaton Vance Global Advisors Limited, Eaton Vance Management’s Real Estate Investment Group, Boston Management and Research, Calvert Research and Management, Eaton Vance and Calvert Fund Families and our investment advisory affiliates (“Eaton Vance”) (see Investment Management Affiliates definition below) |
| What we do |
How does Eaton Vance
protect my personal
information? | To protect your personal information from unauthorized access and use, we use security measures that comply with federal law. These measures include computer safeguards and secured files and buildings. We have policies governing the proper handling of customer information by personnel and requiring third parties that provide support to adhere to appropriate security standards with respect to such information. |
How does Eaton Vance
collect my personal
information? | We collect your personal information, for example, when you■ open an account or make deposits or withdrawals from your account
■ buy securities from us or make a wire transfer
■ give us your contact informationWe also collect your personal information from others, such as credit bureaus, affiliates, or other companies. |
| Why can’t I limit all sharing? | Federal law gives you the right to limit only■ sharing for affiliates’ everyday business purposes — information about your creditworthiness
■ affiliates from using your information to market to you
■ sharing for nonaffiliates to market to youState laws and individual companies may give you additional rights to limit sharing. See below for more on your rights under state law. |
| Definitions |
Investment Management
Affiliates | Eaton Vance Investment Management Affiliates include registered investment advisers, registered broker- dealers, and registered and unregistered funds. Investment Management Affiliates does not include entities associated with Morgan Stanley Wealth Management, such as Morgan Stanley Smith Barney LLC and Morgan Stanley & Co. |
| Affiliates | Companies related by common ownership or control. They can be financial and nonfinancial companies.■ Our affiliates include companies with a Morgan Stanley name and financial companies such as Morgan Stanley Smith Barney LLC and Morgan Stanley & Co. |
| Nonaffiliates | Companies not related by common ownership or control. They can be financial and nonfinancial companies.■ Eaton Vance does not share with nonaffiliates so they can market to you. |
| Joint marketing | A formal agreement between nonaffiliated financial companies that together market financial products or services to you.■ Eaton Vance doesn’t jointly market. |
| Other important information |
| Vermont: Except as permitted by law, we will not share personal information we collect about Vermont residents with Nonaffiliates unless you provide us with your written consent to share such information.California: Except as permitted by law, we will not share personal information we collect about California residents with Nonaffiliates and we will limit sharing such personal information with our Affiliates to comply with California privacy laws that apply to us. |
Delivery of Shareholder Documents. The Securities and Exchange Commission (SEC) permits funds to deliver only one copy of shareholder documents, including prospectuses, proxy statements and shareholder reports, to fund investors with multiple accounts at the same residential or post office box address. This practice is often called “householding” and it helps eliminate duplicate mailings to shareholders. Eaton Vance, or your financial intermediary, may household the mailing of your documents indefinitely unless you instruct Eaton Vance, or your financial intermediary, otherwise. If you would prefer that your Eaton Vance documents not be householded, please contact Eaton Vance at 1-800-262-1122, or contact your financial intermediary. Your instructions that householding not apply to delivery of your Eaton Vance documents will typically be effective within 30 days of receipt by Eaton Vance or your financial intermediary.
Portfolio Holdings. Each Eaton Vance Fund and its underlying Portfolio(s) (if applicable) files a schedule of portfolio holdings on Part F to Form N-PORT with the SEC. Certain information filed on Form N-PORT may be viewed on the Eaton Vance website at www.eatonvance.com, by calling Eaton Vance at 1-800-262-1122 or in the EDGAR database on the SEC’s website at www.sec.gov.
Proxy Voting. From time to time, funds are required to vote proxies related to the securities held by the funds. The Eaton Vance Funds or their underlying Portfolios (if applicable) vote proxies according to a set of policies and procedures approved by the Funds’ and Portfolios’ Boards. You may obtain a description of these policies and procedures and information on how the Funds or Portfolios voted proxies relating to portfolio securities during the most recent 12-month period ended June 30, without charge, upon request, by calling 1-800-262-1122 and by accessing the SEC’s website at www.sec.gov.
This Page Intentionally Left Blank
Investment Adviser
Boston Management and Research
Two International Place
Boston, MA 02110
Administrator
Eaton Vance Management
Two International Place
Boston, MA 02110
Investment Sub-Adviser
Eaton Vance Advisers International Ltd.
125 Old Broad Street
London, EC2N 1AR
United Kingdom
Principal Underwriter*
Eaton Vance Distributors, Inc.
Two International Place
Boston, MA 02110
(617) 482-8260
Custodian
State Street Bank and Trust Company
State Street Financial Center, One Lincoln Street
Boston, MA 02111
Transfer Agent
BNY Mellon Investment Servicing (US) Inc.
Attn: Eaton Vance Funds
P.O. Box 9653
Providence, RI 02940-9653
(800) 262-1122
Independent Registered Public Accounting Firm
Deloitte & Touche LLP
200 Berkeley Street
Boston, MA 02116-5022
Fund Offices
Two International Place
Boston, MA 02110
* FINRA BrokerCheck. Investors may check the background of their Investment Professional by contacting the Financial Industry Regulatory Authority (FINRA). FINRA BrokerCheck is a free tool to help investors check the professional background of current and former FINRA-registered securities firms and brokers. FINRA BrokerCheck is available by calling 1-800-289-9999 and at www.FINRA.org. The FINRA BrokerCheck brochure describing this program is available to investors at www.FINRA.org.
Eaton Vance
Tax-Managed Value Fund
Annual Report
October 31, 2022
Commodity Futures Trading Commission Registration. The Commodity Futures Trading Commission (“CFTC”) has adopted regulations that subject registered investment companies and advisers to regulation by the CFTC if a fund invests more than a prescribed level of its assets in certain CFTC-regulated instruments (including futures, certain options and swap agreements) or markets itself as providing investment exposure to such instruments. The investment adviser has claimed an exclusion from the definition of “commodity pool operator” under the Commodity Exchange Act with respect to its management of the Fund. Accordingly, neither the Fund nor the adviser with respect to the operation of the Fund is subject to CFTC regulation. Because of its management of other strategies, the Fund's adviser is registered with the CFTC as a commodity pool operator. The adviser is also registered as a commodity trading advisor.
Fund shares are not insured by the FDIC and are not deposits or other obligations of, or guaranteed by, any depository institution. Shares are subject to investment risks, including possible loss of principal invested.
This report must be preceded or accompanied by a current summary prospectus or prospectus. Before investing, investors should consider carefully the investment objective, risks, and charges and expenses of a mutual fund. This and other important information is contained in the summary prospectus and prospectus, which can be obtained from a financial intermediary. Prospective investors should read the prospectus carefully before investing. For further information, please call 1-800-262-1122.
Annual Report October 31, 2022
Eaton Vance
Tax-Managed Value Fund
Eaton Vance
Tax-Managed Value Fund
October 31, 2022
Management’s Discussion of Fund Performance†
Economic and Market Conditions
The 12-month period starting November 1, 2021, was dominated by the ongoing effects of one black swan event -- the COVID-19 pandemic -- and fallout from another -- Russia’s invasion of Ukraine in February 2022.
In the opening months of the period, stock investors as well as consumers generally appeared to take a “glass is half full” approach. Despite the appearance of a more contagious COVID-19 variant, the highest inflation readings in four decades, and the U.S. Federal Reserve’s (the Fed’s) announcement that it would begin tapering bond purchases that had supported economic growth, major U.S. equity indexes repeatedly closed at new all-time highs during the final months of 2021. As consumers rushed to spend money saved earlier in the pandemic, Mastercard, Inc. reported its highest retail sales on record during the 2021 holiday season.
But as the new year began, investors appeared to reevaluate the twin threats of inflation and interest rate hikes, and stock performance turned negative. In February, Russia’s invasion of Ukraine sent shock waves through U.S. and global markets, exacerbating inflationary pressures on energy and food costs.
As the Fed’s outlook on inflation worsened from “transitory” to “persistent,” investors began to expect the Fed would raise interest rates at every 2022 policy meeting and, in turn, worried that aggressive rate hikes could tip the U.S. economy into recession. At its June, July, and September meetings, the Fed hiked the federal funds rate 0.75% each time -- to a 3.00%-3.25% range -- its first moves of that magnitude since 1994. Higher interest rates, inflation, and recessionary worries drove stock prices down, with rate-sensitive technology stocks -- star performers earlier in the pandemic -- suffering some of the worst declines.
As the period came to a close in October 2022, however, U.S. stocks delivered positive performance for the first time in months -- driven by a combination of better-than-expected company earnings; improving investor sentiment that stocks had been oversold during the August-September 2022 market pullback; and hope that after three aggressive rate hikes, the Fed might announce a smaller rate increase at its next meeting in November.
For the period as a whole, the blue-chip Dow Jones Industrial Average® returned -6.74%; the S&P 500® Index, a broad measure of U.S. stocks, returned -14.61%; and the technology-laden Nasdaq Composite Index returned -28.56%.
Fund Performance
For the 12-month period ended October 31, 2022, Eaton Vance Tax-Managed Value Fund (the Fund) returned -8.95% for Class A shares at net asset value (NAV), underperforming its benchmark, the Russell 1000® Value Index (the Index), which returned -7.00%.
On an individual stock basis, the largest detractors from Fund performance versus the Index were a lack of exposure to Index component Exxon Mobil Corp. (Exxon Mobil); an out-of-Index position in Estee Lauder Cos., Inc. (Estee Lauder); and an overweight position relative to the Index in Alphabet, Inc. (Alphabet).
Not owning major oil and gas exploration and production firm Exxon Mobil detracted from Fund returns relative to the Index, as rising energy prices drove the company’s stock price higher during the period.
While global cosmetics firm Estee Lauder enjoyed strong sales in early 2021, the emergence of the Omicron variant later in the period led to tighter pandemic restrictions in multiple Asian nations -- most notably mainland China -- reducing cosmetic sales in those markets and causing the firm’s stock price to decline.
The share price of Google parent company Alphabet declined during the period, in part as a result of a disappointing third-quarter 2022 earnings report. While Alphabet’s cloud storage business reported strong results, decelerating growth in digital ad revenue during the period -- and a decline in ad revenue for its YouTube division -- weighed on Alphabet’s stock performance. A strengthening U.S. dollar was an additional headwind that reduced the value of Alphabet’s overseas income.
On a sector basis, stock selections in the consumer staples, health care, financials, and consumer discretionary sectors detracted from Fund performance relative to the Index during the period.
In contrast, the largest contributors to Fund performance versus the Index on an individual stock basis included overweight positions in EOG Resources, Inc. (EOG), Chevron Corp. (Chevron), and Eli Lilly & Co. (Eli Lilly).
The Fund’s holdings in energy exploration and production firms EOG and Chevron contributed to relative returns, as higher oil and gas prices led to increased profits and boosted both companies’ stock prices during the period.
Shares of Eli Lilly, a global drug maker specializing in diabetes, oncology, and immunology therapies, performed strongly after the firm increased its stock dividend by 15% during the period. Positive test data for drugs in its development pipeline, including a promising medicine for Alzheimer’s Disease, were an additional tailwind for Eli Lilly’s stock price.
See Endnotes and Additional Disclosures in this report.
Past performance is no guarantee of future results. Returns are historical and are calculated by determining the percentage change in net asset value (NAV) or offering price (as applicable) with all distributions reinvested. Furthermore, returns do not reflect the deduction of taxes that shareholders may have to pay on Fund distributions or upon the redemption of Fund shares. Investment return and principal value will fluctuate so that shares, when redeemed, may be worth more or less than their original cost. Performance for periods less than or equal to one year is cumulative. Performance is for the stated time period only; due to market volatility, current Fund performance may be lower or higher than the quoted return. For performance as of the most recent month-end, please refer to eatonvance.com.
Eaton Vance
Tax-Managed Value Fund
October 31, 2022
Management’s Discussion of Fund Performance† — continued
On a sector basis, an overweight position in energy -- the best-performing sector within the Index during the period -- contributed to Fund performance versus the Index. In addition, stock selections and an underweight position in the information technology sector and stock selections in the industrials and materials sectors contributed to relative returns during the period.
See Endnotes and Additional Disclosures in this report.
Past performance is no guarantee of future results. Returns are historical and are calculated by determining the percentage change in net asset value (NAV) or offering price (as applicable) with all distributions reinvested. Furthermore, returns do not reflect the deduction of taxes that shareholders may have to pay on Fund distributions or upon the redemption of Fund shares. Investment return and principal value will fluctuate so that shares, when redeemed, may be worth more or less than their original cost. Performance for periods less than or equal to one year is cumulative. Performance is for the stated time period only; due to market volatility, current Fund performance may be lower or higher than the quoted return. For performance as of the most recent month-end, please refer to eatonvance.com.
Eaton Vance
Tax-Managed Value Fund
October 31, 2022
Performance
Portfolio Manager(s) Aaron S. Dunn, CFA and Bradley T. Galko, CFA
| % Average Annual Total Returns1,2 | Class
Inception Date | Performance
Inception Date | One Year | Five Years | Ten Years |
| Class A at NAV | 12/27/1999 | 12/27/1999 | (8.95)% | 8.54% | 10.19% |
| Class A with 5.25% Maximum Sales Charge | — | — | (13.72) | 7.37 | 9.60 |
| Class C at NAV | 01/24/2000 | 01/24/2000 | (9.61) | 7.72 | 9.53 |
| Class C with 1% Maximum Deferred Sales Charge | — | — | (10.48) | 7.72 | 9.53 |
| Class I at NAV | 11/30/2007 | 12/27/1999 | (8.70) | 8.81 | 10.46 |
|
| Russell 1000® Value Index | — | — | (7.00)% | 7.20% | 10.29% |
| % After-Tax Returns with Maximum Sales Charge2 | Class
Inception Date | Performance
Inception Date | One Year | Five Years | Ten Years |
| Class A After Taxes on Distributions | 12/27/1999 | 12/27/1999 | (14.49)% | 6.97% | 8.78% |
| Class A After Taxes on Distributions and Sale of Fund Shares | — | — | (7.21) | 6.02 | 7.88 |
| Class C After Taxes on Distributions | 01/24/2000 | 01/24/2000 | (11.19) | 7.48 | 8.84 |
| Class C After Taxes on Distributions and Sale of Fund Shares | — | — | (5.34) | 6.35 | 7.88 |
| Class I After Taxes on Distributions | 11/30/2007 | 12/27/1999 | (9.56) | 8.34 | 9.58 |
| Class I After Taxes on Distributions and Sale of Fund Shares | — | — | (4.14) | 7.22 | 8.63 |
| % Total Annual Operating Expense Ratios3 | Class A | Class C | Class I |
| | 1.15% | 1.90% | 0.90% |
Growth of $10,000
This graph shows the change in value of a hypothetical investment of $10,000 in Class A of the Fund for the period indicated. For comparison, the same investment is shown in the indicated index.
| Growth of Investment | Amount Invested | Period Beginning | At NAV | With Maximum Sales Charge |
| Class C | $10,000 | 10/31/2012 | $24,871 | N.A. |
| Class I, at minimum investment | $1,000,000 | 10/31/2012 | $2,706,790 | N.A. |
See Endnotes and Additional Disclosures in this report.
Past performance is no guarantee of future results. Returns are historical and are calculated by determining the percentage change in net asset value (NAV) or offering price (as applicable) with all distributions reinvested. Furthermore, returns do not reflect the deduction of taxes that shareholders may have to pay on Fund distributions or upon the redemption of Fund shares. Investment return and principal value will fluctuate so that shares, when redeemed, may be worth more or less than their original cost. Performance for periods less than or equal to one year is cumulative. Performance is for the stated time period only; due to market volatility, current Fund performance may be lower or higher than the quoted return. For performance as of the most recent month-end, please refer to eatonvance.com.
Eaton Vance
Tax-Managed Value Fund
October 31, 2022
| Sector Allocation (% of net assets)1 |
| Top 10 Holdings (% of net assets)1 |
| JPMorgan Chase & Co. | 3.8% |
| Chevron Corp. | 3.7 |
| NextEra Energy, Inc. | 3.5 |
| Sempra Energy | 2.8 |
| Home Depot, Inc. (The) | 2.7 |
| PNC Financial Services Group, Inc. (The) | 2.6 |
| EOG Resources, Inc. | 2.6 |
| Goldman Sachs Group, Inc. (The) | 2.4 |
| Thermo Fisher Scientific, Inc. | 2.4 |
| Johnson & Johnson | 2.3 |
| Total | 28.8% |
Footnotes:
Fund invests in an affiliated investment company (Portfolio) with the same objective(s) and policies as the Fund. References to investments are to the Portfolio’s holdings.
| 1 | Excludes cash and cash equivalents. |
Eaton Vance
Tax-Managed Value Fund
October 31, 2022
Endnotes and Additional Disclosures
| † | The views expressed in this report are those of the portfolio manager(s) and are current only through the date stated at the top of this page. These views are subject to change at any time based upon market or other conditions, and Eaton Vance and the Fund(s) disclaim any responsibility to update such views. These views may not be relied upon as investment advice and, because investment decisions are based on many factors, may not be relied upon as an indication of trading intent on behalf of any Eaton Vance fund. This commentary may contain statements that are not historical facts, referred to as “forward-looking statements.” The Fund’s actual future results may differ significantly from those stated in any forward-looking statement, depending on factors such as changes in securities or financial markets or general economic conditions, the volume of sales and purchases of Fund shares, the continuation of investment advisory, administrative and service contracts, and other risks discussed from time to time in the Fund’s filings with the Securities and Exchange Commission. |
| | |
| 1 | Russell 1000® Value Index is an unmanaged index of U.S. large-cap value stocks. Unless otherwise stated, index returns do not reflect the effect of any applicable sales charges, commissions, expenses, taxes or leverage, as applicable. It is not possible to invest directly in an index. |
| 2 | Total Returns at NAV do not include applicable sales charges. If sales charges were deducted, the returns would be lower. Total Returns shown with maximum sales charge reflect the stated maximum sales charge. Unless otherwise stated, performance does not reflect the deduction of taxes on Fund distributions or redemptions of Fund shares. After-tax returns are calculated using certain assumptions, including using the highest historical individual federal income tax rates, and do not reflect the impact of state/local taxes. Actual after-tax returns depend on a shareholder’s tax situation and the actual characterization of distributions and may differ from those shown. After-tax returns are not relevant to shareholders who hold shares in tax-deferred accounts or shares held by nontaxable entities. Return After Taxes on Distributions may be the same as Return Before Taxes for the same period because no taxable distributions were made during that period. Return After Taxes on Distributions and Sale of Fund Shares may be greater than or equal to Return After Taxes on Distributions for the same period because of losses realized on the sale of Fund shares. The Fund’s after-tax returns also may reflect foreign tax credits passed by the Fund to its shareholders.Effective November 5, 2020, Class C shares automatically convert to Class A shares eight years after purchase. The average annual total returns listed for Class C reflect conversion to Class A shares after eight years. Prior to November 5, 2020, Class C shares automatically converted to Class A shares ten years after purchase. |
| 3 | Source: Fund prospectus. The expense ratios for the current reporting period can be found in the Financial Highlights section of this report. Performance reflects expenses waived and/or reimbursed, if applicable. Without such waivers and/or reimbursements, performance would have been lower. |
| | Fund profile subject to change due to active management. |
| | Additional Information |
| | S&P 500® Index is an unmanaged index of large-cap stocks commonly used as a measure of U.S. stock market performance. Dow Jones Industrial Average® is a price-weighted average of 30 blue-chip stocks that are generally the leaders in their industry. S&P Dow Jones Indices are a product of S&P Dow Jones Indices LLC (“S&P DJI”) and have been licensed for use. S&P® and S&P 500® are registered trademarks of S&P DJI; Dow Jones® is a registered trademark of Dow Jones Trademark Holdings LLC (“Dow Jones”); S&P DJI, Dow Jones and their respective affiliates do not sponsor, endorse, sell or promote the Fund, will not have any liability with respect thereto and do not have any liability for any errors, omissions, or interruptions of the S&P Dow Jones Indices. Nasdaq Composite Index is a market capitalization-weighted index of all domestic and international securities listed on Nasdaq. Source: Nasdaq, Inc. The information is provided by Nasdaq (with its affiliates, are referred to as the “Corporations”) and Nasdaq’s third party licensors on an “as is” basis and the Corporations make no guarantees and bear no liability of any kind with respect to the information or the Fund. |
Eaton Vance
Tax-Managed Value Fund
October 31, 2022
Example
As a Fund shareholder, you incur two types of costs: (1) transaction costs, including sales charges (loads) on purchases and redemption fees (if applicable); and (2) ongoing costs, including management fees; distribution and/or service fees; and other Fund expenses. This Example is intended to help you understand your ongoing costs (in dollars) of Fund investing and to compare these costs with the ongoing costs of investing in other mutual funds. The Example is based on an investment of $1,000 invested at the beginning of the period and held for the entire period (May 1, 2022 to October 31, 2022).
Actual Expenses
The first section of the table below provides information about actual account values and actual expenses. You may use the information in this section, together with the amount you invested, to estimate the expenses that you paid over the period. Simply divide your account value by $1,000 (for example, an $8,600 account value divided by $1,000 = 8.6), then multiply the result by the number in the first section under the heading entitled “Expenses Paid During Period” to estimate the expenses you paid on your account during this period.
Hypothetical Example for Comparison Purposes
The second section of the table below provides information about hypothetical account values and hypothetical expenses based on the actual Fund expense ratio and an assumed rate of return of 5% per year (before expenses), which is not the actual Fund return. The hypothetical account values and expenses may not be used to estimate the actual ending account balance or expenses you paid for the period. You may use this information to compare the ongoing costs of investing in your Fund and other funds. To do so, compare this 5% hypothetical example with the 5% hypothetical examples that appear in the shareholder reports of the other funds.
Please note that the expenses shown in the table are meant to highlight your ongoing costs only and do not reflect any transactional costs, such as sales charges (loads) or redemption fees (if applicable). Therefore, the second section of the table is useful in comparing ongoing costs only, and will not help you determine the relative total costs of owning different funds. In addition, if these transactional costs were included, your costs would be higher.
| | Beginning
Account Value
(5/1/22) | Ending
Account Value
(10/31/22) | Expenses Paid
During Period*
(5/1/22 – 10/31/22) | Annualized
Expense
Ratio |
| Actual | | | | |
| Class A | $1,000.00 | $ 985.50 | $5.91 | 1.18% |
| Class C | $1,000.00 | $ 981.60 | $9.64 | 1.93% |
| Class I | $1,000.00 | $ 986.80 | $4.66 | 0.93% |
| |
| Hypothetical | | | | |
| (5% return per year before expenses) | | | | |
| Class A | $1,000.00 | $1,019.26 | $6.01 | 1.18% |
| Class C | $1,000.00 | $1,015.48 | $9.80 | 1.93% |
| Class I | $1,000.00 | $1,020.52 | $4.74 | 0.93% |
| * | Expenses are equal to the Fund's annualized expense ratio for the indicated Class, multiplied by the average account value over the period, multiplied by 184/365 (to reflect the one-half year period). The Example assumes that the $1,000 was invested at the net asset value per share determined at the close of business on April 30, 2022. The Example reflects the expenses of both the Fund and the Portfolio. |
Eaton Vance
Tax-Managed Value Fund
October 31, 2022
Statement of Assets and Liabilities
| | October 31, 2022 |
| Assets | |
| Investment in Tax-Managed Value Portfolio, at value (identified cost $329,288,295) | $ 719,483,517 |
| Receivable for Fund shares sold | 703,427 |
| Total assets | $720,186,944 |
| Liabilities | |
| Payable for Fund shares redeemed | $ 908,685 |
| Payable to affiliates: | |
| Administration fee | 86,639 |
| Distribution and service fees | 106,465 |
| Trustees' fees | 43 |
| Accrued expenses | 148,209 |
| Total liabilities | $ 1,250,041 |
| Net Assets | $718,936,903 |
| Sources of Net Assets | |
| Paid-in capital | $ 360,333,626 |
| Distributable earnings | 358,603,277 |
| Net Assets | $718,936,903 |
| Class A Shares | |
| Net Assets | $ 431,901,663 |
| Shares Outstanding | 12,477,312 |
Net Asset Value and Redemption Price Per Share
(net assets ÷ shares of beneficial interest outstanding) | $ 34.61 |
Maximum Offering Price Per Share
(100 ÷ 94.75 of net asset value per share) | $ 36.53 |
| Class C Shares | |
| Net Assets | $ 24,303,690 |
| Shares Outstanding | 733,344 |
Net Asset Value and Offering Price Per Share*
(net assets ÷ shares of beneficial interest outstanding) | $ 33.14 |
| Class I Shares | |
| Net Assets | $ 262,731,550 |
| Shares Outstanding | 7,614,031 |
Net Asset Value, Offering Price and Redemption Price Per Share
(net assets ÷ shares of beneficial interest outstanding) | $ 34.51 |
| On sales of $50,000 or more, the offering price of Class A shares is reduced. |
| * | Redemption price per share is equal to the net asset value less any applicable contingent deferred sales charge. |
8
See Notes to Financial Statements.
Eaton Vance
Tax-Managed Value Fund
October 31, 2022
| | Year Ended |
| | October 31, 2022 |
| Investment Income | |
| Dividend income allocated from Portfolio (net of foreign taxes withheld of $129,278) | $ 17,640,136 |
| Securities lending income allocated from Portfolio, net | 5,490 |
| Expenses allocated from Portfolio | (5,147,221) |
| Total investment income from Portfolio | $ 12,498,405 |
| Expenses | |
| Administration fee | $ 1,133,024 |
| Distribution and service fees: | |
| Class A | 1,144,636 |
| Class C | 250,368 |
| Trustees’ fees and expenses | 500 |
| Custodian fee | 51,607 |
| Transfer and dividend disbursing agent fees | 319,025 |
| Legal and accounting services | 50,840 |
| Printing and postage | 30,951 |
| Registration fees | 57,800 |
| ReFlow liquidity program fees | 74,299 |
| Miscellaneous | 14,602 |
| Total expenses | $ 3,127,652 |
| Net investment income | $ 9,370,753 |
| Realized and Unrealized Gain (Loss) from Portfolio | |
| Net realized gain (loss): | |
| Investment transactions | $ 25,393,136(1) |
| Foreign currency transactions | (25,654) |
| Net realized gain | $ 25,367,482 |
| Change in unrealized appreciation (depreciation): | |
| Investments | $ (105,754,814) |
| Foreign currency | (21,447) |
| Net change in unrealized appreciation (depreciation) | $(105,776,261) |
| Net realized and unrealized loss | $ (80,408,779) |
| Net decrease in net assets from operations | $ (71,038,026) |
| (1) | Includes $17,763,343 of net realized gains from redemptions in-kind. |
9
See Notes to Financial Statements.
Eaton Vance
Tax-Managed Value Fund
October 31, 2022
Statements of Changes in Net Assets
| | Year Ended October 31, |
| | 2022 | 2021 |
| Increase (Decrease) in Net Assets | | |
| From operations: | | |
| Net investment income | $ 9,370,753 | $ 6,218,617 |
| Net realized gain | 25,367,482 (1) | 41,266,650 (2) |
| Net change in unrealized appreciation (depreciation) | (105,776,261) | 196,213,210 |
| Net increase (decrease) in net assets from operations | $ (71,038,026) | $243,698,477 |
| Distributions to shareholders: | | |
| Class A | $ (21,856,449) | $ (5,308,485) |
| Class C | (1,044,216) | (99,561) |
| Class I | (13,331,190) | (3,326,217) |
| Total distributions to shareholders | $ (36,231,855) | $ (8,734,263) |
| Transactions in shares of beneficial interest: | | |
| Class A | $ (428,147) | $ (12,956,492) |
| Class C | 1,562,566 | (1,436,395) |
| Class I | 17,784,670 | 14,451,497 |
| Net increase in net assets from Fund share transactions | $ 18,919,089 | $ 58,610 |
| Net increase (decrease) in net assets | $ (88,350,792) | $235,022,824 |
| Net Assets | | |
| At beginning of year | $ 807,287,695 | $ 572,264,871 |
| At end of year | $ 718,936,903 | $807,287,695 |
| (1) | Includes $17,763,343 of net realized gains from redemptions in-kind. |
| (2) | Includes $11,222,759 of net realized gains from redemptions in-kind. |
10
See Notes to Financial Statements.
Eaton Vance
Tax-Managed Value Fund
October 31, 2022
| | Class A |
| | Year Ended October 31, |
| | 2022 | 2021 | 2020 | 2019 | 2018 |
| Net asset value — Beginning of year | $ 39.770 | $ 28.170 | $ 29.890 | $ 27.000 | $ 25.240 |
| Income (Loss) From Operations | | | | | |
| Net investment income(1) | $ 0.425 | $ 0.286 | $ 0.354 | $ 0.344 | $ 0.268 |
| Net realized and unrealized gain (loss) | (3.833) | 11.731 | (1.720) | 2.931 | 1.744 |
| Total income (loss) from operations | $ (3.408) | $ 12.017 | $ (1.366) | $ 3.275 | $ 2.012 |
| Less Distributions | | | | | |
| From net investment income | $ (0.307) | $ (0.341) | $ (0.339) | $ (0.278) | $ (0.252) |
| From net realized gain | (1.445) | (0.076) | (0.015) | (0.107) | — |
| Total distributions | $ (1.752) | $ (0.417) | $ (0.354) | $ (0.385) | $ (0.252) |
| Net asset value — End of year | $ 34.610 | $ 39.770 | $ 28.170 | $ 29.890 | $ 27.000 |
| Total Return(2) | (8.95)% | 43.03% | (4.66)% | 12.35% | 8.02% |
| Ratios/Supplemental Data | | | | | |
| Net assets, end of year (000’s omitted) | $431,902 | $497,565 | $362,651 | $417,533 | $312,065 |
| Ratios (as a percentage of average daily net assets):(3) | | | | | |
| Expenses | 1.16% (4) | 1.15% | 1.17% | 1.18% | 1.17% |
| Net investment income | 1.18% | 0.80% | 1.25% | 1.24% | 1.00% |
| Portfolio Turnover of the Portfolio | 29% | 11% | 25% | 18% | 10% |
| (1) | Computed using average shares outstanding. |
| (2) | Returns are historical and are calculated by determining the percentage change in net asset value with all distributions reinvested and do not reflect the effect of sales charges. |
| (3) | Includes the Fund’s share of the Portfolio’s allocated expenses. |
| (4) | Includes a reduction by the investment adviser of a portion of the Portfolio's adviser fee due to the Portfolio’s investment in the Liquidity Fund (equal to less than 0.005% of average daily net assets for the year ended October 31, 2022). |
11
See Notes to Financial Statements.
Eaton Vance
Tax-Managed Value Fund
October 31, 2022
Financial Highlights — continued
| | Class C |
| | Year Ended October 31, |
| | 2022 | 2021 | 2020 | 2019 | 2018 |
| Net asset value — Beginning of year | $ 38.170 | $ 27.020 | $ 28.580 | $ 25.810 | $ 24.140 |
| Income (Loss) From Operations | | | | | |
| Net investment income(1) | $ 0.148 | $ 0.018 | $ 0.137 | $ 0.150 | $ 0.066 |
| Net realized and unrealized gain (loss) | (3.677) | 11.278 | (1.673) | 2.794 | 1.664 |
| Total income (loss) from operations | $ (3.529) | $11.296 | $ (1.536) | $ 2.944 | $ 1.730 |
| Less Distributions | | | | | |
| From net investment income | $ (0.056) | $ (0.070) | $ (0.009) | $ (0.067) | $ (0.060) |
| From net realized gain | (1.445) | (0.076) | (0.015) | (0.107) | — |
| Total distributions | $ (1.501) | $ (0.146) | $ (0.024) | $ (0.174) | $ (0.060) |
| Net asset value — End of year | $33.140 | $38.170 | $27.020 | $28.580 | $ 25.810 |
| Total Return(2) | (9.61)% | 41.94% | (5.38)% | 11.50% | 7.17% |
| Ratios/Supplemental Data | | | | | |
| Net assets, end of year (000’s omitted) | $ 24,304 | $ 26,389 | $ 20,066 | $ 26,672 | $112,571 |
| Ratios (as a percentage of average daily net assets):(3) | | | | | |
| Expenses | 1.91% (4) | 1.90% | 1.92% | 1.93% | 1.92% |
| Net investment income | 0.43% | 0.05% | 0.50% | 0.58% | 0.26% |
| Portfolio Turnover of the Portfolio | 29% | 11% | 25% | 18% | 10% |
| (1) | Computed using average shares outstanding. |
| (2) | Returns are historical and are calculated by determining the percentage change in net asset value with all distributions reinvested and do not reflect the effect of sales charges. |
| (3) | Includes the Fund’s share of the Portfolio’s allocated expenses. |
| (4) | Includes a reduction by the investment adviser of a portion of the Portfolio's adviser fee due to the Portfolio’s investment in the Liquidity Fund (equal to less than 0.005% of average daily net assets for the year ended October 31, 2022). |
12
See Notes to Financial Statements.
Eaton Vance
Tax-Managed Value Fund
October 31, 2022
Financial Highlights — continued
| | Class I |
| | Year Ended October 31, |
| | 2022 | 2021 | 2020 | 2019 | 2018 |
| Net asset value — Beginning of year | $ 39.650 | $ 28.080 | $ 29.790 | $ 26.920 | $ 25.170 |
| Income (Loss) From Operations | | | | | |
| Net investment income(1) | $ 0.512 | $ 0.373 | $ 0.421 | $ 0.411 | $ 0.331 |
| Net realized and unrealized gain (loss) | (3.807) | 11.690 | (1.707) | 2.914 | 1.732 |
| Total income (loss) from operations | $ (3.295) | $ 12.063 | $ (1.286) | $ 3.325 | $ 2.063 |
| Less Distributions | | | | | |
| From net investment income | $ (0.400) | $ (0.417) | $ (0.409) | $ (0.348) | $ (0.313) |
| From net realized gain | (1.445) | (0.076) | (0.015) | (0.107) | — |
| Total distributions | $ (1.845) | $ (0.493) | $ (0.424) | $ (0.455) | $ (0.313) |
| Net asset value — End of year | $ 34.510 | $ 39.650 | $ 28.080 | $ 29.790 | $ 26.920 |
| Total Return(2) | (8.70)% | 43.41% | (4.42)% | 12.61% | 8.25% |
| Ratios/Supplemental Data | | | | | |
| Net assets, end of year (000’s omitted) | $262,732 | $283,334 | $189,549 | $195,921 | $169,397 |
| Ratios (as a percentage of average daily net assets):(3) | | | | | |
| Expenses | 0.91% (4) | 0.90% | 0.92% | 0.93% | 0.92% |
| Net investment income | 1.42% | 1.05% | 1.49% | 1.49% | 1.24% |
| Portfolio Turnover of the Portfolio | 29% | 11% | 25% | 18% | 10% |
| (1) | Computed using average shares outstanding. |
| (2) | Returns are historical and are calculated by determining the percentage change in net asset value with all distributions reinvested. |
| (3) | Includes the Fund’s share of the Portfolio’s allocated expenses. |
| (4) | Includes a reduction by the investment adviser of a portion of the Portfolio's adviser fee due to the Portfolio’s investment in the Liquidity Fund (equal to less than 0.005% of average daily net assets for the year ended October 31, 2022). |
13
See Notes to Financial Statements.
Eaton Vance
Tax-Managed Value Fund
October 31, 2022
Notes to Financial Statements
1 Significant Accounting Policies
Eaton Vance Tax-Managed Value Fund (the Fund) is a diversified series of Eaton Vance Mutual Funds Trust (the Trust). The Trust is a Massachusetts business trust registered under the Investment Company Act of 1940, as amended (the 1940 Act), as an open-end management investment company. The Fund offers three classes of shares. Class A shares are generally sold subject to a sales charge imposed at time of purchase. Class C shares are sold at net asset value and are generally subject to a contingent deferred sales charge (see Note 5). Effective November 5, 2020, Class C shares automatically convert to Class A shares eight years after their purchase as described in the Fund’s prospectus. Class I shares are sold at net asset value and are not subject to a sales charge. Each class represents a pro-rata interest in the Fund, but votes separately on class-specific matters and (as noted below) is subject to different expenses. Realized and unrealized gains and losses and net investment income and losses, other than class-specific expenses, are allocated daily to each class of shares based on the relative net assets of each class to the total net assets of the Fund. Each class of shares differs in its distribution plan and certain other class-specific expenses. The Fund invests all of its investable assets in interests in Tax-Managed Value Portfolio (the Portfolio), a Massachusetts business trust, having the same investment objective and policies as the Fund. The value of the Fund’s investment in the Portfolio reflects the Fund’s proportionate interest in the net assets of the Portfolio (81.7% at October 31, 2022). The performance of the Fund is directly affected by the performance of the Portfolio. The financial statements of the Portfolio, including the portfolio of investments, are included elsewhere in this report and should be read in conjunction with the Fund’s financial statements.
The following is a summary of significant accounting policies of the Fund. The policies are in conformity with accounting principles generally accepted in the United States of America (U.S. GAAP). The Fund is an investment company and follows accounting and reporting guidance in the Financial Accounting Standards Board (FASB) Accounting Standards Codification Topic 946.
A Investment Valuation—Valuation of securities by the Portfolio is discussed in Note 1A of the Portfolio's Notes to Financial Statements, which are included elsewhere in this report.
B Income— The Fund's net investment income or loss consists of the Fund's pro-rata share of the net investment income or loss of the Portfolio, less all actual and accrued expenses of the Fund.
C Federal Taxes—The Fund's policy is to comply with the provisions of the Internal Revenue Code applicable to regulated investment companies and to distribute to shareholders each year substantially all of its net investment income, and all or substantially all of its net realized capital gains. Accordingly, no provision for federal income or excise tax is necessary.
As of October 31, 2022, the Fund had no uncertain tax positions that would require financial statement recognition, de-recognition, or disclosure. The Fund files a U.S. federal income tax return annually after its fiscal year-end, which is subject to examination by the Internal Revenue Service for a period of three years from the date of filing.
D Expenses—The majority of expenses of the Trust are directly identifiable to an individual fund. Expenses which are not readily identifiable to a specific fund are allocated taking into consideration, among other things, the nature and type of expense and the relative size of the funds.
E Use of Estimates—The preparation of the financial statements in conformity with U.S. GAAP requires management to make estimates and assumptions that affect the reported amounts of assets and liabilities at the date of the financial statements and the reported amounts of income and expense during the reporting period. Actual results could differ from those estimates.
F Indemnifications—Under the Trust’s organizational documents, its officers and Trustees may be indemnified against certain liabilities and expenses arising out of the performance of their duties to the Fund. Under Massachusetts law, if certain conditions prevail, shareholders of a Massachusetts business trust (such as the Trust) could be deemed to have personal liability for the obligations of the Trust. However, the Trust’s Declaration of Trust contains an express disclaimer of liability on the part of Fund shareholders and the By-laws provide that the Trust shall assume, upon request by the shareholder, the defense on behalf of any Fund shareholders. Moreover, the By-laws also provide for indemnification out of Fund property of any shareholder held personally liable solely by reason of being or having been a shareholder for all loss or expense arising from such liability. Additionally, in the normal course of business, the Fund enters into agreements with service providers that may contain indemnification clauses. The Fund’s maximum exposure under these arrangements is unknown as this would involve future claims that may be made against the Fund that have not yet occurred.
G Other—Investment transactions are accounted for on a trade date basis.
Eaton Vance
Tax-Managed Value Fund
October 31, 2022
Notes to Financial Statements — continued
2 Distributions to Shareholders and Income Tax Information
It is the present policy of the Fund to make at least one distribution annually (normally in December) of all or substantially all of its net investment income and to distribute annually all or substantially all of its net realized capital gains. Distributions to shareholders are recorded on the ex-dividend date. Distributions are declared separately for each class of shares. Shareholders may reinvest income and capital gain distributions in additional shares of the same class of the Fund at the net asset value as of the ex-dividend date or, at the election of the shareholder, receive distributions in cash. Distributions to shareholders are determined in accordance with income tax regulations, which may differ from U.S. GAAP. As required by U.S. GAAP, only distributions in excess of tax basis earnings and profits are reported in the financial statements as a return of capital. Permanent differences between book and tax accounting relating to distributions are reclassified to paid-in capital. For tax purposes, distributions from short-term capital gains are considered to be from ordinary income.
The tax character of distributions declared for the years ended October 31, 2022 and October 31, 2021 was as follows:
| | Year Ended October 31, |
| | 2022 | 2021 |
| Ordinary income | $ 6,941,399 | $7,203,140 |
| Long-term capital gains | $29,290,456 | $1,531,123 |
During the year ended October 31, 2022, distributable earnings was decreased by $22,638,895 and paid-in capital was increased by $22,638,895 due to the Fund’s use of equalization accounting and differences between book and tax accounting for redemptions in-kind. Tax equalization accounting allows the Fund to treat as a distribution that portion of redemption proceeds representing a redeeming shareholder’s portion of undistributed taxable income and net capital gains. These reclassifications had no effect on the net assets or net asset value per share of the Fund.
As of October 31, 2022, the components of distributable earnings (accumulated loss) on a tax basis were as follows:
| Undistributed ordinary income | $ 6,713,548 |
| Undistributed long-term capital gains | 7,444,350 |
| Net unrealized appreciation | 344,445,379 |
| Distributable earnings | $358,603,277 |
3 Investment Adviser Fee and Other Transactions with Affiliates
The investment adviser fee is earned by Eaton Vance Management (EVM), an indirect, wholly-owned subsidiary of Morgan Stanley, as compensation for investment advisory services rendered to the Fund. The fee is computed at an annual rate as a percentage of the Fund’s average daily net assets that are not invested in other investment companies for which EVM or its affiliates serve as investment adviser and receive an advisory fee as follows and is payable monthly:
| Average Daily Net Assets | Annual Fee Rate |
| Up to $500 million | 0.6500% |
| $500 million but less than $1 billion | 0.6250% |
| $1 billion but less than $2 billion | 0.6000% |
| $2 billion but less than $5 billion | 0.5750% |
| $5 billion and over | 0.5550% |
For the year ended October 31, 2022, the Fund incurred no investment adviser fee on such assets. To the extent the Fund’s assets are invested in the Portfolio, the Fund is allocated its share of the Portfolio’s investment adviser fee. The Portfolio has engaged Boston Management and Research (BMR) to render investment advisory services. See Note 2 of the Portfolio’s Notes to Financial Statements which are included elsewhere in this report. The administration fee is earned by EVM as compensation for administrative services rendered to the Fund. The fee is computed at an annual rate of 0.15% of the Fund’s average daily net assets. For the year ended October 31, 2022, the administration fee amounted to $1,133,024.
EVM provides sub-transfer agency and related services to the Fund pursuant to a Sub-Transfer Agency Support Services Agreement. For the year ended October 31, 2022, EVM earned $68,574 from the Fund pursuant to such agreement, which is included in transfer and dividend disbursing agent fees on
Eaton Vance
Tax-Managed Value Fund
October 31, 2022
Notes to Financial Statements — continued
the Statement of Operations. The Fund was informed that Eaton Vance Distributors, Inc. (EVD), an affiliate of EVM and the Fund’s principal underwriter, received $21,689 as its portion of the sales charge on sales of Class A shares for the year ended October 31, 2022. EVD also received distribution and service fees from Class A and Class C shares (see Note 4) and contingent deferred sales charges (see Note 5).
Trustees and officers of the Fund who are members of EVM’s or BMR's organizations receive remuneration for their services to the Fund out of the investment adviser fee. Certain officers and Trustees of the Fund and the Portfolio are officers of the above organizations.
4 Distribution Plans
The Fund has in effect a distribution plan for Class A shares (Class A Plan) pursuant to Rule 12b-1 under the 1940 Act. Pursuant to the Class A Plan, the Fund pays EVD a distribution and service fee of 0.25% per annum of its average daily net assets attributable to Class A shares for distribution services and facilities provided to the Fund by EVD, as well as for personal services and/or the maintenance of shareholder accounts. Distribution and service fees paid or accrued to EVD for the year ended October 31, 2022 amounted to $1,144,636 for Class A shares.
The Fund also has in effect a distribution plan for Class C shares (Class C Plan) pursuant to Rule 12b-1 under the 1940 Act. Pursuant to the Class C Plan, the Fund pays EVD amounts equal to 0.75% per annum of its average daily net assets attributable to Class C shares for providing ongoing distribution services and facilities to the Fund. For the year ended October 31, 2022, the Fund paid or accrued to EVD $187,776 for Class C shares.
Pursuant to the Class C Plan, the Fund also makes payments of service fees to EVD, financial intermediaries and other persons in amounts equal to 0.25% per annum of its average daily net assets attributable to that class. Service fees paid or accrued are for personal services and/or the maintenance of shareholder accounts. They are separate and distinct from the sales commissions and distribution fees payable to EVD. Service fees paid or accrued for the year ended October 31, 2022 amounted to $62,592 for Class C shares.
Distribution and service fees are subject to the limitations contained in the Financial Industry Regulatory Authority Rule 2341(d).
5 Contingent Deferred Sales Charges
A contingent deferred sales charge (CDSC) of 1% generally is imposed on redemptions of Class C shares made within 12 months of purchase. Class A shares may be subject to a 1% CDSC if redeemed within 12 months (18 months prior to April 29, 2022) of purchase (depending on the circumstances of purchase). Generally, the CDSC is based upon the lower of the net asset value at date of redemption or date of purchase. No charge is levied on shares acquired by reinvestment of dividends or capital gain distributions. For the year ended October 31, 2022, the Fund was informed that EVD received approximately $100 and $2,000 of CDSCs paid by Class A and Class C shareholders, respectively.
6 Investment Transactions
For the year ended October 31, 2022, increases and decreases in the Fund's investment in the Portfolio aggregated $15,740,646 and $35,952,836, respectively. Decreases in the Fund's investment in the Portfolio include distributions of securities as the result of redemptions in-kind of $26,734,849.
7 Shares of Beneficial Interest
The Fund’s Declaration of Trust permits the Trustees to issue an unlimited number of full and fractional shares of beneficial interest (without par value). Such shares may be issued in a number of different series (such as the Fund) and classes. Sales and redemptions of Class I shares include shares purchased and redeemed in connection with the ReFlow liquidity program, a program designed to provide an alternative liquidity source for mutual funds experiencing net redemptions of their shares. Transactions in Fund shares, including direct exchanges pursuant to share class conversions for all periods presented, were as follows:
| | Year Ended
October 31, 2022 | | Year Ended
October 31, 2021 |
| | Shares | Amount | | Shares | Amount |
| Class A | | | | | |
| Sales | 441,788 | $ 15,988,190 | | 508,765 | $ 17,831,568 |
| Issued to shareholders electing to receive payments of distributions in Fund shares | 499,033 | 18,918,332 | | 145,510 | 4,625,757 |
| Redemptions | (974,887) | (35,334,669) | | (1,017,458) | (35,413,817) |
| Net decrease | (34,066) | $ (428,147) | | (363,183) | $(12,956,492) |
Eaton Vance
Tax-Managed Value Fund
October 31, 2022
Notes to Financial Statements — continued
| | Year Ended
October 31, 2022 | | Year Ended
October 31, 2021 |
| | Shares | Amount | | Shares | Amount |
| Class C | | | | | |
| Sales | 167,228 | $ 5,812,328 | | 128,397 | $ 4,429,673 |
| Issued to shareholders electing to receive payments of distributions in Fund shares | 26,062 | 952,311 | | 3,030 | 93,077 |
| Redemptions | (151,235) | (5,202,073) | | (182,833) | (5,959,145) |
| Net increase (decrease) | 42,055 | $ 1,562,566 | | (51,406) | $ (1,436,395) |
| Class I | | | | | |
| Sales | 2,314,128 | $ 83,408,226 | | 1,639,132 | $ 57,300,081 |
| Issued to shareholders electing to receive payments of distributions in Fund shares | 314,485 | 11,859,243 | | 93,737 | 2,963,953 |
| Redemptions | (2,160,896) | (77,482,799) | | (1,336,684) | (45,812,537) |
| Net increase | 467,717 | $ 17,784,670 | | 396,185 | $ 14,451,497 |
Eaton Vance
Tax-Managed Value Fund
October 31, 2022
Report of Independent Registered Public Accounting Firm
To the Trustees of Eaton Vance Mutual Funds Trust and Shareholders of Eaton Vance Tax-Managed Value Fund:
Opinion on the Financial Statements and Financial Highlights
We have audited the accompanying statement of assets and liabilities of Eaton Vance Tax-Managed Value Fund (the “Fund") (one of the funds constituting Eaton Vance Mutual Funds Trust), as of October 31, 2022, the related statement of operations for the year then ended, the statements of changes in net assets for each of the two years in the period then ended, the financial highlights for each of the five years in the period then ended, and the related notes. In our opinion, the financial statements and financial highlights present fairly, in all material respects, the financial position of the Fund as of October 31, 2022, and the results of its operations for the year then ended, the changes in its net assets for each of the two years in the period then ended, and the financial highlights for each of the five years in the period then ended, in conformity with accounting principles generally accepted in the United States of America.
Basis for Opinion
These financial statements and financial highlights are the responsibility of the Fund's management. Our responsibility is to express an opinion on the Fund's financial statements and financial highlights based on our audits. We are a public accounting firm registered with the Public Company Accounting Oversight Board (United States) (PCAOB) and are required to be independent with respect to the Fund in accordance with the U.S. federal securities laws and the applicable rules and regulations of the Securities and Exchange Commission and the PCAOB.
We conducted our audits in accordance with the standards of the PCAOB. Those standards require that we plan and perform the audit to obtain reasonable assurance about whether the financial statements and financial highlights are free of material misstatement, whether due to error or fraud. The Fund is not required to have, nor were we engaged to perform, an audit of its internal control over financial reporting. As part of our audits, we are required to obtain an understanding of internal control over financial reporting but not for the purpose of expressing an opinion on the effectiveness of the Fund’s internal control over financial reporting. Accordingly, we express no such opinion.
Our audits included performing procedures to assess the risks of material misstatement of the financial statements and financial highlights, whether due to error or fraud, and performing procedures that respond to those risks. Such procedures included examining, on a test basis, evidence regarding the amounts and disclosures in the financial statements and financial highlights. Our audits also included evaluating the accounting principles used and significant estimates made by management, as well as evaluating the overall presentation of the financial statements and financial highlights. We believe that our audits provide a reasonable basis for our opinion.
/s/ Deloitte & Touche LLP
Boston, Massachusetts
December 22, 2022
We have served as the auditor of one or more Eaton Vance investment companies since 1959.
Eaton Vance
Tax-Managed Value Fund
October 31, 2022
Federal Tax Information (Unaudited)
The Form 1099-DIV you receive in February 2023 will show the tax status of all distributions paid to your account in calendar year 2022. Shareholders are advised to consult their own tax adviser with respect to the tax consequences of their investment in the Fund. As required by the Internal Revenue Code and/or regulations, shareholders must be notified regarding the status of qualified dividend income for individuals, the dividends received deduction for corporations and capital gains dividends.
Qualified Dividend Income. For the fiscal year ended October 31, 2022, the Fund designates approximately $15,989,843, or up to the maximum amount of such dividends allowable pursuant to the Internal Revenue Code, as qualified dividend income eligible for the reduced tax rate of 15%.
Dividends Received Deduction. Corporate shareholders are generally entitled to take the dividends received deduction on the portion of the Fund’s dividend distribution that qualifies under tax law. For the Fund’s fiscal 2022 ordinary income dividends, 100% qualifies for the corporate dividends received deduction.
Capital Gains Dividends. The Fund hereby designates as a capital gain dividend with respect to the taxable year ended October 31, 2022, $7,884,471 or, if subsequently determined to be different, the net capital gain of such year.
Tax-Managed Value Portfolio
October 31, 2022
| Security | Shares | Value |
| Aerospace & Defense — 2.4% |
| Hexcel Corp. | | 179,575 | $ 10,002,327 |
| Raytheon Technologies Corp. | | 113,000 | 10,714,660 |
| | | | $ 20,716,987 |
| Banks — 13.3% |
| Bank of America Corp. | | 426,076 | $ 15,355,779 |
| Citizens Financial Group, Inc. | | 238,499 | 9,754,609 |
| JPMorgan Chase & Co. | | 263,180 | 33,129,098 |
| KeyCorp | | 669,553 | 11,964,912 |
| PNC Financial Services Group, Inc. (The) | | 142,029 | 22,984,553 |
| Truist Financial Corp. | | 159,821 | 7,158,383 |
| U.S. Bancorp | | 187,164 | 7,945,112 |
| Wells Fargo & Co. | | 188,847 | 8,685,074 |
| | | | $116,977,520 |
| Beverages — 1.1% |
| Constellation Brands, Inc., Class A | | 38,140 | $ 9,423,631 |
| | | | $ 9,423,631 |
| Building Products — 0.5% |
| Carrier Global Corp. | | 113,000 | $ 4,492,880 |
| | | | $ 4,492,880 |
| Capital Markets — 3.6% |
| Ameriprise Financial, Inc. | | 32,971 | $ 10,191,995 |
| Goldman Sachs Group, Inc. (The) | | 62,358 | 21,482,955 |
| | | | $ 31,674,950 |
| Chemicals — 3.1% |
| FMC Corp. | | 106,733 | $ 12,690,554 |
| Linde PLC | | 50,216 | 14,931,727 |
| | | | $ 27,622,281 |
| Containers & Packaging — 1.1% |
| Ball Corp. | | 46,376 | $ 2,290,511 |
| Packaging Corp. of America | | 64,683 | 7,775,543 |
| | | | $ 10,066,054 |
| Diversified Telecommunication Services — 1.1% |
| Verizon Communications, Inc. | | 250,449 | $ 9,359,279 |
| | | | $ 9,359,279 |
| Security | Shares | Value |
| Electric Utilities — 3.5% |
| NextEra Energy, Inc. | | 392,766 | $ 30,439,365 |
| | | | $ 30,439,365 |
| Electrical Equipment — 1.0% |
| Rockwell Automation, Inc. | | 33,916 | $ 8,658,755 |
| | | | $ 8,658,755 |
| Energy Equipment & Services — 1.2% |
| Halliburton Co. | | 293,530 | $ 10,690,363 |
| | | | $ 10,690,363 |
| Entertainment — 0.9% |
| Walt Disney Co. (The)(1) | | 75,963 | $ 8,093,098 |
| | | | $ 8,093,098 |
| Equity Real Estate Investment Trusts (REITs) — 4.1% |
| AvalonBay Communities, Inc. | | 47,915 | $ 8,390,875 |
| Boston Properties, Inc. | | 59,105 | 4,296,934 |
| CubeSmart | | 174,330 | 7,299,197 |
| Invitation Homes, Inc. | | 116,709 | 3,698,508 |
| Mid-America Apartment Communities, Inc. | | 77,009 | 12,125,067 |
| | | | $ 35,810,581 |
| Food & Staples Retailing — 2.9% |
| BJ's Wholesale Club Holdings, Inc.(1) | | 187,587 | $ 14,519,234 |
| Performance Food Group Co.(1) | | 211,410 | 11,001,776 |
| | | | $ 25,521,010 |
| Food Products — 3.0% |
| Hershey Co. (The) | | 47,695 | $ 11,388,135 |
| Nestle S.A. | | 138,900 | 15,120,488 |
| | | | $ 26,508,623 |
| Health Care Equipment & Supplies — 1.5% |
| Stryker Corp. | | 58,093 | $ 13,317,239 |
| | | | $ 13,317,239 |
| Health Care Providers & Services — 1.9% |
| UnitedHealth Group, Inc. | | 30,029 | $ 16,670,599 |
| | | | $ 16,670,599 |
| Hotels, Restaurants & Leisure — 1.0% |
| Papa John's International, Inc.(2) | | 117,978 | $ 8,568,742 |
| | | | $ 8,568,742 |
20
See Notes to Financial Statements.
Tax-Managed Value Portfolio
October 31, 2022
Portfolio of Investments — continued
| Security | Shares | Value |
| Household Durables — 0.9% |
| D.R. Horton, Inc. | | 99,360 | $ 7,638,797 |
| | | | $ 7,638,797 |
| Industrial Conglomerates — 1.9% |
| Honeywell International, Inc. | | 83,731 | $ 17,082,799 |
| | | | $ 17,082,799 |
| Insurance — 2.5% |
| Arch Capital Group, Ltd.(1) | | 183,981 | $ 10,578,907 |
| Travelers Cos., Inc. (The) | | 64,030 | 11,810,974 |
| | | | $ 22,389,881 |
| Interactive Media & Services — 3.5% |
| Alphabet, Inc., Class A(1) | | 158,480 | $ 14,977,945 |
| Alphabet, Inc., Class C(1) | | 163,980 | 15,522,347 |
| | | | $ 30,500,292 |
| IT Services — 1.0% |
| Visa, Inc., Class A | | 44,697 | $ 9,259,431 |
| | | | $ 9,259,431 |
| Leisure Products — 0.4% |
| Hasbro, Inc. | | 47,605 | $ 3,106,226 |
| | | | $ 3,106,226 |
| Life Sciences Tools & Services — 2.4% |
| Thermo Fisher Scientific, Inc. | | 40,907 | $ 21,024,971 |
| | | | $ 21,024,971 |
| Machinery — 5.2% |
| Ingersoll Rand, Inc. | | 353,722 | $ 17,862,961 |
| Otis Worldwide Corp. | | 56,500 | 3,991,160 |
| Parker-Hannifin Corp. | | 32,913 | 9,565,176 |
| Westinghouse Air Brake Technologies Corp. | | 150,850 | 14,071,288 |
| | | | $ 45,490,585 |
| Multi-Utilities — 3.2% |
| CMS Energy Corp. | | 68,853 | $ 3,928,063 |
| Sempra Energy | | 162,537 | 24,533,335 |
| | | | $ 28,461,398 |
| Oil, Gas & Consumable Fuels — 9.5% |
| Chevron Corp. | | 182,306 | $ 32,979,155 |
| ConocoPhillips | | 129,368 | 16,312,011 |
| Security | Shares | Value |
| Oil, Gas & Consumable Fuels (continued) |
| EOG Resources, Inc. | | 167,473 | $ 22,863,414 |
| Phillips 66 | | 109,182 | 11,386,591 |
| | | | $ 83,541,171 |
| Personal Products — 1.4% |
| Estee Lauder Cos., Inc. (The), Class A | | 61,550 | $ 12,340,159 |
| | | | $ 12,340,159 |
| Pharmaceuticals — 11.1% |
| Bristol-Myers Squibb Co. | | 183,774 | $ 14,236,972 |
| Eli Lilly & Co. | | 55,038 | 19,928,709 |
| Johnson & Johnson | | 116,398 | 20,249,760 |
| Merck & Co., Inc. | | 167,049 | 16,905,359 |
| Novo Nordisk A/S ADR | | 66,803 | 7,270,838 |
| Royalty Pharma PLC, Class A | | 82,011 | 3,470,706 |
| Zoetis, Inc. | | 101,295 | 15,273,260 |
| | | | $ 97,335,604 |
| Road & Rail — 1.1% |
| Union Pacific Corp. | | 50,876 | $ 10,029,695 |
| | | | $ 10,029,695 |
| Semiconductors & Semiconductor Equipment — 3.6% |
| Intel Corp. | | 258,430 | $ 7,347,165 |
| Micron Technology, Inc. | | 84,156 | 4,552,840 |
| QUALCOMM, Inc. | | 69,710 | 8,202,078 |
| Texas Instruments, Inc. | | 75,008 | 12,048,535 |
| | | | $ 32,150,618 |
| Software — 1.1% |
| Microsoft Corp. | | 25,630 | $ 5,949,492 |
| Oracle Corp. | | 52,884 | 4,128,654 |
| | | | $ 10,078,146 |
| Specialty Retail — 2.7% |
| Home Depot, Inc. (The) | | 81,060 | $ 24,004,298 |
| | | | $ 24,004,298 |
| Wireless Telecommunication Services — 1.0% |
| T-Mobile US, Inc.(1) | | 59,830 | $ 9,067,835 |
| | | | $ 9,067,835 |
Total Common Stocks
(identified cost $421,433,273) | | | $878,113,863 |
21
See Notes to Financial Statements.
Tax-Managed Value Portfolio
October 31, 2022
Portfolio of Investments — continued
| Short-Term Investments — 0.3% |
| Security | Shares | Value |
| Morgan Stanley Institutional Liquidity Funds - Government Portfolio, Institutional Class, 2.88%(3) | | 2,138,376 | $ 2,138,376 |
Total Short-Term Investments
(identified cost $2,138,376) | | | $ 2,138,376 |
Total Investments — 100.0%
(identified cost $423,571,649) | | | $880,252,239 |
| Other Assets, Less Liabilities — 0.0%(4) | | | $ 375,786 |
| Net Assets — 100.0% | | | $880,628,025 |
| The percentage shown for each investment category in the Portfolio of Investments is based on net assets. |
| (1) | Non-income producing security. |
| (2) | All or a portion of this security was on loan at October 31, 2022. The aggregate market value of securities on loan at October 31, 2022 was $126,667. |
| (3) | May be deemed to be an affiliated investment company. The rate shown is the annualized seven-day yield as of October 31, 2022. |
| (4) | Amount is less than 0.05%. |
| Abbreviations: |
| ADR | – American Depositary Receipt |
22
See Notes to Financial Statements.
Tax-Managed Value Portfolio
October 31, 2022
Statement of Assets and Liabilities
| | October 31, 2022 |
| Assets | |
| Unaffiliated investments, at value (identified cost $421,433,273) — including $126,667 of securities on loan | $ 878,113,863 |
| Affiliated investment, at value (identified cost $2,138,376) | 2,138,376 |
| Dividends receivable | 790,521 |
| Dividends receivable from affiliated investment | 3,021 |
| Securities lending income receivable | 61 |
| Tax reclaims receivable | 225,553 |
| Total assets | $881,271,395 |
| Liabilities | |
| Payable to affiliates: | |
| Investment adviser fee | $ 452,582 |
| Trustees' fees | 5,486 |
| Accrued expenses | 185,302 |
| Total liabilities | $ 643,370 |
| Net Assets applicable to investors' interest in Portfolio | $880,628,025 |
23
See Notes to Financial Statements.
Tax-Managed Value Portfolio
October 31, 2022
| | Year Ended |
| | October 31, 2022 |
| Investment Income | |
| Dividend income (net of foreign taxes withheld of $158,403) | $ 21,619,433 |
| Dividend income from affiliated investments | 11,968 |
| Securities lending income, net | 6,733 |
| Total investment income | $ 21,638,134 |
| Expenses | |
| Investment adviser fee | $ 5,917,273 |
| Trustees’ fees and expenses | 59,225 |
| Custodian fee | 235,195 |
| Legal and accounting services | 73,335 |
| Miscellaneous | 26,950 |
| Total expenses | $ 6,311,978 |
| Deduct: | |
| Waiver and/or reimbursement of expenses by affiliate | $ 799 |
| Total expense reductions | $ 799 |
| Net expenses | $ 6,311,179 |
| Net investment income | $ 15,326,955 |
| Realized and Unrealized Gain (Loss) | |
| Net realized gain (loss): | |
| Investment transactions | $ 31,232,441(1) |
| Investment transactions - affiliated investments | (670) |
| Foreign currency transactions | (31,441) |
| Net realized gain | $ 31,200,330 |
| Change in unrealized appreciation (depreciation): | |
| Investments | $ (129,809,007) |
| Foreign currency | (26,281) |
| Net change in unrealized appreciation (depreciation) | $(129,835,288) |
| Net realized and unrealized loss | $ (98,634,958) |
| Net decrease in net assets from operations | $ (83,308,003) |
| (1) | Includes $21,802,941 of net realized gains from redemptions in-kind. |
24
See Notes to Financial Statements.
Tax-Managed Value Portfolio
October 31, 2022
Statements of Changes in Net Assets
| | Year Ended October 31, |
| | 2022 | 2021 |
| Increase (Decrease) in Net Assets | | |
| From operations: | | |
| Net investment income | $ 15,326,955 | $ 11,303,165 |
| Net realized gain | 31,200,330 (1) | 50,830,291 (2) |
| Net change in unrealized appreciation (depreciation) | (129,835,288) | 241,676,051 |
| Net increase (decrease) in net assets from operations | $ (83,308,003) | $303,809,507 |
| Capital transactions: | | |
| Contributions | $ 19,403,167 | $ 20,515,433 |
| Withdrawals | (49,804,502) | (34,694,681) |
| Net decrease in net assets from capital transactions | $ (30,401,335) | $ (14,179,248) |
| Net increase (decrease) in net assets | $(113,709,338) | $289,630,259 |
| Net Assets | | |
| At beginning of year | $ 994,337,363 | $ 704,707,104 |
| At end of year | $ 880,628,025 | $994,337,363 |
| (1) | Includes $21,802,941 of net realized gains from redemptions in-kind. |
| (2) | Includes $13,829,598 of net realized gains from redemptions in-kind. |
25
See Notes to Financial Statements.
Tax-Managed Value Portfolio
October 31, 2022
| | Year Ended October 31, |
| Ratios/Supplemental Data | 2022 | 2021 | 2020 | 2019 | 2018 |
| Ratios (as a percentage of average daily net assets): | | | | | |
| Expenses | 0.68% (1) | 0.68% | 0.68% | 0.68% | 0.68% |
| Net investment income | 1.65% | 1.27% | 1.73% | 1.74% | 1.49% |
| Portfolio Turnover | 29% | 11% | 25% | 18% | 10% |
| Total Return | (8.51)% | 43.69% | (4.18)% | 12.90% | 8.55% |
| Net assets, end of year (000’s omitted) | $880,628 | $994,337 | $704,707 | $788,248 | $730,479 |
| (1) | Includes a reduction by the investment adviser of a portion of its adviser fee due to the Portfolio's investment in the Liquidity Fund (equal to less than 0.005% of average daily net assets for the year ended October 31, 2022). |
26
See Notes to Financial Statements.
Tax-Managed Value Portfolio
October 31, 2022
Notes to Financial Statements
1 Significant Accounting Policies
Tax-Managed Value Portfolio (the Portfolio) is a Massachusetts business trust registered under the Investment Company Act of 1940, as amended (the 1940 Act), as a diversified, open-end management investment company. The Portfolio’s investment objective is to achieve long-term, after-tax returns by investing primarily in value stocks. The Declaration of Trust permits the Trustees to issue interests in the Portfolio. At October 31, 2022, Eaton Vance Tax-Managed Value Fund and Eaton Vance Tax-Managed Equity Asset Allocation Fund held an interest of 81.7% and 18.3%, respectively, in the Portfolio.
The following is a summary of significant accounting policies of the Portfolio. The policies are in conformity with accounting principles generally accepted in the United States of America (U.S. GAAP). The Portfolio is an investment company and follows accounting and reporting guidance in the Financial Accounting Standards Board (FASB) Accounting Standards Codification Topic 946.
A Investment Valuation—The following methodologies are used to determine the market value or fair value of investments.
Equity Securities. Equity securities listed on a U.S. securities exchange generally are valued at the last sale or closing price on the day of valuation or, if no sales took place on such date, at the mean between the closing bid and ask prices on the exchange where such securities are principally traded. Equity securities listed on the NASDAQ National Market System are valued at the NASDAQ official closing price. Unlisted or listed securities for which closing sales prices or closing quotations are not available are valued at the mean between the latest available bid and ask prices.
Foreign Securities and Currencies. Foreign securities and currencies are valued in U.S. dollars, based on foreign currency exchange rate quotations supplied by a third party pricing service. The pricing service uses a proprietary model to determine the exchange rate. Inputs to the model include reported trades and implied bid/ask spreads. The daily valuation of exchange-traded foreign securities generally is determined as of the close of trading on the principal exchange on which such securities trade. Events occurring after the close of trading on foreign exchanges may result in adjustments to the valuation of foreign securities to more accurately reflect their fair value as of the close of regular trading on the New York Stock Exchange. When valuing foreign equity securities that meet certain criteria, the Portfolio's Trustees have approved the use of a fair value service that values such securities to reflect market trading that occurs after the close of the applicable foreign markets of comparable securities or other instruments that have a strong correlation to the fair-valued securities.
Other. Investments in management investment companies (including money market funds) that do not trade on an exchange are valued at the net asset value as of the close of each business day.
Fair Valuation. In connection with Rule 2a-5 of the 1940 Act, which became effective September 8, 2022, the Trustees have designated the Portfolio’s investment adviser as its valuation designee. Investments for which valuations or market quotations are not readily available or are deemed unreliable are valued by the investment adviser, as valuation designee, at fair value using methods that most fairly reflect the security’s “fair value”, which is the amount that the Portfolio might reasonably expect to receive for the security upon its current sale in the ordinary course. Each such determination is based on a consideration of relevant factors, which are likely to vary from one pricing context to another. These factors may include, but are not limited to, the type of security, the existence of any contractual restrictions on the security’s disposition, the price and extent of public trading in similar securities of the issuer or of comparable companies or entities, quotations or relevant information obtained from broker/dealers or other market participants, information obtained from the issuer, analysts, and/or the appropriate stock exchange (for exchange-traded securities), an analysis of the company’s or entity’s financial statements, and an evaluation of the forces that influence the issuer and the market(s) in which the security is purchased and sold.
B Investment Transactions—Investment transactions for financial statement purposes are accounted for on a trade date basis. Realized gains and losses on investments sold are determined on the basis of identified cost.
C Income—Dividend income is recorded on the ex-dividend date for dividends received in cash and/or securities. However, if the ex-dividend date has passed, certain dividends from foreign securities are recorded as the Portfolio is informed of the ex-dividend date. Withholding taxes on foreign dividends and capital gains have been provided for in accordance with the Portfolio's understanding of the applicable countries’ tax rules and rates. In consideration of recent decisions rendered by European courts, the Portfolio has filed additional tax reclaims for previously withheld taxes on dividends earned in certain European Union countries. These filings are subject to various administrative and judicial proceedings within these countries. Due to the uncertainty as to the ultimate resolution of these proceedings, the likelihood of receipt of these reclaims, and the potential timing of payment, no amounts are reflected in the financial statements for such outstanding reclaims.
D Federal Taxes—The Portfolio has elected to be treated as a partnership for federal tax purposes. No provision is made by the Portfolio for federal or state taxes on any taxable income of the Portfolio because each investor in the Portfolio is ultimately responsible for the payment of any taxes on its share of taxable income. Since at least one of the Portfolio's investors is a regulated investment company that invests all or substantially all of its assets in the Portfolio, the Portfolio normally must satisfy the applicable source of income and diversification requirements (under the Internal Revenue Code) in order for its investors to satisfy them. The Portfolio will allocate, at least annually among its investors, each investor's distributive share of the Portfolio's net investment income, net realized capital gains and losses and any other items of income, gain, loss, deduction or credit.
As of October 31, 2022, the Portfolio had no uncertain tax positions that would require financial statement recognition, de-recognition, or disclosure. The Portfolio files a U.S. federal income tax return annually after its fiscal year-end, which is subject to examination by the Internal Revenue Service for a period of three years from the date of filing.
Tax-Managed Value Portfolio
October 31, 2022
Notes to Financial Statements — continued
E Foreign Currency Translation—Investment valuations, other assets, and liabilities initially expressed in foreign currencies are translated each business day into U.S. dollars based upon current exchange rates. Purchases and sales of foreign investment securities and income and expenses denominated in foreign currencies are translated into U.S. dollars based upon currency exchange rates in effect on the respective dates of such transactions. Recognized gains or losses on investment transactions attributable to changes in foreign currency exchange rates are recorded for financial statement purposes as net realized gains and losses on investments. That portion of unrealized gains and losses on investments that results from fluctuations in foreign currency exchange rates is not separately disclosed.
F Use of Estimates—The preparation of the financial statements in conformity with U.S. GAAP requires management to make estimates and assumptions that affect the reported amounts of assets and liabilities at the date of the financial statements and the reported amounts of income and expense during the reporting period. Actual results could differ from those estimates.
G Indemnifications—Under the Portfolio’s organizational documents, its officers and Trustees may be indemnified against certain liabilities and expenses arising out of the performance of their duties to the Portfolio. Under Massachusetts law, if certain conditions prevail, interestholders in the Portfolio could be deemed to have personal liability for the obligations of the Portfolio. However, the Portfolio’s Declaration of Trust contains an express disclaimer of liability on the part of Portfolio interestholders. Additionally, in the normal course of business, the Portfolio enters into agreements with service providers that may contain indemnification clauses. The Portfolio’s maximum exposure under these arrangements is unknown as this would involve future claims that may be made against the Portfolio that have not yet occurred.
2 Investment Adviser Fee and Other Transactions with Affiliates
The investment adviser fee is earned by Boston Management and Research (BMR), an indirect, wholly-owned subsidiary of Morgan Stanley, as compensation for investment advisory services rendered to the Portfolio. The fee is computed at an annual rate as a percentage of the Portfolio’s average daily net assets as follows and is payable monthly:
| Average Daily Net Assets | Annual Fee Rate |
| Up to $500 million | 0.6500% |
| $500 million but less than $1 billion | 0.6250% |
| $1 billion but less than $2 billion | 0.6000% |
| $2 billion but less than $5 billion | 0.5750% |
| $5 billion and over | 0.5550% |
For the year ended October 31, 2022, the investment adviser fee amounted to $5,917,273 or 0.64% of the Portfolio's average daily net assets. Effective April 26, 2022, the Portfolio may invest in a money market fund, the Institutional Class of the Morgan Stanley Institutional Liquidity Funds - Government Portfolio (the “Liquidity Fund”), an open-end management investment company managed by Morgan Stanley Investment Management Inc., a wholly-owned subsidiary of Morgan Stanley. The investment adviser fee paid by the Portfolio is reduced by an amount equal to its pro-rata share of the advisory and administration fees paid by the Portfolio due to its investment in the Liquidity Fund. For the year ended October 31, 2022, the investment adviser fee paid was reduced by $799 relating to the Portfolio's investment in the Liquidity Fund. Prior to April 26, 2022, the Portfolio may have invested its cash in Eaton Vance Cash Reserves Fund, LLC (Cash Reserves Fund), an affiliated investment company managed by Eaton Vance Management (EVM), an affiliate of BMR. EVM did not receive a fee for advisory services provided to Cash Reserves Fund.
Trustees and officers of the Portfolio who are members of EVM’s or BMR’s organizations receive remuneration for their services to the Portfolio out of the investment adviser fee. Trustees of the Portfolio who are not affiliated with the investment adviser may elect to defer receipt of all or a percentage of their annual fees in accordance with the terms of the Trustees Deferred Compensation Plan. For the year ended October 31, 2022, no significant amounts have been deferred. Certain officers and Trustees of the Portfolio are officers of the above organizations.
3 Purchases and Sales of Investments
Purchases and sales of investments, other than short-term obligations and in-kind transactions, aggregated $281,889,397 and $267,991,153, respectively, for the year ended October 31, 2022. In-kind sales for the year ended October 31, 2022 aggregated $26,734,849.
Tax-Managed Value Portfolio
October 31, 2022
Notes to Financial Statements — continued
4 Federal Income Tax Basis of Investments
The cost and unrealized appreciation (depreciation) of investments of the Portfolio at October 31, 2022, as determined on a federal income tax basis, were as follows:
| Aggregate cost | $426,540,711 |
| Gross unrealized appreciation | $ 458,513,668 |
| Gross unrealized depreciation | (4,802,140) |
| Net unrealized appreciation | $453,711,528 |
5 Line of Credit
The Portfolio participates with other portfolios and funds managed by EVM and its affiliates in a $725 million unsecured line of credit agreement with a group of banks, which is in effect through October 24, 2023. In connection with the renewal of the agreement on October 25, 2022, the borrowing limit was decreased from $800 million. Borrowings are made by the Portfolio solely for temporary purposes related to redemptions and other short-term cash needs. Interest is charged to the Portfolio based on its borrowings at an amount above either the Secured Overnight Financing Rate (SOFR) or Federal Funds rate. In addition, a fee computed at an annual rate of 0.15% on the daily unused portion of the line of credit is allocated among the participating portfolios and funds at the end of each quarter. Also in connection with the renewal of the agreement, an arrangement fee totaling $150,000 was incurred that was allocated to the participating portfolios and funds. Because the line of credit is not available exclusively to the Portfolio, it may be unable to borrow some or all of its requested amounts at any particular time. The Portfolio did not have any significant borrowings or allocated fees during the year ended October 31, 2022.
6 Securities Lending Agreement
The Portfolio has established a securities lending agreement with State Street Bank and Trust Company (SSBT) as securities lending agent in which the Portfolio lends portfolio securities to qualified borrowers in exchange for collateral consisting of either cash or securities issued or guaranteed by the U.S. government or its agencies or instrumentalities in an amount at least equal to the market value of the securities on loan. The market value of securities loaned is determined daily and any additional required collateral is delivered to the Portfolio on the next business day. Cash collateral is invested in the State Street Navigator Securities Lending Government Money Market Portfolio, a money market fund registered under the 1940 Act. The Portfolio earns interest on the amount invested but it must pay (and at times receive from) the broker a loan rebate fee computed as a varying percentage of the collateral received. For security loans secured by non-cash collateral, the Portfolio earns a negotiated lending fee from the borrower. A portion of the income earned by the Portfolio from its investment of cash collateral, net of rebate fees, and lending fees received is allocated to SSBT for its services as lending agent and the portion allocated to the Portfolio is presented as securities lending income, net on the Statement of Operations. Non-cash collateral is held by the lending agent on behalf of the Portfolio and cannot be sold or re-pledged by the Portfolio; accordingly, such collateral is not reflected in the Statement of Assets and Liabilities.
The Portfolio is subject to possible delay in the recovery of loaned securities. Pursuant to the securities lending agreement, SSBT has provided indemnification to the Portfolio in the event of default by a borrower with respect to a loan. The Portfolio bears the risk of loss with respect to the investment of cash collateral.
At October 31, 2022, the value of the securities loaned and the value of the collateral received, which exceeded the value of the securities loaned, amounted to $126,667 and $128,645, respectively. Collateral received was comprised of U.S. government and/or agencies securities. The securities lending transactions have no contractual maturity date and each of the Portfolio and borrower has the option to terminate a loan at any time.
Tax-Managed Value Portfolio
October 31, 2022
Notes to Financial Statements — continued
7 Investments in Affiliated Funds
At October 31, 2022, the value of the Portfolio's investment in funds that may be deemed to be affiliated was $2,138,376, which represents 0.3% of the Portfolio's net assets. Transactions in affiliated funds by the Portfolio for the year ended October 31, 2022 were as follows:
| Name | Value,
beginning
of period | Purchases | Sales
proceeds | Net
realized
gain (loss) | Change in
unrealized
appreciation
(depreciation) | Value, end
of period | Dividend
income | Units/Shares,
end of period |
| Short-Term Investments |
| Cash Reserves Fund | $3,069,396 | $31,715,724 | $(34,784,450) | $ (670) | $ — | $ — | $ 837 | — |
| Liquidity Fund | — | 26,574,521 | (24,436,145) | — | — | 2,138,376 | 11,131 | 2,138,376 |
| Total | | | | $(670) | $ — | $2,138,376 | $11,968 | |
8 Fair Value Measurements
Under generally accepted accounting principles for fair value measurements, a three-tier hierarchy to prioritize the assumptions, referred to as inputs, is used in valuation techniques to measure fair value. The three-tier hierarchy of inputs is summarized in the three broad levels listed below.
| • | Level 1 – quoted prices in active markets for identical investments |
| • | Level 2 – other significant observable inputs (including quoted prices for similar investments, interest rates, prepayment speeds, credit risk, etc.) |
| • | Level 3 – significant unobservable inputs (including a fund's own assumptions in determining the fair value of investments) |
In cases where the inputs used to measure fair value fall in different levels of the fair value hierarchy, the level disclosed is determined based on the lowest level input that is significant to the fair value measurement in its entirety. The inputs or methodology used for valuing securities are not necessarily an indication of the risk associated with investing in those securities.
At October 31, 2022, the hierarchy of inputs used in valuing the Portfolio's investments, which are carried at value, were as follows:
| Asset Description | Level 1 | Level 2 | Level 3 | Total |
| Common Stocks: | | | | |
| Communication Services | $ 57,020,504 | $ — | $ — | $ 57,020,504 |
| Consumer Discretionary | 43,318,063 | — | — | 43,318,063 |
| Consumer Staples | 58,672,935 | 15,120,488 | — | 73,793,423 |
| Energy | 94,231,534 | — | — | 94,231,534 |
| Financials | 171,042,351 | — | — | 171,042,351 |
| Health Care | 148,348,413 | — | — | 148,348,413 |
| Industrials | 106,471,701 | — | — | 106,471,701 |
| Information Technology | 51,488,195 | — | — | 51,488,195 |
| Materials | 37,688,335 | — | — | 37,688,335 |
| Real Estate | 35,810,581 | — | — | 35,810,581 |
| Utilities | 58,900,763 | — | — | 58,900,763 |
| Total Common Stocks | $862,993,375 | $15,120,488* | $ — | $878,113,863 |
| Short-Term Investments | $ 2,138,376 | $ — | $ — | $ 2,138,376 |
| Total Investments | $865,131,751 | $15,120,488 | $ — | $880,252,239 |
| * | Includes foreign equity securities whose values were adjusted to reflect market trading of comparable securities or other correlated instruments that occurred after the close of trading in their applicable foreign markets. |
Tax-Managed Value Portfolio
October 31, 2022
Notes to Financial Statements — continued
9 Risks and Uncertainties
Pandemic Risk
An outbreak of respiratory disease caused by a novel coronavirus was first detected in China in late 2019 and subsequently spread internationally. This coronavirus has resulted in closing borders, enhanced health screenings, changes to healthcare service preparation and delivery, quarantines, cancellations, disruptions to supply chains and customer activity, as well as general concern and uncertainty. Health crises caused by outbreaks of disease, such as the coronavirus outbreak, may exacerbate other pre-existing political, social and economic risks and disrupt normal market conditions and operations. The impact of this outbreak has negatively affected the worldwide economy, as well as the economies of individual countries and industries, and could continue to affect the market in significant and unforeseen ways. Other epidemics and pandemics that may arise in the future may have similar effects. Any such impact could adversely affect the Portfolio’s performance, or the performance of the securities in which the Portfolio invests.
Tax-Managed Value Portfolio
October 31, 2022
Report of Independent Registered Public Accounting Firm
To the Trustees and Investors of Tax-Managed Value Portfolio:
Opinion on the Financial Statements and Financial Highlights
We have audited the accompanying statement of assets and liabilities of Tax-Managed Value Portfolio (the “Portfolio"), including the portfolio of investments, as of October 31, 2022, the related statement of operations for the year then ended, the statements of changes in net assets for each of the two years in the period then ended, the financial highlights for each of the five years in the period then ended, and the related notes. In our opinion, the financial statements and financial highlights present fairly, in all material respects, the financial position of the Portfolio as of October 31, 2022, and the results of its operations for the year then ended, the changes in its net assets for each of the two years in the period then ended, and the financial highlights for each of the five years in the period then ended, in conformity with accounting principles generally accepted in the United States of America.
Basis for Opinion
These financial statements and financial highlights are the responsibility of the Portfolio’s management. Our responsibility is to express an opinion on the Portfolio’s financial statements and financial highlights based on our audits. We are a public accounting firm registered with the Public Company Accounting Oversight Board (United States) (PCAOB) and are required to be independent with respect to the Portfolio in accordance with the U.S. federal securities laws and the applicable rules and regulations of the Securities and Exchange Commission and the PCAOB.
We conducted our audits in accordance with the standards of the PCAOB. Those standards require that we plan and perform the audit to obtain reasonable assurance about whether the financial statements and financial highlights are free of material misstatement, whether due to error or fraud. The Portfolio is not required to have, nor were we engaged to perform, an audit of its internal control over financial reporting. As part of our audits, we are required to obtain an understanding of internal control over financial reporting but not for the purpose of expressing an opinion on the effectiveness of the Portfolio’s internal control over financial reporting. Accordingly, we express no such opinion.
Our audits included performing procedures to assess the risks of material misstatement of the financial statements and financial highlights, whether due to error or fraud, and performing procedures that respond to those risks. Such procedures included examining, on a test basis, evidence regarding the amounts and disclosures in the financial statements and financial highlights. Our audits also included evaluating the accounting principles used and significant estimates made by management, as well as evaluating the overall presentation of the financial statements and financial highlights. Our procedures included confirmation of securities owned as of October 31, 2022, by correspondence with the custodian and brokers; when replies were not received from brokers, we performed other auditing procedures. We believe that our audits provide a reasonable basis for our opinion.
/s/ Deloitte & Touche LLP
Boston, Massachusetts
December 22, 2022
We have served as the auditor of one or more Eaton Vance investment companies since 1959.
Eaton Vance
Tax-Managed Value Fund
October 31, 2022
Board of Trustees’ Contract Approval
Overview of the Contract Review Process
The Investment Company Act of 1940, as amended (the “1940 Act”), provides, in substance, that the investment advisory agreement between a fund and its investment adviser will continue in effect from year-to-year only if its continuation is approved on an annual basis by a vote of the fund’s board of trustees, including a majority of the trustees who are not “interested persons” of the fund (“independent trustees”), cast in person at a meeting called for the purpose of considering such approval.
At a meeting held on June 8, 2022, the Boards of Trustees/Directors (collectively, the “Board”) that oversee the registered investment companies advised by Eaton Vance Management or its affiliate, Boston Management and Research (the “Eaton Vance Funds”), including a majority of the independent trustees (the “Independent Trustees”), voted to approve the continuation of existing investment advisory agreements and sub-advisory agreements1 for each of the Eaton Vance Funds for an additional one-year period. The Board relied upon the affirmative recommendation of its Contract Review Committee, which is a committee exclusively comprised of Independent Trustees. Prior to making its recommendation, the Contract Review Committee reviewed information furnished by the adviser and sub-adviser to each of the Eaton Vance Funds (including information specifically requested by the Board) for a series of formal meetings held between April and June 2022. Members of the Contract Review Committee also considered information received at prior meetings of the Board and its committees, to the extent such information was relevant to the Contract Review Committee’s annual evaluation of the investment advisory agreements and sub-advisory agreements.
In connection with its evaluation of the investment advisory agreements and sub-advisory agreements, the Board considered various information relating to the Eaton Vance Funds. This included information applicable to all or groups of Eaton Vance Funds, which is referenced immediately below, and information applicable to the particular Eaton Vance Fund covered by this report (additional fund-specific information is referenced below under “Results of the Contract Review Process”). (For funds that invest through one or more underlying portfolios, references to “each fund” in this section may include information that was considered at the portfolio-level.)
Information about Fees, Performance and Expenses
• A report from an independent data provider comparing advisory and other fees paid by each fund to such fees paid by comparable funds, as identified by the independent data provider (“comparable funds”);
• A report from an independent data provider comparing each fund’s total expense ratio (and its components) to those of comparable funds;
• A report from an independent data provider comparing the investment performance of each fund (including, as relevant, total return data, income data, Sharpe ratios and information ratios) to the investment performance of comparable funds and, as applicable, benchmark indices, over various time periods;
• In certain instances, data regarding investment performance relative to customized groups of peer funds and blended indices identified by the adviser in consultation with the Portfolio Management Committee of the Board (a committee exclusively comprised of Independent Trustees);
• Comparative information concerning the fees charged and services provided by the adviser and sub-adviser to each fund in managing other accounts (which may include other mutual funds, collective investment funds and institutional accounts) using investment strategies and techniques similar to those used in managing such fund(s), if any;
• Profitability analyses with respect to the adviser and sub-adviser to each of the funds;
Information about Portfolio Management and Trading
• Descriptions of the investment management services provided to each fund, as well as each of the funds’ investment strategies and policies;
• The procedures and processes used to determine the value of fund assets, including, when necessary, the determination of “fair value” and actions taken to monitor and test the effectiveness of such procedures and processes;
• Information about the policies and practices of each fund’s adviser and sub-adviser with respect to trading, including their processes for seeking best execution of portfolio transactions;
• Information about the allocation of brokerage transactions and the benefits, if any, received by the adviser and sub-adviser to each fund as a result of brokerage allocation, including, as applicable, information concerning the acquisition of research through client commission arrangements and policies with respect to “soft dollars”;
• Data relating to the portfolio turnover rate of each fund and related information regarding active management in the context of particular strategies;
Information about each Adviser and Sub-adviser
• Reports detailing the financial results and condition of the adviser and sub-adviser to each fund;
1 Not all Eaton Vance Funds have entered into a sub-advisory agreement with a sub-adviser. Accordingly, references to “sub-adviser” or “sub-advisory agreement” in this “Overview” section may not be applicable to the particular Eaton Vance Fund covered by this report. Following the “Overview” section, further information regarding the Board’s evaluation of a fund’s contractual arrangements is included under the “Results of the Contract Review Process” section.
Eaton Vance
Tax-Managed Value Fund
October 31, 2022
Board of Trustees’ Contract Approval — continued
• Information regarding the individual investment professionals whose responsibilities include portfolio management and investment research for the funds, and, for portfolio managers and certain other investment professionals, information relating to their responsibilities with respect to managing other mutual funds and investment accounts, as applicable;
• Information regarding the adviser’s and its parent company’s (Morgan Stanley’s) efforts to retain and attract talented investment professionals, including in the context of a particularly competitive marketplace for talent, as well as the ongoing unique environment presented by hybrid, remote and other alternative work arrangements;
• The Code of Ethics of the adviser and its affiliates and the sub-adviser of each fund, together with information relating to compliance with, and the administration of, such codes;
• Policies and procedures relating to proxy voting, including regular reporting with respect to fund proxy voting activities;
• Information regarding the handling of corporate actions and class actions, as well as information regarding litigation and other regulatory matters;
• Information concerning the resources devoted to compliance efforts undertaken by the adviser and its affiliates and the sub-adviser of each fund, if any, including descriptions of their various compliance programs and their record of compliance;
• Information concerning the business continuity and disaster recovery plans of the adviser and its affiliates and the sub-adviser of each fund, if any;
• A description of Eaton Vance Management’s and Boston Management and Research’s oversight of sub-advisers, including with respect to regulatory and compliance issues, investment management and other matters;
Other Relevant Information
• Information regarding ongoing initiatives to further integrate and harmonize, where applicable, the investment management and other departments of the adviser and its affiliates with the overall investment management infrastructure of Morgan Stanley, in light of Morgan Stanley’s acquisition of Eaton Vance on March 1, 2021;
• Information concerning the nature, cost and character of the administrative and other non-investment advisory services provided by Eaton Vance Management and its affiliates;
• Information concerning oversight of the relationship with the custodian, subcustodians, fund accountants, and other third-party service providers by the adviser and/or administrator to each of the funds;
• Information concerning efforts to implement policies and procedures with respect to various new regulations applicable to the funds, including Rule 12d1-4 (the Fund-of-Funds Rule), Rule 18f-4 (the Derivatives Rule) and Rule 2a-5 (the Fair Valuation Rule);
• For an Eaton Vance Fund structured as an exchange-listed closed-end fund, information concerning the benefits of the closed-end fund structure, as well as, where relevant, the closed-end fund’s market prices (including as compared to the closed-end fund’s net asset value (NAV)), trading volume data, continued use of auction preferred shares (where applicable), distribution rates and other relevant matters;
• The risks which the adviser and/or its affiliates incur in connection with the management and operation of the funds, including, among others, litigation, regulatory, entrepreneurial, and other business risks (and the associated costs of such risks); and
• The terms of each investment advisory agreement and sub-advisory agreement.
During the various meetings of the Board and its committees over the course of the year leading up to the June 8, 2022 meeting, the Trustees received information from portfolio managers and other investment professionals of the advisers and sub-advisers of the funds regarding investment and performance matters, and considered various investment and trading strategies used in pursuing the funds’ investment objectives. The Trustees also received information regarding risk management techniques employed in connection with the management of the funds. The Board and its committees evaluated issues pertaining to industry and regulatory developments, compliance procedures, fund governance and other issues with respect to the funds, and received and participated in reports and presentations provided by Eaton Vance Management, Boston Management and Research and fund sub-advisers, with respect to such matters. In addition to the formal meetings of the Board and its committees, the Independent Trustees held regular teleconferences to discuss, among other topics, matters relating to the continuation of investment advisory agreements and sub-advisory agreements.
The Contract Review Committee was advised throughout the contract review process by Goodwin Procter LLP, independent legal counsel for the Independent Trustees. The members of the Contract Review Committee, with the advice of such counsel, exercised their own business judgment in determining the material factors to be considered in evaluating each investment advisory agreement and sub-advisory agreement and the weight to be given to each such factor. The conclusions reached with respect to each investment advisory agreement and sub-advisory agreement were based on a comprehensive evaluation of all the information provided and not any single factor. Moreover, each member of the Contract Review Committee may have placed varying emphasis on particular factors in reaching conclusions with respect to each investment advisory agreement and sub-advisory agreement. In evaluating each investment advisory agreement and sub-advisory agreement, including the fee structures and other terms contained in such agreements, the members of the Contract Review Committee were also informed by multiple years of analysis and discussion with the adviser and sub-adviser to each of the Eaton Vance Funds.
Results of the Contract Review Process
Based on its consideration of the foregoing, and such other information it deemed relevant, including the factors and conclusions described below, the Contract Review Committee concluded that the continuation of the investment advisory agreement between Eaton Vance Tax-Managed Value Fund (the “Fund”) and Eaton Vance Management (“EVM”), as well as the investment advisory agreement between Tax-Managed Value Portfolio (the “Portfolio”), the portfolio in which the Fund invests, and Boston Management and Research (“BMR”) (EVM, with respect to the Fund, and BMR, with respect to the
Eaton Vance
Tax-Managed Value Fund
October 31, 2022
Board of Trustees’ Contract Approval — continued
Portfolio, are each referred to herein as the “Adviser”), including their respective fee structures, are in the interests of shareholders and, therefore, recommended to the Board approval of each agreement. Based on the recommendation of the Contract Review Committee, the Board, including a majority of the Independent Trustees, voted to approve continuation of the investment advisory agreements for the Fund and the Portfolio (together, the “investment advisory agreements”).
Nature, Extent and Quality of Services
In considering whether to approve the investment advisory agreements for the Fund and the Portfolio, the Board evaluated the nature, extent and quality of services provided to the Fund and to the Portfolio by the applicable Adviser.
The Board considered each Adviser’s management capabilities and investment processes in light of the types of investments held by the Fund and the Portfolio, including the education, experience and number of investment professionals and other personnel who provide portfolio management, investment research, and similar services to the Portfolio. The Board specifically noted that each Adviser has devoted extensive resources to in-house equity research capabilities and also draws upon independent research available from third-party sources. The Board considered each Adviser’s experience managing funds that seek to maximize after-tax returns. The Board also took into account the resources dedicated to portfolio management and other services, the compensation methods of each Adviser and other factors, including the reputation and resources of each Adviser to recruit and retain highly qualified research, advisory and supervisory investment professionals. In addition, the Board considered the time and attention devoted to the Eaton Vance Funds, including the Fund and the Portfolio, by senior management, as well as the infrastructure, operational capabilities and support staff in place to assist in the portfolio management and operations of the Fund and the Portfolio, including the provision of administrative services. The Board also considered the business-related and other risks to which each Adviser or its affiliates may be subject in managing the Fund and the Portfolio.
The Board noted that, under the terms of the investment advisory agreement of the Fund, EVM may invest assets of the Fund directly in securities, for which it would receive a fee, or in the Portfolio, for which it receives no separate fee but for which BMR receives an advisory fee from the Portfolio.
The Board considered the compliance programs of each Adviser and relevant affiliates thereof. The Board considered compliance and reporting matters regarding, among other things, personal trading by investment professionals, disclosure of portfolio holdings, late trading, frequent trading, portfolio valuation, business continuity and the allocation of investment opportunities. The Board also considered the responses of each Adviser and its affiliates to requests in recent years from regulatory authorities, such as the Securities and Exchange Commission and the Financial Industry Regulatory Authority.
The Board considered other administrative services provided or overseen by EVM and its affiliates, including transfer agency and accounting services. The Board evaluated the benefits to shareholders of investing in a fund that is a part of a large fund complex offering exposure to a variety of asset classes and investment disciplines, as well as the ability, in many cases, to exchange an investment among different funds without incurring additional sales charges.
After consideration of the foregoing factors, among others, the Board concluded that the nature, extent and quality of services provided by each Adviser, taken as a whole, are appropriate and consistent with the terms of the applicable investment advisory agreement.
Fund Performance
The Board compared the Fund’s investment performance to that of comparable funds identified by an independent data provider (the peer group), as well as an appropriate benchmark index. The Board’s review included comparative performance data with respect to the Fund for the one-, three-, five- and ten-year periods ended December 31, 2021. In this regard, the Board noted that the performance of the Fund was higher than the median performance of the Fund’s peer group for the three-year period. The Board also noted that the performance of the Fund was higher than its benchmark index for the three-year period. The Board concluded that the performance of the Fund was satisfactory.
Management Fees and Expenses
The Board considered contractual fee rates payable by the Portfolio and by the Fund for advisory and administrative services (referred to collectively as “management fees”). As part of its review, the Board considered the Fund’s management fees and total expense ratio for the one-year period ended December 31, 2021, as compared to those of comparable funds, before and after giving effect to any undertaking to waive fees or reimburse expenses. The Board also considered certain Fund specific factors that had an impact on the Fund’s total expense ratio relative to comparable funds, as identified by management in response to inquiries from the Contract Review Committee.
After considering the foregoing information, and in light of the nature, extent and quality of the services provided by each Adviser, the Board concluded that the management fees charged for advisory and related services are reasonable.
Profitability and “Fall-Out” Benefits
The Board considered the level of profits realized by each Adviser and relevant affiliates thereof in providing investment advisory and administrative services to the Fund, to the Portfolio and to all Eaton Vance Funds as a group. The Board considered the level of profits realized without regard to marketing support or other payments by each Adviser and its affiliates to third parties in respect of distribution or other services.
The Board concluded that, in light of the foregoing factors and the nature, extent and quality of the services rendered, the profits realized by each Adviser and its affiliates are deemed not to be excessive.
Eaton Vance
Tax-Managed Value Fund
October 31, 2022
Board of Trustees’ Contract Approval — continued
The Board also considered direct or indirect fall-out benefits received by each Adviser and its affiliates in connection with their respective relationships with the Fund and the Portfolio, including the benefits of research services that may be available to each Adviser as a result of securities transactions effected for the Fund and the Portfolio and other investment advisory clients.
Economies of Scale
In reviewing management fees and profitability, the Board also considered the extent to which the applicable Adviser and its affiliates, on the one hand, and the Fund and the Portfolio, on the other hand, can expect to realize benefits from economies of scale as the assets of the Fund and the Portfolio increase. The Board acknowledged the difficulty in accurately measuring the benefits resulting from economies of scale, if any, with respect to the management of any specific fund or group of funds. The Board reviewed data summarizing the increases and decreases in the assets of the Fund and of all Eaton Vance Funds as a group over various time periods, and evaluated the extent to which the total expense ratio of the Fund and the profitability of each Adviser and its affiliates may have been affected by such increases or decreases. Based upon the foregoing, the Board concluded that the Fund currently shares in the benefits from economies of scale, if any, when they are realized by each Adviser. The Board also concluded that the structure of the advisory fees, which include breakpoints at several asset levels, will allow the Fund and the Portfolio to continue to benefit from any economies of scale in the future.
Eaton Vance
Tax-Managed Value Fund
October 31, 2022
Liquidity Risk Management Program
The Fund has implemented a written liquidity risk management program (Program) and related procedures to manage its liquidity in accordance with Rule 22e-4 under the Investment Company Act of 1940, as amended (Liquidity Rule). The Liquidity Rule defines “liquidity risk” as the risk that a fund could not meet requests to redeem shares issued by the fund without significant dilution of the remaining investors’ interests in the fund. The Fund’s Board of Trustees/Directors has designated the investment adviser to serve as the administrator of the Program and the related procedures. The administrator has established a Liquidity Risk Management Oversight Committee (Committee) to perform the functions necessary to administer the Program. As part of the Program, the administrator is responsible for identifying illiquid investments and categorizing the relative liquidity of the Fund’s investments in accordance with the Liquidity Rule. Under the Program, the administrator assesses, manages, and periodically reviews the Fund’s liquidity risk, and is responsible for making certain reports to the Fund’s Board of Trustees/Directors and the Securities and Exchange Commission (SEC) regarding the liquidity of the Fund’s investments, and to notify the Board of Trustees/Directors and the SEC of certain liquidity events specified in the Liquidity Rule. The liquidity of the Fund’s portfolio investments is determined based on a number of factors including, but not limited to, relevant market, trading and investment-specific considerations under the Program.
At a meeting of the Fund’s Board of Trustees/Directors on June 7, 2022, the Committee provided a written report to the Fund’s Board of Trustees/Directors pertaining to the operation, adequacy, and effectiveness of implementation of the Program, as well as the operation of the highly liquid investment minimum (if applicable) for the period January 1, 2021 through December 31, 2021 (Review Period). The Program operated effectively during the Review Period, supporting the administrator’s ability to assess, manage and monitor Fund liquidity risk, including during periods of market volatility and net redemptions. During the Review Period, the Fund met redemption requests on a timely basis.
There can be no assurance that the Program will achieve its objectives in the future. Please refer to the Fund’s prospectus for more information regarding the Fund’s exposure to liquidity risk and other principal risks to which an investment in the Fund may be subject.
Eaton Vance
Tax-Managed Value Fund
October 31, 2022
Management and Organization
Fund Management. The Trustees of Eaton Vance Mutual Funds Trust (the Trust) and Tax-Managed Value Portfolio (the Portfolio) are responsible for the overall management and supervision of the Trust's and the Portfolio's affairs. The Board members and officers of the Trust and the Portfolio are listed below. Except as indicated, each individual has held the office shown or other offices in the same company for the last five years. Board members hold indefinite terms of office. Each Trustee holds office until his or her successor is elected and qualified, subject to a prior death, resignation, retirement, disqualification or removal. Under the terms of the Fund's and the Portfolio's current Trustee retirement policy, an Independent Trustee must retire and resign as a Trustee on the earlier of: (i) the first day of July following his or her 74th birthday; or (ii), with limited exception, December 31st of the 20th year in which he or she has served as a Trustee. However, if such retirement and resignation would cause the Fund and the Portfolio to be out of compliance with Section 16 of the 1940 Act or any other regulations or guidance of the SEC, then such retirement and resignation will not become effective until such time as action has been taken for the Fund and the Portfolio to be in compliance therewith. The “noninterested Trustees” consist of those Trustees who are not “interested persons” of the Trust and the Portfolio, as that term is defined under the 1940 Act. The business address of each Board member and officer is Two International Place, Boston, Massachusetts 02110. As used below, “BMR” refers to Boston Management and Research, “EVC” refers to Eaton Vance Corp., “EV” refers to EV LLC, “EVM” refers to Eaton Vance Management and “EVD” refers to Eaton Vance Distributors, Inc. EV is the trustee of each of EVM and BMR. Effective March 1, 2021, each of EVM, BMR, EVD and EV are indirect, wholly owned subsidiaries of Morgan Stanley. Each officer affiliated with EVM may hold a position with other EVM affiliates that is comparable to his or her position with EVM listed below. Each Trustee oversees 135 funds (with the exception of Mr. Bowser who oversees 110 funds) in the Eaton Vance fund complex (including both funds and portfolios in a hub and spoke structure).
| Name and Year of Birth | Trust/Portfolio
Position(s) | Length of Service | Principal Occupation(s) and Other Directorships
During Past Five Years and Other Relevant Experience |
| Interested Trustee |
Thomas E. Faust Jr.
1958 | Trustee | Since 2007 | Chairman of Morgan Stanley Investment Management, Inc. (MSIM), member of the Board of Managers and President of EV (since 2021), Chief Executive Officer of EVM and BMR. Formerly, Chairman, Chief Executive Officer (2007-2021) and President (2006-2021) of EVC and Director of EVD (2007-2022). Mr. Faust is an interested person because of his positions with MSIM, BMR, EVM and EV, which are affiliates of the Trust and the Portfolio.
Other Directorships. Formerly, Director of EVC (2007-2021) and Hexavest Inc. (investment management firm) (2012-2021). |
| Noninterested Trustees |
Alan C. Bowser(1)
1962 | Trustee | Since 2022 | Chief Diversity Officer, Partner and a member of the Operating Committee, and formerly served as Senior Advisor on Diversity and Inclusion for the firm’s chief executive officer, Co-Head of the Americas Region, and Senior Client Advisor of Bridgewater Associates, an asset management firm (2011- present).
Other Directorships. None. |
Mark R. Fetting
1954 | Trustee | Since 2016 | Private investor. Formerly held various positions at Legg Mason, Inc. (investment management firm) (2000-2012), including President, Chief Executive Officer, Director and Chairman (2008-2012), Senior Executive Vice President (2004-2008) and Executive Vice President (2001-2004). Formerly, President of Legg Mason family of funds (2001-2008). Formerly, Division President and Senior Officer of Prudential Financial Group, Inc. and related companies (investment management firm) (1991-2000).
Other Directorships. None. |
Cynthia E. Frost
1961 | Trustee | Since 2014 | Private investor. Formerly, Chief Investment Officer of Brown University (university endowment) (2000-2012). Formerly, Portfolio Strategist for Duke Management Company (university endowment manager) (1995-2000). Formerly, Managing Director, Cambridge Associates (investment consulting company) (1989-1995). Formerly, Consultant, Bain and Company (management consulting firm) (1987- 1989). Formerly, Senior Equity Analyst, BA Investment Management Company (1983-1985).
Other Directorships. None. |
George J. Gorman
1952 | Chairperson of the
Board and Trustee | Since 2021
(Chairperson) and 2014 (Trustee) | Principal at George J. Gorman LLC (consulting firm). Formerly, Senior Partner at Ernst & Young LLP (a registered public accounting firm) (1974-2009).
Other Directorships. None. |
Eaton Vance
Tax-Managed Value Fund
October 31, 2022
Management and Organization — continued
| Name and Year of Birth | Trust/Portfolio
Position(s) | Length of Service | Principal Occupation(s) and Other Directorships
During Past Five Years and Other Relevant Experience |
| Noninterested Trustees (continued) |
Valerie A. Mosley
1960 | Trustee | Since 2014 | Chairwoman and Chief Executive Officer of Valmo Ventures (a consulting and investment firm). Founder of Upward Wealth, Inc., dba BrightUp, a fintech platform. Formerly, Partner and Senior Vice President, Portfolio Manager and Investment Strategist at Wellington Management Company, LLP (investment management firm) (1992-2012). Formerly, Chief Investment Officer, PG Corbin Asset Management (1990-1992). Formerly worked in institutional corporate bond sales at Kidder Peabody (1986-1990).
Other Directorships. Director of DraftKings, Inc. (digital sports entertainment and gaming company) (since September 2020). Director of Envestnet, Inc. (provider of intelligent systems for wealth management and financial wellness) (since 2018). Formerly, Director of Dynex Capital, Inc. (mortgage REIT) (2013-2020) and Director of Groupon, Inc. (e-commerce provider) (2020-2022). |
Keith Quinton
1958 | Trustee | Since 2018 | Private investor, researcher and lecturer. Formerly, Independent Investment Committee Member at New Hampshire Retirement System (2017-2021). Formerly, Portfolio Manager and Senior Quantitative Analyst at Fidelity Investments (investment management firm) (2001-2014).
Other Directorships. Formerly, Director (2016-2021) and Chairman (2019-2021) of New Hampshire Municipal Bond Bank. |
Marcus L. Smith
1966 | Trustee | Since 2018 | Private investor and independent corporate director. Formerly, Chief Investment Officer, Canada (2012-2017), Chief Investment Officer, Asia (2010-2012), Director of Asian Research (2004-2010) and portfolio manager (2001-2017) at MFS Investment Management (investment management firm).
Other Directorships. Director of First Industrial Realty Trust, Inc. (an industrial REIT) (since 2021). Director of MSCI Inc. (global provider of investment decision support tools) (since 2017). Formerly, Director of DCT Industrial Trust Inc. (logistics real estate company) (2017-2018). |
Susan J. Sutherland
1957 | Trustee | Since 2015 | Private investor. Director of Ascot Group Limited and certain of its subsidiaries (insurance and reinsurance) (since 2017). Formerly, Director of Hagerty Holding Corp. (insurance) (2015-2018) and Montpelier Re Holdings Ltd. (insurance and reinsurance) (2013-2015). Formerly, Associate, Counsel and Partner at Skadden, Arps, Slate, Meagher & Flom LLP (law firm) (1982-2013).
Other Directorships. Director of Kairos Acquisition Corp. (insurance/InsurTech acquisition company) (since 2021). |
Scott E. Wennerholm
1959 | Trustee | Since 2016 | Private Investor. Formerly, Trustee at Wheelock College (postsecondary institution) (2012-2018). Formerly, Consultant at GF Parish Group (executive recruiting firm) (2016-2017). Formerly, Chief Operating Officer and Executive Vice President at BNY Mellon Asset Management (investment management firm) (2005-2011). Formerly, Chief Operating Officer and Chief Financial Officer at Natixis Global Asset Management (investment management firm) (1997-2004). Formerly, Vice President at Fidelity Investments Institutional Services (investment management firm) (1994-1997).
Other Directorships. None. |
Nancy A. Wiser(1)
1967 | Trustee | Since 2022 | Formerly, Executive Vice President and the Global Head of Operations at Wells Fargo Asset Management (2011-2021).
Other Directorships. None. |
| Name and Year of Birth | Trust/Portfolio
Position(s) | Length of Service | Principal Occupation(s)
During Past Five Years |
| Principal Officers who are not Trustees |
Eric A. Stein
1980 | President of the
Trust | Since 2020 | Vice President and Chief Investment Officer, Fixed Income of EVM and BMR. Prior to November 1, 2020, Mr. Stein was a co-Director of Eaton Vance’s Global Income Investments. Also Vice President of Calvert Research and Management (“CRM”). |
Edward J. Perkin
1972 | President of the
Portfolio | Since 2014 | Chief Equity Investment Officer and Vice President of EVM and BMR since 2014. Also Vice President of CRM. |
Deidre E. Walsh
1971 | Vice President and Chief
Legal Officer | Since 2009 | Vice President of EVM and BMR. Also Vice President of CRM. |
Eaton Vance
Tax-Managed Value Fund
October 31, 2022
Management and Organization — continued
| Name and Year of Birth | Trust/Portfolio
Position(s) | Length of Service | Principal Occupation(s)
During Past Five Years |
| Principal Officers who are not Trustees (continued) |
James F. Kirchner
1967 | Treasurer | Since 2007 | Vice President of EVM and BMR. Also Vice President of CRM. |
Nicholas Di Lorenzo
1987 | Secretary | Since 2022 | Formerly, associate (2012-2021) and counsel (2022) at Dechert LLP. |
Richard F. Froio
1968 | Chief Compliance
Officer | Since 2017 | Vice President of EVM and BMR since 2017. Formerly Deputy Chief Compliance Officer (Adviser/Funds) and Chief Compliance Officer (Distribution) at PIMCO (2012-2017) and Managing Director at BlackRock/Barclays Global Investors (2009-2012). |
(1) Mr. Bowser and Ms. Wiser began serving as Trustees effective April 4, 2022.
The SAI for the Fund includes additional information about the Trustees and officers of the Fund and the Portfolio and can be obtained without charge on Eaton Vance’s website at www.eatonvance.com or by calling 1-800-262-1122.
| FACTS | WHAT DOES EATON VANCE DO WITH YOUR
PERSONAL INFORMATION? |
| Why? | Financial companies choose how they share your personal information. Federal law gives consumers the right to limit some but not all sharing. Federal law also requires us to tell you how we collect, share, and protect your personal information. Please read this notice carefully to understand what we do. |
| |
| What? | The types of personal information we collect and share depend on the product or service you have with us. This information can include:■ Social Security number and income
■ investment experience and risk tolerance
■ checking account number and wire transfer instructions |
| |
| How? | All financial companies need to share customers’ personal information to run their everyday business. In the section below, we list the reasons financial companies can share their customers’ personal information; the reasons Eaton Vance chooses to share; and whether you can limit this sharing. |
Reasons we can share your
personal information | Does Eaton Vance
share? | Can you limit
this sharing? |
| For our everyday business purposes — such as to process your transactions, maintain your account(s), respond to court orders and legal investigations, or report to credit bureaus | Yes | No |
| For our marketing purposes — to offer our products and services to you | Yes | No |
| For joint marketing with other financial companies | No | We don’t share |
| For our investment management affiliates’ everyday business purposes — information about your transactions, experiences, and creditworthiness | Yes | Yes |
| For our affiliates’ everyday business purposes — information about your transactions and experiences | Yes | No |
| For our affiliates’ everyday business purposes — information about your creditworthiness | No | We don’t share |
| For our investment management affiliates to market to you | Yes | Yes |
| For our affiliates to market to you | No | We don’t share |
| For nonaffiliates to market to you | No | We don’t share |
To limit our
sharing | Call toll-free 1-800-262-1122 or email: EVPrivacy@eatonvance.comPlease note:If you are a new customer, we can begin sharing your information 30 days from the date we sent this notice. When you are no longer our customer, we continue to share your information as described in this notice. However, you can contact us at any time to limit our sharing. |
| Questions? | Call toll-free 1-800-262-1122 or email: EVPrivacy@eatonvance.com |
| Privacy Notice — continued | April 2021 |
| Who we are |
| Who is providing this notice? | Eaton Vance Management, Eaton Vance Distributors, Inc., Eaton Vance Trust Company, Eaton Vance Management (International) Limited, Eaton Vance Advisers International Ltd., Eaton Vance Global Advisors Limited, Eaton Vance Management’s Real Estate Investment Group, Boston Management and Research, Calvert Research and Management, Eaton Vance and Calvert Fund Families and our investment advisory affiliates (“Eaton Vance”) (see Investment Management Affiliates definition below) |
| What we do |
How does Eaton Vance
protect my personal
information? | To protect your personal information from unauthorized access and use, we use security measures that comply with federal law. These measures include computer safeguards and secured files and buildings. We have policies governing the proper handling of customer information by personnel and requiring third parties that provide support to adhere to appropriate security standards with respect to such information. |
How does Eaton Vance
collect my personal
information? | We collect your personal information, for example, when you■ open an account or make deposits or withdrawals from your account
■ buy securities from us or make a wire transfer
■ give us your contact informationWe also collect your personal information from others, such as credit bureaus, affiliates, or other companies. |
| Why can’t I limit all sharing? | Federal law gives you the right to limit only■ sharing for affiliates’ everyday business purposes — information about your creditworthiness
■ affiliates from using your information to market to you
■ sharing for nonaffiliates to market to youState laws and individual companies may give you additional rights to limit sharing. See below for more on your rights under state law. |
| Definitions |
Investment Management
Affiliates | Eaton Vance Investment Management Affiliates include registered investment advisers, registered broker- dealers, and registered and unregistered funds. Investment Management Affiliates does not include entities associated with Morgan Stanley Wealth Management, such as Morgan Stanley Smith Barney LLC and Morgan Stanley & Co. |
| Affiliates | Companies related by common ownership or control. They can be financial and nonfinancial companies.■ Our affiliates include companies with a Morgan Stanley name and financial companies such as Morgan Stanley Smith Barney LLC and Morgan Stanley & Co. |
| Nonaffiliates | Companies not related by common ownership or control. They can be financial and nonfinancial companies.■ Eaton Vance does not share with nonaffiliates so they can market to you. |
| Joint marketing | A formal agreement between nonaffiliated financial companies that together market financial products or services to you.■ Eaton Vance doesn’t jointly market. |
| Other important information |
| Vermont: Except as permitted by law, we will not share personal information we collect about Vermont residents with Nonaffiliates unless you provide us with your written consent to share such information.California: Except as permitted by law, we will not share personal information we collect about California residents with Nonaffiliates and we will limit sharing such personal information with our Affiliates to comply with California privacy laws that apply to us. |
Delivery of Shareholder Documents. The Securities and Exchange Commission (SEC) permits funds to deliver only one copy of shareholder documents, including prospectuses, proxy statements and shareholder reports, to fund investors with multiple accounts at the same residential or post office box address. This practice is often called “householding” and it helps eliminate duplicate mailings to shareholders. Eaton Vance, or your financial intermediary, may household the mailing of your documents indefinitely unless you instruct Eaton Vance, or your financial intermediary, otherwise. If you would prefer that your Eaton Vance documents not be householded, please contact Eaton Vance at 1-800-262-1122, or contact your financial intermediary. Your instructions that householding not apply to delivery of your Eaton Vance documents will typically be effective within 30 days of receipt by Eaton Vance or your financial intermediary.
Portfolio Holdings. Each Eaton Vance Fund and its underlying Portfolio(s) (if applicable) files a schedule of portfolio holdings on Part F to Form N-PORT with the SEC. Certain information filed on Form N-PORT may be viewed on the Eaton Vance website at www.eatonvance.com, by calling Eaton Vance at 1-800-262-1122 or in the EDGAR database on the SEC’s website at www.sec.gov.
Proxy Voting. From time to time, funds are required to vote proxies related to the securities held by the funds. The Eaton Vance Funds or their underlying Portfolios (if applicable) vote proxies according to a set of policies and procedures approved by the Funds’ and Portfolios’ Boards. You may obtain a description of these policies and procedures and information on how the Funds or Portfolios voted proxies relating to portfolio securities during the most recent 12-month period ended June 30, without charge, upon request, by calling 1-800-262-1122 and by accessing the SEC’s website at www.sec.gov.
This Page Intentionally Left Blank
Investment Adviser of Tax-Managed Value Portfolio
Boston Management and Research
Two International Place
Boston, MA 02110
Investment Adviser and Administrator of Eaton Vance Tax-Managed Value Fund
Eaton Vance Management
Two International Place
Boston, MA 02110
Principal Underwriter*
Eaton Vance Distributors, Inc.
Two International Place
Boston, MA 02110
(617) 482-8260
Custodian
State Street Bank and Trust Company
State Street Financial Center, One Lincoln Street
Boston, MA 02111
Transfer Agent
BNY Mellon Investment Servicing (US) Inc.
Attn: Eaton Vance Funds
P.O. Box 9653
Providence, RI 02940-9653
(800) 262-1122
Independent Registered Public Accounting Firm
Deloitte & Touche LLP
200 Berkeley Street
Boston, MA 02116-5022
Fund Offices
Two International Place
Boston, MA 02110
* FINRA BrokerCheck. Investors may check the background of their Investment Professional by contacting the Financial Industry Regulatory Authority (FINRA). FINRA BrokerCheck is a free tool to help investors check the professional background of current and former FINRA-registered securities firms and brokers. FINRA BrokerCheck is available by calling 1-800-289-9999 and at www.FINRA.org. The FINRA BrokerCheck brochure describing this program is available to investors at www.FINRA.org.

Eaton Vance
Floating-Rate Advantage Fund
Annual Report
October 31, 2022

Commodity Futures Trading Commission Registration. The Commodity Futures Trading Commission (“CFTC”) has adopted regulations that subject registered investment companies and advisers to regulation by the CFTC if a fund invests more than a prescribed level of its assets in certain CFTC-regulated instruments (including futures, certain options and swap agreements) or markets itself as providing investment exposure to such instruments. The investment adviser has claimed an exclusion from the definition of “commodity pool operator” under the Commodity Exchange Act with respect to its management of the Fund. Accordingly, neither the Fund nor the adviser with respect to the operation of the Fund is subject to CFTC regulation. Because of its management of other strategies, the Fund’s adviser is registered with the CFTC as a commodity pool operator. The adviser is also registered as a commodity trading advisor.
Fund shares are not insured by the FDIC and are not deposits or other obligations of, or guaranteed by, any depository institution. Shares are subject to investment risks, including possible loss of principal invested.
This report must be preceded or accompanied by a current summary prospectus or prospectus. Before investing, investors should consider carefully the investment objective, risks, and charges and expenses of a mutual fund. This and other important information is contained in the summary prospectus and prospectus, which can be obtained from a financial intermediary. Prospective investors should read the prospectus carefully before investing. For further information, please call 1-800-262-1122.
Annual Report October 31, 2022
Eaton Vance
Floating-Rate Advantage Fund
Eaton Vance
Floating-Rate Advantage Fund
October 31, 2022
Management’s Discussion of Fund Performance†
Economic and Market Conditions
Amid increasing global concerns about inflation and rising interest rates, compounded by the economic fallout from Russia’s invasion of Ukraine, senior loans displayed their value as a portfolio diversifier by outperforming most U.S. fixed-income asset classes during the 12-month period ended October 31, 2022.
Although returns for the Morningstar® LSTA® US Leveraged Loan IndexSM (the Index), a broad measure of the asset class, were negative at –1.78% during the period, senior loans generally outperformed corporate bonds, corporate high yield bonds, municipal bonds, and U.S. government bonds — and even outperformed the broad equity market S&P 500® Index.
In the opening month of the period, November 2021, a new COVID-19 variant caused equity and fixed-income prices to plummet worldwide. In contrast, senior loans rallied during the next two months. The ongoing rollout of vaccines, the reopening of U.S. businesses, and comparatively low yields in other fixed-income asset classes all provided tailwinds for the senior loan asset class.
In February 2022, however, the economic impact of Russia’s invasion of Ukraine became a tipping point for loan performance. While the U.S. Federal Reserve’s projection of multiple rate increases in 2022 was generally viewed as a positive sign for floating-rate loans, investors began to worry about the negative effects of supply-chain disruptions, higher commodity and labor expenses, rising debt service costs on loan issuers, and the potential for recession in both the U.S. and global economies.
Manifesting investor concerns, higher quality loans began to outperform lower quality loans. Loan prices, which had risen earlier in the period, declined each month from February through June 2022. After a brief summer rally amid hope that inflationary and recessionary fears were subsiding, loan prices resumed their downward slide in September before recovering modestly in October. While mutual fund inflows for floating-rate loans continued through April, flows turned negative in May and remained negative the rest of the period — although demand for collateralized loan obligations from institutional investors stayed positive throughout the period. By period-end, loan prices had fallen to $92.20 from $98.55 at the start of the period.
Issuer fundamentals, however, remained a bright spot for senior loans during the period. While the trailing 12-month default rate inched higher — from 0.20% at the beginning of the period to 0.83% at period-end — it remained well below the market’s long-term average of 3.20%.
For the period as a whole, higher quality loans outperformed lower quality issues, with BBB-, BB-, B-, CCC- and D-rated (defaulted) loans within the Index returning 1.98%, 1.36%, –2.42%, –10.66%, and –37.83%, respectively.
Fund Performance
For the 12-month period ended October 31, 2022, Eaton Vance Floating-Rate Advantage Fund (the Fund) returned –4.62% for Class A shares at net asset value (NAV), underperforming its benchmark, the Morningstar® LSTA® US Leveraged Loan IndexSM (the Index), which returned –1.78%.
The Index is unmanaged, and returns do not reflect any applicable sales charges, commissions, expenses, or leverage.
The Fund’s out-of-Index allocation to secured high yield bonds was the principal detractor from performance versus the Index, as floating-rate loans outperformed their fixed-rate counterparts in the bond market during the period.
The Fund’s use of investment leverage, which is not employed by the Index, also detracted from performance versus the Index. The Fund uses leverage to gain additional exposure to the loan market, thus, magnifying exposure to the Fund’s underlying investments in both up and down market environments. During a period when loan prices generally declined, leverage magnified the decrease in value of the Fund’s underlying holdings.
The Fund’s underweight position in BBB-rated loans — the highest credit-rating category within the Index and best-performing category during the period — hurt performance relative to the Index as well.
In contrast, contributors to Fund performance versus the Index included the Fund’s cash position during a period of negative loan performance, and an underweight position in CCC-rated loans, which underperformed the Index during the period.
See Endnotes and Additional Disclosures in this report.
Past performance is no guarantee of future results. Returns are historical and are calculated by determining the percentage change in net asset value (NAV) or offering price (as applicable) with all distributions reinvested. Furthermore, returns do not reflect the deduction of taxes that shareholders may have to pay on Fund distributions or upon the redemption of Fund shares. Investment return and principal value will fluctuate so that shares, when redeemed, may be worth more or less than their original cost. Performance for periods less than or equal to one year is cumulative. Performance is for the stated time period only; due to market volatility, current Fund performance may be lower or higher than the quoted return. For performance as of the most recent month-end, please refer to eatonvance.com.
Eaton Vance
Floating-Rate Advantage Fund
October 31, 2022
Performance
Portfolio Manager(s) Andrew N. Sveen, CFA, Ralph H. Hinckley, Jr., CFA and Jake T. Lemle, CFA
| | | | | | | | | | | | | | | | | | | | |
| % Average Annual Total Returns1,2 | | Class
Inception Date | | | Performance
Inception Date | | | One Year | | | Five Years | | | Ten Years | |
| | | | | |
Advisers Class at NAV | | | 03/15/2008 | | | | 08/04/1989 | | | | (4.62 | )% | | | 2.11 | % | | | 3.26 | % |
Class A at NAV | | | 03/17/2008 | | | | 08/04/1989 | | | | (4.62 | ) | | | 2.11 | | | | 3.26 | |
Class A with 3.25% Maximum Sales Charge | | | — | | | | — | | | | (7.76 | ) | | | 1.43 | | | | 2.92 | |
Class C at NAV | | | 03/15/2008 | | | | 08/04/1989 | | | | (5.11 | ) | | | 1.60 | | | | 2.85 | |
Class C with 1% Maximum Deferred Sales Charge | | | — | | | | — | | | | (6.02 | ) | | | 1.60 | | | | 2.85 | |
Class I at NAV | | | 03/15/2008 | | | | 08/04/1989 | | | | (4.38 | ) | | | 2.36 | | | | 3.52 | |
Class R6 at NAV | | | 05/31/2019 | | | | 08/04/1989 | | | | (4.36 | ) | | | 2.38 | | | | 3.53 | |
|
| |
| | | | | |
Morningstar® LSTA® US Leveraged Loan IndexSM | | | — | | | | — | | | | (1.78 | )% | | | 3.07 | % | | | 3.61 | % |
| | | | | |
| % Total Annual Operating Expense Ratios3 | | Advisers Class | | | Class A | | | Class C | | | Class I | | | Class R6 | |
| | | | | |
| | | 1.28% | | | | 1.28% | | | | 1.79 | % | | | 1.03 | % | | | 0.98 | % |
| | | | | |
| % Total Leverage4 | | | | | | | | | | | | | | | |
| | | | | |
Borrowings | | | | | | | | | | | | | | | | | | | 21.97 | % |
Growth of $10,0002
This graph shows the change in value of a hypothetical investment of $10,000 in Class A of the Fund for the period indicated. For comparison, the same investment is shown in the indicated index.
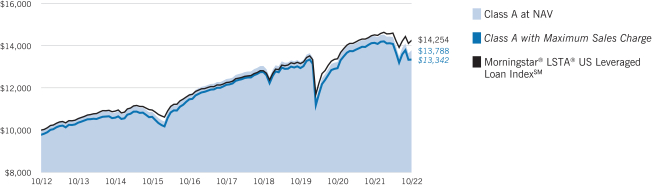
| | | | | | | | | | | | | | | | |
| Growth of Investment2 | | Amount Invested | | | Period Beginning | | | At NAV | | | With Maximum Sales Charge | |
| | | | |
Advisers Class | | | $10,000 | | | | 10/31/2012 | | | | $13,788 | | | | N.A. | |
Class C | | | $10,000 | | | | 10/31/2012 | | | | $13,247 | | | | N.A. | |
Class I, at minimum investment | | | $1,000,000 | | | | 10/31/2012 | | | | $1,413,475 | | | | N.A. | |
Class R6, at minimum investment | | | $5,000,000 | | | | 10/31/2012 | | | | $7,072,381 | | | | N.A. | |
See Endnotes and Additional Disclosures in this report.
Past performance is no guarantee of future results. Returns are historical and are calculated by determining the percentage change in net asset value (NAV) or offering price (as applicable) with all distributions reinvested. Furthermore, returns do not reflect the deduction of taxes that shareholders may have to pay on Fund distributions or upon the redemption of Fund shares. Investment return and principal value will fluctuate so that shares, when redeemed, may be worth more or less than their original cost. Performance for periods less than or equal to one year is cumulative. Performance is for the stated time period only; due to market volatility, current Fund performance may be lower or higher than the quoted return. For performance as of the most recent month-end, please refer to eatonvance.com.
Eaton Vance
Floating-Rate Advantage Fund
October 31, 2022
Fund Profile
Top 10 Issuers (% of total investments)1
| | | | |
Numericable Group SA | | | 0.9 | % |
| |
Finastra USA, Inc. | | | 0.9 | |
| |
Carnival Corporation | | | 0.8 | |
| |
Virgin Media SFA Finance Limited | | | 0.8 | |
| |
Epicor Software Corporation | | | 0.8 | |
| |
Bausch Health Companies Inc. | | | 0.8 | |
| |
TransDigm, Inc. | | | 0.7 | |
| |
ICON Luxembourg S.a.r.l. | | | 0.7 | |
| |
Ultimate Software Group Inc. (The) | | | 0.7 | |
| |
Ziggo B.V. | | | 0.6 | |
| |
Total | | | 7.7 | % |
Credit Quality (% of bonds, loans and asset-backed securities)2
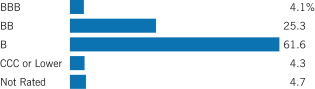
Top 10 Sectors (% of total investments)1
| | | | |
Electronics/Electrical | | | 20.7 | % |
| |
Health Care | | | 10.3 | |
| |
Business Equipment & Services | | | 9.2 | |
| |
Industrial Equipment | | | 4.9 | |
| |
Leisure Goods/Activities/Movies | | | 4.8 | |
| |
Chemicals & Plastics | | | 4.4 | |
| |
Cable & Satellite Television | | | 4.1 | |
| |
Building & Development | | | 4.1 | |
| |
Automotive | | | 3.3 | |
| |
Drugs | | | 3.3 | |
| |
Total | | | 69.1 | % |
Footnotes:
Fund invests in an affiliated investment company (Portfolio) with the same objective(s) and policies as the Fund. References to investments are to the Portfolio’s holdings.
| 1 | Excludes cash and cash equivalents. |
| 2 | Credit ratings are categorized using S&P Global Ratings (“S&P”). Ratings, which are subject to change, apply to the creditworthiness of the issuers of the underlying securities and not to the Fund or its shares. Credit ratings measure the quality of a bond based on the issuer’s creditworthiness, with ratings ranging from AAA, being the highest, to D, being the lowest based on S&P’s measures. Ratings of BBB or higher by S&P are considered to be investment-grade quality. Credit ratings are based largely on the ratings agency’s analysis at the time of rating. The rating assigned to any particular security is not necessarily a reflection of the issuer’s current financial condition and does not necessarily reflect its assessment of the volatility of a security’s market value or of the liquidity of an investment in the security. Holdings designated as “Not Rated” (if any) are not rated by S&P. |
Eaton Vance
Floating-Rate Advantage Fund
October 31, 2022
Endnotes and Additional Disclosures
| † | The views expressed in this report are those of the portfolio manager(s) and are current only through the date stated at the top of this page. These views are subject to change at any time based upon market or other conditions, and Eaton Vance and the Fund(s) disclaim any responsibility to update such views. These views may not be relied upon as investment advice and, because investment decisions are based on many factors, may not be relied upon as an indication of trading intent on behalf of any Eaton Vance fund. This commentary may contain statements that are not historical facts, referred to as “forward-looking statements.” The Fund’s actual future results may differ significantly from those stated in any forward-looking statement, depending on factors such as changes in securities or financial markets or general economic conditions, the volume of sales and purchases of Fund shares, the continuation of investment advisory, administrative and service contracts, and other risks discussed from time to time in the Fund’s filings with the Securities and Exchange Commission. |
| 1 | Morningstar® LSTA® US Leveraged Loan IndexSM is an unmanaged index of the institutional leveraged loan market. Morningstar® LSTA® Leveraged Loan indices are a product of Morningstar, Inc. (“Morningstar”) and have been licensed for use. Morningstar® is a registered trademark of Morningstar licensed for certain use. Loan Syndications and Trading Association® and LSTA® are trademarks of the LSTA licensed for certain use by Morningstar, and further sublicensed by Morningstar for certain use. Neither Morningstar nor LSTA guarantees the accuracy and/or completeness of the Morningstar® LSTA® US Leveraged Loan IndexSM or any data included therein, and shall have no liability for any errors, omissions, or interruptions therein. Unless otherwise stated, index returns do not reflect the effect of any applicable sales charges, commissions, expenses, taxes or leverage, as applicable. It is not possible to invest directly in an index. Prior to August 29, 2022, the index name was S&P/LSTA Leveraged Loan Index. |
| 2 | Total Returns at NAV do not include applicable sales charges. If sales charges were deducted, the returns would be lower. Total Returns shown with maximum sales charge reflect the stated maximum sales charge. Unless otherwise stated, performance does not reflect the deduction of taxes on Fund distributions or redemptions of Fund shares. |
Effective November 5, 2020, Class C shares automatically convert to Class A shares eight years after purchase. The average annual total returns listed for Class C reflect conversion to Class A shares after eight years. Prior to November 5, 2020, Class C shares automatically converted to Class A shares ten years after purchase.
Performance prior to the inception date of a class may be linked to the performance of an older class of the Fund. This linked performance is adjusted for any applicable sales charge, but is not adjusted for class expense differences. If adjusted for such differences, the performance would be different. The performance of Class R6 is linked to Class I. Performance presented in the Financial Highlights included in the financial statements is not linked.
| 3 | Source: Fund prospectus. The expense ratios for the current reporting period can be found in the Financial Highlights section of this report. Performance reflects expenses waived and/or reimbursed, if applicable. Without such waivers and/or reimbursements, performance would have been lower. |
| 4 | Total leverage is shown as a percentage of the Fund’s aggregate net assets plus borrowings outstanding. The Fund employs leverage through borrowings. Use of leverage creates an opportunity for income, but creates risks including greater volatility of NAV. The cost of borrowings rises and falls with changes in short-term interest rates. The Fund may be required to maintain prescribed asset coverage for its leverage and may be required to reduce its leverage at an inopportune time. |
Fund profile subject to change due to active management.
Additional Information
S&P 500® Index is an unmanaged index of large-cap stocks commonly used as a measure of U.S. stock market performance. S&P Dow Jones Indices are a product of S&P Dow Jones Indices LLC (“S&P DJI”) and have been licensed for use. S&P® and S&P 500® are registered trademarks of S&P DJI; Dow Jones® is a registered trademark of Dow Jones Trademark Holdings LLC (“Dow Jones”); S&P DJI, Dow Jones and their respective affiliates do not sponsor, endorse, sell or promote the Fund, will not have any liability with respect thereto and do not have any liability for any errors, omissions, or interruptions of the S&P Dow Jones Indices.
Eaton Vance
Floating-Rate Advantage Fund
October 31, 2022
Fund Expenses
Example
As a Fund shareholder, you incur two types of costs: (1) transaction costs, including sales charges (loads) on purchases and redemption fees (if applicable); and (2) ongoing costs, including management fees; distribution and/or service fees; and other Fund expenses. This Example is intended to help you understand your ongoing costs (in dollars) of Fund investing and to compare these costs with the ongoing costs of investing in other mutual funds. The Example is based on an investment of $1,000 invested at the beginning of the period and held for the entire period (May 1, 2022 to October 31, 2022).
Actual Expenses
The first section of the table below provides information about actual account values and actual expenses. You may use the information in this section, together with the amount you invested, to estimate the expenses that you paid over the period. Simply divide your account value by $1,000 (for example, an $8,600 account value divided by $1,000 = 8.6), then multiply the result by the number in the first section under the heading entitled “Expenses Paid During Period” to estimate the expenses you paid on your account during this period.
Hypothetical Example for Comparison Purposes
The second section of the table below provides information about hypothetical account values and hypothetical expenses based on the actual Fund expense ratio and an assumed rate of return of 5% per year (before expenses), which is not the actual Fund return. The hypothetical account values and expenses may not be used to estimate the actual ending account balance or expenses you paid for the period. You may use this information to compare the ongoing costs of investing in your Fund and other funds. To do so, compare this 5% hypothetical example with the 5% hypothetical examples that appear in the shareholder reports of the other funds.
Please note that the expenses shown in the table are meant to highlight your ongoing costs only and do not reflect any transactional costs, such as sales charges (loads) or redemption fees (if applicable). Therefore, the second section of the table is useful in comparing ongoing costs only, and will not help you determine the relative total costs of owning different funds. In addition, if these transactional costs were included, your costs would be higher.
| | | | | | | | | | | | | | | | |
| | | Beginning
Account Value
(5/1/22) | | | Ending
Account Value
(10/31/22) | | | Expenses Paid
During Period*
(5/1/22 – 10/31/22) | | | Annualized
Expense
Ratio | |
| | | | |
Actual | | | | | | | | | | | | | | | | |
Advisers Class | | $ | 1,000.00 | | | $ | 957.30 | | | $ | 8.24 | | | | 1.67 | % |
Class A | | $ | 1,000.00 | | | $ | 957.40 | | | $ | 8.24 | | | | 1.67 | % |
Class C | | $ | 1,000.00 | | | $ | 954.80 | | | $ | 10.64 | | | | 2.16 | % |
Class I | | $ | 1,000.00 | | | $ | 958.50 | | | $ | 6.86 | | | | 1.39 | % |
Class R6 | | $ | 1,000.00 | | | $ | 958.60 | | | $ | 6.37 | | | | 1.29 | % |
| | | | | |
Hypothetical | | | | | | | | | | | | | | | | |
(5% return per year before expenses) | | | | | | | | | | | | | | | | |
Advisers Class | | $ | 1,000.00 | | | $ | 1,016.79 | | | $ | 8.49 | | | | 1.67 | % |
Class A | | $ | 1,000.00 | | | $ | 1,016.79 | | | $ | 8.49 | | | | 1.67 | % |
Class C | | $ | 1,000.00 | | | $ | 1,014.32 | | | $ | 10.97 | | | | 2.16 | % |
Class I | | $ | 1,000.00 | | | $ | 1,018.20 | | | $ | 7.07 | | | | 1.39 | % |
Class R6 | | $ | 1,000.00 | | | $ | 1,018.70 | | | $ | 6.56 | | | | 1.29 | % |
| * | Expenses are equal to the Fund’s annualized expense ratio for the indicated Class, multiplied by the average account value over the period, multiplied by 184/365 (to reflect the one-half year period). The Example assumes that the $1,000 was invested at the net asset value per share determined at the close of business on April 30, 2022. The Example reflects the expenses of both the Fund and the Portfolio. |
Eaton Vance
Floating-Rate Advantage Fund
October 31, 2022
Statement of Assets and Liabilities
| | | | |
| Assets | | October 31, 2022 | |
| |
Investment in Senior Debt Portfolio, at value (identified cost $7,929,528,237) | | $ | 6,970,396,360 | |
| |
Receivable for Fund shares sold | | | 20,580,421 | |
| |
Total assets | | $ | 6,990,976,781 | |
|
| Liabilities | |
| |
Payable for Fund shares redeemed | | $ | 48,338,880 | |
| |
Distributions payable | | | 6,310,192 | |
|
Payable to affiliates: | |
| |
Administration fee | | | 600,476 | |
| |
Distribution and service fees | | | 511,865 | |
| |
Trustees’ fees | | | 42 | |
| |
Accrued expenses | | | 1,109,272 | |
| |
Total liabilities | | $ | 56,870,727 | |
| |
Net Assets | | $ | 6,934,106,054 | |
|
| Sources of Net Assets | |
| |
Paid-in capital | | $ | 8,399,416,140 | |
| |
Accumulated loss | | | (1,465,310,086 | ) |
| |
Net Assets | | $ | 6,934,106,054 | |
|
| Advisers Class Shares | |
| |
Net Assets | | $ | 82,924,504 | |
| |
Shares Outstanding | | | 8,619,104 | |
| |
Net Asset Value, Offering Price and Redemption Price Per Share | | | | |
| |
(net assets ÷ shares of beneficial interest outstanding) | | $ | 9.62 | |
|
| Class A Shares | |
| |
Net Assets | | $ | 1,259,540,400 | |
| |
Shares Outstanding | | | 130,882,783 | |
|
Net Asset Value and Redemption Price Per Share | |
| |
(net assets ÷ shares of beneficial interest outstanding) | | $ | 9.62 | |
|
Maximum Offering Price Per Share | |
| |
(100 ÷ 96.75 of net asset value per share) | | $ | 9.94 | |
|
| Class C Shares | |
| |
Net Assets | | $ | 352,238,855 | |
| |
Shares Outstanding | | | 36,666,813 | |
|
Net Asset Value and Offering Price Per Share* | |
| |
(net assets ÷ shares of beneficial interest outstanding) | | $ | 9.61 | |
|
| Class I Shares | |
| |
Net Assets | | $ | 5,215,270,895 | |
| |
Shares Outstanding | | | 541,984,944 | |
|
Net Asset Value, Offering Price and Redemption Price Per Share | |
| |
(net assets ÷ shares of beneficial interest outstanding) | | $ | 9.62 | |
| | | | |
| | 7 | | See Notes to Financial Statements. |
Eaton Vance
Floating-Rate Advantage Fund
October 31, 2022
Statement of Assets and Liabilities — continued
| | | | |
| Class R6 Shares | | October 31, 2022 | |
| |
Net Assets | | $ | 24,131,400 | |
| |
Shares Outstanding | | | 2,509,645 | |
|
Net Asset Value, Offering Price and Redemption Price Per Share | |
| |
(net assets ÷ shares of beneficial interest outstanding) | | $ | 9.62 | |
On sales of $100,000 or more, the offering price of Class A shares is reduced.
| * | Redemption price per share is equal to the net asset value less any applicable contingent deferred sales charge. |
| | | | |
| | 8 | | See Notes to Financial Statements. |
Eaton Vance
Floating-Rate Advantage Fund
October 31, 2022
Statement of Operations
| | | | |
| Investment Income | | Year Ended
October 31, 2022 | |
| |
Dividend income allocated from Portfolio | | $ | 4,454,469 | |
| |
Interest and other income allocated from Portfolio | | | 509,881,992 | |
| |
Expenses, excluding interest expense, allocated from Portfolio | | | (43,229,508 | ) |
| |
Interest expense allocated from Portfolio | | | (39,645,074 | ) |
Total investment income from Portfolio | | $ | 431,461,879 | |
|
| Expenses | |
| |
Administration fee | | $ | 8,358,961 | |
|
Distribution and service fees: | |
| |
Advisers Class | | | 224,259 | |
| |
Class A | | | 3,427,122 | |
| |
Class C | | | 3,053,545 | |
| |
Trustees’ fees and expenses | | | 500 | |
| |
Custodian fee | | | 62,000 | |
| |
Transfer and dividend disbursing agent fees | | | 4,938,309 | |
| |
Legal and accounting services | | | 173,086 | |
| |
Printing and postage | | | 404,478 | |
| |
Registration fees | | | 370,127 | |
| |
Miscellaneous | | | 61,527 | |
Total expenses | | $ | 21,073,914 | |
| |
Net investment income | | $ | 410,387,965 | |
|
| Realized and Unrealized Gain (Loss) from Portfolio | |
|
Net realized gain (loss): | |
| |
Investment transactions | | $ | (129,132,041 | ) |
| |
Foreign currency transactions | | | 12,719,200 | |
| |
Forward foreign currency exchange contracts | | | 174,977,901 | |
Net realized gain | | $ | 58,565,060 | |
|
Change in unrealized appreciation (depreciation): | |
| |
Investments | | $ | (877,149,406 | ) |
| |
Foreign currency | | | (1,237,124 | ) |
| |
Forward foreign currency exchange contracts | | | (11,475,734 | ) |
| |
Net change in unrealized appreciation (depreciation) | | $ | (889,862,264 | ) |
| |
Net realized and unrealized loss | | $ | (831,297,204 | ) |
| |
Net decrease in net assets from operations | | $ | (420,909,239 | ) |
| | | | |
| | 9 | | See Notes to Financial Statements. |
Eaton Vance
Floating-Rate Advantage Fund
October 31, 2022
Statements of Changes in Net Assets
| | | | | | | | |
| | | Year Ended October 31, | |
| Increase (Decrease) in Net Assets | | 2022 | | | 2021 | |
| | |
From operations: | | | | | | | | |
| | |
Net investment income | | $ | 410,387,965 | | | $ | 257,375,581 | |
| | |
Net realized gain (loss) | | | 58,565,060 | | | | (7,279,554 | ) |
| | |
Net change in unrealized appreciation (depreciation) | | | (889,862,264 | ) | | | 289,687,526 | |
| | |
Net increase (decrease) in net assets from operations | | $ | (420,909,239 | ) | | $ | 539,783,553 | |
| | |
Distributions to shareholders: | | | | | | | | |
| | |
Advisers Class | | $ | (4,262,210 | ) | | $ | (2,952,681 | ) |
| | |
Class A | | | (64,863,824 | ) | | | (51,259,370 | ) |
| | |
Class C | | | (17,090,864 | ) | | | (15,957,989 | ) |
| | |
Class I | | | (317,923,672 | ) | | | (191,260,639 | ) |
| | |
Class R6 | | | (3,300,693 | ) | | | (4,430,148 | ) |
| | |
Total distributions to shareholders | | $ | (407,441,263 | ) | | $ | (265,860,827 | ) |
| | |
Transactions in shares of beneficial interest: | | | | | | | | |
| | |
Advisers Class | | $ | 2,955,057 | | | $ | 20,660,038 | |
| | |
Class A | | | 11,843,171 | | | | 142,830,927 | |
| | |
Class C | | | (44,912,321 | ) | | | (96,895,146 | ) |
| | |
Class I | | | (37,587,568 | ) | | | 2,168,779,553 | |
| | |
Class R6 | | | (107,120,998 | ) | | | 99,462,411 | |
| | |
Net increase (decrease) in net assets from Fund share transactions | | $ | (174,822,659 | ) | | $ | 2,334,837,783 | |
Net increase (decrease) in net assets | | $ | (1,003,173,161 | ) | | $ | 2,608,760,509 | |
| | |
| Net Assets | | | | | | | | |
| | |
At beginning of year | | $ | 7,937,279,215 | | | $ | 5,328,518,706 | |
| | |
At end of year | | $ | 6,934,106,054 | | | $ | 7,937,279,215 | |
| | | | |
| | 10 | | See Notes to Financial Statements. |
Eaton Vance
Floating-Rate Advantage Fund
October 31, 2022
Financial Highlights
| | | | | | | | | | | | | | | | | | | | |
| | | Advisers Class | |
| |
| | | Year Ended October 31, | |
| | | 2022 | | | 2021 | | | 2020 | | | 2019 | | | 2018 | |
| | | | | |
Net asset value — Beginning of year | | $ | 10.580 | | | $ | 10.070 | | | $ | 10.550 | | | $ | 10.940 | | | $ | 10.910 | |
| | | | | |
| Income (Loss) From Operations | | | | | | | | | | | | | | | | | | | | |
| | | | | |
Net investment income(1) | | $ | 0.487 | | | $ | 0.398 | | | $ | 0.457 | | | $ | 0.558 | | | $ | 0.493 | |
| | | | | |
Net realized and unrealized gain (loss) | | | (0.966 | ) | | | 0.528 | | | | (0.473 | ) | | | (0.390 | ) | | | 0.029 | |
| | | | | |
Total income (loss) from operations | | $ | (0.479 | ) | | $ | 0.926 | | | $ | (0.016 | ) | | $ | 0.168 | | | $ | 0.522 | |
| | | | | |
| Less Distributions | | | | | | | | | | | | | | | | | | | | |
| | | | | |
From net investment income | | $ | (0.481 | ) | | $ | (0.416 | ) | | $ | (0.464 | ) | | $ | (0.558 | ) | | $ | (0.492 | ) |
| | | | | |
Total distributions | | $ | (0.481 | ) | | $ | (0.416 | ) | | $ | (0.464 | ) | | $ | (0.558 | ) | | $ | (0.492 | ) |
| | | | | |
Net asset value — End of year | | $ | 9.620 | | | $ | 10.580 | | | $ | 10.070 | | | $ | 10.550 | | | $ | 10.940 | |
| | | | | |
Total Return(2) | | | (4.62 | )% | | | 9.30 | % | | | (0.05 | )% | | | 1.59 | % | | | 4.88 | % |
| | | | | |
| Ratios/Supplemental Data | | | | | | | | | | | | | | | | | | | | |
| | | | | |
Net assets, end of year (000’s omitted) | | $ | 82,925 | | | $ | 88,509 | | | $ | 64,551 | | | $ | 139,516 | | | $ | 221,484 | |
| | | | | |
Ratios (as a percentage of average daily net assets):(3) | | | | | | | | | | | | | | | | | | | | |
| | | | | |
Expenses excluding interest and fees | | | 0.94 | % | | | 0.95 | % | | | 1.00 | % | | | 0.99 | % | | | 0.96 | % |
| | | | | |
Interest and fee expense | | | 0.49 | % | | | 0.33 | % | | | 0.63 | % | | | 0.87 | % | | | 0.44 | % |
| | | | | |
Total expenses | | | 1.43 | %(4) | | | 1.28 | % | | | 1.63 | % | | | 1.86 | % | | | 1.40 | % |
| | | | | |
Net investment income | | | 4.79 | % | | | 3.79 | % | | | 4.50 | % | | | 5.21 | % | | | 4.51 | % |
| | | | | |
Portfolio Turnover of the Portfolio | | | 27 | % | | | 28 | % | | | 30 | % | | | 17 | % | | | 29 | % |
| (1) | Computed using average shares outstanding. |
| (2) | Returns are historical and are calculated by determining the percentage change in net asset value with all distributions reinvested. |
| (3) | Includes the Fund’s share of the Portfolio’s allocated expenses. |
| (4) | Includes a reduction by the investment adviser of a portion of the Portfolio’s adviser fee due to the Portfolio’s investment in the Liquidity Fund (equal to less than 0.005% of average daily net assets for the year ended October 31, 2022). |
| | | | |
| | 11 | | See Notes to Financial Statements. |
Eaton Vance
Floating-Rate Advantage Fund
October 31, 2022
Financial Highlights — continued
| | | | | | | | | | | | | | | | | | | | |
| | | Class A | |
| |
| | | Year Ended October 31, | |
| | | 2022 | | | 2021 | | | 2020 | | | 2019 | | | 2018 | |
| | | | | |
Net asset value — Beginning of year | | $ | 10.580 | | | $ | 10.070 | | | $ | 10.550 | | | $ | 10.950 | | | $ | 10.910 | |
| | | | | |
| Income (Loss) From Operations | | | | | | | | | | | | | | | | | | | | |
| | | | | |
Net investment income(1) | | $ | 0.485 | | | $ | 0.399 | | | $ | 0.447 | | | $ | 0.559 | | | $ | 0.493 | |
| | | | | |
Net realized and unrealized gain (loss) | | | (0.964 | ) | | | 0.527 | | | | (0.463 | ) | | | (0.401 | ) | | | 0.039 | |
| | | | | |
Total income (loss) from operations | | $ | (0.479 | ) | | $ | 0.926 | | | $ | (0.016 | ) | | $ | 0.158 | | | $ | 0.532 | |
| | | | | |
| Less Distributions | | | | | | | | | | | | | | | | | | | | |
| | | | | |
From net investment income | | $ | (0.481 | ) | | $ | (0.416 | ) | | $ | (0.464 | ) | | $ | (0.558 | ) | | $ | (0.492 | ) |
| | | | | |
Total distributions | | $ | (0.481 | ) | | $ | (0.416 | ) | | $ | (0.464 | ) | | $ | (0.558 | ) | | $ | (0.492 | ) |
| | | | | |
Net asset value — End of year | | $ | 9.620 | | | $ | 10.580 | | | $ | 10.070 | | | $ | 10.550 | | | $ | 10.950 | |
| | | | | |
Total Return(2) | | | (4.62 | )% | | | 9.30 | % | | | (0.05 | )% | | | 1.50 | % | | | 4.97 | % |
| | | | | |
| Ratios/Supplemental Data | | | | | | | | | | | | | | | | | | | | |
| | | | | |
Net assets, end of year (000’s omitted) | | $ | 1,259,540 | | | $ | 1,378,928 | | | $ | 1,175,942 | | | $ | 1,426,205 | | | $ | 1,856,836 | |
| | | | | |
Ratios (as a percentage of average daily net assets):(3) | | | | | | | | | | | | | | | | | | | | |
| | | | | |
Expenses excluding interest and fees | | | 0.94 | % | | | 0.95 | % | | | 0.99 | % | | | 0.99 | % | | | 0.96 | % |
| | | | | |
Interest and fee expense | | | 0.49 | % | | | 0.33 | % | | | 0.60 | % | | | 0.88 | % | | | 0.44 | % |
| | | | | |
Total expenses | | | 1.43 | %(4) | | | 1.28 | % | | | 1.59 | % | | | 1.87 | % | | | 1.40 | % |
| | | | | |
Net investment income | | | 4.77 | % | | | 3.80 | % | | | 4.44 | % | | | 5.21 | % | | | 4.50 | % |
| | | | | |
Portfolio Turnover of the Portfolio | | | 27 | % | | | 28 | % | | | 30 | % | | | 17 | % | | | 29 | % |
| (1) | Computed using average shares outstanding. |
| (2) | Returns are historical and are calculated by determining the percentage change in net asset value with all distributions reinvested and do not reflect the effect of sales charges. |
| (3) | Includes the Fund’s share of the Portfolio’s allocated expenses. |
| (4) | Includes a reduction by the investment adviser of a portion of the Portfolio’s adviser fee due to the Portfolio’s investment in the Liquidity Fund (equal to less than 0.005% of average daily net assets for the year ended October 31, 2022). |
| | | | |
| | 12 | | See Notes to Financial Statements. |
Eaton Vance
Floating-Rate Advantage Fund
October 31, 2022
Financial Highlights — continued
| | | | | | | | | | | | | | | | | | | | |
| | | Class C | |
| |
| | | Year Ended October 31, | |
| | | 2022 | | | 2021 | | | 2020 | | | 2019 | | | 2018 | |
| | | | | |
Net asset value — Beginning of year | | $ | 10.560 | | | $ | 10.050 | | | $ | 10.530 | | | $ | 10.920 | | | $ | 10.890 | |
| | | | | |
| Income (Loss) From Operations | | | | | | | | | | | | | | | | | | | | |
| | | | | |
Net investment income(1) | | $ | 0.430 | | | $ | 0.347 | | | $ | 0.397 | | | $ | 0.503 | | | $ | 0.436 | |
| | | | | |
Net realized and unrealized gain (loss) | | | (0.950 | ) | | | 0.526 | | | | (0.464 | ) | | | (0.390 | ) | | | 0.030 | |
| | | | | |
Total income (loss) from operations | | $ | (0.520 | ) | | $ | 0.873 | | | $ | (0.067 | ) | | $ | 0.113 | | | $ | 0.466 | |
| | | | | |
| Less Distributions | | | | | | | | | | | | | | | | | | | | |
| | | | | |
From net investment income | | $ | (0.430 | ) | | $ | (0.363 | ) | | $ | (0.413 | ) | | $ | (0.503 | ) | | $ | (0.436 | ) |
| | | | | |
Total distributions | | $ | (0.430 | ) | | $ | (0.363 | ) | | $ | (0.413 | ) | | $ | (0.503 | ) | | $ | (0.436 | ) |
| | | | | |
Net asset value — End of year | | $ | 9.610 | | | $ | 10.560 | | | $ | 10.050 | | | $ | 10.530 | | | $ | 10.920 | |
| | | | | |
Total Return(2) | | | (5.11 | )% | | | 8.77 | % | | | (0.56 | )% | | | 1.08 | % | | | 4.36 | % |
| | | | | |
| Ratios/Supplemental Data | | | | | | | | | | | | | | | | | | | | |
| | | | | |
Net assets, end of year (000’s omitted) | | $ | 352,239 | | | $ | 435,786 | | | $ | 508,535 | | | $ | 754,873 | | | $ | 1,192,124 | |
| | | | | |
Ratios (as a percentage of average daily net assets):(3) | | | | | | | | | | | | | | | | | | | | |
| | | | | |
Expenses excluding interest and fees | | | 1.44 | % | | | 1.46 | % | | | 1.50 | % | | | 1.49 | % | | | 1.46 | % |
| | | | | |
Interest and fee expense | | | 0.48 | % | | | 0.33 | % | | | 0.60 | % | | | 0.87 | % | | | 0.44 | % |
| | | | | |
Total expenses | | | 1.92 | %(4) | | | 1.79 | % | | | 2.10 | % | | | 2.36 | % | | | 1.90 | % |
| | | | | |
Net investment income | | | 4.23 | % | | | 3.31 | % | | | 3.95 | % | | | 4.71 | % | | | 4.00 | % |
| | | | | |
Portfolio Turnover of the Portfolio | | | 27 | % | | | 28 | % | | | 30 | % | | | 17 | % | | | 29 | % |
| (1) | Computed using average shares outstanding. |
| (2) | Returns are historical and are calculated by determining the percentage change in net asset value with all distributions reinvested and do not reflect the effect of sales charges. |
| (3) | Includes the Fund’s share of the Portfolio’s allocated expenses. |
| (4) | Includes a reduction by the investment adviser of a portion of the Portfolio’s adviser fee due to the Portfolio’s investment in the Liquidity Fund (equal to less than 0.005% of average daily net assets for the year ended October 31, 2022). |
| | | | |
| | 13 | | See Notes to Financial Statements. |
Eaton Vance
Floating-Rate Advantage Fund
October 31, 2022
Financial Highlights — continued
| | | | | | | | | | | | | | | | | | | | |
| | | Class I | |
| |
| | | Year Ended October 31, | |
| | | 2022 | | | 2021 | | | 2020 | | | 2019 | | | 2018 | |
| | | | | |
Net asset value — Beginning of year | | $ | 10.580 | | | $ | 10.070 | | | $ | 10.550 | | | $ | 10.940 | | | $ | 10.910 | |
| | | | | |
| Income (Loss) From Operations | | | | | | | | | | | | | | | | | | | | |
| | | | | |
Net investment income(1) | | $ | 0.507 | | | $ | 0.423 | | | $ | 0.474 | | | $ | 0.586 | | | $ | 0.521 | |
| | | | | |
Net realized and unrealized gain (loss) | | | (0.961 | ) | | | 0.529 | | | | (0.465 | ) | | | (0.392 | ) | | | 0.028 | |
| | | | | |
Total income (loss) from operations | | $ | (0.454 | ) | | $ | 0.952 | | | $ | 0.009 | | | $ | 0.194 | | | $ | 0.549 | |
| | | | | |
| Less Distributions | | | | | | | | | | | | | | | | | | | | |
| | | | | |
From net investment income | | $ | (0.506 | ) | | $ | (0.442 | ) | | $ | (0.489 | ) | | $ | (0.584 | ) | | $ | (0.519 | ) |
| | | | | |
Total distributions | | $ | (0.506 | ) | | $ | (0.442 | ) | | $ | (0.489 | ) | | $ | (0.584 | ) | | $ | (0.519 | ) |
| | | | | |
Net asset value — End of year | | $ | 9.620 | | | $ | 10.580 | | | $ | 10.070 | | | $ | 10.550 | | | $ | 10.940 | |
| | | | | |
Total Return(2) | | | (4.38 | )% | | | 9.57 | % | | | 0.20 | % | | | 1.84 | % | | | 5.14 | % |
| | | | | |
| Ratios/Supplemental Data | | | | | | | | | | | | | | | | | | | | |
| | | | | |
Net assets, end of year (000’s omitted) | | $ | 5,215,271 | | | $ | 5,898,403 | | | $ | 3,545,676 | | | $ | 4,898,901 | | | $ | 7,387,447 | |
| | | | | |
Ratios (as a percentage of average daily net assets):(3) | | | | | | | | | | | | | | | | | | | | |
| | | | | |
Expenses excluding interest and fees | | | 0.69 | % | | | 0.70 | % | | | 0.75 | % | | | 0.74 | % | | | 0.71 | % |
| | | | | |
Interest and fee expense | | | 0.47 | % | | | 0.32 | % | | | 0.60 | % | | | 0.88 | % | | | 0.44 | % |
| | | | | |
Total expenses | | | 1.16 | %(4) | | | 1.02 | % | | | 1.35 | % | | | 1.62 | % | | | 1.15 | % |
| | | | | |
Net investment income | | | 4.99 | % | | | 4.02 | % | | | 4.70 | % | | | 5.47 | % | | | 4.76 | % |
| | | | | |
Portfolio Turnover of the Portfolio | | | 27 | % | | | 28 | % | | | 30 | % | | | 17 | % | | | 29 | % |
| (1) | Computed using average shares outstanding. |
| (2) | Returns are historical and are calculated by determining the percentage change in net asset value with all distributions reinvested. |
| (3) | Includes the Fund’s share of the Portfolio’s allocated expenses. |
| (4) | Includes a reduction by the investment adviser of a portion of the Portfolio’s adviser fee due to the Portfolio’s investment in the Liquidity Fund (equal to less than 0.005% of average daily net assets for the year ended October 31, 2022). |
| | | | |
| | 14 | | See Notes to Financial Statements. |
Eaton Vance
Floating-Rate Advantage Fund
October 31, 2022
Financial Highlights — continued
| | | | | | | | | | | | | | | | |
| | | Class R6 | |
| | |
| | | Year Ended October 31, | | | Period Ended
October 31, 2019(1) | |
| | | 2022 | | | 2021 | | | 2020 | |
| | | | | |
Net asset value — Beginning of period | | $ | 10.580 | | | $ | 10.060 | | | $ | 10.550 | | | $ | 10.740 | |
| | | | |
| Income (Loss) From Operations | | | | | | | | | | | | | | | | |
| | | | |
Net investment income(2) | | $ | 0.480 | | | $ | 0.427 | | | $ | 0.460 | | | $ | 0.247 | |
| | | | |
Net realized and unrealized gain (loss) | | | (0.931 | ) | | | 0.540 | | | | (0.455 | ) | | | (0.190 | ) |
| | | | |
Total income (loss) from operations | | $ | (0.451 | ) | | $ | 0.967 | | | $ | 0.005 | | | $ | 0.057 | |
| | | | |
| Less Distributions | | | | | | | | | | | | | | | | |
| | | | |
From net investment income | | $ | (0.509 | ) | | $ | (0.447 | ) | | $ | (0.495 | ) | | $ | (0.247 | ) |
| | | | |
Total distributions | | $ | (0.509 | ) | | $ | (0.447 | ) | | $ | (0.495 | ) | | $ | (0.247 | ) |
| | | | |
Net asset value — End of period | | $ | 9.620 | | | $ | 10.580 | | | $ | 10.060 | | | $ | 10.550 | |
| | | | |
Total Return(3) | | | (4.36 | )% | | | 9.63 | % | | | 0.16 | % | | | 0.53 | %(4) |
| | | | |
| Ratios/Supplemental Data | | | | | | | | | | | | | | | | |
| | | | |
Net assets, end of period (000’s omitted) | | $ | 24,131 | | | $ | 135,653 | | | $ | 33,814 | | | $ | 10 | |
| | | | |
Ratios (as a percentage of average daily net assets):(5) | | | | | | | | | | | | | | | | |
| | | | |
Expenses excluding interest and fees | | | 0.63 | % | | | 0.65 | % | | | 0.68 | % | | | 0.62 | %(7) |
| | | | |
Interest and fee expense | | | 0.38 | % | | | 0.30 | % | | | 0.55 | % | | | 0.94 | %(7) |
| | | | |
Total expenses | | | 1.01 | %(6) | | | 0.95 | % | | | 1.23 | % | | | 1.56 | %(7) |
| | | | |
Net investment income | | | 4.66 | % | | | 4.06 | % | | | 4.63 | % | | | 5.48 | %(7) |
| | | | |
Portfolio Turnover of the Portfolio | | | 27 | % | | | 28 | % | | | 30 | % | | | 17 | %(4)(8) |
| (1) | For the period from the commencement of operations, May 31, 2019, to October 31, 2019. |
| (2) | Computed using average shares outstanding. |
| (3) | Returns are historical and are calculated by determining the percentage change in net asset value with all distributions reinvested. |
| (5) | Includes the Fund’s share of the Portfolio’s allocated expenses. |
| (6) | Includes a reduction by the investment adviser of a portion of the Portfolio’s adviser fee due to the Portfolio’s investment in the Liquidity Fund (equal to less than 0.005% of average daily net assets for the year ended October 31, 2022). |
| (8) | For the year ended October 31, 2019. |
| | | | |
| | 15 | | See Notes to Financial Statements. |
Eaton Vance
Floating-Rate Advantage Fund
October 31, 2022
Notes to Financial Statements
1 Significant Accounting Policies
Eaton Vance Floating-Rate Advantage Fund (the Fund) is a diversified series of Eaton Vance Mutual Funds Trust (the Trust). The Trust is a Massachusetts business trust registered under the Investment Company Act of 1940, as amended (the 1940 Act), as an open-end management investment company. The Fund offers five classes of shares. Class A shares are generally sold subject to a sales charge imposed at time of purchase. Class C shares are sold at net asset value and are generally subject to a contingent deferred sales charge (see Note 5). Effective November 5, 2020, Class C shares automatically convert to Class A shares eight years after their purchase as described in the Fund’s prospectus. Advisers Class, Class I and Class R6 shares are generally sold at net asset value and are not subject to a sales charge. Each class represents a pro-rata interest in the Fund, but votes separately on class-specific matters and (as noted below) is subject to different expenses. Realized and unrealized gains and losses are allocated daily to each class of shares based on the relative net assets of each class to the total net assets of the Fund. Net investment income, other than class-specific expenses, is allocated daily to each class of shares based upon the ratio of the value of each class’s paid shares to the total value of all paid shares. Sub-accounting, recordkeeping and similar administrative fees payable to financial intermediaries, which are a component of transfer and dividend disbursing agent fees on the Statement of Operations, are not allocated to Class R6 shares. Each class of shares differs in its distribution plan and certain other class-specific expenses. The Fund invests all of its investable assets in interests in Senior Debt Portfolio (the Portfolio), a Massachusetts business trust, having the same investment objective and policies as the Fund. The value of the Fund’s investment in the Portfolio reflects the Fund’s proportionate interest in the net assets of the Portfolio (94.6% at October 31, 2022). The performance of the Fund is directly affected by the performance of the Portfolio. The financial statements of the Portfolio, including the portfolio of investments, are included elsewhere in this report and should be read in conjunction with the Fund’s financial statements.
The following is a summary of significant accounting policies of the Fund. The policies are in conformity with accounting principles generally accepted in the United States of America (U.S. GAAP). The Fund is an investment company and follows accounting and reporting guidance in the Financial Accounting Standards Board (FASB) Accounting Standards Codification Topic 946.
A Investment Valuation — Valuation of securities by the Portfolio is discussed in Note 1A of the Portfolio’s Notes to Financial Statements, which are included elsewhere in this report.
B Income — The Fund’s net investment income or loss consists of the Fund’s pro-rata share of the net investment income or loss of the Portfolio, less all actual and accrued expenses of the Fund.
C Federal Taxes — The Fund’s policy is to comply with the provisions of the Internal Revenue Code applicable to regulated investment companies and to distribute to shareholders each year substantially all of its net investment income, and all or substantially all of its net realized capital gains. Accordingly, no provision for federal income or excise tax is necessary.
As of October 31, 2022, the Fund had no uncertain tax positions that would require financial statement recognition, de-recognition, or disclosure. The Fund files a U.S. federal income tax return annually after its fiscal year-end, which is subject to examination by the Internal Revenue Service for a period of three years from the date of filing.
D Expenses — The majority of expenses of the Trust are directly identifiable to an individual fund. Expenses which are not readily identifiable to a specific fund are allocated taking into consideration, among other things, the nature and type of expense and the relative size of the funds.
E Use of Estimates — The preparation of the financial statements in conformity with U.S. GAAP requires management to make estimates and assumptions that affect the reported amounts of assets and liabilities at the date of the financial statements and the reported amounts of income and expense during the reporting period. Actual results could differ from those estimates.
F Indemnifications — Under the Trust’s organizational documents, its officers and Trustees may be indemnified against certain liabilities and expenses arising out of the performance of their duties to the Fund. Under Massachusetts law, if certain conditions prevail, shareholders of a Massachusetts business trust (such as the Trust) could be deemed to have personal liability for the obligations of the Trust. However, the Trust’s Declaration of Trust contains an express disclaimer of liability on the part of Fund shareholders and the By-laws provide that the Trust shall assume, upon request by the shareholder, the defense on behalf of any Fund shareholders. Moreover, the By-laws also provide for indemnification out of Fund property of any shareholder held personally liable solely by reason of being or having been a shareholder for all loss or expense arising from such liability. Additionally, in the normal course of business, the Fund enters into agreements with service providers that may contain indemnification clauses. The Fund’s maximum exposure under these arrangements is unknown as this would involve future claims that may be made against the Fund that have not yet occurred.
G Other — Investment transactions are accounted for on a trade date basis.
Eaton Vance
Floating-Rate Advantage Fund
October 31, 2022
Notes to Financial Statements — continued
2 Distributions to Shareholders and Income Tax Information
The Fund declares dividends daily to shareholders of record at the time of declaration. Distributions are generally paid monthly. Distributions of realized capital gains are made at least annually. Distributions are declared separately for each class of shares. Shareholders may reinvest income and capital gain distributions in additional shares of the same class of the Fund at the net asset value as of the reinvestment date or, at the election of the shareholder, receive distributions in cash. Distributions to shareholders are determined in accordance with income tax regulations, which may differ from U.S. GAAP. As required by U.S. GAAP, only distributions in excess of tax basis earnings and profits are reported in the financial statements as a return of capital.
Permanent differences between book and tax accounting relating to distributions are reclassified to paid-in capital. For tax purposes, distributions from short-term capital gains are considered to be from ordinary income.
The tax character of distributions declared for the years ended October 31, 2022 and October 31, 2021 was as follows:
| | | | | | | | |
| | | Year Ended October 31, | |
| | | 2022 | | | 2021 | |
| | |
Ordinary income | | $ | 407,441,263 | | | $ | 265,860,827 | |
During the year ended October 31, 2022, accumulated loss was increased by $15,048,566 and paid-in capital was increased by $15,048,566 due to the Fund’s use of equalization accounting. Tax equalization accounting allows the Fund to treat as a distribution that portion of redemption proceeds representing a redeeming shareholder’s portion of undistributed taxable income and net capital gains. These reclassifications had no effect on the net assets or net asset value per share of the Fund.
As of October 31, 2022, the components of distributable earnings (accumulated loss) on a tax basis were as follows:
| | | | |
| | | | | |
| |
Undistributed ordinary income | | $ | 13,324,793 | |
| |
Deferred capital losses | | | (683,898,422 | ) |
| |
Net unrealized depreciation | | | (788,425,579 | ) |
| |
Distributions payable | | | (6,310,878 | ) |
| |
Accumulated loss | | $ | (1,465,310,086 | ) |
At October 31, 2022, the Fund, for federal income tax purposes, had deferred capital losses of $683,898,422 which would reduce its taxable income arising from future net realized gains on investment transactions, if any, to the extent permitted by the Internal Revenue Code, and thus would reduce the amount of distributions to shareholders, which would otherwise be necessary to relieve the Fund of any liability for federal income or excise tax. The deferred capital losses are treated as arising on the first day of the Fund’s next taxable year and retain the same short-term or long-term character as when originally deferred. Of the deferred capital losses at October 31, 2022, $590,901,022 are long-term and $92,997,400 are short-term.
3 Investment Adviser Fee and Other Transactions with Affiliates
The investment adviser fee is earned by Eaton Vance Management (EVM), an indirect, wholly-owned subsidiary of Morgan Stanley, as compensation for investment advisory services rendered to the Fund. The investment adviser fee is computed at an annual rate as a percentage of the Fund’s average daily gross assets that are not invested in other investment companies for which EVM or its affiliates serve as investment adviser and receive an advisory fee as follows and is payable monthly:
| | | | |
| Average Daily Gross Assets | | Annual Fee Rate | |
| |
Up to and including $1 billion | | | 0.5000 | % |
| |
In excess of $1 billion up to and including $2 billion | | | 0.4500 | % |
| |
In excess of $2 billion up to and including $7 billion | | | 0.4000 | % |
| |
In excess of $7 billion up to and including $10 billion | | | 0.3875 | % |
| |
In excess of $10 billion up to and including $15 billion | | | 0.3750 | % |
| |
In excess of $15 billion | | | 0.3625 | % |
Gross assets are calculated by deducting all liabilities of the Fund except the principal amount of any indebtedness for money borrowed. For the year ended October 31, 2022, the Fund incurred no investment adviser fee on such assets. To the extent that the Fund’s assets are invested in the Portfolio, the Fund
Eaton Vance
Floating-Rate Advantage Fund
October 31, 2022
Notes to Financial Statements — continued
is allocated its share of the Portfolio’s investment adviser fee. The Portfolio has engaged Boston Management and Research (BMR) to render investment advisory services. See Note 2 of the Portfolio’s Notes to Financial Statements which are included elsewhere in this report.
The administration fee is earned by EVM as compensation for administrative services rendered to the Fund. The fee is computed at an annual rate of 0.10% of the Fund’s average daily net assets. For the year ended October 31, 2022, the administration fee amounted to $8,358,961. EVM provides sub-transfer agency and related services to the Fund pursuant to a Sub-Transfer Agency Support Services Agreement. For the year ended October 31, 2022, EVM earned $261,055 from the Fund pursuant to such agreement, which is included in transfer and dividend disbursing agent fees on the Statement of Operations. The Fund was informed that Eaton Vance Distributors, Inc. (EVD), an affiliate of EVM and the Fund’s principal underwriter, received $67,232 as its portion of the sales charge on sales of Class A shares for the year ended October 31, 2022. The Fund was informed that Morgan Stanley affiliated broker-dealers, which may be deemed to be affiliates of EVM, BMR and EVD, also received a portion of the sales charge on sales of Class A shares for the year ended October 31, 2022 in the amount of $32,802. EVD also received distribution and service fees from Advisers Class, Class A and Class C shares (see Note 4) and contingent deferred sales charges (see Note 5).
Trustees and officers of the Fund who are members of EVM’s or BMR’s organizations receive remuneration for their services to the Fund out of the investment adviser fee. Certain officers and Trustees of the Fund and the Portfolio are officers of the above organizations.
4 Distribution Plans
The Fund has in effect a distribution plan for Advisers Class shares and Class A shares (Advisers/Class A Plan) pursuant to Rule 12b-1 under the 1940 Act. Pursuant to the Advisers/Class A Plan, the Fund pays EVD a distribution and service fee of 0.25% per annum of its average daily net assets attributable to Advisers Class and Class A shares for distribution services and facilities provided to the Fund by EVD, as well as for personal services and/or the maintenance of shareholder accounts. Distribution and service fees paid or accrued to EVD for the year ended October 31, 2022 amounted to $224,259 for Advisers Class shares and $3,427,122 for Class A shares.
The Fund also has in effect a distribution plan for Class C shares (Class C Plan) pursuant to Rule 12b-1 under the 1940 Act. Pursuant to the Class C Plan, the Fund pays EVD amounts equal to 0.60% per annum of its average daily net assets attributable to Class C shares for providing ongoing distribution services and facilities to the Fund. For the year ended October 31, 2022, the Fund paid or accrued to EVD $2,442,836 for Class C shares.
Pursuant to the Class C Plan, the Fund also makes payments of service fees to EVD, financial intermediaries and other persons in amounts equal to 0.15% per annum of its average daily net assets attributable to Class C shares. Although there is no present intention to do so, Class C shares could pay service fees of up to 0.25% annually upon Trustee approval. Service fees paid or accrued are for personal services and/or the maintenance of shareholder accounts. They are separate and distinct from the sales commissions and distribution fees payable to EVD. Service fees paid or accrued for the year ended October 31, 2022 amounted to $610,709 for Class C shares.
Distribution and service fees are subject to the limitations contained in the Financial Industry Regulatory Authority Rule 2341(d).
5 Contingent Deferred Sales Charges
A contingent deferred sales charge (CDSC) of 1% generally is imposed on redemptions of Class C shares made within 12 months of purchase. Class A shares may be subject to a 0.75% (1% prior to April 29, 2022) CDSC if redeemed within 12 months (18 months prior to April 29, 2022) of purchase (depending on the circumstances of purchase). Generally, the CDSC is based upon the lower of the net asset value at date of redemption or date of purchase. No charge is levied on shares acquired by reinvestment of dividends or capital gain distributions. For the year ended October 31, 2022, the Fund was informed that EVD received approximately $169,000 and $70,000 of CDSCs paid by Class A and Class C shareholders, respectively.
6 Investment Transactions
For the year ended October 31, 2022, increases and decreases in the Fund’s investment in the Portfolio aggregated $1,893,930,174 and $2,438,416,794, respectively.
Eaton Vance
Floating-Rate Advantage Fund
October 31, 2022
Notes to Financial Statements — continued
7 Shares of Beneficial Interest
The Fund’s Declaration of Trust permits the Trustees to issue an unlimited number of full and fractional shares of beneficial interest (without par value). Such shares may be issued in a number of different series (such as the Fund) and classes. Transactions in Fund shares, including direct exchanges pursuant to share class conversions for all periods presented, were as follows:
| | | | | | | | | | | | | | | | |
| | | Year Ended
October 31, 2022 | | | Year Ended
October 31, 2021 | |
| | | Shares | | | Amount | | | Shares | | | Amount | |
| | | | |
Advisers Class | | | | | | | | | | | | | | | | |
| | | | |
Sales | | | 3,137,426 | | | $ | 32,082,416 | | | | 3,423,459 | | | $ | 36,063,423 | |
| | | | |
Issued to shareholders electing to receive payments of distributions in Fund shares | | | 421,564 | | | | 4,228,403 | | | | 277,988 | | | | 2,924,373 | |
| | | | |
Redemptions | | | (3,306,979 | ) | | | (33,355,762 | ) | | | (1,745,553 | ) | | | (18,327,758 | ) |
| | | | |
Net increase | | | 252,011 | | | $ | 2,955,057 | | | | 1,955,894 | | | $ | 20,660,038 | |
| | | | |
Class A | | | | | | | | | | | | | | | | |
| | | | |
Sales | | | 31,521,602 | | | $ | 325,499,146 | | | | 38,032,843 | | | $ | 399,867,689 | |
| | | | |
Issued to shareholders electing to receive payments of distributions in Fund shares | | | 5,414,555 | | | | 54,348,789 | | | | 4,016,339 | | | | 42,241,064 | |
| | | | |
Redemptions | | | (36,378,082 | ) | | | (368,004,764 | ) | | | (28,491,334 | ) | | | (299,277,826 | ) |
| | | | |
Net increase | | | 558,075 | | | $ | 11,843,171 | | | | 13,557,848 | | | $ | 142,830,927 | |
| | | | |
Class C | | | | | | | | | | | | | | | | |
| | | | |
Sales | | | 7,124,983 | | | $ | 73,641,186 | | | | 8,817,717 | | | $ | 92,711,370 | |
| | | | |
Issued to shareholders electing to receive payments of distributions in Fund shares | | | 1,521,498 | | | | 15,247,782 | | | | 1,351,653 | | | | 14,182,610 | |
| | | | |
Redemptions | | | (13,237,792 | ) | | | (133,801,289 | ) | | | (19,496,449 | ) | | | (203,789,126 | ) |
| | | | |
Net decrease | | | (4,591,311 | ) | | $ | (44,912,321 | ) | | | (9,327,079 | ) | | $ | (96,895,146 | ) |
| | | | |
Class I | | | | | | | | | | | | | | | | |
| | | | |
Sales | | | 378,384,610 | | | $ | 3,911,906,179 | | | | 337,493,016 | | | $ | 3,554,740,668 | |
| | | | |
Issued to shareholders electing to receive payments of distributions in Fund shares | | | 25,769,703 | | | | 258,944,572 | | | | 14,628,667 | | | | 153,963,061 | |
| | | | |
Redemptions | | | (419,698,107 | ) | | | (4,208,438,319 | ) | | | (146,715,867 | ) | | | (1,539,924,176 | ) |
| | | | |
Net increase (decrease) | | | (15,543,794 | ) | | $ | (37,587,568 | ) | | | 205,405,816 | | | $ | 2,168,779,553 | |
| | | | |
Class R6 | | | | | | | | | | | | | | | | |
| | | | |
Sales | | | 10,838,711 | | | $ | 111,166,323 | | | | 14,428,998 | | | $ | 151,759,150 | |
| | | | |
Issued to shareholders electing to receive payments of distributions in Fund shares | | | 213,520 | | | | 2,159,950 | | | | 250,695 | | | | 2,638,252 | |
| | | | |
Redemptions | | | (21,370,023 | ) | | | (220,447,271 | ) | | | (5,211,932 | ) | | | (54,934,991 | ) |
| | | | |
Net increase (decrease) | | | (10,317,792 | ) | | $ | (107,120,998 | ) | | | 9,467,761 | | | $ | 99,462,411 | |
Eaton Vance
Floating-Rate Advantage Fund
October 31, 2022
Report of Independent Registered Public Accounting Firm
To the Trustees of Eaton Vance Mutual Funds Trust and Shareholders of Eaton Vance Floating-Rate Advantage Fund:
Opinion on the Financial Statements and Financial Highlights
We have audited the accompanying statement of assets and liabilities of Eaton Vance Floating-Rate Advantage Fund (the “Fund”) (one of the funds constituting Eaton Vance Mutual Funds Trust), as of October 31, 2022, the related statement of operations for the year then ended, the statements of changes in net assets for each of the two years in the period then ended, the financial highlights for each of the five years in the period then ended, and the related notes. In our opinion, the financial statements and financial highlights present fairly, in all material respects, the financial position of the Fund as of October 31, 2022, and the results of its operations for the year then ended, the changes in its net assets for each of the two years in the period then ended, and the financial highlights for each of the five years in the period then ended, in conformity with accounting principles generally accepted in the United States of America.
Basis for Opinion
These financial statements and financial highlights are the responsibility of the Fund’s management. Our responsibility is to express an opinion on the Fund’s financial statements and financial highlights based on our audits. We are a public accounting firm registered with the Public Company Accounting Oversight Board (United States) (PCAOB) and are required to be independent with respect to the Fund in accordance with the U.S. federal securities laws and the applicable rules and regulations of the Securities and Exchange Commission and the PCAOB.
We conducted our audits in accordance with the standards of the PCAOB. Those standards require that we plan and perform the audit to obtain reasonable assurance about whether the financial statements and financial highlights are free of material misstatement, whether due to error or fraud. The Fund is not required to have, nor were we engaged to perform, an audit of its internal control over financial reporting. As part of our audits, we are required to obtain an understanding of internal control over financial reporting but not for the purpose of expressing an opinion on the effectiveness of the Fund’s internal control over financial reporting. Accordingly, we express no such opinion.
Our audits included performing procedures to assess the risks of material misstatement of the financial statements and financial highlights, whether due to error or fraud, and performing procedures that respond to those risks. Such procedures included examining, on a test basis, evidence regarding the amounts and disclosures in the financial statements and financial highlights. Our audits also included evaluating the accounting principles used and significant estimates made by management, as well as evaluating the overall presentation of the financial statements and financial highlights. We believe that our audits provide a reasonable basis for our opinion.
/s/ Deloitte & Touche LLP
Boston, Massachusetts
December 22, 2022
We have served as the auditor of one or more Eaton Vance investment companies since 1959.
Eaton Vance
Floating-Rate Advantage Fund
October 31, 2022
Federal Tax Information (Unaudited)
The Form 1099-DIV you receive in February 2023 will show the tax status of all distributions paid to your account in calendar year 2022. Shareholders are advised to consult their own tax adviser with respect to the tax consequences of their investment in the Fund. As required by the Internal Revenue Code and/or regulations, shareholders must be notified regarding the status of qualified dividend income for individuals and 163(j) interest dividends.
Qualified Dividend Income. For the fiscal year ended October 31, 2022, the Fund designates approximately $1,459,430 or up to the maximum amount of such dividends allowable pursuant to the Internal Revenue Code, as qualified dividend income eligible for the reduced tax rate of 15%.
163(j) Interest Dividends. For the fiscal year ended October 31, 2022, the Fund designates 94.42% of distributions from net investment income as a 163(j) interest dividend.
Senior Debt Portfolio
October 31, 2022
Portfolio of Investments
| | | | | | | | | | |
| Asset-Backed Securities — 3.8% | |
| Security | | | | Principal
Amount
(000’s omitted) | | | Value | |
| | | |
AGL CLO 17, Ltd., Series 2022-17A, Class E, 10.338%, (3 mo. SOFR + 6.35%), 1/21/35(1)(2) | | | | $ | 1,000 | | | $ | 832,224 | |
| | | |
Alinea CLO, Ltd.: | | | | | | | | | | |
| | | |
Series 2018-1A, Class D, 7.343%, (3 mo. USD LIBOR + 3.10%), 7/20/31(1)(2) | | | | | 2,500 | | | | 2,196,693 | |
| | | |
Series 2018-1A, Class E, 10.243%, (3 mo. USD LIBOR + 6.00%), 7/20/31(1)(2) | | | | | 3,000 | | | | 2,410,995 | |
| | | |
AMMC CLO 15, Ltd., Series 2014-15A, Class ERR, 10.989%, (3 mo. USD LIBOR + 6.91%), 1/15/32(1)(2) | | | | | 5,000 | | | | 3,919,760 | |
| | | |
AMMC CLO XII, Ltd., Series 2013-12A, Class ER, 9.092%, (3 mo. USD LIBOR + 6.18%), 11/10/30(1)(2) | | | | | 3,525 | | | | 2,743,021 | |
| | | |
Apidos CLO XX, Series 2015-20A, Class DR, 9.779%, (3 mo. USD LIBOR + 5.70%), 7/16/31(1)(2) | | | | | 2,375 | | | | 1,960,199 | |
| | | |
Ares LVlll CLO, Ltd., Series 2020-58A, Class ER, 10.564%, (3 mo. SOFR + 6.70%), 1/15/35(1)(2) | | | | | 3,000 | | | | 2,439,324 | |
| | | |
Ares XLIX CLO, Ltd.: | | | | | | | | | | |
| | | |
Series 2018-49A, Class D, 7.325%, (3 mo. USD LIBOR + 3.00%), 7/22/30(1)(2) | | | | | 2,500 | | | | 2,216,017 | |
| | | |
Series 2018-49A, Class E, 10.025%, (3 mo. USD LIBOR + 5.70%), 7/22/30(1)(2) | | | | | 3,500 | | | | 2,890,412 | |
| | | |
Ares XXXIIR CLO, Ltd.: | | | | | | | | | | |
| | | |
Series 2014-32RA, Class C, 5.805%, (3 mo. USD LIBOR + 2.90%), 5/15/30(1)(2) | | | | | 5,000 | | | | 4,323,625 | |
| | | |
Series 2014-32RA, Class D, 8.755%, (3 mo. USD LIBOR + 5.85%), 5/15/30(1)(2) | | | | | 1,000 | | | | 810,236 | |
| | | |
Ares XXXVR CLO, Ltd., Series 2015-35RA, Class E, 9.779%, (3 mo. USD LIBOR + 5.70%), 7/15/30(1)(2) | | | | | 4,000 | | | | 3,249,960 | |
| | | |
Babson CLO, Ltd.: | | | | | | | | | | |
| | | |
Series 2015-1A, Class DR, 6.843%, (3 mo. USD LIBOR + 2.60%), 1/20/31(1)(2) | | | | | 2,500 | | | | 2,143,750 | |
| | | |
Series 2018-1A, Class C, 6.679%, (3 mo. USD LIBOR + 2.60%), 4/15/31(1)(2) | | | | | 3,500 | | | | 2,993,819 | |
| | | |
Bain Capital Credit CLO, Ltd., Series 2018-1A, Class D, 7.025%, (3 mo. USD LIBOR + 2.70%), 4/23/31(1)(2) | | | | | 5,000 | | | | 4,292,110 | |
| | | |
Battalion CLO XXII, Ltd., Series 2021-22A, Class E, 11.193%, (3 mo. USD LIBOR + 6.95%), 1/20/35(1)(2) | | | | | 1,750 | | | | 1,434,109 | |
| | | |
Battalion CLO XXIII, Ltd., Series 2022-23A, Class D, 6.083%, (3 mo. SOFR + 3.95%), 5/19/36(1)(2) | | | | | 3,500 | | | | 3,243,152 | |
| | | |
Benefit Street Partners CLO V-B, Ltd.: | | | | | | | | | | |
| | | |
Series 2018-5BA, Class C, 7.173%, (3 mo. USD LIBOR + 2.93%), 4/20/31(1)(2) | | | | | 5,000 | | | | 4,332,635 | |
| | | |
Series 2018-5BA, Class D, 10.193%, (3 mo. USD LIBOR + 5.95%), 4/20/31(1)(2) | | | | | 3,500 | | | | 2,867,620 | |
| | | |
Benefit Street Partners CLO VIII, Ltd., Series 2015-8A, Class DR, 9.843%, (3 mo. USD LIBOR + 5.60%), 1/20/31(1)(2) | | | | | 5,401 | | | | 4,273,152 | |
| | | | | | | | | | |
| Security | | | | Principal
Amount
(000’s omitted) | | | Value | |
| | | |
Benefit Street Partners CLO XIV, Ltd., Series 2018-14A, Class D, 6.843%, (3 mo. USD LIBOR + 2.60%), 4/20/31(1)(2) | | | | $ | 1,500 | | | $ | 1,288,166 | |
| | | |
Benefit Street Partners CLO XVI, Ltd., Series 2018-16A, Class E, 10.779%, (3 mo. USD LIBOR + 6.70%), 1/17/32(1)(2) | | | | | 2,250 | | | | 1,902,560 | |
| | | |
Benefit Street Partners CLO XVII, Ltd., Series 2019-17A, Class ER, 10.429%, (3 mo. USD LIBOR + 6.35%), 7/15/32(1)(2) | | | | | 1,750 | | | | 1,458,174 | |
| | | |
Benefit Street Partners CLO XXII, Ltd., Series 2020-22A, Class ER, 10.893%, (3 mo. SOFR + 6.93%), 4/20/35(1)(2) | | | | | 1,000 | | | | 827,510 | |
| | | |
Benefit Street Partners CLO XXV, Ltd., Series 2021-25A, Class E, 10.929%, (3 mo. USD LIBOR + 6.85%), 1/15/35(1)(2) | | | | | 3,000 | | | | 2,603,145 | |
| | | |
Betony CLO 2, Ltd.: | | | | | | | | | | |
| | | |
Series 2018-1A, Class C, 7.315%, (3 mo. USD LIBOR + 2.90%), 4/30/31(1)(2) | | | | | 2,500 | | | | 2,181,535 | |
| | | |
Series 2018-1A, Class D, 10.065%, (3 mo. USD LIBOR + 5.65%), 4/30/31(1)(2) | | | | | 4,550 | | | | 3,613,346 | |
| | | |
BlueMountain CLO XXIV, Ltd., Series 2019-24A, Class ER, 11.083%, (3 mo. USD LIBOR + 6.84%), 4/20/34(1)(2) | | | | | 1,250 | | | | 1,017,309 | |
| | | |
BlueMountain CLO XXVI, Ltd., Series 2019-26A, Class ER, 11.373%, (3 mo. USD LIBOR + 7.13%), 10/20/34(1)(2) | | | | | 3,000 | | | | 2,501,094 | |
| | | |
BlueMountain CLO XXX, Ltd., Series 2020-30A, Class ER, 10.564%, (3 mo. SOFR + 6.70%), 4/15/35(1)(2) | | | | | 2,000 | | | | 1,583,188 | |
| | | |
BlueMountain CLO XXXV, Ltd., Series 2022-35A, Class E, 9.893%, (3 mo. SOFR + 7.75%), 7/22/35(1)(2) | | | | | 2,000 | | | | 1,735,462 | |
| | | |
BlueMountain CLO, Ltd.: | | | | | | | | | | |
| | | |
Series 2015-3A, Class CR, 6.843%, (3 mo. USD LIBOR + 2.60%), 4/20/31(1)(2) | | | | | 5,000 | | | | 4,099,865 | |
| | | |
Series 2015-3A, Class DR, 9.643%, (3 mo. USD LIBOR + 5.40%), 4/20/31(1)(2) | | | | | 3,000 | | | | 2,274,153 | |
| | | |
Series 2016-3A, Class DR, 6.005%, (3 mo. USD LIBOR + 3.10%), 11/15/30(1)(2) | | | | | 1,500 | | | | 1,302,261 | |
| | | |
Series 2016-3A, Class ER, 8.855%, (3 mo. USD LIBOR + 5.95%), 11/15/30(1)(2) | | | | | 1,500 | | | | 1,164,126 | |
| | | |
Series 2018-1A, Class D, 7.465%, (3 mo. USD LIBOR + 3.05%), 7/30/30(1)(2) | | | | | 2,500 | | | | 2,126,600 | |
| | | |
Series 2018-1A, Class E, 10.365%, (3 mo. USD LIBOR + 5.95%), 7/30/30(1)(2) | | | | | 2,000 | | | | 1,528,400 | |
| | | |
Series 2021-33A, Class E, 9.814%, (3 mo. USD LIBOR + 6.83%), 11/20/34(1)(2) | | | | | 2,500 | | | | 2,090,870 | |
| | | |
Canyon Capital CLO, Ltd.: | | | | | | | | | | |
| | | |
Series 2012-1RA, Class E, 9.779%, (3 mo. USD LIBOR + 5.70%), 7/15/30(1)(2) | | | | | 4,875 | | | | 3,809,369 | |
| | | |
Series 2016-1A, Class DR, 6.879%, (3 mo. USD LIBOR + 2.80%), 7/15/31(1)(2) | | | | | 3,000 | | | | 2,610,582 | |
| | | | |
| | 22 | | See Notes to Financial Statements. |
Senior Debt Portfolio
October 31, 2022
Portfolio of Investments — continued
| | | | | | | | | | |
| Security | | | | Principal
Amount
(000’s omitted) | | | Value | |
| | | |
Canyon Capital CLO, Ltd.: (continued) | | | | | | | | | | |
| | | |
Series 2016-1A, Class ER, 9.829%, (3 mo. USD LIBOR + 5.75%), 7/15/31(1)(2) | | | | $ | 4,000 | | | $ | 3,078,144 | |
| | | |
Series 2016-2A, Class ER, 10.079%, (3 mo. USD LIBOR + 6.00%), 10/15/31(1)(2) | | | | | 4,500 | | | | 3,478,288 | |
| | | |
Series 2018-1A, Class D, 6.979%, (3 mo. USD LIBOR + 2.90%), 7/15/31(1)(2) | | | | | 3,000 | | | | 2,598,006 | |
| | | |
Series 2018-1A, Class E, 9.829%, (3 mo. USD LIBOR + 5.75%), 7/15/31(1)(2) | | | | | 2,750 | | | | 2,168,977 | |
| | | |
Series 2019-2A, Class ER, 10.829%, (3 mo. USD LIBOR + 6.75%), 10/15/34(1)(2) | | | | | 1,500 | | | | 1,236,644 | |
| | | |
Carlyle CLO C17, Ltd.: | | | | | | | | | | |
| | | |
Series C17A, Class CR, 7.215%, (3 mo. USD LIBOR + 2.80%), 4/30/31(1)(2) | | | | | 5,000 | | | | 4,414,415 | |
| | | |
Series C17A, Class DR, 10.415%, (3 mo. USD LIBOR + 6.00%), 4/30/31(1)(2) | | | | | 3,500 | | | | 2,837,838 | |
| | | |
Carlyle Global Market Strategies CLO, Ltd.: Series 2012-3A, Class CR2, 7.511%, (3 mo. USD LIBOR + 3.50%), 1/14/32(1)(2) | | | | | 2,500 | | | | 2,038,950 | |
| | | |
Series 2012-3A, Class DR2, 10.511%, (3 mo. USD LIBOR + 6.50%), 1/14/32(1)(2) | | | | | 1,500 | | | | 1,198,611 | |
| | | |
Series 2014-3RA, Class C, 7.308%, (3 mo. USD LIBOR + 2.95%), 7/27/31(1)(2) | | | | | 1,000 | | | | 859,225 | |
| | | |
Series 2014-3RA, Class D, 9.758%, (3 mo. USD LIBOR + 5.40%), 7/27/31(1)(2) | | | | | 2,150 | | | | 1,675,207 | |
| | | |
Series 2014-4RA, Class C, 6.979%, (3 mo. USD LIBOR + 2.90%), 7/15/30(1)(2) | | | | | 2,750 | | | | 2,357,066 | |
| | | |
Series 2014-4RA, Class D, 9.729%, (3 mo. USD LIBOR + 5.65%), 7/15/30(1)(2) | | | | | 3,500 | | | | 2,686,964 | |
| | | |
Carlyle US CLO, Ltd., Series 2019-4A, Class DR, 10.464%, (3 mo. SOFR + 6.60%), 4/15/35(1)(2) | | | | | 3,000 | | | | 2,341,932 | |
| | | |
CarVal CLO IV, Ltd., Series 2021-1A, Class E, 10.843%, (3 mo. USD LIBOR + 6.60%), 7/20/34(1)(2) | | | | | 1,000 | | | | 852,090 | |
| | | |
CIFC Funding, Ltd., Series 2022-4A, Class D, 6.074%, (3 mo. SOFR + 3.55%), 7/16/35(1)(2) | | | | | 1,750 | | | | 1,605,751 | |
| | | |
Dryden CLO, Ltd.: | | | | | | | | | | |
| | | |
Series 2018-55A, Class D, 6.929%, (3 mo. USD LIBOR + 2.85%), 4/15/31(1)(2) | | | | | 1,500 | | | | 1,303,875 | |
| | | |
Series 2018-55A, Class E, 9.479%, (3 mo. USD LIBOR + 5.40%), 4/15/31(1)(2) | | | | | 2,000 | | | | 1,602,542 | |
| | | |
Series 2022-112A, Class E, 10.514%, (3 mo. SOFR + 7.78%), 8/15/34(1)(2) | | | | | 2,000 | | | | 1,834,140 | |
| | | |
Dryden Senior Loan Fund: | | | | | | | | | | |
| | | |
Series 2015-41A, Class DR, 6.679%, (3 mo. USD LIBOR + 2.60%), 4/15/31(1)(2) | | | | | 7,000 | | | | 6,125,595 | |
| | | |
Series 2015-41A, Class ER, 9.379%, (3 mo. USD LIBOR + 5.30%), 4/15/31(1)(2) | | | | | 1,268 | | | | 1,015,382 | |
| | | |
Series 2016-42A, Class DR, 7.009%, (3 mo. USD LIBOR + 2.93%), 7/15/30(1)(2) | | | | | 2,500 | | | | 2,207,390 | |
| | | |
Series 2016-42A, Class ER, 9.629%, (3 mo. USD LIBOR + 5.55%), 7/15/30(1)(2) | | | | | 3,500 | | | | 2,874,553 | |
| | | |
Elmwood CLO 14, Ltd., Series 2022-1A, Class E, 10.313%, (3 mo. SOFR + 6.35%), 4/20/35(1)(2) | | | | | 1,950 | | | | 1,755,312 | |
| | | | | | | | | | |
| Security | | | | Principal
Amount
(000’s omitted) | | | Value | |
| | | |
Elmwood CLO 17, Ltd., Series 2022-4A, Class E, 9.244%, (3 mo. SOFR + 7.15%), 7/17/35(1)(2) | | | | $ | 2,000 | | | $ | 1,779,814 | |
| | | |
Galaxy XV CLO, Ltd., Series 2013-15A, Class ER, 10.724%, (3 mo. USD LIBOR + 6.65%), 10/15/30(1)(2) | | | | | 4,500 | | | | 3,642,196 | |
| | | |
Galaxy XXV CLO, Ltd.: | | | | | | | | | | |
| | | |
Series 2015-19A, Class D1R, 10.855%, (3 mo. USD LIBOR + 6.53%), 7/24/30(1)(2) | | | | | 2,000 | | | | 1,588,582 | |
| | | |
Series 2018-25A, Class D, 7.458%, (3 mo. USD LIBOR + 3.10%), 10/25/31(1)(2) | | | | | 2,500 | | | | 2,211,837 | |
| | | |
Series 2018-25A, Class E, 10.308%, (3 mo. USD LIBOR + 5.95%), 10/25/31(1)(2) | | | | | 3,500 | | | | 2,826,271 | |
| | | |
Golub Capital Partners CLO 37B, Ltd.: Series 2018-37A, Class D, 7.543%, (3 mo. USD LIBOR + 3.30%), 7/20/30(1)(2) | | | | | 4,000 | | | | 3,515,372 | |
| | | |
Series 2018-37A, Class E, 9.993%, (3 mo. USD LIBOR + 5.75%), 7/20/30(1)(2) | | | | | 4,750 | | | | 4,324,319 | |
| | | |
Golub Capital Partners CLO 53B, Ltd., Series 2021-53A, Class E, 10.943%, (3 mo. USD LIBOR + 6.70%), 7/20/34(1)(2) | | | | | 1,250 | | | | 1,034,799 | |
| | | |
Golub Capital Partners CLO 58B, Ltd., Series 2021-58A, Class E, 11.168%, (3 mo. USD LIBOR + 6.81%), 1/25/35(1)(2) | | | | | 2,500 | | | | 2,057,463 | |
| | | |
Golub Capital Partners CLO, Ltd., Series 2020-48A, Class D, 7.879%, (3 mo. USD LIBOR + 3.80%), 4/17/33(1)(2) | | | | | 2,000 | | | | 1,757,108 | |
| | | |
Halseypoint CLO 5, Ltd., Series 2021-5A, Class E, 11.355%, (3 mo. USD LIBOR + 6.94%), 1/30/35(1)(2) | | | | | 2,000 | | | | 1,673,020 | |
| | | |
Harriman Park CLO, Ltd., Series 2020-1A, Class ER, 10.643%, (3 mo. USD LIBOR + 6.40%), 4/20/34(1)(2) | | | | | 1,000 | | | | 844,910 | |
| | | |
ICG US CLO, Ltd.: | | | | | | | | | | |
| | | |
Series 2018-2A, Class D, 7.425%, (3 mo. USD LIBOR + 3.10%), 7/22/31(1)(2) | | | | | 2,000 | | | | 1,718,470 | |
| | | |
Series 2018-2A, Class E, 10.075%, (3 mo. USD LIBOR + 5.75%), 7/22/31(1)(2) | | | | | 3,000 | | | | 2,239,749 | |
| | | |
Madison Park Funding LIX, Ltd., Series 2021-59A, Class E, 10.794%, (3 mo. USD LIBOR + 6.60%), 1/18/34(1)(2) | | | | | 1,550 | | | | 1,325,250 | |
| | | |
Madison Park Funding XXXVI, Ltd., Series 2019-36A, Class ER, 10.914%, (3 mo. SOFR + 7.05%), 4/15/35(1)(2) | | | | | 2,500 | | | | 2,159,505 | |
| | | |
Marble Point CLO XXIV, Ltd., Series 2022-1A, Class D1, 8.203%, (3 mo. SOFR + 4.24%), 4/20/35(1)(2) | | | | | 2,000 | | | | 1,823,490 | |
| | | |
Neuberger Berman CLO XVIII, Ltd., Series 2014-18A, Class DR2, 10.198%, (3 mo. USD LIBOR + 5.92%), 10/21/30(1)(2) | | | | | 2,000 | | | | 1,689,860 | |
| | | |
Neuberger Berman CLO XXII, Ltd.: | | | | | | | | | | |
| | | |
Series 2016-22A, Class DR, 7.179%, (3 mo. USD LIBOR + 3.10%), 10/17/30(1)(2) | | | | | 2,500 | | | | 2,232,140 | |
| | | | |
| | 23 | | See Notes to Financial Statements. |
Senior Debt Portfolio
October 31, 2022
Portfolio of Investments — continued
| | | | | | | | | | |
| Security | | | | Principal
Amount
(000’s omitted) | | | Value | |
| | | |
Neuberger Berman CLO XXII, Ltd.: (continued) | | | | | | | | | | |
| | | |
Series 2016-22A, Class ER, 10.139%, (3 mo. USD LIBOR + 6.06%), 10/17/30(1)(2) | | | | $ | 3,000 | | | $ | 2,543,190 | |
| | | |
Neuberger Berman Loan Advisers CLO 28, Ltd., Series 2018-28A, Class E, 9.843%, (3 mo. USD LIBOR + 5.60%), 4/20/30(1)(2) | | | | | 1,950 | | | | 1,622,985 | |
| | | |
Neuberger Berman Loan Advisers CLO 48, Ltd., Series 2022-48A, Class E, 10.56%, (3 mo. SOFR + 6.50%), 4/25/36(1)(2) | | | | | 2,600 | | | | 2,222,870 | |
| | | |
OCP CLO, Ltd.: | | | | | | | | | | |
| | | |
Series 2022-24A, Class D, 5.461%, (3 mo. SOFR + 3.80%), 7/20/35(1)(2) | | | | | 500 | | | | 454,612 | |
| | | |
Series 2022-24A, Class E, 9.081%, (3 mo. SOFR + 7.42%), 7/20/35(1)(2) | | | | | 1,000 | | | | 858,601 | |
| | | |
Palmer Square CLO, Ltd.: | | | | | | | | | | |
| | | |
Series 2013-2A, Class DRR, 9.929%, (3 mo. USD LIBOR + 5.85%), 10/17/31(1)(2) | | | | | 3,250 | | | | 2,748,070 | |
| | | |
Series 2015-1A, Class DR4, 9.484%, (3 mo. USD LIBOR + 6.50%), 5/21/34(1)(2) | | | | | 2,000 | | | | 1,700,194 | |
| | | |
Series 2018-1A, Class C, 6.694%, (3 mo. USD LIBOR + 2.50%), 4/18/31(1)(2) | | | | | 3,000 | | | | 2,644,785 | |
| | | |
Series 2018-1A, Class D, 9.344%, (3 mo. USD LIBOR + 5.15%), 4/18/31(1)(2) | | | | | 2,000 | | | | 1,656,110 | |
| | | |
Series 2018-2A, Class D, 9.679%, (3 mo. USD LIBOR + 5.60%), 7/16/31(1)(2) | | | | | 2,000 | | | | 1,718,734 | |
| | | |
Series 2021-2A, Class E, 10.429%, (3 mo. USD LIBOR + 6.35%), 7/15/34(1)(2) | | | | | 1,000 | | | | 886,353 | |
| | | |
Series 2022-1A, Class E, 10.313%, (3 mo. SOFR + 6.35%), 4/20/35(1)(2) | | | | | 5,500 | | | | 4,745,526 | |
| | | |
Series 2022-3A, Class E, 11.274%, (3 mo. SOFR + 7.98%), 7/20/35(1)(2) | | | | | 2,250 | | | | 2,125,868 | |
| | | |
RAD CLO 5, Ltd., Series 2019-5A, Class E, 11.025%, (3 mo. USD LIBOR + 6.70%), 7/24/32(1)(2) | | | | | 1,750 | | | | 1,466,325 | |
| | | |
RAD CLO 11, Ltd., Series 2021-11A, Class E, 10.329%, (3 mo. USD LIBOR + 6.25%), 4/15/34(1)(2) | | | | | 750 | | | | 634,436 | |
| | | |
RAD CLO 14, Ltd., Series 2021-14A, Class E, 10.579%, (3 mo. USD LIBOR + 6.50%), 1/15/35(1)(2) | | | | | 1,050 | | | | 854,466 | |
| | | |
Regatta XIII Funding, Ltd.: | | | | | | | | | | |
| | | |
Series 2018-2A, Class C, 7.179%, (3 mo. USD LIBOR + 3.10%), 7/15/31(1)(2) | | | | | 2,500 | | | | 2,203,268 | |
| | | |
Series 2018-2A, Class D, 10.029%, (3 mo. USD LIBOR + 5.95%), 7/15/31(1)(2) | | | | | 5,000 | | | | 4,032,770 | |
| | | |
Regatta XIV Funding, Ltd.: | | | | | | | | | | |
| | | |
Series 2018-3A, Class D, 7.558%, (3 mo. USD LIBOR + 3.20%), 10/25/31(1)(2) | | | | | 2,500 | | | | 2,206,958 | |
| | | |
Series 2018-3A, Class E, 10.308%, (3 mo. USD LIBOR + 5.95%), 10/25/31(1)(2) | | | | | 4,500 | | | | 3,618,648 | |
| | | |
Regatta XV Funding, Ltd., Series 2018-4A, Class D, 10.858%, (3 mo. USD LIBOR + 6.50%), 10/25/31(1)(2) | | | | | 3,875 | | | | 3,111,687 | |
| | | | | | | | | | | | |
| Security | | | | | Principal
Amount
(000’s omitted) | | | Value | |
| | | |
Upland CLO, Ltd.: | | | | | | | | | | | | |
| | | |
Series 2016-1A, Class CR, 7.143%, (3 mo. USD LIBOR + 2.90%), 4/20/31(1)(2) | | | | | | $ | 4,500 | | | $ | 3,899,839 | |
| | | |
Series 2016-1A, Class DR, 10.143%, (3 mo. USD LIBOR + 5.90%), 4/20/31(1)(2) | | | | | | | 4,625 | | | | 3,694,686 | |
| | | |
Vibrant CLO IX, Ltd.: | | | | | | | | | | | | |
| | | |
Series 2018-9A, Class C, 7.443%, (3 mo. USD LIBOR + 3.20%), 7/20/31(1)(2) | | | | | | | 2,500 | | | | 2,083,450 | |
| | | |
Series 2018-9A, Class D, 10.493%, (3 mo. USD LIBOR + 6.25%), 7/20/31(1)(2) | | | | | | | 3,500 | | | | 2,453,027 | |
| | | |
Vibrant CLO X, Ltd.: | | | | | | | | | | | | |
| | | |
Series 2018-10A, Class C, 7.493%, (3 mo. USD LIBOR + 3.25%), 10/20/31(1)(2) | | | | | | | 5,000 | | | | 4,156,205 | |
| | | |
Series 2018-10A, Class D, 10.433%, (3 mo. USD LIBOR + 6.19%), 10/20/31(1)(2) | | | | | | | 5,000 | | | | 3,645,185 | |
| | | |
Voya CLO, Ltd.: | | | | | | | | | | | | |
| | | |
Series 2014-1A, Class DR2, 10.19%, (3 mo. SOFR + 6.26%), 4/18/31(1)(2) | | | | | | | 3,250 | | | | 2,490,823 | |
| | | |
Series 2015-3A, Class CR, 7.393%, (3 mo. USD LIBOR + 3.15%), 10/20/31(1)(2) | | | | | | | 2,500 | | | | 2,065,483 | |
| | | |
Series 2015-3A, Class DR, 10.443%, (3 mo. USD LIBOR + 6.20%), 10/20/31(1)(2) | | | | | | | 5,500 | | | | 3,974,866 | |
| | | |
Series 2016-3A, Class CR, 7.444%, (3 mo. USD LIBOR + 3.25%), 10/18/31(1)(2) | | | | | | | 2,000 | | | | 1,573,884 | |
| | | |
Series 2016-3A, Class DR, 10.274%, (3 mo. USD LIBOR + 6.08%), 10/18/31(1)(2) | | | | | | | 3,375 | | | | 2,472,660 | |
| | | |
Series 2018-1A, Class C, 6.827%, (3 mo. USD LIBOR + 2.60%), 4/19/31(1)(2) | | | | | | | 5,000 | | | | 4,254,190 | |
| | | |
Webster Park CLO, Ltd.: | | | | | | | | | | | | |
| | | |
Series 2015-1A, Class CR, 7.143%, (3 mo. USD LIBOR + 2.90%), 7/20/30(1)(2) | | | | | | | 2,000 | | | | 1,764,840 | |
| | | |
Series 2015-1A, Class DR, 9.743%, (3 mo. USD LIBOR + 5.50%), 7/20/30(1)(2) | | | | | | | 2,500 | | | | 2,049,573 | |
| | | |
Wellfleet CLO, Ltd.: | | | | | | | | | | | | |
| | | |
Series 2021-3A, Class E, 11.179%, (3 mo. USD LIBOR + 7.10%), 1/15/35(1)(2) | | | | | | | 1,050 | | | | 870,240 | |
| | | |
Series 2022-1A, Class D, 8.004%, (3 mo. SOFR + 4.14%), 4/15/34(1)(2) | | | | | | | 1,000 | | | | 901,800 | |
| | | |
Series 2022-1A, Class E, 11.724%, (3 mo. SOFR + 7.86%), 4/15/34(1)(2) | | | | | | | 2,300 | | | | 2,040,606 | |
| | | |
Series 2022-2A, Class E, 12.173%, (3 mo. SOFR + 8.56%), 10/18/35(1)(2) | | | | | | | 1,000 | | | | 933,156 | |
| |
Total Asset-Backed Securities
(identified cost $337,185,315) | | | $ | 281,262,549 | |
|
| Common Stocks — 0.6% | |
| Security | | | | | Shares | | | Value | |
|
| Aerospace and Defense — 0.0%(3) | |
| | | |
IAP Global Services, LLC(4)(5)(6) | | | | | | | 168 | | | $ | 715,582 | |
| | | |
| | | | | | | | | | | $ | 715,582 | |
| | | | |
| | 24 | | See Notes to Financial Statements. |
Senior Debt Portfolio
October 31, 2022
Portfolio of Investments — continued
| | | | | | | | | | | | |
| Security | | | | | Shares | | | Value | |
|
| Containers and Glass Products — 0.0%(3) | |
| | | |
LG Newco Holdco, Inc., Class A(5)(6) | | | | | | | 342,076 | | | $ | 4,389,964 | |
| | | |
| | | | | | | | | | | $ | 4,389,964 | |
|
| Electronics/Electrical — 0.0%(3) | |
| | | |
Skillsoft Corp.(5)(6) | | | | | | | 1,010,393 | | | $ | 1,808,604 | |
| | | |
| | | | | | | | | | | $ | 1,808,604 | |
|
| Health Care — 0.1% | |
| | | |
Akorn Holding Company, LLC, Class A(5)(6) | | | | | | | 792,089 | | | $ | 4,752,534 | |
| | | |
| | | | | | | | | | | $ | 4,752,534 | |
|
| Investment Companies — 0.1% | |
| | | |
Aegletes B.V.(5)(6) | | | | | | | 138,671 | | | $ | 5,130,827 | |
| | | |
| | | | | | | | | | | $ | 5,130,827 | |
|
| Nonferrous Metals/Minerals — 0.0%(3) | |
| | | |
ACNR Holdings, Inc., Class A(5)(6) | | | | | | | 30,298 | | | $ | 3,120,694 | |
| | | |
| | | | | | | | | | | $ | 3,120,694 | |
|
| Oil and Gas — 0.2% | |
| | | |
AFG Holdings, Inc.(4)(5)(6) | | | | | | | 281,241 | | | $ | 835,286 | |
| | | |
McDermott International, Ltd.(5)(6) | | | | | | | 1,382,889 | | | | 739,846 | |
| | | |
QuarterNorth Energy, Inc.(5)(6) | | | | | | | 92,081 | | | | 11,279,922 | |
| | | |
| | | | | | | | | | | $ | 12,855,054 | |
|
| Radio and Television — 0.1% | |
| | | |
Clear Channel Outdoor Holdings, Inc.(5)(6) | | | | | | | 482,097 | | | $ | 689,399 | |
| | | |
Cumulus Media, Inc., Class A(5)(6) | | | | | | | 371,654 | | | | 2,739,090 | |
| | | |
iHeartMedia, Inc., Class A(5)(6) | | | | | | | 205,018 | | | | 1,697,549 | |
| | | |
| | | | | | | | | | | $ | 5,126,038 | |
|
| Retailers (Except Food and Drug) — 0.0%(3) | |
| | | |
David’s Bridal, LLC(4)(5)(6) | | | | | | | 195,511 | | | $ | 0 | |
| | | |
Phillips Pet Holding Corp.(4)(5)(6) | | | | | | | 2,960 | | | | 907,007 | |
| | | |
| | | | | | | | | | | $ | 907,007 | |
|
| Telecommunications — 0.0%(3) | |
| | | |
GEE Acquisition Holdings Corp.(4)(5)(6) | | | | | | | 390,679 | | | $ | 3,516,111 | |
| | | |
| | | | | | | | | | | $ | 3,516,111 | |
| | | | | | | | | | | | |
| Security | | | | | Shares | | | Value | |
|
| Utilities — 0.1% | |
| | | |
Longview Intermediate Holdings, LLC, Class A(5)(6) | | | | | | | 359,046 | | | $ | 4,936,883 | |
| | | |
| | | | | | | | | | | $ | 4,936,883 | |
| |
Total Common Stocks
(identified cost $70,586,341) | | | $ | 47,259,298 | |
|
| Convertible Preferred Stocks — 0.1% | |
| Security | | | | | Shares | | | Value | |
|
| Containers and Glass Products — 0.1% | |
| | | |
LG Newco Holdco, Inc., Series A, 13.00%(5)(6) | | | | | | | 51,966 | | | $ | 6,196,953 | |
| |
Total Convertible Preferred Stocks
(identified cost $2,728,218) | | | $ | 6,196,953 | |
|
| Corporate Bonds — 8.4% | |
| | | | | | Principal | | | | |
| | | | | | Amount* | | | | |
| Security | | | | | (000’s omitted) | | | Value | |
|
| Aerospace and Defense — 0.1% | |
| | | |
Spirit AeroSystems, Inc., 5.50%, 1/15/25(1) | | | | | | | 3,750 | | | $ | 3,623,906 | |
| | | |
TransDigm, Inc.: | | | | | | | | | | | | |
| | | |
6.25%, 3/15/26(1) | | | | | | | 1,500 | | | | 1,482,203 | |
| | | |
8.00%, 12/15/25(1) | | | | | | | 1,500 | | | | 1,528,095 | |
| | | |
| | | | | | | | | | | $ | 6,634,204 | |
|
| Air Transport — 0.7% | |
| | | |
American Airlines, Inc./AAdvantage Loyalty IP, Ltd.: | | | | | | | | | | | | |
| | | |
5.50%, 4/20/26(1) | | | | | | | 19,300 | | | $ | 18,410,882 | |
| | | |
5.75%, 4/20/29(1) | | | | | | | 14,475 | | | | 13,198,088 | |
| | | |
Delta Air Lines, Inc., 7.00%, 5/1/25(1) | | | | | | | 5,300 | | | | 5,375,176 | |
| | | |
Delta Air Lines, Inc./SkyMiles IP, Ltd., 4.75%, 10/20/28(1) | | | | | | | 7,925 | | | | 7,377,795 | |
| | | |
United Airlines, Inc.: | | | | | | | | | | | | |
| | | |
4.375%, 4/15/26(1) | | | | | | | 5,050 | | | | 4,618,315 | |
| | | |
4.625%, 4/15/29(1) | | | | | | | 5,050 | | | | 4,327,976 | |
| | | |
| | | | | | | | | | | $ | 53,308,232 | |
|
| Airlines — 0.1% | |
| | | |
Air Canada, 3.875%, 8/15/26(1) | | | | | | | 7,550 | | | $ | 6,691,527 | |
| | | |
| | | | | | | | | | | $ | 6,691,527 | |
|
| Automotive — 0.2% | |
| | | |
Clarios Global, L.P., 6.75%, 5/15/25(1) | | | | | | | 2,183 | | | $ | 2,187,628 | |
| | | | |
| | 25 | | See Notes to Financial Statements. |
Senior Debt Portfolio
October 31, 2022
Portfolio of Investments — continued
| | | | | | | | | | | | |
| | | | | | Principal | | | | |
| | | | | | Amount* | | | | |
| Security | | | | | (000’s omitted) | | | Value | |
|
| Automotive (continued) | |
| | | |
Clarios Global, L.P./Clarios US Finance Co., 6.25%, 5/15/26(1) | | | | | | | 4,478 | | | $ | 4,343,033 | |
| | | |
Tenneco, Inc.: | | | | | | | | | | | | |
| | | |
5.125%, 4/15/29(1) | | | | | | | 10,125 | | | | 10,056,178 | |
| | | |
7.875%, 1/15/29(1) | | | | | | | 550 | | | | 545,812 | |
| | | |
| | | | | | | | | | | $ | 17,132,651 | |
|
| Building and Development — 0.1% | |
| | | |
Cushman & Wakefield U.S. Borrower, LLC, 6.75%, 5/15/28(1) | | | | | | | 3,625 | | | $ | 3,455,586 | |
| | | |
Winnebago Industries, Inc., 6.25%, 7/15/28(1) | | | | | | | 1,100 | | | | 1,025,120 | |
| | | |
| | | | | | | | | | | $ | 4,480,706 | |
|
| Business Equipment and Services — 1.0% | |
| | | |
Allied Universal Holdco, LLC/Allied Universal Finance Corp., 6.625%, 7/15/26(1) | | | | | | | 2,475 | | | $ | 2,368,315 | |
| | | |
Allied Universal Holdco, LLC/Allied Universal Finance Corp./Atlas Luxco 4 S.a.r.l.: | | | | | | | | | | | | |
| | | |
4.625%, 6/1/28(1) | | | | | | | 20,725 | | | | 16,994,085 | |
| | | |
4.625%, 6/1/28(1) | | | | | | | 28,825 | | | | 24,169,890 | |
| | | |
Prime Security Services Borrower, LLC/Prime Finance, Inc.: | | | | | | | | | | | | |
| | | |
5.25%, 4/15/24(1) | | | | | | | 9,125 | | | | 9,097,716 | |
| | | |
5.75%, 4/15/26(1) | | | | | | | 17,950 | | | | 17,504,291 | |
| | | |
| | | | | | | | | | | $ | 70,134,297 | |
|
| Cable and Satellite Television — 0.7% | |
| | | |
Altice France S.A.: | | | | | | | | | | | | |
| | | |
5.125%, 1/15/29(1) | | | | | | | 1,600 | | | $ | 1,206,312 | |
| | | |
5.125%, 7/15/29(1) | | | | | | | 63,200 | | | | 47,716,000 | |
| | | |
5.50%, 10/15/29(1) | | | | | | | 6,455 | | | | 4,934,363 | |
| | | |
| | | | | | | | | | | $ | 53,856,675 | |
|
| Chemicals — 0.2% | |
| | | |
Cheever Escrow Issuer, LLC, 7.125%, 10/1/27(1) | | | | | | | 1,075 | | | $ | 988,350 | |
| | | |
INEOS Finance PLC, 3.375%, 3/31/26(1) | | | EUR | | | | 2,000 | | | | 1,780,632 | |
| | | |
INEOS Quattro Finance 2 PLC, 3.375%, 1/15/26(1) | | | | | | | 3,700 | | | | 3,135,287 | |
| | | |
Olympus Water US Holding Corp., 4.25%, 10/1/28(1) | | | | | | | 10,050 | | | | 8,184,148 | |
| | | |
| | | | | | | | | | | $ | 14,088,417 | |
|
| Commercial Services — 0.1% | |
| | | |
WASH Multifamily Acquisition, Inc., 5.75%, 4/15/26(1) | | | | | | | 8,775 | | | $ | 8,196,014 | |
| | | |
| | | | | | | | | | | $ | 8,196,014 | |
| | | | | | | | | | | | |
| | | | | | Principal | | | | |
| | | | | | Amount* | | | | |
| Security | | | | | (000’s omitted) | | | Value | |
| | | |
| Communications Equipment — 0.1% | | | | | | | | | |
| | | |
CommScope, Inc., 4.75%, 9/1/29(1) | | | | | | | 7,038 | | | $ | 5,962,025 | |
| | | |
| | | | | | | | | | | $ | 5,962,025 | |
|
| Containers & Packaging — 0.2% | |
| | | |
Clydesdale Acquisition Holdings, Inc., 6.625%, 4/15/29(1) | | | | | | | 2,525 | | | $ | 2,400,631 | |
| | | |
Pactiv Evergreen Group Issuer, Inc./Pactiv Evergreen Group Issuer, LLC: | | | | | | | | | | | | |
| | | |
4.00%, 10/15/27(1) | | | | | | | 6,325 | | | | 5,614,070 | |
| | | |
4.375%, 10/15/28(1) | | | | | | | 10,100 | | | | 8,851,489 | |
| | | |
| | | | | | | | | | | $ | 16,866,190 | |
|
| Diversified Financial Services — 0.2% | |
| | | |
AG Issuer, LLC, 6.25%, 3/1/28(1) | | | | | | | 11,581 | | | $ | 10,792,649 | |
| | | |
AG TTMT Escrow Issuer, LLC, 8.625%, 9/30/27(1) | | | | | | | 3,350 | | | | 3,367,051 | |
| | | |
NFP Corp., 7.50%, 10/1/30(1) | | | | | | | 3,350 | | | | 3,194,252 | |
| | | |
| | | | | | | | | | | $ | 17,353,952 | |
|
| Diversified Telecommunication Services — 0.1% | |
| | | |
Virgin Media Secured Finance PLC, 4.50%, 8/15/30(1) | | | | | | | 7,625 | | | $ | 6,318,984 | |
| | | |
Zayo Group Holdings, Inc., 4.00%, 3/1/27(1) | | | | | | | 4,000 | | | | 3,097,340 | |
| | | |
| | | | | | | | | | | $ | 9,416,324 | |
|
| Drugs — 0.1% | |
| | | |
Jazz Securities DAC, 4.375%, 1/15/29(1) | | | | | | | 10,050 | | | $ | 8,944,701 | |
| | | |
| | | | | | | | | | | $ | 8,944,701 | |
|
| Ecological Services and Equipment — 0.1% | |
| | | |
GFL Environmental, Inc., 4.25%, 6/1/25(1) | | | | | | | 6,025 | | | $ | 5,760,683 | |
| | | |
| | | | | | | | | | | $ | 5,760,683 | |
|
| Electronics/Electrical — 0.3% | |
| | | |
GoTo Group, Inc., 5.50%, 9/1/27(1) | | | | | | | 12,010 | | | $ | 6,996,065 | |
| | | |
Imola Merger Corp., 4.75%, 5/15/29(1) | | | | | | | 20,200 | | | | 17,451,689 | |
| | | |
| | | | | | | | | | | $ | 24,447,754 | |
|
| Entertainment — 0.1% | |
| | | |
AMC Entertainment Holdings, Inc., 7.50%, 2/15/29(1) | | | | | | | 9,650 | | | $ | 6,646,630 | |
| | | |
Live Nation Entertainment, Inc., 3.75%, 1/15/28(1) | | | | | | | 2,412 | | | | 2,105,094 | |
| | | |
Six Flags Theme Parks, Inc., 7.00%, 7/1/25(1) | | | | | | | 1,208 | | | | 1,221,530 | |
| | | |
| | | | | | | | | | | $ | 9,973,254 | |
|
| Health Care — 0.6% | |
| | | |
HCA, Inc., 5.25%, 4/15/25 | | | | | | | 1,250 | | | $ | 1,229,232 | |
| | | | |
| | 26 | | See Notes to Financial Statements. |
Senior Debt Portfolio
October 31, 2022
Portfolio of Investments — continued
| | | | | | | | | | | | |
| | | | | | Principal | | | | |
| | | | | | Amount* | | | | |
| Security | | | | | (000’s omitted) | | | Value | |
|
| Health Care (continued) | |
| | | |
Medline Borrower, L.P., 3.875%, 4/1/29(1) | | | | | | | 25,150 | | | $ | 20,589,048 | |
| | | |
RP Escrow Issuer, LLC, 5.25%, 12/15/25(1) | | | | | | | 2,650 | | | | 1,988,082 | |
| | | |
Tenet Healthcare Corp., 4.25%, 6/1/29(1) | | | | | | | 25,375 | | | | 21,417,134 | |
| | | |
| | | | | | | | | | | $ | 45,223,496 | |
|
| Hotels, Restaurants & Leisure — 0.5% | |
| | | |
Carnival Corporation, 4.00%, 8/1/28(1) | | | | | | | 37,975 | | | $ | 30,664,813 | |
| | | |
SeaWorld Parks & Entertainment, Inc., 8.75%, 5/1/25(1) | | | | | | | 2,425 | | | | 2,487,165 | |
| | | |
| | | | | | | | | | | $ | 33,151,978 | |
|
| Household Products — 0.0%(3) | |
| | | |
Kronos Acquisition Holdings, Inc./KIK Custom Products, Inc., 5.00%, 12/31/26(1) | | | | | | | 1,300 | | | $ | 1,180,199 | |
| | | |
| | | | | | | | | | | $ | 1,180,199 | |
|
| Insurance — 0.0%(3) | |
| | | |
Alliant Holdings Intermediate LLC/Alliant Holdings Co., 4.25%, 10/15/27(1) | | | | | | | 700 | | | $ | 631,792 | |
| | | |
NFP Corp., 4.875%, 8/15/28(1) | | | | | | | 1,000 | | | | 864,290 | |
| | | |
| | | | | | | | | | | $ | 1,496,082 | |
|
| Internet Software & Services — 0.3% | |
| | | |
Arches Buyer, Inc., 4.25%, 6/1/28(1) | | | | | | | 7,525 | | | $ | 6,190,667 | |
| | | |
Central Parent, Inc./CDK Global, Inc., 7.25%, 6/15/29(1) | | | | | | | 15,225 | | | | 14,586,464 | |
| | | |
| | | | | | | | | | | $ | 20,777,131 | |
|
| IT Services — 0.1% | |
| | | |
Rackspace Technology Global, Inc., 3.50%, 2/15/28(1) | | | | | | | 5,785 | | | $ | 3,830,424 | |
| | | |
| | | | | | | | | | | $ | 3,830,424 | |
|
| Leisure Goods/Activities/Movies — 0.3% | |
| | | |
Lindblad Expeditions, LLC, 6.75%, 2/15/27(1) | | | | | | | 3,475 | | | $ | 3,096,438 | |
| | | |
NCL Corp., Ltd., 5.875%, 2/15/27(1) | | | | | | | 22,375 | | | | 20,005,376 | |
| | | |
| | | | | | | | | | | $ | 23,101,814 | |
|
| Machinery — 0.2% | |
| | | |
Madison IAQ, LLC, 4.125%, 6/30/28(1) | | | | | | | 12,300 | | | $ | 10,206,171 | |
| | | |
TK Elevator U.S. Newco, Inc., 5.25%, 7/15/27(1) | | | | | | | 4,950 | | | | 4,450,149 | |
| | | |
| | | | | | | | | | | $ | 14,656,320 | |
|
| Media — 0.4% | |
| | | |
Diamond Sports Group, LLC/Diamond Sports Finance Co., 5.375%, 8/15/26(1) | | | | | | | 6,700 | | | $ | 1,348,375 | |
| | | | | | | | | | | | |
| | | | | | Principal | | | | |
| | | | | | Amount* | | | | |
| Security | | | | | (000’s omitted) | | | Value | |
|
| Media (continued) | |
| | | |
iHeartCommunications, Inc.: | | | | | | | | | | | | |
| | | |
4.75%, 1/15/28(1) | | | | | | | 2,975 | | | $ | 2,600,105 | |
| | | |
5.25%, 8/15/27(1) | | | | | | | 2,500 | | | | 2,282,000 | |
| | | |
6.375%, 5/1/26 | | | | | | | 1,159 | | | | 1,107,530 | |
| | | |
8.375%, 5/1/27 | | | | | | | 2,101 | | | | 1,891,358 | |
| | | |
Univision Communications, Inc.: | | | | | | | | | | | | |
| | | |
4.50%, 5/1/29(1) | | | | | | | 10,075 | | | | 8,505,315 | |
| | | |
7.375%, 6/30/30(1) | | | | | | | 12,850 | | | | 12,447,859 | |
| | | |
| | | | | | | | | | | $ | 30,182,542 | |
|
| Oil, Gas & Consumable Fuels — 0.2% | |
| | | |
CITGO Petroleum Corporation: | | | | | | | | | | | | |
| | | |
6.375%, 6/15/26(1) | | | | | | | 2,100 | | | $ | 2,073,519 | |
| | | |
7.00%, 6/15/25(1) | | | | | | | 12,175 | | | | 12,003,089 | |
| | | |
| | | | | | | | | | | $ | 14,076,608 | |
|
| Pharmaceuticals — 0.1% | |
| | | |
Bausch Health Companies, Inc.: | | | | | | | | | | | | |
| | | |
4.875%, 6/1/28(1) | | | | | | | 9,050 | | | $ | 5,562,356 | |
| | | |
6.125%, 2/1/27(1) | | | | | | | 6,425 | | | | 4,235,171 | |
| | | |
| | | | | | | | | | | $ | 9,797,527 | |
|
| Professional Services — 0.1% | |
| | | |
CoreLogic, Inc., 4.50%, 5/1/28(1) | | | | | | | 6,000 | | | $ | 4,048,125 | |
| | | |
| | | | | | | | | | | $ | 4,048,125 | |
|
| Real Estate Investment Trusts (REITs) — 0.1% | |
| | | |
Park Intermediate Holdings, LLC/PK Domestic Property, LLC/PK Finance Co-Issuer, 5.875%, 10/1/28(1) | | | | | | | 7,925 | | | $ | 7,209,531 | |
| | | |
| | | | | | | | | | | $ | 7,209,531 | |
|
| Retail — 0.1% | |
| | | |
Fertitta Entertainment, LLC/Fertitta Entertainment Finance Co., Inc., 4.625%, 1/15/29(1) | | | | | | | 6,790 | | | $ | 5,917,926 | |
| | | |
| | | | | | | | | | | $ | 5,917,926 | |
|
| Retailers (Except Food and Drug) — 0.0%(3) | |
| | | |
PetSmart, Inc./PetSmart Finance Corp., 4.75%, 2/15/28(1) | | | | | | | 1,575 | | | $ | 1,441,141 | |
| | | |
| | | | | | | | | | | $ | 1,441,141 | |
|
| Software — 0.3% | |
| | | |
Boxer Parent Co., Inc., 7.125%, 10/2/25(1) | | | | | | | 4,850 | | | $ | 4,776,280 | |
| | | | |
| | 27 | | See Notes to Financial Statements. |
Senior Debt Portfolio
October 31, 2022
Portfolio of Investments — continued
| | | | | | | | | | | | |
| | | | | | Principal | | | | |
| | | | | | Amount* | | | | |
| Security | | | | | (000’s omitted) | | | Value | |
|
| Software (continued) | |
| | | |
Sabre GLBL, Inc.: | | | | | | | | | | | | |
| | | |
7.375%, 9/1/25(1) | | | | | | | 2,675 | | | $ | 2,517,229 | |
| | | |
9.25%, 4/15/25(1) | | | | | | | 2,925 | | | | 2,839,400 | |
| | | |
Veritas US, Inc./Veritas Bermuda, Ltd., 7.50%, 9/1/25(1) | | | | | | | 13,575 | | | | 11,453,574 | |
| | | |
| | | | | | | | | | | $ | 21,586,483 | |
|
| Technology — 0.1% | |
| | | |
Clarivate Science Holdings Corp., 3.875%, 7/1/28(1) | | | | | | | 12,575 | | | $ | 10,814,179 | |
| | | |
| | | | | | | | | | | $ | 10,814,179 | |
|
| Telecommunications — 0.4% | |
| | | |
LCPR Senior Secured Financing DAC, 5.125%, 7/15/29(1) | | | | | | | 10,125 | | | $ | 8,554,916 | |
| | | |
Lumen Technologies, Inc., 4.00%, 2/15/27(1) | | | | | | | 11,175 | | | | 9,517,859 | |
| | | |
VMED O2 UK Financing I PLC, 4.25%, 1/31/31(1) | | | | | | | 10,575 | | | | 8,429,125 | |
| | | |
| | | | | | | | | | | $ | 26,501,900 | |
|
| Trading Companies & Distributors — 0.1% | |
| | | |
American Builders & Contractors Supply Co., Inc., 4.00%, 1/15/28(1) | | | | | | | 875 | | | $ | 773,802 | |
| | | |
SRS Distribution, Inc., 4.625%, 7/1/28(1) | | | | | | | 5,100 | | | | 4,489,377 | |
| | | |
| | | | | | | | | | | $ | 5,263,179 | |
|
| Wireless Telecommunication Services — 0.1% | |
| | | |
Digicel International Finance, Ltd./Digicel International Holdings, Ltd., 8.75%, 5/25/24(1) | | | | | | | 7,250 | | | $ | 6,203,426 | |
| | | |
| | | | | | | | | | | $ | 6,203,426 | |
| |
Total Corporate Bonds
(identified cost $725,253,951) | | | $ | 619,707,617 | |
|
| Exchange-Traded Funds — 0.2% | |
| Security | | | | | Shares | | | Value | |
| | | |
SPDR Blackstone Senior Loan ETF | | | | | | | 384,000 | | | $ | 15,874,560 | |
| |
Total Exchange-Traded Funds
(identified cost $17,625,066) | | | $ | 15,874,560 | |
| | | | | | | | | | | | |
| Preferred Stocks — 0.1% | |
| Security | | | Shares | | | Value | |
|
| Financial Services — 0.0% | |
| | | |
DBI Investors, Inc., Series A-1(4)(5)(6) | | | | | | | 9,245 | | | $ | 0 | |
| | | |
| | | | | | | | | | | $ | 0 | |
|
| Nonferrous Metals/Minerals — 0.1% | |
| | | |
ACNR Holdings, Inc., 15.00% (PIK)(5)(6) | | | | | | | 14,309 | | | $ | 8,835,807 | |
| | | |
| | | | | | | | | | | $ | 8,835,807 | |
|
| Retailers (Except Food and Drug) — 0.0% | |
| | | |
David’s Bridal, LLC: | | | | | | | | | | | | |
| | | |
Series A, 8.00% (PIK)(4)(5)(6) | | | | | | | 5,438 | | | $ | 0 | |
| | | |
Series B, 10.00% (PIK)(4)(5)(6) | | | | | | | 22,162 | | | | 0 | |
| | | |
| | | | | | | | | | | $ | 0 | |
| |
Total Preferred Stocks
(identified cost $1,794,236) | | | $ | 8,835,807 | |
|
| Senior Floating-Rate Loans — 110.8%(7) | |
| | | | | | Principal | | | | |
| | | | | | Amount* | | | | |
| Borrower/Description | | | | | (000’s omitted) | | | Value | |
|
| Aerospace and Defense — 2.5% | |
| | | |
Aernnova Aerospace S.A.U.: | | | | | | | | | | | | |
| | | |
Term Loan, 3.00%, (6 mo. EURIBOR + 3.00%), 2/26/27 | | | EUR | | | | 4,179 | | | $ | 3,534,138 | |
| | | |
Term Loan, 4.10%, (3 mo. EURIBOR + 3.00%), 2/22/27 | | | EUR | | | | 1,071 | | | | 906,189 | |
| | | |
AI Convoy (Luxembourg) S.a.r.l.: | | | | | | | | | | | | |
| | | |
Term Loan, 5.532%, (6 mo. EURIBOR + 3.50%), 1/18/27 | | | EUR | | | | 4,300 | | | | 3,952,011 | |
| | | |
Term Loan, 8.173%, (USD LIBOR + 3.50%), 1/18/27(8) | | | | | | | 3,469 | | | | 3,399,034 | |
| | | |
Dynasty Acquisition Co., Inc.: | | | | | | | | | | | | |
| | | |
Term Loan, 7.254%, (1 mo. USD LIBOR + 3.50%), 4/6/26 | | | | | | | 37,583 | | | | 35,402,728 | |
| | | |
Term Loan, 7.254%, (1 mo. USD LIBOR + 3.50%), 4/6/26 | | | | | | | 20,209 | | | | 19,036,895 | |
| | | |
IAP Worldwide Services, Inc., Term Loan - Second Lien, 10.174%, (3 mo. USD LIBOR + 6.50%), 7/18/23(4) | | | | | | | 1,195 | | | | 927,699 | |
| | | |
Spirit Aerosystems, Inc., Term Loan, 7.504%, (1 mo. USD LIBOR + 3.75%), 1/15/25 | | | | | | | 8,263 | | | | 8,204,345 | |
| | | |
TransDigm, Inc.: | | | | | | | | | | | | |
| | | |
Term Loan, 5.924%, (3 mo. USD LIBOR + 2.25%), 8/22/24 | | | | | | | 29,668 | | | | 29,231,417 | |
| | | |
Term Loan, 5.924%, (3 mo. USD LIBOR + 2.25%), 12/9/25 | | | | | | | 46,661 | | | | 45,629,966 | |
| | | | |
| | 28 | | See Notes to Financial Statements. |
Senior Debt Portfolio
October 31, 2022
Portfolio of Investments — continued
| | | | | | | | | | | | |
| | | | | | Principal | | | | |
| | | | | | Amount* | | | | |
| Borrower/Description | | | | | (000’s omitted) | | | Value | |
|
| Aerospace and Defense (continued) | |
| | | |
WP CPP Holdings, LLC, Term Loan, 8.168%, (USD LIBOR + 3.75%), 4/30/25(8) | | | | | | | 35,566 | | | $ | 30,586,375 | |
| | | |
| | | | | | | | | | | $ | 180,810,797 | |
|
| Airlines — 1.7% | |
| | | |
American Airlines, Inc.: | | | | | | | | | | | | |
| | | |
Term Loan, 5.346%, (1 mo. USD LIBOR + 1.75%), 6/27/25 | | | | | | | 8,335 | | | $ | 7,898,037 | |
| | | |
Term Loan, 8.993%, (3 mo. USD LIBOR + 4.75%), 4/20/28 | | | | | | | 36,000 | | | | 35,691,444 | |
| | | |
Mileage Plus Holdings, LLC, Term Loan, 8.777%, (3 mo. USD LIBOR + 5.25%), 6/21/27 | | | | | | | 22,586 | | | | 23,108,557 | |
| | | |
SkyMiles IP, Ltd., Term Loan, 7.993%, (3 mo. USD LIBOR + 3.75%), 10/20/27 | | | | | | | 37,975 | | | | 38,365,307 | |
| | | |
United Airlines, Inc., Term Loan, 8.108%, (3 mo. USD LIBOR + 3.75%), 4/21/28 | | | | | | | 24,145 | | | | 23,633,342 | |
| | | |
| | | | | | | | | | | $ | 128,696,687 | |
|
| Apparel & Luxury Goods — 0.1% | |
| | | |
Samsonite International S.A., Term Loan, 5.504%, (1 mo. USD LIBOR + 1.75%), 4/25/25 | | | | | | | 4,469 | | | $ | 4,278,993 | |
| | | |
| | | | | | | | | | | $ | 4,278,993 | |
|
| Auto Components — 2.8% | |
| | | |
Adient US, LLC, Term Loan, 7.004%, (1 mo. USD LIBOR + 3.25%), 4/10/28 | | | | | | | 14,918 | | | $ | 14,452,231 | |
| | | |
American Axle and Manufacturing, Inc., Term Loan, 5.84%, (1 mo. USD LIBOR + 2.25%), 4/6/24 | | | | | | | 14,328 | | | | 14,170,545 | |
| | | |
Chassix, Inc., Term Loan, 8.272%, (USD LIBOR + 5.50%), 11/15/23(8) | | | | | | | 10,132 | | | | 9,292,298 | |
| | | |
Clarios Global, L.P.: | | | | | | | | | | | | |
| | | |
Term Loan, 4.383%, (1 mo. EURIBOR + 3.25%), 4/30/26 | | | EUR | | | | 31,981 | | | | 29,511,095 | |
| | | |
Term Loan, 7.004%, (1 mo. USD LIBOR + 3.25%), 4/30/26 | | | | | | | 19,784 | | | | 19,295,909 | |
| | | |
DexKo Global, Inc.: | | | | | | | | | | | | |
| | | |
Term Loan, 5.133%, (1 mo. EURIBOR + 4.00%), 10/4/28 | | | EUR | | | | 1,115 | | | | 972,576 | |
| | | |
Term Loan, 5.218%, (EURIBOR + 4.00%), 10/4/28(8) | | | EUR | | | | 6,931 | | | | 6,044,458 | |
| | | |
Term Loan, 5.578%, (3 mo. EURIBOR + 4.00%), 10/4/28 | | | EUR | | | | 3,604 | | | | 3,143,284 | |
| | | |
Term Loan, 7.476%, (USD LIBOR + 3.75%), 10/4/28(8) | | | | | | | 14,403 | | | | 13,083,892 | |
| | | |
Garrett LX I S.a.r.l.: | | | | | | | | | | | | |
| | | |
Term Loan, 5.105%, (3 mo. EURIBOR + 3.50%), 4/30/28 | | | EUR | | | | 17,397 | | | | 16,117,868 | |
| | | |
Term Loan, 7.67%, (3 mo. USD LIBOR + 3.25%), 4/30/28 | | | | | | | 6,336 | | | | 6,177,600 | |
| | | | | | | | | | | | |
| | | | | | Principal | | | | |
| | | | | | Amount* | | | | |
| Borrower/Description | | | | | (000’s omitted) | | | Value | |
|
| Auto Components (continued) | |
| | | |
LTI Holdings, Inc.: | | | | | | | | | | | | |
| | | |
Term Loan, 7.004%, (1 mo. USD LIBOR + 3.25%), 9/6/25 | | | | | | | 8,157 | | | $ | 7,631,332 | |
| | | |
Term Loan, 8.254%, (1 mo. USD LIBOR + 4.50%), 7/24/26 | | | | | | | 8,051 | | | | 7,568,028 | |
| | | |
Tenneco, Inc., Term Loan, 6.206%, (1 mo. USD LIBOR + 3.00%), 10/1/25 | | | | | | | 35,937 | | | | 35,829,168 | |
| | | |
TI Group Automotive Systems, LLC, Term Loan, 4.443%, (1 mo. EURIBOR + 3.25%), 12/16/26 | | | EUR | | | | 10,439 | | | | 9,568,615 | |
| | | |
Truck Hero, Inc., Term Loan, 7.254%, (1 mo. USD LIBOR + 3.50%), 1/31/28 | | | | | | | 16,572 | | | | 14,309,005 | |
| | | |
Wheel Pros, LLC, Term Loan, 8.825%, (3 mo. USD LIBOR + 4.50%), 5/11/28 | | | | | | | 2,029 | | | | 1,484,186 | |
| | | |
| | | | | | | | | | | $ | 208,652,090 | |
|
| Automobiles — 0.7% | |
| | | |
Bombardier Recreational Products, Inc., Term Loan, 5.754%, (1 mo. USD LIBOR + 2.00%), 5/24/27 | | | | | | | 35,551 | | | $ | 34,239,658 | |
| | | |
MajorDrive Holdings IV, LLC, Term Loan, 7.125%, (3 mo. USD LIBOR + 4.00%), 6/1/28 | | | | | | | 16,046 | | | | 14,822,155 | |
| | | |
| | | | | | | | | | | $ | 49,061,813 | |
|
| Beverages — 0.3% | |
| | | |
Arterra Wines Canada, Inc., Term Loan, 7.142%, (3 mo. USD LIBOR + 3.50%), 11/24/27 | | | | | | | 3,520 | | | $ | 3,223,441 | |
| | | |
City Brewing Company, LLC, Term Loan, 6.814%, (1 mo. USD LIBOR + 3.50%), 4/5/28 | | | | | | | 6,428 | | | | 4,443,637 | |
| | | |
Triton Water Holdings, Inc., Term Loan, 7.174%, (3 mo. USD LIBOR + 3.50%), 3/31/28 | | | | | | | 12,361 | | | | 11,067,278 | |
| | | |
| | | | | | | | | | | $ | 18,734,356 | |
|
| Biotechnology — 0.5% | |
| | | |
Alkermes, Inc., Term Loan, 5.98%, (1 mo. USD LIBOR + 2.50%), 3/12/26 | | | | | | | 12,832 | | | $ | 12,351,258 | |
| | | |
Alltech, Inc., Term Loan, 7.754%, (1 mo. USD LIBOR + 4.00%), 10/13/28 | | | | | | | 8,014 | | | | 7,703,878 | |
| | | |
Grifols Worldwide Operations USA, Inc., Term Loan, 5.754%, (1 mo. USD LIBOR + 2.00%), 11/15/27 | | | | | | | 17,268 | | | | 16,605,844 | |
| | | |
| | | | | | | | | | | $ | 36,660,980 | |
|
| Building Products — 1.2% | |
| | | |
ACProducts, Inc., Term Loan, 7.325%, (USD LIBOR + 4.25%), 5/17/28(8) | | | | | | | 20,585 | | | $ | 14,432,956 | |
| | | |
Cornerstone Building Brands, Inc., Term Loan, 6.589%, (1 mo. USD LIBOR + 3.25%), 4/12/28 | | | | | | | 24,655 | | | | 20,794,600 | |
| | | |
CPG International, Inc., Term Loan, 6.269%, (SOFR + 2.50%), 4/28/29 | | | | | | | 14,950 | | | | 14,499,168 | |
| | | | |
| | 29 | | See Notes to Financial Statements. |
Senior Debt Portfolio
October 31, 2022
Portfolio of Investments — continued
| | | | | | | | | | | | |
| | | | | | Principal | | | | |
| | | | | | Amount* | | | | |
| Borrower/Description | | | | | (000’s omitted) | | | Value | |
|
| Building Products (continued) | |
| | | |
LHS Borrower, LLC, Term Loan, 8.579%, (SOFR + 4.75%), 2/16/29 | | | | | | | 16,214 | | | $ | 12,876,554 | |
| | | |
MI Windows and Doors, LLC, Term Loan, 7.329%, (SOFR + 3.50%), 12/18/27 | | | | | | | 6,415 | | | | 6,258,774 | |
| | | |
Standard Industries, Inc., Term Loan, 6.675%, (6 mo. USD LIBOR + 2.50%), 9/22/28 | | | | | | | 16,752 | | | | 16,440,954 | |
| | | |
| | | | | | | | | | | $ | 85,303,006 | |
|
| Capital Markets — 4.7% | |
| | | |
Advisor Group, Inc., Term Loan, 8.254%, (1 mo. USD LIBOR + 4.50%), 7/31/26 | | | | | | | 38,748 | | | $ | 37,319,242 | |
| | | |
AllSpring Buyer, LLC, Term Loan, 6.688%, (3 mo. USD LIBOR + 3.00%), 11/1/28 | | | | | | | 8,313 | | | | 8,219,543 | |
| | | |
Andromeda Investissements, Term Loan, 4.00%, (3 mo. EURIBOR + 3.00%), 6/12/26 | | | EUR | | | | 5,250 | | | | 4,967,808 | |
| | | |
Aretec Group, Inc., Term Loan, 8.079%, (SOFR + 4.25%), 10/1/25 | | | | | | | 25,783 | | | | 25,090,241 | |
| | | |
Axalta Coating Systems US Holdings, Inc., Term Loan, 5.424%, (3 mo. USD LIBOR + 1.75%), 6/1/24 | | | | | | | 13,906 | | | | 13,772,666 | |
| | | |
Brookfield Property REIT, Inc., Term Loan, 6.289%, (SOFR + 2.50%), 8/27/25 | | | | | | | 5,701 | | | | 5,580,425 | |
| | | |
CeramTec AcquiCo GmbH, Term Loan, 4.332%, (3 mo. EURIBOR + 3.75%), 3/16/29 | | | EUR | | | | 14,461 | | | | 13,249,425 | |
| | | |
Citadel Securities L.P., Term Loan, 6.843%, (SOFR + 3.00%), 2/2/28 | | | | | | | 2,500 | | | | 2,487,500 | |
| | | |
Clipper Acquisitions Corp., Term Loan, 4.924%, (1 mo. USD LIBOR + 1.75%), 3/3/28 | | | | | | | 7,875 | | | | 7,727,603 | |
| | | |
Edelman Financial Center, LLC, Term Loan, 7.254%, (1 mo. USD LIBOR + 3.50%), 4/7/28 | | | | | | | 30,510 | | | | 28,512,997 | |
| | | |
EIG Management Company, LLC, Term Loan, 7.504%, (1 mo. USD LIBOR + 3.75%), 2/22/25 | | | | | | | 2,698 | | | | 2,623,683 | |
| | | |
FinCo I, LLC, Term Loan, 6.254%, (1 mo. USD LIBOR + 2.50%), 6/27/25 | | | | | | | 19,622 | | | | 19,582,460 | |
| | | |
Focus Financial Partners, LLC: | | | | | | | | | | | | |
| | | |
Term Loan, 5.754%, (1 mo. USD LIBOR + 2.00%), 7/3/24 | | | | | | | 22,480 | | | | 22,197,125 | |
| | | |
Term Loan, 6.254%, (1 mo. USD LIBOR + 2.50%), 6/30/28 | | | | | | | 10,942 | | | | 10,719,454 | |
| | | |
Franklin Square Holdings, L.P., Term Loan, 6.063%, (1 mo. USD LIBOR + 2.25%), 8/1/25 | | | | | | | 6,552 | | | | 6,453,692 | |
| | | |
Greenhill & Co., Inc., Term Loan, 6.32%, (1 mo. USD LIBOR + 3.25%), 4/12/24 | | | | | | | 5,525 | | | | 5,414,114 | |
| | | |
Guggenheim Partners, LLC, Term Loan, 6.504%, (1 mo. USD LIBOR + 2.75%), 7/21/23 | | | | | | | 32,597 | | | | 32,434,487 | |
| | | |
HighTower Holdings, LLC, Term Loan, 8.278%, (3 mo. USD LIBOR + 4.00%), 4/21/28 | | | | | | | 12,177 | | | | 11,355,287 | |
| | | |
Hudson River Trading, LLC, Term Loan, 6.164%, (SOFR + 3.00%), 3/20/28 | | | | | | | 30,042 | | | | 27,680,923 | |
| | | | | | | | | | | | |
| | | | | | Principal | | | | |
| | | | | | Amount* | | | | |
| Borrower/Description | | | | | (000’s omitted) | | | Value | |
|
| Capital Markets (continued) | |
| | | |
LPL Holdings, Inc., Term Loan, 4.878%, (1 mo. USD LIBOR + 1.75%), 11/12/26 | | | | | | | 19,353 | | | $ | 19,135,027 | |
| | | |
Mariner Wealth Advisors, LLC, Term Loan, 7.065%, (SOFR + 3.25%), 8/18/28 | | | | | | | 15,222 | | | | 14,670,512 | |
| | | |
Victory Capital Holdings, Inc.: | | | | | | | | | | | | |
| | | |
Term Loan, 5.962%, (SOFR + 2.25%), 7/1/26 | | | | | | | 18,855 | | | | 18,495,568 | |
| | | |
Term Loan, 5.962%, (SOFR + 2.25%), 12/29/28 | | | | | | | 8,636 | | | | 8,455,472 | |
| | | |
| | | | | | | | | | | $ | 346,145,254 | |
|
| Chemicals — 4.5% | |
| | | |
Aruba Investments, Inc.: | | | | | | | | | | | | |
| | | |
Term Loan, 4.979%, (1 mo. EURIBOR + 4.00%), 11/24/27 | | | EUR | | | | 4,211 | | | $ | 3,828,484 | |
| | | |
Term Loan, 7.576%, (1 mo. USD LIBOR + 4.00%), 11/24/27 | | | | | | | 6,206 | | | | 5,848,981 | |
| | | |
Caldic B.V., Term Loan, 5.105%, (3 mo. EURIBOR + 3.50%), 2/3/29 | | | EUR | | | | 6,000 | | | | 5,418,079 | |
| | | |
Chemours Company (The), Term Loan, 3.20%, (3 mo. EURIBOR + 2.00%), 4/3/25 | | | EUR | | | | 5,595 | | | | 5,253,031 | |
| | | |
Colouroz Investment 1 GmbH: | | | | | | | | | | | | |
| | | |
Term Loan, 5.752%, (EURIBOR + 4.25%), 9/21/23(8) | | | EUR | | | | 1,165 | | | | 886,729 | |
| | | |
Term Loan, 5.751%, (EURIBOR + 4.25%), 9/21/23(8) | | | EUR | | | | 27 | | | | 20,701 | |
| | | |
CPC Acquisition Corp., Term Loan, 7.424%, (3 mo. USD LIBOR + 3.75%), 12/29/27 | | | | | | | 19,799 | | | | 15,838,800 | |
| | | |
Flint Group GmbH: | | | | | | | | | | | | |
| | | |
Term Loan, 5.751%, (3 mo. EURIBOR + 4.25%), 9/21/23 | | | EUR | | | | 32 | | | | 24,257 | |
| | | |
Term Loan, 5.751%, (3 mo. EURIBOR + 4.25%), 9/21/23 | | | EUR | | | | 73 | | | | 55,234 | |
| | | |
Term Loan, 5.751%, (3 mo. EURIBOR + 4.25%), 9/21/23 | | | EUR | | | | 144 | | | | 109,443 | |
| | | |
Term Loan, 6.50%, (EURIBOR + 5.00%), 5.75% cash, 0.75% PIK, 9/21/23(8) | | | EUR | | | | 1,103 | | | | 839,418 | |
| | | |
Term Loan, 9.32%, (3 mo. USD LIBOR + 5.00%), 8.57% cash, 0.75% PIK, 9/21/23 | | | | | | | 1,324 | | | | 1,001,467 | |
| | | |
Flint Group US, LLC: | | | | | | | | | | | | |
| | | |
Term Loan, 9.32%, (3 mo. USD LIBOR + 5.00%), 8.57% cash, 0.75% PIK, 9/21/23 | | | | | | | 8,005 | | | | 6,054,138 | |
| | | |
Term Loan, 9.32%, (3 mo. USD LIBOR + 5.00%), 8.57% cash, 0.75% PIK, 9/21/23 | | | | | | | 1,990 | | | | 1,477,826 | |
| | | |
Gemini HDPE, LLC, Term Loan, 7.358%, (3 mo. USD LIBOR + 3.00%), 12/31/27 | | | | | | | 5,952 | | | | 5,738,619 | |
| | | |
GEON Performance Solutions, LLC, Term Loan, 8.174%, (1 mo. USD LIBOR + 4.50%), 8/18/28 | | | | | | | 7,698 | | | | 7,479,872 | |
| | | |
Groupe Solmax, Inc., Term Loan, 8.392%, (3 mo. USD LIBOR + 4.75%), 5/29/28 | | | | | | | 22,082 | | | | 19,321,774 | |
| | | | |
| | 30 | | See Notes to Financial Statements. |
Senior Debt Portfolio
October 31, 2022
Portfolio of Investments — continued
| | | | | | | | | | |
| | | | | Principal | | | | |
| | | | | Amount* | | | | |
| Borrower/Description | | | | (000’s omitted) | | | Value | |
|
| Chemicals (continued) | |
| | | |
INEOS Enterprises Holdings II Limited, Term Loan, 3.25%, (3 mo. EURIBOR + 3.25%), 8/31/26 | | EUR | | | 2,325 | | | $ | 2,106,208 | |
| | | |
INEOS Enterprises Holdings US Finco, LLC, Term Loan, 6.57%, (3 mo. USD LIBOR + 3.50%), 8/28/26 | | | | | 2,471 | | | | 2,248,844 | |
| | | |
INEOS Finance PLC: | | | | | | | | | | |
| | | |
Term Loan, 3.133%, (1 mo. EURIBOR + 2.00%), 4/1/24 | | EUR | | | 7,878 | | | | 7,654,203 | |
| | | |
Term Loan, 3.883%, (1 mo. EURIBOR + 2.75%), 11/8/28 | | EUR | | | 9,675 | | | | 8,676,894 | |
| | | |
INEOS Quattro Holdings UK Ltd., Term Loan, 3.883%, (1 mo. EURIBOR + 2.75%), 1/29/26 | | EUR | | | 30,000 | | | | 26,806,283 | |
| | | |
INEOS Styrolution US Holding, LLC, Term Loan, 6.504%, (1 mo. USD LIBOR + 2.75%), 1/29/26 | | | | | 15,207 | | | | 14,354,866 | |
| | | |
INEOS US Finance, LLC: | | | | | | | | | | |
| | | |
Term Loan, 5.754%, (1 mo. USD LIBOR + 2.00%), 4/1/24 | | | | | 790 | | | | 777,025 | |
| | | |
Term Loan, 6.254%, (1 mo. USD LIBOR + 2.50%), 11/8/28 | | | | | 6,836 | | | | 6,380,508 | |
| | | |
Kraton Corporation, Term Loan, 6.718%, (SOFR + 3.25%), 3/15/29 | | | | | 6,194 | | | | 6,000,316 | |
| | | |
Kraton Polymers Holdings B.V., Term Loan, 4.25%, (3 mo. EURIBOR + 3.25%), 3/15/29 | | EUR | | | 4,650 | | | | 4,239,221 | |
| | | |
Lonza Group AG: | | | | | | | | | | |
| | | |
Term Loan, 5.193%, (3 mo. EURIBOR + 4.00%), 7/3/28 | | EUR | | | 7,875 | | | | 7,009,084 | |
| | | |
Term Loan, 5.193%, (3 mo. EURIBOR + 4.00%), 7/3/28 | | EUR | | | 9,025 | | | | 8,032,633 | |
| | | |
Term Loan, 7.674%, (3 mo. USD LIBOR + 4.00%), 7/3/28 | | | | | 24,160 | | | | 21,357,328 | |
| | | |
LSF11 Skyscraper Holdco S.a.r.l.: | | | | | | | | | | |
| | | |
Term Loan, 4.693%, (3 mo. EURIBOR + 3.50%), 9/29/27 | | EUR | | | 13,775 | | | | 13,037,985 | |
| | | |
Term Loan, 7.174%, (3 mo. USD LIBOR + 3.50%), 9/29/27 | | | | | 5,590 | | | | 5,394,741 | |
| | | |
Messer Industries GmbH: | | | | | | | | | | |
| | | |
Term Loan, 3.693%, (2 mo. EURIBOR + 2.50%), 3/2/26 | | EUR | | | 2,152 | | | | 2,033,311 | |
| | | |
Term Loan, 6.174%, (3 mo. USD LIBOR + 2.50%), 3/2/26 | | | | | 5,010 | | | | 4,931,885 | |
| | | |
Momentive Performance Materials, Inc., Term Loan, 7.01%, (1 mo. USD LIBOR + 3.25%), 5/15/24 | | | | | 1,114 | | | | 1,102,987 | |
| | | |
Olympus Water US Holding Corporation: | | | | | | | | | | |
| | | |
Term Loan, 7.438%, (3 mo. USD LIBOR + 3.75%), 11/9/28 | | | | | 5,484 | | | | 5,007,666 | |
| | | |
Term Loan, 8.153%, (SOFR + 4.50%), 11/9/28 | | | | | 5,920 | | | | 5,449,590 | |
| | | |
Orion Engineered Carbons GmbH: | | | | | | | | | | |
| | | |
Term Loan, 3.693%, (3 mo. EURIBOR + 2.50%), 9/24/28 | | EUR | | | 1,250 | | | | 1,187,444 | |
| | | |
Term Loan, 5.924%, (3 mo. USD LIBOR + 2.25%), 9/24/28 | | | | | 4,901 | | | | 4,752,466 | |
| | | | | | | | | | | | |
| | | | | | Principal | | | | |
| | | | | | Amount* | | | | |
| Borrower/Description | | | | | (000’s omitted) | | | Value | |
|
| Chemicals (continued) | |
| | | |
PQ Corporation, Term Loan, 6.915%, (3 mo. USD LIBOR + 2.50%), 6/9/28 | | | | | | | 25,462 | | | $ | 24,634,727 | |
| | | |
Rohm Holding GmbH: | | | | | | | | | | | | |
| | | |
Term Loan, 4.881%, (6 mo. EURIBOR + 4.25%), 7/31/26 | | | EUR | | | | 2,350 | | | | 1,842,426 | |
| | | |
Term Loan, 8.121%, (3 mo. USD LIBOR + 4.75%), 7/31/26 | | | | | | | 19,534 | | | | 14,894,741 | |
| | | |
Spectrum Holdings III Corp., Term Loan, 7.004%, (1 mo. USD LIBOR + 3.25%), 1/31/25 | | | | | | | 5,530 | | | | 5,070,731 | |
| | | |
Starfruit Finco B.V., Term Loan, 7.165%, (3 mo. USD LIBOR + 2.75%), 10/1/25 | | | | | | | 8,204 | | | | 7,765,127 | |
| | | |
Trinseo Materials Operating S.C.A., Term Loan, 6.254%, (1 mo. USD LIBOR + 2.50%), 5/3/28 | | | | | | | 7,668 | | | | 6,679,645 | |
| | | |
Tronox Finance, LLC: | | | | | | | | | | | | |
| | | |
Term Loan, 5.938%, (USD LIBOR + 2.25%), 3/10/28(8) | | | | | | | 12,836 | | | | 12,138,188 | |
| | | |
Term Loan, 6.803%, (SOFR + 3.25%), 4/4/29 | | | | | | | 3,955 | | | | 3,796,920 | |
| | | |
W.R. Grace & Co.-Conn., Term Loan, 7.438%, (3 mo. USD LIBOR + 3.75%), 9/22/28 | | | | | | | 17,071 | | | | 16,453,696 | |
| | | |
| | | | | | | | | | | $ | 331,014,542 | |
|
| Commercial Services & Supplies — 2.2% | |
| | | |
Allied Universal Holdco, LLC, Term Loan, 4.883%, (1 mo. EURIBOR + 3.75%), 5/12/28 | | | EUR | | | | 9,503 | | | $ | 8,270,536 | |
| | | |
Asplundh Tree Expert, LLC, Term Loan, 5.504%, (1 mo. USD LIBOR + 1.75%), 9/7/27 | | | | | | | 10,241 | | | | 10,094,584 | |
| | | |
Belfor Holdings, Inc., Term Loan, 7.754%, (1 mo. USD LIBOR + 4.00%), 4/6/26 | | | | | | | 6,882 | | | | 6,818,795 | |
| | | |
Clean Harbors, Inc., Term Loan, 5.754%, (1 mo. USD LIBOR + 2.00%), 10/8/28 | | | | | | | 4,722 | | | | 4,705,291 | |
| | | |
Covanta Holding Corporation: | | | | | | | | | | | | |
| | | |
Term Loan, 6.229%, (1 mo. USD LIBOR + 2.50%), 11/30/28 | | | | | | | 2,245 | | | | 2,219,477 | |
| | | |
Term Loan, 6.229%, (1 mo. USD LIBOR + 2.50%), 11/30/28 | | | | | | | 169 | | | | 167,088 | |
| | | |
EnergySolutions, LLC, Term Loan, 7.424%, (3 mo. USD LIBOR + 3.75%), 5/9/25 | | | | | | | 18,180 | | | | 16,907,534 | |
| | | |
Garda World Security Corporation, Term Loan, 7.24%, (3 mo. USD LIBOR + 4.25%), 10/30/26 | | | | | | | 13,008 | | | | 12,433,839 | |
| | | |
GFL Environmental, Inc., Term Loan, 7.415%, (3 mo. USD LIBOR + 3.00%), 5/30/25 | | | | | | | 7,648 | | | | 7,620,584 | |
| | | |
Harsco Corporation, Term Loan, 6.063%, (1 mo. USD LIBOR + 2.25%), 3/10/28 | | | | | | | 3,827 | | | | 3,358,765 | |
| | | |
LABL, Inc., Term Loan, 8.754%, (1 mo. USD LIBOR + 5.00%), 10/29/28 | | | | | | | 9,454 | | | | 8,751,636 | |
| | | | |
| | 31 | | See Notes to Financial Statements. |
Senior Debt Portfolio
October 31, 2022
Portfolio of Investments — continued
| | | | | | | | | | | | |
| | | | | | Principal | | | | |
| | | | | | Amount* | | | | |
| Borrower/Description | | | | | (000’s omitted) | | | Value | |
|
| Commercial Services & Supplies (continued) | |
| | | |
Monitronics International, Inc., Term Loan, 11.915%, (3 mo. USD LIBOR + 6.50%), 3/29/24 | | | | | | | 15,011 | | | $ | 9,932,406 | |
| | | |
PECF USS Intermediate Holding III Corporation, Term Loan, 8.004%, (1 mo. USD LIBOR + 4.25%), 12/15/28 | | | | | | | 8,122 | | | | 6,314,390 | |
| | | |
Phoenix Services International, LLC: | | | | | | | | | | | | |
| | | |
DIP Loan, 5.559%, (SOFR + 2.00%), 3/28/23 | | | | | | | 1,468 | | | | 1,468,372 | |
| | | |
Term Loan, 0.00%, 3/1/25(11) | | | | | | | 14,735 | | | | 3,296,942 | |
| | | |
Prime Security Services Borrower, LLC, Term Loan, 6.505%, (3 mo. USD LIBOR + 2.75%), 9/23/26 | | | | | | | 17,895 | | | | 17,658,683 | |
| | | |
SITEL Group, Term Loan, 4.883%, (1 mo. EURIBOR + 3.75%), 8/28/28 | | | EUR | | | | 7,075 | | | | 6,716,562 | |
| | | |
SITEL Worldwide Corporation, Term Loan, 7.51%, (1 mo. USD LIBOR + 3.75%), 8/28/28 | | | | | | | 13,546 | | | | 13,359,596 | |
| | | |
Tempo Acquisition, LLC, Term Loan, 6.729%, (SOFR + 3.00%), 8/31/28 | | | | | | | 4,242 | | | | 4,195,129 | |
| | | |
TruGreen Limited Partnership, Term Loan, 7.754%, (1 mo. USD LIBOR + 4.00%), 11/2/27 | | | | | | | 4,986 | | | | 4,630,922 | |
| | | |
Werner FinCo, L.P., Term Loan, 7.674%, (3 mo. USD LIBOR + 4.00%), 7/24/24 | | | | | | | 11,528 | | | | 10,490,453 | |
| | | |
| | | | | | | | | | | $ | 159,411,584 | |
|
| Communications Equipment — 0.4% | |
| | | |
CommScope, Inc., Term Loan, 7.004%, (1 mo. USD LIBOR + 3.25%), 4/6/26 | | | | | | | 19,305 | | | $ | 18,484,409 | |
| | | |
Digi International, Inc., Term Loan, 8.754%, (1 mo. USD LIBOR + 5.00%), 11/1/28 | | | | | | | 5,321 | | | | 5,234,956 | |
| | | |
Tiger Acquisition, LLC, Term Loan, 7.004%, (1 mo. USD LIBOR + 3.25%), 6/1/28 | | | | | | | 3,369 | | | | 3,154,966 | |
| | | |
| | | | | | | | | | | $ | 26,874,331 | |
|
| Construction Materials — 0.4% | |
| | | |
Oscar AcquisitionCo, LLC, Term Loan, 8.153%, (SOFR + 4.50%), 4/29/29 | | | | | | | 14,400 | | | $ | 13,082,400 | |
| | | |
Quikrete Holdings, Inc.: | | | | | | | | | | | | |
| | | |
Term Loan, 6.379%, (1 mo. USD LIBOR + 2.63%), 2/1/27 | | | | | | | 4,791 | | | | 4,667,728 | |
| | | |
Term Loan, 6.754%, (1 mo. USD LIBOR + 3.00%), 6/11/28 | | | | | | | 11,418 | | | | 11,152,300 | |
| | | |
| | | | | | | | | | | $ | 28,902,428 | |
|
| Containers & Packaging — 1.7% | |
| | | |
Berlin Packaging, LLC, Term Loan, 6.911%, (USD LIBOR + 3.75%), 3/11/28(8) | | | | | | | 12,280 | | | $ | 11,780,748 | |
| | | |
BWAY Holding Company, Term Loan, 6.378%, (1 mo. USD LIBOR + 3.25%), 4/3/24 | | | | | | | 10,928 | | | | 10,397,500 | |
| | | | | | | | | | | | |
| | | | | | Principal | | | | |
| | | | | | Amount* | | | | |
| Borrower/Description | | | | | (000’s omitted) | | | Value | |
|
| Containers & Packaging (continued) | |
| | | |
Clydesdale Acquisition Holdings, Inc., Term Loan, 8.004%, (SOFR + 4.18%), 4/13/29 | | | | | | | 11,820 | | | $ | 11,404,688 | |
| | | |
Kouti B.V., Term Loan, 3.757%, (3 mo. EURIBOR + 3.18%), 8/31/28 | | | EUR | | | | 32,750 | | | | 28,912,882 | |
| | | |
Pregis TopCo Corporation: | | | | | | | | | | | | |
| | | |
Term Loan, 7.754%, (1 mo. USD LIBOR + 4.00%), 7/31/26 | | | | | | | 1,634 | | | | 1,561,353 | |
| | | |
Term Loan, 7.843%, (1 mo. USD LIBOR + 4.00%), 7/31/26 | | | | | | | 2,358 | | | | 2,254,903 | |
| | | |
Pretium PKG Holdings, Inc.: | | | | | | | | | | | | |
| | | |
Term Loan, 7.60%, (3 mo. USD LIBOR + 4.00%), 10/2/28 | | | | | | | 7,816 | | | | 6,871,514 | |
| | | |
Term Loan - Second Lien, 10.205%, (3 mo. USD LIBOR + 6.75%), 10/1/29 | | | | | | | 7,100 | | | | 5,999,500 | |
| | | |
Pro Mach Group, Inc., Term Loan, 7.754%, (1 mo. USD LIBOR + 4.00%), 8/31/28 | | | | | | | 4,822 | | | | 4,708,899 | |
| | | |
Proampac PG Borrower, LLC, Term Loan, 7.842%, (USD LIBOR + 3.75%), 11/3/25(8) | | | | | | | 26,020 | | | | 24,841,185 | |
| | | |
Trident TPI Holdings, Inc.: | | | | | | | | | | | | |
| | | |
Term Loan, 6.30%, (3 mo. USD LIBOR + 4.00%), 9/15/28(9) | | | | | | | 818 | | | | 778,128 | |
| | | |
Term Loan, 6.924%, (3 mo. USD LIBOR + 3.25%), 10/17/24 | | | | | | | 12,388 | | | | 12,217,903 | |
| | | |
Term Loan, 7.674%, (3 mo. USD LIBOR + 4.00%), 9/15/28 | | | | | | | 5,743 | | | | 5,462,066 | |
| | | |
| | | | | | | | | | | $ | 127,191,269 | |
|
| Distributors — 0.6% | |
| | | |
Autokiniton US Holdings, Inc., Term Loan, 7.80%, (1 mo. USD LIBOR + 4.50%), 4/6/28 | | | | | | | 22,517 | | | $ | 21,114,953 | |
| | | |
Phillips Feed Service, Inc., Term Loan, 10.48%, (1 mo. USD LIBOR + 7.00%), 11/13/24(4) | | | | | | | 543 | | | | 434,800 | |
| | | |
White Cap Buyer, LLC, Term Loan, 7.479%, (SOFR + 3.75%), 10/19/27 | | | | | | | 23,406 | | | | 22,223,971 | |
| | | |
| | | | | | | | | | | $ | 43,773,724 | |
|
| Diversified Consumer Services — 0.9% | |
| | | |
Ascend Learning, LLC: | | | | | | | | | | | | |
| | | |
Term Loan, 7.132%, (1 mo. USD LIBOR + 3.50%), 12/11/28 | | | | | | | 15,095 | | | $ | 13,899,933 | |
| | | |
Term Loan - Second Lien, 9.504%, (1 mo. USD LIBOR + 5.75%), 12/10/29 | | | | | | | 5,243 | | | | 4,469,931 | |
| | | |
Corporation Service Company, Term Loan, 8/31/29(10) | | | | | | | 5,800 | | | | 5,694,875 | |
| | | |
FrontDoor, Inc., Term Loan, 6.004%, (1 mo. USD LIBOR + 2.25%), 6/17/28 | | | | | | | 963 | | | | 933,126 | |
| | | |
KUEHG Corp.: | | | | | | | | | | | | |
| | | |
Term Loan, 7.504%, (1 mo. USD LIBOR + 3.75%), 2/21/25 | | | | | | | 35,133 | | | | 33,741,983 | |
| | | | |
| | 32 | | See Notes to Financial Statements. |
Senior Debt Portfolio
October 31, 2022
Portfolio of Investments — continued
| | | | | | | | | | | | |
| | | | | | Principal | | | | |
| | | | | | Amount* | | | | |
| Borrower/Description | | | | | (000’s omitted) | | | Value | |
|
| Diversified Consumer Services (continued) | |
| | | |
KUEHG Corp.: (continued) | | | | | | | | | | | | |
| | | |
Term Loan - Second Lien, 12.004%, (1 mo. USD LIBOR + 8.25%), 8/22/25 | | | | | | | 4,075 | | | $ | 3,969,050 | |
| | | |
Sotheby’s, Term Loan, 8.579%, (3 mo. USD LIBOR + 4.50%), 1/15/27 | | | | | | | 5,440 | | | | 5,342,705 | |
| | | |
| | | | | | | | | | | $ | 68,051,603 | |
|
| Diversified Financial Services — 0.5% | |
| | | |
Concorde Midco Ltd., Term Loan, 5.16%, (3 mo. EURIBOR + 4.00%), 3/1/28 | | | EUR | | | | 7,480 | | | $ | 6,720,660 | |
| | | |
Sandy BidCo B.V., Term Loan, 6.038%, (6 mo. EURIBOR + 4.00%), 8/17/29 | | | EUR | | | | 22,608 | | | | 21,337,307 | |
| | | |
Zephyr Bidco Limited: | | | | | | | | | | | | |
| | | |
Term Loan, 4.693%, (1 mo. EURIBOR + 3.75%), 7/23/25 | | | EUR | | | | 5,025 | | | | 4,228,511 | |
| | | |
Term Loan, 6.934%, (SONIA + 4.75%), 7/23/25 | | | GBP | | | | 8,725 | | | | 7,829,559 | |
| | | |
| | | | | | | | | | | $ | 40,116,037 | |
|
| Diversified Telecommunication Services — 4.6% | |
| | | |
Altice France S.A.: | | | | | | | | | | | | |
| | | |
Term Loan, 6.905%, (3 mo. USD LIBOR + 4.00%), 8/14/26 | | | | | | | 6,111 | | | $ | 5,617,482 | |
| | | |
Term Loan, 7.767%, (3 mo. USD LIBOR + 3.69%), 1/31/26 | | | | | | | 10,584 | | | | 9,555,216 | |
| | | |
CenturyLink, Inc., Term Loan, 6.004%, (1 mo. USD LIBOR + 2.25%), 3/15/27 | | | | | | | 50,922 | | | | 47,601,542 | |
| | | |
GEE Holdings 2, LLC: | | | | | | | | | | | | |
| | | |
Term Loan, 11.604%, (3 mo. USD LIBOR + 8.00%), 3/24/25 | | | | | | | 9,869 | | | | 9,905,850 | |
| | | |
Term Loan - Second Lien, 11.854%, (3 mo. USD LIBOR + 8.25%), 5.104% cash, 6.75% PIK, 3/23/26 | | | | | | | 7,355 | | | | 5,639,016 | |
| | | |
LCPR Loan Financing, LLC, Term Loan, 7.162%, (1 mo. USD LIBOR + 3.75%), 10/16/28 | | | | | | | 1,800 | | | | 1,758,938 | |
| | | |
Numericable Group S.A.: | | | | | | | | | | | | |
| | | |
Term Loan, 4.605%, (3 mo. EURIBOR + 3.00%), 7/31/25 | | | EUR | | | | 6,241 | | | | 5,697,445 | |
| | | |
Term Loan, 7.165%, (3 mo. USD LIBOR + 2.75%), 7/31/25 | | | | | | | 17,114 | | | | 15,592,049 | |
| | | |
Telenet Financing USD, LLC, Term Loan, 5.412%, (1 mo. USD LIBOR + 2.00%), 4/30/28 | | | | | | | 38,225 | | | | 37,105,543 | |
| | | |
Telenet International Finance S.a.r.l., Term Loan, 2.613%, (6 mo. EURIBOR + 2.25%), 4/30/29 | | | EUR | | | | 6,565 | | | | 6,111,563 | |
| | | |
UPC Broadband Holding B.V.: | | | | | | | | | | | | |
| | | |
Term Loan, 2.863%, (6 mo. EURIBOR + 2.50%), 4/30/29 | | | EUR | | | | 5,650 | | | | 5,227,656 | |
| | | |
Term Loan, 3.363%, (6 mo. EURIBOR + 3.00%), 1/31/29 | | | EUR | | | | 15,150 | | | | 14,139,167 | |
| | | |
Term Loan, 5.662%, (1 mo. USD LIBOR + 2.25%), 4/30/28 | | | | | | | 7,125 | | | | 6,961,716 | |
| | | | | | | | | | | | |
| | | | | | Principal | | | | |
| | | | | | Amount* | | | | |
| Borrower/Description | | | | | (000’s omitted) | | | Value | |
|
| Diversified Telecommunication Services (continued) | |
| | | |
UPC Financing Partnership, Term Loan, 6.337%, (1 mo. USD LIBOR + 2.93%), 1/31/29 | | | | | | | 31,475 | | | $ | 30,851,134 | |
| | | |
Virgin Media Bristol, LLC: | | | | | | | | | | | | |
| | | |
Term Loan, 5.912%, (1 mo. USD LIBOR + 2.50%), 1/31/28 | | | | | | | 44,255 | | | | 43,477,885 | |
| | | |
Term Loan, 6.662%, (1 mo. USD LIBOR + 3.25%), 1/31/29 | | | | | | | 500 | | | | 493,047 | |
| | | |
Virgin Media Ireland Limited, Term Loan, 3.863%, (6 mo. EURIBOR + 3.50%), 7/15/29 | | | EUR | | | | 12,500 | | | | 11,609,365 | |
| | | |
Virgin Media SFA Finance Limited: | | | | | | | | | | | | |
| | | |
Term Loan, 3.345%, (1 mo. EURIBOR + 2.50%), 1/31/29 | | | EUR | | | | 13,800 | | | | 12,734,339 | |
| | | |
Term Loan, 5.469%, (SONIA + 3.25%), 1/15/27 | | | GBP | | | | 11,825 | | | | 12,170,911 | |
| | | |
Zayo Group Holdings, Inc., Term Loan, 4.383%, (1 mo. EURIBOR + 3.25%), 3/9/27 | | | EUR | | | | 4,461 | | | | 3,583,876 | |
| | | |
Ziggo B.V., Term Loan, 3.764%, (6 mo. EURIBOR + 3.00%), 1/31/29 | | | EUR | | | | 26,500 | | | | 24,247,857 | |
| | | |
Ziggo Financing Partnership, Term Loan, 5.912%, (1 mo. USD LIBOR + 2.50%), 4/30/28 | | | | | | | 30,034 | | | | 29,299,337 | |
| | | |
| | | | | | | | | | | $ | 339,380,934 | |
|
| Electrical Equipment — 0.1% | |
| | | |
AZZ, Inc., Term Loan, 8.079%, (SOFR + 4.25%), 5/13/29 | | | | | | | 2,294 | | | $ | 2,276,431 | |
| | | |
GrafTech Finance, Inc., Term Loan, 6.754%, (1 mo. USD LIBOR + 3.00%), 2/12/25 | | | | | | | 4,844 | | | | 4,620,379 | |
| | | |
II-VI Incorporated, Term Loan, 5.878%, (1 mo. USD LIBOR + 2.75%), 7/2/29 | | | | | | | 1,613 | | | | 1,569,769 | |
| | | |
| | | | | | | | | | | $ | 8,466,579 | |
|
| Electronic Equipment, Instruments & Components — 1.3% | |
| | | |
Chamberlain Group, Inc., Term Loan, 7.254%, (1 mo. USD LIBOR + 3.50%), 11/3/28 | | | | | | | 20,346 | | | $ | 18,561,721 | |
| | | |
Creation Technologies, Inc., Term Loan, 9.248%, (3 mo. USD LIBOR + 5.50%), 10/5/28 | | | | | | | 12,562 | | | | 10,426,356 | |
| | | |
Ingram Micro, Inc., Term Loan, 7.174%, (3 mo. USD LIBOR + 3.50%), 6/30/28 | | | | | | | 6,062 | | | | 5,857,352 | |
| | | |
Minimax Viking GmbH, Term Loan, 3.883%, (1 mo. EURIBOR + 2.75%), 7/31/25 | | | EUR | | | | 1,904 | | | | 1,828,150 | |
| | | |
Mirion Technologies, Inc., Term Loan, 5.627%, (6 mo. USD LIBOR + 2.75%), 10/20/28 | | | | | | | 8,037 | | | | 7,850,912 | |
| | | |
Robertshaw US Holding Corp., Term Loan, 7.313%, (1 mo. USD LIBOR + 3.50%), 2/28/25 | | | | | | | 20,706 | | | | 16,927,084 | |
| | | |
Verifone Systems, Inc., Term Loan, 6.997%, (3 mo. USD LIBOR + 4.00%), 8/20/25 | | | | | | | 19,617 | | | | 17,526,406 | |
| | | |
Verisure Holding AB: | | | | | | | | | | | | |
| | | |
Term Loan, 3.473%, (6 mo. EURIBOR + 3.25%), 3/27/28 | | | EUR | | | | 11,550 | | | | 10,722,293 | |
| | | | |
| | 33 | | See Notes to Financial Statements. |
Senior Debt Portfolio
October 31, 2022
Portfolio of Investments — continued
| | | | | | | | | | | | |
| | | | | | Principal | | | | |
| | | | | | Amount* | | | | |
| Borrower/Description | | | | | (000’s omitted) | | | Value | |
|
| Electronic Equipment, Instruments & Components (continued) | |
| | | |
Verisure Holding AB: (continued) | | | | | | | | | | | | |
| | | |
Term Loan, 3.753%, (6 mo. EURIBOR + 3.25%), 7/20/26 | | | EUR | | | | 4,900 | | | $ | 4,573,669 | |
| | | |
| | | | | | | | | | | $ | 94,273,943 | |
| | | |
| Energy Equipment & Services — 0.3% | | | | | | | | | |
| | | |
Ameriforge Group, Inc.: | | | | | | | | | | | | |
| | | |
Term Loan, 15.025%, (1 mo. USD LIBOR + 13.00%), 12/29/23(9) | | | | | | | 2,149 | | | $ | 1,066,459 | |
| | | |
Term Loan, 16.67%, (3 mo. USD LIBOR + 13.00%), 11.67% cash, 5.00% PIK, 12/31/23 | | | | | | | 16,884 | | | | 8,378,748 | |
| | | |
Lealand Finance Company B.V.: | | | | | | | | | | | | |
| | | |
Letter of Credit, 4.153%, 6/28/24(9) | | | | | | | 10,000 | | | | 8,200,000 | |
| | | |
Term Loan, 7.75%, (1 mo. USD LIBOR + 4.00%), 4.75% cash, 3.00% PIK, 6/30/25 | | | | | | | 3,332 | | | | 1,777,040 | |
| | | |
| | | | | | | | | | | $ | 19,422,247 | |
| | | |
| Engineering & Construction — 1.3% | | | | | | | | | |
| | | |
Aegion Corporation, Term Loan, 8.504%, (1 mo. USD LIBOR + 4.75%), 5/17/28 | | | | | | | 17,856 | | | $ | 16,553,604 | |
| | | |
Amentum Government Services Holdings, LLC: | | | | | | | | | | | | |
| | | |
Term Loan, 7.393%, (SOFR + 4.00%), 2/15/29 | | | | | | | 8,803 | | | | 8,560,857 | |
| | | |
Term Loan, 7.798%, (3 mo. USD LIBOR + 4.00%), 1/29/27 | | | | | | | 10,511 | | | | 10,222,097 | |
| | | |
American Residential Services, LLC, Term Loan, 7.174%, (3 mo. USD LIBOR + 3.50%), 10/15/27 | | | | | | | 8,532 | | | | 8,318,938 | |
| | | |
APi Group DE, Inc.: | | | | | | | | | | | | |
| | | |
Term Loan, 6.254%, (1 mo. USD LIBOR + 2.50%), 10/1/26 | | | | | | | 13,447 | | | | 13,280,240 | |
| | | |
Term Loan, 6.504%, (1 mo. USD LIBOR + 2.75%), 1/3/29 | | | | | | | 7,510 | | | | 7,417,140 | |
| | | |
Centuri Group, Inc., Term Loan, 5.57%, (3 mo. USD LIBOR + 2.50%), 8/27/28 | | | | | | | 9,249 | | | | 9,074,142 | |
| | | |
Northstar Group Services, Inc., Term Loan, 9.254%, (1 mo. USD LIBOR + 5.50%), 11/12/26 | | | | | | | 13,315 | | | | 13,148,652 | |
| | | |
USIC Holdings, Inc., Term Loan, 7.254%, (1 mo. USD LIBOR + 3.50%), 5/12/28 | | | | | | | 7,863 | | | | 7,493,028 | |
| | | |
| | | | | | | | | | | $ | 94,068,698 | |
| | | |
| Entertainment — 2.5% | | | | | | | | | |
| | | |
Alchemy Copyrights, LLC, Term Loan, 6.128%, (1 mo. USD LIBOR + 3.00%), 3/10/28 | | | | | | | 4,337 | | | $ | 4,315,010 | |
| | | |
AMC Entertainment Holdings, Inc., Term Loan, 6.314%, (1 mo. USD LIBOR + 3.00%), 4/22/26 | | | | | | | 21,362 | | | | 15,274,076 | |
| | | |
City Football Group Limited, Term Loan, 6.484%, (3 mo. USD LIBOR + 3.50%), 7/21/28 | | | | | | | 15,632 | | | | 14,615,803 | |
| | | | | | | | | | | | |
| | | | | | Principal | | | | |
| | | | | | Amount* | | | | |
| Borrower/Description | | | | | (000’s omitted) | | | Value | |
| | | |
| Entertainment (continued) | | | | | | | | | |
| | | |
Crown Finance US, Inc.: | | | | | | | | | | | | |
| | | |
DIP Loan, 0.00%, 9/7/23(9) | | | | | | | 881 | | | $ | 884,833 | |
| | | |
DIP Loan, 13.612%, (SOFR + 10.00%), 9/7/23 | | | | | | | 10,482 | | | | 10,530,379 | |
| | | |
Delta 2 (LUX) S.a.r.l., Term Loan, 6.254%, (1 mo. USD LIBOR + 2.50%), 2/1/24 | | | | | | | 72,728 | | | | 72,743,375 | |
| | | |
Playtika Holding Corp., Term Loan, 6.504%, (1 mo. USD LIBOR + 2.75%), 3/13/28 | | | | | | | 35,881 | | | | 34,990,099 | |
| | | |
Renaissance Holding Corp.: | | | | | | | | | | | | |
| | | |
Term Loan, 7.004%, (1 mo. USD LIBOR + 3.25%), 5/30/25 | | | | | | | 6,984 | | | | 6,771,212 | |
| | | |
Term Loan, 7.608%, (SOFR + 4.50%), 3/30/29 | | | | | | | 2,793 | | | | 2,709,210 | |
| | | |
Term Loan - Second Lien, 10.754%, (1 mo. USD LIBOR + 7.00%), 5/29/26 | | | | | | | 3,175 | | | | 3,034,770 | |
| | | |
UFC Holdings, LLC, Term Loan, 7.11%, (3 mo. USD LIBOR + 2.75%), 4/29/26 | | | | | | | 18,198 | | | | 17,838,641 | |
| | | |
Vue International Bidco PLC: | | | | | | | | | | | | |
| | | |
Term Loan, 5.66%, (2 mo. EURIBOR + 4.75%), 7/3/26 | | | EUR | | | | 3,433 | | | | 2,318,151 | |
| | | |
Term Loan, 9.766%, (3 mo. EURIBOR + 8.00%), 6/30/27 | | | EUR | | | | 384 | | | | 358,432 | |
| | | |
| | | | | | | | | | | $ | 186,383,991 | |
| | |
| Equity Real Estate Investment Trusts (REITs) — 0.1% | | | | | | | |
| | | |
Iron Mountain, Inc., Term Loan, 5.504%, (1 mo. USD LIBOR + 1.75%), 1/2/26 | | | | | | | 9,049 | | | $ | 8,901,585 | |
| | | |
| | | | | | | | | | | $ | 8,901,585 | |
| | | |
| Food Products — 1.3% | | | | | | | | | |
| | | |
8th Avenue Food & Provisions, Inc., Term Loan, 8.382%, (1 mo. USD LIBOR + 4.75%), 10/1/25 | | | | | | | 7,326 | | | $ | 6,428,565 | |
| | | |
Badger Buyer Corp., Term Loan, 7.254%, (1 mo. USD LIBOR + 3.50%), 9/30/24 | | | | | | | 9,594 | | | | 8,454,399 | |
| | | |
CHG PPC Parent, LLC: | | | | | | | | | | | | |
| | | |
Term Loan, 4.633%, (1 mo. EURIBOR + 3.50%), 3/31/25 | | | EUR | | | | 2,000 | | | | 1,876,850 | |
| | | |
Term Loan, 6.632%, (1 mo. USD LIBOR + 3.00%), 12/8/28 | | | | | | | 6,293 | | | | 6,104,574 | |
| | | |
Del Monte Foods, Inc., Term Loan, 7.827%, (SOFR + 4.35%), 5/16/29 | | | | | | | 6,625 | | | | 6,446,953 | |
| | | |
Froneri International, Ltd.: | | | | | | | | | | | | |
| | | |
Term Loan, 3.006%, (6 mo. EURIBOR + 2.38%), 1/29/27 | | | EUR | | | | 1,500 | | | | 1,355,446 | |
| | | |
Term Loan, 6.004%, (1 mo. USD LIBOR + 2.25%), 1/29/27 | | | | | | | 8,796 | | | | 8,510,013 | |
| | | |
Monogram Food Solutions, LLC, Term Loan, 7.813%, (1 mo. USD LIBOR + 4.00%), 8/28/28 | | | | | | | 6,600 | | | | 6,435,122 | |
| | | |
Nomad Foods Europe Midco Limited, Term Loan, 5.155%, (3 mo. USD LIBOR + 2.25%), 5/15/24 | | | | | | | 18,546 | | | | 18,439,591 | |
| | | | |
| | 34 | | See Notes to Financial Statements. |
Senior Debt Portfolio
October 31, 2022
Portfolio of Investments — continued
| | | | | | | | | | | | |
| | | | | | Principal | | | | |
| | | | | | Amount* | | | | |
| Borrower/Description | | | | | (000’s omitted) | | | Value | |
| | | |
| Food Products (continued) | | | | | | | | | |
| | | |
Sovos Brands Intermediate, Inc., Term Loan, 7.915%, (3 mo. USD LIBOR + 3.50%), 6/8/28 | | | | | | | 9,191 | | | $ | 8,836,978 | |
| | | |
United Petfood Group B.V., Term Loan, 4.558%, (3 mo. EURIBOR + 3.00%), 4/23/28 | | | EUR | | | | 9,025 | | | | 8,138,545 | |
| | | |
Valeo F1 Company Limited (Ireland): | | | | | | | | | | | | |
| | | |
Term Loan, 5.193%, (3 mo. EURIBOR + 4.00%), 6/30/28 | | | EUR | | | | 9,450 | | | | 7,973,137 | |
| | | |
Term Loan, 7.188%, (SONIA + 5.00%), 6/28/28 | | | GBP | | | | 5,500 | | | | 5,203,603 | |
| | | |
| | | | | | | | | | | $ | 94,203,776 | |
| | | |
| Gas Utilities — 0.4% | | | | | | | | | |
| | | |
CQP Holdco, L.P., Term Loan, 7.424%, (3 mo. USD LIBOR + 3.75%), 6/5/28 | | | | | | | 30,084 | | | $ | 29,756,472 | |
| | | |
| | | | | | | | | | | $ | 29,756,472 | |
| | | |
| Health Care Equipment & Supplies — 1.2% | | | | | | | | | |
| | | |
Bayou Intermediate II, LLC, Term Loan, 7.302%, (3 mo. USD LIBOR + 4.50%), 8/2/28 | | | | | | | 10,645 | | | $ | 10,218,780 | |
| | | |
CryoLife, Inc., Term Loan, 7.174%, (3 mo. USD LIBOR + 3.50%), 6/1/27 | | | | | | | 6,575 | | | | 6,164,080 | |
| | | |
Gloves Buyer, Inc., Term Loan, 7.754%, (1 mo. USD LIBOR + 4.00%), 12/29/27 | | | | | | | 18,448 | | | | 16,787,590 | |
| | | |
ICU Medical, Inc., Term Loan, 5.961%, (SOFR + 2.25%), 1/8/29(8) | | | | | | | 8,060 | | | | 7,899,567 | |
| | | |
Journey Personal Care Corp., Term Loan, 7.924%, (3 mo. USD LIBOR + 4.25%), 3/1/28 | | | | | | | 27,725 | | | | 17,854,871 | |
| | | |
Medline Borrower, L.P.: | | | | | | | | | | | | |
| | | |
Term Loan, 4.633%, (1 mo. EURIBOR + 3.50%), 10/23/28 | | | EUR | | | | 1,000 | | | | 916,602 | |
| | | |
Term Loan, 7.004%, (1 mo. USD LIBOR + 3.25%), 10/23/28 | | | | | | | 31,940 | | | | 29,402,099 | |
| | | |
| | | | | | | | | | | $ | 89,243,589 | |
| | | |
| Health Care Providers & Services — 6.1% | | | | | | | | | |
| | | |
AEA International Holdings (Lux) S.a.r.l., Term Loan, 7.438%, (3 mo. USD LIBOR + 3.75%), 9/7/28 | | | | | | | 17,518 | | | $ | 17,254,800 | |
| | | |
Biogroup-LCD, Term Loan, 4.742%, (3 mo. EURIBOR + 2.75%), 2/9/28 | | | EUR | | | | 11,000 | | | | 9,828,971 | |
| | | |
BW NHHC Holdco, Inc., Term Loan, 7.961%, (3 mo. USD LIBOR + 5.00%), 5/15/25 | | | | | | | 14,693 | | | | 9,287,082 | |
| | | |
CAB, Term Loan, 3.527%, (3 mo. EURIBOR + 3.25%), 2/9/28 | | | EUR | | | | 7,850 | | | | 7,282,597 | |
| | | |
Cano Health, LLC, Term Loan, 7.829%, (SOFR + 4.00%), 11/23/27 | | | | | | | 7,686 | | | | 6,595,783 | |
| | | |
CCRR Parent, Inc., Term Loan, 7.51%, (1 mo. USD LIBOR + 3.75%), 3/6/28 | | | | | | | 5,289 | | | | 5,136,788 | |
| | | | | | | | | | |
| | | | | Principal | | | | |
| | | | | Amount* | | | | |
| Borrower/Description | | | | (000’s omitted) | | | Value | |
| | | |
| Health Care Providers & Services (continued) | | | | | | | | |
| | | |
Cerba Healthcare S.A.S.: | | | | | | | | | | |
| | | |
Term Loan, 4.383%, (1 mo. EURIBOR + 3.25%), 6/30/28 | | EUR | | | 20,800 | | | $ | 18,739,857 | |
| | | |
Term Loan, 5.133%, (1 mo. EURIBOR + 4.00%), 2/15/29 | | EUR | | | 8,600 | | | | 8,047,441 | |
| | | |
CHG Healthcare Services, Inc., Term Loan, 7.004%, (3 mo. USD LIBOR + 3.25%), 9/29/28 | | | | | 9,244 | | | | 8,993,974 | |
| | | |
Covis Finco S.a.r.l., Term Loan, 10.203%, (SOFR + 6.50%), 2/18/27 | | | | | 13,796 | | | | 9,312,469 | |
| | | |
Dedalus Finance GmbH, Term Loan, 5.782%, (6 mo. EURIBOR + 3.75%), 7/17/27 | | EUR | | | 20,150 | | | | 17,424,078 | |
| | | |
Electron BidCo, Inc., Term Loan, 6.754%, (1 mo. USD LIBOR + 3.00%), 11/1/28 | | | | | 8,950 | | | | 8,685,492 | |
| | | |
Elsan S.A.S., Term Loan, 4.314%, (EURIBOR + 3.35%), 6/16/28(8) | | EUR | | | 4,150 | | | | 3,841,062 | |
| | | |
Ensemble RCM, LLC, Term Loan, 7.944%, (SOFR + 3.75%), 8/3/26 | | | | | 18,703 | | | | 18,445,456 | |
| | | |
Envision Healthcare Corporation: | | | | | | | | | | |
| | | |
Term Loan, 11.603%, (SOFR + 7.88%), 3/31/27 | | | | | 6,752 | | | | 6,270,915 | |
| | | |
Term Loan - Second Lien, 6.825%, (SOFR + 4.25%), 3/31/27 | | | | | 47,476 | | | | 20,810,511 | |
| | | |
IVC Acquisition, Ltd.: | | | | | | | | | | |
| | | |
Term Loan, 4.141%, (3 mo. EURIBOR + 3.75%), 2/13/26 | | EUR | | | 9,760 | | | | 8,946,032 | |
| | | |
Term Loan, 4.391%, (3 mo. EURIBOR + 4.00%), 2/13/26 | | EUR | | | 20,825 | | | | 19,249,002 | |
| | | |
Term Loan, 6.309%, (SONIA + 4.50%), 2/13/26 | | GBP | | | 1,050 | | | | 1,088,542 | |
| | | |
MDVIP, Inc., Term Loan, 7.072%, (1 mo. USD LIBOR + 3.50%), 10/16/28 | | | | | 5,871 | | | | 5,683,378 | |
| | | |
Medical Solutions Holdings, Inc.: | | | | | | | | | | |
| | | |
Term Loan, 3.50%, 11/1/28(9) | | | | | 2,124 | | | | 2,052,492 | |
| | | |
Term Loan, 6.377%, (3 mo. USD LIBOR + 3.50%), 11/1/28 | | | | | 13,203 | | | | 12,757,434 | |
| | | |
Term Loan - Second Lien, 9.877%, (3 mo. USD LIBOR + 7.00%), 11/1/29 | | | | | 9,500 | | | | 9,143,750 | |
| | | |
Mehilainen Yhtiot Oy, Term Loan, 4.718%, (3 mo. EURIBOR + 3.53%), 8/11/25 | | EUR | | | 7,975 | | | | 7,408,414 | |
| | | |
Midwest Physician Administrative Services, LLC, Term Loan, 6.924%, (3 mo. USD LIBOR + 3.25%), 3/12/28 | | | | | 10,133 | | | | 9,178,685 | |
| | | |
National Mentor Holdings, Inc.: | | | | | | | | | | |
| | | |
Term Loan, 7.43%, (3 mo. USD LIBOR + 3.75%), 3/2/28 | | | | | 576 | | | | 415,996 | |
| | | |
Term Loan, 7.466%, (USD LIBOR + 3.75%), 3/2/28(8) | | | | | 20,783 | | | | 15,008,980 | |
| | | |
Term Loan - Second Lien, 10.93%, (3 mo. USD LIBOR + 7.25%), 3/2/29 | | | | | 6,475 | | | | 4,451,563 | |
| | | | |
| | 35 | | See Notes to Financial Statements. |
Senior Debt Portfolio
October 31, 2022
Portfolio of Investments — continued
| | | | | | | | | | | | |
| | | | | | Principal | | | | |
| | | | | | Amount* | | | | |
| Borrower/Description | | | | | (000’s omitted) | | | Value | |
| | | |
| Health Care Providers & Services (continued) | | | | | | | | | |
| | | |
Option Care Health, Inc., Term Loan, 6.504%, (1 mo. USD LIBOR + 2.75%), 10/27/28 | | | | | | | 3,068 | | | $ | 3,016,259 | |
| | | |
Pearl Intermediate Parent, LLC, Term Loan - Second Lien, 10.004%, (1 mo. USD LIBOR + 6.25%), 2/13/26 | | | | | | | 2,575 | | | | 2,356,125 | |
| | | |
Pediatric Associates Holding Company, LLC: | | | | | | | | | | | | |
| | | |
Term Loan, 5.122%, (1 mo. USD LIBOR + 3.25%), 12/29/28(9) | | | | | | | 190 | | | | 184,128 | |
| | | |
Term Loan, 7.004%, (1 mo. USD LIBOR + 3.25%), 12/29/28 | | | | | | | 1,253 | | | | 1,212,195 | |
| | | |
PetVet Care Centers, LLC, Term Loan, 7.254%, (1 mo. USD LIBOR + 3.50%), 2/14/25 | | | | | | | 7,877 | | | | 7,404,555 | |
| | | |
Phoenix Guarantor, Inc.: | | | | | | | | | | | | |
| | | |
Term Loan, 7.004%, (1 mo. USD LIBOR + 3.25%), 3/5/26 | | | | | | | 24,303 | | | | 23,376,898 | |
| | | |
Term Loan, 7.254%, (1 mo. USD LIBOR + 3.50%), 3/5/26 | | | | | | | 4,479 | | | | 4,308,599 | |
| | | |
Radiology Partners, Inc., Term Loan, 7.825%, (1 mo. USD LIBOR + 4.25%), 7/9/25 | | | | | | | 24,215 | | | | 19,674,998 | |
| | | |
Radnet Management, Inc., Term Loan, 6.754%, (1 mo. USD LIBOR + 3.00%), 4/21/28 | | | | | | | 13,423 | | | | 13,063,901 | |
| | | |
Ramsay Generale de Sante S.A., Term Loan, 4.502%, (3 mo. EURIBOR + 2.80%), 4/22/27 | | | EUR | | | | 9,900 | | | | 9,257,800 | |
| | | |
Select Medical Corporation, Term Loan, 6.26%, (1 mo. USD LIBOR + 2.50%), 3/6/25 | | | | | | | 56,458 | | | | 55,055,263 | |
| | | |
Sound Inpatient Physicians, Term Loan, 6.754%, (1 mo. USD LIBOR + 3.00%), 6/27/25 | | | | | | | 2,592 | | | | 2,060,789 | |
| | | |
Synlab Bondco PLC, Term Loan, 2.778%, (6 mo. EURIBOR + 2.50%), 7/1/27 | | | EUR | | | | 2,600 | | | | 2,458,107 | |
| | | |
TTF Holdings, LLC, Term Loan, 7.813%, (1 mo. USD LIBOR + 4.00%), 3/31/28 | | | | | | | 5,644 | | | | 5,545,547 | |
| | | |
U.S. Anesthesia Partners, Inc., Term Loan, 7.378%, (1 mo. USD LIBOR + 4.25%), 10/1/28 | | | | | | | 16,467 | | | | 15,611,638 | |
| | | |
WP CityMD Bidco, LLC, Term Loan, 6.924%, (3 mo. USD LIBOR + 3.25%), 12/22/28 | | | | | | | 10,410 | | | | 10,144,893 | |
| | | |
| | | | | | | | | | | $ | 446,073,239 | |
|
| Health Care Technology — 2.2% | |
| | | |
athenahealth, Inc.: | | | | | | | | | | | | |
| | | |
Term Loan, 3.50%, 2/15/29(9) | | | | | | | 1,943 | | | $ | 1,773,454 | |
| | | |
Term Loan, 6.967%, (SOFR + 3.50%), 2/15/29 | | | | | | | 11,434 | | | | 10,437,222 | |
| | | |
Bracket Intermediate Holding Corp., Term Loan, 7.998%, (3 mo. USD LIBOR + 4.25%), 9/5/25 | | | | | | | 13,198 | | | | 12,673,761 | |
| | | |
Certara, L.P., Term Loan, 7.254%, (1 mo. USD LIBOR + 3.50%), 8/15/26 | | | | | | | 9,378 | | | | 9,166,859 | |
| | | |
eResearchTechnology, Inc., Term Loan, 8.254%, (1 mo. USD LIBOR + 4.50%), 2/4/27 | | | | | | | 9,661 | | | | 9,021,009 | |
| | | |
GHX Ultimate Parent Corporation, Term Loan, 6.127%, (6 mo. USD LIBOR + 3.25%), 6/28/24 | | | | | | | 3,360 | | | | 3,254,986 | |
| | | | | | | | | | | | |
| | | | | | Principal | | | | |
| | | | | | Amount* | | | | |
| Borrower/Description | | | | | (000’s omitted) | | | Value | |
|
| Health Care Technology (continued) | |
| | | |
Imprivata, Inc.: | | | | | | | | | | | | |
| | | |
Term Loan, 7.504%, (1 mo. USD LIBOR + 3.75%), 12/1/27 | | | | | | | 18,352 | | | $ | 18,008,258 | |
| | | |
Term Loan, 7.979%, (SOFR + 4.25%), 12/1/27 | | | | | | | 3,616 | | | | 3,572,246 | |
| | | |
MedAssets Software Intermediate Holdings, Inc.: | | | | | | | | | | | | |
| | | |
Term Loan, 7.754%, (1 mo. USD LIBOR + 4.00%), 12/18/28 | | | | | | | 17,711 | | | | 16,825,450 | |
| | | |
Term Loan - Second Lien, 10.504%, (1 mo. USD LIBOR + 6.75%), 12/17/29 | | | | | | | 9,625 | | | | 8,285,518 | |
| | | |
Navicure, Inc., Term Loan, 7.754%, (1 mo. USD LIBOR + 4.00%), 10/22/26 | | | | | | | 22,298 | | | | 21,747,638 | |
| | | |
PointClickCare Technologies, Inc., Term Loan, 5.938%, (6 mo. USD LIBOR + 3.00%), 12/29/27 | | | | | | | 5,122 | | | | 5,021,696 | |
| | | |
Project Ruby Ultimate Parent Corp., Term Loan, 7.004%, (1 mo. USD LIBOR + 3.25%), 3/10/28 | | | | | | | 10,022 | | | | 9,459,586 | |
| | | |
Symplr Software, Inc., Term Loan, 8.694%, (SOFR + 4.50%), 12/22/27 | | | | | | | 9,190 | | | | 8,606,640 | |
| | | |
Verscend Holding Corp., Term Loan, 7.754%, (1 mo. USD LIBOR + 4.00%), 8/27/25 | | | | | | | 27,592 | | | | 27,255,785 | |
| | | |
| | | | | | | | | | | $ | 165,110,108 | |
|
| Hotels, Restaurants & Leisure — 4.4% | |
| | | |
1011778 B.C. Unlimited Liability Company, Term Loan, 5.655%, (1 mo. USD LIBOR + 1.75%), 11/19/26 | | | | | | | 28,971 | | | $ | 28,234,554 | |
| | | |
Bally’s Corporation, Term Loan, 6.55%, (3 mo. USD LIBOR + 3.25%), 10/2/28 | | | | | | | 12,402 | | | | 11,562,871 | |
| | | |
Carnival Corporation: | | | | | | | | | | | | |
| | | |
Term Loan, 3.975%, (6 mo. EURIBOR + 3.75%), 6/30/25 | | | EUR | | | | 9,645 | | | | 9,102,701 | |
| | | |
Term Loan, 5.877%, (6 mo. USD LIBOR + 3.00%), 6/30/25 | | | | | | | 4,112 | | | | 3,872,042 | |
| | | |
Term Loan, 6.127%, (6 mo. USD LIBOR + 3.25%), 10/18/28 | | | | | | | 40,395 | | | | 37,112,677 | |
| | | |
Churchill Downs Incorporated, Term Loan, 5.76%, (1 mo. USD LIBOR + 2.00%), 12/27/24 | | | | | | | 3,334 | | | | 3,316,041 | |
| | | |
ClubCorp Holdings, Inc., Term Loan, 6.424%, (3 mo. USD LIBOR + 2.75%), 9/18/24 | | | | | | | 23,636 | | | | 21,286,770 | |
| | | |
Dave & Buster’s, Inc., Term Loan, 8.875%, (SOFR + 5.00%), 6/29/29 | | | | | | | 12,294 | | | | 12,061,114 | |
| | | |
Fertitta Entertainment, LLC, Term Loan, 7.729%, (SOFR + 4.00%), 1/27/29 | | | | | | | 29,928 | | | | 28,148,321 | |
| | | |
Great Canadian Gaming Corporation, Term Loan, 7.602%, (3 mo. USD LIBOR + 4.00%), 11/1/26 | | | | | | | 8,817 | | | | 8,589,754 | |
| | | |
GVC Holdings PLC, Term Loan, 3.633%, (1 mo. EURIBOR + 2.50%), 3/29/24 | | | EUR | | | | 21,325 | | | | 20,442,192 | |
| | | |
Hilton Grand Vacations Borrower, LLC, Term Loan, 6.754%, (1 mo. USD LIBOR + 3.00%), 8/2/28 | | | | | | | 9,999 | | | | 9,855,264 | |
| | | | |
| | 36 | | See Notes to Financial Statements. |
Senior Debt Portfolio
October 31, 2022
Portfolio of Investments — continued
| | | | | | | | | | | | |
| | | | | | Principal | | | | |
| | | | | | Amount* | | | | |
| Borrower/Description | | | | | (000’s omitted) | | | Value | |
|
| Hotels, Restaurants & Leisure (continued) | |
| | | |
IRB Holding Corp., Term Loan, 6.208%, (SOFR + 3.00%), 12/15/27 | | | | | | | 6,251 | | | $ | 6,075,014 | |
| | | |
NCL Corporation Limited, Term Loan, 1/2/24(10) | | | | | | | 4,500 | | | | 4,252,500 | |
| | | |
Oravel Stays Singapore Pte, Ltd., Term Loan, 11.86%, (3 mo. USD LIBOR + 8.25%), 6/23/26 | | | | | | | 5,974 | | | | 5,227,578 | |
| | | |
Playa Resorts Holding B.V., Term Loan, 6.50%, (1 mo. USD LIBOR + 2.75%), 4/29/24 | | | | | | | 20,920 | | | | 20,431,436 | |
| | | |
Scientific Games Holdings, L.P.: | | | | | | | | | | | | |
| | | |
Term Loan, 5.185%, (3 mo. EURIBOR + 4.00%), 4/4/29 | | | EUR | | | | 1,000 | | | | 924,837 | |
| | | |
Term Loan, 7.097%, (SOFR + 3.50%), 4/4/29 | | | | | | | 9,300 | | | | 8,780,102 | |
| | | |
Scientific Games International, Inc., Term Loan, 6.402%, (SOFR + 3.00%), 4/14/29 | | | | | | | 10,474 | | | | 10,365,085 | |
| | | |
SeaWorld Parks & Entertainment, Inc., Term Loan, 6.813%, (1 mo. USD LIBOR + 3.00%), 8/25/28 | | | | | | | 11,039 | | | | 10,785,994 | |
| | | |
Stars Group Holdings B.V. (The): | | | | | | | | | | | | |
| | | |
Term Loan, 3.728%, (3 mo. EURIBOR + 2.50%), 7/21/26 | | | EUR | | | | 12,305 | | | | 11,471,661 | |
| | | |
Term Loan, 5.892%, (3 mo. USD LIBOR + 2.25%), 7/21/26 | | | | | | | 31,669 | | | | 31,157,571 | |
| | | |
Travel Leaders Group, LLC, Term Loan, 7.754%, (1 mo. USD LIBOR + 4.00%), 1/25/24 | | | | | | | 19,763 | | | | 17,552,388 | |
| | | |
| | | | | | | | | | | $ | 320,608,467 | |
|
| Household Durables — 0.9% | |
| | | |
Libbey Glass, Inc., Term Loan, 11.941%, (3 mo. USD LIBOR + 8.00%), 11/13/25 | | | | | | | 8,749 | | | $ | 8,960,657 | |
| | | |
Serta Simmons Bedding, LLC: | | | | | | | | | | | | |
| | | |
Term Loan, 10.793%, (1 mo. USD LIBOR + 7.50%), 8/10/23 | | | | | | | 13,879 | | | | 13,505,559 | |
| | | |
Term Loan - Second Lien, 10.793%, (1 mo. USD LIBOR + 7.50%), 8/10/23 | | | | | | | 45,875 | | | | 23,199,711 | |
| | | |
Solis IV B.V.: | | | | | | | | | | | | |
| | | |
Term Loan, 4.468%, (3 mo. EURIBOR + 4.00%), 2/26/29 | | | EUR | | | | 4,700 | | | | 3,882,255 | |
| | | |
Term Loan, 6.34%, (SOFR + 3.50%), 2/26/29 | | | | | | | 18,149 | | | | 15,173,535 | |
| | | |
Spectrum Brands, Inc., Term Loan, 5.76%, (1 mo. USD LIBOR + 2.00%), 3/3/28 | | | | | | | 4,925 | | | | 4,740,313 | |
| | | |
| | | | | | | | | | | $ | 69,462,030 | |
|
| Household Products — 0.6% | |
| | | |
Diamond (BC) B.V., Term Loan, 7.163%, (USD LIBOR + 2.75%), 9/29/28(8) | | | | | | | 12,832 | | | $ | 12,032,991 | |
| | | |
Energizer Holdings, Inc., Term Loan, 5.875%, (1 mo. USD LIBOR + 2.25%), 12/22/27 | | | | | | | 9,021 | | | | 8,758,248 | |
| | | |
Kronos Acquisition Holdings, Inc.: | | | | | | | | | | | | |
| | | |
Term Loan, 6.82%, (3 mo. USD LIBOR + 3.75%), 12/22/26 | | | | | | | 12,408 | | | | 11,762,177 | |
| | | | | | | | | | | | |
| | | | | | Principal | | | | |
| | | | | | Amount* | | | | |
| Borrower/Description | | | | | (000’s omitted) | | | Value | |
|
| Household Products (continued) | |
| | | |
Kronos Acquisition Holdings, Inc.: (continued) | | | | | | | | | | | | |
| | | |
Term Loan, 8.94%, (SOFR + 6.00%), 12/22/26 | | | | | | | 5,707 | | | $ | 5,478,600 | |
| | | |
Nobel Bidco B.V., Term Loan, 3.50%, (3 mo. EURIBOR + 3.50%), 9/1/28 | | | EUR | | | | 12,550 | | | | 8,472,481 | |
| | | |
| | | | | | | | | | | $ | 46,504,497 | |
|
| Independent Power and Renewable Electricity Producers — 0.3% | |
| | | |
Calpine Construction Finance Company, L.P., Term Loan, 5.754%, (1 mo. USD LIBOR + 2.00%), 1/15/25 | | | | | | | 10,602 | | | $ | 10,477,764 | |
| | | |
Calpine Corporation: | | | | | | | | | | | | |
| | | |
Term Loan, 5.76%, (1 mo. USD LIBOR + 2.00%), 4/5/26 | | | | | | | 3,207 | | | | 3,150,645 | |
| | | |
Term Loan, 6.26%, (1 mo. USD LIBOR + 2.50%), 12/16/27 | | | | | | | 5,183 | | | | 5,133,612 | |
| | | |
Longview Power, LLC, Term Loan, 13.674%, (3 mo. USD LIBOR + 10.00%), 7/30/25 | | | | | | | 704 | | | | 693,173 | |
| | | |
| | | | | | | | | | | $ | 19,455,194 | |
|
| Industrial Conglomerates — 0.5% | |
| | | |
Rain Carbon GmbH, Term Loan, 3.282%, (3 mo. EURIBOR + 3.00%), 1/16/25 | | | EUR | | | | 15,875 | | | $ | 14,773,110 | |
| | | |
SPX Flow, Inc., Term Loan, 8.329%, (SOFR + 4.50%), 4/5/29 | | | | | | | 25,678 | | | | 24,394,571 | |
| | | |
| | | | | | | | | | | $ | 39,167,681 | |
|
| Insurance — 2.2% | |
| | | |
Alliant Holdings Intermediate, LLC: | | | | | | | | | | | | |
| | | |
Term Loan, 6.98%, (1 mo. USD LIBOR + 3.50%), 11/6/27 | | | | | | | 14,110 | | | $ | 13,646,337 | |
| | | |
Term Loan, 7.004%, (1 mo. USD LIBOR + 3.25%), 5/9/25 | | | | | | | 3,172 | | | | 3,086,048 | |
| | | |
Term Loan, 7.004%, (1 mo. USD LIBOR + 3.25%), 5/9/25 | | | | | | | 5,587 | | | | 5,434,159 | |
| | | |
AmWINS Group, Inc., Term Loan, 6.004%, (1 mo. USD LIBOR + 2.25%), 2/19/28 | | | | | | | 26,084 | | | | 25,553,308 | |
| | | |
AssuredPartners, Inc.: | | | | | | | | | | | | |
| | | |
Term Loan, 7.229%, (SOFR + 3.50%), 2/12/27 | | | | | | | 5,348 | | | | 5,109,128 | |
| | | |
Term Loan, 7.254%, (1 mo. USD LIBOR + 3.50%), 2/12/27 | | | | | | | 17,016 | | | | 16,268,060 | |
| | | |
Term Loan, 7.254%, (1 mo. USD LIBOR + 3.50%), 2/12/27 | | | | | | | 3,424 | | | | 3,273,319 | |
| | | |
Financiere CEP S.A.S., Term Loan, 4.225%, (6 mo. EURIBOR + 4.00%), 6/18/27 | | | EUR | | | | 5,242 | | | | 4,869,910 | |
| | | |
Hub International Limited: | | | | | | | | | | | | |
| | | |
Term Loan, 7.326%, (3 mo. USD LIBOR + 3.00%), 4/25/25 | | | | | | | 18,060 | | | | 17,734,360 | |
| | | |
Term Loan, 7.527%, (3 mo. USD LIBOR + 3.25%), 4/25/25 | | | | | | | 7,009 | | | | 6,895,215 | |
| | | | |
| | 37 | | See Notes to Financial Statements. |
Senior Debt Portfolio
October 31, 2022
Portfolio of Investments — continued
| | | | | | | | | | | | |
| | | | | | Principal | | | | |
| | | | | | Amount* | | | | |
| Borrower/Description | | | | | (000’s omitted) | | | Value | |
|
| Insurance (continued) | |
| | | |
NFP Corp., Term Loan, 7.004%, (1 mo. USD LIBOR + 3.25%), 2/15/27 | | | | | | | 32,929 | | | $ | 31,315,856 | |
| | | |
Ryan Specialty Group, LLC, Term Loan, 6.829%, (SOFR + 3.00%), 9/1/27 | | | | | | | 12,622 | | | | 12,484,348 | |
| | | |
USI, Inc.: | | | | | | | | | | | | |
| | | |
Term Loan, 6.424%, (3 mo. USD LIBOR + 2.75%), 5/16/24 | | | | | | | 8,739 | | | | 8,641,423 | |
| | | |
Term Loan, 6.924%, (3 mo. USD LIBOR + 3.25%), 12/2/26 | | | | | | | 5,729 | | | | 5,624,184 | |
| | | |
| | | | | | | | | | | $ | 159,935,655 | |
|
| Interactive Media & Services — 0.5% | |
| | | |
Buzz Finco, LLC: | | | | | | | | | | | | |
| | | |
Term Loan, 6.504%, (1 mo. USD LIBOR + 2.75%), 1/29/27 | | | | | | | 2,762 | | | $ | 2,693,138 | |
| | | |
Term Loan, 7.004%, (1 mo. USD LIBOR + 3.25%), 1/29/27 | | | | | | | 549 | | | | 540,608 | |
| | | |
Foundational Education Group, Inc., Term Loan, 7.565%, (SOFR + 3.75%), 8/31/28 | | | | | | | 3,594 | | | | 3,517,895 | |
| | | |
Getty Images, Inc.: | | | | | | | | | | | | |
| | | |
Term Loan, 5.563%, (3 mo. EURIBOR + 5.00%), 2/19/26 | | | EUR | | | | 3,724 | | | | 3,662,278 | |
| | | |
Term Loan, 7.625%, (3 mo. USD LIBOR + 4.50%), 2/19/26 | | | | | | | 16,263 | | | | 16,194,032 | |
| | | |
Match Group, Inc., Term Loan, 4.692%, (3 mo. USD LIBOR + 1.75%), 2/13/27 | | | | | | | 7,625 | | | | 7,485,211 | |
| | | |
| | | | | | | | | | | $ | 34,093,162 | |
|
| Internet & Direct Marketing Retail — 0.7% | |
| | | |
Adevinta ASA: | | | | | | | | | | | | |
| | | |
Term Loan, 4.443%, (3 mo. EURIBOR + 3.25%), 6/26/28 | | | EUR | | | | 8,955 | | | $ | 8,553,858 | |
| | | |
Term Loan, 6.674%, (3 mo. USD LIBOR + 3.00%), 6/26/28 | | | | | | | 6,394 | | | | 6,259,186 | |
| | | |
CNT Holdings I Corp., Term Loan, 7.239%, (SOFR + 3.50%), 11/8/27 | | | | | | | 14,704 | | | | 14,350,444 | |
| | | |
Etraveli Holding AB, Term Loan, 5.193%, (3 mo. EURIBOR + 4.00%), 8/2/24 | | | EUR | | | | 9,472 | | | | 9,274,931 | |
| | | |
Hoya Midco, LLC, Term Loan, 6.979%, (SOFR + 3.25%), 2/3/29 | | | | | | | 7,394 | | | | 7,320,188 | |
| | | |
Speedster Bidco GmbH, Term Loan, 5.108%, (6 mo. EURIBOR + 3.25%), 3/31/27 | | | EUR | | | | 2,550 | | | | 2,215,533 | |
| | | |
| | | | | | | | | | | $ | 47,974,140 | |
|
| IT Services — 4.8% | |
| | | |
Asurion, LLC: | | | | | | | | | | | | |
| | | |
Term Loan, 6.754%, (1 mo. USD LIBOR + 3.00%), 11/3/24 | | | | | | | 2,394 | | | $ | 2,268,452 | |
| | | | | | | | | | | | |
| | | | | | Principal | | | | |
| | | | | | Amount* | | | | |
| Borrower/Description | | | | | (000’s omitted) | | | Value | |
|
| IT Services (continued) | |
| | | |
Asurion, LLC: (continued) | | | | | | | | | | | | |
| | | |
Term Loan, 7.004%, (1 mo. USD LIBOR + 3.25%), 12/23/26 | | | | | | | 5,463 | | | $ | 4,883,992 | |
| | | |
Term Loan, 7.004%, (1 mo. USD LIBOR + 3.25%), 7/31/27 | | | | | | | 11,574 | | | | 10,223,475 | |
| | | |
Term Loan, 7.653%, (SOFR + 4.00%), 8/19/28 | | | | | | | 21,762 | | | | 19,653,378 | |
| | | |
Term Loan - Second Lien, 9.004%, (1 mo. USD LIBOR + 5.25%), 1/31/28 | | | | | | | 14,360 | | | | 10,186,625 | |
| | | |
Cyxtera DC Holdings, Inc.: | | | | | | | | | | | | |
| | | |
Term Loan, 7.36%, (3 mo. USD LIBOR + 3.00%), 5/1/24 | | | | | | | 46,010 | | | | 39,551,012 | |
| | | |
Term Loan, 8.36%, (3 mo. USD LIBOR + 4.00%), 5/1/24 | | | | | | | 13,349 | | | | 11,913,703 | |
| | | |
Endure Digital, Inc., Term Loan, 6.698%, (1 mo. USD LIBOR + 3.50%), 2/10/28 | | | | | | | 31,575 | | | | 27,056,096 | |
| | | |
Gainwell Acquisition Corp., Term Loan, 7.674%, (3 mo. USD LIBOR + 4.00%), 10/1/27 | | | | | | | 72,450 | | | | 69,129,032 | |
| | | |
Go Daddy Operating Company, LLC: | | | | | | | | | | | | |
| | | |
Term Loan, 5.504%, (1 mo. USD LIBOR + 1.75%), 2/15/24 | | | | | | | 52,866 | | | | 52,733,506 | |
| | | |
Term Loan, 5.754%, (1 mo. USD LIBOR + 2.00%), 8/10/27 | | | | | | | 9,897 | | | | 9,758,449 | |
| | | |
Indy US Bidco, LLC: | | | | | | | | | | | | |
| | | |
Term Loan, 4.883%, (1 mo. EURIBOR + 3.75%), 3/6/28 | | | EUR | | | | 6,493 | | | | 5,779,974 | |
| | | |
Term Loan, 7.504%, (1 mo. USD LIBOR + 3.75%), 3/5/28 | | | | | | | 6,300 | | | | 5,606,637 | |
| | | |
Informatica, LLC, Term Loan, 6.563%, (1 mo. USD LIBOR + 2.75%), 10/27/28 | | | | | | | 34,676 | | | | 33,843,532 | |
| | | |
NAB Holdings, LLC, Term Loan, 6.703%, (SOFR + 3.00%), 11/23/28 | | | | | | | 18,461 | | | | 17,752,854 | |
| | | |
Rackspace Technology Global, Inc., Term Loan, 5.617%, (3 mo. USD LIBOR + 2.75%), 2/15/28 | | | | | | | 13,623 | | | | 8,736,972 | |
| | | |
Skopima Merger Sub, Inc., Term Loan, 7.754%, (1 mo. USD LIBOR + 4.00%), 5/12/28 | | | | | | | 8,826 | | | | 8,252,041 | |
| | | |
team.blue Finco S.a.r.l.: | | | | | | | | | | | | |
| | | |
Term Loan, 4.893%, (3 mo. EURIBOR + 3.70%), 3/30/28 | | | EUR | | | | 11,706 | | | | 10,792,479 | |
| | | |
Term Loan, 4.943%, (3 mo. EURIBOR + 3.75%), 3/27/28 | | | EUR | | | | 669 | | | | 616,713 | |
| | | |
WEX, Inc., Term Loan, 6.004%, (1 mo. USD LIBOR + 2.25%), 3/31/28 | | | | | | | 4,383 | | | | 4,304,194 | |
| | | |
| | | | | | | | | | | $ | 353,043,116 | |
|
| Leisure Products — 0.5% | |
| | | |
Accell Group N.V., Term Loan, 4.583%, (6 mo. EURIBOR + 4.50%), 9/14/29 | | | EUR | | | | 3,500 | | | $ | 3,225,400 | |
| | | |
Amer Sports Oyj, Term Loan, 5.131%, (6 mo. EURIBOR + 4.50%), 3/30/26 | | | EUR | | | | 20,475 | | | | 17,907,455 | |
| | | | |
| | 38 | | See Notes to Financial Statements. |
Senior Debt Portfolio
October 31, 2022
Portfolio of Investments — continued
| | | | | | | | | | | | |
| | | | | | Principal | | | | |
| | | | | | Amount* | | | | |
| Borrower/Description | | | | | (000’s omitted) | | | Value | |
|
| Leisure Products (continued) | |
| | | |
Fender Musical Instruments Corporation, Term Loan, 7.368%, (SOFR + 4.00%), 12/1/28 | | | | | | | 4,309 | | | $ | 3,630,517 | |
| | | |
Hayward Industries, Inc., Term Loan, 6.254%, (1 mo. USD LIBOR + 2.50%), 5/30/28 | | | | | | | 12,406 | | | | 11,683,139 | |
| | | |
SRAM, LLC, Term Loan, 6.423%, (USD LIBOR + 2.75%), 5/18/28(8) | | | | | | | 2,401 | | | | 2,335,052 | |
| | | |
| | | | | | | | | | | $ | 38,781,563 | |
|
| Life Sciences Tools & Services — 2.6% | |
| | | |
Avantor Funding, Inc.: | | | | | | | | | | | | |
| | | |
Term Loan, 3.185%, (1 mo. EURIBOR + 2.50%), 6/12/28 | | | EUR | | | | 21,528 | | | $ | 20,815,824 | |
| | | |
Term Loan, 6.004%, (1 mo. USD LIBOR + 2.25%), 11/8/27 | | | | | | | 21,670 | | | | 21,249,831 | |
| | | |
Cambrex Corporation, Term Loan, 7.329%, (SOFR + 3.50%), 12/4/26 | | | | | | | 5,941 | | | | 5,731,931 | |
| | | |
Catalent Pharma Solutions, Inc., Term Loan, 5.625%, (1 mo. USD LIBOR + 2.00%), 2/22/28 | | | | | | | 790 | | | | 783,356 | |
| | | |
Curia Global, Inc., Term Loan, 8.163%, (USD LIBOR + 3.75%), 8/30/26(8) | | | | | | | 19,617 | | | | 18,039,004 | |
| | | |
ICON Luxembourg S.a.r.l., Term Loan, 5.938%, (3 mo. USD LIBOR + 2.25%), 7/3/28 | | | | | | | 58,701 | | | | 58,211,457 | |
| | | |
IQVIA, Inc., Term Loan, 5.504%, (1 mo. USD LIBOR + 1.75%), 1/17/25 | | | | | | | 13,620 | | | | 13,585,840 | |
| | | |
LGC Group Holdings, Ltd., Term Loan, 3.883%, (1 mo. EURIBOR + 2.75%), 4/21/27 | | | EUR | | | | 4,025 | | | | 3,599,823 | |
| | | |
Loire Finco Luxembourg S.a.r.l., Term Loan, 6.754%, (1 mo. USD LIBOR + 3.00%), 4/21/27 | | | | | | | 3,520 | | | | 3,282,218 | |
| | | |
Packaging Coordinators Midco, Inc., Term Loan, 7.424%, (3 mo. USD LIBOR + 3.75%), 11/30/27 | | | | | | | 8,461 | | | | 8,199,308 | |
| | | |
Parexel International Corporation, Term Loan, 7.004%, (1 mo. USD LIBOR + 3.25%), 11/15/28 | | | | | | | 10,837 | | | | 10,466,908 | |
| | | |
PRA Health Sciences, Inc., Term Loan, 5.938%, (3 mo. USD LIBOR + 2.25%), 7/3/28 | | | | | | | 14,626 | | | | 14,503,684 | |
| | | |
Sotera Health Holdings, LLC, Term Loan, 7.165%, (3 mo. USD LIBOR + 2.75%), 12/11/26 | | | | | | | 11,625 | | | | 10,578,750 | |
| | | |
| | | | | | | | | | | $ | 189,047,934 | |
|
| Machinery — 5.0% | |
| | | |
AI Alpine AT Bidco GmbH, Term Loan, 4.731%, (6 mo. EURIBOR + 3.00%), 10/31/25 | | | EUR | | | | 6,125 | | | $ | 5,515,823 | |
| | | |
AI Aqua Merger Sub, Inc., Term Loan, 6.858%, (SOFR + 3.75%), 7/31/28 | | | | | | | 14,771 | | | | 13,774,121 | |
| | | |
Albion Financing 3 S.a.r.l., Term Loan, 9.575%, (3 mo. USD LIBOR + 5.25%), 8/17/26 | | | | | | | 20,197 | | | | 19,137,013 | |
| | | |
Ali Group North America Corporation, Term Loan, 5.843%, (1 mo. USD LIBOR + 2.00%), 7/30/29 | | | | | | | 18,405 | | | | 18,094,853 | |
| | | | | | | | | | |
| | | | | Principal | | | | |
| | | | | Amount* | | | | |
| Borrower/Description | | | | (000’s omitted) | | | Value | |
|
| Machinery (continued) | |
| | | |
Alliance Laundry Systems, LLC, Term Loan, 7.409%, (3 mo. USD LIBOR + 3.50%), 10/8/27 | | | | | 5,549 | | | $ | 5,371,533 | |
| | | |
American Trailer World Corp., Term Loan, 7.579%, (SOFR + 3.75%), 3/3/28 | | | | | 22,867 | | | | 20,824,861 | |
| | | |
Apex Tool Group, LLC, Term Loan, 8.624%, (SOFR + 5.25%), 2/8/29 | | | | | 26,255 | | | | 22,808,743 | |
| | | |
Clark Equipment Company, Term Loan, 6.153%, (SOFR + 2.50%), 4/20/29 | | | | | 14,229 | | | | 14,007,958 | |
| | | |
Conair Holdings, LLC, Term Loan, 7.424%, (3 mo. USD LIBOR + 3.75%), 5/17/28 | | | | | 26,309 | | | | 22,275,174 | |
| | | |
CPM Holdings, Inc., Term Loan, 6.628%, (1 mo. USD LIBOR + 3.50%), 11/17/25 | | | | | 14,110 | | | | 13,741,663 | |
| | | |
Delachaux Group S.A., Term Loan, 8.915%, (3 mo. USD LIBOR + 4.50%), 4/16/26 | | | | | 5,517 | | | | 4,992,433 | |
| | | |
Engineered Machinery Holdings, Inc.: | | | | | | | | | | |
| | | |
Term Loan, 4.943%, (3 mo. EURIBOR + 3.75%), 5/21/28 | | EUR | | | 12,004 | | | | 10,755,521 | |
| | | |
Term Loan, 7.424%, (3 mo. USD LIBOR + 3.75%), 5/19/28 | | | | | 22,813 | | | | 22,118,901 | |
| | | |
Term Loan - Second Lien, 9.674%, (3 mo. USD LIBOR + 6.00%), 5/21/29 | | | | | 2,000 | | | | 1,891,250 | |
| | | |
EWT Holdings III Corp., Term Loan, 6.313%, (1 mo. USD LIBOR + 2.50%), 4/1/28 | | | | | 7,416 | | | | 7,327,948 | |
| | | |
Filtration Group Corporation: | | | | | | | | | | |
| | | |
Term Loan, 4.633%, (3 mo. EURIBOR + 3.50%), 3/29/25 | | EUR | | | 3,561 | | | | 3,345,738 | |
| | | |
Term Loan, 6.754%, (1 mo. USD LIBOR + 3.00%), 3/29/25 | | | | | 17,176 | | | | 16,853,895 | |
| | | |
Term Loan, 7.254%, (1 mo. USD LIBOR + 3.50%), 10/21/28 | | | | | 3,251 | | | | 3,143,476 | |
| | | |
Gates Global, LLC: | | | | | | | | | | |
| | | |
Term Loan, 4.133%, (1 mo. EURIBOR + 3.00%), 4/1/24 | | EUR | | | 6,914 | | | | 6,490,736 | |
| | | |
Term Loan, 6.254%, (1 mo. USD LIBOR + 2.50%), 3/31/27 | | | | | 23,563 | | | | 22,983,686 | |
| | | |
Granite Holdings US Acquisition Co., Term Loan, 7.688%, (3 mo. USD LIBOR + 4.00%), 9/30/26 | | | | | 8,020 | | | | 7,842,605 | |
| | | |
Icebox Holdco III, Inc.: | | | | | | | | | | |
| | | |
Term Loan, 7.424%, (3 mo. USD LIBOR + 3.75%), 12/22/28 | | | | | 12,634 | | | | 11,718,376 | |
| | | |
Term Loan, 7.58%, (3 mo. USD LIBOR + 3.75%), 12/22/28 | | | | | 2,627 | | | | 2,436,675 | |
| | | |
Illuminate Buyer, LLC, Term Loan, 7.254%, (1 mo. USD LIBOR + 3.50%), 6/30/27 | | | | | 886 | | | | 829,318 | |
| | | |
Madison IAQ, LLC, Term Loan, 6.815%, (3 mo. USD LIBOR + 3.25%), 6/21/28 | | | | | 43,495 | | | | 39,580,357 | |
| | | |
Penn Engineering & Manufacturing Corp., Term Loan, 6.424%, (3 mo. USD LIBOR + 2.75%), 6/27/24 | | | | | 1,662 | | | | 1,624,609 | |
| | | |
Titan Acquisition Limited, Term Loan, 5.877%, (6 mo. USD LIBOR + 3.00%), 3/28/25 | | | | | 30,197 | | | | 27,651,971 | |
| | | | |
| | 39 | | See Notes to Financial Statements. |
Senior Debt Portfolio
October 31, 2022
Portfolio of Investments — continued
| | | | | | | | | | | | |
| | | | | | Principal | | | | |
| | | | | | Amount* | | | | |
| Borrower/Description | | | | | (000’s omitted) | | | Value | |
|
| Machinery (continued) | |
| | | |
TK Elevator Topco GmbH, Term Loan, 4.256%, (1 mo. EURIBOR + 3.63%), 7/29/27 | | | EUR | | | | 12,100 | | | $ | 11,016,143 | |
| | | |
Vertical US Newco, Inc., Term Loan, 6.871%, (6 mo. USD LIBOR + 3.50%), 7/30/27 | | | | | | | 6 | | | | 5,934 | |
| | | |
Zephyr German BidCo GmbH, Term Loan, 4.216%, (3 mo. EURIBOR + 3.40%), 3/10/28 | | | EUR | | | | 13,675 | | | | 12,489,484 | |
| | | |
| | | | | | | | | | | $ | 370,650,798 | |
|
| Media — 2.6% | |
| | | |
Axel Springer SE, Term Loan, 5.816%, (3 mo. EURIBOR + 4.75%), 12/18/26 | | | EUR | | | | 9,800 | | | $ | 9,273,241 | |
| | | |
Charter Communications Operating, LLC, Term Loan, 5.51%, (1 mo. USD LIBOR + 1.75%), 2/1/27 | | | | | | | 8,949 | | | | 8,800,114 | |
| | | |
CSC Holdings, LLC: | | | | | | | | | | | | |
| | | |
Term Loan, 5.662%, (1 mo. USD LIBOR + 2.25%), 7/17/25 | | | | | | | 43,629 | | | | 42,374,695 | |
| | | |
Term Loan, 5.662%, (1 mo. USD LIBOR + 2.25%), 1/15/26 | | | | | | | 5,648 | | | | 5,476,919 | |
| | | |
Diamond Sports Group, LLC: | | | | | | | | | | | | |
| | | |
Term Loan, 11.208%, (SOFR + 8.10%), 5/26/26 | | | | | | | 5,928 | | | | 5,715,012 | |
| | | |
Term Loan - Second Lien, 6.458%, (SOFR + 3.35%), 8/24/26 | | | | | | | 28,513 | | | | 5,705,654 | |
| | | |
Entravision Communications Corporation, Term Loan, 6.504%, (1 mo. USD LIBOR + 2.75%), 11/29/24 | | | | | | | 7,998 | | | | 7,837,550 | |
| | | |
Gray Television, Inc., Term Loan, 5.628%, (1 mo. USD LIBOR + 2.50%), 1/2/26 | | | | | | | 3,553 | | | | 3,501,623 | |
| | | |
Hubbard Radio, LLC, Term Loan, 8.01%, (1 mo. USD LIBOR + 4.25%), 3/28/25 | | | | | | | 8,179 | | | | 6,761,447 | |
| | | |
iHeartCommunications, Inc.: | | | | | | | | | | | | |
| | | |
Term Loan, 6.754%, (1 mo. USD LIBOR + 3.00%), 5/1/26 | | | | | | | 1,127 | | | | 1,067,305 | |
| | | |
Term Loan, 7.004%, (1 mo. USD LIBOR + 3.25%), 5/1/26 | | | | | �� | | 3,165 | | | | 3,001,646 | |
| | | |
Magnite, Inc., Term Loan, 8.642%, (USD LIBOR + 5.00%), 4/28/28(8) | | | | | | | 6,567 | | | | 6,205,697 | |
| | | |
Mission Broadcasting, Inc., Term Loan, 5.628%, (1 mo. USD LIBOR + 2.50%), 6/2/28 | | | | | | | 4,049 | | | | 4,016,696 | |
| | | |
MJH Healthcare Holdings, LLC, Term Loan, 7.329%, (SOFR + 3.50%), 1/28/29 | | | | | | | 3,980 | | | | 3,781,000 | |
| | | |
Nexstar Broadcasting, Inc., Term Loan, 6.254%, (1 mo. USD LIBOR + 2.50%), 9/18/26 | | | | | | | 1,285 | | | | 1,274,439 | |
| | | |
Recorded Books, Inc., Term Loan, 7.578%, (SOFR + 4.00%), 8/29/25 | | | | | | | 19,758 | | | | 19,247,697 | |
| | | |
Sinclair Television Group, Inc.: | | | | | | | | | | | | |
| | | |
Term Loan, 6.26%, (1 mo. USD LIBOR + 2.50%), 9/30/26 | | | | | | | 5,361 | | | | 5,078,018 | |
| | | |
Term Loan, 6.76%, (1 mo. USD LIBOR + 3.00%), 4/1/28 | | | | | | | 25,444 | | | | 23,700,673 | |
| | | | | | | | | | | | |
| | | | | | Principal | | | | |
| | | | | | Amount* | | | | |
| Borrower/Description | | | | | (000’s omitted) | | | Value | |
|
| Media (continued) | |
| | | |
Univision Communications, Inc.: | | | | | | | | | | | | |
| | | |
Term Loan, 6.504%, (1 mo. USD LIBOR + 2.75%), 3/15/24 | | | | | | | 7,611 | | | $ | 7,594,693 | |
| | | |
Term Loan, 7.004%, (1 mo. USD LIBOR + 3.25%), 3/15/26 | | | | | | | 23,431 | | | | 22,769,800 | |
| | | |
| | | | | | | | | | | $ | 193,183,919 | |
|
| Metals/Mining — 0.7% | |
| | | |
American Consolidated Natural Resources, Inc., Term Loan, 20.33%, (3 mo. USD LIBOR + 16.00%), 17.33% cash, 3.00% PIK, 9/16/25 | | | | | | | 353 | | | $ | 355,165 | |
| | | |
Dynacast International, LLC: | | | | | | | | | | | | |
| | | |
Term Loan, 7.48%, (3 mo. USD LIBOR + 4.50%), 7/22/25 | | | | | | | 16,535 | | | | 14,095,665 | |
| | | |
Term Loan, 11.98%, (3 mo. USD LIBOR + 9.00%), 10/22/25 | | | | | | | 2,956 | | | | 2,512,474 | |
| | | |
WireCo WorldGroup, Inc., Term Loan, 7.188%, (3 mo. USD LIBOR + 4.25%), 11/13/28 | | | | | | | 9,555 | | | | 9,356,098 | |
| | | |
Zekelman Industries, Inc., Term Loan, 5.604%, (3 mo. USD LIBOR + 2.00%), 1/24/27 | | | | | | | 27,021 | | | | 26,300,880 | |
| | | |
| | | | | | | | | | | $ | 52,620,282 | |
|
| Oil, Gas & Consumable Fuels — 2.0% | |
| | | |
Buckeye Partners, L.P., Term Loan, 5.365%, (1 mo. USD LIBOR + 2.25%), 11/1/26 | | | | | | | 7,670 | | | $ | 7,593,766 | |
| | | |
Centurion Pipeline Company, LLC: | | | | | | | | | | | | |
| | | |
Term Loan, 7.004%, (1 mo. USD LIBOR + 3.25%), 9/29/25 | | | | | | | 3,362 | | | | 3,328,442 | |
| | | |
Term Loan, 7.754%, (1 mo. USD LIBOR + 4.00%), 9/28/25 | | | | | | | 2,000 | | | | 1,975,315 | |
| | | |
CITGO Petroleum Corporation, Term Loan, 10.004%, (1 mo. USD LIBOR + 6.25%), 3/28/24 | | | | | | | 28,221 | | | | 28,295,825 | |
| | | |
Delek US Holdings, Inc., Term Loan, 9.254%, (1 mo. USD LIBOR + 5.50%), 3/31/25 | | | | | | | 5,119 | | | | 5,077,160 | |
| | | |
Freeport LNG Investments, LLLP, Term Loan, 7.743%, (3 mo. USD LIBOR + 3.50%), 12/21/28 | | | | | | | 18,707 | | | | 17,556,404 | |
| | | |
GIP II Blue Holding, L.P, Term Loan, 8.174%, (3 mo. USD LIBOR + 4.50%), 9/29/28 | | | | | | | 20,357 | | | | 20,223,854 | |
| | | |
Matador Bidco S.a.r.l., Term Loan, 8.254%, (1 mo. USD LIBOR + 4.50%), 10/15/26 | | | | | | | 34,028 | | | | 33,390,126 | |
| | | |
Oryx Midstream Services Permian Basin, LLC, Term Loan, 6.211%, (3 mo. USD LIBOR + 3.25%), 10/5/28 | | | | | | | 6,625 | | | | 6,540,377 | |
| | | |
Oxbow Carbon, LLC, Term Loan, 7.878%, (3 mo. USD LIBOR + 4.25%), 10/17/25 | | | | | | | 6,355 | | | | 6,336,218 | |
| | | | |
| | 40 | | See Notes to Financial Statements. |
Senior Debt Portfolio
October 31, 2022
Portfolio of Investments — continued
| | | | | | | | | | | | |
| | | | | | Principal | | | | |
| | | | | | Amount* | | | | |
| Borrower/Description | | | | | (000’s omitted) | | | Value | |
|
| Oil, Gas & Consumable Fuels (continued) | |
| | | |
QuarterNorth Energy Holding, Inc., Term Loan - Second Lien, 11.754%, (1 mo. USD LIBOR + 8.00%), 8/27/26 | | | | | | | 7,607 | | | $ | 7,588,345 | |
| | | |
UGI Energy Services, LLC, Term Loan, 7.254%, (1 mo. USD LIBOR + 3.50%), 8/13/26 | | | | | | | 10,760 | | | | 10,721,842 | |
| | | |
| | | | | | | | | | | $ | 148,627,674 | |
|
| Personal Products — 0.6% | |
| | | |
HLF Financing S.a.r.l., Term Loan, 6.254%, (1 mo. USD LIBOR + 2.50%), 8/18/25 | | | | | | | 23,453 | | | $ | 22,658,684 | |
| | | |
Rainbow Finco S.a.r.l., Term Loan, 4.658%, (6 mo. EURIBOR + 3.75%), 2/24/29 | | | EUR | | | | 14,875 | | | | 13,885,573 | |
| | | |
Sunshine Luxembourg VII S.a.r.l., Term Loan, 7.424%, (3 mo. USD LIBOR + 3.75%), 10/1/26 | | | | | | | 10,963 | | | | 10,449,341 | |
| | | |
| | | | | | | | | | | $ | 46,993,598 | |
|
| Pharmaceuticals — 2.0% | |
| | | |
Aenova Holding GmbH, Term Loan, 5.034%, (6 mo. EURIBOR + 4.50%), 3/6/26 | | | EUR | | | | 4,075 | | | $ | 3,503,592 | |
| | | |
AI Sirona (Luxembourg) Acquisition S.a.r.l., Term Loan, 4.383%, (1 mo. EURIBOR + 3.25%), 9/29/25 | | | EUR | | | | 12,550 | | | | 11,658,382 | |
| | | |
Akorn, Inc., Term Loan, 11.243%, (3 mo. USD LIBOR + 7.50%), 10/1/25 | | | | | | | 3,363 | | | | 3,194,693 | |
| | | |
Amneal Pharmaceuticals, LLC, Term Loan, 7.251%, (USD LIBOR + 3.50%), 5/4/25(8) | | | | | | | 19,101 | | | | 16,381,914 | |
| | | |
Bausch Health Companies, Inc., Term Loan, 8.624%, (SOFR + 5.25%), 2/1/27 | | | | | | | 19,416 | | | | 14,596,425 | |
| | | |
Elanco Animal Health Incorporated, Term Loan, 4.878%, (1 mo. USD LIBOR + 1.75%), 8/1/27 | | | | | | | 3,152 | | | | 3,045,478 | |
| | | |
Horizon Therapeutics USA, Inc.: | | | | | | | | | | | | |
| | | |
Term Loan, 5.375%, (1 mo. USD LIBOR + 1.75%), 3/15/28 | | | | | | | 18,567 | | | | 18,236,530 | |
| | | |
Term Loan, 5.625%, (1 mo. USD LIBOR + 2.00%), 5/22/26 | | | | | | | 13,469 | | | | 13,246,881 | |
| | | |
Jazz Financing Lux S.a.r.l., Term Loan, 7.254%, (1 mo. USD LIBOR + 3.50%), 5/5/28 | | | | | | | 8,411 | | | | 8,327,955 | |
| | | |
Mallinckrodt International Finance S.A.: | | | | | | | | | | | | |
| | | |
Term Loan, 8.733%, (3 mo. USD LIBOR + 5.25%), 9/30/27 | | | | | | | 39,004 | | | | 31,764,179 | |
| | | |
Term Loan, 8.983%, (3 mo. USD LIBOR + 5.50%), 9/30/27 | | | | | | | 12,395 | | | | 10,122,805 | |
| | | |
PharmaZell GmbH, Term Loan, 5.193%, (1 mo. EURIBOR + 4.00%), 5/12/27 | | | EUR | | | | 1,950 | | | | 1,840,368 | |
| | | |
Recipharm AB, Term Loan, 3.539%, (3 mo. EURIBOR + 3.20%), 2/17/28 | | | EUR | | | | 15,275 | | | | 13,661,441 | |
| | | |
| | | | | | | | | | | $ | 149,580,643 | |
| | | | | | | | | | | | |
| | | | | | Principal | | | | |
| | | | | | Amount* | | | | |
| Borrower/Description | | | | | (000’s omitted) | | | Value | |
|
| Professional Services — 2.0% | |
| | | |
AlixPartners, LLP, Term Loan, 4.443%, (3 mo. EURIBOR + 3.25%), 2/4/28 | | | EUR | | | | 4,137 | | | $ | 3,873,749 | |
| | | |
APFS Staffing Holdings, Inc., Term Loan, 8.044%, (SOFR + 4.00%), 12/29/28(8) | | | | | | | 3,980 | | | | 3,860,600 | |
| | | |
Blitz 20-487 GmbH, Term Loan, 4.805%, (3 mo. EURIBOR + 3.20%), 4/28/28 | | | EUR | | | | 10,525 | | | | 9,790,250 | |
| | | |
Brown Group Holding, LLC: | | | | | | | | | | | | |
| | | |
Term Loan, 6.254%, (1 mo. USD LIBOR + 2.50%), 6/7/28 | | | | | | | 12,357 | | | | 12,027,781 | |
| | | |
Term Loan, 7.419%, (SOFR + 3.75%), 7/2/29 | | | | | | | 3,950 | | | | 3,912,475 | |
| | | |
CoreLogic, Inc., Term Loan, 7.313%, (1 mo. USD LIBOR + 3.50%), 6/2/28 | | | | | | | 22,523 | | | | 16,596,903 | |
| | | |
Deerfield Dakota Holding, LLC, Term Loan, 7.479%, (SOFR + 3.75%), 4/9/27 | | | | | | | 18,339 | | | | 17,390,398 | |
| | | |
EAB Global, Inc., Term Loan, 7.254%, (1 mo. USD LIBOR + 3.50%), 8/16/28 | | | | | | | 15,855 | | | | 15,177,378 | |
| | | |
Employbridge, LLC, Term Loan, 8.424%, (3 mo. USD LIBOR + 4.75%), 7/19/28 | | | | | | | 23,042 | | | | 19,766,955 | |
| | | |
First Advantage Holdings, LLC, Term Loan, 6.504%, (1 mo. USD LIBOR + 2.75%), 1/31/27 | | | | | | | 3,606 | | | | 3,566,278 | |
| | | |
Rockwood Service Corporation, Term Loan, 8.004%, (1 mo. USD LIBOR + 4.25%), 1/23/27 | | | | | | | 6,306 | | | | 6,164,093 | |
| | | |
Trans Union, LLC, Term Loan, 6.004%, (1 mo. USD LIBOR + 2.25%), 12/1/28 | | | | | | | 34,751 | | | | 34,259,056 | |
| | | |
Vaco Holdings, LLC, Term Loan, 8.708%, (SOFR + 5.00%), 1/21/29(8) | | | | | | | 3,970 | | | | 3,880,675 | |
| | | |
| | | | | | | | | | | $ | 150,266,591 | |
|
| Real Estate Management & Development — 0.7% | |
| | | |
Cushman & Wakefield U.S. Borrower, LLC, Term Loan, 6.504%, (1 mo. USD LIBOR + 2.75%), 8/21/25 | | | | | | | 36,918 | | | $ | 36,176,064 | |
| | | |
RE/MAX International, Inc., Term Loan, 6.313%, (1 mo. USD LIBOR + 2.50%), 7/21/28 | | | | | | | 18,071 | | | | 17,099,920 | |
| | | |
| | | | | | | | | | | $ | 53,275,984 | |
|
| Road & Rail — 2.2% | |
| | | |
Avis Budget Car Rental, LLC, Term Loan, 5.51%, (1 mo. USD LIBOR + 1.75%), 8/6/27 | | | | | | | 2,450 | | | $ | 2,378,431 | |
| | | |
Grab Holdings, Inc., Term Loan, 8.26%, (1 mo. USD LIBOR + 4.50%), 1/29/26 | | | | | | | 50,114 | | | | 47,365,791 | |
| | | |
Hertz Corporation, (The): | | | | | | | | | | | | |
| | | |
Term Loan, 7.01%, (1 mo. USD LIBOR + 3.25%), 6/30/28 | | | | | | | 14,562 | | | | 14,070,175 | |
| | | |
Term Loan, 7.01%, (1 mo. USD LIBOR + 3.25%), 6/30/28 | | | | | | | 2,779 | | | | 2,685,252 | |
| | | |
Kenan Advantage Group, Inc., Term Loan, 7.504%, (1 mo. USD LIBOR + 3.75%), 3/24/26 | | | | | | | 23,397 | | | | 22,370,539 | |
| | | | |
| | 41 | | See Notes to Financial Statements. |
Senior Debt Portfolio
October 31, 2022
Portfolio of Investments — continued
| | | | | | | | | | | | |
| | | | | | Principal | | | | |
| | | | | | Amount* | | | | |
| Borrower/Description | | | | | (000’s omitted) | | | Value | |
|
| Road & Rail (continued) | |
| | | |
Uber Technologies, Inc.: | | | | | | | | | | | | |
| | | |
Term Loan, 6.57%, (3 mo. USD LIBOR + 3.50%), 4/4/25 | | | | | | | 54,492 | | | $ | 54,173,793 | |
| | | |
Term Loan, 6.57%, (3 mo. USD LIBOR + 3.50%), 2/25/27 | | | | | | | 14,283 | | | | 14,154,194 | |
| | | |
XPO Logistics, Inc., Term Loan, 4.936%, (1 mo. USD LIBOR + 1.75%), 2/24/25 | | | | | | | 2,789 | | | | 2,752,602 | |
| | | |
| | | | | | | | | | | $ | 159,950,777 | |
|
| Semiconductors & Semiconductor Equipment — 1.5% | |
| | | |
Altar Bidco, Inc.: | | | | | | | | | | | | |
| | | |
Term Loan, 5.368%, (SOFR + 3.35%), 2/1/29(8) | | | | | | | 26,035 | | | $ | 24,423,850 | |
| | | |
Term Loan - Second Lien, 7.355%, (SOFR + 5.60%), 2/1/30 | | | | | | | 7,300 | | | | 6,302,331 | |
| | | |
Bright Bidco B.V., Term Loan, 12.094%, (SOFR + 8.00%), 10/31/27 | | | | | | | 4,040 | | | | 3,615,404 | |
| | | |
Entegris, Inc., Term Loan, 5.708%, (SOFR + 3.00%), 7/6/29 | | | | | | | 2,500 | | | | 2,491,015 | |
| | | |
MACOM Technology Solutions Holdings, Inc., Term Loan, 6.004%, (1 mo. USD LIBOR + 2.25%), 5/17/24 | | | | | | | 1,630 | | | | 1,602,785 | |
| | | |
MaxLinear, Inc., Term Loan, 5.882%, (1 mo. USD LIBOR + 2.25%), 6/23/28 | | | | | | | 3,900 | | | | 3,831,750 | |
| | | |
MKS Instruments, Inc.: | | | | | | | | | | | | |
| | | |
Term Loan, 3.913%, (1 mo. EURIBOR + 3.00%), 8/17/29 | | | EUR | | | | 6,075 | | | | 5,838,518 | |
| | | |
Term Loan, 6.317%, (SOFR + 2.75%), 8/17/29 | | | | | | | 53,430 | | | | 52,400,350 | |
| | | |
Synaptics Incorporated, Term Loan, 4.356%, (3 mo. USD LIBOR + 2.25%), 12/2/28 | | | | | | | 3,205 | | | | 3,173,012 | |
| | | |
Ultra Clean Holdings, Inc., Term Loan, 7.504%, (1 mo. USD LIBOR + 3.75%), 8/27/25 | | | | | | | 3,137 | | | | 3,105,832 | |
| | | |
| | | | | | | | | | | $ | 106,784,847 | |
|
| Software — 19.8% | |
| | | |
Applied Systems, Inc.: | | | | | | | | | | | | |
| | | |
Term Loan, 6.674%, (3 mo. USD LIBOR + 3.00%), 9/19/24 | | | | | | | 58,822 | | | $ | 58,171,324 | |
| | | |
Term Loan - Second Lien, 9.174%, (3 mo. USD LIBOR + 5.50%), 9/19/25 | | | | | | | 3,903 | | | | 3,856,225 | |
| | | |
AppLovin Corporation: | | | | | | | | | | | | |
| | | |
Term Loan, 6.674%, (3 mo. USD LIBOR + 3.00%), 10/25/28 | | | | | | | 19,403 | | | | 18,741,612 | |
| | | |
Term Loan, 7.004%, (1 mo. USD LIBOR + 3.25%), 8/15/25 | | | | | | | 51,653 | | | | 50,611,495 | |
| | | |
Aptean, Inc.: | | | | | | | | | | | | |
| | | |
Term Loan, 7.32%, (3 mo. USD LIBOR + 4.25%), 4/23/26 | | | | | | | 32,604 | | | | 31,299,597 | |
| | | |
Term Loan - Second Lien, 10.07%, (3 mo. USD LIBOR + 7.00%), 4/23/27 | | | | | | | 6,500 | | | | 6,207,500 | |
| | | | | | | | | | |
| | | | | Principal | | | | |
| | | | | Amount* | | | | |
| Borrower/Description | | | | (000’s omitted) | | | Value | |
|
| Software (continued) | |
| | | |
AQA Acquisition Holding, Inc., Term Loan, 7.32%, (3 mo. USD LIBOR + 4.25%), 3/3/28 | | | | | 5,227 | | | $ | 5,024,480 | |
| | | |
Astra Acquisition Corp.: | | | | | | | | | | |
| | | |
Term Loan, 9.004%, (1 mo. USD LIBOR + 5.25%), 10/25/28 | | | | | 14,219 | | | | 12,394,029 | |
| | | |
Term Loan - Second Lien, 12.629%, (1 mo. USD LIBOR + 8.88%), 10/25/29 | | | | | 21,995 | | | | 20,125,161 | |
| | | |
Banff Merger Sub, Inc.: | | | | | | | | | | |
| | | |
Term Loan, 5.133%, (3 mo. EURIBOR + 4.00%), 10/2/25 | | EUR | | | 5,969 | | | | 5,555,342 | |
| | | |
Term Loan, 7.504%, (1 mo. USD LIBOR + 3.75%), 10/2/25 | | | | | 24,175 | | | | 23,290,501 | |
| | | |
Term Loan - Second Lien, 9.254%, (1 mo. USD LIBOR + 5.50%), 2/27/26 | | | | | 15,700 | | | | 14,463,625 | |
| | | |
Cast and Crew Payroll, LLC: | | | | | | | | | | |
| | | |
Term Loan, 7.254%, (1 mo. USD LIBOR + 3.50%), 2/9/26 | | | | | 9,464 | | | | 9,325,777 | |
| | | |
Term Loan, 7.478%, (SOFR + 3.75%), 12/29/28 | | | | | 6,501 | | | | 6,413,516 | |
| | | |
CDK Global, Inc., Term Loan, 8.112%, (SOFR + 4.50%), 7/6/29 | | | | | 37,725 | | | | 37,012,412 | |
| | | |
CentralSquare Technologies, LLC, Term Loan, 7.424%, (3 mo. USD LIBOR + 3.75%), 8/29/25 | | | | | 22,190 | | | | 19,327,722 | |
| | | |
Ceridian HCM Holding, Inc., Term Loan, 6.254%, (1 mo. USD LIBOR + 2.50%), 4/30/25 | | | | | 22,798 | | | | 22,116,842 | |
| | | |
Cloudera, Inc.: | | | | | | | | | | |
| | | |
Term Loan, 7.504%, (1 mo. USD LIBOR + 3.75%), 10/8/28 | | | | | 34,192 | | | | 31,969,169 | |
| | | |
Term Loan - Second Lien, 9.754%, (1 mo. USD LIBOR + 6.00%), 10/8/29 | | | | | 9,450 | | | | 7,843,500 | |
| | | |
ConnectWise, LLC, Term Loan, 7.174%, (3 mo. USD LIBOR + 3.50%), 9/29/28 | | | | | 18,221 | | | | 17,273,131 | |
| | | |
Constant Contact, Inc., Term Loan, 7.909%, (3 mo. USD LIBOR + 4.00%), 2/10/28 | | | | | 15,503 | | | | 13,495,245 | |
| | | |
Cornerstone OnDemand, Inc., Term Loan, 7.504%, (1 mo. USD LIBOR + 3.75%), 10/16/28 | | | | | 17,164 | | | | 14,417,550 | |
| | | |
Delta TopCo, Inc., Term Loan, 5.836%, (3 mo. USD LIBOR + 3.75%), 12/1/27 | | | | | 16,679 | | | | 15,271,395 | |
| | | |
E2open, LLC, Term Loan, 6.644%, (3 mo. USD LIBOR + 3.50%), 2/4/28 | | | | | 20,268 | | | | 19,799,785 | |
| | | |
ECI Macola Max Holding, LLC, Term Loan, 7.424%, (3 mo. USD LIBOR + 3.75%), 11/9/27 | | | | | 29,575 | | | | 28,675,857 | |
| | | |
Epicor Software Corporation: | | | | | | | | | | |
| | | |
Term Loan, 7.004%, (1 mo. USD LIBOR + 3.25%), 7/30/27 | | | | | 70,465 | | | | 67,056,419 | |
| | | |
Term Loan - Second Lien, 11.504%, (1 mo. USD LIBOR + 7.75%), 7/31/28 | | | | | 7,650 | | | | 7,535,250 | |
| | | |
Finastra USA, Inc.: | | | | | | | | | | |
| | | |
Term Loan, 6.871%, (3 mo. USD LIBOR + 3.50%), 6/13/24 | | | | | 62,749 | | | | 56,991,893 | |
| | | | |
| | 42 | | See Notes to Financial Statements. |
Senior Debt Portfolio
October 31, 2022
Portfolio of Investments — continued
| | | | | | | | | | |
| | | | | Principal | | | | |
| | | | | Amount* | | | | |
| Borrower/Description | | | | (000’s omitted) | | | Value | |
|
| Software (continued) | |
| | | |
Finastra USA, Inc.: (continued) | | | | | | | | | | |
| | | |
Term Loan - Second Lien, 10.621%, (6 mo. USD LIBOR + 7.25%), 6/13/25 | | | | | 29,000 | | | $ | 21,677,500 | |
| | | |
Fiserv Investment Solutions, Inc., Term Loan, 6.961%, (3 mo. USD LIBOR + 4.00%), 2/18/27 | | | | | 6,509 | | | | 6,163,289 | |
| | | |
GoTo Group, Inc., Term Loan, 8.322%, (1 mo. USD LIBOR + 4.75%), 8/31/27 | | | | | 28,641 | | | | 18,473,273 | |
| | | |
Hyland Software, Inc.: | | | | | | | | | | |
| | | |
Term Loan, 7.254%, (1 mo. USD LIBOR + 3.50%), 7/1/24 | | | | | 57,743 | | | | 56,407,693 | |
| | | |
Term Loan - Second Lien, 10.004%, (1 mo. USD LIBOR + 6.25%), 7/7/25 | | | | | 7,940 | | | | 7,632,449 | |
| | | |
IGT Holding IV AB: | | | | | | | | | | |
| | | |
Term Loan, 4.093%, (3 mo. EURIBOR + 2.90%), 3/31/28 | | EUR | | | 6,205 | | | | 5,689,679 | |
| | | |
Term Loan, 7.074%, (3 mo. USD LIBOR + 3.40%), 3/31/28 | | | | | 1,674 | | | | 1,627,967 | |
| | | |
Imperva, Inc., Term Loan, 6.921%, (3 mo. USD LIBOR + 4.00%), 1/12/26 | | | | | 4,950 | | | | 4,004,611 | |
| | | |
Ivanti Software, Inc.: | | | | | | | | | | |
| | | |
Term Loan, 7.332%, (3 mo. USD LIBOR + 4.25%), 12/1/27 | | | | | 18,420 | | | | 13,906,775 | |
| | | |
Term Loan - Second Lien, 10.332%, (3 mo. USD LIBOR + 7.25%), 12/1/28 | | | | | 9,000 | | | | 6,045,003 | |
| | | |
MA FinanceCo., LLC, Term Loan, 7.418%, (3 mo. USD LIBOR + 4.25%), 6/5/25 | | | | | 14,307 | | | | 14,235,912 | |
| | | |
Magenta Buyer, LLC: | | | | | | | | | | |
| | | |
Term Loan, 9.17%, (3 mo. USD LIBOR + 4.75%), 7/27/28 | | | | | 56,497 | | | | 49,558,060 | |
| | | |
Term Loan - Second Lien, 12.67%, (3 mo. USD LIBOR + 8.25%), 7/27/29 | | | | | 17,275 | | | | 14,914,078 | |
| | | |
Marcel LUX IV S.a.r.l.: | | | | | | | | | | |
| | | |
Term Loan, 4.693%, (3 mo. EURIBOR + 3.50%), 3/16/26 | | EUR | | | 9,150 | | | | 8,584,709 | |
| | | |
Term Loan, 6.979%, (SOFR + 3.25%), 3/15/26 | | | | | 11,824 | | | | 11,616,805 | |
| | | |
Term Loan, 7.125%, (SOFR + 4.00%), 12/31/27 | | | | | 910 | | | | 894,050 | |
| | | |
Maverick Bidco, Inc.: | | | | | | | | | | |
| | | |
Term Loan, 8.165%, (3 mo. USD LIBOR + 3.75%), 5/18/28 | | | | | 12,035 | | | | 11,463,778 | |
| | | |
Term Loan - Second Lien, 11.165%, (3 mo. USD LIBOR + 6.75%), 5/18/29 | | | | | 3,325 | | | | 3,125,500 | |
| | | |
McAfee, LLC: | | | | | | | | | | |
| | | |
Term Loan, 5.604%, (EURIBOR + 4.00%), 3/1/29(8) | | EUR | | | 17,307 | | | | 15,987,279 | |
| | | |
Term Loan, 6.87%, (SOFR + 3.75%), 3/1/29 | | | | | 40,349 | | | | 36,885,610 | |
| | | |
Mediaocean, LLC, Term Loan, 7.254%, (1 mo. USD LIBOR + 3.50%), 12/15/28 | | | | | 5,597 | | | | 5,275,055 | |
| | | |
MH Sub I, LLC, Term Loan, 7.504%, (1 mo. USD LIBOR + 3.75%), 9/13/24 | | | | | 5,271 | | | | 5,084,527 | |
| | | | | | | | | | |
| | | | | Principal | | | | |
| | | | | Amount* | | | | |
| Borrower/Description | | | | (000’s omitted) | | | Value | |
|
| Software (continued) | |
| | | |
Mitnick Corporate Purchaser, Inc., Term Loan, 8.944%, (SOFR + 4.75%), 5/2/29 | | | | | 7,500 | | | $ | 7,164,375 | |
| | | |
N-Able International Holdings II, LLC, Term Loan, 6.07%, (3 mo. USD LIBOR + 3.00%), 7/19/28 | | | | | 1,648 | | | | 1,598,736 | |
| | | |
NortonLifeLock, Inc., Term Loan, 5.829%, (SOFR + 2.00%), 9/12/29 | | | | | 4,400 | | | | 4,304,142 | |
| | | |
Panther Commercial Holdings, L.P., Term Loan, 8.665%, (3 mo. USD LIBOR + 4.25%), 1/7/28 | | | | | 23,327 | | | | 21,125,511 | |
| | | |
Polaris Newco, LLC: | | | | | | | | | | |
| | | |
Term Loan, 5.193%, (3 mo. EURIBOR + 4.00%), 6/2/28 | | EUR | | | 9,257 | | | | 8,522,641 | |
| | | |
Term Loan, 7.674%, (3 mo. USD LIBOR + 4.00%), 6/2/28 | | | | | 7,850 | | | | 7,198,684 | |
| | | |
Proofpoint, Inc.: | | | | | | | | | | |
| | | |
Term Loan, 6.32%, (3 mo. USD LIBOR + 3.25%), 8/31/28 | | | | | 55,771 | | | | 53,165,441 | |
| | | |
Term Loan - Second Lien, 9.32%, (3 mo. USD LIBOR + 6.25%), 8/31/29 | | | | | 2,070 | | | | 2,009,624 | |
| | | |
Quest Software US Holdings, Inc., Term Loan, 8.494%, (SOFR + 4.25%), 2/1/29 | | | | | 32,269 | | | | 23,991,191 | |
| | | |
RealPage, Inc., Term Loan, 6.754%, (1 mo. USD LIBOR + 3.00%), 4/24/28 | | | | | 31,169 | | | | 29,361,024 | |
| | | |
Red Planet Borrower, LLC, Term Loan, 7.504%, (1 mo. USD LIBOR + 3.75%), 10/2/28 | | | | | 16,783 | | | | 10,357,499 | |
| | | |
Redstone Holdco 2 L.P., Term Loan, 9.108%, (3 mo. USD LIBOR + 4.75%), 4/27/28 | | | | | 20,908 | | | | 15,187,125 | |
| | | |
Sabre GLBL, Inc.: | | | | | | | | | | |
| | | |
Term Loan, 7.254%, (1 mo. USD LIBOR + 3.50%), 12/17/27 | | | | | 8,649 | | | | 7,762,318 | |
| | | |
Term Loan, 7.254%, (1 mo. USD LIBOR + 3.50%), 12/17/27 | | | | | 5,426 | | | | 4,869,528 | |
| | | |
Term Loan, 8.079%, (SOFR + 4.25%), 6/30/28 | | | | | 3,949 | | | | 3,517,108 | |
| | | |
Seattle Spinco, Inc., Term Loan, 6.504%, (1 mo. USD LIBOR + 2.75%), 6/21/24 | | | | | 14,726 | | | | 14,609,280 | |
| | | |
SkillSoft Corporation, Term Loan, 8.473%, (SOFR + 5.25%), 7/14/28 | | | | | 11,509 | | | | 9,569,819 | |
| | | |
SolarWinds Holdings, Inc., Term Loan, 6.504%, (1 mo. USD LIBOR + 2.75%), 2/5/24 | | | | | 55,099 | | | | 54,664,204 | |
| | | |
Sophia, L.P., Term Loan, 7.174%, (3 mo. USD LIBOR + 3.50%), 10/7/27 | | | | | 33,197 | | | | 32,076,179 | |
| | | |
Sovos Compliance, LLC, Term Loan, 8.254%, (1 mo. USD LIBOR + 4.50%), 8/11/28 | | | | | 13,258 | | | | 12,870,899 | |
| | | |
Sportradar Capital S.a.r.l., Term Loan, 4.443%, (1 mo. EURIBOR + 3.50%), 11/22/27 | | EUR | | | 8,408 | | | | 7,976,957 | |
| | | |
SS&C European Holdings S.a.r.l., Term Loan, 5.504%, (1 mo. USD LIBOR + 1.75%), 4/16/25 | | | | | 5,299 | | | | 5,196,807 | |
| | | |
SS&C Technologies, Inc.: | | | | | | | | | | |
| | | |
Term Loan, 5.504%, (1 mo. USD LIBOR + 1.75%), 4/16/25 | | | | | 6,528 | | | | 6,401,620 | |
| | | | |
| | 43 | | See Notes to Financial Statements. |
Senior Debt Portfolio
October 31, 2022
Portfolio of Investments — continued
| | | | | | | | | | | | |
| | | | | | Principal | | | | |
| | | | | | Amount* | | | | |
| Borrower/Description | | | | | (000’s omitted) | | | Value | |
|
| Software (continued) | |
| | | |
SS&C Technologies, Inc.: (continued) | | | | | | | | | | | | |
| | | |
Term Loan, 5.504%, (1 mo. USD LIBOR + 1.75%), 4/16/25 | | | | | | | 5,089 | | | $ | 4,984,649 | |
| | | |
Term Loan, 6.079%, (SOFR + 2.25%), 3/22/29 | | | | | | | 3,726 | | | | 3,663,806 | |
| | | |
Term Loan, 6.079%, (SOFR + 2.25%), 3/22/29 | | | | | | | 5,615 | | | | 5,520,515 | |
| | | |
SurveyMonkey, Inc., Term Loan, 7.51%, (1 mo. USD LIBOR + 3.75%), 10/10/25 | | | | | | | 9,541 | | | | 9,255,035 | |
| | | |
Turing Midco, LLC, Term Loan, 6.504%, (1 mo. USD LIBOR + 2.75%), 3/23/28 | | | | | | | 988 | | | | 973,228 | |
| | | |
Ultimate Software Group, Inc. (The): | | | | | | | | | | | | |
| | | |
Term Loan, 6.998%, (3 mo. USD LIBOR + 3.25%), 5/4/26 | | | | | | | 57,158 | | | | 55,287,181 | |
| | | |
Term Loan, 7.504%, (1 mo. USD LIBOR + 3.75%), 5/4/26 | | | | | | | 21,191 | | | | 20,642,507 | |
| | | |
Term Loan - Second Lien, 8.998%, (1 mo. USD LIBOR + 5.25%), 5/3/27 | | | | | | | 5,550 | | | | 5,138,373 | |
| | | |
Veritas US, Inc., Term Loan, 8.674%, (3 mo. USD LIBOR + 5.00%), 9/1/25 | | | | | | | 20,046 | | | | 16,053,322 | |
| | | |
Vision Solutions, Inc., Term Loan, 8.358%, (3 mo. USD LIBOR + 4.00%), 4/24/28 | | | | | | | 39,657 | | | | 33,807,894 | |
| | | |
VS Buyer, LLC, Term Loan, 6.754%, (1 mo. USD LIBOR + 3.00%), 2/28/27 | | | | | | | 17,472 | | | | 17,035,560 | |
| | | |
| | | | | | | | | | | $ | 1,459,382,738 | |
|
| Specialty Retail — 2.7% | |
| | | |
Belron Finance US, LLC, Term Loan, 5.375%, (3 mo. USD LIBOR + 2.50%), 4/13/28 | | | | | | | 8,594 | | | $ | 8,471,925 | |
| | | |
Belron Luxembourg S.a.r.l., Term Loan, 2.769%, (3 mo. EURIBOR + 2.50%), 4/13/28 | | | EUR | | | | 3,925 | | | | 3,634,026 | |
| | | |
Boels Topholding B.V., Term Loan, 3.571%, (3 mo. EURIBOR + 3.25%), 2/6/27 | | | EUR | | | | 8,800 | | | | 8,255,245 | |
| | | |
David’s Bridal, Inc.: | | | | | | | | | | | | |
| | | |
Term Loan, 9.754%, (1 mo. USD LIBOR + 6.00%), 6/30/23 | | | | | | | 3,272 | | | | 3,062,617 | |
| | | |
Term Loan, 14.28%, (3 mo. USD LIBOR + 10.00%), 9.28% cash, 5.00% PIK, 6/23/23 | | | | | | | 2,730 | | | | 2,631,001 | |
| | | |
Great Outdoors Group, LLC, Term Loan, 7.504%, (1 mo. USD LIBOR + 3.75%), 3/6/28 | | | | | | | 48,192 | | | | 45,521,760 | |
| | | |
Harbor Freight Tools USA, Inc., Term Loan, 6.504%, (1 mo. USD LIBOR + 2.75%), 10/19/27 | | | | | | | 40,641 | | | | 38,197,055 | |
| | | |
L1R HB Finance Limited: | | | | | | | | | | | | |
| | | |
Term Loan, 6.016%, (6 mo. EURIBOR + 4.25%), 9/2/24 | | | EUR | | | | 8,523 | | | | 6,337,964 | |
| | | |
Term Loan, 7.217%, (SONIA + 5.25%), 9/2/24 | | | GBP | | | | 6,773 | | | | 5,864,148 | |
| | | |
Les Schwab Tire Centers, Term Loan, 6.58%, (3 mo. USD LIBOR + 3.25%), 11/2/27 | | | | | | | 34,391 | | | | 33,488,514 | |
| | | |
LIDS Holdings, Inc., Term Loan, 8.99%, (SOFR + 5.50%), 12/14/26 | | | | | | | 6,412 | | | | 5,419,826 | |
| | | | | | | | | | | | |
| | | | | | Principal | | | | |
| | | | | | Amount* | | | | |
| Borrower/Description | | | | | (000’s omitted) | | | Value | |
|
| Specialty Retail (continued) | |
| | | |
Mattress Firm, Inc., Term Loan, 8.433%, (3 mo. USD LIBOR + 4.25%), 9/25/28 | | | | | | | 18,290 | | | $ | 15,712,459 | |
| | | |
PetSmart, Inc., Term Loan, 7.50%, (1 mo. USD LIBOR + 3.75%), 2/11/28 | | | | | | | 23,305 | | | | 22,484,038 | |
| | | |
| | | | | | | | | | | $ | 199,080,578 | |
|
| Technology Hardware, Storage & Peripherals — 0.1% | |
| | | |
NCR Corporation, Term Loan, 6.92%, (3 mo. USD LIBOR + 2.50%), 8/28/26 | | | | | | | 9,022 | | | $ | 8,690,879 | |
| | | |
| | | | | | | | | | | $ | 8,690,879 | |
|
| Thrifts & Mortgage Finance — 0.2% | |
| | | |
Ditech Holding Corporation, Term Loan, 0.00%, 6/30/23(11) | | | | | | | 18,677 | | | $ | 2,334,566 | |
| | | |
Walker & Dunlop, Inc., Term Loan, 6.079%, (SOFR + 2.25%), 12/16/28 | | | | | | | 14,118 | | | | 13,906,538 | |
| | | |
| | | | | | | | | | | $ | 16,241,104 | |
|
| Trading Companies & Distributors — 3.2% | |
| | | |
American Builders & Contractors Supply Co., Inc., Term Loan, 5.754%, (1 mo. USD LIBOR + 2.00%), 1/15/27 | | | | | | | 23,057 | | | $ | 22,633,586 | |
| | | |
Avolon TLB Borrower 1 (US), LLC: | | | | | | | | | | | | |
| | | |
Term Loan, 5.239%, (1 mo. USD LIBOR + 1.75%), 1/15/25 | | | | | | | 22,425 | | | | 22,048,861 | |
| | | |
Term Loan, 5.739%, (1 mo. USD LIBOR + 2.25%), 12/1/27 | | | | | | | 16,979 | | | | 16,692,294 | |
| | | |
Beacon Roofing Supply, Inc., Term Loan, 6.004%, (1 mo. USD LIBOR + 2.25%), 5/19/28 | | | | | | | 5,225 | | | | 5,120,745 | |
| | | |
Core & Main L.P., Term Loan, 6.528%, (USD LIBOR + 2.50%), 7/27/28(8) | | | | | | | 11,815 | | | | 11,552,815 | |
| | | |
DXP Enterprises, Inc., Term Loan, 8.504%, (1 mo. USD LIBOR + 4.75%), 12/16/27 | | | | | | | 5,158 | | | | 4,930,848 | |
| | | |
Electro Rent Corporation, Term Loan, 9.278%, (3 mo. USD LIBOR + 5.00%), 1/31/24 | | | | | | | 22,153 | | | | 20,915,667 | |
| | | |
Hillman Group, Inc. (The): | | | | | | | | | | | | |
| | | |
Term Loan, 3.034%, (1 mo. USD LIBOR + 2.75%), 7/14/28(9) | | | | | | | 988 | | | | 946,653 | |
| | | |
Term Loan, 6.326%, (1 mo. USD LIBOR + 2.75%), 7/14/28 | | | | | | | 4,088 | | | | 3,915,885 | |
| | | |
Park River Holdings, Inc., Term Loan, 6.993%, (3 mo. USD LIBOR + 3.25%), 12/28/27 | | | | | | | 12,810 | | | | 10,916,001 | |
| | | |
Patagonia Bidco Limited: | | | | | | | | | | | | |
| | | |
Term Loan, 6.94%, (SONIA + 5.25%), 3/5/29 | | | GBP | | | | 16,965 | | | | 16,148,393 | |
| | | |
Term Loan, 6.94%, (SONIA + 5.25%), 3/5/29 | | | GBP | | | | 3,085 | | | | 2,936,071 | |
| | | |
Quimper AB, Term Loan, 4.085%, (3 mo. EURIBOR + 2.93%), 2/16/26 | | | EUR | | | | 27,350 | | | | 24,956,425 | |
| | | | |
| | 44 | | See Notes to Financial Statements. |
Senior Debt Portfolio
October 31, 2022
Portfolio of Investments — continued
| | | | | | | | | | | | |
| | | | | | Principal | | | | |
| | | | | | Amount* | | | | |
| Borrower/Description | | | | | (000’s omitted) | | | Value | |
|
| Trading Companies & Distributors (continued) | |
| | | |
SiteOne Landscape Supply, LLC, Term Loan, 5.76%, (1 mo. USD LIBOR + 2.00%), 3/23/28 | | | | | | | 3,802 | | | $ | 3,769,999 | |
| | | |
Spin Holdco, Inc., Term Loan, 7.144%, (3 mo. USD LIBOR + 4.00%), 3/4/28 | | | | | | | 54,340 | | | | 48,111,099 | |
| | | |
SRS Distribution, Inc.: | | | | | | | | | | | | |
| | | |
Term Loan, 7.254%, (1 mo. USD LIBOR + 3.50%), 6/2/28 | | | | | | | 16,460 | | | | 15,332,165 | |
| | | |
Term Loan, 7.329%, (SOFR + 3.50%), 6/2/28 | | | | | | | 5,409 | | | | 5,037,248 | |
| | | |
| | | | | | | | | | | $ | 235,964,755 | |
|
| Wireless Telecommunication Services — 0.4% | |
| | | |
CCI Buyer, Inc., Term Loan, 7.553%, (SOFR + 4.00%), 12/17/27 | | | | | | | 17,095 | | | $ | 16,435,967 | |
| | | |
Digicel International Finance Limited, Term Loan, 7.004%, (1 mo. USD LIBOR + 3.25%), 5/28/24 | | | | | | | 19,120 | | | | 16,459,132 | |
| | | |
| | | | | | | | | | | $ | 32,895,099 | |
| |
Total Senior Floating-Rate Loans
(identified cost $8,971,504,229) | | | $ | 8,161,228,360 | |
|
| Warrants — 0.0% | |
| Security | | | Shares | | | Value | |
|
| Leisure Goods/Activities/Movies — 0.0% | |
| | | |
Cineworld Group PLC, Exp. 11/23/25(5)(6) | | | | | | | 2,180,552 | | | $ | 0 | |
| | | |
| | | | | | | | | | | $ | 0 | |
|
| Retailers (Except Food and Drug) — 0.0% | |
| | | |
David’s Bridal, LLC, Exp. 11/26/22(4)(5)(6) | | | | | | | 37,742 | | | $ | 0 | |
| | | |
| | | | | | | | | | | $ | 0 | |
| |
Total Warrants
(identified cost $0) | | | $ | 0 | |
| | | | | | | | | | |
| Short-Term Investments — 1.2% | |
| Security | | Shares | | | Value | |
| | | |
Morgan Stanley Institutional Liquidity Funds - Government Portfolio, Institutional Class, 2.88%(12) | | | | | 86,209,963 | | | $ | 86,209,963 | |
| |
Total Short-Term Investments
(identified cost $86,209,963) | | | $ | 86,209,963 | |
| |
Total Investments — 125.2%
(identified cost $10,212,887,319) | | | $ | 9,226,575,107 | |
| |
Less Unfunded Loan Commitments — (0.2)% | | | $ | (17,523,253 | ) |
| |
Net Investments — 125.0%
(identified cost $10,195,364,066) | | | $ | 9,209,051,854 | |
| |
Other Assets, Less Liabilities — (25.0)% | | | $ | (1,839,546,663 | ) |
| |
Net Assets — 100.0% | | | $ | 7,369,505,191 | |
The percentage shown for each investment category in the Portfolio of Investments is based on net assets.
| | * | In U.S. dollars unless otherwise indicated. |
| | (1) | Security exempt from registration under Rule 144A of the Securities Act of 1933, as amended. These securities may be sold in certain transactions in reliance on an exemption from registration (normally to qualified institutional buyers). At October 31, 2022, the aggregate value of these securities is $896,742,046 or 12.2% of the Portfolio’s net assets. |
| | (2) | Variable rate security. The stated interest rate represents the rate in effect at October 31, 2022. |
| | (3) | Amount is less than 0.05%. |
| | (4) | For fair value measurement disclosure purposes, security is categorized as Level 3 (see Note 8). |
| | (5) | Non-income producing security. |
| | (6) | Security was acquired in connection with a restructuring of a Senior Loan and may be subject to restrictions on resale. |
| | (7) | Senior floating-rate loans (Senior Loans) often require prepayments from excess cash flows or permit the borrowers to repay at their election. The degree to which borrowers repay, whether as a contractual requirement or at their election, cannot be predicted with accuracy. As a result, the actual remaining maturity may be substantially less than the stated maturities shown. However, Senior Loans will typically have an expected average life of approximately two to four years. Senior Loans typically have rates of interest which are redetermined periodically by reference to a base lending rate, plus a spread. These base lending rates are primarily the London Interbank Offered Rate (“LIBOR”) or the Secured Overnight Financing Rate (“SOFR”) and secondarily, the prime rate offered by one or more major United States banks (the “Prime Rate”). Base lending rates may be subject to a floor, or minimum rate. Rates for SOFR are generally 1 or 3-month tenors and may also be subject to a credit spread adjustment. Senior Loans are generally subject to contractual restrictions that must be satisfied before they can be bought or sold. |
| | | | |
| | 45 | | See Notes to Financial Statements. |
Senior Debt Portfolio
October 31, 2022
Portfolio of Investments — continued
| | (8) | The stated interest rate represents the weighted average interest rate at October 31, 2022 of contracts within the senior loan facility. Interest rates on contracts are primarily redetermined either weekly, monthly or quarterly by reference to the indicated base lending rate and spread and the reset period. |
| | (9) | Unfunded or partially unfunded loan commitments. The stated interest rate reflects the weighted average of the reference rate and spread for the funded portion, if any, and the commitment fees on the portion of the loan that is unfunded. At October 31, 2022, the total value of unfunded loan commitments is $15,328,757. See Note 1F for description. |
| | (10) | This Senior Loan will settle after October 31, 2022, at which time the interest rate will be determined. |
| | (11) | Issuer is in default with respect to interest and/or principal payments or has declared bankruptcy. For a variable rate security, interest rate has been adjusted to reflect non-accrual status. |
| | (12) | May be deemed to be an affiliated investment company. The rate shown is the annualized seven-day yield as of October 31, 2022. |
| | | | | | | | | | | | | | | | | | | | | | | | |
| Forward Foreign Currency Exchange Contracts (OTC) | |
| Currency Purchased | | | Currency Sold | | | Counterparty | | Settlement
Date | | | Unrealized
Appreciation | | | Unrealized
(Depreciation) | |
| | | | | | | |
| USD | | | 306,654,284 | | | EUR | | | 312,407,318 | | | Standard Chartered Bank | | | 11/2/22 | | | $ | — | | | $ | (2,082,158 | ) |
| | | | | | | |
| USD | | | 309,418,873 | | | EUR | | | 312,407,318 | | | Standard Chartered Bank | | | 12/2/22 | | | | 25,127 | | | | — | |
| | | | | | | |
| USD | | | 48,337,258 | | | EUR | | | 49,530,320 | | | Bank of America, N.A. | | | 12/30/22 | | | | — | | | | (856,678 | ) |
| | | | | | | |
| USD | | | 48,348,269 | | | EUR | | | 49,530,320 | | | State Street Bank and Trust Company | | | 12/30/22 | | | | — | | | | (845,668 | ) |
| | | | | | | |
| USD | | | 60,722,247 | | | EUR | | | 62,214,875 | | | State Street Bank and Trust Company | | | 12/30/22 | | | | — | | | | (1,070,098 | ) |
| | | | | | | |
| USD | | | 48,086,789 | | | EUR | | | 49,530,320 | | | State Street Bank and Trust Company | | | 12/30/22 | | | | — | | | | (1,107,148 | ) |
| | | | | | | |
| USD | | | 72,531,601 | | | EUR | | | 74,295,480 | | | State Street Bank and Trust Company | | | 12/30/22 | | | | — | | | | (1,259,304 | ) |
| | | | | | | |
| USD | | | 38,429,945 | | | EUR | | | 38,223,260 | | | Bank of America, N.A. | | | 1/31/23 | | | | 373,090 | | | | — | |
| | | | | | | |
| USD | | | 24,057,737 | | | EUR | | | 23,889,538 | | | Bank of America, N.A. | | | 1/31/23 | | | | 272,203 | | | | — | |
| | | | | | | |
| USD | | | 24,035,369 | | | EUR | | | 23,889,538 | | | Bank of America, N.A. | | | 1/31/23 | | | | 249,835 | | | | — | |
| | | | | | | |
| USD | | | 24,085,284 | | | EUR | | | 23,889,538 | | | Standard Chartered Bank | | | 1/31/23 | | | | 299,750 | | | | — | |
| | | | | | | |
| USD | | | 3,860,661 | | | EUR | | | 3,830,163 | | | Standard Chartered Bank | | | 1/31/23 | | | | 47,172 | | | | — | |
| | | | | | | |
| USD | | | 41,724,966 | | | EUR | | | 41,447,006 | | | State Street Bank and Trust Company | | | 1/31/23 | | | | 458,401 | | | | — | |
| | | | | | | |
| USD | | | 38,484,516 | | | EUR | | | 38,223,260 | | | State Street Bank and Trust Company | | | 1/31/23 | | | | 427,662 | | | | — | |
| | | | | | | |
| USD | | | 38,459,984 | | | EUR | | | 38,223,260 | | | State Street Bank and Trust Company | | | 1/31/23 | | | | 403,130 | | | | — | |
| | | | | | | |
| USD | | | 38,426,176 | | | EUR | | | 38,223,260 | | | State Street Bank and Trust Company | | | 1/31/23 | | | | 369,321 | | | | — | |
| | | | | | | |
| USD | | | 24,034,309 | | | EUR | | | 23,889,538 | | | State Street Bank and Trust Company | | | 1/31/23 | | | | 248,774 | | | | — | |
| | | | | | | |
| USD | | | 29,828,199 | | | GBP | | | 25,674,364 | | | State Street Bank and Trust Company | | | 1/31/23 | | | | 294,754 | | | | — | |
| | | | | | | |
| USD | | | 22,633,338 | | | GBP | | | 19,506,055 | | | State Street Bank and Trust Company | | | 1/31/23 | | | | 195,352 | | | | — | |
| | | | | | | |
| | | | | | | | | | | | | | | | | | | $ | 3,664,571 | | | $ | (7,221,054 | ) |
Abbreviations:
| | | | |
| | |
| DIP | | – | | Debtor In Possession |
| | |
| EURIBOR | | – | | Euro Interbank Offered Rate |
| | |
| LIBOR | | – | | London Interbank Offered Rate |
| | |
| LOC | | – | | Letter of Credit |
| | |
| OTC | | – | | Over-the-counter |
| | |
| PIK | | – | | Payment In Kind |
| | |
| SOFR | | – | | Secured Overnight Financing Rate |
| | |
| SONIA | | – | | Sterling Overnight Interbank Average |
Currency Abbreviations:
| | | | |
| | |
| EUR | | – | | Euro |
| | |
| GBP | | – | | British Pound Sterling |
| | |
| USD | | – | | United States Dollar |
| | | | |
| | 46 | | See Notes to Financial Statements. |
Senior Debt Portfolio
October 31, 2022
Statement of Assets and Liabilities
| | | | |
| Assets | | October 31, 2022 | |
| |
Unaffiliated investments, at value (identified cost $10,109,154,103) | | $ | 9,122,841,891 | |
| |
Affiliated investment, at value (identified cost $86,209,963) | | | 86,209,963 | |
| |
Cash | | | 74,833,804 | |
| |
Deposits for derivatives collateral — forward foreign currency exchange contracts | | | 10,190,000 | |
| |
Foreign currency, at value (identified cost $2,587,299) | | | 2,584,254 | |
| |
Interest receivable | | | 46,051,289 | |
| |
Dividends receivable from affiliated investment | | | 295,562 | |
| |
Receivable for investments sold | | | 131,742,983 | |
| |
Receivable for open forward foreign currency exchange contracts | | | 3,664,571 | |
| |
Prepaid upfront fees on notes payable | | | 1,470,929 | |
| |
Prepaid expenses | | | 91,621 | |
| |
Total assets | | $ | 9,479,976,867 | |
|
| Liabilities | |
| |
Notes payable | | $ | 2,075,000,000 | |
| |
Payable for investments purchased | | | 17,782,879 | |
| |
Payable for open forward foreign currency exchange contracts | | | 7,221,054 | |
| |
Payable to affiliates: | | | | |
| |
Investment adviser fee | | | 3,342,669 | |
| |
Trustees’ fees | | | 9,042 | |
| |
Accrued expenses | | | 7,116,032 | |
| |
Total liabilities | | $ | 2,110,471,676 | |
| |
Net Assets applicable to investors’ interest in Portfolio | | $ | 7,369,505,191 | |
| | | | |
| | 47 | | See Notes to Financial Statements. |
Senior Debt Portfolio
October 31, 2022
Statement of Operations
| | | | |
| Investment Income | | Year Ended October 31, 2022 | |
| |
Dividend income | | $ | 3,511,633 | |
| |
Dividend income from affiliated investments | | | 1,174,436 | |
| |
Interest and other income | | | 536,679,907 | |
| |
Total investment income | | $ | 541,365,976 | |
| |
| Expenses | | | | |
| |
Investment adviser fee | | $ | 43,097,659 | |
| |
Trustees’ fees and expenses | | | 108,500 | |
| |
Custodian fee | | | 1,660,753 | |
| |
Legal and accounting services | | | 296,208 | |
| |
Interest expense and fees | | | 41,773,533 | |
| |
Miscellaneous | | | 417,788 | |
| |
Total expenses | | $ | 87,354,441 | |
| |
Deduct: | | | | |
| |
Waiver and/or reimbursement of expenses by affiliate | | $ | 99,493 | |
| |
Total expense reductions | | $ | 99,493 | |
| |
Net expenses | | $ | 87,254,948 | |
| |
Net investment income | | $ | 454,111,028 | |
| |
| Realized and Unrealized Gain (Loss) | | | | |
| |
Net realized gain (loss): | | | | |
| |
Investment transactions | | $ | (136,245,567 | ) |
| |
Investment transactions - affiliated investment | | | (845 | ) |
| |
Foreign currency transactions | | | 13,378,894 | |
| |
Forward foreign currency exchange contracts | | | 184,053,316 | |
| |
Net realized gain | | $ | 61,185,798 | |
| |
Change in unrealized appreciation (depreciation): | | | | |
| |
Investments | | $ | (920,250,385 | ) |
| |
Foreign currency | | | (1,311,602 | ) |
| |
Forward foreign currency exchange contracts | | | (12,090,696 | ) |
| |
Net change in unrealized appreciation (depreciation) | | $ | (933,652,683 | ) |
| |
Net realized and unrealized loss | | $ | (872,466,885 | ) |
| |
Net decrease in net assets from operations | | $ | (418,355,857 | ) |
| | | | |
| | 48 | | See Notes to Financial Statements. |
Senior Debt Portfolio
October 31, 2022
Statements of Changes in Net Assets
| | | | | | | | |
| | | Year Ended October 31, | |
| Increase (Decrease) in Net Assets | | 2022 | | | 2021 | |
| | |
From operations: | | | | | | | | |
| | |
Net investment income | | $ | 454,111,028 | | | $ | 288,686,903 | |
| | |
Net realized gain (loss) | | | 61,185,798 | | | | (6,964,197 | ) |
| | |
Net change in unrealized appreciation (depreciation) | | | (933,652,683 | ) | | | 297,665,446 | |
| | |
Net increase (decrease) in net assets from operations | | $ | (418,355,857 | ) | | $ | 579,388,152 | |
| | |
Capital transactions: | | | | | | | | |
| | |
Contributions | | $ | 2,156,822,498 | | | $ | 2,717,828,706 | |
| | |
Withdrawals | | | (2,792,514,701 | ) | | | (323,097,860 | ) |
| | |
Net increase (decrease) in net assets from capital transactions | | $ | (635,692,203 | ) | | $ | 2,394,730,846 | |
| | |
Net increase (decrease) in net assets | | $ | (1,054,048,060 | ) | | $ | 2,974,118,998 | |
|
| Net Assets | |
| | |
At beginning of year | | $ | 8,423,553,251 | | | $ | 5,449,434,253 | |
| | |
At end of year | | $ | 7,369,505,191 | | | $ | 8,423,553,251 | |
| | | | |
| | 49 | | See Notes to Financial Statements. |
Senior Debt Portfolio
October 31, 2022
Statement of Cash Flows
| | | | |
| Cash Flows From Operating Activities | | Year Ended October 31, 2022 | |
| |
Net decrease in net assets from operations | | $ | (418,355,857 | ) |
| |
Adjustments to reconcile net decrease in net assets from operations to net cash used in operating activities: | | | | |
| |
Investments purchased | | | (3,628,745,573 | ) |
| |
Investments sold and principal repayments | | | 2,836,139,278 | |
| |
Decrease in short-term investments, net | | | 9,877,268 | |
| |
Net amortization/accretion of premium (discount) | | | (11,512,750 | ) |
| |
Amortization of prepaid upfront fees on notes payable | | | 3,909,381 | |
| |
Increase in interest receivable | | | (16,913,822 | ) |
| |
Increase in dividends receivable from affiliated investments | | | (292,762 | ) |
| |
Decrease in receivable for open forward foreign currency exchange contracts | | | 4,905,894 | |
| |
Decrease in prepaid expenses | | | 28,025 | |
| |
Increase in payable for open forward foreign currency exchange contracts | | | 7,184,802 | |
| |
Decrease in payable to affiliate for investment adviser fee | | | (10,309 | ) |
| |
Increase in accrued expenses | | | 4,241,832 | |
| |
Decrease in unfunded loan commitments | | | (4,967,527 | ) |
| |
Net change in unrealized (appreciation) depreciation from investments | | | 920,250,385 | |
| |
Net realized loss from investments | | | 136,246,412 | |
| |
Net cash used in operating activities | | $ | (158,015,323 | ) |
| |
| Cash Flows From Financing Activities | | | | |
| |
Proceeds from capital contributions | | $ | 2,156,822,498 | |
| |
Payments for capital withdrawals | | | (2,792,514,701 | ) |
| |
Proceeds from notes payable | | | 1,900,000,000 | |
| |
Repayments of notes payable | | | (1,200,000,000 | ) |
| |
Payment of prepaid upfront fees on notes payable | | | (3,937,500 | ) |
| |
Net cash provided by financing activities | | $ | 60,370,297 | |
| |
Net decrease in cash and restricted cash* | | $ | (97,645,026 | ) |
| |
Cash and restricted cash at beginning of year (including foreign currency) | | $ | 185,253,084 | |
| |
Cash and restricted cash at end of year (including foreign currency) | | $ | 87,608,058 | |
|
| Supplemental disclosure of cash flow information: | |
| |
Cash paid for interest and fees on borrowings | | $ | 37,375,557 | |
| * | Includes net change in unrealized appreciation (depreciation) on foreign currency of $40,876. |
The following table provides a reconciliation of cash and restricted cash reported within the Statement of Assets and Liabilities that sum to the total of such amounts shown on the Statement of Cash Flows.
| | | | |
| | | October 31, 2022 | |
| |
Cash | | $ | 74,833,804 | |
| |
Deposits for derivatives collateral — forward foreign currency exchange contracts | | | 10,190,000 | |
| |
Foreign currency | | | 2,584,254 | |
| |
Total cash and restricted cash as shown on the Statement of Cash Flows | | $ | 87,608,058 | |
| | | | |
| | 50 | | See Notes to Financial Statements. |
Senior Debt Portfolio
October 31, 2022
Financial Highlights
| | | | | | | | | | | | | | | | | | | | |
| | | Year Ended October 31, | |
| Ratios/Supplemental Data | | 2022 | | | 2021 | | | 2020 | | | 2019 | | | 2018 | |
| | | | | |
Ratios (as a percentage of average daily net assets): | | | | | | | | | | | | | | | | | | | | |
| | | | | |
Expenses excluding interest and fees | | | 0.52 | % | | | 0.53 | % | | | 0.56 | % | | | 0.55 | % | | | 0.51 | % |
| | | | | |
Interest and fee expense | | | 0.47 | % | | | 0.32 | % | | | 0.60 | % | | | 0.88 | % | | | 0.47 | % |
| | | | | |
Total expenses | | | 0.99 | %(1) | | | 0.85 | % | | | 1.16 | % | | | 1.43 | % | | | 0.98 | % |
| | | | | |
Net investment income | | | 5.16 | % | | | 4.19 | % | | | 4.86 | % | | | 5.63 | % | | | 4.92 | % |
| | | | | |
Portfolio Turnover | | | 27 | % | | | 28 | % | | | 30 | % | | | 17 | % | | | 29 | % |
| | | | | |
Total Return | | | (4.22 | )% | | | 9.75 | % | | | 0.39 | % | | | 2.04 | % | | | 5.41 | % |
| | | | | |
Net assets, end of year (000’s omitted) | | $ | 7,369,505 | | | $ | 8,423,553 | | | $ | 5,449,434 | | | $ | 7,343,453 | | | $ | 10,969,159 | |
| (1) | Includes a reduction by the investment adviser of a portion of its adviser fee due to the Portfolio’s investment in the Liquidity Fund (equal to less than 0.005% of average daily net assets for the year ended October 31, 2022). |
Senior Debt Portfolio
October 31, 2022
Notes to Financial Statements
1 Significant Accounting Policies
Senior Debt Portfolio (the Portfolio) is a Massachusetts business trust registered under the Investment Company Act of 1940, as amended (the 1940 Act), as an open-end management investment company. The Portfolio’s investment objective is to provide a high level of current income. The Declaration of Trust permits the Trustees to issue interests in the Portfolio. At October 31, 2022, Eaton Vance Floating-Rate Advantage Fund, Eaton Vance Short Duration Strategic Income Fund and Eaton Vance Short Duration Inflation-Protected Income Fund held an interest of 94.6%, 1.9% and 3.5%, respectively, in the Portfolio.
The following is a summary of significant accounting policies of the Portfolio. The policies are in conformity with accounting principles generally accepted in the United States of America (U.S. GAAP). The Portfolio is an investment company and follows accounting and reporting guidance in the Financial Accounting Standards Board (FASB) Accounting Standards Codification Topic 946.
A Investment Valuation — The following methodologies are used to determine the market value or fair value of investments.
Senior Floating-Rate Loans. Interests in senior floating-rate loans (Senior Loans) are valued generally at the average mean of bid and ask quotations obtained from a third party pricing service. Senior Loans, for which a valuation is not available or deemed unreliable, are fair valued by the investment adviser utilizing one or more of the valuation techniques described below to assess the likelihood that the borrower will make a full repayment of the loan underlying such Senior Loan. If the investment adviser believes that there is a reasonable likelihood of full repayment, the investment adviser will determine fair value using a matrix pricing approach that considers the yield on the Senior Loan relative to yields on other Senior Loans issued by companies of comparable credit quality. If the investment adviser believes there is not a reasonable likelihood of full repayment, the investment adviser will determine fair value using analyses that include, but are not limited to: (i) a comparison of the value of the borrower’s outstanding equity and debt to that of comparable public companies; (ii) a discounted cash flow analysis; or (iii) when the investment adviser believes it is likely that a borrower will be liquidated or sold, an analysis of the terms of such liquidation or sale. In certain cases, the investment adviser will use a combination of analytical methods to determine fair value, such as when only a portion of a borrower’s assets are likely to be sold. In conducting its assessment and analyses for purposes of determining fair value of a Senior Loan, the investment adviser will use its discretion and judgment in considering and appraising relevant factors. Junior Loans (i.e., subordinated loans and second lien loans) are valued in the same manner as Senior Loans.
Debt Obligations. Debt obligations are generally valued on the basis of valuations provided by third party pricing services, as derived from such services’ pricing models. Inputs to the models may include, but are not limited to, reported trades, executable bid and ask prices, broker/dealer quotations, prices or yields of securities with similar characteristics, interest rates, anticipated prepayments, benchmark curves or information pertaining to the issuer, as well as industry and economic events. The pricing services may use a matrix approach, which considers information regarding securities with similar characteristics to determine the valuation for a security. Short-term debt obligations purchased with a remaining maturity of sixty days or less for which a valuation from a third party pricing service is not readily available may be valued at amortized cost, which approximates fair value.
Equity Securities. Equity securities listed on a U.S. securities exchange generally are valued at the last sale or closing price on the day of valuation or, if no sales took place on such date, at the mean between the closing bid and ask prices on the exchange where such securities are principally traded. Equity securities listed on the NASDAQ National Market System are valued at the NASDAQ official closing price. Unlisted or listed securities for which closing sales prices or closing quotations are not available are valued at the mean between the latest available bid and ask prices or, in the case of preferred equity securities that are not listed or traded in the over-the-counter market, by a third party pricing service that uses various techniques that consider factors including, but not limited to, prices or yields of securities with similar characteristics, benchmark yields, broker/dealer quotes, quotes of underlying common stock, issuer spreads, as well as industry and economic events.
Derivatives. Forward foreign currency exchange contracts are generally valued at the mean of the average bid and average ask prices that are reported by currency dealers to a third party pricing service at the valuation time. Such third party pricing service valuations are supplied for specific settlement periods and the Portfolio’s forward foreign currency exchange contracts are valued at an interpolated rate between the closest preceding and subsequent settlement period reported by the third party pricing service.
Foreign Securities and Currencies. Foreign securities and currencies are valued in U.S. dollars, based on foreign currency exchange rate quotations supplied by a third party pricing service. The pricing service uses a proprietary model to determine the exchange rate. Inputs to the model include reported trades and implied bid/ask spreads.
Other. Investments in management investment companies (including money market funds) that do not trade on an exchange are valued at the net asset value as of the close of each business day.
Fair Valuation. In connection with Rule 2a-5 of the 1940 Act, which became effective September 8, 2022, the Trustees have designated the Portfolio’s investment adviser as its valuation designee. Investments for which valuations or market quotations are not readily available or are deemed unreliable are valued by the investment adviser, as valuation designee, at fair value using methods that most fairly reflect the security’s “fair value”, which is the amount that the Portfolio might reasonably expect to receive for the security upon its current sale in the ordinary course. Each such determination is based on a consideration of relevant factors, which are likely to vary from one pricing context to another. These factors may include, but are not limited to, the type of security, the existence of any contractual restrictions on the security’s disposition, the price and extent of public trading in similar securities of the issuer or of comparable companies or entities, quotations or relevant information obtained from broker/dealers or other market participants, information obtained from the issuer, analysts, and/or the appropriate stock exchange (for exchange-traded securities), an analysis of the company’s or entity’s financial statements, and an evaluation of the forces that influence the issuer and the market(s) in which the security is purchased and sold.
Senior Debt Portfolio
October 31, 2022
Notes to Financial Statements — continued
B Investment Transactions — Investment transactions for financial statement purposes are accounted for on a trade date basis. Realized gains and losses on investments sold are determined on the basis of identified cost.
C Income — Interest income is recorded on the basis of interest accrued, adjusted for amortization of premium or accretion of discount. Fees associated with loan amendments are recognized immediately. Dividend income is recorded on the ex-dividend date for dividends received in cash and/or securities. Withholding taxes on foreign dividends have been provided for in accordance with the Portfolio’s understanding of the applicable countries’ tax rules and rates. Distributions from investment companies are recorded as dividend income, capital gains or return of capital based on the nature of the distribution.
D Federal Taxes — The Portfolio has elected to be treated as a partnership for federal tax purposes. No provision is made by the Portfolio for federal or state taxes on any taxable income of the Portfolio because each investor in the Portfolio is ultimately responsible for the payment of any taxes on its share of taxable income. Since at least one of the Portfolio’s investors is a regulated investment company that invests all or substantially all of its assets in the Portfolio, the Portfolio normally must satisfy the applicable source of income and diversification requirements (under the Internal Revenue Code) in order for its investors to satisfy them. The Portfolio will allocate, at least annually among its investors, each investor’s distributive share of the Portfolio’s net investment income, net realized capital gains and losses and any other items of income, gain, loss, deduction or credit.
As of October 31, 2022, the Portfolio had no uncertain tax positions that would require financial statement recognition, de-recognition, or disclosure. The Portfolio files a U.S. federal income tax return annually after its fiscal year-end, which is subject to examination by the Internal Revenue Service for a period of three years from the date of filing.
E Foreign Currency Translation — Investment valuations, other assets, and liabilities initially expressed in foreign currencies are translated each business day into U.S. dollars based upon current exchange rates. Purchases and sales of foreign investment securities and income and expenses denominated in foreign currencies are translated into U.S. dollars based upon currency exchange rates in effect on the respective dates of such transactions. Recognized gains or losses on investment transactions attributable to changes in foreign currency exchange rates are recorded for financial statement purposes as net realized gains and losses on investments. That portion of unrealized gains and losses on investments that results from fluctuations in foreign currency exchange rates is not separately disclosed.
F Unfunded Loan Commitments — The Portfolio may enter into certain loan agreements all or a portion of which may be unfunded. The Portfolio is obligated to fund these commitments at the borrower’s discretion. These commitments are disclosed in the accompanying Portfolio of Investments. At October 31, 2022, the Portfolio had sufficient cash and/or securities to cover these commitments.
G Use of Estimates — The preparation of the financial statements in conformity with U.S. GAAP requires management to make estimates and assumptions that affect the reported amounts of assets and liabilities at the date of the financial statements and the reported amounts of income and expense during the reporting period. Actual results could differ from those estimates.
H Indemnifications — Under the Portfolio’s organizational documents, its officers and Trustees may be indemnified against certain liabilities and expenses arising out of the performance of their duties to the Portfolio. Under Massachusetts law, if certain conditions prevail, interestholders in the Portfolio could be deemed to have personal liability for the obligations of the Portfolio. However, the Portfolio’s Declaration of Trust contains an express disclaimer of liability on the part of Portfolio interestholders. Additionally, in the normal course of business, the Portfolio enters into agreements with service providers that may contain indemnification clauses. The Portfolio’s maximum exposure under these arrangements is unknown as this would involve future claims that may be made against the Portfolio that have not yet occurred.
I Forward Foreign Currency Exchange Contracts — The Portfolio may enter into forward foreign currency exchange contracts for the purchase or sale of a specific foreign currency at a fixed price on a future date. The forward foreign currency exchange contracts are adjusted by the daily exchange rate of the underlying currency and any gains or losses are recorded as unrealized until such time as the contracts have been closed. Risks may arise upon entering these contracts from the potential inability of counterparties to meet the terms of their contracts and from movements in the value of a foreign currency relative to the U.S. dollar.
J When-Issued Securities and Delayed Delivery Transactions — The Portfolio may purchase securities on a delayed delivery or when-issued basis. Payment and delivery may take place after the customary settlement period for that security. At the time the transaction is negotiated, the price of the security that will be delivered is fixed. The Portfolio maintains cash and/or security positions for these commitments such that sufficient liquid assets will be available to make payments upon settlement. Securities purchased on a delayed delivery or when-issued basis are marked-to-market daily and begin earning interest on settlement date. Such security purchases are subject to the risk that when delivered they will be worth less than the agreed upon payment price. Losses may also arise if the counterparty does not perform under the contract.
Senior Debt Portfolio
October 31, 2022
Notes to Financial Statements — continued
2 Investment Adviser Fee and Other Transactions with Affiliates
The investment adviser fee is earned by Boston Management and Research (BMR), an indirect, wholly-owned subsidiary of Morgan Stanley, as compensation for investment advisory services rendered to the Portfolio. The fee is computed at an annual rate as a percentage of average daily gross assets as follows and is payable monthly:
| | | | |
| Average Daily Gross Assets | | Annual Fee Rate | |
| |
Up to and including $1 billion | | | 0.5000 | % |
| |
In excess of $1 billion up to and including $2 billion | | | 0.4500 | % |
| |
In excess of $2 billion up to and including $7 billion | | | 0.4000 | % |
| |
In excess of $7 billion up to and including $10 billion | | | 0.3875 | % |
| |
In excess of $10 billion up to and including $15 billion | | | 0.3750 | % |
| |
In excess of $15 billion | | | 0.3625 | % |
Gross assets are calculated by deducting all liabilities of the Portfolio except the principal amount of any indebtedness for money borrowed. For the year ended October 31, 2022, the Portfolio’s investment adviser fee amounted to $43,097,659 or 0.49% of the Portfolio’s average daily net assets. Effective April 26, 2022, the Portfolio may invest in a money market fund, the Institutional Class of the Morgan Stanley Institutional Liquidity Funds - Government Portfolio (the “Liquidity Fund”), an open-end management investment company managed by Morgan Stanley Investment Management Inc., a wholly-owned subsidiary of Morgan Stanley. The investment adviser fee paid by the Portfolio is reduced by an amount equal to its pro-rata share of the advisory and administration fees paid by the Portfolio due to its investment in the Liquidity Fund. For the year ended October 31, 2022, the investment adviser fee paid was reduced by $99,493 relating to the Portfolio’s investment in the Liquidity Fund. Prior to April 26, 2022, the Portfolio may have invested its cash in Eaton Vance Cash Reserves Fund, LLC (Cash Reserves Fund), an affiliated investment company managed by Eaton Vance Management (EVM), an affiliate of BMR. EVM did not receive a fee for advisory services provided to Cash Reserves Fund.
Trustees and officers of the Portfolio who are members of EVM’s or BMR’s organizations receive remuneration for their services to the Portfolio out of the investment adviser fee. Trustees of the Portfolio who are not affiliated with the investment adviser may elect to defer receipt of all or a percentage of their annual fees in accordance with the terms of the Trustees Deferred Compensation Plan. For the year ended October 31, 2022, no significant amounts have been deferred. Certain officers and Trustees of the Portfolio are officers of the above organizations.
3 Purchases and Sales of Investments
Purchases and sales of investments, other than short-term obligations and including maturities, paydowns and principal repayments on Senior Loans, aggregated $2,886,173,543 and $2,956,764,866, respectively, for the year ended October 31, 2022.
4 Federal Income Tax Basis of Investments
The cost and unrealized appreciation (depreciation) of investments, including open derivative contracts, of the Portfolio at October 31, 2022, as determined on a federal income tax basis, were as follows:
| | | | |
| |
Aggregate cost | | $ | 10,017,057,139 | |
| |
Gross unrealized appreciation | | $ | 34,258,304 | |
| |
Gross unrealized depreciation | | | (842,263,589 | ) |
| |
Net unrealized depreciation | | $ | (808,005,285 | ) |
Senior Debt Portfolio
October 31, 2022
Notes to Financial Statements — continued
5 Financial Instruments
The Portfolio may trade in financial instruments with off-balance sheet risk in the normal course of its investing activities. These financial instruments may include forward foreign currency exchange contracts and may involve, to a varying degree, elements of risk in excess of the amounts recognized for financial statement purposes. The notional or contractual amounts of these instruments represent the investment the Portfolio has in particular classes of financial instruments and do not necessarily represent the amounts potentially subject to risk. The measurement of the risks associated with these instruments is meaningful only when all related and offsetting transactions are considered. A summary of obligations under these financial instruments at October 31, 2022 is included in the Portfolio of Investments. At October 31, 2022, the Portfolio had sufficient cash and/or securities to cover commitments under these contracts.
The Portfolio is subject to foreign exchange risk in the normal course of pursuing its investment objective. Because the Portfolio holds foreign currency denominated investments, the value of these investments and related receivables and payables may change due to future changes in foreign currency exchange rates. To hedge against this risk, the Portfolio enters into forward foreign currency exchange contracts.
The Portfolio enters into forward foreign currency exchange contracts that may contain provisions whereby the counterparty may terminate the contract under certain conditions, including but not limited to a decline in the Portfolio’s net assets below a certain level over a certain period of time, which would trigger a payment by the Portfolio for those derivatives in a liability position. At October 31, 2022, the fair value of derivatives with credit-related contingent features in a net liability position was $7,221,054. The aggregate fair value of assets pledged as collateral by the Portfolio for such liability was $10,190,000 at October 31, 2022.
The over-the-counter (OTC) derivatives in which the Portfolio invests are subject to the risk that the counterparty to the contract fails to perform its obligations under the contract. To mitigate this risk, the Portfolio has entered into an International Swaps and Derivatives Association, Inc. Master Agreement (“ISDA Master Agreement”) or similar agreement with substantially all its derivative counterparties. An ISDA Master Agreement is a bilateral agreement between the Portfolio and a counterparty that governs certain OTC derivatives and typically contains, among other things, set-off provisions in the event of a default and/or termination event as defined under the relevant ISDA Master Agreement. Under an ISDA Master Agreement, the Portfolio may, under certain circumstances, offset with the counterparty certain derivative financial instruments’ payables and/or receivables with collateral held and/or posted and create one single net payment. The provisions of the ISDA Master Agreement typically permit a single net payment in the event of default including the bankruptcy or insolvency of the counterparty. However, bankruptcy or insolvency laws of a particular jurisdiction may impose restrictions on or prohibitions against the right of offset in bankruptcy or insolvency. Certain ISDA Master Agreements allow counterparties to OTC derivatives to terminate derivative contracts prior to maturity in the event the Portfolio’s net assets decline by a stated percentage or the Portfolio fails to meet the terms of its ISDA Master Agreements, which would cause the counterparty to accelerate payment by the Portfolio of any net liability owed to it.
The collateral requirements for derivatives traded under an ISDA Master Agreement are governed by a Credit Support Annex to the ISDA Master Agreement. Collateral requirements are determined at the close of business each day and are typically based on changes in market values for each transaction under an ISDA Master Agreement and netted into one amount for such agreement. Generally, the amount of collateral due from or to a counterparty is subject to a minimum transfer threshold amount before a transfer is required, which may vary by counterparty. Collateral pledged for the benefit of the Portfolio and/or counterparty is held in segregated accounts by the Portfolio’s custodian and cannot be sold, re-pledged, assigned or otherwise used while pledged. The portion of such collateral representing cash, if any, is reflected as deposits for derivatives collateral and, in the case of cash pledged by a counterparty for the benefit of the Portfolio, a corresponding liability on the Statement of Assets and Liabilities. Securities pledged by the Portfolio as collateral, if any, are identified as such in the Portfolio of Investments.
The fair value of open derivative instruments (not considered to be hedging instruments for accounting disclosure purposes) and whose primary underlying risk exposure is foreign exchange risk at October 31, 2022 was as follows:
| | | | | | | | |
| | | Fair Value | |
| Derivative | | Asset Derivative(1) | | | Liability Derivative(2) | |
| | |
Forward foreign currency exchange contracts | | $ | 3,664,571 | | | $ | (7,221,054 | ) |
| (1) | Statement of Assets and Liabilities location: Receivable for open forward foreign currency exchange contracts. |
| (2) | Statement of Assets and Liabilities location: Payable for open forward foreign currency exchange contracts. |
Senior Debt Portfolio
October 31, 2022
Notes to Financial Statements — continued
The Portfolio’s derivative assets and liabilities at fair value by type, which are reported gross in the Statement of Assets and Liabilities, are presented in the table above. The following tables present the Portfolio’s derivative assets and liabilities by counterparty, net of amounts available for offset under a master netting agreement and net of the related collateral received by the Portfolio for such assets and pledged by the Portfolio for such liabilities as of October 31, 2022.
| | | | | | | | | | | | | | | | | | | | |
| Counterparty | | Derivative
Assets Subject to Master Netting
Agreement | | | Derivatives
Available
for Offset | | | Non-cash
Collateral
Received(a) | | | Cash
Collateral
Received(a) | | | Net Amount
of Derivative
Assets(b) | |
| | | | | |
Bank of America, N.A. | | $ | 895,128 | | | $ | (856,678 | ) | | $ | (38,450 | ) | | $ | — | | | $ | — | |
| | | | | |
Standard Chartered Bank | | | 372,049 | | | | (372,049 | ) | | | — | | | | — | | | | — | |
| | | | | |
State Street Bank and Trust Company | | | 2,397,394 | | | | (2,397,394 | ) | | | — | | | | — | | | | — | |
| | | | | |
| | | $ | 3,664,571 | | | $ | (3,626,121 | ) | | $ | (38,450 | ) | | $ | — | | | $ | — | |
| | | | | |
| Counterparty | | Derivative
Liabilities Subject to Master Netting
Agreement | | | Derivatives
Available
for Offset | | | Non-cash
Collateral
Pledged(a) | | | Cash
Collateral
Pledged(a) | | | Net Amount
of Derivative
Liabilities(c) | |
| | | | | |
Bank of America, N.A. | | $ | (856,678 | ) | | $ | 856,678 | | | $ | — | | | $ | — | | | $ | — | |
| | | | | |
Standard Chartered Bank | | | (2,082,158 | ) | | | 372,049 | | | | — | | | | 1,710,109 | | | | — | |
| | | | | |
State Street Bank and Trust Company | | | (4,282,218 | ) | | | 2,397,394 | | | | — | | | | 1,884,824 | | | | — | |
| | | | | |
| | | $ | (7,221,054 | ) | | $ | 3,626,121 | | | $ | — | | | $ | 3,594,933 | | | $ | — | |
| (a) | In some instances, the total collateral received and/or pledged may be more than the amount shown due to overcollateralization. |
| (b) | Net amount represents the net amount due from the counterparty in the event of default. |
| (c) | Net amount represents the net amount payable to the counterparty in the event of default. |
The effect of derivative instruments (not considered to be hedging instruments for accounting disclosure purposes) on the Statement of Operations and whose primary underlying risk exposure is foreign exchange risk for the year ended October 31, 2022 was as follows:
| | | | | | | | |
| Derivative | | Realized Gain (Loss)
on Derivatives Recognized
in Income(1) | | | Change in Unrealized
Appreciation (Depreciation) on
Derivatives Recognized in Income(2) | |
| | |
Forward foreign currency exchange contracts | | $ | 184,053,316 | | | $ | (12,090,696 | ) |
| (1) | Statement of Operations location: Net realized gain (loss) - Forward foreign currency exchange contracts. |
| (2) | Statement of Operations location: Change in unrealized appreciation (depreciation) - Forward foreign currency exchange contracts. |
The average notional amount of forward foreign currency exchange contracts (based on the absolute value of notional amounts of currency purchased and currency sold) outstanding during the year ended October 31, 2022, which is indicative of the volume of this derivative type, was approximately $1,374,177,000.
Senior Debt Portfolio
October 31, 2022
Notes to Financial Statements — continued
6 Revolving Credit and Security Agreement
The Portfolio has entered into a Revolving Credit and Security Agreement, as amended (the Loan Facility) with certain Citibank, N.A. (“Citi”) sponsored conduits (the “Conduit Lenders”) that issue commercial paper, certain banks (the “Direct Lenders”) and Citi as secondary lender (together with any other secondary lenders, the “Secondary Lenders”) and as agent (the “Agent”) for the Conduit Lenders, the Direct Lenders and the Secondary Lenders that allows it to borrow up to $2.825 billion ($2.625 billion prior to August 26, 2022 and $2.725 billion prior to March 7, 2022) and to invest the borrowings in accordance with its investment practices. Borrowings under the Loan Facility are secured by the assets of the Portfolio and is in effect through March 6, 2023. In connection with borrowings from a Conduit Lender, the Portfolio pays to the Conduit Lender an amount equal to the Conduit Lender’s cost of borrowing (i.e., the interest payable on commercial paper issued by such Conduit Lender) plus a dealer commission (collectively, the “CP Rate”) multiplied by the principal amount of the advance to the Portfolio under the Loan Facility. In addition, the Portfolio pays a drawn fee to Citi on behalf of the Conduit Lenders equal to 0.90% per annum on its outstanding borrowings, a liquidity fee payable to the Secondary Lenders equal to 0.15% or 0.25% per annum of the undrawn amount under the Loan Facility depending on the amount borrowed by the Portfolio thereunder, and an upfront fee equal to 0.15% of the total commitment amount under the Loan Facility. The Portfolio pays substantially similar fees with respect to borrowings from the Direct Lenders, but it pays one-month Term SOFR (or such other duration as approved by the Agent) on advances rather than the CP Rate. In the event that the Conduit Lenders are unable to fund their commitment and the Secondary Lenders provide backstop liquidity, the Portfolio is charged an interest rate similar to that paid to the Direct Lenders but a drawn fee that is substantially higher than the drawn fee paid to the Direct Lenders. Drawn and liquidity fees for the year ended October 31, 2022 totaled $17,802,255 and are included in interest expense and fees on the Statement of Operations. In connection with the renewal of the Loan Facility on March 7, 2022, the Portfolio paid upfront fees of $3,937,500. These upfront fees are being amortized to interest expense through March 6, 2023. The unamortized balance at October 31, 2022 is approximately $1,471,000 and is included in prepaid upfront fees on notes payable on the Statement of Assets and Liabilities. At October 31, 2022, the Portfolio had borrowings outstanding under the Loan Facility of $2,075,000,000 at an annual interest rate of 2.40%. Based on the short-term nature of borrowings under the Loan Facility and the variable interest rate, the carrying amount of the borrowings at October 31, 2022 approximated its fair value. If measured at fair value, borrowings under the Loan Facility would have been considered as Level 2 in the fair value hierarchy (see Note 8) at October 31, 2022. For the year ended October 31, 2022, the average borrowings under the Loan Facility and the average annual interest rate (excluding fees) were $1,717,260,274 and 1.03%, respectively.
7 Investments in Affiliated Funds
At October 31, 2022, the value of the Portfolio’s investment in funds that may be deemed to be affiliated was $86,209,963, which represents 1.2% of the Portfolio’s net assets. Transactions in affiliated funds by the Portfolio for the year ended October 31, 2022 were as follows:
| | | | | | | | | | | | | | | | | | | | | | | | | | | | | | | | |
| Name | | Value,
beginning
of period | | | Purchases | | | Sales
proceeds | | | Net
realized
gain (loss) | | | Change in
unrealized
appreciation
(depreciation) | | | Value, end
of period | | | Dividend
income | | | Units/Shares,
end of period | |
Affiliated Fund | |
| | | | | | | | |
Cash Reserves Fund | | $ | 96,088,076 | | | $ | 1,714,054,780 | | | $ | (1,810,142,011 | ) | | $ | (845 | ) | | $ | — | | | $ | — | | | $ | 46,288 | | | | — | |
| | | | | | | | |
Liquidity Fund | | | — | | | | 1,790,028,283 | | | | (1,703,818,320 | ) | | | — | | | | — | | | | 86,209,963 | | | | 1,128,148 | | | | 86,209,963 | |
| | | | | | | | |
Total | | | | | | | | | | | | | | $ | (845 | ) | | $ | — | | | $ | 86,209,963 | | | $ | 1,174,436 | | | | | |
8 Fair Value Measurements
Under generally accepted accounting principles for fair value measurements, a three-tier hierarchy to prioritize the assumptions, referred to as inputs, is used in valuation techniques to measure fair value. The three-tier hierarchy of inputs is summarized in the three broad levels listed below.
| • | | Level 1 – quoted prices in active markets for identical investments |
| • | | Level 2 – other significant observable inputs (including quoted prices for similar investments, interest rates, prepayment speeds, credit risk, etc.) |
| • | | Level 3 – significant unobservable inputs (including a fund’s own assumptions in determining the fair value of investments) |
In cases where the inputs used to measure fair value fall in different levels of the fair value hierarchy, the level disclosed is determined based on the lowest level input that is significant to the fair value measurement in its entirety. The inputs or methodology used for valuing securities are not necessarily an indication of the risk associated with investing in those securities.
Senior Debt Portfolio
October 31, 2022
Notes to Financial Statements — continued
At October 31, 2022, the hierarchy of inputs used in valuing the Portfolio’s investments and open derivative instruments, which are carried at value, were as follows:
| | | | | | | | | | | | | | | | |
| Asset Description | | Level 1 | | | Level 2 | | | Level 3* | | | Total | |
| | | | |
Asset-Backed Securities | | $ | — | | | $ | 281,262,549 | | | $ | — | | | $ | 281,262,549 | |
| | | | |
Common Stocks | | | 6,934,642 | | | | 34,350,670 | | | | 5,973,986 | | | | 47,259,298 | |
| | | | |
Convertible Preferred Stocks | | | — | | | | 6,196,953 | | | | — | | | | 6,196,953 | |
| | | | |
Corporate Bonds | | | — | | | | 619,707,617 | | | | — | | | | 619,707,617 | |
| | | | |
Exchange-Traded Funds | | | 15,874,560 | | | | — | | | | — | | | | 15,874,560 | |
| | | | |
Preferred Stocks | | | — | | | | 8,835,807 | | | | 0 | | | | 8,835,807 | |
| | | | |
Senior Floating-Rate Loans (Less Unfunded Loan Commitments) | | | — | | | | 8,142,342,608 | | | | 1,362,499 | | | | 8,143,705,107 | |
| | | | |
Warrants | | | — | | | | 0 | | | | 0 | | | | 0 | |
| | | | |
Short-Term Investments | | | 86,209,963 | | | | — | | | | — | | | | 86,209,963 | |
| | | | |
Total Investments | | $ | 109,019,165 | | | $ | 9,092,696,204 | | | $ | 7,336,485 | | | $ | 9,209,051,854 | |
| | | | |
Forward Foreign Currency Exchange Contracts | | $ | — | | | $ | 3,664,571 | | | $ | — | | | $ | 3,664,571 | |
| | | | |
Total | | $ | 109,019,165 | | | $ | 9,096,360,775 | | | $ | 7,336,485 | | | $ | 9,212,716,425 | |
| | | | |
Liability Description | | | | | | | | | | | | | | | | |
| | | | |
Forward Foreign Currency Exchange Contracts | | $ | — | | | $ | (7,221,054 | ) | | $ | — | | | $ | (7,221,054 | ) |
| | | | |
Total | | $ | — | | | $ | (7,221,054 | ) | | $ | — | | | $ | (7,221,054 | ) |
| * | None of the unobservable inputs for Level 3 assets, individually or collectively, had a material impact on the Portfolio. |
Level 3 investments at the beginning and/or end of the period in relation to net assets were not significant and accordingly, a reconciliation of Level 3 assets for the year ended October 31, 2022 is not presented.
9 Risks and Uncertainties
Risks Associated with Foreign Investments
Foreign investments can be adversely affected by political, economic and market developments abroad, including the imposition of economic and other sanctions by the United States or another country. There may be less publicly available information about foreign issuers because they may not be subject to reporting practices, requirements or regulations comparable to those to which United States companies are subject. Foreign markets may be smaller, less liquid and more volatile than the major markets in the United States. Trading in foreign markets typically involves higher expense than trading in the United States. The Portfolio may have difficulties enforcing its legal or contractual rights in a foreign country. Securities that trade or are denominated in currencies other than the U.S. dollar may be adversely affected by fluctuations in currency exchange rates.
Credit Risk
The Portfolio invests primarily in below investment grade floating-rate loans, which are considered speculative because of the credit risk of their issuers. Changes in economic conditions or other circumstances are more likely to reduce the capacity of issuers of these securities to make principal and interest payments. Such companies are more likely to default on their payments of interest and principal owed than issuers of investment grade bonds. An economic downturn generally leads to a higher non-payment rate, and a loan or other debt obligation may lose significant value before a default occurs. Lower rated investments also may be subject to greater price volatility than higher rated investments. Moreover, the specific collateral used to secure a loan may decline in value or become illiquid, which would adversely affect the loan’s value.
LIBOR Transition Risk
Certain instruments held by the Portfolio may pay an interest rate based on the London Interbank Offered Rate (“LIBOR”), which is the average offered rate for various maturities of short-term loans between certain major international banks. LIBOR is used throughout global banking and financial industries to determine interest rates for a variety of financial instruments (such as debt instruments and derivatives) and borrowing arrangements. The ICE Benchmark Administration Limited, the administrator of LIBOR, ceased publishing certain LIBOR settings on December 31, 2021, and is expected to cease publishing
Senior Debt Portfolio
October 31, 2022
Notes to Financial Statements — continued
the remaining LIBOR settings on June 30, 2023. Although the transition process away from LIBOR has become increasingly well-defined, the impact on certain debt securities, derivatives and other financial instruments that utilize LIBOR remains uncertain. The phase-out of LIBOR may result in, among other things, increased volatility or illiquidity in markets for instruments based on LIBOR and changes in the value of such instruments.
Pandemic Risk
An outbreak of respiratory disease caused by a novel coronavirus was first detected in China in late 2019 and subsequently spread internationally. This coronavirus has resulted in closing borders, enhanced health screenings, changes to healthcare service preparation and delivery, quarantines, cancellations, disruptions to supply chains and customer activity, as well as general concern and uncertainty. Health crises caused by outbreaks of disease, such as the coronavirus outbreak, may exacerbate other pre-existing political, social and economic risks and disrupt normal market conditions and operations. The impact of this outbreak has negatively affected the worldwide economy, as well as the economies of individual countries and industries, and could continue to affect the market in significant and unforeseen ways. Other epidemics and pandemics that may arise in the future may have similar effects. Any such impact could adversely affect the Portfolio’s performance, or the performance of the securities in which the Portfolio invests.
Senior Debt Portfolio
October 31, 2022
Report of Independent Registered Public Accounting Firm
To the Trustees and Investors of Senior Debt Portfolio:
Opinion on the Financial Statements and Financial Highlights
We have audited the accompanying statement of assets and liabilities of Senior Debt Portfolio (the “Portfolio”), including the portfolio of investments, as of October 31, 2022, the related statements of operations and cash flows for the year then ended, the statements of changes in net assets for each of the two years in the period then ended, the financial highlights for each of the five years in the period then ended, and the related notes. In our opinion, the financial statements and financial highlights present fairly, in all material respects, the financial position of the Portfolio as of October 31, 2022, and the results of its operations and its cash flows for the year then ended, the changes in its net assets for each of the two years in the period then ended, and the financial highlights for each of the five years in the period then ended, in conformity with accounting principles generally accepted in the United States of America.
Basis for Opinion
These financial statements and financial highlights are the responsibility of the Portfolio’s management. Our responsibility is to express an opinion on the Portfolio’s financial statements and financial highlights based on our audits. We are a public accounting firm registered with the Public Company Accounting Oversight Board (United States) (PCAOB) and are required to be independent with respect to the Portfolio in accordance with the U.S. federal securities laws and the applicable rules and regulations of the Securities and Exchange Commission and the PCAOB.
We conducted our audits in accordance with the standards of the PCAOB. Those standards require that we plan and perform the audit to obtain reasonable assurance about whether the financial statements and financial highlights are free of material misstatement, whether due to error or fraud. The Portfolio is not required to have, nor were we engaged to perform, an audit of its internal control over financial reporting. As part of our audits, we are required to obtain an understanding of internal control over financial reporting but not for the purpose of expressing an opinion on the effectiveness of the Portfolio’s internal control over financial reporting. Accordingly, we express no such opinion.
Our audits included performing procedures to assess the risks of material misstatement of the financial statements and financial highlights, whether due to error or fraud, and performing procedures that respond to those risks. Such procedures included examining, on a test basis, evidence regarding the amounts and disclosures in the financial statements and financial highlights. Our audits also included evaluating the accounting principles used and significant estimates made by management, as well as evaluating the overall presentation of the financial statements and financial highlights. Our procedures included confirmation of securities and senior loans owned as of October 31, 2022, by correspondence with the custodian, brokers and selling or agent banks; when replies were not received from brokers and selling or agent banks, we performed other auditing procedures. We believe that our audits provide a reasonable basis for our opinion.
/s/ Deloitte & Touche LLP
Boston, Massachusetts
December 22, 2022
We have served as the auditor of one or more Eaton Vance investment companies since 1959.
Eaton Vance
Floating-Rate Advantage Fund
October 31, 2022
Board of Trustees’ Contract Approval
Overview of the Contract Review Process
The Investment Company Act of 1940, as amended (the “1940 Act”), provides, in substance, that the investment advisory agreement between a fund and its investment adviser will continue in effect from year-to-year only if its continuation is approved on an annual basis by a vote of the fund’s board of trustees, including a majority of the trustees who are not “interested persons” of the fund (“independent trustees”), cast in person at a meeting called for the purpose of considering such approval.
At a meeting held on June 8, 2022, the Boards of Trustees/Directors (collectively, the “Board”) that oversee the registered investment companies advised by Eaton Vance Management or its affiliate, Boston Management and Research (the “Eaton Vance Funds”), including a majority of the independent trustees (the “Independent Trustees”), voted to approve the continuation of existing investment advisory agreements and sub-advisory agreements1 for each of the Eaton Vance Funds for an additional one-year period. The Board relied upon the affirmative recommendation of its Contract Review Committee, which is a committee exclusively comprised of Independent Trustees. Prior to making its recommendation, the Contract Review Committee reviewed information furnished by the adviser and sub-adviser to each of the Eaton Vance Funds (including information specifically requested by the Board) for a series of formal meetings held between April and June 2022. Members of the Contract Review Committee also considered information received at prior meetings of the Board and its committees, to the extent such information was relevant to the Contract Review Committee’s annual evaluation of the investment advisory agreements and sub-advisory agreements.
In connection with its evaluation of the investment advisory agreements and sub-advisory agreements, the Board considered various information relating to the Eaton Vance Funds. This included information applicable to all or groups of Eaton Vance Funds, which is referenced immediately below, and information applicable to the particular Eaton Vance Fund covered by this report (additional fund-specific information is referenced below under “Results of the Contract Review Process”). (For funds that invest through one or more underlying portfolios, references to “each fund” in this section may include information that was considered at the portfolio-level.)
Information about Fees, Performance and Expenses
| | • | | A report from an independent data provider comparing advisory and other fees paid by each fund to such fees paid by comparable funds, as identified by the independent data provider (“comparable funds”); |
| | • | | A report from an independent data provider comparing each fund’s total expense ratio (and its components) to those of comparable funds; |
| | • | | A report from an independent data provider comparing the investment performance of each fund (including, as relevant, total return data, income data, Sharpe ratios and information ratios) to the investment performance of comparable funds and, as applicable, benchmark indices, over various time periods; |
| | • | | In certain instances, data regarding investment performance relative to customized groups of peer funds and blended indices identified by the adviser in consultation with the Portfolio Management Committee of the Board (a committee exclusively comprised of Independent Trustees); |
| | • | | Comparative information concerning the fees charged and services provided by the adviser and sub-adviser to each fund in managing other accounts (which may include other mutual funds, collective investment funds and institutional accounts) using investment strategies and techniques similar to those used in managing such fund(s), if any; |
| | • | | Profitability analyses with respect to the adviser and sub-adviser to each of the funds; |
Information about Portfolio Management and Trading
| | • | | Descriptions of the investment management services provided to each fund, as well as each of the funds’ investment strategies and policies; |
| | • | | The procedures and processes used to determine the value of fund assets, including, when necessary, the determination of “fair value” and actions taken to monitor and test the effectiveness of such procedures and processes; |
| | • | | Information about the policies and practices of each fund’s adviser and sub-adviser with respect to trading, including their processes for seeking best execution of portfolio transactions; |
| | • | | Information about the allocation of brokerage transactions and the benefits, if any, received by the adviser and sub-adviser to each fund as a result of brokerage allocation, including, as applicable, information concerning the acquisition of research through client commission arrangements and policies with respect to “soft dollars”; |
| | • | | Data relating to the portfolio turnover rate of each fund and related information regarding active management in the context of particular strategies; |
Information about each Adviser and Sub-adviser
| | • | | Reports detailing the financial results and condition of the adviser and sub-adviser to each fund; |
| 1 | Not all Eaton Vance Funds have entered into a sub-advisory agreement with a sub-adviser. Accordingly, references to “sub-adviser” or “sub-advisory agreement” in this “Overview” section may not be applicable to the particular Eaton Vance Fund covered by this report. Following the “Overview” section, further information regarding the Board’s evaluation of a fund’s contractual arrangements is included under the “Results of the Contract Review Process” section. |
Eaton Vance
Floating-Rate Advantage Fund
October 31, 2022
Board of Trustees’ Contract Approval — continued
| | • | | Information regarding the individual investment professionals whose responsibilities include portfolio management and investment research for the funds, and, for portfolio managers and certain other investment professionals, information relating to their responsibilities with respect to managing other mutual funds and investment accounts, as applicable; |
| | • | | Information regarding the adviser’s and its parent company’s (Morgan Stanley’s) efforts to retain and attract talented investment professionals, including in the context of a particularly competitive marketplace for talent, as well as the ongoing unique environment presented by hybrid, remote and other alternative work arrangements; |
| | • | | The Code of Ethics of the adviser and its affiliates and the sub-adviser of each fund, together with information relating to compliance with, and the administration of, such codes; |
| | • | | Policies and procedures relating to proxy voting, including regular reporting with respect to fund proxy voting activities; |
| | • | | Information regarding the handling of corporate actions and class actions, as well as information regarding litigation and other regulatory matters; |
| | • | | Information concerning the resources devoted to compliance efforts undertaken by the adviser and its affiliates and the sub-adviser of each fund, if any, including descriptions of their various compliance programs and their record of compliance; |
| | • | | Information concerning the business continuity and disaster recovery plans of the adviser and its affiliates and the sub-adviser of each fund, if any; |
| | • | | A description of Eaton Vance Management’s and Boston Management and Research’s oversight of sub-advisers, including with respect to regulatory and compliance issues, investment management and other matters; |
Other Relevant Information
| | • | | Information regarding ongoing initiatives to further integrate and harmonize, where applicable, the investment management and other departments of the adviser and its affiliates with the overall investment management infrastructure of Morgan Stanley, in light of Morgan Stanley’s acquisition of Eaton Vance on March 1, 2021; |
| | • | | Information concerning the nature, cost and character of the administrative and other non-investment advisory services provided by Eaton Vance Management and its affiliates; |
| | • | | Information concerning oversight of the relationship with the custodian, subcustodians, fund accountants, and other third-party service providers by the adviser and/or administrator to each of the funds; |
| | • | | Information concerning efforts to implement policies and procedures with respect to various new regulations applicable to the funds, including Rule 12d1-4 (the Fund-of-Funds Rule), Rule 18f-4 (the Derivatives Rule) and Rule 2a-5 (the Fair Valuation Rule); |
| | • | | For an Eaton Vance Fund structured as an exchange-listed closed-end fund, information concerning the benefits of the closed-end fund structure, as well as, where relevant, the closed-end fund’s market prices (including as compared to the closed-end fund’s net asset value (NAV)), trading volume data, continued use of auction preferred shares (where applicable), distribution rates and other relevant matters; |
| | • | | The risks which the adviser and/or its affiliates incur in connection with the management and operation of the funds, including, among others, litigation, regulatory, entrepreneurial, and other business risks (and the associated costs of such risks); and |
| | • | | The terms of each investment advisory agreement and sub-advisory agreement. |
During the various meetings of the Board and its committees over the course of the year leading up to the June 8, 2022 meeting, the Trustees received information from portfolio managers and other investment professionals of the advisers and sub-advisers of the funds regarding investment and performance matters, and considered various investment and trading strategies used in pursuing the funds’ investment objectives. The Trustees also received information regarding risk management techniques employed in connection with the management of the funds. The Board and its committees evaluated issues pertaining to industry and regulatory developments, compliance procedures, fund governance and other issues with respect to the funds, and received and participated in reports and presentations provided by Eaton Vance Management, Boston Management and Research and fund sub-advisers, with respect to such matters. In addition to the formal meetings of the Board and its committees, the Independent Trustees held regular teleconferences to discuss, among other topics, matters relating to the continuation of investment advisory agreements and sub-advisory agreements.
The Contract Review Committee was advised throughout the contract review process by Goodwin Procter LLP, independent legal counsel for the Independent Trustees. The members of the Contract Review Committee, with the advice of such counsel, exercised their own business judgment in determining the material factors to be considered in evaluating each investment advisory agreement and sub-advisory agreement and the weight to be given to each such factor. The conclusions reached with respect to each investment advisory agreement and sub-advisory agreement were based on a comprehensive evaluation of all the information provided and not any single factor. Moreover, each member of the Contract Review Committee may have placed varying emphasis on particular factors in reaching conclusions with respect to each investment advisory agreement and sub-advisory agreement. In evaluating each investment advisory agreement and sub-advisory agreement, including the fee structures and other terms contained in such agreements, the members of the Contract Review Committee were also informed by multiple years of analysis and discussion with the adviser and sub-adviser to each of the Eaton Vance Funds.
Eaton Vance
Floating-Rate Advantage Fund
October 31, 2022
Board of Trustees’ Contract Approval — continued
Results of the Contract Review Process
Based on its consideration of the foregoing, and such other information it deemed relevant, including the factors and conclusions described below, the Contract Review Committee concluded that the continuation of the investment advisory agreement between Eaton Vance Floating-Rate Advantage Fund (the “Fund”) and Eaton Vance Management (“EVM”), as well as the investment advisory agreement between Senior Debt Portfolio (the “Portfolio”), the portfolio in which the Fund invests, and Boston Management and Research (“BMR”) (EVM, with respect to the Fund, and BMR, with respect to the Portfolio, are each referred to herein as the “Adviser”), including their respective fee structures, are in the interests of shareholders and, therefore, recommended to the Board approval of each agreement. Based on the recommendation of the Contract Review Committee, the Board, including a majority of the Independent Trustees, voted to approve continuation of the investment advisory agreements for the Fund and the Portfolio (together, the “investment advisory agreements”).
Nature, Extent and Quality of Services
In considering whether to approve the investment advisory agreements for the Fund and the Portfolio, the Board evaluated the nature, extent and quality of services provided to the Fund and to the Portfolio by the applicable Adviser.
The Board considered each Adviser’s management capabilities and investment processes in light of the types of investments held by the Fund and the Portfolio, including the education, experience and number of investment professionals and other personnel who provide portfolio management, investment research, and similar services to the Portfolio, including recent changes to such personnel. In particular, the Board considered the abilities and experience of each Adviser’s investment professionals in analyzing special considerations relevant to investing in senior floating rate loans. The Board considered each Adviser’s large group of bank loan investment professionals and other personnel who provide services to the Fund and to the Portfolio, including portfolio managers and analysts. The Board also took into account the resources dedicated to portfolio management and other services, the compensation methods of each Adviser and other factors, including the reputation and resources of the Adviser to recruit and retain highly qualified research, advisory and supervisory investment professionals. In addition, the Board considered the time and attention devoted to the Eaton Vance Funds, including the Fund and the Portfolio, by senior management, as well as the infrastructure, operational capabilities and support staff in place to assist in the portfolio management and operations of the Fund and the Portfolio, including the provision of administrative services. The Board also considered the business-related and other risks to which each Adviser or its affiliates may be subject in managing the Fund and the Portfolio.
The Board noted that, under the terms of the investment advisory agreement of the Fund, EVM may invest assets of the Fund directly in securities, for which it would receive a fee, or in the Portfolio, for which it receives no separate fee but for which BMR receives an advisory fee from the Portfolio.
The Board considered the compliance programs of each Adviser and relevant affiliates thereof. The Board considered compliance and reporting matters regarding, among other things, personal trading by investment professionals, disclosure of portfolio holdings, late trading, frequent trading, portfolio valuation, business continuity and the allocation of investment opportunities. The Board also considered the responses of each Adviser and its affiliates to requests in recent years from regulatory authorities, such as the Securities and Exchange Commission and the Financial Industry Regulatory Authority.
The Board considered other administrative services provided or overseen by EVM and its affiliates, including transfer agency and accounting services. The Board evaluated the benefits to shareholders of investing in a fund that is a part of a large fund complex offering exposure to a variety of asset classes and investment disciplines, as well as the ability, in many cases, to exchange an investment among different funds without incurring additional sales charges.
After consideration of the foregoing factors, among others, the Board concluded that the nature, extent and quality of services provided by each Adviser, taken as a whole, are appropriate and consistent with the terms of the applicable investment advisory agreement.
Fund Performance
The Board compared the Fund’s investment performance to that of comparable funds identified by an independent data provider (the peer group), as well as an appropriate benchmark index and a custom peer group of similarly managed funds. The Board’s review included comparative performance data with respect to the Fund for the one-, three-, five- and ten-year periods ended December 31, 2021. In this regard, the Board noted that the performance of the Fund was higher than the median performance of the Fund’s peer group and custom peer group for the three-year period. The Board also noted that the performance of the Fund was lower than its benchmark index for the three-year period. The Board concluded that the performance of the Fund was satisfactory.
Management Fees and Expenses
The Board considered contractual fee rates payable by the Portfolio and by the Fund for advisory and administrative services (referred to collectively as “management fees”). As part of its review, the Board considered the Fund’s management fees and total expense ratio for the one-year period ended December 31, 2021, as compared to those of comparable funds, before and after giving effect to any undertaking to waive fees or reimburse expenses. The Board also considered certain factors identified by management in response to inquiries from the Contract Review Committee regarding the Fund’s total expense ratio relative to comparable funds.
Eaton Vance
Floating-Rate Advantage Fund
October 31, 2022
Board of Trustees’ Contract Approval — continued
After considering the foregoing information, and in light of the nature, extent and quality of the services provided by each Adviser, the Board concluded that the management fees charged for advisory and related services are reasonable.
Profitability and “Fall-Out” Benefits
The Board considered the level of profits realized by each Adviser and relevant affiliates thereof in providing investment advisory and administrative services to the Fund, to the Portfolio and to all Eaton Vance Funds as a group. The Board considered the level of profits realized without regard to marketing support or other payments by each Adviser and its affiliates to third parties in respect of distribution or other services.
The Board concluded that, in light of the foregoing factors and the nature, extent and quality of the services rendered, the profits realized by each Adviser and its affiliates are deemed not to be excessive.
The Board also considered direct or indirect fall-out benefits received by each Adviser and its affiliates in connection with their respective relationships with the Fund and the Portfolio, including the benefits of research services that may be available to each Adviser as a result of securities transactions effected for the Fund and the Portfolio and other investment advisory clients.
Economies of Scale
In reviewing management fees and profitability, the Board also considered the extent to which the applicable Adviser and its affiliates, on the one hand, and the Fund and the Portfolio, on the other hand, can expect to realize benefits from economies of scale as the assets of the Fund and the Portfolio increase. The Board acknowledged the difficulty in accurately measuring the benefits resulting from economies of scale, if any, with respect to the management of any specific fund or group of funds. The Board reviewed data summarizing the increases and decreases in the assets of the Fund and of all Eaton Vance Funds as a group over various time periods, and evaluated the extent to which the total expense ratio of the Fund and the profitability of each Adviser and its affiliates may have been affected by such increases or decreases. Based upon the foregoing, the Board concluded that the Fund currently shares in the benefits from economies of scale, if any, when they are realized by the Adviser. The Board also concluded that the structure of the advisory fees, which include breakpoints at several asset levels will allow the Fund and the Portfolio to continue to benefit from any economies of scale in the future.
Eaton Vance
Floating-Rate Advantage Fund
October 31, 2022
Liquidity Risk Management Program
The Fund has implemented a written liquidity risk management program (Program) and related procedures to manage its liquidity in accordance with Rule 22e-4 under the Investment Company Act of 1940, as amended (Liquidity Rule). The Liquidity Rule defines “liquidity risk” as the risk that a fund could not meet requests to redeem shares issued by the fund without significant dilution of the remaining investors’ interests in the fund. The Fund’s Board of Trustees/Directors has designated the investment adviser to serve as the administrator of the Program and the related procedures. The administrator has established a Liquidity Risk Management Oversight Committee (Committee) to perform the functions necessary to administer the Program. As part of the Program, the administrator is responsible for identifying illiquid investments and categorizing the relative liquidity of the Fund’s investments in accordance with the Liquidity Rule. Under the Program, the administrator assesses, manages, and periodically reviews the Fund’s liquidity risk, and is responsible for making certain reports to the Fund’s Board of Trustees/Directors and the Securities and Exchange Commission (SEC) regarding the liquidity of the Fund’s investments, and to notify the Board of Trustees/Directors and the SEC of certain liquidity events specified in the Liquidity Rule. The liquidity of the Fund’s portfolio investments is determined based on a number of factors including, but not limited to, relevant market, trading and investment-specific considerations under the Program.
At a meeting of the Fund’s Board of Trustees/Directors on June 7, 2022, the Committee provided a written report to the Fund’s Board of Trustees/Directors pertaining to the operation, adequacy, and effectiveness of implementation of the Program, as well as the operation of the highly liquid investment minimum (if applicable) for the period January 1, 2021 through December 31, 2021 (Review Period). The Program operated effectively during the Review Period, supporting the administrator’s ability to assess, manage and monitor Fund liquidity risk, including during periods of market volatility and net redemptions. During the Review Period, the Fund met redemption requests on a timely basis.
There can be no assurance that the Program will achieve its objectives in the future. Please refer to the Fund’s prospectus for more information regarding the Fund’s exposure to liquidity risk and other principal risks to which an investment in the Fund may be subject.
Eaton Vance
Floating-Rate Advantage Fund
October 31, 2022
Management and Organization
Fund Management. The Trustees of Eaton Vance Mutual Funds Trust (the Trust) and Senior Debt Portfolio (the Portfolio) are responsible for the overall management and supervision of the Trust’s and the Portfolio’s affairs. The Board members and officers of the Trust and the Portfolio are listed below. Except as indicated, each individual has held the office shown or other offices in the same company for the last five years. Board members hold indefinite terms of office. Each Trustee holds office until his or her successor is elected and qualified, subject to a prior death, resignation, retirement, disqualification or removal. Under the terms of the Fund’s and the Portfolio’s current Trustee retirement policy, an Independent Trustee must retire and resign as a Trustee on the earlier of: (i) the first day of July following his or her 74th birthday; or (ii), with limited exception, December 31st of the 20th year in which he or she has served as a Trustee. However, if such retirement and resignation would cause the Fund and the Portfolio to be out of compliance with Section 16 of the 1940 Act or any other regulations or guidance of the SEC, then such retirement and resignation will not become effective until such time as action has been taken for the Fund and the Portfolio to be in compliance therewith. The “noninterested Trustees” consist of those Trustees who are not “interested persons” of the Trust and the Portfolio, as that term is defined under the 1940 Act. The business address of each Board member and officer is Two International Place, Boston, Massachusetts 02110. As used below, “BMR” refers to Boston Management and Research, “EVC” refers to Eaton Vance Corp., “EV” refers to EV LLC, “EVM” refers to Eaton Vance Management and “EVD” refers to Eaton Vance Distributors, Inc. EV is the trustee of each of EVM and BMR. Effective March 1, 2021, each of EVM, BMR, EVD and EV are indirect, wholly owned subsidiaries of Morgan Stanley. Each officer affiliated with EVM may hold a position with other EVM affiliates that is comparable to his or her position with EVM listed below. Each Trustee oversees 135 funds (with the exception of Mr. Bowser who oversees 110 funds) in the Eaton Vance fund complex (including both funds and portfolios in a hub and spoke structure).
| | | | | | |
| Name and Year of Birth | | Trust/Portfolio
Position(s) | | Length of Service | | Principal Occupation(s) and Other Directorships
During Past Five Years and Other Relevant Experience |
|
| Interested Trustee |
| | | |
Thomas E. Faust Jr. 1958 | | Trustee | | 2007 | | Chairman of Morgan Stanley Investment Management, Inc. (MSIM), member of the Board of Managers and President of EV (since 2021), Chief Executive Officer of EVM and BMR. Formerly, Chairman, Chief Executive Officer (2007-2021) and President (2006-2021) of EVC and Director of EVD (2007-2022). Mr. Faust is an interested person because of his positions with MSIM, BMR, EVM and EV, which are affiliates of the Trust and the Portfolio. Other Directorships. Formerly, Director of EVC (2007-2021) and Hexavest Inc. (investment management firm) (2012-2021). |
|
| Noninterested Trustees |
| | | |
Alan C. Bowser(1) 1962 | | Trustee | | Since 2022 | | Chief Diversity Officer, Partner and a member of the Operating Committee, and formerly served as Senior Advisor on Diversity and Inclusion for the firm’s chief executive officer, Co-Head of the Americas Region, and Senior Client Advisor of Bridgewater Associates, an asset management firm (2011- present). Other Directorships. None. |
| | | |
Mark R. Fetting 1954 | | Trustee | | Since 2016 | | Private investor. Formerly held various positions at Legg Mason, Inc. (investment management firm) (2000-2012), including President, Chief Executive Officer, Director and Chairman (2008-2012), Senior Executive Vice President (2004-2008) and Executive Vice President (2001-2004). Formerly, President of Legg Mason family of funds (2001-2008). Formerly, Division President and Senior Officer of Prudential Financial Group, Inc. and related companies (investment management firm) (1991-2000). Other Directorships. None. |
| | | |
Cynthia E. Frost 1961 | | Trustee | | Since 2014 | | Private investor. Formerly, Chief Investment Officer of Brown University (university endowment) (2000-2012). Formerly, Portfolio Strategist for Duke Management Company (university endowment manager) (1995-2000). Formerly, Managing Director, Cambridge Associates (investment consulting company) (1989-1995). Formerly, Consultant, Bain and Company (management consulting firm) (1987-1989). Formerly, Senior Equity Analyst, BA Investment Management Company (1983-1985). Other Directorships. None. |
| | | |
George J. Gorman 1952 | | Chairperson of the Board and Trustee | | Since 2021 (Chairperson) and 2014 (Trustee) | | Principal at George J. Gorman LLC (consulting firm). Formerly, Senior Partner at Ernst & Young LLP (a registered public accounting firm) (1974-2009). Other Directorships. None. |
Eaton Vance
Floating-Rate Advantage Fund
October 31, 2022
Management and Organization — continued
| | | | | | |
| Name and Year of Birth | | Trust/Portfolio
Position(s) | | Length of Service | | Principal Occupation(s) and Other Directorships
During Past Five Years and Other Relevant Experience |
|
| Noninterested Trustees (continued) |
| | | |
Valerie A. Mosley 1960 | | Trustee | | Since 2014 | | Chairwoman and Chief Executive Officer of Valmo Ventures (a consulting and investment firm). Founder of Upward Wealth, Inc., dba BrightUp, a fintech platform. Formerly, Partner and Senior Vice President, Portfolio Manager and Investment Strategist at Wellington Management Company, LLP (investment management firm) (1992-2012). Formerly, Chief Investment Officer, PG Corbin Asset Management (1990-1992). Formerly worked in institutional corporate bond sales at Kidder Peabody (1986-1990). Other Directorships. Director of DraftKings, Inc. (digital sports entertainment and gaming company) (since September 2020). Director of Envestnet, Inc. (provider of intelligent systems for wealth management and financial wellness) (since 2018). Formerly, Director of Dynex Capital, Inc. (mortgage REIT) (2013-2020) and Director of Groupon, Inc. (e-commerce provider) (2020-2022). |
| | | |
Keith Quinton 1958 | | Trustee | | Since 2018 | | Private investor, researcher and lecturer. Formerly, Independent Investment Committee Member at New Hampshire Retirement System (2017-2021). Formerly, Portfolio Manager and Senior Quantitative Analyst at Fidelity Investments (investment management firm) (2001-2014). Other Directorships. Formerly, Director (2016-2021) and Chairman (2019-2021) of New Hampshire Municipal Bond Bank. |
| | | |
Marcus L. Smith 1966 | | Trustee | | Since 2018 | | Private investor and independent corporate director. Formerly, Chief Investment Officer, Canada (2012-2017), Chief Investment Officer, Asia (2010-2012), Director of Asian Research (2004-2010) and portfolio manager (2001-2017) at MFS Investment Management (investment management firm). Other Directorships. Director of First Industrial Realty Trust, Inc. (an industrial REIT) (since 2021). Director of MSCI Inc. (global provider of investment decision support tools) (since 2017). Formerly, Director of DCT Industrial Trust Inc. (logistics real estate company) (2017-2018). |
| | | |
Susan J. Sutherland 1957 | | Trustee | | Since 2015 | | Private investor. Director of Ascot Group Limited and certain of its subsidiaries (insurance and reinsurance) (since 2017). Formerly, Director of Hagerty Holding Corp. (insurance) (2015-2018) and Montpelier Re Holdings Ltd. (insurance and reinsurance) (2013-2015). Formerly, Associate, Counsel and Partner at Skadden, Arps, Slate, Meagher & Flom LLP (law firm) (1982-2013). Other Directorships. Director of Kairos Acquisition Corp. (insurance/InsurTech acquisition company) (since 2021). |
| | | |
Scott E. Wennerholm 1959 | | Trustee | | Since 2016 | | Private investor. Formerly, Trustee at Wheelock College (postsecondary institution) (2012-2018). Formerly, Consultant at GF Parish Group (executive recruiting firm) (2016-2017). Formerly, Chief Operating Officer and Executive Vice President at BNY Mellon Asset Management (investment management firm) (2005-2011). Formerly, Chief Operating Officer and Chief Financial Officer at Natixis Global Asset Management (investment management firm) (1997-2004). Formerly, Vice President at Fidelity Investments Institutional Services (investment management firm) (1994-1997). Other Directorships. None. |
| | | |
Nancy A. Wiser(1) 1967 | | Trustee | | Since 2022 | | Formerly, Executive Vice President and the Global Head of Operations at Wells Fargo Asset Management (2011-2021). Other Directorships. None. |
| | | | | | |
| Name and Year of Birth | | Trust/Portfolio
Position(s) | | Length of Service | | Principal Occupation(s) During Past Five Years |
|
| Principal Officers who are not Trustees |
| | | |
Eric A. Stein 1980 | | President | | Since 2020 | | Vice President and Chief Investment Officer, Fixed Income of EVM and BMR. Prior to November 1, 2020, Mr. Stein was a co-Director of Eaton Vance’s Global Income Investments. Also Vice President of Calvert Research and Management (“CRM”). |
| | | |
Edward J. Perkin 1972 | | Vice President and Chief Legal Officer | | Since 2009 | | Vice President of EVM and BMR. Also Vice President of CRM. |
| | | |
James F. Kirchner 1967 | | Treasurer | | Since 2007 | | Vice President of EVM and BMR. Also Vice President of CRM. |
Eaton Vance
Floating-Rate Advantage Fund
October 31, 2022
Management and Organization — continued
| | | | | | |
| Name and Year of Birth | | Trust/Portfolio
Position(s) | | Length of Service | | Principal Occupation(s) During Past Five Years |
|
| Principal Officers who are not Trustees (continued) |
| | | |
Nicholas Di Lorenzo 1987 | | Secretary | | Since 2022 | | Formerly, associate (2012-2021) and counsel (2022) at Dechert LLP. |
| | | |
Richard F. Froio 1968 | | Chief Compliance Officer | | Since 2017 | | Vice President of EVM and BMR since 2017. Formerly, Deputy Chief Compliance Officer (Adviser/Funds) and Chief Compliance Officer (Distribution) at PIMCO (2012-2017) and Managing Director at BlackRock/Barclays Global Investors (2009-2012). |
| (1) | Mr. Bowser and Ms. Wiser began serving as Trustees effective April 4, 2022. |
The SAI for the Fund includes additional information about the Trustees and officers of the Fund and the Portfolio and can be obtained without charge on Eaton Vance’s website at www.eatonvance.com or by calling 1-800-262-1122.
Eaton Vance Funds
| | |
| Privacy Notice | | April 2021 |
| | |
| |
| FACTS | | WHAT DOES EATON VANCE DO WITH YOUR
PERSONAL INFORMATION? |
| | | |
| |
| | |
| Why? | | Financial companies choose how they share your personal information. Federal law gives consumers the right to limit some but not all sharing. Federal law also requires us to tell you how we collect, share, and protect your personal information. Please read this notice carefully to understand what we do. |
| | |
| | | |
| What? | | The types of personal information we collect and share depend on the product or service you have with us. This information can include: ∎ Social Security number and income ∎ investment experience and risk tolerance ∎ checking account number and wire transfer instructions |
| | |
| | | |
| How? | | All financial companies need to share customers’ personal information to run their everyday business. In the section below, we list the reasons financial companies can share their customers’ personal information; the reasons Eaton Vance chooses to share; and whether you can limit this sharing. |
| | |
| | | |
| | | | |
Reasons we can share your
personal information | | Does Eaton Vance share? | | Can you limit this sharing? |
| For our everyday business purposes — such as to process your transactions, maintain your account(s), respond to court orders and legal investigations, or report to credit bureaus | | Yes | | No |
| For our marketing purposes — to offer our products and services to you | | Yes | | No |
| For joint marketing with other financial companies | | No | | We don’t share |
| For our investment management affiliates’ everyday business purposes — information about your transactions, experiences, and creditworthiness | | Yes | | Yes |
| For our affiliates’ everyday business purposes — information about your transactions and experiences | | Yes | | No |
| For our affiliates’ everyday business purposes — information about your creditworthiness | | No | | We don’t share |
| For our investment management affiliates to market to you | | Yes | | Yes |
| For our affiliates to market to you | | No | | We don’t share |
| For nonaffiliates to market to you | | No | | We don’t share |
| | |
| To limit our sharing | | Call toll-free 1-800-262-1122 or email: EVPrivacy@eatonvance.com Please note: If you are a new customer, we can begin sharing your information 30 days from the date we sent this notice. When you are no longer our customer, we continue to share your information as described in this notice. However, you can contact us at any time to limit our sharing. |
| | |
| | | |
| | |
| Questions? | | Call toll-free 1-800-262-1122 or email: EVPrivacy@eatonvance.com |
| | |
| | | |
Eaton Vance Funds
| | |
| Privacy Notice — continued | | April 2021 |
| | |
| Who we are |
| Who is providing this notice? | | Eaton Vance Management, Eaton Vance Distributors, Inc., Eaton Vance Trust Company, Eaton Vance Management (International) Limited, Eaton Vance Advisers International Ltd., Eaton Vance Global Advisors Limited, Eaton Vance Management’s Real Estate Investment Group, Boston Management and Research, Calvert Research and Management, Eaton Vance and Calvert Fund Families and our investment advisory affiliates (“Eaton Vance”) (see Investment Management Affiliates definition below) |
| What we do |
| How does Eaton Vance protect my personal information? | | To protect your personal information from unauthorized access and use, we use security measures that comply with federal law. These measures include computer safeguards and secured files and buildings. We have policies governing the proper handling of customer information by personnel and requiring third parties that provide support to adhere to appropriate security standards with respect to such information. |
| How does Eaton Vance collect my personal information? | | We collect your personal information, for example, when you ∎ open an account or make deposits or withdrawals from your account ∎ buy securities from us or make a wire transfer ∎ give us your contact information We also collect your personal information from others, such as credit bureaus, affiliates, or other companies. |
| Why can’t I limit all sharing? | | Federal law gives you the right to limit only ∎ sharing for affiliates’ everyday business purposes — information about your creditworthiness ∎ affiliates from using your information to market to you ∎ sharing for nonaffiliates to market to you State laws and individual companies may give you additional rights to limit sharing. See below for more on your rights under state law. |
| Definitions |
| Investment Management Affiliates | | Eaton Vance Investment Management Affiliates include registered investment advisers, registered broker- dealers, and registered and unregistered funds. Investment Management Affiliates does not include entities associated with Morgan Stanley Wealth Management, such as Morgan Stanley Smith Barney LLC and Morgan Stanley & Co. |
| Affiliates | | Companies related by common ownership or control. They can be financial and nonfinancial companies. ∎ Our affiliates include companies with a Morgan Stanley name and financial companies such as Morgan Stanley Smith Barney LLC and Morgan Stanley & Co. |
| Nonaffiliates | | Companies not related by common ownership or control. They can be financial and nonfinancial companies. ∎ Eaton Vance does not share with nonaffiliates so they can market to you. |
| Joint marketing | | A formal agreement between nonaffiliated financial companies that together market financial products or services to you. ∎ Eaton Vance doesn’t jointly market. |
| Other important information |
Vermont: Except as permitted by law, we will not share personal information we collect about Vermont residents with Nonaffiliates unless you provide us with your written consent to share such information. California: Except as permitted by law, we will not share personal information we collect about California residents with Nonaffiliates and we will limit sharing such personal information with our Affiliates to comply with California privacy laws that apply to us. |
Eaton Vance Funds
IMPORTANT NOTICES
Delivery of Shareholder Documents. The Securities and Exchange Commission (SEC) permits funds to deliver only one copy of shareholder documents, including prospectuses, proxy statements and shareholder reports, to fund investors with multiple accounts at the same residential or post office box address. This practice is often called “householding” and it helps eliminate duplicate mailings to shareholders. Eaton Vance, or your financial intermediary, may household the mailing of your documents indefinitely unless you instruct Eaton Vance, or your financial intermediary, otherwise. If you would prefer that your Eaton Vance documents not be householded, please contact Eaton Vance at 1-800-262-1122, or contact your financial intermediary. Your instructions that householding not apply to delivery of your Eaton Vance documents will typically be effective within 30 days of receipt by Eaton Vance or your financial intermediary.
Portfolio Holdings. Each Eaton Vance Fund and its underlying Portfolio(s) (if applicable) files a schedule of portfolio holdings on Part F to Form N-PORT with the SEC. Certain information filed on Form N-PORT may be viewed on the Eaton Vance website at www.eatonvance.com, by calling Eaton Vance at 1-800-262-1122 or in the EDGAR database on the SEC’s website at www.sec.gov.
Proxy Voting. From time to time, funds are required to vote proxies related to the securities held by the funds. The Eaton Vance Funds or their underlying Portfolios (if applicable) vote proxies according to a set of policies and procedures approved by the Funds’ and Portfolios’ Boards. You may obtain a description of these policies and procedures and information on how the Funds or Portfolios voted proxies relating to portfolio securities during the most recent 12-month period ended June 30, without charge, upon request, by calling 1-800-262-1122 and by accessing the SEC’s website at www.sec.gov.
This Page Intentionally Left Blank
Investment Adviser of Senior Debt Portfolio
Boston Management and Research
Two International Place
Boston, MA 02110
Investment Adviser and Administrator of Eaton Vance Floating-Rate Advantage Fund
Eaton Vance Management
Two International Place
Boston, MA 02110
Principal Underwriter*
Eaton Vance Distributors, Inc.
Two International Place
Boston, MA 02110
(617) 482-8260
Custodian
State Street Bank and Trust Company
State Street Financial Center, One Lincoln Street
Boston, MA 02111
Transfer Agent
BNY Mellon Investment Servicing (US) Inc.
Attn: Eaton Vance Funds
P.O. Box 9653
Providence, RI 02940-9653
(800) 262-1122
Independent Registered Public Accounting Firm
Deloitte & Touche LLP
200 Berkeley Street
Boston, MA 02116-5022
Fund Offices
Two International Place
Boston, MA 02110
| * | FINRA BrokerCheck. Investors may check the background of their Investment Professional by contacting the Financial Industry Regulatory Authority (FINRA). FINRA BrokerCheck is a free tool to help investors check the professional background of current and former FINRA-registered securities firms and brokers. FINRA BrokerCheck is available by calling 1-800-289-9999 and at www.FINRA.org. The FINRA BrokerCheck brochure describing this program is available to investors at www.FINRA.org. |
3232 10.31.22
Eaton Vance
Multi-Asset Credit Fund
Annual Report
October 31, 2022
Commodity Futures Trading Commission Registration. The Commodity Futures Trading Commission (“CFTC”) has adopted regulations that subject registered investment companies and advisers to regulation by the CFTC if a fund invests more than a prescribed level of its assets in certain CFTC-regulated instruments (including futures, certain options and swap agreements) or markets itself as providing investment exposure to such instruments. The investment adviser has claimed an exclusion from the definition of “commodity pool operator” under the Commodity Exchange Act with respect to its management of the Fund. Accordingly, neither the Fund nor the adviser with respect to the operation of the Fund is subject to CFTC regulation. Because of its management of other strategies, the Fund's adviser is registered with the CFTC as a commodity pool operator. The adviser is also registered as a commodity trading advisor.
Fund shares are not insured by the FDIC and are not deposits or other obligations of, or guaranteed by, any depository institution. Shares are subject to investment risks, including possible loss of principal invested.
This report must be preceded or accompanied by a current summary prospectus or prospectus. Before investing, investors should consider carefully the investment objective, risks, and charges and expenses of a mutual fund. This and other important information is contained in the summary prospectus and prospectus, which can be obtained from a financial intermediary. Prospective investors should read the prospectus carefully before investing. For further information, please call 1-800-262-1122.
Annual Report October 31, 2022
Eaton Vance
Multi-Asset Credit Fund
Eaton Vance
Multi-Asset Credit Fund
October 31, 2022
Management’s Discussion of Fund Performance†
Economic and Market Conditions
For fixed-income investors, the dominant themes of the 12-month period ended October 31, 2022, were persistently high inflation rates in the U.S. and around the globe, and central banks’ attempts to tame inflation with interest rate hikes. The result was a period-long sell-off in fixed-income assets, with nearly all major U.S. fixed-income indexes reporting double-digit declines.
In the opening months of the period, U.S. Treasury rates rose against the backdrop of inflationary concerns and anticipation the U.S. Federal Reserve (the Fed) would begin hiking interest rates in 2022.
As the new year began, investors generally expected three relatively modest Fed rate hikes during 2022. But in February, Russia’s invasion of Ukraine sent shock waves through markets worldwide, exacerbating inflationary pressures on energy and food prices. At its March 2022 meeting, the Fed ended a two-year period of near-zero interest rates with a 0.25% increase in the federal funds rate, its first hike since 2018.
As markets recognized the potential for the Fed to raise the federal funds rate at every policy meeting in 2022 to combat inflation, interest rates continued their upward trajectory through most of the spring and summer. At its September meeting, the Fed announced its third straight 0.75% rate hike -- its fifth rate hike of 2022 -- and reaffirmed that fighting inflation remained the central bank’s top priority. By period-end, the Bloomberg U.S. Treasury Index had declined 14.09%.
As spreads widened during the period, investment-grade corporate bonds underperformed Treasurys and suffered one of their worst 12-month periods in U.S. history, with the Bloomberg U.S. Corporate Bond Index (the Corporate Index) declining 19.57%. During the period, lower rated bonds and bonds with longer durations generally underperformed higher rated bonds and bonds with shorter durations. The Corporate Index was concentrated in longer duration bonds rated BBB -- the lowest investment grade credit rating -- that were most affected by the widespread fixed-income sell-off during the period.
Despite a lower overall credit rating, the high yield corporate asset class outperformed both investment-grade assets and Treasurys, as the Bloomberg U.S. Corporate High Yield Index returned -11.76% during the period -- and was one of the few major fixed-income asset classes to deliver a positive return in the final month of the period. In contrast, mortgage-backed securities (MBS) underperformed Treasurys, with the Bloomberg U.S. MBS Index returning -15.04%.
As a result of their very short duration in a period characterized by rising rates, floating-rate loans were a standout asset class during the period. The Morningstar® LSTA® US Leveraged Loan IndexSM, a broad measure of the asset class, returned -1.78% -- outperforming corporate bonds, corporate high yield bonds, municipal bonds, MBS, and Treasurys. Despite a volatile market environment, issuer fundamentals remained strong for floating-rate loans during the period. While the trailing 12-month default rate inched higher -- from 0.20% at the beginning of the period to 0.83% at period-end -- it remained well below the market’s long-term average of 3.20%.
Fund Performance
For the 12-month period ended October 31, 2022, Eaton Vance Multi-Asset Credit Fund (the Fund) returned -7.80% for Class A shares at net asset value (NAV). The Fund underperformed its primary benchmark, the Morningstar® LSTA® US Leveraged Loan IndexSM (the Primary Index), which returned -1.78%; and underperformed its blended benchmark consisting of 50% Morningstar® LSTA® US Leveraged Loan IndexSM and 50% ICE BofA Developed Markets High Yield ex-Subordinated Financials Index-Hedged USD (the Blended Index), which returned -6.60% during the period.
The Blended Index is more representative of the Fund’s investment strategy and holdings than the Primary Index. The Fund seeks total return by investing across multiple areas of the credit markets.
The Fund’s out-of-Index allocation to emerging-market bonds was the largest detractor from performance versus the Blended Index during the period. The Fund’s position in Ukrainian sovereign bonds fell sharply in value following Russia’s invasion in February 2022. The Fund also held positions in Eastern European corporate bonds that declined in price as a result of the war.
The Fund’s underweight position in floating-rate loans also hurt performance relative to the Blended Index, as floating-rate loans were one of the best-performing income asset classes during a period of rising interest rates.
However, the Fund’s floating-rate allocation performed approximately in line with the floating-rate market, as measured by the Primary Index. Within the floating-rate allocation, lack of exposure to a troubled pharmaceutical company and an underweight position in CCC-rated loans contributed to relative performance. Meanwhile, an overweight position in a remote access software company performed poorly and detracted from relative returns during the period.
The Fund’s out-of-Index allocation to mortgage-backed securities and the Fund’s out-of-Index allocation to investment-grade corporate bonds hurt performance versus the Blended Index as well. The Fund’s investments in both asset classes underperformed the Blended Index during the period.
See Endnotes and Additional Disclosures in this report.
Past performance is no guarantee of future results. Returns are historical and are calculated by determining the percentage change in net asset value (NAV) or offering price (as applicable) with all distributions reinvested. Furthermore, returns do not reflect the deduction of taxes that shareholders may have to pay on Fund distributions or upon the redemption of Fund shares. Investment return and principal value will fluctuate so that shares, when redeemed, may be worth more or less than their original cost. Performance for periods less than or equal to one year is cumulative. Performance is for the stated time period only; due to market volatility, current Fund performance may be lower or higher than the quoted return. For performance as of the most recent month-end, please refer to eatonvance.com.
Eaton Vance
Multi-Asset Credit Fund
October 31, 2022
Management’s Discussion of Fund Performance† — continued
In contrast, the Fund’s underweight allocation to high yield corporate bonds contributed to Fund returns versus the Blended Index, as high yield bonds generally underperformed floating-rate loans, the other component of the Blended Index.
Within its high yield allocation, the Fund had a relatively shorter average duration and higher average credit quality than the high yield component of the Blended Index. This asset mix contributed to relative performance as interest rates rose, credit spreads widened, and higher rated bonds outperformed lower rated bonds during the period. In particular, the Fund reduced its exposure to CCC-rated bonds in early 2022, which aided relative returns as BB- and B-rated bonds generally outperformed CCC-rated bonds in the second half of the period.
Security selections within the health care sector contributed to relative returns as well, as the Fund avoided exposure to several companies whose bond prices declined sharply during the period.
In a period marked by a significant fixed-income market decline, the Fund’s cash position also boosted returns versus the Blended Index.
See Endnotes and Additional Disclosures in this report.
Past performance is no guarantee of future results. Returns are historical and are calculated by determining the percentage change in net asset value (NAV) or offering price (as applicable) with all distributions reinvested. Furthermore, returns do not reflect the deduction of taxes that shareholders may have to pay on Fund distributions or upon the redemption of Fund shares. Investment return and principal value will fluctuate so that shares, when redeemed, may be worth more or less than their original cost. Performance for periods less than or equal to one year is cumulative. Performance is for the stated time period only; due to market volatility, current Fund performance may be lower or higher than the quoted return. For performance as of the most recent month-end, please refer to eatonvance.com.
Eaton Vance
Multi-Asset Credit Fund
October 31, 2022
Performance
Portfolio Manager(s) Justin H. Bourgette, CFA, John Redding and Kelley Gerrity of Eaton Vance Management; Jeffrey D. Mueller of Eaton Vance Advisers International Ltd.
| % Average Annual Total Returns1,2 | Class
Inception Date | Performance
Inception Date | One Year | Five Years | Ten Years |
| Class A at NAV | 10/31/2011 | 10/31/2011 | (7.80)% | 1.31% | 2.67% |
| Class A with 3.25% Maximum Sales Charge | — | — | (10.80) | 0.65 | 2.34 |
| Class C at NAV | 10/31/2011 | 10/31/2011 | (8.48) | 0.65 | 2.12 |
| Class C with 1% Maximum Deferred Sales Charge | — | — | (9.36) | 0.65 | 2.12 |
| Class I at NAV | 10/31/2011 | 10/31/2011 | (7.53) | 1.69 | 3.00 |
| Class R6 at NAV | 09/03/2019 | 10/31/2011 | (7.58) | 1.69 | 3.00 |
|
| Morningstar® LSTA® US Leveraged Loan IndexSM | — | — | (1.78)% | 3.07% | 3.61% |
| ICE BofA Developed Markets High Yield ex-Subordinated Financials Index – Hedged USD | — | — | (11.37) | 1.81 | 4.14 |
| Blended Index | — | — | (6.60) | 2.47 | 3.90 |
| % Total Annual Operating Expense Ratios3 | Class A | Class C | Class I | Class R6 |
| | 0.96% | 1.71% | 0.71% | 0.65% |
Growth of $10,000
This graph shows the change in value of a hypothetical investment of $10,000 in Class A of the Fund for the period indicated. For comparison, the same investment is shown in the indicated index.
| Growth of Investment2 | Amount Invested | Period Beginning | At NAV | With Maximum Sales Charge |
| Class C | $10,000 | 10/31/2012 | $12,340 | N.A. |
| Class I, at minimum investment | $1,000,000 | 10/31/2012 | $1,343,661 | N.A. |
| Class R6, at minimum investment | $5,000,000 | 10/31/2012 | $6,719,971 | N.A. |
See Endnotes and Additional Disclosures in this report.
Past performance is no guarantee of future results. Returns are historical and are calculated by determining the percentage change in net asset value (NAV) or offering price (as applicable) with all distributions reinvested. Furthermore, returns do not reflect the deduction of taxes that shareholders may have to pay on Fund distributions or upon the redemption of Fund shares. Investment return and principal value will fluctuate so that shares, when redeemed, may be worth more or less than their original cost. Performance for periods less than or equal to one year is cumulative. Performance is for the stated time period only; due to market volatility, current Fund performance may be lower or higher than the quoted return. For performance as of the most recent month-end, please refer to eatonvance.com.
Eaton Vance
Multi-Asset Credit Fund
October 31, 2022
| Asset Allocation (% of total investments) |
| Credit Quality (% of total investments, excluding common stocks)1 |
Footnotes:
| 1 | Ratings are based on Moody’s Investors Service, Inc. (“Moody’s”), S&P Global Ratings (“S&P”) or Fitch Ratings (“Fitch”), as applicable. For purposes of ratings restrictions, the average of Moody’s, S&P and Fitch is used. Ratings, which are subject to change, apply to the creditworthiness of the issuers of the underlying securities and not to the Fund or its shares. Credit ratings measure the quality of a bond based on the issuer’s creditworthiness, with ratings ranging from AAA, being the highest, to D, being the lowest based on S&P’s measures. Ratings of BBB or higher by S&P or Fitch (Baa or higher by Moody’s) are considered to be investment-grade quality. Credit ratings are based largely on the ratings agency’s analysis at the time of rating. The rating assigned to any particular security is not necessarily a reflection of the issuer’s current financial condition and does not necessarily reflect its assessment of the volatility of a security’s market value or of the liquidity of an investment in the security. Holdings designated as “Not Rated” (if any) are not rated by the national ratings agencies stated above. |
Eaton Vance
Multi-Asset Credit Fund
October 31, 2022
Endnotes and Additional Disclosures
| † | The views expressed in this report are those of the portfolio manager(s) and are current only through the date stated at the top of this page. These views are subject to change at any time based upon market or other conditions, and Eaton Vance and the Fund(s) disclaim any responsibility to update such views. These views may not be relied upon as investment advice and, because investment decisions are based on many factors, may not be relied upon as an indication of trading intent on behalf of any Eaton Vance fund. This commentary may contain statements that are not historical facts, referred to as “forward-looking statements.” The Fund’s actual future results may differ significantly from those stated in any forward-looking statement, depending on factors such as changes in securities or financial markets or general economic conditions, the volume of sales and purchases of Fund shares, the continuation of investment advisory, administrative and service contracts, and other risks discussed from time to time in the Fund’s filings with the Securities and Exchange Commission. |
| | |
| 1 | Morningstar® LSTA® US Leveraged Loan IndexSM is an unmanaged index of the institutional leveraged loan market. Morningstar® LSTA® Leveraged Loan indices are a product of Morningstar, Inc. (“Morningstar”) and have been licensed for use. Morningstar® is a registered trademark of Morningstar licensed for certain use. Loan Syndications and Trading Association® and LSTA® are trademarks of the LSTA licensed for certain use by Morningstar, and further sublicensed by Morningstar for certain use. Neither Morningstar nor LSTA guarantees the accuracy and/or completeness of the Morningstar® LSTA® US Leveraged Loan IndexSM or any data included therein, and shall have no liability for any errors, omissions, or interruptions therein. Unless otherwise stated, index returns do not reflect the effect of any applicable sales charges, commissions, expenses, taxes or leverage, as applicable. It is not possible to invest directly in an index. Prior to August 29, 2022, the index name was S&P/LSTA Leveraged Loan Index. ICE BofA Developed Markets High Yield ex-Subordinated Financials Index – Hedged USD is an unmanaged index of global developed market, below investment grade corporate bonds, USD hedged. ICE® BofA® indices are not for redistribution or other uses; provided “as is”, without warranties, and with no liability. Eaton Vance has prepared this report and ICE Data Indices, LLC does not endorse it, or guarantee, review, or endorse Eaton Vance’s products. BofA® is a licensed registered trademark of Bank of America Corporation in the United States and other countries. The Blended Index consists of 50% Morningstar® LSTA® US Leveraged Loan IndexSM and 50% ICE BofA Developed Markets High Yield ex-Subordinated Financials Index – Hedged USD, rebalanced monthly. Unless otherwise stated, index returns do not reflect the effect of any applicable sales charges, commissions, expenses, taxes or leverage, as applicable. It is not possible to invest directly in an index. |
| 2 | Total Returns at NAV do not include applicable sales charges. If sales charges were deducted, the returns would be lower. Total Returns shown with maximum sales charge reflect the stated maximum sales charge. Unless otherwise stated, performance does not reflect the deduction of taxes on Fund distributions or redemptions of Fund shares. |
| | Performance prior to the inception date of a class may be linked to the performance of an older class of the Fund. This linked performance is adjusted for any applicable sales charge, but is not adjusted for class expense differences. If adjusted for such differences, the performance would be different. The performance of Class R6 is linked to Class I. Performance presented in the Financial Highlights included in the financial statements is not linked.Effective November 5, 2020, Class C shares automatically convert to Class A shares eight years after purchase. The average annual total returns listed for Class C reflect conversion to Class A shares after eight years. Prior to November 5, 2020, Class C shares automatically converted to Class A shares ten years after purchase.Effective September 15, 2018, the Fund changed its investment strategy to invest at least 80% of its net assets (plus any borrowings for investment purposes) in credit-related investments. Prior to September 15, 2018, the Fund was a “fund-of-funds” and invested primarily among other investment companies managed by Eaton Vance and its affiliates that invested in various asset classes. |
| 3 | Source: Fund prospectus. The expense ratios for the current reporting period can be found in the Financial Highlights section of this report. Performance reflects expenses waived and/or reimbursed, if applicable. Without such waivers and/or reimbursements, performance would have been lower. |
| | Fund profile subject to change due to active management. |
| | Additional Information |
| | Bloomberg U.S. Treasury Index measures the performance of U.S. Treasuries with a maturity of one year or more. Bloomberg U.S. Corporate Bond Index measures the performance of investment-grade U.S. corporate securities with a maturity of one year or more. Bloomberg U.S. Corporate High Yield Index measures USD-denominated, non-investment grade corporate securities. Bloomberg U.S. Mortgage Backed Securities Index measures agency mortgage-backed pass-through securities issued by Ginnie Mae (GNMA), Fannie Mae (FNMA), and Freddie Mac (FHLMC). |
| | Duration is a measure of the expected change in price of a bond — in percentage terms — given a one percent change in interest rates, all else being constant. Securities with lower durations tend to be less sensitive to interest rate changes. |
Eaton Vance
Multi-Asset Credit Fund
October 31, 2022
Example
As a Fund shareholder, you incur two types of costs: (1) transaction costs, including sales charges (loads) on purchases and redemption fees (if applicable); and (2) ongoing costs, including management fees; distribution and/or service fees; and other Fund expenses. This Example is intended to help you understand your ongoing costs (in dollars) of Fund investing and to compare these costs with the ongoing costs of investing in other mutual funds. The Example is based on an investment of $1,000 invested at the beginning of the period and held for the entire period (May 1, 2022 to October 31, 2022).
Actual Expenses
The first section of the table below provides information about actual account values and actual expenses. You may use the information in this section, together with the amount you invested, to estimate the expenses that you paid over the period. Simply divide your account value by $1,000 (for example, an $8,600 account value divided by $1,000 = 8.6), then multiply the result by the number in the first section under the heading entitled “Expenses Paid During Period” to estimate the expenses you paid on your account during this period.
Hypothetical Example for Comparison Purposes
The second section of the table below provides information about hypothetical account values and hypothetical expenses based on the actual Fund expense ratio and an assumed rate of return of 5% per year (before expenses), which is not the actual Fund return. The hypothetical account values and expenses may not be used to estimate the actual ending account balance or expenses you paid for the period. You may use this information to compare the ongoing costs of investing in your Fund and other funds. To do so, compare this 5% hypothetical example with the 5% hypothetical examples that appear in the shareholder reports of the other funds.
Please note that the expenses shown in the table are meant to highlight your ongoing costs only and do not reflect any transactional costs, such as sales charges (loads) or redemption fees (if applicable). Therefore, the second section of the table is useful in comparing ongoing costs only, and will not help you determine the relative total costs of owning different funds. In addition, if these transactional costs were included, your costs would be higher.
| | Beginning
Account Value
(5/1/22) | Ending
Account Value
(10/31/22) | Expenses Paid
During Period*
(5/1/22 – 10/31/22) | Annualized
Expense
Ratio |
| Actual | | | | |
| Class A | $1,000.00 | $ 959.60 | $4.74 | 0.96% |
| Class C | $1,000.00 | $ 956.00 | $8.48 | 1.72% |
| Class I | $1,000.00 | $ 961.90 | $3.51 | 0.71% |
| Class R6 | $1,000.00 | $ 961.10 | $3.26 | 0.66% |
| |
| Hypothetical | | | | |
| (5% return per year before expenses) | | | | |
| Class A | $1,000.00 | $1,020.37 | $4.89 | 0.96% |
| Class C | $1,000.00 | $1,016.54 | $8.74 | 1.72% |
| Class I | $1,000.00 | $1,021.63 | $3.62 | 0.71% |
| Class R6 | $1,000.00 | $1,021.88 | $3.36 | 0.66% |
| * | Expenses are equal to the Fund's annualized expense ratio for the indicated Class, multiplied by the average account value over the period, multiplied by 184/365 (to reflect the one-half year period). The Example assumes that the $1,000 was invested at the net asset value per share determined at the close of business on April 30, 2022. |
Eaton Vance
Multi-Asset Credit Fund
October 31, 2022
| Asset-Backed Securities — 5.2% |
| Security | Principal
Amount
(000's omitted) | Value |
| Ares LII CLO, Ltd., Series 2019-52A, Class DR, 7.625%, (3 mo. USD LIBOR + 3.30%), 4/22/31(1)(2) | $ | 1,750 | $ 1,560,001 |
| Benefit Street Partners CLO XIX, Ltd.: | | | |
| Series 2019-19A, Class D, 7.879%, (3 mo. USD LIBOR + 3.80%), 1/15/33(1)(2) | | 1,000 | 904,763 |
| Series 2019-19A, Class E, 11.099%, (3 mo. USD LIBOR + 7.02%), 1/15/33(1)(2) | | 1,000 | 873,120 |
| Benefit Street Partners CLO XVIII, Ltd., Series 2019-18A, Class ER, 10.829%, (3 mo. USD LIBOR + 6.75%), 10/15/34(1)(2) | | 500 | 428,368 |
| BlueMountain CLO XXVI, Ltd., Series 2019-26A, Class ER, 11.373%, (3 mo. USD LIBOR + 7.13%), 10/20/34(1)(2) | | 500 | 416,849 |
| BlueMountain CLO, Ltd., Series 2018-1A, Class E, 10.365%, (3 mo. USD LIBOR + 5.95%), 7/30/30(1)(2) | | 250 | 191,050 |
| Canyon Capital CLO, Ltd., Series 2020-3A, Class E, 11.329%, (3 mo. USD LIBOR + 7.25%), 1/15/34(1)(2) | | 1,000 | 890,950 |
| Carlyle Global Market Strategies CLO, Ltd.: | | | |
| Series 2014-3RA, Class C, 7.308%, (3 mo. USD LIBOR + 2.95%), 7/27/31(1)(2) | | 2,725 | 2,341,388 |
| Series 2014-4RA, Class C, 6.979%, (3 mo. USD LIBOR + 2.90%), 7/15/30(1)(2) | | 2,000 | 1,714,230 |
| Series 2014-4RA, Class D, 9.729%, (3 mo. USD LIBOR + 5.65%), 7/15/30(1)(2) | | 250 | 191,926 |
| Series 2015-5A, Class DR, 10.943%, (3 mo. USD LIBOR + 6.70%), 1/20/32(1)(2) | | 250 | 204,608 |
| Coinstar Funding, LLC, Series 2017-1A, Class A2, 5.216%, 4/25/47(1) | | 61 | 57,027 |
| Crown City CLO III, Series 2021-1A, Class C, 7.543%, (3 mo. USD LIBOR + 3.30%), 7/20/34(1)(2) | | 1,000 | 842,897 |
| Golub Capital Partners CLO 53B, Ltd., Series 2021-53A, Class E, 10.943%, (3 mo. USD LIBOR + 6.70%), 7/20/34(1)(2) | | 500 | 413,919 |
| Golub Capital Partners CLO 60B, Ltd., Series 2022-60A, Class D, 7.83%, (3 mo. SOFR + 3.77%), 10/25/34(1)(2) | | 2,000 | 1,799,846 |
| Madison Park Funding XXXVI, Ltd.: | | | |
| Series 2019-36A, Class D1R, 7.364%, (3 mo. SOFR + 3.50%), 4/15/35(1)(2) | | 1,000 | 903,577 |
| Series 2019-36A, Class ER, 10.914%, (3 mo. SOFR + 7.05%), 4/15/35(1)(2) | | 1,000 | 863,802 |
| Neuberger Berman CLO XXII, Ltd., Series 2016-22A, Class ER, 10.139%, (3 mo. USD LIBOR + 6.06%), 10/17/30(1)(2) | | 250 | 211,933 |
| Neuberger Berman Loan Advisers CLO 39, Ltd., Series 2020-39A, Class E, 11.443%, (3 mo. USD LIBOR + 7.20%), 1/20/32(1)(2) | | 1,500 | 1,373,704 |
| Palmer Square CLO, Ltd.: | | | |
| Series 2013-2A, Class DRR, 9.929%, (3 mo. USD LIBOR + 5.85%), 10/17/31(1)(2) | | 250 | 211,390 |
| Security | Principal
Amount
(000's omitted) | Value |
| Palmer Square CLO, Ltd.: (continued) | | | |
| Series 2015-1A, Class DR4, 9.484%, (3 mo. USD LIBOR + 6.50%), 5/21/34(1)(2) | $ | 1,000 | $ 850,097 |
| Series 2019-1A, Class DR, 9.405%, (3 mo. USD LIBOR + 6.50%), 11/14/34(1)(2) | | 500 | 426,522 |
| Series 2021-2A, Class E, 10.429%, (3 mo. USD LIBOR + 6.35%), 7/15/34(1)(2) | | 1,000 | 886,353 |
| RAD CLO 5, Ltd., Series 2019-5A, Class E, 11.025%, (3 mo. USD LIBOR + 6.70%), 7/24/32(1)(2) | | 500 | 418,950 |
| Regatta XIV Funding, Ltd., Series 2018-3A, Class E, 10.308%, (3 mo. USD LIBOR + 5.95%), 10/25/31(1)(2) | | 1,000 | 804,144 |
| Regatta XV Funding, Ltd., Series 2018-4A, Class D, 10.858%, (3 mo. USD LIBOR + 6.50%), 10/25/31(1)(2) | | 250 | 200,754 |
| Theorem Funding Trust, Series 2022-3A, Class A, 7.599%, 4/15/29(1)(3) | | 634 | 632,234 |
| Voya CLO, Ltd., Series 2016-3A, Class DR, 10.274%, (3 mo. USD LIBOR + 6.08%), 10/18/31(1)(2) | | 250 | 183,160 |
Total Asset-Backed Securities
(identified cost $23,616,415) | | | $ 20,797,562 |
| Collateralized Mortgage Obligations — 0.4% |
| Security | Principal
Amount
(000's omitted) | Value |
| Federal Home Loan Mortgage Corp., Series 5160, Class ZY, 3.00%, 10/25/50 | $ | 734 | $ 544,696 |
| PNMAC GMSR Issuer Trust, Series 2018-GT2, Class A, 6.236%, (1 mo. USD LIBOR + 2.65%), 8/25/25(1)(2) | | 117 | 115,483 |
| Unison Trust, Series 2021-1, Class A, 4.50%, 4/25/50(1)(4) | | 1,223 | 1,118,457 |
Total Collateralized Mortgage Obligations
(identified cost $2,057,682) | | | $ 1,778,636 |
| Commercial Mortgage-Backed Securities — 3.1% |
| Security | Principal
Amount*
(000's omitted) | Value |
| BAMLL Commercial Mortgage Securities Trust, Series 2019-BPR, Class ENM, 3.843%, 11/5/32(1)(4) | | 600 | $ 438,908 |
| BBCMS Mortgage Trust: | | | |
| Series 2017-C1, Class D, 3.495%, 2/15/50(1)(4) | | 1,000 | 746,105 |
| Series 2017-DELC, Class D, 5.237%, (1 mo. USD LIBOR + 1.70%), 8/15/36(1)(2) | | 1,200 | 1,145,050 |
| BX Trust, Series 2018-EXCL, Class C, 5.388%, (1 mo. USD LIBOR + 1.975%), 9/15/37(1)(2) | | 980 | 917,012 |
8
See Notes to Financial Statements.
Eaton Vance
Multi-Asset Credit Fund
October 31, 2022
Portfolio of Investments — continued
| Security | Principal
Amount*
(000's omitted) | Value |
| Citigroup Commercial Mortgage Trust, Series 2013-GC11, Class C, 4.134%, 4/10/46(4) | | 200 | $ 196,353 |
| COMM Mortgage Trust, Series 2014-CR21, Class C, 4.419%, 12/10/47(4) | | 738 | 664,373 |
| CSMC Trust: | | | |
| Series 2022-CNTR, Class A, 7.32%, (1 mo. SOFR + 3.944%), 1/15/24(1)(2) | | 1,000 | 934,519 |
| Series 2022-NWPT, Class A, 6.519%, (1 mo. SOFR + 3.143%), 9/9/24(1)(2) | | 290 | 287,434 |
| JPMBB Commercial Mortgage Securities Trust: | | | |
| Series 2014-C19, Class B, 4.394%, 4/15/47(4) | | 215 | 204,909 |
| Series 2014-C23, Class D, 3.983%, 9/15/47(1)(4) | | 750 | 645,987 |
| JPMorgan Chase Commercial Mortgage Securities Trust: | | | |
| Series 2014-DSTY, Class B, 3.771%, 6/10/27(1) | | 150 | 29,925 |
| Series 2021-MHC, Class C, 4.712%, (1 mo. USD LIBOR + 1.30%), 4/15/38(1)(2) | | 1,800 | 1,702,978 |
| Morgan Stanley Capital I Trust, Series 2019-BPR, Class A, 5.062%, (1 mo. USD LIBOR + 1.65%), 5/15/36(1)(2)(5) | | 438 | 420,332 |
| Natixis Commercial Mortgage Securities Trust, Series 2018-FL1, Class C, 5.612%, (1 mo. USD LIBOR + 2.20%), 6/15/35(1)(2) | | 100 | 88,946 |
| Vita Scientia, Series 2022-1A, Class D, 3.008%, (3 mo. EURIBOR + 2.49%), 8/27/25(1)(2) | EUR | 450 | 392,674 |
| VMC Finance, LLC, Series 2021-HT1, Class B, 7.943%, (1 mo. USD LIBOR + 4.50%), 1/18/37(1)(2) | | 2,000 | 1,848,488 |
| Wells Fargo Commercial Mortgage Trust: | | | |
| Series 2015-LC22, Class C, 4.556%, 9/15/58(4) | | 100 | 91,707 |
| Series 2016-C35, Class D, 3.142%, 7/15/48(1) | | 1,700 | 1,258,168 |
| WFRBS Commercial Mortgage Trust, Series 2013-C16, Class B, 4.981%, 9/15/46(4) | | 640 | 606,085 |
Total Commercial Mortgage-Backed Securities
(identified cost $13,590,660) | | | $ 12,619,953 |
| Security | Shares | Value |
| Electronics/Electrical — 0.0%(6) |
| Riverbed Technology, Inc.(7)(8) | | 846 | $ 425 |
| | | | $ 425 |
| Oil and Gas — 0.0% |
| Sable Permian Resources, LLC(7)(8)(9) | | 11,719,991 | $ 0 |
| | | | $ 0 |
Total Common Stocks
(identified cost $11,473,746) | | | $ 425 |
| Security | Principal
Amount
(000's omitted) | Value |
| Leisure Goods/Activities/Movies — 0.2% |
| Peloton Interactive, Inc., 0.00%, 2/15/26 | $ | 741 | $ 533,552 |
| | | | $ 533,552 |
| Technology — 0.0%(6) |
| 1Life Healthcare, Inc., 3.00%, 6/15/25 | $ | 75 | $ 72,975 |
| | | | $ 72,975 |
Total Convertible Bonds
(identified cost $712,956) | | | $ 606,527 |
| Convertible Preferred Stocks — 0.0%(6) |
| Security | Shares | Value |
| Electronics/Electrical — 0.0%(6) |
| Riverbed Technology, Inc., Series A, 6.50%, (1.50% cash, 5.00% PIK)(7)(8) | | 2,611 | $ 2,611 |
Total Convertible Preferred Stocks
(identified cost $78,328) | | | $ 2,611 |
| Security | Principal
Amount*
(000's omitted) | Value |
| Aerospace and Defense — 1.1% |
| Moog, Inc., 4.25%, 12/15/27(1) | | 791 | $ 709,096 |
| Rolls-Royce PLC, 5.75%, 10/15/27(1) | | 1,200 | 1,087,608 |
| TransDigm UK Holdings PLC, 6.875%, 5/15/26 | | 400 | 390,960 |
| TransDigm, Inc.: | | | |
| 4.625%, 1/15/29 | | 343 | 292,631 |
| 5.50%, 11/15/27 | | 743 | 678,983 |
| 6.375%, 6/15/26 | | 818 | 790,458 |
| 7.50%, 3/15/27 | | 541 | 533,902 |
| | | | $ 4,483,638 |
| Agriculture — 0.2% |
| Darling Ingredients, Inc., 6.00%, 6/15/30(1) | | 559 | $ 538,795 |
| Kernel Holding S.A., 6.75%, 10/27/27(10) | | 750 | 247,125 |
| | | | $ 785,920 |
9
See Notes to Financial Statements.
Eaton Vance
Multi-Asset Credit Fund
October 31, 2022
Portfolio of Investments — continued
| Security | Principal
Amount*
(000's omitted) | Value |
| Air Transport — 0.7% |
| Air France-KLM, 1.875%, 1/16/25(10) | EUR | 400 | $ 353,716 |
| American Airlines, Inc./AAdvantage Loyalty IP, Ltd.: | | | |
| 5.50%, 4/20/26(1) | | 778 | 742,159 |
| 5.75%, 4/20/29(1) | | 128 | 116,709 |
| Deutsche Lufthansa AG, 2.875%, 2/11/25(10) | EUR | 400 | 369,583 |
| Gatwick Airport Finance PLC, 4.375%, 4/7/26(10) | GBP | 1,050 | 1,005,035 |
| United Airlines, Inc., 4.625%, 4/15/29(1) | | 195 | 167,120 |
| | | | $ 2,754,322 |
| Automotive — 1.9% |
| Allison Transmission, Inc., 3.75%, 1/30/31(1) | | 118 | $ 94,429 |
| Asbury Automotive Group, Inc.: | | | |
| 4.625%, 11/15/29(1) | | 392 | 323,384 |
| 4.75%, 3/1/30 | | 303 | 248,720 |
| Clarios Global, L.P./Clarios US Finance Co.: | | | |
| 4.375%, 5/15/26(10) | EUR | 1,777 | 1,646,801 |
| 8.50%, 5/15/27(1) | | 670 | 657,736 |
| Faurecia S.E.: | | | |
| 2.375%, 6/15/29(10) | EUR | 350 | 262,304 |
| 2.75%, 2/15/27(10) | EUR | 700 | 594,448 |
| Ford Motor Co.: | | | |
| 4.75%, 1/15/43 | | 325 | 226,907 |
| 6.625%, 10/1/28 | | 825 | 814,927 |
| 9.625%, 4/22/30 | | 44 | 49,176 |
| Goodyear Tire & Rubber Co. (The): | | | |
| 5.00%, 7/15/29 | | 935 | 813,235 |
| 5.25%, 7/15/31 | | 511 | 433,635 |
| Lithia Motors, Inc.: | | | |
| 3.875%, 6/1/29(1) | | 398 | 321,773 |
| 4.375%, 1/15/31(1) | | 452 | 367,686 |
| Real Hero Merger Sub 2, Inc., 6.25%, 2/1/29(1) | | 117 | 84,162 |
| Sonic Automotive, Inc.: | | | |
| 4.625%, 11/15/29(1) | | 587 | 461,285 |
| 4.875%, 11/15/31(1) | | 239 | 180,786 |
| Wheel Pros, Inc., 6.50%, 5/15/29(1) | | 406 | 191,690 |
| | | | $ 7,773,084 |
| Banks and Thrifts — 0.1% |
| SVB Financial Group, 4.10% to 2/15/31(11)(12) | | 720 | $ 446,209 |
| | | | $ 446,209 |
| Building and Development — 1.9% |
| Brookfield Property REIT, Inc./BPR Cumulus, LLC/BPR Nimbus, LLC/GGSI Sellco, LLC, 4.50%, 4/1/27(1) | | 391 | $ 333,492 |
| Security | Principal
Amount*
(000's omitted) | Value |
| Building and Development (continued) |
| Builders FirstSource, Inc.: | | | |
| 4.25%, 2/1/32(1) | | 335 | $ 268,631 |
| 5.00%, 3/1/30(1) | | 105 | 90,333 |
| Greystar Real Estate Partners, LLC, 5.75%, 12/1/25(1) | | 550 | 532,854 |
| HT Troplast GmbH, 9.25%, 7/15/25(10) | EUR | 1,465 | 1,266,740 |
| KB Home: | | | |
| 4.00%, 6/15/31 | | 26 | 19,732 |
| 4.80%, 11/15/29 | | 170 | 139,015 |
| MIWD Holdco II, LLC/MIWD Finance Corp., 5.50%, 2/1/30(1) | | 490 | 378,714 |
| Oscar AcquisitionCo, LLC/Oscar Finance, Inc., 9.50%, 4/15/30(1) | | 188 | 159,638 |
| Patrick Industries, Inc., 7.50%, 10/15/27(1) | | 70 | 64,472 |
| Smyrna Ready Mix Concrete, LLC, 6.00%, 11/1/28(1) | | 1,478 | 1,245,688 |
| Standard Industries, Inc.: | | | |
| 2.25%, 11/21/26(10) | EUR | 1,500 | 1,233,595 |
| 4.75%, 1/15/28(1) | | 753 | 661,676 |
| Victoria PLC, 3.625%, 8/24/26(10) | EUR | 1,658 | 1,279,855 |
| | | | $ 7,674,435 |
| Business Equipment and Services — 1.0% |
| Adtalem Global Education, Inc., 5.50%, 3/1/28(1) | | 680 | $ 621,513 |
| Allied Universal Holdco, LLC/Allied Universal Finance Corp./Atlas Luxco 4 S.a.r.l.: | | | |
| 3.625%, 6/1/28(10) | EUR | 350 | 278,426 |
| 4.625%, 6/1/28(1) | | 239 | 195,975 |
| GEMS MENASA Cayman, Ltd./GEMS Education Delaware, LLC: | | | |
| 7.125%, 7/31/26(1) | | 1,535 | 1,454,367 |
| 7.125%, 7/31/26(10) | | 260 | 246,342 |
| Terminix Co., LLC (The), 7.45%, 8/15/27 | | 973 | 1,086,140 |
| | | | $ 3,882,763 |
| Cable and Satellite Television — 1.2% |
| Altice France S.A.: | | | |
| 5.875%, 2/1/27(10) | EUR | 752 | $ 647,437 |
| 8.125%, 2/1/27(1) | | 795 | 729,015 |
| CCO Holdings, LLC/CCO Holdings Capital Corp.: | | | |
| 4.25%, 2/1/31(1) | | 565 | 447,285 |
| 4.50%, 8/15/30(1) | | 900 | 731,952 |
| 4.75%, 3/1/30(1) | | 1,288 | 1,084,709 |
| 4.75%, 2/1/32(1) | | 225 | 180,544 |
| 5.00%, 2/1/28(1) | | 400 | 362,696 |
| 6.375%, 9/1/29(1) | | 601 | 554,777 |
10
See Notes to Financial Statements.
Eaton Vance
Multi-Asset Credit Fund
October 31, 2022
Portfolio of Investments — continued
| Security | Principal
Amount*
(000's omitted) | Value |
| Cable and Satellite Television (continued) |
| Virgin Media Vendor Financing Notes III DAC, 4.875%, 7/15/28(10) | GBP | 181 | $ 166,979 |
| | | | $ 4,905,394 |
| Capital Goods — 0.2% |
| BWX Technologies, Inc.: | | | |
| 4.125%, 6/30/28(1) | | 576 | $ 504,841 |
| 4.125%, 4/15/29(1) | | 221 | 191,397 |
| | | | $ 696,238 |
| Chemicals and Plastics — 1.2% |
| ASP Unifrax Holdings, Inc., 5.25%, 9/30/28(1) | | 147 | $ 117,257 |
| Avient Corp., 7.125%, 8/1/30(1) | | 240 | 229,823 |
| Braskem Idesa SAPI, 7.45%, 11/15/29(10) | | 1,150 | 882,596 |
| Herens Holdco S.a.r.l., 4.75%, 5/15/28(1) | | 452 | 370,951 |
| Herens Midco S.a.r.l., 5.25%, 5/15/29(10) | EUR | 600 | 386,307 |
| INEOS Quattro Finance 2 PLC, 2.50%, 1/15/26(10) | EUR | 440 | 364,593 |
| NOVA Chemicals Corp., 4.875%, 6/1/24(1) | | 259 | 252,461 |
| Nufarm Australia, Ltd./Nufarm Americas, Inc., 5.00%, 1/27/30(1) | | 583 | 493,982 |
| SPCM S.A.: | | | |
| 2.625%, 2/1/29(10) | EUR | 117 | 89,596 |
| 2.625%, 2/1/29(1) | EUR | 100 | 76,577 |
| Univar Solutions USA, Inc., 5.125%, 12/1/27(1) | | 300 | 277,935 |
| Valvoline, Inc.: | | | |
| 3.625%, 6/15/31(1) | | 256 | 202,344 |
| 4.25%, 2/15/30(1) | | 370 | 356,684 |
| W.R. Grace Holdings, LLC, 4.875%, 6/15/27(1) | | 639 | 559,924 |
| | | | $ 4,661,030 |
| Clothing/Textiles — 0.2% |
| William Carter Co. (The), 5.625%, 3/15/27(1) | | 678 | $ 645,511 |
| | | | $ 645,511 |
| Commercial Services — 1.6% |
| APi Group DE, Inc., 4.75%, 10/15/29(1) | | 914 | $ 771,775 |
| Autostrade per l'Italia SpA: | | | |
| 1.75%, 2/1/27(10) | EUR | 350 | 303,630 |
| 2.00%, 12/4/28(10) | EUR | 100 | 81,741 |
| EC Finance PLC, 3.00%, 10/15/26(10) | EUR | 381 | 333,581 |
| HealthEquity, Inc., 4.50%, 10/1/29(1) | | 718 | 628,250 |
| Korn Ferry, 4.625%, 12/15/27(1) | | 620 | 564,870 |
| LABL, Inc., 5.875%, 11/1/28(1) | | 598 | 520,580 |
| Metis Merger Sub, LLC, 6.50%, 5/15/29(1) | | 395 | 317,939 |
| Security | Principal
Amount*
(000's omitted) | Value |
| Commercial Services (continued) |
| MoneyGram International, Inc., 5.375%, 8/1/26(1) | | 437 | $ 429,781 |
| NESCO Holdings II, Inc., 5.50%, 4/15/29(1) | | 349 | 306,748 |
| Verisure Holding AB: | | | |
| 3.25%, 2/15/27(10) | EUR | 600 | 505,796 |
| 3.875%, 7/15/26(10) | EUR | 230 | 203,971 |
| Verisure Midholding AB, 5.25%, 2/15/29(10) | EUR | 380 | 289,586 |
| WASH Multifamily Acquisition, Inc., 5.75%, 4/15/26(1) | | 1,110 | 1,036,761 |
| | | | $ 6,295,009 |
| Computers — 0.5% |
| Booz Allen Hamilton, Inc., 3.875%, 9/1/28(1) | | 1,238 | $ 1,093,030 |
| NCR Corp.: | | | |
| 5.125%, 4/15/29(1) | | 53 | 44,597 |
| 5.25%, 10/1/30(1) | | 42 | 33,985 |
| Presidio Holdings, Inc., 8.25%, 2/1/28(1) | | 763 | 680,146 |
| | | | $ 1,851,758 |
| Conglomerates — 0.2% |
| Spectrum Brands, Inc.: | | | |
| 5.00%, 10/1/29(1) | | 325 | $ 268,125 |
| 5.50%, 7/15/30(1) | | 467 | 375,628 |
| | | | $ 643,753 |
| Consumer Products — 0.2% |
| Central Garden & Pet Co., 4.125%, 10/15/30 | | 731 | $ 605,254 |
| | | | $ 605,254 |
| Containers and Glass Products — 0.6% |
| Ardagh Metal Packaging Finance USA, LLC/Ardagh Metal Packaging Finance PLC, 3.00%, 9/1/29(10) | EUR | 500 | $ 354,806 |
| Canpack S.A./Canpack US, LLC, 3.875%, 11/15/29(1) | | 1,114 | 886,889 |
| Crown Americas, LLC/Crown Americas Capital Corp. VI, 4.75%, 2/1/26 | | 846 | 811,064 |
| Verallia S.A., 1.875%, 11/10/31(10) | EUR | 700 | 512,640 |
| | | | $ 2,565,399 |
| Cosmetics/Toiletries — 0.2% |
| Edgewell Personal Care Co.: | | | |
| 4.125%, 4/1/29(1) | | 238 | $ 203,609 |
| 5.50%, 6/1/28(1) | | 650 | 612,596 |
| | | | $ 816,205 |
| Distribution & Wholesale — 0.7% |
| BCPE Empire Holdings, Inc., 7.625%, 5/1/27(1) | | 1,138 | $ 1,042,201 |
11
See Notes to Financial Statements.
Eaton Vance
Multi-Asset Credit Fund
October 31, 2022
Portfolio of Investments — continued
| Security | Principal
Amount*
(000's omitted) | Value |
| Distribution & Wholesale (continued) |
| Parts Europe S.A., 5.456%, (3 mo. EURIBOR + 4.00%), 7/20/27(2)(10) | EUR | 581 | $ 559,876 |
| Performance Food Group, Inc.: | | | |
| 4.25%, 8/1/29(1) | | 551 | 468,102 |
| 5.50%, 10/15/27(1) | | 450 | 426,535 |
| 6.875%, 5/1/25(1) | | 209 | 208,797 |
| | | | $ 2,705,511 |
| Diversified Financial Services — 2.9% |
| ADLER Group S.A., 2.75%, 11/13/26(10) | EUR | 100 | $ 42,989 |
| AG TTMT Escrow Issuer, LLC, 8.625%, 9/30/27(1) | | 345 | 346,756 |
| Encore Capital Group, Inc.: | | | |
| 5.375%, 2/15/26(10) | GBP | 555 | 556,915 |
| 5.628%, (3 mo. EURIBOR + 4.25%), 1/15/28(2)(10) | EUR | 643 | 572,647 |
| Jane Street Group/JSG Finance, Inc., 4.50%, 11/15/29(1) | | 482 | 427,122 |
| Jefferson Capital Holdings, LLC, 6.00%, 8/15/26(1) | | 798 | 665,532 |
| KOC Holding AS, 6.50%, 3/11/25(10) | | 1,400 | 1,331,134 |
| Lincoln Financing S.a.r.l., 3.625%, 4/1/24(10) | EUR | 1,147 | 1,103,994 |
| Oxford Finance, LLC/Oxford Finance Co-Issuer II, Inc., 6.375%, 2/1/27(1) | | 443 | 406,085 |
| PRA Group, Inc.: | | | |
| 5.00%, 10/1/29(1) | | 186 | 149,445 |
| 7.375%, 9/1/25(1) | | 784 | 751,056 |
| ProGroup AG, 3.00%, 3/31/26(10) | EUR | 1,631 | 1,421,834 |
| Rocket Mortgage, LLC/Rocket Mortgage Co.-Issuer, Inc.: | | | |
| 2.875%, 10/15/26(1) | | 365 | 305,583 |
| 3.625%, 3/1/29(1) | | 364 | 283,050 |
| 4.00%, 10/15/33(1) | | 65 | 45,557 |
| Sherwood Financing PLC, 6.00%, 11/15/26(10) | GBP | 934 | 782,982 |
| VistaJet Malta Finance PLC/XO Management Holding, Inc., 6.375%, 2/1/30(1) | | 635 | 528,711 |
| Vivion Investments S.a.r.l., 3.00%, 8/8/24(10) | EUR | 2,500 | 2,127,380 |
| | | | $ 11,848,772 |
| Drugs — 0.7% |
| AdaptHealth, LLC: | | | |
| 5.125%, 3/1/30(1) | | 318 | $ 276,561 |
| 6.125%, 8/1/28(1) | | 658 | 609,472 |
| Catalent Pharma Solutions, Inc., 2.375%, 3/1/28(10) | EUR | 824 | 686,397 |
| Endo DAC/Endo Finance, LLC/Endo Finco, Inc., 5.875%, 10/15/24(1) | | 400 | 318,076 |
| Endo Luxembourg Finance Co. I S.a.r.l./Endo US, Inc., 6.125%, 4/1/29(1) | | 459 | 347,831 |
| Perrigo Finance Unlimited Co., 4.40%, 6/15/30 | | 899 | 753,335 |
| | | | $ 2,991,672 |
| Security | Principal
Amount*
(000's omitted) | Value |
| Ecological Services and Equipment — 1.1% |
| Clean Harbors, Inc.: | | | |
| 4.875%, 7/15/27(1) | | 200 | $ 188,509 |
| 5.125%, 7/15/29(1) | | 674 | 625,863 |
| Covanta Holding Corp., 4.875%, 12/1/29(1) | | 750 | 640,391 |
| GFL Environmental, Inc.: | | | |
| 3.50%, 9/1/28(1) | | 1,032 | 877,659 |
| 4.25%, 6/1/25(1) | | 313 | 299,269 |
| 4.75%, 6/15/29(1) | | 1,106 | 966,464 |
| Paprec Holding S.A.: | | | |
| 3.50%, 7/1/28(10) | EUR | 716 | 567,573 |
| 4.00%, 3/31/25(10) | EUR | 400 | 366,641 |
| | | | $ 4,532,369 |
| Electric Utilities — 0.8% |
| Drax Finco PLC, 6.625%, 11/1/25(1) | | 582 | $ 542,055 |
| EDP - Energias de Portugal S.A., 4.496% to 1/30/24, 4/30/79(10)(12) | EUR | 1,100 | 1,064,686 |
| FirstEnergy Corp.: | | | |
| 2.65%, 3/1/30 | | 585 | 474,233 |
| Series B, 4.40%, 7/15/27 | | 494 | 464,740 |
| Pattern Energy Operations, L.P./Pattern Energy Operations, Inc., 4.50%, 8/15/28(1) | | 578 | 521,173 |
| WESCO Distribution, Inc., 7.25%, 6/15/28(1) | | 267 | 271,247 |
| | | | $ 3,338,134 |
| Electronics/Electrical — 0.7% |
| Coherent Corp., 5.00%, 12/15/29(1) | | 714 | $ 614,254 |
| Imola Merger Corp., 4.75%, 5/15/29(1) | | 964 | 832,843 |
| Open Text Corp., 3.875%, 2/15/28(1) | | 798 | 684,660 |
| Sensata Technologies B.V., 5.00%, 10/1/25(1) | | 436 | 423,425 |
| Sensata Technologies, Inc., 4.375%, 2/15/30(1) | | 360 | 310,176 |
| | | | $ 2,865,358 |
| Energy — 0.7% |
| Enviva Partners, L.P./Enviva Partners Finance Corp., 6.50%, 1/15/26(1) | | 1,078 | $ 1,036,643 |
| New Fortress Energy, Inc., 6.50%, 9/30/26(1) | | 941 | 914,657 |
| Sunoco, L.P./Sunoco Finance Corp.: | | | |
| 4.50%, 5/15/29 | | 583 | 502,152 |
| 4.50%, 4/30/30 | | 372 | 317,299 |
| | | | $ 2,770,751 |
| Engineering & Construction — 0.4% |
| Brundage-Bone Concrete Pumping Holdings, Inc., 6.00%, 2/1/26(1) | | 42 | $ 38,074 |
12
See Notes to Financial Statements.
Eaton Vance
Multi-Asset Credit Fund
October 31, 2022
Portfolio of Investments — continued
| Security | Principal
Amount*
(000's omitted) | Value |
| Engineering & Construction (continued) |
| Cellnex Finance Co. S.A., 2.25%, 4/12/26(10) | EUR | 600 | $ 540,963 |
| Dycom Industries, Inc., 4.50%, 4/15/29(1) | | 377 | 329,334 |
| TopBuild Corp., 4.125%, 2/15/32(1) | | 791 | 620,467 |
| | | | $ 1,528,838 |
| Entertainment — 1.6% |
| Caesars Entertainment, Inc.: | | | |
| 6.25%, 7/1/25(1) | | 1,031 | $ 1,007,542 |
| 8.125%, 7/1/27(1) | | 508 | 494,921 |
| CDI Escrow Issuer, Inc., 5.75%, 4/1/30(1) | | 519 | 469,176 |
| CPUK Finance, Ltd., 4.875%, 8/28/25(10) | GBP | 1,130 | 1,177,428 |
| Jacobs Entertainment, Inc., 6.75%, 2/15/29(1) | | 755 | 666,918 |
| Live Nation Entertainment, Inc., 4.75%, 10/15/27(1) | | 342 | 304,794 |
| Lottomatica SpA: | | | |
| 5.125%, 7/15/25(10) | EUR | 365 | 337,232 |
| 6.25%, 7/15/25(10) | EUR | 300 | 282,182 |
| Scientific Games International, Inc., 7.00%, 5/15/28(1) | | 982 | 952,452 |
| Speedway Motorsports, LLC/Speedway Funding II, Inc., 4.875%, 11/1/27(1) | | 796 | 692,783 |
| | | | $ 6,385,428 |
| Environmental — 0.1% |
| Clearway Energy Operating, LLC, 4.75%, 3/15/28(1) | | 350 | $ 324,283 |
| | | | $ 324,283 |
| Financial Intermediaries — 1.2% |
| Ally Financial, Inc., Series B, 4.70% to 5/15/26(11)(12) | | 635 | $ 462,359 |
| Compass Group Diversified Holdings, LLC, 5.25%, 4/15/29(1) | | 160 | 138,006 |
| Ford Motor Credit Co., LLC: | | | |
| 2.70%, 8/10/26 | | 800 | 694,184 |
| 2.90%, 2/16/28 | | 203 | 165,294 |
| 3.815%, 11/2/27 | | 641 | 552,082 |
| 4.125%, 8/17/27 | | 457 | 406,817 |
| 5.113%, 5/3/29 | | 300 | 268,723 |
| 5.125%, 6/16/25 | | 273 | 263,824 |
| Icahn Enterprises, L.P./Icahn Enterprises Finance Corp.: | | | |
| 6.25%, 5/15/26 | | 300 | 288,552 |
| 6.375%, 12/15/25 | | 680 | 661,681 |
| MSCI, Inc.: | | | |
| 3.625%, 9/1/30(1) | | 357 | 298,934 |
| 3.875%, 2/15/31(1) | | 592 | 499,900 |
| | | | $ 4,700,356 |
| Security | Principal
Amount*
(000's omitted) | Value |
| Food Products — 0.8% |
| Kraft Heinz Foods Co.: | | | |
| 3.875%, 5/15/27 | | 379 | $ 355,377 |
| 4.25%, 3/1/31 | | 587 | 530,832 |
| 4.375%, 6/1/46 | | 164 | 128,318 |
| 4.625%, 10/1/39 | | 17 | 14,122 |
| 5.50%, 6/1/50 | | 37 | 33,963 |
| Nomad Foods Bondco PLC, 2.50%, 6/24/28(10) | EUR | 1,302 | 1,037,274 |
| Pilgrim's Pride Corp., 3.50%, 3/1/32(1) | | 1,123 | 862,705 |
| Post Holdings, Inc., 5.625%, 1/15/28(1) | | 363 | 339,841 |
| | | | $ 3,302,432 |
| Food Service — 0.6% |
| 1011778 B.C. Unlimited Liability Company/New Red Finance, Inc.: | | | |
| 3.875%, 1/15/28(1) | | 386 | $ 339,996 |
| 4.375%, 1/15/28(1) | | 473 | 415,961 |
| IRB Holding Corp., 7.00%, 6/15/25(1) | | 37 | 37,022 |
| US Foods, Inc., 4.75%, 2/15/29(1) | | 936 | 831,730 |
| Yum! Brands, Inc., 3.625%, 3/15/31 | | 758 | 609,849 |
| | | | $ 2,234,558 |
| Food/Drug Retailers — 0.3% |
| Albertsons Cos., Inc./Safeway, Inc./New Albertsons, L.P./Albertsons, LLC: | | | |
| 4.875%, 2/15/30(1) | | 393 | $ 349,735 |
| 5.875%, 2/15/28(1) | | 806 | 754,593 |
| | | | $ 1,104,328 |
| Forest Products & Paper — 0.0%(6) |
| Glatfelter Corp., 4.75%, 11/15/29(1) | | 51 | $ 32,920 |
| | | | $ 32,920 |
| Health Care — 3.4% |
| Avantor Funding, Inc.: | | | |
| 2.625%, 11/1/25(10) | EUR | 300 | $ 277,493 |
| 3.875%, 7/15/28(10) | EUR | 350 | 303,949 |
| Centene Corp.: | | | |
| 2.50%, 3/1/31 | | 296 | 227,657 |
| 3.00%, 10/15/30 | | 584 | 471,072 |
| 3.375%, 2/15/30 | | 613 | 510,169 |
| 4.625%, 12/15/29 | | 643 | 582,970 |
| Chrome Bidco SASU, 3.50%, 5/31/28(10) | EUR | 500 | 401,827 |
| Encompass Health Corp., 4.75%, 2/1/30 | | 616 | 526,501 |
| Grifols Escrow Issuer S.A.: | | | |
| 3.875%, 10/15/28(10) | EUR | 1,847 | 1,395,617 |
13
See Notes to Financial Statements.
Eaton Vance
Multi-Asset Credit Fund
October 31, 2022
Portfolio of Investments — continued
| Security | Principal
Amount*
(000's omitted) | Value |
| Health Care (continued) |
| Grifols Escrow Issuer S.A.: (continued) | | | |
| 4.75%, 10/15/28(1) | | 595 | $ 465,632 |
| Grifols S.A., 1.625%, 2/15/25(10) | EUR | 400 | 361,709 |
| HCA, Inc.: | | | |
| 5.875%, 2/1/29 | | 708 | 691,799 |
| 7.69%, 6/15/25 | | 200 | 206,412 |
| IQVIA, Inc., 2.25%, 3/15/29(10) | EUR | 311 | 250,372 |
| Legacy LifePoint Health, LLC, 4.375%, 2/15/27(1) | | 354 | 279,953 |
| LifePoint Health, Inc., 5.375%, 1/15/29(1) | | 124 | 79,397 |
| Medline Borrower, L.P., 5.25%, 10/1/29(1) | | 1,095 | 854,658 |
| ModivCare Escrow Issuer, Inc., 5.00%, 10/1/29(1) | | 414 | 352,879 |
| ModivCare, Inc., 5.875%, 11/15/25(1) | | 357 | 339,655 |
| Molina Healthcare, Inc.: | | | |
| 3.875%, 11/15/30(1) | | 573 | 488,272 |
| 3.875%, 5/15/32(1) | | 814 | 681,025 |
| Option Care Health, Inc., 4.375%, 10/31/29(1) | | 478 | 413,434 |
| RegionalCare Hospital Partners Holdings, Inc./LifePoint Health, Inc., 9.75%, 12/1/26(1) | | 130 | 103,918 |
| Team Health Holdings, Inc., 6.375%, 2/1/25(1) | | 639 | 483,844 |
| Tenet Healthcare Corp.: | | | |
| 4.375%, 1/15/30(1) | | 169 | 142,087 |
| 6.125%, 10/1/28(1) | | 1,004 | 870,594 |
| 6.875%, 11/15/31 | | 313 | 266,097 |
| US Acute Care Solutions, LLC, 6.375%, 3/1/26(1) | | 845 | 768,194 |
| Varex Imaging Corp., 7.875%, 10/15/27(1) | | 852 | 832,818 |
| | | | $ 13,630,004 |
| Home Furnishings — 0.2% |
| Tempur Sealy International, Inc., 3.875%, 10/15/31(1) | | 928 | $ 698,719 |
| | | | $ 698,719 |
| Industrial Equipment — 0.3% |
| Madison IAQ, LLC, 5.875%, 6/30/29(1) | | 744 | $ 511,697 |
| TK Elevator Midco GmbH, 6.128%, (3 mo. EURIBOR + 4.75%), 7/15/27(2)(10) | EUR | 630 | 583,311 |
| | | | $ 1,095,008 |
| Insurance — 0.5% |
| Alliant Holdings Intermediate, LLC/Alliant Holdings Co-Issuer, 6.75%, 10/15/27(1) | | 1,017 | $ 929,431 |
| Galaxy Finco, Ltd., 9.25%, 7/31/27(10) | GBP | 981 | 900,008 |
| | | | $ 1,829,439 |
| Security | Principal
Amount*
(000's omitted) | Value |
| Internet Software & Services — 0.5% |
| Arches Buyer, Inc.: | | | |
| 4.25%, 6/1/28(1) | | 195 | $ 160,423 |
| 6.125%, 12/1/28(1) | | 197 | 152,183 |
| Match Group Holdings II, LLC, 3.625%, 10/1/31(1) | | 555 | 423,853 |
| Netflix, Inc., 5.375%, 11/15/29(1) | | 581 | 553,280 |
| Science Applications International Corp., 4.875%, 4/1/28(1) | | 908 | 828,052 |
| | | | $ 2,117,791 |
| Leisure Goods/Activities/Movies — 1.5% |
| Cinemark USA, Inc.: | | | |
| 5.25%, 7/15/28(1) | | 390 | $ 297,028 |
| 5.875%, 3/15/26(1) | | 112 | 94,456 |
| 8.75%, 5/1/25(1) | | 413 | 414,732 |
| LHMC Finco 2 S.a.r.l., 7.25%, (7.25% cash or 8.00% PIK), 10/2/25(10)(13) | EUR | 1,310 | 1,115,780 |
| Life Time, Inc.: | | | |
| 5.75%, 1/15/26(1) | | 401 | 373,955 |
| 8.00%, 4/15/26(1) | | 636 | 555,478 |
| Lindblad Expeditions, LLC, 6.75%, 2/15/27(1) | | 452 | 402,760 |
| Motion Finco S.a.r.l., 7.00%, 5/15/25(10) | EUR | 435 | 423,891 |
| National CineMedia, LLC: | | | |
| 5.75%, 8/15/26 | | 333 | 28,736 |
| 5.875%, 4/15/28(1) | | 685 | 276,326 |
| NCL Corp., Ltd.: | | | |
| 5.875%, 3/15/26(1) | | 212 | 174,017 |
| 5.875%, 2/15/27(1) | | 102 | 91,198 |
| 7.75%, 2/15/29(1) | | 86 | 68,709 |
| NCL Finance, Ltd., 6.125%, 3/15/28(1) | | 93 | 72,446 |
| Playtika Holding Corp., 4.25%, 3/15/29(1) | | 621 | 518,361 |
| Royal Caribbean Cruises, Ltd., 11.625%, 8/15/27(1) | | 480 | 461,146 |
| SeaWorld Parks & Entertainment, Inc., 5.25%, 8/15/29(1) | | 158 | 136,119 |
| Viking Cruises, Ltd.: | | | |
| 5.875%, 9/15/27(1) | | 485 | 384,436 |
| 7.00%, 2/15/29(1) | | 205 | 162,941 |
| Viking Ocean Cruises Ship VII, Ltd., 5.625%, 2/15/29(1) | | 131 | 102,313 |
| | | | $ 6,154,828 |
| Machinery — 0.1% |
| IMA Industria Macchine Automatiche SpA, 3.75%, 1/15/28(10) | EUR | 678 | $ 552,633 |
| | | | $ 552,633 |
| Media — 0.3% |
| Beasley Mezzanine Holdings, LLC, 8.625%, 2/1/26(1) | | 470 | $ 338,988 |
14
See Notes to Financial Statements.
Eaton Vance
Multi-Asset Credit Fund
October 31, 2022
Portfolio of Investments — continued
| Security | Principal
Amount*
(000's omitted) | Value |
| Media (continued) |
| Outfront Media Capital, LLC/Outfront Media Capital Corp., 4.625%, 3/15/30(1) | | 382 | $ 316,527 |
| Univision Communications, Inc., 7.375%, 6/30/30(1) | | 664 | 643,220 |
| | | | $ 1,298,735 |
| Metals/Mining — 0.8% |
| Compass Minerals International, Inc., 6.75%, 12/1/27(1) | | 800 | $ 753,733 |
| Freeport-McMoRan, Inc., 5.45%, 3/15/43 | | 416 | 342,362 |
| Hudbay Minerals, Inc.: | | | |
| 4.50%, 4/1/26(1) | | 503 | 442,524 |
| 6.125%, 4/1/29(1) | | 220 | 182,670 |
| Novelis Corp., 3.25%, 11/15/26(1) | | 237 | 208,039 |
| Novelis Sheet Ingot GmbH, 3.375%, 4/15/29(10) | EUR | 600 | 487,260 |
| Roller Bearing Co. of America, Inc., 4.375%, 10/15/29(1) | | 902 | 792,615 |
| | | | $ 3,209,203 |
| Nonferrous Metals/Minerals — 0.5% |
| Eldorado Gold Corp., 6.25%, 9/1/29(1) | | 485 | $ 393,097 |
| New Gold, Inc., 7.50%, 7/15/27(1) | | 1,876 | 1,602,594 |
| | | | $ 1,995,691 |
| Oil and Gas — 3.0% |
| Aethon III BR, LLC, 9.00%, (1 mo. USD LIBOR + 7.50%), 10/1/25(2) | | 757 | $ 759,231 |
| Aethon United BR, L.P./Aethon United Finance Corp., 8.25%, 2/15/26(1) | | 450 | 458,045 |
| Callon Petroleum Co., 8.00%, 8/1/28(1) | | 704 | 703,134 |
| Colgate Energy Partners III, LLC: | | | |
| 5.875%, 7/1/29(1) | | 451 | 421,581 |
| 7.75%, 2/15/26(1) | | 362 | 360,980 |
| CrownRock, L.P./CrownRock Finance, Inc., 5.00%, 5/1/29(1) | | 487 | 443,100 |
| CVR Energy, Inc., 5.75%, 2/15/28(1) | | 865 | 784,101 |
| Nabors Industries, Ltd., 9.00%, 2/1/25(1) | | 433 | 439,691 |
| Neptune Energy Bondco PLC, 6.625%, 5/15/25(1) | | 1,150 | 1,119,417 |
| Occidental Petroleum Corp.: | | | |
| 6.20%, 3/15/40 | | 141 | 135,963 |
| 6.375%, 9/1/28 | | 167 | 169,886 |
| 6.625%, 9/1/30 | | 1,093 | 1,138,764 |
| Parkland Corp.: | | | |
| 4.50%, 10/1/29(1) | | 480 | 405,149 |
| 4.625%, 5/1/30(1) | | 292 | 243,616 |
| Precision Drilling Corp., 7.125%, 1/15/26(1) | | 520 | 511,550 |
| Tap Rock Resources, LLC, 7.00%, 10/1/26(1) | | 847 | 792,162 |
| Security | Principal
Amount*
(000's omitted) | Value |
| Oil and Gas (continued) |
| Targa Resources Partners, L.P./Targa Resources Partners Finance Corp.: | | | |
| 4.00%, 1/15/32 | | 268 | $ 220,228 |
| 4.875%, 2/1/31 | | 322 | 284,505 |
| 6.875%, 1/15/29 | | 341 | 340,543 |
| Tervita Corp., 11.00%, 12/1/25(1) | | 478 | 520,032 |
| Transocean Poseidon, Ltd., 6.875%, 2/1/27(1) | | 512 | 490,906 |
| Weatherford International, Ltd., 8.625%, 4/30/30(1) | | 350 | 330,596 |
| Wintershall Dea Finance 2 B.V., 2.499% to 4/20/26(10)(11)(12) | EUR | 1,300 | 1,019,891 |
| | | | $ 12,093,071 |
| Packaging & Containers — 0.6% |
| Kleopatra Finco S.a.r.l., 4.25%, 3/1/26(10) | EUR | 752 | $ 614,485 |
| Mauser Packaging Solutions Holding Co., 7.25%, 4/15/25(1) | | 188 | 169,497 |
| Schoeller Packaging B.V., 6.375%, 11/1/24(10) | EUR | 1,050 | 838,761 |
| Trivium Packaging Finance B.V.: | | | |
| 3.75%, 8/15/26(10) | EUR | 575 | 512,511 |
| 4.071%, (3 mo. EURIBOR + 3.75%), 8/15/26(2)(10) | EUR | 500 | 463,538 |
| | | | $ 2,598,792 |
| Pharmaceuticals — 0.5% |
| BellRing Brands, Inc., 7.00%, 3/15/30(1) | | 759 | $ 718,420 |
| Herbalife Nutrition, Ltd./HLF Financing, Inc., 7.875%, 9/1/25(1) | | 1,024 | 958,316 |
| Horizon Therapeutics USA, Inc., 5.50%, 8/1/27(1) | | 282 | 272,112 |
| P&L Development, LLC/PLD Finance Corp., 7.75%, 11/15/25(1) | | 292 | 225,809 |
| | | | $ 2,174,657 |
| Pipelines — 1.5% |
| Antero Midstream Partners, L.P./Antero Midstream Finance Corp.: | | | |
| 5.75%, 3/1/27(1) | | 493 | $ 470,598 |
| 7.875%, 5/15/26(1) | | 148 | 151,151 |
| Cheniere Energy Partners, L.P., 4.00%, 3/1/31 | | 1,202 | 1,014,939 |
| Cheniere Energy, Inc., 4.625%, 10/15/28 | | 779 | 720,229 |
| DCP Midstream, L.P., Series A, 7.375% to 12/15/22(11)(12) | | 562 | 555,006 |
| DT Midstream, Inc., 4.125%, 6/15/29(1) | | 599 | 519,324 |
| EQM Midstream Partners, L.P.: | | | |
| 4.50%, 1/15/29(1) | | 743 | 633,370 |
| 6.00%, 7/1/25(1) | | 75 | 72,735 |
| 6.50%, 7/1/27(1) | | 405 | 395,863 |
| 7.50%, 6/1/30(1) | | 296 | 288,260 |
15
See Notes to Financial Statements.
Eaton Vance
Multi-Asset Credit Fund
October 31, 2022
Portfolio of Investments — continued
| Security | Principal
Amount*
(000's omitted) | Value |
| Pipelines (continued) |
| Kinetik Holdings, L.P., 5.875%, 6/15/30(1) | | 679 | $ 637,814 |
| Venture Global Calcasieu Pass, LLC, 3.875%, 8/15/29(1) | | 586 | 504,074 |
| Western Midstream Operating, L.P., 4.30%, 2/1/30 | | 285 | 251,235 |
| | | | $ 6,214,598 |
| Publishing — 0.2% |
| McGraw-Hill Education, Inc.: | | | |
| 5.75%, 8/1/28(1) | | 485 | $ 428,349 |
| 8.00%, 8/1/29(1) | | 604 | 515,617 |
| | | | $ 943,966 |
| Radio and Television — 0.3% |
| Sirius XM Radio, Inc.: | | | |
| 3.125%, 9/1/26(1) | | 203 | $ 181,836 |
| 3.875%, 9/1/31(1) | | 204 | 163,594 |
| 5.50%, 7/1/29(1) | | 900 | 831,397 |
| | | | $ 1,176,827 |
| Real Estate Investment Trusts (REITs) — 0.5% |
| HAT Holdings I, LLC/HAT Holdings II, LLC: | | | |
| 3.375%, 6/15/26(1) | | 600 | $ 489,156 |
| 3.75%, 9/15/30(1) | | 250 | 172,881 |
| Heimstaden Bostad AB, 3.248% to 11/19/24(10)(11)(12) | EUR | 750 | 535,285 |
| Shimao Group Holdings, Ltd., 5.60%, 7/15/26(10)(14) | | 1,250 | 65,945 |
| VICI Properties, L.P./VICI Note Co., Inc.: | | | |
| 3.75%, 2/15/27(1) | | 75 | 65,880 |
| 4.625%, 12/1/29(1) | | 648 | 564,981 |
| | | | $ 1,894,128 |
| Retail — 1.4% |
| Arko Corp., 5.125%, 11/15/29(1) | | 881 | $ 698,809 |
| Dufry One B.V., 3.375%, 4/15/28(10) | EUR | 1,350 | 1,103,525 |
| Fertitta Entertainment, LLC/Fertitta Entertainment Finance Co., Inc., 4.625%, 1/15/29(1) | | 361 | 314,635 |
| Ken Garff Automotive, LLC, 4.875%, 9/15/28(1) | | 724 | 602,156 |
| LCM Investments Holdings II, LLC, 4.875%, 5/1/29(1) | | 775 | 655,755 |
| Midco GB SASU, 7.75%, (7.75% cash or 8.50% PIK), 11/1/27(10)(13) | EUR | 815 | 762,253 |
| Punch Finance PLC, 6.125%, 6/30/26(10) | GBP | 745 | 747,715 |
| Suburban Propane Partners, L.P./Suburban Energy Finance Corp., 5.00%, 6/1/31(1) | | 254 | 214,119 |
| Victoria's Secret & Co., 4.625%, 7/15/29(1) | | 774 | 617,598 |
| | | | $ 5,716,565 |
| Security | Principal
Amount*
(000's omitted) | Value |
| Retailers (Except Food and Drug) — 0.8% |
| Bath & Body Works, Inc.: | | | |
| 6.625%, 10/1/30(1) | | 430 | $ 385,753 |
| 6.875%, 11/1/35 | | 536 | 451,341 |
| 6.95%, 3/1/33 | | 282 | 232,594 |
| 7.60%, 7/15/37 | | 55 | 43,580 |
| 9.375%, 7/1/25(1) | | 54 | 56,094 |
| Dave & Buster's, Inc., 7.625%, 11/1/25(1) | | 923 | 921,805 |
| PetSmart, Inc./PetSmart Finance Corp., 7.75%, 2/15/29(1) | | 844 | 794,297 |
| Superior Plus, L.P./Superior General Partner, Inc., 4.50%, 3/15/29(1) | | 437 | 371,485 |
| | | | $ 3,256,949 |
| Semiconductors & Semiconductor Equipment — 0.2% |
| Entegris Escrow Corp., 4.75%, 4/15/29(1) | | 218 | $ 192,931 |
| ON Semiconductor Corp., 3.875%, 9/1/28(1) | | 661 | 584,036 |
| | | | $ 776,967 |
| Software — 0.1% |
| Sabre GLBL, Inc., 9.25%, 4/15/25(1) | | 237 | $ 230,064 |
| | | | $ 230,064 |
| Software and Services — 0.4% |
| Fair Isaac Corp., 4.00%, 6/15/28(1) | | 667 | $ 605,286 |
| Gartner, Inc.: | | | |
| 3.75%, 10/1/30(1) | | 547 | 460,848 |
| 4.50%, 7/1/28(1) | | 534 | 495,950 |
| | | | $ 1,562,084 |
| Specialty Retail — 0.1% |
| Fiber Bidco SpA: | | | |
| 7.543%, (3 mo. EURIBOR + 6.00%), 10/25/27(2)(10) | EUR | 200 | $ 187,724 |
| 11.00%, 10/25/27(10) | EUR | 270 | 271,861 |
| | | | $ 459,585 |
| Steel — 0.6% |
| Allegheny Ludlum, LLC, 6.95%, 12/15/25 | | 401 | $ 392,864 |
| Infrabuild Australia Pty, Ltd., 12.00%, 10/1/24(1) | | 2,185 | 2,032,509 |
| TMS International Corp., 6.25%, 4/15/29(1) | | 89 | 62,550 |
| | | | $ 2,487,923 |
| Surface Transport — 0.1% |
| Hertz Corp. (The): | | | |
| 4.625%, 12/1/26(1) | | 47 | $ 40,137 |
16
See Notes to Financial Statements.
Eaton Vance
Multi-Asset Credit Fund
October 31, 2022
Portfolio of Investments — continued
| Security | Principal
Amount*
(000's omitted) | Value |
| Surface Transport (continued) |
| Hertz Corp. (The): (continued) | | | |
| 5.00%, 12/1/29(1) | | 379 | $ 301,258 |
| | | | $ 341,395 |
| Technology — 0.6% |
| Almaviva-The Italian Innovation Co. SpA, 4.875%, 10/30/26(10) | EUR | 450 | $ 400,937 |
| AthenaHealth Group, Inc., 6.50%, 2/15/30(1) | | 750 | 586,328 |
| International Game Technology PLC: | | | |
| 3.50%, 6/15/26(10) | EUR | 250 | 234,589 |
| 4.125%, 4/15/26(1) | | 573 | 532,752 |
| 6.25%, 1/15/27(1) | | 200 | 198,621 |
| 6.50%, 2/15/25(1) | | 537 | 538,031 |
| Seagate HDD Cayman, 3.375%, 7/15/31 | | 136 | 97,269 |
| | | | $ 2,588,527 |
| Telecommunications — 3.6% |
| Ciena Corp., 4.00%, 1/31/30(1) | | 491 | $ 415,688 |
| Connect Finco S.a.r.l./Connect US Finco, LLC, 6.75%, 10/1/26(1) | | 1,299 | 1,223,203 |
| DKT Finance ApS, 9.375%, 6/17/23(1) | | 600 | 579,750 |
| Iliad Holding SASU: | | | |
| 5.125%, 10/15/26(10) | EUR | 175 | 161,400 |
| 5.625%, 10/15/28(10) | EUR | 146 | 129,925 |
| 6.50%, 10/15/26(1) | | 543 | 503,736 |
| 7.00%, 10/15/28(1) | | 362 | 328,557 |
| LCPR Senior Secured Financing DAC, 5.125%, 7/15/29(1) | | 1,141 | 964,065 |
| Level 3 Financing, Inc.: | | | |
| 4.25%, 7/1/28(1) | | 594 | 491,672 |
| 4.625%, 9/15/27(1) | | 232 | 201,870 |
| Lorca Telecom Bondco S.A., 4.00%, 9/18/27(10) | EUR | 1,573 | 1,371,095 |
| Network i2i, Ltd., 3.975% to 3/3/26(10)(11)(12) | | 1,000 | 794,405 |
| Sprint Capital Corp., 6.875%, 11/15/28 | | 1,091 | 1,127,538 |
| Sprint Corp.: | | | |
| 7.625%, 2/15/25 | | 324 | 333,347 |
| 7.625%, 3/1/26 | | 225 | 235,212 |
| Summer (BC) Bidco B, LLC, 5.50%, 10/31/26(1) | | 583 | 464,864 |
| Summer (BC) Holdco A S.a.r.l., 9.25%, 10/31/27(10) | EUR | 327 | 252,900 |
| Summer (BC) Holdco B S.a.r.l., 5.75%, 10/31/26(10) | EUR | 600 | 515,764 |
| Telecom Italia Finance S.A., 7.75%, 1/24/33 | EUR | 425 | 422,547 |
| Telecom Italia SpA: | | | |
| 1.625%, 1/18/29(10) | EUR | 455 | 326,324 |
| 2.75%, 4/15/25(10) | EUR | 367 | 332,918 |
| 4.00%, 4/11/24(10) | EUR | 600 | 578,437 |
| T-Mobile USA, Inc., 2.25%, 2/15/26 | | 520 | 467,680 |
| Security | Principal
Amount*
(000's omitted) | Value |
| Telecommunications (continued) |
| Viasat, Inc., 5.625%, 4/15/27(1) | | 583 | $ 540,071 |
| Viavi Solutions, Inc., 3.75%, 10/1/29(1) | | 601 | 502,643 |
| VTR Comunicaciones SpA, 5.125%, 1/15/28(10) | | 667 | 425,203 |
| Wp/ap Telecom Holdings III B.V., 5.50%, 1/15/30(10) | EUR | 1,125 | 866,864 |
| | | | $ 14,557,678 |
| Transportation — 0.3% |
| Cargo Aircraft Management, Inc., 4.75%, 2/1/28(1) | | 457 | $ 408,706 |
| Getlink S.E., 3.50%, 10/30/25(10) | EUR | 550 | 519,886 |
| Seaspan Corp., 5.50%, 8/1/29(1) | | 552 | 426,552 |
| | | | $ 1,355,144 |
| Utilities — 0.9% |
| Calpine Corp., 5.00%, 2/1/31(1) | | 615 | $ 521,064 |
| Leeward Renewable Energy Operations, LLC, 4.25%, 7/1/29(1) | | 411 | 333,512 |
| NextEra Energy Operating Partners, L.P., 4.50%, 9/15/27(1) | | 332 | 309,250 |
| NRG Energy, Inc.: | | | |
| 3.625%, 2/15/31(1) | | 563 | 448,784 |
| 3.875%, 2/15/32(1) | | 118 | 93,285 |
| 5.75%, 1/15/28 | | 580 | 554,576 |
| TerraForm Power Operating, LLC: | | | |
| 4.75%, 1/15/30(1) | | 460 | 414,487 |
| 5.00%, 1/31/28(1) | | 450 | 417,902 |
| Vistra Operations Co., LLC: | | | |
| 4.375%, 5/1/29(1) | | 193 | 165,538 |
| 5.00%, 7/31/27(1) | | 580 | 536,062 |
| | | | $ 3,794,460 |
Total Corporate Bonds
(identified cost $230,030,312) | | | $198,957,063 |
| Security | Shares | Value |
| Distribution & Wholesale — 0.2% |
| WESCO International, Inc., Series A, 10.625% to 6/22/25 | | 36,126 | $ 975,402 |
Total Preferred Stocks
(identified cost $1,027,930) | | | $ 975,402 |
17
See Notes to Financial Statements.
Eaton Vance
Multi-Asset Credit Fund
October 31, 2022
Portfolio of Investments — continued
| Senior Floating-Rate Loans — 29.9%(15) |
| Borrower/Description | Principal
Amount
(000's omitted) | Value |
| Aerospace and Defense — 0.7% |
| Dynasty Acquisition Co., Inc.: | | | |
| Term Loan, 7.254%, (1 mo. USD LIBOR + 3.50%), 4/6/26 | $ | 835 | $ 787,015 |
| Term Loan, 7.254%, (1 mo. USD LIBOR + 3.50%), 4/6/26 | | 449 | 423,127 |
| WP CPP Holdings, LLC, Term Loan, 8.168%, (USD LIBOR + 3.75%), 4/30/25(16) | | 1,867 | 1,606,039 |
| | | | $ 2,816,181 |
| Airlines — 0.8% |
| American Airlines, Inc., Term Loan, 8.993%, (3 mo. USD LIBOR + 4.75%), 4/20/28 | $ | 2,000 | $ 1,982,858 |
| Mileage Plus Holdings, LLC, Term Loan, 8.777%, (3 mo. USD LIBOR + 5.25%), 6/21/27 | | 621 | 635,085 |
| United Airlines, Inc., Term Loan, 8.108%, (3 mo. USD LIBOR + 3.75%), 4/21/28 | | 474 | 463,942 |
| | | | $ 3,081,885 |
| Auto Components — 0.3% |
| DexKo Global, Inc., Term Loan, 7.476%, (USD LIBOR + 3.75%), 10/4/28(16) | $ | 522 | $ 474,545 |
| LTI Holdings, Inc., Term Loan, 7.004%, (1 mo. USD LIBOR + 3.25%), 9/6/25 | | 719 | 672,508 |
| | | | $ 1,147,053 |
| Biotechnology — 0.3% |
| Alltech, Inc., Term Loan, 7.754%, (1 mo. USD LIBOR + 4.00%), 10/13/28 | $ | 1,241 | $ 1,192,551 |
| | | | $ 1,192,551 |
| Capital Markets — 0.7% |
| Advisor Group, Inc., Term Loan, 8.254%, (1 mo. USD LIBOR + 4.50%), 7/31/26 | $ | 1,975 | $ 1,901,790 |
| Axalta Coating Systems US Holdings, Inc., Term Loan, 5.424%, (3 mo. USD LIBOR + 1.75%), 6/1/24 | | 965 | 955,739 |
| | | | $ 2,857,529 |
| Chemicals — 1.4% |
| CPC Acquisition Corp., Term Loan, 7.424%, (3 mo. USD LIBOR + 3.75%), 12/29/27 | $ | 746 | $ 596,970 |
| Messer Industries GmbH, Term Loan, 6.174%, (3 mo. USD LIBOR + 2.50%), 3/2/26 | | 1,448 | 1,425,724 |
| Olympus Water US Holding Corporation, Term Loan, 8.153%, (SOFR + 4.50%), 11/9/28 | | 1,493 | 1,373,846 |
| Borrower/Description | Principal
Amount
(000's omitted) | Value |
| Chemicals (continued) |
| PQ Corporation, Term Loan, 6.915%, (3 mo. USD LIBOR + 2.50%), 6/9/28 | $ | 1,015 | $ 981,577 |
| W.R. Grace & Co.-Conn., Term Loan, 7.438%, (3 mo. USD LIBOR + 3.75%), 9/22/28 | | 1,489 | 1,434,915 |
| | | | $ 5,813,032 |
| Commercial Services & Supplies — 1.1% |
| Allied Universal Holdco, LLC, Term Loan, 7.504%, (1 mo. USD LIBOR + 3.75%), 5/12/28 | $ | 1,887 | $ 1,716,620 |
| EnergySolutions, LLC, Term Loan, 7.424%, (3 mo. USD LIBOR + 3.75%), 5/9/25 | | 1,135 | 1,055,416 |
| Tempo Acquisition, LLC, Term Loan, 6.729%, (SOFR + 3.00%), 8/31/28 | | 1,489 | 1,472,466 |
| | | | $ 4,244,502 |
| Communications Equipment — 0.2% |
| CommScope, Inc., Term Loan, 7.004%, (1 mo. USD LIBOR + 3.25%), 4/6/26 | $ | 987 | $ 945,268 |
| | | | $ 945,268 |
| Construction Materials — 0.2% |
| Quikrete Holdings, Inc., Term Loan, 6.754%, (1 mo. USD LIBOR + 3.00%), 6/11/28 | $ | 796 | $ 777,510 |
| | | | $ 777,510 |
| Containers & Packaging — 0.2% |
| Proampac PG Borrower, LLC, Term Loan, 6.997%, (USD LIBOR + 3.75%), 11/3/25(16) | $ | 988 | $ 942,772 |
| | | | $ 942,772 |
| Distributors — 0.3% |
| Autokiniton US Holdings, Inc., Term Loan, 7.80%, (1 mo. USD LIBOR + 4.50%), 4/6/28 | $ | 1,098 | $ 1,029,518 |
| | | | $ 1,029,518 |
| Diversified Telecommunication Services — 1.3% |
| Altice France S.A., Term Loan, 6.905%, (3 mo. USD LIBOR + 4.00%), 8/14/26 | $ | 1,661 | $ 1,527,100 |
| CenturyLink, Inc., Term Loan, 6.004%, (1 mo. USD LIBOR + 2.25%), 3/15/27 | | 714 | 667,341 |
| UPC Financing Partnership, Term Loan, 6.337%, (1 mo. USD LIBOR + 2.93%), 1/31/29 | | 1,100 | 1,078,197 |
18
See Notes to Financial Statements.
Eaton Vance
Multi-Asset Credit Fund
October 31, 2022
Portfolio of Investments — continued
| Borrower/Description | Principal
Amount
(000's omitted) | Value |
| Diversified Telecommunication Services (continued) |
| Virgin Media Bristol, LLC, Term Loan, 5.912%, (1 mo. USD LIBOR + 2.50%), 1/31/28 | $ | 550 | $ 540,337 |
| Ziggo Financing Partnership, Term Loan, 5.912%, (1 mo. USD LIBOR + 2.50%), 4/30/28 | | 1,350 | 1,316,974 |
| | | | $ 5,129,949 |
| Electrical Equipment — 0.3% |
| Brookfield WEC Holdings, Inc., Term Loan, 6.504%, (1 mo. USD LIBOR + 2.75%), 8/1/25 | $ | 1,269 | $ 1,249,337 |
| | | | $ 1,249,337 |
| Electronic Equipment, Instruments & Components — 0.4% |
| Robertshaw US Holding Corp., Term Loan, 7.313%, (1 mo. USD LIBOR + 3.50%), 2/28/25 | $ | 1,892 | $ 1,546,684 |
| | | | $ 1,546,684 |
| Entertainment — 1.2% |
| Delta 2 (LUX) S.a.r.l., Term Loan, 6.254%, (1 mo. USD LIBOR + 2.50%), 2/1/24 | $ | 2,000 | $ 2,000,416 |
| Playtika Holding Corp., Term Loan, 6.504%, (1 mo. USD LIBOR + 2.75%), 3/13/28 | | 990 | 965,378 |
| UFC Holdings, LLC, Term Loan, 7.11%, (3 mo. USD LIBOR + 2.75%), 4/29/26 | | 1,860 | 1,823,166 |
| | | | $ 4,788,960 |
| Food Products — 0.4% |
| Nomad Foods Europe Midco Limited, Term Loan, 5.155%, (3 mo. USD LIBOR + 2.25%), 5/15/24 | $ | 1,579 | $ 1,569,822 |
| | | | $ 1,569,822 |
| Health Care — 0.1% |
| Pluto Acquisition I, Inc., Term Loan, 6/22/26(17) | $ | 332 | $ 289,161 |
| | | | $ 289,161 |
| Health Care Providers & Services — 0.9% |
| CHG Healthcare Services, Inc., Term Loan, 7.004%, (1 mo. USD LIBOR + 3.25%), 9/29/28 | $ | 1,685 | $ 1,639,921 |
| Medical Solutions Holdings, Inc.: | | | |
| Term Loan, 3.50%, 11/1/28(18) | | 138 | 133,342 |
| Term Loan, 6.377%, (USD LIBOR + 3.50%), 11/1/28(16) | | 858 | 828,801 |
| National Mentor Holdings, Inc.: | | | |
| Term Loan, 7.43%, (3 mo. USD LIBOR + 3.75%), 3/2/28 | | 41 | 29,812 |
| Borrower/Description | Principal
Amount
(000's omitted) | Value |
| Health Care Providers & Services (continued) |
| National Mentor Holdings, Inc.: (continued) | | | |
| Term Loan, 7.466%, (USD LIBOR + 3.75%), 3/2/28(16) | $ | 1,255 | $ 906,592 |
| | | | $ 3,538,468 |
| Health Care Technology — 0.8% |
| athenahealth, Inc.: | | | |
| Term Loan, 3.50%, 2/15/29(18) | $ | 145 | $ 132,292 |
| Term Loan, 6.967%, (SOFR + 3.50%), 2/15/29 | | 853 | 778,569 |
| Navicure, Inc., Term Loan, 7.754%, (1 mo. USD LIBOR + 4.00%), 10/22/26 | | 1,671 | 1,629,766 |
| Verscend Holding Corp., Term Loan, 7.754%, (1 mo. USD LIBOR + 4.00%), 8/27/25 | | 748 | 738,883 |
| | | | $ 3,279,510 |
| Hotels, Restaurants & Leisure — 1.1% |
| ClubCorp Holdings, Inc., Term Loan, 6.424%, (3 mo. USD LIBOR + 2.75%), 9/18/24 | $ | 1,233 | $ 1,110,527 |
| Dave & Buster's, Inc., Term Loan, 8.875%, (SOFR + 5.00%), 6/29/29 | | 351 | 344,463 |
| Fertitta Entertainment, LLC, Term Loan, 7.729%, (SOFR + 4.00%), 1/27/29 | | 1,364 | 1,282,860 |
| IRB Holding Corp., Term Loan, 6.208%, (SOFR + 3.00%), 12/15/27 | | 920 | 894,277 |
| Spectacle Gary Holdings, LLC, Term Loan, 8.004%, (1 mo. USD LIBOR + 4.25%), 11/19/28 | | 899 | 864,854 |
| | | | $ 4,496,981 |
| Household Products — 0.5% |
| Diamond (BC) B.V., Term Loan, 7.163%, (USD LIBOR + 2.75%), 9/29/28(16) | $ | 1,489 | $ 1,396,075 |
| Kronos Acquisition Holdings, Inc., Term Loan, 6.82%, (3 mo. USD LIBOR + 3.75%), 12/22/26 | | 732 | 693,721 |
| | | | $ 2,089,796 |
| Insurance — 0.7% |
| AmWINS Group, Inc., Term Loan, 6.004%, (1 mo. USD LIBOR + 2.25%), 2/19/28 | $ | 1,295 | $ 1,268,647 |
| USI, Inc., Term Loan, 6.424%, (3 mo. USD LIBOR + 2.75%), 5/16/24 | | 1,694 | 1,675,506 |
| | | | $ 2,944,153 |
| Interactive Media & Services — 0.2% |
| Getty Images, Inc., Term Loan, 7.625%, (3 mo. USD LIBOR + 4.50%), 2/19/26 | $ | 949 | $ 944,842 |
| | | | $ 944,842 |
19
See Notes to Financial Statements.
Eaton Vance
Multi-Asset Credit Fund
October 31, 2022
Portfolio of Investments — continued
| Borrower/Description | Principal
Amount
(000's omitted) | Value |
| Internet & Direct Marketing Retail — 0.3% |
| Hoya Midco, LLC, Term Loan, 6.979%, (SOFR + 3.25%), 2/3/29 | $ | 1,132 | $ 1,120,344 |
| | | | $ 1,120,344 |
| IT Services — 1.9% |
| Asurion, LLC: | | | |
| Term Loan, 7.004%, (1 mo. USD LIBOR + 3.25%), 12/23/26 | $ | 2,397 | $ 2,143,424 |
| Term Loan - Second Lien, 9.004%, (1 mo. USD LIBOR + 5.25%), 1/31/28 | | 1,000 | 709,375 |
| Cyxtera DC Holdings, Inc., Term Loan, 7.36%, (3 mo. USD LIBOR + 3.00%), 5/1/24 | | 1,488 | 1,279,311 |
| Gainwell Acquisition Corp., Term Loan, 7.674%, (3 mo. USD LIBOR + 4.00%), 10/1/27 | | 1,489 | 1,420,408 |
| Informatica, LLC, Term Loan, 6.563%, (1 mo. USD LIBOR + 2.75%), 10/27/28 | | 1,816 | 1,772,294 |
| Travelport Finance (Luxembourg) S.a.r.l., Term Loan, 12.424%, (3 mo. USD LIBOR + 8.75%), 5.174% cash, 7.25% PIK, 2/28/25 | | 373 | 369,805 |
| | | | $ 7,694,617 |
| Leisure Products — 0.1% |
| Peloton Interactive, Inc., Term Loan, 8.346%, (SOFR + 6.50%), 5/25/27 | $ | 315 | $ 306,279 |
| | | | $ 306,279 |
| Life Sciences Tools & Services — 0.4% |
| Curia Global, Inc., Term Loan, 8.163%, (USD LIBOR + 3.75%), 8/30/26(16) | $ | 1,766 | $ 1,623,761 |
| | | | $ 1,623,761 |
| Machinery — 2.0% |
| Alliance Laundry Systems, LLC, Term Loan, 7.409%, (3 mo. USD LIBOR + 3.50%), 10/8/27 | $ | 992 | $ 960,587 |
| Apex Tool Group, LLC, Term Loan, 8.624%, (SOFR + 5.25%), 2/8/29 | | 1,587 | 1,378,981 |
| Engineered Machinery Holdings, Inc., Term Loan, 7.424%, (3 mo. USD LIBOR + 3.75%), 5/19/28 | | 742 | 719,869 |
| EWT Holdings III Corp., Term Loan, 6.313%, (1 mo. USD LIBOR + 2.50%), 4/1/28 | | 1,980 | 1,956,450 |
| Gates Global, LLC, Term Loan, 6.254%, (1 mo. USD LIBOR + 2.50%), 3/31/27 | | 2,044 | 1,993,407 |
| Madison IAQ, LLC, Term Loan, 6.815%, (3 mo. USD LIBOR + 3.25%), 6/21/28 | | 990 | 900,860 |
| | | | $ 7,910,154 |
| Borrower/Description | Principal
Amount
(000's omitted) | Value |
| Media — 0.1% |
| Diamond Sports Group, LLC: | | | |
| Term Loan, 11.208%, (SOFR + 8.00%), 5/26/26 | $ | 134 | $ 128,718 |
| Term Loan - Second Lien, 6.458%, (SOFR + 3.25%), 8/24/26 | | 792 | 158,478 |
| | | | $ 287,196 |
| Metals/Mining — 0.1% |
| WireCo WorldGroup, Inc., Term Loan, 7.188%, (3 mo. USD LIBOR + 4.25%), 11/13/28 | $ | 314 | $ 307,798 |
| | | | $ 307,798 |
| Oil, Gas & Consumable Fuels — 0.6% |
| CITGO Petroleum Corporation, Term Loan, 10.004%, (1 mo. USD LIBOR + 6.25%), 3/28/24 | $ | 2,525 | $ 2,532,069 |
| | | | $ 2,532,069 |
| Pharmaceuticals — 0.6% |
| Bausch Health Companies, Inc., Term Loan, 8.624%, (SOFR + 5.25%), 2/1/27 | $ | 890 | $ 668,918 |
| Jazz Financing Lux S.a.r.l., Term Loan, 7.254%, (1 mo. USD LIBOR + 3.50%), 5/5/28 | | 971 | 961,258 |
| Mallinckrodt International Finance S.A., Term Loan, 8.733%, (3 mo. USD LIBOR + 5.25%), 9/30/27 | | 843 | 686,742 |
| | | | $ 2,316,918 |
| Professional Services — 0.4% |
| CoreLogic, Inc., Term Loan, 7.313%, (1 mo. USD LIBOR + 3.50%), 6/2/28 | $ | 1,485 | $ 1,094,255 |
| First Advantage Holdings, LLC, Term Loan, 6.504%, (1 mo. USD LIBOR + 2.75%), 1/31/27 | | 737 | 728,555 |
| | | | $ 1,822,810 |
| Real Estate Management & Development — 0.4% |
| Cushman & Wakefield U.S. Borrower, LLC, Term Loan, 6.504%, (1 mo. USD LIBOR + 2.75%), 8/21/25 | $ | 1,737 | $ 1,701,815 |
| | | | $ 1,701,815 |
| Semiconductors & Semiconductor Equipment — 0.2% |
| Entegris, Inc., Term Loan, 5.708%, (SOFR + 3.00%), 7/6/29 | $ | 750 | $ 747,305 |
| | | | $ 747,305 |
| Software — 6.4% |
| Applied Systems, Inc., Term Loan, 6.674%, (3 mo. USD LIBOR + 3.00%), 9/19/24 | $ | 1,529 | $ 1,512,089 |
20
See Notes to Financial Statements.
Eaton Vance
Multi-Asset Credit Fund
October 31, 2022
Portfolio of Investments — continued
| Borrower/Description | Principal
Amount
(000's omitted) | Value |
| Software (continued) |
| Banff Merger Sub, Inc., Term Loan, 7.504%, (1 mo. USD LIBOR + 3.75%), 10/2/25 | $ | 1,653 | $ 1,592,393 |
| CDK Global, Inc., Term Loan, 8.112%, (SOFR + 4.50%), 7/6/29 | | 1,400 | 1,373,555 |
| CentralSquare Technologies, LLC, Term Loan, 7.424%, (3 mo. USD LIBOR + 3.75%), 8/29/25 | | 1,234 | 1,074,792 |
| Epicor Software Corporation, Term Loan, 7.004%, (1 mo. USD LIBOR + 3.25%), 7/30/27 | | 1,719 | 1,635,846 |
| Finastra USA, Inc., Term Loan, 6.871%, (3 mo. USD LIBOR + 3.50%), 6/13/24 | | 1,463 | 1,329,204 |
| GoTo Group, Inc., Term Loan, 8.322%, (1 mo. USD LIBOR + 4.75%), 8/31/27 | | 1,622 | 1,046,053 |
| Hyland Software, Inc., Term Loan, 7.254%, (1 mo. USD LIBOR + 3.50%), 7/1/24 | | 1,996 | 1,950,041 |
| Magenta Buyer, LLC, Term Loan, 9.17%, (3 mo. USD LIBOR + 4.75%), 7/27/28 | | 1,489 | 1,305,889 |
| McAfee, LLC, Term Loan, 6.87%, (SOFR + 3.75%), 3/1/29 | | 998 | 911,882 |
| Panther Commercial Holdings, L.P., Term Loan, 8.665%, (3 mo. USD LIBOR + 4.25%), 1/7/28 | | 1,229 | 1,113,347 |
| Polaris Newco, LLC, Term Loan, 7.674%, (3 mo. USD LIBOR + 4.00%), 6/2/28 | | 1,231 | 1,129,179 |
| Proofpoint, Inc., Term Loan, 6.32%, (3 mo. USD LIBOR + 3.25%), 8/31/28 | | 743 | 707,820 |
| RealPage, Inc., Term Loan, 6.754%, (1 mo. USD LIBOR + 3.00%), 4/24/28 | | 1,980 | 1,865,160 |
| Riverbed Technology, Inc., Term Loan, 11.20%, (1 mo. USD LIBOR + 8.00%), 9.20% cash, 2.00% PIK, 12/7/26 | | 269 | 104,483 |
| Sophia, L.P., Term Loan, 7.174%, (3 mo. USD LIBOR + 3.50%), 10/7/27 | | 1,982 | 1,915,572 |
| Ultimate Software Group, Inc. (The): | | | |
| Term Loan, 6.998%, (3 mo. USD LIBOR + 3.25%), 5/4/26 | | 1,476 | 1,427,431 |
| Term Loan, 7.504%, (1 mo. USD LIBOR + 3.75%), 5/4/26 | | 1,440 | 1,402,678 |
| Veritas US, Inc., Term Loan, 8.674%, (3 mo. USD LIBOR + 5.00%), 9/1/25 | | 1,461 | 1,169,985 |
| Vision Solutions, Inc., Term Loan, 8.358%, (3 mo. USD LIBOR + 4.00%), 4/24/28 | | 1,483 | 1,263,842 |
| | | | $ 25,831,241 |
| Specialty Retail — 1.2% |
| Great Outdoors Group, LLC, Term Loan, 7.504%, (1 mo. USD LIBOR + 3.75%), 3/6/28 | $ | 1,432 | $ 1,352,934 |
| Borrower/Description | Principal
Amount
(000's omitted) | Value |
| Specialty Retail (continued) |
| Les Schwab Tire Centers, Term Loan, 6.58%, (3 mo. USD LIBOR + 3.25%), 11/2/27 | $ | 1,717 | $ 1,671,719 |
| PetSmart, Inc., Term Loan, 7.50%, (1 mo. USD LIBOR + 3.75%), 2/11/28 | | 1,877 | 1,811,225 |
| | | | $ 4,835,878 |
| Trading Companies & Distributors — 1.1% |
| Core & Main L.P., Term Loan, 6.528%, (USD LIBOR + 2.50%), 7/27/28(16) | $ | 1,832 | $ 1,791,193 |
| Electro Rent Corporation, Term Loan, 9.278%, (3 mo. USD LIBOR + 5.00%), 1/31/24 | | 1,447 | 1,366,442 |
| Spin Holdco, Inc., Term Loan, 7.144%, (3 mo. USD LIBOR + 4.00%), 3/4/28 | | 1,556 | 1,377,517 |
| | | | $ 4,535,152 |
Total Senior Floating-Rate Loans
(identified cost $127,662,137) | | | $120,288,801 |
| U.S. Government Agency Mortgage-Backed Securities — 2.4% |
| Security | Principal
Amount
(000's omitted) | Value |
| Government National Mortgage Association, 5.00%, 30-Year, TBA(19) | $ | 10,050 | $ 9,768,211 |
Total U.S. Government Agency Mortgage-Backed Securities
(identified cost $9,765,119) | | | $ 9,768,211 |
| U.S. Treasury Obligations — 2.5% |
| Security | Principal
Amount
(000's omitted) | Value |
| U.S. Treasury Note, 4.125%, 9/30/27 | $ | 9,900 | $ 9,847,020 |
Total U.S. Treasury Obligations
(identified cost $9,883,554) | | | $ 9,847,020 |
| Security | Shares | Value |
| Leisure Goods/Activities/Movies — 0.0% |
| Cineworld Group PLC, Exp. 11/23/25(7)(8) | | 128,689 | $ 0 |
Total Warrants
(identified cost $0) | | | $ 0 |
21
See Notes to Financial Statements.
Eaton Vance
Multi-Asset Credit Fund
October 31, 2022
Portfolio of Investments — continued
| Security | Principal
Amount | Value |
| Surface Transport — 0.0%(6) |
| Hertz Corp., Escrow Certificates(7) | $ | 105,000 | $ 7,875 |
Total Miscellaneous
(identified cost $0) | | | $ 7,875 |
| Short-Term Investments — 7.8% |
| Security | Shares | Value |
| Morgan Stanley Institutional Liquidity Funds - Government Portfolio, Institutional Class, 2.88%(20) | | 31,492,053 | $ 31,492,053 |
Total Short-Term Investments
(identified cost $31,492,053) | | | $ 31,492,053 |
Total Investments — 101.1%
(identified cost $461,390,892) | | | $407,142,139 |
| Less Unfunded Loan Commitments — (0.1)%(6) | | | $ (282,928) |
Net Investments — 101.0%
(identified cost $461,107,964) | | | $406,859,211 |
| Other Assets, Less Liabilities — (1.0)% | | | $ (4,260,204) |
| Net Assets — 100.0% | | | $402,599,007 |
| The percentage shown for each investment category in the Portfolio of Investments is based on net assets. |
| * | In U.S. dollars unless otherwise indicated. |
| (1) | Security exempt from registration under Rule 144A of the Securities Act of 1933, as amended. These securities may be sold in certain transactions in reliance on an exemption from registration (normally to qualified institutional buyers). At October 31, 2022, the aggregate value of these securities is $152,158,208 or 37.8% of the Fund's net assets. |
| (2) | Variable rate security. The stated interest rate represents the rate in effect at October 31, 2022. |
| (3) | When-issued security. |
| (4) | Weighted average fixed-rate coupon that changes/updates monthly. Rate shown is the rate at October 31, 2022. |
| (5) | Represents an investment in an issuer that may be deemed to be an affiliate. |
| (6) | Amount is less than 0.05% or (0.05)%, as applicable. |
| (7) | Non-income producing security. |
| (8) | Security was acquired in connection with a restructuring of a Senior Loan and may be subject to restrictions on resale. |
| (9) | For fair value measurement disclosure purposes, security is categorized as Level 3 (see Note 11). |
| (10) | Security exempt from registration under Regulation S of the Securities Act of 1933, as amended, which exempts from registration securities offered and sold outside the United States. Security may not be offered or sold in the United States except pursuant to an exemption from, or in a transaction not subject to, the registration requirements of the Securities Act of 1933, as amended. At October 31, 2022, the aggregate value of these securities is $49,555,347 or 12.3% of the Fund's net assets. |
| (11) | Perpetual security with no stated maturity date but may be subject to calls by the issuer. |
| (12) | Security converts to variable rate after the indicated fixed-rate coupon period. |
| (13) | Represents a payment-in-kind security which may pay interest in additional principal at the issuer’s discretion. |
| (14) | Issuer is in default with respect to interest and/or principal payments. |
| (15) | Senior floating-rate loans (Senior Loans) often require prepayments from excess cash flows or permit the borrowers to repay at their election. The degree to which borrowers repay, whether as a contractual requirement or at their election, cannot be predicted with accuracy. As a result, the actual remaining maturity may be substantially less than the stated maturities shown. However, Senior Loans will typically have an expected average life of approximately two to four years. Senior Loans typically have rates of interest which are redetermined periodically by reference to a base lending rate, plus a spread. These base lending rates are primarily the London Interbank Offered Rate (“LIBOR”) or the Secured Overnight Financing Rate (“SOFR”) and secondarily, the prime rate offered by one or more major United States banks (the “Prime Rate”). Base lending rates may be subject to a floor, or minimum rate. Rates for SOFR are generally 1 or 3-month tenors and may also be subject to a credit spread adjustment. Senior Loans are generally subject to contractual restrictions that must be satisfied before they can be bought or sold. |
| (16) | The stated interest rate represents the weighted average interest rate at October 31, 2022 of contracts within the senior loan facility. Interest rates on contracts are primarily redetermined either weekly, monthly or quarterly by reference to the indicated base lending rate and spread and the reset period. |
| (17) | This Senior Loan will settle after October 31, 2022, at which time the interest rate will be determined. |
| (18) | Unfunded or partially unfunded loan commitments. The stated interest rate reflects the weighted average of the reference rate and spread for the funded portion, if any, and the commitment fees on the portion of the loan that is unfunded. At October 31, 2022, the total value of unfunded loan commitments is $265,634. See Note 1G for description. |
| (19) | TBA (To Be Announced) securities are purchased on a forward commitment basis with an approximate principal amount and maturity date. The actual principal amount and maturity date are determined upon settlement. |
| (20) | May be deemed to be an affiliated investment company. The rate shown is the annualized seven-day yield as of October 31, 2022. |
22
See Notes to Financial Statements.
Eaton Vance
Multi-Asset Credit Fund
October 31, 2022
Portfolio of Investments — continued
| Forward Foreign Currency Exchange Contracts (OTC) |
| Currency Purchased | Currency Sold | Counterparty | Settlement
Date | Unrealized
Appreciation | Unrealized
(Depreciation) |
| USD | 10,844,038 | EUR | 10,745,588 | Bank of America, N.A. | 1/31/23 | $ 145,231 | $ — |
| USD | 10,831,640 | EUR | 10,745,587 | Bank of America, N.A. | 1/31/23 | 132,834 | — |
| USD | 10,829,623 | EUR | 10,745,588 | Bank of America, N.A. | 1/31/23 | 130,816 | — |
| USD | 8,605,870 | EUR | 8,550,776 | Bank of America, N.A. | 1/31/23 | 92,320 | — |
| USD | 389,633 | EUR | 385,895 | Bank of America, N.A. | 1/31/23 | 5,418 | — |
| USD | 1,407 | EUR | 1,405 | Bank of America, N.A. | 1/31/23 | 9 | — |
| USD | 533,111 | EUR | 530,956 | State Street Bank and Trust Company | 1/31/23 | 4,466 | — |
| USD | 31,486 | EUR | 31,432 | State Street Bank and Trust Company | 1/31/23 | 191 | — |
| USD | 5,412,896 | GBP | 4,652,389 | Bank of America, N.A. | 1/31/23 | 61,213 | — |
| USD | 22,143 | GBP | 19,070 | JPMorgan Chase Bank, N.A. | 1/31/23 | 206 | — |
| | | | | | | $572,704 | $ — |
| Abbreviations: |
| EURIBOR | – Euro Interbank Offered Rate |
| LIBOR | – London Interbank Offered Rate |
| OTC | – Over-the-counter |
| PIK | – Payment In Kind |
| SOFR | – Secured Overnight Financing Rate |
| TBA | – To Be Announced |
| Currency Abbreviations: |
| EUR | – Euro |
| GBP | – British Pound Sterling |
| USD | – United States Dollar |
23
See Notes to Financial Statements.
Eaton Vance
Multi-Asset Credit Fund
October 31, 2022
Statement of Assets and Liabilities
| | October 31, 2022 |
| Assets | |
| Unaffiliated investments, at value (identified cost $429,196,631) | $ 374,946,826 |
| Affiliated investments, at value (identified cost $31,911,333) | 31,912,385 |
| Cash | 1,104,215 |
| Deposits for derivatives collateral - forward foreign currency exchange contracts | 600,199 |
| Interest receivable | 4,027,519 |
| Interest and dividends receivable from affiliated investments | 75,549 |
| Receivable for investments sold | 3,324,138 |
| Receivable for Fund shares sold | 144,797 |
| Receivable for open forward foreign currency exchange contracts | 572,704 |
| Tax reclaims receivable | 42,484 |
| Total assets | $ 416,750,816 |
| Liabilities | |
| Cash collateral due to broker | $ 600,199 |
| Payable for investments purchased | 1,601,376 |
| Payable for when-issued/delayed delivery/forward commitment securities | 10,425,398 |
| Payable for Fund shares redeemed | 697,440 |
| Distributions payable | 53,237 |
| Due to custodian - foreign currency, at value (identified cost $328,998) | 328,969 |
| Payable to affiliates: | |
| Investment adviser and administration fee | 180,064 |
| Distribution and service fees | 17,261 |
| Trustees' fees | 2,520 |
| Accrued expenses | 245,345 |
| Total liabilities | $ 14,151,809 |
| Net Assets | $ 402,599,007 |
| Sources of Net Assets | |
| Paid-in capital | $ 665,279,043 |
| Accumulated loss | (262,680,036) |
| Net Assets | $ 402,599,007 |
| Class A Shares | |
| Net Assets | $ 44,921,173 |
| Shares Outstanding | 4,777,192 |
Net Asset Value and Redemption Price Per Share
(net assets ÷ shares of beneficial interest outstanding) | $ 9.40 |
Maximum Offering Price Per Share
(100 ÷ 96.75 of net asset value per share) | $ 9.72 |
| Class C Shares | |
| Net Assets | $ 8,266,967 |
| Shares Outstanding | 878,442 |
Net Asset Value and Offering Price Per Share*
(net assets ÷ shares of beneficial interest outstanding) | $ 9.41 |
| Class I Shares | |
| Net Assets | $ 205,778,156 |
| Shares Outstanding | 21,827,267 |
Net Asset Value, Offering Price and Redemption Price Per Share
(net assets ÷ shares of beneficial interest outstanding) | $ 9.43 |
24
See Notes to Financial Statements.
Eaton Vance
Multi-Asset Credit Fund
October 31, 2022
Statement of Assets and Liabilities — continued
| | October 31, 2022 |
| Class R6 Shares | |
| Net Assets | $143,632,711 |
| Shares Outstanding | 15,240,121 |
Net Asset Value, Offering Price and Redemption Price Per Share
(net assets ÷ shares of beneficial interest outstanding) | $ 9.42 |
| On sales of $100,000 or more, the offering price of Class A shares is reduced. |
| * | Redemption price per share is equal to the net asset value less any applicable contingent deferred sales charge. |
25
See Notes to Financial Statements.
Eaton Vance
Multi-Asset Credit Fund
October 31, 2022
| | Year Ended |
| | October 31, 2022 |
| Investment Income | |
| Dividend income | $ 227,350 |
| Dividend income from affiliated investments | 210,000 |
| Interest and other income (net of foreign taxes withheld of $1,149) | 22,050,329 |
| Interest income from affiliated investments | 7,048 |
| Total investment income | $ 22,494,727 |
| Expenses | |
| Investment adviser and administration fee | $ 2,300,724 |
| Distribution and service fees: | |
| Class A | 118,710 |
| Class C | 166,735 |
| Trustees’ fees and expenses | 26,761 |
| Custodian fee | 195,651 |
| Transfer and dividend disbursing agent fees | 182,102 |
| Legal and accounting services | 108,205 |
| Printing and postage | 25,481 |
| Registration fees | 72,691 |
| Miscellaneous | 39,565 |
| Total expenses | $ 3,236,625 |
| Deduct: | |
| Waiver and/or reimbursement of expenses by affiliate | $ 14,565 |
| Total expense reductions | $ 14,565 |
| Net expenses | $ 3,222,060 |
| Net investment income | $ 19,272,667 |
| Realized and Unrealized Gain (Loss) | |
| Net realized gain (loss): | |
| Investment transactions | $ (11,875,711) |
| Investment transactions - affiliated investments | 10,072 |
| Swap contracts | 114,742 |
| Foreign currency transactions | (82,710) |
| Forward foreign currency exchange contracts | 8,036,342 |
| Net realized loss | $ (3,797,265) |
| Change in unrealized appreciation (depreciation): | |
| Investments | $ (47,880,221) |
| Investments - affiliated investments | 1,052 |
| Foreign currency | (15,079) |
| Forward foreign currency exchange contracts | 382,477 |
| Net change in unrealized appreciation (depreciation) | $(47,511,771) |
| Net realized and unrealized loss | $(51,309,036) |
| Net decrease in net assets from operations | $(32,036,369) |
26
See Notes to Financial Statements.
Eaton Vance
Multi-Asset Credit Fund
October 31, 2022
Statements of Changes in Net Assets
| | Year Ended October 31, |
| | 2022 | 2021 |
| Increase (Decrease) in Net Assets | | |
| From operations: | | |
| Net investment income | $ 19,272,667 | $ 17,241,814 |
| Net realized gain (loss) | (3,797,265) | 11,518,187 |
| Net change in unrealized appreciation (depreciation) | (47,511,771) | 8,104,986 |
| Net increase (decrease) in net assets from operations | $ (32,036,369) | $ 36,864,987 |
| Distributions to shareholders: | | |
| Class A | $ (2,179,540) | $ (2,441,307) |
| Class C | (613,791) | (918,488) |
| Class I | (12,184,954) | (13,710,039) |
| Class R6 | (5,097,071) | (1,018,286) |
| Total distributions to shareholders | $ (20,075,356) | $ (18,088,120) |
| Transactions in shares of beneficial interest: | | |
| Class A | $ (10,630,209) | $ (4,422,683) |
| Class C | (13,534,522) | (11,856,859) |
| Class I | (108,874,811) | 27,480,521 |
| Class R6 | 113,967,404 | 39,031,168 |
| Net increase (decrease) in net assets from Fund share transactions | $ (19,072,138) | $ 50,232,147 |
| Net increase (decrease) in net assets | $ (71,183,863) | $ 69,009,014 |
| Net Assets | | |
| At beginning of year | $ 473,782,870 | $ 404,773,856 |
| At end of year | $ 402,599,007 | $473,782,870 |
27
See Notes to Financial Statements.
Eaton Vance
Multi-Asset Credit Fund
October 31, 2022
| | Class A |
| | Year Ended October 31, |
| | 2022 | 2021 | 2020 | 2019 | 2018 |
| Net asset value — Beginning of year | $10.680 | $ 10.210 | $ 10.760 | $ 10.620 | $ 10.830 |
| Income (Loss) From Operations | | | | | |
| Net investment income(1) | $ 0.468 | $ 0.394 | $ 0.423 | $ 0.496 | $ 0.216 |
| Net realized and unrealized gain (loss) | (1.287) | 0.489 | (0.500) | 0.148 | (0.118) |
| Total income (loss) from operations | $ (0.819) | $ 0.883 | $ (0.077) | $ 0.644 | $ 0.098 |
| Less Distributions | | | | | |
| From net investment income | $ (0.461) | $ (0.413) | $ (0.473) | $ (0.504) | $ (0.308) |
| Total distributions | $ (0.461) | $ (0.413) | $ (0.473) | $ (0.504) | $ (0.308) |
| Net asset value — End of year | $ 9.400 | $10.680 | $10.210 | $10.760 | $10.620 |
| Total Return(2) | (7.80)% | 8.73% | (0.66)% (3) | 6.22% (3) | 0.89% (3) |
| Ratios/Supplemental Data | | | | | |
| Net assets, end of year (000’s omitted) | $44,921 | $ 61,518 | $ 63,023 | $ 3,888 | $ 1,032 |
| Ratios (as a percentage of average daily net assets):(4) | | | | | |
| Expenses | 0.97% (5) | 0.96% | 0.99% (3) | 1.00% (3) | 1.08% (3)(6)(7) |
| Net investment income | 4.66% | 3.70% | 4.13% | 4.64% | 2.00% |
| Portfolio Turnover | 80% | 76% | 93% | 96% | 113% (8) |
| (1) | Computed using average shares outstanding. |
| (2) | Returns are historical and are calculated by determining the percentage change in net asset value with all distributions reinvested and do not reflect the effect of sales charges. |
| (3) | The investment adviser and administrator (and sub-adviser, if applicable) reimbursed certain operating expenses (equal to 0.01%, 0.70% and 0.22% of average daily net assets for the years ended October 31, 2020, 2019 and 2018, respectively). Absent this reimbursement, total return would be lower. |
| (4) | Includes the Fund’s share of the Portfolios’ allocated expenses for the period while the Fund was investing in the Portfolios. |
| (5) | Includes a reduction by the investment adviser of a portion of its adviser and administration fee due to the Fund's investment in the Liquidity Fund (equal to less than 0.005% of average daily net assets for the year ended October 31, 2022). |
| (6) | Excludes expenses incurred by the Fund as a result of its investments in Affiliated Investment Funds (equal to 0.26% of average daily net assets for the year ended October 31, 2018). |
| (7) | Includes interest and dividend expense, including on securities sold short, of less than 0.005% of average daily net assets for the year ended October 31, 2018. |
| (8) | Percentage includes both the Fund's contributions to and withdrawals from the Portfolios and purchases and sales of securities held directly by the Fund, if any. |
References to Portfolios herein are to Massachusetts business trusts managed by Eaton Vance Management or its affiliates in which the Fund invested a substantial portion of its investable assets during the year ended October 31, 2018.
28
See Notes to Financial Statements.
Eaton Vance
Multi-Asset Credit Fund
October 31, 2022
Financial Highlights — continued
| | Class C |
| | Year Ended October 31, |
| | 2022 | 2021 | 2020 | 2019 | 2018 |
| Net asset value — Beginning of year | $10.690 | $ 10.220 | $ 10.770 | $ 10.620 | $ 10.790 |
| Income (Loss) From Operations | | | | | |
| Net investment income(1) | $ 0.352 | $ 0.315 | $ 0.353 | $ 0.411 | $ 0.159 |
| Net realized and unrealized gain (loss) | (1.246) | 0.489 | (0.508) | 0.154 | (0.090) |
| Total income (loss) from operations | $ (0.894) | $ 0.804 | $ (0.155) | $ 0.565 | $ 0.069 |
| Less Distributions | | | | | |
| From net investment income | $ (0.386) | $ (0.334) | $ (0.395) | $ (0.415) | $ (0.239) |
| Total distributions | $ (0.386) | $ (0.334) | $ (0.395) | $ (0.415) | $ (0.239) |
| Net asset value — End of year | $ 9.410 | $10.690 | $10.220 | $10.770 | $10.620 |
| Total Return(2) | (8.48)% | 7.92% | (1.40)% (3) | 5.43% (3) | 0.63% (3) |
| Ratios/Supplemental Data | | | | | |
| Net assets, end of year (000’s omitted) | $ 8,267 | $ 23,956 | $ 34,273 | $ 1,259 | $ 693 |
| Ratios (as a percentage of average daily net assets):(4) | | | | | |
| Expenses | 1.72% (5) | 1.71% | 1.74% (3) | 1.75% (3) | 1.82% (3)(6)(7) |
| Net investment income | 3.47% | 2.95% | 3.45% | 3.85% | 1.48% |
| Portfolio Turnover | 80% | 76% | 93% | 96% | 113% (8) |
| (1) | Computed using average shares outstanding. |
| (2) | Returns are historical and are calculated by determining the percentage change in net asset value with all distributions reinvested and do not reflect the effect of sales charges. |
| (3) | The investment adviser and administrator (and sub-adviser, if applicable) reimbursed certain operating expenses (equal to 0.01%, 0.70% and 0.28% of average daily net assets for the years ended October 31, 2020, 2019 and 2018, respectively). Absent this reimbursement, total return would be lower. |
| (4) | Includes the Fund’s share of the Portfolios’ allocated expenses for the period while the Fund was investing in the Portfolios. |
| (5) | Includes a reduction by the investment adviser of a portion of its adviser and administration fee due to the Fund's investment in the Liquidity Fund (equal to less than 0.005% of average daily net assets for the year ended October 31, 2022). |
| (6) | Excludes expenses incurred by the Fund as a result of its investments in Affiliated Investment Funds (equal to 0.26% of average daily net assets for the year ended October 31, 2018). |
| (7) | Includes interest and dividend expense, including on securities sold short, of less than 0.005% of average daily net assets for the year ended October 31, 2018. |
| (8) | Percentage includes both the Fund's contributions to and withdrawals from the Portfolios and purchases and sales of securities held directly by the Fund, if any. |
References to Portfolios herein are to Massachusetts business trusts managed by Eaton Vance Management or its affiliates in which the Fund invested a substantial portion of its investable assets during the year ended October 31, 2018.
29
See Notes to Financial Statements.
Eaton Vance
Multi-Asset Credit Fund
October 31, 2022
Financial Highlights — continued
| | Class I |
| | Year Ended October 31, |
| | 2022 | 2021 | 2020 | 2019 | 2018 |
| Net asset value — Beginning of year | $ 10.710 | $ 10.240 | $ 10.790 | $ 10.650 | $ 10.820 |
| Income (Loss) From Operations | | | | | |
| Net investment income(1) | $ 0.461 | $ 0.420 | $ 0.449 | $ 0.526 | $ 0.278 |
| Net realized and unrealized gain (loss) | (1.253) | 0.491 | (0.499) | 0.146 | (0.093) |
| Total income (loss) from operations | $ (0.792) | $ 0.911 | $ (0.050) | $ 0.672 | $ 0.185 |
| Less Distributions | | | | | |
| From net investment income | $ (0.488) | $ (0.441) | $ (0.500) | $ (0.532) | $ (0.355) |
| Total distributions | $ (0.488) | $ (0.441) | $ (0.500) | $ (0.532) | $ (0.355) |
| Net asset value — End of year | $ 9.430 | $ 10.710 | $ 10.240 | $10.790 | $10.650 |
| Total Return(2) | (7.53)% | 8.99% | (0.40)% (3) | 6.48% (3) | 1.72% (3) |
| Ratios/Supplemental Data | | | | | |
| Net assets, end of year (000’s omitted) | $205,778 | $345,990 | $304,389 | $ 68,533 | $ 17,654 |
| Ratios (as a percentage of average daily net assets):(4) | | | | | |
| Expenses | 0.72% (5) | 0.71% | 0.74% (3) | 0.75% (3) | 0.81% (3)(6)(7) |
| Net investment income | 4.56% | 3.93% | 4.38% | 4.90% | 2.59% |
| Portfolio Turnover | 80% | 76% | 93% | 96% | 113% (8) |
| (1) | Computed using average shares outstanding. |
| (2) | Returns are historical and are calculated by determining the percentage change in net asset value with all distributions reinvested. |
| (3) | The investment adviser and administrator (and sub-adviser, if applicable) reimbursed certain operating expenses (equal to 0.01%, 0.70% and 0.33% of average daily net assets for the years ended October 31, 2020, 2019 and 2018, respectively). Absent this reimbursement, total return would be lower. |
| (4) | Includes the Fund’s share of the Portfolios’ allocated expenses for the period while the Fund was investing in the Portfolios. |
| (5) | Includes a reduction by the investment adviser of a portion of its adviser and administration fee due to the Fund's investment in the Liquidity Fund (equal to less than 0.005% of average daily net assets for the year ended October 31, 2022). |
| (6) | Excludes expenses incurred by the Fund as a result of its investments in Affiliated Investment Funds (equal to 0.26% of average daily net assets for the year ended October 31, 2018). |
| (7) | Includes interest and dividend expense, including on securities sold short, of less than 0.005% of average daily net assets for the year ended October 31, 2018. |
| (8) | Percentage includes both the Fund's contributions to and withdrawals from the Portfolios and purchases and sales of securities held directly by the Fund, if any. |
References to Portfolios herein are to Massachusetts business trusts managed by Eaton Vance Management or its affiliates in which the Fund invested a substantial portion of its investable assets during the year ended October 31, 2018.
30
See Notes to Financial Statements.
Eaton Vance
Multi-Asset Credit Fund
October 31, 2022
Financial Highlights — continued
| | Class R6 |
| | Year Ended October 31, | Period Ended
October 31, 2019(1) |
| | 2022 | 2021 | 2020 | |
| Net asset value — Beginning of period | $ 10.710 | $ 10.230 | $ 10.790 | $ 10.820 |
| Income (Loss) From Operations | | | | |
| Net investment income(2) | $ 0.483 | $ 0.418 | $ 0.443 | $ 0.059 |
| Net realized and unrealized gain (loss) | (1.281) | 0.507 | (0.501) | (0.011) |
| Total income (loss) from operations | $ (0.798) | $ 0.925 | $ (0.058) | $ 0.048 |
| Less Distributions | | | | |
| From net investment income | $ (0.492) | $ (0.445) | $ (0.502) | $ (0.078) |
| Total distributions | $ (0.492) | $ (0.445) | $ (0.502) | $ (0.078) |
| Net asset value — End of period | $ 9.420 | $10.710 | $10.230 | $10.790 |
| Total Return(3) | (7.58)% | 9.13% | (0.47)% (4) | 0.44% (4)(5) |
| Ratios/Supplemental Data | | | | |
| Net assets, end of period (000’s omitted) | $143,633 | $ 42,319 | $ 3,089 | $ 10 |
| Ratios (as a percentage of average daily net assets): | | | | |
| Expenses | 0.66% (6) | 0.65% | 0.69% (4) | 0.75% (4)(7) |
| Net investment income | 4.90% | 3.90% | 4.34% | 3.40% (7) |
| Portfolio Turnover | 80% | 76% | 93% | 96% (8) |
| (1) | For the period from the commencement of operations, September 3, 2019, to October, 31, 2019. |
| (2) | Computed using average shares outstanding. |
| (3) | Returns are historical and are calculated by determining the percentage change in net asset value with all distributions reinvested. |
| (4) | The investment adviser and administrator and sub-adviser reimbursed certain operating expenses (equal to 0.01% and 0.68% of average daily net assets for the year ended October 31, 2020 and the period ended October 31, 2019, respectively). Absent this reimbursement, total return would be lower. |
| (5) | Not annualized. |
| (6) | Includes a reduction by the investment adviser of a portion of its adviser and administration fee due to the Fund's investment in the Liquidity Fund (equal to less than 0.005% of average daily net assets for the year ended October 31, 2022). |
| (7) | Annualized. |
| (8) | For the year ended October 31, 2019. |
31
See Notes to Financial Statements.
Eaton Vance
Multi-Asset Credit Fund
October 31, 2022
Notes to Financial Statements
1 Significant Accounting Policies
Eaton Vance Multi-Asset Credit Fund (the Fund) is a diversified series of Eaton Vance Mutual Funds Trust (the Trust). The Trust is a Massachusetts business trust registered under the Investment Company Act of 1940, as amended (the 1940 Act), as an open-end management investment company. The Fund’s investment objective is to seek total return. The Fund offers four classes of shares. Class A shares are generally sold subject to a sales charge imposed at time of purchase. Class C shares are sold at net asset value and are generally subject to a contingent deferred sales charge (see Note 6). Effective November 5, 2020, Class C shares automatically convert to Class A shares eight years after their purchase as described in the Fund’s prospectus. Class I and Class R6 shares are sold at net asset value and are not subject to a sales charge. Each class represents a pro-rata interest in the Fund, but votes separately on class-specific matters and (as noted below) is subject to different expenses. Realized and unrealized gains and losses are allocated daily to each class of shares based on the relative net assets of each class to the total net assets of the Fund. Net investment income, other than class-specific expenses, is allocated daily to each class of shares based upon the ratio of the value of each class’s paid shares to the total value of all paid shares. Sub-accounting, recordkeeping and similar administrative fees payable to financial intermediaries, which are a component of transfer and dividend disbursing agent fees on the Statement of Operations, are not allocated to Class R6 shares. Each class of shares differs in its distribution plan and certain other class-specific expenses.
The following is a summary of significant accounting policies of the Fund. The policies are in conformity with accounting principles generally accepted in the United States of America (U.S. GAAP). The Fund is an investment company and follows accounting and reporting guidance in the Financial Accounting Standards Board (FASB) Accounting Standards Codification Topic 946.
A Investment Valuation—The following methodologies are used to determine the market value or fair value of investments.
Debt Obligations. Debt obligations are generally valued on the basis of valuations provided by third party pricing services, as derived from such services’ pricing models. Inputs to the models may include, but are not limited to, reported trades, executable bid and ask prices, broker/dealer quotations, prices or yields of securities with similar characteristics, interest rates, anticipated prepayments, benchmark curves or information pertaining to the issuer, as well as industry and economic events. The pricing services may use a matrix approach, which considers information regarding securities with similar characteristics to determine the valuation for a security. Short-term debt obligations purchased with a remaining maturity of sixty days or less for which a valuation from a third party pricing service is not readily available may be valued at amortized cost, which approximates fair value.
Senior Floating-Rate Loans. Interests in senior floating-rate loans (Senior Loans) are valued generally at the average mean of bid and ask quotations obtained from a third party pricing service. Senior Loans, for which a valuation is not available or deemed unreliable, are fair valued by the investment adviser utilizing one or more of the valuation techniques described below to assess the likelihood that the borrower will make a full repayment of the loan underlying such Senior Loan. If the investment adviser believes that there is a reasonable likelihood of full repayment, the investment adviser will determine fair value using a matrix pricing approach that considers the yield on the Senior Loan relative to yields on other Senior Loans issued by companies of comparable credit quality. If the investment adviser believes there is not a reasonable likelihood of full repayment, the investment adviser will determine fair value using analyses that include, but are not limited to: (i) a comparison of the value of the borrower’s outstanding equity and debt to that of comparable public companies; (ii) a discounted cash flow analysis; or (iii) when the investment adviser believes it is likely that a borrower will be liquidated or sold, an analysis of the terms of such liquidation or sale. In certain cases, the investment adviser will use a combination of analytical methods to determine fair value, such as when only a portion of a borrower’s assets are likely to be sold. In conducting its assessment and analyses for purposes of determining fair value of a Senior Loan, the investment adviser will use its discretion and judgment in considering and appraising relevant factors. Junior Loans (i.e., subordinated loans and second lien loans) are valued in the same manner as Senior Loans.
Equity Securities. Equity securities listed on a U.S. securities exchange generally are valued at the last sale or closing price on the day of valuation or, if no sales took place on such date, at the mean between the closing bid and ask prices on the exchange where such securities are principally traded. Equity securities listed on the NASDAQ National Market System are valued at the NASDAQ official closing price. Unlisted or listed securities for which closing sales prices or closing quotations are not available are valued at the mean between the latest available bid and ask prices or, in the case of preferred equity securities that are not listed or traded in the over-the-counter market, by a third party pricing service that uses various techniques that consider factors including, but not limited to, prices or yields of securities with similar characteristics, benchmark yields, broker/dealer quotes, quotes of underlying common stock, issuer spreads, as well as industry and economic events.
Derivatives. Forward foreign currency exchange contracts are generally valued at the mean of the average bid and average ask prices that are reported by currency dealers to a third party pricing service at the valuation time. Such third party pricing service valuations are supplied for specific settlement periods and the Fund’s forward foreign currency exchange contracts are valued at an interpolated rate between the closest preceding and subsequent settlement period reported by the third party pricing service.
Foreign Securities and Currencies. Foreign securities and currencies are valued in U.S. dollars, based on foreign currency exchange rate quotations supplied by a third party pricing service. The pricing service uses a proprietary model to determine the exchange rate. Inputs to the model include reported trades and implied bid/ask spreads.
Other. Investments in management investment companies (including money market funds) that do not trade on an exchange are valued at the net asset value as of the close of each business day.
Eaton Vance
Multi-Asset Credit Fund
October 31, 2022
Notes to Financial Statements — continued
Fair Valuation. In connection with Rule 2a-5 of the 1940 Act, which became effective September 8, 2022, the Trustees have designated the Fund’s investment adviser as its valuation designee. Investments for which valuations or market quotations are not readily available or are deemed unreliable are valued by the investment adviser, as valuation designee, at fair value using methods that most fairly reflect the security’s “fair value”, which is the amount that the Fund might reasonably expect to receive for the security upon its current sale in the ordinary course. Each such determination is based on a consideration of relevant factors, which are likely to vary from one pricing context to another. These factors may include, but are not limited to, the type of security, the existence of any contractual restrictions on the security’s disposition, the price and extent of public trading in similar securities of the issuer or of comparable companies or entities, quotations or relevant information obtained from broker/dealers or other market participants, information obtained from the issuer, analysts, and/or the appropriate stock exchange (for exchange-traded securities), an analysis of the company’s or entity’s financial statements, and an evaluation of the forces that influence the issuer and the market(s) in which the security is purchased and sold.
B Investment Transactions—Investment transactions for financial statement purposes are accounted for on a trade date basis. Realized gains and losses on investments sold are determined on the basis of identified cost.
C Income—Interest income is recorded on the basis of interest accrued, adjusted for amortization of premium or accretion of discount. Fees associated with loan amendments are recognized immediately. Dividend income is recorded on the ex-dividend date for dividends received in cash and/or securities. Withholding taxes on foreign interest have been provided for in accordance with the Fund’s understanding of the applicable countries’ tax rules and rates. Distributions from investment companies are recorded as dividend income, capital gains or return of capital based on the nature of the distribution.
D Federal Taxes—The Fund's policy is to comply with the provisions of the Internal Revenue Code applicable to regulated investment companies and to distribute to shareholders each year substantially all of its net investment income, and all or substantially all of its net realized capital gains. Accordingly, no provision for federal income or excise tax is necessary.
As of October 31, 2022, the Fund had no uncertain tax positions that would require financial statement recognition, de-recognition, or disclosure. The Fund files a U.S. federal income tax return annually after its fiscal year-end, which is subject to examination by the Internal Revenue Service for a period of three years from the date of filing.
E Expenses—The majority of expenses of the Trust are directly identifiable to an individual fund. Expenses which are not readily identifiable to a specific fund are allocated taking into consideration, among other things, the nature and type of expense and the relative size of the funds.
F Foreign Currency Translation—Investment valuations, other assets, and liabilities initially expressed in foreign currencies are translated each business day into U.S. dollars based upon current exchange rates. Purchases and sales of foreign investment securities and income and expenses denominated in foreign currencies are translated into U.S. dollars based upon currency exchange rates in effect on the respective dates of such transactions. Recognized gains or losses on investment transactions attributable to changes in foreign currency exchange rates are recorded for financial statement purposes as net realized gains and losses on investments. That portion of unrealized gains and losses on investments that results from fluctuations in foreign currency exchange rates is not separately disclosed.
G Unfunded Loan Commitments—The Fund may enter into certain loan agreements all or a portion of which may be unfunded. The Fund is obligated to fund these commitments at the borrower's discretion. These commitments are disclosed in the accompanying Portfolio of Investments. At October 31, 2022, the Fund had sufficient cash and/or securities to cover these commitments.
H Use of Estimates—The preparation of the financial statements in conformity with U.S. GAAP requires management to make estimates and assumptions that affect the reported amounts of assets and liabilities at the date of the financial statements and the reported amounts of income and expense during the reporting period. Actual results could differ from those estimates.
I Indemnifications—Under the Trust’s organizational documents, its officers and Trustees may be indemnified against certain liabilities and expenses arising out of the performance of their duties to the Fund. Under Massachusetts law, if certain conditions prevail, shareholders of a Massachusetts business trust (such as the Trust) could be deemed to have personal liability for the obligations of the Trust. However, the Trust’s Declaration of Trust contains an express disclaimer of liability on the part of Fund shareholders and the By-laws provide that the Trust shall assume, upon request by the shareholder, the defense on behalf of any Fund shareholders. Moreover, the By-laws also provide for indemnification out of Fund property of any shareholder held personally liable solely by reason of being or having been a shareholder for all loss or expense arising from such liability. Additionally, in the normal course of business, the Fund enters into agreements with service providers that may contain indemnification clauses. The Fund’s maximum exposure under these arrangements is unknown as this would involve future claims that may be made against the Fund that have not yet occurred.
J Forward Foreign Currency Exchange Contracts—The Fund may enter into forward foreign currency exchange contracts for the purchase or sale of a specific foreign currency at a fixed price on a future date. The forward foreign currency exchange contracts are adjusted by the daily exchange rate of the underlying currency and any gains or losses are recorded as unrealized until such time as the contracts have been closed. Risks may arise upon entering these contracts from the potential inability of counterparties to meet the terms of their contracts and from movements in the value of a foreign currency relative to the U.S. dollar.
Eaton Vance
Multi-Asset Credit Fund
October 31, 2022
Notes to Financial Statements — continued
K Credit Default Swaps—Swap contracts are privately negotiated agreements between the Fund and a counterparty. Certain swap contracts may be centrally cleared (“centrally cleared swaps”), whereby all payments made or received by the Fund pursuant to the contract are with a central clearing party (CCP) rather than the original counterparty. The CCP guarantees the performance of the original parties to the contract. When the Fund is the buyer of a credit default swap contract, the Fund is entitled to receive the par (or other agreed-upon) value of a referenced debt obligation (or basket of debt obligations) from the counterparty (or CCP in the case of a centrally cleared swap) to the contract if a credit event by a third party, such as a U.S. or foreign corporate issuer or sovereign issuer, on the debt obligation occurs. In return, the Fund pays the counterparty a periodic stream of payments over the term of the contract provided that no credit event has occurred. If no credit event occurs, the Fund would have spent the stream of payments and received no proceeds from the contract. When the Fund is the seller of a credit default swap contract, it receives the stream of payments, but is obligated to pay to the buyer of the protection an amount up to the notional amount of the swap and in certain instances take delivery of securities of the reference entity upon the occurrence of a credit event, as defined under the terms of that particular swap agreement. Credit events are contract specific but may include bankruptcy, failure to pay, restructuring, obligation acceleration and repudiation/moratorium. If the Fund is a seller of protection and a credit event occurs, the maximum potential amount of future payments that the Fund could be required to make would be an amount equal to the notional amount of the agreement. This potential amount would be partially offset by any recovery value of the respective referenced obligation, or net amount received from the settlement of a buy protection credit default swap agreement entered into by the Fund for the same referenced obligation. As the seller, the Fund may create economic leverage to its portfolio because, in addition to its total net assets, the Fund is subject to investment exposure on the notional amount of the swap. The interest fee paid or received on the swap contract, which is based on a specified interest rate on a fixed notional amount, is accrued daily as a component of unrealized appreciation (depreciation) and is recorded as realized gain upon receipt or realized loss upon payment. The Fund also records an increase or decrease to unrealized appreciation (depreciation) in an amount equal to the daily valuation. For centrally cleared swaps, the daily change in valuation is recorded as a receivable or payable for variation margin and settled in cash with the CCP daily. All upfront payments and receipts, if any, are amortized over the life of the swap contract as realized gains or losses. Those upfront payments or receipts for non-centrally cleared swaps are recorded as other assets or other liabilities, respectively, net of amortization. For financial reporting purposes, unamortized upfront payments or receipts, if any, are netted with unrealized appreciation or depreciation on swap contracts to determine the market value of swaps. Upon entering into centrally cleared swaps, the Fund is required to deposit with the CCP, either in cash or securities, an amount equal to a certain percentage of the notional amount (initial margin), which is subject to adjustment. These transactions involve certain risks, including the risk that the seller may be unable to fulfill the transaction. In the case of centrally cleared swaps, counterparty risk is minimal due to protections provided by the CCP.
2 Distributions to Shareholders and Income Tax Information
The Fund declares dividends daily to shareholders of record at the time of declaration. Distributions are generally paid monthly. Distributions of realized capital gains (if any) are made annually. Distributions to shareholders are recorded on the ex-dividend date. Distributions are declared separately for each class of shares. Shareholders may reinvest income and capital gain distributions in additional shares of the same class of the Fund at the net asset value as of the ex-dividend date or, at the election of the shareholder, receive distributions in cash. Distributions to shareholders are determined in accordance with income tax regulations, which may differ from U.S. GAAP. As required by U.S. GAAP, only distributions in excess of tax basis earnings and profits are reported in the financial statements as a return of capital. Permanent differences between book and tax accounting relating to distributions are reclassified to paid-in capital. For tax purposes, distributions from short-term capital gains are considered to be from ordinary income.
The tax character of distributions declared for the years ended October 31, 2022 and October 31, 2021 was as follows:
| | Year Ended October 31, |
| | 2022 | 2021 |
| Ordinary income | $20,075,356 | $18,088,120 |
During the year ended October 31, 2022, accumulated loss was increased by $256,117 and paid-in capital was increased by $256,117 due to the Fund’s use of equalization accounting. Tax equalization accounting allows the Fund to treat as a distribution that portion of redemption proceeds representing a redeeming shareholder’s portion of undistributed taxable income and net capital gains. These reclassifications had no effect on the net assets or net asset value per share of the Fund.
Eaton Vance
Multi-Asset Credit Fund
October 31, 2022
Notes to Financial Statements — continued
As of October 31, 2022, the components of distributable earnings (accumulated loss) on a tax basis were as follows:
| Undistributed ordinary income | $ 25,534 |
| Deferred capital losses | (213,345,760) |
| Net unrealized depreciation | (49,306,573) |
| Distributions payable | (53,237) |
| Accumulated loss | $(262,680,036) |
At October 31, 2022, the Fund, for federal income tax purposes, had deferred capital losses of $213,345,760 which would reduce its taxable income arising from future net realized gains on investment transactions, if any, to the extent permitted by the Internal Revenue Code, and thus would reduce the amount of distributions to shareholders, which would otherwise be necessary to relieve the Fund of any liability for federal income or excise tax. The deferred capital losses are treated as arising on the first day of the Fund’s next taxable year and retain the same short-term or long-term character as when originally deferred. Of the deferred capital losses at October 31, 2022, $4,961,764 are short-term and $208,383,996 are long-term.
The cost and unrealized appreciation (depreciation) of investments, including open derivative contracts, of the Fund at October 31, 2022, as determined on a federal income tax basis, were as follows:
| Aggregate cost | $ 456,149,830 |
| Gross unrealized appreciation | $ 1,139,954 |
| Gross unrealized depreciation | (50,430,573) |
| Net unrealized depreciation | $ (49,290,619) |
3 Investment Adviser and Administration Fee and Other Transactions with Affiliates
The investment adviser and administration fee is earned by Eaton Vance Management (EVM), an indirect, wholly-owned subsidiary of Morgan Stanley, as compensation for investment advisory and administrative services rendered to the Fund. The investment adviser and administration fee is computed at an annual rate as a percentage of the Fund’s average daily net assets that are not invested in other investment companies for which EVM or its affiliates serve as investment adviser and receive an advisory fee as follows and is payable monthly:
| Average Daily Net Assets | Annual Fee Rate |
| Up to $1 billion | 0.550% |
| $1 billion but less than $2.5 billion | 0.530% |
| $2.5 billion but less than $5 billion | 0.510% |
| $5 billion and over | 0.500% |
For the year ended October 31, 2022, the investment adviser and administration fee amounted to $2,300,724 or 0.55% of the Fund’s average daily net assets. Pursuant to an investment sub-advisory agreement, EVM has delegated a portion of the investment management of the Fund to Eaton Vance Advisers International Ltd. (EVAIL), an affiliate of EVM. EVM pays EVAIL a portion of its investment adviser and administration fee for sub-advisory services provided to the Fund.
Effective April 26, 2022, the Fund may invest in a money market fund, the Institutional Class of the Morgan Stanley Institutional Liquidity Funds - Government Portfolio (the "Liquidity Fund"), an open-end management investment company managed by Morgan Stanley Investment Management Inc., a wholly-owned subsidiary of Morgan Stanley. The investment adviser and administration fee paid by the Fund is reduced by an amount equal to its pro-rata share of the advisory and administration fees paid by the Fund due to its investment in the Liquidity Fund. For the year ended October 31, 2022, the investment adviser and administration fee paid was reduced by $14,565 relating to the Fund's investment in the Liquidity Fund. Prior to April 26, 2022, the Fund may have invested its cash in Eaton Vance Cash Reserves Fund, LLC (Cash Reserves Fund), an affiliated investment company managed by EVM. EVM did not receive a fee for advisory services provided to Cash Reserves Fund.
Eaton Vance
Multi-Asset Credit Fund
October 31, 2022
Notes to Financial Statements — continued
EVM and EVAIL have agreed to reimburse the Fund’s expenses to the extent that total annual operating expenses (relating to ordinary operating expenses only and excluding such expenses as acquired fund fees and expenses of unaffiliated funds, borrowing costs, taxes or litigation expenses) exceed 0.99%, 1.74%, 0.74% and 0.69% of the Fund’s average daily net assets for Class A, Class C, Class I and Class R6, respectively. This agreement may be changed or terminated after February 28, 2023. Pursuant to this agreement, no operating expenses were allocated to EVM and EVAIL for the year ended October 31, 2022.
EVM provides sub-transfer agency and related services to the Fund pursuant to a Sub-Transfer Agency Support Services Agreement. For the year ended October 31, 2022, EVM earned $11,300 from the Fund pursuant to such agreement, which is included in transfer and dividend disbursing agent fees on the Statement of Operations. The Fund was informed that Eaton Vance Distributors, Inc. (EVD), an affiliate of EVM and the Fund’s principal underwriter, received $182 as its portion of the sales charges on sales of Class A shares for the year ended October 31, 2022. EVD also received distribution and service fees from Class A and Class C shares (see Note 5) and contingent deferred sales charges (see Note 6).
Trustees and officers of the Fund who are members of EVM’s organization receive remuneration for their services to the Fund out of the investment adviser and administration fee. Trustees of the Fund who are not affiliated with EVM may elect to defer receipt of all or a percentage of their annual fees in accordance with the terms of the Trustees Deferred Compensation Plan. For the year ended October 31, 2022, no significant amounts have been deferred. Certain officers and Trustees of the Fund are officers of EVM.
4 Purchases and Sales of Investments
Purchases and sales of investments, other than short-term obligations and including maturities, paydowns and principal repayments on Senior Loans, for the year ended October 31, 2022 were as follows:
| | Purchases | Sales |
| Investments (non-U.S. Government) | $ 292,765,499 | $ 319,802,266 |
| U.S. Government and Agency Securities | 26,627,079 | 20,366,257 |
| | $319,392,578 | $340,168,523 |
5 Distribution Plans
The Fund has in effect a distribution plan for Class A shares (Class A Plan) pursuant to Rule 12b-1 under the 1940 Act. Pursuant to the Class A Plan, the Fund pays EVD a distribution and service fee of 0.25% per annum of its average daily net assets attributable to Class A shares for distribution services and facilities provided to the Fund by EVD, as well as for personal services and/or the maintenance of shareholder accounts. Distribution and service fees paid or accrued to EVD for the year ended October 31, 2022 amounted to $118,710 for Class A shares.
The Fund also has in effect a distribution plan for Class C shares (Class C Plan) pursuant to Rule 12b-1 under the 1940 Act. Pursuant to the Class C Plan, the Fund pays EVD amounts equal to 0.75% per annum of its average daily net assets attributable to Class C shares for providing ongoing distribution services and facilities to the Fund. For the year ended October 31, 2022, the Fund paid or accrued to EVD $125,051 for Class C shares.
Pursuant to the Class C Plan, the Fund also makes payments of service fees to EVD, financial intermediaries and other persons in amounts equal to 0.25% per annum of its average daily net assets attributable to that class. Service fees paid or accrued are for personal services and/or the maintenance of shareholder accounts. They are separate and distinct from the sales commissions and distribution fees payable to EVD. Service fees paid or accrued for the year ended October 31, 2022 amounted to $41,684 for Class C shares.
Distribution and service fees are subject to the limitations contained in the Financial Industry Regulatory Authority Rule 2341(d).
6 Contingent Deferred Sales Charges
A contingent deferred sales charge (CDSC) of 1% generally is imposed on redemptions of Class C shares made within 12 months of purchase. Class A shares may be subject to a 0.75% (1% prior to April 29, 2022) CDSC if redeemed within 12 months (18 months prior to April 29, 2022) of purchase (depending on the circumstances of purchase). Generally, the CDSC is based upon the lower of the net asset value at date of redemption or date of purchase. No charge is levied on shares acquired by reinvestment of dividends or capital gain distributions. For the year ended October 31, 2022, the Fund was informed that EVD received less than $100 of CDSCs paid by Class C shareholders and no CDSCs paid by Class A shareholders.
Eaton Vance
Multi-Asset Credit Fund
October 31, 2022
Notes to Financial Statements — continued
7 Shares of Beneficial Interest
The Fund’s Declaration of Trust permits the Trustees to issue an unlimited number of full and fractional shares of beneficial interest (without par value). Such shares may be issued in a number of different series (such as the Fund) and classes. Transactions in Fund shares, including direct exchanges pursuant to share class conversions for all periods presented, were as follows:
| | Year Ended
October 31, 2022 | | Year Ended
October 31, 2021 |
| | Shares | Amount | | Shares | Amount |
| Class A | | | | | |
| Sales | 1,174,963 | $ 11,607,550 | | 852,631 | $ 9,060,118 |
| Issued to shareholders electing to receive payments of distributions in Fund shares | 187,456 | 1,857,405 | | 164,533 | 1,754,967 |
| Redemptions | (2,343,927) | (24,095,164) | | (1,431,541) | (15,237,768) |
| Net decrease | (981,508) | $ (10,630,209) | | (414,377) | $ (4,422,683) |
| Class C | | | | | |
| Sales | 28,523 | $ 287,396 | | 125,590 | $ 1,333,427 |
| Issued to shareholders electing to receive payments of distributions in Fund shares | 60,321 | 603,965 | | 84,549 | 902,296 |
| Redemptions | (1,450,989) | (14,425,883) | | (1,323,584) | (14,092,582) |
| Net decrease | (1,362,145) | $ (13,534,522) | | (1,113,445) | $ (11,856,859) |
| Class I | | | | | |
| Sales | 6,164,379 | $ 63,453,436 | | 12,756,957 | $ 136,200,827 |
| Issued to shareholders electing to receive payments of distributions in Fund shares | 1,194,356 | 11,928,833 | | 1,255,082 | 13,427,614 |
| Redemptions | (17,836,543) | (184,257,080) | | (11,445,365) | (122,147,920) |
| Net increase (decrease) | (10,477,808) | $(108,874,811) | | 2,566,674 | $ 27,480,521 |
| Class R6 | | | | | |
| Sales | 11,166,945 | $ 113,062,124 | | 3,703,402 | $ 39,586,888 |
| Issued to shareholders electing to receive payments of distributions in Fund shares | 509,601 | 4,956,821 | | 71,105 | 762,586 |
| Redemptions | (389,300) | (4,051,541) | | (123,440) | (1,318,306) |
| Net increase | 11,287,246 | $ 113,967,404 | | 3,651,067 | $ 39,031,168 |
At October 31, 2022, donor advised and pooled income funds (established and maintained by a public charity) managed by EVM owned in the aggregate 26.5% of the value of the outstanding shares of the Fund.
8 Financial Instruments
The Fund may trade in financial instruments with off-balance sheet risk in the normal course of its investing activities. These financial instruments may include forward foreign currency exchange contracts and swap contracts and may involve, to a varying degree, elements of risk in excess of the amounts recognized for financial statement purposes. The notional or contractual amounts of these instruments represent the investment the Fund has in particular classes of financial instruments and do not necessarily represent the amounts potentially subject to risk. The measurement of the risks associated with these instruments is meaningful only when all related and offsetting transactions are considered. A summary of obligations under these financial instruments at October 31, 2022 is included in the Portfolio of Investments. At October 31, 2022, the Fund had sufficient cash and/or securities to cover commitments under these contracts.
Eaton Vance
Multi-Asset Credit Fund
October 31, 2022
Notes to Financial Statements — continued
In the normal course of pursuing its investment objective, the Fund is subject to the following risks:
Credit Risk: During the year ended October 31, 2022, the Fund entered into credit default swap contracts to enhance total return and/or as a substitute for the purchase of securities.
Foreign Exchange Risk: The Fund engages in forward foreign currency exchange contracts to hedge against fluctuations in currency exchange rates.
The Fund enters into forward foreign currency exchange contracts that may contain provisions whereby the counterparty may terminate the contract under certain conditions, including but not limited to a decline in the Fund's net assets below a certain level over a certain period of time, which would trigger a payment by the Fund for those derivatives in a liability position. At October 31, 2022, the Fund had no open derivatives with credit-related contingent features in a net liability position.
The over-the-counter (OTC) derivatives in which the Fund invests are subject to the risk that the counterparty to the contract fails to perform its obligations under the contract. To mitigate this risk, the Fund has entered into an International Swaps and Derivatives Association, Inc. Master Agreement (“ISDA Master Agreement”) or similar agreement with substantially all its derivative counterparties. An ISDA Master Agreement is a bilateral agreement between the Fund and a counterparty that governs certain OTC derivatives and typically contains, among other things, set-off provisions in the event of a default and/or termination event as defined under the relevant ISDA Master Agreement. Under an ISDA Master Agreement, the Fund may, under certain circumstances, offset with the counterparty certain derivative financial instruments’ payables and/or receivables with collateral held and/or posted and create one single net payment. The provisions of the ISDA Master Agreement typically permit a single net payment in the event of default including the bankruptcy or insolvency of the counterparty. However, bankruptcy or insolvency laws of a particular jurisdiction may impose restrictions on or prohibitions against the right of offset in bankruptcy or insolvency. Certain ISDA Master Agreements allow counterparties to OTC derivatives to terminate derivative contracts prior to maturity in the event the Fund’s net assets decline by a stated percentage or the Fund fails to meet the terms of its ISDA Master Agreements, which would cause the counterparty to accelerate payment by the Fund of any net liability owed to it.
The collateral requirements for derivatives traded under an ISDA Master Agreement are governed by a Credit Support Annex to the ISDA Master Agreement. Collateral requirements are determined at the close of business each day and are typically based on changes in market values for each transaction under an ISDA Master Agreement and netted into one amount for such agreement. Generally, the amount of collateral due from or to a counterparty is subject to a minimum transfer threshold amount before a transfer is required, which may vary by counterparty. Collateral pledged for the benefit of the Fund and/or counterparty is held in segregated accounts by the Fund’s custodian and cannot be sold, re-pledged, assigned or otherwise used while pledged. The portion of such collateral representing cash, if any, is reflected as deposits for derivatives collateral and, in the case of cash pledged by a counterparty for the benefit of the Fund, a corresponding liability on the Statement of Assets and Liabilities. Securities pledged by the Fund as collateral, if any, are identified as such in the Portfolio of Investments. The carrying amount of the liability for cash collateral due to broker at October 31, 2022 approximated its fair value. If measured at fair value, such liability would have been considered as Level 2 in the fair value hierarchy (see Note 11) at October 31, 2022.
The fair value of open derivative instruments (not considered to be hedging instruments for accounting disclosure purposes) and whose primary underlying risk exposure is foreign exchange risk at October 31, 2022 was as follows:
| | Fair Value |
| Derivative | Asset Derivative | Liability Derivative |
| Forward foreign currency exchange contracts | $572,704 (1) | $ — |
| (1) | Statement of Assets and Liabilities location: Receivable for open forward foreign currency exchange contracts. |
Eaton Vance
Multi-Asset Credit Fund
October 31, 2022
Notes to Financial Statements — continued
The Fund's derivative assets at fair value by type, which are reported gross in the Statement of Assets and Liabilities, are presented in the table above. The following table presents the Fund’s derivative assets by counterparty, net of amounts available for offset under a master netting agreement and net of the related collateral received by the Fund for such assets as of October 31, 2022.
| Counterparty | Derivative
Assets Subject to
Master Netting
Agreement | Derivatives
Available
for Offset | Non-cash
Collateral
Received(a) | Cash
Collateral
Received(a) | Net Amount
of Derivative
Assets(b) |
| Bank of America, N.A. | $ 567,841 | $ — | $ — | $ (400,000) | $ 167,841 |
| JPMorgan Chase Bank, N.A. | 206 | — | — | — | 206 |
| State Street Bank and Trust Company | 4,657 | — | (4,657) | — | — |
| | $572,704 | $ — | $(4,657) | $(400,000) | $168,047 |
| (a) | In some instances, the total collateral received and/or pledged may be more than the amount shown due to overcollateralization. |
| (b) | Net amount represents the net amount due from the counterparty in the event of default. |
The effect of derivative instruments (not considered to be hedging instruments for accounting disclosure purposes) on the Statement of Operations by risk exposure for the year ended October 31, 2022 was as follows:
| Statement of Operations Caption | Credit | Foreign
Exchange | Total |
| Net realized gain (loss): | | | |
| Swap contracts | $ 114,742 | $ — | $ 114,742 |
| Forward foreign currency exchange contracts | — | 8,036,342 | 8,036,342 |
| Total | $114,742 | $8,036,342 | $8,151,084 |
| Change in unrealized appreciation (depreciation): | | | |
| Forward foreign currency exchange contracts | $ — | $ 382,477 | $ 382,477 |
The average notional amounts of derivative contracts outstanding during the year ended October 31, 2022, which are indicative of the volume of these derivative types, were approximately as follows:
Forward
Foreign Currency
Exchange Contracts* | Swap
Contracts |
| $54,344,000 | $385,000 |
| * | The average notional amount for forward foreign currency exchange contracts is based on the absolute value of notional amounts of currency purchased and currency sold. |
Eaton Vance
Multi-Asset Credit Fund
October 31, 2022
Notes to Financial Statements — continued
9 Line of Credit
The Fund participates with other portfolios and funds managed by EVM and its affiliates in a $725 million unsecured line of credit agreement with a group of banks, which is in effect through October 24, 2023. In connection with the renewal of the agreement on October 25, 2022, the borrowing limit was decreased from $800 million. Borrowings are made by the Fund solely for temporary purposes related to redemptions and other short-term cash needs. Interest is charged to the Fund based on its borrowings at an amount above either the Secured Overnight Financing Rate (SOFR) or Federal Funds rate. In addition, a fee computed at an annual rate of 0.15% on the daily unused portion of the line of credit is allocated among the participating portfolios and funds at the end of each quarter. Also in connection with the renewal of the agreement, an arrangement fee totaling $150,000 was incurred that was allocated to the participating portfolios and funds. Because the line of credit is not available exclusively to the Fund, it may be unable to borrow some or all of its requested amounts at any particular time. The Fund did not have any significant borrowings or allocated fees during the year ended October 31, 2022.
10 Investments in Affiliated Issuers and Funds
The Fund invested in issuers that may be deemed to be affiliated with Morgan Stanley. At October 31, 2022, the value of the Fund's investment in affiliated issuers and funds was $31,912,385, which represents 7.9% of the Fund's net assets. Transactions in affiliated issuers and funds by the Fund for the year ended October 31, 2022 were as follows:
| Name | Value,
beginning
of period | Purchases | Sales
proceeds | Net
realized
gain (loss) | Change in
unrealized
appreciation
(depreciation) | Value, end
of period | Interest/
Dividend
income | Principal amount/
Units/Shares, end
of period |
| Commercial Mortgage-Backed Securities | | | | | | | | |
| Morgan Stanley Capital I Trust, Series 2019-BPR, Class A, 5.062%, (1 mo. USD LIBOR + 1.65%), 5/15/36 | $ — | $ 477,500 | $ (61,607) | $ 2,761 | $ 1,052 | $ 420,332 | $ 7,048 | $ 438,393 |
| Short-Term Investments |
| Cash Reserves Fund | 21,857,933 | 252,340,921 | (274,206,165) | 7,311 | — | — | 9,520 | — |
| Liquidity Fund | — | 180,051,621 | (148,559,568) | — | — | 31,492,053 | 200,480 | 31,492,053 |
| Total | | | | $10,072 | $1,052 | $31,912,385 | $217,048 | |
11 Fair Value Measurements
Under generally accepted accounting principles for fair value measurements, a three-tier hierarchy to prioritize the assumptions, referred to as inputs, is used in valuation techniques to measure fair value. The three-tier hierarchy of inputs is summarized in the three broad levels listed below.
| • | Level 1 – quoted prices in active markets for identical investments |
| • | Level 2 – other significant observable inputs (including quoted prices for similar investments, interest rates, prepayment speeds, credit risk, etc.) |
| • | Level 3 – significant unobservable inputs (including a fund's own assumptions in determining the fair value of investments) |
In cases where the inputs used to measure fair value fall in different levels of the fair value hierarchy, the level disclosed is determined based on the lowest level input that is significant to the fair value measurement in its entirety. The inputs or methodology used for valuing securities are not necessarily an indication of the risk associated with investing in those securities.
At October 31, 2022, the hierarchy of inputs used in valuing the Fund's investments and open derivative instruments, which are carried at value, were as follows:
| Asset Description | Level 1 | Level 2 | Level 3* | Total |
| Asset-Backed Securities | $ — | $ 20,797,562 | $ — | $ 20,797,562 |
| Collateralized Mortgage Obligations | — | 1,778,636 | — | 1,778,636 |
| Commercial Mortgage-Backed Securities | — | 12,619,953 | — | 12,619,953 |
Eaton Vance
Multi-Asset Credit Fund
October 31, 2022
Notes to Financial Statements — continued
| Asset Description (continued) | Level 1 | Level 2 | Level 3* | Total |
| Common Stocks | $ — | $ 425 | $ 0 | $ 425 |
| Convertible Bonds | — | 606,527 | — | 606,527 |
| Convertible Preferred Stocks | — | 2,611 | — | 2,611 |
| Corporate Bonds | — | 198,957,063 | — | 198,957,063 |
| Preferred Stocks | 975,402 | — | — | 975,402 |
| Senior Floating-Rate Loans (Less Unfunded Loan Commitments) | — | 120,005,873 | — | 120,005,873 |
| U.S. Government Agency Mortgage-Backed Securities | — | 9,768,211 | — | 9,768,211 |
| U.S. Treasury Obligations | — | 9,847,020 | — | 9,847,020 |
| Warrants | — | 0 | 0 | 0 |
| Miscellaneous | — | 7,875 | — | 7,875 |
| Short-Term Investments | 31,492,053 | — | — | 31,492,053 |
| Total Investments | $32,467,455 | $374,391,756 | $ — | $406,859,211 |
| Forward Foreign Currency Exchange Contracts | $ — | $ 572,704 | $ — | $ 572,704 |
| Total | $32,467,455 | $374,964,460 | $ — | $407,431,915 |
| * | None of the unobservable inputs for Level 3 assets, individually or collectively, had a material impact on the Fund. |
Level 3 investments at the beginning and/or end of the period in relation to net assets were not significant and accordingly, a reconciliation of Level 3 assets for the year ended October 31, 2022 is not presented.
12 Risks and Uncertainties
LIBOR Transition Risk
Certain instruments held by the Fund may pay an interest rate based on the London Interbank Offered Rate (“LIBOR”), which is the average offered rate for various maturities of short-term loans between certain major international banks. LIBOR is used throughout global banking and financial industries to determine interest rates for a variety of financial instruments (such as debt instruments and derivatives) and borrowing arrangements. The ICE Benchmark Administration Limited, the administrator of LIBOR, ceased publishing certain LIBOR settings on December 31, 2021, and is expected to cease publishing the remaining LIBOR settings on June 30, 2023. Although the transition process away from LIBOR has become increasingly well-defined, the impact on certain debt securities, derivatives and other financial instruments that utilize LIBOR remains uncertain. The phase-out of LIBOR may result in, among other things, increased volatility or illiquidity in markets for instruments based on LIBOR and changes in the value of such instruments.
Pandemic Risk
An outbreak of respiratory disease caused by a novel coronavirus was first detected in China in late 2019 and subsequently spread internationally. This coronavirus has resulted in closing borders, enhanced health screenings, changes to healthcare service preparation and delivery, quarantines, cancellations, disruptions to supply chains and customer activity, as well as general concern and uncertainty. Health crises caused by outbreaks of disease, such as the coronavirus outbreak, may exacerbate other pre-existing political, social and economic risks and disrupt normal market conditions and operations. The impact of this outbreak has negatively affected the worldwide economy, as well as the economies of individual countries and industries, and could continue to affect the market in significant and unforeseen ways. Other epidemics and pandemics that may arise in the future may have similar effects. Any such impact could adversely affect the Fund's performance, or the performance of the securities in which the Fund invests.
Eaton Vance
Multi-Asset Credit Fund
October 31, 2022
Report of Independent Registered Public Accounting Firm
To the Trustees of Eaton Vance Mutual Funds Trust and Shareholders of Eaton Vance Multi-Asset Credit Fund:
Opinion on the Financial Statements and Financial Highlights
We have audited the accompanying statement of assets and liabilities of Eaton Vance Multi-Asset Credit Fund (the "Fund") (one of the funds constituting Eaton Vance Mutual Funds Trust), including the portfolio of investments, as of October 31, 2022, the related statement of operations for the year then ended, the statements of changes in net assets for each of the two years in the period then ended, the financial highlights for each of the five years in the period then ended, and the related notes. In our opinion, the financial statements and financial highlights present fairly, in all material respects, the financial position of the Fund as of October 31, 2022, and the results of its operations for the year then ended, the changes in its net assets for each of the two years in the period then ended, and the financial highlights for each of the five years in the period then ended in conformity with accounting principles generally accepted in the United States of America.
Basis for Opinion
These financial statements and financial highlights are the responsibility of the Fund's management. Our responsibility is to express an opinion on the Fund's financial statements and financial highlights based on our audits. We are a public accounting firm registered with the Public Company Accounting Oversight Board (United States) (PCAOB) and are required to be independent with respect to the Fund in accordance with the U.S. federal securities laws and the applicable rules and regulations of the Securities and Exchange Commission and the PCAOB.
We conducted our audits in accordance with the standards of the PCAOB. Those standards require that we plan and perform the audit to obtain reasonable assurance about whether the financial statements and financial highlights are free of material misstatement, whether due to error or fraud. The Fund is not required to have, nor were we engaged to perform, an audit of its internal control over financial reporting. As part of our audits, we are required to obtain an understanding of internal control over financial reporting but not for the purpose of expressing an opinion on the effectiveness of the Fund’s internal control over financial reporting. Accordingly, we express no such opinion.
Our audits included performing procedures to assess the risks of material misstatement of the financial statements and financial highlights, whether due to error or fraud, and performing procedures that respond to those risks. Such procedures included examining, on a test basis, evidence regarding the amounts and disclosures in the financial statements and financial highlights. Our audits also included evaluating the accounting principles used and significant estimates made by management, as well as evaluating the overall presentation of the financial statements and financial highlights. Our procedures included confirmation of securities and senior loans owned as of October 31, 2022, by correspondence with the custodian, brokers and selling or agent banks; when replies were not received from brokers, and selling or agent banks, we performed other auditing procedures. We believe that our audits provide a reasonable basis for our opinion.
/s/ Deloitte & Touche LLP
Boston, Massachusetts
December 20, 2022
We have served as the auditor of one or more Eaton Vance investment companies since 1959.
Eaton Vance
Multi-Asset Credit Fund
October 31, 2022
Federal Tax Information (Unaudited)
The Form 1099-DIV you receive in February 2023 will show the tax status of all distributions paid to your account in calendar year 2022. Shareholders are advised to consult their own tax adviser with respect to the tax consequences of their investment in the Fund. As required by the Internal Revenue Code and/or regulations, shareholders must be notified regarding the status of qualified dividend income for individuals and 163(j) interest dividends.
Qualified Dividend Income. For the fiscal year ended October 31, 2022, the Fund designates approximately $78,056, or up to the maximum amount of such dividends allowable pursuant to the Internal Revenue Code, as qualified dividend income eligible for the reduced tax rate of 15%.
163(j) Interest Dividends. For the fiscal year ended October 31, 2022, the Fund designates 60.57% of distributions from net investment income as a 163(j) interest dividend.
Eaton Vance
Multi-Asset Credit Fund
October 31, 2022
Board of Trustees’ Contract Approval
Overview of the Contract Review Process
The Investment Company Act of 1940, as amended (the “1940 Act”), provides, in substance, that the investment advisory agreement between a fund and its investment adviser will continue in effect from year-to-year only if its continuation is approved on an annual basis by a vote of the fund’s board of trustees, including a majority of the trustees who are not “interested persons” of the fund (“independent trustees”), cast in person at a meeting called for the purpose of considering such approval.
At a meeting held on June 8, 2022, the Boards of Trustees/Directors (collectively, the “Board”) that oversee the registered investment companies advised by Eaton Vance Management or its affiliate, Boston Management and Research (the “Eaton Vance Funds”), including a majority of the independent trustees (the “Independent Trustees”), voted to approve the continuation of existing investment advisory agreements and sub-advisory agreements1 for each of the Eaton Vance Funds for an additional one-year period. The Board relied upon the affirmative recommendation of its Contract Review Committee, which is a committee exclusively comprised of Independent Trustees. Prior to making its recommendation, the Contract Review Committee reviewed information furnished by the adviser and sub-adviser to each of the Eaton Vance Funds (including information specifically requested by the Board) for a series of formal meetings held between April and June 2022. Members of the Contract Review Committee also considered information received at prior meetings of the Board and its committees, to the extent such information was relevant to the Contract Review Committee’s annual evaluation of the investment advisory agreements and sub-advisory agreements.
In connection with its evaluation of the investment advisory agreements and sub-advisory agreements, the Board considered various information relating to the Eaton Vance Funds. This included information applicable to all or groups of Eaton Vance Funds, which is referenced immediately below, and information applicable to the particular Eaton Vance Fund covered by this report (additional fund-specific information is referenced below under “Results of the Contract Review Process”). (For funds that invest through one or more underlying portfolios, references to “each fund” in this section may include information that was considered at the portfolio-level.)
Information about Fees, Performance and Expenses
• A report from an independent data provider comparing advisory and other fees paid by each fund to such fees paid by comparable funds, as identified by the independent data provider (“comparable funds”);
• A report from an independent data provider comparing each fund’s total expense ratio (and its components) to those of comparable funds;
• A report from an independent data provider comparing the investment performance of each fund (including, as relevant, total return data, income data, Sharpe ratios and information ratios) to the investment performance of comparable funds and, as applicable, benchmark indices, over various time periods;
• In certain instances, data regarding investment performance relative to customized groups of peer funds and blended indices identified by the adviser in consultation with the Portfolio Management Committee of the Board (a committee exclusively comprised of Independent Trustees);
• Comparative information concerning the fees charged and services provided by the adviser and sub-adviser to each fund in managing other accounts (which may include other mutual funds, collective investment funds and institutional accounts) using investment strategies and techniques similar to those used in managing such fund(s), if any;
• Profitability analyses with respect to the adviser and sub-adviser to each of the funds;
Information about Portfolio Management and Trading
• Descriptions of the investment management services provided to each fund, as well as each of the funds’ investment strategies and policies;
• The procedures and processes used to determine the value of fund assets, including, when necessary, the determination of “fair value” and actions taken to monitor and test the effectiveness of such procedures and processes;
• Information about the policies and practices of each fund’s adviser and sub-adviser with respect to trading, including their processes for seeking best execution of portfolio transactions;
• Information about the allocation of brokerage transactions and the benefits, if any, received by the adviser and sub-adviser to each fund as a result of brokerage allocation, including, as applicable, information concerning the acquisition of research through client commission arrangements and policies with respect to “soft dollars”;
• Data relating to the portfolio turnover rate of each fund and related information regarding active management in the context of particular strategies;
Information about each Adviser and Sub-adviser
• Reports detailing the financial results and condition of the adviser and sub-adviser to each fund;
1 Not all Eaton Vance Funds have entered into a sub-advisory agreement with a sub-adviser. Accordingly, references to “sub-adviser” or “sub-advisory agreement” in this “Overview” section may not be applicable to the particular Eaton Vance Fund covered by this report. Following the “Overview” section, further information regarding the Board’s evaluation of a fund’s contractual arrangements is included under the “Results of the Contract Review Process” section.
Eaton Vance
Multi-Asset Credit Fund
October 31, 2022
Board of Trustees’ Contract Approval — continued
• Information regarding the individual investment professionals whose responsibilities include portfolio management and investment research for the funds, and, for portfolio managers and certain other investment professionals, information relating to their responsibilities with respect to managing other mutual funds and investment accounts, as applicable;
• Information regarding the adviser’s and its parent company’s (Morgan Stanley’s) efforts to retain and attract talented investment professionals, including in the context of a particularly competitive marketplace for talent, as well as the ongoing unique environment presented by hybrid, remote and other alternative work arrangements;
• The Code of Ethics of the adviser and its affiliates and the sub-adviser of each fund, together with information relating to compliance with, and the administration of, such codes;
• Policies and procedures relating to proxy voting, including regular reporting with respect to fund proxy voting activities;
• Information regarding the handling of corporate actions and class actions, as well as information regarding litigation and other regulatory matters;
• Information concerning the resources devoted to compliance efforts undertaken by the adviser and its affiliates and the sub-adviser of each fund, if any, including descriptions of their various compliance programs and their record of compliance;
• Information concerning the business continuity and disaster recovery plans of the adviser and its affiliates and the sub-adviser of each fund, if any;
• A description of Eaton Vance Management’s and Boston Management and Research’s oversight of sub-advisers, including with respect to regulatory and compliance issues, investment management and other matters;
Other Relevant Information
• Information regarding ongoing initiatives to further integrate and harmonize, where applicable, the investment management and other departments of the adviser and its affiliates with the overall investment management infrastructure of Morgan Stanley, in light of Morgan Stanley’s acquisition of Eaton Vance on March 1, 2021;
• Information concerning the nature, cost and character of the administrative and other non-investment advisory services provided by Eaton Vance Management and its affiliates;
• Information concerning oversight of the relationship with the custodian, subcustodians, fund accountants, and other third-party service providers by the adviser and/or administrator to each of the funds;
• Information concerning efforts to implement policies and procedures with respect to various new regulations applicable to the funds, including Rule 12d1-4 (the Fund-of-Funds Rule), Rule 18f-4 (the Derivatives Rule) and Rule 2a-5 (the Fair Valuation Rule);
• For an Eaton Vance Fund structured as an exchange-listed closed-end fund, information concerning the benefits of the closed-end fund structure, as well as, where relevant, the closed-end fund’s market prices (including as compared to the closed-end fund’s net asset value (NAV)), trading volume data, continued use of auction preferred shares (where applicable), distribution rates and other relevant matters;
• The risks which the adviser and/or its affiliates incur in connection with the management and operation of the funds, including, among others, litigation, regulatory, entrepreneurial, and other business risks (and the associated costs of such risks); and
• The terms of each investment advisory agreement and sub-advisory agreement.
During the various meetings of the Board and its committees over the course of the year leading up to the June 8, 2022 meeting, the Trustees received information from portfolio managers and other investment professionals of the advisers and sub-advisers of the funds regarding investment and performance matters, and considered various investment and trading strategies used in pursuing the funds’ investment objectives. The Trustees also received information regarding risk management techniques employed in connection with the management of the funds. The Board and its committees evaluated issues pertaining to industry and regulatory developments, compliance procedures, fund governance and other issues with respect to the funds, and received and participated in reports and presentations provided by Eaton Vance Management, Boston Management and Research and fund sub-advisers, with respect to such matters. In addition to the formal meetings of the Board and its committees, the Independent Trustees held regular teleconferences to discuss, among other topics, matters relating to the continuation of investment advisory agreements and sub-advisory agreements.
The Contract Review Committee was advised throughout the contract review process by Goodwin Procter LLP, independent legal counsel for the Independent Trustees. The members of the Contract Review Committee, with the advice of such counsel, exercised their own business judgment in determining the material factors to be considered in evaluating each investment advisory agreement and sub-advisory agreement and the weight to be given to each such factor. The conclusions reached with respect to each investment advisory agreement and sub-advisory agreement were based on a comprehensive evaluation of all the information provided and not any single factor. Moreover, each member of the Contract Review Committee may have placed varying emphasis on particular factors in reaching conclusions with respect to each investment advisory agreement and sub-advisory agreement. In evaluating each investment advisory agreement and sub-advisory agreement, including the fee structures and other terms contained in such agreements, the members of the Contract Review Committee were also informed by multiple years of analysis and discussion with the adviser and sub-adviser to each of the Eaton Vance Funds.
Results of the Contract Review Process
Based on its consideration of the foregoing, and such other information it deemed relevant, including the factors and conclusions described below, the Contract Review Committee concluded that the continuation of the investment advisory and administrative agreement between Eaton Vance Multi-Asset Credit Fund (the “Fund”) and Eaton Vance Management (the “Adviser”), and the sub-advisory agreement between the Adviser and Eaton Vance Advisers
Eaton Vance
Multi-Asset Credit Fund
October 31, 2022
Board of Trustees’ Contract Approval — continued
International Ltd. (the “Sub-adviser”), an affiliate of the Adviser, with respect to the Fund, including their respective fee structures, are in the interests of shareholders and, therefore, recommended to the Board approval of each agreement. Based on the recommendation of the Contract Review Committee, the Board, including a majority of the Independent Trustees, voted to approve continuation of the investment advisory and administrative agreement and the sub-advisory agreement for the Fund.
Nature, Extent and Quality of Services
In considering whether to approve the investment advisory and administrative agreement and the sub-advisory agreement for the Fund, the Board evaluated the nature, extent and quality of services provided to the Fund by the Adviser and the Sub-adviser.
The Board considered the Adviser’s and the Sub-adviser’s management capabilities and investment processes in light of the types of investments held by the Fund, including the education, experience and number of investment professionals and other personnel who provide portfolio management, investment research, and similar services to the Fund. Regarding the Adviser, the Board considered the Adviser’s responsibilities with respect to oversight of the Sub-adviser and coordinating activities in implementing the investment strategies of the Fund. With respect to the Sub-adviser, the Board considered the resources available to the Sub-adviser in fulfilling its duties under the sub-advisory agreement. The Board also considered the abilities and experience of the Adviser’s and the Sub-adviser’s investment professionals in analyzing factors relevant to investing in credit-related investments, including fixed income, variable-rate, and floating-rate debt investments as well as derivatives that provide exposure to such investments. The Board considered the international investment capabilities of the Sub-adviser, which is based in London, and the benefits to the Fund of having portfolio management services involving investments in international equities provided by investment professionals located abroad. The Board also took into account the resources dedicated to portfolio management and other services, the compensation methods of the Adviser and other factors, including the reputation and resources of the Adviser to recruit and retain highly qualified research, advisory and supervisory investment professionals. In addition, the Board considered the time and attention devoted to the Eaton Vance Funds, including the Fund, by senior management, as well as the infrastructure, operational capabilities and support staff in place to assist in the portfolio management and operations of the Fund, including the provision of administrative services. The Board also considered the business-related and other risks to which the Adviser or its affiliates may be subject in managing the Fund.
The Board considered the compliance programs of the Adviser and relevant affiliates thereof, including the Sub-adviser. The Board considered compliance and reporting matters regarding, among other things, personal trading by investment professionals, disclosure of portfolio holdings, late trading, frequent trading, portfolio valuation, business continuity and the allocation of investment opportunities. The Board also considered the responses of the Adviser and its affiliates to requests in recent years from regulatory authorities, such as the Securities and Exchange Commission and the Financial Industry Regulatory Authority.
The Board considered other administrative services provided or overseen by the Adviser and its affiliates, including transfer agency and accounting services. The Board evaluated the benefits to shareholders of investing in a fund that is a part of a large fund complex offering exposure to a variety of asset classes and investment disciplines, as well as the ability, in many cases, to exchange an investment among different funds without incurring additional sales charges.
After consideration of the foregoing factors, among others, the Board concluded that the nature, extent and quality of services provided by the Adviser and the Sub-adviser, taken as a whole, are appropriate and consistent with the terms of the investment advisory and administrative agreement and the sub-advisory agreement.
Fund Performance
The Board compared the Fund’s investment performance to that of comparable funds identified by an independent data provider (the peer group), as well as appropriate benchmark indices. The Board’s review included comparative performance data with respect to the Fund for the one-, three-, five- and ten-year periods ended December 31, 2021. In this regard, the Board noted that the performance of the Fund was lower than the median performance of the Fund’s peer group for the three-year period ended December 31, 2021. The Board also noted that the performance of the Fund was higher than its primary benchmark index and lower than its custom benchmark index for the same three-year period. On the basis of the foregoing and other relevant information provided by the Adviser in response to inquiries from the Contract Review Committee, the Board concluded that it would continue to monitor the Fund’s performance on the basis of excess return based on a scale previously approved by the Board.
Management Fees and Expenses
The Board considered contractual fee rates payable by the Fund for advisory and administrative services (referred to collectively as “management fees”). As part of its review, the Board considered the Fund’s management fees and total expense ratio for the one-year period ended December 31, 2021, as compared to those of comparable funds, before and after giving effect to any undertaking to waive fees or reimburse expenses. The Board also received and considered information about the services offered and the fee rates charged by the Adviser and/or Sub-adviser to other types of accounts with investment objectives and strategies that are substantially similar to and/or managed in a similar investment style as the Fund. In this regard, the Board received information about the differences in the nature and scope of services the Adviser and/or Sub-adviser provide to the Fund as compared to other types of accounts and the material differences in compliance, reporting and other legal burdens and risks to the Adviser and/or Sub-adviser as between the Fund
Eaton Vance
Multi-Asset Credit Fund
October 31, 2022
Board of Trustees’ Contract Approval — continued
and other types of accounts. The Board also considered factors that had an impact on the Fund’s total expense ratio relative to comparable funds. The Board also considered that the management fees paid by the Fund are for services that are in addition to, and are not duplicative of, services provided under the advisory contract(s) of the exchange traded funds in which the Fund may invest.
After considering the foregoing information, and in light of the nature, extent and quality of the services provided by the Adviser and the Sub-adviser, the Board concluded that the management fees charged for advisory and related services are reasonable.
Profitability and “Fall-Out” Benefits
The Board considered the level of profits realized by the Adviser and relevant affiliates thereof, including the Sub-adviser, in providing investment advisory and administrative services to the Fund and to all Eaton Vance Funds as a group. The Board considered the level of profits realized without regard to marketing support or other payments by the Adviser and its affiliates to third parties in respect of distribution or other services.
The Board concluded that, in light of the foregoing factors and the nature, extent and quality of the services rendered, the profits realized by the Adviser and its affiliates are deemed not to be excessive.
The Board also considered direct or indirect fall-out benefits received by the Adviser and its affiliates, including the Sub-adviser, in connection with their respective relationships with the Fund, including the benefits of research services that may be available to the Adviser or the Sub-adviser as a result of securities transactions effected for the Fund and other investment advisory clients.
Economies of Scale
In reviewing management fees and profitability, the Board also considered the extent to which the Adviser and its affiliates, on the one hand, and the Fund, on the other hand, can expect to realize benefits from economies of scale as the assets of the Fund increase. The Board acknowledged the difficulty in accurately measuring the benefits resulting from economies of scale, if any, with respect to the management of any specific fund or group of funds. The Board reviewed data summarizing the increases and decreases in the assets of the Fund and of all Eaton Vance Funds as a group over various time periods, and evaluated the extent to which the total expense ratio of the Fund and the profitability of the Adviser and its affiliates may have been affected by such increases or decreases. Based upon the foregoing, the Board concluded that the Fund currently shares in the benefits from economies of scale, if any, when they are realized by the Adviser. The Board also concluded that the structure of the advisory fee, which includes breakpoints at several asset levels, will allow the Fund to continue to benefit from any economies of scale in the future.
Eaton Vance
Multi-Asset Credit Fund
October 31, 2022
Liquidity Risk Management Program
The Fund has implemented a written liquidity risk management program (Program) and related procedures to manage its liquidity in accordance with Rule 22e-4 under the Investment Company Act of 1940, as amended (Liquidity Rule). The Liquidity Rule defines “liquidity risk” as the risk that a fund could not meet requests to redeem shares issued by the fund without significant dilution of the remaining investors’ interests in the fund. The Fund’s Board of Trustees/Directors has designated the investment adviser to serve as the administrator of the Program and the related procedures. The administrator has established a Liquidity Risk Management Oversight Committee (Committee) to perform the functions necessary to administer the Program. As part of the Program, the administrator is responsible for identifying illiquid investments and categorizing the relative liquidity of the Fund’s investments in accordance with the Liquidity Rule. Under the Program, the administrator assesses, manages, and periodically reviews the Fund’s liquidity risk, and is responsible for making certain reports to the Fund’s Board of Trustees/Directors and the Securities and Exchange Commission (SEC) regarding the liquidity of the Fund’s investments, and to notify the Board of Trustees/Directors and the SEC of certain liquidity events specified in the Liquidity Rule. The liquidity of the Fund’s portfolio investments is determined based on a number of factors including, but not limited to, relevant market, trading and investment-specific considerations under the Program.
At a meeting of the Fund’s Board of Trustees/Directors on June 7, 2022, the Committee provided a written report to the Fund’s Board of Trustees/Directors pertaining to the operation, adequacy, and effectiveness of implementation of the Program, as well as the operation of the highly liquid investment minimum (if applicable) for the period January 1, 2021 through December 31, 2021 (Review Period). The Program operated effectively during the Review Period, supporting the administrator’s ability to assess, manage and monitor Fund liquidity risk, including during periods of market volatility and net redemptions. During the Review Period, the Fund met redemption requests on a timely basis.
There can be no assurance that the Program will achieve its objectives in the future. Please refer to the Fund’s prospectus for more information regarding the Fund’s exposure to liquidity risk and other principal risks to which an investment in the Fund may be subject.
Eaton Vance
Multi-Asset Credit Fund
October 31, 2022
Management and Organization
Fund Management. The Trustees of Eaton Vance Mutual Funds Trust (the Trust) are responsible for the overall management and supervision of the Trust's affairs. The Board members and officers of the Trust are listed below. Except as indicated, each individual has held the office shown or other offices in the same company for the last five years. Board members hold indefinite terms of office. Each Trustee holds office until his or her successor is elected and qualified, subject to a prior death, resignation, retirement, disqualification or removal. Under the terms of the Fund’s current Trustee retirement policy, an Independent Trustee must retire and resign as a Trustee on the earlier of: (i) the first day of July following his or her 74th birthday; or (ii), with limited exception, December 31st of the 20th year in which he or she has served as a Trustee. However, if such retirement and resignation would cause the Fund to be out of compliance with Section 16 of the 1940 Act or any other regulations or guidance of the SEC, then such retirement and resignation will not become effective until such time as action has been taken for the Fund to be in compliance therewith. The “noninterested Trustees” consist of those Trustees who are not “interested persons” of the Trust, as that term is defined under the 1940 Act. The business address of each Board member and officer is Two International Place, Boston, Massachusetts 02110. As used below, “BMR” refers to Boston Management and Research, “EVC” refers to Eaton Vance Corp., “EV” refers to EV LLC, “EVM” refers to Eaton Vance Management and “EVD” refers to Eaton Vance Distributors, Inc. EV is the trustee of each of EVM and BMR. Effective March 1, 2021, each of EVM, BMR, EVD and EV are indirect, wholly owned subsidiaries of Morgan Stanley. Each officer affiliated with EVM may hold a position with other EVM affiliates that is comparable to his or her position with EVM listed below. Each Trustee oversees 135 funds (with the exception of Mr. Bowser who oversees 110 funds) in the Eaton Vance fund complex (including both funds and portfolios in a hub and spoke structure).
| Name and Year of Birth | Trust
Position(s) | Length of Service | Principal Occupation(s) and Other Directorships
During Past Five Years and Other Relevant Experience |
| Interested Trustee |
Thomas E. Faust Jr.
1958 | Trustee | Since 2007 | Chairman of Morgan Stanley Investment Management, Inc. (MSIM), member of the Board of Managers and President of EV (since 2021), Chief Executive Officer of EVM and BMR. Formerly, Chairman, Chief Executive Officer (2007-2021) and President (2006-2021) of EVC and Director of EVD (2007-2022). Mr. Faust is an interested person because of his positions with MSIM, BMR, EVM and EV, which are affiliates of the Trust.
Other Directorships. Formerly, Director of EVC (2007-2021) and Hexavest Inc. (investment management firm) (2012-2021). |
| Noninterested Trustees |
Alan C. Bowser(1)
1962 | Trustee | Since 2022 | Chief Diversity Officer, Partner and a member of the Operating Committee, and formerly served as Senior Advisor on Diversity and Inclusion for the firm’s chief executive officer, Co-Head of the Americas Region, and Senior Client Advisor of Bridgewater Associates, an asset management firm (2011- present).
Other Directorships. None. |
Mark R. Fetting
1954 | Trustee | Since 2016 | Private investor. Formerly held various positions at Legg Mason, Inc. (investment management firm) (2000-2012), including President, Chief Executive Officer, Director and Chairman (2008-2012), Senior Executive Vice President (2004-2008) and Executive Vice President (2001-2004). Formerly, President of Legg Mason family of funds (2001-2008). Formerly, Division President and Senior Officer of Prudential Financial Group, Inc. and related companies (investment management firm) (1991-2000).
Other Directorships. None. |
Cynthia E. Frost
1961 | Trustee | Since 2014 | Private investor. Formerly, Chief Investment Officer of Brown University (university endowment) (2000-2012). Formerly, Portfolio Strategist for Duke Management Company (university endowment manager) (1995-2000). Formerly, Managing Director, Cambridge Associates (investment consulting company) (1989-1995). Formerly, Consultant, Bain and Company (management consulting firm) (1987-1989). Formerly, Senior Equity Analyst, BA Investment Management Company (1983-1985).
Other Directorships. None. |
George J. Gorman
1952 | Chairperson
of the Board
and Trustee | Since 2021
(Chairperson) and
2014 (Trustee) | Principal at George J. Gorman LLC (consulting firm). Formerly, Senior Partner at Ernst & Young LLP (a registered public accounting firm) (1974-2009).
Other Directorships. None. |
Eaton Vance
Multi-Asset Credit Fund
October 31, 2022
Management and Organization — continued
| Name and Year of Birth | Trust
Position(s) | Length of Service | Principal Occupation(s) and Other Directorships
During Past Five Years and Other Relevant Experience |
| Noninterested Trustees (continued) |
Valerie A. Mosley
1960 | Trustee | Since 2014 | Chairwoman and Chief Executive Officer of Valmo Ventures (a consulting and investment firm). Founder of Upward Wealth, Inc., dba BrightUp, a fintech platform. Formerly, Partner and Senior Vice President, Portfolio Manager and Investment Strategist at Wellington Management Company, LLP (investment management firm) (1992-2012). Formerly, Chief Investment Officer, PG Corbin Asset Management (1990-1992). Formerly worked in institutional corporate bond sales at Kidder Peabody (1986-1990).
Other Directorships. Director of DraftKings, Inc. (digital sports entertainment and gaming company) (since September 2020). Director of Envestnet, Inc. (provider of intelligent systems for wealth management and financial wellness) (since 2018). Formerly, Director of Dynex Capital, Inc. (mortgage REIT) (2013-2020) and Director of Groupon, Inc. (e-commerce provider) (2020-2022). |
Keith Quinton
1958 | Trustee | Since 2018 | Private investor, researcher and lecturer. Formerly, Independent Investment Committee Member at New Hampshire Retirement System (2017-2021). Formerly, Portfolio Manager and Senior Quantitative Analyst at Fidelity Investments (investment management firm) (2001-2014).
Other Directorships. Formerly, Director (2016-2021) and Chairman (2019-2021) of New Hampshire Municipal Bond Bank. |
Marcus L. Smith
1966 | Trustee | Since 2018 | Private investor and independent corporate director. Formerly, Chief Investment Officer, Canada (2012-2017), Chief Investment Officer, Asia (2010-2012), Director of Asian Research (2004-2010) and portfolio manager (2001-2017) at MFS Investment Management (investment management firm).
Other Directorships. Director of First Industrial Realty Trust, Inc. (an industrial REIT) (since 2021). Director of MSCI Inc. (global provider of investment decision support tools) (since 2017). Formerly, Director of DCT Industrial Trust Inc. (logistics real estate company) (2017-2018). |
Susan J. Sutherland
1957 | Trustee | Since 2015 | Private investor. Director of Ascot Group Limited and certain of its subsidiaries (insurance and reinsurance) (since 2017). Formerly, Director of Hagerty Holding Corp. (insurance) (2015-2018) and Montpelier Re Holdings Ltd. (insurance and reinsurance) (2013-2015). Formerly, Associate, Counsel and Partner at Skadden, Arps, Slate, Meagher & Flom LLP (law firm) (1982-2013).
Other Directorships. Director of Kairos Acquisition Corp. (insurance/InsurTech acquisition company) (since 2021). |
Scott E. Wennerholm
1959 | Trustee | Since 2016 | Private investor. Formerly, Trustee at Wheelock College (postsecondary institution) (2012-2018). Formerly, Consultant at GF Parish Group (executive recruiting firm) (2016-2017). Formerly, Chief Operating Officer and Executive Vice President at BNY Mellon Asset Management (investment management firm) (2005-2011). Formerly, Chief Operating Officer and Chief Financial Officer at Natixis Global Asset Management (investment management firm) (1997-2004). Formerly, Vice President at Fidelity Investments Institutional Services (investment management firm) (1994-1997).
Other Directorships. None. |
Nancy A. Wiser(1)
1967 | Trustee | Since 2022 | Formerly, Executive Vice President and the Global Head of Operations at Wells Fargo Asset Management (2011-2021).
Other Directorships. None. |
| Name and Year of Birth | Trust
Position(s) | Length of Service | Principal Occupation(s)
During Past Five Years |
| Principal Officers who are not Trustees |
Eric A. Stein
1980 | President | Since 2020 | Vice President and Chief Investment Officer, Fixed Income of EVM and BMR. Prior to November 1, 2020, Mr. Stein was a co-Director of Eaton Vance’s Global Income Investments. Also Vice President of Calvert Research and Management (“CRM”). |
Deidre E. Walsh
1971 | Vice President and
Chief Legal Officer | Since 2009 | Vice President of EVM and BMR. Also Vice President of CRM. |
James F. Kirchner
1967 | Treasurer | Since 2007 | Vice President of EVM and BMR. Also Vice President of CRM. |
Eaton Vance
Multi-Asset Credit Fund
October 31, 2022
Management and Organization — continued
| Name and Year of Birth | Trust
Position(s) | Length of Service | Principal Occupation(s)
During Past Five Years |
| Principal Officers who are not Trustees (continued) |
Nicholas Di Lorenzo
1987 | Secretary | Since 2022 | Formerly, associate (2012-2021) and counsel (2022) at Dechert LLP. |
Richard F. Froio
1968 | Chief Compliance
Officer | Since 2017 | Vice President of EVM and BMR since 2017. Formerly, Deputy Chief Compliance Officer (Adviser/Funds) and Chief Compliance Officer (Distribution) at PIMCO (2012-2017) and Managing Director at BlackRock/Barclays Global Investors (2009-2012). |
(1) Mr. Bowser and Ms. Wiser began serving as Trustees effective April 4, 2022.
The SAI for the Fund includes additional information about the Trustees and officers of the Fund and can be obtained without charge on Eaton Vance’s website at www.eatonvance.com or by calling 1-800-262-1122.
| FACTS | WHAT DOES EATON VANCE DO WITH YOUR
PERSONAL INFORMATION? |
| Why? | Financial companies choose how they share your personal information. Federal law gives consumers the right to limit some but not all sharing. Federal law also requires us to tell you how we collect, share, and protect your personal information. Please read this notice carefully to understand what we do. |
| |
| What? | The types of personal information we collect and share depend on the product or service you have with us. This information can include:■ Social Security number and income
■ investment experience and risk tolerance
■ checking account number and wire transfer instructions |
| |
| How? | All financial companies need to share customers’ personal information to run their everyday business. In the section below, we list the reasons financial companies can share their customers’ personal information; the reasons Eaton Vance chooses to share; and whether you can limit this sharing. |
Reasons we can share your
personal information | Does Eaton Vance
share? | Can you limit
this sharing? |
| For our everyday business purposes — such as to process your transactions, maintain your account(s), respond to court orders and legal investigations, or report to credit bureaus | Yes | No |
| For our marketing purposes — to offer our products and services to you | Yes | No |
| For joint marketing with other financial companies | No | We don’t share |
| For our investment management affiliates’ everyday business purposes — information about your transactions, experiences, and creditworthiness | Yes | Yes |
| For our affiliates’ everyday business purposes — information about your transactions and experiences | Yes | No |
| For our affiliates’ everyday business purposes — information about your creditworthiness | No | We don’t share |
| For our investment management affiliates to market to you | Yes | Yes |
| For our affiliates to market to you | No | We don’t share |
| For nonaffiliates to market to you | No | We don’t share |
To limit our
sharing | Call toll-free 1-800-262-1122 or email: EVPrivacy@eatonvance.comPlease note:If you are a new customer, we can begin sharing your information 30 days from the date we sent this notice. When you are no longer our customer, we continue to share your information as described in this notice. However, you can contact us at any time to limit our sharing. |
| Questions? | Call toll-free 1-800-262-1122 or email: EVPrivacy@eatonvance.com |
| Privacy Notice — continued | April 2021 |
| Who we are |
| Who is providing this notice? | Eaton Vance Management, Eaton Vance Distributors, Inc., Eaton Vance Trust Company, Eaton Vance Management (International) Limited, Eaton Vance Advisers International Ltd., Eaton Vance Global Advisors Limited, Eaton Vance Management’s Real Estate Investment Group, Boston Management and Research, Calvert Research and Management, Eaton Vance and Calvert Fund Families and our investment advisory affiliates (“Eaton Vance”) (see Investment Management Affiliates definition below) |
| What we do |
How does Eaton Vance
protect my personal
information? | To protect your personal information from unauthorized access and use, we use security measures that comply with federal law. These measures include computer safeguards and secured files and buildings. We have policies governing the proper handling of customer information by personnel and requiring third parties that provide support to adhere to appropriate security standards with respect to such information. |
How does Eaton Vance
collect my personal
information? | We collect your personal information, for example, when you■ open an account or make deposits or withdrawals from your account
■ buy securities from us or make a wire transfer
■ give us your contact informationWe also collect your personal information from others, such as credit bureaus, affiliates, or other companies. |
| Why can’t I limit all sharing? | Federal law gives you the right to limit only■ sharing for affiliates’ everyday business purposes — information about your creditworthiness
■ affiliates from using your information to market to you
■ sharing for nonaffiliates to market to youState laws and individual companies may give you additional rights to limit sharing. See below for more on your rights under state law. |
| Definitions |
Investment Management
Affiliates | Eaton Vance Investment Management Affiliates include registered investment advisers, registered broker- dealers, and registered and unregistered funds. Investment Management Affiliates does not include entities associated with Morgan Stanley Wealth Management, such as Morgan Stanley Smith Barney LLC and Morgan Stanley & Co. |
| Affiliates | Companies related by common ownership or control. They can be financial and nonfinancial companies.■ Our affiliates include companies with a Morgan Stanley name and financial companies such as Morgan Stanley Smith Barney LLC and Morgan Stanley & Co. |
| Nonaffiliates | Companies not related by common ownership or control. They can be financial and nonfinancial companies.■ Eaton Vance does not share with nonaffiliates so they can market to you. |
| Joint marketing | A formal agreement between nonaffiliated financial companies that together market financial products or services to you.■ Eaton Vance doesn’t jointly market. |
| Other important information |
| Vermont: Except as permitted by law, we will not share personal information we collect about Vermont residents with Nonaffiliates unless you provide us with your written consent to share such information.California: Except as permitted by law, we will not share personal information we collect about California residents with Nonaffiliates and we will limit sharing such personal information with our Affiliates to comply with California privacy laws that apply to us. |
Delivery of Shareholder Documents. The Securities and Exchange Commission (SEC) permits funds to deliver only one copy of shareholder documents, including prospectuses, proxy statements and shareholder reports, to fund investors with multiple accounts at the same residential or post office box address. This practice is often called “householding” and it helps eliminate duplicate mailings to shareholders. Eaton Vance, or your financial intermediary, may household the mailing of your documents indefinitely unless you instruct Eaton Vance, or your financial intermediary, otherwise. If you would prefer that your Eaton Vance documents not be householded, please contact Eaton Vance at 1-800-262-1122, or contact your financial intermediary. Your instructions that householding not apply to delivery of your Eaton Vance documents will typically be effective within 30 days of receipt by Eaton Vance or your financial intermediary.
Portfolio Holdings. Each Eaton Vance Fund and its underlying Portfolio(s) (if applicable) files a schedule of portfolio holdings on Part F to Form N-PORT with the SEC. Certain information filed on Form N-PORT may be viewed on the Eaton Vance website at www.eatonvance.com, by calling Eaton Vance at 1-800-262-1122 or in the EDGAR database on the SEC’s website at www.sec.gov.
Proxy Voting. From time to time, funds are required to vote proxies related to the securities held by the funds. The Eaton Vance Funds or their underlying Portfolios (if applicable) vote proxies according to a set of policies and procedures approved by the Funds’ and Portfolios’ Boards. You may obtain a description of these policies and procedures and information on how the Funds or Portfolios voted proxies relating to portfolio securities during the most recent 12-month period ended June 30, without charge, upon request, by calling 1-800-262-1122 and by accessing the SEC’s website at www.sec.gov.
This Page Intentionally Left Blank
This Page Intentionally Left Blank
Investment Adviser and Administrator
Eaton Vance Management
Two International Place
Boston, MA 02110
Investment Sub-Adviser
Eaton Vance Advisers International Ltd.
125 Old Broad Street
London, EC2N 1AR
United Kingdom
Principal Underwriter*
Eaton Vance Distributors, Inc.
Two International Place
Boston, MA 02110
(617) 482-8260
Custodian
State Street Bank and Trust Company
State Street Financial Center, One Lincoln Street
Boston, MA 02111
Transfer Agent
BNY Mellon Investment Servicing (US) Inc.
Attn: Eaton Vance Funds
P.O. Box 9653
Providence, RI 02940-9653
(800) 262-1122
Independent Registered Public Accounting Firm
Deloitte & Touche LLP
200 Berkeley Street
Boston, MA 02116-5022
Fund Offices
Two International Place
Boston, MA 02110
* FINRA BrokerCheck. Investors may check the background of their Investment Professional by contacting the Financial Industry Regulatory Authority (FINRA). FINRA BrokerCheck is a free tool to help investors check the professional background of current and former FINRA-registered securities firms and brokers. FINRA BrokerCheck is available by calling 1-800-289-9999 and at www.FINRA.org. The FINRA BrokerCheck brochure describing this program is available to investors at www.FINRA.org.
Eaton Vance
Short Duration High Income Fund
Annual Report
October 31, 2022
Commodity Futures Trading Commission Registration. The Commodity Futures Trading Commission (“CFTC”) has adopted regulations that subject registered investment companies and advisers to regulation by the CFTC if a fund invests more than a prescribed level of its assets in certain CFTC-regulated instruments (including futures, certain options and swap agreements) or markets itself as providing investment exposure to such instruments. The investment adviser has claimed an exclusion from the definition of “commodity pool operator” under the Commodity Exchange Act with respect to its management of the Fund. Accordingly, neither the Fund nor the adviser with respect to the operation of the Fund is subject to CFTC regulation. Because of its management of other strategies, the Fund's adviser is registered with the CFTC as a commodity pool operator. The adviser is also registered as a commodity trading advisor.
Fund shares are not insured by the FDIC and are not deposits or other obligations of, or guaranteed by, any depository institution. Shares are subject to investment risks, including possible loss of principal invested.
This report must be preceded or accompanied by a current summary prospectus or prospectus. Before investing, investors should consider carefully the investment objective, risks, and charges and expenses of a mutual fund. This and other important information is contained in the summary prospectus and prospectus, which can be obtained from a financial intermediary. Prospective investors should read the prospectus carefully before investing. For further information, please call 1-800-262-1122.
Annual Report October 31, 2022
Eaton Vance
Short Duration High Income Fund
Eaton Vance
Short Duration High Income Fund
October 31, 2022
Management’s Discussion of Fund Performance†
Economic and Market Conditions
For the 12-month period ended October 31, 2022, the U.S. high yield bond market recorded negative returns. Two key events -- more restrictive monetary policies by central banks worldwide in response to the highest inflation readings in years, and the first major European war in decades -- prompted a sharp rise in stock volatility and a widespread sell-off of risk assets during the period.
The U.S. high yield bond market began the period with modest returns even as market volatility surged among risk assets. A dizzying combination of a rapidly spreading Omicron variant of COVID-19, central banks’ evolving monetary policies, and concerns over a potential economic slowdown in China, unsettled investors during the period.
The high yield market turned negative during the first quarter of calendar 2022, following money-tightening messages from the U.S. Federal Reserve (the Fed). Elevated tensions over the buildup of Russian troops along the Ukrainian border and the economic impact from the spread of Omicron further weighed on risk sentiment. U.S. Treasury yields leapt, credit spreads generally widened, and fixed-rate products were sold off during the period.
For the most part, volatility increased and investor aversion to risk heightened later in the period. The Fed’s focus on fighting inflation prompted a spike in U.S. Treasury yields and was accompanied by a notable weakening in oil prices. The ongoing war in Ukraine and the precarious energy situation in Western Europe further rattled investors. In the last month of the period, however, expectations that the Fed might moderate its pace of interest rate hikes produced a strong rally in high yield markets.
For the period as a whole, the ICE BofA U.S. High Yield Index returned -11.45%, and the Bloomberg U.S. Aggregate Bond Index returned -15.68%.
By period-end, high yield issuance totaled $139 billion, down from $500 billion during the prior 12-month period. During the same time, the trailing 12-month par-weighted default rate rose to 0.84%, from 0.36% at the end of the prior 12-month period.
Fund Performance
For the 12-month period ended October 31, 2022, Eaton Vance Short Duration High Income Fund (the Fund) returned -4.00% for Class A shares at net asset value (NAV), underperforming its benchmark, the ICE BofA U.S. High Yield Cash Pay BB-B 1-3 Year Index (the Index), which returned -2.91%.
Security selections by sector detracted from performance relative to the Index during the period. Credit selections within the leisure, health care, and metals & mining industries especially weighed on relative returns.
While security selections by industry hurt relative performance overall, selections within several industries -- notably chemicals, energy, and cable & satellite TV -- contributed to relative returns. Allocation decisions by industry contributed to returns relative to the Index -- notably underweight exposures to the banks & thrifts and retail industries. The Fund’s small cash position also added to relative returns during the period.
Security selections by credit-rating quality detracted from relative performance during the period. Selections within the B-rated segment particularly weighed on relative returns. Selections within CCC-rated and split-BBB/BB-rated securities also hurt performance relative to the Index during the period, while a small exposure to nonrated securities further detracted.
Allocation decisions by credit-rating quality contributed to overall relative performance. Selection decisions and a significant underweight exposure to BB-rated securities especially helped returns. An overweight exposure to B-rated securities and an out-of-Index allocation to CC-rated securities also enhanced relative performance during the period.
While the Fund’s duration positioning contributed to relative performance during the period, credit selection detracted to a greater extent. Selection decisions coupled with an overweight position in bonds with durations between 2-5 years weighed heavily on relative returns. An underweight exposure to bonds with durations between 0-2 years also had a negative impact on returns relative to the Index during the period.
See Endnotes and Additional Disclosures in this report.
Past performance is no guarantee of future results. Returns are historical and are calculated by determining the percentage change in net asset value (NAV) or offering price (as applicable) with all distributions reinvested. Furthermore, returns do not reflect the deduction of taxes that shareholders may have to pay on Fund distributions or upon the redemption of Fund shares. Investment return and principal value will fluctuate so that shares, when redeemed, may be worth more or less than their original cost. Performance for periods less than or equal to one year is cumulative. Performance is for the stated time period only; due to market volatility, current Fund performance may be lower or higher than the quoted return. For performance as of the most recent month-end, please refer to eatonvance.com.
Eaton Vance
Short Duration High Income Fund
October 31, 2022
Performance
Portfolio Manager(s) Kelley Gerrity and Stephen C. Concannon, CFA
| % Average Annual Total Returns1,2 | Class
Inception Date | Performance
Inception Date | One Year | Five Years | Ten Years |
| Class A at NAV | 11/01/2013 | 02/21/2012 | (4.00)% | 2.08% | 3.16% |
| Class A with 3.25% Maximum Sales Charge | — | — | (7.13) | 1.41 | 2.93 |
| Class I at NAV | 11/01/2013 | 02/21/2012 | (3.75) | 2.32 | 3.40 |
|
| ICE BofA U.S. High Yield Cash Pay BB-B 1–3 Year Index | — | — | (2.91)% | 2.81% | 3.86% |
| % Total Annual Operating Expense Ratios3 | Class A | Class I |
| Gross | 1.21% | 0.96% |
| Net | 0.91 | 0.66 |
Growth of $10,0002
This graph shows the change in value of a hypothetical investment of $10,000 in Class A of the Fund for the period indicated. For comparison, the same investment is shown in the indicated index.
| Growth of Investment2 | Amount Invested | Period Beginning | At NAV | With Maximum Sales Charge |
| Class I, at minimum investment | $1,000,000 | 10/31/2012 | $1,397,728 | N.A. |
See Endnotes and Additional Disclosures in this report.
Past performance is no guarantee of future results. Returns are historical and are calculated by determining the percentage change in net asset value (NAV) or offering price (as applicable) with all distributions reinvested. Furthermore, returns do not reflect the deduction of taxes that shareholders may have to pay on Fund distributions or upon the redemption of Fund shares. Investment return and principal value will fluctuate so that shares, when redeemed, may be worth more or less than their original cost. Performance for periods less than or equal to one year is cumulative. Performance is for the stated time period only; due to market volatility, current Fund performance may be lower or higher than the quoted return. For performance as of the most recent month-end, please refer to eatonvance.com.
Eaton Vance
Short Duration High Income Fund
October 31, 2022
| Credit Quality (% of total investments)1 |
Footnotes:
| 1 | Ratings are based on Moody’s Investors Service, Inc. (“Moody’s”), S&P Global Ratings (“S&P”) or Fitch Ratings (“Fitch”), as applicable. For purposes of ratings restrictions, the average of Moody’s, S&P and Fitch is used. Ratings, which are subject to change, apply to the creditworthiness of the issuers of the underlying securities and not to the Fund or its shares. Credit ratings measure the quality of a bond based on the issuer’s creditworthiness, with ratings ranging from AAA, being the highest, to D, being the lowest based on S&P’s measures. Ratings of BBB or higher by S&P or Fitch (Baa or higher by Moody’s) are considered to be investment-grade quality. Credit ratings are based largely on the ratings agency’s analysis at the time of rating. The rating assigned to any particular security is not necessarily a reflection of the issuer’s current financial condition and does not necessarily reflect its assessment of the volatility of a security’s market value or of the liquidity of an investment in the security. Holdings designated as “Not Rated” (if any) are not rated by the national ratings agencies stated above. |
Eaton Vance
Short Duration High Income Fund
October 31, 2022
Endnotes and Additional Disclosures
| † | The views expressed in this report are those of the portfolio manager(s) and are current only through the date stated at the top of this page. These views are subject to change at any time based upon market or other conditions, and Eaton Vance and the Fund(s) disclaim any responsibility to update such views. These views may not be relied upon as investment advice and, because investment decisions are based on many factors, may not be relied upon as an indication of trading intent on behalf of any Eaton Vance fund. This commentary may contain statements that are not historical facts, referred to as “forward-looking statements.” The Fund’s actual future results may differ significantly from those stated in any forward-looking statement, depending on factors such as changes in securities or financial markets or general economic conditions, the volume of sales and purchases of Fund shares, the continuation of investment advisory, administrative and service contracts, and other risks discussed from time to time in the Fund’s filings with the Securities and Exchange Commission. |
| | |
| 1 | ICE BofA U.S. High Yield Cash Pay BB-B 1–3 Year Index is an unmanaged index of U.S. corporate bonds currently paying a coupon, rated BB1 through B3, and having a maturity less than 3 years. ICE® BofA® indices are not for redistribution or other uses; provided “as is”, without warranties, and with no liability. Eaton Vance has prepared this report and ICE Data Indices, LLC does not endorse it, or guarantee, review, or endorse Eaton Vance’s products. BofA® is a licensed registered trademark of Bank of America Corporation in the United States and other countries. Unless otherwise stated, index returns do not reflect the effect of any applicable sales charges, commissions, expenses, taxes or leverage, as applicable. It is not possible to invest directly in an index. |
| 2 | Total Returns at NAV do not include applicable sales charges. If sales charges were deducted, the returns would be lower. Total Returns shown with maximum sales charge reflect the stated maximum sales charge. Unless otherwise stated, performance does not reflect the deduction of taxes on Fund distributions or redemptions of Fund shares.Performance prior to the inception date of Class A and Class I is linked to the performance of Short Duration High Income Portfolio (the Portfolio), the Portfolio that the Fund invested in prior to June 15, 2020. This linked performance is adjusted for any applicable sales charge, but is not adjusted for class expense differences. If adjusted for such differences, the performance would be different. Performance presented in the Financial Highlights included in the financial statements is not linked. |
| 3 | Source: Fund prospectus. Net expense ratios reflect a contractual expense reimbursement that continues through 2/28/23. The expense ratios for the current reporting period can be found in the Financial Highlights section of this report. Performance reflects expenses waived and/or reimbursed, if applicable. Without such waivers and/or reimbursements, performance would have been lower.Fund profile subject to change due to active management. |
| | Additional Information |
| | ICE BofA U.S. High Yield Index is an unmanaged index of below-investment grade U.S. corporate bonds. Bloomberg U.S. Aggregate Bond Index is an unmanaged index of domestic investment-grade bonds, including corporate, government and mortgage-backed securities. |
| | Duration is a measure of the expected change in price of a bond — in percentage terms — given a one percent change in interest rates, all else being constant. Securities with lower durations tend to be less sensitive to interest rate changes. |
| | Risk asset is a term broadly used to describe any asset that is not a high-quality government bond. |
Eaton Vance
Short Duration High Income Fund
October 31, 2022
Example
As a Fund shareholder, you incur two types of costs: (1) transaction costs, including sales charges (loads) on purchases and redemption fees (if applicable); and (2) ongoing costs, including management fees; distribution and/or service fees; and other Fund expenses. This Example is intended to help you understand your ongoing costs (in dollars) of Fund investing and to compare these costs with the ongoing costs of investing in other mutual funds. The Example is based on an investment of $1,000 invested at the beginning of the period and held for the entire period (May 1, 2022 to October 31, 2022).
Actual Expenses
The first section of the table below provides information about actual account values and actual expenses. You may use the information in this section, together with the amount you invested, to estimate the expenses that you paid over the period. Simply divide your account value by $1,000 (for example, an $8,600 account value divided by $1,000 = 8.6), then multiply the result by the number in the first section under the heading entitled “Expenses Paid During Period” to estimate the expenses you paid on your account during this period.
Hypothetical Example for Comparison Purposes
The second section of the table below provides information about hypothetical account values and hypothetical expenses based on the actual Fund expense ratio and an assumed rate of return of 5% per year (before expenses), which is not the actual Fund return. The hypothetical account values and expenses may not be used to estimate the actual ending account balance or expenses you paid for the period. You may use this information to compare the ongoing costs of investing in your Fund and other funds. To do so, compare this 5% hypothetical example with the 5% hypothetical examples that appear in the shareholder reports of the other funds.
Please note that the expenses shown in the table are meant to highlight your ongoing costs only and do not reflect any transactional costs, such as sales charges (loads) or redemption fees (if applicable). Therefore, the second section of the table is useful in comparing ongoing costs only, and will not help you determine the relative total costs of owning different funds. In addition, if these transactional costs were included, your costs would be higher.
| | Beginning
Account Value
(5/1/22) | Ending
Account Value
(10/31/22) | Expenses Paid
During Period*
(5/1/22 – 10/31/22) | Annualized
Expense
Ratio |
| Actual | | | | |
| Class A | $1,000.00 | $ 978.30 | $4.49** | 0.90% |
| Class I | $1,000.00 | $ 979.60 | $3.24** | 0.65% |
| |
| Hypothetical | | | | |
| (5% return per year before expenses) | | | | |
| Class A | $1,000.00 | $1,020.67 | $4.58** | 0.90% |
| Class I | $1,000.00 | $1,021.93 | $3.31** | 0.65% |
| * | Expenses are equal to the Fund's annualized expense ratio for the indicated Class, multiplied by the average account value over the period, multiplied by 184/365 (to reflect the one-half year period). The Example assumes that the $1,000 was invested at the net asset value per share determined at the close of business on April 30, 2022. |
| ** | Absent an allocation of certain expenses to an affiliate, expenses would be higher. |
Eaton Vance
Short Duration High Income Fund
October 31, 2022
| Commercial Mortgage-Backed Securities — 0.8% |
| Security | Principal
Amount
(000's omitted) | Value |
| BAMLL Commercial Mortgage Securities Trust, Series 2019-BPR, Class ENM, 3.843%, 11/5/32(1)(2) | $ | 795 | $ 581,553 |
Total Commercial Mortgage-Backed Securities
(identified cost $759,346) | | | $ 581,553 |
| Security | Shares | Value |
| Technology — 0.0%(3) |
| Riverbed Technology, Inc.(4)(5) | | 423 | $ 213 |
Total Common Stocks
(identified cost $6,786) | | | $ 213 |
| Security | Principal
Amount
(000's omitted) | Value |
| Leisure — 0.3% |
| Peloton Interactive, Inc., 0.00%, 2/15/26 | $ | 298 | $ 214,573 |
Total Convertible Bonds
(identified cost $262,228) | | | $ 214,573 |
| Convertible Preferred Stocks — 0.2% |
| Security | Shares | Value |
| Healthcare — 0.2% |
| Becton Dickinson and Co., Series B, 6.00% | | 3,572 | $ 174,099 |
| | | | $ 174,099 |
| Technology — 0.0%(3) |
| Riverbed Technology, Inc., Series A, 6.50%, (1.50% cash, 5.00% PIK)(5) | | 590 | $ 590 |
| | | | $ 590 |
Total Convertible Preferred Stocks
(identified cost $200,333) | | | $ 174,689 |
| Security | Principal
Amount*
(000's omitted) | Value |
| Aerospace — 2.8% |
| Bombardier, Inc., 7.50%, 12/1/24(1) | | 500 | $ 498,173 |
| Spirit AeroSystems, Inc., 5.50%, 1/15/25(1) | | 580 | 560,497 |
| TransDigm, Inc.: | | | |
| 6.25%, 3/15/26(1) | | 810 | 800,389 |
| 6.375%, 6/15/26 | | 267 | 258,010 |
| | | | $ 2,117,069 |
| Air Transportation — 1.4% |
| American Airlines, Inc./AAdvantage Loyalty IP, Ltd., 5.50%, 4/20/26(1) | | 600 | $ 572,359 |
| Delta Air Lines, Inc., 2.90%, 10/28/24 | | 550 | 520,668 |
| | | | $ 1,093,027 |
| Automotive & Auto Parts — 4.9% |
| Ford Motor Credit Co., LLC: | | | |
| 3.37%, 11/17/23 | | 200 | $ 193,317 |
| 3.664%, 9/8/24 | | 2,475 | 2,349,716 |
| 5.125%, 6/16/25 | | 850 | 821,432 |
| Goodyear Tire & Rubber Co. (The), 9.50%, 5/31/25 | | 340 | 353,759 |
| | | | $ 3,718,224 |
| Broadcasting — 1.5% |
| Sirius XM Radio, Inc., 3.125%, 9/1/26(1) | | 330 | $ 295,596 |
| Townsquare Media, Inc., 6.875%, 2/1/26(1) | | 162 | 153,255 |
| Univision Communications, Inc., 5.125%, 2/15/25(1) | | 730 | 706,574 |
| | | | $ 1,155,425 |
| Cable & Satellite TV — 1.1% |
| CCO Holdings, LLC/CCO Holdings Capital Corp., 4.00%, 3/1/23(1) | | 500 | $ 496,854 |
| CSC Holdings, LLC, 5.25%, 6/1/24 | | 325 | 315,593 |
| | | | $ 812,447 |
| Chemicals — 3.0% |
| Compass Minerals International, Inc., 4.875%, 7/15/24(1) | | 1,187 | $ 1,126,183 |
| NOVA Chemicals Corp., 4.875%, 6/1/24(1) | | 219 | 213,471 |
| Valvoline, Inc., 4.25%, 2/15/30(1) | | 500 | 482,005 |
| W.R. Grace Holdings, LLC, 5.625%, 10/1/24(1) | | 480 | 471,202 |
| | | | $ 2,292,861 |
7
See Notes to Financial Statements.
Eaton Vance
Short Duration High Income Fund
October 31, 2022
Portfolio of Investments — continued
| Security | Principal
Amount*
(000's omitted) | Value |
| Consumer Products — 0.7% |
| Spectrum Brands, Inc., 5.75%, 7/15/25 | | 540 | $ 533,628 |
| | | | $ 533,628 |
| Containers — 2.5% |
| Ball Corp.: | | | |
| 4.00%, 11/15/23 | | 342 | $ 335,311 |
| 5.25%, 7/1/25 | | 474 | 468,909 |
| Graphic Packaging International, LLC, 4.125%, 8/15/24 | | 275 | 268,324 |
| Mauser Packaging Solutions Holding Co., 5.50%, 4/15/24(1) | | 821 | 806,095 |
| | | | $ 1,878,639 |
| Diversified Financial Services — 4.7% |
| Bread Financial Holdings, Inc., 4.75%, 12/15/24(1) | | 322 | $ 281,867 |
| Icahn Enterprises, L.P./Icahn Enterprises Finance Corp., 4.75%, 9/15/24 | | 750 | 730,882 |
| MoneyGram International, Inc., 5.375%, 8/1/26(1) | | 404 | 397,327 |
| Navient Corp.: | | | |
| 5.875%, 10/25/24 | | 350 | 338,940 |
| 6.125%, 3/25/24 | | 388 | 381,709 |
| 7.25%, 9/25/23 | | 300 | 301,245 |
| PRA Group, Inc., 7.375%, 9/1/25(1) | | 896 | 858,349 |
| Rocket Mortgage, LLC/Rocket Mortgage Co.-Issuer, Inc., 2.875%, 10/15/26(1) | | 325 | 272,095 |
| | | | $ 3,562,414 |
| Energy — 8.0% |
| Aethon United BR, L.P./Aethon United Finance Corp., 8.25%, 2/15/26(1) | | 530 | $ 539,475 |
| Colgate Energy Partners III, LLC, 7.75%, 2/15/26(1) | | 300 | 299,154 |
| CVR Energy, Inc., 5.25%, 2/15/25(1) | | 300 | 289,590 |
| Devon Energy Corp., 5.25%, 10/15/27 | | 400 | 396,963 |
| EQM Midstream Partners, L.P.: | | | |
| 4.00%, 8/1/24 | | 262 | 248,483 |
| 7.50%, 6/1/27(1) | | 500 | 494,338 |
| Matador Resources Co., 5.875%, 9/15/26 | | 250 | 246,250 |
| Nabors Industries, Ltd., 9.00%, 2/1/25(1) | | 152 | 154,349 |
| Neptune Energy Bondco PLC, 6.625%, 5/15/25(1) | | 720 | 700,853 |
| New Fortress Energy, Inc.: | | | |
| 6.50%, 9/30/26(1) | | 400 | 388,802 |
| 6.75%, 9/15/25(1) | | 400 | 393,260 |
| Tap Rock Resources, LLC, 7.00%, 10/1/26(1) | | 485 | 453,599 |
| Tervita Corp., 11.00%, 12/1/25(1) | | 722 | 785,487 |
| Transocean Proteus, Ltd., 6.25%, 12/1/24(1) | | 135 | 131,786 |
| Security | Principal
Amount*
(000's omitted) | Value |
| Energy (continued) |
| Weatherford International, Ltd., 11.00%, 12/1/24(1) | | 62 | $ 63,923 |
| Western Midstream Operating, L.P., 3.35%, 2/1/25 | | 548 | 522,060 |
| | | | $ 6,108,372 |
| Entertainment & Film — 0.8% |
| Cinemark USA, Inc., 8.75%, 5/1/25(1) | | 300 | $ 301,258 |
| Live Nation Entertainment, Inc., 4.875%, 11/1/24(1) | | 325 | 316,352 |
| | | | $ 617,610 |
| Environmental — 1.0% |
| GFL Environmental, Inc., 3.75%, 8/1/25(1) | | 765 | $ 724,792 |
| | | | $ 724,792 |
| Food, Beverage & Tobacco — 2.0% |
| Herbalife Nutrition, Ltd./HLF Financing, Inc., 7.875%, 9/1/25(1) | | 298 | $ 278,885 |
| Performance Food Group, Inc., 6.875%, 5/1/25(1) | | 502 | 501,513 |
| US Foods, Inc., 6.25%, 4/15/25(1) | | 725 | 722,568 |
| | | | $ 1,502,966 |
| Gaming — 5.3% |
| Caesars Entertainment, Inc.: | | | |
| 6.25%, 7/1/25(1) | | 1,508 | $ 1,473,689 |
| 8.125%, 7/1/27(1) | | 380 | 370,217 |
| Caesars Resort Collection, LLC/CRC Finco, Inc., 5.75%, 7/1/25(1) | | 250 | 244,531 |
| International Game Technology PLC, 6.50%, 2/15/25(1) | | 1,100 | 1,102,112 |
| MGM Resorts International, 6.75%, 5/1/25 | | 250 | 247,141 |
| Wynn Las Vegas, LLC/Wynn Las Vegas Capital Corp., 4.25%, 5/30/23(1) | | 555 | 547,333 |
| | | | $ 3,985,023 |
| Healthcare — 6.6% |
| Endo DAC/Endo Finance, LLC/Endo Finco, Inc., 5.875%, 10/15/24(1)(6) | | 260 | $ 206,749 |
| HCA, Inc., 5.375%, 2/1/25 | | 1,301 | 1,285,261 |
| Legacy LifePoint Health, LLC, 6.75%, 4/15/25(1) | | 256 | 227,137 |
| ModivCare, Inc., 5.875%, 11/15/25(1) | | 658 | 626,031 |
| Owens & Minor, Inc., 4.375%, 12/15/24 | | 479 | 457,913 |
| Perrigo Finance Unlimitd Co., 3.90%, 12/15/24 | | 527 | 503,198 |
| RegionalCare Hospital Partners Holdings, Inc./LifePoint Health, Inc., 9.75%, 12/1/26(1) | | 400 | 319,748 |
| Tenet Healthcare Corp., 4.875%, 1/1/26(1) | | 958 | 907,140 |
| US Acute Care Solutions, LLC, 6.375%, 3/1/26(1) | | 520 | 472,735 |
| | | | $ 5,005,912 |
8
See Notes to Financial Statements.
Eaton Vance
Short Duration High Income Fund
October 31, 2022
Portfolio of Investments — continued
| Security | Principal
Amount*
(000's omitted) | Value |
| Homebuilders & Real Estate — 5.4% |
| Brookfield Property REIT, Inc./BPR Cumulus, LLC/BPR Nimbus, LLC/GGSI Sellco, LLC, 4.50%, 4/1/27(1) | | 188 | $ 160,349 |
| Greystar Real Estate Partners, LLC, 5.75%, 12/1/25(1) | | 921 | 892,288 |
| HAT Holdings I, LLC/HAT Holdings II, LLC, 6.00%, 4/15/25(1) | | 342 | 326,508 |
| Meritage Homes Corp., 6.00%, 6/1/25 | | 300 | 291,603 |
| Outfront Media Capital, LLC/Outfront Media Capital Corp., 6.25%, 6/15/25(1) | | 403 | 397,916 |
| Starwood Property Trust, Inc., 3.75%, 12/31/24(1) | | 684 | 640,337 |
| Taylor Morrison Communities, Inc./Taylor Morrison Holdings II, Inc., 5.625%, 3/1/24(1) | | 199 | 195,249 |
| VICI Properties, L.P./VICI Note Co., Inc., 3.50%, 2/15/25(1) | | 854 | 795,126 |
| Vivion Investments S.a.r.l., 3.00%, 8/8/24(7) | EUR | 500 | 425,476 |
| | | | $ 4,124,852 |
| Insurance — 2.5% |
| Alliant Holdings Intermediate, LLC/Alliant Holdings Co-Issuer, 6.75%, 10/15/27(1) | | 410 | $ 374,697 |
| AssuredPartners, Inc., 7.00%, 8/15/25(1) | | 342 | 328,169 |
| HUB International, Ltd., 7.00%, 5/1/26(1) | | 850 | 840,943 |
| USI, Inc., 6.875%, 5/1/25(1) | | 370 | 359,671 |
| | | | $ 1,903,480 |
| Leisure — 3.8% |
| Merlin Entertainments, Ltd., 5.75%, 6/15/26(1) | | 400 | $ 372,496 |
| NCL Corp., Ltd., 3.625%, 12/15/24(1) | | 952 | 828,142 |
| Royal Caribbean Cruises, Ltd., 11.625%, 8/15/27(1) | | 225 | 216,162 |
| SeaWorld Parks & Entertainment, Inc., 8.75%, 5/1/25(1) | | 345 | 353,844 |
| Vail Resorts, Inc., 6.25%, 5/15/25(1) | | 450 | 448,745 |
| Viking Cruises, Ltd., 6.25%, 5/15/25(1) | | 727 | 637,066 |
| | | | $ 2,856,455 |
| Metals & Mining — 1.2% |
| New Gold, Inc., 7.50%, 7/15/27(1) | | 1,100 | $ 939,687 |
| | | | $ 939,687 |
| Paper — 1.2% |
| Clearwater Paper Corp., 5.375%, 2/1/25(1) | | 187 | $ 181,783 |
| Enviva Partners, L.P./Enviva Partners Finance Corp., 6.50%, 1/15/26(1) | | 780 | 750,075 |
| | | | $ 931,858 |
| Railroad — 0.3% |
| Watco Cos., LLC/Watco Finance Corp., 6.50%, 6/15/27(1) | | 250 | $ 235,846 |
| | | | $ 235,846 |
| Security | Principal
Amount*
(000's omitted) | Value |
| Restaurant — 3.0% |
| 1011778 B.C. Unlimited Liability Company/New Red Finance, Inc., 5.75%, 4/15/25(1) | | 438 | $ 436,947 |
| Dave & Buster's, Inc., 7.625%, 11/1/25(1) | | 1,118 | 1,116,552 |
| IRB Holding Corp., 7.00%, 6/15/25(1) | | 753 | 753,444 |
| | | | $ 2,306,943 |
| Services — 5.8% |
| Allied Universal Holdco, LLC/Allied Universal Finance Corp., 6.625%, 7/15/26(1) | | 642 | $ 614,326 |
| Aramark Services, Inc., 6.375%, 5/1/25(1) | | 910 | 901,753 |
| GEMS MENASA Cayman, Ltd./GEMS Education Delaware, LLC, 7.125%, 7/31/26(1) | | 1,027 | 973,052 |
| Hertz Corp. (The), 4.625%, 12/1/26(1) | | 169 | 144,324 |
| Korn Ferry, 4.625%, 12/15/27(1) | | 380 | 346,210 |
| Sabre GLBL, Inc., 9.25%, 4/15/25(1) | | 522 | 506,724 |
| WESCO Distribution, Inc., 7.125%, 6/15/25(1) | | 899 | 909,105 |
| | | | $ 4,395,494 |
| Steel — 2.4% |
| Allegheny Ludlum, LLC, 6.95%, 12/15/25 | | 515 | $ 504,551 |
| Cleveland-Cliffs, Inc., 6.75%, 3/15/26(1) | | 376 | 373,900 |
| Infrabuild Australia Pty, Ltd., 12.00%, 10/1/24(1) | | 975 | 906,955 |
| | | | $ 1,785,406 |
| Super Retail — 0.7% |
| Bath & Body Works, Inc., 9.375%, 7/1/25(1) | | 309 | $ 320,982 |
| William Carter Co. (The), 5.625%, 3/15/27(1) | | 185 | 176,135 |
| | | | $ 497,117 |
| Technology — 4.0% |
| Clarios Global, L.P., 6.75%, 5/15/25(1) | | 299 | $ 299,634 |
| Clarios Global, L.P./Clarios US Finance Co., 8.50%, 5/15/27(1) | | 750 | 736,271 |
| NortonLifeLock, Inc.: | | | |
| 5.00%, 4/15/25(1) | | 322 | 313,203 |
| 6.75%, 9/30/27(1) | | 500 | 493,590 |
| Seagate HDD Cayman: | | | |
| 4.75%, 1/1/25 | | 410 | 396,286 |
| 4.875%, 3/1/24 | | 350 | 341,653 |
| Sensata Technologies B.V., 5.00%, 10/1/25(1) | | 500 | 485,578 |
| | | | $ 3,066,215 |
| Telecommunications — 5.5% |
| Altice France S.A., 2.50%, 1/15/25(7) | EUR | 200 | $ 176,696 |
9
See Notes to Financial Statements.
Eaton Vance
Short Duration High Income Fund
October 31, 2022
Portfolio of Investments — continued
| Security | Principal
Amount*
(000's omitted) | Value |
| Telecommunications (continued) |
| Connect Finco S.a.r.l./Connect US Finco, LLC, 6.75%, 10/1/26(1) | | 285 | $ 268,370 |
| DKT Finance ApS, 9.375%, 6/17/23(1) | | 250 | 241,563 |
| Iliad Holding SASU, 6.50%, 10/15/26(1) | | 210 | 194,815 |
| LCPR Senior Secured Financing DAC, 6.75%, 10/15/27(1) | | 400 | 373,488 |
| Sprint Corp.: | | | |
| 7.125%, 6/15/24 | | 450 | 455,531 |
| 7.625%, 2/15/25 | | 865 | 889,955 |
| 7.875%, 9/15/23 | | 1,545 | 1,572,413 |
| | | | $ 4,172,831 |
| Transport Excluding Air & Rail — 0.7% |
| Fenix Marine Service Holdings, Ltd., 8.00%, 1/15/24 | | 562 | $ 560,606 |
| | | | $ 560,606 |
| Utility — 2.7% |
| AmeriGas Partners, L.P./AmeriGas Finance Corp.: | | | |
| 5.50%, 5/20/25 | | 507 | $ 486,738 |
| 5.625%, 5/20/24 | | 342 | 334,951 |
| Drax Finco PLC, 6.625%, 11/1/25(1) | | 702 | 653,818 |
| NextEra Energy Operating Partners, L.P., 4.25%, 7/15/24(1) | | 616 | 598,595 |
| | | | $ 2,074,102 |
Total Corporate Bonds
(identified cost $67,609,377) | | | $64,959,301 |
| Exchange-Traded Funds — 1.3% |
| Security | Shares | Value |
| Fixed Income Funds — 1.3% |
| iShares 0-5 Year High Yield Corporate Bond ETF | | 25,191 | $ 1,029,052 |
Total Exchange-Traded Funds
(identified cost $1,034,594) | | | $ 1,029,052 |
| Senior Floating-Rate Loans — 4.7%(8) |
| Borrower/Description | Principal
Amount
(000's omitted) | Value |
| Air Transportation — 1.1% |
| Mileage Plus Holdings, LLC, Term Loan, 8.777%, (3 mo. USD LIBOR + 5.25%), 6/21/27 | $ | 808 | $ 826,173 |
| | | | $ 826,173 |
| Borrower/Description | Principal
Amount
(000's omitted) | Value |
| Gaming — 0.2% |
| Spectacle Gary Holdings, LLC, Term Loan, 8.004%, (1 mo. USD LIBOR + 4.25%), 11/19/28 | $ | 178 | $ 170,940 |
| | | | $ 170,940 |
| Healthcare — 0.2% |
| Pluto Acquisition I, Inc., Term Loan, 6/22/26(9) | $ | 141 | $ 122,806 |
| | | | $ 122,806 |
| Insurance — 0.5% |
| Alliant Holdings Intermediate, LLC, Term Loan, 7.004%, (1 mo. USD LIBOR + 3.25%), 5/9/25 | $ | 399 | $ 388,094 |
| | | | $ 388,094 |
| Services — 0.5% |
| Travelport Finance (Luxembourg) S.a.r.l., Term Loan, 12.424%, (3 mo. USD LIBOR + 8.75%), 5.174% cash, 7.25% PIK, 2/28/25 | $ | 359 | $ 355,978 |
| | | | $ 355,978 |
| Steel — 0.6% |
| TMS International Corp., Term Loan, 6.869%, (USD LIBOR + 2.75%), 8/14/24(10) | $ | 498 | $ 475,958 |
| | | | $ 475,958 |
| Super Retail — 0.5% |
| PetSmart, Inc., Term Loan, 7.50%, (1 mo. USD LIBOR + 3.75%), 2/11/28 | $ | 374 | $ 360,620 |
| | | | $ 360,620 |
| Technology — 1.1% |
| GoTo Group, Inc., Term Loan, 8.322%, (1 mo. USD LIBOR + 4.75%), 8/31/27 | $ | 2 | $ 1,142 |
| Presidio Holdings, Inc., Term Loan, 7.892%, (USD LIBOR + 3.50%), 1/22/27(10) | | 840 | 822,785 |
| Riverbed Technology, Inc., Term Loan, 11.20%, (1 mo. USD LIBOR + 8.00%), 9.20% cash, 2.00% PIK, 12/7/26 | | 52 | 20,213 |
| | | | $ 844,140 |
Total Senior Floating-Rate Loans
(identified cost $3,621,356) | | | $ 3,544,709 |
10
See Notes to Financial Statements.
Eaton Vance
Short Duration High Income Fund
October 31, 2022
Portfolio of Investments — continued
| Short-Term Investments — 5.9% |
| Security | Shares | Value |
| Morgan Stanley Institutional Liquidity Funds - Government Portfolio, Institutional Class, 2.88%(11) | | 4,521,527 | $ 4,521,527 |
Total Short-Term Investments
(identified cost $4,521,527) | | | $ 4,521,527 |
Total Investments — 98.7%
(identified cost $78,015,547) | | | $75,025,617 |
| Other Assets, Less Liabilities — 1.3% | | | $ 982,849 |
| Net Assets — 100.0% | | | $76,008,466 |
| The percentage shown for each investment category in the Portfolio of Investments is based on net assets. |
| * | In U.S. dollars unless otherwise indicated. |
| (1) | Security exempt from registration under Rule 144A of the Securities Act of 1933, as amended. These securities may be sold in certain transactions in reliance on an exemption from registration (normally to qualified institutional buyers). At October 31, 2022, the aggregate value of these securities is $47,025,683 or 61.9% of the Fund's net assets. |
| (2) | Weighted average fixed-rate coupon that changes/updates monthly. Rate shown is the rate at October 31, 2022. |
| (3) | Amount is less than 0.05%. |
| (4) | Non-income producing security. |
| (5) | Security was acquired in connection with a restructuring of a Senior Loan and may be subject to restrictions on resale. |
| (6) | Issuer is in default with respect to interest and/or principal payments. |
| (7) | Security exempt from registration under Regulation S of the Securities Act of 1933, as amended, which exempts from registration securities offered and sold outside the United States. Security may not be offered or sold in the United States except pursuant to an exemption from, or in a transaction not subject to, the registration requirements of the Securities Act of 1933, as amended. At October 31, 2022, the aggregate value of these securities is $602,172 or 0.8% of the Fund's net assets. |
| (8) | Senior floating-rate loans (Senior Loans) often require prepayments from excess cash flows or permit the borrowers to repay at their election. The degree to which borrowers repay, whether as a contractual requirement or at their election, cannot be predicted with accuracy. As a result, the actual remaining maturity may be substantially less than the stated maturities shown. However, Senior Loans will typically have an expected average life of approximately two to four years. Senior Loans typically have rates of interest which are redetermined periodically by reference to a base lending rate, plus a spread. These base lending rates are primarily the London Interbank Offered Rate (“LIBOR”) or the Secured Overnight Financing Rate (“SOFR”) and secondarily, the prime rate offered by one or more major United States banks (the “Prime Rate”). Base lending rates may be subject to a floor, or minimum rate. Rates for SOFR are generally 1 or 3-month tenors and may also be subject to a credit spread adjustment. Senior Loans are generally subject to contractual restrictions that must be satisfied before they can be bought or sold. |
| (9) | This Senior Loan will settle after October 31, 2022, at which time the interest rate will be determined. |
| (10) | The stated interest rate represents the weighted average interest rate at October 31, 2022 of contracts within the senior loan facility. Interest rates on contracts are primarily redetermined either weekly, monthly or quarterly by reference to the indicated base lending rate and spread and the reset period. |
| (11) | May be deemed to be an affiliated investment company. The rate shown is the annualized seven-day yield as of October 31, 2022. |
| Forward Foreign Currency Exchange Contracts (OTC) |
| Currency Purchased | Currency Sold | Counterparty | Settlement
Date | Unrealized
Appreciation | Unrealized
(Depreciation) |
| USD | 161,466 | EUR | 160,000 | Bank of America, N.A. | 1/31/23 | $ 2,162 | $ — |
| USD | 161,281 | EUR | 160,000 | Bank of America, N.A. | 1/31/23 | 1,978 | — |
| USD | 161,251 | EUR | 160,000 | Bank of America, N.A. | 1/31/23 | 1,948 | — |
| USD | 128,139 | EUR | 127,319 | Bank of America, N.A. | 1/31/23 | 1,375 | — |
| | | | | | | $7,463 | $ — |
11
See Notes to Financial Statements.
Eaton Vance
Short Duration High Income Fund
October 31, 2022
Portfolio of Investments — continued
| Abbreviations: |
| LIBOR | – London Interbank Offered Rate |
| OTC | – Over-the-counter |
| PIK | – Payment In Kind |
| Currency Abbreviations: |
| EUR | – Euro |
| USD | – United States Dollar |
12
See Notes to Financial Statements.
Eaton Vance
Short Duration High Income Fund
October 31, 2022
Statement of Assets and Liabilities
| | October 31, 2022 |
| Assets | |
| Unaffiliated investments, at value (identified cost $73,494,020) | $ 70,504,090 |
| Affiliated investment, at value (identified cost $4,521,527) | 4,521,527 |
| Cash | 26,866 |
| Interest receivable | 1,144,454 |
| Dividends receivable from affiliated investment | 7,831 |
| Receivable for investments sold | 1,243,729 |
| Receivable for Fund shares sold | 70,687 |
| Receivable for open forward foreign currency exchange contracts | 7,463 |
| Receivable from affiliate | 15,648 |
| Total assets | $77,542,295 |
| Liabilities | |
| Payable for investments purchased | $ 1,132,457 |
| Payable for Fund shares redeemed | 239,078 |
| Distributions payable | 4,182 |
| Due to custodian - foreign currency, at value (identified cost $16,766) | 16,764 |
| Payable to affiliates: | |
| Investment adviser and administration fee | 33,854 |
| Distribution and service fees | 1,397 |
| Trustees' fees | 370 |
| Accrued expenses | 105,727 |
| Total liabilities | $ 1,533,829 |
| Net Assets | $76,008,466 |
| Sources of Net Assets | |
| Paid-in capital | $ 81,915,961 |
| Accumulated loss | (5,907,495) |
| Net Assets | $76,008,466 |
| Class A Shares | |
| Net Assets | $ 6,682,999 |
| Shares Outstanding | 763,722 |
Net Asset Value and Redemption Price Per Share
(net assets ÷ shares of beneficial interest outstanding) | $ 8.75 |
Maximum Offering Price Per Share
(100 ÷ 96.75 of net asset value per share) | $ 9.04 |
| Class I Shares | |
| Net Assets | $ 69,325,467 |
| Shares Outstanding | 7,913,473 |
Net Asset Value, Offering Price and Redemption Price Per Share
(net assets ÷ shares of beneficial interest outstanding) | $ 8.76 |
| On sales of $100,000 or more, the offering price of Class A shares is reduced. |
13
See Notes to Financial Statements.
Eaton Vance
Short Duration High Income Fund
October 31, 2022
| | Year Ended |
| | October 31, 2022 |
| Investment Income | |
| Dividend income | $ 52,234 |
| Dividend income from affiliated investments | 26,920 |
| Interest and other income | 3,045,279 |
| Total investment income | $ 3,124,433 |
| Expenses | |
| Investment adviser and administration fee | $ 354,926 |
| Distribution and service fees: | |
| Class A | 16,885 |
| Trustees’ fees and expenses | 4,306 |
| Custodian fee | 39,453 |
| Transfer and dividend disbursing agent fees | 40,900 |
| Legal and accounting services | 67,782 |
| Printing and postage | 6,404 |
| Registration fees | 41,956 |
| Miscellaneous | 12,603 |
| Total expenses | $ 585,215 |
| Deduct: | |
| Waiver and/or reimbursement of expenses by affiliate | $ 146,866 |
| Total expense reductions | $ 146,866 |
| Net expenses | $ 438,349 |
| Net investment income | $ 2,686,084 |
| Realized and Unrealized Gain (Loss) | |
| Net realized gain (loss): | |
| Investment transactions | $ (1,055,394) |
| Investment transactions - affiliated investments | (512) |
| Foreign currency transactions | (2,980) |
| Forward foreign currency exchange contracts | 141,673 |
| Net realized loss | $ (917,213) |
| Change in unrealized appreciation (depreciation): | |
| Investments | $ (3,755,081) |
| Foreign currency | (175) |
| Forward foreign currency exchange contracts | 2,326 |
| Net change in unrealized appreciation (depreciation) | $(3,752,930) |
| Net realized and unrealized loss | $(4,670,143) |
| Net decrease in net assets from operations | $(1,984,059) |
14
See Notes to Financial Statements.
Eaton Vance
Short Duration High Income Fund
October 31, 2022
Statements of Changes in Net Assets
| | Year Ended October 31, |
| | 2022 | 2021 |
| Increase (Decrease) in Net Assets | | |
| From operations: | | |
| Net investment income | $ 2,686,084 | $ 2,131,171 |
| Net realized gain (loss) | (917,213) | 570,118 |
| Net change in unrealized appreciation (depreciation) | (3,752,930) | 1,524,768 |
| Net increase (decrease) in net assets from operations | $ (1,984,059) | $ 4,226,057 |
| Distributions to shareholders: | | |
| Class A | $ (278,639) | $ (247,433) |
| Class I | (2,549,762) | (2,006,956) |
| Total distributions to shareholders | $ (2,828,401) | $ (2,254,389) |
| Transactions in shares of beneficial interest: | | |
| Class A | $ 164,876 | $ 253,499 |
| Class I | 11,717,543 | 18,591,518 |
| Net increase in net assets from Fund share transactions | $11,882,419 | $18,845,017 |
| Net increase in net assets | $ 7,069,959 | $20,816,685 |
| Net Assets | | |
| At beginning of year | $ 68,938,507 | $ 48,121,822 |
| At end of year | $76,008,466 | $68,938,507 |
15
See Notes to Financial Statements.
Eaton Vance
Short Duration High Income Fund
October 31, 2022
| | Class A |
| | Year Ended October 31, |
| | 2022 | 2021 | 2020 | 2019 | 2018 |
| Net asset value — Beginning of year | $ 9.500 | $ 9.120 | $ 9.540 | $ 9.470 | $ 9.820 |
| Income (Loss) From Operations | | | | | |
| Net investment income(1) | $ 0.355 | $ 0.356 | $ 0.394 | $ 0.432 | $ 0.439 |
| Net realized and unrealized gain (loss) | (0.730) | 0.401 | (0.387) | 0.070 | (0.350) |
| Total income (loss) from operations | $(0.375) | $ 0.757 | $ 0.007 | $ 0.502 | $ 0.089 |
| Less Distributions | | | | | |
| From net investment income | $ (0.375) | $ (0.377) | $ (0.414) | $ (0.432) | $ (0.439) |
| Tax return of capital | — | — | (0.013) | — | — |
| Total distributions | $(0.375) | $(0.377) | $(0.427) | $(0.432) | $(0.439) |
| Net asset value — End of year | $ 8.750 | $ 9.500 | $ 9.120 | $ 9.540 | $ 9.470 |
| Total Return(2)(3) | (4.00)% | 8.39% | 0.15% | 5.41% | 0.93% |
| Ratios/Supplemental Data | | | | | |
| Net assets, end of year (000’s omitted) | $ 6,683 | $ 7,059 | $ 6,537 | $ 6,914 | $ 4,726 |
| Ratios (as a percentage of average daily net assets):(4) | | | | | |
| Expenses (3) | 0.90% (5) | 0.90% | 0.90% | 0.90% | 0.91% (6) |
| Net investment income | 3.89% | 3.76% | 4.29% | 4.54% | 4.55% |
| Portfolio Turnover of the Portfolio(7) | — | — | 50% | 63% | 52% |
| Portfolio Turnover of the Fund | 96% | 75% | 34% (8) | — | — |
| (1) | Computed using average shares outstanding. |
| (2) | Returns are historical and are calculated by determining the percentage change in net asset value with all distributions reinvested and do not reflect the effect of sales charges. |
| (3) | The investment adviser and administrator of the Fund and/or the investment adviser of the Portfolio reimbursed certain operating expenses (equal to 0.23%, 0.30%, 0.31%, 0.39% and 0.38% of average daily net assets for the years ended October 31, 2022, 2021, 2020, 2019 and 2018, respectively). Absent this reimbursement, total return would be lower. |
| (4) | Includes the Fund’s share of the Portfolio’s allocated expenses for the period while the Fund was investing in the Portfolio. |
| (5) | Includes a reduction by the investment adviser and administrator of a portion of its investment adviser and administration fee due to the Fund's investment in the Liquidity Fund (equal to less than 0.005% of average daily net assets for the year ended October 31, 2022). |
| (6) | Includes interest expense of 0.01% of average daily net assets for the year ended October 31, 2018. |
| (7) | Portfolio turnover represents the rate of portfolio activity for the period while the Fund was investing in the Portfolio. |
| (8) | For the period from June 15, 2020 through October 31, 2020 when the Fund was making investments directly in securities. |
References to Portfolio herein are to Short Duration High Income Portfolio, a Massachusetts business trust in which the Fund invested all of its investable assets prior to the close of business on June 12, 2020 and which had the same investment objective and policies as the Fund during such period.
16
See Notes to Financial Statements.
Eaton Vance
Short Duration High Income Fund
October 31, 2022
Financial Highlights — continued
| | Class I |
| | Year Ended October 31, |
| | 2022 | 2021 | 2020 | 2019 | 2018 |
| Net asset value — Beginning of year | $ 9.510 | $ 9.130 | $ 9.560 | $ 9.490 | $ 9.840 |
| Income (Loss) From Operations | | | | | |
| Net investment income(1) | $ 0.381 | $ 0.375 | $ 0.417 | $ 0.457 | $ 0.462 |
| Net realized and unrealized gain (loss) | (0.733) | 0.407 | (0.396) | 0.069 | (0.348) |
| Total income (loss) from operations | $ (0.352) | $ 0.782 | $ 0.021 | $ 0.526 | $ 0.114 |
| Less Distributions | | | | | |
| From net investment income | $ (0.398) | $ (0.402) | $ (0.437) | $ (0.456) | $ (0.464) |
| Tax return of capital | — | — | (0.014) | — | — |
| Total distributions | $ (0.398) | $ (0.402) | $ (0.451) | $ (0.456) | $ (0.464) |
| Net asset value — End of year | $ 8.760 | $ 9.510 | $ 9.130 | $ 9.560 | $ 9.490 |
| Total Return(2)(3) | (3.75)% | 8.65% | 0.30% | 5.67% | 1.19% |
| Ratios/Supplemental Data | | | | | |
| Net assets, end of year (000’s omitted) | $69,325 | $61,879 | $41,585 | $49,780 | $40,712 |
| Ratios (as a percentage of average daily net assets):(4) | | | | | |
| Expenses (3) | 0.65% (5) | 0.65% | 0.65% | 0.65% | 0.66% (6) |
| Net investment income | 4.18% | 3.95% | 4.53% | 4.79% | 4.79% |
| Portfolio Turnover of the Portfolio(7) | — | — | 50% | 63% | 52% |
| Portfolio Turnover of the Fund | 96% | 75% | 34% (8) | — | — |
| (1) | Computed using average shares outstanding. |
| (2) | Returns are historical and are calculated by determining the percentage change in net asset value with all distributions reinvested. |
| (3) | The investment adviser and administrator of the Fund and/or the investment adviser of the Portfolio reimbursed certain operating expenses (equal to 0.23%, 0.30%, 0.31%, 0.39% and 0.38% of average daily net assets for the years ended October 31, 2022, 2021, 2020, 2019 and 2018, respectively). Absent this reimbursement, total return would be lower. |
| (4) | Includes the Fund’s share of the Portfolio’s allocated expenses for the period while the Fund was investing in the Portfolio. |
| (5) | Includes a reduction by the investment adviser and administrator of a portion of its investment adviser and administration fee due to the Fund's investment in the Liquidity Fund (equal to less than 0.005% of average daily net assets for the year ended October 31, 2022). |
| (6) | Includes interest expense of 0.01% of average daily net assets for the year ended October 31, 2018. |
| (7) | Portfolio turnover represents the rate of portfolio activity for the period while the Fund was investing in the Portfolio. |
| (8) | For the period from June 15, 2020 through October 31, 2020 when the Fund was making investments directly in securities. |
References to Portfolio herein are to Short Duration High Income Portfolio, a Massachusetts business trust in which the Fund invested all of its investable assets prior to the close of business on June 12, 2020 and which had the same investment objective and policies as the Fund during such period.
17
See Notes to Financial Statements.
Eaton Vance
Short Duration High Income Fund
October 31, 2022
Notes to Financial Statements
1 Significant Accounting Policies
Eaton Vance Short Duration High Income Fund (the Fund) is a non-diversified series of Eaton Vance Mutual Funds Trust (the Trust). The Trust is a Massachusetts business trust registered under the Investment Company Act of 1940, as amended (the 1940 Act), as an open-end management investment company. The Fund’s investment objective is total return. The Fund offers two classes of shares. Class A shares are generally sold subject to a sales charge imposed at time of purchase. Class A shares may be subject to a 0.75% (1% prior to April 29, 2022) contingent deferred sales charge (CDSC) if redeemed within 12 months (18 months prior to April 29, 2022) of purchase (depending on the circumstances of purchase). Class I shares are sold at net asset value and are not subject to a sales charge. Each class represents a pro-rata interest in the Fund, but votes separately on class-specific matters and (as noted below) is subject to different expenses. Realized and unrealized gains and losses are allocated daily to each class of shares based on the relative net assets of each class to the total net assets of the Fund. Net investment income, other than class-specific expenses, is allocated daily to each class of shares based upon the ratio of the value of each class’s paid shares to the total value of all paid shares. Each class of shares differs in its distribution plan and certain other class-specific expenses.
The following is a summary of significant accounting policies of the Fund. The policies are in conformity with accounting principles generally accepted in the United States of America (U.S. GAAP). The Fund is an investment company and follows accounting and reporting guidance in the Financial Accounting Standards Board (FASB) Accounting Standards Codification Topic 946.
A Investment Valuation—The following methodologies are used to determine the market value or fair value of investments.
Debt Obligations. Debt obligations are generally valued on the basis of valuations provided by third party pricing services, as derived from such services’ pricing models. Inputs to the models may include, but are not limited to, reported trades, executable bid and ask prices, broker/dealer quotations, prices or yields of securities with similar characteristics, interest rates, anticipated prepayments, benchmark curves or information pertaining to the issuer, as well as industry and economic events. The pricing services may use a matrix approach, which considers information regarding securities with similar characteristics to determine the valuation for a security. Short-term debt obligations purchased with a remaining maturity of sixty days or less for which a valuation from a third party pricing service is not readily available may be valued at amortized cost, which approximates fair value.
Senior Floating-Rate Loans. Interests in senior floating-rate loans (Senior Loans) are valued generally at the average mean of bid and ask quotations obtained from a third party pricing service. Senior Loans, for which a valuation is not available or deemed unreliable, are fair valued by the investment adviser utilizing one or more of the valuation techniques described below to assess the likelihood that the borrower will make a full repayment of the loan underlying such Senior Loan. If the investment adviser believes that there is a reasonable likelihood of full repayment, the investment adviser will determine fair value using a matrix pricing approach that considers the yield on the Senior Loan relative to yields on other Senior Loans issued by companies of comparable credit quality. If the investment adviser believes there is not a reasonable likelihood of full repayment, the investment adviser will determine fair value using analyses that include, but are not limited to: (i) a comparison of the value of the borrower's outstanding equity and debt to that of comparable public companies; (ii) a discounted cash flow analysis; or (iii) when the investment adviser believes it is likely that a borrower will be liquidated or sold, an analysis of the terms of such liquidation or sale. In certain cases, the investment adviser will use a combination of analytical methods to determine fair value, such as when only a portion of a borrower's assets are likely to be sold. In conducting its assessment and analyses for purposes of determining fair value of a Senior Loan, the investment adviser will use its discretion and judgment in considering and appraising relevant factors. Junior Loans (i.e., subordinated loans and second lien loans) are valued in the same manner as Senior Loans.
Equity Securities. Equity securities listed on a U.S. securities exchange generally are valued at the last sale or closing price on the day of valuation or, if no sales took place on such date, at the mean between the closing bid and ask prices on the exchange where such securities are principally traded. Equity securities listed on the NASDAQ National Market System are valued at the NASDAQ official closing price. Unlisted or listed securities for which closing sales prices or closing quotations are not available are valued at the mean between the latest available bid and ask prices or, in the case of preferred equity securities that are not listed or traded in the over-the-counter market, by a third party pricing service that uses various techniques that consider factors including, but not limited to, prices or yields of securities with similar characteristics, benchmark yields, broker/dealer quotes, quotes of underlying common stock, issuer spreads, as well as industry and economic events.
Derivatives. Forward foreign currency exchange contracts are generally valued at the mean of the average bid and average ask prices that are reported by currency dealers to a third party pricing service at the valuation time. Such third party pricing service valuations are supplied for specific settlement periods and the Fund’s forward foreign currency exchange contracts are valued at an interpolated rate between the closest preceding and subsequent settlement period reported by the third party pricing service.
Foreign Securities and Currencies. Foreign securities and currencies are valued in U.S. dollars, based on foreign currency exchange rate quotations supplied by a third party pricing service. The pricing service uses a proprietary model to determine the exchange rate. Inputs to the model include reported trades and implied bid/ask spreads.
Other. Investments in management investment companies (including money market funds) that do not trade on an exchange are valued at the net asset value as of the close of each business day.
Fair Valuation. In connection with Rule 2a-5 of the 1940 Act, which became effective September 8, 2022, the Trustees have designated the Fund’s investment adviser as its valuation designee. Investments for which valuations or market quotations are not readily available or are deemed unreliable are valued by the investment adviser, as valuation designee, at fair value using methods that most fairly reflect the security’s “fair value”, which is the amount
Eaton Vance
Short Duration High Income Fund
October 31, 2022
Notes to Financial Statements — continued
that the Fund might reasonably expect to receive for the security upon its current sale in the ordinary course. Each such determination is based on a consideration of relevant factors, which are likely to vary from one pricing context to another. These factors may include, but are not limited to, the type of security, the existence of any contractual restrictions on the security’s disposition, the price and extent of public trading in similar securities of the issuer or of comparable companies or entities, quotations or relevant information obtained from broker/dealers or other market participants, information obtained from the issuer, analysts, and/or the appropriate stock exchange (for exchange-traded securities), an analysis of the company’s or entity’s financial statements, and an evaluation of the forces that influence the issuer and the market(s) in which the security is purchased and sold.
B Investment Transactions—Investment transactions for financial statement purposes are accounted for on a trade date basis. Realized gains and losses on investments sold are determined on the basis of identified cost.
C Income—Interest income is recorded on the basis of interest accrued, adjusted for amortization of premium or accretion of discount. Fees associated with loan amendments are recognized immediately. Dividend income is recorded on the ex-dividend date for dividends received in cash and/or securities. Distributions from investment companies are recorded as dividend income, capital gains or return of capital based on the nature of the distribution.
D Federal Taxes—The Fund’s policy is to comply with the provisions of the Internal Revenue Code applicable to regulated investment companies and to distribute to shareholders each year substantially all of its net investment income, and all or substantially all of its net realized capital gains. Accordingly, no provision for federal income or excise tax is necessary.
As of October 31, 2022, the Fund had no uncertain tax positions that would require financial statement recognition, de-recognition, or disclosure. The Fund files a U.S. federal income tax return annually after its fiscal year-end, which is subject to examination by the Internal Revenue Service for a period of three years from the date of filing.
E Expenses—The majority of expenses of the Trust are directly identifiable to an individual fund. Expenses which are not readily identifiable to a specific fund are allocated taking into consideration, among other things, the nature and type of expense and the relative size of the funds.
F Foreign Currency Translation—Investment valuations, other assets, and liabilities initially expressed in foreign currencies are translated each business day into U.S. dollars based upon current exchange rates. Purchases and sales of foreign investment securities and income and expenses denominated in foreign currencies are translated into U.S. dollars based upon currency exchange rates in effect on the respective dates of such transactions. Recognized gains or losses on investment transactions attributable to changes in foreign currency exchange rates are recorded for financial statement purposes as net realized gains and losses on investments. That portion of unrealized gains and losses on investments that results from fluctuations in foreign currency exchange rates is not separately disclosed.
G Use of Estimates—The preparation of the financial statements in conformity with U.S. GAAP requires management to make estimates and assumptions that affect the reported amounts of assets and liabilities at the date of the financial statements and the reported amounts of income and expense during the reporting period. Actual results could differ from those estimates.
H Indemnifications—Under the Trust’s organizational documents, its officers and Trustees may be indemnified against certain liabilities and expenses arising out of the performance of their duties to the Fund. Under Massachusetts law, if certain conditions prevail, shareholders of a Massachusetts business trust (such as the Trust) could be deemed to have personal liability for the obligations of the Trust. However, the Trust’s Declaration of Trust contains an express disclaimer of liability on the part of Fund shareholders and the By-laws provide that the Trust shall assume, upon request by the shareholder, the defense on behalf of any Fund shareholders. Moreover, the By-laws also provide for indemnification out of Fund property of any shareholder held personally liable solely by reason of being or having been a shareholder for all loss or expense arising from such liability. Additionally, in the normal course of business, the Fund enters into agreements with service providers that may contain indemnification clauses. The Fund's maximum exposure under these arrangements is unknown as this would involve future claims that may be made against the Fund that have not yet occurred.
I Forward Foreign Currency Exchange Contracts—The Fund may enter into forward foreign currency exchange contracts for the purchase or sale of a specific foreign currency at a fixed price on a future date. The forward foreign currency exchange contracts are adjusted by the daily exchange rate of the underlying currency and any gains or losses are recorded as unrealized until such time as the contracts have been closed. Risks may arise upon entering these contracts from the potential inability of counterparties to meet the terms of their contracts and from movements in the value of a foreign currency relative to the U.S. dollar.
2 Distributions to Shareholders and Income Tax Information
The Fund declares dividends daily to shareholders of record at the time of declaration. Distributions are generally paid monthly. Distributions of realized capital gains are made at least annually. Distributions are declared separately for each class of shares. Shareholders may reinvest income and capital gain distributions in additional shares of the same class of the Fund at the net asset value as of the reinvestment date or, at the election of the shareholder, receive distributions in cash. Distributions to shareholders are determined in accordance with income tax regulations, which may differ from U.S. GAAP. As required by U.S. GAAP, only distributions in excess of tax basis earnings and profits are reported in the financial statements as a return of capital. Permanent differences between book and tax accounting relating to distributions are reclassified to paid-in capital. For tax purposes, distributions from short-term capital gains are considered to be from ordinary income.
Eaton Vance
Short Duration High Income Fund
October 31, 2022
Notes to Financial Statements — continued
The tax character of distributions declared for the years ended October 31, 2022 and October 31, 2021 was as follows:
| | Year Ended October 31, |
| | 2022 | 2021 |
| Ordinary income | $2,828,401 | $2,254,389 |
As of October 31, 2022, the components of distributable earnings (accumulated loss) on a tax basis were as follows:
| Undistributed ordinary income | $ 168,989 |
| Deferred capital losses | (2,825,736) |
| Net unrealized depreciation | (3,246,566) |
| Distributions payable | (4,182) |
| Accumulated loss | $(5,907,495) |
At October 31, 2022, the Fund, for federal income tax purposes, had deferred capital losses of $2,825,736 which would reduce its taxable income arising from future net realized gains on investment transactions, if any, to the extent permitted by the Internal Revenue Code, and thus would reduce the amount of distributions to shareholders, which would otherwise be necessary to relieve the Fund of any liability for federal income or excise tax. The deferred capital losses are treated as arising on the first day of the Fund’s next taxable year and retain the same short-term or long-term character as when originally deferred. Of the deferred capital losses at October 31, 2022, $1,901,801 are short-term and $923,935 are long-term.
The cost and unrealized appreciation (depreciation) of investments, including open derivative contracts, of the Fund at October 31, 2022, as determined on a federal income tax basis, were as follows:
| Aggregate cost | $ 78,271,921 |
| Gross unrealized appreciation | $ 23,559 |
| Gross unrealized depreciation | (3,269,863) |
| Net unrealized depreciation | $ (3,246,304) |
3 Investment Adviser and Administration Fee and Other Transactions with Affiliates
The investment adviser and administration fee is earned by Eaton Vance Management (EVM), an indirect, wholly-owned subsidiary of Morgan Stanley, as compensation for investment advisory and administrative services rendered to the Fund. The investment adviser and administration fee is computed at an annual rate as a percentage of the Fund’s average daily net assets as follows and is payable monthly:
| Average Daily Net Assets | Annual Fee Rate |
| Up to $1 billion | 0.550% |
| $1 billion but less than $2.5 billion | 0.525% |
| $2.5 billion but less than $5 billion | 0.505% |
| $5 billion and over | 0.490% |
For the year ended October 31, 2022, the investment adviser and administration fee amounted to $354,926 or 0.55% of the Fund’s average daily net assets. Effective April 26, 2022, the Fund may invest in a money market fund, the Institutional Class of the Morgan Stanley Institutional Liquidity Funds - Government Portfolio (the "Liquidity Fund"), an open-end management investment company managed by Morgan Stanley Investment Management Inc., a wholly-owned subsidiary of Morgan Stanley. The investment adviser and administration fee paid by the Fund is reduced by an amount equal to its pro-rata share of the advisory and administration fees paid by the Fund due to its investment in the Liquidity Fund. For the year ended October 31, 2022, the
Eaton Vance
Short Duration High Income Fund
October 31, 2022
Notes to Financial Statements — continued
investment adviser and administration fee paid was reduced by $2,059 relating to the Fund's investment in the Liquidity Fund. Prior to April 26, 2022, the Fund may have invested its cash in Eaton Vance Cash Reserves Fund, LLC (Cash Reserves Fund), an affiliated investment company managed by EVM. EVM did not receive a fee for advisory services provided to Cash Reserves Fund.
EVM has agreed to reimburse the Fund’s expenses to the extent that total annual operating expenses (relating to ordinary operating expenses only and excluding such expenses as borrowing costs, taxes or litigation expenses) exceed 0.90% and 0.65% of the Fund’s average daily net assets for Class A and Class I, respectively. This agreement may be changed or terminated after February 28, 2023. Pursuant to this agreement, EVM was allocated $144,807 of the Fund’s operating expenses for the year ended October 31, 2022.
EVM provides sub-transfer agency and related services to the Fund pursuant to a Sub-Transfer Agency Support Services Agreement. For the year ended October 31, 2022, EVM earned $2,760 from the Fund pursuant to such agreement, which is included in transfer and dividend disbursing agent fees on the Statement of Operations. The Fund was informed that Eaton Vance Distributors, Inc. (EVD), an affiliate of EVM and the Fund's principal underwriter, received $1,002 as its portion of the sales charge on sales of Class A shares and no CDSCs paid by Class A shareholders for the year ended October 31, 2022. EVD also received distribution and service fees from Class A shares (see Note 4).
Trustees and officers of the Fund who are members of EVM’s organization receive remuneration for their services to the Fund out of the investment adviser and administration fee. Trustees of the Fund who are not affiliated with EVM may elect to defer receipt of all or a percentage of their annual fees in accordance with the terms of the Trustees Deferred Compensation Plan. For the year ended October 31, 2022, no significant amounts have been deferred. Certain officers and Trustees of the Fund are officers of EVM.
4 Distribution Plan
The Fund has in effect a distribution plan for Class A shares (Class A Plan) pursuant to Rule 12b-1 under the 1940 Act. Pursuant to the Class A Plan, the Fund pays EVD a distribution and service fee of 0.25% per annum of its average daily net assets attributable to Class A shares for distribution services and facilities provided to the Fund by EVD, as well as for personal services and/or the maintenance of shareholder accounts. Distribution and service fees paid or accrued to EVD for the year ended October 31, 2022 amounted to $16,885 for Class A shares.
Distribution and service fees are subject to the limitations contained in the Financial Industry Regulatory Authority Rule 2341(d).
5 Purchases and Sales of Investments
Purchases and sales of investments, other than short-term obligations and including maturities, paydowns and principal repayments on Senior Loans, aggregated $69,824,554 and $60,009,712, respectively, for the year ended October 31, 2022.
6 Shares of Beneficial Interest
The Fund’s Declaration of Trust permits the Trustees to issue an unlimited number of full and fractional shares of beneficial interest (without par value). Such shares may be issued in a number of different series (such as the Fund) and classes. Transactions in Fund shares were as follows:
| | Year Ended
October 31, 2022 | | Year Ended
October 31, 2021 |
| | Shares | Amount | | Shares | Amount |
| Class A | | | | | |
| Sales | 156,200 | $ 1,414,154 | | 215,964 | $ 2,048,056 |
| Issued to shareholders electing to receive payments of distributions in Fund shares | 29,979 | 270,963 | | 25,476 | 241,579 |
| Redemptions | (165,322) | (1,520,241) | | (215,530) | (2,036,136) |
| Net increase | 20,857 | $ 164,876 | | 25,910 | $ 253,499 |
Eaton Vance
Short Duration High Income Fund
October 31, 2022
Notes to Financial Statements — continued
| | Year Ended
October 31, 2022 | | Year Ended
October 31, 2021 |
| | Shares | Amount | | Shares | Amount |
| Class I | | | | | |
| Sales | 6,766,427 | $ 60,662,464 | | 2,714,751 | $ 25,850,442 |
| Issued to shareholders electing to receive payments of distributions in Fund shares | 278,621 | 2,518,053 | | 208,718 | 1,982,246 |
| Redemptions | (5,636,745) | (51,462,974) | | (975,310) | (9,241,170) |
| Net increase | 1,408,303 | $ 11,717,543 | | 1,948,159 | $18,591,518 |
7 Financial Instruments
The Fund may trade in financial instruments with off-balance sheet risk in the normal course of its investing activities. These financial instruments may include forward foreign currency exchange contracts and may involve, to a varying degree, elements of risk in excess of the amounts recognized for financial statement purposes. The notional or contractual amounts of these instruments represent the investment the Fund has in particular classes of financial instruments and do not necessarily represent the amounts potentially subject to risk. The measurement of the risks associated with these instruments is meaningful only when all related and offsetting transactions are considered. A summary of obligations under these financial instruments at October 31, 2022 is included in the Portfolio of Investments. At October 31, 2022, the Fund had sufficient cash and/or securities to cover commitments under these contracts.
The Fund is subject to foreign exchange risk in the normal course of pursuing its investment objective. Because the Fund holds foreign currency denominated investments, the value of these investments and related receivables and payables may change due to future changes in foreign currency exchange rates. To hedge against this risk, the Fund enters into forward foreign currency exchange contracts.
The Fund enters into forward foreign currency exchange contracts that may contain provisions whereby the counterparty may terminate the contract under certain conditions, including but not limited to a decline in the Fund’s net assets below a certain level over a certain period of time, which would trigger a payment by the Fund for those derivatives in a liability position. At October 31, 2022, the Fund had no open derivatives with credit-related contingent features in a net liability position.
The over-the-counter (OTC) derivatives in which the Fund invests are subject to the risk that the counterparty to the contract fails to perform its obligations under the contract. To mitigate this risk, the Fund has entered into an International Swaps and Derivatives Association, Inc. Master Agreement (“ISDA Master Agreement”) or similar agreement with substantially all its derivative counterparties. An ISDA Master Agreement is a bilateral agreement between the Fund and a counterparty that governs certain OTC derivatives and typically contains, among other things, set-off provisions in the event of a default and/or termination event as defined under the relevant ISDA Master Agreement. Under an ISDA Master Agreement, the Fund may, under certain circumstances, offset with the counterparty certain derivative financial instruments’ payables and/or receivables with collateral held and/or posted and create one single net payment. The provisions of the ISDA Master Agreement typically permit a single net payment in the event of default including the bankruptcy or insolvency of the counterparty. However, bankruptcy or insolvency laws of a particular jurisdiction may impose restrictions on or prohibitions against the right of offset in bankruptcy or insolvency. Certain ISDA Master Agreements allow counterparties to OTC derivatives to terminate derivative contracts prior to maturity in the event the Fund’s net assets decline by a stated percentage or the Fund fails to meet the terms of its ISDA Master Agreements, which would cause the counterparty to accelerate payment by the Fund of any net liability owed to it.
The collateral requirements for derivatives traded under an ISDA Master Agreement are governed by a Credit Support Annex to the ISDA Master Agreement. Collateral requirements are determined at the close of business each day and are typically based on changes in market values for each transaction under an ISDA Master Agreement and netted into one amount for such agreement. Generally, the amount of collateral due from or to a counterparty is subject to a minimum transfer threshold amount before a transfer is required, which may vary by counterparty. Collateral pledged for the benefit of the Fund and/or counterparty is held in segregated accounts by the Fund’s custodian and cannot be sold, re-pledged, assigned or otherwise used while pledged. The portion of such collateral representing cash, if any, is reflected as deposits for derivatives collateral and, in the case of cash pledged by a counterparty for the benefit of the Fund, a corresponding liability on the Statement of Assets and Liabilities. Securities pledged by the Fund as collateral, if any, are identified as such in the Portfolio of Investments.
Eaton Vance
Short Duration High Income Fund
October 31, 2022
Notes to Financial Statements — continued
The fair value of open derivative instruments (not considered to be hedging instruments for accounting disclosure purposes) and whose primary underlying risk exposure is foreign exchange risk at October 31, 2022 was as follows:
| | Fair Value |
| Derivative | Asset Derivative | Liability Derivative |
| Forward foreign currency exchange contracts | $7,463 (1) | $ — |
| (1) | Statement of Assets and Liabilities location: Receivable for open forward foreign currency exchange contracts. |
The Fund’s derivative assets at fair value by type, which are reported gross in the Statement of Assets and Liabilities, are presented in the table above. The following table presents the Fund’s derivative assets by counterparty, net of amounts available for offset under a master netting agreement and net of the related collateral received by the Fund for such assets as of October 31, 2022.
| Counterparty | Derivative
Assets Subject to
Master Netting
Agreement | Derivatives
Available
for Offset | Non-cash
Collateral
Received(a) | Cash
Collateral
Received(a) | Net Amount
of Derivative
Assets(b) |
| Bank of America, N.A. | $7,463 | $ — | $ — | $ — | $7,463 |
| (a) | In some instances, the total collateral received and/or pledged may be more than the amount shown due to overcollateralization. |
| (b) | Net amount represents the net amount due from the counterparty in the event of default. |
The effect of derivative instruments (not considered to be hedging instruments for accounting disclosure purposes) on the Statement of Operations and whose primary underlying risk exposure is foreign exchange risk for the year ended October 31, 2022 was as follows:
| Derivative | Realized Gain (Loss)
on Derivatives Recognized
in Income(1) | Change in Unrealized
Appreciation (Depreciation) on
Derivatives Recognized in Income(2) |
| Forward foreign currency exchange contracts | $141,673 | $2,326 |
| (1) | Statement of Operations location: Net realized gain (loss) - Forward foreign currency exchange contracts. |
| (2) | Statement of Operations location: Change in unrealized appreciation (depreciation) - Forward foreign currency exchange contracts. |
The average notional amount of forward foreign currency exchange contracts (based on the absolute value of notional amounts of currency purchased and currency sold) outstanding during the year ended October 31, 2022, which is indicative of the volume of this derivative type, was approximately $996,000.
8 Line of Credit
The Fund participates with other portfolios and funds managed by EVM and its affiliates in a $725 million unsecured line of credit agreement with a group of banks, which is in effect through October 24, 2023. In connection with the renewal of the agreement on October 25, 2022, the borrowing limit was decreased from $800 million. Borrowings are made by the Fund solely for temporary purposes related to redemptions and other short-term cash needs. Interest is charged to the Fund based on its borrowings at an amount above either the Secured Overnight Financing Rate (SOFR) or Federal Funds rate. In addition, a fee computed at an annual rate of 0.15% on the daily unused portion of the line of credit is allocated among the participating portfolios and funds at the end of each quarter. Also in connection with the renewal of the agreement, an arrangement fee totaling $150,000 was incurred that was allocated to the participating portfolios and funds. Because the line of credit is not available exclusively to the Fund, it may be unable to borrow some or all of its requested amounts at any particular time. The Fund did not have any significant borrowings or allocated fees during the year ended October 31, 2022.
Eaton Vance
Short Duration High Income Fund
October 31, 2022
Notes to Financial Statements — continued
9 Investments in Affiliated Funds
At October 31, 2022, the value of the Fund's investment in funds that may be deemed to be affiliated was $4,521,527, which represents 5.9% of the Fund's net assets. Transactions in affiliated funds by the Fund for the year ended October 31, 2022 were as follows:
| Name | Value,
beginning
of period | Purchases | Sales
proceeds | Net
realized
gain (loss) | Change in
unrealized
appreciation
(depreciation) | Value, end
of period | Dividend
income | Units/Shares,
end of period |
| Short-Term Investments |
| Cash Reserves Fund | $4,550,435 | $17,721,981 | $(22,271,904) | $ (512) | $ — | $ — | $ 1,116 | — |
| Liquidity Fund | — | 50,890,051 | (46,368,524) | — | — | 4,521,527 | 25,804 | 4,521,527 |
| Total | | | | $(512) | $ — | $4,521,527 | $26,920 | |
10 Fair Value Measurements
Under generally accepted accounting principles for fair value measurements, a three-tier hierarchy to prioritize the assumptions, referred to as inputs, is used in valuation techniques to measure fair value. The three-tier hierarchy of inputs is summarized in the three broad levels listed below.
| • | Level 1 – quoted prices in active markets for identical investments |
| • | Level 2 – other significant observable inputs (including quoted prices for similar investments, interest rates, prepayment speeds, credit risk, etc.) |
| • | Level 3 – significant unobservable inputs (including a fund's own assumptions in determining the fair value of investments) |
In cases where the inputs used to measure fair value fall in different levels of the fair value hierarchy, the level disclosed is determined based on the lowest level input that is significant to the fair value measurement in its entirety. The inputs or methodology used for valuing securities are not necessarily an indication of the risk associated with investing in those securities.
At October 31, 2022, the hierarchy of inputs used in valuing the Fund's investments and open derivative instruments, which are carried at value, were as follows:
| Asset Description | Level 1 | Level 2 | Level 3 | Total |
| Commercial Mortgage-Backed Securities | $ — | $ 581,553 | $ — | $ 581,553 |
| Common Stocks | — | 213 | — | 213 |
| Convertible Bonds | — | 214,573 | — | 214,573 |
| Convertible Preferred Stocks | 174,099 | 590 | — | 174,689 |
| Corporate Bonds | — | 64,959,301 | — | 64,959,301 |
| Exchange-Traded Funds | 1,029,052 | — | — | 1,029,052 |
| Senior Floating-Rate Loans | — | 3,544,709 | — | 3,544,709 |
| Short-Term Investments | 4,521,527 | — | — | 4,521,527 |
| Total Investments | $5,724,678 | $69,300,939 | $ — | $75,025,617 |
| Forward Foreign Currency Exchange Contracts | $ — | $ 7,463 | $ — | $ 7,463 |
| Total | $5,724,678 | $69,308,402 | $ — | $75,033,080 |
Eaton Vance
Short Duration High Income Fund
October 31, 2022
Notes to Financial Statements — continued
11 Risks and Uncertainties
Credit Risk
The Fund primarily invests in lower rated and comparable quality unrated high yield securities. These investments have different risks than investments in debt securities rated investment grade. Risk of loss upon default by the borrower is significantly greater with respect to such debt than with other debt securities because these securities are generally unsecured and are more sensitive to adverse economic conditions, such as recession or increasing interest rates, than are investment grade issuers.
Pandemic Risk
An outbreak of respiratory disease caused by a novel coronavirus was first detected in China in late 2019 and subsequently spread internationally. This coronavirus has resulted in closing borders, enhanced health screenings, changes to healthcare service preparation and delivery, quarantines, cancellations, disruptions to supply chains and customer activity, as well as general concern and uncertainty. Health crises caused by outbreaks of disease, such as the coronavirus outbreak, may exacerbate other pre-existing political, social and economic risks and disrupt normal market conditions and operations. The impact of this outbreak has negatively affected the worldwide economy, as well as the economies of individual countries and industries, and could continue to affect the market in significant and unforeseen ways. Other epidemics and pandemics that may arise in the future may have similar effects. Any such impact could adversely affect the Fund's performance, or the performance of the securities in which the Fund invests.
Eaton Vance
Short Duration High Income Fund
October 31, 2022
Report of Independent Registered Public Accounting Firm
To the Trustees of Eaton Vance Mutual Funds Trust and Shareholders of Eaton Vance Short Duration High Income Fund:
Opinion on the Financial Statements and Financial Highlights
We have audited the accompanying statement of assets and liabilities of Eaton Vance Short Duration High Income Fund (the “Fund”) (one of the funds constituting Eaton Vance Mutual Funds Trust), including the portfolio of investments, as of October 31, 2022, the related statement of operations for the year then ended, the statements of changes in net assets for each of the two years in the period then ended, the financial highlights for each of the five years in the period then ended, and the related notes. In our opinion, the financial statements and financial highlights present fairly, in all material respects, the financial position of the Fund as of October 31, 2022, and the results of its operations for the year then ended, the changes in its net assets for each of the two years in the period then ended, and the financial highlights for each of the five years in the period then ended, in conformity with accounting principles generally accepted in the United States of America.
Basis for Opinion
These financial statements and financial highlights are the responsibility of the Fund's management. Our responsibility is to express an opinion on the Fund's financial statements and financial highlights based on our audits. We are a public accounting firm registered with the Public Company Accounting Oversight Board (United States) (PCAOB) and are required to be independent with respect to the Fund in accordance with the U.S. federal securities laws and the applicable rules and regulations of the Securities and Exchange Commission and the PCAOB.
We conducted our audits in accordance with the standards of the PCAOB. Those standards require that we plan and perform the audit to obtain reasonable assurance about whether the financial statements and financial highlights are free of material misstatement, whether due to error or fraud. The Fund is not required to have, nor were we engaged to perform, an audit of its internal control over financial reporting. As part of our audits, we are required to obtain an understanding of internal control over financial reporting but not for the purpose of expressing an opinion on the effectiveness of the Fund’s internal control over financial reporting. Accordingly, we express no such opinion.
Our audits included performing procedures to assess the risks of material misstatement of the financial statements and financial highlights, whether due to error or fraud, and performing procedures that respond to those risks. Such procedures included examining, on a test basis, evidence regarding the amounts and disclosures in the financial statements and financial highlights. Our audits also included evaluating the accounting principles used and significant estimates made by management, as well as evaluating the overall presentation of the financial statements and financial highlights. Our procedures included confirmation of securities and senior loans owned as of October 31, 2022, by correspondence with the custodian, brokers and selling or agent banks; when replies were not received from brokers and selling or agent banks, we performed other auditing procedures. We believe that our audits provide a reasonable basis for our opinion.
/s/ Deloitte & Touche LLP
Boston, Massachusetts
December 20, 2022
We have served as the auditor of one or more Eaton Vance investment companies since 1959.
Eaton Vance
Short Duration High Income Fund
October 31, 2022
Federal Tax Information (Unaudited)
The Form 1099-DIV you receive in February 2023 will show the tax status of all distributions paid to your account in calendar year 2022. Shareholders are advised to consult their own tax adviser with respect to the tax consequences of their investment in the Fund. As required by the Internal Revenue Code and/or regulations, shareholders must be notified regarding the status of qualified dividend income for individuals and 163(j) interest dividends.
Qualified Dividend Income. For the fiscal year ended October 31, 2022, the Fund designates approximately $8,801, or up to the maximum amount of such dividends allowable pursuant to the Internal Revenue Code, as qualified dividend income eligible for the reduced tax rate of 15%.
163(j) Interest Dividends. For the fiscal year ended October 31, 2022, the Fund designates 82.42% of distributions from net investment income as a 163(j) interest dividend.
Eaton Vance
Short Duration High Income Fund
October 31, 2022
Board of Trustees’ Contract Approval
Overview of the Contract Review Process
The Investment Company Act of 1940, as amended (the “1940 Act”), provides, in substance, that the investment advisory agreement between a fund and its investment adviser will continue in effect from year-to-year only if its continuation is approved on an annual basis by a vote of the fund’s board of trustees, including a majority of the trustees who are not “interested persons” of the fund (“independent trustees”), cast in person at a meeting called for the purpose of considering such approval.
At a meeting held on June 8, 2022, the Boards of Trustees/Directors (collectively, the “Board”) that oversee the registered investment companies advised by Eaton Vance Management or its affiliate, Boston Management and Research (the “Eaton Vance Funds”), including a majority of the independent trustees (the “Independent Trustees”), voted to approve the continuation of existing investment advisory agreements and sub-advisory agreements1 for each of the Eaton Vance Funds for an additional one-year period. The Board relied upon the affirmative recommendation of its Contract Review Committee, which is a committee exclusively comprised of Independent Trustees. Prior to making its recommendation, the Contract Review Committee reviewed information furnished by the adviser and sub-adviser to each of the Eaton Vance Funds (including information specifically requested by the Board) for a series of formal meetings held between April and June 2022. Members of the Contract Review Committee also considered information received at prior meetings of the Board and its committees, to the extent such information was relevant to the Contract Review Committee’s annual evaluation of the investment advisory agreements and sub-advisory agreements.
In connection with its evaluation of the investment advisory agreements and sub-advisory agreements, the Board considered various information relating to the Eaton Vance Funds. This included information applicable to all or groups of Eaton Vance Funds, which is referenced immediately below, and information applicable to the particular Eaton Vance Fund covered by this report (additional fund-specific information is referenced below under “Results of the Contract Review Process”). (For funds that invest through one or more underlying portfolios, references to “each fund” in this section may include information that was considered at the portfolio-level.)
Information about Fees, Performance and Expenses
• A report from an independent data provider comparing advisory and other fees paid by each fund to such fees paid by comparable funds, as identified by the independent data provider (“comparable funds”);
• A report from an independent data provider comparing each fund’s total expense ratio (and its components) to those of comparable funds;
• A report from an independent data provider comparing the investment performance of each fund (including, as relevant, total return data, income data, Sharpe ratios and information ratios) to the investment performance of comparable funds and, as applicable, benchmark indices, over various time periods;
• In certain instances, data regarding investment performance relative to customized groups of peer funds and blended indices identified by the adviser in consultation with the Portfolio Management Committee of the Board (a committee exclusively comprised of Independent Trustees);
• Comparative information concerning the fees charged and services provided by the adviser and sub-adviser to each fund in managing other accounts (which may include other mutual funds, collective investment funds and institutional accounts) using investment strategies and techniques similar to those used in managing such fund(s), if any;
• Profitability analyses with respect to the adviser and sub-adviser to each of the funds;
Information about Portfolio Management and Trading
• Descriptions of the investment management services provided to each fund, as well as each of the funds’ investment strategies and policies;
• The procedures and processes used to determine the value of fund assets, including, when necessary, the determination of “fair value” and actions taken to monitor and test the effectiveness of such procedures and processes;
• Information about the policies and practices of each fund’s adviser and sub-adviser with respect to trading, including their processes for seeking best execution of portfolio transactions;
• Information about the allocation of brokerage transactions and the benefits, if any, received by the adviser and sub-adviser to each fund as a result of brokerage allocation, including, as applicable, information concerning the acquisition of research through client commission arrangements and policies with respect to “soft dollars”;
• Data relating to the portfolio turnover rate of each fund and related information regarding active management in the context of particular strategies;
Information about each Adviser and Sub-adviser
• Reports detailing the financial results and condition of the adviser and sub-adviser to each fund;
• Information regarding the individual investment professionals whose responsibilities include portfolio management and investment research for the funds, and, for portfolio managers and certain other investment professionals, information relating to their responsibilities with respect to managing other mutual funds and investment accounts, as applicable;
1 Not all Eaton Vance Funds have entered into a sub-advisory agreement with a sub-adviser. Accordingly, references to “sub-adviser” or “sub-advisory agreement” in this “Overview” section may not be applicable to the particular Eaton Vance Fund covered by this report. Following the “Overview” section, further information regarding the Board’s evaluation of a fund’s contractual arrangements is included under the “Results of the Contract Review Process” section.
Eaton Vance
Short Duration High Income Fund
October 31, 2022
Board of Trustees’ Contract Approval — continued
• Information regarding the adviser’s and its parent company’s (Morgan Stanley’s) efforts to retain and attract talented investment professionals, including in the context of a particularly competitive marketplace for talent, as well as the ongoing unique environment presented by hybrid, remote and other alternative work arrangements;
• The Code of Ethics of the adviser and its affiliates and the sub-adviser of each fund, together with information relating to compliance with, and the administration of, such codes;
• Policies and procedures relating to proxy voting, including regular reporting with respect to fund proxy voting activities;
• Information regarding the handling of corporate actions and class actions, as well as information regarding litigation and other regulatory matters;
• Information concerning the resources devoted to compliance efforts undertaken by the adviser and its affiliates and the sub-adviser of each fund, if any, including descriptions of their various compliance programs and their record of compliance;
• Information concerning the business continuity and disaster recovery plans of the adviser and its affiliates and the sub-adviser of each fund, if any;
• A description of Eaton Vance Management’s and Boston Management and Research’s oversight of sub-advisers, including with respect to regulatory and compliance issues, investment management and other matters;
Other Relevant Information
• Information regarding ongoing initiatives to further integrate and harmonize, where applicable, the investment management and other departments of the adviser and its affiliates with the overall investment management infrastructure of Morgan Stanley, in light of Morgan Stanley’s acquisition of Eaton Vance on March 1, 2021;
• Information concerning the nature, cost and character of the administrative and other non-investment advisory services provided by Eaton Vance Management and its affiliates;
• Information concerning oversight of the relationship with the custodian, subcustodians, fund accountants, and other third-party service providers by the adviser and/or administrator to each of the funds;
• Information concerning efforts to implement policies and procedures with respect to various new regulations applicable to the funds, including Rule 12d1-4 (the Fund-of-Funds Rule), Rule 18f-4 (the Derivatives Rule) and Rule 2a-5 (the Fair Valuation Rule);
• For an Eaton Vance Fund structured as an exchange-listed closed-end fund, information concerning the benefits of the closed-end fund structure, as well as, where relevant, the closed-end fund’s market prices (including as compared to the closed-end fund’s net asset value (NAV)), trading volume data, continued use of auction preferred shares (where applicable), distribution rates and other relevant matters;
• The risks which the adviser and/or its affiliates incur in connection with the management and operation of the funds, including, among others, litigation, regulatory, entrepreneurial, and other business risks (and the associated costs of such risks); and
• The terms of each investment advisory agreement and sub-advisory agreement.
During the various meetings of the Board and its committees over the course of the year leading up to the June 8, 2022 meeting, the Trustees received information from portfolio managers and other investment professionals of the advisers and sub-advisers of the funds regarding investment and performance matters, and considered various investment and trading strategies used in pursuing the funds’ investment objectives. The Trustees also received information regarding risk management techniques employed in connection with the management of the funds. The Board and its committees evaluated issues pertaining to industry and regulatory developments, compliance procedures, fund governance and other issues with respect to the funds, and received and participated in reports and presentations provided by Eaton Vance Management, Boston Management and Research and fund sub-advisers, with respect to such matters. In addition to the formal meetings of the Board and its committees, the Independent Trustees held regular teleconferences to discuss, among other topics, matters relating to the continuation of investment advisory agreements and sub-advisory agreements.
The Contract Review Committee was advised throughout the contract review process by Goodwin Procter LLP, independent legal counsel for the Independent Trustees. The members of the Contract Review Committee, with the advice of such counsel, exercised their own business judgment in determining the material factors to be considered in evaluating each investment advisory agreement and sub-advisory agreement and the weight to be given to each such factor. The conclusions reached with respect to each investment advisory agreement and sub-advisory agreement were based on a comprehensive evaluation of all the information provided and not any single factor. Moreover, each member of the Contract Review Committee may have placed varying emphasis on particular factors in reaching conclusions with respect to each investment advisory agreement and sub-advisory agreement. In evaluating each investment advisory agreement and sub-advisory agreement, including the fee structures and other terms contained in such agreements, the members of the Contract Review Committee were also informed by multiple years of analysis and discussion with the adviser and sub-adviser to each of the Eaton Vance Funds.
Results of the Contract Review Process
Based on its consideration of the foregoing, and such other information it deemed relevant, including the factors and conclusions described below, the Contract Review Committee concluded that the continuation of the investment advisory and administrative agreement between Eaton Vance Short Duration High Income Fund (the “Fund”) and Eaton Vance Management (the “Adviser”), including its fee structure, is in the interests of shareholders and, therefore, recommended to the Board approval of the agreement. Based on the recommendation of the Contract Review Committee, the Board, including a majority of the Independent Trustees, voted to approve continuation of the investment advisory and administrative agreement for the Fund.
Eaton Vance
Short Duration High Income Fund
October 31, 2022
Board of Trustees’ Contract Approval — continued
Nature, Extent and Quality of Services
In considering whether to approve the investment advisory and administrative agreement for the Fund, the Board evaluated the nature, extent and quality of services provided to the Fund by the Adviser.
The Board considered the Adviser’s management capabilities and investment processes in light of the types of investments held by the Fund, including the education, experience and number of investment professionals and other personnel who provide portfolio management, investment research, and similar services to the Fund. The Board considered the abilities and experience of each Adviser’s investment professionals in making investments in fixed-income securities, including those with below-investment grade ratings and durations of three years or less. The Board also took into account the resources dedicated to portfolio management and other services, the compensation methods of the Adviser and other factors, including the reputation and resources of the Adviser to recruit and retain highly qualified research, advisory and supervisory investment professionals. In addition, the Board considered the time and attention devoted to the Eaton Vance Funds, including the Fund, by senior management, as well as the infrastructure, operational capabilities and support staff in place to assist in the portfolio management and operations of the Fund, including the provision of administrative services. The Board also considered the business-related and other risks to which the Adviser or its affiliates may be subject in managing the Fund.
The Board considered the compliance programs of the Adviser and relevant affiliates thereof. The Board considered compliance and reporting matters regarding, among other things, personal trading by investment professionals, disclosure of portfolio holdings, late trading, frequent trading, portfolio valuation, business continuity and the allocation of investment opportunities. The Board also considered the responses of the Adviser and its affiliates to requests in recent years from regulatory authorities, such as the Securities and Exchange Commission and the Financial Industry Regulatory Authority.
The Board considered other administrative services provided or overseen by Eaton Vance Management and its affiliates, including transfer agency and accounting services. The Board evaluated the benefits to shareholders of investing in a fund that is a part of a large fund complex offering exposure to a variety of asset classes and investment disciplines, as well as the ability, in many cases, to exchange an investment among different funds without incurring additional sales charges.
After consideration of the foregoing factors, among others, the Board concluded that the nature, extent and quality of services provided by the Adviser, taken as a whole, are appropriate and consistent with the terms of the investment advisory and administrative agreement.
Fund Performance
The Board compared the Fund’s investment performance to that of comparable funds identified by an independent data provider (the peer group), as well as an appropriate benchmark index and a custom peer group of similarly managed funds. The Board’s review included comparative performance data with respect to the Fund for the one-, three- and five-year periods ended December 31, 2021. In this regard, the Board noted that the performance of the Fund was lower than the median performance of the Fund’s peer group and custom peer group for the three-year period. The Board also noted that the performance of the Fund was higher than its benchmark index for the three-year period. On the basis of the foregoing, the performance of the Fund over other periods, and other relevant information provided by the Adviser in response to inquiries from the Contract Review Committee, the Board concluded that the performance of the Fund was satisfactory.
Management Fees and Expenses
The Board considered contractual fee rates payable by the Fund for advisory and administrative services (referred to collectively as “management fees”). As part of its review, the Board considered the Fund’s management fees and total expense ratio for the one-year period ended December 31, 2021, as compared to those of comparable funds, before and after giving effect to any undertaking to waive fees or reimburse expenses. The Board also considered factors that had an impact on the Fund’s total expense ratio relative to comparable funds.
After considering the foregoing information, and in light of the nature, extent and quality of the services provided by the Adviser, the Board concluded that the management fees charged for advisory and related services are reasonable.
Profitability and “Fall-Out” Benefits
The Board considered the level of profits realized by the Adviser and relevant affiliates thereof in providing investment advisory and administrative services to the Fund and to all Eaton Vance Funds as a group. The Board considered the level of profits realized without regard to marketing support or other payments by the Adviser and its affiliates to third parties in respect of distribution or other services.
The Board concluded that, in light of the foregoing factors and the nature, extent and quality of the services rendered, the profits realized by the Adviser and its affiliates are deemed not to be excessive.
The Board also considered direct or indirect fall-out benefits received by the Adviser and its affiliates in connection with their respective relationships with the Fund, including the benefits of research services that may be available to the Adviser as a result of securities transactions effected for the Fund and other investment advisory clients.
Eaton Vance
Short Duration High Income Fund
October 31, 2022
Board of Trustees’ Contract Approval — continued
Economies of Scale
In reviewing management fees and profitability, the Board also considered the extent to which the Adviser and its affiliates, on the one hand, and the Fund, on the other hand, can expect to realize benefits from economies of scale as the assets of the Fund increase. The Board acknowledged the difficulty in accurately measuring the benefits resulting from economies of scale, if any, with respect to the management of any specific fund or group of funds. The Board reviewed data summarizing the increases and decreases in the assets of the Fund and of all Eaton Vance Funds as a group over various time periods, and evaluated the extent to which the total expense ratio of the Fund and the profitability of the Adviser and its affiliates may have been affected by such increases or decreases. Based upon the foregoing, the Board concluded that the Fund currently shares in the benefits from economies of scale, if any, when they are realized by the Adviser. The Board also concluded that the structure of the advisory fee, which includes breakpoints at several asset levels, will allow the Fund to continue to benefit from any economies of scale in the future.
Eaton Vance
Short Duration High Income Fund
October 31, 2022
Liquidity Risk Management Program
The Fund has implemented a written liquidity risk management program (Program) and related procedures to manage its liquidity in accordance with Rule 22e-4 under the Investment Company Act of 1940, as amended (Liquidity Rule). The Liquidity Rule defines “liquidity risk” as the risk that a fund could not meet requests to redeem shares issued by the fund without significant dilution of the remaining investors’ interests in the fund. The Fund’s Board of Trustees/Directors has designated the investment adviser to serve as the administrator of the Program and the related procedures. The administrator has established a Liquidity Risk Management Oversight Committee (Committee) to perform the functions necessary to administer the Program. As part of the Program, the administrator is responsible for identifying illiquid investments and categorizing the relative liquidity of the Fund’s investments in accordance with the Liquidity Rule. Under the Program, the administrator assesses, manages, and periodically reviews the Fund’s liquidity risk, and is responsible for making certain reports to the Fund’s Board of Trustees/Directors and the Securities and Exchange Commission (SEC) regarding the liquidity of the Fund’s investments, and to notify the Board of Trustees/Directors and the SEC of certain liquidity events specified in the Liquidity Rule. The liquidity of the Fund’s portfolio investments is determined based on a number of factors including, but not limited to, relevant market, trading and investment-specific considerations under the Program.
At a meeting of the Fund’s Board of Trustees/Directors on June 7, 2022, the Committee provided a written report to the Fund’s Board of Trustees/Directors pertaining to the operation, adequacy, and effectiveness of implementation of the Program, as well as the operation of the highly liquid investment minimum (if applicable) for the period January 1, 2021 through December 31, 2021 (Review Period). The Program operated effectively during the Review Period, supporting the administrator’s ability to assess, manage and monitor Fund liquidity risk, including during periods of market volatility and net redemptions. During the Review Period, the Fund met redemption requests on a timely basis.
There can be no assurance that the Program will achieve its objectives in the future. Please refer to the Fund’s prospectus for more information regarding the Fund’s exposure to liquidity risk and other principal risks to which an investment in the Fund may be subject.
Eaton Vance
Short Duration High Income Fund
October 31, 2022
Management and Organization
Fund Management. The Trustees of Eaton Vance Mutual Funds Trust (the Trust) are responsible for the overall management and supervision of the Trust's affairs. The Board members and officers of the Trust are listed below. Except as indicated, each individual has held the office shown or other offices in the same company for the last five years. Board members hold indefinite terms of office. Each Trustee holds office until his or her successor is elected and qualified, subject to a prior death, resignation, retirement, disqualification or removal. Under the terms of the Fund’s current Trustee retirement policy, an Independent Trustee must retire and resign as a Trustee on the earlier of: (i) the first day of July following his or her 74th birthday; or (ii), with limited exception, December 31st of the 20th year in which he or she has served as a Trustee. However, if such retirement and resignation would cause the Fund to be out of compliance with Section 16 of the 1940 Act or any other regulations or guidance of the SEC, then such retirement and resignation will not become effective until such time as action has been taken for the Fund to be in compliance therewith. The “noninterested Trustees” consist of those Trustees who are not “interested persons” of the Trust, as that term is defined under the 1940 Act. The business address of each Board member and officer is Two International Place, Boston, Massachusetts 02110. As used below, “BMR” refers to Boston Management and Research, “EVC” refers to Eaton Vance Corp., “EV” refers to EV LLC, “EVM” refers to Eaton Vance Management and “EVD” refers to Eaton Vance Distributors, Inc. EV is the trustee of each of EVM and BMR. Effective March 1, 2021, each of EVM, BMR, EVD and EV are indirect, wholly owned subsidiaries of Morgan Stanley. Each officer affiliated with EVM may hold a position with other EVM affiliates that is comparable to his or her position with EVM listed below. Each Trustee oversees 135 funds (with the exception of Mr. Bowser who oversees 110 funds) in the Eaton Vance fund complex (including both funds and portfolios in a hub and spoke structure).
| Name and Year of Birth | Trust
Position(s) | Length of Service | Principal Occupation(s) and Other Directorships
During Past Five Years and Other Relevant Experience |
| Interested Trustee |
Thomas E. Faust Jr.
1958 | Trustee | Since 2007 | Chairman of Morgan Stanley Investment Management, Inc. (MSIM), member of the Board of Managers and President of EV (since 2021), Chief Executive Officer of EVM and BMR. Formerly, Chairman, Chief Executive Officer (2007-2021) and President (2006-2021) of EVC and Director of EVD (2007-2022). Mr. Faust is an interested person because of his positions with MSIM, BMR, EVM and EV, which are affiliates of the Trust.
Other Directorships. Formerly, Director of EVC (2007-2021) and Hexavest Inc. (investment management firm) (2012-2021). |
| Noninterested Trustees |
Alan C. Bowser(1)
1962 | Trustee | Since 2022 | Chief Diversity Officer, Partner and a member of the Operating Committee, and formerly served as Senior Advisor on Diversity and Inclusion for the firm’s chief executive officer, Co-Head of the Americas Region, and Senior Client Advisor of Bridgewater Associates, an asset management firm (2011- present).
Other Directorships. None. |
Mark R. Fetting
1954 | Trustee | Since 2016 | Private investor. Formerly held various positions at Legg Mason, Inc. (investment management firm) (2000-2012), including President, Chief Executive Officer, Director and Chairman (2008-2012), Senior Executive Vice President (2004-2008) and Executive Vice President (2001-2004). Formerly, President of Legg Mason family of funds (2001-2008). Formerly, Division President and Senior Officer of Prudential Financial Group, Inc. and related companies (investment management firm) (1991-2000).
Other Directorships. None. |
Cynthia E. Frost
1961 | Trustee | Since 2014 | Private investor. Formerly, Chief Investment Officer of Brown University (university endowment) (2000-2012). Formerly, Portfolio Strategist for Duke Management Company (university endowment manager) (1995-2000). Formerly, Managing Director, Cambridge Associates (investment consulting company) (1989-1995). Formerly, Consultant, Bain and Company (management consulting firm) (1987- 1989). Formerly, Senior Equity Analyst, BA Investment Management Company (1983-1985).
Other Directorships. None. |
George J. Gorman
1952 | Chairperson of the
Board and Trustee | Since 2021
(Chairperson) and 2014 (Trustee) | Principal at George J. Gorman LLC (consulting firm). Formerly, Senior Partner at Ernst & Young LLP (a registered public accounting firm) (1974-2009).
Other Directorships. None. |
Eaton Vance
Short Duration High Income Fund
October 31, 2022
Management and Organization — continued
| Name and Year of Birth | Trust
Position(s) | Length of Service | Principal Occupation(s) and Other Directorships
During Past Five Years and Other Relevant Experience |
| Noninterested Trustees (continued) |
Valerie A. Mosley
1960 | Trustee | Since 2014 | Chairwoman and Chief Executive Officer of Valmo Ventures (a consulting and investment firm). Founder of Upward Wealth, Inc., dba BrightUp, a fintech platform. Formerly, Partner and Senior Vice President, Portfolio Manager and Investment Strategist at Wellington Management Company, LLP (investment management firm) (1992-2012). Formerly, Chief Investment Officer, PG Corbin Asset Management (1990-1992). Formerly worked in institutional corporate bond sales at Kidder Peabody (1986-1990).
Other Directorships. Director of DraftKings, Inc. (digital sports entertainment and gaming company) (since September 2020). Director of Envestnet, Inc. (provider of intelligent systems for wealth management and financial wellness) (since 2018). Formerly, Director of Dynex Capital, Inc. (mortgage REIT) (2013-2020) and Director of Groupon, Inc. (e-commerce provider) (2020-2022). |
Keith Quinton
1958 | Trustee | Since 2018 | Private investor, researcher and lecturer. Formerly, Independent Investment Committee Member at New Hampshire Retirement System (2017-2021). Formerly, Portfolio Manager and Senior Quantitative Analyst at Fidelity Investments (investment management firm) (2001-2014).
Other Directorships. Formerly, Director (2016-2021) and Chairman (2019-2021) of New Hampshire Municipal Bond Bank. |
Marcus L. Smith
1966 | Trustee | Since 2018 | Private investor and independent corporate director. Formerly, Chief Investment Officer, Canada (2012-2017), Chief Investment Officer, Asia (2010-2012), Director of Asian Research (2004-2010) and portfolio manager (2001-2017) at MFS Investment Management (investment management firm).
Other Directorships. Director of First Industrial Realty Trust, Inc. (an industrial REIT) (since 2021). Director of MSCI Inc. (global provider of investment decision support tools) (since 2017). Formerly, Director of DCT Industrial Trust Inc. (logistics real estate company) (2017-2018). |
Susan J. Sutherland
1957 | Trustee | Since 2015 | Private investor. Director of Ascot Group Limited and certain of its subsidiaries (insurance and reinsurance) (since 2017). Formerly, Director of Hagerty Holding Corp. (insurance) (2015-2018) and Montpelier Re Holdings Ltd. (insurance and reinsurance) (2013-2015). Formerly, Associate, Counsel and Partner at Skadden, Arps, Slate, Meagher & Flom LLP (law firm) (1982-2013).
Other Directorships. Director of Kairos Acquisition Corp. (insurance/InsurTech acquisition company) (since 2021). |
Scott E. Wennerholm
1959 | Trustee | Since 2016 | Private investor. Formerly, Trustee at Wheelock College (postsecondary institution) (2012-2018). Formerly, Consultant at GF Parish Group (executive recruiting firm) (2016-2017). Formerly, Chief Operating Officer and Executive Vice President at BNY Mellon Asset Management (investment management firm) (2005-2011). Formerly, Chief Operating Officer and Chief Financial Officer at Natixis Global Asset Management (investment management firm) (1997-2004). Formerly, Vice President at Fidelity Investments Institutional Services (investment management firm) (1994-1997).
Other Directorships. None. |
Nancy A. Wiser(1)
1967 | Trustee | Since 2022 | Formerly, Executive Vice President and the Global Head of Operations at Wells Fargo Asset Management (2011-2021).
Other Directorships. None. |
| Name and Year of Birth | Trust
Position(s) | Length of Service | Principal Occupation(s)
During Past Five Years |
| Principal Officers who are not Trustees |
Eric A. Stein
1980 | President | Since 2020 | Vice President and Chief Investment Officer, Fixed Income of EVM and BMR. Prior to November 1, 2020, Mr. Stein was a co-Director of Eaton Vance’s Global Income Investments. Also Vice President of Calvert Research and Management (“CRM”). |
Deidre E. Walsh
1971 | Vice President and Chief
Legal Officer | Since 2009 | Vice President of EVM and BMR. Also Vice President of CRM. |
James F. Kirchner
1967 | Treasurer | Since 2007 | Vice President of EVM and BMR. Also Vice President of CRM. |
Eaton Vance
Short Duration High Income Fund
October 31, 2022
Management and Organization — continued
| Name and Year of Birth | Trust
Position(s) | Length of Service | Principal Occupation(s)
During Past Five Years |
| Principal Officers who are not Trustees (continued) |
Nicholas Di Lorenzo
1987 | Secretary | Since 2022 | Formerly, associate (2012-2021) and counsel (2022) at Dechert LLP. |
Richard F. Froio
1968 | Chief Compliance
Officer | Since 2017 | Vice President of EVM and BMR since 2017. Formerly, Deputy Chief Compliance Officer (Adviser/Funds) and Chief Compliance Officer (Distribution) at PIMCO (2012-2017) and Managing Director at BlackRock/Barclays Global Investors (2009-2012). |
(1) Mr. Bowser and Ms. Wiser began serving as Trustees effective April 4, 2022.
The SAI for the Fund includes additional information about the Trustees and officers of the Fund and can be obtained without charge on Eaton Vance’s website at www.eatonvance.com or by calling 1-800-262-1122.
| FACTS | WHAT DOES EATON VANCE DO WITH YOUR
PERSONAL INFORMATION? |
| Why? | Financial companies choose how they share your personal information. Federal law gives consumers the right to limit some but not all sharing. Federal law also requires us to tell you how we collect, share, and protect your personal information. Please read this notice carefully to understand what we do. |
| |
| What? | The types of personal information we collect and share depend on the product or service you have with us. This information can include:■ Social Security number and income
■ investment experience and risk tolerance
■ checking account number and wire transfer instructions |
| |
| How? | All financial companies need to share customers’ personal information to run their everyday business. In the section below, we list the reasons financial companies can share their customers’ personal information; the reasons Eaton Vance chooses to share; and whether you can limit this sharing. |
Reasons we can share your
personal information | Does Eaton Vance
share? | Can you limit
this sharing? |
| For our everyday business purposes — such as to process your transactions, maintain your account(s), respond to court orders and legal investigations, or report to credit bureaus | Yes | No |
| For our marketing purposes — to offer our products and services to you | Yes | No |
| For joint marketing with other financial companies | No | We don’t share |
| For our investment management affiliates’ everyday business purposes — information about your transactions, experiences, and creditworthiness | Yes | Yes |
| For our affiliates’ everyday business purposes — information about your transactions and experiences | Yes | No |
| For our affiliates’ everyday business purposes — information about your creditworthiness | No | We don’t share |
| For our investment management affiliates to market to you | Yes | Yes |
| For our affiliates to market to you | No | We don’t share |
| For nonaffiliates to market to you | No | We don’t share |
To limit our
sharing | Call toll-free 1-800-262-1122 or email: EVPrivacy@eatonvance.comPlease note:If you are a new customer, we can begin sharing your information 30 days from the date we sent this notice. When you are no longer our customer, we continue to share your information as described in this notice. However, you can contact us at any time to limit our sharing. |
| Questions? | Call toll-free 1-800-262-1122 or email: EVPrivacy@eatonvance.com |
| Privacy Notice — continued | April 2021 |
| Who we are |
| Who is providing this notice? | Eaton Vance Management, Eaton Vance Distributors, Inc., Eaton Vance Trust Company, Eaton Vance Management (International) Limited, Eaton Vance Advisers International Ltd., Eaton Vance Global Advisors Limited, Eaton Vance Management’s Real Estate Investment Group, Boston Management and Research, Calvert Research and Management, Eaton Vance and Calvert Fund Families and our investment advisory affiliates (“Eaton Vance”) (see Investment Management Affiliates definition below) |
| What we do |
How does Eaton Vance
protect my personal
information? | To protect your personal information from unauthorized access and use, we use security measures that comply with federal law. These measures include computer safeguards and secured files and buildings. We have policies governing the proper handling of customer information by personnel and requiring third parties that provide support to adhere to appropriate security standards with respect to such information. |
How does Eaton Vance
collect my personal
information? | We collect your personal information, for example, when you■ open an account or make deposits or withdrawals from your account
■ buy securities from us or make a wire transfer
■ give us your contact informationWe also collect your personal information from others, such as credit bureaus, affiliates, or other companies. |
| Why can’t I limit all sharing? | Federal law gives you the right to limit only■ sharing for affiliates’ everyday business purposes — information about your creditworthiness
■ affiliates from using your information to market to you
■ sharing for nonaffiliates to market to youState laws and individual companies may give you additional rights to limit sharing. See below for more on your rights under state law. |
| Definitions |
Investment Management
Affiliates | Eaton Vance Investment Management Affiliates include registered investment advisers, registered broker- dealers, and registered and unregistered funds. Investment Management Affiliates does not include entities associated with Morgan Stanley Wealth Management, such as Morgan Stanley Smith Barney LLC and Morgan Stanley & Co. |
| Affiliates | Companies related by common ownership or control. They can be financial and nonfinancial companies.■ Our affiliates include companies with a Morgan Stanley name and financial companies such as Morgan Stanley Smith Barney LLC and Morgan Stanley & Co. |
| Nonaffiliates | Companies not related by common ownership or control. They can be financial and nonfinancial companies.■ Eaton Vance does not share with nonaffiliates so they can market to you. |
| Joint marketing | A formal agreement between nonaffiliated financial companies that together market financial products or services to you.■ Eaton Vance doesn’t jointly market. |
| Other important information |
| Vermont: Except as permitted by law, we will not share personal information we collect about Vermont residents with Nonaffiliates unless you provide us with your written consent to share such information.California: Except as permitted by law, we will not share personal information we collect about California residents with Nonaffiliates and we will limit sharing such personal information with our Affiliates to comply with California privacy laws that apply to us. |
Delivery of Shareholder Documents. The Securities and Exchange Commission (SEC) permits funds to deliver only one copy of shareholder documents, including prospectuses, proxy statements and shareholder reports, to fund investors with multiple accounts at the same residential or post office box address. This practice is often called “householding” and it helps eliminate duplicate mailings to shareholders. Eaton Vance, or your financial intermediary, may household the mailing of your documents indefinitely unless you instruct Eaton Vance, or your financial intermediary, otherwise. If you would prefer that your Eaton Vance documents not be householded, please contact Eaton Vance at 1-800-262-1122, or contact your financial intermediary. Your instructions that householding not apply to delivery of your Eaton Vance documents will typically be effective within 30 days of receipt by Eaton Vance or your financial intermediary.
Portfolio Holdings. Each Eaton Vance Fund and its underlying Portfolio(s) (if applicable) files a schedule of portfolio holdings on Part F to Form N-PORT with the SEC. Certain information filed on Form N-PORT may be viewed on the Eaton Vance website at www.eatonvance.com, by calling Eaton Vance at 1-800-262-1122 or in the EDGAR database on the SEC’s website at www.sec.gov.
Proxy Voting. From time to time, funds are required to vote proxies related to the securities held by the funds. The Eaton Vance Funds or their underlying Portfolios (if applicable) vote proxies according to a set of policies and procedures approved by the Funds’ and Portfolios’ Boards. You may obtain a description of these policies and procedures and information on how the Funds or Portfolios voted proxies relating to portfolio securities during the most recent 12-month period ended June 30, without charge, upon request, by calling 1-800-262-1122 and by accessing the SEC’s website at www.sec.gov.
This Page Intentionally Left Blank
This Page Intentionally Left Blank
Investment Adviser and Administrator
Eaton Vance Management
Two International Place
Boston, MA 02110
Principal Underwriter*
Eaton Vance Distributors, Inc.
Two International Place
Boston, MA 02110
(617) 482-8260
Custodian
State Street Bank and Trust Company
State Street Financial Center, One Lincoln Street
Boston, MA 02111
Transfer Agent
BNY Mellon Investment Servicing (US) Inc.
Attn: Eaton Vance Funds
P.O. Box 9653
Providence, RI 02940-9653
(800) 262-1122
Independent Registered Public Accounting Firm
Deloitte & Touche LLP
200 Berkeley Street
Boston, MA 02116-5022
Fund Offices
Two International Place
Boston, MA 02110
* FINRA BrokerCheck. Investors may check the background of their Investment Professional by contacting the Financial Industry Regulatory Authority (FINRA). FINRA BrokerCheck is a free tool to help investors check the professional background of current and former FINRA-registered securities firms and brokers. FINRA BrokerCheck is available by calling 1-800-289-9999 and at www.FINRA.org. The FINRA BrokerCheck brochure describing this program is available to investors at www.FINRA.org.
Eaton Vance
Emerging and Frontier Countries Equity Fund
Annual Report
October 31, 2022
Commodity Futures Trading Commission Registration. The Commodity Futures Trading Commission (“CFTC”) has adopted regulations that subject registered investment companies and advisers to regulation by the CFTC if a fund invests more than a prescribed level of its assets in certain CFTC-regulated instruments (including futures, certain options and swap agreements) or markets itself as providing investment exposure to such instruments. The investment adviser has claimed an exclusion from the definition of “commodity pool operator” under the Commodity Exchange Act with respect to its management of the Fund. Accordingly, neither the Fund nor the adviser with respect to the operation of the Fund is subject to CFTC regulation. Because of its management of other strategies, the Fund's adviser is registered with the CFTC as a commodity pool operator. The adviser is also registered as a commodity trading advisor.
Fund shares are not insured by the FDIC and are not deposits or other obligations of, or guaranteed by, any depository institution. Shares are subject to investment risks, including possible loss of principal invested.
This report must be preceded or accompanied by a current summary prospectus or prospectus. Before investing, investors should consider carefully the investment objective, risks, and charges and expenses of a mutual fund. This and other important information is contained in the summary prospectus and prospectus, which can be obtained from a financial intermediary. Prospective investors should read the prospectus carefully before investing. For further information, please call 1-800-262-1122.
Annual Report October 31, 2022
Eaton Vance
Emerging and Frontier Countries Equity Fund
Eaton Vance
Emerging and Frontier Countries Equity Fund
October 31, 2022
Management’s Discussion of Fund Performance†
Economic and Market Conditions
The 12-month period starting November 1, 2021, was dominated by the ongoing effects of one black swan event -- the COVID-19 pandemic -- and fallout from another -- Russia’s invasion of Ukraine in February 2022.
In the opening months of the period, stock investors as well as consumers generally appeared to take a “glass is half full” approach. In both the U.S. and Europe, consumers rushed to spend money saved earlier in the pandemic. During the final months of 2021, major U.S. equity indexes closed at new all-time highs.
But as the new year began, investors appeared to reevaluate the twin threats of inflation and interest rate hikes, and stock performance turned negative. In February, Russia’s invasion of Ukraine sent shock waves through U.S. and global markets, exacerbating inflationary pressures on energy and food costs. Central banks around the world -- including the U.S. Federal Reserve (the Fed), the Bank of England, and the European Central Bank (ECB) -- initiated their first interest rate increases in years. In Europe, looming energy shortages caused by the Russia-Ukraine conflict pushed inflation rates even higher and stock prices lower. Many emerging-market central banks, meanwhile, had already initiated aggressive monetary policies in early 2021 and continued to hike interest rates during the period.
In the U.S., investors began to expect the Fed would raise interest rates at every policy meeting in 2022 and, in turn, worried that aggressive rate hikes could tip the economy into recession. At its June, July, and September 2022 meetings, the Fed hiked the federal funds rate 0.75% each time -- to a 3.00%-3.25% range -- its first moves of that magnitude since 1994. Higher interest rates, inflation, and recessionary worries drove stock prices down around the globe.
As the period came to a close in October 2022, however, U.S. and European stocks delivered positive performance for the first time in months, amid better-than-expected U.S. company earnings and hope that central bank rate increases would help tame inflation. The Fed’s aggressive rate hikes, however, along with a rising U.S. dollar, weighed heavily on emerging markets, and the MSCI Emerging Markets Index continued to decline during the month.
In the world’s second-largest economy, China’s zero-COVID policy severely restricted economic output during the period. The MSCI Golden Dragon Index, a measure of Chinese large-cap and mid-cap stocks, lost more ground in October and was one of the worst-performing major indexes during the period, declining 42.74%.
Major equity indexes elsewhere also suffered significant losses. For the period as a whole, the MSCI ACWI Index, a broad measure of global equities, returned -19.96%; the S&P 500® Index, a broad measure of U.S. stocks, returned -14.61%; and the technology-laden Nasdaq Composite Index returned -28.56%. The MSCI EAFE Index of developed-market international equities returned -23.00%, while the MSCI Emerging Markets Index, dragged down by its China allocation, returned -31.03% during the period.
Fund Performance
For the 12-month period ended October 31, 2022, Eaton Vance Emerging and Frontier Countries Equity Fund (the Fund) returned -17.13% for Class A shares at net asset value (NAV). The Fund underperformed its primary benchmark, the MSCI Emerging Markets Equal Country Weighted Index (the Primary Index), which returned -15.21%; and outperformed its secondary benchmark, the MSCI Frontier Markets Index (the Secondary Index), which returned -31.19% during the period.
The Fund also outperformed its blended benchmark consisting of 50% Primary Index and 50% Secondary Index (the Blended Index), which returned -23.37% during the period.
The Fund seeks to invest in emerging and frontier equity markets where management believes macroeconomic fundamentals and economic policy are likely to improve. Investment decisions are focused on broad country-level and sector-equity exposures, rather than individual stocks.
The Fund’s overweight positions in South Korea and Taiwan, along with an underweight position in Turkey detracted from Fund performance versus the Primary Index. An out-of-Index position in Vietnam hurt relative performance during the period as well.
The South Korean stock market, which includes a significant number of technology-based exporters, was negatively affected by investor concerns about slowing global growth and the potential for widespread recession in 2023. Stock prices in Taiwan, one of the world’s largest exporters of microchips, were similarly impacted by falling global demand and recessionary worries. Geopolitical tensions with China were an additional headwind for Taiwanese equities during the period.
In Vietnam, another export-dependent economy, equities also declined in price during the period, weighed down by the same concerns about falling global demand for technology-based products and an anticipated recession. Local issues surrounding a crackdown on corruption among real estate development firms dragged on the Vietnamese stock market as well.
See Endnotes and Additional Disclosures in this report.
Past performance is no guarantee of future results. Returns are historical and are calculated by determining the percentage change in net asset value (NAV) or offering price (as applicable) with all distributions reinvested. Furthermore, returns do not reflect the deduction of taxes that shareholders may have to pay on Fund distributions or upon the redemption of Fund shares. Investment return and principal value will fluctuate so that shares, when redeemed, may be worth more or less than their original cost. Performance for periods less than or equal to one year is cumulative. Performance is for the stated time period only; due to market volatility, current Fund performance may be lower or higher than the quoted return. For performance as of the most recent month-end, please refer to eatonvance.com.
Eaton Vance
Emerging and Frontier Countries Equity Fund
October 31, 2022
Management’s Discussion of Fund Performance† — continued
During a period of generally rising interest rates across the globe, Turkey’s central bank took the unorthodox position of cutting rates, which fueled an economic recovery. The Fund, however, underweighted Turkish equities because management felt the rate cut merely postponed the potential effects of previous poor monetary policy.
In contrast, underweight positions in Russia, Hungary, and Poland, along with an out-of-Index position in Cyprus, contributed to Fund performance relative to the Primary Index.
Russia was removed -- written off -- from the Primary Index at a price of zero following its invasion of Ukraine in February 2022. Prior to the invasion, the Fund had sold its entire Russia position. Hungarian and Polish stock prices were depressed by rising inflation, aggravated by spiking energy costs due largely to sanctions imposed on Russian oil and gas by NATO nations.
The Fund’s stock position in the Bank of Cyprus performed well during the period, helped by an unsolicited takeover offer from a private equity firm at a price well above the stock’s previous trading level.
The Fund’s use of derivatives, primarily by hedging its euro and Chinese yuan foreign exchange exposures, contributed to Fund performance relative to the Primary Index during the period.
See Endnotes and Additional Disclosures in this report.
Past performance is no guarantee of future results. Returns are historical and are calculated by determining the percentage change in net asset value (NAV) or offering price (as applicable) with all distributions reinvested. Furthermore, returns do not reflect the deduction of taxes that shareholders may have to pay on Fund distributions or upon the redemption of Fund shares. Investment return and principal value will fluctuate so that shares, when redeemed, may be worth more or less than their original cost. Performance for periods less than or equal to one year is cumulative. Performance is for the stated time period only; due to market volatility, current Fund performance may be lower or higher than the quoted return. For performance as of the most recent month-end, please refer to eatonvance.com.
Eaton Vance
Emerging and Frontier Countries Equity Fund
October 31, 2022
Performance
Portfolio Manager(s) Marshall L. Stocker, Ph.D., CFA and John R. Baur
| % Average Annual Total Returns1,2 | Class
Inception Date | Performance
Inception Date | One Year | Five Years | Since
Inception |
| Class A at NAV | 11/03/2014 | 11/01/2013 | (17.13)% | 0.56% | 1.73% |
| Class A with 5.25% Maximum Sales Charge | — | — | (21.48) | (0.52) | 1.07 |
| Class I at NAV | 11/03/2014 | 11/01/2013 | (16.91) | 0.80 | 1.96 |
|
| MSCI Emerging Markets Equal Country Weighted Index | — | — | (15.21)% | (1.57)% | (0.90)% |
| MSCI Frontier Markets Index | — | — | (31.19) | (2.34) | 1.02 |
| Blended Index | — | — | (23.37) | (1.76) | 0.23 |
| % Total Annual Operating Expense Ratios3 | Class A | Class I |
| | 1.41% | 1.16% |
Growth of $10,000
This graph shows the change in value of a hypothetical investment of $10,000 in Class A of the Fund for the period indicated. For comparison, the same investment is shown in the indicated index.
| Growth of Investment | Amount Invested | Period Beginning | At NAV | With Maximum Sales Charge |
| Class I, at minimum investment | $1,000,000 | 11/01/2013 | $1,190,898 | N.A. |
See Endnotes and Additional Disclosures in this report.
Past performance is no guarantee of future results. Returns are historical and are calculated by determining the percentage change in net asset value (NAV) or offering price (as applicable) with all distributions reinvested. Furthermore, returns do not reflect the deduction of taxes that shareholders may have to pay on Fund distributions or upon the redemption of Fund shares. Investment return and principal value will fluctuate so that shares, when redeemed, may be worth more or less than their original cost. Performance for periods less than or equal to one year is cumulative. Performance is for the stated time period only; due to market volatility, current Fund performance may be lower or higher than the quoted return. For performance as of the most recent month-end, please refer to eatonvance.com.
Eaton Vance
Emerging and Frontier Countries Equity Fund
October 31, 2022
| Sector Allocation (% of net assets)1,2 |
| Country Allocation (% of net assets)1,2 |
Footnotes:
Fund invests in an affiliated investment company (Portfolio) with the same objective(s) and policies as the Fund. References to investments are to the Portfolio’s holdings.
| 1 | Depiction does not reflect the Fund’s derivatives positions. |
| 2 | Excludes cash and cash equivalents. |
Eaton Vance
Emerging and Frontier Countries Equity Fund
October 31, 2022
Endnotes and Additional Disclosures
| † | The views expressed in this report are those of the portfolio manager(s) and are current only through the date stated at the top of this page. These views are subject to change at any time based upon market or other conditions, and Eaton Vance and the Fund(s) disclaim any responsibility to update such views. These views may not be relied upon as investment advice and, because investment decisions are based on many factors, may not be relied upon as an indication of trading intent on behalf of any Eaton Vance fund. This commentary may contain statements that are not historical facts, referred to as “forward-looking statements.” The Fund’s actual future results may differ significantly from those stated in any forward-looking statement, depending on factors such as changes in securities or financial markets or general economic conditions, the volume of sales and purchases of Fund shares, the continuation of investment advisory, administrative and service contracts, and other risks discussed from time to time in the Fund’s filings with the Securities and Exchange Commission. |
| | |
| 1 | MSCI Emerging Markets Equal Country Weighted Index is an unmanaged index of emerging markets common stock where each country within the index has the same weight. MSCI Frontier Markets Index is an unmanaged index that measures the performance of stock markets with less-developed economies and financial markets than emerging markets, and that typically have more restrictions on foreign stock ownership. MSCI indexes are net of foreign withholding taxes. Source: MSCI. MSCI data may not be reproduced or used for any other purpose. MSCI provides no warranties, has not prepared or approved this report, and has no liability hereunder. The Blended Index consists of 50% MSCI Emerging Markets Equal Country Weighted Index and 50% MSCI Frontier Markets Index, rebalanced monthly. Unless otherwise stated, index returns do not reflect the effect of any applicable sales charges, commissions, expenses, taxes or leverage, as applicable. It is not possible to invest directly in an index. |
| 2 | Total Returns at NAV do not include applicable sales charges. If sales charges were deducted, the returns would be lower. Total Returns shown with maximum sales charge reflect the stated maximum sales charge. Unless otherwise stated, performance does not reflect the deduction of taxes on Fund distributions or redemptions of Fund shares.Performance prior to the inception date of Class A and Class I is linked to the performance of Global Macro Capital Opportunities Portfolio (the Portfolio) into which the Fund invests. This linked performance is adjusted for any applicable sales charge, but is not adjusted for class expense differences. If adjusted for such differences, the performance would be different. Performance since inception for an index, if presented, is the performance since the Portfolio’s inception. Performance presented in the Financial Highlights included in the financial statements is not linked. |
| 3 | Source: Fund prospectus. The expense ratios for the current reporting period can be found in the Financial Highlights section of this report. Performance reflects expenses waived and/or reimbursed, if applicable. Without such waivers and/or reimbursements, performance would have been lower. |
| | Fund profile subject to change due to active management. |
| | Additional Information |
| | S&P 500® Index is an unmanaged index of large-cap stocks commonly used as a measure of U.S. stock market performance. S&P Dow Jones Indices are a product of S&P Dow Jones Indices LLC (“S&P DJI”) and have been licensed for use. S&P® and S&P 500® are registered trademarks of S&P DJI; Dow Jones is a registered trademark of Dow Jones Trademark Holdings LLC (“Dow Jones”); S&P DJI, Dow Jones and their respective affiliates do not sponsor, endorse, sell or promote the Fund, will not have any liability with respect thereto and do not have any liability for any errors, omissions, or interruptions of the S&P Dow Jones Indices. Nasdaq Composite Index is a market capitalization-weighted index of all domestic and international securities listed on Nasdaq. Source: Nasdaq, Inc. The information is provided by Nasdaq (with its affiliates, are referred to as the “Corporations”) and Nasdaq’s third party licensors on an “as is” basis and the Corporations make no guarantees and bear no liability of any kind with respect to the information or the Fund. MSCI Golden Dragon Index is an unmanaged index of common stocks traded in China, Hong Kong and Taiwan. MSCI ACWI Index is an unmanaged free-float-adjusted, market-capitalization-weighted index designed to measure the equity market performance of developed and emerging markets. MSCI EAFE Index is an unmanaged index of equities in the developed markets, excluding the U.S. and Canada. MSCI Emerging Markets Index is an unmanaged index of emerging markets common stocks. |
Eaton Vance
Emerging and Frontier Countries Equity Fund
October 31, 2022
Example
As a Fund shareholder, you incur two types of costs: (1) transaction costs, including sales charges (loads) on purchases and redemption fees (if applicable); and (2) ongoing costs, including management fees; distribution and/or service fees; and other Fund expenses. This Example is intended to help you understand your ongoing costs (in dollars) of Fund investing and to compare these costs with the ongoing costs of investing in other mutual funds. The Example is based on an investment of $1,000 invested at the beginning of the period and held for the entire period (May 1, 2022 to October 31, 2022).
Actual Expenses
The first section of the table below provides information about actual account values and actual expenses. You may use the information in this section, together with the amount you invested, to estimate the expenses that you paid over the period. Simply divide your account value by $1,000 (for example, an $8,600 account value divided by $1,000 = 8.6), then multiply the result by the number in the first section under the heading entitled “Expenses Paid During Period” to estimate the expenses you paid on your account during this period.
Hypothetical Example for Comparison Purposes
The second section of the table below provides information about hypothetical account values and hypothetical expenses based on the actual Fund expense ratio and an assumed rate of return of 5% per year (before expenses), which is not the actual Fund return. The hypothetical account values and expenses may not be used to estimate the actual ending account balance or expenses you paid for the period. You may use this information to compare the ongoing costs of investing in your Fund and other funds. To do so, compare this 5% hypothetical example with the 5% hypothetical examples that appear in the shareholder reports of the other funds.
Please note that the expenses shown in the table are meant to highlight your ongoing costs only and do not reflect any transactional costs, such as sales charges (loads) or redemption fees (if applicable). Therefore, the second section of the table is useful in comparing ongoing costs only, and will not help you determine the relative total costs of owning different funds. In addition, if these transactional costs were included, your costs would be higher.
| | Beginning
Account Value
(5/1/22) | Ending
Account Value
(10/31/22) | Expenses Paid
During Period*
(5/1/22 – 10/31/22) | Annualized
Expense
Ratio |
| Actual | | | | |
| Class A | $1,000.00 | $ 894.50 | $7.21** | 1.51% |
| Class I | $1,000.00 | $ 895.90 | $5.93** | 1.24% |
| |
| Hypothetical | | | | |
| (5% return per year before expenses) | | | | |
| Class A | $1,000.00 | $1,017.59 | $7.68** | 1.51% |
| Class I | $1,000.00 | $1,018.96 | $6.31** | 1.24% |
| * | Expenses are equal to the Fund's annualized expense ratio for the indicated Class, multiplied by the average account value over the period, multiplied by 184/365 (to reflect the one-half year period). The Example assumes that the $1,000 was invested at the net asset value per share determined at the close of business on April 30, 2022. The Example reflects the expenses of both the Fund and the Portfolio. |
| ** | Absent an allocation of certain expenses to an affiliate, expenses would be higher. |
Eaton Vance
Emerging and Frontier Countries Equity Fund
October 31, 2022
Statement of Assets and Liabilities
| | October 31, 2022 |
| Assets | |
| Investment in Global Macro Capital Opportunities Portfolio, at value (identified cost $177,448,409) | $ 183,631,810 |
| Receivable for Fund shares sold | 307,726 |
| Receivable from affiliate | 64,977 |
| Total assets | $184,004,513 |
| Liabilities | |
| Payable for Fund shares redeemed | $ 165,804 |
| Payable to affiliates: | |
| Distribution and service fees | 496 |
| Trustees' fees | 42 |
| Accrued expenses | 74,855 |
| Total liabilities | $ 241,197 |
| Net Assets | $183,763,316 |
| Sources of Net Assets | |
| Paid-in capital | $ 176,526,274 |
| Distributable earnings | 7,237,042 |
| Net Assets | $183,763,316 |
| Class A Shares | |
| Net Assets | $ 2,340,481 |
| Shares Outstanding | 222,662 |
Net Asset Value and Redemption Price Per Share
(net assets ÷ shares of beneficial interest outstanding) | $ 10.51 |
Maximum Offering Price Per Share
(100 ÷ 94.75 of net asset value per share) | $ 11.09 |
| Class I Shares | |
| Net Assets | $ 181,422,835 |
| Shares Outstanding | 17,147,968 |
Net Asset Value, Offering Price and Redemption Price Per Share
(net assets ÷ shares of beneficial interest outstanding) | $ 10.58 |
| On sales of $50,000 or more, the offering price of Class A shares is reduced. |
8
See Notes to Financial Statements.
Eaton Vance
Emerging and Frontier Countries Equity Fund
October 31, 2022
| | Year Ended |
| | October 31, 2022 |
| Investment Income | |
| Dividend income allocated from Portfolio (net of foreign taxes withheld of $560,525) | $ 6,377,032 |
| Interest income allocated from Portfolio (net of foreign taxes withheld of $6) | 17,351 |
| Expenses allocated from Portfolio | (2,340,490) |
| Total investment income from Portfolio | $ 4,053,893 |
| Expenses | |
| Distribution and service fees: | |
| Class A | $ 3,786 |
| Trustees’ fees and expenses | 499 |
| Custodian fee | 23,357 |
| Transfer and dividend disbursing agent fees | 134,559 |
| Legal and accounting services | 43,639 |
| Printing and postage | 12,845 |
| Registration fees | 45,240 |
| Miscellaneous | 8,690 |
| Total expenses | $ 272,615 |
| Deduct: | |
| Waiver and/or reimbursement of expenses by affiliate | $ 164,141 |
| Total expense reductions | $ 164,141 |
| Net expenses | $ 108,474 |
| Net investment income | $ 3,945,419 |
| Realized and Unrealized Gain (Loss) from Portfolio | |
| Net realized gain (loss): | |
| Investment transactions (net of foreign capital gains taxes of $82) | $ (219,535) |
| Futures contracts | (3,342,016) |
| Swap contracts | 246,142 |
| Foreign currency transactions | (988,019) |
| Forward foreign currency exchange contracts | 2,759,239 |
| Net realized loss | $ (1,544,189) |
| Change in unrealized appreciation (depreciation): | |
| Investments (including net increase in accrued foreign capital gains taxes of $10,898) | $ (38,842,504) |
| Futures contracts | 133,371 |
| Swap contracts | (80,033) |
| Foreign currency | 10,530 |
| Forward foreign currency exchange contracts | 2,196,566 |
| Net change in unrealized appreciation (depreciation) | $(36,582,070) |
| Net realized and unrealized loss | $(38,126,259) |
| Net decrease in net assets from operations | $(34,180,840) |
9
See Notes to Financial Statements.
Eaton Vance
Emerging and Frontier Countries Equity Fund
October 31, 2022
Statements of Changes in Net Assets
| | Year Ended October 31, |
| | 2022 | 2021 |
| Increase (Decrease) in Net Assets | | |
| From operations: | | |
| Net investment income | $ 3,945,419 | $ 1,583,814 |
| Net realized gain (loss) | (1,544,189) | 24,455,539 |
| Net change in unrealized appreciation (depreciation) | (36,582,070) | 24,471,496 |
| Net increase (decrease) in net assets from operations | $ (34,180,840) | $ 50,510,849 |
| Distributions to shareholders: | | |
| Class A | $ (30,411) | $ — |
| Class I | (5,228,045) | (176,518) |
| Total distributions to shareholders | $ (5,258,456) | $ (176,518) |
| Transactions in shares of beneficial interest: | | |
| Class A | $ 1,245,692 | $ (675,039) |
| Class I | 31,510,639 | (4,693,322) |
| Net increase (decrease) in net assets from Fund share transactions | $ 32,756,331 | $ (5,368,361) |
| Net increase (decrease) in net assets | $ (6,682,965) | $ 44,965,970 |
| Net Assets | | |
| At beginning of year | $ 190,446,281 | $ 145,480,311 |
| At end of year | $183,763,316 | $190,446,281 |
10
See Notes to Financial Statements.
Eaton Vance
Emerging and Frontier Countries Equity Fund
October 31, 2022
| | Class A |
| | Year Ended October 31, |
| | 2022 | 2021 | 2020 | 2019 | 2018 |
| Net asset value — Beginning of year | $ 12.990 | $ 9.610 | $10.100 | $ 9.700 | $10.950 |
| Income (Loss) From Operations | | | | | |
| Net investment income(1) | $ 0.221 | $ 0.073 | $ 0.040 | $ 0.091 | $ 0.068 |
| Net realized and unrealized gain (loss) | (2.387) | 3.307 | (0.349) | 0.571 | (1.318) |
| Total income (loss) from operations | $ (2.166) | $ 3.380 | $ (0.309) | $ 0.662 | $ (1.250) |
| Less Distributions | | | | | |
| From net investment income | $ (0.096) | $ — | $ (0.181) | $ (0.262) | $ — |
| From net realized gain | (0.218) | — | — | — | — |
| Total distributions | $ (0.314) | $ — | $ (0.181) | $ (0.262) | $ — |
| Net asset value — End of year | $10.510 | $12.990 | $ 9.610 | $10.100 | $ 9.700 |
| Total Return(2) | (17.13)% (3) | 35.17% | (3.20)% (3) | 7.05% (3) | (11.42)% (3) |
| Ratios/Supplemental Data | | | | | |
| Net assets, end of year (000’s omitted) | $ 2,340 | $ 1,387 | $ 1,572 | $ 2,328 | $ 2,657 |
| Ratios (as a percentage of average daily net assets):(4) | | | | | |
| Expenses | 1.56% (3)(5) | 1.64% | 1.65% (3) | 1.66% (3)(6) | 1.65% (3) |
| Net investment income | 1.90% | 0.60% | 0.43% | 0.91% | 0.62% |
| Portfolio Turnover of the Portfolio | 67% | 70% | 44% | 43% | 39% |
| (1) | Computed using average shares outstanding. |
| (2) | Returns are historical and are calculated by determining the percentage change in net asset value with all distributions reinvested and do not reflect the effect of sales charges. |
| (3) | The investment adviser reimbursed certain operating expenses (equal to 0.09%, 0.08%, 0.07% and 0.02% of average daily net assets for the years ended October 31, 2022, 2020, 2019 and 2018, respectively). Absent this reimbursement, total return would be lower. |
| (4) | Includes the Fund’s share of the Portfolio’s allocated expenses. |
| (5) | Includes a reduction by the investment adviser of a portion of the Portfolio's adviser fee due to the Portfolio’s investment in the Liquidity Fund (equal to less than 0.005% of average daily net assets for the year ended October 31, 2022). |
| (6) | Includes interest expense of 0.01% of average daily net assets for the year ended October 31, 2019. |
11
See Notes to Financial Statements.
Eaton Vance
Emerging and Frontier Countries Equity Fund
October 31, 2022
Financial Highlights — continued
| | Class I |
| | Year Ended October 31, |
| | 2022 | 2021 | 2020 | 2019 | 2018 |
| Net asset value — Beginning of year | $ 13.080 | $ 9.660 | $ 10.150 | $ 9.740 | $ 10.980 |
| Income (Loss) From Operations | | | | | |
| Net investment income(1) | $ 0.252 | $ 0.111 | $ 0.067 | $ 0.117 | $ 0.092 |
| Net realized and unrealized gain (loss) | (2.398) | 3.321 | (0.348) | 0.572 | (1.332) |
| Total income (loss) from operations | $ (2.146) | $ 3.432 | $ (0.281) | $ 0.689 | $ (1.240) |
| Less Distributions | | | | | |
| From net investment income | $ (0.136) | $ (0.012) | $ (0.209) | $ (0.279) | $ — |
| From net realized gain | (0.218) | — | — | — | — |
| Total distributions | $ (0.354) | $ (0.012) | $ (0.209) | $ (0.279) | $ — |
| Net asset value — End of year | $ 10.580 | $ 13.080 | $ 9.660 | $ 10.150 | $ 9.740 |
| Total Return(2) | (16.91)% (3) | 35.54% | (2.93)% (3) | 7.31% (3) | (11.29)% (3) |
| Ratios/Supplemental Data | | | | | |
| Net assets, end of year (000’s omitted) | $181,423 | $189,060 | $143,908 | $176,468 | $159,428 |
| Ratios (as a percentage of average daily net assets):(4) | | | | | |
| Expenses | 1.31% (3)(5) | 1.39% | 1.40% (3) | 1.41% (3)(6) | 1.40% (3) |
| Net investment income | 2.12% | 0.89% | 0.71% | 1.17% | 0.82% |
| Portfolio Turnover of the Portfolio | 67% | 70% | 44% | 43% | 39% |
| (1) | Computed using average shares outstanding. |
| (2) | Returns are historical and are calculated by determining the percentage change in net asset value with all distributions reinvested. |
| (3) | The investment adviser reimbursed certain operating expenses (equal to 0.09%, 0.08%, 0.07% and 0.02% of average daily net assets for the years ended October 31, 2022, 2020, 2019 and 2018, respectively). Absent this reimbursement, total return would be lower. |
| (4) | Includes the Fund’s share of the Portfolio’s allocated expenses. |
| (5) | Includes a reduction by the investment adviser of a portion of the Portfolio's adviser fee due to the Portfolio’s investment in the Liquidity Fund (equal to less than 0.005% of average daily net assets for the year ended October 31, 2022). |
| (6) | Includes interest expense of 0.01% of average daily net assets for the year ended October 31, 2019. |
12
See Notes to Financial Statements.
Eaton Vance
Emerging and Frontier Countries Equity Fund
October 31, 2022
Notes to Financial Statements
1 Significant Accounting Policies
Eaton Vance Emerging and Frontier Countries Equity Fund (the Fund) is a non-diversified series of Eaton Vance Mutual Funds Trust (the Trust). The Trust is a Massachusetts business trust registered under the Investment Company Act of 1940, as amended (the 1940 Act), as an open-end management investment company. The Fund offers two classes of shares. Class A shares are generally sold subject to a sales charge imposed at time of purchase. Class I shares are sold at net asset value and are not subject to a sales charge. Each class represents a pro-rata interest in the Fund, but votes separately on class-specific matters and (as noted below) is subject to different expenses. Realized and unrealized gains and losses and net investment income and losses, other than class-specific expenses, are allocated daily to each class of shares based on the relative net assets of each class to the total net assets of the Fund. Each class of shares differs in its distribution plan and certain other class-specific expenses. The Fund invests substantially all of its investable assets in interests in Global Macro Capital Opportunities Portfolio (the Portfolio), a Massachusetts business trust, having the same investment objective and policies as the Fund. The value of the Fund’s investment in the Portfolio reflects the Fund’s proportionate interest in the net assets of the Portfolio (99.9% at October 31, 2022). The performance of the Fund is directly affected by the performance of the Portfolio. The financial statements of the Portfolio, including the portfolio of investments, are included elsewhere in this report and should be read in conjunction with the Fund’s financial statements.
The following is a summary of significant accounting policies of the Fund. The policies are in conformity with accounting principles generally accepted in the United States of America (U.S. GAAP). The Fund is an investment company and follows accounting and reporting guidance in the Financial Accounting Standards Board (FASB) Accounting Standards Codification Topic 946.
A Investment Valuation— Valuation of securities by the Portfolio is discussed in Note 1A of the Portfolio's Notes to Financial Statements, which are included elsewhere in this report.
B Income—The Fund's net investment income or loss consists of the Fund's pro-rata share of the net investment income or loss of the Portfolio, less all actual and accrued expenses of the Fund.
C Federal and Other Taxes—The Fund’s policy is to comply with the provisions of the Internal Revenue Code applicable to regulated investment companies and to distribute to shareholders each year substantially all of its net investment income, and all or substantially all of its net realized capital gains. Accordingly, no provision for federal income or excise tax is necessary.
In addition to the requirements of the Internal Revenue Code, the Fund may also be required to recognize its pro-rata share of the capital gains taxes incurred by the Portfolio. In doing so, the daily net asset value would reflect the Fund’s pro-rata share of the estimated reserve for such taxes incurred by the Portfolio.
As of October 31, 2022, the Fund had no uncertain tax positions that would require financial statement recognition, de-recognition, or disclosure. The Fund files a U.S. federal income tax return annually after its fiscal year-end, which is subject to examination by the Internal Revenue Service for a period of three years from the date of filing.
D Expenses—The majority of expenses of the Trust are directly identifiable to an individual fund. Expenses which are not readily identifiable to a specific fund are allocated taking into consideration, among other things, the nature and type of expense and the relative size of the funds.
E Use of Estimates—The preparation of the financial statements in conformity with U.S. GAAP requires management to make estimates and assumptions that affect the reported amounts of assets and liabilities at the date of the financial statements and the reported amounts of income and expense during the reporting period. Actual results could differ from those estimates.
F Indemnifications—Under the Trust's organizational documents, its officers and Trustees may be indemnified against certain liabilities and expenses arising out of the performance of their duties to the Fund. Under Massachusetts law, if certain conditions prevail, shareholders of a Massachusetts business trust (such as the Fund) could be deemed to have personal liability for the obligations of the Fund. However, the Fund’s Declaration of Trust contains an express disclaimer of liability on the part of Fund shareholders and the By-laws provide that the Fund shall assume, upon request by the shareholder, the defense on behalf of any Fund shareholders. Moreover, the By-laws also provide for indemnification out of Fund property of any shareholder held personally liable solely by reason of being or having been a shareholder for all loss or expense arising from such liability. Additionally, in the normal course of business, the Fund enters into agreements with service providers that may contain indemnification clauses. The Fund’s maximum exposure under these arrangements is unknown as this would involve future claims that may be made against the Fund that have not yet occurred.
G Other—Investment transactions are accounted for on a trade date basis.
Eaton Vance
Emerging and Frontier Countries Equity Fund
October 31, 2022
Notes to Financial Statements — continued
2 Distributions to Shareholders and Income Tax Information
It is the present policy of the Fund to make at least one distribution annually (normally in December) of all or substantially all of its net investment income and to distribute annually all or substantially all of its net realized capital gains. Distributions to shareholders are recorded on the ex-dividend date. Distributions are declared separately for each class of shares. Shareholders may reinvest income and capital gain distributions in additional shares of the same class of the Fund at the net asset value as of the ex-dividend date or, at the election of the shareholder, receive distributions in cash. Distributions to shareholders are determined in accordance with income tax regulations, which may differ from U.S. GAAP. As required by U.S. GAAP, only distributions in excess of tax basis earnings and profits are reported in the financial statements as a return of capital. Permanent differences between book and tax accounting relating to distributions are reclassified to paid-in capital. For tax purposes, distributions from short-term capital gains are considered to be from ordinary income.
The tax character of distributions declared for the years ended October 31, 2022 and October 31, 2021 was as follows:
| | Year Ended October 31, |
| | 2022 | 2021 |
| Ordinary income | $2,016,467 | $176,518 |
| Long-term capital gains | $3,241,989 | $ — |
As of October 31, 2022, the components of distributable earnings (accumulated loss) on a tax basis were as follows:
| Undistributed ordinary income | $ 10,197,769 |
| Deferred capital losses | (3,489,455) |
| Net unrealized appreciation | 528,728 |
| Distributable earnings | $ 7,237,042 |
At October 31, 2022, the Fund, for federal income tax purposes, had deferred capital losses of $3,489,455 which would reduce its taxable income arising from future net realized gains on investment transactions, if any, to the extent permitted by the Internal Revenue Code, and thus would reduce the amount of distributions to shareholders, which would otherwise be necessary to relieve the Fund of any liability for federal income or excise tax. The deferred capital losses are treated as arising on the first day of the Fund’s next taxable year and retain the same short-term or long-term character as when originally deferred. Of the deferred capital losses at October 31, 2022, $3,489,455 are short-term.
3 Investment Adviser Fee and Other Transactions with Affiliates
The investment adviser fee is earned by Eaton Vance Management (EVM), an indirect, wholly-owned subsidiary of Morgan Stanley, as compensation for investment advisory services rendered to the Fund. The investment adviser fee is computed at an annual rate as a percentage of the Fund’s average daily net assets that are not invested in other investment companies for which EVM or its affiliates serve as investment adviser and receive an advisory fee as follows and is payable monthly:
| Average Daily Net Assets | Annual Fee Rate |
| Up to $500 million | 1.000% |
| $500 million but less than $1 billion | 0.950% |
| $1 billion but less than $2.5 billion | 0.925% |
| $2.5 billion but less than $5 billion | 0.900% |
| $5 billion and over | 0.880% |
For the year ended October 31, 2022, the Fund incurred no investment adviser fee on such assets. To the extent the Fund’s assets are invested in the Portfolio, the Fund is allocated its share of the Portfolio’s investment adviser fee. The Portfolio has engaged Boston Management and Research (BMR) to render investment advisory services. See Note 2 of the Portfolio’s Notes to Financial Statements which are included elsewhere in this report. EVM also serves as the administrator of the Fund, but receives no compensation. EVM has agreed to reimburse the Fund’s expenses to the extent that total annual operating expenses (relating to ordinary operating expenses only and excluding such expenses as brokerage commissions, acquired fund fees of unaffiliated
Eaton Vance
Emerging and Frontier Countries Equity Fund
October 31, 2022
Notes to Financial Statements — continued
funds, borrowing costs, taxes or litigation expenses) exceed 1.40% and 1.15% (1.65% and 1.40% for Class A and Class I, respectively, prior to July 1, 2022) of the Fund’s average daily net assets for Class A and Class I, respectively. This agreement may be changed or terminated after February 28, 2023. Pursuant to this agreement, $164,141 operating expenses were allocated to EVM for the year ended October 31, 2022.
EVM provides sub-transfer agency and related services to the Fund pursuant to a Sub-Transfer Agency Support Services Agreement. For the year ended October 31, 2022, EVM earned $2,919 from the Fund pursuant to such agreement, which is included in transfer and dividend disbursing agent fees on the Statement of Operations. The Fund was informed that Eaton Vance Distributors, Inc. (EVD), an affiliate of EVM and the Fund’s principal underwriter, received less than $100 as its portion of the sales charge on sales of Class A shares for the year ended October 31, 2022. EVD also received distribution and service fees from Class A shares (see Note 4).
Trustees and officers of the Fund who are members of EVM’s or BMR's organizations receive remuneration for their services to the Fund out of the investment adviser fee. Certain officers and Trustees of the Fund and the Portfolio are officers of the above organizations.
4 Distribution Plan
The Fund has in effect a distribution plan for Class A shares (Class A Plan) pursuant to Rule 12b-1 under the 1940 Act. Pursuant to the Class A Plan, the Fund pays EVD a distribution and service fee of 0.25% per annum of its average daily net assets attributable to Class A shares for distribution services and facilities provided to the Fund by EVD, as well as for personal services and/or the maintenance of shareholder accounts. Distribution and service fees paid or accrued to EVD for the year ended October 31, 2022 amounted to $3,786 for Class A shares.
Distribution and service fees are subject to the limitations contained in the Financial Industry Regulatory Authority Rule 2341(d).
5 Contingent Deferred Sales Charges
Class A shares may be subject to a 1% contingent deferred sales charge (CDSC) if redeemed within 12 months (18 months prior to April 29, 2022) of purchase (depending on the circumstances of purchase). Generally, the CDSC is based upon the lower of the net asset value at date of redemption or date of purchase. No charge is levied on shares acquired by reinvestment of dividends or capital gain distributions. For the year ended October 31, 2022, the Fund was informed that EVD received no CDSCs paid by Class A shareholders.
6 Investment Transactions
For the year ended October 31, 2022, increases and decreases in the Fund’s investment in the Portfolio aggregated $40,153,386 and $12,951,136, respectively.
7 Shares of Beneficial Interest
The Fund’s Declaration of Trust permits the Trustees to issue an unlimited number of full and fractional shares of beneficial interest (without par value). Such shares may be issued in a number of different series (such as the Fund) and classes. Transactions in Fund shares, including direct exchanges pursuant to share class conversions for all periods presented, were as follows:
| | Year Ended
October 31, 2022 | | Year Ended
October 31, 2021 |
| | Shares | Amount | | Shares | Amount |
| Class A | | | | | |
| Sales | 144,260 | $ 1,595,090 | | 35,058 | $ 426,775 |
| Issued to shareholders electing to receive payments of distributions in Fund shares | 2,259 | 29,187 | | — | — |
| Redemptions | (30,591) | (378,585) | | (91,969) | (1,101,814) |
| Net increase (decrease) | 115,928 | $ 1,245,692 | | (56,911) | $ (675,039) |
Eaton Vance
Emerging and Frontier Countries Equity Fund
October 31, 2022
Notes to Financial Statements — continued
| | Year Ended
October 31, 2022 | | Year Ended
October 31, 2021 |
| | Shares | Amount | | Shares | Amount |
| Class I | | | | | |
| Sales | 4,906,903 | $ 57,594,274 | | 2,394,974 | $ 29,875,775 |
| Issued to shareholders electing to receive payments of distributions in Fund shares | 402,704 | 5,227,095 | | 15,175 | 176,330 |
| Redemptions | (2,618,985) | (31,310,730) | | (2,854,703) | (34,745,427) |
| Net increase (decrease) | 2,690,622 | $ 31,510,639 | | (444,554) | $ (4,693,322) |
At October 31, 2022, donor advised and pooled income funds (established and maintained by a public charity) managed by EVM owned in the aggregate 17.2% of the value of the outstanding shares of the Fund.
Eaton Vance
Emerging and Frontier Countries Equity Fund
October 31, 2022
Report of Independent Registered Public Accounting Firm
To the Trustees of Eaton Vance Mutual Funds Trust and Shareholders of Eaton Vance Emerging and Frontier Countries Equity Fund:
Opinion on the Financial Statements and Financial Highlights
We have audited the accompanying statement of assets and liabilities of Eaton Vance Emerging and Frontier Countries Equity Fund (the “Fund”) (one of the funds constituting Eaton Vance Mutual Funds Trust), as of October 31, 2022, the related statement of operations for the year then ended, the statements of changes in net assets for each of the two years in the period then ended, the financial highlights for each of the five years in the period then ended, and the related notes. In our opinion, the financial statements and financial highlights present fairly, in all material respects, the financial position of the Fund as of October 31, 2022, and the results of its operations for the year then ended, the changes in its net assets for each of the two years in the period then ended, and the financial highlights for each of the five years in the period then ended, in conformity with accounting principles generally accepted in the United States of America.
Basis for Opinion
These financial statements and financial highlights are the responsibility of the Fund's management. Our responsibility is to express an opinion on the Fund's financial statements and financial highlights based on our audits. We are a public accounting firm registered with the Public Company Accounting Oversight Board (United States) (PCAOB) and are required to be independent with respect to the Fund in accordance with the U.S. federal securities laws and the applicable rules and regulations of the Securities and Exchange Commission and the PCAOB.
We conducted our audits in accordance with the standards of the PCAOB. Those standards require that we plan and perform the audit to obtain reasonable assurance about whether the financial statements and financial highlights are free of material misstatement, whether due to error or fraud. The Fund is not required to have, nor were we engaged to perform, an audit of its internal control over financial reporting. As part of our audits, we are required to obtain an understanding of internal control over financial reporting but not for the purpose of expressing an opinion on the effectiveness of the Fund’s internal control over financial reporting. Accordingly, we express no such opinion.
Our audits included performing procedures to assess the risks of material misstatement of the financial statements and financial highlights, whether due to error or fraud, and performing procedures that respond to those risks. Such procedures included examining, on a test basis, evidence regarding the amounts and disclosures in the financial statements and financial highlights. Our audits also included evaluating the accounting principles used and significant estimates made by management, as well as evaluating the overall presentation of the financial statements and financial highlights. We believe that our audits provide a reasonable basis for our opinion.
/s/ Deloitte & Touche LLP
Boston, Massachusetts
December 20, 2022
We have served as the auditor of one or more Eaton Vance investment companies since 1959.
Eaton Vance
Emerging and Frontier Countries Equity Fund
October 31, 2022
Federal Tax Information (Unaudited)
The Form 1099-DIV you receive in February 2023 will show the tax status of all distributions paid to your account in calendar year 2022. Shareholders are advised to consult their own tax adviser with respect to the tax consequences of their investment in the Fund. As required by the Internal Revenue Code and/or regulations, shareholders must be notified regarding the status of qualified dividend income for individuals, the foreign tax credit and 163(j) interest dividends.
Qualified Dividend Income. For the fiscal year ended October 31, 2022, the Fund designates approximately $3,278,874, or up to the maximum amount of such dividends allowable pursuant to the Internal Revenue Code, as qualified dividend income eligible for the reduced tax rate of 15%.
Foreign Tax Credit. For the fiscal year ended October 31, 2022, the Fund paid foreign taxes of $545,250 and recognized foreign source income of $6,863,682.
163(j) Interest Dividends. For the fiscal year ended October 31, 2022, the Fund designates 69.03% of distributions from net investment income as a 163(j) interest dividend.
Global Macro Capital Opportunities Portfolio
October 31, 2022
| Security | Shares | Value |
| Brazil — 10.1% |
| AMBEV S.A. | | 238,842 | $ 739,807 |
| B3 S.A. - Brasil Bolsa Balcao | | 335,425 | 976,632 |
| Banco Bradesco S.A. | | 95,480 | 307,577 |
| Banco Bradesco S.A., PFC Shares | | 284,006 | 1,091,929 |
| Banco BTG Pactual S.A. | | 67,300 | 377,052 |
| Banco do Brasil S.A. | | 49,200 | 352,606 |
| BB Seguridade Participacoes S.A. | | 43,679 | 251,056 |
| Centrais Eletricas Brasilier | | 54,415 | 524,819 |
| Cia Energetica de Minas Gerais, PFC Shares | | 96,795 | 213,060 |
| Cosan S.A. | | 69,843 | 227,965 |
| Equatorial Energia S.A. | | 59,500 | 345,907 |
| Gerdau S.A., PFC Shares | | 66,452 | 331,263 |
| Hapvida Participacoes e Investimentos S.A.(1) | | 506,334 | 764,574 |
| Itau Unibanco Holding S.A., PFC Shares | | 257,375 | 1,514,703 |
| Itausa S.A., PFC Shares | | 247,640 | 514,888 |
| JBS S.A. | | 49,280 | 238,124 |
| Klabin S.A. | | 47,400 | 198,391 |
| Localiza Rent a Car S.A. | | 38,651 | 527,818 |
| Localiza Rent a Car S.A.(2) | | 118 | 1,611 |
| Lojas Renner S.A. | | 60,200 | 360,116 |
| Magazine Luiza S.A.(2) | | 121,800 | 105,400 |
| Natura & Co. Holding S.A. | | 56,300 | 162,944 |
| Petro Rio S.A.(2) | | 47,211 | 323,453 |
| Petroleo Brasileiro S.A. | | 201,527 | 1,297,607 |
| Petroleo Brasileiro S.A., PFC Shares | | 256,759 | 1,481,751 |
| Raia Drogasil S.A. | | 65,200 | 332,090 |
| Rede D'Or Sao Luiz S.A.(1) | | 25,300 | 157,565 |
| Rumo S.A. | | 80,500 | 345,033 |
| Suzano S.A. | | 41,597 | 428,412 |
| Telefonica Brasil S.A. | | 29,800 | 238,319 |
| TOTVS S.A. | | 35,029 | 224,869 |
| Vale S.A. | | 209,039 | 2,716,637 |
| Vibra Energia S.A. | | 68,000 | 240,248 |
| Weg S.A. | | 84,700 | 660,481 |
| | | | $ 18,574,707 |
| Bulgaria — 0.9% |
| Eurohold Bulgaria AD(2) | | 1,613,493 | $ 1,573,987 |
| | | | $ 1,573,987 |
| China — 7.2% |
| Agricultural Bank of China, Ltd., Class H | | 359,000 | $ 102,471 |
| Alibaba Group Holding, Ltd.(2) | | 142,000 | 1,104,037 |
| Alibaba Health Information Technology, Ltd.(2) | | 72,000 | 30,471 |
| Security | Shares | Value |
| China (continued) |
| Aluminum Corp. of China, Ltd., Class H | | 72,000 | $ 20,526 |
| Anhui Conch Cement Co., Ltd., Class H | | 27,500 | 70,783 |
| ANTA Sports Products, Ltd. | | 13,800 | 121,324 |
| Bank of China, Ltd., Class H | | 821,000 | 264,425 |
| Bank of Communications, Ltd., Class H | | 188,000 | 91,729 |
| BYD Co., Ltd., Class A | | 2,900 | 98,192 |
| BYD Co., Ltd., Class H | | 8,500 | 190,427 |
| China CITIC Bank Corp., Ltd., Class H | | 227,000 | 85,569 |
| China Conch Venture Holdings, Ltd. | | 40,500 | 59,733 |
| China Construction Bank Corp., Class H | | 940,000 | 498,847 |
| China Gas Holdings, Ltd. | | 76,400 | 67,803 |
| China Hongqiao Group, Ltd. | | 37,000 | 26,187 |
| China International Capital Corp., Ltd., Class H(1) | | 22,400 | 31,130 |
| China Life Insurance Co., Ltd., Class H | | 88,000 | 95,960 |
| China Longyuan Power Group Corp., Ltd., Class H | | 72,000 | 82,272 |
| China Mengniu Dairy Co., Ltd.(2) | | 36,000 | 115,241 |
| China Merchants Bank Co., Ltd., Class A | | 26,900 | 99,246 |
| China Merchants Bank Co., Ltd., Class H | | 42,500 | 139,141 |
| China Merchants Port Holdings Co., Ltd. | | 50,000 | 58,620 |
| China National Building Material Co., Ltd., Class H | | 102,000 | 59,228 |
| China Overseas Land & Investment, Ltd. | | 49,000 | 93,635 |
| China Pacific Insurance (Group) Co., Ltd., Class H | | 64,200 | 103,490 |
| China Petroleum & Chemical Corp., Class H | | 298,000 | 118,105 |
| China Power International Development, Ltd. | | 91,000 | 26,298 |
| China Resources Beer Holdings Co., Ltd. | | 18,000 | 84,934 |
| China Resources Gas Group, Ltd. | | 26,000 | 66,590 |
| China Resources Land, Ltd. | | 38,000 | 118,894 |
| China Resources Mixc Lifestyle Services, Ltd.(1) | | 17,800 | 52,125 |
| China Resources Power Holdings Co., Ltd. | | 54,000 | 78,466 |
| China Shenhua Energy Co., Ltd., Class H | | 42,000 | 110,328 |
| China State Construction International Holdings, Ltd. | | 36,000 | 32,385 |
| China Tourism Group Duty Free Corp., Ltd., Class A | | 3,400 | 74,709 |
| China Tower Corp., Ltd., Class H(1) | | 1,082,000 | 97,894 |
| China Vanke Co., Ltd., Class H | | 46,600 | 59,803 |
| China Yangtze Power Co., Ltd., Class A | | 35,900 | 99,907 |
| CITIC Securities Co., Ltd., Class H | | 61,000 | 91,143 |
| CITIC, Ltd. | | 132,000 | 118,119 |
| Contemporary Amperex Technology Co., Ltd., Class A | | 1,700 | 87,244 |
| COSCO SHIPPING Holdings Co., Ltd., Class H | | 75,000 | 80,825 |
| Country Garden Holdings Co., Ltd. | | 197,000 | 25,392 |
| Country Garden Services Holdings Co., Ltd. | | 41,000 | 35,835 |
| CSPC Pharmaceutical Group, Ltd. | | 110,000 | 112,988 |
| East Money Information Co., Ltd., Class A | | 26,200 | 56,165 |
| ENN Energy Holdings, Ltd. | | 9,300 | 92,461 |
| Foshan Haitian Flavouring & Food Co., Ltd., Class A | | 3,850 | 31,554 |
| Fosun International, Ltd. | | 43,500 | 26,583 |
19
See Notes to Financial Statements.
Global Macro Capital Opportunities Portfolio
October 31, 2022
Portfolio of Investments — continued
| Security | Shares | Value |
| China (continued) |
| Ganfeng Lithium Co., Ltd., Class H(1) | | 9,800 | $ 66,283 |
| Geely Automobile Holdings, Ltd. | | 70,000 | 75,333 |
| Genscript Biotech Corp.(2) | | 16,000 | 40,453 |
| Great Wall Motor Co., Ltd., Class H | | 79,500 | 86,846 |
| Guangdong Investment, Ltd. | | 84,000 | 52,960 |
| Guangzhou Automobile Group Co., Ltd., Class H | | 102,000 | 62,159 |
| Haier Smart Home Co., Ltd., Class H | | 51,400 | 128,653 |
| Hengan International Group Co., Ltd. | | 18,500 | 71,729 |
| Industrial & Commercial Bank of China, Ltd., Class A | | 66,000 | 37,569 |
| Industrial & Commercial Bank of China, Ltd., Class H | | 582,000 | 252,684 |
| Industrial Bank Co., Ltd., Class A | | 36,400 | 75,085 |
| Innovent Biologics, Inc.(1)(2) | | 34,000 | 120,382 |
| JD.com, Inc., Class A | | 19,750 | 359,658 |
| Kingboard Holdings, Ltd.(2) | | 10,500 | 25,921 |
| Kingdee International Software Group Co., Ltd.(2) | | 64,000 | 104,871 |
| Kingsoft Corp., Ltd. | | 27,200 | 82,365 |
| Kuaishou Technology(1)(2) | | 11,800 | 48,732 |
| Kunlun Energy Co., Ltd. | | 106,000 | 63,353 |
| Kweichow Moutai Co., Ltd., Class A | | 800 | 148,283 |
| Lenovo Group, Ltd. | | 158,000 | 126,275 |
| Li Ning Co., Ltd. | | 25,000 | 129,323 |
| Longfor Group Holdings, Ltd.(1) | | 35,500 | 45,234 |
| LONGi Green Energy Technology Co., Ltd., Class A | | 13,160 | 86,911 |
| Luzhou Laojiao Co., Ltd., Class A | | 2,900 | 62,207 |
| Meituan, Class B(1)(2) | | 36,100 | 577,980 |
| Muyuan Foods Co., Ltd., Class A | | 5,400 | 34,788 |
| NetEase, Inc. | | 21,200 | 235,219 |
| New China Life Insurance Co., Ltd., Class H | | 16,200 | 25,727 |
| Nongfu Spring Co., Ltd., Class H(1) | | 21,400 | 107,490 |
| People's Insurance Co. Group of China, Ltd., Class H | | 147,000 | 40,625 |
| PetroChina Co., Ltd., Class H | | 396,000 | 151,481 |
| PICC Property & Casualty Co., Ltd., Class H | | 144,000 | 132,813 |
| Ping An Bank Co., Ltd., Class A | | 20,100 | 28,533 |
| Ping An Insurance Group Co. of China, Ltd., Class A | | 16,200 | 80,434 |
| Ping An Insurance Group Co. of China, Ltd., Class H | | 64,000 | 256,217 |
| Postal Savings Bank of China Co., Ltd., Class H(1) | | 191,000 | 88,578 |
| Shandong Weigao Group Medical Polymer Co., Ltd., Class H | | 40,800 | 56,214 |
| Shanxi Xinghuacun Fen Wine Factory Co., Ltd., Class A | | 2,300 | 73,364 |
| Shenzhen Mindray Bio-Medical Electronics Co., Ltd., Class A | | 2,000 | 89,405 |
| Shenzhou International Group Holdings, Ltd. | | 16,000 | 111,088 |
| Silergy Corp. | | 8,000 | 92,253 |
| Sino Biopharmaceutical, Ltd. | | 232,000 | 112,575 |
| Sinopharm Group Co., Ltd., Class H | | 44,400 | 84,232 |
| Smoore International Holdings, Ltd.(1) | | 46,000 | 48,967 |
| Sunny Optical Technology Group Co., Ltd. | | 8,600 | 74,528 |
| Security | Shares | Value |
| China (continued) |
| Tencent Holdings, Ltd. | | 59,800 | $ 1,571,351 |
| Tingyi (Cayman Islands) Holding Corp. | | 54,000 | 84,407 |
| Tsingtao Brewery Co., Ltd., Class H | | 14,000 | 98,015 |
| Want Want China Holdings, Ltd. | | 132,000 | 86,709 |
| Weichai Power Co., Ltd., Class H | | 31,000 | 29,693 |
| Wharf Holdings, Ltd. | | 34,000 | 97,359 |
| Wuliangye Yibin Co., Ltd., Class A | | 5,200 | 95,309 |
| WuXi AppTec Co., Ltd., Class A | | 2,800 | 29,343 |
| WuXi AppTec Co., Ltd., Class H(1) | | 9,800 | 78,657 |
| WuXi Biologics Cayman, Inc.(1)(2) | | 36,500 | 164,237 |
| Xiaomi Corp., Class B(1)(2) | | 156,800 | 176,098 |
| Xinyi Solar Holdings, Ltd. | | 104,000 | 103,251 |
| Yankuang Energy Group Co., Ltd., Class H | | 40,000 | 112,461 |
| Zhongsheng Group Holdings, Ltd. | | 16,500 | 62,623 |
| Zijin Mining Group Co., Ltd., Class H | | 122,000 | 116,368 |
| | | | $ 13,250,895 |
| Cyprus — 3.9% |
| Bank of Cyprus Holdings PLC(2)(3) | | 45,800 | $ 64,602 |
| Bank of Cyprus Holdings PLC(2)(3) | | 4,912,529 | 7,047,341 |
| Galaxy Cosmos Mezz PLC(2) | | 87,536 | 14,135 |
| Sunrisemezz PLC(2) | | 104,410 | 8,451 |
| | | | $ 7,134,529 |
| Egypt — 0.1% |
| Taaleem Management Services Co. SAE(2) | | 1,147,699 | $ 170,740 |
| | | | $ �� 170,740 |
| Georgia — 6.4% |
| Bank of Georgia Group PLC | | 87,990 | $ 2,146,924 |
| Georgia Capital PLC(2) | | 638,176 | 4,570,963 |
| TBC Bank Group PLC | | 230,522 | 4,977,527 |
| | | | $ 11,695,414 |
| Greece — 12.8% |
| Alpha Services and Holdings S.A.(2) | | 2,363,462 | $ 2,188,790 |
| Athens Water Supply & Sewage Co. S.A. | | 45,738 | 325,674 |
| Eurobank Ergasias Services and Holdings S.A.(2) | | 2,708,650 | 2,673,985 |
| GEK Terna Holding Real Estate Construction S.A.(2) | | 60,645 | 577,312 |
| Hellenic Energy Holdings S.A. | | 64,933 | 443,912 |
| Hellenic Telecommunications Organization S.A. | | 211,741 | 3,325,296 |
| Holding Co. ADMIE IPTO S.A. | | 127,120 | 210,540 |
| JUMBO S.A. | | 120,639 | 1,713,505 |
| LAMDA Development S.A.(2) | | 75,271 | 456,047 |
| Motor Oil (Hellas) Corinth Refineries S.A. | | 64,576 | 1,109,869 |
| Mytilineos S.A. | | 104,888 | 1,758,784 |
20
See Notes to Financial Statements.
Global Macro Capital Opportunities Portfolio
October 31, 2022
Portfolio of Investments — continued
| Security | Shares | Value |
| Greece (continued) |
| National Bank of Greece S.A.(2) | | 575,615 | $ 2,085,611 |
| OPAP S.A. | | 205,387 | 2,516,637 |
| Piraeus Financial Holdings S.A.(2) | | 730,870 | 901,017 |
| Public Power Corp. S.A.(2) | | 220,255 | 1,390,287 |
| Sarantis S.A. | | 37,617 | 235,805 |
| Terna Energy S.A. | | 60,392 | 1,122,337 |
| Titan Cement International S.A. | | 45,809 | 511,929 |
| | | | $ 23,547,337 |
| India — 2.4% |
| Adani Enterprises, Ltd. | | 1,866 | $ 75,581 |
| Adani Green Energy, Ltd.(2) | | 2,292 | 58,389 |
| Adani Ports and Special Economic Zone, Ltd. | | 4,514 | 45,048 |
| Adani Total Gas, Ltd. | | 1,817 | 79,961 |
| Adani Transmission , Ltd.(2) | | 1,842 | 74,665 |
| Apollo Hospitals Enterprise, Ltd. | | 848 | 46,227 |
| Asian Paints, Ltd. | | 2,393 | 90,175 |
| Avenue Supermarts, Ltd.(1)(2) | | 1,162 | 60,733 |
| Axis Bank, Ltd. | | 12,918 | 141,665 |
| Bajaj Finance, Ltd. | | 1,547 | 133,758 |
| Bajaj Finserv, Ltd. | | 2,803 | 57,198 |
| Bharti Airtel, Ltd. | | 12,736 | 128,083 |
| Cipla, Ltd. | | 3,753 | 52,978 |
| Divi's Laboratories, Ltd. | | 1,088 | 47,436 |
| Dr. Reddy's Laboratories, Ltd. | | 932 | 50,096 |
| Eicher Motors, Ltd. | | 1,100 | 51,313 |
| Grasim Industries, Ltd. | | 2,220 | 46,364 |
| HCL Technologies, Ltd. | | 6,829 | 85,761 |
| HDFC Life Insurance Co., Ltd.(1) | | 7,502 | 49,031 |
| Hindalco Industries, Ltd. | | 10,552 | 51,676 |
| Hindustan Unilever, Ltd.(2) | | 4,450 | 137,702 |
| Housing Development Finance Corp., Ltd. | | 9,221 | 275,719 |
| ICICI Bank, Ltd. | | 27,268 | 299,838 |
| Infosys, Ltd. | | 17,637 | 329,062 |
| ITC, Ltd. | | 19,003 | 80,180 |
| JSW Steel, Ltd. | | 6,057 | 49,383 |
| Kotak Mahindra Bank, Ltd. | | 3,514 | 80,893 |
| Larsen & Toubro, Ltd. | | 4,245 | 104,360 |
| Mahindra & Mahindra, Ltd. | | 5,522 | 90,212 |
| Maruti Suzuki India, Ltd. | | 770 | 88,843 |
| Nestle India, Ltd. | | 247 | 60,757 |
| NTPC, Ltd. | | 28,513 | 59,808 |
| Power Grid Corp. of India, Ltd.(2) | | 22,616 | 62,235 |
| Reliance Industries, Ltd. | | 15,515 | 478,029 |
| SBI Life Insurance Co., Ltd.(1) | | 3,441 | 52,731 |
| State Bank of India | | 11,604 | 80,542 |
| Security | Shares | Value |
| India (continued) |
| Sun Pharmaceutical Industries, Ltd. | | 6,306 | $ 77,537 |
| Tata Consultancy Services, Ltd. | | 4,989 | 191,758 |
| Tata Consumer Products, Ltd. | | 4,771 | 44,440 |
| Tata Motors, Ltd.(2) | | 12,047 | 60,230 |
| Tata Steel, Ltd. | | 51,573 | 62,975 |
| Tech Mahindra, Ltd.(2) | | 4,348 | 55,922 |
| Titan Co., Ltd. | | 2,324 | 77,646 |
| UltraTech Cement, Ltd. | | 740 | 60,063 |
| Wipro, Ltd. | | 10,744 | 50,263 |
| | | | $ 4,437,266 |
| Indonesia — 8.3% |
| Adaro Energy Indonesia Tbk PT | | 2,190,000 | $ 558,710 |
| Astra International Tbk PT | | 2,663,400 | 1,138,152 |
| Bank Central Asia Tbk PT | | 6,818,000 | 3,854,061 |
| Bank Jago Tbk PT(2) | | 626,600 | 205,148 |
| Bank Mandiri Persero Tbk PT | | 2,376,000 | 1,605,114 |
| Bank Negara Indonesia Persero Tbk PT | | 1,073,000 | 646,947 |
| Bank Rakyat Indonesia Persero Tbk PT | | 8,524,484 | 2,543,136 |
| Barito Pacific Tbk PT | | 4,792,700 | 253,565 |
| Charoen Pokphand Indonesia Tbk PT | | 1,122,700 | 401,090 |
| Kalbe Farma Tbk PT | | 3,455,800 | 454,459 |
| Merdeka Copper Gold Tbk PT(2) | | 1,889,000 | 457,396 |
| Sumber Alfaria Trijaya Tbk PT | | 2,806,800 | 507,190 |
| Telkom Indonesia Persero Tbk PT | | 6,229,100 | 1,749,448 |
| Unilever Indonesia Tbk PT | | 1,221,400 | 363,372 |
| United Tractors Tbk PT | | 245,500 | 507,826 |
| | | | $ 15,245,614 |
| Kazakhstan — 1.9% |
| Halyk Savings Bank of Kazakhstan JSC GDR(2)(4) | | 52,200 | $ 527,220 |
| Kaspi.kz JSC GDR(4) | | 30,100 | 1,971,550 |
| NAC Kazatomprom JSC GDR(2)(4) | | 40,600 | 1,071,840 |
| | | | $ 3,570,610 |
| Lithuania — 1.2% |
| AB Ignitis Grupe GDR(4) | | 49,010 | $ 872,445 |
| Siauliu Bankas AB | | 2,442,564 | 1,381,186 |
| | | | $ 2,253,631 |
| Serbia — 0.5% |
| Metalac AD(2) | | 67,357 | $ 897,144 |
| | | | $ 897,144 |
| Slovenia — 2.3% |
| Nova Ljubljanska Banka dd(1) | | 61,521 | $ 3,281,466 |
21
See Notes to Financial Statements.
Global Macro Capital Opportunities Portfolio
October 31, 2022
Portfolio of Investments — continued
| Security | Shares | Value |
| Slovenia (continued) |
| Nova Ljubljanska Banka dd GDR(4) | | 60,052 | $ 610,562 |
| Petrol | | 930 | 395,590 |
| | | | $ 4,287,618 |
| South Korea — 9.6% |
| AMOREPACIFIC Corp. | | 1,140 | $ 74,016 |
| Celltrion Healthcare Co., Ltd. | | 2,946 | 143,333 |
| Celltrion, Inc. | | 2,896 | 389,277 |
| CJ CheilJedang Corp. | | 339 | 98,426 |
| Coway Co., Ltd. | | 2,186 | 84,764 |
| Doosan Enerbility Co., Ltd.(2) | | 13,566 | 125,871 |
| Ecopro BM Co., Ltd. | | 1,708 | 137,569 |
| Hana Financial Group, Inc. | | 9,769 | 282,435 |
| Hanwha Solutions Corp.(2) | | 4,550 | 150,371 |
| HLB, Inc.(2) | | 3,700 | 104,897 |
| HMM Co., Ltd. | | 9,451 | 126,425 |
| HYBE Co., Ltd.(2) | | 432 | 36,568 |
| Hyundai Engineering & Construction Co., Ltd. | | 3,379 | 82,608 |
| Hyundai Glovis Co., Ltd. | | 762 | 92,878 |
| Hyundai Mobis Co., Ltd. | | 1,909 | 292,801 |
| Hyundai Motor Co. | | 4,067 | 468,675 |
| Hyundai Steel Co. | | 2,500 | 49,195 |
| Kakao Corp. | | 9,381 | 332,789 |
| KakaoBank Corp.(2) | | 2,472 | 29,591 |
| KB Financial Group, Inc. | | 12,130 | 408,163 |
| Kia Corp. | | 7,832 | 363,959 |
| Korea Aerospace Industries, Ltd. | | 2,870 | 95,314 |
| Korea Electric Power Corp.(2) | | 9,138 | 107,157 |
| Korea Investment Holdings Co., Ltd. | | 1,239 | 43,010 |
| Korea Shipbuilding & Offshore Engineering Co., Ltd.(2) | | 1,746 | 88,944 |
| Korea Zinc Co., Ltd. | | 330 | 147,989 |
| Korean Air Lines Co., Ltd.(2) | | 6,673 | 108,063 |
| Krafton, Inc.(2) | | 869 | 107,943 |
| KT&G Corp. | | 3,555 | 238,759 |
| L&F Co., Ltd.(2) | | 839 | 132,217 |
| LG Chem, Ltd. | | 1,442 | 632,805 |
| LG Corp. | | 3,183 | 176,698 |
| LG Display Co., Ltd. | | 9,346 | 83,407 |
| LG Electronics, Inc. | | 3,428 | 195,808 |
| LG Energy Solution, Ltd.(2) | | 683 | 252,723 |
| LG H&H Co., Ltd. | | 316 | 112,901 |
| LG Innotek Co., Ltd. | | 522 | 108,296 |
| Lotte Chemical Corp. | | 493 | 51,084 |
| Naver Corp. | | 3,924 | 465,458 |
| NCSoft Corp. | | 575 | 157,078 |
| Pearl Abyss Corp.(2) | | 890 | 25,913 |
| Security | Shares | Value |
| South Korea (continued) |
| POSCO Chemical Co., Ltd. | | 1,169 | $ 163,226 |
| POSCO Holdings, Inc. | | 2,360 | 411,326 |
| Samsung Biologics Co., Ltd.(1)(2) | | 533 | 327,548 |
| Samsung C&T Corp. | | 2,715 | 225,376 |
| Samsung Electro-Mechanics Co., Ltd. | | 1,863 | 157,780 |
| Samsung Electronics Co., Ltd. | | 134,116 | 5,581,884 |
| Samsung Engineering Co., Ltd.(2) | | 6,765 | 113,011 |
| Samsung Fire & Marine Insurance Co., Ltd. | | 1,075 | 150,768 |
| Samsung Heavy Industries Co., Ltd.(2) | | 25,662 | 92,643 |
| Samsung Life Insurance Co., Ltd. | | 3,000 | 141,773 |
| Samsung SDI Co., Ltd. | | 1,581 | 815,662 |
| Samsung SDS Co., Ltd. | | 1,303 | 114,155 |
| Shinhan Financial Group Co., Ltd. | | 14,332 | 364,270 |
| SK Bioscience Co., Ltd.(2) | | 942 | 49,829 |
| SK Hynix, Inc. | | 15,615 | 903,976 |
| SK Innovation Co., Ltd.(2) | | 1,789 | 216,627 |
| SK Square Co., Ltd.(2) | | 3,831 | 99,054 |
| SK, Inc. | | 1,234 | 184,913 |
| S-Oil Corp. | | 1,757 | 106,535 |
| Woori Financial Group, Inc. | | 18,413 | 151,944 |
| Yuhan Corp. | | 2,351 | 98,575 |
| | | | $ 17,677,053 |
| Taiwan — 5.8% |
| ASE Technology Holding Co., Ltd. | | 73,358 | $ 181,132 |
| Asustek Computer, Inc. | | 17,000 | 124,291 |
| AUO Corp.(2) | | 183,200 | 95,609 |
| Cathay Financial Holding Co., Ltd. | | 161,087 | 188,521 |
| Chailease Holding Co., Ltd. | | 33,348 | 153,824 |
| China Steel Corp. | | 248,000 | 206,440 |
| Chunghwa Telecom Co., Ltd. | | 79,000 | 272,385 |
| CTBC Financial Holding Co., Ltd. | | 256,000 | 161,725 |
| Delta Electronics, Inc. | | 38,680 | 307,769 |
| E.Sun Financial Holding Co., Ltd. | | 189,462 | 136,160 |
| First Financial Holding Co., Ltd. | | 164,408 | 126,118 |
| Formosa Chemicals & Fibre Corp. | | 83,000 | 178,904 |
| Formosa Plastics Corp. | | 82,000 | 211,266 |
| Fubon Financial Holding Co., Ltd. | | 157,046 | 248,059 |
| Globalwafers Co., Ltd. | | 6,000 | 66,504 |
| Hon Hai Precision Industry Co., Ltd. | | 218,508 | 693,998 |
| Hotai Motor Co., Ltd. | | 8,000 | 144,739 |
| Hua Nan Financial Holdings Co., Ltd. | | 151,525 | 98,850 |
| Largan Precision Co., Ltd. | | 2,000 | 114,424 |
| MediaTek, Inc. | | 26,000 | 473,933 |
| Mega Financial Holding Co., Ltd. | | 158,875 | 147,189 |
| Nan Ya Plastics Corp. | | 108,000 | 228,835 |
22
See Notes to Financial Statements.
Global Macro Capital Opportunities Portfolio
October 31, 2022
Portfolio of Investments — continued
| Security | Shares | Value |
| Taiwan (continued) |
| Novatek Microelectronics Corp. | | 13,000 | $ 96,860 |
| Quanta Computer, Inc. | | 67,000 | 141,913 |
| Realtek Semiconductor Corp. | | 11,000 | 86,716 |
| Shin Kong Financial Holding Co., Ltd. | | 8,514 | 2,111 |
| Taishin Financial Holding Co., Ltd. | | 186,173 | 76,404 |
| Taiwan Cement Corp. | | 142,343 | 133,473 |
| Taiwan Cooperative Financial Holding Co., Ltd. | | 155,604 | 120,564 |
| Taiwan Semiconductor Manufacturing Co., Ltd. | | 392,000 | 4,712,704 |
| Uni-President Enterprises Corp. | | 108,960 | 221,272 |
| United Microelectronics Corp. | | 221,000 | 265,744 |
| Yuanta Financial Holding Co., Ltd. | | 249,694 | 152,465 |
| | | | $ 10,570,901 |
| United Arab Emirates — 11.7% |
| Abu Dhabi Commercial Bank PJSC | | 661,924 | $ 1,703,902 |
| Abu Dhabi Islamic Bank PJSC | | 321,170 | 830,996 |
| Abu Dhabi National Oil Co. for Distribution PJSC | | 647,100 | 795,272 |
| Al Yah Satellite Communications Co. PJSC (Yahsat) | | 4,224,438 | 3,150,241 |
| Aldar Properties PJSC | | 1,008,500 | 1,186,269 |
| Aramex PJSC | | 852,000 | 842,590 |
| Dubai Electricity & Water Authority PJSC | | 3,264,287 | 2,169,156 |
| Dubai Islamic Bank PJSC | | 423,067 | 670,255 |
| Emaar Properties PJSC | | 1,012,900 | 1,672,049 |
| Emirates Telecommunications Group Co. PJSC | | 440,000 | 3,092,345 |
| First Abu Dhabi Bank PJSC | | 652,654 | 3,182,835 |
| National Central Cooling Co. PJSC | | 1,342,340 | 1,163,284 |
| Ras Al Khaimah Ceramics | | 1,240,700 | 972,664 |
| | | | $ 21,431,858 |
| Uruguay — 0.1% |
| dLocal, Ltd.(2) | | 10,000 | $ 223,000 |
| | | | $ 223,000 |
| Vietnam — 9.2% |
| Bao Viet Holdings | | 177,200 | $ 374,255 |
| FPT Corp. | | 1,251,279 | 4,073,177 |
| Gelex Group JSC | | 528,300 | 285,599 |
| Hoa Sen Group(2) | | 684,800 | 313,993 |
| Hoang Huy Investment Financial Services JSC | | 845,200 | 271,580 |
| Masan Group Corp. | | 99,900 | 343,442 |
| Mobile World Investment Corp. | | 1,041,098 | 2,313,123 |
| Nam Kim Steel JSC | | 534,800 | 291,427 |
| No Va Land Investment Group Corp.(2) | | 7,524 | 21,191 |
| Phat Dat Real Estate Development Corp.(2) | | 3,271 | 5,747 |
| Phu Nhuan Jewelry JSC | | 568,400 | 2,433,690 |
| Refrigeration Electrical Engineering Corp. | | 547,655 | 1,862,909 |
| Security | Shares | Value |
| Vietnam (continued) |
| Vietnam Construction and Import-Export JSC | | 485,300 | $ 311,294 |
| Vietnam National Petroleum Group(2) | | 269,100 | 308,270 |
| Vietnam Prosperity JSC Bank(2) | | 2,687,038 | 1,891,686 |
| Vietnam Rubber Group, Ltd. | | 486,700 | 282,245 |
| Vietnam Technological & Commercial Joint Stock Bank(2) | | 1,388,000 | 1,470,219 |
| | | | $ 16,853,847 |
Total Common Stocks
(identified cost $171,580,178) | | | $173,396,151 |
| Security | Shares | Value |
| South Korea — 0.6% |
| Hyundai Motor Co., Ltd. | | 1,499 | $ 83,861 |
| Samsung Electronics Co., Ltd. | | 23,936 | 894,534 |
| | | | $ 978,395 |
| Taiwan — 0.0%(5) |
| Fubon Financial Holding Co., Ltd. | | 2,110 | $ 3,556 |
| | | | $ 3,556 |
Total Preferred Stocks
(identified cost $984,484) | | | $ 981,951 |
| Security | Shares | Value |
| South Korea — 0.0%(5) |
| HLB, Inc. | | 331 | $ 2,277 |
Total Rights
(identified cost $0) | | | $ 2,277 |
| Short-Term Investments — 2.0% |
| Security | Shares | Value |
| Morgan Stanley Institutional Liquidity Funds - Government Portfolio, Institutional Class, 2.88%(6) | | 2,240,401 | $ 2,240,401 |
Total Affiliated Fund
(identified cost $2,240,401) | | | $ 2,240,401 |
23
See Notes to Financial Statements.
Global Macro Capital Opportunities Portfolio
October 31, 2022
Portfolio of Investments — continued
| U.S. Treasury Obligations — 0.8% |
| Security | Principal
Amount
(000's omitted) | Value |
| U.S. Treasury Bill, 0.00%, 11/8/22 | $ | 1,500 | $ 1,499,223 |
Total U.S. Treasury Obligations
(identified cost $1,499,221) | | | $ 1,499,223 |
Total Short-Term Investments
(identified cost $3,739,622) | | | $ 3,739,624 |
| | | |
Total Investments — 97.0%
(identified cost $176,304,284) | | | $178,120,003 |
| Other Assets, Less Liabilities — 3.0% | | | $ 5,513,013 |
| Net Assets — 100.0% | | | $183,633,016 |
| The percentage shown for each investment category in the Portfolio of Investments is based on net assets. |
| (1) | Security exempt from registration under Rule 144A of the Securities Act of 1933, as amended. These securities may be sold in certain transactions in reliance on an exemption from registration (normally to qualified institutional buyers). At October 31, 2022, the aggregate value of these securities is $6,397,435 or 3.5% of the Portfolio's net assets. |
| (2) | Non-income producing security. |
| (3) | Securities are traded on separate exchanges for the same entity. |
| (4) | Security exempt from registration under Regulation S of the Securities Act of 1933, as amended, which exempts from registration securities offered and sold outside the United States. Security may not be offered or sold in the United States except pursuant to an exemption from, or in a transaction not subject to, the registration requirements of the Securities Act of 1933, as amended. At October 31, 2022, the aggregate value of these securities is $5,053,617 or 2.8% of the Portfolio's net assets. |
| (5) | Amount is less than 0.05%. |
| (6) | May be deemed to be an affiliated investment company. The rate shown is the annualized seven-day yield as of October 31, 2022. |
| Sector Classification of Portfolio |
| Sector | Percentage
of Net Assets | Value |
| Financials | 36.7% | $67,426,770 |
| Information Technology | 12.1 | 22,276,482 |
| Consumer Discretionary | 10.0 | 18,295,291 |
| Communication Services | 8.2 | 15,117,427 |
| Industrials | 6.0 | 11,038,902 |
| Utilities | 5.1 | 9,409,834 |
| Materials | 5.0 | 9,070,183 |
| Energy | 4.7 | 8,624,769 |
| Consumer Staples | 3.1 | 5,596,047 |
| Real Estate | 2.1 | 3,869,580 |
| Health Care | 2.0 | 3,655,094 |
| Short-Term Investments | 2.0 | 3,739,624 |
| Total Investments | 97.0% | $178,120,003 |
| Forward Foreign Currency Exchange Contracts (Centrally Cleared) |
| Currency Purchased | Currency Sold | Settlement
Date | Value/Unrealized
Appreciation
(Depreciation) |
| EUR | 1,296,988 | USD | 1,305,054 | 12/21/22 | $ (18,067) |
| EUR | 19,000,000 | USD | 19,118,166 | 12/21/22 | (264,673) |
| USD | 5,004,407 | EUR | 4,973,476 | 12/21/22 | 69,281 |
| USD | 4,173,880 | EUR | 4,148,082 | 12/21/22 | 57,783 |
| USD | 3,561,469 | EUR | 3,539,456 | 12/21/22 | 49,305 |
| USD | 2,393,115 | EUR | 2,378,324 | 12/21/22 | 33,130 |
| USD | 2,126,885 | EUR | 2,113,739 | 12/21/22 | 29,445 |
| USD | 1,559,640 | EUR | 1,550,000 | 12/21/22 | 21,592 |
| USD | 1,857,350 | EUR | 1,868,375 | 12/21/22 | 3,382 |
24
See Notes to Financial Statements.
Global Macro Capital Opportunities Portfolio
October 31, 2022
Portfolio of Investments — continued
| Forward Foreign Currency Exchange Contracts (Centrally Cleared) (continued) |
| Currency Purchased | Currency Sold | Settlement
Date | Value/Unrealized
Appreciation
(Depreciation) |
| USD | 34,344 | EUR | 34,548 | 12/21/22 | $ 63 |
| | | | | | $ (18,759) |
| Forward Foreign Currency Exchange Contracts (OTC) |
| Currency Purchased | Currency Sold | Counterparty | Settlement
Date | Unrealized
Appreciation | Unrealized
(Depreciation) |
| USD | 2,171 | EUR | 2,217 | Bank of America, N.A. | 11/4/22 | $ — | $ (21) |
| USD | 2,718 | EUR | 2,731 | HSBC Bank USA, N.A. | 11/4/22 | 19 | — |
| CNH | 88,600,000 | USD | 13,136,630 | Bank of America, N.A. | 11/25/22 | — | (1,043,927) |
| CNH | 47,500,000 | USD | 7,042,337 | BNP Paribas | 11/25/22 | — | (559,229) |
| USD | 13,072,785 | CNH | 88,600,000 | Bank of America, N.A. | 11/25/22 | 980,082 | — |
| USD | 7,069,241 | CNH | 47,500,000 | BNP Paribas | 11/25/22 | 586,133 | — |
| CNH | 52,600,000 | USD | 7,799,410 | BNP Paribas | 12/22/22 | — | (608,520) |
| CNH | 9,300,000 | USD | 1,379,167 | JPMorgan Chase Bank, N.A. | 12/22/22 | — | (107,774) |
| CNH | 20,863,000 | USD | 3,092,968 | Standard Chartered Bank | 12/22/22 | — | (240,811) |
| USD | 6,080,680 | CNH | 40,700,000 | BNP Paribas | 12/22/22 | 516,628 | — |
| USD | 1,778,593 | CNH | 11,900,000 | BNP Paribas | 12/22/22 | 151,758 | — |
| USD | 1,389,471 | CNH | 9,300,000 | JPMorgan Chase Bank, N.A. | 12/22/22 | 118,078 | — |
| USD | 1,658,189 | CNH | 11,100,000 | Standard Chartered Bank | 12/22/22 | 140,720 | — |
| USD | 1,459,030 | CNH | 9,763,000 | Standard Chartered Bank | 12/22/22 | 124,341 | — |
| USD | 4,456,726 | AED | 16,370,000 | Standard Chartered Bank | 4/19/23 | 459 | — |
| USD | 1,657,609 | AED | 6,100,000 | Standard Chartered Bank | 5/30/23 | — | (2,930) |
| USD | 36,233,394 | CNH | 243,500,000 | BNP Paribas | 6/16/23 | 2,540,471 | — |
| | | | | | | $5,158,689 | $(2,563,212) |
| Futures Contracts |
| Description | Number of
Contracts | Position | Expiration
Date | Notional
Amount | Value/Unrealized
Appreciation
(Depreciation) |
| Equity Futures | | | | | |
| MSCI Emerging Markets Index | 45 | Long | 12/16/22 | $1,920,600 | $ (1,323) |
| | | | | | $(1,323) |
| Abbreviations: |
| GDR | – Global Depositary Receipt |
| OTC | – Over-the-counter |
| PFC Shares | – Preference Shares |
| Currency Abbreviations: |
| AED | – United Arab Emirates Dirham |
| CNH | – Yuan Renminbi Offshore |
| EUR | – Euro |
| USD | – United States Dollar |
25
See Notes to Financial Statements.
Global Macro Capital Opportunities Portfolio
October 31, 2022
Statement of Assets and Liabilities
| | October 31, 2022 |
| Assets | |
| Unaffiliated investments, at value (identified cost $174,063,883) | $ 175,879,602 |
| Affiliated investment, at value (identified cost $2,240,401) | 2,240,401 |
| Cash | 959,538 |
| Deposits for derivatives collateral: | |
| Futures contracts | 96,830 |
| Centrally cleared derivatives | 18,053 |
| OTC derivatives - forward foreign currency exchange contracts | 980,000 |
| Foreign currency, at value (identified cost $645,834) | 636,413 |
| Dividends receivable | 148,576 |
| Dividends receivable from affiliated investment | 11,113 |
| Receivable for investments sold | 1,759,612 |
| Receivable for variation margin on open centrally cleared derivatives | 2,494 |
| Receivable for open forward foreign currency exchange contracts | 5,158,689 |
| Tax reclaims receivable | 12,209 |
| Other assets | 6,678 |
| Total assets | $187,910,208 |
| Liabilities | |
| Cash collateral due to broker | $ 980,000 |
| Payable for investments purchased | 224,358 |
| Payable for variation margin on open futures contracts | 98,032 |
| Payable for open forward foreign currency exchange contracts | 2,563,212 |
| Payable to affiliates: | |
| Investment adviser fee | 151,353 |
| Trustees' fees | 1,129 |
| Accrued foreign capital gains taxes | 10,898 |
| Accrued expenses | 248,210 |
| Total liabilities | $ 4,277,192 |
| Net Assets applicable to investors' interest in Portfolio | $183,633,016 |
26
See Notes to Financial Statements.
Global Macro Capital Opportunities Portfolio
October 31, 2022
| | Year Ended |
| | October 31, 2022 |
| Investment Income | |
| Dividend income (net of foreign taxes withheld of $560,529) | $ 6,316,667 |
| Dividend income from affiliated investments | 60,411 |
| Interest income | 17,351 |
| Total investment income | $ 6,394,429 |
| Expenses | |
| Investment adviser fee | $ 1,865,169 |
| Trustees’ fees and expenses | 12,031 |
| Custodian fee | 330,031 |
| Legal and accounting services | 85,100 |
| Miscellaneous | 54,130 |
| Total expenses | $ 2,346,461 |
| Deduct: | |
| Waiver and/or reimbursement of expenses by affiliate | $ 5,958 |
| Total expense reductions | $ 5,958 |
| Net expenses | $ 2,340,503 |
| Net investment income | $ 4,053,926 |
| Realized and Unrealized Gain (Loss) | |
| Net realized gain (loss): | |
| Investment transactions (net of foreign capital gains taxes of $82) | $ (217,559) |
| Investment transactions - affiliated investment | (1,976) |
| Futures contracts | (3,342,039) |
| Swap contracts | 246,144 |
| Foreign currency transactions | (988,026) |
| Forward foreign currency exchange contracts | 2,759,260 |
| Net realized loss | $ (1,544,196) |
| Change in unrealized appreciation (depreciation): | |
| Investments (including net increase in accrued foreign capital gains taxes of $10,898) | $ (38,842,784) |
| Futures contracts | 133,371 |
| Swap contracts | (80,033) |
| Foreign currency | 10,530 |
| Forward foreign currency exchange contracts | 2,196,581 |
| Net change in unrealized appreciation (depreciation) | $(36,582,335) |
| Net realized and unrealized loss | $(38,126,531) |
| Net decrease in net assets from operations | $(34,072,605) |
27
See Notes to Financial Statements.
Global Macro Capital Opportunities Portfolio
October 31, 2022
Statements of Changes in Net Assets
| | Year Ended October 31, |
| | 2022 | 2021 |
| Increase (Decrease) in Net Assets | | |
| From operations: | | |
| Net investment income | $ 4,053,926 | $ 1,848,852 |
| Net realized gain (loss) | (1,544,196) | 24,455,725 |
| Net change in unrealized appreciation (depreciation) | (36,582,335) | 24,471,674 |
| Net increase (decrease) in net assets from operations | $ (34,072,605) | $ 50,776,251 |
| Capital transactions: | | |
| Contributions | $ 40,153,386 | $ 13,948,565 |
| Withdrawals | (12,951,136) | (19,915,526) |
| Net increase (decrease) in net assets from capital transactions | $ 27,202,250 | $ (5,966,961) |
| Net increase (decrease) in net assets | $ (6,870,355) | $ 44,809,290 |
| Net Assets | | |
| At beginning of year | $ 190,503,371 | $ 145,694,081 |
| At end of year | $183,633,016 | $190,503,371 |
28
See Notes to Financial Statements.
Global Macro Capital Opportunities Portfolio
October 31, 2022
| | Year Ended October 31, |
| Ratios/Supplemental Data | 2022 | 2021 | 2020 | 2019 | 2018 |
| Ratios (as a percentage of average daily net assets): | | | | | |
| Expenses | 1.26% (1) | 1.24% | 1.28% | 1.29% (2) | 1.25% |
| Net investment income | 2.17% | 1.04% | 0.84% | 1.29% | 0.97% |
| Portfolio Turnover | 67% | 70% | 44% | 43% | 39% |
| Total Return | (16.87)% | 35.70% | (2.84)% | 7.44% | (11.06)% |
| Net assets, end of year (000’s omitted) | $183,633 | $190,503 | $145,694 | $179,334 | $162,169 |
| (1) | Includes a reduction by the investment adviser of a portion of its adviser fee due to the Portfolio’s investment in the Liquidity Fund (equal to less than 0.005% of average daily net assets for the year ended October 31, 2022). |
| (2) | Includes interest expense of 0.01% of average daily net assets for the year ended October 31, 2019. |
Global Macro Capital Opportunities Portfolio
October 31, 2022
Notes to Financial Statements
1 Significant Accounting Policies
Global Macro Capital Opportunities Portfolio (the Portfolio) is a Massachusetts business trust registered under the Investment Company Act of 1940, as amended (the 1940 Act), as a non-diversified, open-end management investment company. The Portfolio’s investment objective is total return. The Declaration of Trust permits the Trustees to issue interests in the Portfolio. At October 31, 2022, Eaton Vance Emerging and Frontier Countries Equity Fund held a 99.9% interest in the Portfolio.
The following is a summary of significant accounting policies of the Portfolio. The policies are in conformity with accounting principles generally accepted in the United States of America (U.S. GAAP). The Portfolio is an investment company and follows accounting and reporting guidance in the Financial Accounting Standards Board (FASB) Accounting Standards Codification Topic 946.
A Investment Valuation—The following methodologies are used to determine the market value or fair value of investments.
Equity Securities. Equity securities listed on a U.S. securities exchange generally are valued at the last sale or closing price on the day of valuation or, if no sales took place on such date, at the mean between the closing bid and ask prices on the exchange where such securities are principally traded. Equity securities listed on the NASDAQ National Market System are valued at the NASDAQ official closing price. Unlisted or listed securities for which closing sales prices or closing quotations are not available are valued at the mean between the latest available bid and ask prices.
Debt Obligations. Debt obligations are generally valued on the basis of valuations provided by third party pricing services, as derived from such services’ pricing models. Inputs to the models may include, but are not limited to, reported trades, executable bid and ask prices, broker/dealer quotations, prices or yields of securities with similar characteristics, interest rates, anticipated prepayments, benchmark curves or information pertaining to the issuer, as well as industry and economic events. The pricing services may use a matrix approach, which considers information regarding securities with similar characteristics to determine the valuation for a security. Short-term debt obligations purchased with a remaining maturity of sixty days or less for which a valuation from a third party pricing service is not readily available may be valued at amortized cost, which approximates fair value.
Derivatives. Futures contracts are valued at the closing settlement price established by the board of trade or exchange on which they are traded, with adjustments for fair valuation for certain foreign futures contracts as described below. Forward foreign currency exchange contracts are generally valued at the mean of the average bid and average ask prices that are reported by currency dealers to a third party pricing service at the valuation time. Such third party pricing service valuations are supplied for specific settlement periods and the Portfolio’s forward foreign currency exchange contracts are valued at an interpolated rate between the closest preceding and subsequent settlement period reported by the third party pricing service.
Foreign Securities, Futures Contracts and Currencies. Foreign securities, futures contracts and currencies are valued in U.S. dollars, based on foreign currency exchange rate quotations supplied by a third party pricing service. The pricing service uses a proprietary model to determine the exchange rate. Inputs to the model include reported trades and implied bid/ask spreads. The daily valuation of exchange-traded foreign securities and certain exchange-traded foreign futures contracts generally is determined as of the close of trading on the principal exchange on which such securities and contracts trade. Events occurring after the close of trading on foreign exchanges may result in adjustments to the valuation of foreign securities and certain foreign futures contracts to more accurately reflect their fair value as of the close of regular trading on the New York Stock Exchange. When valuing foreign equity securities and foreign futures contracts that meet certain criteria, the Portfolio’s Trustees have approved the use of a fair value service that values such securities and foreign futures contracts to reflect market trading that occurs after the close of the applicable foreign markets of comparable securities or other instruments that have a strong correlation to the fair-valued securities and foreign futures contracts.
Other. Investments in management investment companies (including money market funds) that do not trade on an exchange are valued at the net asset value as of the close of each business day.
Fair Valuation. In connection with Rule 2a-5 of the 1940 Act, which became effective September 8, 2022, the Trustees have designated the Portfolio’s investment adviser as its valuation designee. Investments for which valuations or market quotations are not readily available or are deemed unreliable are valued by the investment adviser, as valuation designee, at fair value using methods that most fairly reflect the security’s “fair value”, which is the amount that the Portfolio might reasonably expect to receive for the security upon its current sale in the ordinary course. Each such determination is based on a consideration of relevant factors, which are likely to vary from one pricing context to another. These factors may include, but are not limited to, the type of security, the existence of any contractual restrictions on the security’s disposition, the price and extent of public trading in similar securities of the issuer or of comparable companies or entities, quotations or relevant information obtained from broker/dealers or other market participants, information obtained from the issuer, analysts, and/or the appropriate stock exchange (for exchange-traded securities), an analysis of the company’s or entity’s financial statements, and an evaluation of the forces that influence the issuer and the market(s) in which the security is purchased and sold.
B Investment Transactions—Investment transactions for financial statement purposes are accounted for on a trade date basis. Realized gains and losses on investments sold are determined on the basis of identified cost.
C Income—Dividend income is recorded on the ex-dividend date for dividends received in cash and/or securities. However, if the ex-dividend date has passed, certain dividends from foreign securities are recorded as the Fund is informed of the ex-dividend date. Withholding taxes on foreign dividends and capital gains have been provided for in accordance with the Fund’s understanding of the applicable countries’ tax rules and rates. Interest income is recorded on the basis of interest accrued, adjusted for amortization of premium or accretion of discount.
Global Macro Capital Opportunities Portfolio
October 31, 2022
Notes to Financial Statements — continued
D Federal and Other Taxes—The Portfolio has elected to be treated as a partnership for federal tax purposes. No provision is made by the Portfolio for federal or state taxes on any taxable income of the Portfolio because each investor in the Portfolio is ultimately responsible for the payment of any taxes on its share of taxable income. Since at least one of the Portfolio’s investors is a regulated investment company that invests all or substantially all of its assets in the Portfolio, the Portfolio normally must satisfy the applicable source of income and diversification requirements (under the Internal Revenue Code) in order for its investors to satisfy them. The Portfolio will allocate, at least annually among its investors, each investor’s distributive share of the Portfolio’s net investment income, net realized capital gains and losses and any other items of income, gain, loss, deduction or credit.
In addition to the requirements of the Internal Revenue Code, the Portfolio may also be subject to local taxes on the recognition of capital gains in India. In determining the daily net asset value, the Portfolio estimates the accrual for such taxes, if any, based on the unrealized appreciation on certain portfolio securities, the holding period of such securities, the related tax rates, and the availability of any realized losses in excess of gains that may be carried forward to offset future gains. Taxes attributable to unrealized appreciation are included in the change in unrealized appreciation (depreciation) on investments. Capital gains taxes on certain Indian securities sold at a gain are included in net realized gain (loss) on investments.
As of October 31, 2022, the Portfolio had no uncertain tax positions that would require financial statement recognition, de-recognition, or disclosure. The Portfolio files a U.S. federal income tax return annually after its fiscal year-end, which is subject to examination by the Internal Revenue Service for a period of three years from the date of filing.
E Foreign Currency Translation—Investment valuations, other assets, and liabilities initially expressed in foreign currencies are translated each business day into U.S. dollars based upon current exchange rates. Purchases and sales of foreign investment securities and income and expenses denominated in foreign currencies are translated into U.S. dollars based upon currency exchange rates in effect on the respective dates of such transactions. Recognized gains or losses on investment transactions attributable to changes in foreign currency exchange rates are recorded for financial statement purposes as net realized gains and losses on investments. That portion of unrealized gains and losses on investments that results from fluctuations in foreign currency exchange rates is not separately disclosed.
F Use of Estimates—The preparation of the financial statements in conformity with U.S. GAAP requires management to make estimates and assumptions that affect the reported amounts of assets and liabilities at the date of the financial statements and the reported amounts of income and expense during the reporting period. Actual results could differ from those estimates.
G Indemnifications—Under the Portfolio’s organizational documents, its officers and Trustees may be indemnified against certain liabilities and expenses arising out of the performance of their duties to the Portfolio. Under Massachusetts law, if certain conditions prevail, interestholders in the Portfolio could be deemed to have personal liability for the obligations of the Portfolio. However, the Portfolio’s Declaration of Trust contains an express disclaimer of liability on the part of Portfolio interestholders. Additionally, in the normal course of business, the Portfolio enters into agreements with service providers that may contain indemnification clauses. The Portfolio’s maximum exposure under these arrangements is unknown as this would involve future claims that may be made against the Portfolio that have not yet occurred.
H Futures Contracts—Upon entering into a futures contract, the Portfolio is required to deposit with the broker, either in cash or securities, an amount equal to a certain percentage of the contract amount (initial margin). Subsequent payments, known as variation margin, are made or received by the Portfolio each business day, depending on the daily fluctuations in the value of the underlying security or index, and are recorded as unrealized gains or losses by the Portfolio. Gains (losses) are realized upon the expiration or closing of the futures contracts. Should market conditions change unexpectedly, the Portfolio may not achieve the anticipated benefits of the futures contracts and may realize a loss. Futures contracts have minimal counterparty risk as they are exchange traded and the clearinghouse for the exchange is substituted as the counterparty, guaranteeing counterparty performance.
I Forward Foreign Currency Exchange Contracts—The Portfolio may enter into forward foreign currency exchange contracts for the purchase or sale of a specific foreign currency at a fixed price on a future date. The forward foreign currency exchange contracts are adjusted by the daily exchange rate of the underlying currency and any gains or losses are recorded as unrealized until such time as the contracts have been closed. While forward foreign currency exchange contracts are privately negotiated agreements between the Portfolio and a counterparty, certain contracts may be “centrally cleared”, whereby all payments made or received by the Portfolio pursuant to the contract are with a central clearing party (CCP) rather than the original counterparty. The CCP guarantees the performance of the original parties to the contract. Upon entering into centrally cleared contracts, the Portfolio is required to deposit with the CCP, either in cash or securities, an amount of initial margin determined by the CCP, which is subject to adjustment. For centrally cleared contracts, the daily change in valuation is recorded as a receivable or payable for variation margin and settled in cash with the CCP daily. Risks may arise upon entering these contracts from the potential inability of counterparties to meet the terms of their contracts and from movements in the value of a foreign currency relative to the U.S. dollar. In the case of centrally cleared contracts, counterparty risk is minimal due to protections provided by the CCP.
J Total Return Swaps—In a total return swap, the buyer receives a periodic return equal to the total return of a specified security, securities or index for a specified period of time. In return, the buyer pays the counterparty a fixed or variable stream of payments, typically based upon short-term interest rates, possibly plus or minus an agreed upon spread. During the term of the outstanding swap agreement, changes in the underlying value of the swap are recorded as unrealized gains and losses. Periodic payments received or made are recorded as realized gains or losses. The Portfolio is exposed to credit loss in the event of nonperformance by the swap counterparty. Risk may also arise from the unanticipated movements in value of exchange rates, interest rates, securities, or the index.
Global Macro Capital Opportunities Portfolio
October 31, 2022
Notes to Financial Statements — continued
2 Investment Adviser Fee and Other Transactions with Affiliates
The investment adviser fee is earned by Boston Management and Research (BMR), an indirect, wholly-owned subsidiary of Morgan Stanley, as compensation for investment advisory services rendered to the Portfolio. The investment adviser fee is computed at an annual rate as a percentage of the Portfolio’s average daily net assets as follows and is payable monthly:
| Average Daily Net Assets | Annual Fee Rate |
| Up to $500 million | 1.000% |
| $500 million but less than $1 billion | 0.950% |
| $1 billion but less than $2.5 billion | 0.925% |
| $2.5 billion but less than $5 billion | 0.900% |
| $5 billion and over | 0.880% |
For the year ended October 31, 2022, the investment adviser fee amounted to $1,865,169 or 1.00% of the Portfolio’s average daily net assets. Effective April 26, 2022, the Portfolio may invest in a money market fund, the Institutional Class of the Morgan Stanley Institutional Liquidity Funds - Government Portfolio (the “Liquidity Fund”), an open-end management investment company managed by Morgan Stanley Investment Management Inc., a wholly-owned subsidiary of Morgan Stanley. The investment adviser fee paid by the Portfolio is reduced by an amount equal to its pro-rata share of the advisory and administration fees paid by the Portfolio due to its investment in the Liquidity Fund. For the year ended October 31, 2022, the investment adviser fee paid was reduced by $5,958 relating to the Portfolio's investment in the Liquidity Fund. Prior to April 26, 2022, the Portfolio may have invested its cash in Eaton Vance Cash Reserves Fund, LLC (Cash Reserves Fund), an affiliated investment company managed by Eaton Vance Management (EVM), an affiliate of BMR. EVM did not receive a fee for advisory services provided to Cash Reserves Fund.
Trustees and officers of the Portfolio who are members of EVM’s or BMR’s organizations receive remuneration for their services to the Portfolio out of the investment adviser fee. Trustees of the Portfolio who are not affiliated with the investment adviser may elect to defer receipt of all or a percentage of their annual fees in accordance with the terms of the Trustees Deferred Compensation Plan. For the year ended October 31, 2022, no significant amounts have been deferred. Certain officers and Trustees of the Portfolio are officers of the above organizations.
3 Purchases and Sales of Investments
Purchases and sales of investments, other than short-term obligations, aggregated $166,669,660 and $115,066,690, respectively, for the year ended October 31, 2022.
4 Federal Income Tax Basis of Investments
The cost and unrealized appreciation (depreciation) of investments, including open derivative contracts, of the Portfolio at October 31, 2022, as determined on a federal income tax basis, were as follows:
| Aggregate cost | $ 179,577,064 |
| Gross unrealized appreciation | $ 17,093,974 |
| Gross unrealized depreciation | (18,553,505) |
| Net unrealized depreciation | $ (1,459,531) |
5 Financial Instruments
The Portfolio may trade in financial instruments with off-balance sheet risk in the normal course of its investing activities. These financial instruments may include forward foreign currency exchange contracts, futures contracts and swap contracts and may involve, to a varying degree, elements of risk in excess of the amounts recognized for financial statement purposes. The notional or contractual amounts of these instruments represent the investment the Portfolio has in particular classes of financial instruments and do not necessarily represent the amounts potentially subject to risk. The measurement of the risks associated with these instruments is meaningful only when all related and offsetting transactions are considered. A summary of obligations under these financial instruments at October 31, 2022 is included in the Portfolio of Investments. At October 31, 2022, the Portfolio had sufficient cash and/or securities to cover commitments under these contracts.
In the normal course of pursuing its investment objective, the Portfolio is subject to the following risks:
Global Macro Capital Opportunities Portfolio
October 31, 2022
Notes to Financial Statements — continued
Equity Price Risk: During the year ended October 31, 2022, the Portfolio entered into equity futures contracts and total return swaps to enhance total return, to manage certain investment risks and/or as a substitute for the purchase of securities.
Foreign Exchange Risk: The Portfolio engages in forward foreign currency exchange contracts to enhance total return, to seek to hedge against fluctuations in currency exchange rates and/or as a substitute for the purchase or sale of securities or currencies.
The Portfolio enters into forward foreign currency exchange contracts that may contain provisions whereby the counterparty may terminate the contract under certain conditions, including but not limited to a decline in the Portfolio’s net assets below a certain level over a certain period of time, which would trigger a payment by the Portfolio for those derivatives in a liability position. At October 31, 2022, the fair value of derivatives with credit-related contingent features in a net liability position was $2,563,212. At October 31, 2022 there were no assets pledged by the Portfolio for such liability.
The over-the-counter (OTC) derivatives in which the Portfolio invests are subject to the risk that the counterparty to the contract fails to perform its obligations under the contract. To mitigate this risk, the Portfolio has entered into an International Swaps and Derivatives Association, Inc. Master Agreement (“ISDA Master Agreement”) or similar agreement with substantially all its derivative counterparties. An ISDA Master Agreement is a bilateral agreement between the Portfolio and a counterparty that governs certain OTC derivatives and typically contains, among other things, set-off provisions in the event of a default and/or termination event as defined under the relevant ISDA Master Agreement. Under an ISDA Master Agreement, the Portfolio may, under certain circumstances, offset with the counterparty certain derivative financial instruments’ payables and/or receivables with collateral held and/or posted and create one single net payment. The provisions of the ISDA Master Agreement typically permit a single net payment in the event of default including the bankruptcy or insolvency of the counterparty. However, bankruptcy or insolvency laws of a particular jurisdiction may impose restrictions on or prohibitions against the right of offset in bankruptcy or insolvency. Certain ISDA Master Agreements allow counterparties to OTC derivatives to terminate derivative contracts prior to maturity in the event the Portfolio’s net assets decline by a stated percentage or the Portfolio fails to meet the terms of its ISDA Master Agreements, which would cause the counterparty to accelerate payment by the Portfolio of any net liability owed to it.
The collateral requirements for derivatives traded under an ISDA Master Agreement are governed by a Credit Support Annex to the ISDA Master Agreement. Collateral requirements are determined at the close of business each day and are typically based on changes in market values for each transaction under an ISDA Master Agreement and netted into one amount for such agreement. Generally, the amount of collateral due from or to a counterparty is subject to a minimum transfer threshold amount before a transfer is required, which may vary by counterparty. Collateral pledged for the benefit of the Portfolio and/or counterparty is held in segregated accounts by the Portfolio’s custodian and cannot be sold, re-pledged, assigned or otherwise used while pledged. The portion of such collateral representing cash, if any, is reflected as deposits for derivatives collateral and, in the case of cash pledged by a counterparty for the benefit of the Portfolio, a corresponding liability on the Statement of Assets and Liabilities. Securities pledged by the Portfolio as collateral, if any, are identified as such in the Portfolio of Investments. The carrying amount of the liability for cash collateral due to broker at October 31, 2022 approximated its fair value. If measured at fair value, such liability would have been considered as Level 2 in the fair value hierarchy (see Note 8) at October 31, 2022.
Global Macro Capital Opportunities Portfolio
October 31, 2022
Notes to Financial Statements — continued
The fair value of open derivative instruments (not considered to be hedging instruments for accounting disclosure purposes) by risk exposure at October 31, 2022 was as follows:
| | Fair Value |
| Statement of Assets and Liabilities Caption | Equity
Price | Foreign
Exchange | Total |
| Not applicable | $ —* | $ 263,981* | $ 263,981 |
| Receivable for open forward foreign currency exchange contracts | — | 5,158,689 | 5,158,689 |
| Total Asset Derivatives | $ — | $ 5,422,670 | $ 5,422,670 |
| Derivatives not subject to master netting or similar agreements | $ — | $ 263,981 | $ 263,981 |
| Total Asset Derivatives subject to master netting or similar agreements | $ — | $ 5,158,689 | $ 5,158,689 |
| Not applicable | $ (1,323)* | $ (282,740)* | $ (284,063) |
| Payable for open forward foreign currency exchange contracts | — | (2,563,212) | (2,563,212) |
| Total Liability Derivatives | $(1,323) | $(2,845,952) | $(2,847,275) |
| Derivatives not subject to master netting or similar agreements | $(1,323) | $ (282,740) | $ (284,063) |
| Total Liability Derivatives subject to master netting or similar agreements | $ — | $(2,563,212) | $(2,563,212) |
| * | Only the current day’s variation margin on open futures contracts and centrally cleared derivatives is reported within the Statement of Assets and Liabilities as Receivable or Payable for variation margin on open futures contracts and centrally cleared derivatives, as applicable. |
The Portfolio’s derivative assets and liabilities at fair value by risk, which are reported gross in the Statement of Assets and Liabilities, are presented in the table above. The following tables present the Portfolio’s derivative assets and liabilities by counterparty, net of amounts available for offset under a master netting agreement and net of the related collateral received by the Portfolio for such assets and pledged by the Portfolio for such liabilities as of October 31, 2022.
| Counterparty | Derivative
Assets Subject to
Master Netting
Agreement | Derivatives
Available
for Offset | Non-cash
Collateral
Received(a) | Cash
Collateral
Received(a) | Net Amount
of Derivative
Assets(b) |
| Bank of America, N.A. | $ 980,082 | $ (980,082) | $ — | $ — | $ — |
| BNP Paribas | 3,794,990 | (1,167,749) | (1,375,124) | (950,000) | 302,117 |
| HSBC Bank USA, N.A. | 19 | — | — | — | 19 |
| JPMorgan Chase Bank, N.A. | 118,078 | (107,774) | — | — | 10,304 |
| Standard Chartered Bank | 265,520 | (243,741) | — | (21,779) | — |
| | $5,158,689 | $(2,499,346) | $(1,375,124) | $(971,779) | $312,440 |
Global Macro Capital Opportunities Portfolio
October 31, 2022
Notes to Financial Statements — continued
| Counterparty | Derivative
Liabilities Subject to
Master Netting
Agreement | Derivatives
Available
for Offset | Non-cash
Collateral
Pledged(a) | Cash
Collateral
Pledged(a) | Net Amount
of Derivative
Liabilities(c) |
| Bank of America, N.A. | $ (1,043,948) | $ 980,082 | $ — | $ — | $ (63,866) |
| BNP Paribas | (1,167,749) | 1,167,749 | — | — | — |
| JPMorgan Chase Bank, N.A. | (107,774) | 107,774 | — | — | — |
| Standard Chartered Bank | (243,741) | 243,741 | — | — | — |
| | $(2,563,212) | $2,499,346 | $ — | $ — | $(63,866) |
| (a) | In some instances, the total collateral received and/or pledged may be more than the amount shown due to overcollateralization. |
| (b) | Net amount represents the net amount due from the counterparty in the event of default. |
| (c) | Net amount represents the net amount payable to the counterparty in the event of default. |
The effect of derivative instruments (not considered to be hedging instruments for accounting disclosure purposes) on the Statement of Operations by risk exposure for the year ended October 31, 2022 was as follows:
| Statement of Operations Caption | Equity
Price | Foreign
Exchange | Total |
| Net realized gain (loss): | | |
| Futures contracts | $(3,342,039) | $ — | $(3,342,039) |
| Swap contracts | 246,144 | — | 246,144 |
| Forward foreign currency exchange contracts | — | 2,759,260 | 2,759,260 |
| Total | $(3,095,895) | $2,759,260 | $ (336,635) |
| Change in unrealized appreciation (depreciation): | | |
| Futures contracts | $133,371 | $ — | $ 133,371 |
| Swap contracts | (80,033) | — | (80,033) |
| Forward foreign currency exchange contracts | — | 2,196,581 | 2,196,581 |
| Total | $53,338 | $2,196,581 | $ 2,249,919 |
The average notional cost of futures contracts and average notional amounts of other derivative contracts outstanding during the year ended October 31, 2022, which are indicative of the volume of these derivative types, were approximately as follows:
Futures
Contracts — Long | Futures
Contracts — Short | Forward
Foreign Currency
Exchange Contracts* | Swap
Contracts |
| $12,094,000 | $6,470,000 | $110,849,000 | $385,000 |
| * | The average notional amount for forward foreign currency exchange contracts is based on the absolute value of notional amounts of currency purchased and currency sold. |
Global Macro Capital Opportunities Portfolio
October 31, 2022
Notes to Financial Statements — continued
6 Line of Credit
The Portfolio participates with other portfolios and funds managed by EVM and its affiliates in a $725 million unsecured line of credit agreement with a group of banks, which is in effect through October 24, 2023. In connection with the renewal of the agreement on October 25, 2022, the borrowing limit was decreased from $800 million. Borrowings are made by the Portfolio solely for temporary purposes related to redemptions and other short-term cash needs. Interest is charged to the Portfolio based on its borrowings at an amount above either the Secured Overnight Financing Rate (SOFR) or Federal Funds rate. In addition, a fee computed at an annual rate of 0.15% on the daily unused portion of the line of credit is allocated among the participating portfolios and funds at the end of each quarter. Also in connection with the renewal of the agreement, an arrangement fee totaling $150,000 was incurred that was allocated to the participating portfolios and funds. Because the line of credit is not available exclusively to the Portfolio, it may be unable to borrow some or all of its requested amounts at any particular time. The Portfolio did not have any significant borrowings or allocated fees during the year ended October 31, 2022.
7 Investments in Affiliated Funds
At October 31, 2022, the value of the Portfolio's investment in funds that may be deemed to be affiliated was $2,240,401, which represents 1.2% of the Portfolio's net assets. Transactions in affiliated funds by the Portfolio for the year ended October 31, 2022 were as follows:
| Name | Value,
beginning
of period | Purchases | Sales
proceeds | Net
realized
gain (loss) | Change in
unrealized
appreciation
(depreciation) | Value, end
of period | Dividend
income | Units/Shares,
end of period |
| Short-Term Investments |
| Cash Reserves Fund | $20,820,477 | $95,455,792 | $(116,274,293) | $ (1,976) | $ — | $ — | $ 4,129 | — |
| Liquidity Fund | — | 80,250,352 | (78,009,951) | — | — | 2,240,401 | 56,282 | 2,240,401 |
| Total | | | | $(1,976) | $ — | $2,240,401 | $60,411 | |
8 Fair Value Measurements
Under generally accepted accounting principles for fair value measurements, a three-tier hierarchy to prioritize the assumptions, referred to as inputs, is used in valuation techniques to measure fair value. The three-tier hierarchy of inputs is summarized in the three broad levels listed below.
| • | Level 1 – quoted prices in active markets for identical investments |
| • | Level 2 – other significant observable inputs (including quoted prices for similar investments, interest rates, prepayment speeds, credit risk, etc.) |
| • | Level 3 – significant unobservable inputs (including a fund's own assumptions in determining the fair value of investments) |
In cases where the inputs used to measure fair value fall in different levels of the fair value hierarchy, the level disclosed is determined based on the lowest level input that is significant to the fair value measurement in its entirety. The inputs or methodology used for valuing securities are not necessarily an indication of the risk associated with investing in those securities.
At October 31, 2022, the hierarchy of inputs used in valuing the Portfolio’s investments and open derivative instruments, which are carried at value, were as follows:
| Asset Description | Level 1 | Level 2 | Level 3 | Total |
| Common Stocks: | | | | |
| Asia/Pacific | $ 3,570,610 | $ 78,035,576 | $ — | $ 81,606,186 |
| Emerging Europe | 22,586 | 51,367,074 | — | 51,389,660 |
| Latin America | 18,797,707 | — | — | 18,797,707 |
| Middle East/Africa | — | 21,602,598 | — | 21,602,598 |
| Total Common Stocks | $ 22,390,903 | $ 151,005,248* | $ — | $ 173,396,151 |
| Preferred Stocks | $ — | $ 981,951 | $ — | $ 981,951 |
| Rights | — | 2,277 | — | 2,277 |
Global Macro Capital Opportunities Portfolio
October 31, 2022
Notes to Financial Statements — continued
| Asset Description (continued) | Level 1 | Level 2 | Level 3 | Total |
| Short-Term Investments: | | | | |
| Affiliated Fund | $ 2,240,401 | $ — | $ — | $ 2,240,401 |
| U.S. Treasury Obligations | — | 1,499,223 | — | 1,499,223 |
| Total Investments | $ 24,631,304 | $ 153,488,699 | $ — | $ 178,120,003 |
| Forward Foreign Currency Exchange Contracts | $ — | $ 5,422,670 | $ — | $ 5,422,670 |
| Total | $ 24,631,304 | $ 158,911,369 | $ — | $ 183,542,673 |
| Liability Description | | | | |
| Forward Foreign Currency Exchange Contracts | $ — | $ (2,845,952) | $ — | $ (2,845,952) |
| Futures Contracts | (1,323) | — | — | (1,323) |
| Total | $ (1,323) | $ (2,845,952) | $ — | $ (2,847,275) |
| * | Includes foreign equity securities whose values were adjusted to reflect market trading of comparable securities or other correlated instruments that occurred after the close of trading in their applicable foreign markets. |
9 Risks and Uncertainties
Risks Associated with Foreign Investments
Foreign investments can be adversely affected by political, economic and market developments abroad, including the imposition of economic and other sanctions by the United States or another country. There may be less publicly available information about foreign issuers because they may not be subject to reporting practices, requirements or regulations comparable to those to which United States companies are subject. Foreign markets may be smaller, less liquid and more volatile than the major markets in the United States. Trading in foreign markets typically involves higher expense than trading in the United States. The Portfolio may have difficulties enforcing its legal or contractual rights in a foreign country. Securities that trade or are denominated in currencies other than the U.S. dollar may be adversely affected by fluctuations in currency exchange rates.
Emerging market securities often involve greater risks than developed market securities. Investment markets within emerging market countries are typically smaller, less liquid, less developed and more volatile than those in more developed markets like the United States, and may be focused in certain economic sectors. The information available about an emerging market issuer may be less reliable than for comparable issuers in more developed capital markets. Governmental actions can have a significant effect on the economic conditions in emerging market countries. It may be more difficult to make a claim or obtain a judgment in the courts of these countries than it is in the United States. The possibility of fraud, negligence, undue influence being exerted by an issuer or refusal to recognize ownership exists in some emerging markets. Disruptions due to work stoppages and trading improprieties in foreign securities markets have caused such markets to close. Emerging market securities are also subject to speculative trading, which contributes to their volatility.
Frontier markets are among the smallest and least mature investment markets. Frontier market countries may have greater political or economic instability and may also be subject to trade barriers, adjustments in currency values and developing or changing securities laws and other regulations. Investments in frontier market countries generally are less liquid and subject to greater price volatility than investments in developed markets or emerging markets.
Pandemic Risk
An outbreak of respiratory disease caused by a novel coronavirus was first detected in China in late 2019 and subsequently spread internationally. This coronavirus has resulted in closing borders, enhanced health screenings, changes to healthcare service preparation and delivery, quarantines, cancellations, disruptions to supply chains and customer activity, as well as general concern and uncertainty. Health crises caused by outbreaks of disease, such as the coronavirus outbreak, may exacerbate other pre-existing political, social and economic risks and disrupt normal market conditions and operations. The impact of this outbreak has negatively affected the worldwide economy, as well as the economies of individual countries and industries, and could continue to affect the market in significant and unforeseen ways. Other epidemics and pandemics that may arise in the future may have similar effects. Any such impact could adversely affect the Portfolio's performance, or the performance of the securities in which the Portfolio invests.
Global Macro Capital Opportunities Portfolio
October 31, 2022
Report of Independent Registered Public Accounting Firm
To the Trustees and Investors of Global Macro Capital Opportunities Portfolio:
Opinion on the Financial Statements and Financial Highlights
We have audited the accompanying statement of assets and liabilities of Global Macro Capital Opportunities Portfolio (the “Portfolio"), including the portfolio of investments, as of October 31, 2022, the related statement of operations for the year then ended, the statements of changes in net assets for each of the two years in the period then ended, the financial highlights for each of the five years in the period then ended, and the related notes. In our opinion, the financial statements and financial highlights present fairly, in all material respects, the financial position of the Portfolio as of October 31, 2022, and the results of its operations for the year then ended, the changes in its net assets for each of the two years in the period then ended, and the financial highlights for each of the five years in the period then ended, in conformity with accounting principles generally accepted in the United States of America.
Basis for Opinion
These financial statements and financial highlights are the responsibility of the Portfolio’s management. Our responsibility is to express an opinion on the Portfolio’s financial statements and financial highlights based on our audits. We are a public accounting firm registered with the Public Company Accounting Oversight Board (United States) (PCAOB) and are required to be independent with respect to the Portfolio in accordance with the U.S. federal securities laws and the applicable rules and regulations of the Securities and Exchange Commission and the PCAOB.
We conducted our audits in accordance with the standards of the PCAOB. Those standards require that we plan and perform the audit to obtain reasonable assurance about whether the financial statements and financial highlights are free of material misstatement, whether due to error or fraud. The Portfolio is not required to have, nor were we engaged to perform, an audit of its internal control over financial reporting. As part of our audits, we are required to obtain an understanding of internal control over financial reporting but not for the purpose of expressing an opinion on the effectiveness of the Portfolio’s internal control over financial reporting. Accordingly, we express no such opinion.
Our audits included performing procedures to assess the risks of material misstatement of the financial statements and financial highlights, whether due to error or fraud, and performing procedures that respond to those risks. Such procedures included examining, on a test basis, evidence regarding the amounts and disclosures in the financial statements and financial highlights. Our audits also included evaluating the accounting principles used and significant estimates made by management, as well as evaluating the overall presentation of the financial statements and financial highlights. Our procedures included confirmation of securities owned as of October 31, 2022, by correspondence with the custodian and brokers; when replies were not received from brokers, we performed other auditing procedures. We believe that our audits provide a reasonable basis for our opinion.
/s/ Deloitte & Touche LLP
Boston, Massachusetts
December 20, 2022
We have served as the auditor of one or more Eaton Vance investment companies since 1959.
Eaton Vance
Emerging and Frontier Countries Equity Fund
October 31, 2022
Board of Trustees’ Contract Approval
Overview of the Contract Review Process
The Investment Company Act of 1940, as amended (the “1940 Act”), provides, in substance, that the investment advisory agreement between a fund and its investment adviser will continue in effect from year-to-year only if its continuation is approved on an annual basis by a vote of the fund’s board of trustees, including a majority of the trustees who are not “interested persons” of the fund (“independent trustees”), cast in person at a meeting called for the purpose of considering such approval.
At a meeting held on June 8, 2022, the Boards of Trustees/Directors (collectively, the “Board”) that oversee the registered investment companies advised by Eaton Vance Management or its affiliate, Boston Management and Research (the “Eaton Vance Funds”), including a majority of the independent trustees (the “Independent Trustees”), voted to approve the continuation of existing investment advisory agreements and sub-advisory agreements1 for each of the Eaton Vance Funds for an additional one-year period. The Board relied upon the affirmative recommendation of its Contract Review Committee, which is a committee exclusively comprised of Independent Trustees. Prior to making its recommendation, the Contract Review Committee reviewed information furnished by the adviser and sub-adviser to each of the Eaton Vance Funds (including information specifically requested by the Board) for a series of formal meetings held between April and June 2022. Members of the Contract Review Committee also considered information received at prior meetings of the Board and its committees, to the extent such information was relevant to the Contract Review Committee’s annual evaluation of the investment advisory agreements and sub-advisory agreements.
In connection with its evaluation of the investment advisory agreements and sub-advisory agreements, the Board considered various information relating to the Eaton Vance Funds. This included information applicable to all or groups of Eaton Vance Funds, which is referenced immediately below, and information applicable to the particular Eaton Vance Fund covered by this report (additional fund-specific information is referenced below under “Results of the Contract Review Process”). (For funds that invest through one or more underlying portfolios, references to “each fund” in this section may include information that was considered at the portfolio-level.)
Information about Fees, Performance and Expenses
• A report from an independent data provider comparing advisory and other fees paid by each fund to such fees paid by comparable funds, as identified by the independent data provider (“comparable funds”);
• A report from an independent data provider comparing each fund’s total expense ratio (and its components) to those of comparable funds;
• A report from an independent data provider comparing the investment performance of each fund (including, as relevant, total return data, income data, Sharpe ratios and information ratios) to the investment performance of comparable funds and, as applicable, benchmark indices, over various time periods;
• In certain instances, data regarding investment performance relative to customized groups of peer funds and blended indices identified by the adviser in consultation with the Portfolio Management Committee of the Board (a committee exclusively comprised of Independent Trustees);
• Comparative information concerning the fees charged and services provided by the adviser and sub-adviser to each fund in managing other accounts (which may include other mutual funds, collective investment funds and institutional accounts) using investment strategies and techniques similar to those used in managing such fund(s), if any;
• Profitability analyses with respect to the adviser and sub-adviser to each of the funds;
Information about Portfolio Management and Trading
• Descriptions of the investment management services provided to each fund, as well as each of the funds’ investment strategies and policies;
• The procedures and processes used to determine the value of fund assets, including, when necessary, the determination of “fair value” and actions taken to monitor and test the effectiveness of such procedures and processes;
• Information about the policies and practices of each fund’s adviser and sub-adviser with respect to trading, including their processes for seeking best execution of portfolio transactions;
• Information about the allocation of brokerage transactions and the benefits, if any, received by the adviser and sub-adviser to each fund as a result of brokerage allocation, including, as applicable, information concerning the acquisition of research through client commission arrangements and policies with respect to “soft dollars”;
• Data relating to the portfolio turnover rate of each fund and related information regarding active management in the context of particular strategies;
Information about each Adviser and Sub-adviser
• Reports detailing the financial results and condition of the adviser and sub-adviser to each fund;
1 Not all Eaton Vance Funds have entered into a sub-advisory agreement with a sub-adviser. Accordingly, references to “sub-adviser” or “sub-advisory agreement” in this “Overview” section may not be applicable to the particular Eaton Vance Fund covered by this report. Following the “Overview” section, further information regarding the Board’s evaluation of a fund’s contractual arrangements is included under the “Results of the Contract Review Process” section.
Eaton Vance
Emerging and Frontier Countries Equity Fund
October 31, 2022
Board of Trustees’ Contract Approval — continued
• Information regarding the individual investment professionals whose responsibilities include portfolio management and investment research for the funds, and, for portfolio managers and certain other investment professionals, information relating to their responsibilities with respect to managing other mutual funds and investment accounts, as applicable;
• Information regarding the adviser’s and its parent company’s (Morgan Stanley’s) efforts to retain and attract talented investment professionals, including in the context of a particularly competitive marketplace for talent, as well as the ongoing unique environment presented by hybrid, remote and other alternative work arrangements;
• The Code of Ethics of the adviser and its affiliates and the sub-adviser of each fund, together with information relating to compliance with, and the administration of, such codes;
• Policies and procedures relating to proxy voting, including regular reporting with respect to fund proxy voting activities;
• Information regarding the handling of corporate actions and class actions, as well as information regarding litigation and other regulatory matters;
• Information concerning the resources devoted to compliance efforts undertaken by the adviser and its affiliates and the sub-adviser of each fund, if any, including descriptions of their various compliance programs and their record of compliance;
• Information concerning the business continuity and disaster recovery plans of the adviser and its affiliates and the sub-adviser of each fund, if any;
• A description of Eaton Vance Management’s and Boston Management and Research’s oversight of sub-advisers, including with respect to regulatory and compliance issues, investment management and other matters;
Other Relevant Information
• Information regarding ongoing initiatives to further integrate and harmonize, where applicable, the investment management and other departments of the adviser and its affiliates with the overall investment management infrastructure of Morgan Stanley, in light of Morgan Stanley’s acquisition of Eaton Vance on March 1, 2021;
• Information concerning the nature, cost and character of the administrative and other non-investment advisory services provided by Eaton Vance Management and its affiliates;
• Information concerning oversight of the relationship with the custodian, subcustodians, fund accountants, and other third-party service providers by the adviser and/or administrator to each of the funds;
• Information concerning efforts to implement policies and procedures with respect to various new regulations applicable to the funds, including Rule 12d1-4 (the Fund-of-Funds Rule), Rule 18f-4 (the Derivatives Rule) and Rule 2a-5 (the Fair Valuation Rule);
• For an Eaton Vance Fund structured as an exchange-listed closed-end fund, information concerning the benefits of the closed-end fund structure, as well as, where relevant, the closed-end fund’s market prices (including as compared to the closed-end fund’s net asset value (NAV)), trading volume data, continued use of auction preferred shares (where applicable), distribution rates and other relevant matters;
• The risks which the adviser and/or its affiliates incur in connection with the management and operation of the funds, including, among others, litigation, regulatory, entrepreneurial, and other business risks (and the associated costs of such risks); and
• The terms of each investment advisory agreement and sub-advisory agreement.
During the various meetings of the Board and its committees over the course of the year leading up to the June 8, 2022 meeting, the Trustees received information from portfolio managers and other investment professionals of the advisers and sub-advisers of the funds regarding investment and performance matters, and considered various investment and trading strategies used in pursuing the funds’ investment objectives. The Trustees also received information regarding risk management techniques employed in connection with the management of the funds. The Board and its committees evaluated issues pertaining to industry and regulatory developments, compliance procedures, fund governance and other issues with respect to the funds, and received and participated in reports and presentations provided by Eaton Vance Management, Boston Management and Research and fund sub-advisers, with respect to such matters. In addition to the formal meetings of the Board and its committees, the Independent Trustees held regular teleconferences to discuss, among other topics, matters relating to the continuation of investment advisory agreements and sub-advisory agreements.
The Contract Review Committee was advised throughout the contract review process by Goodwin Procter LLP, independent legal counsel for the Independent Trustees. The members of the Contract Review Committee, with the advice of such counsel, exercised their own business judgment in determining the material factors to be considered in evaluating each investment advisory agreement and sub-advisory agreement and the weight to be given to each such factor. The conclusions reached with respect to each investment advisory agreement and sub-advisory agreement were based on a comprehensive evaluation of all the information provided and not any single factor. Moreover, each member of the Contract Review Committee may have placed varying emphasis on particular factors in reaching conclusions with respect to each investment advisory agreement and sub-advisory agreement. In evaluating each investment advisory agreement and sub-advisory agreement, including the fee structures and other terms contained in such agreements, the members of the Contract Review Committee were also informed by multiple years of analysis and discussion with the adviser and sub-adviser to each of the Eaton Vance Funds.
Results of the Contract Review Process
Based on its consideration of the foregoing, and such other information it deemed relevant, including the factors and conclusions described below, the Contract Review Committee concluded that the continuation of the investment advisory agreement between Eaton Vance Emerging and Frontier Countries Equity Fund (the “Fund”) and Eaton Vance Management (“EVM”), as well as the investment advisory agreement between Global Macro Capital Opportunities Portfolio (the “Portfolio”), the portfolio in which the Fund invests, and Boston Management and Research (“BMR”) (EVM, with respect to the
Eaton Vance
Emerging and Frontier Countries Equity Fund
October 31, 2022
Board of Trustees’ Contract Approval — continued
Fund, and BMR, with respect to the Portfolio, are each referred to herein as the “Adviser”), including their respective fee structures, are in the interests of shareholders and, therefore, recommended to the Board approval of each agreement. Based on the recommendation of the Contract Review Committee, the Board, including a majority of the Independent Trustees, voted to approve continuation of the investment advisory agreement for the Fund and the investment advisory agreement for the Portfolio (together, the “investment advisory agreements”).
Nature, Extent and Quality of Services
In considering whether to approve the investment advisory agreements for the Fund and the Portfolio, the Board evaluated the nature, extent and quality of services provided to the Fund and the Portfolio by the applicable Adviser.
The Board considered each Adviser’s management capabilities and investment processes in light of the types of investments held by the Fund and the Portfolio, including the education, experience and number of investment professionals and other personnel who provide portfolio management, investment research, and similar services to the Fund and the Portfolio, including recent changes to such personnel. In particular, the Board considered the abilities and experience of each Adviser’s investment professionals in investing in equity securities traded in developed, emerging, frontier, and off-index markets. The Board also took into account the resources dedicated to portfolio management and other services, the compensation methods of each Adviser and other factors, including the reputation and resources of the Adviser to recruit and retain highly qualified research, advisory and supervisory investment professionals. In addition, the Board considered the time and attention devoted to the Eaton Vance Funds, including the Fund and the Portfolio, by senior management, as well as the infrastructure, operational capabilities and support staff in place to assist in the portfolio management and operations of the Fund and the Portfolio, including the provision of administrative services. The Board also considered the business-related and other risks to which each Adviser or its affiliates may be subject in managing the Fund and the Portfolio.
The Board noted that, under the terms of the investment advisory agreement of the Fund, EVM may invest assets of the Fund directly in securities, for which it would receive a fee, or in the Portfolio, for which it receives no separate fee but for which BMR receives an advisory fee from the Portfolio.
The Board considered the compliance programs of each Adviser and relevant affiliates thereof. The Board considered compliance and reporting matters regarding, among other things, personal trading by investment professionals, disclosure of portfolio holdings, late trading, frequent trading, portfolio valuation, business continuity and the allocation of investment opportunities. The Board also considered the responses of each Adviser and its affiliates to requests in recent years from regulatory authorities, such as the Securities and Exchange Commission and the Financial Industry Regulatory Authority.
The Board considered other administrative services provided or overseen by EVM and its affiliates, including transfer agency and accounting services. The Board evaluated the benefits to shareholders of investing in a fund that is a part of a large fund complex offering exposure to a variety of asset classes and investment disciplines, as well as the ability, in many cases, to exchange an investment among different funds without incurring additional sales charges.
After consideration of the foregoing factors, among others, the Board concluded that the nature, extent and quality of services provided by each Adviser, taken as a whole, are appropriate and consistent with the terms of the applicable investment advisory agreement.
Fund Performance
The Board compared the Fund’s investment performance to that of comparable funds identified by an independent data provider (the peer group), as well as appropriate benchmark indices. The Board’s review included comparative performance data with respect to the Fund for the one-, three- and five-year periods ended December 31, 2021. In this regard, the Board noted that the performance of the Fund was higher than the median performance of the Fund’s peer group for the three-year period. The Board also noted that the performance of the Fund was higher than its primary, secondary and custom benchmark indexes for the three-year period. The Board concluded that the performance of the Fund was satisfactory.
Management Fees and Expenses
The Board considered contractual fee rates payable by the Fund and by the Portfolio for advisory and administrative services (referred to collectively as “management fees”). As part of its review, the Board considered the Fund’s management fees and total expense ratio for the one-year period ended December 31, 2021, as compared to those of comparable funds, before and after giving effect to any undertaking to waive fees or reimburse expenses. The Board also considered certain factors identified by management in response to inquiries from the Contract Review Committee regarding the Fund’s total expense ratio relative to comparable funds.
After considering the foregoing information, and in light of the nature, extent and quality of the services provided by each Adviser, the Board concluded that the management fees charged for advisory and related services are reasonable.
Profitability and “Fall-Out” Benefits
The Board considered the level of profits realized by each Adviser and relevant affiliates thereof in providing investment advisory and administrative services to the Fund, to the Portfolio and to all Eaton Vance Funds as a group. The Board considered the level of profits realized without regard to marketing support or other payments by each Adviser and its affiliates to third parties in respect of distribution or other services.
The Board concluded that, in light of the foregoing factors and the nature, extent and quality of the services rendered, the profits realized by each Adviser and its affiliates are deemed not to be excessive.
Eaton Vance
Emerging and Frontier Countries Equity Fund
October 31, 2022
Board of Trustees’ Contract Approval — continued
The Board also considered direct or indirect fall-out benefits received by each Adviser and its affiliates in connection with their respective relationships with the Fund and the Portfolio, including the benefits of research services that may be available to each Adviser as a result of securities transactions effected for the Fund and the Portfolio and other investment advisory clients.
Economies of Scale
In reviewing management fees and profitability, the Board also considered the extent to which the applicable Adviser and its affiliates, on the one hand, and the Fund and the Portfolio, on the other hand, can expect to realize benefits from economies of scale as the assets of the Fund and the Portfolio increase. The Board acknowledged the difficulty in accurately measuring the benefits resulting from economies of scale, if any, with respect to the management of any specific fund or group of funds. The Board reviewed data summarizing the increases and decreases in the assets of the Fund and of all Eaton Vance Funds as a group over various time periods, and evaluated the extent to which the total expense ratio of the Fund and the profitability of each Adviser and its affiliates may have been affected by such increases or decreases. Based upon the foregoing, the Board concluded that the Fund currently shares in the benefits from economies of scale, if any, when they are realized by the Adviser. The Board also concluded that the structure of the advisory fees, which include breakpoints at several asset levels, will allow the Fund and the Portfolio to continue to benefit from any economies of scale in the future.
Eaton Vance
Emerging and Frontier Countries Equity Fund
October 31, 2022
Liquidity Risk Management Program
The Fund has implemented a written liquidity risk management program (Program) and related procedures to manage its liquidity in accordance with Rule 22e-4 under the Investment Company Act of 1940, as amended (Liquidity Rule). The Liquidity Rule defines “liquidity risk” as the risk that a fund could not meet requests to redeem shares issued by the fund without significant dilution of the remaining investors’ interests in the fund. The Fund’s Board of Trustees/Directors has designated the investment adviser to serve as the administrator of the Program and the related procedures. The administrator has established a Liquidity Risk Management Oversight Committee (Committee) to perform the functions necessary to administer the Program. As part of the Program, the administrator is responsible for identifying illiquid investments and categorizing the relative liquidity of the Fund’s investments in accordance with the Liquidity Rule. Under the Program, the administrator assesses, manages, and periodically reviews the Fund’s liquidity risk, and is responsible for making certain reports to the Fund’s Board of Trustees/Directors and the Securities and Exchange Commission (SEC) regarding the liquidity of the Fund’s investments, and to notify the Board of Trustees/Directors and the SEC of certain liquidity events specified in the Liquidity Rule. The liquidity of the Fund’s portfolio investments is determined based on a number of factors including, but not limited to, relevant market, trading and investment-specific considerations under the Program.
At a meeting of the Fund’s Board of Trustees/Directors on June 7, 2022, the Committee provided a written report to the Fund’s Board of Trustees/Directors pertaining to the operation, adequacy, and effectiveness of implementation of the Program, as well as the operation of the highly liquid investment minimum (if applicable) for the period January 1, 2021 through December 31, 2021 (Review Period). The Program operated effectively during the Review Period, supporting the administrator’s ability to assess, manage and monitor Fund liquidity risk, including during periods of market volatility and net redemptions. During the Review Period, the Fund met redemption requests on a timely basis.
There can be no assurance that the Program will achieve its objectives in the future. Please refer to the Fund’s prospectus for more information regarding the Fund’s exposure to liquidity risk and other principal risks to which an investment in the Fund may be subject.
Eaton Vance
Emerging and Frontier Countries Equity Fund
October 31, 2022
Management and Organization
Fund Management. The Trustees of Eaton Vance Mutual Funds Trust (the Trust) and Global Macro Capital Opportunities Portfolio (the Portfolio) are responsible for the overall management and supervision of the Trust’s and the Portfolio’s affairs. The Board members and officers of the Trust and the Portfolio are listed below. Except as indicated, each individual has held the office shown or other offices in the same company for the last five years. Board members hold indefinite terms of office. Each Trustee holds office until his or her successor is elected and qualified, subject to a prior death, resignation, retirement, disqualification or removal. Under the terms of the Fund's and the Portfolio's current Trustee retirement policy, an Independent Trustee must retire and resign as a Trustee on the earlier of: (i) the first day of July following his or her 74th birthday; or (ii), with limited exception, December 31st of the 20th year in which he or she has served as a Trustee. However, if such retirement and resignation would cause the Fund and the Portfolio to be out of compliance with Section 16 of the 1940 Act or any other regulations or guidance of the SEC, then such retirement and resignation will not become effective until such time as action has been taken for the Fund and the Portfolio to be in compliance therewith. The “Noninterested Trustees” consist of those Trustees who are not “interested persons” of the Trust/Portfolio, as that term is defined under the 1940 Act. The business address of each Board member and officer is Two International Place, Boston, Massachusetts 02110. As used below, “BMR” refers to Boston Management and Research, “EVC” refers to Eaton Vance Corp., “EV” refers to Eaton Vance, Inc., “EVM” refers to Eaton Vance Management and “EVD” refers to Eaton Vance Distributors, Inc. EV is the trustee of each of EVM and BMR. Effective March 1, 2021, each of EVM, BMR, EVD and EV are indirect, wholly owned subsidiaries of Morgan Stanley. Each officer affiliated with EVM may hold a position with other EVM affiliates that is comparable to his or her position with EVM listed below. Each Trustee oversees 135 funds (with the exception of Mr. Bowser who oversees 110 funds) in the Eaton Vance fund complex (including both funds and portfolios in a hub and spoke structure).
| Name and Year of Birth | Trust/Portfolio
Position(s) | Length of Service | Principal Occupation(s) and Other Directorships
During Past Five Years and Other Relevant Experience |
| Interested Trustee |
Thomas E. Faust Jr.
1958 | Trustee | Since 2007 | Chairman of Morgan Stanley Investment Management, Inc. (MSIM), member of the Board of Managers and President of EV (since 2021), Chief Executive Officer of EVM and BMR. Formerly, Chairman, Chief Executive Officer (2007-2021) and President (2006-2021) of EVC and Director of EVD (2007-2022). Mr. Faust is an interested person because of his positions with MSIM, BMR, EVM and EV, which are affiliates of the Trust and the Portfolio.
Other Directorships. Formerly, Director of EVC (2007-2021) and Hexavest Inc. (investment management firm) (2012-2021). |
| Noninterested Trustees |
Alan C. Bowser(1)
1962 | Trustee | Since 2022 | Chief Diversity Officer, Partner and a member of the Operating Committee, and formerly served as Senior Advisor on Diversity and Inclusion for the firm’s chief executive officer, Co-Head of the Americas Region, and Senior Client Advisor of Bridgewater Associates, an asset management firm (2011- present).
Other Directorships. None. |
Mark R. Fetting
1954 | Trustee | Since 2016 | Private investor. Formerly held various positions at Legg Mason, Inc. (investment management firm) (2000-2012), including President, Chief Executive Officer, Director and Chairman (2008-2012), Senior Executive Vice President (2004-2008) and Executive Vice President (2001-2004). Formerly, President of Legg Mason family of funds (2001-2008). Formerly, Division President and Senior Officer of Prudential Financial Group, Inc. and related companies (investment management firm) (1991-2000).
Other Directorships. None. |
Cynthia E. Frost
1961 | Trustee | Since 2014 | Private investor. Formerly, Chief Investment Officer of Brown University (university endowment) (2000-2012). Formerly, Portfolio Strategist for Duke Management Company (university endowment manager) (1995-2000). Formerly, Managing Director, Cambridge Associates (investment consulting company) (1989-1995). Formerly, Consultant, Bain and Company (management consulting firm) (1987-1989). Formerly, Senior Equity Analyst, BA Investment Management Company (1983-1985).
Other Directorships. None. |
George J. Gorman
1952 | Chairperson
of the Board
and Trustee | Since 2021
(Chairperson) and
2014 (Trustee) | Principal at George J. Gorman LLC (consulting firm). Formerly, Senior Partner at Ernst & Young LLP (a registered public accounting firm) (1974-2009).
Other Directorships. None. |
Eaton Vance
Emerging and Frontier Countries Equity Fund
October 31, 2022
Management and Organization — continued
| Name and Year of Birth | Trust/Portfolio
Position(s) | Length of Service | Principal Occupation(s) and Other Directorships
During Past Five Years and Other Relevant Experience |
| Noninterested Trustees (continued) |
Valerie A. Mosley
1960 | Trustee | Since 2014 | Chairwoman and Chief Executive Officer of Valmo Ventures (a consulting and investment firm). Founder of Upward Wealth, Inc., dba BrightUp, a fintech platform. Formerly, Partner and Senior Vice President, Portfolio Manager and Investment Strategist at Wellington Management Company, LLP (investment management firm) (1992-2012). Formerly, Chief Investment Officer, PG Corbin Asset Management (1990-1992). Formerly worked in institutional corporate bond sales at Kidder Peabody (1986-1990).
Other Directorships. Director of DraftKings, Inc. (digital sports entertainment and gaming company) (since September 2020). Director of Envestnet, Inc. (provider of intelligent systems for wealth management and financial wellness) (since 2018). Formerly, Director of Dynex Capital, Inc. (mortgage REIT) (2013-2020) and Director of Groupon, Inc. (e-commerce provider) (2020-2022). |
Keith Quinton
1958 | Trustee | Since 2018 | Private investor, researcher and lecturer. Formerly, Independent Investment Committee Member at New Hampshire Retirement System (2017-2021). Formerly, Portfolio Manager and Senior Quantitative Analyst at Fidelity Investments (investment management firm) (2001-2014).
Other Directorships. Formerly, Director (2016-2021) and Chairman (2019-2021) of New Hampshire Municipal Bond Bank. |
Marcus L. Smith
1966 | Trustee | Since 2018 | Private investor and independent corporate director. Formerly, Chief Investment Officer, Canada (2012-2017), Chief Investment Officer, Asia (2010-2012), Director of Asian Research (2004-2010) and portfolio manager (2001-2017) at MFS Investment Management (investment management firm).
Other Directorships. Director of First Industrial Realty Trust, Inc. (an industrial REIT) (since 2021). Director of MSCI Inc. (global provider of investment decision support tools) (since 2017). Formerly, Director of DCT Industrial Trust Inc. (logistics real estate company) (2017-2018). |
Susan J. Sutherland
1957 | Trustee | Since 2015 | Private investor. Director of Ascot Group Limited and certain of its subsidiaries (insurance and reinsurance) (since 2017). Formerly, Director of Hagerty Holding Corp. (insurance) (2015-2018) and Montpelier Re Holdings Ltd. (insurance and reinsurance) (2013-2015). Formerly, Associate, Counsel and Partner at Skadden, Arps, Slate, Meagher & Flom LLP (law firm) (1982-2013).
Other Directorships. Director of Kairos Acquisition Corp. (insurance/InsurTech acquisition company) (since 2021). |
Scott E. Wennerholm
1959 | Trustee | Since 2016 | Private investor. Formerly, Trustee at Wheelock College (postsecondary institution) (2012-2018). Formerly, Consultant at GF Parish Group (executive recruiting firm) (2016-2017). Formerly, Chief Operating Officer and Executive Vice President at BNY Mellon Asset Management (investment management firm) (2005-2011). Formerly, Chief Operating Officer and Chief Financial Officer at Natixis Global Asset Management (investment management firm) (1997-2004). Formerly, Vice President at Fidelity Investments Institutional Services (investment management firm) (1994-1997).
Other Directorships. None. |
Nancy A. Wiser(1)
1967 | Trustee | Since 2022 | Formerly, Executive Vice President and the Global Head of Operations at Wells Fargo Asset Management (2011-2021).
Other Directorships. None. |
| Name and Year of Birth | Trust/Portfolio
Position(s) | Length of Service | Principal Occupation(s)
During Past Five Years |
| Principal Officers who are not Trustees |
Eric A. Stein
1980 | President | Since 2020 | Vice President and Chief Investment Officer, Fixed Income of EVM and BMR. Prior to November 1, 2020, Mr. Stein was a co-Director of Eaton Vance’s Global Income Investments. Also Vice President of Calvert Research and Management (“CRM”). |
Edward J. Perkin
1972 | Vice President and
Chief Legal Officer | Since 2009 | Vice President of EVM and BMR. Also Vice President of CRM. |
James F. Kirchner
1967 | Treasurer | Since 2007 | Vice President of EVM and BMR. Also Vice President of CRM. |
Eaton Vance
Emerging and Frontier Countries Equity Fund
October 31, 2022
Management and Organization — continued
| Name and Year of Birth | Trust/Portfolio
Position(s) | Length of Service | Principal Occupation(s)
During Past Five Years |
| Principal Officers who are not Trustees (continued) |
Nicholas Di Lorenzo
1987 | Secretary | Since 2022 | Formerly, associate (2012-2021) and counsel (2022) at Dechert LLP. |
Richard F. Froio
1968 | Chief Compliance
Officer | Since 2017 | Vice President of EVM and BMR since 2017. Formerly, Deputy Chief Compliance Officer (Adviser/Funds) and Chief Compliance Officer (Distribution) at PIMCO (2012-2017) and Managing Director at BlackRock/Barclays Global Investors (2009-2012). |
(1) Mr. Bowser and Ms. Wiser began serving as Trustees effective April 4, 2022.
The SAI for the Fund includes additional information about the Trustees and officers of the Fund and the Portfolio and can be obtained without charge on Eaton Vance’s website at www.eatonvance.com or by calling 1-800-262-1122.
| FACTS | WHAT DOES EATON VANCE DO WITH YOUR
PERSONAL INFORMATION? |
| Why? | Financial companies choose how they share your personal information. Federal law gives consumers the right to limit some but not all sharing. Federal law also requires us to tell you how we collect, share, and protect your personal information. Please read this notice carefully to understand what we do. |
| |
| What? | The types of personal information we collect and share depend on the product or service you have with us. This information can include:■ Social Security number and income
■ investment experience and risk tolerance
■ checking account number and wire transfer instructions |
| |
| How? | All financial companies need to share customers’ personal information to run their everyday business. In the section below, we list the reasons financial companies can share their customers’ personal information; the reasons Eaton Vance chooses to share; and whether you can limit this sharing. |
Reasons we can share your
personal information | Does Eaton Vance
share? | Can you limit
this sharing? |
| For our everyday business purposes — such as to process your transactions, maintain your account(s), respond to court orders and legal investigations, or report to credit bureaus | Yes | No |
| For our marketing purposes — to offer our products and services to you | Yes | No |
| For joint marketing with other financial companies | No | We don’t share |
| For our investment management affiliates’ everyday business purposes — information about your transactions, experiences, and creditworthiness | Yes | Yes |
| For our affiliates’ everyday business purposes — information about your transactions and experiences | Yes | No |
| For our affiliates’ everyday business purposes — information about your creditworthiness | No | We don’t share |
| For our investment management affiliates to market to you | Yes | Yes |
| For our affiliates to market to you | No | We don’t share |
| For nonaffiliates to market to you | No | We don’t share |
To limit our
sharing | Call toll-free 1-800-262-1122 or email: EVPrivacy@eatonvance.comPlease note:If you are a new customer, we can begin sharing your information 30 days from the date we sent this notice. When you are no longer our customer, we continue to share your information as described in this notice. However, you can contact us at any time to limit our sharing. |
| Questions? | Call toll-free 1-800-262-1122 or email: EVPrivacy@eatonvance.com |
| Privacy Notice — continued | April 2021 |
| Who we are |
| Who is providing this notice? | Eaton Vance Management, Eaton Vance Distributors, Inc., Eaton Vance Trust Company, Eaton Vance Management (International) Limited, Eaton Vance Advisers International Ltd., Eaton Vance Global Advisors Limited, Eaton Vance Management’s Real Estate Investment Group, Boston Management and Research, Calvert Research and Management, Eaton Vance and Calvert Fund Families and our investment advisory affiliates (“Eaton Vance”) (see Investment Management Affiliates definition below) |
| What we do |
How does Eaton Vance
protect my personal
information? | To protect your personal information from unauthorized access and use, we use security measures that comply with federal law. These measures include computer safeguards and secured files and buildings. We have policies governing the proper handling of customer information by personnel and requiring third parties that provide support to adhere to appropriate security standards with respect to such information. |
How does Eaton Vance
collect my personal
information? | We collect your personal information, for example, when you■ open an account or make deposits or withdrawals from your account
■ buy securities from us or make a wire transfer
■ give us your contact informationWe also collect your personal information from others, such as credit bureaus, affiliates, or other companies. |
| Why can’t I limit all sharing? | Federal law gives you the right to limit only■ sharing for affiliates’ everyday business purposes — information about your creditworthiness
■ affiliates from using your information to market to you
■ sharing for nonaffiliates to market to youState laws and individual companies may give you additional rights to limit sharing. See below for more on your rights under state law. |
| Definitions |
Investment Management
Affiliates | Eaton Vance Investment Management Affiliates include registered investment advisers, registered broker- dealers, and registered and unregistered funds. Investment Management Affiliates does not include entities associated with Morgan Stanley Wealth Management, such as Morgan Stanley Smith Barney LLC and Morgan Stanley & Co. |
| Affiliates | Companies related by common ownership or control. They can be financial and nonfinancial companies.■ Our affiliates include companies with a Morgan Stanley name and financial companies such as Morgan Stanley Smith Barney LLC and Morgan Stanley & Co. |
| Nonaffiliates | Companies not related by common ownership or control. They can be financial and nonfinancial companies.■ Eaton Vance does not share with nonaffiliates so they can market to you. |
| Joint marketing | A formal agreement between nonaffiliated financial companies that together market financial products or services to you.■ Eaton Vance doesn’t jointly market. |
| Other important information |
| Vermont: Except as permitted by law, we will not share personal information we collect about Vermont residents with Nonaffiliates unless you provide us with your written consent to share such information.California: Except as permitted by law, we will not share personal information we collect about California residents with Nonaffiliates and we will limit sharing such personal information with our Affiliates to comply with California privacy laws that apply to us. |
Delivery of Shareholder Documents. The Securities and Exchange Commission (SEC) permits funds to deliver only one copy of shareholder documents, including prospectuses, proxy statements and shareholder reports, to fund investors with multiple accounts at the same residential or post office box address. This practice is often called “householding” and it helps eliminate duplicate mailings to shareholders. Eaton Vance, or your financial intermediary, may household the mailing of your documents indefinitely unless you instruct Eaton Vance, or your financial intermediary, otherwise. If you would prefer that your Eaton Vance documents not be householded, please contact Eaton Vance at 1-800-262-1122, or contact your financial intermediary. Your instructions that householding not apply to delivery of your Eaton Vance documents will typically be effective within 30 days of receipt by Eaton Vance or your financial intermediary.
Portfolio Holdings. Each Eaton Vance Fund and its underlying Portfolio(s) (if applicable) files a schedule of portfolio holdings on Part F to Form N-PORT with the SEC. Certain information filed on Form N-PORT may be viewed on the Eaton Vance website at www.eatonvance.com, by calling Eaton Vance at 1-800-262-1122 or in the EDGAR database on the SEC’s website at www.sec.gov.
Proxy Voting. From time to time, funds are required to vote proxies related to the securities held by the funds. The Eaton Vance Funds or their underlying Portfolios (if applicable) vote proxies according to a set of policies and procedures approved by the Funds’ and Portfolios’ Boards. You may obtain a description of these policies and procedures and information on how the Funds or Portfolios voted proxies relating to portfolio securities during the most recent 12-month period ended June 30, without charge, upon request, by calling 1-800-262-1122 and by accessing the SEC’s website at www.sec.gov.
This Page Intentionally Left Blank
This Page Intentionally Left Blank
This Page Intentionally Left Blank
Investment Adviser of Global Macro Capital Opportunities Portfolio
Boston Management and Research
Two International Place
Boston, MA 02110
Investment Adviser and Administrator of Eaton Vance
Emerging and Frontier Countries Equity Fund
Eaton Vance Management
Two International Place
Boston, MA 02110
Principal Underwriter*
Eaton Vance Distributors, Inc.
Two International Place
Boston, MA 02110
(617) 482-8260
Custodian
State Street Bank and Trust Company
State Street Financial Center, One Lincoln Street
Boston, MA 02111
Transfer Agent
BNY Mellon Investment Servicing (US) Inc.
Attn: Eaton Vance Funds
P.O. Box 9653
Providence, RI 02940-9653
(800) 262-1122
Independent Registered Public Accounting Firm
Deloitte & Touche LLP
200 Berkeley Street
Boston, MA 02116-5022
Fund Offices
Two International Place
Boston, MA 02110
* FINRA BrokerCheck. Investors may check the background of their Investment Professional by contacting the Financial Industry Regulatory Authority (FINRA). FINRA BrokerCheck is a free tool to help investors check the professional background of current and former FINRA-registered securities firms and brokers. FINRA BrokerCheck is available by calling 1-800-289-9999 and at www.FINRA.org. The FINRA BrokerCheck brochure describing this program is available to investors at www.FINRA.org.
Item 2. Code of Ethics
The registrant (sometimes referred to as the “Fund”) has adopted a code of ethics applicable to its Principal Executive Officer, Principal Financial Officer and Principal Accounting Officer. The registrant undertakes to provide a copy of such code of ethics to any person upon request, without charge, by calling 1-800-262-1122. The registrant has not amended the code of ethics as described in Form N-CSR during the period covered by this report. The registrant has not granted any waiver, including an implicit waiver, from a provision of the code of ethics as described in Form N-CSR during the period covered by this report.
Item 3. Audit Committee Financial Expert
The registrant’s Board of Trustees (the “Board”) has designated George J. Gorman and Scott E. Wennerholm, each an independent trustee, as audit committee financial experts. Mr. Gorman is a certified public accountant who is the Principal at George J. Gorman LLC (a consulting firm). Previously, Mr. Gorman served in various capacities at Ernst & Young LLP (a registered public accounting firm), including as Senior Partner. Mr. Gorman also has experience serving as an independent trustee and audit committee financial expert of other
mutual fund complexes. Mr. Wennerholm is a private investor. Previously, Mr. Wennerholm served as a Trustee at Wheelock College (postsecondary institution), as a Consultant at GF Parish Group (executive recruiting firm), Chief Operating Officer and Executive Vice President at BNY Mellon Asset Management (investment management firm), Chief Operating Officer and Chief Financial Officer at Natixis Global Asset Management (investment management firm), and Vice President at Fidelity Investments Institutional Services (investment management firm).
Item 4. Principal Accountant Fees and Services
Eaton Vance Emerging and Frontier Countries Equity Fund, Eaton Vance Floating-Rate Fund, Eaton Vance Floating-Rate Advantage Fund, Eaton Vance Floating-Rate & High Income Fund, Eaton Vance Global Bond Fund, Eaton Vance Global Income Builder Fund, Eaton Vance Global Small-Cap Equity Fund, Eaton Vance Government Opportunities Fund, Eaton Vance High Income Opportunities Fund, Eaton Vance Multi-Asset Credit Fund, Eaton Vance Short Duration Government Income Fund, Eaton Vance Short Duration High Income Fund, Eaton Vance Tax-Managed Equity Asset Allocation Fund, Eaton Vance Tax-Managed Global Dividend Income Fund, Eaton Vance Tax-Managed Multi-Cap Growth Fund, Eaton Vance Tax-Managed Small-Cap Fund, Eaton Vance Tax-Managed Value Fund and Parametric Tax-Managed International Equity Fund (the “Fund(s)”) are series of Eaton Vance Mutual Funds Trust (the “Trust”), a Massachusetts business trust, which, including the Funds, contains a total of 33 series (the “Series”). The Trust is registered under the Investment Company Act of 1940 as an open-end management investment company. This Form N-CSR relates to the Funds’ annual reports.
(a)-(d)
The following table presents the aggregate fees billed to the fund for the fund’s fiscal years ended October 31, 2021 and October 31, 2022 by the Fund’s principal accountant, Deloitte and Touche LLP (“D&T”), for professional services rendered for the audit of the fund’s annual financial statements and fees billed for other services rendered by D&T during such periods.
| | | | | | | | |
| Eaton Vance Emerging and Frontier Countries Equity Fund | | | | |
Fiscal Years Ended | | 10/31/21 | | | 10/31/22 | |
Audit Fees | | $ | 15,530 | | | $ | 17,850 | |
Audit-Related Fees(1) | | $ | 0 | | | $ | 0 | |
Tax Fees(2) | | $ | 9,102 | | | $ | 350 | |
All Other Fees(3) | | $ | 0 | | | $ | 0 | |
| | | | | | | | |
Total | | $ | 24,452 | | | $ | 18,200 | |
| | | | | | | | |
| Eaton Vance Floating-Rate Fund | | | | |
Fiscal Years Ended | | 10/31/21 | | | 10/31/22 | |
Audit Fees | | $ | 27,250 | | | $ | 30,650 | |
Audit-Related Fees(1) | | $ | 0 | | | $ | 0 | |
Tax Fees(2) | | $ | 17,229 | | | $ | 1,650 | |
All Other Fees(3) | | $ | 0 | | | $ | 0 | |
| | | | | | | | |
Total | | $ | 44,479 | | | $ | 32,300 | |
| | | | | | | | |
| Eaton Vance Floating-Rate Advantage Fund | | | | |
Fiscal Years Ended | | 10/31/21 | | | 10/31/22 | |
Audit Fees | | $ | 27,050 | | | $ | 30,450 | |
Audit-Related Fees(1) | | $ | 0 | | | $ | 0 | |
Tax Fees(2) | | $ | 15,038 | | | $ | 1,650 | |
All Other Fees(3) | | $ | 0 | | | $ | 0 | |
| | | | | | | | |
Total | | $ | 42,088 | | | $ | 32,100 | |
| | | | | | | | |
| | | | | | | | |
| Eaton Vance Floating-Rate & High Income Fund | | | | |
Fiscal Years Ended | | 10/31/21 | | | 10/31/22 | |
Audit Fees | | $ | 29,150 | | | $ | 34,700 | |
Audit-Related Fees(1) | | $ | 0 | | | $ | 0 | |
Tax Fees(2) | | $ | 14,665 | | | $ | 1,650 | |
All Other Fees(3) | | $ | 0 | | | $ | 0 | |
| | | | | | | | |
Total | | $ | 43,815 | | | $ | 36,350 | |
| | | | | | | | |
| Eaton Vance Global Bond Fund | | | | |
Fiscal Years Ended | | 10/31/21 | | | 10/31/22 | |
Audit Fees | | $ | 22,950 | | | $ | 26,050 | |
Audit-Related Fees(1) | | $ | 0 | | | $ | 0 | |
Tax Fees(2) | | $ | 8,065 | | | $ | 350 | |
All Other Fees(3) | | $ | 0 | | | $ | 0 | |
| | | | | | | | |
Total | | $ | 31,015 | | | $ | 26,400 | |
| | | | | | | | |
| Eaton Vance Global Income Builder Fund | | | | |
Fiscal Years Ended | | 10/31/21 | | | 10/31/22 | |
Audit Fees | | $ | 15,150 | | | $ | 17,650 | |
Audit-Related Fees(1) | | $ | 0 | | | $ | 0 | |
Tax Fees(2) | | $ | 7,353 | | | $ | 1,650 | |
All Other Fees(3) | | $ | 0 | | | $ | 0 | |
| | | | | | | | |
Total | | $ | 22,503 | | | $ | 19,300 | |
| | | | | | | | |
| Eaton Vance Global Small-Cap Equity Fund | | | | |
Fiscal Years Ended | | 10/31/21 | | | 10/31/22 | |
Audit Fees | | $ | 28,750 | | | $ | 32,250 | |
Audit-Related Fees(1) | | $ | 0 | | | $ | 0 | |
Tax Fees(2) | | $ | 11,299 | | | $ | 2,650 | |
All Other Fees(3) | | $ | 0 | | | $ | 0 | |
| | | | | | | | |
Total | | $ | 40,049 | | | $ | 34,900 | |
| | | | | | | | |
| Eaton Vance Government Opportunities Fund | | | | |
Fiscal Years Ended | | 10/31/21 | | | 10/31/22 | |
Audit Fees | | $ | 56,550 | | | $ | 61,433 | |
Audit-Related Fees(1) | | $ | 0 | | | $ | 0 | |
Tax Fees(2) | | $ | 13,729 | | | $ | 350 | |
All Other Fees(3) | | $ | 0 | | | $ | 0 | |
| | | | | | | | |
Total | | $ | 70,279 | | | $ | 61,783 | |
| | | | | | | | |
| Eaton Vance High Income Opportunities Fund | | | | |
Fiscal Years Ended | | 10/31/21 | | | 10/31/22 | |
Audit Fees | | $ | 25,150 | | | $ | 28,350 | |
Audit-Related Fees(1) | | $ | 0 | | | $ | 0 | |
Tax Fees(2) | | $ | 8,934 | | | $ | 350 | |
All Other Fees(3) | | $ | 0 | | | $ | 0 | |
| | | | | | | | |
Total | | $ | 34,084 | | | $ | 28,700 | |
| | | | | | | | |
| | | | | | | | |
Eaton Vance Multi-Asset Credit Fund Fiscal Years Ended | | 10/31/21 | | | 10/31/22 | |
Audit Fees | | $ | 74,061 | | | $ | 81,233 | |
Audit-Related Fees(1) | | $ | 0 | | | $ | 0 | |
Tax Fees(2) | | $ | 18,71 | | | $ | 4,750 | |
All Other Fees(3) | | $ | 0 | | | $ | 0 | |
| | | | | | | | |
Total | | $ | 92,932 | | | $ | 85,983 | |
| | | | | | | | |
| Eaton Vance Short Duration Government Income Fund | | | | |
Fiscal Years Ended | | 10/31/21 | | | 10/31/22 | |
Audit Fees | | $ | 89,050 | | | $ | 95,367 | |
Audit-Related Fees(1) | | $ | 0 | | | $ | 0 | |
Tax Fees(2) | | $ | 13,861 | | | $ | 350 | |
All Other Fees(3) | | $ | 0 | | | $ | 0 | |
| | | | | | | | |
Total | | $ | 102,911 | | | $ | 95,717 | |
| | | | | | | | |
| Eaton Vance Short Duration High Income Fund | | | | |
Fiscal Years Ended | | 10/31/21 | | | 10/31/22 | |
Audit Fees | | $ | 50,911 | | | $ | 58,650 | |
Audit-Related Fees(1) | | $ | 0 | | | $ | 0 | |
Tax Fees(2) | | $ | 18,998 | | | $ | 350 | |
All Other Fees(3) | | $ | 0 | | | $ | 0 | |
| | | | | | | | |
| | | | | | | | |
Total | | $ | 69,909 | | | $ | 59,000 | |
| | | | | | | | |
| Eaton Vance Tax-Managed Equity Asset Allocation Fund | | | | |
Fiscal Years Ended | | 10/31/21 | | | 10/31/22 | |
Audit Fees | | $ | 39,450 | | | $ | 43,650 | |
Audit-Related Fees(1) | | $ | 0 | | | $ | 0 | |
Tax Fees(2) | | $ | 20,037 | | | $ | 3,150 | |
All Other Fees(3) | | $ | 0 | | | $ | 0 | |
| | | | | | | | |
Total | | $ | 59,487 | | | $ | 46,800 | |
| | | | | | | | |
| Eaton Vance Tax-Managed Global Dividend Income Fund | | | | |
Fiscal Years Ended | | 10/31/21 | | | 10/31/22 | |
Audit Fees | | $ | 39,750 | | | $ | 43,950 | |
Audit-Related Fees(1) | | $ | 0 | | | $ | 0 | |
1Tax Fees(2) | | $ | 10,604 | | | $ | 6,200 | |
All Other Fees(3) | | $ | 0 | | | $ | 0 | |
| | | | | | | | |
Total | | $ | 50,354 | | | $ | 50,150 | |
| | | | | | | | |
| Eaton Vance Tax-Managed Multi-Cap Growth Fund | | | | |
Fiscal Years Ended | | 10/31/21 | | | 10/31/22 | |
Audit Fees | | $ | 15,050 | | | $ | 17,550 | |
Audit-Related Fees(1) | | $ | 0 | | | $ | 0 | |
Tax Fees(2) | | $ | 6,985 | | | $ | 1,650 | |
All Other Fees(3) | | $ | 0 | | | $ | 0 | |
| | | | | | | | |
Total | | $ | 22,035 | | | $ | 19,200 | |
| | | | | | | | |
| Eaton Vance Tax-Managed Small-Cap Fund | | | | |
Fiscal Years Ended | | 10/31/21 | | | 10/31/22 | |
Audit Fees | | $ | 17,050 | | | $ | 19,750 | |
Audit-Related Fees(1) | | $ | 0 | | | $ | 0 | |
Tax Fees(2) | | $ | 5,675 | | | $ | 1,650 | |
All Other Fees(3) | | $ | 0 | | | $ | 0 | |
| | | | | | | | |
Total | | $ | 22,725 | | | $ | 21,400 | |
| | | | | | | | |
| | | | | | | | |
Eaton Vance Tax-Managed Value Fund Fiscal Years Ended | | 10/31/21 | | | 10/31/22 | |
Audit Fees | | $ | 18,750 | | | $ | 21,550 | |
Audit-Related Fees(1) | | $ | 0 | | | $ | 0 | |
Tax Fees(2) | | $ | 6,975 | | | $ | 1,300 | |
All Other Fees(3) | | $ | 0 | | | $ | 0 | |
| | | | | | | | |
Total | | $ | 25,725 | | | $ | 22,850 | |
| | | | | | | | |
| Parametric Tax-Managed International Equity Fund | | | | |
Fiscal Years Ended | | 10/31/21 | | | 10/31/22 | |
Audit Fees | | $ | 15,150 | | | $ | 17,650 | |
Audit-Related Fees(1) | | $ | 0 | | | $ | 0 | |
Tax Fees(2) | | $ | 6,836 | | | $ | 1,650 | |
All Other Fees(3) | | $ | 0 | | | $ | 0 | |
| | | | | | | | |
Total | | $ | 21,986 | | | $ | 19,300 | |
| | | | | | | | |
| (1) | Audit-related fees consist of the aggregate fees billed for assurance and related services that are reasonably related to the performance of the audit of financial statements and are not reported under the category of audit fees. |
| (2) | Tax fees consist of the aggregate fees billed for professional services rendered by the principal accountant relating to tax compliance, tax advice, and tax planning and specifically include fees for tax return preparation and other related tax compliance/planning matters. |
| (3) | All other fees consist of the aggregate fees billed for products and services provided by the principal accountant other than audit, audit-related, and tax services. |
The various Series comprising the Trust have differing fiscal year ends (January 31, February 28, July 31, September 30, October 31, November 30, or December 31). The following table presents the aggregate audit, audit-related, tax, and other fees billed to all of the Series in the Trust by D&T for the last two fiscal years of each Series.
| | | | | | | | | | | | | | | | | | | | | | | | | | | | | | | | | | | | | | | | | | | | |
Fiscal
Years
Ended | | 12/31/20 | | | 1/31/21 | | | 2/28/21 | | | 9/30/21 | | | 10/31/21 | | | 11/30/21 | | | 12/31/21 | | | 1/31/22 | | | 2/28/22 | | | 9/30/22 | | | 10/31/22 | |
Audit Fees | | $ | 106,700 | | | $ | 201,300 | | | $ | 26,250 | | | $ | 91,600 | | | $ | 729,872 | | | $ | 37,050 | | | $ | 111,700 | | | $ | 198,900 | | | $ | 24,050 | | | $ | 104,200 | | | $ | 816,633 | |
Audit-Related Fees(1) | | $ | 0 | | | $ | 0 | | | $ | 0 | | | $ | 0 | | | $ | 0 | | | $ | 0 | | | $ | 0 | | | $ | 0 | | | $ | 0 | | | $ | 0 | | | $ | 0 | |
Tax Fees(2) | | $ | 60,338 | | | $ | 73,973 | | | $ | 10,103 | | | $ | 23,248 | | | $ | 271,569 | | | $ | 13,000 | | | $ | 61,738 | | | $ | 78,353 | | | $ | 8,478 | | | $ | 5,000 | | | $ | 44,100 | |
All Other Fees(3) | | $ | 0 | | | $ | 0 | | | $ | 0 | | | $ | 0 | | | $ | 0 | | | $ | 0 | | | $ | 0 | | | $ | 0 | | | $ | 0 | | | $ | 0 | | | $ | 0 | |
| | | | | | | | | | | | | | | | | | | | | | | | | | | | | | | | | | | | | | | | | | | | |
Total | | $ | 167,038 | | | $ | 275,273 | | | $ | 36,353 | | | $ | 114,848 | | | $ | 1,001,441 | | | $ | 50,050 | | | $ | 173,438 | | | $ | 277,253 | | | $ | 32,528 | | | $ | 109,200 | | | $ | 860,733 | |
| | | | | | | | | | | | | | | | | | | | | | | | | | | | | | | | | | | | | | | | | | | | |
| (1) | Audit-related fees consist of the aggregate fees billed for assurance and related services that are reasonably related to the performance of the audit of the registrant’s financial statements and are not reported under the category of audit fees. Includes consent fee for N-14 registration statements related to fund mergers. |
| (2) | Tax fees consist of the aggregate fees billed for professional services rendered by the principal accountant relating to tax compliance, tax advice, and tax planning and specifically include fees for tax return preparation and other related tax compliance/planning matters. |
| (3) | All other fees consist of the aggregate fees billed for products and services provided by the principal accountant other than audit, audit-related, and tax services. |
(e)(1) The registrant’s audit committee has adopted policies and procedures relating to the pre-approval of services provided by the registrant’s principal accountant (the “Pre-Approval Policies”). The Pre-Approval Policies establish a framework intended to assist the audit committee in the proper discharge of its pre-approval responsibilities. As a general matter, the Pre-Approval Policies (i) specify certain types of audit, audit-related, tax, and other services determined to be pre-approved by the audit committee; and (ii) delineate specific procedures governing the mechanics of the pre-approval process, including the approval and monitoring of audit and non-audit service fees. Unless a service is specifically pre-approved under the Pre-Approval Policies, it must be separately pre-approved by the audit committee.
The Pre-Approval Policies and the types of audit and non-audit services pre-approved therein must be reviewed and ratified by the registrant’s audit committee at least annually. The registrant’s audit committee maintains full responsibility for the appointment, compensation, and oversight of the work of the registrant’s principal accountant.
(e)(2) No services described in paragraphs (b)-(d) above were approved by the registrant’s audit committee pursuant to the “de minimis exception” set forth in Rule 2-01(c)(7)(i)(C) of Regulation S-X.
(f) Not applicable.
(g) The following table presents (i) the aggregate non-audit fees (i.e., fees for audit-related, tax, and other services) billed for services rendered to all of the Series in the Trust by D&T for the last two fiscal years of each Series; and (ii) the aggregate non-audit fees (i.e., fees for audit-related, tax, and other services) billed to the Eaton Vance organization by D&T for the last two fiscal years of each Series.
| | | | | | | | | | | | | | | | | | | | | | | | | | | | | | | | | | | | | | | | | | | | |
Fiscal Years
Ended | | 12/31/20 | | | 1/31/21 | | | 2/28/21 | | | 9/30/21 | | | 10/31/21 | | | 11/30/21 | | | 12/31/21 | | | 1/31/22 | | | 2/28/22 | | | 9/30/22 | | | 10/31/22 | |
Registrant(1) | | $ | 60,338 | | | $ | 73,973 | | | $ | 10,103 | | | $ | 23,248 | | | $ | 271,569 | | | $ | 13,000 | | | $ | 61,738 | | | $ | 78,353 | | | $ | 8,478 | | | $ | 5,000 | | | $ | 44,100 | |
Eaton Vance(2) | | $ | 150,300 | | | $ | 150,300 | | | $ | 150,300 | | | $ | 51,800 | | | $ | 51,800 | | | $ | 51,800 | | | $ | 51,800 | | | $ | 51,800 | | | $ | 51,800 | | | $ | 52,836 | | | $ | 52,836 | |
| (1) | Includes all of the Series of the Trust. During the fiscal years reported above, certain of the Funds were “feeder” funds in a “master-feeder” fund structure or funds of funds. |
| (2) | Various subsidiaries of Morgan Stanley act in either an investment advisory and/or service provider capacity with respect to the Series and/or their respective “master” funds (if applicable). |
(h) The registrant’s audit committee has considered whether the provision by the registrant’s principal accountant of non-audit services to the registrant’s investment adviser and any entity controlling, controlled by, or under common control with the adviser that provides ongoing services to the registrant that were not pre-approved pursuant to Rule 2-01(c)(7)(ii) of Regulation S-X is compatible with maintaining the principal accountant’s independence.
Item 5. Audit Committee of Listed Registrants
Not applicable.
Item 6. Schedule of Investments
Please see schedule of investments contained in the Report to Stockholders included under Item 1 of this Form N-CSR.
Item 7. Disclosure of Proxy Voting Policies and Procedures for Closed-End Management Investment Companies
Not applicable.
Item 8. Portfolio Managers of Closed-End Management Investment Companies
Not applicable.
Item 9. Purchases of Equity Securities by Closed-End Management Investment Company and Affiliated Purchasers
Not applicable.
Item 10. Submission of Matters to a Vote of Security Holders
No material changes.
Item 11. Controls and Procedures
(a) It is the conclusion of the registrant’s principal executive officer and principal financial officer that the effectiveness of the registrant’s current disclosure controls and procedures (such disclosure controls and procedures having been evaluated within 90 days of the date of this filing) provide reasonable assurance that the information required to be disclosed by the registrant has been recorded, processed, summarized and reported within the time period specified in the Commission’s rules and forms and that the information required to be disclosed by the registrant has been accumulated and communicated to the registrant’s principal executive officer and principal financial officer in order to allow timely decisions regarding required disclosure.
(b) There have been no changes in the registrant’s internal controls over financial reporting during the period covered by this report that has materially affected, or is reasonably likely to materially affect, the registrant’s internal control over financial reporting.
Item 12. Disclosure of Securities Lending Activities for Closed-End Management Investment Companies
Not applicable.
Item 13. Exhibits
Signatures
Pursuant to the requirements of the Securities Exchange Act of 1934 and the Investment Company Act of 1940, the registrant has duly caused this report to be signed on its behalf by the undersigned, thereunto duly authorized.
| | |
| Eaton Vance Mutual Funds Trust |
| |
| By: | | /s/ Eric A. Stein |
| | Eric A. Stein |
| | President |
|
| Date: December 28, 2022 |
Pursuant to the requirements of the Securities Exchange Act of 1934 and the Investment Company Act of 1940, this report has been signed below by the following persons on behalf of the registrant and in the capacities and on the dates indicated.
| | |
| By: | | /s/ James F. Kirchner |
| | James F. Kirchner |
| | Treasurer |
|
| Date: December 28, 2022 |
| |
| By: | | /s/ Eric A. Stein |
| | Eric A. Stein |
| | President |
|
| Date: December 28, 2022 |