UNITED STATES
SECURITIES AND EXCHANGE COMMISSION
Washington, D.C. 20549
Form N-CSR
CERTIFIED SHAREHOLDER REPORT OF REGISTERED
MANAGEMENT INVESTMENT COMPANIES
Investment Company Act File Number: 811-04015
Eaton Vance Mutual Funds Trust
(Exact Name of Registrant as Specified in Charter)
Two International Place, Boston, Massachusetts 02110
(Address of Principal Executive Offices)
Deidre E. Walsh
Two International Place, Boston, Massachusetts 02110
(Name and Address of Agent for Services)
(617) 482-8260
(Registrant’s Telephone Number)
October 31
Date of Fiscal Year End
October 31, 2022
Date of Reporting Period
| Item 1. | Reports to Stockholders |
Eaton Vance
Emerging Markets Local Income Fund
Annual Report
October 31, 2022
Commodity Futures Trading Commission Registration. The Commodity Futures Trading Commission (“CFTC”) has adopted regulations that subject registered investment companies and advisers to regulation by the CFTC if a fund invests more than a prescribed level of its assets in certain CFTC-regulated instruments (including futures, certain options and swap agreements) or markets itself as providing investment exposure to such instruments. The adviser is registered with the CFTC as a commodity pool operator with respect to its management of the Fund. As the commodity pool operator of the Fund, the adviser has claimed relief under the Commodity Exchange Act from certain reporting and recordkeeping requirements. The adviser is also registered as a commodity trading advisor.
Fund shares are not insured by the FDIC and are not deposits or other obligations of, or guaranteed by, any depository institution. Shares are subject to investment risks, including possible loss of principal invested.
This report must be preceded or accompanied by a current summary prospectus or prospectus. Before investing, investors should consider carefully the investment objective, risks, and charges and expenses of a mutual fund. This and other important information is contained in the summary prospectus and prospectus, which can be obtained from a financial intermediary. Prospective investors should read the prospectus carefully before investing. For further information, please call 1-800-262-1122.
Annual Report October 31, 2022
Eaton Vance
Emerging Markets Local Income Fund
Eaton Vance
Emerging Markets Local Income Fund
October 31, 2022
Management’s Discussion of Fund Performance†
Economic and Market Conditions
The world’s equity and fixed-income markets posted broad losses during the 12-month period ended October 31, 2022. The declines were due to several factors, including high inflation in many countries, aggressive monetary tightening by the U.S. Federal Reserve (the Fed), and slowing global economic growth.
During the period, U.S. inflation surged as strong consumer demand following the relaxation of COVID-19 restrictions coincided with supply shortages created by the pandemic. Production and trade disruptions resulting from Russia’s February 2022 invasion of Ukraine added to inflationary pressures by driving up prices of energy and grains. The Fed responded by increasing short-term interest rates at the fastest pace in decades and signaling that it would continue hiking rates until inflation was under control -- even if it meant pushing the U.S. economy into recession.
The European Central Bank and Bank of England also raised interest rates during the period in efforts to tame inflation, despite signs of deterioration in the European economy. Conversely, the Bank of Japan held its main policy rate at −0.1%. Inflation rose in Japan during the period but remained low compared to inflation in other developed countries. The widening differential between interest rates in Japan and the U.S. contributed to a substantial weakening in the Japanese yen versus the U.S. dollar during the period.
In China, government policies helped contain inflation but also significantly slowed economic growth. First, China maintained its zero-COVID policy, which led to lockdowns of major cities during the period. Second, Chinese leaders renewed their focus on the country’s “common prosperity” agenda, implementing measures that negatively affected certain sectors of China’s economy, including real estate and technology.
During the period, a number of emerging and frontier nations either defaulted on their sovereign debt or were pushed to the brink of default. Rising food and energy prices pressured these governments to offer subsidies to consumers, putting additional stress on fiscal balances already strained by pandemic-related spending. In addition, broad strength in the U.S. dollar made servicing U.S. dollar-denominated debt more expensive.
On a positive note, we believe there were signs late in the period that inflation may have peaked in several major emerging-market economies. Central banks in these countries indicated that they were at, or near, the end of their tightening cycles.
Fund Performance
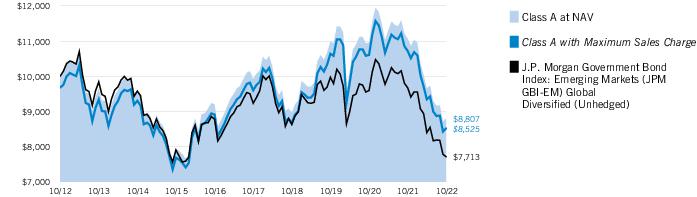
For the 12-month period ended October 31, 2022, Eaton Vance Emerging Markets Local Income Fund (the Fund) returned -20.47% for Class A shares at net asset value (NAV), underperforming its benchmark, the J.P. Morgan Government Bond Index: Emerging Markets (JPM GBI-EM) Global Diversified (Unhedged) (the Index), which returned -20.27%.
The Fund’s interest rate exposures had the largest negative impact on performance relative to the Index during the period, and positioning in sovereign credit also detracted. On the plus side, currency exposure was the top contributor to relative performance, and corporate credit exposure added value as well.
On a regional basis, relative returns in Eastern European positions were negatively affected by an out-of-Index position in Ukrainian local bonds. This investment performed poorly due to the Russia-Ukraine war, which led to a steep sell-off in Ukrainian local assets. The unfavorable impact of this exposure was partly offset by underweight positions in local interest rates in Russia, Poland, and Hungary, as interest rates increased and bond prices declined in these three nations during the period. By period-end, the local interest rate position in Russia was sold from the Fund.
In Asia, an out-of-Index position in South Korean local interest rates hurt relative performance given the global trend of rising rates during the period. Conversely, a lack of exposure to the Chinese yuan was helpful amid the slowdown in China’s economy.
In Latin America, overweight exposure to Colombian interest rates detracted from returns versus the Index, while an overweight position in Brazilian rates was a notable contributor. Inflation in Brazil moderated during the period, prompting the country’s central bank to pause its rate-hiking campaign.
In the Middle East & Africa, the Fund’s lack of exposure to Egypt late in the period was a major contributor to performance relative to the Index. During this time, the Egyptian pound fell sharply, pressured by the Egyptian government’s decision to adopt a more flexible exchange-rate system to help secure a loan from the International Monetary Fund.
The Fund used derivatives extensively to both hedge select undesired risk exposures as well as gain select desired risk exposures. Some of the above commentary about notable drivers of performance at the country level involved the use of derivatives. The Fund’s use of derivatives broadly detracted from returns versus the Index during the period. In particular, interest rate swaps, which are used both to gain and hedge desired exposures, detracted from Fund performance versus the Index. Currency forwards, which are also used both to gain and hedge desired exposures and are the other major derivative type used by the Fund, further detracted from relative performance during the period.
See Endnotes and Additional Disclosures in this report.
Past performance is no guarantee of future results. Returns are historical and are calculated by determining the percentage change in net asset value (NAV) or offering price (as applicable) with all distributions reinvested. Furthermore, returns do not reflect the deduction of taxes that shareholders may have to pay on Fund distributions or upon the redemption of Fund shares. Investment return and principal value will fluctuate so that shares, when redeemed, may be worth more or less than their original cost. Performance for periods less than or equal to one year is cumulative. Performance is for the stated time period only; due to market volatility, current Fund performance may be lower or higher than the quoted return. For performance as of the most recent month-end, please refer to eatonvance.com.
Eaton Vance
Emerging Markets Local Income Fund
October 31, 2022
Performance
Portfolio Manager(s) John R. Baur, Brian Shaw, CFA and Patrick Campbell, CFA
| % Average Annual Total Returns1,2 | Class
Inception Date | Performance
Inception Date | One Year | Five Years | Ten Years |
| Class A at NAV | 06/27/2007 | 06/27/2007 | (20.47)% | (2.35)% | (1.26)% |
| Class A with 3.25% Maximum Sales Charge | — | — | (22.98) | (2.99) | (1.58) |
| Class C at NAV | 08/03/2010 | 06/27/2007 | (21.31) | (3.08) | (1.81) |
| Class C with 1% Maximum Deferred Sales Charge | — | — | (22.01) | (3.08) | (1.81) |
| Class I at NAV | 11/30/2009 | 06/27/2007 | (20.48) | (2.12) | (1.00) |
|
| J.P. Morgan Government Bond Index: Emerging Markets (JPM GBI-EM) Global Diversified (Unhedged) | — | — | (20.27)% | (3.54)% | (2.56)% |
| % Total Annual Operating Expense Ratios3 | Class A | Class C | Class I |
| | 1.16% | 1.86% | 0.86% |
Growth of $10,000
This graph shows the change in value of a hypothetical investment of $10,000 in Class A of the Fund for the period indicated. For comparison, the same investment is shown in the indicated index.
| Growth of Investment | Amount Invested | Period Beginning | At NAV | With Maximum Sales Charge |
| Class C | $10,000 | 10/31/2012 | $8,333 | N.A. |
| Class I, at minimum investment | $1,000,000 | 10/31/2012 | $904,635 | N.A. |
See Endnotes and Additional Disclosures in this report.
Past performance is no guarantee of future results. Returns are historical and are calculated by determining the percentage change in net asset value (NAV) or offering price (as applicable) with all distributions reinvested. Furthermore, returns do not reflect the deduction of taxes that shareholders may have to pay on Fund distributions or upon the redemption of Fund shares. Investment return and principal value will fluctuate so that shares, when redeemed, may be worth more or less than their original cost. Performance for periods less than or equal to one year is cumulative. Performance is for the stated time period only; due to market volatility, current Fund performance may be lower or higher than the quoted return. For performance as of the most recent month-end, please refer to eatonvance.com.
Eaton Vance
Emerging Markets Local Income Fund
October 31, 2022
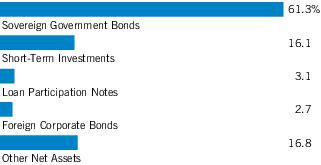
| Asset Allocation (% of net assets)1 |
| Foreign Currency Exposure (% of net assets)2 |
| Brazil | 12.9% |
| Mexico | 10.3 |
| Indonesia | 9.9 |
| Singapore | 8.0 |
| Poland | 6.8 |
| Thailand | 6.1 |
| Dominican Republic | 5.3 |
| Czech Republic | 5.3 |
| Ukraine | 5.2 |
| Malaysia | 5.1 |
| Serbia | 4.2 |
| Uzbekistan | 4.0 |
| South Africa | 3.6 |
| Uruguay | 3.5 |
| Romania | 3.5 |
| Colombia | 3.0 |
| Hungary | 2.7 |
| Kazakhstan | 2.5 |
| Peru | 2.5 |
| China | 2.4 |
| Korea | 2.0 |
| Uganda | 1.9 |
| Other | 2.0 3 |
| Euro | -3.9 |
| Total Long | 113.5 |
| Total Short | -4.7 |
| Total Net | 108.8 |
Footnotes:
Fund invests in an affiliated investment company (Portfolio) with the same objective(s) and policies as the Fund. References to investments are to the Portfolio’s holdings.
| 1 | Other Net Assets represents other assets less liabilities and includes any investment type that represents less than 1% of net assets. |
| 2 | Currency exposures include all foreign exchange denominated assets and currency derivatives. Total exposures may exceed 100% due to implicit leverage created by derivatives. |
| 3 | Includes amounts each less than 1.0% or –1.0%, as applicable. |
Eaton Vance
Emerging Markets Local Income Fund
October 31, 2022
Endnotes and Additional Disclosures
| † | The views expressed in this report are those of the portfolio manager(s) and are current only through the date stated at the top of this page. These views are subject to change at any time based upon market or other conditions, and Eaton Vance and the Fund(s) disclaim any responsibility to update such views. These views may not be relied upon as investment advice and, because investment decisions are based on many factors, may not be relied upon as an indication of trading intent on behalf of any Eaton Vance fund. This commentary may contain statements that are not historical facts, referred to as “forward-looking statements.” The Fund’s actual future results may differ significantly from those stated in any forward-looking statement, depending on factors such as changes in securities or financial markets or general economic conditions, the volume of sales and purchases of Fund shares, the continuation of investment advisory, administrative and service contracts, and other risks discussed from time to time in the Fund’s filings with the Securities and Exchange Commission. |
| | |
| 1 | J.P. Morgan Government Bond Index: Emerging Markets (JPM GBI-EM) Global Diversified (Unhedged) is an unmanaged index of local-currency bonds with maturities of more than one year issued by emerging markets governments. Information has been obtained from sources believed to be reliable but J.P. Morgan does not warrant its completeness or accuracy. The Index is used with permission. The Index may not be copied, used, or distributed without J.P. Morgan’s prior written approval. Copyright 2021, J.P. Morgan Chase & Co. All rights reserved. Unless otherwise stated, index returns do not reflect the effect of any applicable sales charges, commissions, expenses, taxes or leverage, as applicable. It is not possible to invest directly in an index. |
| 2 | Total Returns at NAV do not include applicable sales charges. If sales charges were deducted, the returns would be lower. Total Returns shown with maximum sales charge reflect the stated maximum sales charge. Unless otherwise stated, performance does not reflect the deduction of taxes on Fund distributions or redemptions of Fund shares.Effective November 5, 2020, Class C shares automatically convert to Class A shares eight years after purchase. The average annual total returns listed for Class C reflect conversion to Class A shares after eight years. Prior to November 5, 2020, Class C shares automatically converted to Class A shares ten years after purchase. |
| 3 | Source: Fund prospectus. The expense ratios for the current reporting period can be found in the Financial Highlights section of this report. Performance reflects expenses waived and/or reimbursed, if applicable. Without such waivers and/or reimbursements, performance would have been lower. |
| | Fund profile subject to change due to active management. |
Eaton Vance
Emerging Markets Local Income Fund
October 31, 2022
Example
As a Fund shareholder, you incur two types of costs: (1) transaction costs, including sales charges (loads) on purchases and redemption fees (if applicable); and (2) ongoing costs, including management fees; distribution and/or service fees; and other Fund expenses. This Example is intended to help you understand your ongoing costs (in dollars) of Fund investing and to compare these costs with the ongoing costs of investing in other mutual funds. The Example is based on an investment of $1,000 invested at the beginning of the period and held for the entire period (May 1, 2022 to October 31, 2022).
Actual Expenses
The first section of the table below provides information about actual account values and actual expenses. You may use the information in this section, together with the amount you invested, to estimate the expenses that you paid over the period. Simply divide your account value by $1,000 (for example, an $8,600 account value divided by $1,000 = 8.6), then multiply the result by the number in the first section under the heading entitled “Expenses Paid During Period” to estimate the expenses you paid on your account during this period.
Hypothetical Example for Comparison Purposes
The second section of the table below provides information about hypothetical account values and hypothetical expenses based on the actual Fund expense ratio and an assumed rate of return of 5% per year (before expenses), which is not the actual Fund return. The hypothetical account values and expenses may not be used to estimate the actual ending account balance or expenses you paid for the period. You may use this information to compare the ongoing costs of investing in your Fund and other funds. To do so, compare this 5% hypothetical example with the 5% hypothetical examples that appear in the shareholder reports of the other funds.
Please note that the expenses shown in the table are meant to highlight your ongoing costs only and do not reflect any transactional costs, such as sales charges (loads) or redemption fees (if applicable). Therefore, the second section of the table is useful in comparing ongoing costs only, and will not help you determine the relative total costs of owning different funds. In addition, if these transactional costs were included, your costs would be higher.
| | Beginning
Account Value
(5/1/22) | Ending
Account Value
(10/31/22) | Expenses Paid
During Period*
(5/1/22 – 10/31/22) | Annualized
Expense
Ratio |
| Actual | | | | |
| Class A | $1,000.00 | $ 912.20 | $5.74 | 1.19% |
| Class C | $1,000.00 | $ 907.90 | $9.14 | 1.90% |
| Class I | $1,000.00 | $ 910.70 | $4.33 | 0.90% |
| |
| Hypothetical | | | | |
| (5% return per year before expenses) | | | | |
| Class A | $1,000.00 | $1,019.21 | $6.06 | 1.19% |
| Class C | $1,000.00 | $1,015.63 | $9.65 | 1.90% |
| Class I | $1,000.00 | $1,020.67 | $4.58 | 0.90% |
| * | Expenses are equal to the Fund's annualized expense ratio for the indicated Class, multiplied by the average account value over the period, multiplied by 184/365 (to reflect the one-half year period). The Example assumes that the $1,000 was invested at the net asset value per share determined at the close of business on April 30, 2022. The Example reflects the expenses of both the Fund and the Portfolio. |
Eaton Vance
Emerging Markets Local Income Fund
October 31, 2022
Statement of Assets and Liabilities
| | October 31, 2022 |
| Assets | |
| Investment in Emerging Markets Local Income Portfolio, at value (identified cost $1,081,061,207) | $ 831,430,236 |
| Receivable for Fund shares sold | 1,895,141 |
| Total assets | $ 833,325,377 |
| Liabilities | |
| Payable for Fund shares redeemed | $ 3,127,711 |
| Payable to affiliates: | |
| Distribution and service fees | 51,555 |
| Trustees' fees | 43 |
| Other | 4,725 |
| Accrued expenses | 350,147 |
| Total liabilities | $ 3,534,181 |
| Net Assets | $ 829,791,196 |
| Sources of Net Assets | |
| Paid-in capital | $ 987,119,888 |
| Accumulated loss | (157,328,692) |
| Net Assets | $ 829,791,196 |
| Class A Shares | |
| Net Assets | $ 87,882,831 |
| Shares Outstanding | 27,289,873 |
Net Asset Value and Redemption Price Per Share
(net assets ÷ shares of beneficial interest outstanding) | $ 3.22 |
Maximum Offering Price Per Share
(100 ÷ 96.75 of net asset value per share) | $ 3.33 |
| Class C Shares | |
| Net Assets | $ 33,976,129 |
| Shares Outstanding | 10,435,925 |
Net Asset Value and Offering Price Per Share*
(net assets ÷ shares of beneficial interest outstanding) | $ 3.26 |
| Class I Shares | |
| Net Assets | $ 707,932,236 |
| Shares Outstanding | 219,967,325 |
Net Asset Value, Offering Price and Redemption Price Per Share
(net assets ÷ shares of beneficial interest outstanding) | $ 3.22 |
| On sales of $100,000 or more, the offering price of Class A shares is reduced. |
| * | Redemption price per share is equal to the net asset value less any applicable contingent deferred sales charge. |
7
See Notes to Financial Statements.
Eaton Vance
Emerging Markets Local Income Fund
October 31, 2022
| | Year Ended |
| | October 31, 2022 |
| Investment Income | |
| Dividend income allocated from Portfolio | $ 665,701 |
| Interest income allocated from Portfolio (net of foreign taxes withheld of $1,796,379) | 77,130,750 |
| Expenses allocated from Portfolio | (8,284,846) |
| Total investment income from Portfolio | $ 69,511,605 |
| Expenses | |
| Distribution and service fees: | |
| Class A | $ 343,397 |
| Class C | 445,833 |
| Trustees’ fees and expenses | 500 |
| Custodian fee | 60,326 |
| Transfer and dividend disbursing agent fees | 772,688 |
| Legal and accounting services | 57,971 |
| Printing and postage | 372,372 |
| Registration fees | 92,024 |
| Miscellaneous | 17,513 |
| Total expenses | $ 2,162,624 |
| Net investment income | $ 67,348,981 |
| Realized and Unrealized Gain (Loss) from Portfolio | |
| Net realized gain (loss): | |
| Investment transactions (net of foreign capital gains taxes of $265,099) | $ (66,276,484) |
| Futures contracts | 4,642,689 |
| Swap contracts | (47,686,429) |
| Foreign currency transactions | (5,696,180) |
| Forward foreign currency exchange contracts | (17,812,193) |
| Non-deliverable bond forward contracts | (18,633,766) |
| Net realized loss | $(151,462,363) |
| Change in unrealized appreciation (depreciation): | |
| Investments (including net decrease in accrued foreign capital gains taxes of $1,195,024) | $ (175,679,884) |
| Futures contracts | (269,053) |
| Swap contracts | 4,859,563 |
| Foreign currency | (872,864) |
| Forward foreign currency exchange contracts | 7,127,568 |
| Non-deliverable bond forward contracts | 507,066 |
| Net change in unrealized appreciation (depreciation) | $(164,327,604) |
| Net realized and unrealized loss | $(315,789,967) |
| Net decrease in net assets from operations | $(248,440,986) |
8
See Notes to Financial Statements.
Eaton Vance
Emerging Markets Local Income Fund
October 31, 2022
Statements of Changes in Net Assets
| | Year Ended October 31, |
| | 2022 | 2021 |
| Increase (Decrease) in Net Assets | | |
| From operations: | | |
| Net investment income | $ 67,348,981 | $ 73,990,839 |
| Net realized gain (loss) | (151,462,363) | 14,421,284 |
| Net change in unrealized appreciation (depreciation) | (164,327,604) | (95,065,101) |
| Net decrease in net assets from operations | $ (248,440,986) | $ (6,652,978) |
| Distributions to shareholders: | | |
| Class A | $ — | $ (3,528,165) |
| Class C | — | (1,336,288) |
| Class I | — | (29,959,647) |
| Total distributions to shareholders | $ — | $ (34,824,100) |
| Tax return of capital to shareholders: | | |
| Class A | $ (13,947,887) | $ (11,744,917) |
| Class C | (5,086,599) | (4,324,921) |
| Class I | (114,849,166) | (107,917,807) |
| Total tax return of capital to shareholders | $ (133,883,652) | $ (123,987,645) |
| Transactions in shares of beneficial interest: | | |
| Class A | $ (17,218,330) | $ 30,113,299 |
| Class C | (9,079,577) | 4,959,581 |
| Class I | (183,103,782) | 379,512,959 |
| Net increase (decrease) in net assets from Fund share transactions | $ (209,401,689) | $ 414,585,839 |
| Net increase (decrease) in net assets | $ (591,726,327) | $ 249,121,116 |
| Net Assets | | |
| At beginning of year | $1,421,517,523 | $ 1,172,396,407 |
| At end of year | $ 829,791,196 | $1,421,517,523 |
9
See Notes to Financial Statements.
Eaton Vance
Emerging Markets Local Income Fund
October 31, 2022
| | Class A |
| | Year Ended October 31, |
| | 2022 | 2021 | 2020 | 2019 | 2018 |
| Net asset value — Beginning of year | $ 4.590 | $ 5.030 | $ 5.760 | $ 5.190 | $ 6.310 |
| Income (Loss) From Operations | | | | | |
| Net investment income(1) | $ 0.234 | $ 0.228 | $ 0.286 | $ 0.363 | $ 0.408 |
| Net realized and unrealized gain (loss) | (1.125) | (0.168) | (0.293) | 0.759 | (0.970) |
| Total income (loss) from operations | $ (0.891) | $ 0.060 | $ (0.007) | $ 1.122 | $ (0.562) |
| Less Distributions | | | | | |
| From net investment income | $ — | $ (0.123) | $ (0.198) | $ (0.552) | $ — |
| Tax return of capital | (0.479) | (0.377) | (0.525) | — | (0.558) |
| Total distributions | $ (0.479) | $ (0.500) | $ (0.723) | $ (0.552) | $ (0.558) |
| Net asset value — End of year | $ 3.220 | $ 4.590 | $ 5.030 | $ 5.760 | $ 5.190 |
| Total Return(2) | (20.47)% | 1.06% | (0.31)% (3) | 22.64% (3) | (9.65)% (3) |
| Ratios/Supplemental Data | | | | | |
| Net assets, end of year (000’s omitted) | $87,883 | $145,043 | $129,954 | $152,308 | $107,550 |
| Ratios (as a percentage of average daily net assets):(4) | | | | | |
| Expenses | 1.19% (5) | 1.16% | 1.20% (3) | 1.20% (3) | 1.23% (3)(6) |
| Net investment income | 5.99% | 4.53% | 5.40% | 6.57% | 6.84% |
| Portfolio Turnover of the Portfolio | 33% | 56% | 56% | 46% | 52% |
| (1) | Computed using average shares outstanding. |
| (2) | Returns are historical and are calculated by determining the percentage change in net asset value with all distributions reinvested and do not reflect the effect of sales charges. |
| (3) | The investment adviser reimbursed certain operating expenses (equal to 0.02%, 0.02% and 0.09% of average daily net assets for the years ended October 31, 2020, 2019 and 2018, respectively). Absent this reimbursement, total return would be lower. |
| (4) | Includes the Fund’s share of the Portfolio’s allocated expenses. |
| (5) | Includes a reduction by the investment adviser of a portion of the Portfolio's adviser fee due to the Portfolio’s investment in the Liquidity Fund (equal to less than 0.005% of average daily net assets for the year ended October 31, 2022). |
| (6) | Includes interest expense, including on securities sold short and/or reverse repurchase agreements if applicable, of 0.02% of average daily net assets for the year ended October 31, 2018. |
10
See Notes to Financial Statements.
Eaton Vance
Emerging Markets Local Income Fund
October 31, 2022
Financial Highlights — continued
| | Class C |
| | Year Ended October 31, |
| | 2022 | 2021 | 2020 | 2019 | 2018 |
| Net asset value — Beginning of year | $ 4.650 | $ 5.080 | $ 5.820 | $ 5.240 | $ 6.380 |
| Income (Loss) From Operations | | | | | |
| Net investment income(1) | $ 0.209 | $ 0.194 | $ 0.250 | $ 0.328 | $ 0.373 |
| Net realized and unrealized gain (loss) | (1.142) | (0.154) | (0.298) | 0.770 | (0.992) |
| Total income (loss) from operations | $ (0.933) | $ 0.040 | $ (0.048) | $ 1.098 | $ (0.619) |
| Less Distributions | | | | | |
| From net investment income | $ — | $ (0.115) | $ (0.190) | $ (0.518) | $ — |
| Tax return of capital | (0.457) | (0.355) | (0.502) | — | (0.521) |
| Total distributions | $ (0.457) | $ (0.470) | $ (0.692) | $ (0.518) | $ (0.521) |
| Net asset value — End of year | $ 3.260 | $ 4.650 | $ 5.080 | $ 5.820 | $ 5.240 |
| Total Return(2) | (21.31)% | 0.46% | (0.90)% (3) | 21.87% (3) | (10.42)% (3) |
| Ratios/Supplemental Data | | | | | |
| Net assets, end of year (000’s omitted) | $33,976 | $58,639 | $59,169 | $62,869 | $44,416 |
| Ratios (as a percentage of average daily net assets):(4) | | | | | |
| Expenses | 1.89% (5) | 1.86% | 1.90% (3) | 1.90% (3) | 1.93% (3)(6) |
| Net investment income | 5.28% | 3.82% | 4.68% | 5.88% | 6.17% |
| Portfolio Turnover of the Portfolio | 33% | 56% | 56% | 46% | 52% |
| (1) | Computed using average shares outstanding. |
| (2) | Returns are historical and are calculated by determining the percentage change in net asset value with all distributions reinvested and do not reflect the effect of sales charges. |
| (3) | The investment adviser reimbursed certain operating expenses (equal to 0.02%, 0.02% and 0.09% of average daily net assets for the years ended October 31, 2020, 2019 and 2018, respectively). Absent this reimbursement, total return would be lower. |
| (4) | Includes the Fund’s share of the Portfolio’s allocated expenses. |
| (5) | Includes a reduction by the investment adviser of a portion of the Portfolio's adviser fee due to the Portfolio’s investment in the Liquidity Fund (equal to less than 0.005% of average daily net assets for the year ended October 31, 2022). |
| (6) | Includes interest expense, including on securities sold short and/or reverse repurchase agreements if applicable, of 0.02% of average daily net assets for the year ended October 31, 2018. |
11
See Notes to Financial Statements.
Eaton Vance
Emerging Markets Local Income Fund
October 31, 2022
Financial Highlights — continued
| | Class I |
| | Year Ended October 31, |
| | 2022 | 2021 | 2020 | 2019 | 2018 |
| Net asset value — Beginning of year | $ 4.590 | $ 5.020 | $ 5.760 | $ 5.190 | $ 6.310 |
| Income (Loss) From Operations | | | | | |
| Net investment income(1) | $ 0.246 | $ 0.243 | $ 0.301 | $ 0.381 | $ 0.427 |
| Net realized and unrealized gain (loss) | (1.126) | (0.158) | (0.302) | 0.757 | (0.971) |
| Total income (loss) from operations | $ (0.880) | $ 0.085 | $ (0.001) | $ 1.138 | $ (0.544) |
| Less Distributions | | | | | |
| From net investment income | $ — | $ (0.127) | $ (0.202) | $ (0.568) | $ — |
| Tax return of capital | (0.490) | (0.388) | (0.537) | — | (0.576) |
| Total distributions | $ (0.490) | $ (0.515) | $ (0.739) | $ (0.568) | $ (0.576) |
| Net asset value — End of year | $ 3.220 | $ 4.590 | $ 5.020 | $ 5.760 | $ 5.190 |
| Total Return(2) | (20.48)% | 1.36% | (0.01)% (3) | 23.00% (3) | (9.38)% (3) |
| Ratios/Supplemental Data | | | | | |
| Net assets, end of year (000’s omitted) | $707,932 | $1,217,836 | $983,273 | $938,608 | $555,630 |
| Ratios (as a percentage of average daily net assets):(4) | | | | | |
| Expenses | 0.89% (5) | 0.86% | 0.90% (3) | 0.90% (3) | 0.93% (3)(6) |
| Net investment income | 6.28% | 4.86% | 5.68% | 6.90% | 7.15% |
| Portfolio Turnover of the Portfolio | 33% | 56% | 56% | 46% | 52% |
| (1) | Computed using average shares outstanding. |
| (2) | Returns are historical and are calculated by determining the percentage change in net asset value with all distributions reinvested. |
| (3) | The investment adviser reimbursed certain operating expenses (equal to 0.02%, 0.02% and 0.09% of average daily net assets for the years ended October 31, 2020, 2019 and 2018, respectively). Absent this reimbursement, total return would be lower. |
| (4) | Includes the Fund’s share of the Portfolio’s allocated expenses. |
| (5) | Includes a reduction by the investment adviser of a portion of the Portfolio's adviser fee due to the Portfolio’s investment in the Liquidity Fund (equal to less than 0.005% of average daily net assets for the year ended October 31, 2022). |
| (6) | Includes interest expense, including on securities sold short and/or reverse repurchase agreements if applicable, of 0.02% of average daily net assets for the year ended October 31, 2018. |
12
See Notes to Financial Statements.
Eaton Vance
Emerging Markets Local Income Fund
October 31, 2022
Notes to Financial Statements
1 Significant Accounting Policies
Eaton Vance Emerging Markets Local Income Fund (the Fund) is a non-diversified series of Eaton Vance Mutual Funds Trust (the Trust). The Trust is a Massachusetts business trust registered under the Investment Company Act of 1940, as amended (the 1940 Act), as an open-end management investment company. The Fund offers three classes of shares. Class A shares are generally sold subject to a sales charge imposed at time of purchase. Class C shares are sold at net asset value and are generally subject to a contingent deferred sales charge (see Note 5). Effective November 5, 2020, Class C shares automatically convert to Class A shares eight years after their purchase as described in the Fund’s prospectus. Class I shares are sold at net asset value and are not subject to a sales charge. Each class represents a pro-rata interest in the Fund, but votes separately on class-specific matters and (as noted below) is subject to different expenses. Realized and unrealized gains and losses and net investment income and losses, other than class-specific expenses, are allocated daily to each class of shares based on the relative net assets of each class to the total net assets of the Fund. Each class of shares differs in its distribution plan and certain other class-specific expenses. The Fund invests substantially all of its investable assets in interests in Emerging Markets Local Income Portfolio (the Portfolio), a Massachusetts business trust, having the same investment objective and policies as the Fund. The value of the Fund’s investment in the Portfolio reflects the Fund’s proportionate interest in the net assets of the Portfolio (86.7% at October 31, 2022). The performance of the Fund is directly affected by the performance of the Portfolio. The financial statements of the Portfolio, including the portfolio of investments, are included elsewhere in this report and should be read in conjunction with the Fund’s financial statements.
The following is a summary of significant accounting policies of the Fund. The policies are in conformity with accounting principles generally accepted in the United States of America (U.S. GAAP). The Fund is an investment company and follows accounting and reporting guidance in the Financial Accounting Standards Board (FASB) Accounting Standards Codification Topic 946.
A Investment Valuation—Valuation of securities by the Portfolio is discussed in Note 1A of the Portfolio's Notes to Financial Statements, which are included elsewhere in this report.
B Income— The Fund's net investment income or loss consists of the Fund's pro-rata share of the net investment income or loss of the Portfolio, less all actual and accrued expenses of the Fund.
C Federal and Other Taxes—The Fund’s policy is to comply with the provisions of the Internal Revenue Code applicable to regulated investment companies and to distribute to shareholders each year substantially all of its net investment income, and all or substantially all of its net realized capital gains. Accordingly, no provision for federal income or excise tax is necessary.
In addition to the requirements of the Internal Revenue Code, the Fund may also be required to recognize its pro-rata share of the capital gains taxes incurred by the Portfolio. In doing so, the daily net asset value would reflect the Fund’s pro-rata share of the estimated reserve for such taxes incurred by the Portfolio.
As of October 31, 2022, the Fund had no uncertain tax positions that would require financial statement recognition, de-recognition, or disclosure. The Fund files a U.S. federal income tax return annually after its fiscal year-end, which is subject to examination by the Internal Revenue Service for a period of three years from the date of filing.
D Expenses—The majority of expenses of the Trust are directly identifiable to an individual fund. Expenses which are not readily identifiable to a specific fund are allocated taking into consideration, among other things, the nature and type of expense and the relative size of the funds.
E Use of Estimates—The preparation of the financial statements in conformity with U.S. GAAP requires management to make estimates and assumptions that affect the reported amounts of assets and liabilities at the date of the financial statements and the reported amounts of income and expense during the reporting period. Actual results could differ from those estimates.
F Indemnifications—Under the Trust’s organizational documents, its officers and Trustees may be indemnified against certain liabilities and expenses arising out of the performance of their duties to the Fund. Under Massachusetts law, if certain conditions prevail, shareholders of a Massachusetts business trust (such as the Trust) could be deemed to have personal liability for the obligations of the Trust. However, the Trust’s Declaration of Trust contains an express disclaimer of liability on the part of Fund shareholders and the By-laws provide that the Trust shall assume, upon request by the shareholder, the defense on behalf of any Fund shareholders. Moreover, the By-laws also provide for indemnification out of Fund property of any shareholder held personally liable solely by reason of being or having been a shareholder for all loss or expense arising from such liability. Additionally, in the normal course of business, the Fund enters into agreements with service providers that may contain indemnification clauses. The Fund's maximum exposure under these arrangements is unknown as this would involve future claims that may be made against the Fund that have not yet occurred.
G Other—Investment transactions are accounted for on a trade date basis.
Eaton Vance
Emerging Markets Local Income Fund
October 31, 2022
Notes to Financial Statements — continued
2 Distributions to Shareholders and Income Tax Information
The Fund expects to pay any required income distributions monthly and intends to distribute annually all or substantially all of its net realized capital gains. The Fund may include in its distributions amounts attributable to the imputed interest on foreign currency exposures and certain other derivative positions which, in certain circumstances, may result in a return of capital for federal income tax purposes. Distributions to shareholders are recorded on the ex-dividend date. Distributions are declared separately for each class of shares. Shareholders may reinvest income and capital gain distributions in additional shares of the same class of the Fund at the net asset value as of the ex-dividend date or, at the election of the shareholder, receive distributions in cash. Distributions to shareholders are determined in accordance with income tax regulations, which may differ from U.S. GAAP. As required by U.S. GAAP, only distributions in excess of tax basis earnings and profits are reported in the financial statements as a return of capital. Permanent differences between book and tax accounting relating to distributions are reclassified to paid-in capital. For tax purposes, distributions from short-term capital gains are considered to be from ordinary income.
The tax character of distributions declared for the years ended October 31, 2022 and October 31, 2021 was as follows:
| | Year Ended October 31, |
| | 2022 | 2021 |
| Ordinary income | $ — | $ 34,824,100 |
| Tax return of capital | $133,883,652 | $123,987,645 |
During the year ended October 31, 2022, accumulated loss was decreased by $126,799,228 and paid-in capital was decreased by $126,799,228 due to differences between book and tax accounting, primarily for net operating losses. These reclassifications had no effect on the net assets or net asset value per share of the Fund.
As of October 31, 2022, the components of distributable earnings (accumulated loss) on a tax basis were as follows:
| Deferred capital losses | $ (44,681,829) |
| Net unrealized depreciation | (112,646,863) |
| Accumulated loss | $(157,328,692) |
At October 31, 2022, the Fund, for federal income tax purposes, had deferred capital losses of $44,681,829 which would reduce its taxable income arising from future net realized gains on investment transactions, if any, to the extent permitted by the Internal Revenue Code, and thus would reduce the amount of distributions to shareholders, which would otherwise be necessary to relieve the Fund of any liability for federal income or excise tax. The deferred capital losses are treated as arising on the first day of the Fund’s next taxable year and retain the same short-term or long-term character as when originally deferred. Of the deferred capital losses at October 31, 2022, $44,681,829 are short-term.
3 Investment Adviser Fee and Other Transactions with Affiliates
The investment adviser fee is earned by Eaton Vance Management (EVM), an indirect, wholly-owned subsidiary of Morgan Stanley, as compensation for investment advisory services rendered to the Fund. The investment adviser fee is computed at an annual rate as a percentage of the Fund’s average daily net assets that are not invested in other investment companies for which EVM or its affiliates serve as investment adviser or administrator as follows and is payable monthly:
| Average Daily Net Assets | Annual Fee Rate |
| Up to $1 billion | 0.650% |
| $1 billion but less than $2 billion | 0.625% |
| $2 billion but less than $5 billion | 0.600% |
| $5 billion and over | 0.575% |
For the year ended October 31, 2022, the Fund incurred no investment adviser fee on such assets. To the extent the Fund’s assets are invested in the Portfolio, the Fund is allocated its share of the Portfolio’s investment adviser fee. The Portfolio has engaged Boston Management and Research (BMR) to render investment advisory services. See Note 2 of the Portfolio’s Notes to Financial Statements which are included elsewhere in this report. EVM also serves as the administrator of the Fund, but receives no compensation. EVM has agreed to reimburse the Fund’s expenses to the extent that total annual
Eaton Vance
Emerging Markets Local Income Fund
October 31, 2022
Notes to Financial Statements — continued
operating expenses (relating to ordinary operating expenses only and excluding such expenses as borrowing costs, taxes or litigation expenses) exceed 1.20%, 1.90% and 0.90% of the Fund’s average daily net assets for Class A, Class C and Class I, respectively. This agreement may be changed or terminated after February 28, 2023. Pursuant to this agreement, no operating expenses were allocated to EVM for the year ended October 31, 2022.
EVM provides sub-transfer agency and related services to the Fund pursuant to a Sub-Transfer Agency Support Services Agreement. For the year ended October 31, 2022, EVM earned $20,080 from the Fund pursuant to such agreement, which is included in transfer and dividend disbursing agent fees on the Statement of Operations. The Fund was informed that Eaton Vance Distributors, Inc. (EVD), an affiliate of EVM and the Fund's principal underwriter, received $51,604 as its portion of the sales charge on sales of Class A shares for the year ended October 31, 2022. The Fund was informed that Morgan Stanley affiliated broker-dealers, which may be deemed to be affiliates of EVM, BMR and EVD, also received a portion of the sales charge on sales of Class A shares for the year ended October 31, 2022 in the amount of $1,551. EVD also received distribution and service fees from Class A and Class C shares (see Note 4) and contingent deferred sales charges (see Note 5).
Trustees and officers of the Fund who are members of EVM’s or BMR's organizations receive remuneration for their services to the Fund out of the investment adviser fee. Certain officers and Trustees of the Fund and the Portfolio are officers of the above organizations.
4 Distribution Plans
The Fund has in effect a distribution plan for Class A shares (Class A Plan) pursuant to Rule 12b-1 under the 1940 Act. Pursuant to the Class A Plan, the Fund pays EVD a distribution and service fee of 0.30% per annum of its average daily net assets attributable to Class A shares for distribution services and facilities provided to the Fund by EVD, as well as for personal services and/or the maintenance of shareholder accounts. Distribution and service fees paid or accrued to EVD for the year ended October 31, 2022 amounted to $343,397 for Class A shares.
The Fund also has in effect a distribution plan for Class C shares (Class C Plan) pursuant to Rule 12b-1 under the 1940 Act. Pursuant to the Class C Plan, the Fund pays EVD amounts equal to 0.75% per annum of its average daily net assets attributable to Class C shares for providing ongoing distribution services and facilities to the Fund. For the year ended October 31, 2022, the Fund paid or accrued to EVD $334,375 for Class C shares.
Pursuant to the Class C Plan, the Fund also makes payments of service fees to EVD, financial intermediaries and other persons in amounts equal to 0.25% per annum of its average daily net assets attributable to that class. Service fees paid or accrued are for personal services and/or the maintenance of shareholder accounts. They are separate and distinct from the sales commissions and distribution fees payable to EVD. Service fees paid or accrued for the year ended October 31, 2022 amounted to $111,458 for Class C shares.
Distribution and service fees are subject to the limitations contained in the Financial Industry Regulatory Authority Rule 2341(d).
5 Contingent Deferred Sales Charges
A contingent deferred sales charge (CDSC) of 1% generally is imposed on redemptions of Class C shares made within 12 months of purchase. Class A shares may be subject to a 0.75% (1% prior to April 29, 2022) CDSC if redeemed within 12 months (18 months prior to April 29, 2022) of purchase (depending on the circumstances of purchase). Generally, the CDSC is based upon the lower of the net asset value at date of redemption or date of purchase. No charge is levied on shares acquired by reinvestment of dividends or capital gain distributions. For the year ended October 31, 2022, the Fund was informed that EVD received approximately $9,000 and $8,000 of CDSCs paid by Class A and Class C shareholders, respectively.
6 Investment Transactions
For the year ended October 31, 2022, increases and decreases in the Fund's investment in the Portfolio aggregated $109,200,430 and $451,022,305, respectively.
Eaton Vance
Emerging Markets Local Income Fund
October 31, 2022
Notes to Financial Statements — continued
7 Shares of Beneficial Interest
The Fund’s Declaration of Trust permits the Trustees to issue an unlimited number of full and fractional shares of beneficial interest (without par value). Such shares may be issued in a number of different series (such as the Fund) and classes. Transactions in Fund shares, including direct exchanges pursuant to share class conversions for all periods presented, were as follows:
| | Year Ended
October 31, 2022 | | Year Ended
October 31, 2021 |
| | Shares | Amount | | Shares | Amount |
| Class A | | | | | |
| Sales | 8,744,229 | $ 34,415,385 | | 18,274,543 | $ 92,948,187 |
| Issued to shareholders electing to receive payments of distributions in Fund shares | 3,336,364 | 12,695,340 | | 2,799,887 | 13,895,628 |
| Redemptions | (16,356,773) | (64,329,055) | | (15,367,242) | (76,730,516) |
| Net increase (decrease) | (4,276,180) | $ (17,218,330) | | 5,707,188 | $ 30,113,299 |
| Class C | | | | | |
| Sales | 1,633,628 | $ 6,788,155 | | 3,368,182 | $ 17,293,127 |
| Issued to shareholders electing to receive payments of distributions in Fund shares | 1,277,313 | 4,922,131 | | 1,095,871 | 5,499,953 |
| Redemptions | (5,096,503) | (20,789,863) | | (3,486,291) | (17,833,499) |
| Net increase (decrease) | (2,185,562) | $ (9,079,577) | | 977,762 | $ 4,959,581 |
| Class I | | | | | |
| Sales | 103,149,612 | $ 411,448,840 | | 212,433,306 | $ 1,086,953,947 |
| Issued to shareholders electing to receive payments of distributions in Fund shares | 27,991,737 | 106,732,653 | | 25,659,906 | 127,179,340 |
| Redemptions | (176,382,555) | (701,285,275) | | (168,623,621) | (834,620,328) |
| Net increase (decrease) | (45,241,206) | $(183,103,782) | | 69,469,591 | $ 379,512,959 |
Eaton Vance
Emerging Markets Local Income Fund
October 31, 2022
Report of Independent Registered Public Accounting Firm
To the Trustees of Eaton Vance Mutual Funds Trust and Shareholders of Eaton Vance Emerging Markets Local Income Fund:
Opinion on the Financial Statements and Financial Highlights
We have audited the accompanying statement of assets and liabilities of Eaton Vance Emerging Markets Local Income Fund (the “Fund”) (one of the funds constituting Eaton Vance Mutual Funds Trust), as of October 31, 2022, the related statement of operations for the year then ended, the statements of changes in net assets for each of the two years in the period then ended, the financial highlights for each of the five years in the period then ended, and the related notes. In our opinion, the financial statements and financial highlights present fairly, in all material respects, the financial position of the Fund as of October 31, 2022, and the results of its operations for the year then ended, the changes in its net assets for each of the two years in the period then ended, and the financial highlights for each of the five years in the period then ended, in conformity with accounting principles generally accepted in the United States of America.
Basis for Opinion
These financial statements and financial highlights are the responsibility of the Fund's management. Our responsibility is to express an opinion on the Fund's financial statements and financial highlights based on our audits. We are a public accounting firm registered with the Public Company Accounting Oversight Board (United States) (PCAOB) and are required to be independent with respect to the Fund in accordance with the U.S. federal securities laws and the applicable rules and regulations of the Securities and Exchange Commission and the PCAOB.
We conducted our audits in accordance with the standards of the PCAOB. Those standards require that we plan and perform the audit to obtain reasonable assurance about whether the financial statements and financial highlights are free of material misstatement, whether due to error or fraud. The Fund is not required to have, nor were we engaged to perform, an audit of its internal control over financial reporting. As part of our audits, we are required to obtain an understanding of internal control over financial reporting but not for the purpose of expressing an opinion on the effectiveness of the Fund’s internal control over financial reporting. Accordingly, we express no such opinion.
Our audits included performing procedures to assess the risks of material misstatement of the financial statements and financial highlights, whether due to error or fraud, and performing procedures that respond to those risks. Such procedures included examining, on a test basis, evidence regarding the amounts and disclosures in the financial statements and financial highlights. Our audits also included evaluating the accounting principles used and significant estimates made by management, as well as evaluating the overall presentation of the financial statements and financial highlights. We believe that our audits provide a reasonable basis for our opinion.
/s/ Deloitte & Touche LLP
Boston, Massachusetts
December 29, 2022
We have served as the auditor of one or more Eaton Vance investment companies since 1959.
Eaton Vance
Emerging Markets Local Income Fund
October 31, 2022
Federal Tax Information (Unaudited)
The Form 1099-DIV you receive in February 2023 will show the tax status of all distributions paid to your account in calendar year 2022. Shareholders are advised to consult their own tax adviser with respect to the tax consequences of their investment in the Fund. As required by the Internal Revenue Code and/or regulations, shareholders must be notified regarding the status of the foreign tax credit and 163(j) interest dividends.
Foreign Tax Credit. For the fiscal year ended October 31, 2022, the Fund paid foreign taxes of $1,926,271 and recognized foreign source income of $76,319,136.
163(j) Interest Dividends. For the fiscal year ended October 31, 2022, the Fund designates 100% of distributions from net investment income as a 163(j) interest dividend.
Emerging Markets Local Income Portfolio
October 31, 2022
| Foreign Corporate Bonds — 2.7% |
| Security | Principal
Amount
(000's omitted) | Value |
| Brazil — 0.9% |
| Simpar Finance S.a.r.l., 10.75%, 2/12/28(1) | BRL | 53,195 | $ 8,354,153 |
| | | | $ 8,354,153 |
| Colombia — 0.3% |
| Patrimonio Autonomo Union del Sur, 6.66%, 2/28/41(2) | COP | 18,185,000 | $ 2,964,095 |
| | | | $ 2,964,095 |
| Mexico — 0.0%(3) |
| Petroleos Mexicanos, 7.19%, 9/12/24(2) | MXN | 10,630 | $ 488,910 |
| | | | $ 488,910 |
| Peru — 1.2% |
| Alicorp SAA, 6.875%, 4/17/27(1) | PEN | 25,530 | $ 5,961,284 |
| Telefonica del Peru SAA, 7.375%, 4/10/27(2) | PEN | 24,500 | 5,397,216 |
| | | | $ 11,358,500 |
| Uzbekistan — 0.3% |
| Nederlandse Financierings-Maatschappij voor Ontwikkelingslanden NV (FMO), 15.00%, 12/8/22(1) | UZS | 34,000,000 | $ 3,049,577 |
| | | | $ 3,049,577 |
Total Foreign Corporate Bonds
(identified cost $25,394,686) | | | $ 26,215,235 |
| Loan Participation Notes — 3.1% |
| Security | Principal
Amount
(000's omitted) | Value |
| Uzbekistan — 3.1% |
| Daryo Finance BV (borrower - Uzbek Industrial and Construction Bank ATB), 18.75%, 6/15/23(1)(4)(5) | UZS | 159,708,000 | $ 14,300,922 |
| Europe Asia Investment Finance BV (borrower - Joint Stock Commercial Bank "Asaka"), 18.70%, 7/26/23(1)(4)(5) | UZS | 168,539,054 | 15,079,756 |
Total Loan Participation Notes
(identified cost $32,881,388) | | | $ 29,380,678 |
| Sovereign Government Bonds — 61.3% |
| Security | Principal
Amount
(000's omitted) | Value |
| Argentina — 0.1% |
| Provincia de Cordoba, 6.875%, 12/10/25(1) | USD | 1,106 | $ 846,272 |
| | | | $ 846,272 |
| Armenia — 0.6% |
| Republic of Armenia, 7.15%, 3/26/25(1) | USD | 5,828 | $ 5,728,085 |
| | | | $ 5,728,085 |
| Azerbaijan — 0.3% |
| Republic of Azerbaijan, 4.75%, 3/18/24(1) | USD | 3,142 | $ 3,080,178 |
| | | | $ 3,080,178 |
| Bahrain — 0.3% |
| CBB International Sukuk Programme Co. WLL, 6.25%, 11/14/24(1) | USD | 2,624 | $ 2,641,116 |
| | | | $ 2,641,116 |
| Bolivia — 0.3% |
| Bolivian Government International Bond, 5.95%, 8/22/23(1) | USD | 2,762 | $ 2,644,615 |
| | | | $ 2,644,615 |
| Bosnia and Herzegovina — 0.1% |
| Republic of Srpska: | | | |
| 1.50%, 6/30/23 | BAM | 32 | $ 16,315 |
| 1.50%, 10/30/23 | BAM | 88 | 43,986 |
| 1.50%, 12/15/23 | BAM | 10 | 4,793 |
| 1.50%, 5/31/25 | BAM | 1,669 | 781,811 |
| 1.50%, 6/9/25 | BAM | 160 | 77,177 |
| 1.50%, 12/24/25 | BAM | 232 | 115,843 |
| 1.50%, 9/25/26 | BAM | 145 | 72,273 |
| 1.50%, 9/26/27 | BAM | 55 | 25,425 |
| | | | $ 1,137,623 |
| Brazil — 0.4% |
| Nota do Tesouro Nacional, 10.00%, 1/1/27 | BRL | 22,375 | $ 4,114,701 |
| | | | $ 4,114,701 |
| China — 2.0% |
| China Government Bond: | | | |
| 2.68%, 5/21/30 | CNY | 40,600 | $ 5,568,123 |
19
See Notes to Financial Statements.
Emerging Markets Local Income Portfolio
October 31, 2022
Portfolio of Investments — continued
| Security | Principal
Amount
(000's omitted) | Value |
| China (continued) |
| China Government Bond: (continued) | | | |
| 3.53%, 10/18/51 | CNY | 93,820 | $ 13,847,468 |
| | | | $ 19,415,591 |
| Colombia — 2.5% |
| Republic of Colombia: | | | |
| 2.625%, 3/15/23 | USD | 3,500 | $ 3,447,066 |
| 4.00%, 2/26/24 | USD | 3,429 | 3,289,748 |
| Titulos De Tesoreria B: | | | |
| 5.75%, 11/3/27 | COP | 27,398,000 | 4,027,515 |
| 6.00%, 4/28/28 | COP | 18,865,200 | 2,744,340 |
| 7.00%, 3/26/31 | COP | 64,677,900 | 8,790,405 |
| 7.00%, 6/30/32 | COP | 5,447,000 | 712,701 |
| 10.00%, 7/24/24 | COP | 3,528,300 | 687,059 |
| | | | $ 23,698,834 |
| Costa Rica — 0.7% |
| Costa Rica Government Bond, 9.66%, 9/30/26(1) | CRC | 4,136,100 | $ 6,752,472 |
| | | | $ 6,752,472 |
| Czech Republic — 0.4% |
| Czech Republic Government Bond, 0.95%, 5/15/30(1) | CZK | 140,000 | $ 3,987,779 |
| | | | $ 3,987,779 |
| Dominican Republic — 5.1% |
| Dominican Republic: | | | |
| 8.00%, 1/15/27(1) | DOP | 111,360 | $ 1,746,879 |
| 8.00%, 2/12/27(1) | DOP | 568,540 | 8,866,241 |
| 8.90%, 2/15/23(1) | DOP | 145,250 | 2,675,276 |
| 12.00%, 8/8/25(2) | DOP | 836,870 | 14,761,457 |
| 12.75%, 9/23/29(2) | DOP | 587,800 | 11,092,860 |
| 13.00%, 6/10/34(1) | DOP | 312,000 | 5,708,155 |
| Dominican Republic Central Bank Notes: | | | |
| 8.00%, 3/12/27(1) | DOP | 36,140 | 538,626 |
| 12.00%, 10/3/25(2) | DOP | 221,270 | 3,895,602 |
| | | | $ 49,285,096 |
| Ecuador — 0.2% |
| Republic of Ecuador, 1.50% to 7/31/23, 7/31/40(1)(6) | USD | 6,853 | $ 2,288,275 |
| | | | $ 2,288,275 |
| El Salvador — 0.5% |
| Republic of El Salvador, 7.75%, 1/24/23(1) | USD | 4,660 | $ 4,252,080 |
| | | | $ 4,252,080 |
| Security | Principal
Amount
(000's omitted) | Value |
| Honduras — 0.2% |
| Honduras Government International Bond, 7.50%, 3/15/24(1) | USD | 2,218 | $ 2,218,000 |
| | | | $ 2,218,000 |
| Hungary — 0.7% |
| Hungary Government Bond, 3.25%, 10/22/31 | HUF | 4,850,000 | $ 7,114,005 |
| | | | $ 7,114,005 |
| Indonesia — 6.1% |
| Indonesia Government Bond: | | | |
| 6.50%, 2/15/31 | IDR | 339,135,000 | $ 20,334,619 |
| 7.50%, 5/15/38 | IDR | 267,486,000 | 17,042,961 |
| 7.50%, 4/15/40 | IDR | 45,427,000 | 2,872,553 |
| 8.25%, 5/15/36 | IDR | 242,576,000 | 16,197,032 |
| 8.375%, 4/15/39 | IDR | 22,764,000 | 1,544,770 |
| 9.50%, 5/15/41 | IDR | 5,702,000 | 427,465 |
| | | | $ 58,419,400 |
| Iraq — 0.2% |
| Republic of Iraq, 6.752%, 3/9/23(1) | USD | 1,710 | $ 1,687,582 |
| | | | $ 1,687,582 |
| Ivory Coast — 0.1% |
| Ivory Coast Government International Bond, 5.125%, 6/15/25(1) | EUR | 721 | $ 666,926 |
| | | | $ 666,926 |
| Jordan — 0.4% |
| Kingdom of Jordan, 4.95%, 7/7/25(1) | USD | 4,503 | $ 4,217,442 |
| | | | $ 4,217,442 |
| Macedonia — 0.6% |
| North Macedonia Government International Bond: | | | |
| 2.75%, 1/18/25(1) | EUR | 913 | $ 823,941 |
| 5.625%, 7/26/23(1) | EUR | 5,192 | 5,122,434 |
| | | | $ 5,946,375 |
| Malaysia — 1.2% |
| Malaysia Government Bond: | | | |
| 3.828%, 7/5/34 | MYR | 28,100 | $ 5,496,585 |
| 4.254%, 5/31/35 | MYR | 27,750 | 5,633,437 |
| | | | $ 11,130,022 |
20
See Notes to Financial Statements.
Emerging Markets Local Income Portfolio
October 31, 2022
Portfolio of Investments — continued
| Security | Principal
Amount
(000's omitted) | Value |
| Mexico — 3.2% |
| Mexican Bonos: | | | |
| 7.75%, 11/13/42 | MXN | 230,000 | $ 9,371,617 |
| 8.50%, 5/31/29 | MXN | 39,000 | 1,844,030 |
| 8.50%, 11/18/38 | MXN | 410,469 | 18,271,349 |
| 10.00%, 11/20/36 | MXN | 22,074 | 1,120,646 |
| | | | $ 30,607,642 |
| Oman — 0.3% |
| Oman Government International Bond, 4.875%, 2/1/25(1) | USD | 3,173 | $ 3,091,454 |
| | | | $ 3,091,454 |
| Paraguay — 0.2% |
| Republic of Paraguay, 4.625%, 1/25/23(1) | USD | 2,330 | $ 2,326,528 |
| | | | $ 2,326,528 |
| Peru — 2.4% |
| Peru Government Bond: | | | |
| 5.94%, 2/12/29 | PEN | 4,380 | $ 987,224 |
| 6.15%, 8/12/32 | PEN | 6,602 | 1,413,466 |
| 6.714%, 2/12/55 | PEN | 4,100 | 830,512 |
| 6.85%, 2/12/42 | PEN | 19,284 | 4,093,957 |
| 6.90%, 8/12/37 | PEN | 8,763 | 1,891,033 |
| 6.95%, 8/12/31 | PEN | 59,887 | 13,834,224 |
| | | | $ 23,050,416 |
| Romania — 3.2% |
| Romania Government International Bond: | | | |
| 2.75%, 2/26/26(1) | EUR | 2,755 | $ 2,487,020 |
| 3.624%, 5/26/30(1) | EUR | 2,755 | 2,144,069 |
| Romanian Government Bond: | | | |
| 3.25%, 6/24/26 | RON | 57,650 | 9,589,911 |
| 4.15%, 1/26/28 | RON | 48,045 | 7,722,013 |
| 4.85%, 4/22/26 | RON | 32,030 | 5,668,019 |
| 5.80%, 7/26/27 | RON | 16,020 | 2,824,513 |
| | | | $ 30,435,545 |
| Serbia — 3.9% |
| Serbia Treasury Bond: | | | |
| 4.50%, 1/11/26 | RSD | 1,114,580 | $ 8,757,149 |
| 4.50%, 8/20/32 | RSD | 3,298,130 | 21,393,150 |
| 5.875%, 2/8/28 | RSD | 970,810 | 7,626,941 |
| | | | $ 37,777,240 |
| Security | Principal
Amount
(000's omitted) | Value |
| Seychelles — 0.1% |
| Republic of Seychelles, 8.00%, 1/1/26(1) | USD | 688 | $ 674,683 |
| | | | $ 674,683 |
| South Africa — 12.4% |
| Republic of South Africa: | | | |
| 8.25%, 3/31/32 | ZAR | 147,394 | $ 6,613,121 |
| 8.50%, 1/31/37 | ZAR | 369,200 | 15,504,566 |
| 8.75%, 1/31/44 | ZAR | 408,487 | 16,882,091 |
| 8.75%, 2/28/48 | ZAR | 231,000 | 9,504,090 |
| 9.00%, 1/31/40 | ZAR | 334,480 | 14,345,197 |
| 10.50%, 12/21/26 | ZAR | 980,230 | 56,004,172 |
| | | | $118,853,237 |
| Suriname — 0.5% |
| Republic of Suriname, 9.25%, 10/26/26(1)(7) | USD | 5,529 | $ 4,439,787 |
| | | | $ 4,439,787 |
| Thailand — 3.8% |
| Thailand Government Bond: | | | |
| 1.585%, 12/17/35 | THB | 528,144 | $ 10,972,076 |
| 3.30%, 6/17/38 | THB | 594,751 | 14,658,518 |
| 3.40%, 6/17/36 | THB | 205,000 | 5,239,907 |
| 4.875%, 6/22/29 | THB | 183,489 | 5,363,958 |
| | | | $ 36,234,459 |
| Ukraine — 4.1% |
| Ukraine Government Bond: | | | |
| 9.79%, 5/26/27(4) | UAH | 914,377 | $ 8,188,451 |
| 9.99%, 5/22/24(4) | UAH | 589,859 | 6,896,361 |
| 10.00%, 8/23/23(4) | UAH | 38,483 | 402,061 |
| 10.95%, 11/1/23(4) | UAH | 12,367 | 129,208 |
| 11.67%, 11/22/23(4) | UAH | 118,929 | 1,242,542 |
| 12.52%, 5/13/26(4) | UAH | 166,150 | 1,529,241 |
| 15.84%, 2/26/25(4) | UAH | 1,853,842 | 20,751,963 |
| 15.97%, 4/19/23(4) | UAH | 2,910 | 30,403 |
| | | | $ 39,170,230 |
| United Arab Emirates — 0.3% |
| Sharjah Sukuk Ltd., 3.764%, 9/17/24(1) | USD | 2,747 | $ 2,629,665 |
| | | | $ 2,629,665 |
| Uruguay — 1.8% |
| Uruguay Government Bond, 3.875%, 7/2/40(8) | UYU | 678,613 | $ 16,847,962 |
21
See Notes to Financial Statements.
Emerging Markets Local Income Portfolio
October 31, 2022
Portfolio of Investments — continued
| Security | Principal
Amount
(000's omitted) | Value |
| Uruguay (continued) |
| Uruguay Monetary Regulation Bill, 0.00%, 7/3/24 | UYU | 38,225 | $ 783,044 |
| | | | $ 17,631,006 |
| Uzbekistan — 0.5% |
| Republic of Uzbekistan: | | | |
| 4.75%, 2/20/24(1) | USD | 3,100 | $ 2,960,113 |
| 14.00%, 7/19/24(1) | UZS | 5,000,000 | 437,758 |
| 14.50%, 11/25/23(1) | UZS | 11,470,000 | 1,032,022 |
| | | | $ 4,429,893 |
| Vietnam — 0.3% |
| Vietnam Government International Bond, 4.80%, 11/19/24(1) | USD | 3,124 | $ 3,022,470 |
| | | | $ 3,022,470 |
| Zambia — 1.3% |
| Zambia Government Bond: | | | |
| 11.00%, 1/25/26 | ZMW | 100,560 | $ 4,136,824 |
| 11.00%, 12/27/26 | ZMW | 73,540 | 2,733,385 |
| 12.00%, 3/22/28 | ZMW | 31,390 | 1,070,406 |
| 12.00%, 5/31/28 | ZMW | 14,200 | 476,572 |
| 12.00%, 11/1/28 | ZMW | 21,800 | 712,711 |
| 12.00%, 2/21/29 | ZMW | 47,550 | 1,517,673 |
| 13.00%, 12/27/31 | ZMW | 57,140 | 1,731,079 |
| 14.00%, 12/5/31 | ZMW | 4,800 | 154,681 |
| | | | $ 12,533,331 |
Total Sovereign Government Bonds
(identified cost $838,113,831) | | | $588,180,055 |
| Short-Term Investments — 16.1% |
| Security | Shares | Value |
| Morgan Stanley Institutional Liquidity Funds - Government Portfolio, Institutional Class, 2.88%(9) | | 34,198,985 | $ 34,198,985 |
Total Affiliated Fund
(identified cost $34,198,985) | | | $ 34,198,985 |
| Sovereign Government Securities — 8.6% |
| Security | Principal
Amount
(000's omitted) | Value |
| Israel — 4.8% |
| Bank of Israel Treasury Bill: | | | |
| 0.00%, 12/7/22 | ILS | 156,100 | $ 44,114,689 |
| 0.00%, 1/4/23 | ILS | 5,359 | 1,510,546 |
| | | | $ 45,625,235 |
| Uganda — 1.9% |
| Uganda Treasury Bill: | | | |
| 0.00%, 3/30/23 | UGX | 22,640,400 | $ 5,683,418 |
| 0.00%, 4/13/23 | UGX | 16,824,100 | 4,199,437 |
| 0.00%, 4/27/23 | UGX | 1,425,700 | 353,813 |
| 0.00%, 5/25/23 | UGX | 31,532,000 | 7,738,089 |
| | | | $ 17,974,757 |
| Ukraine — 0.3% |
| Ukraine Treasury Bill, 0.00%, 3/1/23(4) | UAH | 122,375 | $ 2,887,584 |
| | | | $ 2,887,584 |
| Uruguay — 1.6% |
| Uruguay Monetary Regulation Bill: | | | |
| 0.00%, 11/11/22 | UYU | 118,450 | $ 2,905,215 |
| 0.00%, 11/16/22 | UYU | 31,006 | 759,278 |
| 0.00%, 11/23/22 | UYU | 236,075 | 5,768,358 |
| 0.00%, 1/11/23 | UYU | 262,600 | 6,316,621 |
| | | | $ 15,749,472 |
Total Sovereign Government Securities
(identified cost $85,759,735) | | | $ 82,237,048 |
| U.S. Treasury Obligations — 3.9% |
| Security | Principal
Amount
(000's omitted) | Value |
| U.S. Treasury Bill: | | | |
| 0.00%, 11/8/22(10) | $ | 15,950 | $ 15,941,739 |
| 0.00%, 11/15/22(10) | | 21,700 | 21,674,726 |
Total U.S. Treasury Obligations
(identified cost $37,617,744) | | | $ 37,616,465 |
Total Short-Term Investments
(identified cost $157,576,464) | | | $154,052,498 |
22
See Notes to Financial Statements.
Emerging Markets Local Income Portfolio
October 31, 2022
Portfolio of Investments — continued
| | | Value |
Total Investments — 83.2%
(identified cost $1,053,966,369) | | | $797,828,466 |
| Other Assets, Less Liabilities — 16.8% | | | $160,902,065 |
| Net Assets — 100.0% | | | $958,730,531 |
| The percentage shown for each investment category in the Portfolio of Investments is based on net assets. |
| (1) | Security exempt from registration under Regulation S of the Securities Act of 1933, as amended, which exempts from registration securities offered and sold outside the United States. Security may not be offered or sold in the United States except pursuant to an exemption from, or in a transaction not subject to, the registration requirements of the Securities Act of 1933, as amended. At October 31, 2022, the aggregate value of these securities is $138,483,635 or 14.4% of the Portfolio's net assets. |
| (2) | Security exempt from registration under Rule 144A of the Securities Act of 1933, as amended. These securities may be sold in certain transactions in reliance on an exemption from registration (normally to qualified institutional buyers). At October 31, 2022, the aggregate value of these securities is $38,600,140 or 4.0% of the Portfolio's net assets. |
| (3) | Amount is less than 0.05%. |
| (4) | For fair value measurement disclosure purposes, security is categorized as Level 3 (see Note 8). |
| (5) | Limited recourse note whose payments by the issuer are limited to amounts received by the issuer from the borrower pursuant to a loan agreement with the borrower. |
| (6) | Step coupon security. Interest rate represents the rate in effect at October 31, 2022. |
| (7) | Issuer is in default with respect to interest and/or principal payments. For a variable rate security, interest rate has been adjusted to reflect non-accrual status. |
| (8) | Inflation-linked security whose principal is adjusted for inflation based on changes in a designated inflation index or inflation rate for the applicable country. Interest is calculated based on the inflation-adjusted principal. |
| (9) | May be deemed to be an affiliated investment company. The rate shown is the annualized seven-day yield as of October 31, 2022. |
| (10) | Security (or a portion thereof) has been pledged to cover collateral requirements on open derivative contracts. |
| Forward Foreign Currency Exchange Contracts (Centrally Cleared) |
| Currency Purchased | Currency Sold | Settlement
Date | Value/Unrealized
Appreciation
(Depreciation) |
| BRL | 83,521,000 | USD | 15,230,497 | 11/3/22 | $ 938,509 |
| BRL | 47,329,000 | USD | 8,678,806 | 11/3/22 | 483,715 |
| BRL | 53,195,000 | USD | 9,914,452 | 11/3/22 | 383,680 |
| BRL | 11,137,000 | USD | 2,038,325 | 11/3/22 | 117,710 |
| BRL | 7,610,000 | USD | 1,396,927 | 11/3/22 | 76,308 |
| BRL | 400,000 | USD | 75,357 | 11/3/22 | 2,079 |
| BRL | 100,000 | USD | 18,850 | 11/3/22 | 509 |
| BRL | 7,000,000 | USD | 1,363,332 | 11/3/22 | (8,187) |
| BRL | 34,074,000 | USD | 6,683,208 | 11/3/22 | (86,750) |
| BRL | 110,858,000 | USD | 21,562,251 | 11/3/22 | (101,018) |
| USD | 2,446,226 | BRL | 12,900,000 | 11/3/22 | (51,112) |
| USD | 3,405,405 | BRL | 17,900,000 | 11/3/22 | (59,894) |
| USD | 6,490,026 | BRL | 34,554,000 | 11/3/22 | (199,356) |
| USD | 9,950,193 | BRL | 52,850,452 | 11/3/22 | (281,237) |
| USD | 14,974,129 | BRL | 80,164,000 | 11/3/22 | (544,988) |
23
See Notes to Financial Statements.
Emerging Markets Local Income Portfolio
October 31, 2022
Portfolio of Investments — continued
| Forward Foreign Currency Exchange Contracts (Centrally Cleared) (continued) |
| Currency Purchased | Currency Sold | Settlement
Date | Value/Unrealized
Appreciation
(Depreciation) |
| USD | 9,700,390 | BRL | 53,195,000 | 11/3/22 | $ (597,742) |
| USD | 19,320,190 | BRL | 103,660,548 | 11/3/22 | (747,673) |
| BRL | 66,930,800 | USD | 12,406,080 | 11/4/22 | 548,024 |
| BRL | 10,328,827 | USD | 1,909,902 | 11/4/22 | 89,188 |
| USD | 14,857,621 | BRL | 77,259,627 | 11/4/22 | (95,573) |
| USD | 17,235,892 | ZAR | 296,164,336 | 11/18/22 | 1,132,749 |
| USD | 782,688 | ZAR | 13,448,922 | 11/18/22 | 51,439 |
| BRL | 103,660,548 | USD | 19,198,531 | 12/2/22 | 745,295 |
| BRL | 34,554,000 | USD | 6,449,168 | 12/2/22 | 198,867 |
| BRL | 77,259,627 | USD | 14,765,902 | 12/2/22 | 98,505 |
| BRL | 25,600,000 | USD | 4,848,898 | 12/2/22 | 76,427 |
| BRL | 25,600,000 | USD | 4,867,855 | 12/2/22 | 57,471 |
| BRL | 4,940,000 | USD | 937,234 | 12/2/22 | 13,200 |
| BRL | 30,106,000 | USD | 5,848,778 | 12/2/22 | (56,518) |
| USD | 9,852,021 | BRL | 53,195,000 | 12/2/22 | (382,460) |
| CLP | 7,662,300,480 | USD | 8,162,411 | 12/21/22 | (107,615) |
| COP | 267,305,447 | USD | 59,827 | 12/21/22 | (6,162) |
| COP | 669,840,234 | USD | 149,919 | 12/21/22 | (15,443) |
| COP | 17,745,107,000 | USD | 3,599,413 | 12/21/22 | (36,912) |
| COP | 155,687,623,689 | USD | 34,733,095 | 12/21/22 | (3,477,302) |
| EUR | 10,518,605 | USD | 10,584,023 | 12/21/22 | (146,526) |
| EUR | 232,869,495 | USD | 234,317,771 | 12/21/22 | (3,243,905) |
| IDR | 98,100,000,000 | USD | 6,250,000 | 12/21/22 | 18,033 |
| IDR | 85,900,000,000 | USD | 5,473,429 | 12/21/22 | 15,093 |
| IDR | 76,890,000,000 | USD | 4,899,100 | 12/21/22 | 13,734 |
| IDR | 74,380,000,000 | USD | 4,740,720 | 12/21/22 | 11,739 |
| IDR | 68,460,462,674 | USD | 4,363,744 | 12/21/22 | 10,491 |
| IDR | 46,458,231,000 | USD | 2,969,810 | 12/21/22 | (1,393) |
| IDR | 46,678,064,232 | USD | 3,118,280 | 12/21/22 | (135,817) |
| IDR | 102,741,465,413 | USD | 6,899,345 | 12/21/22 | (334,750) |
| IDR | 352,113,312,995 | USD | 23,519,378 | 12/21/22 | (1,021,338) |
| KRW | 440,000,000 | USD | 308,462 | 12/21/22 | 90 |
| KRW | 2,833,400,000 | USD | 2,035,503 | 12/21/22 | (48,566) |
| KRW | 4,601,400,000 | USD | 3,305,627 | 12/21/22 | (78,870) |
| KRW | 8,555,100,000 | USD | 6,146,040 | 12/21/22 | (146,729) |
| KRW | 8,897,400,000 | USD | 6,394,475 | 12/21/22 | (155,124) |
| KRW | 8,555,100,000 | USD | 6,161,978 | 12/21/22 | (162,667) |
| PEN | 7,203,306 | USD | 1,794,099 | 12/21/22 | 3,946 |
| PEN | 13,554,568 | USD | 3,457,445 | 12/21/22 | (74,037) |
| PEN | 63,737,218 | USD | 16,298,161 | 12/21/22 | (388,468) |
| USD | 10,203,828 | COP | 45,737,641,000 | 12/21/22 | 1,021,556 |
| USD | 5,125,511 | COP | 22,974,590,000 | 12/21/22 | 513,140 |
| USD | 4,274,784 | COP | 19,209,683,000 | 12/21/22 | 418,255 |
| USD | 2,458,543 | COP | 11,020,172,000 | 12/21/22 | 246,137 |
24
See Notes to Financial Statements.
Emerging Markets Local Income Portfolio
October 31, 2022
Portfolio of Investments — continued
| Forward Foreign Currency Exchange Contracts (Centrally Cleared) (continued) |
| Currency Purchased | Currency Sold | Settlement
Date | Value/Unrealized
Appreciation
(Depreciation) |
| USD | 2,433,158 | COP | 10,933,638,859 | 12/21/22 | $ 238,125 |
| USD | 2,147,278 | COP | 9,649,265,000 | 12/21/22 | 210,095 |
| USD | 1,222,206 | COP | 5,492,103,191 | 12/21/22 | 119,613 |
| USD | 1,029,980 | COP | 4,628,443,000 | 12/21/22 | 100,776 |
| USD | 586,253 | COP | 2,634,385,000 | 12/21/22 | 57,374 |
| USD | 2,296,964 | COP | 11,347,000,000 | 12/21/22 | 18,944 |
| USD | 2,286,937 | COP | 11,346,000,000 | 12/21/22 | 9,119 |
| USD | 2,284,995 | COP | 11,345,000,000 | 12/21/22 | 7,377 |
| USD | 1,920,346 | COP | 9,547,000,000 | 12/21/22 | 3,694 |
| USD | 47,728,127 | EUR | 47,433,128 | 12/21/22 | 660,750 |
| USD | 35,576,732 | EUR | 35,356,839 | 12/21/22 | 492,526 |
| USD | 15,093,289 | EUR | 15,000,000 | 12/21/22 | 208,952 |
| USD | 8,282,029 | EUR | 8,230,839 | 12/21/22 | 114,657 |
| USD | 6,659,334 | EUR | 6,618,174 | 12/21/22 | 92,192 |
| USD | 5,538,197 | EUR | 5,503,967 | 12/21/22 | 76,671 |
| USD | 5,185,654 | EUR | 5,153,602 | 12/21/22 | 71,790 |
| USD | 1,155,484 | EUR | 1,148,342 | 12/21/22 | 15,997 |
| USD | 707,750 | EUR | 703,376 | 12/21/22 | 9,798 |
| USD | 396,156 | EUR | 398,508 | 12/21/22 | 721 |
| USD | 16,406,328 | IDR | 245,622,414,013 | 12/21/22 | 712,451 |
| USD | 3,687,617 | IDR | 55,128,400,000 | 12/21/22 | 165,226 |
| USD | 3,402,804 | IDR | 50,944,061,062 | 12/21/22 | 147,768 |
| USD | 2,730,746 | IDR | 40,692,600,000 | 12/21/22 | 130,720 |
| USD | 1,167,254 | IDR | 17,394,000,000 | 12/21/22 | 55,876 |
| USD | 89,144 | IDR | 1,334,599,288 | 12/21/22 | 3,871 |
| USD | 57,714 | IDR | 859,900,000 | 12/21/22 | 2,771 |
| USD | 55,727 | IDR | 830,000,000 | 12/21/22 | 2,695 |
| USD | 56,057 | IDR | 839,900,000 | 12/21/22 | 2,392 |
| USD | 14,683 | IDR | 218,800,000 | 12/21/22 | 703 |
| USD | 14,447,030 | PEN | 56,498,002 | 12/21/22 | 344,347 |
| USD | 6,306,008 | PEN | 24,778,196 | 12/21/22 | 121,027 |
| USD | 5,738,661 | PEN | 22,534,000 | 12/21/22 | 113,862 |
| USD | 3,359,198 | PEN | 13,440,151 | 12/21/22 | 4,350 |
| USD | 28,538 | PEN | 114,417 | 12/21/22 | (22) |
| USD | 3,326,274 | PEN | 13,350,000 | 12/21/22 | (6,071) |
| BRL | 113,618,000 | USD | 20,780,499 | 1/4/23 | 926,279 |
| BRL | 72,310,542 | USD | 13,235,447 | 1/4/23 | 579,519 |
| IDR | 50,196,000,000 | USD | 3,291,239 | 1/11/23 | (87,743) |
| IDR | 53,482,000,000 | USD | 3,504,718 | 1/11/23 | (91,511) |
| IDR | 60,168,000,000 | USD | 3,946,996 | 1/11/23 | (107,089) |
| BRL | 80,164,000 | USD | 14,691,200 | 2/2/23 | 529,912 |
| BRL | 52,850,452 | USD | 9,761,271 | 2/2/23 | 273,690 |
| USD | 5,258,970 | IDR | 80,173,000,000 | 7/11/23 | 190,068 |
| USD | 3,018,893 | IDR | 46,020,000,000 | 7/11/23 | 109,299 |
25
See Notes to Financial Statements.
Emerging Markets Local Income Portfolio
October 31, 2022
Portfolio of Investments — continued
| Forward Foreign Currency Exchange Contracts (Centrally Cleared) (continued) |
| Currency Purchased | Currency Sold | Settlement
Date | Value/Unrealized
Appreciation
(Depreciation) |
| USD | 2,471,594 | IDR | 37,653,000,000 | 7/11/23 | $ 91,000 |
| | | | | | $ 1,216,318 |
| Forward Foreign Currency Exchange Contracts (OTC) |
| Currency Purchased | Currency Sold | Counterparty | Settlement
Date | Unrealized
Appreciation | Unrealized
(Depreciation) |
| KZT | 253,765,227 | USD | 525,938 | Citibank, N.A. | 11/1/22 | $ 17,282 | $ — |
| KZT | 253,765,226 | USD | 525,938 | Citibank, N.A. | 11/1/22 | 17,282 | — |
| KZT | 54,546,232 | USD | 113,049 | Citibank, N.A. | 11/1/22 | 3,715 | — |
| KZT | 54,546,232 | USD | 113,049 | Citibank, N.A. | 11/1/22 | 3,715 | — |
| USD | 116,495 | KZT | 54,546,231 | Citibank, N.A. | 11/1/22 | — | (269) |
| USD | 116,495 | KZT | 54,546,231 | Citibank, N.A. | 11/1/22 | — | (269) |
| USD | 541,967 | KZT | 253,765,226 | Citibank, N.A. | 11/1/22 | — | (1,253) |
| USD | 541,967 | KZT | 253,765,227 | Citibank, N.A. | 11/1/22 | — | (1,253) |
| USD | 621,851 | ZMW | 10,695,839 | Citibank, N.A. | 11/1/22 | — | (39,572) |
| USD | 12,586,414 | EUR | 12,500,000 | Citibank, N.A. | 11/4/22 | 231,607 | — |
| USD | 3,476,909 | EUR | 3,500,000 | Standard Chartered Bank | 11/4/22 | 17,563 | — |
| USD | 283,190 | EUR | 287,296 | UBS AG | 11/4/22 | — | (768) |
| KZT | 593,832,875 | USD | 1,221,250 | JPMorgan Chase Bank, N.A. | 11/7/22 | 47,662 | — |
| KZT | 591,389,138 | USD | 1,225,677 | JPMorgan Chase Bank, N.A. | 11/7/22 | 38,013 | — |
| USD | 456,988 | ZMW | 8,385,735 | Standard Chartered Bank | 11/16/22 | — | (60,002) |
| TRY | 105,000,000 | USD | 5,527,770 | Standard Chartered Bank | 11/17/22 | 53,945 | — |
| USD | 12,843,753 | CNH | 88,000,000 | Standard Chartered Bank | 11/17/22 | 838,527 | — |
| USD | 9,194,420 | CNH | 62,000,000 | Standard Chartered Bank | 11/17/22 | 736,193 | — |
| USD | 9,795,756 | CNH | 67,040,000 | Standard Chartered Bank | 11/17/22 | 649,957 | — |
| USD | 2,045,986 | CNH | 15,000,000 | UBS AG | 11/17/22 | — | (359) |
| EUR | 3,117,028 | USD | 3,065,257 | UBS AG | 11/18/22 | 18,605 | — |
| KZT | 384,173,671 | USD | 779,257 | Citibank, N.A. | 11/18/22 | 38,439 | — |
| KZT | 383,939,893 | USD | 779,257 | Citibank, N.A. | 11/18/22 | 37,941 | — |
| KZT | 383,784,042 | USD | 779,257 | Citibank, N.A. | 11/18/22 | 37,610 | — |
| KZT | 383,589,228 | USD | 779,257 | Citibank, N.A. | 11/18/22 | 37,195 | — |
| USD | 1,595,026 | EUR | 1,558,514 | Standard Chartered Bank | 11/18/22 | 53,095 | — |
| USD | 1,581,885 | EUR | 1,558,514 | Standard Chartered Bank | 11/18/22 | 39,954 | — |
| EUR | 1,243,906 | USD | 1,224,078 | Citibank, N.A. | 11/22/22 | 6,945 | — |
| KZT | 306,373,977 | USD | 621,953 | Citibank, N.A. | 11/22/22 | 29,223 | — |
| KZT | 306,000,805 | USD | 621,953 | Citibank, N.A. | 11/22/22 | 28,430 | — |
| USD | 1,257,177 | EUR | 1,243,906 | UBS AG | 11/22/22 | 26,154 | — |
| EUR | 519,197 | USD | 511,094 | UBS AG | 11/25/22 | 2,836 | — |
| KZT | 251,291,340 | USD | 519,197 | JPMorgan Chase Bank, N.A. | 11/25/22 | 14,336 | — |
| USD | 521,427 | EUR | 519,197 | Standard Chartered Bank | 11/25/22 | 7,497 | — |
| EUR | 3,109,764 | USD | 3,061,744 | Citibank, N.A. | 11/28/22 | 17,139 | — |
| KZT | 1,530,781,465 | USD | 3,109,764 | Citibank, N.A. | 11/28/22 | 136,881 | — |
26
See Notes to Financial Statements.
Emerging Markets Local Income Portfolio
October 31, 2022
Portfolio of Investments — continued
| Forward Foreign Currency Exchange Contracts (OTC) (continued) |
| Currency Purchased | Currency Sold | Counterparty | Settlement
Date | Unrealized
Appreciation | Unrealized
(Depreciation) |
| KZT | 610,446,727 | USD | 1,243,906 | Citibank, N.A. | 11/28/22 | $ 50,795 | $ — |
| KZT | 609,202,822 | USD | 1,243,906 | Citibank, N.A. | 11/28/22 | 48,157 | — |
| USD | 3,131,215 | EUR | 3,109,764 | UBS AG | 11/28/22 | 52,333 | — |
| KZT | 405,452,305 | USD | 832,979 | JPMorgan Chase Bank, N.A. | 12/2/22 | 25,730 | — |
| KZT | 90,806,655 | USD | 186,557 | JPMorgan Chase Bank, N.A. | 12/2/22 | 5,763 | — |
| KZT | 1,331,886,823 | USD | 2,726,483 | JPMorgan Chase Bank, N.A. | 12/6/22 | 89,846 | — |
| KZT | 486,656,961 | USD | 1,000,837 | JPMorgan Chase Bank, N.A. | 12/6/22 | 28,219 | — |
| KZT | 765,741,473 | USD | 1,565,133 | Citibank, N.A. | 12/7/22 | 53,416 | — |
| USD | 45,998,350 | ILS | 156,100,000 | Citibank, N.A. | 12/8/22 | 1,722,374 | — |
| SGD | 7,960,000 | USD | 5,528,876 | Goldman Sachs International | 12/12/22 | 95,538 | — |
| SGD | 5,840,000 | USD | 4,054,443 | Goldman Sachs International | 12/12/22 | 72,011 | — |
| SGD | 18,317,600 | USD | 12,915,089 | Goldman Sachs International | 12/12/22 | 27,846 | — |
| SGD | 10,520,000 | USD | 7,409,703 | Standard Chartered Bank | 12/12/22 | 23,568 | — |
| SGD | 9,280,000 | USD | 6,537,122 | Standard Chartered Bank | 12/12/22 | 19,984 | — |
| SGD | 12,600,000 | USD | 8,971,004 | Standard Chartered Bank | 12/12/22 | — | (68,038) |
| SGD | 14,491,800 | USD | 10,321,317 | Standard Chartered Bank | 12/12/22 | — | (81,633) |
| SGD | 18,300,000 | USD | 12,894,171 | UBS AG | 12/12/22 | 36,329 | — |
| SGD | 15,900,000 | USD | 11,203,945 | UBS AG | 12/12/22 | 30,751 | — |
| USD | 1,334,105 | SGD | 1,900,000 | JPMorgan Chase Bank, N.A. | 12/12/22 | — | (8,406) |
| USD | 1,875,306 | SGD | 2,675,300 | Standard Chartered Bank | 12/12/22 | — | (15,020) |
| KZT | 597,803,980 | USD | 1,221,878 | JPMorgan Chase Bank, N.A. | 12/13/22 | 38,700 | — |
| KZT | 596,887,571 | USD | 1,221,878 | JPMorgan Chase Bank, N.A. | 12/13/22 | 36,767 | — |
| USD | 761,647 | ZMW | 13,892,445 | ICBC Standard Bank plc | 12/13/22 | — | (89,489) |
| ZMW | 22,954,909 | USD | 1,262,994 | ICBC Standard Bank plc | 12/13/22 | 143,365 | — |
| EUR | 1,406,924 | PLN | 6,800,000 | UBS AG | 12/14/22 | — | (20,234) |
| EUR | 31,910,357 | RON | 160,000,000 | Goldman Sachs International | 12/14/22 | — | (435,485) |
| EUR | 2,592,988 | RON | 13,030,000 | Standard Chartered Bank | 12/14/22 | — | (41,128) |
| PLN | 168,059,960 | EUR | 35,008,845 | Standard Chartered Bank | 12/14/22 | 264,942 | — |
| PLN | 168,059,960 | EUR | 35,008,845 | Standard Chartered Bank | 12/14/22 | 264,942 | — |
| PLN | 3,250,000 | EUR | 677,013 | Standard Chartered Bank | 12/14/22 | 5,124 | — |
| PLN | 3,250,000 | EUR | 677,013 | Standard Chartered Bank | 12/14/22 | 5,124 | — |
| RON | 187,327,000 | EUR | 37,360,447 | Goldman Sachs International | 12/14/22 | 509,863 | — |
| USD | 8,416,611 | MYR | 37,900,000 | Goldman Sachs International | 12/14/22 | 397,749 | — |
| USD | 6,843,684 | MYR | 30,800,000 | Goldman Sachs International | 12/14/22 | 327,036 | — |
| USD | 6,290,986 | MYR | 28,300,000 | Goldman Sachs International | 12/14/22 | 303,287 | — |
| USD | 1,480,261 | ZAR | 26,000,000 | Standard Chartered Bank | 12/14/22 | 69,423 | — |
| USD | 7,689,508 | ZAR | 142,424,500 | Standard Chartered Bank | 12/14/22 | — | (38,875) |
| USD | 7,670,626 | ZAR | 142,424,500 | Standard Chartered Bank | 12/14/22 | — | (57,756) |
| ZAR | 58,719,700 | USD | 3,212,794 | Standard Chartered Bank | 12/14/22 | — | (26,486) |
| ZAR | 56,749,560 | USD | 3,230,930 | Standard Chartered Bank | 12/14/22 | — | (151,528) |
| KZT | 898,996,991 | USD | 1,832,817 | JPMorgan Chase Bank, N.A. | 12/15/22 | 61,381 | — |
| USD | 2,519,891 | ZAR | 45,000,000 | Citibank, N.A. | 12/15/22 | 78,238 | — |
| USD | 4,028,159 | ZAR | 73,200,000 | Standard Chartered Bank | 12/15/22 | 56,403 | — |
| USD | 33,881,494 | ZAR | 603,395,524 | State Street Bank and Trust Company | 12/15/22 | 1,141,878 | — |
| USD | 22,711,675 | ZAR | 401,031,402 | State Street Bank and Trust Company | 12/15/22 | 952,127 | — |
27
See Notes to Financial Statements.
Emerging Markets Local Income Portfolio
October 31, 2022
Portfolio of Investments — continued
| Forward Foreign Currency Exchange Contracts (OTC) (continued) |
| Currency Purchased | Currency Sold | Counterparty | Settlement
Date | Unrealized
Appreciation | Unrealized
(Depreciation) |
| USD | 17,115,663 | ZAR | 300,773,550 | State Street Bank and Trust Company | 12/15/22 | $ 796,002 | $ — |
| USD | 11,410,442 | ZAR | 200,515,700 | State Street Bank and Trust Company | 12/15/22 | 530,668 | — |
| USD | 14,571,279 | ZAR | 259,499,899 | State Street Bank and Trust Company | 12/15/22 | 491,083 | — |
| USD | 9,767,519 | ZAR | 172,469,970 | State Street Bank and Trust Company | 12/15/22 | 409,477 | — |
| USD | 7,360,865 | ZAR | 129,352,477 | State Street Bank and Trust Company | 12/15/22 | 342,333 | — |
| USD | 4,907,243 | ZAR | 86,234,985 | State Street Bank and Trust Company | 12/15/22 | 228,222 | — |
| USD | 5,235,070 | ZAR | 93,231,362 | State Street Bank and Trust Company | 12/15/22 | 176,433 | — |
| USD | 3,509,208 | ZAR | 61,963,839 | State Street Bank and Trust Company | 12/15/22 | 147,114 | — |
| USD | 2,644,562 | ZAR | 46,472,879 | State Street Bank and Trust Company | 12/15/22 | 122,991 | — |
| USD | 1,763,041 | ZAR | 30,981,920 | State Street Bank and Trust Company | 12/15/22 | 81,994 | — |
| USD | 23,218,116 | ZAR | 419,351,000 | UBS AG | 12/15/22 | 464,565 | — |
| ZAR | 17,636,914 | USD | 998,834 | State Street Bank and Trust Company | 12/15/22 | — | (41,873) |
| ZAR | 17,636,914 | USD | 1,003,637 | State Street Bank and Trust Company | 12/15/22 | — | (46,676) |
| ZAR | 17,636,914 | USD | 1,003,637 | State Street Bank and Trust Company | 12/15/22 | — | (46,676) |
| ZAR | 53,586,117 | USD | 3,008,935 | State Street Bank and Trust Company | 12/15/22 | — | (101,407) |
| ZAR | 283,784,583 | USD | 16,071,617 | State Street Bank and Trust Company | 12/15/22 | — | (673,760) |
| ZAR | 283,784,584 | USD | 16,148,898 | State Street Bank and Trust Company | 12/15/22 | — | (751,041) |
| ZAR | 283,784,583 | USD | 16,148,898 | State Street Bank and Trust Company | 12/15/22 | — | (751,041) |
| ZAR | 862,220,778 | USD | 48,414,890 | State Street Bank and Trust Company | 12/15/22 | — | (1,631,684) |
| CZK | 38,870,000 | EUR | 1,561,535 | Goldman Sachs International | 12/16/22 | 16,002 | — |
| CZK | 7,071,566 | EUR | 286,895 | Goldman Sachs International | 12/16/22 | 127 | — |
| CZK | 7,071,566 | EUR | 286,904 | Goldman Sachs International | 12/16/22 | 118 | — |
| CZK | 7,071,566 | EUR | 286,906 | Goldman Sachs International | 12/16/22 | 116 | — |
| CZK | 2,585,304 | EUR | 104,907 | Goldman Sachs International | 12/16/22 | 26 | — |
| CZK | 1,373,097,322 | EUR | 55,125,343 | UBS AG | 12/16/22 | 601,441 | — |
| CZK | 227,046,936 | EUR | 9,154,229 | UBS AG | 12/16/22 | 60,731 | — |
| EUR | 5,271,610 | CZK | 131,308,627 | UBS AG | 12/16/22 | — | (57,516) |
| EUR | 7,848,209 | HUF | 3,270,030,050 | Goldman Sachs International | 12/16/22 | — | (11,459) |
| EUR | 862,886 | HUF | 364,500,000 | HSBC Bank USA, N.A. | 12/16/22 | — | (13,109) |
| HUF | 12,380,028,669 | EUR | 29,712,587 | Goldman Sachs International | 12/16/22 | 43,384 | — |
| EUR | 984,526 | HUF | 416,120,000 | UBS AG | 12/21/22 | — | (13,663) |
| EUR | 3,432,667 | PLN | 16,660,000 | UBS AG | 12/21/22 | — | (54,228) |
| MXN | 3,214,967 | USD | 158,440 | Goldman Sachs International | 12/21/22 | 2,440 | — |
| MXN | 2,244,692,380 | USD | 109,896,642 | Standard Chartered Bank | 12/21/22 | 2,430,017 | — |
| MXN | 6,484,637 | USD | 317,478 | Standard Chartered Bank | 12/21/22 | 7,020 | — |
| MXN | 141,308,986 | USD | 6,947,893 | UBS AG | 12/21/22 | 123,351 | — |
| MXN | 135,855,681 | USD | 6,693,570 | UBS AG | 12/21/22 | 104,785 | — |
| MYR | 13,386,240 | USD | 2,961,230 | Goldman Sachs International | 12/21/22 | — | (129,101) |
| MYR | 264,857,029 | USD | 58,590,207 | Goldman Sachs International | 12/21/22 | — | (2,554,358) |
| PLN | 7,000,000 | EUR | 1,452,189 | Goldman Sachs International | 12/21/22 | 12,969 | — |
| RON | 11,000,000 | EUR | 2,228,751 | BNP Paribas | 12/21/22 | — | (7,543) |
| THB | 46,000,000 | USD | 1,215,645 | Standard Chartered Bank | 12/21/22 | — | (1,711) |
| THB | 814,000,000 | USD | 22,173,795 | Standard Chartered Bank | 12/21/22 | — | (692,436) |
| THB | 1,149,302,124 | USD | 31,218,311 | Standard Chartered Bank | 12/21/22 | — | (888,371) |
| THB | 1,334,000,000 | USD | 36,238,675 | Standard Chartered Bank | 12/21/22 | — | (1,034,582) |
28
See Notes to Financial Statements.
Emerging Markets Local Income Portfolio
October 31, 2022
Portfolio of Investments — continued
| Forward Foreign Currency Exchange Contracts (OTC) (continued) |
| Currency Purchased | Currency Sold | Counterparty | Settlement
Date | Unrealized
Appreciation | Unrealized
(Depreciation) |
| USD | 3,001,666 | MXN | 60,960,000 | Barclays Bank PLC | 12/21/22 | $ — | $ (48,833) |
| USD | 3,920,997 | MXN | 80,000,000 | Goldman Sachs International | 12/21/22 | — | (82,283) |
| USD | 1,052,181 | MXN | 21,491,654 | Standard Chartered Bank | 12/21/22 | — | (23,283) |
| USD | 14,044,203 | MXN | 286,864,271 | Standard Chartered Bank | 12/21/22 | — | (310,773) |
| USD | 28,241,086 | MXN | 576,847,145 | Standard Chartered Bank | 12/21/22 | — | (624,924) |
| USD | 16,260,532 | THB | 595,750,000 | Standard Chartered Bank | 12/21/22 | 538,764 | — |
| USD | 12,360,268 | THB | 455,000,000 | Standard Chartered Bank | 12/21/22 | 352,875 | — |
| USD | 8,780,158 | THB | 323,241,524 | Standard Chartered Bank | 12/21/22 | 249,855 | — |
| USD | 5,847,624 | THB | 214,140,000 | Standard Chartered Bank | 12/21/22 | 196,496 | — |
| USD | 2,953,074 | THB | 109,500,000 | Standard Chartered Bank | 12/21/22 | 63,383 | — |
| USD | 4,202,918 | THB | 159,900,000 | Standard Chartered Bank | 12/21/22 | — | (16,823) |
| USD | 5,208,114 | THB | 198,200,000 | Standard Chartered Bank | 12/21/22 | — | (22,359) |
| USD | 11,120,780 | THB | 422,990,000 | Standard Chartered Bank | 12/21/22 | — | (41,873) |
| CNH | 552,778,617 | USD | 82,586,488 | BNP Paribas | 12/22/22 | — | (7,016,729) |
| CNH | 63,840,000 | USD | 9,548,267 | Standard Chartered Bank | 12/22/22 | — | (820,771) |
| CNH | 72,270,000 | USD | 10,807,020 | Standard Chartered Bank | 12/22/22 | — | (927,067) |
| USD | 12,502,164 | CNH | 83,848,000 | Bank of America, N.A. | 12/22/22 | 1,039,396 | — |
| USD | 11,951,751 | CNH | 80,000,000 | Bank of America, N.A. | 12/22/22 | 1,015,038 | — |
| USD | 10,043,289 | CNH | 67,400,000 | Bank of America, N.A. | 12/22/22 | 829,109 | — |
| USD | 25,174,315 | CNH | 168,500,000 | BNP Paribas | 12/22/22 | 2,138,865 | — |
| USD | 15,134,470 | CNH | 101,300,000 | BNP Paribas | 12/22/22 | 1,285,858 | — |
| USD | 7,383,405 | CNH | 49,400,000 | BNP Paribas | 12/22/22 | 629,985 | — |
| USD | 4,439,011 | CNH | 29,700,000 | BNP Paribas | 12/22/22 | 378,756 | — |
| USD | 3,645,420 | CNH | 24,400,000 | BNP Paribas | 12/22/22 | 309,723 | — |
| USD | 1,061,178 | CNH | 7,100,000 | BNP Paribas | 12/22/22 | 90,544 | — |
| USD | 5,767,050 | CNH | 38,600,000 | JPMorgan Chase Bank, N.A. | 12/22/22 | 490,086 | — |
| USD | 3,466,206 | CNH | 23,200,000 | JPMorgan Chase Bank, N.A. | 12/22/22 | 294,559 | — |
| USD | 836,670 | CNH | 5,600,000 | JPMorgan Chase Bank, N.A. | 12/22/22 | 71,101 | — |
| USD | 14,897,157 | CNH | 100,000,000 | Standard Chartered Bank | 12/22/22 | 1,226,267 | — |
| USD | 11,576,010 | CNH | 77,500,000 | Standard Chartered Bank | 12/22/22 | 981,070 | — |
| USD | 6,871,774 | CNH | 46,000,000 | Standard Chartered Bank | 12/22/22 | 583,165 | — |
| USD | 6,036,903 | CNH | 40,395,516 | Standard Chartered Bank | 12/22/22 | 514,477 | — |
| USD | 4,138,003 | CNH | 27,700,000 | Standard Chartered Bank | 12/22/22 | 351,166 | — |
| USD | 3,633,339 | CNH | 24,312,235 | Standard Chartered Bank | 12/22/22 | 309,640 | — |
| USD | 985,950 | CNH | 6,600,000 | Standard Chartered Bank | 12/22/22 | 83,671 | — |
| USD | 867,719 | CNH | 5,806,280 | Standard Chartered Bank | 12/22/22 | 73,949 | — |
| USD | 1,523,357 | ILS | 5,354,449 | Goldman Sachs International | 1/4/23 | — | (470) |
| USD | 646,542 | ZMW | 10,779,473 | Societe Generale | 1/19/23 | — | (7,864) |
| USD | 2,058,311 | ZMW | 35,608,787 | Goldman Sachs International | 1/26/23 | — | (99,365) |
| USD | 617,493 | ZMW | 10,645,586 | Societe Generale | 1/26/23 | — | (27,565) |
| USD | 576,926 | ZMW | 9,908,699 | Societe Generale | 1/30/23 | — | (22,835) |
| USD | 463,820 | ZMW | 8,842,724 | Societe Generale | 2/17/23 | — | (68,634) |
| USD | 304,659 | ZMW | 5,986,547 | Standard Chartered Bank | 5/17/23 | — | (46,283) |
| UZS | 17,164,000,000 | USD | 1,400,000 | ICBC Standard Bank plc | 8/1/23 | — | (16,502) |
29
See Notes to Financial Statements.
Emerging Markets Local Income Portfolio
October 31, 2022
Portfolio of Investments — continued
| Forward Foreign Currency Exchange Contracts (OTC) (continued) |
| Currency Purchased | Currency Sold | Counterparty | Settlement
Date | Unrealized
Appreciation | Unrealized
(Depreciation) |
| UZS | 8,143,221,557 | USD | 648,862 | JPMorgan Chase Bank, N.A. | 10/24/23 | $ — | $ (8,386) |
| | | | | | | $31,517,957 | $(20,873,680) |
| Non-Deliverable Bond Forward Contracts* |
| Settlement Date | Notional Amount
(000's omitted) | Reference Entity | Counterparty | Aggregate Cost | Unrealized
Appreciation
(Depreciation) |
| 11/21/22 | COP | 27,573,800 | Republic of Colombia,
6.25%, 11/26/25 | Bank of America, N.A. | $ 5,583,154 | $ (95,438) |
| 11/22/22 | COP | 14,598,340 | Republic of Colombia,
5.75%, 11/3/27 | Bank of America, N.A. | 2,955,878 | (120,955) |
| 11/22/22 | COP | 56,900,000 | Republic of Colombia,
6.00%, 4/28/28 | Bank of America, N.A. | 11,521,134 | (509,914) |
| 11/22/22 | COP | 24,000,000 | Republic of Colombia,
7.50%, 8/26/26 | Bank of America, N.A. | 4,859,529 | (120,774) |
| 11/22/22 | COP | 67,000,000 | Republic of Colombia,
7.75%, 9/18/30 | Bank of America, N.A. | 13,566,186 | (812,533) |
| 11/22/22 | COP | 73,500,000 | Republic of Colombia,
10.00%, 7/24/24 | Bank of America, N.A. | 14,882,308 | (77,968) |
| 11/23/22 | COP | 28,233,600 | Republic of Colombia,
6.25%, 11/26/25 | Goldman Sachs International | 5,716,750 | 79,623 |
| 12/7/22 | COP | 48,000,000 | Republic of Colombia,
7.50%, 8/26/26 | Bank of America, N.A. | 9,719,058 | (51,492) |
| 12/8/22 | COP | 28,680,000 | Republic of Colombia,
5.75%, 11/3/27 | Bank of America, N.A. | 5,807,137 | 265,851 |
| 12/8/22 | COP | 18,000,000 | Republic of Colombia,
6.00%, 4/28/28 | Goldman Sachs International | 3,644,647 | (151,067) |
| 12/8/22 | COP | 36,489,600 | Republic of Colombia,
6.25%, 11/26/25 | Bank of America, N.A. | 7,388,428 | 235,055 |
| 12/8/22 | COP | 4,122,000 | Republic of Colombia,
6.25%, 11/26/25 | Goldman Sachs International | 834,624 | (19,260) |
| 12/14/22 | COP | 6,183,000 | Republic of Colombia,
6.25%, 11/26/25 | Goldman Sachs International | 1,251,936 | (4,294) |
| 12/16/22 | COP | 7,756,000 | Republic of Colombia,
6.25%, 11/26/25 | Goldman Sachs International | 1,570,438 | 24,926 |
| 12/19/22 | COP | 6,183,000 | Republic of Colombia,
6.25%, 11/26/25 | Goldman Sachs International | 1,251,936 | (9,135) |
| 12/20/22 | COP | 25,537,800 | Republic of Colombia,
6.25%, 11/26/25 | Goldman Sachs International | 5,170,904 | (1,329) |
| 12/21/22 | COP | 5,496,000 | Republic of Colombia,
6.25%, 11/26/25 | Goldman Sachs International | 1,112,832 | 37,003 |
| 12/22/22 | COP | 43,166,100 | Republic of Colombia,
6.25%, 11/26/25 | Goldman Sachs International | 8,740,289 | 210,798 |
| 1/10/23 | COP | 4,072,000 | Republic of Colombia,
6.25%, 11/26/25 | Goldman Sachs International | 824,500 | — |
| | | | | | | $ (1,120,903) |
| * | Represents a short-term forward contract to purchase the reference entity denominated in a non-deliverable foreign currency. |
30
See Notes to Financial Statements.
Emerging Markets Local Income Portfolio
October 31, 2022
Portfolio of Investments — continued
| Futures Contracts |
| Description | Number of
Contracts | Position | Expiration
Date | Notional
Amount | Value/Unrealized
Appreciation
(Depreciation) |
| Interest Rate Futures | | | | | |
| Euro-Bobl | (23) | Short | 12/8/22 | $(2,720,069) | $ 70,462 |
| Euro-Bund | (15) | Short | 12/8/22 | (2,052,199) | 90,870 |
| U.S. 5-Year Treasury Note | (13) | Short | 12/30/22 | (1,385,719) | 60,836 |
| | | | | | $222,168 |
| Interest Rate Swaps (Centrally Cleared) |
Notional Amount
(000's omitted) | Portfolio
Pays/
Receives
Floating
Rate | Floating Rate | Annual
Fixed Rate | Termination
Date | Value | Unamortized
Upfront
Receipts
(Payments) | Unrealized
Appreciation
(Depreciation) |
| BRL | 63,539 | Pays | Brazil CETIP Interbank Deposit Rate
(pays upon termination) | 4.12%
(pays upon termination) | 1/2/23 | $ (942,842) | $ — | $ (942,842) |
| BRL | 109,032 | Pays | Brazil CETIP Interbank Deposit Rate
(pays upon termination) | 4.70%
(pays upon termination) | 1/2/23 | (1,225,951) | — | (1,225,951) |
| BRL | 175,133 | Receives | Brazil CETIP Interbank Deposit Rate
(pays upon termination) | 4.71%
(pays upon termination) | 1/2/23 | 2,357,167 | — | 2,357,167 |
| BRL | 62,400 | Pays | Brazil CETIP Interbank Deposit Rate
(pays upon termination) | 4.84%
(pays upon termination) | 1/2/23 | (647,746) | — | (647,746) |
| BRL | 40,336 | Pays | Brazil CETIP Interbank Deposit Rate
(pays upon termination) | 5.84%
(pays upon termination) | 1/2/23 | (154,440) | — | (154,440) |
| BRL | 30,974 | Pays | Brazil CETIP Interbank Deposit Rate
(pays upon termination) | 5.96%
(pays upon termination) | 1/2/23 | (83,880) | — | (83,880) |
| BRL | 76,081 | Pays | Brazil CETIP Interbank Deposit Rate
(pays upon termination) | 6.55%
(pays upon termination) | 1/2/23 | 130,916 | — | 130,916 |
| BRL | 35,200 | Pays | Brazil CETIP Interbank Deposit Rate
(pays upon termination) | 8.13%
(pays upon termination) | 1/2/23 | 540,952 | — | 540,952 |
| BRL | 31,500 | Pays | Brazil CETIP Interbank Deposit Rate
(pays upon termination) | 5.41%
(pays upon termination) | 1/2/25 | (1,011,387) | — | (1,011,387) |
| BRL | 69,990 | Pays | Brazil CETIP Interbank Deposit Rate
(pays upon termination) | 5.76%
(pays upon termination) | 1/2/25 | (2,233,474) | — | (2,233,474) |
| BRL | 67,422 | Pays | Brazil CETIP Interbank Deposit Rate
(pays upon termination) | 6.09%
(pays upon termination) | 1/2/25 | (2,011,976) | — | (2,011,976) |
| BRL | 70,160 | Pays | Brazil CETIP Interbank Deposit Rate
(pays upon termination) | 6.27%
(pays upon termination) | 1/2/25 | (1,563,074) | — | (1,563,074) |
| BRL | 72,000 | Receives | Brazil CETIP Interbank Deposit Rate
(pays upon termination) | 6.36%
(pays upon termination) | 1/2/25 | 2,061,079 | — | 2,061,079 |
31
See Notes to Financial Statements.
Emerging Markets Local Income Portfolio
October 31, 2022
Portfolio of Investments — continued
| Interest Rate Swaps (Centrally Cleared) (continued) |
Notional Amount
(000's omitted) | Portfolio
Pays/
Receives
Floating
Rate | Floating Rate | Annual
Fixed Rate | Termination
Date | Value | Unamortized
Upfront
Receipts
(Payments) | Unrealized
Appreciation
(Depreciation) |
| BRL | 11,269 | Pays | Brazil CETIP Interbank Deposit Rate
(pays upon termination) | 8.57%
(pays upon termination) | 1/2/25 | $ 77,400 | $ — | $ 77,400 |
| BRL | 47,000 | Pays | Brazil CETIP Interbank Deposit Rate
(pays upon termination) | 9.58%
(pays upon termination) | 1/2/25 | 1,463,168 | — | 1,463,168 |
| BRL | 5,239 | Pays | Brazil CETIP Interbank Deposit Rate
(pays upon termination) | 9.90%
(pays upon termination) | 1/2/25 | 197,283 | — | 197,283 |
| BRL | 57,316 | Pays | Brazil CETIP Interbank Deposit Rate
(pays upon termination) | 11.48%
(pays upon termination) | 1/2/25 | (46,237) | — | (46,237) |
| BRL | 57,254 | Pays | Brazil CETIP Interbank Deposit Rate
(pays upon termination) | 11.49%
(pays upon termination) | 1/2/25 | (43,921) | — | (43,921) |
| BRL | 37,730 | Pays | Brazil CETIP Interbank Deposit Rate
(pays upon termination) | 11.51%
(pays upon termination) | 1/2/25 | (25,958) | — | (25,958) |
| BRL | 77,800 | Pays | Brazil CETIP Interbank Deposit Rate
(pays upon termination) | 11.74%
(pays upon termination) | 1/2/25 | (2,167) | — | (2,167) |
| BRL | 48,500 | Pays | Brazil CETIP Interbank Deposit Rate
(pays upon termination) | 13.19%
(pays upon termination) | 1/2/25 | 294,217 | — | 294,217 |
| BRL | 11,000 | Pays | Brazil CETIP Interbank Deposit Rate
(pays upon termination) | 11.53%
(pays upon termination) | 1/4/27 | 14,244 | — | 14,244 |
| BRL | 19,090 | Pays | Brazil CETIP Interbank Deposit Rate
(pays upon termination) | 13.17%
(pays upon termination) | 1/2/29 | 413,555 | — | 413,555 |
| BRL | 15,200 | Pays | Brazil CETIP Interbank Deposit Rate
(pays upon termination) | 13.07%
(pays upon termination) | 1/2/31 | 424,098 | — | 424,098 |
| CLP | 5,000,000 | Pays | 6-month Sinacofi Chile Interbank Rate
(pays semi-annually) | 3.68%
(pays semi-annually) | 2/11/24 | (477,237) | — | (477,237) |
| CLP | 1,140,000 | Pays | 6-month Sinacofi Chile Interbank Rate
(pays semi-annually) | 3.49%
(pays semi-annually) | 4/26/24 | (100,944) | — | (100,944) |
| CLP | 2,650,000 | Pays | 6-month Sinacofi Chile Interbank Rate
(pays annually) | 1.38%
(pays annually) | 6/17/25 | (521,370) | — | (521,370) |
| CLP | 3,700,000 | Pays | 6-month Sinacofi Chile Interbank Rate
(pays semi-annually) | 1.33%
(pays semi-annually) | 9/11/25 | (684,308) | — | (684,308) |
| CLP | 5,200,000 | Pays | 6-month Sinacofi Chile Interbank Rate
(pays semi-annually) | 1.48%
(pays semi-annually) | 12/23/25 | (1,085,484) | — | (1,085,484) |
| CLP | 2,500,000 | Pays | 6-month Sinacofi Chile Interbank Rate
(pays semi-annually) | 1.59%
(pays semi-annually) | 1/27/26 | (500,138) | — | (500,138) |
| CLP | 2,500,000 | Pays | 6-month Sinacofi Chile Interbank Rate
(pays semi-annually) | 1.92%
(pays semi-annually) | 2/23/26 | (462,519) | — | (462,519) |
32
See Notes to Financial Statements.
Emerging Markets Local Income Portfolio
October 31, 2022
Portfolio of Investments — continued
| Interest Rate Swaps (Centrally Cleared) (continued) |
Notional Amount
(000's omitted) | Portfolio
Pays/
Receives
Floating
Rate | Floating Rate | Annual
Fixed Rate | Termination
Date | Value | Unamortized
Upfront
Receipts
(Payments) | Unrealized
Appreciation
(Depreciation) |
| CLP | 584,900 | Pays | 6-month Sinacofi Chile Interbank Rate
(pays semi-annually) | 2.87%
(pays semi-annually) | 5/31/26 | $ (102,350) | $ — | $ (102,350) |
| CLP | 2,217,300 | Pays | 6-month Sinacofi Chile Interbank Rate
(pays semi-annually) | 6.61%
(pays semi-annually) | 12/21/27 | 2,331 | — | 2,331 |
| CLP | 794,000 | Pays | 6-month Sinacofi Chile Interbank Rate
(pays semi-annually) | 4.02%
(pays semi-annually) | 3/18/29 | (112,397) | — | (112,397) |
| CLP | 3,362,600 | Pays | 6-month Sinacofi Chile Interbank Rate
(pays semi-annually) | 4.08%
(pays semi-annually) | 7/1/31 | (586,464) | — | (586,464) |
| CLP | 1,759,504 | Pays | 6-month Sinacofi Chile Interbank Rate
(pays semi-annually) | 4.18%
(pays semi-annually) | 7/2/31 | (293,833) | — | (293,833) |
| CLP | 4,871,900 | Pays | 6-month Sinacofi Chile Interbank Rate
(pays semi-annually) | 4.22%
(pays semi-annually) | 7/12/31 | (795,492) | — | (795,492) |
| CLP | 466,400 | Pays | 6-month Sinacofi Chile Interbank Rate
(pays semi-annually) | 6.20%
(pays semi-annually) | 4/8/32 | (6,822) | — | (6,822) |
| CLP | 1,432,670 | Pays | 6-month Sinacofi Chile Interbank Rate
(pays semi-annually) | 6.35%
(pays semi-annually) | 4/11/32 | (5,601) | — | (5,601) |
| CLP | 274,770 | Pays | 6-month Sinacofi Chile Interbank Rate
(pays semi-annually) | 6.40%
(pays semi-annually) | 4/20/32 | 224 | — | 224 |
| CLP | 1,398,810 | Pays | 6-month Sinacofi Chile Interbank Rate
(pays semi-annually) | 6.38%
(pays semi-annually) | 4/22/32 | (118) | — | (118) |
| CNY | 33,000 | Pays | 7-day China Fixing Repo Rates
(pays quarterly) | 2.47%
(pays quarterly) | 9/21/27 | 24,129 | — | 24,129 |
| CNY | 56,300 | Pays | 7-day China Fixing Repo Rates
(pays quarterly) | 2.47%
(pays quarterly) | 9/21/27 | 41,166 | — | 41,166 |
| CNY | 24,400 | Pays | 7-day China Fixing Repo Rates
(pays quarterly) | 2.50%
(pays quarterly) | 9/21/27 | 22,396 | — | 22,396 |
| CNY | 28,200 | Pays | 7-day China Fixing Repo Rates
(pays quarterly) | 2.50%
(pays quarterly) | 9/21/27 | 26,761 | — | 26,761 |
| CNY | 18,800 | Pays | 7-day China Fixing Repo Rates
(pays quarterly) | 2.51%
(pays quarterly) | 9/21/27 | 19,244 | — | 19,244 |
| CNY | 28,100 | Pays | 7-day China Fixing Repo Rates
(pays quarterly) | 2.52%
(pays quarterly) | 9/21/27 | 31,037 | — | 31,037 |
| CNY | 28,100 | Pays | 7-day China Fixing Repo Rates
(pays quarterly) | 2.52%
(pays quarterly) | 9/21/27 | 30,163 | — | 30,163 |
| CNY | 9,400 | Pays | 7-day China Fixing Repo Rates
(pays quarterly) | 2.52%
(pays quarterly) | 9/21/27 | 10,324 | — | 10,324 |
33
See Notes to Financial Statements.
Emerging Markets Local Income Portfolio
October 31, 2022
Portfolio of Investments — continued
| Interest Rate Swaps (Centrally Cleared) (continued) |
Notional Amount
(000's omitted) | Portfolio
Pays/
Receives
Floating
Rate | Floating Rate | Annual
Fixed Rate | Termination
Date | Value | Unamortized
Upfront
Receipts
(Payments) | Unrealized
Appreciation
(Depreciation) |
| CNY | 28,100 | Pays | 7-day China Fixing Repo Rates
(pays quarterly) | 2.52%
(pays quarterly) | 9/21/27 | $ 30,862 | $ — | $ 30,862 |
| COP | 6,031,600 | Receives | Colombia Overnight Interbank Reference Rate
(pays quarterly) | 3.76%
(pays quarterly) | 11/26/25 | 247,822 | — | 247,822 |
| COP | 12,063,100 | Receives | Colombia Overnight Interbank Reference Rate
(pays quarterly) | 4.00%
(pays quarterly) | 11/26/25 | 479,599 | — | 479,599 |
| COP | 11,354,500 | Receives | Colombia Overnight Interbank Reference Rate
(pays quarterly) | 4.05%
(pays quarterly) | 11/26/25 | 448,117 | — | 448,117 |
| COP | 15,464,200 | Receives | Colombia Overnight Interbank Reference Rate
(pays quarterly) | 4.11%
(pays quarterly) | 11/26/25 | 605,821 | — | 605,821 |
| COP | 12,992,300 | Receives | Colombia Overnight Interbank Reference Rate
(pays quarterly) | 4.16%
(pays quarterly) | 11/26/25 | 505,024 | — | 505,024 |
| COP | 12,063,100 | Receives | Colombia Overnight Interbank Reference Rate
(pays quarterly) | 4.20%
(pays quarterly) | 11/26/25 | 466,231 | — | 466,231 |
| COP | 12,063,100 | Receives | Colombia Overnight Interbank Reference Rate
(pays quarterly) | 4.28%
(pays quarterly) | 11/26/25 | 460,884 | — | 460,884 |
| COP | 6,488,700 | Receives | Colombia Overnight Interbank Reference Rate
(pays quarterly) | 4.34%
(pays quarterly) | 11/26/25 | 245,614 | — | 245,614 |
| COP | 20,568,100 | Receives | Colombia Overnight Interbank Reference Rate
(pays quarterly) | 4.53%
(pays quarterly) | 11/26/25 | 757,450 | — | 757,450 |
| COP | 12,079,200 | Receives | Colombia Overnight Interbank Reference Rate
(pays quarterly) | 4.55%
(pays quarterly) | 11/26/25 | 443,763 | — | 443,763 |
| COP | 5,979,100 | Receives | Colombia Overnight Interbank Reference Rate
(pays quarterly) | 4.73%
(pays quarterly) | 11/26/25 | 213,530 | — | 213,530 |
| COP | 25,137,100 | Receives | Colombia Overnight Interbank Reference Rate
(pays quarterly) | 4.78%
(pays quarterly) | 11/26/25 | 890,752 | — | 890,752 |
| COP | 20,568,100 | Pays | Colombia Overnight Interbank Reference Rate
(pays quarterly) | 5.68%
(pays quarterly) | 11/26/25 | (626,281) | — | (626,281) |
| COP | 5,427,000 | Receives | Colombia Overnight Interbank Reference Rate
(pays quarterly) | 8.60%
(pays quarterly) | 11/26/25 | 77,535 | — | 77,535 |
| COP | 10,304,000 | Receives | Colombia Overnight Interbank Reference Rate
(pays quarterly) | 8.75%
(pays quarterly) | 11/26/25 | 138,478 | — | 138,478 |
| COP | 5,427,000 | Receives | Colombia Overnight Interbank Reference Rate
(pays quarterly) | 8.85%
(pays quarterly) | 11/26/25 | 69,928 | — | 69,928 |
| COP | 5,496,000 | Receives | Colombia Overnight Interbank Reference Rate
(pays quarterly) | 9.23%
(pays quarterly) | 11/26/25 | 59,154 | — | 59,154 |
34
See Notes to Financial Statements.
Emerging Markets Local Income Portfolio
October 31, 2022
Portfolio of Investments — continued
| Interest Rate Swaps (Centrally Cleared) (continued) |
Notional Amount
(000's omitted) | Portfolio
Pays/
Receives
Floating
Rate | Floating Rate | Annual
Fixed Rate | Termination
Date | Value | Unamortized
Upfront
Receipts
(Payments) | Unrealized
Appreciation
(Depreciation) |
| COP | 3,792,000 | Receives | Colombia Overnight Interbank Reference Rate
(pays quarterly) | 9.42%
(pays quarterly) | 11/26/25 | $ 36,990 | $ — | $ 36,990 |
| COP | 9,065,738 | Receives | Colombia Overnight Interbank Reference Rate
(pays quarterly) | 10.00%
(pays quarterly) | 11/26/25 | 58,948 | — | 58,948 |
| COP | 3,383,000 | Receives | Colombia Overnight Interbank Reference Rate
(pays quarterly) | 10.17%
(pays quarterly) | 11/26/25 | 18,784 | (59) | 18,725 |
| COP | 6,495,000 | Receives | Colombia Overnight Interbank Reference Rate
(pays quarterly) | 10.28%
(pays quarterly) | 11/26/25 | 32,228 | — | 32,228 |
| COP | 25,708,100 | Receives | Colombia Overnight Interbank Reference Rate
(pays quarterly) | 4.38%
(pays quarterly) | 3/30/26 | 1,025,153 | — | 1,025,153 |
| COP | 41,744,000 | Receives | Colombia Overnight Interbank Reference Rate
(pays quarterly) | 4.38%
(pays quarterly) | 3/30/26 | 1,664,127 | — | 1,664,127 |
| COP | 17,723,600 | Receives | Colombia Overnight Interbank Reference Rate
(pays quarterly) | 4.56%
(pays quarterly) | 4/6/26 | 687,016 | — | 687,016 |
| COP | 41,012,000 | Receives | Colombia Overnight Interbank Reference Rate
(pays quarterly) | 11.93%
(pays quarterly) | 12/21/27 | (266,614) | — | (266,614) |
| COP | 10,005,000 | Receives | Colombia Overnight Interbank Reference Rate
(pays quarterly) | 12.10%
(pays quarterly) | 12/21/27 | (77,500) | — | (77,500) |
| COP | 7,441,800 | Receives | Colombia Overnight Interbank Reference Rate
(pays quarterly) | 4.82%
(pays quarterly) | 3/26/28 | 378,261 | — | 378,261 |
| COP | 5,315,600 | Receives | Colombia Overnight Interbank Reference Rate
(pays quarterly) | 4.83%
(pays quarterly) | 3/26/28 | 269,751 | — | 269,751 |
| COP | 14,203,000 | Receives | Colombia Overnight Interbank Reference Rate
(pays quarterly) | 11.93%
(pays quarterly) | 12/21/32 | (165,061) | — | (165,061) |
| CZK | 200,800 | Pays | 6-month CZK PRIBOR
(pays semi-annually) | 1.40%
(pays annually) | 3/6/25 | (951,099) | — | (951,099) |
| CZK | 258,400 | Receives | 6-month CZK PRIBOR
(pays semi-annually) | 1.37%
(pays annually) | 3/17/25 | 1,224,121 | — | 1,224,121 |
| CZK | 300,000 | Pays | 6-month CZK PRIBOR
(pays semi-annually) | 1.46%
(pays annually) | 3/15/26 | (1,766,187) | — | (1,766,187) |
| CZK | 147,500 | Pays | 6-month CZK PRIBOR
(pays semi-annually) | 1.73%
(pays annually) | 5/6/26 | (961,481) | — | (961,481) |
| CZK | 143,000 | Pays | 6-month CZK PRIBOR
(pays semi-annually) | 5.15%
(pays annually) | 9/21/27 | (222,494) | — | (222,494) |
| CZK | 422,198 | Pays | 6-month CZK PRIBOR
(pays semi-annually) | 1.74%
(pays annually) | 5/31/29 | (4,101,742) | — | (4,101,742) |
| CZK | 243,250 | Pays | 6-month CZK PRIBOR
(pays semi-annually) | 2.47%
(pays annually) | 10/5/31 | (2,208,481) | — | (2,208,481) |
| CZK | 116,720 | Pays | 6-month CZK PRIBOR
(pays semi-annually) | 2.51%
(pays annually) | 10/6/31 | (1,044,857) | — | (1,044,857) |
| CZK | 391,000 | Receives | 6-month CZK PRIBOR
(pays semi-annually) | 2.75%
(pays annually) | 10/20/31 | 3,217,959 | — | 3,217,959 |
35
See Notes to Financial Statements.
Emerging Markets Local Income Portfolio
October 31, 2022
Portfolio of Investments — continued
| Interest Rate Swaps (Centrally Cleared) (continued) |
Notional Amount
(000's omitted) | Portfolio
Pays/
Receives
Floating
Rate | Floating Rate | Annual
Fixed Rate | Termination
Date | Value | Unamortized
Upfront
Receipts
(Payments) | Unrealized
Appreciation
(Depreciation) |
| CZK | 388,980 | Pays | 6-month CZK PRIBOR
(pays semi-annually) | 2.65%
(pays annually) | 12/15/31 | $ (3,326,879) | $ — | $ (3,326,879) |
| HUF | 480,000 | Pays | 6-month HUF BUBOR
(pays semi-annually) | 0.79%
(pays annually) | 8/6/24 | (270,279) | — | (270,279) |
| HUF | 3,500,000 | Pays | 6-month HUF BUBOR
(pays semi-annually) | 0.71%
(pays annually) | 11/22/24 | (2,221,339) | — | (2,221,339) |
| HUF | 6,619,000 | Receives | 6-month HUF BUBOR
(pays semi-annually) | 1.30%
(pays annually) | 3/16/25 | 4,045,840 | — | 4,045,840 |
| HUF | 1,000,000 | Pays | 6-month HUF BUBOR
(pays semi-annually) | 1.20%
(pays annually) | 11/4/25 | (778,475) | — | (778,475) |
| HUF | 2,000,000 | Pays | 6-month HUF BUBOR
(pays semi-annually) | 1.06%
(pays annually) | 12/22/25 | (1,534,103) | — | (1,534,103) |
| HUF | 881,600 | Receives | 6-month HUF BUBOR
(pays semi-annually) | 10.03%
(pays annually) | 9/21/27 | 164,816 | — | 164,816 |
| ILS | 13,000 | Pays | 3-month ILS TELBOR
(pays quarterly) | 3.64%
(pays annually) | 12/21/27 | 540 | — | 540 |
| INR | 289,000 | Pays | 1-day INR FBIL MIBOR
(pays semi-annually) | 6.87%
(pays semi-annually) | 12/21/27 | (11,886) | — | (11,886) |
| KRW | 93,003,200 | Pays | 3-month KRW Certificate of Deposit Rate
(pays quarterly) | 1.75%
(pays quarterly) | 10/5/23 | (1,502,771) | — | (1,502,771) |
| KRW | 63,950,500 | Pays | 3-month KRW Certificate of Deposit Rate
(pays quarterly) | 1.75%
(pays quarterly) | 10/5/23 | (1,032,932) | — | (1,032,932) |
| KRW | 40,588,300 | Pays | 3-month KRW Certificate of Deposit Rate
(pays quarterly) | 1.77%
(pays quarterly) | 10/5/23 | (652,471) | — | (652,471) |
| KRW | 11,700,000 | Pays | 3-month KRW Certificate of Deposit Rate
(pays quarterly) | 2.07%
(pays quarterly) | 11/24/31 | (1,250,183) | — | (1,250,183) |
| MXN | 267,700 | Pays | Mexico Interbank TIIE 28 Day
(pays monthly) | 7.58%
(pays monthly) | 3/21/23 | (173,519) | (783) | (174,302) |
| MXN | 350,500 | Pays | Mexico Interbank TIIE 28 Day
(pays monthly) | 8.98%
(pays monthly) | 11/29/23 | (324,835) | (2,917) | (327,752) |
| MXN | 185,000 | Pays | Mexico Interbank TIIE 28 Day
(pays monthly) | 8.13%
(pays monthly) | 2/2/24 | (283,501) | — | (283,501) |
| MXN | 600,760 | Receives | Mexico Interbank TIIE 28 Day
(pays monthly) | 6.76%
(pays monthly) | 3/7/24 | 1,492,817 | — | 1,492,817 |
| MXN | 166,961 | Receives | Mexico Interbank TIIE 28 Day
(pays monthly) | 6.79%
(pays monthly) | 3/7/24 | 411,589 | — | 411,589 |
| MXN | 408,300 | Receives | Mexico Interbank TIIE 28 Day
(pays monthly) | 7.35%
(pays monthly) | 3/14/24 | 855,039 | — | 855,039 |
| MXN | 67,771 | Pays | Mexico Interbank TIIE 28 Day
(pays monthly) | 6.08%
(pays monthly) | 6/27/24 | (228,236) | — | (228,236) |
| MXN | 224,000 | Pays | Mexico Interbank TIIE 28 Day
(pays monthly) | 7.19%
(pays monthly) | 6/27/24 | (558,770) | — | (558,770) |
36
See Notes to Financial Statements.
Emerging Markets Local Income Portfolio
October 31, 2022
Portfolio of Investments — continued
| Interest Rate Swaps (Centrally Cleared) (continued) |
Notional Amount
(000's omitted) | Portfolio
Pays/
Receives
Floating
Rate | Floating Rate | Annual
Fixed Rate | Termination
Date | Value | Unamortized
Upfront
Receipts
(Payments) | Unrealized
Appreciation
(Depreciation) |
| MXN | 130,204 | Receives | Mexico Interbank TIIE 28 Day
(pays monthly) | 6.66%
(pays monthly) | 11/7/24 | $ 428,483 | $ — | $ 428,483 |
| MXN | 391,500 | Pays | Mexico Interbank TIIE 28 Day
(pays monthly) | 4.65%
(pays monthly) | 2/6/25 | (2,174,007) | — | (2,174,007) |
| MXN | 144,000 | Receives | Mexico Interbank TIIE 28 Day
(pays monthly) | 7.40%
(pays monthly) | 3/11/25 | 387,544 | — | 387,544 |
| MXN | 205,000 | Pays | Mexico Interbank TIIE 28 Day
(pays monthly) | 5.44%
(pays monthly) | 3/14/25 | (982,373) | — | (982,373) |
| MXN | 222,000 | Pays | Mexico Interbank TIIE 28 Day
(pays monthly) | 4.71%
(pays monthly) | 12/12/25 | (1,477,912) | — | (1,477,912) |
| MXN | 111,000 | Pays | Mexico Interbank TIIE 28 Day
(pays monthly) | 6.07%
(pays monthly) | 4/28/26 | (573,288) | — | (573,288) |
| MXN | 165,000 | Pays | Mexico Interbank TIIE 28 Day
(pays monthly) | 6.11%
(pays monthly) | 6/8/26 | (846,928) | — | (846,928) |
| MXN | 130,000 | Pays | Mexico Interbank TIIE 28 Day
(pays monthly) | 6.21%
(pays monthly) | 6/29/26 | (658,455) | — | (658,455) |
| MXN | 160,000 | Pays | Mexico Interbank TIIE 28 Day
(pays monthly) | 6.54%
(pays monthly) | 9/4/26 | (763,479) | — | (763,479) |
| MXN | 176,000 | Pays | Mexico Interbank TIIE 28 Day
(pays monthly) | 7.86%
(pays monthly) | 1/5/28 | (535,156) | (3,658) | (538,814) |
| MXN | 83,120 | Pays | Mexico Interbank TIIE 28 Day
(pays monthly) | 6.77%
(pays monthly) | 9/18/29 | (537,060) | — | (537,060) |
| MXN | 15,300 | Pays | Mexico Interbank TIIE 28 Day
(pays monthly) | 5.91%
(pays monthly) | 5/1/30 | (141,172) | — | (141,172) |
| MXN | 124,500 | Pays | Mexico Interbank TIIE 28 Day
(pays monthly) | 5.37%
(pays monthly) | 12/6/30 | (1,406,995) | — | (1,406,995) |
| MXN | 29,200 | Pays | Mexico Interbank TIIE 28 Day
(pays monthly) | 7.95%
(pays monthly) | 12/3/31 | (120,241) | (243,071) | (363,312) |
| PLN | 35,000 | Pays | 6-month PLN WIBOR
(pays semi-annually) | 2.35%
(pays annually) | 11/19/22 | (61,356) | — | (61,356) |
| PLN | 25,000 | Pays | 6-month PLN WIBOR
(pays semi-annually) | 2.43%
(pays annually) | 6/8/23 | (256,528) | — | (256,528) |
| PLN | 20,000 | Pays | 6-month PLN WIBOR
(pays semi-annually) | 2.04%
(pays annually) | 1/31/24 | (301,549) | — | (301,549) |
| PLN | 16,000 | Pays | 6-month PLN WIBOR
(pays semi-annually) | 2.01%
(pays annually) | 2/11/24 | (244,918) | — | (244,918) |
| PLN | 13,000 | Pays | 6-month PLN WIBOR
(pays semi-annually) | 2.05%
(pays annually) | 2/28/24 | (196,030) | — | (196,030) |
| PLN | 15,522 | Pays | 6-month PLN WIBOR
(pays semi-annually) | 2.01%
(pays annually) | 3/13/24 | (237,432) | — | (237,432) |
37
See Notes to Financial Statements.
Emerging Markets Local Income Portfolio
October 31, 2022
Portfolio of Investments — continued
| Interest Rate Swaps (Centrally Cleared) (continued) |
Notional Amount
(000's omitted) | Portfolio
Pays/
Receives
Floating
Rate | Floating Rate | Annual
Fixed Rate | Termination
Date | Value | Unamortized
Upfront
Receipts
(Payments) | Unrealized
Appreciation
(Depreciation) |
| PLN | 18,000 | Pays | 6-month PLN WIBOR
(pays semi-annually) | 1.99%
(pays annually) | 5/30/24 | $ (413,458) | $ — | $ (413,458) |
| PLN | 37,000 | Pays | 6-month PLN WIBOR
(pays semi-annually) | 1.79%
(pays annually) | 7/5/24 | (896,089) | — | (896,089) |
| PLN | 27,850 | Pays | 6-month PLN WIBOR
(pays semi-annually) | 1.76%
(pays annually) | 8/6/24 | (668,969) | — | (668,969) |
| PLN | 12,200 | Pays | 6-month PLN WIBOR
(pays semi-annually) | 1.66%
(pays annually) | 10/2/24 | (296,227) | — | (296,227) |
| PLN | 11,400 | Pays | 6-month PLN WIBOR
(pays semi-annually) | 2.44%
(pays annually) | 10/28/24 | (245,343) | — | (245,343) |
| PLN | 50,000 | Pays | 6-month PLN WIBOR
(pays semi-annually) | 1.97%
(pays annually) | 1/20/25 | (1,304,817) | — | (1,304,817) |
| PLN | 37,000 | Receives | 6-month PLN WIBOR
(pays semi-annually) | 1.44%
(pays annually) | 3/17/25 | 1,059,495 | — | 1,059,495 |
| PLN | 10,800 | Pays | 6-month PLN WIBOR
(pays semi-annually) | 0.48%
(pays annually) | 8/7/25 | (439,562) | — | (439,562) |
| PLN | 11,000 | Pays | 6-month PLN WIBOR
(pays semi-annually) | 0.69%
(pays annually) | 8/26/25 | (432,804) | — | (432,804) |
| PLN | 42,000 | Pays | 6-month PLN WIBOR
(pays semi-annually) | 0.64%
(pays annually) | 1/25/26 | (1,863,397) | — | (1,863,397) |
| PLN | 48,000 | Receives | 6-month PLN WIBOR
(pays semi-annually) | 1.69%
(pays annually) | 9/20/26 | 2,001,000 | — | 2,001,000 |
| PLN | 102,370 | Receives | 6-month PLN WIBOR
(pays semi-annually) | 2.19%
(pays annually) | 10/8/26 | 3,897,877 | — | 3,897,877 |
| PLN | 13,250 | Pays | 6-month PLN WIBOR
(pays semi-annually) | 3.87%
(pays annually) | 3/3/27 | (324,361) | — | (324,361) |
| PLN | 99,138 | Pays | 6-month PLN WIBOR
(pays semi-annually) | 3.91%
(pays annually) | 3/3/27 | (2,387,989) | — | (2,387,989) |
| PLN | 75,000 | Pays | 6-month PLN WIBOR
(pays semi-annually) | 2.84%
(pays annually) | 1/10/28 | (3,026,970) | — | (3,026,970) |
| PLN | 23,000 | Receives | 6-month PLN WIBOR
(pays semi-annually) | 0.93%
(pays annually) | 5/8/30 | 1,895,440 | — | 1,895,440 |
| PLN | 18,500 | Receives | 6-month PLN WIBOR
(pays semi-annually) | 2.02%
(pays annually) | 5/26/31 | 1,369,396 | — | 1,369,396 |
| PLN | 26,700 | Pays | 6-month PLN WIBOR
(pays semi-annually) | 1.74%
(pays annually) | 7/2/31 | (2,076,830) | — | (2,076,830) |
| PLN | 20,500 | Pays | 6-month PLN WIBOR
(pays semi-annually) | 5.19%
(pays annually) | 9/21/32 | (651,605) | — | (651,605) |
| THB | 175,000 | Pays | 6-month THB Fixing Rate
(pays semi-annually) | 1.29%
(pays semi-annually) | 11/25/24 | (75,471) | — | (75,471) |
| THB | 233,000 | Receives | 6-month THB Fixing Rate
(pays semi-annually) | 1.02%
(pays semi-annually) | 3/17/25 | 178,016 | — | 178,016 |
| THB | 291,000 | Pays | 6-month THB Fixing Rate
(pays semi-annually) | 0.90%
(pays semi-annually) | 2/23/26 | (397,526) | — | (397,526) |
| THB | 120,000 | Pays | 6-month THB Fixing Rate
(pays semi-annually) | 1.30%
(pays semi-annually) | 11/18/26 | (160,570) | — | (160,570) |
| THB | 155,000 | Pays | Thai Overnight Repurchase Rate
(pays quarterly) | 2.45%
(pays quarterly) | 6/15/27 | (36,828) | — | (36,828) |
| THB | 93,000 | Pays | Thai Overnight Repurchase Rate
(pays quarterly) | 1.96%
(pays quarterly) | 8/19/27 | (80,217) | — | (80,217) |
38
See Notes to Financial Statements.
Emerging Markets Local Income Portfolio
October 31, 2022
Portfolio of Investments — continued
| Interest Rate Swaps (Centrally Cleared) (continued) |
Notional Amount
(000's omitted) | Portfolio
Pays/
Receives
Floating
Rate | Floating Rate | Annual
Fixed Rate | Termination
Date | Value | Unamortized
Upfront
Receipts
(Payments) | Unrealized
Appreciation
(Depreciation) |
| THB | 219,000 | Pays | Thai Overnight Repurchase Rate
(pays quarterly) | 2.02%
(pays quarterly) | 9/21/27 | $ (189,776) | $ — | $ (189,776) |
| THB | 93,000 | Pays | Thai Overnight Repurchase Rate
(pays quarterly) | 2.04%
(pays quarterly) | 9/21/27 | (79,033) | — | (79,033) |
| THB | 81,729 | Pays | Thai Overnight Repurchase Rate
(pays quarterly) | 2.87%
(pays quarterly) | 12/21/27 | 1,504 | — | 1,504 |
| THB | 85,271 | Pays | Thai Overnight Repurchase Rate
(pays quarterly) | 2.87%
(pays quarterly) | 12/21/27 | 1,996 | — | 1,996 |
| THB | 204,600 | Pays | 6-month THB Fixing Rate
(pays semi-annually) | 1.72%
(pays semi-annually) | 10/29/31 | (646,281) | — | (646,281) |
| THB | 200,000 | Pays | 6-month THB Fixing Rate
(pays semi-annually) | 1.69%
(pays semi-annually) | 11/4/31 | (618,733) | — | (618,733) |
| ZAR | 55,027 | Pays | 3-month ZAR JIBAR
(pays quarterly) | 6.64%
(pays quarterly) | 2/14/25 | (70,460) | — | (70,460) |
| ZAR | 244,000 | Receives | 3-month ZAR JIBAR
(pays quarterly) | 7.04%
(pays quarterly) | 3/12/25 | 204,768 | — | 204,768 |
| ZAR | 65,700 | Receives | 3-month ZAR JIBAR
(pays quarterly) | 6.91%
(pays quarterly) | 3/13/25 | 66,203 | — | 66,203 |
| ZAR | 43,340 | Pays | 3-month ZAR JIBAR
(pays quarterly) | 5.40%
(pays quarterly) | 6/11/25 | (139,388) | — | (139,388) |
| ZAR | 50,000 | Pays | 3-month ZAR JIBAR
(pays quarterly) | 4.97%
(pays quarterly) | 8/24/25 | (208,136) | 64 | (208,072) |
| ZAR | 54,900 | Pays | 3-month ZAR JIBAR
(pays quarterly) | 5.56%
(pays quarterly) | 2/19/26 | (219,094) | 132 | (218,962) |
| ZAR | 68,770 | Pays | 3-month ZAR JIBAR
(pays quarterly) | 8.79%
(pays quarterly) | 3/18/26 | 92,705 | — | 92,705 |
| ZAR | 79,000 | Pays | 3-month ZAR JIBAR
(pays quarterly) | 5.96%
(pays quarterly) | 5/20/26 | (284,434) | 262 | (284,172) |
| ZAR | 132,000 | Receives | 3-month ZAR JIBAR
(pays quarterly) | 6.64%
(pays quarterly) | 10/18/26 | 389,741 | (589) | 389,152 |
| ZAR | 15,850 | Pays | 3-month ZAR JIBAR
(pays quarterly) | 6.54%
(pays quarterly) | 2/23/27 | (54,732) | — | (54,732) |
| ZAR | 185,000 | Pays | 3-month ZAR JIBAR
(pays quarterly) | 8.07%
(pays quarterly) | 9/21/27 | (142,207) | — | (142,207) |
| ZAR | 108,000 | Pays | 3-month ZAR JIBAR
(pays quarterly) | 8.38%
(pays quarterly) | 5/4/32 | (381,703) | 726 | (380,977) |
| Total | | | | | | $(30,717,430) | $ (249,893) | $ (30,967,323) |
39
See Notes to Financial Statements.
Emerging Markets Local Income Portfolio
October 31, 2022
Portfolio of Investments — continued
| Interest Rate Swaps (OTC) |
| Counterparty | Notional Amount
(000's omitted) | Portfolio
Pays/Receives
Floating Rate | Floating Rate | Annual
Fixed Rate | Termination
Date | Value/Unrealized
Appreciation
(Depreciation) |
| Bank of America, N.A. | BRL | 12,953 | Pays | Brazil CETIP Interbank Deposit Rate
(pays upon termination) | 13.10%
(pays upon termination) | 1/2/23 | $ 2,124,718 |
| Bank of America, N.A. | THB | 400,000 | Pays | 6-month THB Fixing Rate
(pays semi-annually) | 1.91%
(pays semi-annually) | 11/2/22 | 69,643 |
| Bank of America, N.A. | THB | 230,000 | Pays | 6-month THB Fixing Rate
(pays semi-annually) | 1.90%
(pays semi-annually) | 12/8/22 | 34,907 |
| BNP Paribas | MYR | 17,413 | Pays | 3-month MYR KLIBOR
(pays quarterly) | 2.95%
(pays quarterly) | 3/16/27 | (177,947) |
| Citibank, N.A. | THB | 330,000 | Pays | 6-month THB Fixing Rate
(pays semi-annually) | 1.87%
(pays semi-annually) | 3/27/23 | 51,129 |
| Citibank, N.A. | THB | 250,000 | Pays | 6-month THB Fixing Rate
(pays semi-annually) | 2.22%
(pays semi-annually) | 10/25/23 | 26,711 |
| Citibank, N.A. | THB | 87,340 | Pays | 6-month THB Fixing Rate
(pays semi-annually) | 1.96%
(pays semi-annually) | 3/18/24 | 6,361 |
| Credit Suisse International | RUB | 275,000 | Pays | 3-month Moscow Prime Offered Rate
(pays quarterly) | 7.85%
(pays annually) | 11/1/22 | 217,304 |
| Deutsche Bank AG | BRL | 1,970 | Pays | Brazil CETIP Interbank Deposit Rate
(pays upon termination) | 12.98%
(pays upon termination) | 1/2/23 | 313,782 |
| Deutsche Bank AG | THB | 324,320 | Pays | 6-month THB Fixing Rate
(pays semi-annually) | 2.13%
(pays semi-annually) | 11/19/23 | 88,204 |
| JPMorgan Chase Bank, N.A. | MYR | 88,787 | Pays | 3-month MYR KLIBOR
(pays quarterly) | 2.95%
(pays quarterly) | 3/16/27 | (908,154) |
| Nomura International PLC | BRL | 4,440 | Pays | Brazil CETIP Interbank Deposit Rate
(pays upon termination) | 12.83%
(pays upon termination) | 1/2/23 | 678,953 |
| Nomura International PLC | BRL | 2,006 | Pays | Brazil CETIP Interbank Deposit Rate
(pays upon termination) | 12.90%
(pays upon termination) | 1/2/23 | 312,517 |
| Standard Chartered Bank | THB | 650,000 | Pays | 6-month THB Fixing Rate
(pays semi-annually) | 2.15%
(pays semi-annually) | 8/20/23 | 141,827 |
| Total | | | | | | | $ 2,979,955 |
40
See Notes to Financial Statements.
Emerging Markets Local Income Portfolio
October 31, 2022
Portfolio of Investments — continued
| Credit Default Swaps - Buy Protection (Centrally Cleared) | |
| Reference Entity | Notional
Amount
(000's omitted) | Contract
Annual
Fixed Rate* | Termination
Date | Value | Unamortized
Upfront
Receipts
(Payments) | Unrealized
Appreciation
(Depreciation) |
| Markit CDX Emerging Markets Index (CDX.EM.31.V2) | | $86 | 1.00%
(pays quarterly)(1) | 6/20/24 | $ 759 | $ (4,316) | $ (3,557) |
| Total | | | | | $759 | $(4,316) | $(3,557) |
| * | The contract annual fixed rate represents the fixed rate of interest paid by the Portfolio (as a buyer of protection) on the notional amount of the credit default swap contract. |
| (1) | Upfront payment is exchanged with the counterparty as a result of the standardized trading coupon. |
| Cross-Currency Swaps (OTC) | | |
| Counterparty | Portfolio Receives | Portfolio Pays | Effective Date/
Termination
Date(1) | Value/Unrealized
Appreciation
(Depreciation) |
| BNP Paribas | 3-month PLN WIBOR + 1.45% on PLN 17,142,858 (Notional Amount) (pays quarterly) plus EUR equivalent of Notional Amount at effective date* | 3-month EURIBOR on EUR equivalent of Notional Amount at effective date (pays quarterly) plus Notional Amount * | 10/14/25/
10/14/28 | $ (980) |
| Citibank, N.A. | 1-day Indice Camara Promedio Rate on CLP 731,637,500 (pays semi-annually)** | (0.07)% on CLP equivalent of CLF 25,000 (pays semi-annually)** | Not Applicable/
2/25/31 | 42,985 |
| Goldman Sachs International | 1-day Indice Camara Promedio Rate on CLP 381,027,240 (pays semi-annually)** | 2.10% on CLP equivalent of CLF 12,000 (pays semi-annually)** | Not Applicable/
4/8/32 | (23,637) |
| Goldman Sachs International | 1-day Indice Camara Promedio Rate on CLP 1,174,947,580 (pays semi-annually)** | 2.25% on CLP equivalent of CLF 37,000 (pays semi-annually)** | Not Applicable/
4/11/32 | (89,930) |
| Goldman Sachs International | 1-day Indice Camara Promedio Rate on CLP 214,234,175 (pays semi-annually)** | 1.85% on CLP equivalent of CLF 6,700 (pays semi-annually)** | Not Applicable/
4/20/32 | (6,902) |
| Goldman Sachs International | 1-day Indice Camara Promedio Rate on CLP 1,088,523,600 (pays semi-annually)** | 1.84% on CLP equivalent of CLF 34,000 (pays semi-annually)** | Not Applicable/
4/22/32 | (33,686) |
| | | | | $(112,150) |
| * | The Portfolio pays interest on the currency received and receives interest on the currency delivered. At the termination date, the notional amount of the currency received will be exchanged for the notional amount of the currency delivered. |
| ** | At the termination date, the Portfolio will either pay or receive the USD equivalent of the difference between the initial CLP notional amount and the CLP equivalent of the CLF notional amount on such date. |
| (1) | Effective date represents the date on which the Portfolio and counterparty exchange the currencies and begin interest payment accrual. |
41
See Notes to Financial Statements.
Emerging Markets Local Income Portfolio
October 31, 2022
Portfolio of Investments — continued
| Abbreviations: |
| BUBOR | – Budapest Interbank Offered Rate |
| EURIBOR | – Euro Interbank Offered Rate |
| FBIL | – Financial Benchmarks India Ltd. |
| JIBAR | – Johannesburg Interbank Average Rate |
| KLIBOR | – Kuala Lumpur Interbank Offered Rate |
| MIBOR | – Mumbai Interbank Offered Rate |
| OTC | – Over-the-counter |
| PRIBOR | – Prague Interbank Offered Rate |
| TELBOR | – Tel Aviv Interbank Offered Rate |
| WIBOR | – Warsaw Interbank Offered Rate |
| Currency Abbreviations: |
| BAM | – Bosnia-Herzegovina Convertible Mark |
| BRL | – Brazilian Real |
| CLP | – Chilean Peso |
| CNH | – Yuan Renminbi Offshore |
| CNY | – Yuan Renminbi |
| COP | – Colombian Peso |
| CRC | – Costa Rican Colon |
| CZK | – Czech Koruna |
| DOP | – Dominican Peso |
| EUR | – Euro |
| HUF | – Hungarian Forint |
| IDR | – Indonesian Rupiah |
| ILS | – Israeli Shekel |
| INR | – Indian Rupee |
| KRW | – South Korean Won |
| KZT | – Kazakhstani Tenge |
| MXN | – Mexican Peso |
| |
| MYR | – Malaysian Ringgit |
| PEN | – Peruvian Sol |
| PLN | – Polish Zloty |
| RON | – Romania New Leu |
| RSD | – Serbian Dinar |
| RUB | – Russian Ruble |
| SGD | – Singapore Dollar |
| THB | – Thai Baht |
| TRY | – New Turkish Lira |
| UAH | – Ukrainian Hryvnia |
| UGX | – Ugandan Shilling |
| USD | – United States Dollar |
| UYU | – Uruguayan Peso |
| UZS | – Uzbekistani Som |
| ZAR | – South African Rand |
| ZMW | – Zambian Kwacha |
42
See Notes to Financial Statements.
Emerging Markets Local Income Portfolio
October 31, 2022
Statement of Assets and Liabilities
| | October 31, 2022 |
| Assets | |
| Unaffiliated investments, at value (identified cost $1,019,767,384) | $ 763,629,481 |
| Affiliated investment, at value (identified cost $34,198,985) | 34,198,985 |
| Cash | 1,507,847 |
| Deposits for derivatives collateral: | |
| Centrally cleared derivatives | 35,051,228 |
| OTC derivatives | 450,000 |
| Foreign currency, at value (identified cost $22,657,562) | 22,078,086 |
| Interest receivable | 20,008,013 |
| Dividends receivable from affiliated investment | 124,691 |
| Receivable for investments sold | 70,818,400 |
| Receivable for variation margin on open futures contracts | 17,234 |
| Receivable for variation margin on open centrally cleared derivatives | 327,445 |
| Receivable for open forward foreign currency exchange contracts | 31,517,957 |
| Receivable for open swap contracts | 4,109,041 |
| Receivable for open non-deliverable bond forward contracts | 853,256 |
| Total assets | $984,691,664 |
| Liabilities | |
| Cash collateral due to brokers | $ 450,000 |
| Payable for open forward foreign currency exchange contracts | 20,873,680 |
| Payable for open swap contracts | 1,241,236 |
| Payable for closed swap contracts | 32,266 |
| Payable for open non-deliverable bond forward contracts | 1,974,159 |
| Payable to affiliates: | |
| Investment adviser fee | 529,112 |
| Trustees' fees | 6,786 |
| Accrued foreign capital gains taxes | 246,000 |
| Accrued expenses | 607,894 |
| Total liabilities | $ 25,961,133 |
| Net Assets applicable to investors' interest in Portfolio | $958,730,531 |
43
See Notes to Financial Statements.
Emerging Markets Local Income Portfolio
October 31, 2022
| | Year Ended |
| | October 31, 2022 |
| Investment Income | |
| Dividend income from affiliated investments | $ 751,897 |
| Interest income (net of foreign taxes withheld of $2,013,621) | 87,634,586 |
| Total investment income | $ 88,386,483 |
| Expenses | |
| Investment adviser fee | $ 7,941,172 |
| Trustees’ fees and expenses | 74,175 |
| Custodian fee | 1,178,480 |
| Legal and accounting services | 148,069 |
| Miscellaneous | 86,597 |
| Total expenses | $ 9,428,493 |
| Deduct: | |
| Waiver and/or reimbursement of expenses by affiliate | $ 62,028 |
| Total expense reductions | $ 62,028 |
| Net expenses | $ 9,366,465 |
| Net investment income | $ 79,020,018 |
| Realized and Unrealized Gain (Loss) | |
| Net realized gain (loss): | |
| Investment transactions (net of foreign capital gains taxes of $299,630) | $ (75,285,871) |
| Investment transactions - affiliated investment | 4,584 |
| Futures contracts | 5,282,556 |
| Swap contracts | (55,459,009) |
| Foreign currency transactions | (6,345,402) |
| Forward foreign currency exchange contracts | (21,520,267) |
| Non-deliverable bond forward contracts | (21,079,989) |
| Net realized loss | $(174,403,398) |
| Change in unrealized appreciation (depreciation): | |
| Investments (including net decrease in accrued foreign capital gains taxes of $1,334,335) | $ (196,713,633) |
| Futures contracts | (320,378) |
| Swap contracts | 4,988,242 |
| Foreign currency | (989,719) |
| Forward foreign currency exchange contracts | 8,920,609 |
| Non-deliverable bond forward contracts | 506,289 |
| Net change in unrealized appreciation (depreciation) | $(183,608,590) |
| Net realized and unrealized loss | $(358,011,988) |
| Net decrease in net assets from operations | $(278,991,970) |
44
See Notes to Financial Statements.
Emerging Markets Local Income Portfolio
October 31, 2022
Statements of Changes in Net Assets
| | Year Ended October 31, |
| | 2022 | 2021 |
| Increase (Decrease) in Net Assets | | |
| From operations: | | |
| Net investment income | $ 79,020,018 | $ 82,706,890 |
| Net realized gain (loss) | (174,403,398) | 14,692,597 |
| Net change in unrealized appreciation (depreciation) | (183,608,590) | (102,304,622) |
| Net decrease in net assets from operations | $ (278,991,970) | $ (4,905,135) |
| Capital transactions: | | |
| Contributions | $ 154,343,479 | $ 713,025,206 |
| Withdrawals | (478,241,966) | (400,434,173) |
| Net increase (decrease) in net assets from capital transactions | $ (323,898,487) | $ 312,591,033 |
| Net increase (decrease) in net assets | $ (602,890,457) | $ 307,685,898 |
| Net Assets | | |
| At beginning of year | $1,561,620,988 | $ 1,253,935,090 |
| At end of year | $ 958,730,531 | $1,561,620,988 |
45
See Notes to Financial Statements.
Emerging Markets Local Income Portfolio
October 31, 2022
| | Year Ended October 31, |
| Ratios/Supplemental Data | 2022 | 2021 | 2020 | 2019 | 2018 |
| Ratios (as a percentage of average daily net assets): | | | | | |
| Expenses | 0.76% (1) | 0.75% | 0.79% | 0.78% | 0.87% (2) |
| Net investment income | 6.43% | 4.98% | 5.79% | 7.01% | 7.22% |
| Portfolio Turnover | 33% | 56% | 56% | 46% | 52% |
| Total Return | (20.12)% | 1.48% | 0.08% | 23.15% | (9.33)% |
| Net assets, end of year (000’s omitted) | $958,731 | $1,561,621 | $1,253,935 | $1,238,490 | $783,270 |
| (1) | Includes a reduction by the investment adviser of a portion of its adviser fee due to the Portfolio's investment in the Liquidity Fund (equal to less than 0.005% of average daily net assets for the year ended October 31, 2022). |
| (2) | Includes interest expense, including on securities sold short and/or reverse repurchase agreements if applicable, of 0.02% of average daily net assets for the year ended October 31, 2018. |
Emerging Markets Local Income Portfolio
October 31, 2022
Notes to Financial Statements
1 Significant Accounting Policies
Emerging Markets Local Income Portfolio (the Portfolio) is a Massachusetts business trust registered under the Investment Company Act of 1940, as amended (the 1940 Act), as a non-diversified, open-end management investment company. The Portfolio’s investment objective is total return. The Declaration of Trust permits the Trustees to issue interests in the Portfolio. At October 31, 2022, Eaton Vance Emerging Markets Local Income Fund, Eaton Vance Short Duration Strategic Income Fund and Eaton Vance International (Cayman Islands) Short Duration Strategic Income Fund held an interest of 86.7%, 12.6% and 0.7%, respectively, in the Portfolio.
The following is a summary of significant accounting policies of the Portfolio. The policies are in conformity with accounting principles generally accepted in the United States of America (U.S. GAAP). The Portfolio is an investment company and follows accounting and reporting guidance in the Financial Accounting Standards Board (FASB) Accounting Standards Codification Topic 946.
A Investment Valuation—The following methodologies are used to determine the market value or fair value of investments.
Debt Obligations. Debt obligations are generally valued on the basis of valuations provided by third party pricing services, as derived from such services’ pricing models. Inputs to the models may include, but are not limited to, reported trades, executable bid and ask prices, broker/dealer quotations, prices or yields of securities with similar characteristics, interest rates, anticipated prepayments, benchmark curves or information pertaining to the issuer, as well as industry and economic events. The pricing services may use a matrix approach, which considers information regarding securities with similar characteristics to determine the valuation for a security. Short-term debt obligations purchased with a remaining maturity of sixty days or less for which a valuation from a third party pricing service is not readily available may be valued at amortized cost, which approximates fair value.
Derivatives. Futures contracts are valued at the closing settlement price established by the board of trade or exchange on which they are traded. Forward foreign currency exchange contracts are generally valued at the mean of the average bid and average ask prices that are reported by currency dealers to a third party pricing service at the valuation time. Such third party pricing service valuations are supplied for specific settlement periods and the Portfolio's forward foreign currency exchange contracts are valued at an interpolated rate between the closest preceding and subsequent settlement period reported by the third party pricing service. Non-deliverable bond forward contracts are generally valued based on the current price of the underlying bond as provided by a third party pricing service and current interest rates. Swaps are normally valued using valuations provided by a third party pricing service. Such pricing service valuations are based on the present value of fixed and projected floating rate cash flows over the term of the swap contract, and in the case of credit default swaps, based on credit spread quotations obtained from broker/dealers and expected default recovery rates determined by the pricing service using proprietary models. Future cash flows on swaps are discounted to their present value using swap rates provided by electronic data services or by broker/dealers.
Foreign Securities and Currencies. Foreign securities and currencies are valued in U.S. dollars, based on foreign currency exchange rate quotations supplied by a third party pricing service. The pricing service uses a proprietary model to determine the exchange rate. Inputs to the model include reported trades and implied bid/ask spreads.
Other. Investments in management investment companies (including money market funds) that do not trade on an exchange are valued at the net asset value as of the close of each business day.
Fair Valuation. In connection with Rule 2a-5 of the 1940 Act, which became effective September 8, 2022, the Trustees have designated the Portfolio’s investment adviser as its valuation designee. Investments for which valuations or market quotations are not readily available or are deemed unreliable are valued by the investment adviser, as valuation designee, at fair value using methods that most fairly reflect the security’s “fair value”, which is the amount that the Portfolio might reasonably expect to receive for the security upon its current sale in the ordinary course. Each such determination is based on a consideration of relevant factors, which are likely to vary from one pricing context to another. These factors may include, but are not limited to, the type of security, the existence of any contractual restrictions on the security’s disposition, the price and extent of public trading in similar securities of the issuer or of comparable companies or entities, quotations or relevant information obtained from broker/dealers or other market participants, information obtained from the issuer, analysts, and/or the appropriate stock exchange (for exchange-traded securities), an analysis of the company’s or entity’s financial statements, and an evaluation of the forces that influence the issuer and the market(s) in which the security is purchased and sold.
B Investment Transactions—Investment transactions for financial statement purposes are accounted for on a trade date basis. Realized gains and losses on investments sold are determined on the basis of identified cost.
C Income—Interest income is recorded on the basis of interest accrued, adjusted for amortization of premium or accretion of discount. Inflation adjustments to the principal amount of inflation-adjusted bonds and notes are reflected as interest income. Deflation adjustments to the principal amount of an inflation-adjusted bond or note are reflected as reductions to interest income to the extent of interest income previously recorded on such bond or note. Dividend income is recorded on the ex-dividend date for dividends received in cash and/or securities. Withholding taxes on foreign interest and capital gains have been provided for in accordance with the Portfolio's understanding of the applicable countries’ tax rules and rates.
D Federal and Other Taxes—The Portfolio has elected to be treated as a partnership for federal tax purposes. No provision is made by the Portfolio for federal or state taxes on any taxable income of the Portfolio because each investor in the Portfolio is ultimately responsible for the payment of any taxes on its share of taxable income. Since at least one of the Portfolio’s investors is a regulated investment company that invests all or substantially all of its assets
Emerging Markets Local Income Portfolio
October 31, 2022
Notes to Financial Statements — continued
in the Portfolio, the Portfolio normally must satisfy the applicable source of income and diversification requirements (under the Internal Revenue Code) in order for its investors to satisfy them. The Portfolio will allocate, at least annually among its investors, each investor’s distributive share of the Portfolio’s net investment income, net realized capital gains and losses and any other items of income, gain, loss, deduction or credit.
In addition to the requirements of the Internal Revenue Code, the Portfolio may also be subject to local taxes on the recognition of capital gains in certain countries. In determining the daily net asset value, the Portfolio estimates the accrual for such taxes, if any, based on the unrealized appreciation on certain portfolio securities and the related tax rates. Taxes attributable to unrealized appreciation are included in the change in unrealized appreciation (depreciation) on investments. Capital gains taxes on securities sold are included in net realized gain (loss) on investments.
As of October 31, 2022, the Portfolio had no uncertain tax positions that would require financial statement recognition, de-recognition, or disclosure. The Portfolio files a U.S. federal income tax return annually after its fiscal year-end, which is subject to examination by the Internal Revenue Service for a period of three years from the date of filing.
E Foreign Currency Translation—Investment valuations, other assets, and liabilities initially expressed in foreign currencies are translated each business day into U.S. dollars based upon current exchange rates. Purchases and sales of foreign investment securities and income and expenses denominated in foreign currencies are translated into U.S. dollars based upon currency exchange rates in effect on the respective dates of such transactions. Recognized gains or losses on investment transactions attributable to changes in foreign currency exchange rates are recorded for financial statement purposes as net realized gains and losses on investments. That portion of unrealized gains and losses on investments that results from fluctuations in foreign currency exchange rates is not separately disclosed.
F Use of Estimates—The preparation of the financial statements in conformity with U.S. GAAP requires management to make estimates and assumptions that affect the reported amounts of assets and liabilities at the date of the financial statements and the reported amounts of income and expense during the reporting period. Actual results could differ from those estimates.
G Indemnifications—Under the Portfolio’s organizational documents, its officers and Trustees may be indemnified against certain liabilities and expenses arising out of the performance of their duties to the Portfolio. Under Massachusetts law, if certain conditions prevail, interestholders in the Portfolio could be deemed to have personal liability for the obligations of the Portfolio. However, the Portfolio’s Declaration of Trust contains an express disclaimer of liability on the part of Portfolio interestholders. Additionally, in the normal course of business, the Portfolio enters into agreements with service providers that may contain indemnification clauses. The Portfolio’s maximum exposure under these arrangements is unknown as this would involve future claims that may be made against the Portfolio that have not yet occurred.
H Futures Contracts Upon entering into a futures contract, the Portfolio is required to deposit with the broker, either in cash or securities, an amount equal to a certain percentage of the contract amount (initial margin). Subsequent payments, known as variation margin, are made or received by the Portfolio each business day, depending on the daily fluctuations in the value of the underlying security, and are recorded as unrealized gains or losses by the Portfolio. Gains (losses) are realized upon the expiration or closing of the futures contracts. Should market conditions change unexpectedly, the Portfolio may not achieve the anticipated benefits of the futures contracts and may realize a loss. Futures contracts have minimal counterparty risk as they are exchange traded and the clearinghouse for the exchange is substituted as the counterparty, guaranteeing counterparty performance.
I Forward Foreign Currency Exchange and Non-Deliverable Bond Forward Contracts—The Portfolio may enter into forward foreign currency exchange contracts for the purchase or sale of a specific foreign currency at a fixed price on a future date. The forward foreign currency exchange contracts are adjusted by the daily exchange rate of the underlying currency and any gains or losses are recorded as unrealized until such time as the contracts have been closed. While forward foreign currency exchange contracts are privately negotiated agreements between the Portfolio and a counterparty, certain contracts may be “centrally cleared”, whereby all payments made or received by the Portfolio pursuant to the contract are with a central clearing party (CCP) rather than the original counterparty. The CCP guarantees the performance of the original parties to the contract. Upon entering into centrally cleared contracts, the Portfolio is required to deposit with the CCP, either in cash or securities, an amount of initial margin determined by the CCP, which is subject to adjustment. For centrally cleared contracts, the daily change in valuation is recorded as a receivable or payable for variation margin and settled in cash with the CCP daily. The Portfolio may also enter into non-deliverable bond forward contracts for the purchase of a bond denominated in a non-deliverable foreign currency at a fixed price on a future date. For non-deliverable bond forward contracts, unrealized gains and losses, based on changes in the value of the contract, and realized gains and losses are accounted for as described above. Risks may arise upon entering these contracts from the potential inability of counterparties to meet the terms of their contracts and from movements in the value of a foreign currency relative to the U.S. dollar. In the case of centrally cleared contracts, counterparty risk is minimal due to protections provided by the CCP.
J Interest Rate Swaps— Swap contracts are privately negotiated agreements between the Portfolio and a counterparty. Certain swap contracts may be centrally cleared. Pursuant to interest rate swap agreements, the Portfolio either makes floating-rate payments to the counterparty (or CCP in the case of centrally cleared swaps) based on a benchmark interest rate in exchange for fixed-rate payments or the Portfolio makes fixed-rate payments to the counterparty (or CCP in the case of a centrally cleared swap) in exchange for payments on a floating benchmark interest rate. Payments received or made, including amortization of upfront payments/receipts, if any (which are amortized over the life of the swap contract), are recorded as realized gains or losses. During the term of the outstanding swap agreement, changes in the underlying value of the swap are recorded as unrealized gains or losses. For centrally cleared swaps, the daily change in valuation is recorded as a receivable or payable for variation margin and settled in cash with the CCP daily. The value of
Emerging Markets Local Income Portfolio
October 31, 2022
Notes to Financial Statements — continued
the swap is determined by changes in the relationship between two rates of interest. The Portfolio is exposed to credit loss in the event of non-performance by the swap counterparty. In the case of centrally cleared swaps, counterparty risk is minimal due to protections provided by the CCP. Risk may also arise from movements in interest rates.
K Cross-Currency Swaps—Cross-currency swaps are interest rate swaps in which interest cash flows are exchanged between two parties based on the notional amounts of two different currencies. The notional amounts are typically determined based on the spot exchange rates at the inception of the trade. Cross-currency swaps also involve the exchange of the notional amounts at the start of the contract at the current spot rate with an agreement to re-exchange such amounts at a later date at either the same exchange rate, a specified rate or the then current spot rate. The entire principal value of a cross-currency swap is subject to the risk that the counterparty to the swap will default on its contractual delivery obligations.
L Credit Default Swaps—When the Portfolio is the buyer of a credit default swap contract, the Portfolio is entitled to receive the par (or other agreed-upon) value of a referenced debt obligation (or basket of debt obligations) from the counterparty (or CCP in the case of a centrally cleared swap) to the contract if a credit event by a third party, such as a U.S. or foreign corporate issuer or sovereign issuer, on the debt obligation occurs. In return, the Portfolio pays the counterparty a periodic stream of payments over the term of the contract provided that no credit event has occurred. If no credit event occurs, the Portfolio would have spent the stream of payments and received no proceeds from the contract. When the Portfolio is the seller of a credit default swap contract, it receives the stream of payments, but is obligated to pay to the buyer of the protection an amount up to the notional amount of the swap and in certain instances take delivery of securities of the reference entity upon the occurrence of a credit event, as defined under the terms of that particular swap agreement. Credit events are contract specific but may include bankruptcy, failure to pay, restructuring, obligation acceleration and repudiation/moratorium. If the Portfolio is a seller of protection and a credit event occurs, the maximum potential amount of future payments that the Portfolio could be required to make would be an amount equal to the notional amount of the agreement. This potential amount would be partially offset by any recovery value of the respective referenced obligation, or net amount received from the settlement of a buy protection credit default swap agreement entered into by the Portfolio for the same referenced obligation. As the seller, the Portfolio may create economic leverage to its portfolio because, in addition to its total net assets, the Portfolio is subject to investment exposure on the notional amount of the swap. The interest fee paid or received on the swap contract, which is based on a specified interest rate on a fixed notional amount, is accrued daily as a component of unrealized appreciation (depreciation) and is recorded as realized gain upon receipt or realized loss upon payment. The Portfolio also records an increase or decrease to unrealized appreciation (depreciation) in an amount equal to the daily valuation. For centrally cleared swaps, the daily change in valuation is recorded as a receivable or payable for variation margin and settled in cash with the CCP daily. All upfront payments and receipts, if any, are amortized over the life of the swap contract as realized gains or losses. Those upfront payments or receipts for non-centrally cleared swaps are recorded as other assets or other liabilities, respectively, net of amortization. For financial reporting purposes, unamortized upfront payments or receipts, if any, are netted with unrealized appreciation or depreciation on swap contracts to determine the market value of swaps as presented in Notes 5 and 8. These transactions involve certain risks, including the risk that the seller may be unable to fulfill the transaction. In the case of centrally cleared swaps, counterparty risk is minimal due to protections provided by the CCP.
M Swaptions—A purchased swaption contract grants the Portfolio, in return for payment of the purchase price, the right, but not the obligation, to enter into a new swap agreement or to shorten, extend, cancel or otherwise modify an existing swap agreement, at some designated future time on specified terms. When the Portfolio purchases a swaption, the premium paid to the writer is recorded as an investment and subsequently marked-to-market to reflect the current value of the swaption. A written swaption gives the Portfolio the obligation, if exercised by the purchaser, to enter into a swap contract according to the terms of the underlying agreement. When the Portfolio writes a swaption, the premium received by the Portfolio is recorded as a liability and subsequently marked-to-market to reflect the current value of the swaption. When a swaption is exercised, the cost of the swap is adjusted by the amount of the premium paid or received. When a swaption expires or an unexercised swaption is closed, a gain or loss is recognized in the amount of the premium paid or received, plus the cost to close. The Portfolio’s risk for purchased swaptions is limited to the premium paid. The writer of a swaption bears the risk of unfavorable changes in the preset terms of the underlying swap contract. Purchased swaptions traded over-the-counter involve risk that the issuer or counterparty will fail to perform its contractual obligations.
2 Investment Adviser Fee and Other Transactions with Affiliates
The investment adviser fee is earned by Boston Management and Research (BMR), an indirect, wholly-owned subsidiary of Morgan Stanley, as compensation for investment advisory services rendered to the Portfolio. The investment adviser fee is computed at an annual rate as a percentage of the Portfolio’s average daily net assets as follows and is payable monthly:
| Average Daily Net Assets | Annual Fee Rate |
| Up to $1 billion | 0.650% |
| $1 billion but less than $2 billion | 0.625% |
| $2 billion but less than $5 billion | 0.600% |
| $5 billion and over | 0.575% |
Emerging Markets Local Income Portfolio
October 31, 2022
Notes to Financial Statements — continued
For the year ended October 31, 2022, the Portfolio’s investment adviser fee amounted to $7,941,172 or 0.65% of the Portfolio’s average daily net assets.
Effective April 26, 2022, the Portfolio may invest in a money market fund, the Institutional Class of the Morgan Stanley Institutional Liquidity Funds - Government Portfolio (the “Liquidity Fund”), an open-end management investment company managed by Morgan Stanley Investment Management Inc., a wholly-owned subsidiary of Morgan Stanley. The investment adviser fee paid by the Portfolio is reduced by an amount equal to its pro-rata share of the advisory and administration fees paid by the Portfolio due to its investment in the Liquidity Fund. For the year ended October 31, 2022, the investment adviser fee paid was reduced by $62,028 relating to the Portfolio's investment in the Liquidity Fund. Prior to April 26, 2022, the Portfolio may have invested its cash in Eaton Vance Cash Reserves Fund, LLC (Cash Reserves Fund), an affiliated investment company managed by Eaton Vance Management (EVM). EVM did not receive a fee for advisory services provided to Cash Reserves Fund.
During the year ended October 31, 2022, EVM reimbursed the Portfolio $7,481 for a net realized loss due to a trading error. The amount of the reimbursement had an impact on total return of less than 0.01%.
Trustees and officers of the Portfolio who are members of EVM’s or BMR's organizations receive remuneration for their services to the Portfolio out of the investment adviser fee. Trustees of the Portfolio who are not affiliated with the investment adviser may elect to defer receipt of all or a percentage of their annual fees in accordance with the terms of the Trustees Deferred Compensation Plan. For the year ended October 31, 2022, no significant amounts have been deferred. Certain officers and Trustees of the Portfolio are officers of the above organizations.
3 Purchases and Sales of Investments
Purchases and sales of investments, other than short-term obligations and including maturities and paydowns, aggregated $301,817,772 and $654,208,899, respectively, for the year ended October 31, 2022.
4 Federal Income Tax Basis of Investments
The cost and unrealized appreciation (depreciation) of investments, including open derivative contracts, of the Portfolio at October 31, 2022, as determined on a federal income tax basis, were as follows:
| Aggregate cost | $ 896,765,769 |
| Gross unrealized appreciation | $ 13,365,158 |
| Gross unrealized depreciation | (141,436,386) |
| Net unrealized depreciation | $ (128,071,228) |
5 Financial Instruments
The Portfolio may trade in financial instruments with off-balance sheet risk in the normal course of its investing activities. These financial instruments may include forward foreign currency exchange contracts, non-deliverable bond forward contracts, futures contracts and swap contracts and may involve, to a varying degree, elements of risk in excess of the amounts recognized for financial statement purposes. The notional or contractual amounts of these instruments represent the investment the Portfolio has in particular classes of financial instruments and do not necessarily represent the amounts potentially subject to risk. The measurement of the risks associated with these instruments is meaningful only when all related and offsetting transactions are considered. A summary of obligations under these financial instruments at October 31, 2022 is included in the Portfolio of Investments. At October 31, 2022, the Portfolio had sufficient cash and/or securities to cover commitments under these contracts.
In the normal course of pursuing its investment objective, the Potfolio is subject to the following risks:
Credit Risk: The Portfolio enters into credit default swap contracts to enhance total return and/or as a substitute for the purchase or sale of securities.
Foreign Exchange Risk: The Portfolio engages in forward foreign currency exchange contracts and cross-currency swaps to enhance total return, to seek to hedge against fluctuations in currency exchange rates and/or as a substitute for the purchase or sale of securities or currencies.
Interest Rate Risk: The Portfolio utilizes various interest rate derivatives including non-deliverable bond forward contracts, interest rate futures contracts, interest rate swaps and swaptions and cross-currency swaps to enhance total return, to seek to hedge against fluctuations in interest rates and/or to change the effective duration of its portfolio.
Emerging Markets Local Income Portfolio
October 31, 2022
Notes to Financial Statements — continued
The Portfolio enters into over-the-counter (OTC) derivatives that may contain provisions whereby the counterparty may terminate the contract under certain conditions, including but not limited to a decline in the Portfolio’s net assets below a certain level over a certain period of time, which would trigger a payment by the Portfolio for those derivatives in a liability position. At October 31, 2022, the fair value of derivatives with credit-related contingent features in a net liability position was $24,089,075. The aggregate fair value of assets pledged as collateral by the Portfolio for such liability was $8,829,579 at October 31, 2022.
The OTC derivatives in which the Portfolio invests are subject to the risk that the counterparty to the contract fails to perform its obligations under the contract. To mitigate this risk, the Portfolio has entered into an International Swaps and Derivatives Association, Inc. Master Agreement (“ISDA Master Agreement”) or similar agreement with substantially all its derivative counterparties. An ISDA Master Agreement is a bilateral agreement between the Portfolio and a counterparty that governs certain OTC derivatives and typically contains, among other things, set-off provisions in the event of a default and/or termination event as defined under the relevant ISDA Master Agreement. Under an ISDA Master Agreement, the Portfolio may, under certain circumstances, offset with the counterparty certain derivative financial instruments’ payables and/or receivables with collateral held and/or posted and create one single net payment. The provisions of the ISDA Master Agreement typically permit a single net payment in the event of default including the bankruptcy or insolvency of the counterparty. However, bankruptcy or insolvency laws of a particular jurisdiction may impose restrictions on or prohibitions against the right of offset in bankruptcy or insolvency. Certain ISDA Master Agreements allow counterparties to OTC derivatives to terminate derivative contracts prior to maturity in the event the Portfolio’s net assets decline by a stated percentage or the Portfolio fails to meet the terms of its ISDA Master Agreements, which would cause the counterparty to accelerate payment by the Portfolio of any net liability owed to it.
The collateral requirements for derivatives traded under an ISDA Master Agreement are governed by a Credit Support Annex to the ISDA Master Agreement. Collateral requirements are determined at the close of business each day and are typically based on changes in market values for each transaction under an ISDA Master Agreement and netted into one amount for such agreement. Generally, the amount of collateral due from or to a counterparty is subject to a minimum transfer threshold amount before a transfer is required, which may vary by counterparty. Collateral pledged for the benefit of the Portfolio and/or counterparty is held in segregated accounts by the Portfolio’s custodian and cannot be sold, re-pledged, assigned or otherwise used while pledged. The portion of such collateral representing cash, if any, is reflected as deposits for derivatives collateral and, in the case of cash pledged by a counterparty for the benefit of the Portfolio, a corresponding liability on the Statement of Assets and Liabilities. Securities pledged by the Portfolio as collateral, if any, are identified as such in the Portfolio of Investments. The carrying amount of the liability for cash collateral due to brokers at October 31, 2022 approximated its fair value. If measured at fair value, such liability would have been considered as Level 2 in the fair value hierarchy (see Note 8) at October 31, 2022.
Emerging Markets Local Income Portfolio
October 31, 2022
Notes to Financial Statements — continued
The fair value of open derivative instruments (not considered to be hedging instruments for accounting disclosure purposes) by risk exposure at October 31, 2022 was as follows:
| | Fair Value |
| Statement of Assets and Liabilities Caption | Credit | Foreign
Exchange | Interest
Rate | Total |
| Not applicable | $ 759* | $ 14,302,886* | $ 42,102,733* | $ 56,406,378 |
| Receivable for open forward foreign currency exchange contracts | — | 31,517,957 | — | 31,517,957 |
| Receivable for open swap contracts | — | — | 4,109,041 | 4,109,041 |
| Receivable for open non-deliverable bond forward contracts | — | — | 853,256 | 853,256 |
| Total Asset Derivatives | $ 759 | $ 45,820,843 | $ 47,065,030 | $ 92,886,632 |
| Derivatives not subject to master netting or similar agreements | $ 759 | $ 14,302,886 | $ 42,102,733 | $ 56,406,378 |
| Total Asset Derivatives subject to master netting or similar agreements | $ — | $ 31,517,957 | $ 4,962,297 | $ 36,480,254 |
| Not applicable | $ — | $ (13,086,568)* | $ (72,597,995)* | $ (85,684,563) |
| Payable for open forward foreign currency exchange contracts | — | (20,873,680) | — | (20,873,680) |
| Payable for open swap contracts; Upfront receipts on non-centrally cleared swap contracts | — | — | (1,241,236) | (1,241,236) |
| Payable for open non-deliverable bond forward contracts | — | — | (1,974,159) | (1,974,159) |
| Total Liability Derivatives | $ — | $(33,960,248) | $(75,813,390) | $(109,773,638) |
| Derivatives not subject to master netting or similar agreements | $ — | $(13,086,568) | $(72,597,995) | $ (85,684,563) |
| Total Liability Derivatives subject to master netting or similar agreements | $ — | $(20,873,680) | $ (3,215,395) | $ (24,089,075) |
| * | Only the current day’s variation margin on open futures contracts and centrally cleared derivatives is reported within the Statement of Assets and Liabilities as Receivable or Payable for variation margin on open futures contracts and centrally cleared derivatives, as applicable. |
The Portfolio's derivative assets and liabilities at fair value by risk, which are reported gross in the Statement of Assets and Liabilities, are presented in the table above. The following tables present the Portfolio's derivative assets and liabilities by counterparty, net of amounts available for offset under a master netting agreement and net of the related collateral received by the Portfolio for such assets and pledged by the Portfolio for such liabilities as of October 31, 2022.
| Counterparty | Derivative
Assets Subject to
Master Netting
Agreement | Derivatives
Available
for Offset | Non-cash
Collateral
Received(a) | Cash
Collateral
Received(a) | Net Amount
of Derivative
Assets(b) |
| Bank of America, N.A. | $ 5,613,717 | $ (1,789,074) | $ (3,638,683) | $ — | $ 185,960 |
| BNP Paribas | 4,833,731 | (4,833,731) | — | — | — |
| Citibank, N.A. | 2,723,570 | (42,616) | — | — | 2,680,954 |
| Credit Suisse International | 217,304 | — | — | — | 217,304 |
| Deutsche Bank AG | 401,986 | — | (353,142) | — | 48,844 |
| Goldman Sachs International | 2,160,862 | (2,160,862) | — | — | — |
| ICBC Standard Bank plc | 143,365 | (105,991) | — | — | 37,374 |
| JPMorgan Chase Bank, N.A. | 1,242,163 | (924,946) | (268,203) | — | 49,014 |
| Nomura International PLC | 991,470 | — | (519,490) | (450,000) | 21,980 |
| Standard Chartered Bank | 11,209,883 | (5,991,722) | — | — | 5,218,161 |
| State Street Bank and Trust Company | 5,420,322 | (4,044,158) | (718,382) | — | 657,782 |
Emerging Markets Local Income Portfolio
October 31, 2022
Notes to Financial Statements — continued
| Counterparty | Derivative
Assets Subject to
Master Netting
Agreement | Derivatives
Available
for Offset | Non-cash
Collateral
Received(a) | Cash
Collateral
Received(a) | Net Amount
of Derivative
Assets(b) |
| UBS AG | $ 1,521,881 | $ (146,768) | $ (1,065,353) | $ — | $ 309,760 |
| | $36,480,254 | $(20,039,868) | $(6,563,253) | $(450,000) | $9,427,133 |
| Counterparty | Derivative
Liabilities Subject to
Master Netting
Agreement | Derivatives
Available
for Offset | Non-cash
Collateral
Pledged(a) | Cash
Collateral
Pledged(a) | Net Amount
of Derivative
Liabilities(c) |
| Bank of America, N.A. | $ (1,789,074) | $ 1,789,074 | $ — | $ — | $ — |
| Barclays Bank PLC | (48,833) | — | — | — | (48,833) |
| BNP Paribas | (7,203,199) | 4,833,731 | 2,183,712 | — | (185,756) |
| Citibank, N.A. | (42,616) | 42,616 | — | — | — |
| Goldman Sachs International | (3,651,761) | 2,160,862 | 1,490,899 | — | — |
| HSBC Bank USA, N.A. | (13,109) | — | — | — | (13,109) |
| ICBC Standard Bank plc | (105,991) | 105,991 | — | — | — |
| JPMorgan Chase Bank, N.A. | (924,946) | 924,946 | — | — | — |
| Societe Generale | (126,898) | — | — | — | (126,898) |
| Standard Chartered Bank | (5,991,722) | 5,991,722 | — | — | — |
| State Street Bank and Trust Company | (4,044,158) | 4,044,158 | — | — | — |
| UBS AG | (146,768) | 146,768 | — | — | — |
| | $(24,089,075) | $20,039,868 | $3,674,611 | $ — | $(374,596) |
| (a) | In some instances, the total collateral received and/or pledged may be more than the amount shown due to overcollateralization. |
| (b) | Net amount represents the net amount due from the counterparty in the event of default. |
| (c) | Net amount represents the net amount payable to the counterparty in the event of default. |
Emerging Markets Local Income Portfolio
October 31, 2022
Notes to Financial Statements — continued
The effect of derivative instruments (not considered to be hedging instruments for accounting disclosure purposes) on the Statement of Operations by risk exposure for the year ended October 31, 2022 was as follows:
| Statement of Operations Caption | Credit | Foreign
Exchange | Interest
Rate | Total |
| Net realized gain (loss): | | | | |
| Investment transactions | $ — | $ — | $ (923,502) | $ (923,502) |
| Futures contracts | — | — | 5,282,556 | 5,282,556 |
| Swap contracts | 69,265 | — | (55,528,274) | (55,459,009) |
| Forward foreign currency exchange contracts | — | (21,520,267) | — | (21,520,267) |
| Non-deliverable bond forward contracts | — | — | (21,079,989) | (21,079,989) |
| Total | $69,265 | $(21,520,267) | $(72,249,209) | $(93,700,211) |
| Change in unrealized appreciation (depreciation): | | | | |
| Investments | $ — | $ — | $ 912,553 | $ 912,553 |
| Futures contracts | — | — | (320,378) | (320,378) |
| Swap contracts | 19,069 | — | 4,969,173 | 4,988,242 |
| Forward foreign currency exchange contracts | — | 8,920,609 | — | 8,920,609 |
| Non-deliverable bond forward contracts | — | — | 506,289 | 506,289 |
| Total | $19,069 | $ 8,920,609 | $ 6,067,637 | $ 15,007,315 |
The average notional cost of futures contracts and average notional amounts of other derivative contracts outstanding during the year ended October 31, 2022, which are indicative of the volume of these derivative types, were approximately as follows:
Futures
Contracts — Short | Forward
Foreign Currency
Exchange Contracts* | Non-Deliverable
Bond Forward
Contracts | Purchased
Swaptions | Swap
Contracts |
| $35,150,000 | $3,077,607,000 | $137,538,000 | $9,192,000 | $1,688,215,000 |
| * | The average notional amount for forward foreign currency exchange contracts is based on the absolute value of notional amounts of currency purchased and currency sold. |
6 Line of Credit
The Portfolio participates with other portfolios and funds managed by EVM and its affiliates in a $725 million unsecured line of credit agreement with a group of banks, which is in effect through October 24, 2023. In connection with the renewal of the agreement on October 25, 2022, the borrowing limit was decreased from $800 million. Borrowings are made by the Portfolio solely for temporary purposes related to redemptions and other short-term cash needs. Interest is charged to the Portfolio based on its borrowings at an amount above either the Secured Overnight Financing Rate (SOFR) or Federal Funds rate. In addition, a fee computed at an annual rate of 0.15% on the daily unused portion of the line of credit is allocated among the participating portfolios and funds at the end of each quarter. Also in connection with the renewal of the agreement, an arrangement fee totaling $150,000 was incurred that was allocated to the participating portfolios and funds. Because the line of credit is not available exclusively to the Portfolio, it may be unable to borrow some or all of its requested amounts at any particular time. The Portfolio did not have any significant borrowings or allocated fees during the year ended October 31, 2022.
Emerging Markets Local Income Portfolio
October 31, 2022
Notes to Financial Statements — continued
7 Investments in Affiliated Funds
At October 31, 2022, the value of the Portfolio's investment in funds that may be deemed to be affiliated was $34,198,985, which represents 3.6% of the Portfolio's net assets. Transactions in affiliated funds by the Portfolio for the year ended October 31, 2022 were as follows:
| Name | Value,
beginning
of period | Purchases | Sales
proceeds | Net
realized
gain (loss) | Change in
unrealized
appreciation
(depreciation) | Value, end
of period | Dividend
income | Units/Shares,
end of period |
| Short-Term Investments |
| Cash Reserves Fund | $7,541,545 | $533,888,639 | $(541,434,768) | $ 4,584 | $ — | $ — | $ 47,112 | — |
| Liquidity Fund | — | 530,770,839 | (496,571,854) | — | — | 34,198,985 | 704,785 | 34,198,985 |
| Total | | | | $4,584 | $ — | $34,198,985 | $751,897 | |
8 Fair Value Measurements
Under generally accepted accounting principles for fair value measurements, a three-tier hierarchy to prioritize the assumptions, referred to as inputs, is used in valuation techniques to measure fair value. The three-tier hierarchy of inputs is summarized in the three broad levels listed below.
| • | Level 1 – quoted prices in active markets for identical investments |
| • | Level 2 – other significant observable inputs (including quoted prices for similar investments, interest rates, prepayment speeds, credit risk, etc.) |
| • | Level 3 – significant unobservable inputs (including a fund's own assumptions in determining the fair value of investments) |
In cases where the inputs used to measure fair value fall in different levels of the fair value hierarchy, the level disclosed is determined based on the lowest level input that is significant to the fair value measurement in its entirety. The inputs or methodology used for valuing securities are not necessarily an indication of the risk associated with investing in those securities.
At October 31, 2022, the hierarchy of inputs used in valuing the Portfolio's investments and open derivative instruments, which are carried at value, were as follows:
| Asset Description | Level 1 | Level 2 | Level 3 | Total |
| Foreign Corporate Bonds | $ — | $ 26,215,235 | $ — | $ 26,215,235 |
| Loan Participation Notes | — | — | 29,380,678 | 29,380,678 |
| Sovereign Government Bonds | — | 549,009,825 | 39,170,230 | 588,180,055 |
| Short-Term Investments: | | | | |
| Affiliated Fund | 34,198,985 | — | — | 34,198,985 |
| Sovereign Government Securities | — | 79,349,464 | 2,887,584 | 82,237,048 |
| U.S. Treasury Obligations | — | 37,616,465 | — | 37,616,465 |
| Total Investments | $34,198,985 | $ 692,190,989 | $71,438,492 | $ 797,828,466 |
| Forward Foreign Currency Exchange Contracts | $ — | $ 45,820,843 | $ — | $ 45,820,843 |
| Non-Deliverable Bond Forward Contracts | — | 853,256 | — | 853,256 |
| Futures Contracts | 222,168 | — | — | 222,168 |
| Swap Contracts | — | 45,990,365 | — | 45,990,365 |
| Total | $34,421,153 | $ 784,855,453 | $71,438,492 | $ 890,715,098 |
| Liability Description | | | | |
| Forward Foreign Currency Exchange Contracts | $ — | $ (33,960,248) | $ — | $ (33,960,248) |
| Non-Deliverable Bond Forward Contracts | — | (1,974,159) | — | (1,974,159) |
Emerging Markets Local Income Portfolio
October 31, 2022
Notes to Financial Statements — continued
| Liability Description (continued) | Level 1 | Level 2 | Level 3 | Total |
| Swap Contracts | $ — | $ (73,839,231) | $ — | $ (73,839,231) |
| Total | $ — | $ (109,773,638) | $ — | $ (109,773,638) |
The following is a reconciliation of Level 3 investments for which significant unobservable inputs were used to determine fair value:
| | Loan
Participation Notes | Sovereign
Government
Bonds | Sovereign
Government
Securities | Total |
| Balance as of October 31, 2021 | $39,020,280 | $ — | $ — | $ 39,020,280 |
| Realized gains (losses) | (756,428) | (653,303) | — | (1,409,731) |
| Change in net unrealized appreciation (depreciation) | (1,439,386) | (102,233,847) | (925,450) | (104,598,683) |
| Cost of purchases | — | 12,624,653 | 3,708,424 | 16,333,077 |
| Proceeds from sales, including return of capital | (7,443,788) | (2,785,765) | — | (10,229,553) |
| Accrued discount (premium) | — | 1,046,208 | 104,610 | 1,150,818 |
| Transfers to Level 3 | — | 131,172,284 | — | 131,172,284 |
| Transfers from Level 3 | — | — | — | — |
| Balance as of October 31, 2022 | $29,380,678 | $ 39,170,230 | $2,887,584 | $ 71,438,492 |
| Change in net unrealized appreciation (depreciation) on investments still held as of October 31, 2022 | $ (1,888,764) | $(102,159,577) | $ (925,450) | $(104,973,791) |
The following is a summary of quantitative information about significant unobservable valuation inputs for Level 3 investments held as of October 31, 2022:
| Type of Investment | Fair Value as of
October 31, 2022 | Valuation Technique | Unobservable Input | Input | Impact to
Valuation from an
Increase to Input* |
| Loan Participation Notes | $29,380,678 | Matrix Pricing | Adjusted Credit Spread to the Central Bank of Uzbekistan Quoted Policy Rate | 3.59% | Decrease |
| Sovereign Government Bonds | 39,170,230 | Third Party Indication of Value | Foreign Currency Exchange Rate | 40.20 UAH/USD | Decrease |
| Sovereign Government Securities | 2,887,584 | Third Party Indication of Value | Foreign Currency Exchange Rate | 40.20 UAH/USD | Decrease |
| * | Represents the directional change in the fair value of the Level 3 investments that would result from an increase to the corresponding unobservable input. A decrease to the unobservable input would have the opposite effect. |
9 Risks and Uncertainties
Risks Associated with Foreign Investments
Foreign investments can be adversely affected by political, economic and market developments abroad, including the imposition of economic and other sanctions by the United States or another country. There may be less publicly available information about foreign issuers because they may not be subject to reporting practices, requirements or regulations comparable to those to which United States companies are subject. Foreign markets may be smaller, less liquid and more volatile than the major markets in the United States. Trading in foreign markets typically involves higher expense than trading in the United States. The Portfolio may have difficulties enforcing its legal or contractual rights in a foreign country. Securities that trade or are denominated in currencies other than the U.S. dollar may be adversely affected by fluctuations in currency exchange rates.
Emerging Markets Local Income Portfolio
October 31, 2022
Notes to Financial Statements — continued
Emerging market securities often involve greater risks than developed market securities. Investment markets within emerging market countries are typically smaller, less liquid, less developed and more volatile than those in more developed markets like the United States, and may be focused in certain economic sectors. The information available about an emerging market issuer may be less reliable than for comparable issuers in more developed capital markets. Governmental actions can have a significant effect on the economic conditions in emerging market countries. It may be more difficult to make a claim or obtain a judgment in the courts of these countries than it is in the United States. The possibility of fraud, negligence, undue influence being exerted by an issuer or refusal to recognize ownership exists in some emerging markets. Disruptions due to work stoppages and trading improprieties in foreign securities markets have caused such markets to close. Emerging market securities are also subject to speculative trading, which contributes to their volatility.
Economic data as reported by sovereign entities may be delayed, inaccurate or fraudulent. In the event of a default by a sovereign entity, there are typically no assets to be seized or cash flows to be attached. Furthermore, the willingness or ability of a sovereign entity to restructure defaulted debt may be limited. Therefore, losses on sovereign defaults may far exceed the losses from the default of a similarly rated U.S. debt issuer.
On February 24, 2022, Russia launched an invasion of Ukraine, following rising tensions over the buildup of Russian troops along the Ukrainian border and joint military exercises by Russia with Belarus. In response to the invasion, many countries, including the U.S., have imposed economic sanctions on Russian governmental institutions, Russian entities, and Russian individuals. The conflict and sanctions have had a negative impact on the Russian economy, on the Russian currency, and on investments having exposure to Russia, Belarus and Ukraine. The conflict could also have a significant effect on investments outside the region. The duration and extent of the military conflict with Russia and the related sanctions cannot be predicted at this time.
LIBOR Transition Risk
Certain instruments held by the Portfolio may pay an interest rate based on the London Interbank Offered Rate (“LIBOR”), which is the average offered rate for various maturities of short-term loans between certain major international banks. LIBOR is used throughout global banking and financial industries to determine interest rates for a variety of financial instruments (such as debt instruments and derivatives) and borrowing arrangements. The ICE Benchmark Administration Limited, the administrator of LIBOR, ceased publishing certain LIBOR settings on December 31, 2021, and is expected to cease publishing the remaining LIBOR settings on June 30, 2023. Although the transition process away from LIBOR has become increasingly well-defined, the impact on certain debt securities, derivatives and other financial instruments that utilize LIBOR remains uncertain. The phase-out of LIBOR may result in, among other things, increased volatility or illiquidity in markets for instruments based on LIBOR and changes in the value of such instruments.
Pandemic Risk
An outbreak of respiratory disease caused by a novel coronavirus was first detected in China in late 2019 and subsequently spread internationally. This coronavirus has resulted in closing borders, enhanced health screenings, changes to healthcare service preparation and delivery, quarantines, cancellations, disruptions to supply chains and customer activity, as well as general concern and uncertainty. Health crises caused by outbreaks of disease, such as the coronavirus outbreak, may exacerbate other pre-existing political, social and economic risks and disrupt normal market conditions and operations. The impact of this outbreak has negatively affected the worldwide economy, as well as the economies of individual countries and industries, and could continue to affect the market in significant and unforeseen ways. Other epidemics and pandemics that may arise in the future may have similar effects. Any such impact could adversely affect the Portfolio's performance, or the performance of the securities in which the Portfolio invests.
Emerging Markets Local Income Portfolio
October 31, 2022
Report of Independent Registered Public Accounting Firm
To the Trustees and Investors of Emerging Markets Local Income Portfolio:
Opinion on the Financial Statements and Financial Highlights
We have audited the accompanying statement of assets and liabilities of Emerging Markets Local Income Portfolio (the “Portfolio"), including the portfolio of investments, as of October 31, 2022, the related statement of operations for the year then ended, the statements of changes in net assets for each of the two years in the period then ended, the financial highlights for each of the five years in the period then ended, and the related notes. In our opinion, the financial statements and financial highlights present fairly, in all material respects, the financial position of the Portfolio as of October 31, 2022, and the results of its operations for the year then ended, the changes in its net assets for each of the two years in the period then ended, and the financial highlights for each of the five years in the period then ended, in conformity with accounting principles generally accepted in the United States of America.
Basis for Opinion
These financial statements and financial highlights are the responsibility of the Portfolio’s management. Our responsibility is to express an opinion on the Portfolio’s financial statements and financial highlights based on our audits. We are a public accounting firm registered with the Public Company Accounting Oversight Board (United States) (PCAOB) and are required to be independent with respect to the Portfolio in accordance with the U.S. federal securities laws and the applicable rules and regulations of the Securities and Exchange Commission and the PCAOB.
We conducted our audits in accordance with the standards of the PCAOB. Those standards require that we plan and perform the audit to obtain reasonable assurance about whether the financial statements and financial highlights are free of material misstatement, whether due to error or fraud. The Portfolio is not required to have, nor were we engaged to perform, an audit of its internal control over financial reporting. As part of our audits, we are required to obtain an understanding of internal control over financial reporting but not for the purpose of expressing an opinion on the effectiveness of the Portfolio’s internal control over financial reporting. Accordingly, we express no such opinion.
Our audits included performing procedures to assess the risks of material misstatement of the financial statements and financial highlights, whether due to error or fraud, and performing procedures that respond to those risks. Such procedures included examining, on a test basis, evidence regarding the amounts and disclosures in the financial statements and financial highlights. Our audits also included evaluating the accounting principles used and significant estimates made by management, as well as evaluating the overall presentation of the financial statements and financial highlights. Our procedures included confirmation of securities owned as of October 31, 2022, by correspondence with the custodian, brokers and selling or agent banks; when replies were not received from brokers and selling or agent banks, we performed other auditing procedures. We believe that our audits provide a reasonable basis for our opinion.
/s/ Deloitte & Touche LLP
Boston, Massachusetts
December 29, 2022
We have served as the auditor of one or more Eaton Vance investment companies since 1959.
Eaton Vance
Emerging Markets Local Income Fund
October 31, 2022
Board of Trustees' Contract Approval
Overview of the Contract Review Process
The Investment Company Act of 1940, as amended (the “1940 Act”), provides, in substance, that the investment advisory agreement between a fund and its investment adviser will continue in effect from year-to-year only if its continuation is approved on an annual basis by a vote of the fund’s board of trustees, including a majority of the trustees who are not “interested persons” of the fund (“independent trustees”), cast in person at a meeting called for the purpose of considering such approval.
At a meeting held on June 8, 2022, the Boards of Trustees/Directors (collectively, the “Board”) that oversee the registered investment companies advised by Eaton Vance Management or its affiliate, Boston Management and Research (the “Eaton Vance Funds”), including a majority of the independent trustees (the “Independent Trustees”), voted to approve the continuation of existing investment advisory agreements and sub-advisory agreements1 for each of the Eaton Vance Funds for an additional one-year period. The Board relied upon the affirmative recommendation of its Contract Review Committee, which is a committee exclusively comprised of Independent Trustees. Prior to making its recommendation, the Contract Review Committee reviewed information furnished by the adviser and sub-adviser to each of the Eaton Vance Funds (including information specifically requested by the Board) for a series of formal meetings held between April and June 2022. Members of the Contract Review Committee also considered information received at prior meetings of the Board and its committees, to the extent such information was relevant to the Contract Review Committee’s annual evaluation of the investment advisory agreements and sub-advisory agreements.
In connection with its evaluation of the investment advisory agreements and sub-advisory agreements, the Board considered various information relating to the Eaton Vance Funds. This included information applicable to all or groups of Eaton Vance Funds, which is referenced immediately below, and information applicable to the particular Eaton Vance Fund covered by this report (additional fund-specific information is referenced below under “Results of the Contract Review Process”). (For funds that invest through one or more underlying portfolios, references to “each fund” in this section may include information that was considered at the portfolio-level.)
Information about Fees, Performance and Expenses
• A report from an independent data provider comparing advisory and other fees paid by each fund to such fees paid by comparable funds, as identified by the independent data provider (“comparable funds”);
• A report from an independent data provider comparing each fund’s total expense ratio (and its components) to those of comparable funds;
• A report from an independent data provider comparing the investment performance of each fund (including, as relevant, total return data, income data, Sharpe ratios and information ratios) to the investment performance of comparable funds and, as applicable, benchmark indices, over various time periods;
• In certain instances, data regarding investment performance relative to customized groups of peer funds and blended indices identified by the adviser in consultation with the Portfolio Management Committee of the Board (a committee exclusively comprised of Independent Trustees);
• Comparative information concerning the fees charged and services provided by the adviser and sub-adviser to each fund in managing other accounts (which may include other mutual funds, collective investment funds and institutional accounts) using investment strategies and techniques similar to those used in managing such fund(s), if any;
• Profitability analyses with respect to the adviser and sub-adviser to each of the funds;
Information about Portfolio Management and Trading
• Descriptions of the investment management services provided to each fund, as well as each of the funds’ investment strategies and policies;
• The procedures and processes used to determine the value of fund assets, including, when necessary, the determination of “fair value” and actions taken to monitor and test the effectiveness of such procedures and processes;
• Information about the policies and practices of each fund’s adviser and sub-adviser with respect to trading, including their processes for seeking best execution of portfolio transactions;
• Information about the allocation of brokerage transactions and the benefits, if any, received by the adviser and sub-adviser to each fund as a result of brokerage allocation, including, as applicable, information concerning the acquisition of research through client commission arrangements and policies with respect to “soft dollars”;
• Data relating to the portfolio turnover rate of each fund and related information regarding active management in the context of particular strategies;
Information about each Adviser and Sub-adviser
• Reports detailing the financial results and condition of the adviser and sub-adviser to each fund;
• Information regarding the individual investment professionals whose responsibilities include portfolio management and investment research for the funds, and, for portfolio managers and certain other investment professionals, information relating to their responsibilities with respect to managing other mutual funds and investment accounts, as applicable;
1 Not all Eaton Vance Funds have entered into a sub-advisory agreement with a sub-adviser. Accordingly, references to “sub-adviser” or “sub-advisory agreement” in this “Overview” section may not be applicable to the particular Eaton Vance Fund covered by this report. Following the “Overview” section, further information regarding the Board’s evaluation of a fund’s contractual arrangements is included under the “Results of the Contract Review Process” section.
Eaton Vance
Emerging Markets Local Income Fund
October 31, 2022
Board of Trustees' Contract Approval — continued
• Information regarding the adviser’s and its parent company’s (Morgan Stanley’s) efforts to retain and attract talented investment professionals, including in the context of a particularly competitive marketplace for talent, as well as the ongoing unique environment presented by hybrid, remote and other alternative work arrangements;
• The Code of Ethics of the adviser and its affiliates and the sub-adviser of each fund, together with information relating to compliance with, and the administration of, such codes;
• Policies and procedures relating to proxy voting, including regular reporting with respect to fund proxy voting activities;
• Information regarding the handling of corporate actions and class actions, as well as information regarding litigation and other regulatory matters;
• Information concerning the resources devoted to compliance efforts undertaken by the adviser and its affiliates and the sub-adviser of each fund, if any, including descriptions of their various compliance programs and their record of compliance;
• Information concerning the business continuity and disaster recovery plans of the adviser and its affiliates and the sub-adviser of each fund, if any;
• A description of Eaton Vance Management’s and Boston Management and Research’s oversight of sub-advisers, including with respect to regulatory and compliance issues, investment management and other matters;
Other Relevant Information
• Information regarding ongoing initiatives to further integrate and harmonize, where applicable, the investment management and other departments of the adviser and its affiliates with the overall investment management infrastructure of Morgan Stanley, in light of Morgan Stanley’s acquisition of Eaton Vance on March 1, 2021;
• Information concerning the nature, cost and character of the administrative and other non-investment advisory services provided by Eaton Vance Management and its affiliates;
• Information concerning oversight of the relationship with the custodian, subcustodians, fund accountants, and other third-party service providers by the adviser and/or administrator to each of the funds;
• Information concerning efforts to implement policies and procedures with respect to various new regulations applicable to the funds, including Rule 12d1-4 (the Fund-of-Funds Rule), Rule 18f-4 (the Derivatives Rule) and Rule 2a-5 (the Fair Valuation Rule);
• For an Eaton Vance Fund structured as an exchange-listed closed-end fund, information concerning the benefits of the closed-end fund structure, as well as, where relevant, the closed-end fund’s market prices (including as compared to the closed-end fund’s net asset value (NAV)), trading volume data, continued use of auction preferred shares (where applicable), distribution rates and other relevant matters;
• The risks which the adviser and/or its affiliates incur in connection with the management and operation of the funds, including, among others, litigation, regulatory, entrepreneurial, and other business risks (and the associated costs of such risks); and
• The terms of each investment advisory agreement and sub-advisory agreement.
During the various meetings of the Board and its committees over the course of the year leading up to the June 8, 2022 meeting, the Trustees received information from portfolio managers and other investment professionals of the advisers and sub-advisers of the funds regarding investment and performance matters, and considered various investment and trading strategies used in pursuing the funds’ investment objectives. The Trustees also received information regarding risk management techniques employed in connection with the management of the funds. The Board and its committees evaluated issues pertaining to industry and regulatory developments, compliance procedures, fund governance and other issues with respect to the funds, and received and participated in reports and presentations provided by Eaton Vance Management, Boston Management and Research and fund sub-advisers, with respect to such matters. In addition to the formal meetings of the Board and its committees, the Independent Trustees held regular teleconferences to discuss, among other topics, matters relating to the continuation of investment advisory agreements and sub-advisory agreements.
The Contract Review Committee was advised throughout the contract review process by Goodwin Procter LLP, independent legal counsel for the Independent Trustees. The members of the Contract Review Committee, with the advice of such counsel, exercised their own business judgment in determining the material factors to be considered in evaluating each investment advisory agreement and sub-advisory agreement and the weight to be given to each such factor. The conclusions reached with respect to each investment advisory agreement and sub-advisory agreement were based on a comprehensive evaluation of all the information provided and not any single factor. Moreover, each member of the Contract Review Committee may have placed varying emphasis on particular factors in reaching conclusions with respect to each investment advisory agreement and sub-advisory agreement. In evaluating each investment advisory agreement and sub-advisory agreement, including the fee structures and other terms contained in such agreements, the members of the Contract Review Committee were also informed by multiple years of analysis and discussion with the adviser and sub-adviser to each of the Eaton Vance Funds.
Results of the Contract Review Process
Based on its consideration of the foregoing, and such other information it deemed relevant, including the factors and conclusions described below, the Contract Review Committee concluded that the continuation of the investment advisory agreement between Eaton Vance Emerging Markets Local Income Fund (the “Fund”) and Eaton Vance Management (“EVM”), as well as the investment advisory agreement between Emerging Markets Local Income Portfolio (the “Portfolio”), the portfolio in which the Fund invests, and Boston Management and Research (“BMR”) (EVM, with respect to the Fund, and BMR, with respect to the Portfolio, are each referred to herein as the “Adviser”), including their respective fee structures, are in the interests of shareholders and, therefore, recommended to the Board approval of each agreement. Based on the recommendation of the Contract Review Committee, the Board, including a majority of the Independent Trustees, voted to approve continuation of the investment advisory agreements for the Fund and the Portfolio.
Eaton Vance
Emerging Markets Local Income Fund
October 31, 2022
Board of Trustees' Contract Approval — continued
Nature, Extent and Quality of Services
In considering whether to approve the investment advisory agreements for the Fund and the Portfolio, the Board evaluated the nature, extent and quality of services provided to the Fund and the Portfolio by the applicable Adviser.
The Board considered each Adviser’s management capabilities and investment processes in light of the types of investments held by the Fund and the Portfolio, including the education, experience and number of investment professionals and other personnel who provide portfolio management, investment research, and similar services to the Fund and the Portfolio, including recent changes to such personnel. The Board considered each Adviser’s expertise with respect to emerging markets and in-house research capabilities. The Board also took into account the resources dedicated to portfolio management and other services, the compensation methods of each Adviser and other factors, including the reputation and resources of the Adviser to recruit and retain highly qualified research, advisory and supervisory investment professionals. In addition, the Board considered the time and attention devoted to the Eaton Vance Funds, including the Fund and the Portfolio, by senior management, as well as the infrastructure, operational capabilities and support staff in place to assist in the portfolio management and operations of the Fund and the Portfolio, including the provision of administrative services. The Board also considered the business-related and other risks to which each Adviser or its affiliates may be subject in managing the Fund and the Portfolio.
The Board noted that under the terms of the investment advisory agreement of the Fund, EVM may invest assets of the Fund directly in securities, for which it would receive a fee, or in the Portfolio, for which it receives no separate fee but for which BMR receives an advisory fee from the Portfolio. The Trustees considered the potential benefits to the Fund of the ability to make direct investments, such as an improved ability to: gain exposure to sectors of the market EVM believes may not be represented or underrepresented by the Portfolio; to hedge certain Portfolio exposures; and/or to otherwise manage the exposures of the Fund.
The Board considered the compliance programs of each Adviser and relevant affiliates thereof. The Board considered compliance and reporting matters regarding, among other things, personal trading by investment professionals, disclosure of portfolio holdings, late trading, frequent trading, portfolio valuation, business continuity and the allocation of investment opportunities. The Board also considered the responses of each Adviser and its affiliates to requests in recent years from regulatory authorities, such as the Securities and Exchange Commission and the Financial Industry Regulatory Authority.
The Board considered other administrative services provided or overseen by Eaton Vance Management and its affiliates, including transfer agency and accounting services. The Board evaluated the benefits to shareholders of investing in a fund that is a part of a large fund complex offering exposure to a variety of asset classes and investment disciplines, as well as the ability, in many cases, to exchange an investment among different funds without incurring additional sales charges.
After consideration of the foregoing factors, among others, the Board concluded that the nature, extent and quality of services provided by each Adviser, taken as a whole, are appropriate and consistent with the terms of the applicable investment advisory agreement.
Fund Performance
The Board compared the Fund’s investment performance to that of comparable funds identified by an independent data provider (the peer group), as well as an appropriate benchmark index. The Board’s review included comparative performance data with respect to the Fund for the one-, three-, five- and ten-year periods ended December 31, 2021. In this regard, the Board noted that the performance of the Fund was higher than the median performance of the Fund’s peer group for the three-year period. The Board also noted that the performance of the Fund was higher than its benchmark index for the three-year period. The Board concluded that the performance of the Fund was satisfactory.
Management Fees and Expenses
The Board considered contractual fee rates payable by the Portfolio and by the Fund for advisory and administrative services (referred to collectively as “management fees”). As part of its review, the Board considered the Fund’s management fees and total expense ratio for the one-year period ended December 31, 2021, as compared to those of comparable funds, before and after giving effect to any undertaking to waive fees or reimburse expenses. The Board also received and considered information about the services offered and the fee rates charged by the Adviser to other types of accounts with investment objectives and strategies that are substantially similar to and/or managed in a similar investment style as the Portfolio. In this regard, the Board received information about the differences in the nature and scope of services the Adviser provides to the Portfolio as compared to other types of accounts and the material differences in compliance, reporting and other legal burdens and risks to the Adviser as between the Portfolio and other types of accounts. The Board also considered certain factors identified by management in response to inquiries from the Contract Review Committee regarding the Fund’s total expense ratio relative to comparable funds.
After considering the foregoing information, and in light of the nature, extent and quality of the services provided by each Adviser, the Board concluded that the management fees charged for advisory and related services are reasonable.
Profitability and “Fall-Out” Benefits
The Board considered the level of profits realized by each Adviser and relevant affiliates thereof in providing investment advisory and administrative services to the Fund, to the Portfolio and to all Eaton Vance Funds as a group. The Board considered the level of profits realized without regard to marketing support or other payments by each Adviser and its affiliates to third parties in respect of distribution or other services.
Eaton Vance
Emerging Markets Local Income Fund
October 31, 2022
Board of Trustees' Contract Approval — continued
The Board concluded that, in light of the foregoing factors and the nature, extent and quality of the services rendered, the profits realized by each Adviser and its affiliates are deemed not to be excessive.
The Board also considered direct or indirect fall-out benefits received by each Adviser and its affiliates in connection with their respective relationships with the Fund and the Portfolio, including the benefits of research services that may be available to each Adviser as a result of securities transactions effected for the Fund and the Portfolio and other investment advisory clients.
Economies of Scale
In reviewing management fees and profitability, the Board also considered the extent to which the applicable Adviser and its affiliates, on the one hand, and the Fund and the Portfolio, on the other hand, can expect to realize benefits from economies of scale as the assets of the Fund and the Portfolio increase. The Board acknowledged the difficulty in accurately measuring the benefits resulting from economies of scale, if any, with respect to the management of any specific fund or group of funds. The Board reviewed data summarizing the increases and decreases in the assets of the Fund and of all Eaton Vance Funds as a group over various time periods, and evaluated the extent to which the total expense ratio of the Fund and the profitability of each Adviser and its affiliates may have been affected by such increases or decreases. Based upon the foregoing, the Board concluded that the Fund currently shares in the benefits from economies of scale, if any, when they are realized by the Adviser. The Board also concluded that the structure of the advisory fees, which include breakpoints at several asset levels, will allow the Fund and the Portfolio to continue to benefit from any economies of scale in the future.
Eaton Vance
Emerging Markets Local Income Fund
October 31, 2022
Liquidity Risk Management Program
The Fund has implemented a written liquidity risk management program (Program) and related procedures to manage its liquidity in accordance with Rule 22e-4 under the Investment Company Act of 1940, as amended (Liquidity Rule). The Liquidity Rule defines “liquidity risk” as the risk that a fund could not meet requests to redeem shares issued by the fund without significant dilution of the remaining investors’ interests in the fund. The Fund’s Board of Trustees/Directors has designated the investment adviser to serve as the administrator of the Program and the related procedures. The administrator has established a Liquidity Risk Management Oversight Committee (Committee) to perform the functions necessary to administer the Program. As part of the Program, the administrator is responsible for identifying illiquid investments and categorizing the relative liquidity of the Fund’s investments in accordance with the Liquidity Rule. Under the Program, the administrator assesses, manages, and periodically reviews the Fund’s liquidity risk, and is responsible for making certain reports to the Fund’s Board of Trustees/Directors and the Securities and Exchange Commission (SEC) regarding the liquidity of the Fund’s investments, and to notify the Board of Trustees/Directors and the SEC of certain liquidity events specified in the Liquidity Rule. The liquidity of the Fund’s portfolio investments is determined based on a number of factors including, but not limited to, relevant market, trading and investment-specific considerations under the Program.
At a meeting of the Fund’s Board of Trustees/Directors on June 7, 2022, the Committee provided a written report to the Fund’s Board of Trustees/Directors pertaining to the operation, adequacy, and effectiveness of implementation of the Program, as well as the operation of the highly liquid investment minimum (if applicable) for the period January 1, 2021 through December 31, 2021 (Review Period). The Program operated effectively during the Review Period, supporting the administrator’s ability to assess, manage and monitor Fund liquidity risk, including during periods of market volatility and net redemptions. During the Review Period, the Fund met redemption requests on a timely basis.
There can be no assurance that the Program will achieve its objectives in the future. Please refer to the Fund’s prospectus for more information regarding the Fund’s exposure to liquidity risk and other principal risks to which an investment in the Fund may be subject.
Eaton Vance
Emerging Markets Local Income Fund
October 31, 2022
Management and Organization
Fund Management. The Trustees of Eaton Vance Mutual Funds Trust (the Trust) and Emerging Markets Local Income Portfolio (the Portfolio) are responsible for the overall management and supervision of the Trust's and the Portfolio's affairs. The Board members and officers of the Trust and the Portfolio are listed below. Except as indicated, each individual has held the office shown or other offices in the same company for the last five years. Board members hold indefinite terms of office. Each Trustee holds office until his or her successor is elected and qualified, subject to a prior death, resignation, retirement, disqualification or removal. Under the terms of the Fund's and the Portfolio's current Trustee retirement policy, an Independent Trustee must retire and resign as a Trustee on the earlier of: (i) the first day of July following his or her 74th birthday; or (ii), with limited exception, December 31st of the 20th year in which he or she has served as a Trustee. However, if such retirement and resignation would cause the Fund and the Portfolio to be out of compliance with Section 16 of the 1940 Act or any other regulations or guidance of the SEC, then such retirement and resignation will not become effective until such time as action has been taken for the Fund and the Portfolio to be in compliance therewith. The “noninterested Trustees” consist of those Trustees who are not “interested persons” of the Trust and the Portfolio, as that term is defined under the 1940 Act. The business address of each Board member and officer is Two International Place, Boston, Massachusetts 02110. As used below, “BMR” refers to Boston Management and Research, “EVC” refers to Eaton Vance Corp., “EV” refers to EV LLC, “EVM” refers to Eaton Vance Management and “EVD” refers to Eaton Vance Distributors, Inc. EV is the trustee of each of EVM and BMR. Effective March 1, 2021, each of EVM, BMR, EVD and EV are indirect, wholly owned subsidiaries of Morgan Stanley. Each officer affiliated with EVM may hold a position with other EVM affiliates that is comparable to his or her position with EVM listed below. Each Trustee oversees 135 funds (with the exception of Mr. Bowser who oversees 110 funds) in the Eaton Vance fund complex (including both funds and portfolios in a hub and spoke structure).
| Name and Year of Birth | Trust/Portfolio
Position(s) | Length of Service | Principal Occupation(s) and Other Directorships
During Past Five Years and Other Relevant Experience |
| Interested Trustee |
Thomas E. Faust Jr.
1958 | Trustee | Since 2007 | Chairman of Morgan Stanley Investment Management, Inc. (MSIM), member of the Board of Managers and President of EV (since 2021), Chief Executive Officer of EVM and BMR. Formerly, Chairman, Chief Executive Officer (2007-2021) and President (2006-2021) of EVC and Director of EVD (2007-2022). Mr. Faust is an interested person because of his positions with MSIM, BMR, EVM and EV, which are affiliates of the Trust and the Portfolio.
Other Directorships. Formerly, Director of EVC (2007-2021) and Hexavest Inc. (investment management firm) (2012-2021). |
| Noninterested Trustees |
Alan C. Bowser(1)
1962 | Trustee | Since 2022 | Chief Diversity Officer, Partner and a member of the Operating Committee, and formerly served as Senior Advisor on Diversity and Inclusion for the firm’s chief executive officer, Co-Head of the Americas Region, and Senior Client Advisor of Bridgewater Associates, an asset management firm (2011- present).
Other Directorships. None. |
Mark R. Fetting
1954 | Trustee | Since 2016 | Private investor. Formerly held various positions at Legg Mason, Inc. (investment management firm) (2000-2012), including President, Chief Executive Officer, Director and Chairman (2008-2012), Senior Executive Vice President (2004-2008) and Executive Vice President (2001-2004). Formerly, President of Legg Mason family of funds (2001-2008). Formerly, Division President and Senior Officer of Prudential Financial Group, Inc. and related companies (investment management firm) (1991-2000).
Other Directorships. None. |
Cynthia E. Frost
1961 | Trustee | Since 2014 | Private investor. Formerly, Chief Investment Officer of Brown University (university endowment) (2000-2012). Formerly, Portfolio Strategist for Duke Management Company (university endowment manager) (1995-2000). Formerly, Managing Director, Cambridge Associates (investment consulting company) (1989-1995). Formerly, Consultant, Bain and Company (management consulting firm) (1987- 1989). Formerly, Senior Equity Analyst, BA Investment Management Company (1983-1985).
Other Directorships. None. |
George J. Gorman
1952 | Chairperson of the
Board and Trustee | Since 2021
(Chairperson) and 2014 (Trustee) | Principal at George J. Gorman LLC (consulting firm). Formerly, Senior Partner at Ernst & Young LLP (a registered public accounting firm) (1974-2009).
Other Directorships. None. |
Eaton Vance
Emerging Markets Local Income Fund
October 31, 2022
Management and Organization — continued
| Name and Year of Birth | Trust/Portfolio
Position(s) | Length of Service | Principal Occupation(s) and Other Directorships
During Past Five Years and Other Relevant Experience |
| Noninterested Trustees (continued) |
Valerie A. Mosley
1960 | Trustee | Since 2014 | Chairwoman and Chief Executive Officer of Valmo Ventures (a consulting and investment firm). Founder of Upward Wealth, Inc., dba BrightUp, a fintech platform. Formerly, Partner and Senior Vice President, Portfolio Manager and Investment Strategist at Wellington Management Company, LLP (investment management firm) (1992-2012). Formerly, Chief Investment Officer, PG Corbin Asset Management (1990-1992). Formerly worked in institutional corporate bond sales at Kidder Peabody (1986-1990).
Other Directorships. Director of DraftKings, Inc. (digital sports entertainment and gaming company) (since September 2020). Director of Envestnet, Inc. (provider of intelligent systems for wealth management and financial wellness) (since 2018). Formerly, Director of Dynex Capital, Inc. (mortgage REIT) (2013-2020) and Director of Groupon, Inc. (e-commerce provider) (2020-2022). |
Keith Quinton
1958 | Trustee | Since 2018 | Private investor, researcher and lecturer. Formerly, Independent Investment Committee Member at New Hampshire Retirement System (2017-2021). Formerly, Portfolio Manager and Senior Quantitative Analyst at Fidelity Investments (investment management firm) (2001-2014).
Other Directorships. Formerly, Director (2016-2021) and Chairman (2019-2021) of New Hampshire Municipal Bond Bank. |
Marcus L. Smith
1966 | Trustee | Since 2018 | Private investor and independent corporate director. Formerly, Chief Investment Officer, Canada (2012-2017), Chief Investment Officer, Asia (2010-2012), Director of Asian Research (2004-2010) and portfolio manager (2001-2017) at MFS Investment Management (investment management firm).
Other Directorships. Director of First Industrial Realty Trust, Inc. (an industrial REIT) (since 2021). Director of MSCI Inc. (global provider of investment decision support tools) (since 2017). Formerly, Director of DCT Industrial Trust Inc. (logistics real estate company) (2017-2018). |
Susan J. Sutherland
1957 | Trustee | Since 2015 | Private investor. Director of Ascot Group Limited and certain of its subsidiaries (insurance and reinsurance) (since 2017). Formerly, Director of Hagerty Holding Corp. (insurance) (2015-2018) and Montpelier Re Holdings Ltd. (insurance and reinsurance) (2013-2015). Formerly, Associate, Counsel and Partner at Skadden, Arps, Slate, Meagher & Flom LLP (law firm) (1982-2013).
Other Directorships. Director of Kairos Acquisition Corp. (insurance/InsurTech acquisition company) (since 2021). |
Scott E. Wennerholm
1959 | Trustee | Since 2016 | Private investor. Formerly, Trustee at Wheelock College (postsecondary institution) (2012-2018). Formerly, Consultant at GF Parish Group (executive recruiting firm) (2016-2017). Formerly, Chief Operating Officer and Executive Vice President at BNY Mellon Asset Management (investment management firm) (2005-2011). Formerly, Chief Operating Officer and Chief Financial Officer at Natixis Global Asset Management (investment management firm) (1997-2004). Formerly, Vice President at Fidelity Investments Institutional Services (investment management firm) (1994-1997).
Other Directorships. None. |
Nancy A. Wiser(1)
1967 | Trustee | Since 2022 | Formerly, Executive Vice President and the Global Head of Operations at Wells Fargo Asset Management (2011-2021).
Other Directorships. None. |
| Name and Year of Birth | Trust/Portfolio
Position(s) | Length of Service | Principal Occupation(s)
During Past Five Years |
| Principal Officers who are not Trustees |
Eric A. Stein
1980 | President | Since 2020 | Vice President and Chief Investment Officer, Fixed Income of EVM and BMR. Prior to November 1, 2020, Mr. Stein was a co-Director of Eaton Vance’s Global Income Investments. Also Vice President of Calvert Research and Management (“CRM”). |
Deidre E. Walsh
1971 | Vice President and Chief
Legal Officer | Since 2009 | Vice President of EVM and BMR. Also Vice President of CRM. |
James F. Kirchner
1967 | Treasurer | Since 2007 | Vice President of EVM and BMR. Also Vice President of CRM. |
Eaton Vance
Emerging Markets Local Income Fund
October 31, 2022
Management and Organization — continued
| Name and Year of Birth | Trust/Portfolio
Position(s) | Length of Service | Principal Occupation(s)
During Past Five Years |
| Principal Officers who are not Trustees (continued) |
Nicholas Di Lorenzo
1987 | Secretary | Since 2022 | Formerly, associate (2012-2021) and counsel (2022) at Dechert LLP. |
Richard F. Froio
1968 | Chief Compliance
Officer | Since 2017 | Vice President of EVM and BMR since 2017. Formerly, Deputy Chief Compliance Officer (Adviser/Funds) and Chief Compliance Officer (Distribution) at PIMCO (2012-2017) and Managing Director at BlackRock/Barclays Global Investors (2009-2012). |
(1) Mr. Bowser and Ms. Wiser began serving as Trustees effective April 4, 2022.
The SAI for the Fund includes additional information about the Trustees and officers of the Fund and the Portfolio and can be obtained without charge on Eaton Vance’s website at www.eatonvance.com or by calling 1-800-262-1122.
| FACTS | WHAT DOES EATON VANCE DO WITH YOUR
PERSONAL INFORMATION? |
| Why? | Financial companies choose how they share your personal information. Federal law gives consumers the right to limit some but not all sharing. Federal law also requires us to tell you how we collect, share, and protect your personal information. Please read this notice carefully to understand what we do. |
| |
| What? | The types of personal information we collect and share depend on the product or service you have with us. This information can include:■ Social Security number and income
■ investment experience and risk tolerance
■ checking account number and wire transfer instructions |
| |
| How? | All financial companies need to share customers’ personal information to run their everyday business. In the section below, we list the reasons financial companies can share their customers’ personal information; the reasons Eaton Vance chooses to share; and whether you can limit this sharing. |
Reasons we can share your
personal information | Does Eaton Vance
share? | Can you limit
this sharing? |
| For our everyday business purposes — such as to process your transactions, maintain your account(s), respond to court orders and legal investigations, or report to credit bureaus | Yes | No |
| For our marketing purposes — to offer our products and services to you | Yes | No |
| For joint marketing with other financial companies | No | We don’t share |
| For our investment management affiliates’ everyday business purposes — information about your transactions, experiences, and creditworthiness | Yes | Yes |
| For our affiliates’ everyday business purposes — information about your transactions and experiences | Yes | No |
| For our affiliates’ everyday business purposes — information about your creditworthiness | No | We don’t share |
| For our investment management affiliates to market to you | Yes | Yes |
| For our affiliates to market to you | No | We don’t share |
| For nonaffiliates to market to you | No | We don’t share |
To limit our
sharing | Call toll-free 1-800-262-1122 or email: EVPrivacy@eatonvance.comPlease note:If you are a new customer, we can begin sharing your information 30 days from the date we sent this notice. When you are no longer our customer, we continue to share your information as described in this notice. However, you can contact us at any time to limit our sharing. |
| Questions? | Call toll-free 1-800-262-1122 or email: EVPrivacy@eatonvance.com |
| Privacy Notice — continued | April 2021 |
| Who we are |
| Who is providing this notice? | Eaton Vance Management, Eaton Vance Distributors, Inc., Eaton Vance Trust Company, Eaton Vance Management (International) Limited, Eaton Vance Advisers International Ltd., Eaton Vance Global Advisors Limited, Eaton Vance Management’s Real Estate Investment Group, Boston Management and Research, Calvert Research and Management, Eaton Vance and Calvert Fund Families and our investment advisory affiliates (“Eaton Vance”) (see Investment Management Affiliates definition below) |
| What we do |
How does Eaton Vance
protect my personal
information? | To protect your personal information from unauthorized access and use, we use security measures that comply with federal law. These measures include computer safeguards and secured files and buildings. We have policies governing the proper handling of customer information by personnel and requiring third parties that provide support to adhere to appropriate security standards with respect to such information. |
How does Eaton Vance
collect my personal
information? | We collect your personal information, for example, when you■ open an account or make deposits or withdrawals from your account
■ buy securities from us or make a wire transfer
■ give us your contact informationWe also collect your personal information from others, such as credit bureaus, affiliates, or other companies. |
| Why can’t I limit all sharing? | Federal law gives you the right to limit only■ sharing for affiliates’ everyday business purposes — information about your creditworthiness
■ affiliates from using your information to market to you
■ sharing for nonaffiliates to market to youState laws and individual companies may give you additional rights to limit sharing. See below for more on your rights under state law. |
| Definitions |
Investment Management
Affiliates | Eaton Vance Investment Management Affiliates include registered investment advisers, registered broker- dealers, and registered and unregistered funds. Investment Management Affiliates does not include entities associated with Morgan Stanley Wealth Management, such as Morgan Stanley Smith Barney LLC and Morgan Stanley & Co. |
| Affiliates | Companies related by common ownership or control. They can be financial and nonfinancial companies.■ Our affiliates include companies with a Morgan Stanley name and financial companies such as Morgan Stanley Smith Barney LLC and Morgan Stanley & Co. |
| Nonaffiliates | Companies not related by common ownership or control. They can be financial and nonfinancial companies.■ Eaton Vance does not share with nonaffiliates so they can market to you. |
| Joint marketing | A formal agreement between nonaffiliated financial companies that together market financial products or services to you.■ Eaton Vance doesn’t jointly market. |
| Other important information |
| Vermont: Except as permitted by law, we will not share personal information we collect about Vermont residents with Nonaffiliates unless you provide us with your written consent to share such information.California: Except as permitted by law, we will not share personal information we collect about California residents with Nonaffiliates and we will limit sharing such personal information with our Affiliates to comply with California privacy laws that apply to us. |
Delivery of Shareholder Documents. The Securities and Exchange Commission (SEC) permits funds to deliver only one copy of shareholder documents, including prospectuses, proxy statements and shareholder reports, to fund investors with multiple accounts at the same residential or post office box address. This practice is often called “householding” and it helps eliminate duplicate mailings to shareholders. Eaton Vance, or your financial intermediary, may household the mailing of your documents indefinitely unless you instruct Eaton Vance, or your financial intermediary, otherwise. If you would prefer that your Eaton Vance documents not be householded, please contact Eaton Vance at 1-800-262-1122, or contact your financial intermediary. Your instructions that householding not apply to delivery of your Eaton Vance documents will typically be effective within 30 days of receipt by Eaton Vance or your financial intermediary.
Portfolio Holdings. Each Eaton Vance Fund and its underlying Portfolio(s) (if applicable) files a schedule of portfolio holdings on Part F to Form N-PORT with the SEC. Certain information filed on Form N-PORT may be viewed on the Eaton Vance website at www.eatonvance.com, by calling Eaton Vance at 1-800-262-1122 or in the EDGAR database on the SEC’s website at www.sec.gov.
Proxy Voting. From time to time, funds are required to vote proxies related to the securities held by the funds. The Eaton Vance Funds or their underlying Portfolios (if applicable) vote proxies according to a set of policies and procedures approved by the Funds’ and Portfolios’ Boards. You may obtain a description of these policies and procedures and information on how the Funds or Portfolios voted proxies relating to portfolio securities during the most recent 12-month period ended June 30, without charge, upon request, by calling 1-800-262-1122 and by accessing the SEC’s website at www.sec.gov.
This Page Intentionally Left Blank
This Page Intentionally Left Blank
This Page Intentionally Left Blank
Investment Adviser of Emerging Markets Local Income Portfolio
Boston Management and Research
Two International Place
Boston, MA 02110
Investment Adviser and Administrator of Eaton Vance Emerging Markets Local Income Fund
Eaton Vance Management
Two International Place
Boston, MA 02110
Principal Underwriter*
Eaton Vance Distributors, Inc.
Two International Place
Boston, MA 02110
(617) 482-8260
Custodian
State Street Bank and Trust Company
State Street Financial Center, One Lincoln Street
Boston, MA 02111
Transfer Agent
BNY Mellon Investment Servicing (US) Inc.
Attn: Eaton Vance Funds
P.O. Box 9653
Providence, RI 02940-9653
(800) 262-1122
Independent Registered Public Accounting Firm
Deloitte & Touche LLP
200 Berkeley Street
Boston, MA 02116-5022
Fund Offices
Two International Place
Boston, MA 02110
* FINRA BrokerCheck. Investors may check the background of their Investment Professional by contacting the Financial Industry Regulatory Authority (FINRA). FINRA BrokerCheck is a free tool to help investors check the professional background of current and former FINRA-registered securities firms and brokers. FINRA BrokerCheck is available by calling 1-800-289-9999 and at www.FINRA.org. The FINRA BrokerCheck brochure describing this program is available to investors at www.FINRA.org.

Eaton Vance
Global Macro Absolute Return Advantage Fund
Annual Report
October 31, 2022

Commodity Futures Trading Commission Registration. The Commodity Futures Trading Commission (“CFTC”) has adopted regulations that subject registered investment companies and advisers to regulation by the CFTC if a fund invests more than a prescribed level of its assets in certain CFTC-regulated instruments (including futures, certain options and swap agreements) or markets itself as providing investment exposure to such instruments. The adviser is registered with the CFTC as a commodity pool operator with respect to its management of the Fund. As the commodity pool operator of the Fund, the adviser has claimed relief under the Commodity Exchange Act from certain reporting and recordkeeping requirements. The adviser is also registered as a commodity trading advisor.
Fund shares are not insured by the FDIC and are not deposits or other obligations of, or guaranteed by, any depository institution. Shares are subject to investment risks, including possible loss of principal invested.
This report must be preceded or accompanied by a current summary prospectus or prospectus. Before investing, investors should consider carefully the investment objective, risks, and charges and expenses of a mutual fund. This and other important information is contained in the summary prospectus and prospectus, which can be obtained from a financial intermediary. Prospective investors should read the prospectus carefully before investing. For further information, please call 1-800-262-1122.
Annual Report October 31, 2022
Eaton Vance
Global Macro Absolute Return Advantage Fund
Eaton Vance
Global Macro Absolute Return Advantage Fund
October 31, 2022
Management’s Discussion of Fund Performance†
Economic and Market Conditions
The world’s equity and fixed-income markets posted broad losses during the 12-month period ended October 31, 2022. The declines were due to several factors, including high inflation in many countries, aggressive monetary tightening by the U.S. Federal Reserve (the Fed), and slowing global economic growth.
During the period, U.S. inflation surged as strong consumer demand following the relaxation of COVID-19 restrictions coincided with supply shortages created by the pandemic. Production and trade disruptions resulting from Russia’s February 2022 invasion of Ukraine added to inflationary pressures by driving up prices of energy and grains. The Fed responded by increasing short-term interest rates at the fastest pace in decades and signaling that it would continue hiking rates until inflation was under control – even if it meant pushing the U.S. economy into recession.
The European Central Bank and Bank of England also raised interest rates during the period in efforts to tame inflation, despite signs of deterioration in the European economy. Conversely, the Bank of Japan held its main policy rate at -0.1%. Inflation rose in Japan during the period but remained low compared to inflation in other developed countries. The widening differential between interest rates in Japan and the U.S. contributed to a substantial weakening in the Japanese yen versus the U.S. dollar during the period.
In China, government policies helped contain inflation but also significantly slowed economic growth. First, China maintained its zero-COVID policy, which led to lockdowns of major cities during the period. Second, Chinese leaders renewed their focus on the country’s “common prosperity” agenda, implementing measures that negatively affected certain sectors of China’s economy, including real estate and technology.
During the period, a number of emerging and frontier nations either defaulted on their sovereign debt or were pushed to the brink of default. Rising food and energy prices pressured these governments to offer subsidies to consumers, putting additional stress on fiscal balances already strained by pandemic-related spending. In addition, broad strength in the U.S. dollar made servicing U.S. dollar-denominated debt more expensive.
On a positive note, we believe there were signs late in the period that inflation may have peaked in several major emerging-market economies. Central banks in these countries indicated that they were at, or near, the end of their tightening cycles.
Fund Performance
For the 12-month period ended October 31, 2022, Eaton Vance Global Macro Absolute Return Advantage Fund (the Fund) returned -5.02% for Class A shares at net asset value (NAV), underperforming its benchmark, the ICE BofA 3-Month U.S. Treasury Bill Index (the Index), which returned 0.78%.
The Fund’s interest rate exposure was the main detractor from its performance during the period. In addition, the Fund’s limited allocations to corporate credit and equities had a slightly negative impact. On the other hand, sovereign credit was the largest contributor to performance, followed by commodities and currencies.
By region, Eastern Europe was the largest detractor from returns, driven by a long local bond position in Ukraine that performed poorly due to the Russia-Ukraine war, which led to a steep sell-off in local Ukrainian assets. A long sovereign credit position in Belarus also hurt returns. The strong performance of short positions in Russian sovereign credit and Polish interest rates helped counter these negative effects. By period-end, the long sovereign credit position in Belarus was sold from the Fund, and the short sovereign credit position in Russia was closed.
Investments in the Dollar Bloc -- Canada, New Zealand, and Australia -- and Asia were the next-largest detractors from returns during the period. In particular, long positions in the Australian dollar and Japanese yen weighed on performance given the broad strength of the U.S. dollar during the period.
The Middle East & Africa also negatively affected performance during the period. A long sovereign credit position in Lebanon was a notable detractor from performance as the challenging macroeconomic backdrop put pressure on emerging-market bonds in general. By period-end, this long sovereign credit position was sold from the Fund.
Western Europe was the top contributor to Fund returns during the period. Short exposure to U.K. and European interest rates was especially helpful, as soaring inflation prompted the Bank of England and European Central Bank to tighten policy, pushing rates higher across the region. By period-end, the Fund’s short U.K. rates exposure was closed.
Latin America benefited performance, helped by a long sovereign credit position in Suriname after the International Monetary Fund (IMF) recognized Suriname’s progress on economic reforms, a condition for receiving IMF support.
The Fund used derivatives extensively to hedge select undesired risk exposures, as well as to gain select desired risk exposures. Some of the above commentary about notable drivers of performance at the country level involved the use of derivatives. The Fund’s use of derivatives broadly helped returns during the period. Interest rate swaps used to gain select exposures as well as hedge others contributed to performance, as did credit default swaps used to gain short exposure to certain sovereign credits, which also acted as hedges to other exposures in certain cases. Currency forwards used to gain both long and short exposure to select currencies around the world further added to performance during the period.
See Endnotes and Additional Disclosures in this report.
Past performance is no guarantee of future results. Returns are historical and are calculated by determining the percentage change in net asset value (NAV) or offering price (as applicable) with all distributions reinvested. Furthermore, returns do not reflect the deduction of taxes that shareholders may have to pay on Fund distributions or upon the redemption of Fund shares. Investment return and principal value will fluctuate so that shares, when redeemed, may be worth more or less than their original cost. Performance for periods less than or equal to one year is cumulative. Performance is for the stated time period only; due to market volatility, current Fund performance may be lower or higher than the quoted return. For performance as of the most recent month-end, please refer to eatonvance.com.
Eaton Vance
Global Macro Absolute Return Advantage Fund
October 31, 2022
Performance
Portfolio Manager(s) John R. Baur, Patrick Campbell, CFA, Kyle Lee, CFA, Federico Sequeda, CFA each of Eaton Vance Management and Hussein Khattab, CFA of Eaton Vance Advisers International Ltd.
| | | | | | | | | | | | | | | | | | | | |
| % Average Annual Total Returns1,2 | | Class
Inception Date | | | Performance
Inception Date | | | One Year | | | Five Years | | | Ten Years | |
| | | | | |
Class A at NAV | | | 08/31/2010 | | | | 08/31/2010 | | | | (5.02 | )% | | | 1.20 | % | | | 2.56 | % |
Class A with 3.25% Maximum Sales Charge | | | — | | | | — | | | | (8.10 | ) | | | 0.55 | | | | 2.23 | |
Class C at NAV | | | 08/31/2010 | | | | 08/31/2010 | | | | (5.69 | ) | | | 0.50 | | | | 1.99 | |
Class C with 1% Maximum Deferred Sales Charge | | | — | | | | — | | | | (6.60 | ) | | | 0.50 | | | | 1.99 | |
Class I at NAV | | | 08/31/2010 | | | | 08/31/2010 | | | | (4.79 | ) | | | 1.51 | | | | 2.87 | |
Class R at NAV | | | 12/01/2010 | | | | 08/31/2010 | | | | (5.29 | ) | | | 1.01 | | | | 2.37 | |
Class R6 at NAV | | | 05/31/2017 | | | | 08/31/2010 | | | | (4.84 | ) | | | 1.57 | | | | 2.91 | |
|
| |
| | | | | |
ICE BofA 3-Month U.S. Treasury Bill Index | | | — | | | | — | | | | 0.78 | % | | | 1.16 | % | | | 0.70 | % |
| | | | | |
| % Total Annual Operating Expense Ratios3 | | Class A | | | Class C | | | Class I | | | Class R | | | Class R6 | |
| | | | | |
Gross | | | 1.57 | % | | | 2.27 | % | | | 1.27 | % | | | 1.77 | % | | | 1.24 | % |
Net | | | 1.46 | | | | 2.16 | | | | 1.16 | | | | 1.66 | | | | 1.13 | |
Growth of $10,000
This graph shows the change in value of a hypothetical investment of $10,000 in Class A of the Fund for the period indicated. For comparison, the same investment is shown in the indicated index.
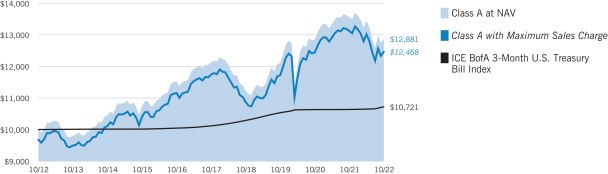
| | | | | | | | | | | | | | | | |
| Growth of Investment2 | | Amount Invested | | | Period Beginning | | | At NAV | | | With Maximum Sales Charge | |
| | | | |
Class C | | | $10,000 | | | | 10/31/2012 | | | | $12,174 | | | | N.A. | |
Class I, at minimum investment | | | $1,000,000 | | | | 10/31/2012 | | | | $1,327,242 | | | | N.A. | |
Class R | | | $10,000 | | | | 10/31/2012 | | | | $12,639 | | | | N.A. | |
Class R6, at minimum investment | | | $5,000,000 | | | | 10/31/2012 | | | | $6,661,987 | | | | N.A. | |
See Endnotes and Additional Disclosures in this report.
Past performance is no guarantee of future results. Returns are historical and are calculated by determining the percentage change in net asset value (NAV) or offering price (as applicable) with all distributions reinvested. Furthermore, returns do not reflect the deduction of taxes that shareholders may have to pay on Fund distributions or upon the redemption of Fund shares. Investment return and principal value will fluctuate so that shares, when redeemed, may be worth more or less than their original cost. Performance for periods less than or equal to one year is cumulative. Performance is for the stated time period only; due to market volatility, current Fund performance may be lower or higher than the quoted return. For performance as of the most recent month-end, please refer to eatonvance.com.
Eaton Vance
Global Macro Absolute Return Advantage Fund
October 31, 2022
Fund Profile
Asset Allocation (% of net assets)1
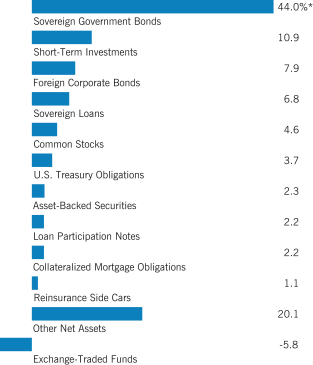
Foreign Currency Exposure (% of net assets)2
| | | | |
| |
Singapore | | | 6.1 | % |
| |
Ukraine | | | 4.4 | |
| |
Dominican Republic | | | 3.8 | |
| |
Serbia | | | 3.5 | |
| |
Uzbekistan | | | 3.3 | |
| |
Iceland | | | 3.3 | |
| |
Australia | | | 2.9 | |
| |
Kazakhstan | | | 2.2 | |
| |
Uruguay | | | 2.0 | |
| |
Japan | | | 2.0 | |
| |
South Korea | | | 1.5 | |
| |
Brazil | | | 1.5 | |
| |
New Zealand | | | 1.3 | |
| |
Uganda | | | 1.1 | |
| |
Other | | | 0.1 | ** |
| |
Chile | | | -1.4 | |
| |
India | | | -1.8 | |
| |
Bahrain | | | -3.2 | |
| |
Saudi Arabia | | | -3.7 | |
| |
Malaysia | | | -3.8 | |
| |
Thailand | | | -4.0 | |
| |
Oman | | | -5.4 | |
| |
Philippines | | | -6.1 | |
| |
South Africa | | | -7.3 | |
| |
Euro | | | -7.3 | |
| |
China | | | -7.8 | |
| |
United Arab Emirates | | | -11.2 | |
| |
Total Long | | | 42.9 | |
| |
Total Short | | | -66.9 | |
| |
Total Net | | | -24.0 | |
Footnotes:
Fund invests in an affiliated investment company (Portfolio) with the same objective(s) and policies as the Fund. References to investments are to the Portfolio’s holdings.
| 1 | Other Net Assets represents other assets less liabilities and includes any investment type that represents less than 1% of net assets. |
| 2 | Currency exposures include all foreign exchange denominated assets, currency derivatives and commodities (including commodity derivatives). Total exposures may exceed 100% due to implicit leverage created by derivatives. |
| * | Net of securities sold short. |
| ** | Includes amounts each less than 1.0% or –1.0%, as applicable. |
Eaton Vance
Global Macro Absolute Return Advantage Fund
October 31, 2022
Endnotes and Additional Disclosures
| † | The views expressed in this report are those of the portfolio manager(s) and are current only through the date stated at the top of this page. These views are subject to change at any time based upon market or other conditions, and Eaton Vance and the Fund(s) disclaim any responsibility to update such views. These views may not be relied upon as investment advice and, because investment decisions are based on many factors, may not be relied upon as an indication of trading intent on behalf of any Eaton Vance fund. This commentary may contain statements that are not historical facts, referred to as “forward-looking statements.” The Fund’s actual future results may differ significantly from those stated in any forward-looking statement, depending on factors such as changes in securities or financial markets or general economic conditions, the volume of sales and purchases of Fund shares, the continuation of investment advisory, administrative and service contracts, and other risks discussed from time to time in the Fund’s filings with the Securities and Exchange Commission. |
| 1 | ICE BofA 3-Month U.S. Treasury Bill Index is an unmanaged index of U.S. Treasury securities maturing in 90 days. ICE® BofA® indices are not for redistribution or other uses; provided “as is”, without warranties, and with no liability. Eaton Vance has prepared this report and ICE Data Indices, LLC does not endorse it, or guarantee, review, or endorse Eaton Vance’s products. BofA® is a licensed registered trademark of Bank of America Corporation in the United States and other countries. Unless otherwise stated, index returns do not reflect the effect of any applicable sales charges, commissions, expenses, taxes or leverage, as applicable. It is not possible to invest directly in an index. |
| 2 | Total Returns at NAV do not include applicable sales charges. If sales charges were deducted, the returns would be lower. Total Returns shown with maximum sales charge reflect the stated maximum sales charge. Unless otherwise stated, performance does not reflect the deduction of taxes on Fund distributions or redemptions of Fund shares. |
Performance prior to the inception date of a class may be linked to the performance of an older class of the Fund. This linked performance is adjusted for any applicable sales charge, but is not adjusted for class expense differences. If adjusted for such differences, the performance would be different. The performance of Class R6 is linked to Class I. Performance presented in the Financial Highlights included in the financial statements is not linked.
Effective November 5, 2020, Class C shares automatically convert to Class A shares eight years after purchase. The average annual total returns listed for Class C reflect conversion to Class A shares after eight years. Prior to November 5, 2020, Class C shares automatically converted to Class A shares ten years after purchase.
| 3 | Source: Fund prospectus. Net expense ratios reflect a contractual expense reimbursement that continues through 2/28/23. The expense ratios for the current reporting period can be found in the Financial Highlights section of this report. Performance reflects expenses waived and/or reimbursed, if applicable. Without such waivers and/or reimbursements, performance would have been lower. |
Fund profile subject to change due to active management.
Additional Information
A long position is the purchase of an investment with the expectation that it will rise in value.
A short position is the sale of a borrowed investment with the expectation that it will decline in value.
Eaton Vance
Global Macro Absolute Return Advantage Fund
October 31, 2022
Fund Expenses
Example
As a Fund shareholder, you incur two types of costs: (1) transaction costs, including sales charges (loads) on purchases and redemption fees (if applicable); and (2) ongoing costs, including management fees; distribution and/or service fees; and other Fund expenses. This Example is intended to help you understand your ongoing costs (in dollars) of Fund investing and to compare these costs with the ongoing costs of investing in other mutual funds. The Example is based on an investment of $1,000 invested at the beginning of the period and held for the entire period (May 1, 2022 to October 31, 2022).
Actual Expenses
The first section of the table below provides information about actual account values and actual expenses. You may use the information in this section, together with the amount you invested, to estimate the expenses that you paid over the period. Simply divide your account value by $1,000 (for example, an $8,600 account value divided by $1,000 = 8.6), then multiply the result by the number in the first section under the heading entitled “Expenses Paid During Period” to estimate the expenses you paid on your account during this period.
Hypothetical Example for Comparison Purposes
The second section of the table below provides information about hypothetical account values and hypothetical expenses based on the actual Fund expense ratio and an assumed rate of return of 5% per year (before expenses), which is not the actual Fund return. The hypothetical account values and expenses may not be used to estimate the actual ending account balance or expenses you paid for the period. You may use this information to compare the ongoing costs of investing in your Fund and other funds. To do so, compare this 5% hypothetical example with the 5% hypothetical examples that appear in the shareholder reports of the other funds.
Please note that the expenses shown in the table are meant to highlight your ongoing costs only and do not reflect any transactional costs, such as sales charges (loads) or redemption fees (if applicable). Therefore, the second section of the table is useful in comparing ongoing costs only, and will not help you determine the relative total costs of owning different funds. In addition, if these transactional costs were included, your costs would be higher.
| | | | | | | | | | | | | | | | |
| | | Beginning
Account Value
(5/1/22) | | | Ending
Account Value
(10/31/22) | | | Expenses Paid During Period* (5/1/22 – 10/31/22) | | | Annualized
Expense
Ratio | |
| | | | |
Actual | | | | | | | | | | | | | | | | |
Class A | | $ | 1,000.00 | | | $ | 957.60 | | | | $7.50** | | | | 1.52 | % |
Class C | | $ | 1,000.00 | | | $ | 954.50 | | | | $10.94** | | | | 2.22 | % |
Class I | | $ | 1,000.00 | | | $ | 959.20 | | | | $6.02** | | | | 1.22 | % |
Class R | | $ | 1,000.00 | | | $ | 956.10 | | | | $8.48** | | | | 1.72 | % |
Class R6 | | $ | 1,000.00 | | | $ | 958.20 | | | | $5.87** | | | | 1.19 | % |
| | | | | |
Hypothetical | | | | | | | | | | | | | | | | |
(5% return per year before expenses) | | | | | | | | | | | | | | | | |
Class A | | $ | 1,000.00 | | | $ | 1,017.54 | | | | $7.73** | | | | 1.52 | % |
Class C | | $ | 1,000.00 | | | $ | 1,014.01 | | | | $11.27** | | | | 2.22 | % |
Class I | | $ | 1,000.00 | | | $ | 1,019.06 | | | | $6.21** | | | | 1.22 | % |
Class R | | $ | 1,000.00 | | | $ | 1,016.53 | | | | $8.74** | | | | 1.72 | % |
Class R6 | | $ | 1,000.00 | | | $ | 1,019.21 | | | | $6.06** | | | | 1.19 | % |
| * | Expenses are equal to the Fund’s annualized expense ratio for the indicated Class, multiplied by the average account value over the period, multiplied by 184/365 (to reflect the one-half year period). The Example assumes that the $1,000 was invested at the net asset value per share determined at the close of business on April 30, 2022. The Example reflects the expenses of both the Fund and the Portfolio. |
| ** | Absent an allocation of certain expenses to an affiliate, the expenses would be higher. |
Eaton Vance
Global Macro Absolute Return Advantage Fund
October 31, 2022
Statement of Assets and Liabilities
| | | | |
| Assets | | October 31, 2022 | |
| |
Investment in Global Macro Absolute Return Advantage Portfolio, at value (identified cost $1,838,477,569) | | $ | 1,523,429,198 | |
| |
Receivable for Fund shares sold | | | 3,657,530 | |
| |
Receivable from affiliate | | | 105,649 | |
| |
Total assets | | $ | 1,527,192,377 | |
| |
| Liabilities | | | | |
| |
Payable for Fund shares redeemed | | $ | 6,007,550 | |
| |
Payable to affiliates: | | | | |
| |
Distribution and service fees | | | 46,677 | |
| |
Trustees’ fees | | | 43 | |
| |
Accrued expenses | | | 399,981 | |
| |
Total liabilities | | $ | 6,454,251 | |
| |
Net Assets | | $ | 1,520,738,126 | |
| |
| Sources of Net Assets | | | | |
| |
Paid-in capital | | $ | 1,913,457,863 | |
| |
Accumulated loss | | | (392,719,737 | ) |
| |
Net Assets | | $ | 1,520,738,126 | |
| |
| Class A Shares | | | | |
| |
Net Assets | | $ | 151,817,942 | |
| |
Shares Outstanding | | | 16,006,605 | |
| |
Net Asset Value and Redemption Price Per Share | | | | |
| |
(net assets ÷ shares of beneficial interest outstanding) | | $ | 9.48 | |
|
Maximum Offering Price Per Share | |
| |
(100 ÷ 96.75 of net asset value per share) | | $ | 9.80 | |
| |
| Class C Shares | | | | |
| |
Net Assets | | $ | 10,906,460 | |
| |
Shares Outstanding | | | 1,181,091 | |
| |
Net Asset Value and Offering Price Per Share* | | | | |
| |
(net assets ÷ shares of beneficial interest outstanding) | | $ | 9.23 | |
| |
| Class I Shares | | | | |
| |
Net Assets | | $ | 803,280,884 | |
| |
Shares Outstanding | | | 83,363,596 | |
| |
Net Asset Value, Offering Price and Redemption Price Per Share | | | | |
| |
(net assets ÷ shares of beneficial interest outstanding) | | $ | 9.64 | |
| |
| Class R Shares | | | | |
| |
Net Assets | | $ | 1,339,614 | |
| |
Shares Outstanding | | | 143,153 | |
| |
Net Asset Value, Offering Price and Redemption Price Per Share | | | | |
| |
(net assets ÷ shares of beneficial interest outstanding) | | $ | 9.36 | |
| | | | |
| | 7 | | See Notes to Financial Statements. |
Eaton Vance
Global Macro Absolute Return Advantage Fund
October 31, 2022
Statement of Assets and Liabilities — continued
| | | | |
| Class R6 Shares | | October 31, 2022 | |
| |
Net Assets | | $ | 553,393,226 | |
| |
Shares Outstanding | | | 57,445,010 | |
| |
Net Asset Value, Offering Price and Redemption Price Per Share | | | | |
| |
(net assets ÷ shares of beneficial interest outstanding) | | $ | 9.63 | |
On sales of $50,000 or more, the offering price of Class A shares is reduced.
| * | Redemption price per share is equal to the net asset value less any applicable contingent deferred sales charge. |
| | | | |
| | 8 | | See Notes to Financial Statements. |
Eaton Vance
Global Macro Absolute Return Advantage Fund
October 31, 2022
Statement of Operations
| | | | |
| Investment Income | | Year Ended October 31, 2022 | |
| |
Dividend income allocated from Portfolio (net of foreign taxes withheld of $227,489) | | $ | 4,368,259 | |
| |
Interest and other income allocated from Portfolio (net of foreign taxes withheld of $886,563) | | | 122,569,797 | |
| |
Expenses, excluding interest and dividend expense, allocated from Portfolio | | | (17,660,927 | ) |
| |
Interest and dividend expense allocated from Portfolio | | | (2,825,239 | ) |
| |
Total investment income from Portfolio | | $ | 106,451,890 | |
| |
| Expenses | | | | |
| |
Distribution and service fees: | | | | |
| |
Class A | | $ | 990,119 | |
| |
Class C | | | 124,443 | |
| |
Class R | | | 6,740 | |
| |
Trustees’ fees and expenses | | | 500 | |
| |
Custodian fee | | | 62,000 | |
| |
Transfer and dividend disbursing agent fees | | | 1,283,727 | |
| |
Legal and accounting services | | | 56,443 | |
| |
Printing and postage | | | 422,059 | |
| |
Registration fees | | | 176,217 | |
| |
Miscellaneous | | | 25,620 | |
| |
Total expenses | | $ | 3,147,868 | |
| |
Deduct: | | | | |
| |
Waiver and/or reimbursement of expenses by affiliate | | $ | 1,771,456 | |
| |
Total expense reductions | | $ | 1,771,456 | |
| |
Net expenses | | $ | 1,376,412 | |
| |
Net investment income | | $ | 105,075,478 | |
| |
| Realized and Unrealized Gain (Loss) from Portfolio | | | | |
| |
Net realized gain (loss): | | | | |
| |
Investment transactions (net of foreign capital gains taxes of $186,558) | | $ | (103,712,546 | ) |
| |
Securities sold short | | | 8,199,970 | |
| |
Futures contracts | | | 36,460,558 | |
| |
Swap contracts | | | 142,540,782 | |
| |
Foreign currency transactions | | | (9,997,734 | ) |
| |
Forward foreign currency exchange contracts | | | 70,927,415 | |
| |
Non-deliverable bond forward contracts | | | (33,715,874 | ) |
| |
Net realized gain | | $ | 110,702,571 | |
| |
Change in unrealized appreciation (depreciation): | | | | |
| |
Investments (including net decrease in accrued foreign capital gains taxes of $24,277) | | $ | (371,113,211 | ) |
| |
Securities sold short | | | 6,754,695 | |
| |
Futures contracts | | | 9,503,187 | |
| |
Swap contracts | | | 48,452,731 | |
| |
Foreign currency | | | (9,965 | ) |
| |
Forward foreign currency exchange contracts | | | 5,313,591 | |
| |
Non-deliverable bond forward contracts | | | 3,185,756 | |
| |
Net change in unrealized appreciation (depreciation) | | $ | (297,913,216 | ) |
| |
Net realized and unrealized loss | | $ | (187,210,645 | ) |
| |
Net decrease in net assets from operations | | $ | (82,135,167 | ) |
| | | | |
| | 9 | | See Notes to Financial Statements. |
Eaton Vance
Global Macro Absolute Return Advantage Fund
October 31, 2022
Statements of Changes in Net Assets
| | | | | | | | |
| | | Year Ended October 31, | |
| Increase (Decrease) in Net Assets | | 2022 | | | 2021 | |
| | |
From operations: | | | | | | | | |
| | |
Net investment income | | $ | 105,075,478 | | | $ | 140,429,069 | |
| | |
Net realized gain (loss) | | | 110,702,571 | | | | (39,662,102 | ) |
| | |
Net change in unrealized appreciation (depreciation) | | | (297,913,216 | ) | | | 57,873,936 | |
| | |
Net increase (decrease) in net assets from operations | | $ | (82,135,167 | ) | | $ | 158,640,903 | |
| | |
Distributions to shareholders: | | | | | | | | |
| | |
Class A | | $ | (28,376,973 | ) | | $ | (41,471,150 | ) |
| | |
Class C | | | (502,076 | ) | | | (744,070 | ) |
| | |
Class I | | | (38,629,833 | ) | | | (72,890,969 | ) |
| | |
Class R | | | (60,698 | ) | | | (69,913 | ) |
| | |
Class R6 | | | (30,233,189 | ) | | | (40,092,547 | ) |
| | |
Total distributions to shareholders | | $ | (97,802,769 | ) | | $ | (155,268,649 | ) |
| | |
Transactions in shares of beneficial interest: | | | | | | | | |
| | |
Class A | | $ | (485,597,806 | ) | | $ | (85,015,295 | ) |
| | |
Class C | | | (1,857,675 | ) | | | (6,984,503 | ) |
| | |
Class I | | | 50,348,589 | | | | (458,377,429 | ) |
| | |
Class R | | | 76,078 | | | | (111,022 | ) |
| | |
Class R6 | | | (28,870,732 | ) | | | (60,189,348 | ) |
| | |
Net decrease in net assets from Fund share transactions | | $ | (465,901,546 | ) | | $ | (610,677,597 | ) |
| | |
Net decrease in net assets | | $ | (645,839,482 | ) | | $ | (607,305,343 | ) |
| | |
| Net Assets | | | | | | | | |
| | |
At beginning of year | | $ | 2,166,577,608 | | | $ | 2,773,882,951 | |
| | |
At end of year | | $ | 1,520,738,126 | | | $ | 2,166,577,608 | |
| | | | |
| | 10 | | See Notes to Financial Statements. |
Eaton Vance
Global Macro Absolute Return Advantage Fund
October 31, 2022
Financial Highlights
| | | | | | | | | | | | | | | | | | | | |
| | | Class A | |
| |
| | | Year Ended October 31, | |
| | | 2022 | | | 2021 | | | 2020 | | | 2019 | | | 2018 | |
| | | | | |
Net asset value — Beginning of year | | $ | 10.450 | | | $ | 10.450 | | | $ | 10.250 | | | $ | 9.510 | | | $ | 10.560 | |
| | | | | |
| Income (Loss) From Operations | | | | | | | | | | | | | | | | | | | | |
| | | | | |
Net investment income(1) | | $ | 0.531 | | | $ | 0.524 | | | $ | 0.549 | | | $ | 0.564 | | | $ | 0.479 | |
| | | | | |
Net realized and unrealized gain (loss) | | | (1.038 | ) | | | 0.049 | | | | 0.066 | | | | 0.176 | | | | (1.239 | ) |
| | | | | |
Total income (loss) from operations | | $ | (0.507 | ) | | $ | 0.573 | | | $ | 0.615 | | | $ | 0.740 | | | $ | (0.760 | ) |
| | | | | |
| Less Distributions | | | | | | | | | | | | | | | | | | | | |
| | | | | |
From net investment income | | $ | (0.463 | ) | | $ | (0.573 | ) | | $ | (0.415 | ) | | $ | — | | | $ | (0.290 | ) |
| | | | | |
Total distributions | | $ | (0.463 | ) | | $ | (0.573 | ) | | $ | (0.415 | ) | | $ | — | | | $ | (0.290 | ) |
| | | | | |
Net asset value — End of year | | $ | 9.480 | | | $ | 10.450 | | | $ | 10.450 | | | $ | 10.250 | | | $ | 9.510 | |
| | | | | |
Total Return(2)(3) | | | (5.02 | )% | | | 5.52 | % | | | 6.15 | % | | | 7.78 | % | | | (7.40 | )% |
| | | | | |
| Ratios/Supplemental Data | | | | | | | | | | | | | | | | | | | | |
| | | | | |
Net assets, end of year (000’s omitted) | | $ | 151,818 | | | $ | 676,641 | | | $ | 758,795 | | | $ | 789,497 | | | $ | 122,402 | |
| | | | | |
Ratios (as a percentage of average daily net assets):(4) | | | | | | | | | | | | | | | | | | | | |
| | | | | |
Expenses(3)(5) | | | 1.51 | %(6) | | | 1.46 | % | | | 1.44 | % | | | 1.57 | % | | | 1.45 | % |
| | | | | |
Net investment income | | | 5.31 | % | | | 5.03 | % | | | 5.35 | % | | | 5.70 | % | | | 4.73 | % |
| | | | | |
Portfolio Turnover of the Portfolio | | | 94 | % | | | 82 | % | | | 80 | % | | | 71 | % | | | 75 | % |
| (1) | Computed using average shares outstanding. |
| (2) | Returns are historical and are calculated by determining the percentage change in net asset value with all distributions reinvested and do not reflect the effect of sales charges. |
| (3) | The investment adviser and administrator of the Fund and/or the investment adviser of the Portfolio reimbursed certain operating expenses (equal to 0.11%, 0.11%, 0.15%, 0.18% and 0.10% of average daily net assets for the years ended October 31, 2022, 2021, 2020, 2019 and 2018, respectively). Absent this reimbursement, total return would be lower. |
| (4) | Includes the Fund’s share of the Portfolio’s allocated expenses. |
| (5) | Includes interest and/or dividend expense, including on securities sold short and/or reverse repurchase agreements if applicable, of 0.16%, 0.11%, 0.09%, 0.22% and 0.07% of average daily net assets for the years ended October 31, 2022, 2021, 2020, 2019 and 2018, respectively. |
| (6) | Includes a reduction by the investment adviser of a portion of the Portfolio’s adviser fee due to the Portfolio’s investment in the Liquidity Fund (equal to less than 0.005% of average daily net assets for the year ended October 31, 2022). |
| | | | |
| | 11 | | See Notes to Financial Statements. |
Eaton Vance
Global Macro Absolute Return Advantage Fund
October 31, 2022
Financial Highlights — continued
| | | | | | | | | | | | | | | | | | | | |
| | | Class C | |
| |
| | | Year Ended October 31, | |
| | | 2022 | | | 2021 | | | 2020 | | | 2019 | | | 2018 | |
| | | | | |
Net asset value — Beginning of year | | $ | 10.180 | | | $ | 10.150 | | | $ | 9.930 | | | $ | 9.270 | | | $ | 10.330 | |
| | | | | |
| Income (Loss) From Operations | | | | | | | | | | | | | | | | | | | | |
| | | | | |
Net investment income(1) | | $ | 0.495 | | | $ | 0.441 | | | $ | 0.468 | | | $ | 0.453 | | | $ | 0.399 | |
| | | | | |
Net realized and unrealized gain (loss) | | | (1.059 | ) | | | 0.043 | | | | 0.056 | | | | 0.207 | | | | (1.214 | ) |
| | | | | |
Total income (loss) from operations | | $ | (0.564 | ) | | $ | 0.484 | | | $ | 0.524 | | | $ | 0.660 | | | $ | (0.815 | ) |
| | | | | |
| Less Distributions | | | | | | | | | | | | | | | | | | | | |
| | | | | |
From net investment income | | $ | (0.386 | ) | | $ | (0.454 | ) | | $ | (0.304 | ) | | $ | — | | | $ | (0.245 | ) |
| | | | | |
Total distributions | | $ | (0.386 | ) | | $ | (0.454 | ) | | $ | (0.304 | ) | | $ | — | | | $ | (0.245 | ) |
| | | | | |
Net asset value — End of year | | $ | 9.230 | | | $ | 10.180 | | | $ | 10.150 | | | $ | 9.930 | | | $ | 9.270 | |
| | | | | |
Total Return(2)(3) | | | (5.69 | )% | | | 4.85 | % | | | 5.29 | % | | | 7.12 | % | | | (8.08 | )% |
| | | | | |
| Ratios/Supplemental Data | | | | | | | | | | | | | | | | | | | | |
| | | | | |
Net assets, end of year (000’s omitted) | | $ | 10,906 | | | $ | 14,020 | | | $ | 20,894 | | | $ | 30,108 | | | $ | 59,782 | |
| | | | | |
Ratios (as a percentage of average daily net assets):(4) | | | | | | | | | | | | | | | | | | | | |
| | | | | |
Expenses(3)(5) | | | 2.21 | %(6) | | | 2.16 | % | | | 2.14 | % | | | 2.29 | % | | | 2.15 | % |
| | | | | |
Net investment income | | | 5.16 | % | | | 4.33 | % | | | 4.69 | % | | | 4.80 | % | | | 4.03 | % |
| | | | | |
Portfolio Turnover of the Portfolio | | | 94 | % | | | 82 | % | | | 80 | % | | | 71 | % | | | 75 | % |
| (1) | Computed using average shares outstanding. |
| (2) | Returns are historical and are calculated by determining the percentage change in net asset value with all distributions reinvested and do not reflect the effect of sales charges. |
| (3) | The investment adviser and administrator of the Fund and/or the investment adviser of the Portfolio reimbursed certain operating expenses (equal to 0.11%, 0.11%, 0.15%, 0.18% and 0.10% of average daily net assets for the years ended October 31, 2022, 2021, 2020, 2019 and 2018, respectively). Absent this reimbursement, total return would be lower. |
| (4) | Includes the Fund’s share of the Portfolio’s allocated expenses. |
| (5) | Includes interest and/or dividend expense, including on securities sold short and/or reverse repurchase agreements if applicable, of 0.16%, 0.11%, 0.09%, 0.24% and 0.07% of average daily net assets for the years ended October 31, 2022, 2021, 2020, 2019 and 2018, respectively. |
| (6) | Includes a reduction by the investment adviser of a portion of the Portfolio’s adviser fee due to the Portfolio’s investment in the Liquidity Fund (equal to less than 0.005% of average daily net assets for the year ended October 31, 2022). |
| | | | |
| | 12 | | See Notes to Financial Statements. |
Eaton Vance
Global Macro Absolute Return Advantage Fund
October 31, 2022
Financial Highlights — continued
| | | | | | | | | | | | | | | | | | | | |
| | | Class I | |
| |
| | | Year Ended October 31, | |
| | | 2022 | | | 2021 | | | 2020 | | | 2019 | | | 2018 | |
| | | | | |
Net asset value — Beginning of year | | $ | 10.620 | | | $ | 10.610 | | | $ | 10.390 | | | $ | 9.610 | | | $ | 10.680 | |
| | | | | |
| Income (Loss) From Operations | | | | | | | | | | | | | | | | | | | | |
| | | | | |
Net investment income(1) | | $ | 0.619 | | | $ | 0.565 | | | $ | 0.592 | | | $ | 0.570 | | | $ | 0.514 | |
| | | | | |
Net realized and unrealized gain (loss) | | | (1.099 | ) | | | 0.047 | | | | 0.062 | | | | 0.216 | | | | (1.250 | ) |
| | | | | |
Total income (loss) from operations | | $ | (0.480 | ) | | $ | 0.612 | | | $ | 0.654 | | | $ | 0.786 | | | $ | (0.736 | ) |
| | | | | |
| Less Distributions | | | | | | | | | | | | | | | | | | | | |
| | | | | |
From net investment income | | $ | (0.500 | ) | | $ | (0.602 | ) | | $ | (0.434 | ) | | $ | (0.006 | ) | | $ | (0.334 | ) |
| | | | | |
Total distributions | | $ | (0.500 | ) | | $ | (0.602 | ) | | $ | (0.434 | ) | | $ | (0.006 | ) | | $ | (0.334 | ) |
| | | | | |
Net asset value — End of year | | $ | 9.640 | | | $ | 10.620 | | | $ | 10.610 | | | $ | 10.390 | | | $ | 9.610 | |
| | | | | |
Total Return(2)(3) | | | (4.79 | )% | | | 5.93 | % | | | 6.36 | % | | | 8.18 | % | | | (7.12 | )% |
| | | | | |
| Ratios/Supplemental Data | | | | | | | | | | | | | | | | | | | | |
| | | | | |
Net assets, end of year (000’s omitted) | | $ | 803,281 | | | $ | 836,706 | | | $ | 1,293,211 | | | $ | 2,075,104 | | | $ | 3,731,477 | |
| | | | | |
Ratios (as a percentage of average daily net assets):(4) | | | | | | | | | | | | | | | | | | | | |
| | | | | |
Expenses(3)(5) | | | 1.21 | %(6) | | | 1.16 | % | | | 1.14 | % | | | 1.29 | % | | | 1.15 | % |
| | | | | |
Net investment income | | | 6.22 | % | | | 5.35 | % | | | 5.70 | % | | | 5.81 | % | | | 5.04 | % |
| | | | | |
Portfolio Turnover of the Portfolio | | | 94 | % | | | 82 | % | | | 80 | % | | | 71 | % | | | 75 | % |
| (1) | Computed using average shares outstanding. |
| (2) | Returns are historical and are calculated by determining the percentage change in net asset value with all distributions reinvested. |
| (3) | The investment adviser and administrator of the Fund and/or the investment adviser of the Portfolio reimbursed certain operating expenses (equal to 0.11%, 0.11%, 0.15%, 0.18% and 0.10% of average daily net assets for the years ended October 31, 2022, 2021, 2020, 2019 and 2018, respectively). Absent this reimbursement, total return would be lower. |
| (4) | Includes the Fund’s share of the Portfolio’s allocated expenses. |
| (5) | Includes interest and/or dividend expense, including on securities sold short and/or reverse repurchase agreements if applicable, of 0.16%, 0.11%, 0.09%, 0.24% and 0.07% of average daily net assets for the years ended October 31, 2022, 2021, 2020, 2019 and 2018, respectively. |
| (6) | Includes a reduction by the investment adviser of a portion of the Portfolio’s adviser fee due to the Portfolio’s investment in the Liquidity Fund (equal to less than 0.005% of average daily net assets for the year ended October 31, 2022). |
| | | | |
| | 13 | | See Notes to Financial Statements. |
Eaton Vance
Global Macro Absolute Return Advantage Fund
October 31, 2022
Financial Highlights — continued
| | | | | | | | | | | | | | | | | | | | |
| | | Class R | |
| |
| | | Year Ended October 31, | |
| | | 2022 | | | 2021 | | | 2020 | | | 2019 | | | 2018 | |
| | | | | |
Net asset value — Beginning of year | | $ | 10.330 | | | $ | 10.330 | | | $ | 10.120 | | | $ | 9.410 | | | $ | 10.440 | |
| | | | | |
| Income (Loss) From Operations | | | | | | | | | | | | | | | | | | | | |
| | | | | |
Net investment income(1) | | $ | 0.554 | | | $ | 0.497 | | | $ | 0.526 | | | $ | 0.515 | | | $ | 0.451 | |
| | | | | |
Net realized and unrealized gain (loss) | | | (1.073 | ) | | | 0.055 | | | | 0.064 | | | | 0.195 | | | | (1.217 | ) |
| | | | | |
Total income (loss) from operations | | $ | (0.519 | ) | | $ | 0.552 | | | $ | 0.590 | | | $ | 0.710 | | | $ | (0.766 | ) |
| | | | | |
| Less Distributions | | | | | | | | | | | | | | | | | | | | |
| | | | | |
From net investment income | | $ | (0.451 | ) | | $ | (0.552 | ) | | $ | (0.380 | ) | | $ | — | | | $ | (0.264 | ) |
| | | | | |
Total distributions | | $ | (0.451 | ) | | $ | (0.552 | ) | | $ | (0.380 | ) | | $ | — | | | $ | (0.264 | ) |
| | | | | |
Net asset value — End of year | | $ | 9.360 | | | $ | 10.330 | | | $ | 10.330 | | | $ | 10.120 | | | $ | 9.410 | |
| | | | | |
Total Return(2)(3) | | | (5.29 | )% | | | 5.36 | % | | | 5.97 | % | | | 7.55 | % | | | (7.53 | )% |
| | | | | |
| Ratios/Supplemental Data | | | | | | | | | | | | | | | | | | | | |
| | | | | |
Net assets, end of year (000’s omitted) | | $ | 1,340 | | | $ | 1,398 | | | $ | 1,506 | | | $ | 1,566 | | | $ | 1,801 | |
| | | | | |
Ratios (as a percentage of average daily net assets):(4) | | | | | | | | | | | | | | | | | | | | |
| | | | | |
Expenses(3)(5) | | | 1.71 | %(6) | | | 1.66 | % | | | 1.64 | % | | | 1.79 | % | | | 1.65 | % |
| | | | | |
Net investment income | | | 5.71 | % | | | 4.82 | % | | | 5.18 | % | | | 5.35 | % | | | 4.50 | % |
| | | | | |
Portfolio Turnover of the Portfolio | | | 94 | % | | | 82 | % | | | 80 | % | | | 71 | % | | | 75 | % |
| (1) | Computed using average shares outstanding. |
| (2) | Returns are historical and are calculated by determining the percentage change in net asset value with all distributions reinvested. |
| (3) | The investment adviser and administrator of the Fund and/or the investment adviser of the Portfolio reimbursed certain operating expenses (equal to 0.11%, 0.11%, 0.15%, 0.18% and 0.10% of average daily net assets for the years ended October 31, 2022, 2021, 2020, 2019 and 2018, respectively). Absent this reimbursement, total return would be lower. |
| (4) | Includes the Fund’s share of the Portfolio’s allocated expenses. |
| (5) | Includes interest and/or dividend expense, including on securities sold short and/or reverse repurchase agreements if applicable, of 0.16%, 0.11%, 0.09%, 0.24% and 0.07% of average daily net assets for the years ended October 31, 2022, 2021, 2020, 2019 and 2018, respectively. |
| (6) | Includes a reduction by the investment adviser of a portion of the Portfolio’s adviser fee due to the Portfolio’s investment in the Liquidity Fund (equal to less than 0.005% of average daily net assets for the year ended October 31, 2022). |
| | | | |
| | 14 | | See Notes to Financial Statements. |
Eaton Vance
Global Macro Absolute Return Advantage Fund
October 31, 2022
Financial Highlights — continued
| | | | | | | | | | | | | | | | | | | | |
| | | Class R6 | |
| |
| | | Year Ended October 31, | |
| | | 2022 | | | 2021 | | | 2020 | | | 2019 | | | 2018 | |
| | | | | |
Net asset value — Beginning of year | | $ | 10.630 | | | $ | 10.620 | | | $ | 10.410 | | | $ | 9.640 | | | $ | 10.690 | |
| | | | | |
| Income (Loss) From Operations | | | | | | | | | | | | | | | | | | | | |
| | | | | |
Net investment income(1) | | $ | 0.619 | | | $ | 0.567 | | | $ | 0.576 | | | $ | 0.579 | | | $ | 0.534 | |
| | | | | |
Net realized and unrealized gain (loss) | | | (1.104 | ) | | | 0.057 | | | | 0.079 | | | | 0.207 | | | | (1.245 | ) |
| | | | | |
Total income (loss) from operations | | $ | (0.485 | ) | | $ | 0.624 | | | $ | 0.655 | | | $ | 0.786 | | | $ | (0.711 | ) |
| | | | | |
| Less Distributions | | | | | | | | | | | | | | | | | | | | |
| | | | | |
From net investment income | | $ | (0.515 | ) | | $ | (0.614 | ) | | $ | (0.445 | ) | | $ | (0.016 | ) | | $ | (0.339 | ) |
| | | | | |
Total distributions | | $ | (0.515 | ) | | $ | (0.614 | ) | | $ | (0.445 | ) | | $ | (0.016 | ) | | $ | (0.339 | ) |
| | | | | |
Net asset value — End of year | | $ | 9.630 | | | $ | 10.630 | | | $ | 10.620 | | | $ | 10.410 | | | $ | 9.640 | |
| | | | | |
Total Return(2)(3) | | | (4.84 | )% | | | 5.94 | % | | | 6.56 | % | | | 8.07 | % | | | (6.88 | )% |
| | | | | |
| Ratios/Supplemental Data | | | | | | | | | | | | | | | | | | | | |
| | | | | |
Net assets, end of year (000’s omitted) | | $ | 553,393 | | | $ | 637,812 | | | $ | 699,477 | | | $ | 140,294 | | | $ | 173,234 | |
| | | | | |
Ratios (as a percentage of average daily net assets):(4) | | | | | | | | | | | | | | | | | | | | |
| | | | | |
Expenses(3)(5) | | | 1.18 | %(6) | | | 1.13 | % | | | 1.11 | % | | | 1.26 | % | | | 1.10 | % |
| | | | | |
Net investment income | | | 6.20 | % | | | 5.36 | % | | | 5.53 | % | | | 5.86 | % | | | 5.30 | % |
| | | | | |
Portfolio Turnover of the Portfolio | | | 94 | % | | | 82 | % | | | 80 | % | | | 71 | % | | | 75 | % |
| (1) | Computed using average shares outstanding. |
| (2) | Returns are historical and are calculated by determining the percentage change in net asset value with all distributions reinvested. |
| (3) | The investment adviser and administrator of the Fund and/or the investment adviser of the Portfolio reimbursed certain operating expenses (equal to 0.11%, 0.11%, 0.15%, 0.18% and 0.10% of average daily net assets for the years ended October 31, 2022, 2021, 2020, 2019 and 2018, respectively). Absent this reimbursement, total return would be lower. |
| (4) | Includes the Fund’s share of the Portfolio’s allocated expenses. |
| (5) | Includes interest and/or dividend expense, including on securities sold short and/or reverse repurchase agreements if applicable, of 0.16%, 0.11%, 0.09%, 0.24% and 0.08% of average daily net assets for the years ended October 31, 2022, 2021, 2020, 2019 and 2018, respectively. |
| (6) | Includes a reduction by the investment adviser of a portion of the Portfolio’s adviser fee due to the Portfolio’s investment in the Liquidity Fund (equal to less than 0.005% of average daily net assets for the year ended October 31, 2022). |
| | | | |
| | 15 | | See Notes to Financial Statements. |
Eaton Vance
Global Macro Absolute Return Advantage Fund
October 31, 2022
Notes to Financial Statements
1 Significant Accounting Policies
Eaton Vance Global Macro Absolute Return Advantage Fund (the Fund) is a non-diversified series of Eaton Vance Mutual Funds Trust (the Trust). The Trust is a Massachusetts business trust registered under the Investment Company Act of 1940, as amended (the 1940 Act), as an open-end management investment company. The Fund offers five classes of shares. Class A shares are generally sold subject to a sales charge imposed at time of purchase. Class C shares are sold at net asset value and are generally subject to a contingent deferred sales charge (see Note 5). Effective November 5, 2020, Class C shares automatically convert to Class A shares eight years after their purchase as described in the Fund’s prospectus. Class I, Class R and Class R6 shares are sold at net asset value and are not subject to a sales charge. Each class represents a pro-rata interest in the Fund, but votes separately on class-specific matters and (as noted below) is subject to different expenses. Realized and unrealized gains and losses and net investment income and losses, other than class-specific expenses, are allocated daily to each class of shares based on the relative net assets of each class to the total net assets of the Fund. Sub-accounting, recordkeeping and similar administrative fees payable to financial intermediaries, which are a component of transfer and dividend disbursing agent fees on the Statement of Operations, are not allocated to Class R6 shares. Each class of shares differs in its distribution plan and certain other class-specific expenses. The Fund invests all of its assets in interests of Global Macro Absolute Return Advantage Portfolio (the Portfolio), a Massachusetts business trust, having the same investment objective and policies as the Fund. The value of the Fund’s investment in the Portfolio reflects the Fund’s proportionate interest in the net assets of the Portfolio (78.3% at October 31, 2022). The performance of the Fund is directly affected by the performance of the Portfolio. The consolidated financial statements of the Portfolio, including the consolidated portfolio of investments, are included elsewhere in this report and should be read in conjunction with the Fund’s financial statements.
The following is a summary of significant accounting policies of the Fund. The policies are in conformity with accounting principles generally accepted in the United States of America (U.S. GAAP). The Fund is an investment company and follows accounting and reporting guidance in the Financial Accounting Standards Board (FASB) Accounting Standards Codification Topic 946.
A Investment Valuation — Valuation of securities by the Portfolio is discussed in Note 1A of the Portfolio’s Notes to Consolidated Financial Statements, which are included elsewhere in this report.
B Income — The Fund’s net investment income or loss consists of the Fund’s pro-rata share of the net investment income or loss of the Portfolio, less all actual and accrued expenses of the Fund.
C Federal and Other Taxes — The Fund’s policy is to comply with the provisions of the Internal Revenue Code applicable to regulated investment companies and to distribute to shareholders each year substantially all of its net investment income, and all or substantially all of its net realized capital gains. Accordingly, no provision for federal income or excise tax is necessary.
In addition to the requirements of the Internal Revenue Code, the Fund may also be required to recognize its pro-rata share of the capital gains taxes incurred by the Portfolio. In doing so, the daily net asset value would reflect the Fund’s pro-rata share of the estimated reserve for such taxes incurred by the Portfolio.
As of October 31, 2022, the Fund had no uncertain tax positions that would require financial statement recognition, de-recognition, or disclosure. The Fund files a U.S. federal income tax return annually after its fiscal year-end, which is subject to examination by the Internal Revenue Service for a period of three years from the date of filing.
D Expenses — The majority of expenses of the Trust are directly identifiable to an individual fund. Expenses which are not readily identifiable to a specific fund are allocated taking into consideration, among other things, the nature and type of expense and the relative size of the funds.
E Use of Estimates — The preparation of the financial statements in conformity with U.S. GAAP requires management to make estimates and assumptions that affect the reported amounts of assets and liabilities at the date of the financial statements and the reported amounts of income and expense during the reporting period. Actual results could differ from those estimates.
F Indemnifications — Under the Trust’s organizational documents, its officers and Trustees may be indemnified against certain liabilities and expenses arising out of the performance of their duties to the Fund. Under Massachusetts law, if certain conditions prevail, shareholders of a Massachusetts business trust (such as the Trust) could be deemed to have personal liability for the obligations of the Trust. However, the Trust’s Declaration of Trust contains an express disclaimer of liability on the part of Fund shareholders and the By-laws provide that the Trust shall assume, upon request by the shareholder, the defense on behalf of any Fund shareholders. Moreover, the By-laws also provide for indemnification out of Fund property of any shareholder held personally liable solely by reason of being or having been a shareholder for all loss or expense arising from such liability. Additionally, in the normal course of business, the Fund enters into agreements with service providers that may contain indemnification clauses. The Fund’s maximum exposure under these arrangements is unknown as this would involve future claims that may be made against the Fund that have not yet occurred.
G Other — Investment transactions are accounted for on a trade date basis.
Eaton Vance
Global Macro Absolute Return Advantage Fund
October 31, 2022
Notes to Financial Statements — continued
2 Distributions to Shareholders and Income Tax Information
It is the present policy of the Fund to make at least one distribution annually (normally in December) of all or substantially all of its net investment income and to distribute annually all or substantially all of its net realized capital gains. Distributions to shareholders are recorded on the ex-dividend date. Distributions are declared separately for each class of shares. Shareholders may reinvest income and capital gain distributions in additional shares of the same class of the Fund at the net asset value as of the ex-dividend date or, at the election of the shareholder, receive distributions in cash. Distributions to shareholders are determined in accordance with income tax regulations, which may differ from U.S. GAAP. As required by U.S. GAAP, only distributions in excess of tax basis earnings and profits are reported in the financial statements as a return of capital. Permanent differences between book and tax accounting relating to distributions are reclassified to paid-in capital. For tax purposes, distributions from short-term capital gains are considered to be from ordinary income.
The tax character of distributions declared for the years ended October 31, 2022 and October 31, 2021 was as follows:
| | | | | | | | |
| | | Year Ended October 31, | |
| | | 2022 | | | 2021 | |
| | |
Ordinary income | | $ | 97,802,769 | | | $ | 155,268,649 | |
During the year ended October 31, 2022, accumulated loss was increased by $17,855,430 and paid-in capital was increased by $17,855,430 due to the Fund’s use of equalization accounting. Tax equalization accounting allows the Fund to treat as a distribution that portion of redemption proceeds representing a redeeming shareholder’s portion of undistributed taxable income and net capital gains. These reclassifications had no effect on the net assets or net asset value per share of the Fund.
As of October 31, 2022, the components of distributable earnings (accumulated loss) on a tax basis were as follows:
| | | | |
| | |
Undistributed ordinary income | | $ | 55,663,112 | |
| |
Deferred capital losses | | | (55,356,654 | ) |
| |
Net unrealized depreciation | | | (393,026,195 | ) |
| |
Accumulated loss | | $ | (392,719,737 | ) |
At October 31, 2022, the Fund, for federal income tax purposes, had deferred capital losses of $55,356,654 which would reduce its taxable income arising from future net realized gains on investment transactions, if any, to the extent permitted by the Internal Revenue Code, and thus would reduce the amount of distributions to shareholders, which would otherwise be necessary to relieve the Fund of any liability for federal income or excise tax. The deferred capital losses are treated as arising on the first day of the Fund’s next taxable year and retain the same short-term or long-term character as when originally deferred. Of the deferred capital losses at October 31, 2022, $10,365,884 are short-term and $44,990,770 are long-term.
3 Investment Adviser and Administration Fee and Other Transactions with Affiliates
The investment adviser and administration fee is earned by Eaton Vance Management (EVM), an indirect, wholly-owned subsidiary of Morgan Stanley, as compensation for investment advisory and administrative services rendered to the Fund. The investment adviser and administration fee is computed at an annual rate as a percentage of the Fund’s average daily net assets that are not invested in other investment companies for which EVM or its affiliates serve as investment adviser and receive an advisory fee as follows and is payable monthly:
| | | | |
| Average Daily Net Assets | | Annual Fee Rate | |
| |
Up to $500 million | | | 1.000 | % |
| |
$500 million but less than $1 billion | | | 0.950 | % |
| |
$1 billion but less than $2.5 billion | | | 0.925 | % |
| |
$2.5 billion but less than $5 billion | | | 0.900 | % |
| |
$5 billion and over | | | 0.880 | % |
For the year ended October 31, 2022, the Fund incurred no investment adviser and administration fee on such assets. Pursuant to an investment sub-advisory agreement effective March 16, 2022, EVM has delegated a portion of the investment management of the Fund to Eaton Vance Advisers International Ltd. (EVAIL), an affiliate of EVM and an indirect, wholly-owned subsidiary of Morgan Stanley. EVAIL uses the portfolio management, research and other resources of its affiliate, MSIM Fund Management (Ireland) Limited (MSIM FMIL), to render investment advisory services to the Fund. MSIM FMIL has entered into a Memorandum of Understanding with EVAIL pursuant to which MSIM FMIL is considered a participating affiliate of the sub-adviser as that term is used in relief granted by the staff of the U.S. Securities and Exchange Commission allowing U.S. registered investment advisers to use portfolio management or research resources of unregistered advisory affiliates subject to the supervision of a U.S. registered adviser. EVM pays EVAIL a
Eaton Vance
Global Macro Absolute Return Advantage Fund
October 31, 2022
Notes to Financial Statements — continued
portion of its investment adviser and administration fee for sub-advisory services provided to the Fund. To the extent the Fund’s assets are invested in the Portfolio, the Fund is allocated its share of the Portfolio’s investment adviser fee. The Portfolio has engaged Boston Management and Research (BMR) to render investment advisory services. See Note 2 of the Portfolio’s Notes to Consolidated Financial Statements which are included elsewhere in this report.
EVM has agreed to reimburse the Fund’s expenses to the extent that total annual operating expenses (relating to ordinary operating expenses only and excluding such expenses as borrowing costs, taxes or litigation expenses) exceed 1.35%, 2.05%, 1.05%, 1.55% and 1.02% of the Fund’s average daily net assets for Class A, Class C, Class I, Class R and Class R6, respectively. This agreement may be changed or terminated after February 28, 2023. Pursuant to this agreement, EVM was allocated $1,771,456 of the Fund’s operating expenses for the year ended October 31, 2022.
EVM provides sub-transfer agency and related services to the Fund pursuant to a Sub-Transfer Agency Support Services Agreement. For the year ended October 31, 2022, EVM earned $76,343 from the Fund pursuant to such agreement, which is included in transfer and dividend disbursing agent fees on the Statement of Operations. The Fund was informed that Eaton Vance Distributors, Inc. (EVD), an affiliate of EVM and the Fund’s principal underwriter, received $2,624 as its portion of the sales charge on sales of Class A shares for the year ended October 31, 2022. EVD also received distribution and service fees from Class A, Class C and Class R shares (see Note 4) and contingent deferred sales charges (see Note 5).
Trustees and officers of the Fund who are members of EVM’s or BMR’s organizations receive remuneration for their services to the Fund out of the investment adviser fee. Certain officers and Trustees of the Fund and the Portfolio are officers of the above organizations.
4 Distribution Plans
The Fund has in effect a distribution plan for Class A shares (Class A Plan) pursuant to Rule 12b-1 under the 1940 Act. Pursuant to the Class A Plan, the Fund pays EVD a distribution and service fee of 0.30% per annum of its average daily net assets attributable to Class A shares for distribution services and facilities provided to the Fund by EVD, as well as for personal services and/or the maintenance of shareholder accounts. Distribution and service fees paid or accrued to EVD for the year ended October 31, 2022 amounted to $990,119 for Class A shares.
The Fund also has in effect distribution plans for Class C shares (Class C Plan) and Class R shares (Class R Plan) pursuant to Rule 12b-1 under the 1940 Act. Pursuant to the Class C Plan, the Fund pays EVD amounts equal to 0.75% per annum of its average daily net assets attributable to Class C shares for providing ongoing distribution services and facilities to the Fund. For the year ended October 31, 2022, the Fund paid or accrued to EVD $93,332 for Class C shares. The Class R Plan requires the Fund to pay EVD an amount up to 0.50% per annum of its average daily net assets attributable to Class R shares for providing ongoing distribution services and facilities to the Fund. The Trustees of the Trust have currently limited Class R distribution payments to 0.25% per annum of the average daily net assets attributable to Class R shares. For the year ended October 31, 2022, the Fund paid or accrued to EVD $3,370 for Class R shares.
Pursuant to the Class C and Class R Plans, the Fund also makes payments of service fees to EVD, financial intermediaries and other persons in amounts equal to 0.25% per annum of its average daily net assets attributable to that class. Service fees paid or accrued are for personal services and/or the maintenance of shareholder accounts. They are separate and distinct from the sales commissions and distribution fees payable to EVD. Service fees paid or accrued for the year ended October 31, 2022 amounted to $31,111 and $3,370 for Class C and Class R shares, respectively.
Distribution and service fees are subject to the limitations contained in the Financial Industry Regulatory Authority Rule 2341(d).
5 Contingent Deferred Sales Charges
A contingent deferred sales charge (CDSC) of 1% generally is imposed on redemptions of Class C shares made within 12 months of purchase. Class A shares may be subject to a 0.75% (1% prior to April 29, 2022) CDSC if redeemed within 12 months (18 months prior to April 29, 2022) of purchase (depending on the circumstances of purchase). Generally, the CDSC is based upon the lower of the net asset value at date of redemption or date of purchase. No charge is levied on shares acquired by reinvestment of dividends or capital gain distributions. For the year ended October 31, 2022, the Fund was informed that EVD received approximately $500 of CDSCs paid by Class C shareholders and no CDSCs paid by Class A shareholders.
6 Investment Transactions
For the year ended October 31, 2022, increases and decreases in the Fund’s investment in the Portfolio aggregated $228,044,410 and $791,453,898, respectively.
Eaton Vance
Global Macro Absolute Return Advantage Fund
October 31, 2022
Notes to Financial Statements — continued
7 Shares of Beneficial Interest
The Fund’s Declaration of Trust permits the Trustees to issue an unlimited number of full and fractional shares of beneficial interest (without par value). Such shares may be issued in a number of different series (such as the Fund) and classes. Transactions in Fund shares, including direct exchanges pursuant to share class conversions for all periods presented, were as follows:
| | | | | | | | | | | | | | | | |
| | | Year Ended
October 31, 2022 | | | Year Ended
October 31, 2021 | |
| | | Shares | | | Amount | | | Shares | | | Amount | |
| | | | |
Class A | | | | | | | | | | | | | | | | |
| | | | |
Sales | | | 15,388,094 | | | $ | 147,798,597 | | | | 24,515,331 | | | $ | 254,902,936 | |
| | | | |
Issued to shareholders electing to receive payments of distributions in Fund shares | | | 2,781,624 | | | | 28,094,404 | | | | 4,018,137 | | | | 41,025,183 | |
| | | | |
Redemptions | | | (66,895,264 | ) | | | (661,490,807 | ) | | | (36,395,330 | ) | | | (380,943,414 | ) |
| | | | |
Net decrease | | | (48,725,546 | ) | | $ | (485,597,806 | ) | | | (7,861,862 | ) | | $ | (85,015,295 | ) |
| | | | |
Class C | | | | | | | | | | | | | | | | |
| | | | |
Sales | | | 122,116 | | | $ | 1,179,889 | | | | 126,078 | | | $ | 1,282,209 | |
| | | | |
Issued to shareholders electing to receive payments of distributions in Fund shares | | | 50,650 | | | | 500,931 | | | | 74,381 | | | | 743,814 | |
| | | | |
Redemptions | | | (368,782 | ) | | | (3,538,495 | ) | | | (882,122 | ) | | | (9,010,526 | ) |
| | | | |
Net decrease | | | (196,016 | ) | | $ | (1,857,675 | ) | | | (681,663 | ) | | $ | (6,984,503 | ) |
| | | | |
Class I | | | | | | | | | | | | | | | | |
| | | | |
Sales | | | 45,214,100 | | | $ | 450,703,862 | | | | 31,282,867 | | | $ | 329,681,750 | |
| | | | |
Issued to shareholders electing to receive payments of distributions in Fund shares | | | 3,499,514 | | | | 35,835,019 | | | | 5,345,504 | | | | 55,272,515 | |
| | | | |
Redemptions | | | (44,160,394 | ) | | | (436,190,292 | ) | | | (79,752,936 | ) | | | (843,331,694 | ) |
| | | | |
Net increase (decrease) | | | 4,553,220 | | | $ | 50,348,589 | | | | (43,124,565 | ) | | $ | (458,377,429 | ) |
| | | | |
Class R | | | | | | | | | | | | | | | | |
| | | | |
Sales | | | 26,070 | | | $ | 249,901 | | | | 23,741 | | | $ | 243,953 | |
| | | | |
Issued to shareholders electing to receive payments of distributions in Fund shares | | | 6,082 | | | | 60,698 | | | | 6,922 | | | | 69,913 | |
| | | | |
Redemptions | | | (24,426 | ) | | | (234,521 | ) | | | (41,015 | ) | | | (424,888 | ) |
| | | | |
Net increase (decrease) | | | 7,726 | | | $ | 76,078 | | | | (10,352 | ) | | $ | (111,022 | ) |
| | | | |
Class R6 | | | | | | | | | | | | | | | | |
| | | | |
Sales | | | 16,341,304 | | | $ | 158,889,083 | | | | 39,296,680 | | | $ | 417,048,516 | |
| | | | |
Issued to shareholders electing to receive payments of distributions in Fund shares | | | 1,028,651 | | | | 10,523,095 | | | | 1,466,855 | | | | 15,181,951 | |
| | | | |
Redemptions | | | (19,941,518 | ) | | | (198,282,910 | ) | | | (46,594,746 | ) | | | (492,419,815 | ) |
| | | | |
Net decrease | | | (2,571,563 | ) | | $ | (28,870,732 | ) | | | (5,831,211 | ) | | $ | (60,189,348 | ) |
Eaton Vance
Global Macro Absolute Return Advantage Fund
October 31, 2022
Report of Independent Registered Public Accounting Firm
To the Trustees of Eaton Vance Mutual Funds Trust and Shareholders of Eaton Vance Global Macro Absolute Return Advantage Fund:
Opinion on the Financial Statements and Financial Highlights
We have audited the accompanying statement of assets and liabilities of Eaton Vance Global Macro Absolute Return Advantage Fund (the “Fund”) (one of the funds constituting Eaton Vance Mutual Funds Trust), as of October 31, 2022, the related statement of operations for the year then ended, the statements of changes in net assets for each of the two years in the period then ended, the financial highlights for each of the five years in the period then ended, and the related notes. In our opinion, the financial statements and financial highlights present fairly, in all material respects, the financial position of the Fund as of October 31, 2022, and the results of its operations for the year then ended, the changes in its net assets for each of the two years in the period then ended, and the financial highlights for each of the five years in the period then ended, in conformity with accounting principles generally accepted in the United States of America.
Basis for Opinion
These financial statements and financial highlights are the responsibility of the Fund’s management. Our responsibility is to express an opinion on the Fund’s financial statements and financial highlights based on our audits. We are a public accounting firm registered with the Public Company Accounting Oversight Board (United States) (PCAOB) and are required to be independent with respect to the Fund in accordance with the U.S. federal securities laws and the applicable rules and regulations of the Securities and Exchange Commission and the PCAOB.
We conducted our audits in accordance with the standards of the PCAOB. Those standards require that we plan and perform the audit to obtain reasonable assurance about whether the financial statements and financial highlights are free of material misstatement, whether due to error or fraud. The Fund is not required to have, nor were we engaged to perform, an audit of its internal control over financial reporting. As part of our audits, we are required to obtain an understanding of internal control over financial reporting but not for the purpose of expressing an opinion on the effectiveness of the Fund’s internal control over financial reporting. Accordingly, we express no such opinion.
Our audits included performing procedures to assess the risks of material misstatement of the financial statements and financial highlights, whether due to error or fraud, and performing procedures that respond to those risks. Such procedures included examining, on a test basis, evidence regarding the amounts and disclosures in the financial statements and financial highlights. Our audits also included evaluating the accounting principles used and significant estimates made by management, as well as evaluating the overall presentation of the financial statements and financial highlights. We believe that our audits provide a reasonable basis for our opinion.
/s/ Deloitte & Touche LLP
Boston, Massachusetts
December 29, 2022
We have served as the auditor of one or more Eaton Vance investment companies since 1959.
Eaton Vance
Global Macro Absolute Return Advantage Fund
October 31, 2022
Federal Tax Information (Unaudited)
The Form 1099-DIV you receive in February 2023 will show the tax status of all distributions paid to your account in calendar year 2022. Shareholders are advised to consult their own tax adviser with respect to the tax consequences of their investment in the Fund. As required by the Internal Revenue Code and/or regulations, shareholders must be notified regarding the status of qualified dividend income for individuals, the foreign tax credit and 163(j) interest dividends.
Qualified Dividend Income. For the fiscal year ended October 31, 2022, the Fund designates approximately $1,489,505, or up to the maximum amount of such dividends allowable pursuant to the Internal Revenue Code, as qualified dividend income eligible for the reduced tax rate of 15%.
Foreign Tax Credit. For the fiscal year ended October 31, 2022, the Fund paid foreign taxes of $218,829 and recognized foreign source income of $86,517,982.
163(j) Interest Dividends. For the fiscal year ended October 31, 2022, the Fund designates 15.31% of distributions from net investment income as a 163(j) interest dividend.
Global Macro Absolute Return Advantage Portfolio
October 31, 2022
Consolidated Portfolio of Investments
| | | | | | | | | | |
| Asset-Backed Securities — 2.3% | |
| Security | | | | Principal Amount (000’s omitted) | | | Value | |
| | | |
Unison Trust, Series 2021-1, Class A, 4.50%, 4/25/50(1)(2) | | | | $ | 48,045 | | | $ | 43,927,324 | |
| |
Total Asset-Backed Securities
(identified cost $47,355,203) | | | $ | 43,927,324 | |
|
| Collateralized Mortgage Obligations — 2.2% | |
| Security | | | | Principal Amount (000’s omitted) | | | Value | |
| | | |
| Federal Home Loan Mortgage Corp.: | | | | | | | | |
| | | |
| Interest Only:(3) | | | | | | | | |
| | | |
Series 2770, Class SH, 3.688%, (7.10% - 1 mo. USD LIBOR), 3/15/34(4) | | | | $ | 752 | | | $ | 86,478 | |
| | | |
Series 4791, Class JI, 4.00%, 5/15/48 | | | | | 8,123 | | | | 1,614,817 | |
| | | |
Federal Home Loan Mortgage Corp. Structured
Agency Credit Risk Debt Notes: | | | | | | | | |
| | | |
Series 2020-DNA4, Class B1, 9.586%, (1 mo. USD LIBOR + 6.00%), 8/25/50(1)(5) | | | | | 7,326 | | | | 7,704,433 | |
| | | |
Series 2020-HQA4, Class B1, 8.836%, (1 mo. USD LIBOR + 5.25%), 9/25/50(1)(5) | | | | | 3,561 | | | | 3,515,003 | |
| | | |
Series 2022-HQA1, Class B1, 9.997%, (30-day average SOFR + 7.00%), 3/25/42(1)(5) | | | | | 6,303 | | | | 5,940,693 | |
| | | |
Series 2022-HQA1, Class M1B, 6.497%, (30-day average SOFR + 3.50%), 3/25/42(1)(5) | | | | | 2,521 | | | | 2,415,190 | |
| | | |
Series 2022-HQA1, Class M2, 8.247%, (30-day average SOFR + 5.25%), 3/25/42(1)(5) | | | | | 5,043 | | | | 4,742,444 | |
| | | |
| Federal National Mortgage Association: | | | | | | | | |
| | | |
| Interest Only:(3) | | | | | | | | |
| | | |
Series 424, Class C8, 3.50%, 2/25/48 | | | | | 10,284 | | | | 1,852,993 | |
| | | |
Series 2010-109, Class PS, 3.014%, (6.60% -1 mo. USD LIBOR), 10/25/40(4) | | | | | 1,606 | | | | 127,575 | |
| | | |
Series 2018-21, Class IO, 3.00%, 4/25/48 | | | | | 8,924 | | | | 1,667,195 | |
| | | |
Series 2018-58, Class BI, 4.00%, 8/25/48 | | | | | 1,471 | | | | 280,993 | |
| | | |
Federal National Mortgage Association Connecticut
Avenue Securities: | | | | | | | | |
| | | |
Series 2021-R02, Class 2B1, 6.297%, (30-day average SOFR + 3.30%), 11/25/41(1)(5) | | | | | 9,233 | | | | 8,154,033 | |
| | | |
Series 2022-R02, Class 2B2, 10.647%, (30-day average SOFR + 7.65%), 1/25/42(1)(5) | | | | | 4,412 | | | | 4,021,166 | |
| |
Total Collateralized Mortgage Obligations
(identified cost $60,680,189) | | | $ | 42,123,013 | |
|
| Common Stocks — 4.6% | |
| Security | | | | Shares | | | Value | |
|
| Argentina — 0.6% | |
| | | |
Banco Macro S.A. ADR(6) | | | | | 123,900 | | | $ | 1,839,915 | |
| | | | | | | | | | |
| Security | | | | Shares | | | Value | |
|
| Argentina (continued) | |
| | | |
Grupo Financiero Galicia S.A. ADR | | | | | 183,900 | | | $ | 1,427,064 | |
| | | |
IRSA Inversiones y Representaciones S.A. ADR(6) | | | | | 133,500 | | | | 570,045 | |
| | | |
Loma Negra Cia Industrial Argentina S.A. ADR | | | | | 281,200 | | | | 1,895,288 | |
| | | |
Pampa Energia S.A. ADR(6) | | | | | 121,000 | | | | 3,045,570 | |
| | | |
Telecom Argentina S.A. ADR(6) | | | | | 335,800 | | | | 1,400,286 | |
| | | |
Transportadora de Gas del Sur S.A. ADR(6) | | | | | 225,961 | | | | 1,959,082 | |
| |
| | | | $ | 12,137,250 | |
|
| Bulgaria — 0.6% | |
| | | |
Eurohold Bulgaria AD(6) | | | | | 11,358,027 | | | $ | 11,079,927 | |
| |
| | | | $ | 11,079,927 | |
|
| Cyprus — 0.6% | |
| | | |
Bank of Cyprus Holdings PLC(6) | | | | | 8,424,416 | | | $ | 12,085,371 | |
| | | |
Galaxy Cosmos Mezz PLC(6) | | | | | 48,441 | | | | 7,822 | |
| | | |
Sunrisemezz PLC(6) | | | | | 272,828 | | | | 22,082 | |
| |
| | | | $ | 12,115,275 | |
|
| Egypt — 0.0%(7) | |
| | | |
Taaleem Management Services Co. SAE(6) | | | | | 2,678,490 | | | $ | 398,471 | |
| |
| | | | $ | 398,471 | |
|
| Greece — 1.0% | |
| | | |
Alpha Services and Holdings S.A.(6) | | | | | 1,307,900 | | | $ | 1,211,239 | |
| | | |
Eurobank Ergasias Services and Holdings S.A.(6) | | | | | 2,207,700 | | | | 2,179,446 | |
| | | |
Hellenic Telecommunications Organization S.A. | | | | | 227,300 | | | | 3,569,643 | |
| | | |
JUMBO S.A. | | | | | 145,300 | | | | 2,063,780 | |
| | | |
Motor Oil (Hellas) Corinth Refineries S.A. | | | | | 78,100 | | | | 1,342,306 | |
| | | |
Mytilineos S.A. | | | | | 102,500 | | | | 1,718,742 | |
| | | |
National Bank of Greece S.A.(6) | | | | | 460,300 | | | | 1,667,793 | |
| | | |
OPAP S.A. | | | | | 161,100 | | | | 1,973,981 | |
| | | |
Piraeus Financial Holdings S.A.(6) | | | | | 1,909,800 | | | | 2,354,403 | |
| | | |
Public Power Corp. S.A.(6) | | | | | 132,900 | | | | 838,887 | |
| | | |
Titan Cement International S.A. | | | | | 6,605 | | | | 73,813 | |
| |
| | | | $ | 18,994,033 | |
|
| Iceland — 0.4% | |
| | | |
Arion Banki HF(1) | | | | | 1,970,378 | | | $ | 2,206,011 | |
| | | |
Eik Fasteignafelag HF | | | | | 6,056,328 | | | | 546,861 | |
| | | |
Eimskipafelag Islands HF | | | | | 493,527 | | | | 1,869,628 | |
| | | |
Hagar HF | | | | | 1,926,423 | | | | 962,176 | |
| | | |
Islandsbanki HF | | | | | 1,104,783 | | | | 979,657 | |
| | | |
Reginn HF | | | | | 2,864,793 | | | | 576,788 | |
| | | | |
| | 22 | | See Notes to Consolidated Financial Statements. |
Global Macro Absolute Return Advantage Portfolio
October 31, 2022
Consolidated Portfolio of Investments — continued
| | | | | | | | | | |
| Security | | | | Shares | | | Value | |
|
| Iceland (continued) | |
| | | |
Reitir Fasteignafelag HF | | | | | 1,754,792 | | | $ | 1,118,181 | |
| | | |
Siminn HF | | | | | 8,447,061 | | | | 663,573 | |
| |
| | | | $ | 8,922,875 | |
|
| Indonesia — 0.0%(7) | |
| | | |
Bayan Resources Tbk PT | | | | | 42,800 | | | $ | 201,446 | |
| |
| | | | $ | 201,446 | |
|
| Japan — 0.4% | |
| | | |
Mizuho Financial Group, Inc. | | | | | 172,700 | | | $ | 1,867,830 | |
| | | |
Resona Holdings, Inc. | | | | | 328,000 | | | | 1,236,216 | |
| | | |
SBI Holdings, Inc. | | | | | 36,900 | | | | 666,564 | |
| | | |
Sumitomo Mitsui Financial Group, Inc. | | | | | 66,500 | | | | 1,867,424 | |
| | | |
Tokio Marine Holdings, Inc. | | | | | 108,200 | | | | 1,958,978 | |
| |
| | | | $ | 7,597,012 | |
|
| United Arab Emirates — 0.1% | |
| | | |
Dubai Electricity & Water Authority PJSC | | | | | 2,009,569 | | | $ | 1,335,382 | |
| |
| | | | $ | 1,335,382 | |
|
| United Kingdom — 0.0%(7) | |
| | | |
Tesnik Cuatro, Ltd.(8) | | | | | 584,285 | | | $ | 467,194 | |
| |
| | | | $ | 467,194 | |
|
| Vietnam — 0.9% | |
| | | |
Bank for Foreign Trade of Vietnam JSC | | | | | 371,402 | | | $ | 1,097,518 | |
| | | |
Binh Minh Plastics JSC | | | | | 45,300 | | | | 110,911 | |
| | | |
Coteccons Construction JSC | | | | | 148,570 | | | | 251,243 | |
| | | |
FPT Corp. | | | | | 1,176,500 | | | | 3,829,756 | |
| | | |
Ho Chi Minh City Infrastructure Investment JSC(6) | | | | | 868,000 | | | | 528,675 | |
| | | |
Hoa Phat Group JSC | | | | | 1,601,821 | | | | 1,007,019 | |
| | | |
KIDO Group Corp. | | | | | 38,090 | | | | 94,198 | |
| | | |
Masan Group Corp. | | | | | 167,040 | | | | 574,259 | |
| | | |
Mobile World Investment Corp. | | | | | 1,116,000 | | | | 2,479,541 | |
| | | |
Phu Nhuan Jewelry JSC | | | | | 357,800 | | | | 1,531,974 | |
| | | |
Refrigeration Electrical Engineering Corp. | | | | | 501,239 | | | | 1,705,019 | |
| | | |
SSI Securities Corp. | | | | | 280,688 | | | | 183,995 | |
| | | |
Vietnam Dairy Products JSC | | | | | 352,996 | | | | 1,114,213 | |
| | | |
Vietnam Prosperity JSC Bank(6) | | | | | 1,332,019 | | | | 937,747 | |
| | | |
Vietnam Technological & Commercial Joint Stock | | | | | | | | | | |
| | | |
Bank(6) | | | | | 666,300 | | | | 705,768 | |
| | | |
Vingroup JSC(6) | | | | | 458,952 | | | | 1,022,588 | |
| |
| | | | $ | 17,174,424 | |
| |
Total Common Stocks
(identified cost $105,290,208) | | | $ | 90,423,289 | |
| | | | | | | | | | | | |
| Convertible Bonds — 0.4% | |
| Security | | | | | Principal
Amount
(000’s omitted) | | | Value | |
|
| Bermuda — 0.2% | |
| | | |
Liberty Latin America, Ltd., 2.00%, 7/15/24 | | | USD | | | | 4,760 | | | $ | 4,239,375 | |
| | | |
| | | | | | | | | | | $ | 4,239,375 | |
| | | |
| India — 0.2% | | | | | | | | | |
| | | |
Indiabulls Housing Finance, Ltd., 4.50%, 9/28/26(9) | | | USD | | | | 4,605 | | | $ | 3,166,513 | |
| | | |
| | | | | | | | | | | $ | 3,166,513 | |
| | | |
Total Convertible Bonds
(identified cost $9,367,085) | | | | | | | | | | $ | 7,405,888 | |
|
| Foreign Corporate Bonds — 7.9% | |
| Security | | | | | Principal
Amount (000’s omitted) | | | Value | |
|
| Argentina — 0.0%(7) | |
| | | |
IRSA Inversiones y Representaciones S.A., 8.75%, 6/22/28(1) | | | USD | | | | 448 | | | $ | 418,159 | |
| | | |
| | | | | | | | | | | $ | 418,159 | |
|
| Armenia — 0.2% | |
| | | |
Ardshinbank CJSC Via Dilijan Finance BV, 6.50%, 1/28/25(9) | | | USD | | | | 5,041 | | | $ | 4,773,777 | |
| | | |
| | | | | | | | | | | $ | 4,773,777 | |
|
| Brazil — 1.1% | |
| | | |
Braskem America Finance Co., 7.125%, 7/22/41(9) | | | USD | | | | 1,778 | | | $ | 1,558,646 | |
| | | |
| Coruripe Netherlands BV: | | | | | | | | | |
| | | |
10.00%, 2/10/27(1) | | | USD | | | | 1,194 | | | | 994,011 | |
| | | |
10.00%, 2/10/27(9) | | | USD | | | | 2,847 | | | | 2,370,143 | |
| | | |
Hidrovias International Finance S.a.r.l., 4.95%, 2/8/31(9) | | | USD | | | | 1,949 | | | | 1,489,781 | |
| | | |
MC Brazil Downstream Trading S.a.r.l., 7.25%, 6/30/31(1) | | | USD | | | | 5,892 | | | | 4,511,740 | |
| | | |
Natura & Co. Luxembourg Holdings S.a.r.l., 6.00%, 4/19/29(1) | | | USD | | | | 1,883 | | | | 1,572,305 | |
| | | |
Natura Cosmeticos S.A., 4.125%, 5/3/28(9) | | | USD | | | | 4,599 | | | | 3,589,520 | |
| | | |
Odebrecht Offshore Drilling Finance, Ltd., 6.72%, 12/1/22(9) | | | USD | | | | 530 | | | | 518,511 | |
| | | |
Petrobras Global Finance BV, 6.90%, 3/19/49 | | | USD | | | | 736 | | | | 609,728 | |
| | | |
Vale S.A., 2.762%(10)(11) | | | BRL | | | | 64,850 | | | | 4,111,575 | |
| | | |
| | | | | | | | | | | $ | 21,325,960 | |
| | | | |
| | 23 | | See Notes to Consolidated Financial Statements. |
Global Macro Absolute Return Advantage Portfolio
October 31, 2022
Consolidated Portfolio of Investments — continued
| | | | | | | | | | | | |
| Security | | | | | Principal
Amount
(000’s omitted) | | | Value | |
|
| Bulgaria — 0.6% | |
| | | |
Bulgarian Energy Holding EAD, 2.45%, 7/22/28(9) | | | EUR | | | | 1,742 | | | $ | 1,250,038 | |
| | | |
Eurohold Bulgaria AD, 6.50%, 12/7/22(9) | | | EUR | | | | 9,718 | | | | 9,581,626 | |
| | | |
| | | | | | | | | | | $ | 10,831,664 | |
|
| Chile — 0.6% | |
| | | |
AES Andes S.A.: | | | | | | | | | | | | |
| | | |
6.35% to 4/7/25, 10/7/79(9)(12) | | | USD | | | | 954 | | | $ | 776,402 | |
| | | |
7.125% to 4/7/24, 3/26/79(9)(12) | | | USD | | | | 1,414 | | | | 1,162,621 | |
| | | |
Latam Airlines Group S.A., 13.375%, 10/15/27(1) | | | USD | | | | 2,840 | | | | 2,795,100 | |
| | | |
Mercury Chile Holdco, LLC, 6.50%, 1/24/27(9) | | | USD | | | | 2,278 | | | | 1,882,881 | |
| | | |
| VTR Comunicaciones SpA: | | | | | | | | | |
| | | |
4.375%, 4/15/29(9) | | | USD | | | | 4,592 | | | | 2,578,844 | |
| | | |
5.125%, 1/15/28(9) | | | USD | | | | 4,579 | | | | 2,919,044 | |
| | | |
| | | | | | | | | | | $ | 12,114,892 | |
|
| China — 0.1% | |
| | | |
KWG Group Holdings, Ltd., 7.875%, 8/30/24 | | | USD | | | | 2,385 | | | $ | 423,246 | |
| | | |
Shimao Group Holdings, Ltd., 5.60%, 7/15/26(9)(13) | | | USD | | | | 7,800 | | | | 411,496 | |
| | | |
Sunac China Holdings, Ltd.: | | | | | | | | | | | | |
| | | |
6.50%, 7/9/23(9)(13) | | | USD | | | | 2,800 | | | | 174,336 | |
| | | |
8.35%, 4/19/23(9)(13) | | | USD | | | | 5,201 | | | | 324,845 | |
| | | |
| Times China Holdings, Ltd.: | | | | | | | | | |
| | | |
5.55%, 6/4/24(9) | | | USD | | | | 6,284 | | | | 558,671 | |
| | | |
6.75%, 7/16/23(9) | | | USD | | | | 4,471 | | | | 534,048 | |
| | | |
| | | | | | | | | | | $ | 2,426,642 | |
|
| Georgia — 0.3% | |
| | | |
| Georgia Capital JSC: | | | | | | | | | |
| | | |
6.125%, 3/9/24(1) | | | USD | | | | 2,580 | | | $ | 2,420,974 | |
| | | |
6.125%, 3/9/24(9) | | | USD | | | | 2,988 | | | | 2,803,826 | |
| | | |
| | | | | | | | | | | $ | 5,224,800 | |
|
| Honduras — 0.1% | |
| | | |
Inversiones Atlantida S.A., 7.50%, 5/19/26(9) | | | USD | | | | 2,687 | | | $ | 2,408,896 | |
| | | |
| | | | | | | | | | | $ | 2,408,896 | |
|
| Iceland — 1.3% | |
| | | |
Arion Banki HF, 6.00%, 4/12/24(9) | | | ISK | | | | 1,720,000 | | | $ | 11,820,144 | |
| | | |
Islandsbanki HF, 6.40%, 10/26/23 | | | ISK | | | | 900,000 | | | | 6,206,682 | |
| | | |
Landsbankinn HF, 5.00%, 11/23/23(9) | | | ISK | | | | 1,020,000 | | | | 6,955,457 | |
| | | |
| WOW Air HF: | | | | | | | | | |
| | | |
0.00%(8)(10)(13) | | | EUR | | | | 121 | | | | 0 | |
| | | |
0.00%, (3 mo. EURIBOR + 9.00%), 9/24/24(8)(13) | | | EUR | | | | 5,500 | | | | 0 | |
| | | |
| | | | | | | | | | | $ | 24,982,283 | |
| | | | | | | | | | | | |
| Security | | | | | Principal
Amount
(000’s omitted) | | | Value | |
|
| India — 0.4% | |
| | | |
JSW Infrastructure, Ltd., 4.95%, 1/21/29(9) | | | USD | | | | 5,576 | | | $ | 4,153,095 | |
| | | |
JSW Steel, Ltd., 5.05%, 4/5/32(9) | | | USD | | | | 2,277 | | | | 1,435,216 | |
| | | |
Vedanta Resources Finance II PLC, 13.875%, 1/21/24(9) | | | USD | | | | 2,214 | | | | 1,855,597 | |
| | | |
| | | | | | | | | | | $ | 7,443,908 | |
|
| Luxembourg — 0.1% | |
| | | |
Gol Finance S.A., 8.00%, 6/30/26(9) | | | USD | | | | 2,020 | | | $ | 1,186,124 | |
| | | |
| | | | | | | | | | | $ | 1,186,124 | |
|
| Mexico — 0.4% | |
| | | |
| Alpha Holding S.A. de CV: | | | | | | | | | |
| | | |
9.00%, 2/10/25(9)(13) | | | USD | | | | 5,879 | | | $ | 88,185 | |
| | | |
10.00%, 12/19/22(9)(13) | | | USD | | | | 2,864 | | | | 42,960 | |
| | | |
Braskem Idesa SAPI, 6.99%, 2/20/32(9) | | | USD | | | | 4,630 | | | | 3,108,096 | |
| | | |
Grupo Kaltex S.A. de CV, 8.875%, 4/11/22(9)(13) | | | USD | | | | 2,297 | | | | 1,412,499 | |
| | | |
Total Play Telecomunicaciones S.A. de CV, 7.50%, 11/12/25(9) | | | USD | | | | 3,170 | | | | 2,686,119 | |
| | | |
Trust Fibra Uno, 4.869%, 1/15/30(9) | | | USD | | | | 1,951 | | | | 1,474,371 | |
| | | |
| | | | | | | | | | | $ | 8,812,230 | |
|
| Moldova — 0.3% | |
| | | |
Aragvi Finance International DAC, 8.45%, 4/29/26(9) | | | USD | | | | 8,981 | | | $ | 6,313,104 | |
| | | |
| | | | | | | | | | | $ | 6,313,104 | |
|
| Morocco — 0.1% | |
| | | |
OCP S.A., 5.125%, 6/23/51(9) | | | USD | | | | 4,051 | | | $ | 2,493,779 | |
| | | |
| | | | | | | | | | | $ | 2,493,779 | |
|
| Nigeria — 0.4% | |
| | | |
IHS Holding, Ltd., 5.625%, 11/29/26(9) | | | USD | | | | 2,750 | | | $ | 2,097,837 | |
| | | |
IHS Netherlands Holdco BV, 8.00%, 9/18/27(9) | | | USD | | | | 1,348 | | | | 1,053,718 | |
| | | |
SEPLAT Petroleum Development Co. PLC, 7.75%, 4/1/26(9) | | | USD | | | | 4,892 | | | | 3,852,695 | |
| | | |
| | | | | | | | | | | $ | 7,004,250 | |
|
| Paraguay — 0.3% | |
| | | |
Frigorifico Concepcion S.A., 7.70%, 7/21/28(1) | | | USD | | | | 7,075 | | | $ | 5,581,963 | |
| | | |
| | | | | | | | | | | $ | 5,581,963 | |
|
| Peru — 0.0%(7) | |
| | | |
PetroTal Corp., 12.00%, 2/16/24(1)(9) | | | USD | | | | 1,012 | | | $ | 1,034,770 | |
| | | |
| | | | | | | | | | | $ | 1,034,770 | |
| | | | |
| | 24 | | See Notes to Consolidated Financial Statements. |
Global Macro Absolute Return Advantage Portfolio
October 31, 2022
Consolidated Portfolio of Investments — continued
| | | | | | | | | | | | |
| Security | | | | | Principal Amount
(000’s omitted) | | | Value | |
|
| Saint Lucia — 0.1% | |
| | | |
Digicel International Finance, Ltd./Digicel International Holdings, Ltd., 8.75%, 5/25/24(9) | | | USD | | | | 1,633 | | | $ | 1,397,268 | |
| | | |
| | | | | | | | | | | $ | 1,397,268 | |
|
| South Africa — 0.3% | |
| | | |
HTA Group, Ltd., 7.00%, 12/18/25(9) | | | USD | | | | 4,493 | | | $ | 3,965,072 | |
| | | |
Petra Diamonds US Treasury PLC, 10.50% PIK, 3/8/26(9)(14) | | | USD | | | | 1,725 | | | | 1,742,722 | |
| | | |
| | | | | | | | | | | $ | 5,707,794 | |
|
| Turkey — 0.3% | |
| | | |
Limak Iskenderun Uluslararasi Liman Isletmeciligi AS, 9.50%, 7/10/36(9) | | | USD | | | | 6,878 | | | $ | 5,492,195 | |
| | | |
| | | | | | | | | | | $ | 5,492,195 | |
|
| Uzbekistan — 0.9% | |
| | | |
Ipoteka-Bank ATIB, 5.50%, 11/19/25(9) | | | USD | | | | 1,336 | | | $ | 1,151,899 | |
| | | |
Nederlandse Financierings-Maatschappij voor Ontwikkelingslanden NV (FMO), 15.00%, 12/8/22 | | | UZS | | | | 177,000,000 | | | | 15,875,737 | |
| | | |
| | | | | | | | | | | $ | 17,027,636 | |
| |
Total Foreign Corporate Bonds
(identified cost $214,639,390) | | | $ | 154,002,094 | |
|
| Loan Participation Notes — 2.2% | |
| Security | | | | | Principal
Amount (000’s omitted) | | | Value | |
|
| Uzbekistan — 2.2% | |
| | | |
Daryo Finance BV (borrower - Uzbek Industrial and Construction Bank ATB), 18.75%, 6/15/23(8)(9)(15) | | | UZS | | | | 294,368,000 | | | $ | 26,358,942 | |
| | | |
Europe Asia Investment Finance BV (borrower - Joint Stock Commercial Bank “Asaka”), 18.70%, 7/26/23(8)(9)(15) | | | UZS | | | | 193,215,665 | | | | 17,287,655 | |
| |
Total Loan Participation Notes
(identified cost $48,926,709) | | | $ | 43,646,597 | |
|
| Reinsurance Side Cars — 1.1% | |
| Security | | | | | Shares | | | Value | |
| | | |
| Eden Re II, Ltd.: | | | | | | | | | |
| | | |
Series 2021A, 0.00%, 3/21/25(1)(8)(16)(17) | | | | | | | 777,005 | | | $ | 594,409 | |
| | | |
Series 2022A, 0.00%, 3/20/26(1)(8)(16)(17) | | | | | | | 2,200,000 | | | | 1,978,020 | |
| | | |
Series 2022B, 0.00%, 3/20/26(1)(8)(16)(17) | | | | | | | 4,900,000 | | | | 4,421,270 | |
| | | | | | | | | | | | |
| Security | | | | | Shares | | | Value | |
| | | |
Mt. Logan Re, Ltd., Series A-1(6)(8)(17)(18) | | | | | | | 8,600 | | | $ | 6,917,664 | |
| | | |
| Sussex Capital, Ltd.: | | | | | | | | | |
| | | |
Designated Investment Series 14(6)(8)(17)(18) | | | | | | | 1,114 | | | | 805,918 | |
| | | |
Series 14, Preference Shares(6)(8)(17)(18) | | | | | | | 7,500 | | | | 5,928,142 | |
| |
Total Reinsurance Side Cars
(identified cost $23,977,005) | | | $ | 20,645,423 | |
|
| Senior Floating-Rate Loans — 0.9%(19) | |
| Borrower/Description | | | | | Principal
Amount (000’s omitted) | | | Value | |
|
| Argentina — 0.0%(7) | |
| | | |
Desa, LLC, Term Loan, 2.50%, 6/30/24(8)(20) | | | | | | $ | 1,204 | | | $ | 608,224 | |
| | | |
| | | | | | | | | | | $ | 608,224 | |
|
| Mexico — 0.9% | |
| | | |
Petroleos Mexicanos, Term Loan, 6.35%, (1 mo. USD LIBOR + 3.00%), 6/28/24 | | | | | | $ | 17,248 | | | $ | 16,644,320 | |
| | | |
| | | | | | | | | | | $ | 16,644,320 | |
| |
Total Senior Floating-Rate Loans
(identified cost $17,860,361) | | | $ | 17,252,544 | |
|
| Sovereign Government Bonds — 45.6% | |
| Security | | | | | Principal
Amount
(000’s omitted) | | | Value | |
|
| Albania — 0.1% | |
| | | |
| Albania Government International Bond: | | | | | | | | | |
| | | |
3.50%, 10/9/25(9) | | | EUR | | | | 1,687 | | | $ | 1,514,697 | |
| | | |
3.50%, 6/16/27(9) | | | EUR | | | | 304 | | | | 264,665 | |
| | | |
3.50%, 11/23/31(9) | | | EUR | | | | 200 | | | | 145,248 | |
| | | |
| | | | | | | | | | | $ | 1,924,610 | |
|
| Argentina — 0.1% | |
| | | |
Provincia de Cordoba, 6.875%, 12/10/25(9)(21) | | | USD | | | | 3,381 | | | $ | 2,586,564 | |
| | | |
| | | | | | | | | | | $ | 2,586,564 | |
|
| Armenia — 0.4% | |
| | | |
| Republic of Armenia: | | | | | | | | | |
| | | |
3.60%, 2/2/31(9) | | | USD | | | | 5,818 | | | $ | 3,996,326 | |
| | | |
3.95%, 9/26/29(9) | | | USD | | | | 4,628 | | | | 3,369,925 | |
| | | |
| | | | | | | | | | | $ | 7,366,251 | |
| | | | |
| | 25 | | See Notes to Consolidated Financial Statements. |
Global Macro Absolute Return Advantage Portfolio
October 31, 2022
Consolidated Portfolio of Investments — continued
| | | | | | | | | | | | |
| Security | | | | | Principal
Amount (000’s omitted) | | | Value | |
|
| Bahrain — 0.8% | |
| | | |
Kingdom of Bahrain, 5.45%, 9/16/32(9) | | | USD | | | | 18,625 | | | $ | 15,074,069 | |
| | | |
| | | | | | | | | | | $ | 15,074,069 | |
|
| Barbados — 2.0% | |
| | | |
Government of Barbados, 6.50%, 10/1/29(9) | | | USD | | | | 43,780 | | | $ | 39,519,220 | |
| | | |
| | | | | | | | | | | $ | 39,519,220 | |
|
| Benin — 1.4% | |
| | | |
| Benin Government International Bond: | | | | | | | | | |
| | | |
4.875%, 1/19/32(9) | | | EUR | | | | 12,386 | | | $ | 8,423,396 | |
| | | |
4.95%, 1/22/35(9) | | | EUR | | | | 4,429 | | | | 2,722,599 | |
| | | |
6.875%, 1/19/52(9) | | | EUR | | | | 26,443 | | | | 16,464,909 | |
| | | |
| | | | | | | | | | | $ | 27,610,904 | |
|
| Colombia — 1.3% | |
| | | |
| Titulos De Tesoreria B: | | | | | | | | | |
| | | |
7.00%, 3/26/31 | | | COP | | | | 104,882,200 | | | $ | 14,254,590 | |
| | | |
7.00%, 6/30/32 | | | COP | | | | 84,791,900 | | | | 11,094,408 | |
| | | |
| | | | | | | | | | | $ | 25,348,998 | |
|
| Costa Rica — 0.6% | |
| | | |
Costa Rica Government Bond, 9.66%, 9/30/26(9) | | | CRC | | | | 7,043,600 | | | $ | 11,499,169 | |
| | | |
| | | | | | | | | | | $ | 11,499,169 | |
|
| Dominican Republic — 3.7% | |
| | | |
| Dominican Republic: | | | | | | | | | |
| | | |
8.00%, 1/15/27(9) | | | DOP | | | | 128,350 | | | $ | 2,013,397 | |
| | | |
8.00%, 2/12/27(9) | | | DOP | | | | 621,240 | | | | 9,688,084 | |
| | | |
9.75%, 6/5/26(9) | | | DOP | | | | 26,150 | | | | 450,361 | |
| | | |
12.00%, 8/8/25(1) | | | DOP | | | | 557,110 | | | | 9,826,801 | |
| | | |
12.75%, 9/23/29(1) | | | DOP | | | | 1,010,500 | | | | 19,069,981 | |
| | | |
13.00%, 6/9/34(9) | | | DOP | | | | 1,334,100 | | | | 24,407,854 | |
| | | |
| Dominican Republic Central Bank Notes: | | | | | | | | | |
| | | |
8.00%, 3/12/27(9) | | | DOP | | | | 46,050 | | | | 686,324 | |
| | | |
12.00%, 10/3/25(1) | | | DOP | | | | 379,500 | | | | 6,681,344 | |
| | | |
| | | | | | | | | | | $ | 72,824,146 | |
|
| Ecuador — 0.6% | |
| | | |
| Republic of Ecuador: | | | | | | | | | |
| | | |
1.50% to 7/31/23, 7/31/40(9)(21) | | | USD | | | | 5,728 | | | $ | 1,633,331 | |
| | | |
1.50% to 7/31/23, 7/31/40(9)(21) | | | USD | | | | 20,787 | | | | 6,941,348 | |
| | | |
5.50% to 7/31/23, 7/31/30(9)(21) | | | USD | | | | 5,470 | | | | 2,931,686 | |
| | | |
| | | | | | | | | | | $ | 11,506,365 | |
| | | | | | | | | | | | |
| Security | | | | | Principal
Amount (000’s omitted) | | | Value | |
|
| Egypt — 1.8% | |
| | | |
| Arab Republic of Egypt: | | | | | | | | | |
| | | |
6.375%, 4/11/31(9) | | | EUR | | | | 11,290 | | | $ | 6,773,431 | |
| | | |
7.50%, 2/16/61(9) | | | USD | | | | 31,114 | | | | 17,454,954 | |
| | | |
7.903%, 2/21/48(9) | | | USD | | | | 4,337 | | | | 2,458,906 | |
| | | |
8.15%, 11/20/59(9) | | | USD | | | | 1,873 | | | | 1,084,268 | |
| | | |
8.70%, 3/1/49(9) | | | USD | | | | 6,386 | | | | 3,820,373 | |
| | | |
8.75%, 9/30/51(9) | | | USD | | | | 2,841 | | | | 1,698,492 | |
| | | |
8.875%, 5/29/50(9) | | | USD | | | | 1,464 | | | | 874,532 | |
| | | |
| | | | | | | | | | | $ | 34,164,956 | |
|
| El Salvador — 1.1% | |
| | | |
Republic of El Salvador: | | | | | | | | | | | | |
| | | |
7.125%, 1/20/50(9) | | | USD | | | | 5,152 | | | $ | 1,808,100 | |
| | | |
7.625%, 2/1/41(9) | | | USD | | | | 2,464 | | | | 881,943 | |
| | | |
7.75%, 1/24/23(9) | | | USD | | | | 21,224 | | | | 19,366,128 | |
| | | |
| | | | | | | | | | | $ | 22,056,171 | |
|
| Ethiopia — 0.4% | |
| | | |
Ethiopia Government International Bond, 6.625%, 12/11/24(9) | | | USD | | | | 13,127 | | | $ | 6,835,360 | |
| | | |
| | | | | | | | | | | $ | 6,835,360 | |
| | | |
| Gabon — 0.9% | | | | | | | | | |
| | | |
Gabon Government International Bond, 6.625%, 2/6/31(9) | | | USD | | | | 24,663 | | | $ | 17,409,612 | |
| | | |
| | | | | | | | | | | $ | 17,409,612 | |
|
| Georgia — 0.2% | |
| | | |
Georgia Government International Bond, 2.75%, 4/22/26(9) | | | USD | | | | 3,773 | | | $ | 3,216,127 | |
| | | |
| | | | | | | | | | | $ | 3,216,127 | |
|
| Honduras — 1.4% | |
| | | |
Honduras Government International Bond: | | | | | | | | | | | | |
| | | |
5.625%, 6/24/30(9) | | | USD | | | | 30,648 | | | $ | 21,044,960 | |
| | | |
6.25%, 1/19/27(9) | | | USD | | | | 7,427 | | | | 5,878,119 | |
| | | |
7.50%, 3/15/24(9) | | | USD | | | | 0 | | | | 79 | |
| | | |
| | | | | | | | | | | $ | 26,923,158 | |
|
| Iceland — 1.4% | |
| | | |
Republic of Iceland: | | | | | | | | | | | | |
| | | |
5.00%, 11/15/28 | | | ISK | | | | 2,319,313 | | | $ | 15,026,230 | |
| | | |
6.50%, 1/24/31 | | | ISK | | | | 1,273,622 | | | | 8,937,444 | |
| | | | |
| | 26 | | See Notes to Consolidated Financial Statements. |
Global Macro Absolute Return Advantage Portfolio
October 31, 2022
Consolidated Portfolio of Investments — continued
| | | | | | | | | | | | |
| Security | | | | | Principal
Amount (000’s omitted) | | | Value | |
|
| Iceland (continued) | |
| | | |
Republic of Iceland: (continued) | | | | | | | | | | | | |
| | | |
8.00%, 6/12/25 | | | ISK | | | | 323,582 | | | $ | 2,317,550 | |
| | | |
| | | | | | | | | | | $ | 26,281,224 | |
|
| Indonesia — 0.3% | |
| | | |
Indonesia Government International Bond, 4.65%, 9/20/32 | | | USD | | | | 5,525 | | | $ | 5,125,215 | |
| | | |
| | | | | | | | | | | $ | 5,125,215 | |
|
| Iraq — 2.1% | |
| | | |
Republic of Iraq: | | | | | | | | | | | | |
| | | |
5.80%, 1/15/28(9) | | | USD | | | | 39,716 | | | $ | 33,899,394 | |
| | | |
6.752%, 3/9/23(9) | | | USD | | | | 6,856 | | | | 6,766,118 | |
| | | |
| | | | | | | | | | | $ | 40,665,512 | |
|
| Ivory Coast — 0.1% | |
| | | |
| Ivory Coast Government International Bond: | | | | | | | | | |
| | | |
5.25%, 3/22/30(9) | | | EUR | | | | 1,851 | | | $ | 1,404,333 | |
| | | |
6.625%, 3/22/48(9) | | | EUR | | | | 1,417 | | | | 891,603 | |
| | | |
| | | | | | | | | | | $ | 2,295,936 | |
|
| Jordan — 0.6% | |
| | | |
Kingdom of Jordan: | | | | | | | | | | | | |
| | | |
5.85%, 7/7/30(9) | | | USD | | | | 1,433 | | | $ | 1,191,210 | |
| | | |
7.375%, 10/10/47(9) | | | USD | | | | 13,405 | | | | 10,098,442 | |
| | | |
| | | | | | | | | | | $ | 11,289,652 | |
|
| Lebanon — 0.4% | |
| | | |
| Lebanese Republic: | | | | | | | | | |
| | | |
5.80%, 4/14/20(9)(13) | | | USD | | | | 332 | | | $ | 20,743 | |
| | | |
6.00%, 1/27/23(9)(13) | | | USD | | | | 1,485 | | | | 93,169 | |
| | | |
6.10%, 10/4/22(9)(13) | | | USD | | | | 5,684 | | | | 362,355 | |
| | | |
6.15%, 6/19/20(13) | | | USD | | | | 442 | | | | 26,905 | |
| | | |
6.20%, 2/26/25(9)(13) | | | USD | | | | 440 | | | | 27,687 | |
| | | |
6.25%, 5/27/22(13) | | | USD | | | | 740 | | | | 47,175 | |
| | | |
6.25%, 11/4/24(9)(13) | | | USD | | | | 11,108 | | | | 701,248 | |
| | | |
6.25%, 6/12/25(9)(13) | | | USD | | | | 7,800 | | | | 493,974 | |
| | | |
6.375%, 3/9/20(13) | | | USD | | | | 6,504 | | | | 402,858 | |
| | | |
6.40%, 5/26/23(13) | | | USD | | | | 11,020 | | | | 698,778 | |
| | | |
6.65%, 4/22/24(9)(13) | | | USD | | | | 13,568 | | | | 857,245 | |
| | | |
6.65%, 11/3/28(9)(13) | | | USD | | | | 2,923 | | | | 184,588 | |
| | | |
6.85%, 5/25/29(13) | | | USD | | | | 9,378 | | | | 593,721 | |
| | | |
7.00%, 12/3/24(13) | | | USD | | | | 4,878 | | | | 308,631 | |
| | | |
7.00%, 3/20/28(9)(13) | | | USD | | | | 13,884 | | | | 865,334 | |
| | | | | | | | | | | | |
| Security | | | | | Principal
Amount (000’s omitted) | | | Value | |
|
| Lebanon (continued) | |
| | | |
| Lebanese Republic: (continued) | | | | | | | | | |
| | | |
7.15%, 11/20/31(9)(13) | | | USD | | | | 12,224 | | | $ | 757,032 | |
| | | |
8.20%, 5/17/33(13) | | | USD | | | | 4,223 | | | | 263,135 | |
| | | |
8.25%, 4/12/21(9)(13) | | | USD | | | | 2,352 | | | | 149,940 | |
| | | |
8.25%, 5/17/34(13) | | | USD | | | | 3,507 | | | | 210,420 | |
| | | |
| | | | | | | | | | | $ | 7,064,938 | |
|
| Macedonia — 1.0% | |
| | | |
North Macedonia Government International Bond: | | | | | | | | | | | | |
| | | |
1.625%, 3/10/28(9) | | | EUR | | | | 21,305 | | | $ | 15,920,692 | |
| | | |
3.675%, 6/3/26(9) | | | EUR | | | | 3,970 | | | | 3,492,842 | |
| | | |
| | | | | | | | | | | $ | 19,413,534 | |
|
| Mozambique — 0.5% | |
| | | |
Mozambique Government International Bond, 5.00% to 9/15/23, 9/15/31(9)(21) | | | USD | | | | 15,512 | | | $ | 10,613,000 | |
| | | |
| | | | | | | | | | | $ | 10,613,000 | |
|
| New Zealand — 1.1% | |
| | | |
New Zealand Government Bond, 2.50%, 9/20/40(9)(22) | | | NZD | | | | 35,121 | | | $ | 20,442,663 | |
| | | |
| | | | | | | | | | | $ | 20,442,663 | |
|
| Oman — 0.1% | |
| | | |
Oman Government International Bond, 6.75%, 1/17/48(9) | | | USD | | | | 2,149 | | | $ | 1,811,717 | |
| | | |
| | | | | | | | | | | $ | 1,811,717 | |
|
| Pakistan — 0.4% | |
| | | |
| Pakistan Government International Bond: | | | | | | | | | |
| | | |
6.00%, 4/8/26(9) | | | USD | | | | 5,376 | | | $ | 1,787,520 | |
| | | |
8.875%, 4/8/51(9) | | | USD | | | | 8,076 | | | | 2,536,874 | |
| | | |
| Third Pakistan International Sukuk Co., Ltd. (The), | | | | | | | | | |
| | | |
5.625%, 12/5/22(9) | | | USD | | | | 2,847 | | | | 2,599,197 | |
| | | |
| | | | | | | | | | | $ | 6,923,591 | |
|
| Peru — 1.6% | |
| | | |
| Peru Government Bond: | | | | | | | | | |
| | | |
6.15%, 8/12/32 | | | PEN | | | | 34,718 | | | $ | 7,433,008 | |
| | | |
6.95%, 8/12/31 | | | PEN | | | | 103,513 | | | | 23,912,069 | |
| | | |
| | | | | | | | | | | $ | 31,345,077 | |
|
| Romania — 2.4% | |
| | | |
| Romania Government International Bond: | | | | | | | | | |
| | | |
3.375%, 1/28/50(9) | | | EUR | | | | 3,514 | | | $ | 1,856,851 | |
| | | | |
| | 27 | | See Notes to Consolidated Financial Statements. |
Global Macro Absolute Return Advantage Portfolio
October 31, 2022
Consolidated Portfolio of Investments — continued
| | | | | | | | | | | | |
| Security | | | | | Principal
Amount (000’s omitted) | | | Value | |
|
| Romania (continued) | |
| | | |
Romania Government International Bond:
(continued) | | | | | | | | | |
| | | |
4.625%, 4/3/49(9) | | | EUR | | | | 20,631 | | | $ | 13,383,920 | |
| | | |
5.00%, 9/27/26(9) | | | EUR | | | | 16,881 | | | | 16,204,619 | |
| | | |
6.625%, 9/27/29(9) | | | EUR | | | | 16,515 | | | | 15,663,732 | |
| | | |
| | | | | | | | | | | $ | 47,109,122 | |
|
| Serbia — 5.0% | |
| | | |
| Serbia International Bond: | | | | | | | | | |
| | | |
1.00%, 9/23/28(9) | | | EUR | | | | 16,093 | | | $ | 11,228,155 | |
| | | |
1.50%, 6/26/29(9) | | | EUR | | | | 27,671 | | | | 19,257,336 | |
| | | |
1.65%, 3/3/33(9) | | | EUR | | | | 533 | | | | 311,923 | |
| | | |
2.05%, 9/23/36(9) | | | EUR | | | | 132 | | | | 72,445 | |
| | | |
3.125%, 5/15/27(9) | | | EUR | | | | 1,567 | | | | 1,323,980 | |
| | | |
| Serbia Treasury Bond: | | | | | | | | | |
| | | |
4.50%, 8/20/32 | | | RSD | | | | 5,345,300 | | | | 34,672,012 | |
| | | |
5.875%, 2/8/28 | | | RSD | | | | 3,900,890 | | | | 30,646,426 | |
| | | |
| | | | | | | | | | | $ | 97,512,277 | |
|
| Sri Lanka — 1.1% | |
| | | |
| Sri Lanka Government International Bond: | | | | | | | | | |
| | | |
5.75%, 4/18/23(9)(13) | | | USD | | | | 12,476 | | | $ | 2,927,869 | |
| | | |
6.20%, 5/11/27(9)(13) | | | USD | | | | 8,847 | | | | 2,037,794 | |
| | | |
6.35%, 6/28/24(9)(13) | | | USD | | | | 3,875 | | | | 910,238 | |
| | | |
6.75%, 4/18/28(9)(13) | | | USD | | | | 16,667 | | | | 3,796,987 | |
| | | |
6.825%, 7/18/26(9)(13) | | | USD | | | | 23,295 | | | | 5,533,934 | |
| | | |
6.85%, 3/14/24(9)(13) | | | USD | | | | 8,685 | | | | 2,045,470 | |
| | | |
6.85%, 11/3/25(9)(13) | | | USD | | | | 6,305 | | | | 1,522,267 | |
| | | |
7.55%, 3/28/30(9)(13) | | | USD | | | | 9,303 | | | | 2,147,782 | |
| | | |
7.85%, 3/14/29(9)(13) | | | USD | | | | 5,620 | | | | 1,300,026 | |
| | | |
| | | | | | | | | | | $ | 22,222,367 | |
|
| Suriname — 3.4% | |
| | | |
| Republic of Suriname: | | | | | | | | | |
| | | |
9.25%, 10/26/26(1)(13) | | | USD | | | | 200 | | | $ | 160,600 | |
| | | |
9.25%, 10/26/26(9)(13) | | | USD | | | | 80,493 | | | | 64,635,879 | |
| | | |
12.875%, 12/30/23(9)(13) | | | USD | | | | 2,634 | | | | 2,133,540 | |
| | | |
| | | | | | | | | | | $ | 66,930,019 | |
|
| Ukraine — 3.6% | |
| | | |
| Ukraine Government Bond: | | | | | | | | | |
| | | |
9.79%, 5/26/27(8) | | | UAH | | | | 1,287,962 | | | $ | 11,533,988 | |
| | | |
10.95%, 11/1/23(8) | | | UAH | | | | 21,651 | | | | 226,205 | |
| | | |
11.67%, 11/22/23(8) | | | UAH | | | | 108,255 | | | | 1,131,022 | |
| | | |
12.52%, 5/13/26(8) | | | UAH | | | | 1,605,408 | | | | 14,776,143 | |
| | | | | | | | | | | | |
| Security | | | | | Principal
Amount (000’s omitted) | | | Value | |
|
| Ukraine (continued) | |
| | | |
| Ukraine Government Bond: (continued) | | | | | | | | | |
| | | |
15.84%, 2/26/25(8) | | | UAH | | | | 3,386,787 | | | $ | 37,911,795 | |
| | | |
15.97%, 4/19/23(8) | | | UAH | | | | 5,100 | | | | 53,284 | |
| | | |
Ukraine Government International Bond, 0.00%, GDP-Linked, 8/1/41(6)(9)(23) | | | USD | | | | 18,650 | | | | 4,743,590 | |
| | | |
| | | | | | | | | | | $ | 70,376,027 | |
|
| Uruguay — 2.0% | |
| | | |
| Uruguay Government Bond: | | | | | | | | | |
| | | |
3.70%, 6/26/37 | | | UYU | | | | 85,429 | | | $ | 2,074,939 | |
| | | |
3.875%, 7/2/40(22) | | | UYU | | | | 1,289,769 | | | | 32,021,179 | |
| | | |
Uruguay Monetary Regulation Bill, 0.00%, 7/3/24 | | | UYU | | | | 253,400 | | | | 5,190,932 | |
| | | |
| | | | | | | | | | | $ | 39,287,050 | |
|
| Uzbekistan — 0.1% | |
| | | |
National Bank of Uzbekistan, 4.85%, 10/21/25(9) | | | USD | | | | 1,236 | | | $ | 1,086,135 | |
| | | |
Republic of Uzbekistan, 14.50%, 11/25/23(9) | | | UZS | | | | 6,120,000 | | | | 550,652 | |
| | | |
| | | | | | | | | | | $ | 1,636,787 | |
|
| Zambia — 1.6% | |
| | | |
| Zambia Government Bond: | | | | | | | | | |
| | | |
11.00%, 1/25/26 | | | ZMW | | | | 338,620 | | | $ | 13,930,103 | |
| | | |
11.00%, 12/27/26 | | | ZMW | | | | 58,770 | | | | 2,184,404 | |
| | | |
12.00%, 3/22/28 | | | ZMW | | | | 25,880 | | | | 882,514 | |
| | | |
12.00%, 5/31/28 | | | ZMW | | | | 11,710 | | | | 393,004 | |
| | | |
12.00%, 11/1/28 | | | ZMW | | | | 12,400 | | | | 405,395 | |
| | | |
12.00%, 2/21/29 | | | ZMW | | | | 46,990 | | | | 1,499,799 | |
| | | |
13.00%, 12/27/31 | | | ZMW | | | | 29,785 | | | | 902,348 | |
| | | |
14.00%, 12/5/31 | | | ZMW | | | | 2,700 | | | | 87,008 | |
| | | |
| Zambia Government International Bond: | | | | | | | | | |
| | | |
5.375%, 9/20/22(9)(13) | | | USD | | | | 20,640 | | | | 7,091,698 | |
| | | |
8.50%, 4/14/24(9)(13) | | | USD | | | | 8,581 | | | | 3,475,562 | |
| | | |
8.97%, 7/30/27(9)(13) | | | USD | | | | 2,782 | | | | 1,120,217 | |
| | | |
| | | | | | | | | | | $ | 31,972,052 | |
| |
Total Sovereign Government Bonds
(identified cost $1,254,369,926) | | | $ | 886,183,440 | |
| | | | |
| | 28 | | See Notes to Consolidated Financial Statements. |
Global Macro Absolute Return Advantage Portfolio
October 31, 2022
Consolidated Portfolio of Investments — continued
| | | | | | | | | | | | |
| Sovereign Loans — 6.8% | |
| Borrower/Description | | Principal
Amount (000’s omitted) | | | Value | |
|
| Ivory Coast — 0.3% | |
| | | |
Republic of Ivory Coast, Term Loan, 5.991%, (6 mo. EURIBOR + 5.75%), 1/6/28(5) | | | EUR | | | | 5,655 | | | $ | 5,604,910 | |
| | | |
| | | | | | | | | | | $ | 5,604,910 | |
|
| Kenya — 1.0% | |
| | | |
Government of Kenya: | | | | | | | | | | | | |
| | | |
Term Loan, 9.312%, (6 mo. USD LIBOR + 6.45%), 6/29/25(5) | | | USD | | | | 17,901 | | | $ | 17,884,119 | |
| | | |
Term Loan, 11.025%, (3 mo. USD LIBOR + 6.70%), 10/24/24(5) | | | USD | | | | 1,988 | | | | 1,972,612 | |
| | | |
| | | | | | | | | | | $ | 19,856,731 | |
|
| Tanzania — 5.5% | |
| | | |
Government of the United Republic of Tanzania: | | | | | | | | | | | | |
| | | |
Term Loan, 7.226%, (6 mo. USD LIBOR + 5.20%), 5/23/23(5) | | | USD | | | | 13,814 | | | $ | 13,887,554 | |
| | | |
Term Loan, 8.232%, (6 mo. USD LIBOR + 6.30%), 4/28/31(5) | | | USD | | | | 92,880 | | | | 91,956,122 | |
| | | |
| | | | | | | | | | | $ | 105,843,676 | |
| | | |
Total Sovereign Loans
(identified cost $133,153,798) | | | | | | | | | | $ | 131,305,317 | |
|
U.S. Government Guaranteed Small Business Administration Loans(24)(25) — 0.8% | |
| Security | | Principal
Amount
(000’s omitted) | | | Value | |
| | | |
1.88%, 12/28/42 | | | | | | $ | 1,302 | | | $ | 81,983 | |
| | | |
2.24%, 11/15/32 to 4/10/43(26) | | | | | | | 26,381 | | | | 1,839,841 | |
| | | |
2.38%, 11/30/42 to 3/1/43 | | | | | | | 5,736 | | | | 448,053 | |
| | | |
2.63%, 10/27/42 to 3/20/43 | | | | | | | 5,077 | | | | 412,670 | |
| | | |
2.80%, 4/12/27 to 3/10/43(26) | | | | | | | 57,762 | | | | 4,646,245 | |
| | | |
2.88%, 10/27/42 to 2/13/43 | | | | | | | 7,038 | | | | 651,864 | |
| | | |
3.03%, 2/2/27 to 12/17/43(26) | | | | | | | 64,218 | | | | 5,565,609 | |
| | | |
3.13%, 10/12/42 to 1/2/43 | | | | | | | 3,044 | | | | 318,102 | |
| | | |
3.63%, 10/27/42 to 3/28/43 | | | | | | | 20,673 | | | | 2,494,589 | |
| | | |
Total U.S. Government Guaranteed Small Business Administration Loans
(identified cost $26,252,017) | | | | | | | | | | $ | 16,458,956 | |
| | | | | | | | | | |
| U.S. Treasury Obligations — 3.7% | |
| Security | | Principal
Amount
(000’s omitted) | | | Value | |
| | | |
U.S. Treasury Bond, 1.75%, 8/15/41(27) | | | | $ | 109,950 | | | $ | 71,811,094 | |
| | | |
Total U.S. Treasury Obligations
(identified cost $84,695,477) | | | | | | | | $ | 71,811,094 | |
|
| Warrants — 0.0%(7) | |
| Security | | | | Shares | | | Value | |
| | | |
IRSA Inversiones y Representaciones S.A., Exp. 3/5/26(6) | | | | | 383,780 | | | $ | 75,797 | |
| | | |
Total Warrants
(identified cost $0) | | | | | | | | $ | 75,797 | |
|
| Miscellaneous — 0.0% | |
| Security | | | | Shares | | | Value | |
|
| Financial Intermediaries — 0.0% | |
| | | |
Alpha Holding S.A., Escrow Certificates(6)(8) | | | | | 5,728,000 | | | $ | 0 | |
| | | |
Alpha Holding S.A., Escrow Certificates(6)(8) | | | | | 11,758,000 | | | | 0 | |
| | | |
Total Miscellaneous
(identified cost $0) | | | | | | | | $ | 0 | |
|
| Short-Term Investments — 10.9% | |
| Affiliated Fund — 6.1% | |
| Security | | Shares | | | Value | |
| | | |
Morgan Stanley Institutional Liquidity Funds - Government Portfolio, Institutional Class, 2.88%(28) | | | | | 118,583,106 | | | $ | 118,583,106 | |
| |
Total Affiliated Fund
(identified cost $118,583,106) | | | $ | 118,583,106 | |
|
| Repurchase Agreements — 1.7% | |
| Description | | Principal
Amount
(000’s omitted) | | | Value | |
| | | |
| Barclays Bank PLC: | | | | | | | | |
| | | |
Dated 10/6/22 with an interest rate of 0.35%, collateralized by EUR 6,000,000 Republic of Poland, 1.00%, due 3/7/29 and a market value, including accrued interest, of $4,970,491(29) | | EUR | | | 5,325 | | | $ | 5,262,430 | |
| | | | |
| | 29 | | See Notes to Consolidated Financial Statements. |
Global Macro Absolute Return Advantage Portfolio
October 31, 2022
Consolidated Portfolio of Investments — continued
| | | | | | | | | | |
| Description | | Principal
Amount
(000’s omitted) | | | Value | |
| | | |
| Barclays Bank PLC: (continued) | | | | | | | | |
| | | |
Dated 10/6/22 with an interest rate of 0.00%, collateralized by EUR 6,000,000 Republic of Poland, 1.125%, due 8/7/26 and a market value, including accrued interest, of $5,489,024(29) | | EUR | | | 5,812 | | | $ | 5,744,201 | |
| | | |
Dated 10/12/22 with an interest rate of 0.15% payable by the Portfolio, collateralized by EUR 3,000,000 Republic of Poland, 2.75%, due 5/25/32 and a market value, including accrued interest, of $2,585,886(29) | | EUR | | | 2,711 | | | | 2,679,392 | |
| | | |
Dated 10/13/22 with an interest rate of 0.00%, collateralized by EUR 1,800,000 Republic of Poland, 1.00%, due 3/7/29 and a market value, including accrued interest, of $1,491,147(29) | | EUR | | | 1,577 | | | | 1,558,717 | |
| | | |
Dated 10/14/22 with an interest rate of 0.10% payable by the Portfolio, collateralized by EUR 3,000,000 Republic of Poland, 1.50%, due 1/19/26 and a market value, including accrued interest, of $2,841,328(29) | | EUR | | | 3,023 | | | | 2,986,985 | |
| | | |
Dated 10/17/22 with an interest rate of 0.05% payable by the Portfolio, collateralized by EUR 6,000,000 Republic of Poland, 1.375%, due 10/22/27 and a market value, including accrued interest, of $5,288,817(29) | | EUR | | | 5,678 | | | | 5,610,788 | |
| | | |
Dated 10/26/22 with an interest rate of 2.75%, collateralized by USD 9,400,000 Ghana Government International Bond, 6.375%, due 2/11/27 and a market value, including accrued interest, of $3,031,610(29) | | USD | | | 3,161 | | | | 3,160,750 | |
| | | |
Nomura International PLC: | | | | | | | | | | |
| | | |
Dated 10/24/22 with an interest rate of 2.15%, collateralized by EUR 1,210,000 Republic of Poland, 1.125%, due 8/7/26 and a market value, including accrued interest, of $1,106,991(29) | | USD | | | 1,144 | | | | 1,144,079 | |
| | | |
Dated 10/24/22 with an interest rate of 2.15%, collateralized by EUR 3,026,000 Republic of Poland, 1.50%, due 9/9/25 and a market value, including accrued interest, of $2,850,000(29) | | USD | | | 2,963 | | | | 2,963,090 | |
| | | |
Dated 10/25/22 with an interest rate of 2.15%, collateralized by EUR 3,044,000 Republic of Poland, 1.00%, due 3/7/29 and a market value, including accrued interest, of $2,521,551(29) | | USD | | | 2,590 | | | | 2,590,441 | |
| | | |
Total Repurchase Agreements
(identified cost $33,468,778) | | | | | | | | $ | 33,700,873 | |
| | | | | | | | | | |
| Sovereign Government Securities — 0.3% | |
| Security | | | | Principal
Amount (000’s omitted) | | | Value | |
| | | |
| Ukraine — 0.3% | | | | | | | | |
| | | |
Ukraine Treasury Bill, 0.00%, 3/1/23(8) | | UAH | | | 224,029 | | | $ | 5,286,231 | |
| | | |
Total Sovereign Government Securities
(identified cost $6,994,088) | | | | | | | | $ | 5,286,231 | |
|
| U.S. Treasury Obligations — 2.8% | |
| Security | | | | Principal
Amount (000’s omitted) | | | Value | |
| | | |
| U.S. Treasury Bill: | | | | | | | | |
| | | |
0.00%, 11/8/22(30) | | | | $ | 43,130 | | | $ | 43,107,661 | |
| | | |
0.00%, 11/15/22(30) | | | | | 11,870 | | | | 11,856,175 | |
| | | |
Total U.S. Treasury Obligations
(identified cost $54,964,494) | | | | | | | | $ | 54,963,836 | |
| | | |
Total Short-Term Investments
(identified cost $214,010,466) | | | | | | | | $ | 212,534,046 | |
| | | |
Total Purchased Options — 0.0%(7)
(identified cost $2,514,525) | | | | | | | | $ | 42 | |
| | | |
Total Investments — 89.4%
(identified cost $2,243,092,359) | | | | | | | | $ | 1,737,794,864 | |
| | | | | | | | | | |
|
| Securities Sold Short — (7.4)% | |
| Exchange-Traded Funds — (5.8)% | |
| Security | | | | Shares | | | Value | |
|
| United States — (5.8)% | |
| | | |
iShares JP Morgan USD Emerging Markets Bond ETF | | | | | (1,416,500 | ) | | $ | (111,761,850 | ) |
| | | |
Total Exchange-Traded Funds
(proceeds $117,910,911) | | | | | | | | $ | (111,761,850 | ) |
| | | | |
| | 30 | | See Notes to Consolidated Financial Statements. |
Global Macro Absolute Return Advantage Portfolio
October 31, 2022
Consolidated Portfolio of Investments — continued
| | | | | | | | | | | | |
| Sovereign Government Bonds — (1.6)% | |
| Security | | Principal
Amount
(000’s omitted) | | | Value | |
| | | |
| Ghana — (0.1)% | | | | | | | | | |
| | | |
Ghana Government International Bond, 6.375%, 2/11/27(9) | | | USD | | | | (9,400 | ) | | $ | (2,898,443 | ) |
| | | |
| | | | | | | | | | | $ | (2,898,443 | ) |
| | | |
| Poland — (1.5)% | | | | | | | | | |
| | | |
Republic of Poland: | | | | | | | | | | | | |
| | | |
1.00%, 3/7/29(9) | | | EUR | | | | (10,844 | ) | | $ | (8,913,162 | ) |
| | | |
1.125%, 8/7/26(9) | | | EUR | | | | (7,210 | ) | | | (6,577,090 | ) |
| | | |
1.375%, 10/22/27(9) | | | EUR | | | | (6,000 | ) | | | (5,286,583 | ) |
| | | |
1.50%, 9/9/25(9) | | | EUR | | | | (3,026 | ) | | | (2,843,409 | ) |
| | | |
1.50%, 1/19/26(9) | | | EUR | | | | (3,000 | ) | | | (2,806,482 | ) |
| | | |
2.75%, 5/25/32(9) | | | EUR | | | | (3,000 | ) | | | (2,550,147 | ) |
| | | |
| | | | | | | | | | | $ | (28,976,873 | ) |
| | | |
Total Sovereign Government Bonds
(proceeds $31,518,574) | | | | | | | | | | $ | (31,875,316 | ) |
| | | |
Total Securities Sold Short
(proceeds $149,429,485) | | | | | | | | | | $ | (143,637,166 | ) |
| | | |
Other Assets, Less Liabilities — 18.0% | | | | | | | | | | $ | 350,613,404 | |
| | | |
Net Assets — 100.0% | | | | | | | | | | $ | 1,944,771,102 | |
The percentage shown for each investment category in the Consolidated
Portfolio of Investments is based on net assets.
| | (1) | Security exempt from registration under Rule 144A of the Securities Act of 1933, as amended. These securities may be sold in certain transactions in reliance on an exemption from registration (normally to qualified institutional buyers). At October 31, 2022, the aggregate value of these securities is $144,687,744 or 7.4% of the Portfolio’s net assets. |
| | (2) | Weighted average fixed-rate coupon that changes/updates monthly. Rate shown is the rate at October 31, 2022. |
| | (3) | Interest only security that entitles the holder to receive only interest payments on the underlying mortgages. Principal amount shown is the notional amount of the underlying mortgages on which coupon interest is calculated. |
| | (4) | Inverse floating-rate security whose coupon varies inversely with changes in the interest rate index. The stated interest rate represents the coupon rate in effect at October 31, 2022. |
| | (5) | Variable rate security. The stated interest rate represents the rate in effect at October 31, 2022. |
| | (6) | Non-income producing security. |
| | (7) | Amount is less than 0.05%. |
| | (8) | For fair value measurement disclosure purposes, security is categorized as Level 3 (see Note 10). |
| | (9) | Security exempt from registration under Regulation S of the Securities Act of 1933, as amended, which exempts from registration securities offered and sold outside the United States. Security may not be offered or sold in the United States except pursuant to an exemption from, or in a transaction not subject to, the registration requirements of the Securities Act of 1933, as amended. At October 31, 2022, the aggregate value of these securities is $692,688,745 or 35.6% of the Portfolio’s net assets. |
| (10) | Perpetual security with no stated maturity date but may be subject to calls by the issuer. |
| (11) | Variable rate security whose coupon rate is linked to the issuer’s mining activities revenue. The coupon rate shown represents the rate in effect at October 31, 2022. |
| (12) | Security converts to variable rate after the indicated fixed-rate coupon period. |
| (13) | Issuer is in default with respect to interest and/or principal payments or has declared bankruptcy. For a variable rate security, interest rate has been adjusted to reflect non-accrual status. |
| (14) | Represents a payment-in-kind security which may pay interest in additional principal at the issuer’s discretion. |
| (15) | Limited recourse note whose payments by the issuer are limited to amounts received by the issuer from the borrower pursuant to a loan agreement with the borrower. |
| (16) | Quantity held represents principal in USD. |
| (17) | Security is subject to risk of loss depending on the occurrence, frequency and severity of the loss events that are covered by underlying reinsurance contracts and that may occur during a specified risk period. |
| (18) | Restricted security (see Note 5). |
| (19) | Senior floating-rate loans (Senior Loans) often require prepayments from excess cash flows or permit the borrowers to repay at their election. The degree to which borrowers repay, whether as a contractual requirement or at their election, cannot be predicted with accuracy. As a result, the actual remaining maturity may be substantially less than the stated maturities shown. However, Senior Loans will typically have an expected average life of approximately two to four years. Senior Loans typically have rates of interest which are redetermined periodically by reference to a base lending rate, plus a spread. These base lending rates are primarily the London Interbank Offered Rate (“LIBOR”) or the Secured Overnight Financing Rate (“SOFR”) and secondarily, the prime rate offered by one or more major United States banks (the “Prime Rate”). Base lending rates may be subject to a floor, or minimum rate. Rates for SOFR are generally 1 or 3-month tenors and may also be subject to a credit spread adjustment. Senior Loans are generally subject to contractual restrictions that must be satisfied before they can be bought or sold. |
| (21) | Step coupon security. Interest rate represents the rate in effect at October 31, 2022. |
| (22) | Inflation-linked security whose principal is adjusted for inflation based on changes in a designated inflation index or inflation rate for the applicable country. Interest is calculated based on the inflation-adjusted principal. |
| (23) | Amounts payable in respect of the security are contingent upon and determined by reference to Ukraine’s GDP and Real GDP Growth Rate. Principal amount represents the notional amount used to calculate payments due to the security holder and does not represent an entitlement for payment. |
| | | | |
| | 31 | | See Notes to Consolidated Financial Statements. |
Global Macro Absolute Return Advantage Portfolio
October 31, 2022
Consolidated Portfolio of Investments — continued
| (24) | Interest only security that entitles the holder to receive only a portion of the interest payments on the underlying loans. Principal amount shown is the notional amount of the underlying loans on which coupon interest is calculated. |
| (25) | Securities comprise a trust that is wholly-owned by the Portfolio and may only be sold on a pro-rata basis with all securities in the trust. |
| (26) | The stated interest rate represents the weighted average fixed interest rate at October 31, 2022 of all interest only securities comprising the certificate. |
| (27) | Security (or a portion thereof) has been pledged for the benefit of the counterparty for reverse repurchase agreements. |
| (28) | May be deemed to be an affiliated investment company. The rate shown is the annualized seven-day yield as of October 31, 2022. |
| (29) | Open repurchase agreement with no specific maturity date. Either party may terminate the agreement upon demand. |
| (30) | Security (or a portion thereof) has been pledged to cover collateral requirements on open derivative contracts. |
| | | | | | | | | | | | | | |
| Purchased Call Options — 0.0%(1) | |
| | | | | |
| Description | | Counterparty | | Notional Amount | | Spread | | Expiration Date | | | Value | |
| | | | | |
| 2-year 10 Constant Maturity Swap Curve Cap | | Bank of America, N.A. | | USD 1,221,400,000 | | 1.06% | | | 12/19/22 | | | $ | 12 | |
| | | | | |
| 2-year 10 Constant Maturity Swap Curve Cap | | Bank of America, N.A. | | USD 596,500,000 | | 1.09 | | | 1/4/23 | | | | 30 | |
| | | | | |
Total | | | | | | | | | | | | $ | 42 | |
| (1) | Amount is less than 0.05%. |
| | | | | | | | | | | | | | | | | | |
| Forward Foreign Currency Exchange Contracts (Centrally Cleared) | |
| | | |
| Currency Purchased | | | Currency Sold | | | Settlement
Date | | | Value/Unrealized
Appreciation
(Depreciation) | |
| | | | | |
| BRL | | | 26,397,148 | | | USD | | | 4,892,891 | | | | 11/4/22 | | | $ | 216,138 | |
| | | | | |
| BRL | | | 25,817,000 | | | USD | | | 4,943,749 | | | | 11/4/22 | | | | 52,995 | |
| | | | | |
| BRL | | | 24,933,000 | | | USD | | | 4,773,611 | | | | 11/4/22 | | | | 52,040 | |
| | | | | |
| BRL | | | 4,073,634 | | | USD | | | 753,255 | | | | 11/4/22 | | | | 35,175 | |
| | | | | |
| BRL | | | 100,000 | | | USD | | | 18,939 | | | | 11/4/22 | | | | 415 | |
| | | | | |
| USD | | | 15,638,612 | | | BRL | | | 81,320,782 | | | | 11/4/22 | | | | (100,597 | ) |
| | | | | |
| USD | | | 23,807,031 | | | ZAR | | | 409,076,216 | | | | 11/18/22 | | | | 1,564,607 | |
| | | | | |
| USD | | | 9,135,137 | | | PHP | | | 538,900,000 | | | | 11/21/22 | | | | (138,155 | ) |
| | | | | |
| USD | | | 10,559,217 | | | PHP | | | 623,300,000 | | | | 11/21/22 | | | | (166,415 | ) |
| | | | | |
| USD | | | 10,365,098 | | | PHP | | | 585,400,000 | | | | 11/25/22 | | | | 297,922 | |
| | | | | |
| USD | | | 10,361,860 | | | PHP | | | 585,300,000 | | | | 11/25/22 | | | | 296,403 | |
| | | | | |
| USD | | | 10,001,060 | | | PHP | | | 566,000,000 | | | | 11/25/22 | | | | 267,508 | |
| | | | | |
| USD | | | 8,628,372 | | | PHP | | | 488,279,580 | | | | 11/25/22 | | | | 231,385 | |
| | | | | |
| BRL | | | 81,320,782 | | | USD | | | 15,542,072 | | | | 12/2/22 | | | | 103,683 | |
| | | | | |
| USD | | | 10,669,552 | | | PHP | | | 632,299,000 | | | | 12/2/22 | | | | (192,301 | ) |
| | | | | |
| USD | | | 11,096,451 | | | PHP | | | 658,075,000 | | | | 12/2/22 | | | | (208,191 | ) |
| | | | | |
| USD | | | 16,328,724 | | | PHP | | | 968,326,000 | | | | 12/2/22 | | | | (305,518 | ) |
| | | | | |
| AUD | | | 45,000,000 | | | USD | | | 30,456,900 | | | | 12/21/22 | | | | (1,626,858 | ) |
| | | | | |
| AUD | | | 49,975,670 | | | USD | | | 33,825,033 | | | | 12/21/22 | | | | (1,807,241 | ) |
| | | | | |
| EUR | | | 2,157,779 | | | USD | | | 2,131,480 | | | | 12/21/22 | | | | 9,661 | |
| | | | | |
| EUR | | | 1,014,883 | | | USD | | | 1,000,729 | | | | 12/21/22 | | | | 6,328 | |
| | | | | |
| EUR | | | 73,827 | | | USD | | | 72,797 | | | | 12/21/22 | | | | 460 | |
| | | | | |
| EUR | | | 1,282,263 | | | USD | | | 1,274,696 | | | | 12/21/22 | | | | (2,321 | ) |
| | | | |
| | 32 | | See Notes to Consolidated Financial Statements. |
Global Macro Absolute Return Advantage Portfolio
October 31, 2022
Consolidated Portfolio of Investments — continued
| | | | | | | | | | | | | | | | | | |
| Forward Foreign Currency Exchange Contracts (Centrally Cleared) (continued) | |
| | | |
| Currency Purchased | | | Currency Sold | | | Settlement
Date | | | Value/Unrealized
Appreciation
(Depreciation) | |
| | | | | |
| EUR | | | 11,759,356 | | | USD | | | 11,689,964 | | | | 12/21/22 | | | $ | (21,283 | ) |
| | | | | |
| EUR | | | 14,778,325 | | | USD | | | 14,691,119 | | | | 12/21/22 | | | | (26,747 | ) |
| | | | | |
| EUR | | | 2,140,000 | | | USD | | | 2,153,309 | | | | 12/21/22 | | | | (29,811 | ) |
| | | | | |
| IDR | | | 221,150,000,000 | | | USD | | | 14,089,577 | | | | 12/21/22 | | | | 40,652 | |
| | | | | |
| IDR | | | 193,630,000,000 | | | USD | | | 12,337,836 | | | | 12/21/22 | | | | 34,021 | |
| | | | | |
| IDR | | | 173,340,000,000 | | | USD | | | 11,044,479 | | | | 12/21/22 | | | | 30,963 | |
| | | | | |
| IDR | | | 167,677,000,000 | | | USD | | | 10,687,143 | | | | 12/21/22 | | | | 26,465 | |
| | | | | |
| IDR | | | 154,348,244,790 | | | USD | | | 9,838,324 | | | | 12/21/22 | | | | 23,652 | |
| | | | | |
| IDR | | | 25,984,326,746 | | | USD | | | 1,735,856 | | | | 12/21/22 | | | | (75,605 | ) |
| | | | | |
| IDR | | | 194,726,840,000 | | | USD | | | 12,739,459 | | | | 12/21/22 | | | | (297,521 | ) |
| | | | | |
| KRW | | | 1,167,500,000 | | | USD | | | 818,476 | | | | 12/21/22 | | | | 240 | |
| | | | | |
| KRW | | | 9,822,800,000 | | | USD | | | 7,056,660 | | | | 12/21/22 | | | | (168,367 | ) |
| | | | | |
| KRW | | | 11,303,300,000 | | | USD | | | 8,141,423 | | | | 12/21/22 | | | | (214,921 | ) |
| | | | | |
| KRW | | | 15,981,700,000 | | | USD | | | 11,485,892 | | | | 12/21/22 | | | | (278,637 | ) |
| | | | | |
| KRW | | | 22,962,200,000 | | | USD | | | 16,496,195 | | | | 12/21/22 | | | | (393,825 | ) |
| | | | | |
| NZD | | | 4,250,000 | | | USD | | | 2,554,250 | | | | 12/21/22 | | | | (81,447 | ) |
| | | | | |
| NZD | | | 4,250,000 | | | USD | | | 2,554,250 | | | | 12/21/22 | | | | (81,447 | ) |
| | | | | |
| NZD | | | 6,250,000 | | | USD | | | 3,756,250 | | | | 12/21/22 | | | | (119,775 | ) |
| | | | | |
| NZD | | | 13,972,238 | | | USD | | | 8,397,315 | | | | 12/21/22 | | | | (267,764 | ) |
| | | | | |
| NZD | | | 46,800,000 | | | USD | | | 28,126,800 | | | | 12/21/22 | | | | (896,874 | ) |
| | | | | |
| PEN | | | 13,782,743 | | | USD | | | 3,432,813 | | | | 12/21/22 | | | | 7,551 | |
| | | | | |
| USD | | | 18,390,923 | | | CLP | | | 17,627,700,000 | | | | 12/21/22 | | | | (139,744 | ) |
| | | | | |
| USD | | | 10,306,828 | | | CLP | | | 10,120,790,000 | | | | 12/21/22 | | | | (332,393 | ) |
| | | | | |
| USD | | | 19,575,451 | | | COP | | | 87,745,000,000 | | | | 12/21/22 | | | | 1,959,795 | |
| | | | | |
| USD | | | 10,126,781 | | | COP | | | 45,392,285,000 | | | | 12/21/22 | | | | 1,013,842 | |
| | | | | |
| USD | | | 8,200,924 | | | COP | | | 36,852,658,000 | | | | 12/21/22 | | | | 802,398 | |
| | | | | |
| USD | | | 6,386,994 | | | COP | | | 28,629,062,000 | | | | 12/21/22 | | | | 639,434 | |
| | | | | |
| USD | | | 4,667,871 | | | COP | | | 20,975,547,187 | | | | 12/21/22 | | | | 456,828 | |
| | | | | |
| USD | | | 4,242,506 | | | COP | | | 19,064,634,000 | | | | 12/21/22 | | | | 415,097 | |
| | | | | |
| USD | | | 2,675,762 | | | COP | | | 12,024,127,000 | | | | 12/21/22 | | | | 261,803 | |
| | | | | |
| USD | | | 2,414,786 | | | COP | | | 10,851,081,000 | | | | 12/21/22 | | | | 236,326 | |
| | | | | |
| USD | | | 1,523,013 | | | COP | | | 6,843,811,000 | | | | 12/21/22 | | | | 149,052 | |
| | | | | |
| USD | | | 5,008,300 | | | COP | | | 24,741,000,000 | | | | 12/21/22 | | | | 41,305 | |
| | | | | |
| USD | | | 4,986,677 | | | COP | | | 24,740,000,000 | | | | 12/21/22 | | | | 19,883 | |
| | | | | |
| USD | | | 4,982,880 | | | COP | | | 24,740,000,000 | | | | 12/21/22 | | | | 16,086 | |
| | | | | |
| USD | | | 4,187,469 | | | COP | | | 20,818,000,000 | | | | 12/21/22 | | | | 8,054 | |
| | | | | |
| USD | | | 75,818,719 | | | EUR | | | 75,350,097 | | | | 12/21/22 | | | | 1,049,637 | |
| | | | | |
| USD | | | 74,157,253 | | | EUR | | | 73,698,901 | | | | 12/21/22 | | | | 1,026,636 | |
| | | | | |
| USD | | | 28,441,752 | | | EUR | | | 28,265,959 | | | | 12/21/22 | | | | 393,749 | |
| | | | | |
| USD | | | 23,143,043 | | | EUR | | | 23,000,000 | | | | 12/21/22 | | | | 320,393 | |
| | | | | |
| USD | | | 19,818,283 | | | EUR | | | 19,695,789 | | | | 12/21/22 | | | | 274,365 | |
| | | | | |
| USD | | | 19,371,461 | | | EUR | | | 19,251,730 | | | | 12/21/22 | | | | 268,179 | |
| | | | | |
| USD | | | 18,778,080 | | | EUR | | | 18,662,016 | | | | 12/21/22 | | | | 259,965 | |
| | | | | |
| USD | | | 15,859,574 | | | EUR | | | 15,761,549 | | | | 12/21/22 | | | | 219,561 | |
| | | | |
| | 33 | | See Notes to Consolidated Financial Statements. |
Global Macro Absolute Return Advantage Portfolio
October 31, 2022
Consolidated Portfolio of Investments — continued
| | | | | | | | | | | | | | | | | | |
| Forward Foreign Currency Exchange Contracts (Centrally Cleared) (continued) | |
| | | |
| Currency Purchased | | | Currency Sold | | | Settlement
Date | | | Value/Unrealized
Appreciation
(Depreciation) | |
| | | | | |
| USD | | | 14,605,900 | | | EUR | | | 14,515,624 | | | | 12/21/22 | | | $ | 202,205 | |
| | | | | |
| USD | | | 9,282,853 | | | EUR | | | 9,225,477 | | | | 12/21/22 | | | | 128,512 | |
| | | | | |
| USD | | | 7,996,340 | | | EUR | | | 7,946,916 | | | | 12/21/22 | | | | 110,702 | |
| | | | | |
| USD | | | 7,641,196 | | | EUR | | | 7,593,967 | | | | 12/21/22 | | | | 105,785 | |
| | | | | |
| USD | | | 6,476,589 | | | EUR | | | 6,436,558 | | | | 12/21/22 | | | | 89,662 | |
| | | | | |
| USD | | | 34,528,067 | | | EUR | | | 34,733,027 | | | | 12/21/22 | | | | 62,863 | |
| | | | | |
| USD | | | 14,477,919 | | | EUR | | | 14,563,860 | | | | 12/21/22 | | | | 26,359 | |
| | | | | |
| USD | | | 1,290,238 | | | EUR | | | 1,282,263 | | | | 12/21/22 | | | | 17,862 | |
| | | | | |
| USD | | | 350,672 | | | EUR | | | 348,505 | | | | 12/21/22 | | | | 4,855 | |
| | | | | |
| USD | | | 293,613 | | | EUR | | | 291,798 | | | | 12/21/22 | | | | 4,065 | |
| | | | | |
| USD | | | 2,145,046 | | | EUR | | | 2,157,779 | | | | 12/21/22 | | | | 3,905 | |
| | | | | |
| USD | | | 1,082,602 | | | EUR | | | 1,088,710 | | | | 12/21/22 | | | | 2,287 | |
| | | | | |
| USD | | | 860,304 | | | EUR | | | 865,411 | | | | 12/21/22 | | | | 1,566 | |
| | | | | |
| USD | | | 16,391,405 | | | IDR | | | 244,222,100,000 | | | | 12/21/22 | | | | 787,000 | |
| | | | | |
| USD | | | 15,825,346 | | | IDR | | | 235,702,700,000 | | | | 12/21/22 | | | | 765,282 | |
| | | | | |
| USD | | | 15,920,884 | | | IDR | | | 238,542,600,000 | | | | 12/21/22 | | | | 679,367 | |
| | | | | |
| USD | | | 8,850,187 | | | IDR | | | 131,882,300,000 | | | | 12/21/22 | | | | 423,657 | |
| | | | | |
| USD | | | 6,061,440 | | | IDR | | | 90,616,100,000 | | | | 12/21/22 | | | | 271,586 | |
| | | | | |
| USD | | | 5,729,659 | | | IDR | | | 85,779,871,536 | | | | 12/21/22 | | | | 248,813 | |
| | | | | |
| USD | | | 5,593,280 | | | IDR | | | 83,738,121,156 | | | | 12/21/22 | | | | 242,890 | |
| | | | | |
| USD | | | 1,918,648 | | | IDR | | | 28,591,000,000 | | | | 12/21/22 | | | | 91,845 | |
| | | | | |
| USD | | | 24,755,764 | | | INR | | | 1,982,347,500 | | | | 12/21/22 | | | | 948,821 | |
| | | | | |
| USD | | | 14,609,933 | | | INR | | | 1,170,000,000 | | | | 12/21/22 | | | | 558,854 | |
| | | | | |
| USD | | | 1,872,414 | | | INR | | | 150,000,000 | | | | 12/21/22 | | | | 70,993 | |
| | | | | |
| USD | | | 23,585,125 | | | NZD | | | 39,243,136 | | | | 12/21/22 | | | | 752,055 | |
| | | | | |
| USD | | | 8,397,315 | | | NZD | | | 13,972,238 | | | | 12/21/22 | | | | 267,764 | |
| | | | | |
| USD | | | 18,770,808 | | | PEN | | | 73,407,000 | | | | 12/21/22 | | | | 447,404 | |
| | | | | |
| USD | | | 8,193,251 | | | PEN | | | 32,193,741 | | | | 12/21/22 | | | | 157,247 | |
| | | | | |
| USD | | | 7,456,134 | | | PEN | | | 29,278,000 | | | | 12/21/22 | | | | 147,939 | |
| | | | | |
| BRL | | | 44,810,000 | | | USD | | | 8,195,657 | | | | 1/4/23 | | | | 365,317 | |
| | | | | |
| BRL | | | 28,519,218 | | | USD | | | 5,220,049 | | | | 1/4/23 | | | | 228,562 | |
| | | | | |
| IDR | | | 95,085,000,000 | | | USD | | | 6,234,510 | | | | 1/11/23 | | | | (166,210 | ) |
| | | | | |
| IDR | | | 101,312,000,000 | | | USD | | | 6,639,056 | | | | 1/11/23 | | | | (173,351 | ) |
| | | | | |
| IDR | | | 113,976,000,000 | | | USD | | | 7,476,778 | | | | 1/11/23 | | | | (202,859 | ) |
| | | | | |
| JPY | | | 6,074,457,667 | | | USD | | | 42,522,258 | | | | 1/12/23 | | | | (1,283,465 | ) |
| | | | | |
| USD | | | 4,535,448 | | | JPY | | | 647,905,033 | | | | 1/12/23 | | | | 136,895 | |
| | | | | |
| USD | | | 3,556,793 | | | JPY | | | 508,816,000 | | | | 1/12/23 | | | | 102,500 | |
| | | | | |
| USD | | | 9,946,122 | | | PHP | | | 587,229,000 | | | | 1/26/23 | | | | (90,453 | ) |
| | | | | |
| USD | | | 10,471,185 | | | PHP | | | 619,580,000 | | | | 1/26/23 | | | | (118,315 | ) |
| | | | | |
| USD | | | 9,962,020 | | | IDR | | | 151,871,000,000 | | | | 7/11/23 | | | | 360,045 | |
| | | | | |
| USD | | | 5,718,775 | | | IDR | | | 87,177,000,000 | | | | 7/11/23 | | | | 207,048 | |
| | | | | |
| USD | | | 4,681,869 | | | IDR | | | 71,325,000,000 | | | | 7/11/23 | | | | 172,378 | |
| | | | | |
| | | | | | | | | | | | | | | | | $ | 12,317,131 | |
| | | | |
| | 34 | | See Notes to Consolidated Financial Statements. |
Global Macro Absolute Return Advantage Portfolio
October 31, 2022
Consolidated Portfolio of Investments — continued
| | | | | | | | | | | | | | | | | | | | | | | | |
| Forward Foreign Currency Exchange Contracts (OTC) | | | | | | | |
| | | | | |
| Currency Purchased | | | Currency Sold | | | Counterparty | | Settlement
Date | | | Unrealized
Appreciation | | | Unrealized
(Depreciation) | |
| | | | | | | |
| EUR | | | 1,856,536 | | | USD | | | 1,824,761 | | | Goldman Sachs International | | | 11/1/22 | | | $ | 9,960 | | | $ | — | |
| | | | | | | |
| KZT | | | 447,889,197 | | | USD | | | 928,268 | | | Citibank, N.A. | | | 11/1/22 | | | | 30,502 | | | | — | |
| | | | | | | |
| KZT | | | 447,889,195 | | | USD | | | 928,268 | | | Citibank, N.A. | | | 11/1/22 | | | | 30,502 | | | | — | |
| | | | | | | |
| KZT | | | 96,564,128 | | | USD | | | 200,133 | | | Citibank, N.A. | | | 11/1/22 | | | | 6,576 | | | | — | |
| | | | | | | |
| KZT | | | 96,564,130 | | | USD | | | 200,133 | | | Citibank, N.A. | | | 11/1/22 | | | | 6,576 | | | | — | |
| | | | | | | |
| USD | | | 1,864,314 | | | EUR | | | 1,856,536 | | | JPMorgan Chase Bank, N.A. | | | 11/1/22 | | | | 29,593 | | | | — | |
| | | | | | | |
| USD | | | 206,232 | | | KZT | | | 96,564,128 | | | Citibank, N.A. | | | 11/1/22 | | | | — | | | | (477 | ) |
| | | | | | | |
| USD | | | 206,232 | | | KZT | | | 96,564,130 | | | Citibank, N.A. | | | 11/1/22 | | | | — | | | | (477 | ) |
| | | | | | | |
| USD | | | 956,558 | | | KZT | | | 447,889,195 | | | Citibank, N.A. | | | 11/1/22 | | | | — | | | | (2,211 | ) |
| | | | | | | |
| USD | | | 956,558 | | | KZT | | | 447,889,197 | | | Citibank, N.A. | | | 11/1/22 | | | | — | | | | (2,211 | ) |
| | | | | | | |
| USD | | | 999,208 | | | ZMW | | | 17,186,371 | | | Citibank, N.A. | | | 11/1/22 | | | | — | | | | (63,585 | ) |
| | | | | | | |
| EUR | | | 3,965,230 | | | USD | | | 3,917,394 | | | Bank of America, N.A. | | | 11/4/22 | | | | 1,778 | | | | — | |
| | | | | | | |
| EUR | | | 1,024,664 | | | USD | | | 1,031,788 | | | Bank of America, N.A. | | | 11/4/22 | | | | — | | | | (19,026 | ) |
| | | | | | | |
| EUR | | | 779,992 | | | USD | | | 781,638 | | | HSBC Bank USA, N.A. | | | 11/4/22 | | | | — | | | | (10,706 | ) |
| | | | | | | |
| EUR | | | 5,526,021 | | | USD | | | 5,362,506 | | | UBS AG | | | 11/4/22 | | | | 99,328 | | | | — | |
| | | | | | | |
| EUR | | | 5,078,071 | | | USD | | | 4,985,442 | | | UBS AG | | | 11/4/22 | | | | 33,645 | | | | — | |
| | | | | | | |
| EUR | | | 833,354 | | | USD | | | 810,787 | | | UBS AG | | | 11/4/22 | | | | 12,887 | | | | — | |
| | | | | | | |
| EUR | | | 203,091 | | | USD | | | 199,477 | | | UBS AG | | | 11/4/22 | | | | 1,255 | | | | — | |
| | | | | | | |
| EUR | | | 2,515,595 | | | USD | | | 2,506,660 | | | UBS AG | | | 11/4/22 | | | | — | | | | (20,284 | ) |
| | | | | | | |
| EUR | | | 1,514,353 | | | USD | | | 1,522,057 | | | UBS AG | | | 11/4/22 | | | | — | | | | (25,293 | ) |
| | | | | | | |
| USD | | | 788,950 | | | EUR | | | 798,584 | | | Bank of America, N.A. | | | 11/4/22 | | | | — | | | | (358 | ) |
| | | | | | | |
| USD | | | 146,056 | | | EUR | | | 148,206 | | | Bank of America, N.A. | | | 11/4/22 | | | | — | | | | (429 | ) |
| | | | | | | |
| USD | | | 776,219 | | | EUR | | | 798,746 | | | Citibank, N.A. | | | 11/4/22 | | | | — | | | | (13,250 | ) |
| | | | | | | |
| USD | | | 12,293,959 | | | EUR | | | 12,571,808 | | | Goldman Sachs International | | | 11/4/22 | | | | — | | | | (131,822 | ) |
| | | | | | | |
| USD | | | 2,971,490 | | | EUR | | | 3,054,089 | | | Standard Chartered Bank | | | 11/4/22 | | | | — | | | | (47,124 | ) |
| | | | | | | |
| USD | | | 6,996,472 | | | EUR | | | 7,155,998 | | | Standard Chartered Bank | | | 11/4/22 | | | | — | | | | (76,405 | ) |
| | | | | | | |
| USD | | | 13,493,129 | | | EUR | | | 13,848,750 | | | State Street Bank and Trust Company | | | 11/4/22 | | | | — | | | | (194,761 | ) |
| | | | | | | |
| USD | | | 297,516 | | | EUR | | | 306,456 | | | UBS AG | | | 11/4/22 | | | | — | | | | (5,380 | ) |
| | | | | | | |
| USD | | | 2,887,698 | | | EUR | | | 2,933,705 | | | UBS AG | | | 11/4/22 | | | | — | | | | (11,930 | ) |
| | | | | | | |
| USD | | | 1,903,672 | | | EUR | | | 1,939,593 | | | UBS AG | | | 11/4/22 | | | | — | | | | (13,392 | ) |
| | | | | | | |
| USD | | | 1,794,741 | | | EUR | | | 1,834,377 | | | UBS AG | | | 11/4/22 | | | | — | | | | (18,328 | ) |
| | | | | | | |
| USD | | | 1,991,740 | | | EUR | | | 2,053,050 | | | UBS AG | | | 11/4/22 | | | | — | | | | (37,463 | ) |
| | | | | | | |
| EUR | | | 2,156,669 | | | USD | | | 2,120,715 | | | JPMorgan Chase Bank, N.A. | | | 11/7/22 | | | | 11,340 | | | | — | |
| | | | | | | |
| KZT | | | 1,048,680,501 | | | USD | | | 2,156,669 | | | JPMorgan Chase Bank, N.A. | | | 11/7/22 | | | | 84,169 | | | | — | |
| | | | | | | |
| KZT | | | 1,044,364,979 | | | USD | | | 2,164,487 | | | JPMorgan Chase Bank, N.A. | | | 11/7/22 | | | | 67,130 | | | | — | |
| | | | | | | |
| TRY | | | 150,338,492 | | | USD | | | 7,861,042 | | | Standard Chartered Bank | | | 11/7/22 | | | | 191,914 | | | | — | |
| | | | | | | |
| USD | | | 2,156,738 | | | EUR | | | 2,156,669 | | | JPMorgan Chase Bank, N.A. | | | 11/7/22 | | | | 24,683 | | | | — | |
| | | | | | | |
| USD | | | 5,442,614 | | | TRY | | | 104,938,492 | | | Standard Chartered Bank | | | 11/7/22 | | | | — | | | | (178,469 | ) |
| | | | | | | |
| USD | | | 2,247,269 | | | TRY | | | 45,400,000 | | | Standard Chartered Bank | | | 11/7/22 | | | | — | | | | (184,605 | ) |
| | | | | | | |
| USD | | | 1,701,137 | | | ARS | | | 299,230,000 | | | Bank of America, N.A. | | | 11/14/22 | | | | — | | | | (142,582 | ) |
| | | | | | | |
| USD | | | 6,786,248 | | | ARS | | | 1,162,145,000 | | | Goldman Sachs International | | | 11/14/22 | | | | — | | | | (374,359 | ) |
| | | | | | | |
| USD | | | 640,203 | | | ZMW | | | 11,747,715 | | | Standard Chartered Bank | | | 11/16/22 | | | | — | | | | (84,058 | ) |
| | | | | | | |
| USD | | | 24,515,513 | | | CNH | | | 167,970,000 | | | Standard Chartered Bank | | | 11/17/22 | | | | 1,600,539 | | | | — | |
| | | | | | | |
| USD | | | 17,543,548 | | | CNH | | | 118,300,000 | | | Standard Chartered Bank | | | 11/17/22 | | | | 1,404,704 | | | | — | |
| | | | | | | |
| USD | | | 18,660,740 | | | CNH | | | 127,710,000 | | | Standard Chartered Bank | | | 11/17/22 | | | | 1,238,156 | | | | — | |
| | | | |
| | 35 | | See Notes to Consolidated Financial Statements. |
Global Macro Absolute Return Advantage Portfolio
October 31, 2022
Consolidated Portfolio of Investments — continued
| | | | | | | | | | | | | | | | | | | | | | | | |
| Forward Foreign Currency Exchange Contracts (OTC) (continued) | | | | | | | |
| | | | | |
| Currency Purchased | | | Currency Sold | | | Counterparty | | Settlement
Date | | | Unrealized
Appreciation | | | Unrealized
(Depreciation) | |
| | | | | | | |
| EUR | | | 5,501,475 | | | USD | | | 5,410,101 | | | UBS AG | | | 11/18/22 | | | $ | 32,837 | | | $ | — | |
| | | | | | | |
| KZT | | | 678,056,796 | | | USD | | | 1,375,369 | | | Citibank, N.A. | | | 11/18/22 | | | | 67,844 | | | | — | |
| | | | | | | |
| KZT | | | 677,644,187 | | | USD | | | 1,375,369 | | | Citibank, N.A. | | | 11/18/22 | | | | 66,965 | | | | — | |
| | | | | | | |
| KZT | | | 677,369,112 | | | USD | | | 1,375,369 | | | Citibank, N.A. | | | 11/18/22 | | | | 66,380 | | | | — | |
| | | | | | | |
| KZT | | | 677,025,269 | | | USD | | | 1,375,369 | | | Citibank, N.A. | | | 11/18/22 | | | | 65,648 | | | | — | |
| | | | | | | |
| USD | | | 2,815,180 | | | EUR | | | 2,750,737 | | | Standard Chartered Bank | | | 11/18/22 | | | | 93,712 | | | | — | |
| | | | | | | |
| USD | | | 2,791,986 | | | EUR | | | 2,750,738 | | | Standard Chartered Bank | | | 11/18/22 | | | | 70,517 | | | | — | |
| | | | | | | |
| USD | | | 1,684,386 | | | PHP | | | 99,420,000 | | | Standard Chartered Bank | | | 11/21/22 | | | | — | | | | (26,415 | ) |
| | | | | | | |
| EUR | | | 2,195,462 | | | USD | | | 2,160,466 | | | Citibank, N.A. | | | 11/22/22 | | | | 12,259 | | | | — | |
| | | | | | | |
| KZT | | | 540,742,307 | | | USD | | | 1,097,731 | | | Citibank, N.A. | | | 11/22/22 | | | | 51,578 | | | | — | |
| | | | | | | |
| KZT | | | 540,083,669 | | | USD | | | 1,097,731 | | | Citibank, N.A. | | | 11/22/22 | | | | 50,178 | | | | — | |
| | | | | | | |
| USD | | | 2,218,886 | | | EUR | | | 2,195,462 | | | UBS AG | | | 11/22/22 | | | | 46,161 | | | | — | |
| | | | | | | |
| USD | | | 2,890,801 | | | KES | | | 388,090,043 | | | ICBC Standard Bank plc | | | 11/23/22 | | | | — | | | | (271,145 | ) |
| | | | | | | |
| USD | | | 2,890,801 | | | KES | | | 388,090,043 | | | ICBC Standard Bank plc | | | 11/23/22 | | | | — | | | | (271,145 | ) |
| | | | | | | |
| EUR | | | 916,370 | | | USD | | | 902,069 | | | UBS AG | | | 11/25/22 | | | | 5,006 | | | | — | |
| | | | | | | |
| KZT | | | 443,522,848 | | | USD | | | 916,370 | | | JPMorgan Chase Bank, N.A. | | | 11/25/22 | | | | 25,303 | | | | — | |
| | | | | | | |
| UGX | | | 37,026,804,000 | | | USD | | | 9,660,006 | | | Standard Chartered Bank | | | 11/25/22 | | | | 46,873 | | | | — | |
| | | | | | | |
| USD | | | 920,306 | | | EUR | | | 916,370 | | | Standard Chartered Bank | | | 11/25/22 | | | | 13,232 | | | | — | |
| | | | | | | |
| EUR | | | 5,488,655 | | | USD | | | 5,403,900 | | | Citibank, N.A. | | | 11/28/22 | | | | 30,250 | | | | — | |
| | | | | | | |
| KZT | | | 2,701,790,508 | | | USD | | | 5,488,655 | | | Citibank, N.A. | | | 11/28/22 | | | | 241,592 | | | | — | |
| | | | | | | |
| KZT | | | 1,077,423,011 | | | USD | | | 2,195,462 | | | Citibank, N.A. | | | 11/28/22 | | | | 89,652 | | | | — | |
| | | | | | | |
| KZT | | | 1,075,227,547 | | | USD | | | 2,195,462 | | | Citibank, N.A. | | | 11/28/22 | | | | 84,996 | | | | — | |
| | | | | | | |
| USD | | | 5,526,516 | | | EUR | | | 5,488,655 | | | UBS AG | | | 11/28/22 | | | | 92,366 | | | | — | |
| | | | | | | |
| EUR | | | 1,470,186 | | | USD | | | 1,447,940 | | | JPMorgan Chase Bank, N.A. | | | 12/2/22 | | | | 8,064 | | | | — | |
| | | | | | | |
| KZT | | | 715,613,046 | | | USD | | | 1,470,186 | | | JPMorgan Chase Bank, N.A. | | | 12/2/22 | | | | 45,413 | | | | — | |
| | | | | | | |
| KZT | | | 160,756,578 | | | USD | | | 330,265 | | | JPMorgan Chase Bank, N.A. | | | 12/2/22 | | | | 10,202 | | | | — | |
| | | | | | | |
| USD | | | 1,475,230 | | | EUR | | | 1,470,186 | | | Standard Chartered Bank | | | 12/2/22 | | | | 19,226 | | | | — | |
| | | | | | | |
| KZT | | | 2,357,862,084 | | | USD | | | 4,826,739 | | | JPMorgan Chase Bank, N.A. | | | 12/6/22 | | | | 159,056 | | | | — | |
| | | | | | | |
| KZT | | | 859,412,954 | | | USD | | | 1,767,430 | | | JPMorgan Chase Bank, N.A. | | | 12/6/22 | | | | 49,834 | | | | — | |
| | | | | | | |
| KZT | | | 1,355,605,264 | | | USD | | | 2,770,782 | | | Citibank, N.A. | | | 12/7/22 | | | | 94,563 | | | | — | |
| | | | | | | |
| AED | | | 72,500,000 | | | USD | | | 19,732,344 | | | Standard Chartered Bank | | | 12/12/22 | | | | 5,073 | | | | — | |
| | | | | | | |
| AED | | | 173,933,000 | | | USD | | | 47,373,825 | | | Standard Chartered Bank | | | 12/12/22 | | | | — | | | | (22,263 | ) |
| | | | | | | |
| SGD | | | 16,980,000 | | | USD | | | 11,794,009 | | | Goldman Sachs International | | | 12/12/22 | | | | 203,799 | | | | — | |
| | | | | | | |
| SGD | | | 12,471,400 | | | USD | | | 8,658,319 | | | Goldman Sachs International | | | 12/12/22 | | | | 153,781 | | | | — | |
| | | | | | | |
| SGD | | | 22,530,000 | | | USD | | | 15,885,103 | | | Goldman Sachs International | | | 12/12/22 | | | | 34,250 | | | | — | |
| | | | | | | |
| SGD | | | 12,960,000 | | | USD | | | 9,128,303 | | | Standard Chartered Bank | | | 12/12/22 | | | | 29,034 | | | | — | |
| | | | | | | |
| SGD | | | 11,460,000 | | | USD | | | 8,072,782 | | | Standard Chartered Bank | | | 12/12/22 | | | | 24,678 | | | | — | |
| | | | | | | |
| SGD | | | 22,800,000 | | | USD | | | 16,233,246 | | | Standard Chartered Bank | | | 12/12/22 | | | | — | | | | (123,116 | ) |
| | | | | | | |
| SGD | | | 26,302,400 | | | USD | | | 18,733,036 | | | Standard Chartered Bank | | | 12/12/22 | | | | — | | | | (148,163 | ) |
| | | | | | | |
| SGD | | | 22,600,000 | | | USD | | | 15,923,948 | | | UBS AG | | | 12/12/22 | | | | 44,865 | | | | — | |
| | | | | | | |
| SGD | | | 19,590,000 | | | USD | | | 13,804,106 | | | UBS AG | | | 12/12/22 | | | | 37,888 | | | | — | |
| | | | | | | |
| USD | | | 33,420,810 | | | AED | | | 123,212,500 | | | Standard Chartered Bank | | | 12/12/22 | | | | — | | | | (122,591 | ) |
| | | | | | | |
| USD | | | 33,420,899 | | | AED | | | 123,220,500 | | | Standard Chartered Bank | | | 12/12/22 | | | | — | | | | (124,680 | ) |
| | | | | | | |
| USD | | | 1,470,777 | | | ARS | | | 270,770,000 | | | Bank of America, N.A. | | | 12/12/22 | | | | — | | | | (73,132 | ) |
| | | | | | | |
| KZT | | | 1,055,693,284 | | | USD | | | 2,157,779 | | | JPMorgan Chase Bank, N.A. | | | 12/13/22 | | | | 68,342 | | | | — | |
| | | | |
| | 36 | | See Notes to Consolidated Financial Statements. |
Global Macro Absolute Return Advantage Portfolio
October 31, 2022
Consolidated Portfolio of Investments — continued
| | | | | | | | | | | | | | | | | | | | | | | | |
| Forward Foreign Currency Exchange Contracts (OTC) (continued) | | | | | | | |
| | | | | |
| Currency Purchased | | | Currency Sold | | | Counterparty | | Settlement
Date | | | Unrealized
Appreciation | | | Unrealized
(Depreciation) | |
| | | | | | | |
| KZT | | | 1,054,074,948 | | | USD | | | 2,157,779 | | | JPMorgan Chase Bank, N.A. | | | 12/13/22 | | | $ | 64,929 | �� | | $ | — | |
| | | | | | | |
| USD | | | 853,603 | | | ZMW | | | 15,834,339 | | | ICBC Standard Bank plc | | | 12/13/22 | | | | — | | | | (116,505 | ) |
| | | | | | | |
| USD | | | 1,067,004 | | | ZMW | | | 19,462,153 | | | ICBC Standard Bank plc | | | 12/13/22 | | | | — | | | | (125,367 | ) |
| | | | | | | |
| EUR | | | 9,339,516 | | | PLN | | | 44,834,346 | | | Standard Chartered Bank | | | 12/14/22 | | | | — | | | | (70,680 | ) |
| | | | | | | |
| EUR | | | 9,339,516 | | | PLN | | | 44,834,348 | | | Standard Chartered Bank | | | 12/14/22 | | | | — | | | | (70,680 | ) |
| | | | | | | |
| TRY | | | 3,346,586 | | | USD | | | 167,816 | | | Standard Chartered Bank | | | 12/14/22 | | | | 6,230 | | | | — | |
| | | | | | | |
| USD | | | 29,801,366 | | | OMR | | | 11,800,000 | | | BNP Paribas | | | 12/14/22 | | | | — | | | | (865,409 | ) |
| | | | | | | |
| USD | | | 13,614,978 | | | TRY | | | 267,807,394 | | | Standard Chartered Bank | | | 12/14/22 | | | | — | | | | (312,851 | ) |
| | | | | | | |
| USD | | | 15,982,840 | | | ZAR | | | 296,033,000 | | | Standard Chartered Bank | | | 12/14/22 | | | | — | | | | (80,802 | ) |
| | | | | | | |
| USD | | | 15,943,594 | | | ZAR | | | 296,033,000 | | | Standard Chartered Bank | | | 12/14/22 | | | | — | | | | (120,048 | ) |
| | | | | | | |
| EUR | | | 3,236,668 | | | USD | | | 3,190,175 | | | JPMorgan Chase Bank, N.A. | | | 12/15/22 | | | | 19,554 | | | | — | |
| | | | | | | |
| KZT | | | 1,587,585,761 | | | USD | | | 3,236,668 | | | JPMorgan Chase Bank, N.A. | | | 12/15/22 | | | | 108,396 | | | | — | |
| | | | | | | |
| USD | | | 3,256,938 | | | EUR | | | 3,236,668 | | | Bank of America, N.A. | | | 12/15/22 | | | | 47,208 | | | | — | |
| | | | | | | |
| USD | | | 9,337,047 | | | ZAR | | | 169,830,000 | | | Bank of America, N.A. | | | 12/15/22 | | | | 122,247 | | | | — | |
| | | | | | | |
| USD | | | 15,056,406 | | | ZAR | | | 268,139,532 | | | State Street Bank and Trust Company | | | 12/15/22 | | | | 507,433 | | | | — | |
| | | | | | | |
| USD | | | 10,092,713 | | | ZAR | | | 178,212,081 | | | State Street Bank and Trust Company | | | 12/15/22 | | | | 423,110 | | | | — | |
| | | | | | | |
| USD | | | 7,605,933 | | | ZAR | | | 133,659,061 | | | State Street Bank and Trust Company | | | 12/15/22 | | | | 353,731 | | | | — | |
| | | | | | | |
| USD | | | 5,070,622 | | | ZAR | | | 89,106,040 | | | State Street Bank and Trust Company | | | 12/15/22 | | | | 235,821 | | | | — | |
| | | | | | | |
| USD | | | 48,259,570 | | | ZAR | | | 871,634,000 | | | UBS AG | | | 12/15/22 | | | | 965,613 | | | | — | |
| | | | | | | |
| ZAR | | | 20,224,163 | | | USD | | | 1,145,358 | | | State Street Bank and Trust Company | | | 12/15/22 | | | | — | | | | (48,016 | ) |
| | | | | | | |
| ZAR | | | 20,224,163 | | | USD | | | 1,150,866 | | | State Street Bank and Trust Company | | | 12/15/22 | | | | — | | | | (53,524 | ) |
| | | | | | | |
| ZAR | | | 20,224,163 | | | USD | | | 1,150,866 | | | State Street Bank and Trust Company | | | 12/15/22 | | | | — | | | | (53,524 | ) |
| | | | | | | |
| ZAR | | | 61,446,936 | | | USD | | | 3,450,331 | | | State Street Bank and Trust Company | | | 12/15/22 | | | | — | | | | (116,283 | ) |
| | | | | | | |
| CZK | | | 518,000,000 | | | EUR | | | 20,885,067 | | | UBS AG | | | 12/16/22 | | | | 138,555 | | | | — | |
| | | | | | | |
| EUR | | | 20,795,997 | | | CZK | | | 518,000,000 | | | UBS AG | | | 12/16/22 | | | | — | | | | (226,893 | ) |
| | | | | | | |
| THB | | | 400,000 | | | USD | | | 10,866 | | | Standard Chartered Bank | | | 12/21/22 | | | | — | | | | (310 | ) |
| | | | | | | |
| THB | | | 412,924 | | | USD | | | 11,216 | | | Standard Chartered Bank | | | 12/21/22 | | | | — | | | | (319 | ) |
| | | | | | | |
| THB | | | 400,000 | | | USD | | | 10,896 | | | Standard Chartered Bank | | | 12/21/22 | | | | — | | | | (340 | ) |
| | | | | | | |
| USD | | | 6,095,696 | | | MYR | | | 27,900,000 | | | Barclays Bank PLC | | | 12/21/22 | | | | 192,888 | | | | — | |
| | | | | | | |
| USD | | | 61,920,363 | | | MYR | | | 279,911,000 | | | Goldman Sachs International | | | 12/21/22 | | | | 2,699,543 | | | | — | |
| | | | | | | |
| USD | | | 6,879,983 | | | MYR | | | 31,500,000 | | | Goldman Sachs International | | | 12/21/22 | | | | 215,522 | | | | — | |
| | | | | | | |
| USD | | | 6,098,361 | | | MYR | | | 27,900,000 | | | Goldman Sachs International | | | 12/21/22 | | | | 195,553 | | | | — | |
| | | | | | | |
| USD | | | 28,993,286 | | | THB | | | 1,062,250,000 | | | Standard Chartered Bank | | | 12/21/22 | | | | 960,641 | | | | — | |
| | | | | | | |
| USD | | | 10,415,620 | | | THB | | | 381,420,000 | | | Standard Chartered Bank | | | 12/21/22 | | | | 349,994 | | | | — | |
| | | | | | | |
| USD | | | 8,079,905 | | | THB | | | 307,400,000 | | | Standard Chartered Bank | | | 12/21/22 | | | | — | | | | (32,342 | ) |
| | | | | | | |
| USD | | | 10,014,190 | | | THB | | | 381,100,000 | | | Standard Chartered Bank | | | 12/21/22 | | | | — | | | | (42,992 | ) |
| | | | | | | |
| USD | | | 21,387,869 | | | THB | | | 813,509,000 | | | Standard Chartered Bank | | | 12/21/22 | | | | — | | | | (80,532 | ) |
| | | | | | | |
| CNH | | | 114,340,000 | | | USD | | | 17,101,329 | | | Standard Chartered Bank | | | 12/22/22 | | | | — | | | | (1,470,033 | ) |
| | | | | | | |
| CNH | | | 129,433,199 | | | USD | | | 19,355,018 | | | Standard Chartered Bank | | | 12/22/22 | | | | — | | | | (1,660,347 | ) |
| | | | | | | |
| USD | | | 12,564,278 | | | CNH | | | 84,100,000 | | | Bank of America, N.A. | | | 12/22/22 | | | | 1,067,059 | | | | — | |
| | | | | | | |
| USD | | | 12,695,671 | | | CNH | | | 85,200,000 | | | Bank of America, N.A. | | | 12/22/22 | | | | 1,048,072 | | | | — | |
| | | | | | | |
| USD | | | 12,426,269 | | | CNH | | | 83,339,000 | | | Bank of America, N.A. | | | 12/22/22 | | | | 1,033,086 | | | | — | |
| | | | | | | |
| USD | | | 39,711,175 | | | CNH | | | 265,800,000 | | | BNP Paribas | | | 12/22/22 | | | | 3,373,948 | | | | — | |
| | | | | | | |
| USD | | | 11,658,008 | | | CNH | | | 78,000,000 | | | BNP Paribas | | | 12/22/22 | | | | 994,713 | | | | — | |
| | | | | | | |
| USD | | | 9,098,791 | | | CNH | | | 60,900,000 | | | JPMorgan Chase Bank, N.A. | | | 12/22/22 | | | | 773,219 | | | | — | |
| | | | |
| | 37 | | See Notes to Consolidated Financial Statements. |
Global Macro Absolute Return Advantage Portfolio
October 31, 2022
Consolidated Portfolio of Investments — continued
| | | | | | | | | | | | | | | | | | | | | | | | |
| Forward Foreign Currency Exchange Contracts (OTC) (continued) | | | | | | | |
| | | | | |
| Currency Purchased | | | Currency Sold | | | Counterparty | | Settlement
Date | | | Unrealized
Appreciation | | | Unrealized
(Depreciation) | |
| | | | | | | |
| USD | | | 13,735,179 | | | CNH | | | 92,200,000 | | | Standard Chartered Bank | | | 12/22/22 | | | $ | 1,130,618 | | | $ | — | |
| | | | | | | |
| USD | | | 12,741,080 | | | CNH | | | 85,300,000 | | | Standard Chartered Bank | | | 12/22/22 | | | | 1,079,810 | | | | — | |
| | | | | | | |
| USD | | | 10,860,391 | | | CNH | | | 72,700,000 | | | Standard Chartered Bank | | | 12/22/22 | | | | 921,654 | | | | — | |
| | | | | | | |
| USD | | | 9,504,695 | | | CNH | | | 63,600,000 | | | Standard Chartered Bank | | | 12/22/22 | | | | 810,009 | | | | — | |
| | | | | | | |
| USD | | | 514,947 | | | ZMW | | | 8,585,454 | | | Societe Generale | | | 1/19/23 | | | | — | | | | (6,263 | ) |
| | | | | | | |
| USD | | | 2,077,725 | | | ZMW | | | 35,944,636 | | | Goldman Sachs International | | | 1/26/23 | | | | — | | | | (100,303 | ) |
| | | | | | | |
| USD | | | 623,317 | | | ZMW | | | 10,745,992 | | | Societe Generale | | | 1/26/23 | | | | — | | | | (27,825 | ) |
| | | | | | | |
| USD | | | 622,695 | | | ZMW | | | 10,694,777 | | | Societe Generale | | | 1/30/23 | | | | — | | | | (24,646 | ) |
| | | | | | | |
| USD | | | 649,773 | | | ZMW | | | 12,387,917 | | | Societe Generale | | | 2/17/23 | | | | — | | | | (96,150 | ) |
| | | | | | | |
| AED | | | 215,000,000 | | | USD | | | 58,551,039 | | | BNP Paribas | | | 3/1/23 | | | | — | | | | (22,084 | ) |
| | | | | | | |
| USD | | | 58,402,155 | | | AED | | | 215,000,000 | | | BNP Paribas | | | 3/1/23 | | | | — | | | | (126,800 | ) |
| | | | | | | |
| AED | | | 28,500,000 | | | USD | | | 7,761,966 | | | BNP Paribas | | | 3/6/23 | | | | — | | | | (3,495 | ) |
| | | | | | | |
| USD | | | 81,979,737 | | | AED | | | 301,839,143 | | | BNP Paribas | | | 3/6/23 | | | | — | | | | (189,050 | ) |
| | | | | | | |
| USD | | | 30,000,000 | | | AED | | | 110,456,400 | | | BNP Paribas | | | 3/13/23 | | | | — | | | | (69,126 | ) |
| | | | | | | |
| USD | | | 109,556,452 | | | AED | | | 403,354,537 | | | BNP Paribas | | | 3/13/23 | | | | — | | | | (247,220 | ) |
| | | | | | | |
| USD | | | 12,664,006 | | | SAR | | | 47,604,000 | | | Standard Chartered Bank | | | 3/13/23 | | | | 5,967 | | | | — | |
| | | | | | | |
| USD | | | 26,361,023 | | | SAR | | | 99,041,000 | | | Standard Chartered Bank | | | 3/14/23 | | | | 25,742 | | | | — | |
| | | | | | | |
| AED | | | 540,959,063 | | | USD | | | 147,328,031 | | | Standard Chartered Bank | | | 3/15/23 | | | | — | | | | (64,937 | ) |
| | | | | | | |
| OMR | | | 8,900,000 | | | USD | | | 23,099,484 | | | Standard Chartered Bank | | | 3/15/23 | | | | 32,539 | | | | — | |
| | | | | | | |
| USD | | | 146,927,879 | | | AED | | | 540,959,063 | | | Standard Chartered Bank | | | 3/15/23 | | | | — | | | | (335,216 | ) |
| | | | | | | |
| USD | | | 20,104,768 | | | BHD | | | 7,651,000 | | | Standard Chartered Bank | | | 3/15/23 | | | | — | | | | (144,148 | ) |
| | | | | | | |
| USD | | | 22,725,930 | | | OMR | | | 8,900,000 | | | Standard Chartered Bank | | | 3/15/23 | | | | — | | | | (406,092 | ) |
| | | | | | | |
| USD | | | 15,256,481 | | | BHD | | | 5,771,878 | | | Standard Chartered Bank | | | 3/16/23 | | | | — | | | | (18,967 | ) |
| | | | | | | |
| UGX | | | 45,000,000,000 | | | USD | | | 11,337,868 | | | Deutsche Bank AG | | | 3/20/23 | | | | 109,683 | | | | — | |
| | | | | | | |
| USD | | | 426,802 | | | ZMW | | | 8,386,651 | | | Standard Chartered Bank | | | 5/17/23 | | | | — | | | | (64,838 | ) |
| | | | | | | |
| USD | | | 2,890,801 | | | KES | | | 413,384,553 | | | Standard Chartered Bank | | | 5/25/23 | | | | — | | | | (198,003 | ) |
| | | | | | | |
| USD | | | 2,227,208 | | | KES | | | 324,058,799 | | | Standard Chartered Bank | | | 6/12/23 | | | | — | | | | (170,347 | ) |
| | | | | | | |
| USD | | | 9,511,645 | | | AED | | | 35,000,000 | | | BNP Paribas | | | 6/21/23 | | | | — | | | | (16,018 | ) |
| | | | | | | |
| USD | | | 9,036,785 | | | SAR | | | 34,000,000 | | | Standard Chartered Bank | | | 7/13/23 | | | | — | | | | (3,092 | ) |
| | | | | | | |
| USD | | | 9,749,607 | | | EGP | | | 214,881,345 | | | Goldman Sachs International | | | 7/20/23 | | | | 1,502,747 | | | | — | |
| | | | | | | |
| USD | | | 6,422,037 | | | EGP | | | 143,147,195 | | | Goldman Sachs International | | | 7/20/23 | | | | 928,238 | | | | — | |
| | | | | | | |
| USD | | | 6,422,037 | | | EGP | | | 144,688,484 | | | Goldman Sachs International | | | 7/27/23 | | | | 880,978 | | | | — | |
| | | | | | | |
| USD | | | 1,734,474 | | | KES | | | 263,640,000 | | | Standard Chartered Bank | | | 8/4/23 | | | | — | | | | (163,509 | ) |
| | | | | | | |
| OMR | | | 14,300,000 | | | USD | | | 37,090,168 | | | Standard Chartered Bank | | | 8/23/23 | | | | 59,375 | | | | — | |
| | | | | | | |
| USD | | | 36,694,600 | | | OMR | | | 14,300,000 | | | Standard Chartered Bank | | | 8/23/23 | | | | — | | | | (454,943 | ) |
| | | | | | | |
| OMR | | | 10,000,000 | | | USD | | | 25,940,545 | | | Standard Chartered Bank | | | 11/6/23 | | | | 36,305 | | | | — | |
| | | | | | | |
| USD | | | 48,448,681 | | | OMR | | | 18,858,800 | | | Standard Chartered Bank | | | 11/6/23 | | | | — | | | | (540,540 | ) |
| | | | | | | |
| USD | | | 28,368,794 | | | OMR | | | 11,000,000 | | | Standard Chartered Bank | | | 2/22/24 | | | | — | | | | (189,411 | ) |
| | | | | | | |
| USD | | | 26,205,980 | | | SAR | | | 98,600,000 | | | Standard Chartered Bank | | | 3/14/24 | | | | 750 | | | | — | |
| | | | | | | |
| USD | | | 12,408,845 | | | BHD | | | 4,730,872 | | | Standard Chartered Bank | | | 3/18/24 | | | | — | | | | (50,318 | ) |
| | | | | | | |
| USD | | | 17,098,499 | | | BHD | | | 6,518,000 | | | Standard Chartered Bank | | | 3/18/24 | | | | — | | | | (67,221 | ) |
| | | | | | | |
| USD | | | 26,650,006 | | | OMR | | | 10,530,750 | | | Standard Chartered Bank | | | 8/29/24 | | | | — | | | | (662,619 | ) |
| | | | | | | |
| | | | | | | | | | | | | | | | | | | $ | 30,548,134 | | | $ | (12,852,613 | ) |
| | | | |
| | 38 | | See Notes to Consolidated Financial Statements. |
Global Macro Absolute Return Advantage Portfolio
October 31, 2022
Consolidated Portfolio of Investments — continued
| | | | | | | | | | | | | | | | | | |
| Non-Deliverable Bond Forward Contracts* | |
| | | | | |
| Settlement Date | | Notional Amount
(000’s omitted) | | | Reference Entity | | Counterparty | | Aggregate Cost | | | Unrealized
Appreciation
(Depreciation) | |
| | | | | | |
| 11/21/22 | | COP | | | 67,019,600 | | | Republic of Colombia,
6.25%, 11/26/25 | | Bank of America, N.A. | | $ | 13,570,154 | | | $ | (231,968) | |
| | | | | | |
| 11/22/22 | | COP | | | 43,897,680 | | | Republic of Colombia,
5.75%, 11/3/27 | | Bank of America, N.A. | | | 8,888,419 | | | | (363,714 | ) |
| | | | | | |
| 11/23/22 | | COP | | | 81,564,000 | | | Republic of Colombia,
6.25%, 11/26/25 | | Goldman Sachs International | | | 16,515,110 | | | | 230,022 | |
| | | | | | |
| 12/3/22 | | COP | | | 20,311,040 | | | Republic of Colombia,
6.00%, 4/28/28 | | Goldman Sachs International | | | 4,112,587 | | | | 15,578 | |
| | | | | | |
| 12/7/22 | | COP | | | 40,781,000 | | | Republic of Colombia,
6.25%, 11/26/25 | | Bank of America, N.A. | | | 8,257,353 | | | | (51,551 | ) |
| | | | | | |
| 12/8/22 | | COP | | | 69,263,320 | | | Republic of Colombia,
5.75%, 11/3/27 | | Bank of America, N.A. | | | 14,024,464 | | | | 642,040 | |
| | | | | | |
| 12/8/22 | | COP | | | 87,159,300 | | | Republic of Colombia,
6.25%, 11/26/25 | | Bank of America, N.A. | | | 17,648,049 | | | | 561,455 | |
| | | | | | |
| 12/8/22 | | COP | | | 9,217,000 | | | Republic of Colombia, 6.25%, 11/26/25 | | Goldman Sachs International | | | 1,866,262 | | | | (43,066 | ) |
| | | | | | |
| 12/14/22 | | COP | | | 13,827,000 | | | Republic of Colombia,
6.25%, 11/26/25 | | Goldman Sachs International | | | 2,799,696 | | | | (9,603 | ) |
| | | | | | |
| 12/15/22 | | COP | | | 80,203,600 | | | Republic of Colombia,
6.25%, 11/26/25 | | Goldman Sachs International | | | 16,239,656 | | | | (132,304 | ) |
| | | | | | |
| 12/16/22 | | COP | | | 119,481,100 | | | Republic of Colombia,
6.25%, 11/26/25 | | Goldman Sachs International | | | 24,192,579 | | | | 383,985 | |
| | | | | | |
| 12/19/22 | | COP | | | 88,592,000 | | | Republic of Colombia,
6.25%, 11/26/25 | | Goldman Sachs International | | | 17,938,142 | | | | (130,895 | ) |
| | | | | | |
| 12/20/22 | | COP | | | 29,239,600 | | | Republic of Colombia,
6.25%, 11/26/25 | | Goldman Sachs International | | | 5,920,445 | | | | (1,522 | ) |
| | | | | | |
| 12/21/22 | | COP | | | 79,082,100 | | | Republic of Colombia,
6.25%, 11/26/25 | | Goldman Sachs International | | | 16,012,574 | | | | 532,434 | |
| | | | | | |
| 12/23/22 | | COP | | | 115,547,000 | | | Republic of Colombia,
6.25%, 11/26/25 | | Goldman Sachs International | | | 23,396,001 | | | | 747,081 | |
| | | | | | |
| 1/10/23 | | COP | | | 66,549,200 | | | Republic of Colombia,
6.25%, 11/26/25 | | Goldman Sachs International | | | 13,474,908 | | | | — | |
| | | | | | |
| | | | | | | | | | | | | | | | | $ | 2,147,972 | |
| * | Represents a short-term forward contract to purchase the reference entity denominated in a non-deliverable foreign currency. |
| | | | | | | | | | | | | | | | | | | | |
| Futures Contracts | |
| | | | | |
| Description | | Number of
Contracts | | | Position | | | Expiration
Date | | | Notional
Amount | | | Value/Unrealized
Appreciation
(Depreciation) | |
| | | | | |
Commodity Futures | | | | | | | | | | | | | | | | | | | | |
| | | | | |
| WTI Crude Oil | | | 876 | | | | Long | | | | 2/21/23 | | | $ | 72,602,881 | | | $ | 6,663,772 | |
| | | | | |
| WTI Crude Oil | | | (833 | ) | | | Short | | | | 11/21/22 | | | | (72,079,490 | ) | | | 1,415,397 | |
| | | | | |
Equity Futures | | | | | | | | | | | | | | | | | | | | |
| | | | | |
| S&P/TSX 60 Index | | | (90 | ) | | | Short | | | | 12/15/22 | | | | (15,558,997 | ) | | | (203,808 | ) |
| | | | | |
| SGX CNX Nifty Index | | | (553 | ) | | | Short | | | | 11/24/22 | | | | (20,000,814 | ) | | | (459,055 | ) |
| | | | |
| | 39 | | See Notes to Consolidated Financial Statements. |
Global Macro Absolute Return Advantage Portfolio
October 31, 2022
Consolidated Portfolio of Investments — continued
| | | | | | | | | | | | | | | | | | | | |
| Futures Contracts (continued) | |
| | | | | |
| Description | | Number of
Contracts | | | Position | | | Expiration
Date | | | Notional
Amount | | | Value/Unrealized
Appreciation
(Depreciation) | |
| | | | | |
Interest Rate Futures | | | | | | | | | | | | | | | | | | | | |
| | | | | |
| Australia 10-Year Treasury Bond | | | 516 | | | | Long | | | | 12/15/22 | | | $ | 39,105,975 | | | $ | (279,531 | ) |
| | | | | |
| Euro-Buxl | | | 13 | | | | Long | | | | 12/8/22 | | | | 1,852,830 | | | | (183,468 | ) |
| | | | | |
| U.S. 10-Year Treasury Note | | | 182 | | | | Long | | | | 12/20/22 | | | | 20,128,062 | | | | (59,329 | ) |
| | | | | |
| Euro-Bobl | | | (453 | ) | | | Short | | | | 12/8/22 | | | | (53,573,521 | ) | | | 561,742 | |
| | | | | |
| Euro-Bund | | | (198 | ) | | | Short | | | | 12/8/22 | | | | (27,089,031 | ) | | | (116,902 | ) |
| | | | | |
| Japan 10-Year Bond | | | (69 | ) | | | Short | | | | 12/13/22 | | | | (69,034,803 | ) | | | (161,450 | ) |
| | | | | |
| U.S. 5-Year Treasury Note | | | (188 | ) | | | Short | | | | 12/30/22 | | | | (20,039,625 | ) | | | 13,338 | |
| | | | | |
| U.S. Ultra 10-Year Treasury Note | | | (596 | ) | | | Short | | | | 12/20/22 | | | | (69,126,687 | ) | | | 5,988,116 | |
| | | | | |
| U.S. Ultra-Long Treasury Bond | | | (390 | ) | | | Short | | | | 12/20/22 | | | | (49,785,938 | ) | | | 8,613,109 | |
| | | | | |
| | | | | | | | | | | | | | | | | | | $ | 21,791,931 | |
| | | | | | | | | | | | | | | | | | |
| Inflation Swaps (Centrally Cleared) | |
| | | | | | |
Notional Amount
(000’s omitted) | | Portfolio
Pays/Receives
Return on
Reference Index | | Reference Index | | Portfolio
Pays/Receives
Rate | | Annual
Rate | | Termination
Date | | | Value/Unrealized
Appreciation
(Depreciation) | |
| | | | | | | |
| EUR | | 11,000 | | Receives | | Eurostat Eurozone HICP ex Tobacco NSA (pays upon termination) | | Pays | | 2.20%
(pays upon termination) | | | 10/15/36 | | | $ | 1,270,394 | |
| | | | | | | |
| EUR | | 10,900 | | Receives | | Eurostat Eurozone HICP ex Tobacco NSA (pays upon termination) | | Pays | | 2.20%
(pays upon termination) | | | 10/15/36 | | | | 1,260,074 | |
| | | | | | | |
| EUR | | 10,900 | | Receives | | Eurostat Eurozone HICP ex Tobacco NSA (pays upon termination) | | Pays | | 2.20%
(pays upon termination) | | | 10/15/36 | | | | 1,260,074 | |
| | | | | | | |
| EUR | | 11,410 | | Receives | | Eurostat Eurozone HICP ex Tobacco NSA (pays upon termination) | | Pays | | 2.08%
(pays upon termination) | | | 1/15/37 | | | | 1,394,321 | |
| | | | | | | |
| EUR | | 10,900 | | Pays | | Eurostat Eurozone HICP ex Tobacco NSA (pays upon termination) | | Receives | | 2.29%
(pays upon termination) | | | 10/15/46 | | | | (1,482,616 | ) |
| | | | | | | |
| EUR | | 10,900 | | Pays | | Eurostat Eurozone HICP ex Tobacco NSA (pays upon termination) | | Receives | | 2.29%
(pays upon termination) | | | 10/15/46 | | | | (1,486,413 | ) |
| | | | | | | |
| EUR | | 11,000 | | Pays | | Eurostat Eurozone HICP ex Tobacco NSA (pays upon termination) | | Receives | | 2.29%
(pays upon termination) | | | 10/15/46 | | | | (1,496,218 | ) |
| | | | | | | |
| EUR | | 11,410 | | Pays | | Eurostat Eurozone HICP ex Tobacco NSA (pays upon termination) | | Receives | | 2.18%
(pays upon termination) | | | 1/15/47 | | | | (1,743,233 | ) |
| | | | | | | |
| EUR | | 4,350 | | Pays | | Eurostat Eurozone HICP ex Tobacco NSA (pays upon termination) | | Receives | | 1.10%
(pays upon termination) | | | 3/12/50 | | | | (1,906,174 | ) |
| | | | | | | |
| USD | | 42,510 | | Pays | | Return on CPI-U (NSA) (pays upon termination) | | Receives | | 2.90%
(pays upon termination) | | | 1/11/27 | | | | (1,791,340 | ) |
| | | | | | | |
| USD | | 51,550 | | Pays | | Return on CPI-U (NSA) (pays upon termination) | | Receives | | 2.75%
(pays upon termination) | | | 10/29/36 | | | | (2,188,836 | ) |
| | | | |
| | 40 | | See Notes to Consolidated Financial Statements. |
Global Macro Absolute Return Advantage Portfolio
October 31, 2022
Consolidated Portfolio of Investments — continued
| | | | | | | | | | | | | | | | | | | | | | |
| Inflation Swaps (Centrally Cleared) (continued) | |
| | | | | | |
Notional Amount
(000’s omitted) | | Portfolio
Pays/Receives
Return on
Reference Index | | | Reference Index | | Portfolio
Pays/Receives
Rate | | Annual
Rate | | | Termination
Date | | | Value/Unrealized
Appreciation
(Depreciation) | |
| | | | | | | |
| USD | | 18,160 | | | Pays | | | Return on CPI-U (NSA) (pays upon termination) | | Receives | |
| 2.67%
(pays upon termination) |
| | | 1/7/37 | | | $ | (782,665 | ) |
| | | | | | | |
| USD | | 34,300 | | | Receives | | | Return on CPI-U (NSA) (pays upon termination) | | Pays | |
| 2.62%
(pays upon termination) |
| | | 10/29/46 | | | | 1,485,106 | |
| | | | | | | |
| USD | | 17,300 | | | Receives | | | Return on CPI-U (NSA) (pays upon termination) | | Pays | |
| 2.62%
(pays upon termination) |
| | | 10/29/46 | | | | 742,079 | |
| | | | | | | |
| USD | | 18,140 | | | Receives | | | Return on CPI-U (NSA) (pays upon termination) | | Pays | |
| 2.54%
(pays upon termination) |
| | | 1/7/47 | | | | 934,020 | |
| | | | | | | |
| USD | | 5,824 | | | Receives | | | Return on CPI-U (NSA) (pays upon termination) | | Pays | |
| 2.42%
(pays upon termination) |
| | | 6/8/48 | | | | 589,764 | |
| | | | | | | |
| USD | | 18,700 | | | Receives | | | Return on CPI-U (NSA) (pays upon termination) | | Pays | |
| 2.43%
(pays upon termination) |
| | | 7/18/52 | | | | 1,044,212 | |
| | | | | | | |
| | | | | | | | | | | | | | | | | | | | | $ | (2,897,451 | ) |
| | | | | | | | | | | | | | | | | | | | | | | | |
| Interest Rate Swaps (Centrally Cleared) | | | | |
| | | | | | | |
Notional Amount
(000’s omitted) | | Portfolio
Pays/
Receives
Floating
Rate | | Floating Rate | | Annual
Fixed Rate | | Termination
Date | | | Value | | | Unamortized
Upfront
Receipts
(Payments) | | | Unrealized
Appreciation
(Depreciation) | |
| | | | | | | | |
| AUD | | 347,130 | | Pays | | 6-month AUD Bank Bill (pays semi-annually) | | 1.58% (pays semi-annually) | | | 1/17/24 | | | $ | (5,775,527 | ) | | $ | — | | | $ | (5,775,527 | ) |
| | | | | | | | |
| BRL | | 180,151 | | Pays | | Brazil CETIP Interbank Deposit Rate
(pays upon termination) | | 11.48% (pays upon termination) | | | 1/2/25 | | | | (145,328 | ) | | | — | | | | (145,328 | ) |
| | | | | | | | |
| BRL | | 179,957 | | Pays | | Brazil CETIP Interbank Deposit Rate
(pays upon termination) | | 11.49% (pays upon termination) | | | 1/2/25 | | | | (138,050 | ) | | | — | | | | (138,050 | ) |
| | | | | | | | |
| BRL | | 118,592 | | Pays | | Brazil CETIP Interbank Deposit Rate
(pays upon termination) | | 11.51% (pays upon termination) | | | 1/2/25 | | | | (81,590 | ) | | | — | | | | (81,590 | ) |
| | | | | | | | |
| BRL | | 486,400 | | Pays | | Brazil CETIP Interbank Deposit Rate (pays upon termination) | | 11.74% (pays upon termination) | | | 1/2/25 | | | | (13,550 | ) | | | — | | | | (13,550 | ) |
| | | | | | | | |
| CAD | | 190,420 | | Pays | | 3-month Canadian Bankers Acceptances (pays quarterly) | | 2.19% (pays semi-annually) | | | 1/18/24 | | | | (3,257,093 | ) | | | — | | | | (3,257,093 | ) |
| | | | | | | | |
| CAD | | 128,330 | | Pays | | 3-month Canadian Bankers Acceptances (pays quarterly) | | 2.19% (pays semi-annually) | | | 1/18/24 | | | | (2,192,344 | ) | | | — | | | | (2,192,344 | ) |
| | | | | | | | |
| CAD | | 39,900 | | Pays | | 3-month Canadian Bankers Acceptances (pays semi-annually) | | 3.45% (pays semi-annually) | | | 7/21/27 | | | | (485,596 | ) | | | 21 | | | | (485,575 | ) |
| | | | | | | | |
| CAD | | 54,000 | | Pays | | 3-month Canadian Bankers Acceptances (pays semi-annually) | | 3.86% (pays semi-annually) | | | 9/21/27 | | | | 93,099 | | | | — | | | | 93,099 | |
| | | | |
| | 41 | | See Notes to Consolidated Financial Statements. |
Global Macro Absolute Return Advantage Portfolio
October 31, 2022
Consolidated Portfolio of Investments — continued
| | | | | | | | | | | | | | | | | | | | | | | | |
| Interest Rate Swaps (Centrally Cleared) (continued) | | | | |
| | | | | | | |
Notional Amount
(000’s omitted) | | Portfolio
Pays/
Receives
Floating
Rate | | Floating Rate | | Annual
Fixed Rate | | Termination
Date | | | Value | | | Unamortized
Upfront
Receipts
(Payments) | | | Unrealized
Appreciation
(Depreciation) | |
| | | | | | | | |
| CLP | | 3,302,600 | | Pays | | 6-month Sinacofi Chile Interbank Rate
(pays semi-annually) | | 6.20% (pays semi-annually) | | | 4/8/32 | | | $ | (48,305 | ) | | $ | — | | | $ | (48,305 | ) |
| | | | | | | | |
| CLP | | 10,143,370 | | Pays | | 6-month Sinacofi Chile Interbank Rate
(pays semi-annually) | | 6.35% (pays semi-annually) | | | 4/11/32 | | | | (39,654 | ) | | | — | | | | (39,654 | ) |
| | | | | | | | |
| CLP | | 1,945,360 | | Pays | | 6-month Sinacofi Chile Interbank Rate
(pays semi-annually) | | 6.40% (pays semi-annually) | | | 4/20/32 | | | | 1,587 | | | | — | | | | 1,587 | |
| | | | | | | | |
| CLP | | 9,903,610 | | Pays | | 6-month Sinacofi Chile Interbank Rate
(pays semi-annually) | | 6.38% (pays semi-annually) | | | 4/22/32 | | | | (834 | ) | | | — | | | | (834 | ) |
| | | | | | | | |
| CNY | | 111,257 | | Pays | | 7-day China Fixing Repo Rates
(pays quarterly) | | 2.63% (pays quarterly) | | | 11/1/26 | | | | 217,675 | | | | — | | | | 217,675 | |
| | | | | | | | |
| CNY | | 229,058 | | Pays | | 7-day China Fixing Repo Rates
(pays quarterly) | | 2.63% (pays quarterly) | | | 11/1/26 | | | | 448,155 | | | | — | | | | 448,155 | |
| | | | | | | | |
| CNY | | 91,623 | | Pays | | 7-day China Fixing Repo Rates
(pays quarterly) | | 2.64% (pays quarterly) | | | 11/1/26 | | | | 182,998 | | | | — | | | | 182,998 | |
| | | | | | | | |
| CNY | | 130,890 | | Pays | | 7-day China Fixing Repo Rates (pays quarterly) | | 2.64% (pays quarterly) | | | 11/1/26 | | | | 261,426 | | | | — | | | | 261,426 | |
| | | | | | | | |
| CNY | | 222,514 | | Pays | | 7-day China Fixing Repo Rates
(pays quarterly) | | 2.64% (pays quarterly) | | | 11/1/26 | | | | 438,375 | | | | — | | | | 438,375 | |
| | | | | | | | |
| CNY | | 307,658 | | Pays | | 7-day China Fixing Repo Rates
(pays quarterly) | | 2.64% (pays quarterly) | | | 11/1/26 | | | | 606,118 | | | | — | | | | 606,118 | |
| | | | | | | | |
| CNY | | 315,167 | | Pays | | 7-day China Fixing Repo Rates
(pays quarterly) | | 2.26% (pays quarterly) | | | 2/7/27 | | | | (53,442 | ) | | | — | | | | (53,442 | ) |
| | | | | | | | |
| CNY | | 113,460 | | Pays | | 7-day China Fixing Repo Rates
(pays quarterly) | | 2.26% (pays quarterly) | | | 2/8/27 | | | | (17,297 | ) | | | — | | | | (17,297 | ) |
| | | | | | | | |
| CNY | | 72,173 | | Pays | | 7-day China Fixing Repo Rates
(pays quarterly) | | 2.27% (pays quarterly) | | | 2/8/27 | | | | (8,941 | ) | | | — | | | | (8,941 | ) |
| | | | | | | | |
| CNY | | 110,100 | | Pays | | 7-day China Fixing Repo Rates
(pays quarterly) | | 2.47% (pays quarterly) | | | 9/21/27 | | | | 80,505 | | | | — | | | | 80,505 | |
| | | | | | | | |
| CNY | | 187,300 | | Pays | | 7-day China Fixing Repo Rates
(pays quarterly) | | 2.47% (pays quarterly) | | | 9/21/27 | | | | 136,953 | | | | — | | | | 136,953 | |
| | | | | | | | |
| CNY | | 81,200 | | Pays | | 7-day China Fixing Repo Rates
(pays quarterly) | | 2.50% (pays quarterly) | | | 9/21/27 | | | | 84,060 | | | | — | | | | 84,060 | |
| | | | | | | | |
| CNY | | 93,600 | | Pays | | 7-day China Fixing Repo Rates
(pays quarterly) | | 2.50% (pays quarterly) | | | 9/21/27 | | | | 88,824 | | | | — | | | | 88,824 | |
| | | | |
| | 42 | | See Notes to Consolidated Financial Statements. |
Global Macro Absolute Return Advantage Portfolio
October 31, 2022
Consolidated Portfolio of Investments — continued
| | | | | | | | | | | | | | | | | | | | | | | | |
| Interest Rate Swaps (Centrally Cleared) (continued) | | | | |
| | | | | | | |
Notional Amount
(000’s omitted) | | Portfolio
Pays/
Receives
Floating
Rate | | Floating Rate | | Annual
Fixed Rate | | Termination
Date | | | Value | | | Unamortized
Upfront
Receipts
(Payments) | | | Unrealized
Appreciation
(Depreciation) | |
| | | | | | | | |
| CNY | | 62,500 | | Pays | | 7-day China Fixing Repo Rates
(pays quarterly) | | 2.51% (pays quarterly) | | | 9/21/27 | | | $ | 63,977 | | | $ | — | | | $ | 63,977 | |
| | | | | | | | |
| CNY | | 93,500 | | Pays | | 7-day China Fixing Repo Rates
(pays quarterly) | | 2.52% (pays quarterly) | | | 9/21/27 | | | | 100,364 | | | | — | | | | 100,364 | |
| | | | | | | | |
| CNY | | 31,100 | | Pays | | 7-day China Fixing Repo Rates
(pays quarterly) | | 2.52% (pays quarterly) | | | 9/21/27 | | | | 34,157 | | | | — | | | | 34,157 | |
| | | | | | | | |
| CNY | | 93,700 | | Pays | | 7-day China Fixing Repo Rates
(pays quarterly) | | 2.52% (pays quarterly) | | | 9/21/27 | | | | 102,911 | | | | — | | | | 102,911 | |
| | | | | | | | |
| CNY | | 93,600 | | Pays | | 7-day China Fixing Repo Rates (pays quarterly) | | 2.53% (pays quarterly) | | | 9/21/27 | | | | 103,384 | | | | — | | | | 103,384 | |
| | | | | | | | |
| COP | | 86,746,200 | | Receives | | Colombia Overnight Interbank Reference Rate (pays quarterly) | | 3.84% (pays quarterly) | | | 5/5/25 | | | | 3,096,434 | | | | — | | | | 3,096,434 | |
| | | | | | | | |
| COP | | 40,662,300 | | Pays | | Colombia Overnight Interbank Reference Rate (pays quarterly) | | 3.19% (pays quarterly) | | | 6/4/25 | | | | (1,578,204 | ) | | | — | | | | (1,578,204 | ) |
| | | | | | | | |
| COP | | 61,940,900 | | Pays | | Colombia Overnight Interbank Reference Rate (pays quarterly) | | 3.26% (pays quarterly) | | | 6/5/25 | | | | (2,385,972 | ) | | | — | | | | (2,385,972 | ) |
| | | | | | | | |
| COP | | 85,106,600 | | Pays | | Colombia Overnight Interbank Reference Rate (pays quarterly) | | 3.34% (pays quarterly) | | | 6/8/25 | | | | (3,246,417 | ) | | | — | | | | (3,246,417 | ) |
| | | | | | | | |
| COP | | 41,729,700 | | Pays | | Colombia Overnight Interbank Reference Rate (pays quarterly) | | 3.44% (pays quarterly) | | | 6/9/25 | | | | (1,571,616 | ) | | | — | | | | (1,571,616 | ) |
| | | | | | | | |
| COP | | 14,659,900 | | Receives | | Colombia Overnight Interbank Reference Rate (pays quarterly) | | 3.76% (pays quarterly) | | | 11/26/25 | | | | 602,335 | | | | — | | | | 602,335 | |
| | | | | | | | |
| COP | | 14,659,900 | | Receives | | Colombia Overnight Interbank Reference Rate (pays quarterly) | | 3.89% (pays quarterly) | | | 11/26/25 | | | | 591,776 | | | | — | | | | 591,776 | |
| | | | | | | | |
| COP | | 29,320,000 | | Receives | | Colombia Overnight Interbank Reference Rate (pays quarterly) | | 4.00% (pays quarterly) | | | 11/26/25 | | | | 1,165,690 | | | | — | | | | 1,165,690 | |
| | | | | | | | |
| COP | | 6,351,000 | | Receives | | Colombia Overnight Interbank Reference Rate (pays quarterly) | | 4.02% (pays quarterly) | | | 11/26/25 | | | | 251,972 | | | | — | | | | 251,972 | |
| | | | | | | | |
| COP | | 14,924,500 | | Receives | | Colombia Overnight Interbank Reference Rate (pays quarterly) | | 4.05% (pays quarterly) | | | 11/26/25 | | | | 589,011 | | | | — | | | | 589,011 | |
| | | | | | | | |
| COP | | 29,320,000 | | Receives | | Colombia Overnight Interbank Reference Rate (pays quarterly) | | 4.07% (pays quarterly) | | | 11/26/25 | | | | 1,154,318 | | | | — | | | | 1,154,318 | |
| | | | | | | | |
| COP | | 20,326,400 | | Receives | | Colombia Overnight Interbank Reference Rate (pays quarterly) | | 4.11% (pays quarterly) | | | 11/26/25 | | | | 796,301 | | | | — | | | | 796,301 | |
| | | | | | | | |
| COP | | 31,578,500 | | Receives | | Colombia Overnight Interbank Reference Rate (pays quarterly) | | 4.16% (pays quarterly) | | | 11/26/25 | | | | 1,227,488 | | | | — | | | | 1,227,488 | |
| | | | |
| | 43 | | See Notes to Consolidated Financial Statements. |
Global Macro Absolute Return Advantage Portfolio
October 31, 2022
Consolidated Portfolio of Investments — continued
| | | | | | | | | | | | | | | | | | | | | | | | | | |
| Interest Rate Swaps (Centrally Cleared) (continued) | | | | |
| | | | | | | |
Notional Amount
(000’s omitted) | | Portfolio
Pays/
Receives
Floating
Rate | | | Floating Rate | | Annual
Fixed Rate | | Termination
Date | | | Value | | | Unamortized
Upfront
Receipts
(Payments) | | | Unrealized
Appreciation
(Depreciation) | |
| | | | | | | | |
| COP | | 17,793,000 | | | Receives | | | Colombia Overnight Interbank Reference Rate (pays quarterly) | | 4.20% (pays quarterly) | | | 11/26/25 | | | $ | 687,688 | | | $ | — | | | $ | 687,688 | |
| | | | | | | | |
| COP | | 29,320,000 | | | Receives | | | Colombia Overnight Interbank Reference Rate (pays quarterly) | | 4.20% (pays quarterly) | | | 11/26/25 | | | | 1,133,199 | | | | — | | | | 1,133,199 | |
| | | | | | | | |
| COP | | 6,192,100 | | | Receives | | | Colombia Overnight Interbank Reference Rate (pays quarterly) | | 4.21% (pays quarterly) | | | 11/26/25 | | | | 239,149 | | | | — | | | | 239,149 | |
| | | | | | | | |
| COP | | 29,320,000 | | | Receives | | | Colombia Overnight Interbank Reference Rate (pays quarterly) | | 4.28% (pays quarterly) | | | 11/26/25 | | | | 1,120,203 | | | | — | | | | 1,120,203 | |
| | | | | | | | |
| COP | | 15,771,100 | | | Receives | | | Colombia Overnight Interbank Reference Rate (pays quarterly) | | 4.34% (pays quarterly) | | | 11/26/25 | | | | 596,977 | | | | — | | | | 596,977 | |
| | | | | | | | |
| COP | | 15,877,300 | | | Receives | | | Colombia Overnight Interbank Reference Rate (pays quarterly) | | 4.55% (pays quarterly) | | | 11/26/25 | | | | 583,297 | | | | — | | | | 583,297 | |
| | | | | | | | |
| COP | | 66,784,856 | | | Receives | | | Colombia Overnight Interbank Reference Rate (pays quarterly) | | 4.78% (pays quarterly) | | | 11/26/25 | | | | 2,366,571 | | | | — | | | | 2,366,571 | |
| | | | | | | | |
| COP | | 31,722,800 | | | Receives | | | Colombia Overnight Interbank Reference Rate (pays quarterly) | | 4.90% (pays quarterly) | | | 11/26/25 | | | | 1,103,908 | | | | — | | | | 1,103,908 | |
| | | | | | | | |
| COP | | 27,035,200 | | | Pays | | | Colombia Overnight Interbank Reference Rate (pays quarterly) | | 5.68% (pays quarterly) | | | 11/26/25 | | | | (823,199 | ) | | | — | | | | (823,199 | ) |
| | | | | | | | |
| COP | | 40,836,000 | | | Receives | | | Colombia Overnight Interbank Reference Rate (pays quarterly) | | 6.00% (pays quarterly) | | | 11/26/25 | | | | 1,171,018 | | | | — | | | | 1,171,018 | |
| | | | | | | | |
| COP | | 115,701,000 | | | Receives | | | Colombia Overnight Interbank Reference Rate (pays quarterly) | | 6.05% (pays quarterly) | | | 11/26/25 | | | | 3,284,519 | | | | — | | | | 3,284,519 | |
| | | | | | | | |
| COP | | 35,344,000 | | | Receives | | | Colombia Overnight Interbank Reference Rate (pays quarterly) | | 6.06% (pays quarterly) | | | 11/26/25 | | | | 957,480 | | | | — | | | | 957,480 | |
| | | | | | | | |
| COP | | 74,865,200 | | | Receives | | | Colombia Overnight Interbank Reference Rate (pays quarterly) | | 6.09% (pays quarterly) | | | 11/26/25 | | | | 2,017,473 | | | | — | | | | 2,017,473 | |
| | | | | | | | |
| COP | | 36,412,000 | | | Receives | | | Colombia Overnight Interbank Reference Rate (pays quarterly) | | 6.14% (pays quarterly) | | | 11/26/25 | | | | 972,288 | | | | — | | | | 972,288 | |
| | | | | | | | |
| COP | | 37,433,000 | | | Receives | | | Colombia Overnight Interbank Reference Rate (pays quarterly) | | 6.18% (pays quarterly) | | | 11/26/25 | | | | 991,806 | | | | — | | | | 991,806 | |
| | | | | | | | |
| COP | | 76,566,300 | | | Receives | | | Colombia Overnight Interbank Reference Rate (pays quarterly) | | 6.25% (pays quarterly) | | | 11/26/25 | | | | 1,998,962 | | | | — | | | | 1,998,962 | |
| | | | | | | | |
| COP | | 149,705,000 | | | Receives | | | Colombia Overnight Interbank Reference Rate (pays quarterly) | | 7.03% (pays quarterly) | | | 11/26/25 | | | | 3,438,606 | | | | — | | | | 3,438,606 | |
| | | | | | | | |
| COP | | 12,136,000 | | | Receives | | | Colombia Overnight Interbank Reference Rate (pays quarterly) | | 8.60% (pays quarterly) | | | 11/26/25 | | | | 173,386 | | | | — | | | | 173,386 | |
| | | | |
| | 44 | | See Notes to Consolidated Financial Statements. |
Global Macro Absolute Return Advantage Portfolio
October 31, 2022
Consolidated Portfolio of Investments — continued
| | | | | | | | | | | | | | | | | | | | | | | | |
| Interest Rate Swaps (Centrally Cleared) (continued) | | | | |
| | | | | | | |
Notional Amount
(000’s omitted) | | Portfolio
Pays/
Receives
Floating
Rate | | Floating Rate | | Annual
Fixed Rate | | Termination
Date | | | Value | | | Unamortized
Upfront
Receipts
(Payments) | | | Unrealized
Appreciation
(Depreciation) | |
| | | | | | | | |
| COP | | 23,044,000 | | Receives | | Colombia Overnight Interbank Reference Rate (pays quarterly) | | 8.75% (pays quarterly) | | | 11/26/25 | | | $ | 309,693 | | | $ | — | | | $ | 309,693 | |
| | | | | | | | |
| COP | | 12,136,000 | | Receives | | Colombia Overnight Interbank Reference Rate (pays quarterly) | | 8.85% (pays quarterly) | | | 11/26/25 | | | | 156,374 | | | | — | | | | 156,374 | |
| | | | | | | | |
| COP | | 12,290,000 | | Receives | | Colombia Overnight Interbank Reference Rate (pays quarterly) | | 9.23% (pays quarterly) | | | 11/26/25 | | | | 132,278 | | | | — | | | | 132,278 | |
| | | | | | | | |
| COP | | 8,481,000 | | Receives | | Colombia Overnight Interbank Reference Rate (pays quarterly) | | 9.42% (pays quarterly) | | | 11/26/25 | | | | 82,729 | | | | — | | | | 82,729 | |
| | | | | | | | |
| COP | | 20,273,656 | | Receives | | Colombia Overnight Interbank Reference Rate (pays quarterly) | | 10.00% (pays quarterly) | | | 11/26/25 | | | | 131,825 | | | | — | | | | 131,825 | |
| | | | | | | | |
| COP | | 7,565,000 | | Receives | | Colombia Overnight Interbank Reference Rate (pays quarterly) | | 10.17% (pays quarterly) | | | 11/26/25 | | | | 42,005 | | | | (131 | ) | | | 41,874 | |
| | | | | | | | |
| COP | | 14,525,000 | | Receives | | Colombia Overnight Interbank Reference Rate (pays quarterly) | | 10.28% (pays quarterly) | | | 11/26/25 | | | | 72,073 | | | | — | | | | 72,073 | |
| | | | | | | | |
| COP | | 69,316,700 | | Receives | | Colombia Overnight Interbank Reference Rate (pays quarterly) | | 4.38% (pays quarterly) | | | 3/30/26 | | | | 2,764,119 | | | | — | | | | 2,764,119 | |
| | | | | | | | |
| COP | | 36,071,400 | | Receives | | Colombia Overnight Interbank Reference Rate (pays quarterly) | | 4.48% (pays quarterly) | | | 3/31/26 | | | | 1,417,275 | | | | — | | | | 1,417,275 | |
| | | | | | | | |
| COP | | 38,614,600 | | Receives | | Colombia Overnight Interbank Reference Rate (pays quarterly) | | 4.56% (pays quarterly) | | | 4/6/26 | | | | 1,496,809 | | | | — | | | | 1,496,809 | |
| | | | | | | | |
| COP | | 77,000,000 | | Receives | | Colombia Overnight Interbank Reference Rate (pays quarterly) | | 11.93% (pays quarterly) | | | 12/21/27 | | | | (500,567 | ) | | | — | | | | (500,567 | ) |
| | | | | | | | |
| COP | | 11,672,000 | | Receives | | Colombia Overnight Interbank Reference Rate (pays quarterly) | | 12.10% (pays quarterly) | | | 12/21/27 | | | | (90,413 | ) | | | — | | | | (90,413 | ) |
| | | | | | | | |
| COP | | 11,441,100 | | Receives | | Colombia Overnight Interbank Reference Rate (pays quarterly) | | 4.82% (pays quarterly) | | | 3/26/28 | | | | 581,543 | | | | — | | | | 581,543 | |
| | | | | | | | |
| COP | | 8,172,200 | | Receives | | Colombia Overnight Interbank Reference Rate (pays quarterly) | | 4.83% (pays quarterly) | | | 3/26/28 | | | | 414,714 | | | | — | | | | 414,714 | |
| | | | | | | | |
| COP | | 16,570,000 | | Receives | | Colombia Overnight Interbank Reference Rate (pays quarterly) | | 11.93% (pays quarterly) | | | 12/21/32 | | | | (192,569 | ) | | | — | | | | (192,569 | ) |
| | | | | | | | |
| EUR | | 3,026 | | Pays | | 6-month EURIBOR
(pays semi-annually) | | 2.98% (pays annually) | | | 10/26/25 | | | | 5,538 | | | | — | | | | 5,538 | |
| | | | | | | | |
| EUR | | 6,472 | | Pays | | 6-month EURIBOR
(pays semi-annually) | | 3.06% (pays annually) | | | 10/11/26 | | | | 40,979 | | | | — | | | | 40,979 | |
| | | | | | | | |
| EUR | | 3,000 | | Pays | | 6-month EURIBOR
(pays semi-annually) | | 3.10% (pays annually) | | | 10/18/26 | | | | 21,560 | | | | — | | | | 21,560 | |
| | | | | | | | |
| EUR | | 1,211 | | Pays | | 6-month EURIBOR
(pays semi-annually) | | 2.99% (pays annually) | | | 10/26/26 | | | | 3,350 | | | | — | | | | 3,350 | |
| | | | |
| | 45 | | See Notes to Consolidated Financial Statements. |
Global Macro Absolute Return Advantage Portfolio
October 31, 2022
Consolidated Portfolio of Investments — continued
| | | | | | | | | | | | | | | | | | | | | | | | |
| Interest Rate Swaps (Centrally Cleared) (continued) | | | | |
| | | | | | | |
Notional Amount
(000’s omitted) | | Portfolio
Pays/
Receives
Floating
Rate | | Floating Rate | | Annual
Fixed Rate | | Termination
Date | | | Value | | | Unamortized
Upfront
Receipts
(Payments) | | | Unrealized
Appreciation
(Depreciation) | |
| | | | | | | | |
| EUR | | 12,416 | | Receives | | 1-day Euro Short-Term Rate
(pays annually) | | 0.78% (pays annually) | | | 4/7/27 | | | $ | 899,710 | | | $ | — | | | $ | 899,710 | |
| | | | | | | | |
| EUR | | 12,416 | | Receives | | 1-day Euro Short-Term Rate
(pays annually) | | 0.98% (pays annually) | | | 4/13/27 | | | | 787,424 | | | | — | | | | 787,424 | |
| | | | | | | | |
| EUR | | 3,000 | | Pays | | 6-month EURIBOR
(pays semi-annually) | | 3.09% (pays annually) | | | 10/19/27 | | | | 22,213 | | | | — | | | | 22,213 | |
| | | | | | | | |
| EUR | | 3,000 | | Pays | | 6-month EURIBOR
(pays semi-annually) | | 3.12% (pays annually) | | | 10/19/27 | | | | 27,223 | | | | — | | | | 27,223 | |
| | | | | | | | |
| EUR | | 5,444 | | Pays | | 6-month EURIBOR
(pays semi-annually) | | 3.03% (pays annually) | | | 10/10/29 | | | | 28,275 | | | | — | | | | 28,275 | |
| | | | | | | | |
| EUR | | 1,800 | | Pays | | 6-month EURIBOR
(pays semi-annually) | | 3.17% (pays annually) | | | 10/17/29 | | | | 24,062 | | | | — | | | | 24,062 | |
| | | | | | | | |
| EUR | | 2,719 | | Pays | | 6-month EURIBOR
(pays semi-annually) | | 3.01% (pays annually) | | | 10/27/29 | | | | 7,831 | | | | — | | | | 7,831 | |
| | | | | | | | |
| EUR | | 9,315 | | Receives | | 1-day Euro Short-Term Rate
(pays annually) | | (0.03)% (pays annually) | | | 11/9/31 | | | | 1,990,090 | | | | — | | | | 1,990,090 | |
| | | | | | | | |
| EUR | | 1,710 | | Receives | | 1-day Euro Short-Term Rate
(pays annually) | | 0.78% (pays annually) | | | 3/17/32 | | | | 259,852 | | | | 212 | | | | 260,064 | |
| | | | | | | | |
| EUR | | 9,074 | | Receives | | 1-day Euro Short-Term Rate
(pays annually) | | 0.98% (pays annually) | | | 4/7/32 | | | | 1,259,798 | | | | — | | | | 1,259,798 | |
| | | | | | | | |
| EUR | | 9,074 | | Receives | | 1-day Euro Short-Term Rate
(pays annually) | | 1.19% (pays annually) | | | 4/13/32 | | | | 1,093,785 | | | | — | | | | 1,093,785 | |
| | | | | | | | |
| EUR | | 600 | | Pays | | 6-month EURIBOR
(pays semi-annually) | | 3.26% (pays annually) | | | 10/17/32 | | | | 11,987 | | | | — | | | | 11,987 | |
| | | | | | | | |
| EUR | | 1,200 | | Pays | | 6-month EURIBOR
(pays semi-annually) | | 3.31% (pays annually) | | | 10/18/32 | | | | 29,597 | | | | — | | | | 29,597 | |
| | | | | | | | |
| EUR | | 1,200 | | Pays | | 6-month EURIBOR
(pays semi-annually) | | 3.20% (pays annually) | | | 10/19/32 | | | | 18,420 | | | | — | | | | 18,420 | |
| | | | | | | | |
| EUR | | 10,000 | | Receives | | 1-day Euro Short-Term Rate
(pays annually) | | 0.82% (pays annually) | | | 3/17/52 | | | | 3,173,873 | | | | — | | | | 3,173,873 | |
| | | | | | | | |
| EUR | | 8,950 | | Receives | | 1-day Euro Short-Term Rate
(pays annually) | | 0.86% (pays annually) | | | 3/18/52 | | | | 2,761,725 | | | | 643 | | | | 2,762,368 | |
| | | | | | | | |
| EUR | | 3,019 | | Receives | | 1-day Euro Short-Term Rate
(pays annually) | | 0.87% (pays annually) | | | 3/18/52 | | | | 922,268 | | | | (106 | ) | | | 922,162 | |
| | | | | | | | |
| EUR | | 1,770 | | Receives | | 1-day Euro Short-Term Rate
(pays annually) | | 1.29% (pays annually) | | | 4/20/52 | | | | 389,064 | | | | 33 | | | | 389,097 | |
| | | | | | | | |
| INR | | 2,390,600 | | Receives | | 1-day INR FBIL MIBOR
(pays semi-annually) | | 6.33% (pays semi-annually) | | | 9/21/27 | | | | 689,561 | | | | — | | | | 689,561 | |
| | | | | | | | |
| INR | | 1,211,300 | | Receives | | 1-day INR FBIL MIBOR
(pays semi-annually) | | 6.33% (pays semi-annually) | | | 9/21/27 | | | | 347,571 | | | | — | | | | 347,571 | |
| | | | | | | | |
| INR | | 1,785,000 | | Receives | | 1-day INR FBIL MIBOR
(pays semi-annually) | | 6.34% (pays semi-annually) | | | 9/21/27 | | | | 510,396 | | | | — | | | | 510,396 | |
| | | | |
| | 46 | | See Notes to Consolidated Financial Statements. |
Global Macro Absolute Return Advantage Portfolio
October 31, 2022
Consolidated Portfolio of Investments — continued
| | | | | | | | | | | | | | | | | | | | | | | | |
| Interest Rate Swaps (Centrally Cleared) (continued) | | | | |
| | | | | | | |
Notional Amount
(000’s omitted) | | Portfolio
Pays/
Receives
Floating
Rate | | Floating Rate | | Annual
Fixed Rate | | Termination
Date | | | Value | | | Unamortized
Upfront
Receipts
(Payments) | | | Unrealized
Appreciation
(Depreciation) | |
| | | | | | | | |
| INR | | 2,980,295 | | Receives | | 1-day INR FBIL MIBOR
(pays semi-annually) | | 6.34% (pays semi-annually) | | | 9/21/27 | | | $ | 840,953 | | | $ | — | | | $ | 840,953 | |
| | | | | | | | |
| INR | | 2,464,505 | | Receives | | 1-day INR FBIL MIBOR
(pays semi-annually) | | 6.36% (pays semi-annually) | | | 9/21/27 | | | | 673,761 | | | | — | | | | 673,761 | |
| | | | | | | | |
| INR | | 1,652,700 | | Receives | | 1-day INR FBIL MIBOR
(pays semi-annually) | | 6.53% (pays semi-annually) | | | 9/21/27 | | | | 314,931 | | | | — | | | | 314,931 | |
| | | | | | | | |
| INR | | 2,674,300 | | Receives | | 1-day INR FBIL MIBOR
(pays semi-annually) | | 6.53%
(pays semi-annually) | | | 9/21/27 | | | | 506,249 | | | | — | | | | 506,249 | |
| | | | | | | | |
| JPY | | 1,534,582 | | Receives | | 1-day Overnight Tokyo Average Rate (pays annually) | | 0.56%
(pays annually) | | | 1/11/52 | | | | 1,595,527 | | | | — | | | | 1,595,527 | |
| | | | | | | | |
| JPY | | 1,613,311 | | Receives | | 1-day Overnight Tokyo Average Rate (pays annually) | | 0.56%
(pays annually) | | | 1/11/52 | | | | 1,689,964 | | | | — | | | | 1,689,964 | |
| | | | | | | | |
| JPY | | 1,952,107 | | Receives | | 1-day Overnight Tokyo Average Rate (pays annually) | | 0.56%
(pays annually) | | | 1/11/52 | | | | 2,036,208 | | | | — | | | | 2,036,208 | |
| | | | | | | | |
| KRW | | 280,598,000 | | Pays | | 3-month KRW Certificate of Deposit Rate (pays quarterly) | | 1.75%
(pays quarterly) | | | 10/5/23 | | | | (4,723,554 | ) | | | — | | | | (4,723,554 | ) |
| | | | | | | | |
| KRW | | 192,943,700 | | Pays | | 3-month KRW Certificate of Deposit Rate (pays quarterly) | | 1.75%
(pays quarterly) | | | 10/5/23 | | | | (3,246,859 | ) | | | — | | | | (3,246,859 | ) |
| | | | | | | | |
| KRW | | 122,458,300 | | Pays | | 3-month KRW Certificate of Deposit Rate (pays quarterly) | | 1.77%
(pays quarterly) | | | 10/5/23 | | | | (2,051,862 | ) | | | — | | | | (2,051,862 | ) |
| | | | | | | | |
| KRW | | 34,139,900 | | Pays | | 3-month KRW Certificate of Deposit Rate (pays quarterly) | | 3.94%
(pays quarterly) | | | 9/21/25 | | | | (125,566 | ) | | | — | | | | (125,566 | ) |
| | | | | | | | |
| KRW | | 62,355,000 | | Pays | | 3-month KRW Certificate of Deposit Rate (pays quarterly) | | 3.97%
(pays quarterly) | | | 9/21/25 | | | | (201,141 | ) | | | — | | | | (201,141 | ) |
| | | | | | | | |
| KRW | | 28,582,000 | | Pays | | 3-month KRW Certificate of Deposit Rate (pays quarterly) | | 3.70%
(pays quarterly) | | | 9/21/27 | | | | (341,046 | ) | | | — | | | | (341,046 | ) |
| | | | | | | | |
| KRW | | 22,980,000 | | Pays | | 3-month KRW Certificate of Deposit Rate (pays quarterly) | | 3.73%
(pays quarterly) | | | 9/21/27 | | | | (251,820 | ) | | | — | | | | (251,820 | ) |
| | | | | | | | |
| KRW | | 20,704,100 | | Pays | | 3-month KRW Certificate of Deposit Rate (pays quarterly) | | 1.65%
(pays quarterly) | | | 7/19/31 | | | | (2,604,307 | ) | | | — | | | | (2,604,307 | ) |
| | | | | | | | |
| NZD | | 190,540 | | Pays | | 3-month NZD Bank Bill (pays quarterly) | | 2.69% (pays semi-annually) | | | 1/18/24 | | | | (2,737,639 | ) | | | — | | | | (2,737,639 | ) |
| | | | | | | | |
| NZD | | 186,090 | | Pays | | 3-month NZD Bank Bill (pays quarterly) | | 2.71% (pays semi-annually) | | | 1/18/24 | | | | (2,653,038 | ) | | | — | | | | (2,653,038 | ) |
| | | | | | | | |
| NZD | | 14,130 | | Pays | | 3-month NZD Bank Bill (pays quarterly) | | 3.98% (pays semi-annually) | | | 7/25/27 | | | | (187,615 | ) | | | — | | | | (187,615 | ) |
| | | | | | | | |
| NZD | | 18,850 | | Pays | | 3-month NZD Bank Bill (pays quarterly) | | 4.00% (pays semi-annually) | | | 7/25/27 | | | | (241,944 | ) | | | — | | | | (241,944 | ) |
| | | | | | | | |
| NZD | | 24,380 | | Pays | | 3-month NZD Bank Bill (pays quarterly) | | 4.00% (pays semi-annually) | | | 7/25/27 | | | | (312,922 | ) | | | — | | | | (312,922 | ) |
| | | | | | | | |
| NZD | | 27,000 | | Pays | | 3-month NZD Bank Bill (pays quarterly) | | 2.09% (pays semi-annually) | | | 9/23/31 | | | | (2,940,445 | ) | | | — | | | | (2,940,445 | ) |
| | | | |
| | 47 | | See Notes to Consolidated Financial Statements. |
Global Macro Absolute Return Advantage Portfolio
October 31, 2022
Consolidated Portfolio of Investments — continued
| | | | | | | | | | | | | | | | | | | | | | | | |
| Interest Rate Swaps (Centrally Cleared) (continued) | | | | |
| | | | | | | |
Notional Amount
(000’s omitted) | | Portfolio
Pays/
Receives
Floating
Rate | | Floating Rate | | Annual
Fixed Rate | | Termination
Date | | | Value | | | Unamortized
Upfront
Receipts
(Payments) | | | Unrealized
Appreciation
(Depreciation) | |
| | | | | | | | |
| NZD | | 15,700 | | Pays | | 3-month NZD Bank Bill (pays quarterly) | | 4.18% (pays semi-annually) | | | 6/28/32 | | | $ | (211,140) | | | $ | — | | | $ | (211,140) | |
| | | | | | | | |
| NZD | | 6,400 | | Pays | | 3-month NZD Bank Bill (pays quarterly) | | 4.20% (pays semi-annually) | | | 6/28/32 | | | | (85,800 | ) | | | — | | | | (85,800 | ) |
| | | | | | | | |
| NZD | | 13,900 | | Pays | | 3-month NZD Bank Bill (pays quarterly) | | 4.21% (pays semi-annually) | | | 6/28/32 | | | | (179,792 | ) | | | — | | | | (179,792 | ) |
| | | | | | | | |
| PLN | | 54,770 | | Receives | | 6-month PLN WIBOR (pays semi-annually) | | 2.49%
(pays annually) | | | 10/14/26 | | | | 1,968,738 | | | | — | | | | 1,968,738 | |
| | | | | | | | |
| PLN | | 163,380 | | Receives | | 6-month PLN WIBOR (pays semi-annually) | | 2.49%
(pays annually) | | | 10/15/26 | | | | 5,875,791 | | | | — | | | | 5,875,791 | |
| | | | | | | | |
| PLN | | 85,600 | | Receives | | 6-month PLN WIBOR (pays semi-annually) | | 3.39%
(pays annually) | | | 12/15/26 | | | | 2,496,480 | | | | — | | | | 2,496,480 | |
| | | | | | | | |
| TWD | | 653,926 | | Receives | | 3-month TWD TAIBOR (pays quarterly) | | 0.87%
(pays quarterly) | | | 11/2/26 | | | | 483,977 | | | | — | | | | 483,977 | |
| | | | | | | | |
| TWD | | 1,307,851 | | Receives | | 3-month TWD TAIBOR (pays quarterly) | | 0.88%
(pays quarterly) | | | 11/2/26 | | | | 952,060 | | | | — | | | | 952,060 | |
| | | | | | | | |
| TWD | | 1,307,851 | | Receives | | 3-month TWD TAIBOR (pays quarterly) | | 0.88%
(pays quarterly) | | | 11/2/26 | | | | 948,882 | | | | — | | | | 948,882 | |
| | | | | | | | |
| USD | | 4,050 | | Receives | | SOFR
(pays annually) | | 1.21%
(pays annually) | | | 11/29/26 | | | | 430,135 | | | | — | | | | 430,135 | |
| | | | | | | | |
| USD | | 24,050 | | Receives | | SOFR
(pays annually) | | 1.39%
(pays annually) | | | 1/12/27 | | | | 2,450,955 | | | | — | | | | 2,450,955 | |
| | | | | | | | |
| USD | | 24,200 | | Receives | | SOFR
(pays annually) | | 1.39%
(pays annually) | | | 1/13/27 | | | | 2,472,597 | | | | — | | | | 2,472,597 | |
| | | | | | | | |
| USD | | 5,458 | | Pays | | SOFR
(pays annually) | | 1.60% (pays semi-annually) | | | 3/10/27 | | | | (572,871 | ) | | | (4,838 | ) | | | (577,709 | ) |
| | | | | | | | |
| USD | | 53,814 | | Receives | | SOFR
(pays annually) | | 1.60% (pays semi-annually) | | | 3/10/27 | | | | 5,641,861 | | | | 50,576 | | | | 5,692,437 | |
| | | | | | | | |
| USD | | 55,850 | | Receives | | SOFR
(pays annually) | | 1.87%
(pays annually) | | | 3/17/27 | | | | 4,773,218 | | | | — | | | | 4,773,218 | |
| | | | | | | | |
| USD | | 50,000 | | Receives | | SOFR
(pays annually) | | 1.87%
(pays annually) | | | 3/17/27 | | | | 4,261,762 | | | | — | | | | 4,261,762 | |
| | | | | | | | |
| USD | | 21,700 | | Receives | | SOFR
(pays annually) | | 1.26%
(pays annually) | | | 11/9/31 | | | | 4,147,524 | | | | — | | | | 4,147,524 | |
| | | | | | | | |
| USD | | 34,552 | | Receives | | SOFR
(pays annually) | | 1.94%
(pays annually) | | | 3/17/32 | | | | 4,974,262 | | | | 1,864 | | | | 4,976,126 | |
| | | | | | | | |
| USD | | 4,300 | | Receives | | SOFR
(pays annually) | | 1.43%
(pays annually) | | | 11/9/51 | | | | 1,527,629 | | | | — | | | | 1,527,629 | |
| | | | | | | | |
| USD | | 18,700 | | Pays | | SOFR
(pays annually) | | 2.60% (pays semi-annually) | | | 7/18/52 | | | | (2,869,256 | ) | | | — | | | | (2,869,256 | ) |
| | | | | | | | |
| ZAR | | 72,640 | | Pays | | 3-month ZAR JIBAR (pays quarterly) | | 5.47%
(pays quarterly) | | | 2/24/26 | | | | (301,506 | ) | | | 171 | | | | (301,335 | ) |
| | | | | | | | |
| ZAR | | 476,700 | | Pays | | 3-month ZAR JIBAR (pays quarterly) | | 5.52%
(pays quarterly) | | | 2/24/26 | | | | (1,938,517 | ) | | | 1,156 | | | | (1,937,361 | ) |
| | | | | | | | |
| ZAR | | 474,850 | | Pays | | 3-month ZAR JIBAR (pays quarterly) | | 5.82%
(pays quarterly) | | | 3/11/26 | | | | (1,707,725 | ) | | | 1,304 | | | | (1,706,421 | ) |
| | | | | | | | |
| ZAR | | 474,840 | | Pays | | 3-month ZAR JIBAR (pays quarterly) | | 5.88%
(pays quarterly) | | | 3/11/26 | | | | (1,660,133 | ) | | | 1,340 | | | | (1,658,793 | ) |
| | | | | | | | |
| ZAR | | 327,631 | | Pays | | 3-month ZAR JIBAR (pays quarterly) | | 8.30%
(pays quarterly) | | | 9/21/27 | | | | (80,151 | ) | | | — | | | | (80,151 | ) |
| | | | |
| | 48 | | See Notes to Consolidated Financial Statements. |
Global Macro Absolute Return Advantage Portfolio
October 31, 2022
Consolidated Portfolio of Investments — continued
| | | | | | | | | | | | | | | | | | | | | | | | | | |
| Interest Rate Swaps (Centrally Cleared) (continued) | | | | |
| | | | | | | |
Notional Amount
(000’s omitted) | | Portfolio
Pays/
Receives
Floating
Rate | | | Floating Rate | | Annual
Fixed Rate | | Termination
Date | | | Value | | | Unamortized
Upfront
Receipts
(Payments) | | | Unrealized
Appreciation
(Depreciation) | |
| | | | | | | | |
| ZAR | | 332,669 | | | Pays | | | 3-month ZAR JIBAR (pays quarterly) | | 8.31%
(pays quarterly) | | | 9/21/27 | | | $ | (72,432 | ) | | $ | — | | | $ | (72,432 | ) |
| | | | | | | | |
Total | | | | | | | | | | | | | | | | $ | 54,401,887 | | | $ | 52,245 | | | $ | 54,454,132 | |
| | | | | | | | | | | | | | | | | | | | | | |
| Interest Rate Swaps (OTC) | |
| | | | | | |
| Counterparty | | Notional Amount
(000’s omitted) | | | Portfolio
Pays/Receives
Floating Rate | | Floating Rate | | Annual
Fixed Rate | | | Termination
Date | | | Value/Unrealized
Appreciation
(Depreciation) | |
| | | | | | | |
| Bank of America, N.A. | | MYR | | | 145,100 | | | Receives | | 3-month MYR KLIBOR (pays quarterly) | |
| 3.61%
(pays quarterly) |
| | | 6/15/27 | | | $ | 703,937 | |
| | | | | | | |
| Citibank, N.A. | | MYR | | | 61,100 | | | Receives | | 3-month MYR KLIBOR (pays quarterly) | |
| 3.89%
(pays quarterly) |
| | | 9/21/27 | | | | 162,894 | |
| | | | | | | |
| Goldman Sachs International | | MYR | | | 114,900 | | | Receives | | 3-month MYR KLIBOR (pays quarterly) | |
| 3.61%
(pays quarterly) |
| | | 6/15/27 | | | | 557,425 | |
| | | | | | | |
| Goldman Sachs International | | MYR | | | 140,000 | | | Receives | | 3-month MYR KLIBOR (pays quarterly) | |
| 3.62%
(pays quarterly) |
| | | 6/15/27 | | | | 672,649 | |
| | | | | | | |
| Standard Chartered Bank | | MYR | | | 322,200 | | | Receives | | 3-month MYR KLIBOR (pays quarterly) | |
| 3.88%
(pays quarterly) |
| | | 9/21/27 | | | | 877,935 | |
| | | | | | | |
Total | | | | | | | | | | | | | | | | | | | | $ | 2,974,840 | |
| | | | | | | | | | | | | | | | | | | | | | | | | | | | |
| Credit Default Swaps - Sell Protection (Centrally Cleared) | |
| | | | | | | |
| Reference Entity | | Notional
Amount*
(000’s omitted) | | | Contract Annual
Fixed Rate** | | | Current Market Annual
Fixed Rate*** | | | Termination
Date | | | Value | | | Unamortized
Upfront
Receipts
(Payments) | | | Unrealized
Appreciation
(Depreciation) | |
| | | | | | | |
| Indonesia | | $ | 83,700 | | |
| 1.00%
(pays quarterly)(1) |
| | | 1.39 | % | | | 12/20/27 | | | $ | (1,362,968 | ) | | $ | 907,102 | | | $ | (455,866 | ) |
| | | | | | | |
| Pemex | | | 88,206 | | |
| 1.00%
(pays quarterly)(1) |
| | | 6.65 | | | | 12/20/27 | | | | (19,103,107 | ) | | | 20,087,073 | | | | 983,966 | |
| | | | | | | |
Total | | $ | 171,906 | | | | | | | | | | | | | | | $ | (20,466,075 | ) | | $ | 20,994,175 | | | $ | 528,100 | |
| | | | | | | | | | | | | | | | | | | | | | | | |
| Credit Default Swaps - Buy Protection (Centrally Cleared) | |
| | | | | | |
| Reference Entity | | Notional
Amount(2)
(000’s omitted) | | | Contract Annual Fixed Rate** | | Termination
Date | | | Value | | | Unamortized
Upfront
Receipts
(Payments) | | | Unrealized
Appreciation
(Depreciation) | |
| | | | | | | |
| Austria | | | | | 18,213 | | | 1.00%
(pays quarterly)(1) | | | 12/20/27 | | | $ | (691,762 | ) | | $ | 682,439 | | | $ | (9,323 | ) |
| | | | | | | |
| Finland | | | | | 18,801 | | | 0.25%
(pays quarterly)(1) | | | 12/20/27 | | | | 29,444 | | | | (39,214 | ) | | | (9,770 | ) |
| | | | |
| | 49 | | See Notes to Consolidated Financial Statements. |
Global Macro Absolute Return Advantage Portfolio
October 31, 2022
Consolidated Portfolio of Investments — continued
| | | | | | | | | | | | | | | | | | | | | | | | |
| Credit Default Swaps - Buy Protection (Centrally Cleared) (continued) | |
| | | | | | |
| Reference Entity | | Notional
Amount(2)
(000’s omitted) | | | Contract Annual Fixed Rate** | | Termination
Date | | | Value | | | Unamortized
Upfront
Receipts
(Payments) | | | Unrealized
Appreciation
(Depreciation) | |
| | | | | | | |
| France | | | | | 87,573 | | | 0.25%
(pays quarterly)(1) | | | 12/20/27 | | | $ | 249,004 | | | $ | (122,480 | ) | | $ | 126,524 | |
| | | | | | | |
| Germany | | | | | 85,444 | | | 0.25%
(pays quarterly)(1) | | | 12/20/27 | | | | 63,033 | | | | 280,031 | | | | 343,064 | |
| | | | | | | |
| Hungary | | | | | 19,438 | | | 1.00%
(pays quarterly)(1) | | | 12/20/27 | | | | 1,310,567 | | | | (1,564,616 | ) | | | (254,049 | ) |
| | | | | | | |
| Malaysia | | | | | 286,450 | | | 1.00%
(pays quarterly)(1) | | | 12/20/27 | | | | 658,760 | | | | 647,644 | | | | 1,306,404 | |
| | | | | | | |
| Markit CDX Emerging Markets Index (CDX.EM.31.V3) | | | | | 860 | | | 1.00%
(pays quarterly)(1) | | | 6/20/24 | | | | 7,594 | | | | (43,156 | ) | | | (35,562 | ) |
| | | | | | | |
| Markit CDX North America High Yield Index (CDX.NA.HY.39.V1) | | | | | 88,968 | | | 5.00%
(pays quarterly)(1) | | | 12/20/27 | | | | 176,486 | | | | (3,556,047 | ) | | | (3,379,561 | ) |
| | | | | | | |
| Markit iTraxx Europe Index (ITRAXX.EUR.38.V1) | | EUR | | | 71,200 | | | 1.00%
(pays quarterly)(1) | | | 12/20/27 | | | | 366,889 | | | | (732,749 | ) | | | (365,860 | ) |
| | | | | | | |
| Mexico | | | | | 73,168 | | | 1.00%
(pays quarterly)(1) | | | 12/20/27 | | | | 1,904,448 | | | | (2,551,265 | ) | | | (646,817 | ) |
| | | | | | | |
| Philippines | | | | | 77,200 | | | 1.00%
(pays quarterly)(1) | | | 12/20/27 | | | | 852,278 | | | | (281,173 | ) | | | 571,105 | |
| | | | | | | |
| Poland | | | | | 73,949 | | | 1.00%
(pays quarterly)(1) | | | 12/20/27 | | | | 1,660,315 | | | | (2,036,233 | ) | | | (375,918 | ) |
| | | | | | | |
| Qatar | | | | | 67,769 | | | 1.00%
(pays quarterly)(1) | | | 12/20/27 | | | | (1,303,352 | ) | | | 1,206,207 | | | | (97,145 | ) |
| | | | | | | |
| Saudi Arabia | | | | | 55,726 | | | 1.00%
(pays quarterly)(1) | | | 6/20/27 | | | | (850,885 | ) | | | 618,477 | | | | (232,408 | ) |
| | | | | | | |
| Saudi Arabia | | | | | 215,880 | | | 1.00%
(pays quarterly)(1) | | | 12/20/27 | | | | (3,232,846 | ) | | | 4,599,783 | | | | 1,366,937 | |
| | | | | | | |
| South Africa | | | | | 64,567 | | | 1.00%
(pays quarterly)(1) | | | 12/20/27 | | | | 5,444,471 | | | | (4,664,545 | ) | | | 779,926 | |
| | | | | | | |
| South Africa | | | | | 58,700 | | | 1.00%
(pays quarterly)(1) | | | 6/20/29 | | | | 7,264,275 | | | | (5,686,428 | ) | | | 1,577,847 | |
| | | | | | | |
| South Africa | | | | | 9,464 | | | 1.00%
(pays quarterly)(1) | | | 6/20/31 | | | | 1,570,477 | | | | (1,246,246 | ) | | | 324,231 | |
| | | | | | | |
| Spain | | | | | 127,300 | | | 1.00%
(pays quarterly)(1) | | | 12/20/27 | | | | (2,414,479 | ) | | | 2,341,453 | | | | (73,026 | ) |
| | | | | | | |
| Turkey | | | | | 30,665 | | | 1.00%
(pays quarterly)(1) | | | 12/20/27 | | | | 6,410,109 | | | | (6,538,325 | ) | | | (128,216 | ) |
| | | | | | | |
| United Kingdom | | | | | 85,267 | | | 1.00%
(pays quarterly)(1) | | | 12/20/27 | | | | (2,840,613 | ) | | | 1,999,089 | | | | (841,524 | ) |
| | | | | | | |
Total | | | | | | | | | | | | | | $ | 16,634,213 | | | $ | (16,687,354 | ) | | $ | (53,141 | ) |
| | | | |
| | 50 | | See Notes to Consolidated Financial Statements. |
Global Macro Absolute Return Advantage Portfolio
October 31, 2022
Consolidated Portfolio of Investments — continued
| | | | | | | | | | | | | | |
| Credit Default Swaps - Sell Protection (OTC) | | |
| | | | | | | | | | | | | | | | | | | | | | | | | | | | |
| | | | | | | | |
Reference
Entity | | Counterparty | | Notional
Amount*
(000’s omitted) | | | Contract Annual
Fixed Rate** | | Current
Market
Annual
Fixed Rate*** | | | Termination
Date | | | Value | | | Unamortized
Upfront
Receipts
(Payments) | | | Unrealized
Appreciation
(Depreciation) | |
| | | | | | | | |
| Vietnam | | BNP Paribas | | $ | 36,400 | | | 1.00% (pays quarterly)(1) | | | 1.56 | % | | | 12/20/27 | | �� | $ | (869,046 | ) | | $ | 1,172,373 | | | $ | 303,327 | |
| | | | | | | | |
| Vietnam | | Goldman Sachs International | | | 19,880 | | | 1.00% (pays quarterly)(1) | | | 0.71 | | | | 6/20/24 | | | | 114,386 | | | | (97,108 | ) | | | 17,278 | |
| | | | | | | | |
| Vietnam | | Goldman Sachs International | | | 38,820 | | | 1.00% (pays quarterly)(1) | | | 1.56 | | | | 12/20/27 | | | | (926,823 | ) | | | 1,332,593 | | | | 405,770 | |
| | | | | | | | |
| Vietnam | | Goldman Sachs International | | | 5,000 | | | 1.00% (pays quarterly)(1) | | | 1.56 | | | | 12/20/27 | | | | (119,375 | ) | | | 148,393 | | | | 29,018 | |
| | | | | | | | |
| Vietnam | | Nomura International PLC | | | 3,500 | | | 1.00% (pays quarterly)(1) | | | 1.56 | | | | 12/20/27 | | | | (83,562 | ) | | | 115,699 | | | | 32,137 | |
| | | | | | | | |
Total | | | | $ | 103,600 | | | | | | | | | | | | | $ | (1,884,420 | ) | | $ | 2,671,950 | | | $ | 787,530 | |
| | | | | | | | | | | | | | | | | | | | | | | | |
| Credit Default Swaps - Buy Protection (OTC) | | | | |
Reference
Entity | | Counterparty | | Notional
Amount
(000’s omitted) | | | Contract
Annual
Fixed Rate** | | Termination
Date | | | Value | | | Unamortized
Upfront
Receipts
(Payments) | | | Unrealized
Appreciation
(Depreciation) | |
| | | | | | | |
| Czech Republic | | JPMorgan Chase Bank, N.A. | | $ | 19,840 | | | 1.00% (pays quarterly) | | | 12/20/27 | | | $ | (434,880 | ) | | $ | 408,512 | | | $ | (26,368 | ) |
| | | | | | | |
| Dubai | | Barclays Bank PLC | | | 6,348 | | | 1.00% (pays quarterly)(1) | | | 12/20/24 | | | | (47,893 | ) | | | (45,060 | ) | | | (92,953 | ) |
| | | | | | | |
| Dubai | | Barclays Bank PLC | | | 9,572 | | | 1.00% (pays quarterly)(1) | | | 12/20/24 | | | | (72,217 | ) | | | (68,004 | ) | | | (140,221 | ) |
| | | | | | | |
| Egypt | | Barclays Bank PLC | | | 9,744 | | | 1.00% (pays quarterly)(1) | | | 12/20/24 | | | | 1,620,691 | | | | (409,561 | ) | | | 1,211,130 | |
| | | | | | | |
| Egypt | | JPMorgan Chase Bank, N.A. | | | 9,097 | | | 1.00% (pays quarterly)(1) | | | 12/20/24 | | | | 1,513,077 | | | | (381,585 | ) | | | 1,131,492 | |
| | | | | | | |
| Oman | | Bank of America, N.A. | | | 14,372 | | | 1.00% (pays quarterly)(1) | | | 12/20/22 | | | | (15,784 | ) | | | (20,781 | ) | | | (36,565 | ) |
| | | | | | | |
| Romania | | Barclays Bank PLC | | | 19,120 | | | 1.00% (pays quarterly)(1) | | | 12/20/27 | | | | 2,203,556 | | | | (2,310,343 | ) | | | (106,787 | ) |
| | | | | | | |
| Saudi Arabia | | Barclays Bank PLC | | | 25,486 | | | 1.00% (pays quarterly)(1) | | | 6/20/31 | | | | (119,570 | ) | | | (405,444 | ) | | | (525,014 | ) |
| | | | | | | |
| Saudi Arabia | | Goldman Sachs International | | | 57,200 | | | 1.00% (pays quarterly)(1) | | | 12/20/32 | | | | (20,067 | ) | | | 416,918 | | | | 396,851 | |
| | | | | | | |
| Sweden | | Barclays Bank PLC | | | 41,185 | | | 0.25% (pays quarterly) | | | 12/20/27 | | | | (110,720 | ) | | | 95,830 | | | | (14,890 | ) |
| | | | | | | |
Total | | | | | | | | | | | | | | $ | 4,516,193 | | | $ | (2,719,518 | ) | | $ | 1,796,675 | |
| | | | |
| | 51 | | See Notes to Consolidated Financial Statements. |
Global Macro Absolute Return Advantage Portfolio
October 31, 2022
Consolidated Portfolio of Investments — continued
| * | If the Portfolio is the seller of credit protection, the notional amount is the maximum potential amount of future payments the Portfolio could be required to make if a credit event, as defined in the credit default swap agreement, were to occur. At October 31, 2022, such maximum potential amount for all open credit default swaps in which the Portfolio is the seller was $275,506,000. |
| ** | The contract annual fixed rate represents the fixed rate of interest received by the Portfolio (as a seller of protection) or paid by the Portfolio (as a buyer of protection) on the notional amount of the credit default swap contract. |
| *** | Current market annual fixed rates, utilized in determining the net unrealized appreciation or depreciation as of period end, serve as an indicator of the market’s perception of the current status of the payment/performance risk associated with the credit derivative. The current market annual fixed rate of a particular reference entity reflects the cost, as quoted by the pricing vendor, of selling protection against default of that entity as of period end and may include upfront payments required to be made to enter into the agreement. The higher the fixed rate, the greater the market perceived risk of a credit event involving the reference entity. A rate identified as “Defaulted” indicates a credit event has occurred for the reference entity. |
| (1) | Upfront payment is exchanged with the counterparty as a result of the standardized trading coupon. |
| (2) | In U.S. dollars unless otherwise indicated. |
| | | | | | | | | | | | | | | | | | |
| Total Return Swaps | | | | | | | | |
| | | | | |
| Counterparty | | Notional Amount
(000’s omitted) | | | Portfolio Receives | | Portfolio Pays | | Termination
Date | | | Value/Unrealized
Appreciation
(Depreciation) | |
| | | | | | |
| Barclays Bank PLC | | USD | | | 12,970 | | | SOFR (pays upon termination) | | Return on iBoxx USD Liquid Leveraged Loans Index (pays upon termination) | | | 12/20/22 | | | $ | (268,397 | ) |
| | | | | | |
| JPMorgan Chase Bank, N.A. | | USD | | | 29,200 | | | SOFR (pays upon termination) | | Return on iBoxx USD Liquid High Yield Index (pays upon termination) | | | 12/20/22 | | | | (905,243 | ) |
| | | | | | |
| | | | | | | | | | | | | | | | | $ | (1,173,640 | ) |
| | | | | | | | | | |
| Cross-Currency Swaps (OTC) |
| | | | |
| Counterparty | | Portfolio Receives | | Portfolio Pays | | | Effective Date/ Termination Date(1) | | Value/Unrealized
Appreciation
(Depreciation) |
| | | | |
| BNP Paribas | | 3-month PLN WIBOR + 1.45% on PLN 33,244,125 (Notional Amount) (pays quarterly) plus EUR equivalent of Notional Amount at effective date* | |
| 3-month EURIBOR on EUR
equivalent of Notional Amount at
effective date (pays quarterly)
plus Notional Amount* |
| | 10/14/2025/ 10/14/2028 | | $ (1,900) |
| | | | |
| Goldman Sachs International | | 1-day Indice Camara Promedio Rate on CLP 2,698,942,950 (pays semi-annually)** | |
| 2.10% on CLP equivalent of CLF
85,000 (pays semi-annually)** |
| | Not Applicable/4/8/32 | | (167,431) |
| | | | |
| Goldman Sachs International | | 1-day Indice Camara Promedio Rate on CLP 8,224,633,060 (pays semi-annually)** | |
| 2.25% on CLP equivalent of CLF
259,000 (pays semi-annually)** |
| | Not Applicable/4/11/32 | | (629,513) |
| | | | |
| Goldman Sachs International | | 1-day Indice Camara Promedio Rate on CLP 1,531,614,475 (pays semi-annually)** | |
| 1.85% on CLP equivalent of CLF
47,900 (pays semi-annually)** |
| | Not Applicable/4/20/32 | | (49,347) |
| | | | |
| Goldman Sachs International | | 1-day Indice Camara Promedio Rate on CLP 7,619,665,200 (pays semi-annually)** | |
| 1.84% on CLP equivalent of CLF
238,000 (pays semi-annually)** |
| | Not Applicable/4/22/32 | | (235,799) |
| | | | |
| | | | | | | | | | | $(1,083,990) |
| (1) | Effective date represents the date on which the Portfolio and counterparty exchange the currencies and begin interest payment accrual. |
| * | The Portfolio pays interest on the currency received and receives interest on the currency delivered. At the termination date, the notional amount of the currency received will be exchanged for the notional amount of the currency delivered. |
| ** | At the termination date, the Portfolio will either pay or receive the USD equivalent of the difference between the initial CLP notional amount and the CLP equivalent of the CLF notional amount on such date. |
| | | | |
| | 52 | | See Notes to Consolidated Financial Statements. |
Global Macro Absolute Return Advantage Portfolio
October 31, 2022
Consolidated Portfolio of Investments — continued
Abbreviations:
| | | | |
| | |
| ADR | | – | | American Depositary Receipt |
| | |
| CPI-U (NSA) | | – | | Consumer Price Index All Urban Non-Seasonally Adjusted |
| | |
| EURIBOR | | – | | Euro Interbank Offered Rate |
| | |
| FBIL | | – | | Financial Benchmarks India Ltd. |
| | |
| GDP | | – | | Gross Domestic Product |
| | |
| HICP | | – | | Harmonised Indices of Consumer Prices |
| | |
| JIBAR | | – | | Johannesburg Interbank Average Rate |
| | |
| KLIBOR | | – | | Kuala Lumpur Interbank Offered Rate |
| | | | |
| | |
| LIBOR | | – | | London Interbank Offered Rate |
| | |
| MIBOR | | – | | Mumbai Interbank Offered Rate |
| | |
| OTC | | – | | Over-the-counter |
| | |
| PIK | | – | | Payment In Kind |
| | |
| SOFR | | – | | Secured Overnight Financing Rate |
| | |
| TAIBOR | | – | | Taipei Interbank Offered Rate |
| | |
| WIBOR | | – | | Warsaw Interbank Offered Rate |
| | |
| WTI | | – | | West Texas Intermediate |
Currency Abbreviations:
| | | | |
| | |
| AED | | – | | United Arab Emirates Dirham |
| | |
| ARS | | – | | Argentina Peso |
| | |
| AUD | | – | | Australian Dollar |
| | |
| BHD | | – | | Bahraini Dinar |
| | |
| BRL | | – | | Brazilian Real |
| | |
| CAD | | – | | Canadian Dollar |
| | |
| CLF | | – | | Chilean Unidad de Fomento |
| | |
| CLP | | – | | Chilean Peso |
| | |
| CNH | | – | | Yuan Renminbi Offshore |
| | |
| CNY | | – | | Yuan Renminbi |
| | |
| COP | | – | | Colombian Peso |
| | |
| CRC | | – | | Costa Rican Colon |
| | |
| CZK | | – | | Czech Koruna |
| | |
| DOP | | – | | Dominican Peso |
| | |
| EGP | | – | | Egyptian Pound |
| | |
| EUR | | – | | Euro |
| | |
| IDR | | – | | Indonesian Rupiah |
| | |
| INR | | – | | Indian Rupee |
| | |
| ISK | | – | | Icelandic Krona |
| | |
| JPY | | – | | Japanese Yen |
| | |
| KES | | – | | Kenyan Shilling |
| | | | |
| | |
| KRW | | – | | South Korean Won |
| | |
| KZT | | – | | Kazakhstani Tenge |
| | |
| MYR | | – | | Malaysian Ringgit |
| | |
| NZD | | – | | New Zealand Dollar |
| | |
| OMR | | – | | Omani Rial |
| | |
| PEN | | – | | Peruvian Sol |
| | |
| PHP | | – | | Philippine Peso |
| | |
| PLN | | – | | Polish Zloty |
| | |
| RSD | | – | | Serbian Dinar |
| | |
| SAR | | – | | Saudi Riyal |
| | |
| SGD | | – | | Singapore Dollar |
| | |
| THB | | – | | Thai Baht |
| | |
| TRY | | – | | New Turkish Lira |
| | |
| TWD | | – | | Taiwan New Dollar |
| | |
| UAH | | – | | Ukrainian Hryvnia |
| | |
| UGX | | – | | Ugandan Shilling |
| | |
| USD | | – | | United States Dollar |
| | |
| UYU | | – | | Uruguayan Peso |
| | |
| UZS | | – | | Uzbekistani Som |
| | |
| ZAR | | – | | South African Rand |
| | |
| ZMW | | – | | Zambian Kwacha |
| | | | |
| | 53 | | See Notes to Consolidated Financial Statements. |
Global Macro Absolute Return Advantage Portfolio
October 31, 2022
Consolidated Statement of Assets and Liabilities
| | | | |
| Assets | | October 31, 2022 | |
| |
Unaffiliated investments, at value (identified cost $2,124,509,253) | | $ | 1,619,211,758 | |
| |
Affiliated investment, at value (identified cost $118,583,106) | | | 118,583,106 | |
| |
Cash | | | 2,908,850 | |
| |
Deposits for derivatives collateral: | | | | |
| |
Futures contracts | | | 4,500,020 | |
| |
Centrally cleared derivatives | | | 157,282,896 | |
| |
OTC derivatives | | | 4,070,000 | |
| |
Foreign currency, at value (identified cost $20,976,518) | | | 22,014,748 | |
| |
Cash collateral for securities sold short | | | 170,277,465 | |
| |
Interest and dividends receivable | | | 39,560,726 | |
| |
Dividends receivable from affiliated investment | | | 364,672 | |
| |
Receivable for investments sold | | | 4,363,254 | |
| |
Receivable for variation margin on open futures contracts | | | 1,208,959 | |
| |
Receivable for variation margin on open centrally cleared derivatives | | | 6,914,223 | |
| |
Receivable for open forward foreign currency exchange contracts | | | 30,548,134 | |
| |
Receivable for open swap contracts | | | 6,501,843 | |
| |
Upfront payments on open non-centrally cleared swap contracts | | | 3,737,886 | |
| |
Receivable for closed swap contracts | | | 215,341 | |
| |
Receivable for open non-deliverable bond forward contracts | | | 3,112,595 | |
| |
Receivable from affiliate | | | 19,281 | |
| |
Total assets | | $ | 2,195,395,757 | |
| |
| Liabilities | | | | |
| |
Cash collateral due to brokers | | $ | 4,070,000 | |
| |
Payable for reverse repurchase agreements, including accrued interest of $6,230 | | | 71,886,043 | |
| |
Payable for investments purchased | | | 6,429,196 | |
| |
Payable for securities sold short, at value (proceeds $149,429,485) | | | 143,637,166 | |
| |
Payable for open forward foreign currency exchange contracts | | | 12,852,613 | |
| |
Payable for open swap contracts | | | 3,200,428 | |
| |
Payable for closed swap contracts | | | 580,204 | |
| |
Payable for closed non-deliverable bond forward contracts | | | 496,353 | |
| |
Upfront receipts on open non-centrally cleared swap contracts | | | 3,690,318 | |
| |
Payable for open non-deliverable bond forward contracts | | | 964,623 | |
| |
Payable to affiliates: | | | | |
| |
Investment adviser fee | | | 1,540,738 | |
| |
Trustees’ fees | | | 9,218 | |
| |
Interest payable on securities sold short | | | 386,239 | |
| |
Accrued expenses | | | 881,516 | |
| |
Total liabilities | | $ | 250,624,655 | |
| |
Net Assets applicable to investors’ interest in Portfolio | | $ | 1,944,771,102 | |
| | | | |
| | 54 | | See Notes to Consolidated Financial Statements. |
Global Macro Absolute Return Advantage Portfolio
October 31, 2022
Consolidated Statement of Operations
| | | | |
| Investment Income | | Year Ended October 31, 2022 | |
| |
Dividend income (net of foreign taxes withheld of $288,041) | | $ | 4,104,102 | |
| |
Dividend income from affiliated investments | | | 1,417,612 | |
| |
Interest and other income (net of foreign taxes withheld of $1,071,970) | | �� | 155,002,913 | |
| |
Total investment income | | $ | 160,524,627 | |
| |
| Expenses | | | | |
| |
Investment adviser fee | | $ | 20,855,978 | |
| |
Trustees’ fees and expenses | | | 108,500 | |
| |
Custodian fee | | | 1,199,700 | |
| |
Legal and accounting services | | | 263,970 | |
| |
Interest expense and fees | | | 1,024,469 | |
| |
Interest and dividend expense on securities sold short | | | 2,528,499 | |
| |
Miscellaneous | | | 80,473 | |
| |
Total expenses | | $ | 26,061,589 | |
| |
Deduct: | | | | |
| |
Waiver and/or reimbursement of expenses by affiliate | | $ | 234,146 | |
| |
Total expense reductions | | $ | 234,146 | |
| |
Net expenses | | $ | 25,827,443 | |
| |
Net investment income | | $ | 134,697,184 | |
| |
| Realized and Unrealized Gain (Loss) | | | | |
| |
Net realized gain (loss): | | | | |
| |
Investment transactions (net of foreign capital gains taxes of $241,038) | | $ | (132,903,208 | ) |
| |
Investment transactions - affiliated investments | | | (26,308 | ) |
| |
Securities sold short | | | 10,528,437 | |
| |
Futures contracts | | | 46,403,574 | |
| |
Swap contracts | | | 183,150,289 | |
| |
Foreign currency transactions | | | (12,646,427 | ) |
| |
Forward foreign currency exchange contracts | | | 88,617,885 | |
| |
Non-deliverable bond forward contracts | | | (43,178,015 | ) |
| |
Net realized gain | | $ | 139,946,227 | |
| |
Change in unrealized appreciation (depreciation): | | | | |
| |
Investments (including net decrease in accrued foreign capital gains taxes of $29,779) | | $ | (472,566,019 | ) |
| |
Securities sold short | | | 8,484,834 | |
| |
Futures contracts | | | 12,090,601 | |
| |
Swap contracts | | | 61,555,321 | |
| |
Foreign currency | | | 44,112 | |
| |
Forward foreign currency exchange contracts | | | 7,985,203 | |
| |
Non-deliverable bond forward contracts | | | 3,868,522 | |
| |
Net change in unrealized appreciation (depreciation) | | $ | (378,537,426 | ) |
| |
Net realized and unrealized loss | | $ | (238,591,199 | ) |
| |
Net decrease in net assets from operations | | $ | (103,894,015 | ) |
| | | | |
| | 55 | | See Notes to Consolidated Financial Statements. |
Global Macro Absolute Return Advantage Portfolio
October 31, 2022
Consolidated Statements of Changes in Net Assets
| | | | | | | | |
| | | Year Ended October 31, | |
| Increase (Decrease) in Net Assets | | 2022 | | | 2021 | |
| | |
From operations: | | | | | | | | |
| | |
Net investment income | | $ | 134,697,184 | | | $ | 163,892,797 | |
| | |
Net realized gain (loss) | | | 139,946,227 | | | | (45,072,641 | ) |
| | |
Net change in unrealized appreciation (depreciation) | | | (378,537,426 | ) | | | 61,571,718 | |
| | |
Net increase (decrease) in net assets from operations | | $ | (103,894,015 | ) | | $ | 180,391,874 | |
| | |
Capital transactions: | | | | | | | | |
| | |
Contributions | | $ | 273,908,421 | | | $ | 424,628,148 | |
| | |
Withdrawals | | | (857,398,700 | ) | | | (1,018,584,474 | ) |
| | |
Net decrease in net assets from capital transactions | | $ | (583,490,279 | ) | | $ | (593,956,326 | ) |
| | |
Net decrease in net assets | | $ | (687,384,294 | ) | | $ | (413,564,452 | ) |
| | |
| Net Assets | | | | | | | | |
| | |
At beginning of year | | $ | 2,632,155,396 | | | $ | 3,045,719,848 | |
| | |
At end of year | | $ | 1,944,771,102 | | | $ | 2,632,155,396 | |
| | | | |
| | 56 | | See Notes to Consolidated Financial Statements. |
Global Macro Absolute Return Advantage Portfolio
October 31, 2022
Consolidated Financial Highlights
| | | | | | | | | | | | | | | | | | | | |
| | | Year Ended October 31, | |
| Ratios/Supplemental Data | | 2022 | | | 2021 | | | 2020 | | | 2019 | | | 2018 | |
| | | | | |
Ratios (as a percentage of average daily net assets): | | | | | | | | | | | | | | | | | | | | |
| | | | | |
Expenses(1) | | | 1.17 | %(2)(3) | | | 1.12 | % | | | 1.11 | %(3) | | | 1.26 | %(3) | | | 1.11 | %(3) |
| | | | | |
Net investment income | | | 6.13 | % | | | 5.37 | % | | | 5.69 | % | | | 5.86 | % | | | 5.09 | % |
| | | | | |
Portfolio Turnover | | | 94 | % | | | 82 | % | | | 80 | % | | | 71 | % | | | 75 | % |
| | | | | |
Total Return | | | (4.83 | )%(3) | | | 5.94 | % | | | 6.57 | %(3) | | | 8.22 | %(3) | | | (7.08 | )%(3) |
| | | | | |
Net assets, end of year (000’s omitted) | | $ | 1,944,771 | | | $ | 2,632,155 | | | $ | 3,045,720 | | | $ | 3,331,278 | | | $ | 4,516,938 | |
| (1) | Includes interest and/or dividend expense, including on securities sold short and/or reverse repurchase agreements if applicable, of 0.16%, 0.11%, 0.09%, 0.24% and 0.07% of average daily net assets for the years ended October 31, 2022, 2021, 2020, 2019 and 2018, respectively. |
| (2) | Includes a reduction by the investment adviser of a portion of its adviser fee due to the Portfolio’s investment in the Liquidity Fund (equal to less than 0.005% of average daily net assets for the year ended October 31, 2022). |
| (3) | The investment adviser reimbursed certain operating expenses (equal to 0.01%, 0.04%, 0.05% and 0.03% of average daily net assets for the years ended October 31, 2022, 2020, 2019 and 2018, respectively). Absent this reimbursement, total return would be lower. |
Global Macro Absolute Return Advantage Portfolio
October 31, 2022
Notes to Consolidated Financial Statements
1 Significant Accounting Policies
Global Macro Absolute Return Advantage Portfolio (the Portfolio) is a Massachusetts business trust registered under the Investment Company Act of 1940, as amended (the 1940 Act), as a non-diversified, open-end management investment company. The Portfolio’s investment objective is total return. The Declaration of Trust permits the Trustees to issue interests in the Portfolio. At October 31, 2022, Eaton Vance Global Macro Absolute Return Advantage Fund, Eaton Vance Short Duration Strategic Income Fund and Eaton Vance International (Cayman Islands) Short Duration Strategic Income Fund held an interest of 78.3%, 21.2% and 0.5%, respectively, in the Portfolio.
The Portfolio seeks to gain exposure to the commodity markets, in whole or in part, through investments in Eaton Vance GMAP Commodity Subsidiary, Ltd. (the Subsidiary), a wholly-owned subsidiary of the Portfolio organized under the laws of the Cayman Islands with the same objective and investment policies and restrictions as the Portfolio. The Portfolio may invest up to 25% of its total assets in the Subsidiary. The net assets of the Subsidiary at October 31, 2022 were $20,009,348 or 1.0% of the Portfolio’s consolidated net assets. The accompanying consolidated financial statements include the accounts of the Subsidiary. Intercompany balances and transactions have been eliminated in consolidation.
The following is a summary of significant accounting policies of the Portfolio. The policies are in conformity with accounting principles generally accepted in the United States of America (U.S. GAAP). The Portfolio is an investment company and follows accounting and reporting guidance in the Financial Accounting Standards Board (FASB) Accounting Standards Codification Topic 946.
A Investment Valuation — The following methodologies are used to determine the market value or fair value of investments.
Debt Obligations. Debt obligations are generally valued on the basis of valuations provided by third party pricing services, as derived from such services’ pricing models. Inputs to the models may include, but are not limited to, reported trades, executable bid and ask prices, broker/dealer quotations, prices or yields of securities with similar characteristics, interest rates, anticipated prepayments, benchmark curves or information pertaining to the issuer, as well as industry and economic events. The pricing services may use a matrix approach, which considers information regarding securities with similar characteristics to determine the valuation for a security. Short-term debt obligations purchased with a remaining maturity of sixty days or less for which a valuation from a third party pricing service is not readily available may be valued at amortized cost, which approximates fair value.
Senior Floating-Rate Loans. Interests in senior floating-rate loans (Senior Loans) are valued generally at the average mean of bid and ask quotations obtained from a third party pricing service.
Equity Securities. Equity securities listed on a U.S. securities exchange generally are valued at the last sale or closing price on the day of valuation or, if no sales took place on such date, at the mean between the closing bid and ask prices on the exchange where such securities are principally traded. Equity securities listed on the NASDAQ National Market System are valued at the NASDAQ official closing price. Unlisted or listed securities for which closing sales prices or closing quotations are not available are valued at the mean between the latest available bid and ask prices.
Derivatives. U.S. exchange-traded options are valued at the mean between the bid and ask prices at valuation time as reported by the Options Price Reporting Authority. Non-U.S. exchange-traded options and over-the-counter options (including options on securities, indices and foreign currencies) are valued by a third party pricing service using techniques that consider factors including the value of the underlying instrument, the volatility of the underlying instrument and the period of time until option expiration. Futures contracts are valued at the closing settlement price established by the board of trade or exchange on which they are traded, with adjustments for fair valuation for certain foreign futures contracts as described below. Forward foreign currency exchange contracts are generally valued at the mean of the average bid and average ask prices that are reported by currency dealers to a third party pricing service at the valuation time. Such third party pricing service valuations are supplied for specific settlement periods and the Portfolio’s forward foreign currency exchange contracts are valued at an interpolated rate between the closest preceding and subsequent settlement period reported by the third party pricing service. Non-deliverable bond forward contracts are generally valued based on the current price of the underlying bond as provided by a third party pricing service and current interest rates. Swaps are normally valued using valuations provided by a third party pricing service. Such pricing service valuations are based on the present value of fixed and projected floating rate cash flows over the term of the swap contract, and in the case of credit default swaps, based on credit spread quotations obtained from broker/dealers and expected default recovery rates determined by the pricing service using proprietary models. In the case of total return swaps, pricing service valuations are based on the value of the underlying index or instrument and reference interest rate. Future cash flows on swaps are discounted to their present value using swap rates provided by electronic data services or by broker/dealers.
Foreign Securities, Futures Contracts and Currencies. Foreign securities, futures contracts and currencies are valued in U.S. dollars, based on foreign currency exchange rate quotations supplied by a third party pricing service. The pricing service uses a proprietary model to determine the exchange rate. Inputs to the model include reported trades and implied bid/ask spreads. The daily valuation of exchange-traded foreign securities and certain exchange-traded foreign futures contracts generally is determined as of the close of trading on the principal exchange on which such securities and contracts trade. Events occurring after the close of trading on foreign exchanges may result in adjustments to the valuation of foreign securities and certain foreign futures contracts to more accurately reflect their fair value as of the close of regular trading on the New York Stock Exchange. When valuing foreign equity securities and foreign futures contracts that meet certain criteria, the Portfolio’s Trustees have approved the use of a fair value service that values such securities and foreign futures contracts to reflect market trading that occurs after the close of the applicable foreign markets of comparable securities or other instruments that have a strong correlation to the fair-valued securities and foreign futures contracts.
Global Macro Absolute Return Advantage Portfolio
October 31, 2022
Notes to Consolidated Financial Statements — continued
Other. Investments in management investment companies (including money market funds) that do not trade on an exchange are valued at the net asset value as of the close of each business day.
Fair Valuation. In connection with Rule 2a-5 of the 1940 Act, which became effective September 8, 2022, the Trustees have designated the Portfolio’s investment adviser as its valuation designee. Investments for which valuations or market quotations are not readily available or are deemed unreliable are valued by the investment adviser, as valuation designee, at fair value using methods that most fairly reflect the security’s “fair value”, which is the amount that the Portfolio might reasonably expect to receive for the security upon its current sale in the ordinary course. Each such determination is based on a consideration of relevant factors, which are likely to vary from one pricing context to another. These factors may include, but are not limited to, the type of security, the existence of any contractual restrictions on the security’s disposition, the price and extent of public trading in similar securities of the issuer or of comparable companies or entities, quotations or relevant information obtained from broker/dealers or other market participants, information obtained from the issuer, analysts, and/or the appropriate stock exchange (for exchange-traded securities), an analysis of the company’s or entity’s financial statements, and an evaluation of the forces that influence the issuer and the market(s) in which the security is purchased and sold.
B Investment Transactions — Investment transactions for financial statement purposes are accounted for on a trade date basis. Realized gains and losses on investments sold are determined on the basis of identified cost.
C Income — Interest income is recorded on the basis of interest accrued, adjusted for amortization of premium or accretion of discount. Inflation adjustments to the principal amount of inflation-adjusted bonds and notes are reflected as interest income. Deflation adjustments to the principal amount of an inflation-adjusted bond or note are reflected as reductions to interest income to the extent of interest income previously recorded on such bond or note. Dividend income is recorded on the ex-dividend date for dividends received in cash and/or securities. However, if the ex-dividend date has passed, certain dividends from foreign securities are recorded as the Portfolio is informed of the ex-dividend date. Withholding taxes on foreign dividends, interest and capital gains have been provided for in accordance with the Portfolio’s understanding of the applicable countries’ tax rules and rates.
D Federal and Other Taxes — The Portfolio has elected to be treated as a partnership for federal tax purposes. No provision is made by the Portfolio for federal or state taxes on any taxable income of the Portfolio because each investor in the Portfolio is ultimately responsible for the payment of any taxes on its share of taxable income. Since at least one of the Portfolio’s investors is a regulated investment company that invests all or substantially all of its assets in the Portfolio, the Portfolio normally must satisfy the applicable source of income and diversification requirements (under the Internal Revenue Code) in order for its investors to satisfy them. The Portfolio will allocate, at least annually among its investors, each investor’s distributive share of the Portfolio’s net investment income, net realized capital gains and losses and any other items of income, gain, loss, deduction or credit.
In addition to the requirements of the Internal Revenue Code, the Portfolio may also be subject to local taxes on the recognition of capital gains in certain countries. In determining the daily net asset value, the Portfolio estimates the accrual for such taxes, if any, based on the unrealized appreciation on certain portfolio securities and the related tax rates. Taxes attributable to unrealized appreciation are included in the change in unrealized appreciation (depreciation) on investments. Capital gains taxes on securities sold are included in net realized gain (loss) on investments.
The Subsidiary is treated as a controlled foreign corporation under the Internal Revenue Code and is not expected to be subject to U.S. federal income tax. The Portfolio is treated as a U.S. shareholder of the Subsidiary. As a result, the Portfolio is required to include in gross income for U.S. federal tax purposes all of the Subsidiary’s income, whether or not such income is distributed by the Subsidiary. If a net loss is realized by the Subsidiary, such loss is not generally available to offset the income earned by the Portfolio.
As of October 31, 2022, the Portfolio had no uncertain tax positions that would require financial statement recognition, de-recognition, or disclosure. The Portfolio files a U.S. federal income tax return annually after its fiscal year-end, which is subject to examination by the Internal Revenue Service for a period of three years from the date of filing.
E Foreign Currency Translation — Investment valuations, other assets, and liabilities initially expressed in foreign currencies are translated each business day into U.S. dollars based upon current exchange rates. Purchases and sales of foreign investment securities and income and expenses denominated in foreign currencies are translated into U.S. dollars based upon currency exchange rates in effect on the respective dates of such transactions. Recognized gains or losses on investment transactions attributable to changes in foreign currency exchange rates are recorded for financial statement purposes as net realized gains and losses on investments. That portion of unrealized gains and losses on investments that results from fluctuations in foreign currency exchange rates is not separately disclosed.
F Unfunded Loan Commitments — The Portfolio may enter into certain loan agreements all or a portion of which may be unfunded. The Portfolio is obligated to fund these commitments at the borrower’s discretion. These commitments, if any, are disclosed in the accompanying Consolidated Portfolio of Investments.
G Use of Estimates — The preparation of the consolidated financial statements in conformity with U.S. GAAP requires management to make estimates and assumptions that affect the reported amounts of assets and liabilities at the date of the consolidated financial statements and the reported amounts of income and expense during the reporting period. Actual results could differ from those estimates.
H Indemnifications — Under the Portfolio’s organizational documents, its officers and Trustees may be indemnified against certain liabilities and expenses arising out of the performance of their duties to the Portfolio. Under Massachusetts law, if certain conditions prevail, interestholders in the Portfolio could
Global Macro Absolute Return Advantage Portfolio
October 31, 2022
Notes to Consolidated Financial Statements — continued
be deemed to have personal liability for the obligations of the Portfolio. However, the Portfolio’s Declaration of Trust contains an express disclaimer of liability on the part of Portfolio interestholders. Additionally, in the normal course of business, the Portfolio enters into agreements with service providers that may contain indemnification clauses. The Portfolio’s maximum exposure under these arrangements is unknown as this would involve future claims that may be made against the Portfolio that have not yet occurred.
I Futures Contracts — Upon entering into a futures contract, the Portfolio is required to deposit with the broker, either in cash or securities, an amount equal to a certain percentage of the contract amount (initial margin). Subsequent payments, known as variation margin, are made or received by the Portfolio each business day, depending on the daily fluctuations in the value of the underlying security, index, or commodity and are recorded as unrealized gains or losses by the Portfolio. Gains (losses) are realized upon the expiration or closing of the futures contracts. Should market conditions change unexpectedly, the Portfolio may not achieve the anticipated benefits of the futures contracts and may realize a loss. Futures contracts have minimal counterparty risk as they are exchange traded and the clearinghouse for the exchange is substituted as the counterparty, guaranteeing counterparty performance.
J Forward Foreign Currency Exchange and Non-Deliverable Bond Forward Contracts — The Portfolio may enter into forward foreign currency exchange contracts for the purchase or sale of a specific foreign currency at a fixed price on a future date. The forward foreign currency exchange contracts are adjusted by the daily exchange rate of the underlying currency and any gains or losses are recorded as unrealized until such time as the contracts have been closed. While forward foreign currency exchange contracts are privately negotiated agreements between the Portfolio and a counterparty, certain contracts may be “centrally cleared”, whereby all payments made or received by the Portfolio pursuant to the contract are with a central clearing party (CCP) rather than the original counterparty. The CCP guarantees the performance of the original parties to the contract. Upon entering into centrally cleared contracts, the Portfolio is required to deposit with the CCP, either in cash or securities, an amount of initial margin determined by the CCP, which is subject to adjustment. For centrally cleared contracts, the daily change in valuation is recorded as a receivable or payable for variation margin and settled in cash with the CCP daily. The Portfolio may also enter into non-deliverable bond forward contracts for the purchase of a bond denominated in a non-deliverable foreign currency at a fixed price on a future date. For non-deliverable bond forward contracts, unrealized gains and losses, based on changes in the value of the contract, and realized gains and losses are accounted for as described above. Risks may arise upon entering these contracts from the potential inability of counterparties to meet the terms of their contracts and from movements in the value of a foreign currency relative to the U.S. dollar. In the case of centrally cleared contracts, counterparty risk is minimal due to protections provided by the CCP.
K Purchased Options — Upon the purchase of a call or put option, the premium paid by the Portfolio is included in the Consolidated Statement of Assets and Liabilities as an investment. The amount of the investment is subsequently marked-to-market to reflect the current market value of the option purchased, in accordance with the Portfolio’s policies on investment valuations discussed above. As the purchaser of an index option, the Portfolio has the right to receive a cash payment equal to any depreciation in the value of the index below the exercise price of the option (in the case of a put) or equal to any appreciation in the value of the index over the exercise price of the option (in the case of a call) as of the valuation date of the option. If an option which the Portfolio had purchased expires on the stipulated expiration date, the Portfolio will realize a loss in the amount of the cost of the option. If the Portfolio enters into a closing sale transaction, the Portfolio will realize a gain or loss, depending on whether the sales proceeds from the closing sale transaction are greater or less than the cost of the option. If the Portfolio exercises a put option on a security, it will realize a gain or loss from the sale of the underlying security, and the proceeds from such sale will be decreased by the premium originally paid. If the Portfolio exercises a call option on a security, the cost of the security which the Portfolio purchases upon exercise will be increased by the premium originally paid. The risk associated with purchasing options is limited to the premium originally paid. Purchased options traded over-the-counter involve risk that the issuer or counterparty will fail to perform its contractual obligations.
L Interest Rate Swaps — Swap contracts are privately negotiated agreements between the Portfolio and a counterparty. Certain swap contracts may be centrally cleared. Pursuant to interest rate swap agreements, the Portfolio either makes floating-rate payments to the counterparty (or CCP in the case of centrally cleared swaps) based on a benchmark interest rate in exchange for fixed-rate payments or the Portfolio makes fixed-rate payments to the counterparty (or CCP in the case of a centrally cleared swap) in exchange for payments on a floating benchmark interest rate. Payments received or made, including amortization of upfront payments/receipts, if any (which are amortized over the life of the swap contract), are recorded as realized gains or losses. During the term of the outstanding swap agreement, changes in the underlying value of the swap are recorded as unrealized gains or losses. For centrally cleared swaps, the daily change in valuation is recorded as a receivable or payable for variation margin and settled in cash with the CCP daily. The value of the swap is determined by changes in the relationship between two rates of interest. The Portfolio is exposed to credit loss in the event of non-performance by the swap counterparty. In the case of centrally cleared swaps, counterparty risk is minimal due to protections provided by the CCP. Risk may also arise from movements in interest rates.
M Inflation Swaps — Pursuant to inflation swap agreements, the Portfolio either makes floating-rate payments to the counterparty (or CCP in the case of centrally cleared swaps) based on a benchmark index in exchange for fixed-rate payments or the Portfolio makes fixed-rate payments to the counterparty (or CCP in the case of centrally cleared swaps) in exchange for floating-rate payments based on the return of a benchmark index. By design, the benchmark index is an inflation index, such as the Consumer Price Index. The accounting policy for payments received or made and changes in the underlying value of the inflation swap are the same as for interest rate swaps as described above. The value of the swap is determined by changes in the relationship between the rate of interest and the benchmark index. The Portfolio is exposed to credit loss in the event of nonperformance by the swap counterparty. In the case of centrally cleared swaps, counterparty risk is minimal due to protections provided by the CCP. Risk may also arise from the unanticipated movements in value of interest rates or the index.
Global Macro Absolute Return Advantage Portfolio
October 31, 2022
Notes to Consolidated Financial Statements — continued
N Cross-Currency Swaps — Cross-currency swaps are interest rate swaps in which interest cash flows are exchanged between two parties based on the notional amounts of two different currencies. The notional amounts are typically determined based on the spot exchange rates at the inception of the trade. Cross-currency swaps also involve the exchange of the notional amounts at the start of the contract at the current spot rate with an agreement to re-exchange such amounts at a later date at either the same exchange rate, a specified rate or the then current spot rate. The entire principal value of a cross-currency swap is subject to the risk that the counterparty to the swap will default on its contractual delivery obligations.
O Credit Default Swaps — When the Portfolio is the buyer of a credit default swap contract, the Portfolio is entitled to receive the par (or other agreed-upon) value of a referenced debt obligation (or basket of debt obligations) from the counterparty (or CCP in the case of a centrally cleared swap) to the contract if a credit event by a third party, such as a U.S. or foreign corporate issuer or sovereign issuer, on the debt obligation occurs. In return, the Portfolio pays the counterparty a periodic stream of payments over the term of the contract provided that no credit event has occurred. If no credit event occurs, the Portfolio would have spent the stream of payments and received no proceeds from the contract. When the Portfolio is the seller of a credit default swap contract, it receives the stream of payments, but is obligated to pay to the buyer of the protection an amount up to the notional amount of the swap and in certain instances take delivery of securities of the reference entity upon the occurrence of a credit event, as defined under the terms of that particular swap agreement. Credit events are contract specific but may include bankruptcy, failure to pay, restructuring, obligation acceleration and repudiation/moratorium. If the Portfolio is a seller of protection and a credit event occurs, the maximum potential amount of future payments that the Portfolio could be required to make would be an amount equal to the notional amount of the agreement. This potential amount would be partially offset by any recovery value of the respective referenced obligation, or net amount received from the settlement of a buy protection credit default swap agreement entered into by the Portfolio for the same referenced obligation. As the seller, the Portfolio may create economic leverage to its portfolio because, in addition to its total net assets, the Portfolio is subject to investment exposure on the notional amount of the swap. The interest fee paid or received on the swap contract, which is based on a specified interest rate on a fixed notional amount, is accrued daily as a component of unrealized appreciation (depreciation) and is recorded as realized gain upon receipt or realized loss upon payment. The Portfolio also records an increase or decrease to unrealized appreciation (depreciation) in an amount equal to the daily valuation. For centrally cleared swaps, the daily change in valuation is recorded as a receivable or payable for variation margin and settled in cash with the CCP daily. All upfront payments and receipts, if any, are amortized over the life of the swap contract as realized gains or losses. Those upfront payments or receipts for non-centrally cleared swaps are recorded as other assets or other liabilities, respectively, net of amortization. For financial reporting purposes, unamortized upfront payments or receipts, if any, are netted with unrealized appreciation or depreciation on swap contracts to determine the market value of swaps as presented in Notes 6 and 10. These transactions involve certain risks, including the risk that the seller may be unable to fulfill the transaction. In the case of centrally cleared swaps, counterparty risk is minimal due to protections provided by the CCP.
P Total Return Swaps — In a total return swap, the buyer receives a periodic return equal to the total return of a specified security, securities or index for a specified period of time. In return, the buyer pays the counterparty a fixed or variable stream of payments, typically based upon short-term interest rates, possibly plus or minus an agreed upon spread. During the term of the outstanding swap agreement, changes in the underlying value of the swap are recorded as unrealized gains and losses. Periodic payments received or made are recorded as realized gains or losses. The Portfolio is exposed to credit loss in the event of nonperformance by the swap counterparty. Risk may also arise from the unanticipated movements in value of exchange rates, interest rates, securities, or the index.
Q Swaptions — A purchased swaption contract grants the Portfolio, in return for payment of the purchase price, the right, but not the obligation, to enter into a new swap agreement or to shorten, extend, cancel or otherwise modify an existing swap agreement, at some designated future time on specified terms. When the Portfolio purchases a swaption, the premium paid to the writer is recorded as an investment and subsequently marked-to-market to reflect the current value of the swaption. A written swaption gives the Portfolio the obligation, if exercised by the purchaser, to enter into a swap contract according to the terms of the underlying agreement. When the Portfolio writes a swaption, the premium received by the Portfolio is recorded as a liability and subsequently marked-to-market to reflect the current value of the swaption. When a swaption is exercised, the cost of the swap is adjusted by the amount of the premium paid or received. When a swaption expires or an unexercised swaption is closed, a gain or loss is recognized in the amount of the premium paid or received, plus the cost to close. The Portfolio’s risk for purchased swaptions is limited to the premium paid. The writer of a swaption bears the risk of unfavorable changes in the preset terms of the underlying swap contract. Purchased swaptions traded over-the-counter involve risk that the issuer or counterparty will fail to perform its contractual obligations.
R Repurchase Agreements — A repurchase agreement is the purchase by the Portfolio of securities from a counterparty in exchange for cash that is coupled with an agreement to resell those securities to the counterparty at a specified date and price. When a repurchase agreement is entered, the Portfolio typically receives securities with a value that equals or exceeds the repurchase price, including any accrued interest earned on the agreement. The value of such securities will be marked-to-market daily, and cash or additional securities will be exchanged between the parties as needed. Except in the case of a repurchase agreement entered to settle a short sale, the value of the securities delivered to the Portfolio will be at least equal to 90% of the repurchase price during the term of the repurchase agreement. The terms of a repurchase agreement entered to settle a short sale may provide that the cash purchase price paid by the Portfolio is more than the value of purchased securities that effectively collateralize the repurchase price payable by the counterparty. In the event of insolvency of the counterparty to a repurchase agreement, recovery of the repurchase price owed to the Portfolio may be delayed. Such an insolvency also may result in a loss to the extent that the value of the purchased securities decreases during the delay or that value has otherwise not been maintained at an amount at least equal to the repurchase price.
S Reverse Repurchase Agreements — Under a reverse repurchase agreement, the Portfolio temporarily transfers possession of a portfolio security to another party, such as a bank or broker/dealer, in return for cash. At the same time, the Portfolio agrees to repurchase the security at an agreed upon time
Global Macro Absolute Return Advantage Portfolio
October 31, 2022
Notes to Consolidated Financial Statements — continued
and price, which reflects an interest payment. In periods of increased demand for a security, the Portfolio may receive a payment from the counterparty for the use of the security, which is recorded as interest income. Because the Portfolio retains effective control over the transferred security, the transaction is accounted for as a secured borrowing. The Portfolio may enter into such agreements when it believes it is able to invest the cash acquired at a rate higher than the cost of the agreement, which would increase earned income. When the Portfolio enters into a reverse repurchase agreement, any fluctuations in the market value of either the securities transferred to another party or the securities in which the proceeds may be invested would affect the market value of the Portfolio’s assets. Because reverse repurchase agreements may be considered to be the practical equivalent of borrowing funds (and the counterparty making a loan), they constitute a form of leverage. The Portfolio segregates cash or liquid assets equal to its obligation to repurchase the security. During the term of the agreement, the Portfolio may also be obligated to pledge additional cash and/or securities in the event of a decline in the fair value of the transferred security. In the event the counterparty to a reverse repurchase agreement becomes insolvent, recovery of the security transferred by the Portfolio may be delayed or the Portfolio may incur a loss equal to the amount by which the value of the security transferred by the Portfolio exceeds the repurchase price payable by the Portfolio.
T Securities Sold Short — A short sale is a transaction in which the Portfolio sells a security it does not own in anticipation of a decline in the market value of that security. To complete such a transaction, the Portfolio must borrow the security to make delivery to the buyer with an obligation to replace such borrowed security at a later date. Until the security is replaced, the Portfolio is required to repay the lender any dividends or interest, which accrue during the period of the loan. The proceeds received from a short sale are recorded as a liability and the Portfolio records an unrealized gain or loss to the extent of the difference between the proceeds received and the value of the open short position on the day of determination. A gain, limited to the price at which the Portfolio sold the security short, or a loss, potentially unlimited as there is no upward limit on the price of a security, is recorded when the short position is terminated. Interest and dividends payable on securities sold short are recorded as an expense.
U Stripped Mortgage-Backed Securities — The Portfolio may invest in Interest Only (IO) and Principal Only (PO) securities, forms of stripped mortgage-backed securities, whereby the IO security receives all the interest and the PO security receives all the principal on a pool of mortgage assets. The yield to maturity on an IO security is extremely sensitive to the rate of principal payments (including prepayments) on the related underlying mortgage assets, and a rapid rate of principal payments may have a material adverse effect on the yield to maturity from these securities. If the underlying mortgages experience greater than anticipated prepayments of principal, the Portfolio may fail to recoup its initial investment in an IO security. The market value of IO and PO securities can be unusually volatile due to changes in interest rates.
2 Investment Adviser Fee and Other Transactions with Affiliates
The investment adviser fee is earned by Boston Management and Research (BMR), an indirect, wholly-owned subsidiary of Morgan Stanley, as compensation for investment advisory services rendered to the Portfolio and the Subsidiary. The Portfolio and Subsidiary each pay BMR a fee computed at an annual rate as a percentage of its respective average daily net assets as follows and is payable monthly:
| | | | |
| Average Daily Net Assets | | Annual Fee Rate | |
| |
Up to $500 million | | | 1.000 | % |
| |
$500 million but less than $1 billion | | | 0.950 | % |
| |
$1 billion but less than $2.5 billion | | | 0.925 | % |
| |
$2.5 billion but less than $5 billion | | | 0.900 | % |
| |
$5 billion and over | | | 0.880 | % |
In determining the investment adviser fee for the Portfolio and Subsidiary, the applicable advisory fee rate is based on the average daily net assets of the Portfolio (inclusive of its interest in the Subsidiary). Such fee rate is then assessed separately on the Portfolio’s average daily net assets (exclusive of its interest in the Subsidiary) and the Subsidiary’s average daily net assets to determine the amount of the investment adviser fee. For the year ended October 31, 2022, the Portfolio’s investment adviser fee amounted to $20,855,978 or 0.95% of the Portfolio’s consolidated average daily net assets. Effective April 26, 2022, the Portfolio may invest in a money market fund, the Institutional Class of the Morgan Stanley Institutional Liquidity Funds - Government Portfolio (the “Liquidity Fund”), an open-end management investment company managed by Morgan Stanley Investment Management Inc., a wholly-owned subsidiary of Morgan Stanley. The investment adviser fee paid by the Portfolio is reduced by an amount equal to its pro-rata share of the advisory and administration fees paid by the Portfolio due to its investment in the Liquidity Fund. For the year ended October 31, 2022, the investment adviser fee paid was reduced by $97,332 relating to the Portfolio’s investment in the Liquidity Fund. Prior to April 26, 2022, the Portfolio may have invested its cash in Eaton Vance Cash Reserves Fund, LLC (Cash Reserves Fund), an affiliated investment company managed by Eaton Vance Management (EVM), an affiliate of BMR. EVM did not receive a fee for advisory services provided to Cash Reserves Fund. Pursuant to a voluntary expense reimbursement, BMR was allocated $136,814 of the Portfolio’s operating expenses for the year ended October 31, 2022.
Pursuant to an investment sub-advisory agreement effective March 16, 2022, BMR has delegated a portion of the investment management of the Portfolio to Eaton Vance Advisers International Ltd. (EVAIL), an affiliate of BMR and an indirect, wholly-owned subsidiary of Morgan Stanley. EVAIL uses the portfolio management, research and other resources of its affiliate, MSIM Fund Management (Ireland) Limited (MSIM FMIL), to render investment advisory
Global Macro Absolute Return Advantage Portfolio
October 31, 2022
Notes to Consolidated Financial Statements — continued
services to the Portfolio. MSIM FMIL has entered into a Memorandum of Understanding with EVAIL pursuant to which MSIM FMIL is considered a participating affiliate of the sub-adviser as that term is used in relief granted by the staff of the U.S. Securities and Exchange Commission allowing U.S. registered investment advisers to use portfolio management or research resources of unregistered advisory affiliates subject to the supervision of a U.S. registered adviser. BMR pays EVAIL a portion of its investment adviser fee for sub-advisory services provided to the Portfolio.
Trustees and officers of the Portfolio who are members of EVM’s or BMR’s organizations receive remuneration for their services to the Portfolio out of the investment adviser fee. Trustees of the Portfolio who are not affiliated with the investment adviser may elect to defer receipt of all or a percentage of their annual fees in accordance with the terms of the Trustees Deferred Compensation Plan. For the year ended October 31, 2022, no significant amounts have been deferred. Certain officers and Trustees of the Portfolio are officers of the above organizations.
3 Purchases and Sales of Investments
Purchases and sales of investments, other than short-term obligations and including maturities, paydowns and securities sold short, for the year ended October 31, 2022 were as follows:
| | | | | | | | |
| | | Purchases | | | Sales | |
| | |
Investments (non-U.S. Government) | | $ | 1,498,252,758 | | | $ | 1,537,623,722 | |
| | |
U.S. Government and Agency Securities | | | 122,817,530 | | | | — | |
| | |
| | | $ | 1,621,070,288 | | | $ | 1,537,623,722 | |
4 Federal Income Tax Basis of Investments
The cost and unrealized appreciation (depreciation) of investments of the Portfolio, including open derivative contracts and the Portfolio’s investment in the Subsidiary, at October 31, 2022, as determined on a federal income tax basis, were as follows:
| | | | |
| |
Aggregate cost | | $ | 2,138,276,199 | |
| |
Gross unrealized appreciation | | $ | 60,890,589 | |
| |
Gross unrealized depreciation | | | (566,773,257 | ) |
| |
Net unrealized depreciation | | $ | (505,882,668 | ) |
5 Restricted Securities
At October 31, 2022, the Portfolio owned the following securities (representing 0.7% of net assets) which were restricted as to public resale and not registered under the Securities Act of 1933 (excluding Rule 144A securities). The Portfolio has various registration rights (exercisable under a variety of circumstances) with respect to these securities. The value of these securities is determined based on valuations provided by brokers when available, or if not available, they are valued by the investment adviser as the Trustees’ valuation designee.
| | | | | | | | | | | | | | | | |
| Description | | Date(s) of
Acquisition | | | Shares | | | Cost | | | Value | |
| | | | |
Reinsurance Side Cars | | | | | | | | | | | | | | | | |
| | | | |
Mt. Logan Re, Ltd., Series A-1 | | | 12/30/20 | | | | 8,600 | | | $ | 8,600,000 | | | $ | 6,917,664 | |
| | | | |
Sussex Capital, Ltd., Designated Investment Series 14, 12/21 | | | 1/24/22 | | | | 1,114 | | | | — | | | | 805,918 | |
| | | | |
Sussex Capital, Ltd., Series 14, Preference Shares | | | 6/1/21 | | | | 7,500 | | | | 7,500,000 | | | | 5,928,142 | |
| | | | |
Total Restricted Securities | | | | | | | | | | $ | 16,100,000 | | | $ | 13,651,724 | |
6 Financial Instruments
The Portfolio may trade in financial instruments with off-balance sheet risk in the normal course of its investing activities. These financial instruments may include forward foreign currency exchange contracts, non-deliverable bond forward contracts, futures contracts and swap contracts and may involve, to a
Global Macro Absolute Return Advantage Portfolio
October 31, 2022
Notes to Consolidated Financial Statements — continued
varying degree, elements of risk in excess of the amounts recognized for financial statement purposes. The notional or contractual amounts of these instruments represent the investment the Portfolio has in particular classes of financial instruments and do not necessarily represent the amounts potentially subject to risk. The measurement of the risks associated with these instruments is meaningful only when all related and offsetting transactions are considered. A summary of obligations under these financial instruments at October 31, 2022 is included in the Consolidated Portfolio of Investments. At October 31, 2022, the Portfolio had sufficient cash and/or securities to cover commitments under these contracts.
In the normal course of pursuing its investment objective, the Portfolio is subject to the following risks:
Commodity Risk: The Portfolio invests in commodities-linked derivative instruments, including commodity futures contracts, that provide exposure to the investment returns of certain commodities. Commodities-linked derivative instruments are used to enhance total return and/or as a substitute for the purchase or sale of commodities and to manage certain investment risks.
Credit Risk: The Portfolio enters into credit default swap contracts to manage certain investment risks and/or to enhance total return or as a substitute for the purchase or sale of securities.
Equity Price Risk: The Portfolio enters into equity index futures contracts and total return swaps to enhance total return and/or to manage certain investment risks.
Foreign Exchange Risk: The Portfolio engages in forward foreign currency exchange contracts and cross-currency swaps to enhance total return, to seek to hedge against fluctuations in currency exchange rates and/or as a substitute for the purchase or sale of securities or currencies.
Interest Rate Risk: The Portfolio utilizes various interest rate derivatives including non-deliverable bond forward contracts, interest rate futures contracts, interest rate swaps and swaptions, inflation swaps, cross-currency swaps and option contracts to enhance total return, to seek to hedge against fluctuations in interest rates and/or to change the effective duration of its portfolio.
The Portfolio enters into over-the-counter (OTC) derivatives that may contain provisions whereby the counterparty may terminate the contract under certain conditions, including but not limited to a decline in the Portfolio’s net assets below a certain level over a certain period of time, which would trigger a payment by the Portfolio for those derivatives in a liability position. At October 31, 2022, the fair value of derivatives with credit-related contingent features in a net liability position was $18,894,803. The aggregate fair value of assets pledged as collateral by the Portfolio for such liability was $12,616,936 at October 31, 2022.
The OTC derivatives in which the Portfolio invests are subject to the risk that the counterparty to the contract fails to perform its obligations under the contract. To mitigate this risk, the Portfolio (and Subsidiary) has entered into an International Swaps and Derivatives Association, Inc. Master Agreement (“ISDA Master Agreement”) or similar agreement with substantially all its derivative counterparties. An ISDA Master Agreement is a bilateral agreement between the Portfolio and a counterparty that governs certain OTC derivatives and typically contains, among other things, set-off provisions in the event of a default and/or termination event as defined under the relevant ISDA Master Agreement. Under an ISDA Master Agreement, the Portfolio (and Subsidiary) may, under certain circumstances, offset with the counterparty certain derivative financial instruments’ payables and/or receivables with collateral held and/or posted and create one single net payment. The provisions of the ISDA Master Agreement typically permit a single net payment in the event of default including the bankruptcy or insolvency of the counterparty. However, bankruptcy or insolvency laws of a particular jurisdiction may impose restrictions on or prohibitions against the right of offset in bankruptcy or insolvency. Certain ISDA Master Agreements allow counterparties to OTC derivatives to terminate derivative contracts prior to maturity in the event the Portfolio’s net assets decline by a stated percentage or the Portfolio fails to meet the terms of its ISDA Master Agreements, which would cause the counterparty to accelerate payment by the Portfolio of any net liability owed to it.
The collateral requirements for derivatives traded under an ISDA Master Agreement are governed by a Credit Support Annex to the ISDA Master Agreement. Collateral requirements are determined at the close of business each day and are typically based on changes in market values for each transaction under an ISDA Master Agreement and netted into one amount for such agreement. Generally, the amount of collateral due from or to a counterparty is subject to a minimum transfer threshold amount before a transfer is required, which may vary by counterparty. Collateral pledged for the benefit of the Portfolio (and Subsidiary) and/or counterparty is held in segregated accounts by the Portfolio’s custodian and cannot be sold, re-pledged, assigned or otherwise used while pledged. The portion of such collateral representing cash, if any, is reflected as deposits for derivatives collateral and, in the case of cash pledged by a counterparty for the benefit of the Portfolio, a corresponding liability on the Consolidated Statement of Assets and Liabilities. Securities pledged by the Portfolio as collateral, if any, are identified as such in the Consolidated Portfolio of Investments. The carrying amount of the liability for cash collateral due to brokers at October 31, 2022 approximated its fair value. If measured at fair value, such liability would have been considered as Level 2 in the fair value hierarchy (see Note 10) at October 31, 2022. Because the Subsidiary is not registered under the 1940 Act, it may not be able to negotiate terms with its counterparties that are equivalent to those a registered portfolio may negotiate. As a result, the Subsidiary may have greater exposure to those counterparties than a registered portfolio.
Global Macro Absolute Return Advantage Portfolio
October 31, 2022
Notes to Consolidated Financial Statements — continued
The fair value of open derivative instruments (not considered to be hedging instruments for accounting disclosure purposes) by risk exposure at October 31, 2022 was as follows:
| | | | | | | | | | | | | | | | | | | | | | | | |
| | | Fair Value | |
Consolidated Statement of Assets and Liabilities Caption | | Commodity | | | Credit | | | Equity Price | | | Foreign
Exchange | | | Interest Rate | | | Total | |
| | | | | | |
Unaffiliated investments, at value | | $ | — | | | $ | — | | | $ | — | | | $ | — | | | $ | 42 | | | $ | 42 | |
| | | | | | |
Not applicable | | | 8,079,169 | * | | | 27,968,150 | * | | | — | | | | 22,325,542 | * | | | 134,503,825 | * | | | 192,876,686 | |
| | | | | | |
Receivable for open forward foreign currency exchange contracts | | | — | | | | — | | | | — | | | | 30,548,134 | | | | — | | | | 30,548,134 | |
| | | | | | |
Receivable/Payable for open swap contracts; Upfront payments/receipts on open non-centrally cleared swap contracts | | | — | | | | 5,451,710 | | | | — | | | | — | | | | 2,974,840 | | | | 8,426,550 | |
| | | | | | |
Receivable for open non-deliverable bond forward contracts | | | — | | | | — | | | | — | | | | — | | | | 3,112,595 | | | | 3,112,595 | |
| | | | | | |
Total Asset Derivatives | | $ | 8,079,169 | | | $ | 33,419,860 | | | $ | — | | | $ | 52,873,676 | | | $ | 140,591,302 | | | $ | 234,964,007 | |
| | | | | | |
Derivatives not subject to master netting or similar agreements | | $ | 8,079,169 | | | $ | 27,968,150 | | | $ | — | | | $ | 22,325,542 | | | $ | 134,503,825 | | | $ | 192,876,686 | |
| | | | | | |
Total Asset Derivatives subject to master netting or similar agreements | | $ | — | | | $ | 5,451,710 | | | $ | — | | | $ | 30,548,134 | | | $ | 6,087,477 | | | $ | 42,087,321 | |
| | | | | | |
Not applicable | | $ | — | | | $ | (31,800,012 | )* | | $ | (662,863 | )* | | $ | (10,008,411 | )* | | $ | (68,623,764 | )* | | $ | (111,095,050 | ) |
| | | | | | |
Payable for open forward foreign currency exchange contracts | | | — | | | | — | | | | — | | | | (12,852,613 | ) | | | — | | | | (12,852,613 | ) |
| | | | | | |
Payable/Receivable for open swap contracts; Upfront payments/receipts on open non-centrally cleared swap contracts | | | — | | | | (2,819,937 | ) | | | — | | | | — | | | | (2,257,630 | ) | | | (5,077,567 | ) |
| | | | | | |
Payable for open non-deliverable bond forward contracts | | | — | | | | — | | | | — | | | | — | | | | (964,623 | ) | | | (964,623 | ) |
| | | | | | |
Total Liability Derivatives | | $ | — | | | $ | (34,619,949 | ) | | $ | (662,863 | ) | | $ | (22,861,024 | ) | | $ | (71,846,017 | ) | | $ | (129,989,853 | ) |
| | | | | | |
Derivatives not subject to master netting or similar agreements | | $ | — | | | $ | (31,800,012 | ) | | $ | (662,863 | ) | | $ | (10,008,411 | ) | | $ | (68,623,764 | ) | | $ | (111,095,050 | ) |
| | | | | | |
Total Liability Derivatives subject to master netting or similar agreements | | $ | — | | | $ | (2,819,937 | ) | | $ | — | | | $ | (12,852,613 | ) | | $ | (3,222,253 | ) | | $ | (18,894,803 | ) |
| * | Only the current day’s variation margin on open futures contracts and centrally cleared derivatives is reported within the Consolidated Statement of Assets and Liabilities as Receivable or Payable for variation margin on open futures contracts and centrally cleared derivatives, as applicable. |
Global Macro Absolute Return Advantage Portfolio
October 31, 2022
Notes to Consolidated Financial Statements — continued
The Portfolio’s derivative assets and liabilities at fair value by risk, which are reported gross in the Consolidated Statement of Assets and Liabilities, are presented in the table above. The following tables present the Portfolio’s derivative assets and liabilities by counterparty, net of amounts available for offset under a master netting agreement and net of the related collateral received by the Portfolio (and Subsidiary) for such assets and pledged by the Portfolio (and Subsidiary) for such liabilities as of October 31, 2022.
| | | | | | | | | | | | | | | | | | | | | | | | |
| Counterparty | | Derivative
Assets Subject to
Master Netting
Agreement | | | Derivatives
Available
for Offset | | | Non-cash
Collateral
Received(a) | | | Cash
Collateral
Received(a) | | | Net Amount
of Derivative
Assets(b) | | | Total Cash
Collateral
Received | |
| | | | | | |
Bank of America, N.A. | | $ | 5,226,924 | | | $ | (898,544 | ) | | $ | (1,337,378 | ) | | $ | — | | | $ | 2,991,002 | | | $ | — | |
| | | | | | |
Barclays Bank PLC | | | 4,017,135 | | | | (618,797 | ) | | | — | | | | (3,398,338 | ) | | | — | | | | 3,440,000 | |
| | | | | | |
BNP Paribas | | | 4,368,661 | | | | (2,410,148 | ) | | | (593,459 | ) | | | (630,000 | ) | | | 735,054 | | | | 630,000 | |
| | | | | | |
Citibank, N.A. | | | 1,158,955 | | | | (82,211 | ) | | | — | | | | — | | | | 1,076,744 | | | | — | |
| | | | | | |
Deutsche Bank AG | | | 109,683 | | | | — | | | | — | | | | — | | | | 109,683 | | | | — | |
| | | | | | |
Goldman Sachs International | | | 10,077,931 | | | | (3,072,229 | ) | | | (5,480,744 | ) | | | — | | | | 1,524,958 | | | | — | |
| | | | | | |
JPMorgan Chase Bank, N.A. | | | 3,062,304 | | | | (1,340,123 | ) | | | (1,722,181 | ) | | | — | | | | — | | | | — | |
| | | | | | |
Standard Chartered Bank | | | 11,035,227 | | | | (8,614,366 | ) | | | — | | | | — | | | | 2,420,861 | | | | — | |
| | | | | | |
State Street Bank and Trust Company | | | 1,520,095 | | | | (466,108 | ) | | | (562,314 | ) | | | — | | | | 491,673 | | | | — | |
| | | | | | |
UBS AG | | | 1,510,406 | | | | (358,963 | ) | | | (688,404 | ) | | | — | | | | 463,039 | | | | — | |
| | | | | | |
| | | $ | 42,087,321 | | | $ | (17,861,489 | ) | | $ | (10,384,480 | ) | | $ | (4,028,338 | ) | | $ | 9,813,014 | | | $ | 4,070,000 | |
| | | | | | |
| Counterparty | | Derivative
Liabilities Subject to
Master Netting
Agreement | | | Derivatives
Available
for Offset | | | Non-cash
Collateral
Pledged(a) | | | Cash
Collateral
Pledged(a) | | | Net Amount
of Derivative
Liabilities(c) | | | Total Cash
Collateral
Pledged | |
| | | | | | |
Bank of America, N.A. | | $ | (898,544 | ) | | $ | 898,544 | | | $ | — | | | $ | — | | | $ | — | | | $ | — | |
| | | | | | |
Barclays Bank PLC | | | (618,797 | ) | | | 618,797 | | | | — | | | | — | | | | — | | | | — | |
| | | | | | |
BNP Paribas | | | (2,410,148 | ) | | | 2,410,148 | | | | — | | | | — | | | | — | | | | — | |
| | | | | | |
Citibank, N.A. | | | (82,211 | ) | | | 82,211 | | | | — | | | | — | | | | — | | | | — | |
| | | | | | |
Goldman Sachs International | | | (3,072,229 | ) | | | 3,072,229 | | | | — | | | | — | | | | — | | | | — | |
| | | | | | |
HSBC Bank USA, N.A. | | | (10,706 | ) | | | — | | | | — | | | | — | | | | (10,706 | ) | | | — | |
| | | | | | |
ICBC Standard Bank plc | | | (784,162 | ) | | | — | | | | 781,595 | | | | — | | | | (2,567 | ) | | | — | |
| | | | | | |
JPMorgan Chase Bank, N.A. | | | (1,340,123 | ) | | | 1,340,123 | | | | — | | | | — | | | | — | | | | — | |
| | | | | | |
Nomura International PLC | | | (83,562 | ) | | | — | | | | 69,964 | | | | — | | | | (13,598 | ) | | | — | |
| | | | | | |
Societe Generale | | | (154,884 | ) | | | — | | | | 154,884 | | | | — | | | | — | | | | — | |
| | | | | | |
Standard Chartered Bank | | | (8,614,366 | ) | | | 8,614,366 | | | | — | | | | — | | | | — | | | | — | |
| | | | | | |
State Street Bank and Trust Company | | | (466,108 | ) | | | 466,108 | | | | — | | | | — | | | | — | | | | — | |
| | | | | | |
UBS AG | | | (358,963 | ) | | | 358,963 | | | | — | | | | — | | | | — | | | | — | |
| | | | | | |
| | | $ | (18,894,803 | ) | | $ | 17,861,489 | | | $ | 1,006,443 | | | $ | — | | | $ | (26,871 | ) | | $ | — | |
| | |
Total — Deposits for derivatives collateral — OTC derivatives | | | | | | | $ | 4,070,000 | |
| (a) | In some instances, the total collateral received and/or pledged may be more than the amount shown due to overcollateralization. |
| (b) | Net amount represents the net amount due from the counterparty in the event of default. |
| (c) | Net amount represents the net amount payable to the counterparty in the event of default. |
Global Macro Absolute Return Advantage Portfolio
October 31, 2022
Notes to Consolidated Financial Statements — continued
Information with respect to reverse repurchase agreements at October 31, 2022 is included at Note 8.
The effect of derivative instruments (not considered to be hedging instruments for accounting disclosure purposes) on the Consolidated Statement of Operations by risk exposure for the year ended October 31, 2022 was as follows:
| | | | | | | | | | | | | | | | | | | | | | | | |
Consolidated Statement of Operations
Caption | | Commodity | | | Credit | | | Equity
Price | | | Foreign
Exchange | | | Interest
Rate | | | Total | |
| | | | | | |
Net realized gain (loss): | | | | | | | | | | | | | | | | | | | | | | | | |
| | | | | | |
Investment transactions | | $ | — | | | $ | — | | | $ | — | | | $ | — | | | $ | (6,323,036 | ) | | $ | (6,323,036 | ) |
| | | | | | |
Futures contracts | | | 6,029,207 | | | | — | | | | 2,087,575 | | | | — | | | | 38,286,792 | | | | 46,403,574 | |
| | | | | | |
Swap contracts | | | (25,853,567 | ) | | | 152,075,728 | | | | 1,951,749 | | | | 428,227 | | | | 54,548,152 | | | | 183,150,289 | |
| | | | | | |
Forward foreign currency exchange contracts | | | — | | | | — | | | | — | | | | 88,617,885 | | | | — | | | | 88,617,885 | |
| | | | | | |
Non-deliverable bond forward contracts | | | — | | | | — | | | | — | | | | — | | | | (43,178,015 | ) | | | (43,178,015 | ) |
| | | | | | |
Total | | $ | (19,824,360 | ) | | $ | 152,075,728 | | | $ | 4,039,324 | | | $ | 89,046,112 | | | $ | 43,333,893 | | | $ | 268,670,697 | |
| | | | | | |
Change in unrealized appreciation (depreciation): | | | | | | | | | | | | | | | | | | | | | | | | |
| | | | | | |
Investments | | $ | — | | | $ | — | | | $ | — | | | $ | 6,170,707 | | | $ | (799,389 | ) | | $ | 5,371,318 | |
| | | | | | |
Futures contracts | | | 8,079,169 | | | | — | | | | (1,755,703 | ) | | | — | | | | 5,767,135 | | | | 12,090,601 | |
| | | | | | |
Swap contracts | | | 6,506,802 | | | | 4,845,592 | | | | (1,513,821 | ) | | | — | | | | 51,716,748 | | | | 61,555,321 | |
| | | | | | |
Forward foreign currency exchange contracts | | | — | | | | — | | | | — | | | | 7,985,203 | | | | — | | | | 7,985,203 | |
| | | | | | |
Non-deliverable bond forward contracts | | | — | | | | — | | | | — | | | | — | | | | 3,868,522 | | | | 3,868,522 | |
| | | | | | |
Total | | $ | 14,585,971 | | | $ | 4,845,592 | | | $ | (3,269,524 | ) | | $ | 14,155,910 | | | $ | 60,553,016 | | | $ | 90,870,965 | |
The average notional cost of futures contracts and average notional amounts of other derivative contracts outstanding during the year ended October 31, 2022, which are indicative of the volume of these derivative types, were approximately as follows:
| | | | | | | | |
Futures Contracts — Long | | Futures Contracts — Short | | Forward Foreign Currency Exchange Contracts* | | Non-Deliverable Bond Forward Contracts | | Purchased Swaptions |
| | | | |
| $75,570,000 | | $376,552,000 | | $4,592,242,000 | | $296,212,000 | | $67,711,000 |
| | |
Purchased Call Options | | Swap Contracts |
| |
$1,817,900,000 | | $6,404,704,000 |
| * | The average notional amount for forward foreign currency exchange contracts is based on the absolute value of notional amounts of currency purchased and currency sold. |
Global Macro Absolute Return Advantage Portfolio
October 31, 2022
Notes to Consolidated Financial Statements — continued
7 Line of Credit
The Portfolio participates with other portfolios and funds managed by EVM and its affiliates in a $725 million unsecured line of credit agreement with a group of banks, which is in effect through October 24, 2023. In connection with the renewal of the agreement on October 25, 2022, the borrowing limit was decreased from $800 million. Borrowings are made by the Portfolio solely for temporary purposes related to redemptions and other short-term cash needs. Interest is charged to the Portfolio based on its borrowings at an amount above either the Secured Overnight Financing Rate (SOFR) or Federal Funds rate. In addition, a fee computed at an annual rate of 0.15% on the daily unused portion of the line of credit is allocated among the participating portfolios and funds at the end of each quarter. Also in connection with the renewal of the agreement, an arrangement fee totaling $150,000 was incurred that was allocated to the participating portfolios and funds. Because the line of credit is not available exclusively to the Portfolio, it may be unable to borrow some or all of its requested amounts at any particular time. The Portfolio did not have any significant borrowings or allocated fees during the year ended October 31, 2022.
8 Reverse Repurchase Agreements
Reverse repurchase agreements outstanding as of October 31, 2022 were as follows:
| | | | | | | | | | | | | | | | | | | | |
| Counterparty | | Trade
Date | | | Maturity Date | | | Interest
Rate Paid | | | Principal
Amount | | | Value
Including
Accrued
Interest | |
| | | | | |
Bank of America, N.A. | | | 10/31/22 | | | | 11/1/22 | | | | 3.12 | % | | $ | 71,879,813 | | | $ | 71,886,043 | |
| | | | | |
Total | | | | | | | | | | | | | | $ | 71,879,813 | | | $ | 71,886,043 | |
At October 31, 2022, the remaining contractual maturity of all open reverse repurchase agreements was less than 30 days. The type of securities pledged as collateral for all open reverse repurchase agreements was U.S. Treasury Obligations.
For the year ended October 31, 2022, the average borrowings under settled reverse repurchase agreements and the average interest rate paid were approximately $24,142,000 and 2.27%, respectively. Based on the short-term nature of the borrowings under the reverse repurchase agreements, the carrying value of the payable for reverse repurchase agreements approximated its fair value at October 31, 2022. If measured at fair value, borrowings under the reverse repurchase agreements would have been considered as Level 2 in the fair value hierarchy (see Note 10) at October 31, 2022.
Reverse repurchase agreements entered into by the Portfolio are subject to Master Repurchase Agreements (MRA), which permit the Portfolio, under certain circumstances, including an event of default (such as bankruptcy or insolvency), to offset payables and/or receivables under the MRA with collateral held and/or posted to the counterparty and create one single net payment due to or from the Portfolio.
The following table presents the Portfolio’s reverse repurchase agreements net of amounts available for offset under an MRA and net of the related collateral pledged by the Portfolio as of October 31, 2022.
| | | | | | | | | | | | | | | | |
| Counterparty | | Reverse
Repurchase
Agreements* | | | Assets
Available for
Offset | | | Securities
Collateral
Pledged(a) | | | Net
Amount(b) | |
| | | | |
Bank of America, N.A. | | $ | (71,886,043 | ) | | $ | — | | | $ | 71,886,043 | | | $ | — | |
| * | Including accrued interest |
| (a) | In some instances, the total collateral pledged may be more than the amount shown due to overcollateralization. |
| (b) | Net amount represents the net amount payable to the counterparty in the event of default. |
9 Investments in Affiliated Funds
At October 31, 2022, the value of the Portfolio’s investment in funds that may be deemed to be affiliated was $118,583,106, which represents 6.1% of the Portfolio’s net assets. Transactions in affiliated funds by the Portfolio for the year ended October 31, 2022 were as follows:
| | | | | | | | | | | | | | | | | | | | | | | | | | | | | | | | |
| Name | | Value,
beginning
of period | | | Purchases | | | Sales proceeds | | | Net
realized
gain (loss) | | | Change in
unrealized
appreciation
(depreciation) | | | Value, end
of period | | | Dividend
income | | | Units/Shares,
end of period | |
| | | | | | | | |
Short-Term Investments | | | | | | | | | | | | | | | | | | | | | | | | | | | | | | | | |
| | | | | | | | |
Cash Reserves Fund | | $ | 244,492,544 | | | $ | 1,346,185,859 | | | $ | (1,590,652,095 | ) | | $ | (26,308 | ) | | $ | — | | | $ | — | | | $ | 86,799 | | | | — | |
| | | | | | | | |
Liquidity Fund | | | — | | | | 1,433,369,772 | | | | (1,314,786,666 | ) | | | — | | | | — | | | | 118,583,106 | | | | 1,330,813 | | | | 118,583,106 | |
| | | | | | | | |
Total | | | | | | | | | | | | | | $ | (26,308 | ) | | $ | — | | | $ | 118,583,106 | | | $ | 1,417,612 | | | | | |
Global Macro Absolute Return Advantage Portfolio
October 31, 2022
Notes to Consolidated Financial Statements — continued
10 Fair Value Measurements
Under generally accepted accounting principles for fair value measurements, a three-tier hierarchy to prioritize the assumptions, referred to as inputs, is used in valuation techniques to measure fair value. The three-tier hierarchy of inputs is summarized in the three broad levels listed below.
| • | | Level 1 – quoted prices in active markets for identical investments |
| • | | Level 2 – other significant observable inputs (including quoted prices for similar investments, interest rates, prepayment speeds, credit risk, etc.) |
| • | | Level 3 – significant unobservable inputs (including a fund’s own assumptions in determining the fair value of investments) |
In cases where the inputs used to measure fair value fall in different levels of the fair value hierarchy, the level disclosed is determined based on the lowest level input that is significant to the fair value measurement in its entirety. The inputs or methodology used for valuing securities are not necessarily an indication of the risk associated with investing in those securities.
At October 31, 2022, the hierarchy of inputs used in valuing the Portfolio’s investments and open derivative instruments, which are carried at value, were as follows:
| | | | | | | | | | | | | | | | |
| Asset Description | | Level 1 | | | Level 2 | | | Level 3 | | | Total | |
| | | | |
Asset-Backed Securities | | $ | — | | | $ | 43,927,324 | | | $ | — | | | $ | 43,927,324 | |
| | | | |
Collateralized Mortgage Obligations | | | — | | | | 42,123,013 | | | | — | | | | 42,123,013 | |
| | | | |
Common Stocks | | | 12,167,154 | | | | 77,788,941 | * | | | 467,194 | | | | 90,423,289 | |
| | | | |
Convertible Bonds | | | — | | | | 7,405,888 | | | | — | | | | 7,405,888 | |
| | | | |
Foreign Corporate Bonds | | | — | | | | 154,002,094 | | | | 0 | | | | 154,002,094 | |
| | | | |
Loan Participation Notes | | | — | | | | — | | | | 43,646,597 | | | | 43,646,597 | |
| | | | |
Reinsurance Side Cars | | | — | | | | — | | | | 20,645,423 | | | | 20,645,423 | |
| | | | |
Senior Floating-Rate Loans | | | — | | | | 16,644,320 | | | | 608,224 | | | | 17,252,544 | |
| | | | |
Sovereign Government Bonds | | | — | | | | 820,551,003 | | | | 65,632,437 | | | | 886,183,440 | |
| | | | |
Sovereign Loans | | | — | | | | 131,305,317 | | | | — | | | | 131,305,317 | |
| | | | |
U.S. Government Guaranteed Small Business Administration Loans | | | — | | | | 16,458,956 | | | | — | | | | 16,458,956 | |
| | | | |
U.S. Treasury Obligations | | | — | | | | 71,811,094 | | | | — | | | | 71,811,094 | |
| | | | |
Warrants | | | 75,797 | | | | — | | | | — | | | | 75,797 | |
| | | | |
Miscellaneous | | | — | | | | — | | | | 0 | | | | 0 | |
| | | | |
Short-Term Investments: | | | | | | | | | | | | | | | | |
| | | | |
Affiliated Fund | | | 118,583,106 | | | | — | | | | — | | | | 118,583,106 | |
| | | | |
Repurchase Agreements | | | — | | | | 33,700,873 | | | | — | | | | 33,700,873 | |
| | | | |
Sovereign Government Securities | | | — | | | | — | | | | 5,286,231 | | | | 5,286,231 | |
| | | | |
U.S. Treasury Obligations | | | — | | | | 54,963,836 | | | | — | | | | 54,963,836 | |
| | | | |
Purchased Call Options | | | — | | | | 42 | | | | — | | | | 42 | |
| | | | |
Total Investments | | $ | 130,826,057 | | | $ | 1,470,682,701 | | | $ | 136,286,106 | | | $ | 1,737,794,864 | |
| | | | |
Forward Foreign Currency Exchange Contracts | | $ | — | | | $ | 52,873,676 | | | $ | — | | | $ | 52,873,676 | |
| | | | |
Non-Deliverable Bond Forward Contracts | | | — | | | | 3,112,595 | | | | — | | | | 3,112,595 | |
| | | | |
Futures Contracts | | | 23,255,474 | | | | — | | | | — | | | | 23,255,474 | |
| | | | |
Swap Contracts | | | — | | | | 155,722,220 | | | | — | | | | 155,722,220 | |
| | | | |
Total | | $ | 154,081,531 | | | $ | 1,682,391,192 | | | $ | 136,286,106 | | | $ | 1,972,758,829 | |
| | | | |
Liability Description | | | | | | | | | | | | | | | | |
| | | | |
Securities Sold Short | | $ | (111,761,850 | ) | | $ | (31,875,316 | ) | | $ | — | | | $ | (143,637,166 | ) |
| | | | |
Forward Foreign Currency Exchange Contracts | | | — | | | | (22,861,024 | ) | | | — | | | | (22,861,024 | ) |
| | | | |
Non-Deliverable Bond Forward Contracts | | | — | | | | (964,623 | ) | | | — | | | | (964,623 | ) |
| | | | |
Futures Contracts | | | (1,004,488 | ) | | | (459,055 | ) | | | — | | | | (1,463,543 | ) |
Global Macro Absolute Return Advantage Portfolio
October 31, 2022
Notes to Consolidated Financial Statements — continued
| | | | | | | | | | | | | | | | |
| Liability Description (continued) | | Level 1 | | | Level 2 | | | Level 3 | | | Total | |
| | | | |
Swap Contracts | | $ | — | | | $ | (104,700,663 | ) | | $ | — | | | $ | (104,700,663 | ) |
| | | | |
Total | | $ | (112,766,338 | ) | | $ | (160,860,681 | ) | | $ | — | | | $ | (273,627,019 | ) |
| * | Includes foreign equity securities whose values were adjusted to reflect market trading of comparable securities or other correlated instruments that occurred after the close of trading in their applicable foreign markets. |
The following is a reconciliation of Level 3 investments for which significant unobservable inputs were used to determine fair value:
| | | | | | | | | | | | | | | | | | | | | | | | | | | | | | | | |
| | | Common
Stocks | | | Foreign
Corporate
Bonds | | | Loan
Participation
Notes | | | Reinsurance
Side Cars* | | | Senior
Floating-
Rate Loans | | | Sovereign
Government
Bonds | | | Sovereign
Government
Securities | | | Total | |
| | | | | | | | |
Balance as of October 31, 2021 | | $ | 390,302 | | | $ | 0 | | | $ | 55,266,184 | | | $ | 22,146,350 | | | $ | 977,300 | | | $ | — | | | $ | — | | | $ | 78,780,136 | |
| | | | | | | | |
Realized gains (losses) | | | — | | | | — | | | | (878,738 | ) | | | — | | | | — | | | | (2,722,802 | ) | | | — | | | | (3,601,540 | ) |
| | | | | | | | |
Change in net unrealized appreciation (depreciation) | | | 76,892 | | | | — | | | | (2,320,237 | ) | | | (2,277,932 | ) | | | (478,457 | ) | | | (185,260,736 | ) | | | (1,707,857 | ) | | | (191,968,327 | ) |
| | | | | | | | |
Cost of purchases | | | — | | | | — | | | | — | | | | 7,100,000 | | | | — | | | | 39,041,257 | | | | 6,803,065 | | | | 52,944,322 | |
| | | | | | | | |
Proceeds from sales, including return of capital | | | — | | | | — | | | | (8,882,375 | ) | | | (6,322,995 | ) | | | — | | | | (37,257,452 | ) | | | — | | | | (52,462,822 | ) |
| | | | | | | | |
Accrued discount (premium) | | | — | | | | — | | | | 461,763 | | | | — | | | | 109,381 | | | | 963,875 | | | | 191,023 | | | | 1,726,042 | |
| | | | | | | | |
Transfers to Level 3 | | | — | | | | — | | | | — | | | | — | | | | — | | | | 250,868,295 | | | | — | | | | 250,868,295 | |
| | | | | | | | |
Transfers from Level 3 | | | — | | | | — | | | | — | | | | — | | | | — | | | | — | | | | — | | | | — | |
| | | | | | | | |
Balance as of October 31, 2022 | | $ | 467,194 | | | $ | 0 | | | $ | 43,646,597 | | | $ | 20,645,423 | | | $ | 608,224 | | | $ | 65,632,437 | | | $ | 5,286,231 | | | $ | 136,286,106 | |
| | | | | | | | |
Change in net unrealized appreciation (depreciation) on investments still held as of October 31, 2022 | | $ | 76,892 | | | $ | — | | | $ | (2,832,068 | ) | | $ | (2,215,967 | ) | | $ | (478,457 | ) | | $ | (182,201,670 | ) | | $ | (1,707,857 | ) | | $ | (189,359,127 | ) |
Not included in the table above are investments in securities categorized as Miscellaneous in the Portfolio of Investments which were acquired during the year ended October 31, 2022 at $0 cost and valued at $0 at October 31, 2022.
| * | The Portfolio’s investments in Reinsurance Side Cars were primarily valued on the basis of broker quotations. |
The following is a summary of quantitative information about significant unobservable valuation inputs for Level 3 investments held as of October 31, 2022:
| | | | | | | | | | | | | | | | |
| Type of Investment | | Fair Value as of
October 31, 2022 | | | Valuation Technique | | Unobservable Input | | Input | | | Impact to
Valuation from an
Increase to Input* | |
| | | | | |
Common Stocks | | $ | 467,194 | | | Market Approach | | EBITDA Multiple Discount Rate | | | 15 | % | | | Decrease | |
| | | | | |
Foreign Corporate Bonds | | | 0 | | | Estimated Recovery Value | | Estimated Recovery Value
Percentage | | | 0 | % | | | Increase | |
| | | | | |
Loan Participation Notes | | | 43,646,597 | | | Matrix Pricing | | Ajdusted Credit Spread to the
Central Bank of Uzbekistan
Quoted Policy Rate | | | 3.59 | % | | | Decrease | |
| | | | | |
Senior Floating-Rate Loans | | | 608,224 | | | Market Approach | | Discount Rate | | | 10 | % | | | Decrease | |
| | | | | |
Sovereign Government Bonds | | | 65,632,437 | | | Third Party Indication of
Value | | Foreign Currency Exchange
Rate | | | 40.20 UAH/USD | | | | Decrease | |
| | | | | |
Sovereign Government Securities | | | 5,286,231 | | | Third Party Indication of
Value | | Foreign Currency Exchange
Rate | | | 40.20 UAH/USD | | | | Decrease | |
Global Macro Absolute Return Advantage Portfolio
October 31, 2022
Notes to Consolidated Financial Statements — continued
| * | Represents the directional change in the fair value of the Level 3 investments that would result from an increase to the corresponding unobservable input. A decrease to the unobservable input would have the opposite effect. |
11 Risks and Uncertainties
Risks Associated with Foreign Investments
Foreign investments can be adversely affected by political, economic and market developments abroad, including the imposition of economic and other sanctions by the United States or another country. There may be less publicly available information about foreign issuers because they may not be subject to reporting practices, requirements or regulations comparable to those to which United States companies are subject. Foreign markets may be smaller, less liquid and more volatile than the major markets in the United States. Trading in foreign markets typically involves higher expense than trading in the United States. The Portfolio may have difficulties enforcing its legal or contractual rights in a foreign country. Securities that trade or are denominated in currencies other than the U.S. dollar may be adversely affected by fluctuations in currency exchange rates.
Emerging market securities often involve greater risks than developed market securities. Investment markets within emerging market countries are typically smaller, less liquid, less developed and more volatile than those in more developed markets like the United States, and may be focused in certain economic sectors. The information available about an emerging market issuer may be less reliable than for comparable issuers in more developed capital markets. Governmental actions can have a significant effect on the economic conditions in emerging market countries. It may be more difficult to make a claim or obtain a judgment in the courts of these countries than it is in the United States. The possibility of fraud, negligence, undue influence being exerted by an issuer or refusal to recognize ownership exists in some emerging markets. Disruptions due to work stoppages and trading improprieties in foreign securities markets have caused such markets to close. Emerging market securities are also subject to speculative trading, which contributes to their volatility.
Economic data as reported by sovereign entities may be delayed, inaccurate or fraudulent. In the event of a default by a sovereign entity, there are typically no assets to be seized or cash flows to be attached. Furthermore, the willingness or ability of a sovereign entity to restructure defaulted debt may be limited. Therefore, losses on sovereign defaults may far exceed the losses from the default of a similarly rated U.S. debt issuer.
On February 24, 2022, Russia launched an invasion of Ukraine, following rising tensions over the buildup of Russian troops along the Ukrainian border and joint military exercises by Russia with Belarus. In response to the invasion, many countries, including the U.S., have imposed economic sanctions on Russian governmental institutions, Russian entities, and Russian individuals. The conflict and sanctions have had a negative impact on the Russian economy, on the Russian currency, and on investments having exposure to Russia, Belarus and Ukraine. The conflict could also have a significant effect on investments outside the region. The duration and extent of the military conflict with Russia and the related sanctions cannot be predicted at this time.
LIBOR Transition Risk
Certain instruments held by the Portfolio may pay an interest rate based on the London Interbank Offered Rate (“LIBOR”), which is the average offered rate for various maturities of short-term loans between certain major international banks. LIBOR is used throughout global banking and financial industries to determine interest rates for a variety of financial instruments (such as debt instruments and derivatives) and borrowing arrangements. The ICE Benchmark Administration Limited, the administrator of LIBOR, ceased publishing certain LIBOR settings on December 31, 2021, and is expected to cease publishing the remaining LIBOR settings on June 30, 2023. Although the transition process away from LIBOR has become increasingly well-defined, the impact on certain debt securities, derivatives and other financial instruments that utilize LIBOR remains uncertain. The phase-out of LIBOR may result in, among other things, increased volatility or illiquidity in markets for instruments based on LIBOR and changes in the value of such instruments.
Pandemic Risk
An outbreak of respiratory disease caused by a novel coronavirus was first detected in China in late 2019 and subsequently spread internationally. This coronavirus has resulted in closing borders, enhanced health screenings, changes to healthcare service preparation and delivery, quarantines, cancellations, disruptions to supply chains and customer activity, as well as general concern and uncertainty. Health crises caused by outbreaks of disease, such as the coronavirus outbreak, may exacerbate other pre-existing political, social and economic risks and disrupt normal market conditions and operations. The impact of this outbreak has negatively affected the worldwide economy, as well as the economies of individual countries and industries, and could continue to affect the market in significant and unforeseen ways. Other epidemics and pandemics that may arise in the future may have similar effects. Any such impact could adversely affect the Portfolio’s performance, or the performance of the securities in which the Portfolio invests.
Global Macro Absolute Return Advantage Portfolio
October 31, 2022
Report of Independent Registered Public Accounting Firm
To the Trustees and Investors of Global Macro Absolute Return Advantage Portfolio:
Opinion on the Financial Statements and Financial Highlights
We have audited the accompanying consolidated statement of assets and liabilities of Global Macro Absolute Return Advantage Portfolio and subsidiary (the “Portfolio”), including the consolidated portfolio of investments, as of October 31, 2022, the related consolidated statement of operations for the year then ended, the consolidated statements of changes in net assets for each of the two years in the period then ended, the consolidated financial highlights for each of the five years in the period then ended, and the related notes (collectively referred to as the “financial statements and financial highlights”). In our opinion, the financial statements and financial highlights present fairly, in all material respects, the financial position of the Portfolio as of October 31, 2022, and the results of its operations for the year then ended, the changes in its net assets for each of the two years in the period then ended, and the financial highlights for each of the five years in the period then ended, in conformity with accounting principles generally accepted in the United States of America.
Basis for Opinion
These financial statements and financial highlights are the responsibility of the Portfolio’s management. Our responsibility is to express an opinion on the Portfolio’s financial statements and financial highlights based on our audits. We are a public accounting firm registered with the Public Company Accounting Oversight Board (United States) (PCAOB) and are required to be independent with respect to the Portfolio in accordance with the U.S. federal securities laws and the applicable rules and regulations of the Securities and Exchange Commission and the PCAOB.
We conducted our audits in accordance with the standards of the PCAOB. Those standards require that we plan and perform the audit to obtain reasonable assurance about whether the financial statements and financial highlights are free of material misstatement, whether due to error or fraud. The Portfolio is not required to have, nor were we engaged to perform, an audit of its internal control over financial reporting. As part of our audits, we are required to obtain an understanding of internal control over financial reporting but not for the purpose of expressing an opinion on the effectiveness of the Portfolio’s internal control over financial reporting. Accordingly, we express no such opinion.
Our audits included performing procedures to assess the risks of material misstatement of the financial statements and financial highlights, whether due to error or fraud, and performing procedures that respond to those risks. Such procedures included examining, on a test basis, evidence regarding the amounts and disclosures in the financial statements and financial highlights. Our audits also included evaluating the accounting principles used and significant estimates made by management, as well as evaluating the overall presentation of the financial statements and financial highlights. Our procedures included confirmation of securities and senior loans owned as of October 31, 2022, by correspondence with the custodian, brokers and selling or agent banks; when replies were not received from brokers and selling or agent banks, we performed other auditing procedures. We believe that our audits provide a reasonable basis for our opinion.
/s/ Deloitte & Touche LLP
Boston, Massachusetts
December 29, 2022
We have served as the auditor of one or more Eaton Vance investment companies since 1959.
Eaton Vance
Global Macro Absolute Return Advantage Fund
October 31, 2022
Board of Trustees’ Contract Approval
Overview of the Contract Review Process
The Investment Company Act of 1940, as amended (the “1940 Act”), provides, in substance, that the investment advisory agreement between a fund and its investment adviser will continue in effect from year-to-year only if its continuation is approved on an annual basis by a vote of the fund’s board of trustees, including a majority of the trustees who are not “interested persons” of the fund (“independent trustees”), cast in person at a meeting called for the purpose of considering such approval.
At a meeting held on June 8, 2022, the Boards of Trustees/Directors (collectively, the “Board”) that oversee the registered investment companies advised by Eaton Vance Management or its affiliate, Boston Management and Research (the “Eaton Vance Funds”), including a majority of the independent trustees (the “Independent Trustees”), voted to approve the continuation of existing investment advisory agreements and sub-advisory agreements1 for each of the Eaton Vance Funds for an additional one-year period. The Board relied upon the affirmative recommendation of its Contract Review Committee, which is a committee exclusively comprised of Independent Trustees. Prior to making its recommendation, the Contract Review Committee reviewed information furnished by the adviser and sub-adviser to each of the Eaton Vance Funds (including information specifically requested by the Board) for a series of formal meetings held between April and June 2022. Members of the Contract Review Committee also considered information received at prior meetings of the Board and its committees, to the extent such information was relevant to the Contract Review Committee’s annual evaluation of the investment advisory agreements and sub-advisory agreements.
In connection with its evaluation of the investment advisory agreements and sub-advisory agreements, the Board considered various information relating to the Eaton Vance Funds. This included information applicable to all or groups of Eaton Vance Funds, which is referenced immediately below, and information applicable to the particular Eaton Vance Fund covered by this report (additional fund-specific information is referenced below under “Results of the Contract Review Process”). (For funds that invest through one or more underlying portfolios, references to “each fund” in this section may include information that was considered at the portfolio-level.)
Information about Fees, Performance and Expenses
| | • | | A report from an independent data provider comparing advisory and other fees paid by each fund to such fees paid by comparable funds, as identified by the independent data provider (“comparable funds”); |
| | • | | A report from an independent data provider comparing each fund’s total expense ratio (and its components) to those of comparable funds; |
| | • | | A report from an independent data provider comparing the investment performance of each fund (including, as relevant, total return data, income data, Sharpe ratios and information ratios) to the investment performance of comparable funds and, as applicable, benchmark indices, over various time periods; |
| | • | | In certain instances, data regarding investment performance relative to customized groups of peer funds and blended indices identified by the adviser in consultation with the Portfolio Management Committee of the Board (a committee exclusively comprised of Independent Trustees); |
| | • | | Comparative information concerning the fees charged and services provided by the adviser and sub-adviser to each fund in managing other accounts (which may include other mutual funds, collective investment funds and institutional accounts) using investment strategies and techniques similar to those used in managing such fund(s), if any; |
| | • | | Profitability analyses with respect to the adviser and sub-adviser to each of the funds; |
Information about Portfolio Management and Trading
| | • | | Descriptions of the investment management services provided to each fund, as well as each of the funds’ investment strategies and policies; |
| | • | | The procedures and processes used to determine the value of fund assets, including, when necessary, the determination of “fair value” and actions taken to monitor and test the effectiveness of such procedures and processes; |
| | • | | Information about the policies and practices of each fund’s adviser and sub-adviser with respect to trading, including their processes for seeking best execution of portfolio transactions; |
| | • | | Information about the allocation of brokerage transactions and the benefits, if any, received by the adviser and sub-adviser to each fund as a result of brokerage allocation, including, as applicable, information concerning the acquisition of research through client commission arrangements and policies with respect to “soft dollars”; |
| | • | | Data relating to the portfolio turnover rate of each fund and related information regarding active management in the context of particular strategies; |
Information about each Adviser and Sub-adviser
| | • | | Reports detailing the financial results and condition of the adviser and sub-adviser to each fund; |
| | • | | Information regarding the individual investment professionals whose responsibilities include portfolio management and investment research for the funds, and, for portfolio managers and certain other investment professionals, information relating to their responsibilities with respect to managing other mutual funds and investment accounts, as applicable; |
| 1 | Not all Eaton Vance Funds have entered into a sub-advisory agreement with a sub-adviser. Accordingly, references to “sub-adviser” or “sub-advisory agreement” in this “Overview” section may not be applicable to the particular Eaton Vance Fund covered by this report. Following the “Overview” section, further information regarding the Board’s evaluation of a fund’s contractual arrangements is included under the “Results of the Contract Review Process” section. |
Eaton Vance
Global Macro Absolute Return Advantage Fund
October 31, 2022
Board of Trustees’ Contract Approval — continued
| | • | | Information regarding the adviser’s and its parent company’s (Morgan Stanley’s) efforts to retain and attract talented investment professionals, including in the context of a particularly competitive marketplace for talent, as well as the ongoing unique environment presented by hybrid, remote and other alternative work arrangements; |
| | • | | The Code of Ethics of the adviser and its affiliates and the sub-adviser of each fund, together with information relating to compliance with, and the administration of, such codes; |
| | • | | Policies and procedures relating to proxy voting, including regular reporting with respect to fund proxy voting activities; |
| | • | | Information regarding the handling of corporate actions and class actions, as well as information regarding litigation and other regulatory matters; |
| | • | | Information concerning the resources devoted to compliance efforts undertaken by the adviser and its affiliates and the sub-adviser of each fund, if any, including descriptions of their various compliance programs and their record of compliance; |
| | • | | Information concerning the business continuity and disaster recovery plans of the adviser and its affiliates and the sub-adviser of each fund, if any; |
| | • | | A description of Eaton Vance Management’s and Boston Management and Research’s oversight of sub-advisers, including with respect to regulatory and compliance issues, investment management and other matters; |
Other Relevant Information
| | • | | Information regarding ongoing initiatives to further integrate and harmonize, where applicable, the investment management and other departments of the adviser and its affiliates with the overall investment management infrastructure of Morgan Stanley, in light of Morgan Stanley’s acquisition of Eaton Vance on March 1, 2021; |
| | • | | Information concerning the nature, cost and character of the administrative and other non-investment advisory services provided by Eaton Vance Management and its affiliates; |
| | • | | Information concerning oversight of the relationship with the custodian, subcustodians, fund accountants, and other third-party service providers by the adviser and/or administrator to each of the funds; |
| | • | | Information concerning efforts to implement policies and procedures with respect to various new regulations applicable to the funds, including Rule 12d1-4 (the Fund-of-Funds Rule), Rule 18f-4 (the Derivatives Rule) and Rule 2a-5 (the Fair Valuation Rule); |
| | • | | For an Eaton Vance Fund structured as an exchange-listed closed-end fund, information concerning the benefits of the closed-end fund structure, as well as, where relevant, the closed-end fund’s market prices (including as compared to the closed-end fund’s net asset value (NAV)), trading volume data, continued use of auction preferred shares (where applicable), distribution rates and other relevant matters; |
| | • | | The risks which the adviser and/or its affiliates incur in connection with the management and operation of the funds, including, among others, litigation, regulatory, entrepreneurial, and other business risks (and the associated costs of such risks); and |
| | • | | The terms of each investment advisory agreement and sub-advisory agreement. |
During the various meetings of the Board and its committees over the course of the year leading up to the June 8, 2022 meeting, the Trustees received information from portfolio managers and other investment professionals of the advisers and sub-advisers of the funds regarding investment and performance matters, and considered various investment and trading strategies used in pursuing the funds’ investment objectives. The Trustees also received information regarding risk management techniques employed in connection with the management of the funds. The Board and its committees evaluated issues pertaining to industry and regulatory developments, compliance procedures, fund governance and other issues with respect to the funds, and received and participated in reports and presentations provided by Eaton Vance Management, Boston Management and Research and fund sub-advisers, with respect to such matters. In addition to the formal meetings of the Board and its committees, the Independent Trustees held regular teleconferences to discuss, among other topics, matters relating to the continuation of investment advisory agreements and sub-advisory agreements.
The Contract Review Committee was advised throughout the contract review process by Goodwin Procter LLP, independent legal counsel for the Independent Trustees. The members of the Contract Review Committee, with the advice of such counsel, exercised their own business judgment in determining the material factors to be considered in evaluating each investment advisory agreement and sub-advisory agreement and the weight to be given to each such factor. The conclusions reached with respect to each investment advisory agreement and sub-advisory agreement were based on a comprehensive evaluation of all the information provided and not any single factor. Moreover, each member of the Contract Review Committee may have placed varying emphasis on particular factors in reaching conclusions with respect to each investment advisory agreement and sub-advisory agreement. In evaluating each investment advisory agreement and sub-advisory agreement, including the fee structures and other terms contained in such agreements, the members of the Contract Review Committee were also informed by multiple years of analysis and discussion with the adviser and sub-adviser to each of the Eaton Vance Funds.
Results of the Contract Review Process
Based on its consideration of the foregoing, and such other information it deemed relevant, including the factors and conclusions described below, the Contract Review Committee concluded that the continuation of the investment advisory and administrative agreement between Eaton Vance Global Macro Absolute Return Advantage Fund (the “Fund”) and Eaton Vance Management (“EVM”), as well as the investment advisory agreement between Global Macro Absolute Return Advantage Portfolio (the “Portfolio”), the portfolio in which the Fund invests, and Boston Management and Research (“BMR”) (EVM, with respect to the Fund, and BMR, with respect to the Portfolio, are each referred to herein as the “Adviser”), and the sub-advisory agreement between EVM and Eaton Vance Advisers International Ltd. (the “Sub-adviser”), an affiliate of the Advisers, with respect to the Fund, and the sub-advisory agreement between BMR and the Sub-adviser, with respect to the Portfolio, including their respective fee structures, are in the interests of shareholders
Eaton Vance
Global Macro Absolute Return Advantage Fund
October 31, 2022
Board of Trustees’ Contract Approval — continued
and, therefore, recommended to the Board approval of each agreement. Based on the recommendation of the Contract Review Committee, the Board, including a majority of the Independent Trustees, voted to approve continuation of the investment advisory and administrative agreement for the Fund and the investment advisory agreement for the Portfolio (together, the “investment advisory agreements”) and the sub-advisory agreements for the Fund and the Portfolio (together, the “sub-advisory agreements”).
Nature, Extent and Quality of Services
In considering whether to approve the investment advisory agreements and sub-advisory agreements for the Fund and the Portfolio, the Board evaluated the nature, extent and quality of services provided to the Fund and to the Portfolio by the applicable Adviser and the Sub-adviser, respectively.
The Board considered each Adviser’s and the Sub-adviser’s management capabilities and investment processes in light of the types of investments held by the Fund and the Portfolio, including the education, experience and number of investment professionals and other personnel who provide portfolio management, investment research, and similar services to the Fund and the Portfolio, including recent changes to such personnel. The Board considered each Adviser’s expertise with respect to global markets and in-house research capabilities. The Board also considered the resources available to the Sub-adviser in fulfilling its duties under the sub-advisory agreements and the abilities and experience of the Sub-adviser’s investment professionals in implementing the investment strategies of the Fund and the Portfolio. In particular, the Board considered the expertise of the Sub-adviser’s investment professionals with respect to global markets and in-house research capabilities. The Board considered the international investment capabilities of the Sub-adviser, which is based in London, and the benefits to the Fund and the Portfolio of having portfolio management services involving investments in international securities provided by investment professionals located abroad. The Board also took into account the resources dedicated to portfolio management and other services, the compensation methods of each Adviser and other factors, including the reputation and resources of each Adviser to recruit and retain highly qualified research, advisory and supervisory investment professionals. In addition, the Board considered the time and attention devoted to the Eaton Vance Funds, including the Fund and the Portfolio, by senior management, as well as the infrastructure, operational capabilities and support staff in place to assist in the portfolio management and operations of the Fund and the Portfolio, including the provision of administrative services. The Board also considered the business-related and other risks to which each Adviser or its affiliates may be subject in managing the Fund and the Portfolio.
The Board noted that, under the terms of the investment advisory agreement of the Fund, EVM may invest assets of the Fund directly in securities, for which it would receive a fee, or in the Portfolio, for which it receives no separate fee but for which BMR receives an advisory fee from the Portfolio.
The Board considered the compliance programs of each Adviser and relevant affiliates thereof, including the Sub-adviser. The Board considered compliance and reporting matters regarding, among other things, personal trading by investment professionals, disclosure of portfolio holdings, late trading, frequent trading, portfolio valuation, business continuity and the allocation of investment opportunities. The Board also considered the responses of each Adviser and its affiliates to requests in recent years from regulatory authorities, such as the Securities and Exchange Commission and the Financial Industry Regulatory Authority.
The Board considered other administrative services provided or overseen by EVM and its affiliates, including transfer agency and accounting services. The Board evaluated the benefits to shareholders of investing in a fund that is a part of a large fund complex offering exposure to a variety of asset classes and investment disciplines, as well as the ability, in many cases, to exchange an investment among different funds without incurring additional sales charges.
After consideration of the foregoing factors, among others, the Board concluded that the nature, extent and quality of services provided by each Adviser and the Sub-adviser, taken as a whole, are appropriate and consistent with the terms of the applicable investment advisory agreement and the applicable sub-advisory agreement.
Fund Performance
The Board compared the Fund’s investment performance to that of comparable funds identified by an independent data provider (the peer group), as well as an appropriate benchmark index. The Board’s review included comparative performance data with respect to the Fund for the one-, three-, five- and ten-year periods ended December 31, 2021. In this regard, the Board noted that the performance of the Fund was higher than the median performance of the Fund’s peer group for the three-year period. The Board also noted that the performance of the Fund was higher than its benchmark index for the three-year period. The Board concluded that the performance of the Fund was satisfactory.
Management Fees and Expenses
The Board considered contractual fee rates payable by the Portfolio and by the Fund for advisory and administrative services (referred to collectively as “management fees”). As part of its review, the Board considered the Fund’s management fees and total expense ratio for a one-year period ended December 31, 2021, as compared to those of comparable funds, before and after giving effect to any undertaking to waive fees or reimburse expenses. The Board noted that the Portfolio has established a wholly-owned subsidiary to accommodate the Portfolio’s commodity-related investments. The subsidiary is managed by BMR pursuant to a separate investment advisory agreement that is subject to annual approval by the Board. The subsidiary’s fee rates are the same as those charged to the Portfolio, and the Portfolio will not pay any additional management fees with respect to its assets invested in the subsidiary. The Board also considered certain factors identified by management in response to inquiries from the Contract Review Committee regarding the Fund’s total expense ratio relative to comparable funds.
Eaton Vance
Global Macro Absolute Return Advantage Fund
October 31, 2022
Board of Trustees’ Contract Approval — continued
After considering the foregoing information, and in light of the nature, extent and quality of the services provided by each Adviser and the Sub-adviser, the Board concluded that the management fees charged for advisory and related services are reasonable.
Profitability and “Fall-Out” Benefits
The Board considered the level of profits realized by each Adviser and relevant affiliates thereof, including the Sub-adviser, in providing investment advisory and administrative services to the Fund, to the Portfolio and to all Eaton Vance Funds as a group. The Board considered the level of profits realized without regard to marketing support or other payments by each Adviser and its affiliates to third parties in respect of distribution or other services.
The Board concluded that, in light of the foregoing factors and the nature, extent and quality of the services rendered, the profits realized by each Adviser and its affiliates, including the Sub-adviser, are deemed not to be excessive.
The Board also considered direct or indirect fall-out benefits received by each Adviser and its affiliates, including the Sub-adviser, in connection with their respective relationships with the Fund and the Portfolio, including the benefits of research services that may be available to each Adviser or the Sub-adviser as a result of securities transactions effected for the Fund and the Portfolio and other investment advisory clients.
Economies of Scale
In reviewing management fees and profitability, the Board also considered the extent to which the applicable Adviser and its affiliates, on the one hand, and the Fund and the Portfolio, on the other hand, can expect to realize benefits from economies of scale as the assets of the Fund and the Portfolio increase. The Board acknowledged the difficulty in accurately measuring the benefits resulting from economies of scale, if any, with respect to the management of any specific fund or group of funds. The Board reviewed data summarizing the increases and decreases in the assets of the Fund and of all Eaton Vance Funds as a group over various time periods, and evaluated the extent to which the total expense ratio of the Fund and the profitability of each Adviser and its affiliates may have been affected by such increases or decreases. Based upon the foregoing, the Board concluded that the Fund currently shares in the benefits from economies of scale, if any, when they are realized by each Adviser. The Board also concluded that the structure of the advisory fees, which include breakpoints at several asset levels, will allow the Fund and the Portfolio to continue to benefit from any economies of scale in the future.
Eaton Vance
Global Macro Absolute Return Advantage Fund
October 31, 2022
Liquidity Risk Management Program
The Fund has implemented a written liquidity risk management program (Program) and related procedures to manage its liquidity in accordance with Rule 22e-4 under the Investment Company Act of 1940, as amended (Liquidity Rule). The Liquidity Rule defines “liquidity risk” as the risk that a fund could not meet requests to redeem shares issued by the fund without significant dilution of the remaining investors’ interests in the fund. The Fund’s Board of Trustees/Directors has designated the investment adviser to serve as the administrator of the Program and the related procedures. The administrator has established a Liquidity Risk Management Oversight Committee (Committee) to perform the functions necessary to administer the Program. As part of the Program, the administrator is responsible for identifying illiquid investments and categorizing the relative liquidity of the Fund’s investments in accordance with the Liquidity Rule. Under the Program, the administrator assesses, manages, and periodically reviews the Fund’s liquidity risk, and is responsible for making certain reports to the Fund’s Board of Trustees/Directors and the Securities and Exchange Commission (SEC) regarding the liquidity of the Fund’s investments, and to notify the Board of Trustees/Directors and the SEC of certain liquidity events specified in the Liquidity Rule. The liquidity of the Fund’s portfolio investments is determined based on a number of factors including, but not limited to, relevant market, trading and investment-specific considerations under the Program.
At a meeting of the Fund’s Board of Trustees/Directors on June 7, 2022, the Committee provided a written report to the Fund’s Board of Trustees/Directors pertaining to the operation, adequacy, and effectiveness of implementation of the Program, as well as the operation of the highly liquid investment minimum (if applicable) for the period January 1, 2021 through December 31, 2021 (Review Period). The Program operated effectively during the Review Period, supporting the administrator’s ability to assess, manage and monitor Fund liquidity risk, including during periods of market volatility and net redemptions. During the Review Period, the Fund met redemption requests on a timely basis.
There can be no assurance that the Program will achieve its objectives in the future. Please refer to the Fund’s prospectus for more information regarding the Fund’s exposure to liquidity risk and other principal risks to which an investment in the Fund may be subject.
Eaton Vance
Global Macro Absolute Return Advantage Fund
October 31, 2022
Management and Organization
Fund Management. The Trustees of Eaton Vance Mutual Funds Trust (the Trust) and Global Macro Absolute Return Advantage Portfolio (the Portfolio) are responsible for the overall management and supervision of the Trust’s and the Portfolio’s affairs. The Board members and officers of the Trust and the Portfolio are listed below. Except as indicated, each individual has held the office shown or other offices in the same company for the last five years. Board members hold indefinite terms of office. Each Trustee holds office until his or her successor is elected and qualified, subject to a prior death, resignation, retirement, disqualification or removal. Under the terms of the Fund’s and the Portfolio’s current Trustee retirement policy, an Independent Trustee must retire and resign as a Trustee on the earlier of: (i) the first day of July following his or her 74th birthday; or (ii), with limited exception, December 31st of the 20th year in which he or she has served as a Trustee. However, if such retirement and resignation would cause the Fund and the Portfolio to be out of compliance with Section 16 of the 1940 Act or any other regulations or guidance of the SEC, then such retirement and resignation will not become effective until such time as action has been taken for the Fund and the Portfolio to be in compliance therewith. The “noninterested Trustees” consist of those Trustees who are not “interested persons” of the Trust and the Portfolio, as that term is defined under the 1940 Act. The business address of each Board member and officer is Two International Place, Boston, Massachusetts 02110. As used below, “BMR” refers to Boston Management and Research, “EVC” refers to Eaton Vance Corp., “EV” refers to EV LLC, “EVM” refers to Eaton Vance Management and “EVD” refers to Eaton Vance Distributors, Inc. EV is the trustee of each of EVM and BMR. Effective March 1, 2021, each of EVM, BMR, EVD and EV are indirect, wholly owned subsidiaries of Morgan Stanley. Each officer affiliated with EVM may hold a position with other EVM affiliates that is comparable to his or her position with EVM listed below. Each Trustee oversees 135 funds (with the exception of Mr. Bowser who oversees 110 funds) in the Eaton Vance fund complex (including both funds and portfolios in a hub and spoke structure).
| | | | | | |
| Name and Year of Birth | | Trust/Portfolio
Position(s) | | Length of Service | | Principal Occupation(s) and Other Directorships During Past Five Years and Other Relevant Experience |
|
| Interested Trustee |
| | | |
Thomas E. Faust Jr. 1958 | | Trustee | | Since 2007 | | Chairman of Morgan Stanley Investment Management, Inc. (MSIM), member of the Board of Managers and President of EV (since 2021), Chief Executive Officer of EVM and BMR. Formerly, Chairman, Chief Executive Officer (2007-2021) and President (2006-2021) of EVC and Director of EVD (2007-2022). Mr. Faust is an interested person because of his positions with MSIM, BMR, EVM and EV, which are affiliates of the Trust and the Portfolio. Other Directorships. Formerly, Director of EVC (2007-2021) and Hexavest Inc. (investment management firm) (2012-2021). |
|
| Noninterested Trustees |
| | | |
Alan C. Bowser(1) 1962 | | Trustee | | Since 2022 | | Chief Diversity Officer, Partner and a member of the Operating Committee, and formerly served as Senior Advisor on Diversity and Inclusion for the firm’s chief executive officer, Co-Head of the Americas Region, and Senior Client Advisor of Bridgewater Associates, an asset management firm (2011-present). Other Directorships. None. |
| | | |
Mark R. Fetting 1954 | | Trustee | | Since 2016 | | Private investor. Formerly held various positions at Legg Mason, Inc. (investment management firm) (2000-2012), including President, Chief Executive Officer, Director and Chairman (2008-2012), Senior Executive Vice President (2004-2008) and Executive Vice President (2001-2004). Formerly, President of Legg Mason family of funds (2001-2008). Formerly, Division President and Senior Officer of Prudential Financial Group, Inc. and related companies (investment management firm) (1991-2000). Other Directorships. None. |
| | | |
Cynthia E. Frost 1961 | | Trustee | | Since 2014 | | Private investor. Formerly, Chief Investment Officer of Brown University (university endowment) (2000-2012). Formerly, Portfolio Strategist for Duke Management Company (university endowment manager) (1995-2000). Formerly, Managing Director, Cambridge Associates (investment consulting company) (1989-1995). Formerly, Consultant, Bain and Company (management consulting firm) (1987-1989). Formerly, Senior Equity Analyst, BA Investment Management Company (1983-1985). Other Directorships. None. |
| | | |
George J. Gorman 1952 | | Chairperson of the Board and Trustee | | Since 2021 (Chairperson) and 2014 (Trustee) | | Principal at George J. Gorman LLC (consulting firm). Formerly, Senior Partner at Ernst & Young LLP (a registered public accounting firm) (1974-2009). Other Directorships. None. |
Eaton Vance
Global Macro Absolute Return Advantage Fund
October 31, 2022
Management and Organization — continued
| | | | | | |
| Name and Year of Birth | | Trust/Portfolio
Position(s) | | Length of Service | | Principal Occupation(s) and Other Directorships During Past Five Years and Other Relevant Experience |
|
| Noninterested Trustees (continued) |
| | | |
Valerie A. Mosley 1960 | | Trustee | | Since 2014 | | Chairwoman and Chief Executive Officer of Valmo Ventures (a consulting and investment firm). Founder of Upward Wealth, Inc., dba BrightUp, a fintech platform. Formerly, Partner and Senior Vice President, Portfolio Manager and Investment Strategist at Wellington Management Company, LLP (investment management firm) (1992-2012). Formerly, Chief Investment Officer, PG Corbin Asset Management (1990-1992). Formerly worked in institutional corporate bond sales at Kidder Peabody (1986-1990). Other Directorships. Director of DraftKings, Inc. (digital sports entertainment and gaming company) (since September 2020). Director of Envestnet, Inc. (provider of intelligent systems for wealth management and financial wellness) (since 2018). Formerly, Director of Dynex Capital, Inc. (mortgage REIT) (2013-2020) and Director of Groupon, Inc. (e-commerce provider) (2020-2022). |
| | | |
Keith Quinton 1958 | | Trustee | | Since 2018 | | Private investor, researcher and lecturer. Formerly, Independent Investment Committee Member at New Hampshire Retirement System (2017-2021). Formerly, Portfolio Manager and Senior Quantitative Analyst at Fidelity Investments (investment management firm) (2001-2014). Other Directorships. Formerly, Director (2016-2021) and Chairman (2019-2021) of New Hampshire Municipal Bond Bank. |
| | | |
Marcus L. Smith 1966 | | Trustee | | Since 2018 | | Private investor and independent corporate director. Formerly, Chief Investment Officer, Canada (2012-2017), Chief Investment Officer, Asia (2010-2012), Director of Asian Research (2004-2010) and portfolio manager (2001-2017) at MFS Investment Management (investment management firm). Other Directorships. Director of First Industrial Realty Trust, Inc. (an industrial REIT) (since 2021). Director of MSCI Inc. (global provider of investment decision support tools) (since 2017). Formerly, Director of DCT Industrial Trust Inc. (logistics real estate company) (2017-2018). |
| | | |
Susan J. Sutherland 1957 | | Trustee | | Since 2015 | | Private investor. Director of Ascot Group Limited and certain of its subsidiaries (insurance and reinsurance) (since 2017). Formerly, Director of Hagerty Holding Corp. (insurance) (2015-2018) and Montpelier Re Holdings Ltd. (insurance and reinsurance) (2013-2015). Formerly, Associate, Counsel and Partner at Skadden, Arps, Slate, Meagher & Flom LLP (law firm) (1982-2013). Other Directorships. Director of Kairos Acquisition Corp. (insurance/InsurTech acquisition company) (since 2021). |
| | | |
Scott E. Wennerholm 1959 | | Trustee | | Since 2016 | | Private investor. Formerly, Trustee at Wheelock College (postsecondary institution) (2012-2018). Formerly, Consultant at GF Parish Group (executive recruiting firm) (2016-2017). Formerly, Chief Operating Officer and Executive Vice President at BNY Mellon Asset Management (investment management firm) (2005-2011). Formerly, Chief Operating Officer and Chief Financial Officer at Natixis Global Asset Management (investment management firm) (1997-2004). Formerly, Vice President at Fidelity Investments Institutional Services (investment management firm) (1994-1997). Other Directorships. None. |
| | | |
Nancy A. Wiser(1) 1967 | | Trustee | | Since 2022 | | Formerly, Executive Vice President and the Global Head of Operations at Wells Fargo Asset Management (2011-2021). Other Directorships. None. |
Eaton Vance
Global Macro Absolute Return Advantage Fund
October 31, 2022
Management and Organization — continued
| | | | | | |
| Name and Year of Birth | | Trust/Portfolio
Position(s) | | Length of Service | | Principal Occupation(s) During Past Five Years |
|
| Principal Officers who are not Trustees |
| | | |
Eric A. Stein 1980 | | President | | Since 2020 | | Vice President and Chief Investment Officer, Fixed Income of EVM and BMR. Prior to November 1, 2020, Mr. Stein was a co-Director of Eaton Vance’s Global Income Investments. Also Vice President of Calvert Research and Management (“CRM”). |
| | | |
Deidre E. Walsh 1971 | | Vice President and Chief Legal Officer | | Since 2009 | | Vice President of EVM and BMR. Also Vice President of CRM. |
| | | |
James F. Kirchner 1967 | | Treasurer | | Since 2007 | | Vice President of EVM and BMR. Also Vice President of CRM. |
| | | |
Nicholas Di Lorenzo 1987 | | Secretary | | Since 2022 | | Formerly, associate (2012-2021) and counsel (2022) at Dechert LLP. |
| | | |
Richard F. Froio 1968 | | Chief Compliance Officer | | Since 2017 | | Vice President of EVM and BMR since 2017. Formerly, Deputy Chief Compliance Officer (Adviser/Funds) and Chief Compliance Officer (Distribution) at PIMCO (2012-2017) and Managing Director at BlackRock/Barclays Global Investors (2009-2012). |
| (1) | Mr. Bowser and Ms. Wiser began serving as Trustees effective April 4, 2022. |
The SAI for the Fund includes additional information about the Trustees and officers of the Fund and the Portfolio and can be obtained without charge on Eaton Vance’s website at www.eatonvance.com or by calling 1-800-262-1122.
Eaton Vance Funds
| | |
| Privacy Notice | | April 2021 |
| | |
| |
| FACTS | | WHAT DOES EATON VANCE DO WITH YOUR
PERSONAL INFORMATION? |
| | | |
| |
| | |
| Why? | | Financial companies choose how they share your personal information. Federal law gives consumers the right to limit some but not all sharing. Federal law also requires us to tell you how we collect, share, and protect your personal information. Please read this notice carefully to understand what we do. |
| | |
| | | |
| What? | | The types of personal information we collect and share depend on the product or service you have with us. This information can include: ∎ Social Security number and income ∎ investment experience and risk tolerance ∎ checking account number and wire transfer instructions |
| | |
| | | |
| How? | | All financial companies need to share customers’ personal information to run their everyday business. In the section below, we list the reasons financial companies can share their customers’ personal information; the reasons Eaton Vance chooses to share; and whether you can limit this sharing. |
| | |
| | | |
| | | | |
Reasons we can share your
personal information | | Does Eaton Vance share? | | Can you limit this sharing? |
| | | |
| For our everyday business purposes — such as to process your transactions, maintain your account(s), respond to court orders and legal investigations, or report to credit bureaus | | Yes | | No |
| For our marketing purposes — to offer our products and services to you | | Yes | | No |
| For joint marketing with other financial companies | | No | | We don’t share |
| For our investment management affiliates’ everyday business purposes — information about your transactions, experiences, and creditworthiness | | Yes | | Yes |
| For our affiliates’ everyday business purposes — information about your transactions and experiences | | Yes | | No |
| For our affiliates’ everyday business purposes — information about your creditworthiness | | No | | We don’t share |
| For our investment management affiliates to market to you | | Yes | | Yes |
| For our affiliates to market to you | | No | | We don’t share |
| For nonaffiliates to market to you | | No | | We don’t share |
| | |
| To limit our sharing | | Call toll-free 1-800-262-1122 or email: EVPrivacy@eatonvance.com Please note: If you are a new customer, we can begin sharing your information 30 days from the date we sent this notice. When you are no longer our customer, we continue to share your information as described in this notice. However, you can contact us at any time to limit our sharing. |
| | |
| | | |
| | |
| Questions? | | Call toll-free 1-800-262-1122 or email: EVPrivacy@eatonvance.com |
| | |
| | | |
Eaton Vance Funds
| | |
| Privacy Notice — continued | | April 2021 |
| | |
| Who we are |
| Who is providing this notice? | | Eaton Vance Management, Eaton Vance Distributors, Inc., Eaton Vance Trust Company, Eaton Vance Management (International) Limited, Eaton Vance Advisers International Ltd., Eaton Vance Global Advisors Limited, Eaton Vance Management’s Real Estate Investment Group, Boston Management and Research, Calvert Research and Management, Eaton Vance and Calvert Fund Families and our investment advisory affiliates (“Eaton Vance”) (see Investment Management Affiliates definition below) |
| What we do |
| How does Eaton Vance protect my personal information? | | To protect your personal information from unauthorized access and use, we use security measures that comply with federal law. These measures include computer safeguards and secured files and buildings. We have policies governing the proper handling of customer information by personnel and requiring third parties that provide support to adhere to appropriate security standards with respect to such information. |
| How does Eaton Vance collect my personal information? | | We collect your personal information, for example, when you ∎ open an account or make deposits or withdrawals from your account ∎ buy securities from us or make a wire transfer ∎ give us your contact information We also collect your personal information from others, such as credit bureaus, affiliates, or other companies. |
| Why can’t I limit all sharing? | | Federal law gives you the right to limit only ∎ sharing for affiliates’ everyday business purposes — information about your creditworthiness ∎ affiliates from using your information to market to you ∎ sharing for nonaffiliates to market to you State laws and individual companies may give you additional rights to limit sharing. See below for more on your rights under state law. |
| Definitions |
| Investment Management Affiliates | | Eaton Vance Investment Management Affiliates include registered investment advisers, registered broker- dealers, and registered and unregistered funds. Investment Management Affiliates does not include entities associated with Morgan Stanley Wealth Management, such as Morgan Stanley Smith Barney LLC and Morgan Stanley & Co. |
| Affiliates | | Companies related by common ownership or control. They can be financial and nonfinancial companies. ∎ Our affiliates include companies with a Morgan Stanley name and financial companies such as Morgan Stanley Smith Barney LLC and Morgan Stanley & Co. |
| Nonaffiliates | | Companies not related by common ownership or control. They can be financial and nonfinancial companies. ∎ Eaton Vance does not share with nonaffiliates so they can market to you. |
| Joint marketing | | A formal agreement between nonaffiliated financial companies that together market financial products or services to you. ∎ Eaton Vance doesn’t jointly market. |
| Other important information |
Vermont: Except as permitted by law, we will not share personal information we collect about Vermont residents with Nonaffiliates unless you provide us with your written consent to share such information. California: Except as permitted by law, we will not share personal information we collect about California residents with Nonaffiliates and we will limit sharing such personal information with our Affiliates to comply with California privacy laws that apply to us. |
Eaton Vance Funds
IMPORTANT NOTICES
Delivery of Shareholder Documents. The Securities and Exchange Commission (SEC) permits funds to deliver only one copy of shareholder documents, including prospectuses, proxy statements and shareholder reports, to fund investors with multiple accounts at the same residential or post office box address. This practice is often called “householding” and it helps eliminate duplicate mailings to shareholders. Eaton Vance, or your financial intermediary, may household the mailing of your documents indefinitely unless you instruct Eaton Vance, or your financial intermediary, otherwise. If you would prefer that your Eaton Vance documents not be householded, please contact Eaton Vance at 1-800-262-1122, or contact your financial intermediary. Your instructions that householding not apply to delivery of your Eaton Vance documents will typically be effective within 30 days of receipt by Eaton Vance or your financial intermediary.
Portfolio Holdings. Each Eaton Vance Fund and its underlying Portfolio(s) (if applicable) files a schedule of portfolio holdings on Part F to Form N-PORT with the SEC. Certain information filed on Form N-PORT may be viewed on the Eaton Vance website at www.eatonvance.com, by calling Eaton Vance at 1-800-262-1122 or in the EDGAR database on the SEC’s website at www.sec.gov.
Proxy Voting. From time to time, funds are required to vote proxies related to the securities held by the funds. The Eaton Vance Funds or their underlying Portfolios (if applicable) vote proxies according to a set of policies and procedures approved by the Funds’ and Portfolios’ Boards. You may obtain a description of these policies and procedures and information on how the Funds or Portfolios voted proxies relating to portfolio securities during the most recent 12-month period ended June 30, without charge, upon request, by calling 1-800-262-1122 and by accessing the SEC’s website at www.sec.gov.
This Page Intentionally Left Blank
Investment Adviser of Global Macro Absolute Return Advantage Portfolio
Boston Management and Research
Two International Place
Boston, MA 02110
Investment Adviser and Administrator of Eaton Vance Global Macro Absolute Return Advantage Fund
Eaton Vance Management
Two International Place
Boston, MA 02110
Investment Sub-Adviser
Eaton Vance Advisers International Ltd.
125 Old Broad Street
London, EC2N 1AR
United Kingdom
Principal Underwriter*
Eaton Vance Distributors, Inc.
Two International Place
Boston, MA 02110
(617) 482-8260
Custodian
State Street Bank and Trust Company
State Street Financial Center, One Lincoln Street
Boston, MA 02111
Transfer Agent
BNY Mellon Investment Servicing (US) Inc.
Attn: Eaton Vance Funds
P.O. Box 9653
Providence, RI 02940-9653
(800) 262-1122
Independent Registered Public Accounting Firm
Deloitte & Touche LLP
200 Berkeley Street
Boston, MA 02116-5022
Fund Offices
Two International Place
Boston, MA 02110
| * | FINRA BrokerCheck. Investors may check the background of their Investment Professional by contacting the Financial Industry Regulatory Authority (FINRA). FINRA BrokerCheck is a free tool to help investors check the professional background of current and former FINRA-registered securities firms and brokers. FINRA BrokerCheck is available by calling 1-800-289-9999 and at www.FINRA.org. The FINRA BrokerCheck brochure describing this program is available to investors at www.FINRA.org. |
4836 10.31.22
The registrant (sometimes referred to as the “Fund”) has adopted a code of ethics applicable to its Principal Executive Officer, Principal Financial Officer and Principal Accounting Officer. The registrant undertakes to provide a copy of such code of ethics to any person upon request, without charge, by calling 1-800-262-1122. The registrant has not amended the code of ethics as described in Form N-CSR during the period covered by this report. The registrant has not granted any waiver, including an implicit waiver, from a provision of the code of ethics as described in Form N-CSR during the period covered by this report.
| Item 3. | Audit Committee Financial Expert |
The registrant’s Board of Trustees (the “Board”) has designated George J. Gorman and Scott E. Wennerholm, each an independent trustee, as audit committee financial experts. Mr. Gorman is a certified public accountant who is the Principal at George J. Gorman LLC (a consulting firm). Previously, Mr. Gorman served in various capacities at Ernst & Young LLP (a registered public accounting firm), including as Senior Partner. Mr. Gorman also has experience serving as an independent trustee and audit committee financial expert of other
mutual fund complexes. Mr. Wennerholm is a private investor. Previously, Mr. Wennerholm served as a Trustee at Wheelock College (postsecondary institution), as a Consultant at GF Parish Group (executive recruiting firm), Chief Operating Officer and Executive Vice President at BNY Mellon Asset Management (investment management firm), Chief Operating Officer and Chief Financial Officer at Natixis Global Asset Management (investment management firm), and Vice President at Fidelity Investments Institutional Services (investment management firm).
| Item 4. | Principal Accountant Fees and Services |
Eaton Vance Emerging Markets Local Income Fund and Eaton Vance Global Macro Absolute Return Advantage Fund (the “Fund(s)”) are series of Eaton Vance Mutual Funds Trust (the “Trust”), a Massachusetts business trust, which, including the Funds, contains a total of 33 series (the “Series”). The Trust is registered under the Investment Company Act of 1940 as an open-end management investment company. This Form N-CSR relates to the Funds’ annual reports.
(a)-(d)
The following table presents the aggregate fees billed to the Funds for the Funds’ fiscal years ended October 31, 2021 and October 31, 2022 by the Funds’ principal accountant, Deloitte and Touche LLP (“D&T”), for professional services rendered for the audit of the Funds’ annual financial statements and fees billed for other services rendered by D&T during such periods.
| | | | | | | | |
Eaton Vance Emerging Markets Local Income Fund Fiscal Years Ended | | 10/31/21 | | | 10/31/22 | |
Audit Fees | | $ | 21,550 | | | $ | 24,550 | |
Audit-Related Fees(1) | | $ | 0 | | | $ | 0 | |
Tax Fees(2) | | $ | 8,209 | | | $ | 3,350 | |
All Other Fees(3) | | $ | 0 | | | $ | 0 | |
| | | | | | | | |
Total | | $ | 29,759 | | | $ | 27,900 | |
| | | | | | | | |
| | | | | | | | |
Eaton Vance Global Macro Absolute Return Advantage Fund Fiscal Years Ended | | 10/31/21 | | | 10/31/22 | |
Audit Fees | | $ | 25,750 | | | $ | 29,050 | |
Audit-Related Fees(1) | | $ | 0 | | | $ | 0 | |
Tax Fees(2) | | $ | 12,118 | | | $ | 3,450 | |
All Other Fees(3) | | $ | 0 | | | $ | 0 | |
| | | | | | | | |
Total | | $ | 37,868 | | | $ | 32,500 | |
| | | | | | | | |
| (1) | Audit-related fees consist of the aggregate fees billed for assurance and related services that are reasonably related to the performance of the audit of financial statements and are not reported under the category of audit fees. |
| (2) | Tax fees consist of the aggregate fees billed for professional services rendered by the principal accountant relating to tax compliance, tax advice, and tax planning and specifically include fees for tax return preparation and other related tax compliance/planning matters. |
| (3) | All other fees consist of the aggregate fees billed for products and services provided by the principal accountant other than audit, audit-related, and tax services. |
The various Series comprising the Trust have differing fiscal year ends (January 31, February 28, July 31, September 30, October 31, November 30, or December 31). The following table presents the aggregate audit, audit-related, tax, and other fees billed to all of the Series in the Trust by D&T for the last two fiscal years of each Series.
| | | | | | | | | | | | | | | | | | | | | | | | | | | | | | | | | | | | | | | | | | | | |
Fiscal Years Ended | | 12/31/20 | | | 1/31/21 | | | 2/28/21 | | | 9/30/21 | | | 10/31/21 | | | 11/30/21 | | | 12/31/21 | | | 1/31/22 | | | 2/28/22 | | | 9/30/22 | | | 10/31/22 | |
Audit Fees | | $ | 106,700 | | | $ | 201,300 | | | $ | 26,250 | | | $ | 91,600 | | | $ | 729,872 | | | $ | 37,050 | | | $ | 111,700 | | | $ | 198,900 | | | $ | 24,050 | | | $ | 104,200 | | | $ | 816,633 | |
Audit-Related Fees(1) | | $ | 0 | | | $ | 0 | | | $ | 0 | | | $ | 0 | | | $ | 0 | | | $ | 0 | | | $ | 0 | | | $ | 0 | | | $ | 0 | | | $ | 0 | | | $ | 0 | |
Tax Fees(2) | | $ | 60,338 | | | $ | 73,973 | | | $ | 10,103 | | | $ | 23,248 | | | $ | 271,569 | | | $ | 13,000 | | | $ | 61,738 | | | $ | 78,353 | | | $ | 8,478 | | | $ | 5,000 | | | $ | 44,100 | |
All Other Fees(3) | | $ | 0 | | | $ | 0 | | | $ | 0 | | | $ | 0 | | | $ | 0 | | | $ | 0 | | | $ | 0 | | | $ | 0 | | | $ | 0 | | | $ | 0 | | | $ | 0 | |
| | | | | | | | | | | | | | | | | | | | | | | | | | | | | | | | | | | | | | | | | | | | |
Total | | $ | 167,038 | | | $ | 275,273 | | | $ | 36,353 | | | $ | 114,848 | | | $ | 1,001,441 | | | $ | 50,050 | | | $ | 173,438 | | | $ | 277,253 | | | $ | 32,528 | | | $ | 109,200 | | | $ | 860,733 | |
| | | | | | | | | | | | | | | | | | | | | | | | | | | | | | | | | | | | | | | | | | | | |
| (1) | Audit-related fees consist of the aggregate fees billed for assurance and related services that are reasonably related to the performance of the audit of the registrant’s financial statements and are not reported under the category of audit fees. Includes consent fee for N-14 registration statements related to fund mergers. |
| (2) | Tax fees consist of the aggregate fees billed for professional services rendered by the principal accountant relating to tax compliance, tax advice, and tax planning and specifically include fees for tax return preparation and other related tax compliance/planning matters. |
| (3) | All other fees consist of the aggregate fees billed for products and services provided by the principal accountant other than audit, audit-related, and tax services. |
(e)(1) The registrant’s audit committee has adopted policies and procedures relating to the pre-approval of services provided by the registrant’s principal accountant (the “Pre-Approval Policies”). The Pre-Approval Policies establish a framework intended to assist the audit committee in the proper discharge of its pre-approval responsibilities. As a general matter, the Pre-Approval Policies (i) specify certain types of audit, audit-related, tax, and other services determined to be pre-approved by the audit committee; and (ii) delineate specific procedures governing the mechanics of the pre-approval process, including the approval and monitoring of audit and non-audit service fees. Unless a service is specifically pre-approved under the Pre-Approval Policies, it must be separately pre-approved by the audit committee.
The Pre-Approval Policies and the types of audit and non-audit services pre-approved therein must be reviewed and ratified by the registrant’s audit committee at least annually. The registrant’s audit committee maintains full responsibility for the appointment, compensation, and oversight of the work of the registrant’s principal accountant.
(e)(2) No services described in paragraphs (b)-(d) above were approved by the registrant’s audit committee pursuant to the “de minimis exception” set forth in Rule 2-01(c)(7)(i)(C) of Regulation S-X.
(f) Not applicable.
(g) The following table presents (i) the aggregate non-audit fees (i.e., fees for audit-related, tax, and other services) billed for services rendered to all of the Series in the Trust by D&T for the last two fiscal years of each Series; and (ii) the aggregate non-audit fees (i.e., fees for audit-related, tax, and other services) billed to the Eaton Vance organization by D&T for the last two fiscal years of each Series.
| | | | | | | | | | | | | | | | | | | | | | | | | | | | | | | | | | | | | | | | | | | | |
Fiscal Years Ended | | 12/31/20 | | | 1/31/21 | | | 2/28/21 | | | 9/30/21 | | | 10/31/21 | | | 11/30/21 | | | 12/31/21 | | | 1/31/22 | | | 2/28/22 | | | 9/30/22 | | | 10/31/22 | |
Registrant(1) | | $ | 60,338 | | | $ | 73,973 | | | $ | 10,103 | | | $ | 23,248 | | | $ | 271,569 | | | $ | 13,000 | | | $ | 61,738 | | | $ | 78,353 | | | $ | 8,478 | | | $ | 5,000 | | | $ | 44,100 | |
Eaton Vance(2) | | $ | 150,300 | | | $ | 150,300 | | | $ | 150,300 | | | $ | 51,800 | | | $ | 51,800 | | | $ | 51,800 | | | $ | 51,800 | | | $ | 51,800 | | | $ | 51,800 | | | $ | 52,836 | | | $ | 52,836 | |
| (1) | Includes all of the Series of the Trust. During the fiscal years reported above, certain of the Funds were “feeder” funds in a “master-feeder” fund structure or funds of funds. |
| (2) | Various subsidiaries of Morgan Stanley. act in either an investment advisory and/or service provider capacity with respect to the Series and/or their respective “master” funds (if applicable). |
(h) The registrant’s audit committee has considered whether the provision by the registrant’s principal accountant of non-audit services to the registrant’s investment adviser and any entity controlling, controlled by, or under common control with the adviser that provides ongoing services to the registrant that were not pre-approved pursuant to Rule 2-01(c)(7)(ii) of Regulation S-X is compatible with maintaining the principal accountant’s independence.
| Item 5. | Audit Committee of Listed Registrants |
Not applicable.
| Item 6. | Schedule of Investments |
Please see schedule of investments contained in the Report to Stockholders included under Item 1 of this Form N-CSR.
| Item 7. | Disclosure of Proxy Voting Policies and Procedures for Closed-End Management Investment Companies |
Not applicable.
| Item 8. | Portfolio Managers of Closed-End Management Investment Companies |
Not applicable.
| Item 9. | Purchases of Equity Securities by Closed-End Management Investment Company and Affiliated Purchasers |
Not applicable.
| Item 10. | Submission of Matters to a Vote of Security Holders |
No material changes.
| Item 11. | Controls and Procedures |
(a) The registrant maintains disclosure controls and procedures to provide reasonable assurance that the information required to be disclosed by the registrant has been recorded, processed, summarized and reported within the time period specified in the Commission’s rules and forms and that the information required to be disclosed by the registrant has been accumulated and communicated to the registrant’s principal executive officer and principal financial officer in order to allow timely decisions regarding required disclosure. Within 90 days prior to the filing date of the annual report on Form N-CSR, management carried out an evaluation of the
effectiveness of the design and operation of the registrant’s disclosure controls and procedures. Based on such evaluation, the principal executive officer and principal financial officer concluded that the registrant’s disclosure controls and procedures were not effective due to a material weakness with respect to Eaton Vance Emerging Markets Local Income Fund (EMLI Fund) and Eaton Vance Global Macro Absolute Return Advantage Fund (GMARA Fund), two series of the registrant. EMLI Fund is a feeder fund of Emerging Markets Local Income Portfolio (EMLI Portfolio) and holds an 86.7% interest in EMLI Portfolio at October 31, 2022. GMARA Fund is a feeder fund of Global Macro Absolute Return Advantage Portfolio (GMARA Portfolio) and holds a 78.3% interest in GMARA Portfolio at October 31, 2022. EMLI Fund is reliant on EMLI Portfolio and GMARA Fund is reliant on GMARA Portfolio to provide accurate information to them regarding their investment in EMLI Portfolio and GMARA Portfolio, respectively.
A material weakness exists in the design and operating effectiveness of controls for EMLI Fund and GMARA Fund because of incorrect information used by EMLI Portfolio and GMARA Portfolio, respectively, over the amounts used to determine the mark-to-market adjustment on unrealized gains and losses arising from foreign currencies at year-end for tax purposes, which affected the determination of tax-related financial statement balances and disclosures by EMLI Fund and GMARA Fund, respectively. This material weakness resulted in audit adjustments to decrease paid-in capital and accumulated loss for EMLI Fund, and decrease undistributed ordinary income and net unrealized depreciation for GMARA Fund at October 31, 2022. This material weakness did not result in a misstatement of previously issued financial statements.
To remediate the material weakness described above, management of EMLI Fund and GMARA Fund is enhancing its oversight and review controls over activities performed by an outsourced tax preparer.
(b) Other than the enhancements to controls noted above that are being implemented subsequent to October 31, 2022, there have been no changes in the registrant’s internal controls over financial reporting during the period covered by this report and subsequent to the date of their evaluation in connection with the preparation of this Form N-CSR that materially affected, or are reasonably likely to materially affect, the registrant’s internal control over financial reporting.
| Item 12. | Disclosure of Securities Lending Activities for Closed-End Management Investment Companies |
Not applicable.
Signatures
Pursuant to the requirements of the Securities Exchange Act of 1934 and the Investment Company Act of 1940, the registrant has duly caused this report to be signed on its behalf by the undersigned, thereunto duly authorized.
| | |
Eaton Vance Mutual Funds Trust |
| |
By: | | /s/ Eric A. Stein |
| | Eric A. Stein |
| | President |
Date: January 6, 2023
Pursuant to the requirements of the Securities Exchange Act of 1934 and the Investment Company Act of 1940, this report has been signed below by the following persons on behalf of the registrant and in the capacities and on the dates indicated.
| | |
By: | | /s/ James F. Kirchner |
| | James F. Kirchner |
| | Treasurer |
Date: January 6, 2023
| | |
By: | | /s/ Eric A. Stein |
| | Eric A. Stein |
| | President |
Date: January 6, 2023